Watertown Town, MA Map & Demographics
Watertown Town Map
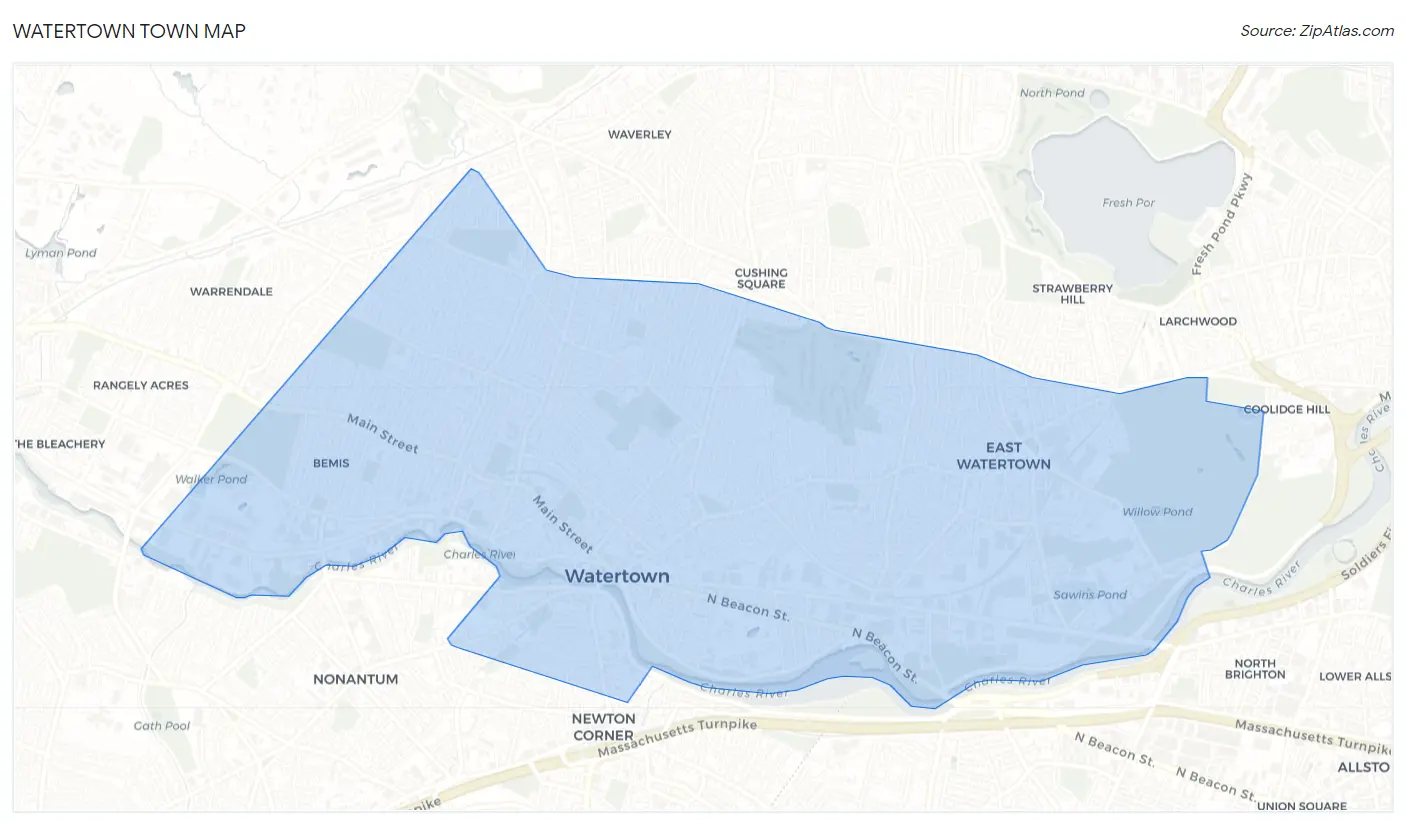
Watertown Town Overview
$69,498
PER CAPITA INCOME
$144,593
AVG FAMILY INCOME
$117,625
AVG HOUSEHOLD INCOME
7.1%
WAGE / INCOME GAP [ % ]
92.9¢/ $1
WAGE / INCOME GAP [ $ ]
0.45
INEQUALITY / GINI INDEX
35,181
TOTAL POPULATION
16,796
MALE POPULATION
18,385
FEMALE POPULATION
91.36
MALES / 100 FEMALES
109.46
FEMALES / 100 MALES
38.2
MEDIAN AGE
2.8
AVG FAMILY SIZE
2.2
AVG HOUSEHOLD SIZE
22,566
LABOR FORCE [ PEOPLE ]
73.8%
PERCENT IN LABOR FORCE
5.7%
UNEMPLOYMENT RATE
Income in Watertown Town
Income Overview in Watertown Town
Per Capita Income in Watertown Town is $69,498, while median incomes of families and households are $144,593 and $117,625 respectively.
| Characteristic | Number | Measure |
| Per Capita Income | 35,181 | $69,498 |
| Median Family Income | 8,790 | $144,593 |
| Mean Family Income | 8,790 | $186,570 |
| Median Household Income | 15,944 | $117,625 |
| Mean Household Income | 15,944 | $153,412 |
| Income Deficit | 8,790 | $0 |
| Wage / Income Gap (%) | 35,181 | 7.06% |
| Wage / Income Gap ($) | 35,181 | 92.94¢ per $1 |
| Gini / Inequality Index | 35,181 | 0.45 |
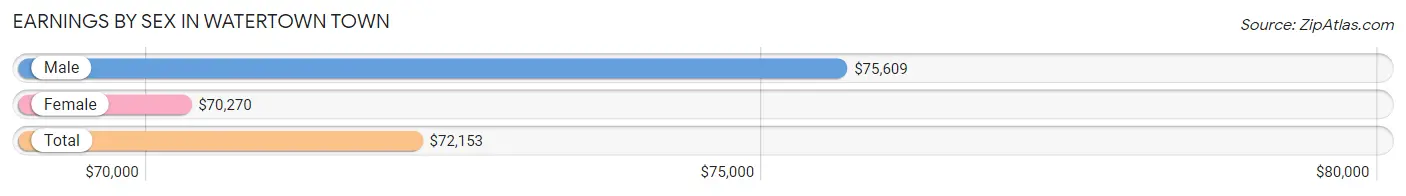
Earnings by Sex in Watertown Town
Average Earnings in Watertown Town are $72,153, $75,609 for men and $70,270 for women, a difference of 7.1%.
| Sex | Number | Average Earnings |
| Male | 11,805 (51.3%) | $75,609 |
| Female | 11,214 (48.7%) | $70,270 |
| Total | 23,019 (100.0%) | $72,153 |
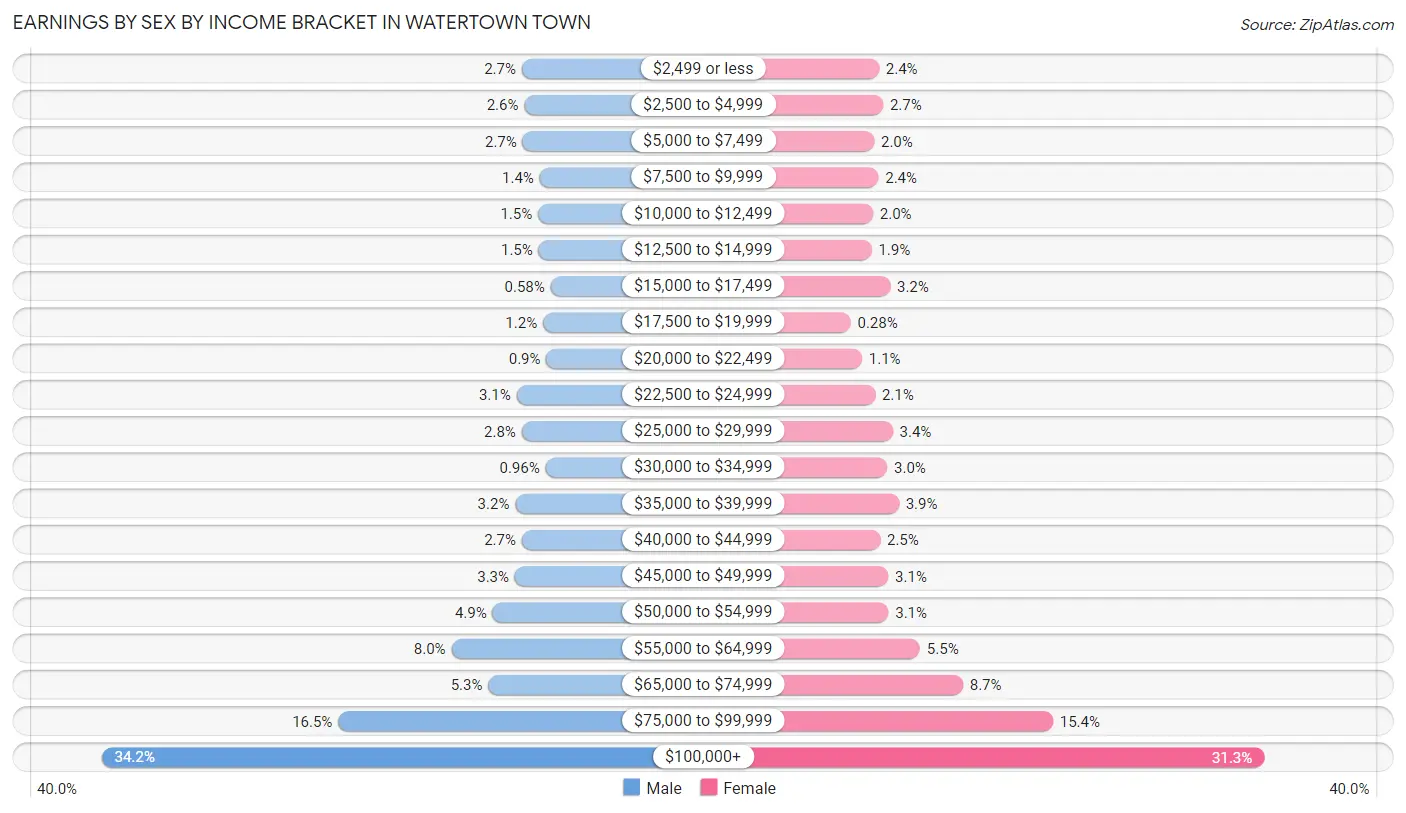
Earnings by Sex by Income Bracket in Watertown Town
The most common earnings brackets in Watertown Town are $100,000+ for men (4,041 | 34.2%) and $100,000+ for women (3,507 | 31.3%).
| Income | Male | Female |
| $2,499 or less | 324 (2.7%) | 269 (2.4%) |
| $2,500 to $4,999 | 301 (2.5%) | 304 (2.7%) |
| $5,000 to $7,499 | 316 (2.7%) | 229 (2.0%) |
| $7,500 to $9,999 | 165 (1.4%) | 265 (2.4%) |
| $10,000 to $12,499 | 180 (1.5%) | 219 (1.9%) |
| $12,500 to $14,999 | 175 (1.5%) | 208 (1.8%) |
| $15,000 to $17,499 | 68 (0.6%) | 363 (3.2%) |
| $17,500 to $19,999 | 136 (1.1%) | 31 (0.3%) |
| $20,000 to $22,499 | 106 (0.9%) | 127 (1.1%) |
| $22,500 to $24,999 | 369 (3.1%) | 237 (2.1%) |
| $25,000 to $29,999 | 325 (2.8%) | 385 (3.4%) |
| $30,000 to $34,999 | 113 (1.0%) | 339 (3.0%) |
| $35,000 to $39,999 | 381 (3.2%) | 436 (3.9%) |
| $40,000 to $44,999 | 324 (2.7%) | 279 (2.5%) |
| $45,000 to $49,999 | 385 (3.3%) | 348 (3.1%) |
| $50,000 to $54,999 | 582 (4.9%) | 349 (3.1%) |
| $55,000 to $64,999 | 946 (8.0%) | 614 (5.5%) |
| $65,000 to $74,999 | 620 (5.2%) | 974 (8.7%) |
| $75,000 to $99,999 | 1,948 (16.5%) | 1,731 (15.4%) |
| $100,000+ | 4,041 (34.2%) | 3,507 (31.3%) |
| Total | 11,805 (100.0%) | 11,214 (100.0%) |
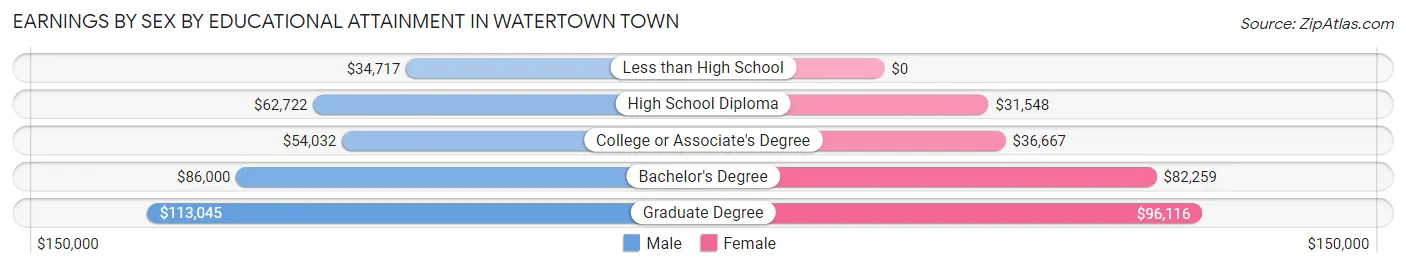
Earnings by Sex by Educational Attainment in Watertown Town
Average earnings in Watertown Town are $80,039 for men and $72,710 for women, a difference of 9.2%. Men with an educational attainment of graduate degree enjoy the highest average annual earnings of $113,045, while those with less than high school education earn the least with $34,717. Women with an educational attainment of graduate degree earn the most with the average annual earnings of $96,116, while those with high school diploma education have the smallest earnings of $31,548.
| Educational Attainment | Male Income | Female Income |
| Less than High School | $34,717 | $0 |
| High School Diploma | $62,722 | $31,548 |
| College or Associate's Degree | $54,032 | $36,667 |
| Bachelor's Degree | $86,000 | $82,259 |
| Graduate Degree | $113,045 | $96,116 |
| Total | $80,039 | $72,710 |
Family Income in Watertown Town
Family Income Brackets in Watertown Town
According to the Watertown Town family income data, there are 3,059 families falling into the $200,000+ income range, which is the most common income bracket and makes up 34.8% of all families. Conversely, the $15,000 to $24,999 income bracket is the least frequent group with only 97 families (1.1%) belonging to this category.
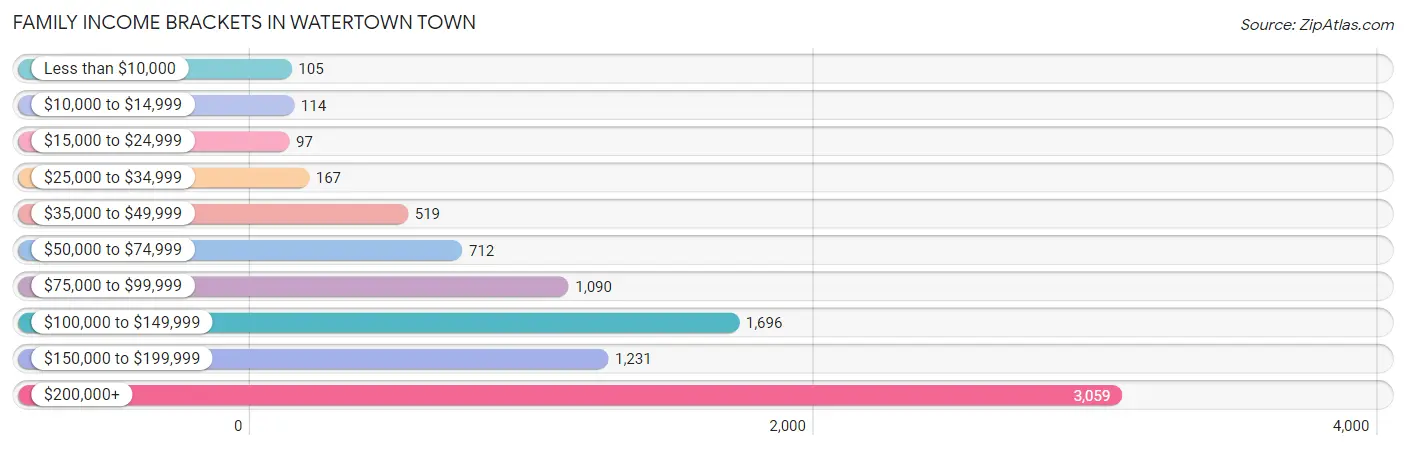
| Income Bracket | # Families | % Families |
| Less than $10,000 | 105 | 1.2% |
| $10,000 to $14,999 | 114 | 1.3% |
| $15,000 to $24,999 | 97 | 1.1% |
| $25,000 to $34,999 | 167 | 1.9% |
| $35,000 to $49,999 | 519 | 5.9% |
| $50,000 to $74,999 | 712 | 8.1% |
| $75,000 to $99,999 | 1,090 | 12.4% |
| $100,000 to $149,999 | 1,696 | 19.3% |
| $150,000 to $199,999 | 1,231 | 14.0% |
| $200,000+ | 3,059 | 34.8% |
Family Income by Famaliy Size in Watertown Town
4-person families (1,303 | 14.8%) account for the highest median family income in Watertown Town with $176,078 per family, while 2-person families (4,294 | 48.8%) have the highest median income of $63,519 per family member.
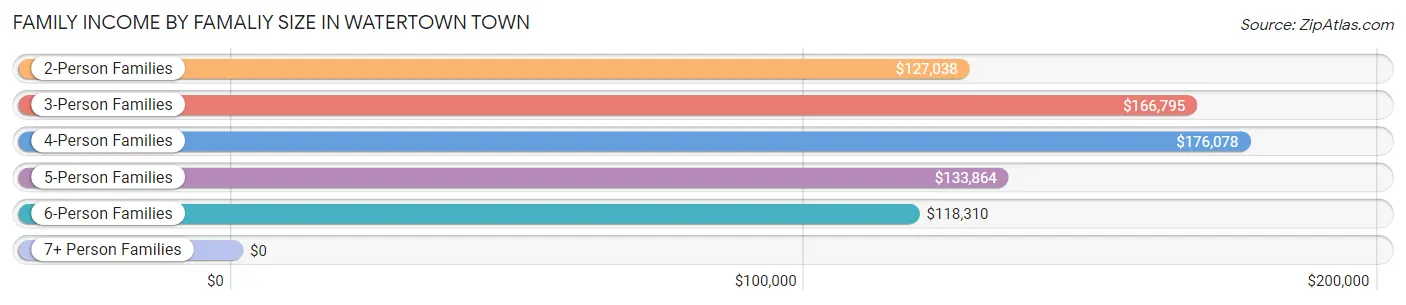
| Income Bracket | # Families | Median Income |
| 2-Person Families | 4,294 (48.8%) | $127,038 |
| 3-Person Families | 2,561 (29.1%) | $166,795 |
| 4-Person Families | 1,303 (14.8%) | $176,078 |
| 5-Person Families | 362 (4.1%) | $133,864 |
| 6-Person Families | 234 (2.7%) | $118,310 |
| 7+ Person Families | 36 (0.4%) | $0 |
| Total | 8,790 (100.0%) | $144,593 |
Family Income by Number of Earners in Watertown Town
The median family income in Watertown Town is $144,593, with families comprising 3+ earners (868) having the highest median family income of $188,289, while families with no earners (570) have the lowest median family income of $64,485, accounting for 9.9% and 6.5% of families, respectively.
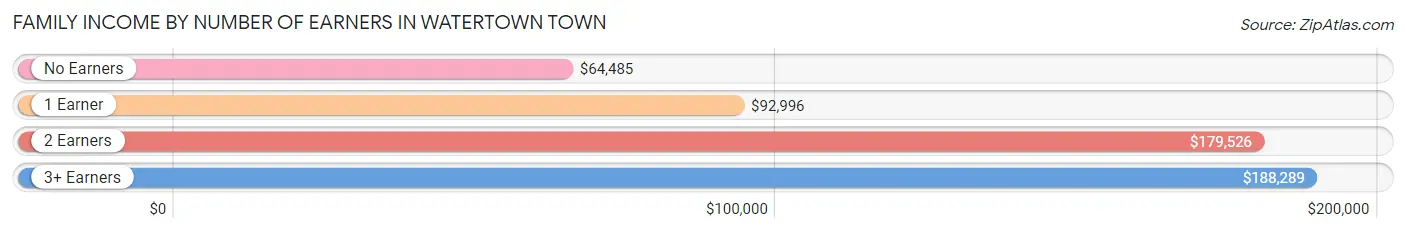
| Number of Earners | # Families | Median Income |
| No Earners | 570 (6.5%) | $64,485 |
| 1 Earner | 2,195 (25.0%) | $92,996 |
| 2 Earners | 5,157 (58.7%) | $179,526 |
| 3+ Earners | 868 (9.9%) | $188,289 |
| Total | 8,790 (100.0%) | $144,593 |
Household Income in Watertown Town
Household Income Brackets in Watertown Town
With 4,018 households falling in the category, the $200,000+ income range is the most frequent in Watertown Town, accounting for 25.2% of all households. In contrast, only 367 households (2.3%) fall into the $10,000 to $14,999 income bracket, making it the least populous group.
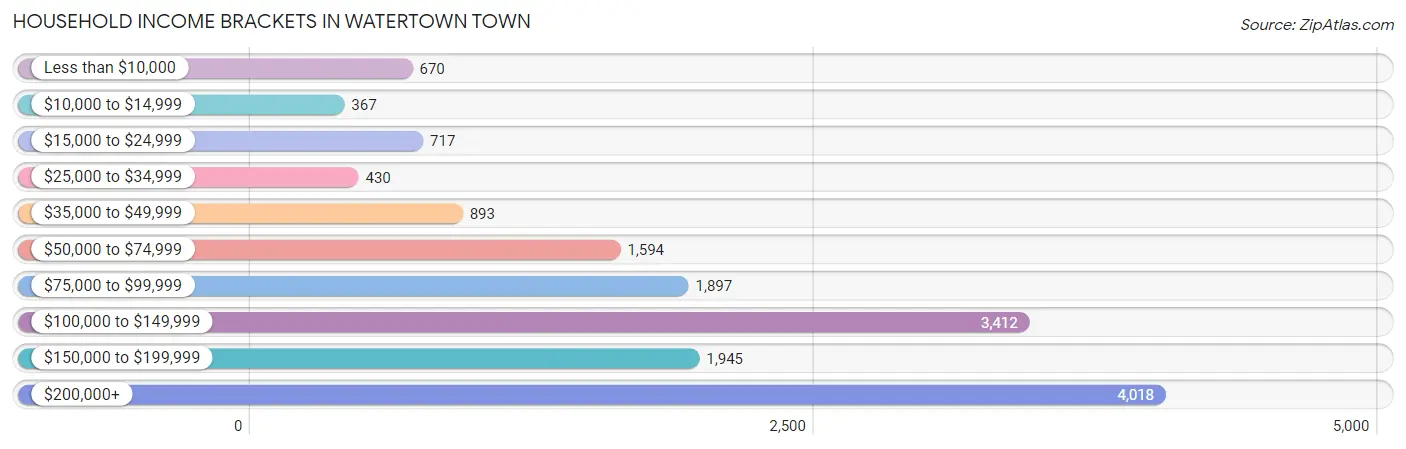
| Income Bracket | # Households | % Households |
| Less than $10,000 | 670 | 4.2% |
| $10,000 to $14,999 | 367 | 2.3% |
| $15,000 to $24,999 | 717 | 4.5% |
| $25,000 to $34,999 | 430 | 2.7% |
| $35,000 to $49,999 | 893 | 5.6% |
| $50,000 to $74,999 | 1,594 | 10.0% |
| $75,000 to $99,999 | 1,897 | 11.9% |
| $100,000 to $149,999 | 3,412 | 21.4% |
| $150,000 to $199,999 | 1,945 | 12.2% |
| $200,000+ | 4,018 | 25.2% |
Household Income by Householder Age in Watertown Town
The median household income in Watertown Town is $117,625, with the highest median household income of $145,139 found in the 25 to 44 years age bracket for the primary householder. A total of 6,414 households (40.2%) fall into this category. Meanwhile, the 15 to 24 years age bracket for the primary householder has the lowest median household income of $38,534, with 236 households (1.5%) in this group.
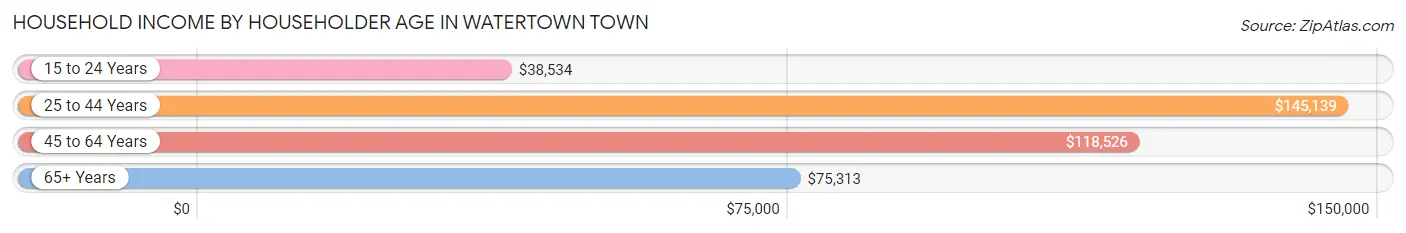
| Income Bracket | # Households | Median Income |
| 15 to 24 Years | 236 (1.5%) | $38,534 |
| 25 to 44 Years | 6,414 (40.2%) | $145,139 |
| 45 to 64 Years | 5,061 (31.7%) | $118,526 |
| 65+ Years | 4,233 (26.6%) | $75,313 |
| Total | 15,944 (100.0%) | $117,625 |
Poverty in Watertown Town
Income Below Poverty by Sex and Age in Watertown Town
With 6.3% poverty level for males and 6.7% for females among the residents of Watertown Town, 5 year old males and 75 year old and over females are the most vulnerable to poverty, with 9 males (64.3%) and 253 females (18.8%) in their respective age groups living below the poverty level.
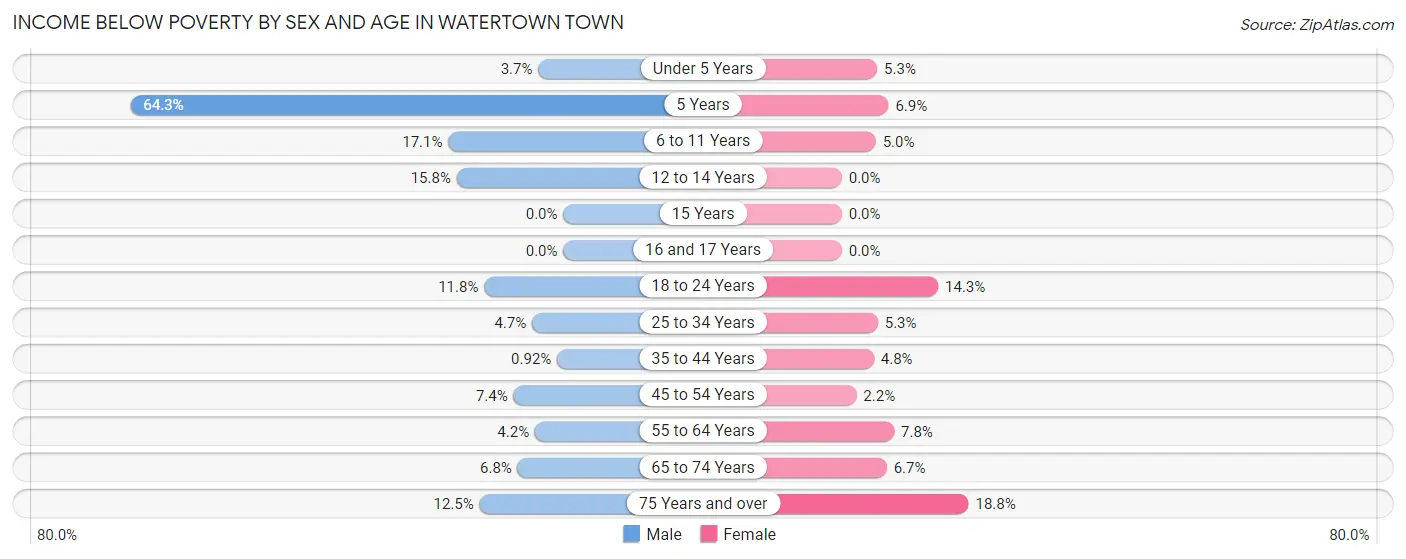
| Age Bracket | Male | Female |
| Under 5 Years | 27 (3.7%) | 55 (5.2%) |
| 5 Years | 9 (64.3%) | 16 (6.9%) |
| 6 to 11 Years | 114 (17.1%) | 46 (5.0%) |
| 12 to 14 Years | 57 (15.8%) | 0 (0.0%) |
| 15 Years | 0 (0.0%) | 0 (0.0%) |
| 16 and 17 Years | 0 (0.0%) | 0 (0.0%) |
| 18 to 24 Years | 144 (11.7%) | 137 (14.3%) |
| 25 to 34 Years | 187 (4.6%) | 199 (5.3%) |
| 35 to 44 Years | 23 (0.9%) | 140 (4.8%) |
| 45 to 54 Years | 144 (7.4%) | 41 (2.2%) |
| 55 to 64 Years | 80 (4.2%) | 204 (7.8%) |
| 65 to 74 Years | 117 (6.8%) | 130 (6.7%) |
| 75 Years and over | 145 (12.4%) | 253 (18.8%) |
| Total | 1,047 (6.3%) | 1,221 (6.7%) |
Income Above Poverty by Sex and Age in Watertown Town
According to the poverty statistics in Watertown Town, males aged 15 years and females aged 12 to 14 years are the age groups that are most secure financially, with 100.0% of males and 100.0% of females in these age groups living above the poverty line.
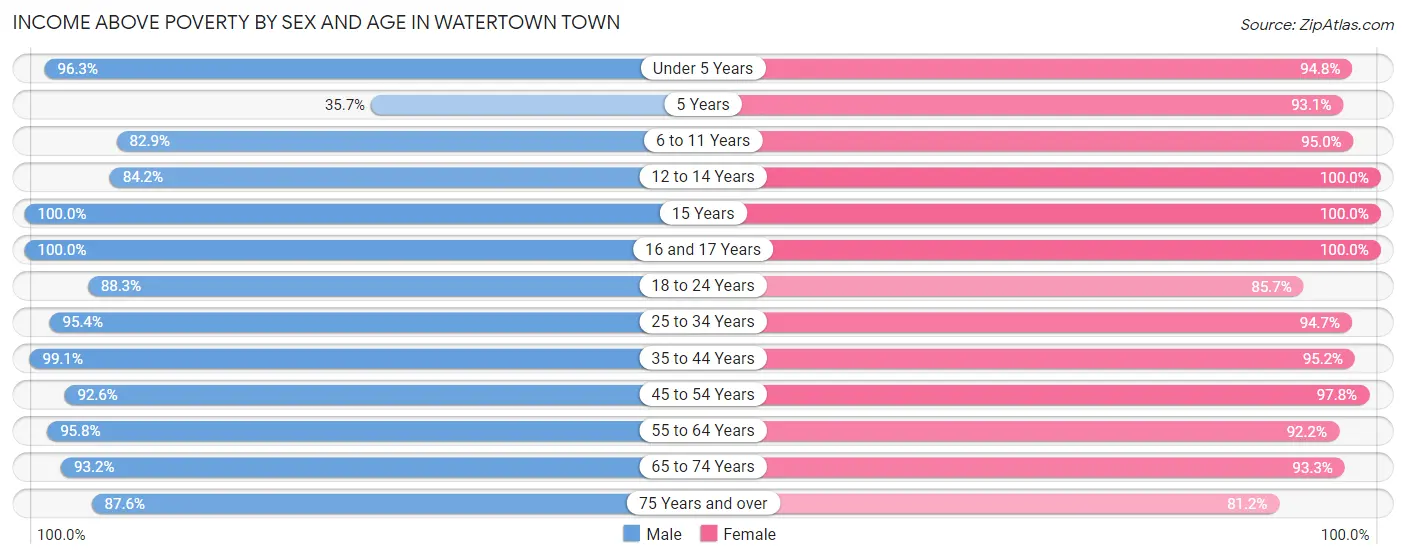
| Age Bracket | Male | Female |
| Under 5 Years | 698 (96.3%) | 993 (94.8%) |
| 5 Years | 5 (35.7%) | 215 (93.1%) |
| 6 to 11 Years | 553 (82.9%) | 866 (95.0%) |
| 12 to 14 Years | 303 (84.2%) | 429 (100.0%) |
| 15 Years | 103 (100.0%) | 72 (100.0%) |
| 16 and 17 Years | 349 (100.0%) | 228 (100.0%) |
| 18 to 24 Years | 1,082 (88.2%) | 821 (85.7%) |
| 25 to 34 Years | 3,835 (95.4%) | 3,526 (94.7%) |
| 35 to 44 Years | 2,467 (99.1%) | 2,802 (95.2%) |
| 45 to 54 Years | 1,802 (92.6%) | 1,850 (97.8%) |
| 55 to 64 Years | 1,818 (95.8%) | 2,423 (92.2%) |
| 65 to 74 Years | 1,609 (93.2%) | 1,820 (93.3%) |
| 75 Years and over | 1,020 (87.5%) | 1,091 (81.2%) |
| Total | 15,644 (93.7%) | 17,136 (93.3%) |
Income Below Poverty Among Married-Couple Families in Watertown Town
The poverty statistics for married-couple families in Watertown Town show that 2.3% or 150 of the total 6,538 families live below the poverty line. Families with 3 or 4 children have the highest poverty rate of 3.4%, comprising of 11 families. On the other hand, families with no children have the lowest poverty rate of 2.0%, which includes 79 families.
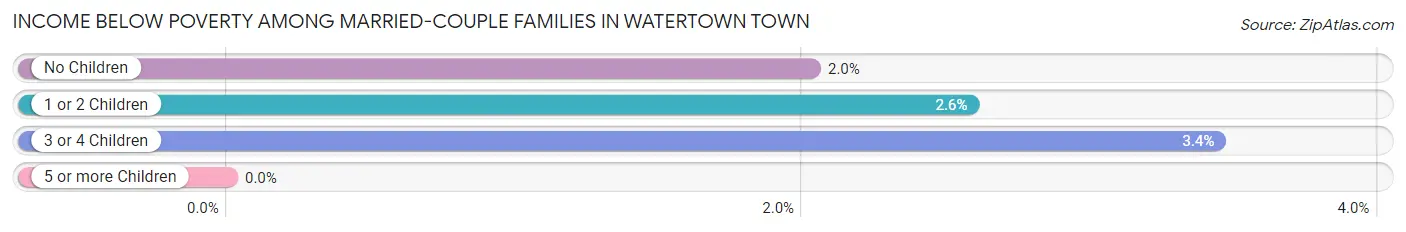
| Children | Above Poverty | Below Poverty |
| No Children | 3,809 (98.0%) | 79 (2.0%) |
| 1 or 2 Children | 2,270 (97.4%) | 60 (2.6%) |
| 3 or 4 Children | 309 (96.6%) | 11 (3.4%) |
| 5 or more Children | 0 (0.0%) | 0 (0.0%) |
| Total | 6,388 (97.7%) | 150 (2.3%) |
Income Below Poverty Among Single-Parent Households in Watertown Town
According to the poverty data in Watertown Town, 2.9% or 18 single-father households and 6.5% or 106 single-mother households are living below the poverty line. Among single-father households, those with no children have the highest poverty rate, with 18 households (3.7%) experiencing poverty. Likewise, among single-mother households, those with 3 or 4 children have the highest poverty rate, with 52 households (89.7%) falling below the poverty line.
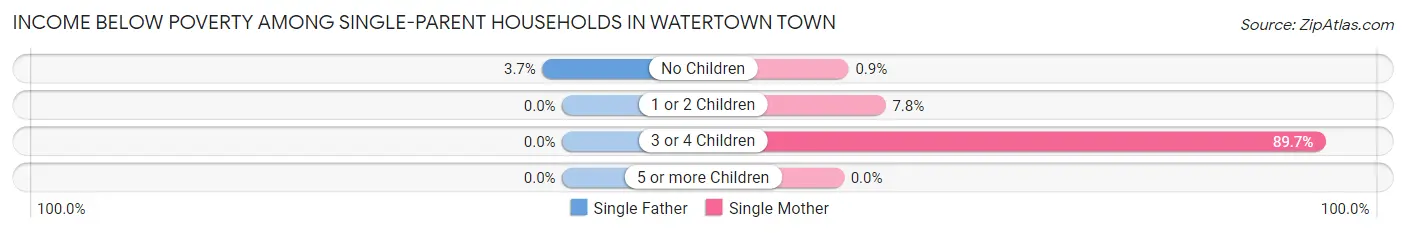
| Children | Single Father | Single Mother |
| No Children | 18 (3.7%) | 9 (0.9%) |
| 1 or 2 Children | 0 (0.0%) | 45 (7.8%) |
| 3 or 4 Children | 0 (0.0%) | 52 (89.7%) |
| 5 or more Children | 0 (0.0%) | 0 (0.0%) |
| Total | 18 (2.9%) | 106 (6.5%) |
Income Below Poverty Among Married-Couple vs Single-Parent Households in Watertown Town
The poverty data for Watertown Town shows that 150 of the married-couple family households (2.3%) and 124 of the single-parent households (5.5%) are living below the poverty level. Within the married-couple family households, those with 3 or 4 children have the highest poverty rate, with 11 households (3.4%) falling below the poverty line. Among the single-parent households, those with 3 or 4 children have the highest poverty rate, with 52 household (89.7%) living below poverty.
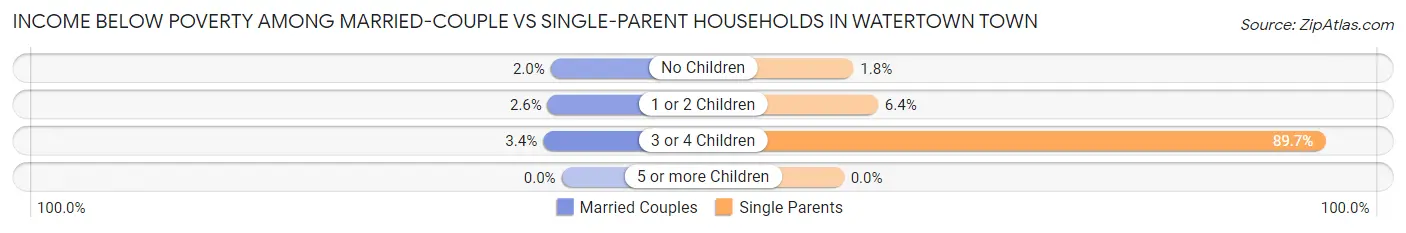
| Children | Married-Couple Families | Single-Parent Households |
| No Children | 79 (2.0%) | 27 (1.8%) |
| 1 or 2 Children | 60 (2.6%) | 45 (6.4%) |
| 3 or 4 Children | 11 (3.4%) | 52 (89.7%) |
| 5 or more Children | 0 (0.0%) | 0 (0.0%) |
| Total | 150 (2.3%) | 124 (5.5%) |
Race in Watertown Town
The most populous races in Watertown Town are White / Caucasian (25,989 | 73.9%), Asian (4,118 | 11.7%), and Two or more Races (2,581 | 7.3%).
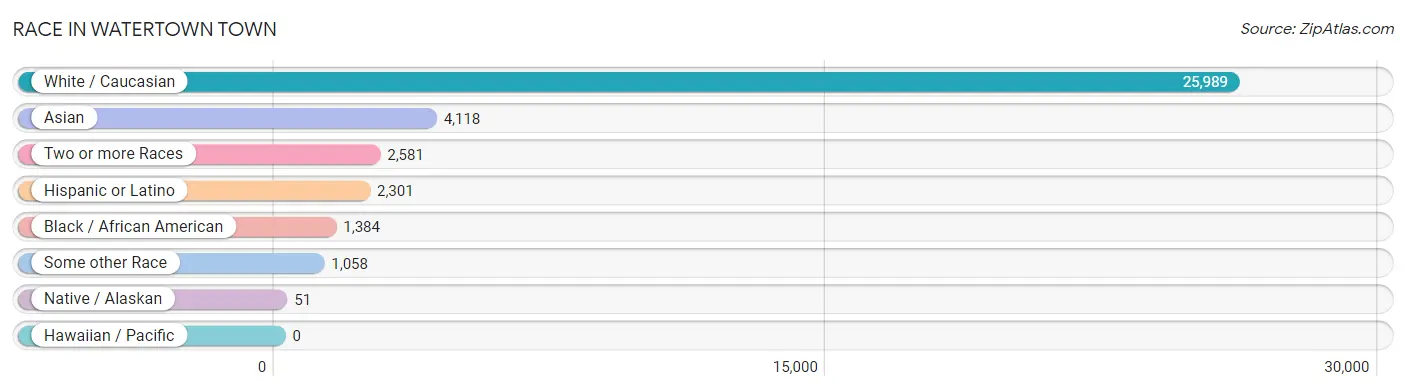
| Race | # Population | % Population |
| Asian | 4,118 | 11.7% |
| Black / African American | 1,384 | 3.9% |
| Hawaiian / Pacific | 0 | 0.0% |
| Hispanic or Latino | 2,301 | 6.5% |
| Native / Alaskan | 51 | 0.1% |
| White / Caucasian | 25,989 | 73.9% |
| Two or more Races | 2,581 | 7.3% |
| Some other Race | 1,058 | 3.0% |
| Total | 35,181 | 100.0% |
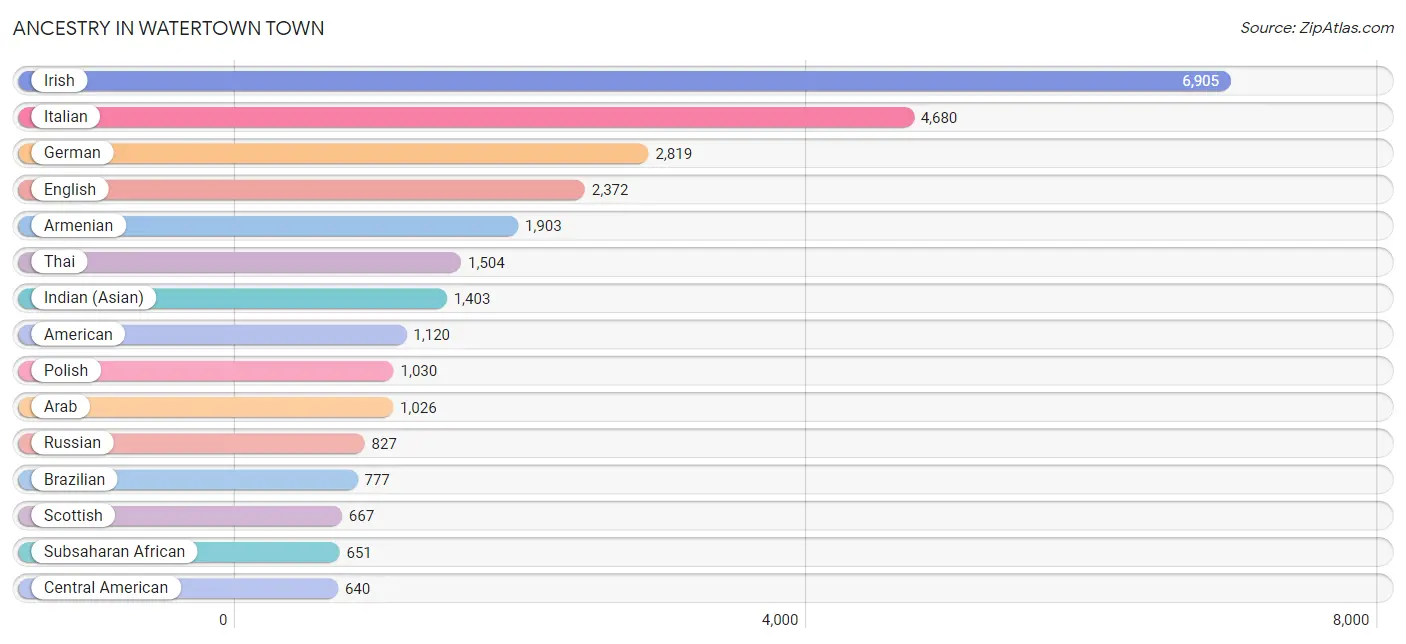
Ancestry in Watertown Town
The most populous ancestries reported in Watertown Town are Irish (6,905 | 19.6%), Italian (4,680 | 13.3%), German (2,819 | 8.0%), English (2,372 | 6.7%), and Armenian (1,903 | 5.4%), together accounting for 53.1% of all Watertown Town residents.
| Ancestry | # Population | % Population |
| African | 128 | 0.4% |
| Albanian | 86 | 0.2% |
| American | 1,120 | 3.2% |
| Arab | 1,026 | 2.9% |
| Argentinean | 39 | 0.1% |
| Armenian | 1,903 | 5.4% |
| Assyrian / Chaldean / Syriac | 54 | 0.2% |
| Australian | 27 | 0.1% |
| Austrian | 182 | 0.5% |
| Basque | 20 | 0.1% |
| Belgian | 5 | 0.0% |
| Bhutanese | 62 | 0.2% |
| Blackfeet | 40 | 0.1% |
| Brazilian | 777 | 2.2% |
| British | 267 | 0.8% |
| Burmese | 283 | 0.8% |
| Canadian | 202 | 0.6% |
| Cape Verdean | 42 | 0.1% |
| Central American | 640 | 1.8% |
| Central American Indian | 63 | 0.2% |
| Chilean | 33 | 0.1% |
| Colombian | 57 | 0.2% |
| Creek | 4 | 0.0% |
| Croatian | 49 | 0.1% |
| Cuban | 120 | 0.3% |
| Cypriot | 9 | 0.0% |
| Czech | 25 | 0.1% |
| Danish | 151 | 0.4% |
| Dominican | 155 | 0.4% |
| Dutch | 123 | 0.4% |
| Eastern European | 225 | 0.6% |
| Ecuadorian | 38 | 0.1% |
| Egyptian | 24 | 0.1% |
| English | 2,372 | 6.7% |
| Ethiopian | 37 | 0.1% |
| European | 637 | 1.8% |
| Filipino | 199 | 0.6% |
| Finnish | 98 | 0.3% |
| French | 445 | 1.3% |
| French Canadian | 512 | 1.5% |
| German | 2,819 | 8.0% |
| German Russian | 34 | 0.1% |
| Greek | 639 | 1.8% |
| Guatemalan | 519 | 1.5% |
| Haitian | 185 | 0.5% |
| Hungarian | 92 | 0.3% |
| Indian (Asian) | 1,403 | 4.0% |
| Indonesian | 37 | 0.1% |
| Iranian | 255 | 0.7% |
| Iraqi | 67 | 0.2% |
| Irish | 6,905 | 19.6% |
| Israeli | 24 | 0.1% |
| Italian | 4,680 | 13.3% |
| Jamaican | 48 | 0.1% |
| Japanese | 91 | 0.3% |
| Kenyan | 317 | 0.9% |
| Korean | 295 | 0.8% |
| Laotian | 34 | 0.1% |
| Latvian | 31 | 0.1% |
| Lebanese | 529 | 1.5% |
| Lithuanian | 184 | 0.5% |
| Mexican | 211 | 0.6% |
| Moroccan | 257 | 0.7% |
| Native Hawaiian | 34 | 0.1% |
| New Zealander | 7 | 0.0% |
| Nicaraguan | 15 | 0.0% |
| Northern European | 247 | 0.7% |
| Norwegian | 273 | 0.8% |
| Okinawan | 20 | 0.1% |
| Pakistani | 23 | 0.1% |
| Palestinian | 13 | 0.0% |
| Peruvian | 49 | 0.1% |
| Polish | 1,030 | 2.9% |
| Portuguese | 307 | 0.9% |
| Puerto Rican | 481 | 1.4% |
| Romanian | 114 | 0.3% |
| Russian | 827 | 2.4% |
| Salvadoran | 106 | 0.3% |
| Scandinavian | 151 | 0.4% |
| Scotch-Irish | 316 | 0.9% |
| Scottish | 667 | 1.9% |
| Serbian | 17 | 0.1% |
| Slovak | 2 | 0.0% |
| South African | 9 | 0.0% |
| South American | 288 | 0.8% |
| Spaniard | 58 | 0.2% |
| Spanish | 141 | 0.4% |
| Spanish American | 4 | 0.0% |
| Sri Lankan | 115 | 0.3% |
| Subsaharan African | 651 | 1.8% |
| Swedish | 384 | 1.1% |
| Swiss | 146 | 0.4% |
| Syrian | 42 | 0.1% |
| Thai | 1,504 | 4.3% |
| Turkish | 153 | 0.4% |
| Ugandan | 29 | 0.1% |
| Ukrainian | 258 | 0.7% |
| Uruguayan | 31 | 0.1% |
| Venezuelan | 41 | 0.1% |
| Vietnamese | 136 | 0.4% |
| Welsh | 253 | 0.7% |
| West Indian | 51 | 0.1% |
| Yugoslavian | 42 | 0.1% | View All 103 Rows |
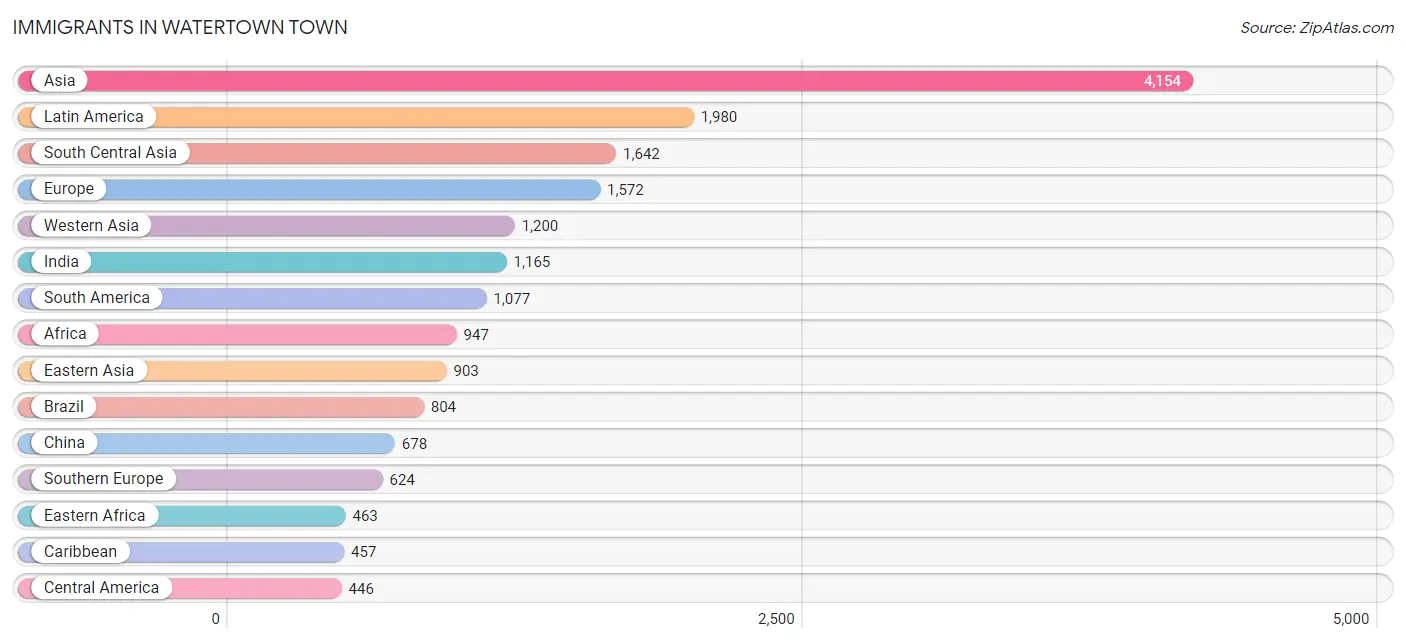
Immigrants in Watertown Town
The most numerous immigrant groups reported in Watertown Town came from Asia (4,154 | 11.8%), Latin America (1,980 | 5.6%), South Central Asia (1,642 | 4.7%), Europe (1,572 | 4.5%), and Western Asia (1,200 | 3.4%), together accounting for 30.0% of all Watertown Town residents.
| Immigration Origin | # Population | % Population |
| Africa | 947 | 2.7% |
| Albania | 40 | 0.1% |
| Argentina | 25 | 0.1% |
| Armenia | 266 | 0.8% |
| Asia | 4,154 | 11.8% |
| Australia | 48 | 0.1% |
| Bangladesh | 30 | 0.1% |
| Bosnia and Herzegovina | 29 | 0.1% |
| Brazil | 804 | 2.3% |
| Cambodia | 45 | 0.1% |
| Cameroon | 120 | 0.3% |
| Canada | 196 | 0.6% |
| Caribbean | 457 | 1.3% |
| Central America | 446 | 1.3% |
| China | 678 | 1.9% |
| Colombia | 57 | 0.2% |
| Croatia | 2 | 0.0% |
| Cuba | 84 | 0.2% |
| Czechoslovakia | 17 | 0.1% |
| Dominican Republic | 108 | 0.3% |
| Eastern Africa | 463 | 1.3% |
| Eastern Asia | 903 | 2.6% |
| Eastern Europe | 441 | 1.3% |
| Ecuador | 38 | 0.1% |
| Egypt | 45 | 0.1% |
| El Salvador | 15 | 0.0% |
| England | 66 | 0.2% |
| Ethiopia | 37 | 0.1% |
| Europe | 1,572 | 4.5% |
| Fiji | 3 | 0.0% |
| France | 79 | 0.2% |
| Germany | 157 | 0.4% |
| Greece | 114 | 0.3% |
| Guatemala | 225 | 0.6% |
| Guyana | 23 | 0.1% |
| Haiti | 233 | 0.7% |
| Honduras | 98 | 0.3% |
| Hong Kong | 84 | 0.2% |
| India | 1,165 | 3.3% |
| Indonesia | 34 | 0.1% |
| Iran | 152 | 0.4% |
| Iraq | 28 | 0.1% |
| Ireland | 89 | 0.3% |
| Israel | 32 | 0.1% |
| Italy | 415 | 1.2% |
| Jamaica | 6 | 0.0% |
| Japan | 15 | 0.0% |
| Kazakhstan | 10 | 0.0% |
| Kenya | 342 | 1.0% |
| Korea | 210 | 0.6% |
| Latin America | 1,980 | 5.6% |
| Latvia | 9 | 0.0% |
| Lebanon | 300 | 0.9% |
| Malaysia | 45 | 0.1% |
| Mexico | 93 | 0.3% |
| Middle Africa | 120 | 0.3% |
| Moldova | 41 | 0.1% |
| Morocco | 237 | 0.7% |
| Nepal | 105 | 0.3% |
| Netherlands | 22 | 0.1% |
| Nicaragua | 15 | 0.0% |
| Nigeria | 52 | 0.2% |
| Northern Africa | 294 | 0.8% |
| Northern Europe | 249 | 0.7% |
| Oceania | 58 | 0.2% |
| Pakistan | 131 | 0.4% |
| Peru | 72 | 0.2% |
| Philippines | 145 | 0.4% |
| Poland | 34 | 0.1% |
| Portugal | 95 | 0.3% |
| Romania | 58 | 0.2% |
| Russia | 118 | 0.3% |
| Saudi Arabia | 46 | 0.1% |
| Singapore | 7 | 0.0% |
| South Africa | 9 | 0.0% |
| South America | 1,077 | 3.1% |
| South Central Asia | 1,642 | 4.7% |
| South Eastern Asia | 399 | 1.1% |
| Southern Europe | 624 | 1.8% |
| Sri Lanka | 18 | 0.1% |
| Syria | 152 | 0.4% |
| Taiwan | 144 | 0.4% |
| Thailand | 23 | 0.1% |
| Trinidad and Tobago | 26 | 0.1% |
| Turkey | 272 | 0.8% |
| Uganda | 63 | 0.2% |
| Ukraine | 60 | 0.2% |
| Uruguay | 17 | 0.1% |
| Uzbekistan | 31 | 0.1% |
| Venezuela | 41 | 0.1% |
| Vietnam | 63 | 0.2% |
| Western Africa | 61 | 0.2% |
| Western Asia | 1,200 | 3.4% |
| Western Europe | 258 | 0.7% |
| Zimbabwe | 21 | 0.1% | View All 95 Rows |
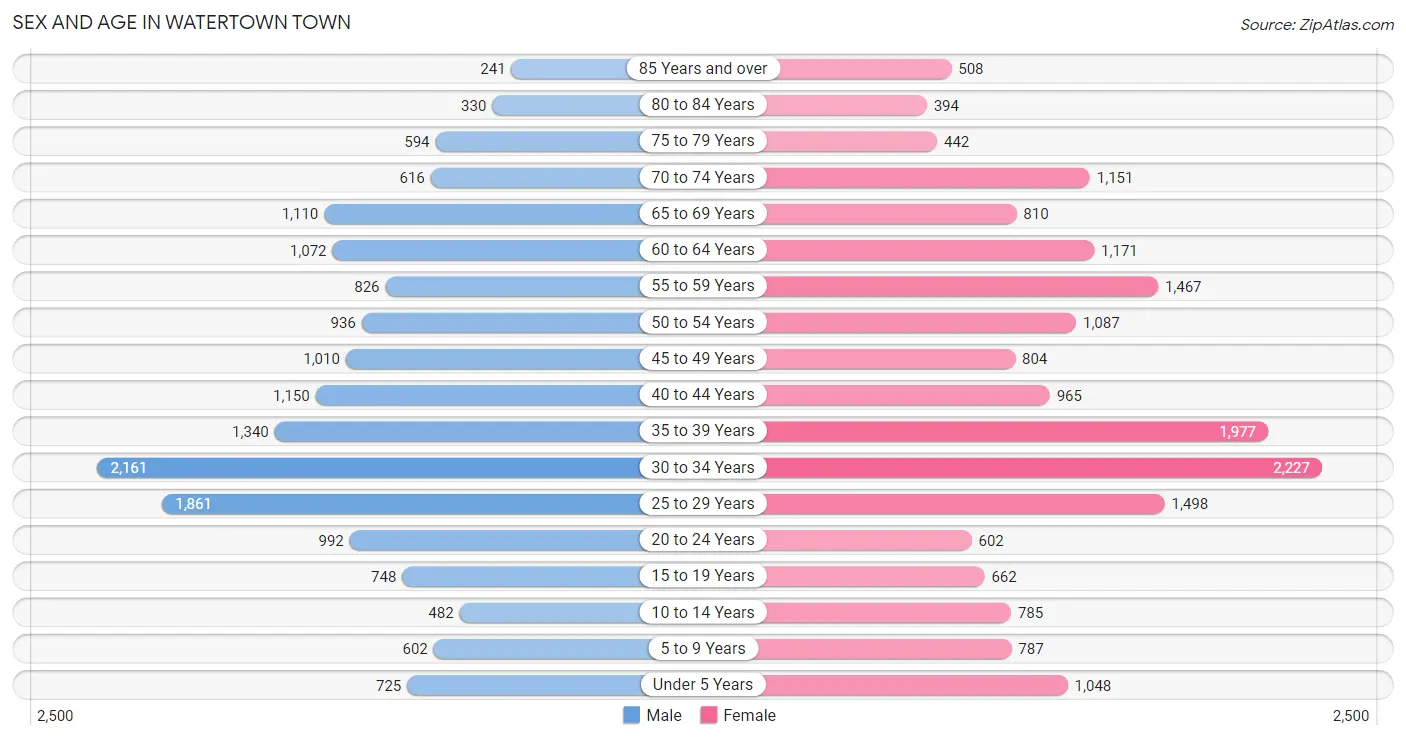
Sex and Age in Watertown Town
Sex and Age in Watertown Town
The most populous age groups in Watertown Town are 30 to 34 Years (2,161 | 12.9%) for men and 30 to 34 Years (2,227 | 12.1%) for women.
| Age Bracket | Male | Female |
| Under 5 Years | 725 (4.3%) | 1,048 (5.7%) |
| 5 to 9 Years | 602 (3.6%) | 787 (4.3%) |
| 10 to 14 Years | 482 (2.9%) | 785 (4.3%) |
| 15 to 19 Years | 748 (4.4%) | 662 (3.6%) |
| 20 to 24 Years | 992 (5.9%) | 602 (3.3%) |
| 25 to 29 Years | 1,861 (11.1%) | 1,498 (8.2%) |
| 30 to 34 Years | 2,161 (12.9%) | 2,227 (12.1%) |
| 35 to 39 Years | 1,340 (8.0%) | 1,977 (10.7%) |
| 40 to 44 Years | 1,150 (6.9%) | 965 (5.2%) |
| 45 to 49 Years | 1,010 (6.0%) | 804 (4.4%) |
| 50 to 54 Years | 936 (5.6%) | 1,087 (5.9%) |
| 55 to 59 Years | 826 (4.9%) | 1,467 (8.0%) |
| 60 to 64 Years | 1,072 (6.4%) | 1,171 (6.4%) |
| 65 to 69 Years | 1,110 (6.6%) | 810 (4.4%) |
| 70 to 74 Years | 616 (3.7%) | 1,151 (6.3%) |
| 75 to 79 Years | 594 (3.5%) | 442 (2.4%) |
| 80 to 84 Years | 330 (2.0%) | 394 (2.1%) |
| 85 Years and over | 241 (1.4%) | 508 (2.8%) |
| Total | 16,796 (100.0%) | 18,385 (100.0%) |
Families and Households in Watertown Town
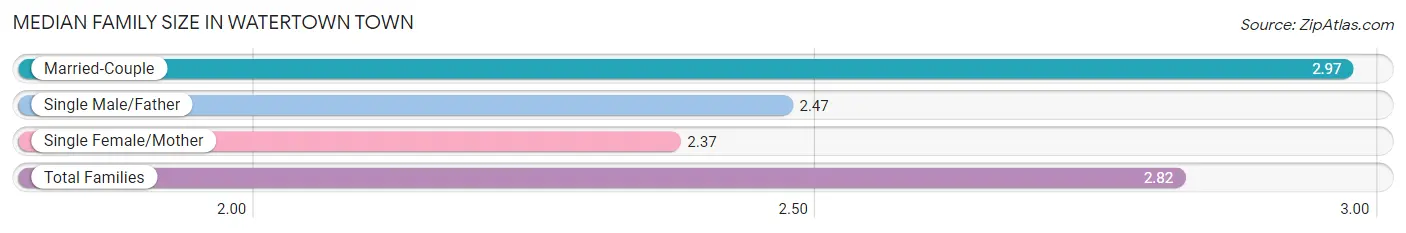
Median Family Size in Watertown Town
The median family size in Watertown Town is 2.82 persons per family, with married-couple families (6,538 | 74.4%) accounting for the largest median family size of 2.97 persons per family. On the other hand, single female/mother families (1,639 | 18.6%) represent the smallest median family size with 2.37 persons per family.
| Family Type | # Families | Family Size |
| Married-Couple | 6,538 (74.4%) | 2.97 |
| Single Male/Father | 613 (7.0%) | 2.47 |
| Single Female/Mother | 1,639 (18.6%) | 2.37 |
| Total Families | 8,790 (100.0%) | 2.82 |
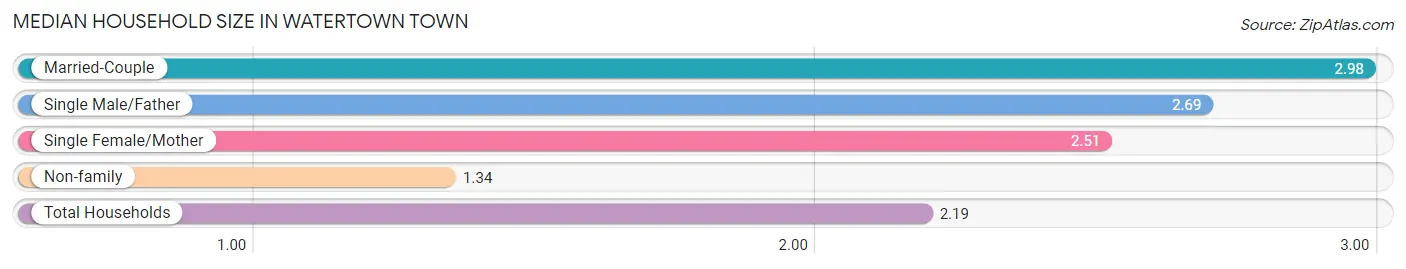
Median Household Size in Watertown Town
The median household size in Watertown Town is 2.19 persons per household, with married-couple households (6,538 | 41.0%) accounting for the largest median household size of 2.98 persons per household. non-family households (7,154 | 44.9%) represent the smallest median household size with 1.34 persons per household.
| Household Type | # Households | Household Size |
| Married-Couple | 6,538 (41.0%) | 2.98 |
| Single Male/Father | 613 (3.8%) | 2.69 |
| Single Female/Mother | 1,639 (10.3%) | 2.51 |
| Non-family | 7,154 (44.9%) | 1.34 |
| Total Households | 15,944 (100.0%) | 2.19 |
Household Size by Marriage Status in Watertown Town
Out of a total of 15,944 households in Watertown Town, 8,790 (55.1%) are family households, while 7,154 (44.9%) are nonfamily households. The most numerous type of family households are 2-person households, comprising 4,069, and the most common type of nonfamily households are 1-person households, comprising 5,158.
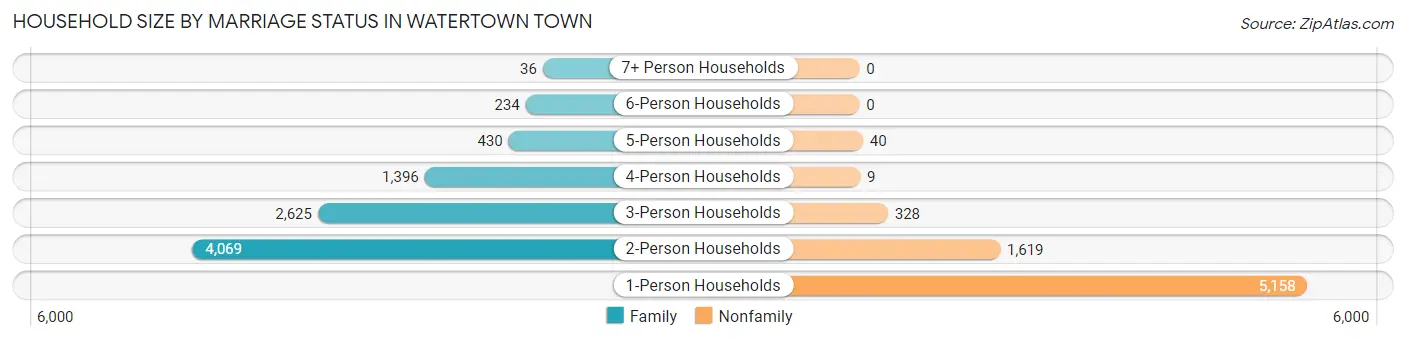
| Household Size | Family Households | Nonfamily Households |
| 1-Person Households | - | 5,158 (32.4%) |
| 2-Person Households | 4,069 (25.5%) | 1,619 (10.2%) |
| 3-Person Households | 2,625 (16.5%) | 328 (2.1%) |
| 4-Person Households | 1,396 (8.8%) | 9 (0.1%) |
| 5-Person Households | 430 (2.7%) | 40 (0.3%) |
| 6-Person Households | 234 (1.5%) | 0 (0.0%) |
| 7+ Person Households | 36 (0.2%) | 0 (0.0%) |
| Total | 8,790 (55.1%) | 7,154 (44.9%) |
Female Fertility in Watertown Town
Fertility by Age in Watertown Town
Average fertility rate in Watertown Town is 49.0 births per 1,000 women. Women in the age bracket of 20 to 34 years have the highest fertility rate with 55.0 births per 1,000 women. Women in the age bracket of 20 to 34 years acount for 54.1% of all women with births.
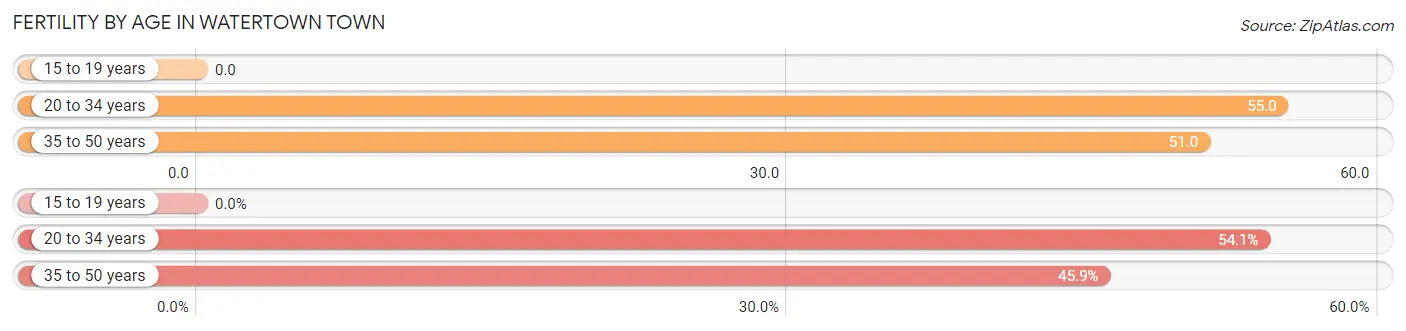
| Age Bracket | Women with Births | Births / 1,000 Women |
| 15 to 19 years | 0 (0.0%) | 0.0 |
| 20 to 34 years | 239 (54.1%) | 55.0 |
| 35 to 50 years | 203 (45.9%) | 51.0 |
| Total | 442 (100.0%) | 49.0 |
Fertility by Age by Marriage Status in Watertown Town
92.1% of women with births (442) in Watertown Town are married. The highest percentage of unmarried women with births falls into 35 to 50 years age bracket with 8.4% of them unmarried at the time of birth, while the lowest percentage of unmarried women with births belong to 20 to 34 years age bracket with 7.5% of them unmarried.
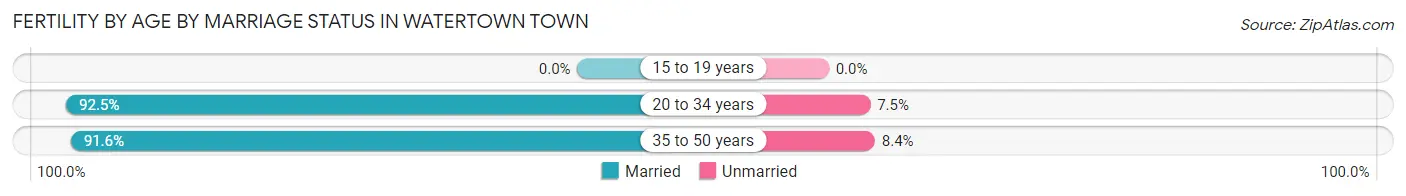
| Age Bracket | Married | Unmarried |
| 15 to 19 years | 0 (0.0%) | 0 (0.0%) |
| 20 to 34 years | 221 (92.5%) | 18 (7.5%) |
| 35 to 50 years | 186 (91.6%) | 17 (8.4%) |
| Total | 407 (92.1%) | 35 (7.9%) |
Fertility by Education in Watertown Town
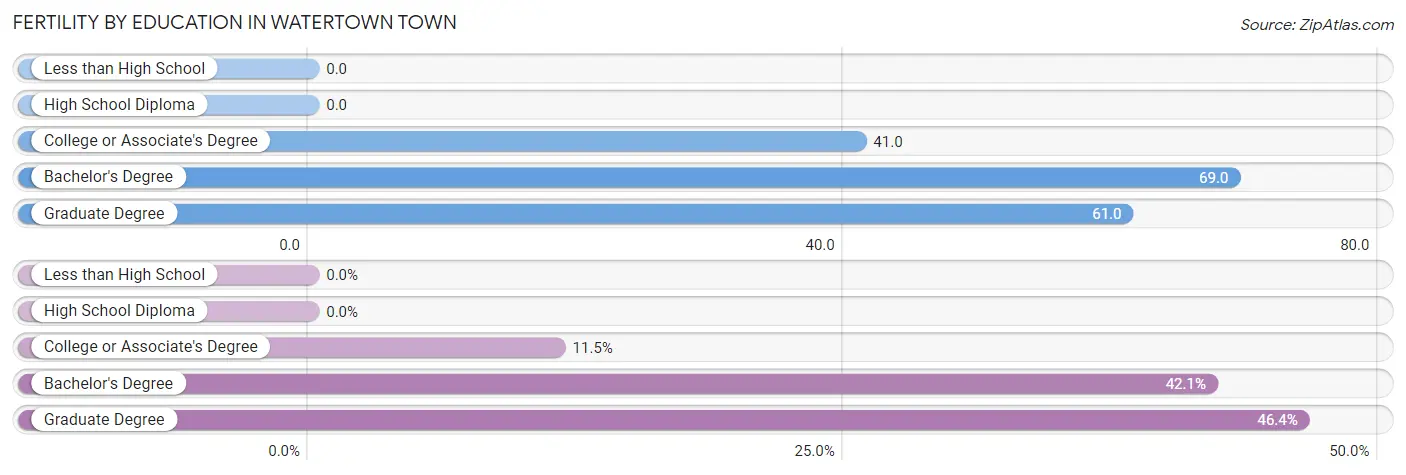
| Educational Attainment | Women with Births | Births / 1,000 Women |
| Less than High School | 0 (0.0%) | 0.0 |
| High School Diploma | 0 (0.0%) | 0.0 |
| College or Associate's Degree | 51 (11.5%) | 41.0 |
| Bachelor's Degree | 186 (42.1%) | 69.0 |
| Graduate Degree | 205 (46.4%) | 61.0 |
| Total | 442 (100.0%) | 49.0 |
Fertility by Education by Marriage Status in Watertown Town
7.9% of women with births in Watertown Town are unmarried. Women with the educational attainment of graduate degree are most likely to be married with 100.0% of them married at childbirth, while women with the educational attainment of college or associate's degree are least likely to be married with 21.6% of them unmarried at childbirth.
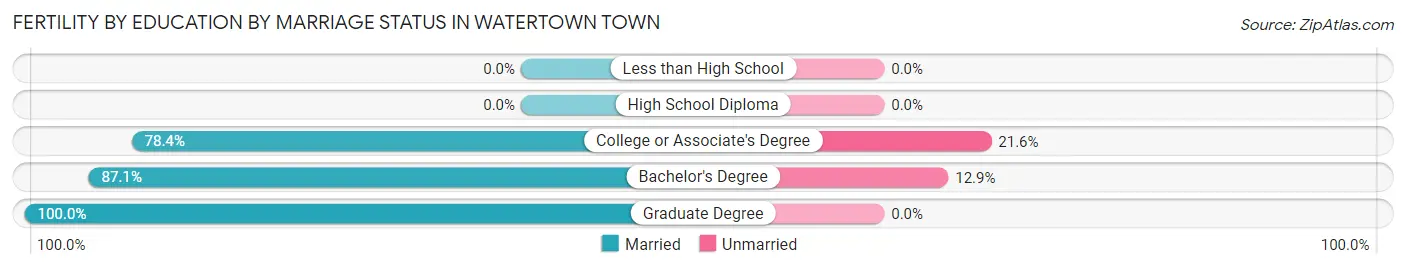
| Educational Attainment | Married | Unmarried |
| Less than High School | 0 (0.0%) | 0 (0.0%) |
| High School Diploma | 0 (0.0%) | 0 (0.0%) |
| College or Associate's Degree | 40 (78.4%) | 11 (21.6%) |
| Bachelor's Degree | 162 (87.1%) | 24 (12.9%) |
| Graduate Degree | 205 (100.0%) | 0 (0.0%) |
| Total | 407 (92.1%) | 35 (7.9%) |
Employment Characteristics in Watertown Town
Employment by Class of Employer in Watertown Town
Among the 20,818 employed individuals in Watertown Town, private company employees (12,530 | 60.2%), not-for-profit organizations (4,328 | 20.8%), and self-employed (not incorporated) (1,276 | 6.1%) make up the most common classes of employment.
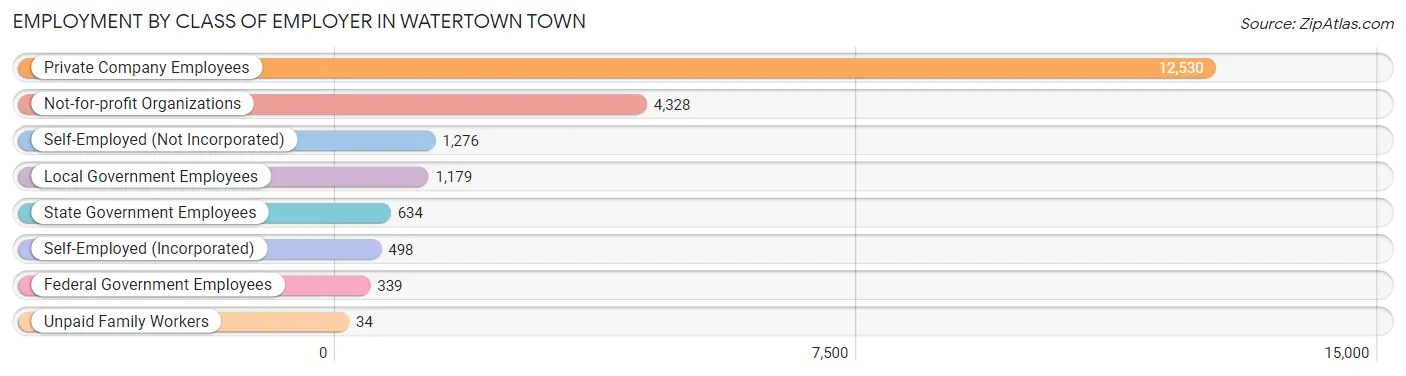
| Employer Class | # Employees | % Employees |
| Private Company Employees | 12,530 | 60.2% |
| Self-Employed (Incorporated) | 498 | 2.4% |
| Self-Employed (Not Incorporated) | 1,276 | 6.1% |
| Not-for-profit Organizations | 4,328 | 20.8% |
| Local Government Employees | 1,179 | 5.7% |
| State Government Employees | 634 | 3.0% |
| Federal Government Employees | 339 | 1.6% |
| Unpaid Family Workers | 34 | 0.2% |
| Total | 20,818 | 100.0% |
Employment Status by Age in Watertown Town
According to the labor force statistics for Watertown Town, out of the total population over 16 years of age (30,577), 73.8% or 22,566 individuals are in the labor force, with 5.7% or 1,286 of them unemployed. The age group with the highest labor force participation rate is 25 to 29 years, with 93.5% or 3,141 individuals in the labor force. Within the labor force, the 20 to 24 years age range has the highest percentage of unemployed individuals, with 20.3% or 214 of them being unemployed.
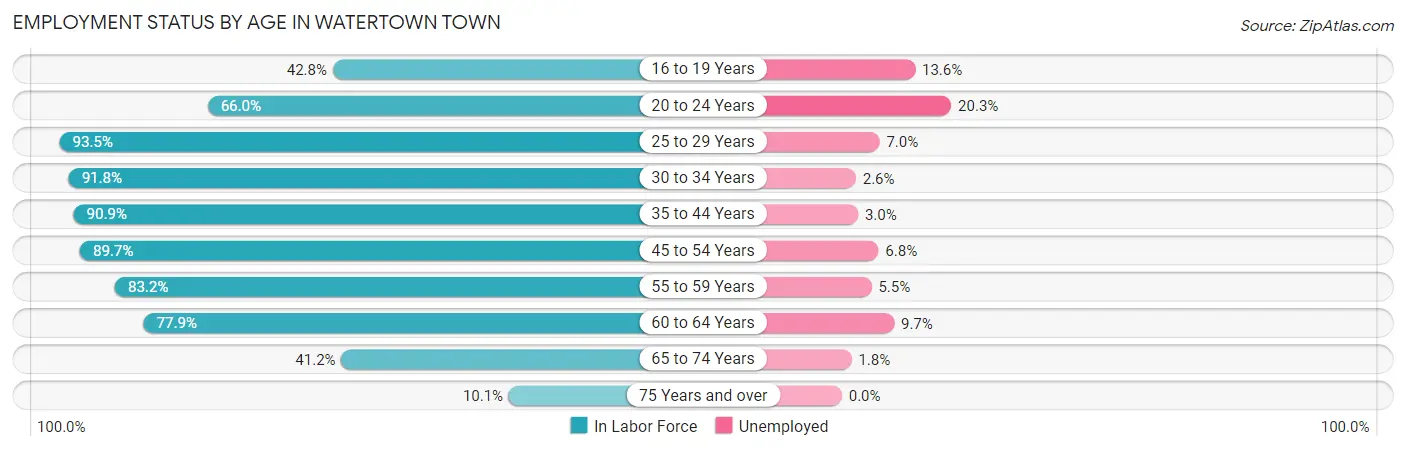
| Age Bracket | In Labor Force | Unemployed |
| 16 to 19 Years | 529 (42.8%) | 72 (13.6%) |
| 20 to 24 Years | 1,052 (66.0%) | 214 (20.3%) |
| 25 to 29 Years | 3,141 (93.5%) | 220 (7.0%) |
| 30 to 34 Years | 4,028 (91.8%) | 105 (2.6%) |
| 35 to 44 Years | 4,938 (90.9%) | 148 (3.0%) |
| 45 to 54 Years | 3,442 (89.7%) | 234 (6.8%) |
| 55 to 59 Years | 1,908 (83.2%) | 105 (5.5%) |
| 60 to 64 Years | 1,747 (77.9%) | 169 (9.7%) |
| 65 to 74 Years | 1,519 (41.2%) | 27 (1.8%) |
| 75 Years and over | 253 (10.1%) | 0 (0.0%) |
| Total | 22,566 (73.8%) | 1,286 (5.7%) |
Employment Status by Educational Attainment in Watertown Town
According to labor force statistics for Watertown Town, 89.1% of individuals (19,203) out of the total population between 25 and 64 years of age (21,552) are in the labor force, with 5.1% or 979 of them being unemployed. The group with the highest labor force participation rate are those with the educational attainment of bachelor's degree or higher, with 92.6% or 14,291 individuals in the labor force. Within the labor force, individuals with less than high school education have the highest percentage of unemployment, with 19.6% or 63 of them being unemployed.
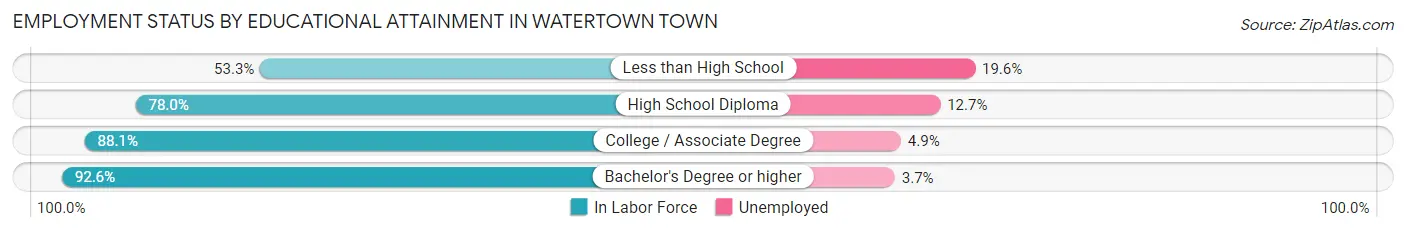
| Educational Attainment | In Labor Force | Unemployed |
| Less than High School | 322 (53.3%) | 118 (19.6%) |
| High School Diploma | 2,033 (78.0%) | 331 (12.7%) |
| College / Associate Degree | 2,562 (88.1%) | 142 (4.9%) |
| Bachelor's Degree or higher | 14,291 (92.6%) | 571 (3.7%) |
| Total | 19,203 (89.1%) | 1,099 (5.1%) |
Employment Occupations by Sex in Watertown Town
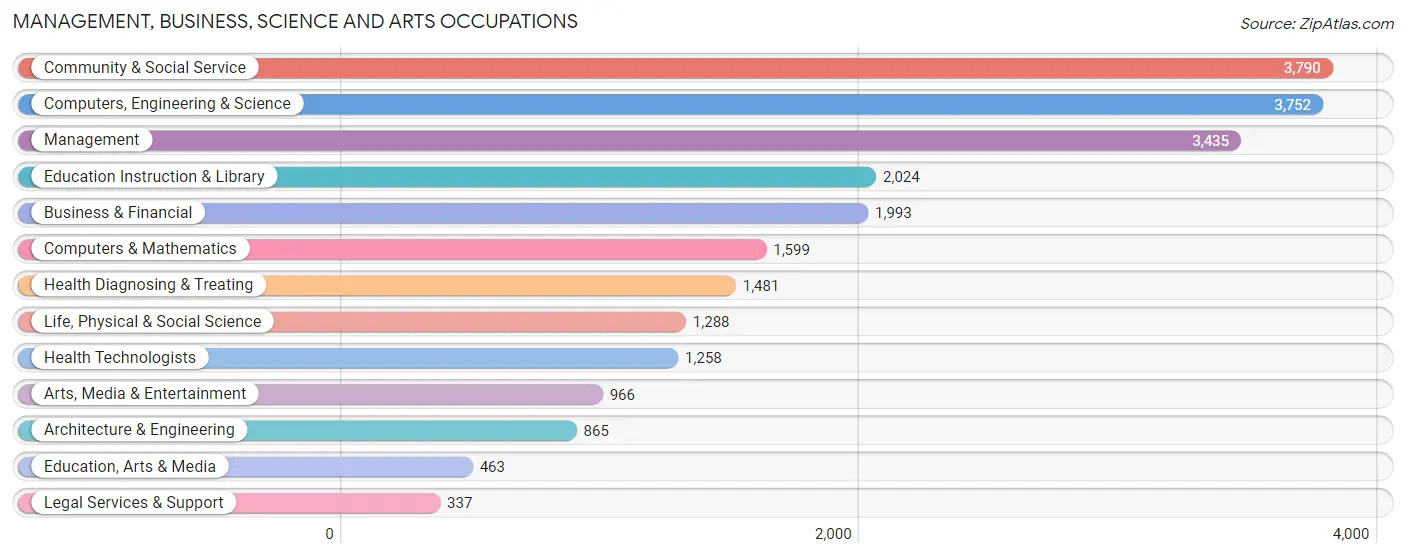
Management, Business, Science and Arts Occupations
The most common Management, Business, Science and Arts occupations in Watertown Town are Community & Social Service (3,790 | 17.8%), Computers, Engineering & Science (3,752 | 17.6%), Management (3,435 | 16.2%), Education Instruction & Library (2,024 | 9.5%), and Business & Financial (1,993 | 9.4%).
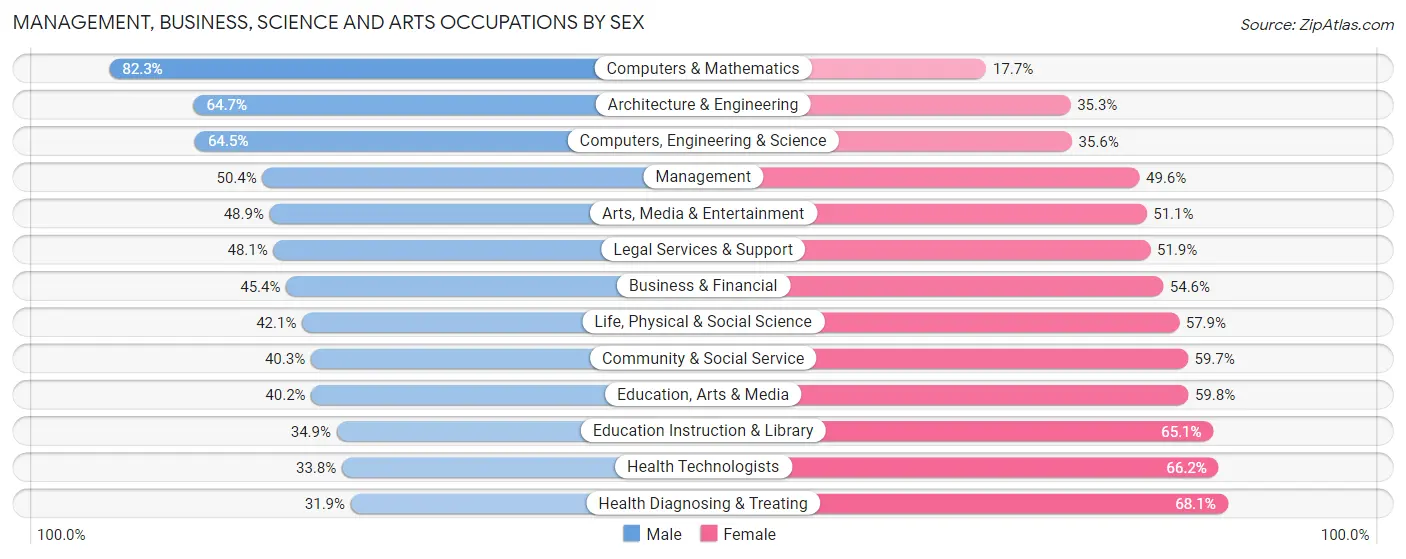
Management, Business, Science and Arts Occupations by Sex
Within the Management, Business, Science and Arts occupations in Watertown Town, the most male-oriented occupations are Computers & Mathematics (82.3%), Architecture & Engineering (64.7%), and Computers, Engineering & Science (64.4%), while the most female-oriented occupations are Health Diagnosing & Treating (68.1%), Health Technologists (66.2%), and Education Instruction & Library (65.1%).
| Occupation | Male | Female |
| Management | 1,730 (50.4%) | 1,705 (49.6%) |
| Business & Financial | 905 (45.4%) | 1,088 (54.6%) |
| Computers, Engineering & Science | 2,418 (64.4%) | 1,334 (35.5%) |
| Computers & Mathematics | 1,316 (82.3%) | 283 (17.7%) |
| Architecture & Engineering | 560 (64.7%) | 305 (35.3%) |
| Life, Physical & Social Science | 542 (42.1%) | 746 (57.9%) |
| Community & Social Service | 1,526 (40.3%) | 2,264 (59.7%) |
| Education, Arts & Media | 186 (40.2%) | 277 (59.8%) |
| Legal Services & Support | 162 (48.1%) | 175 (51.9%) |
| Education Instruction & Library | 706 (34.9%) | 1,318 (65.1%) |
| Arts, Media & Entertainment | 472 (48.9%) | 494 (51.1%) |
| Health Diagnosing & Treating | 473 (31.9%) | 1,008 (68.1%) |
| Health Technologists | 425 (33.8%) | 833 (66.2%) |
| Total (Category) | 7,052 (48.8%) | 7,399 (51.2%) |
| Total (Overall) | 10,866 (51.1%) | 10,397 (48.9%) |
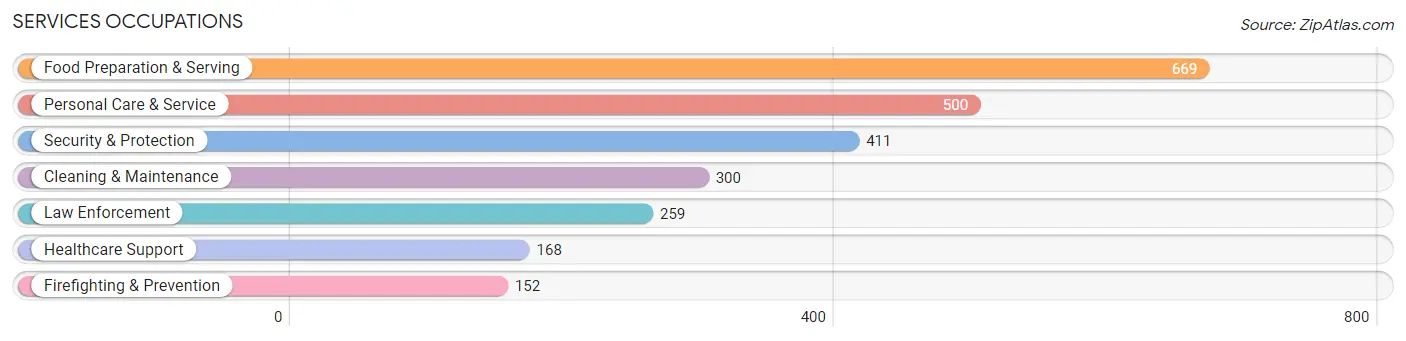
Services Occupations
The most common Services occupations in Watertown Town are Food Preparation & Serving (669 | 3.2%), Personal Care & Service (500 | 2.4%), Security & Protection (411 | 1.9%), Cleaning & Maintenance (300 | 1.4%), and Law Enforcement (259 | 1.2%).
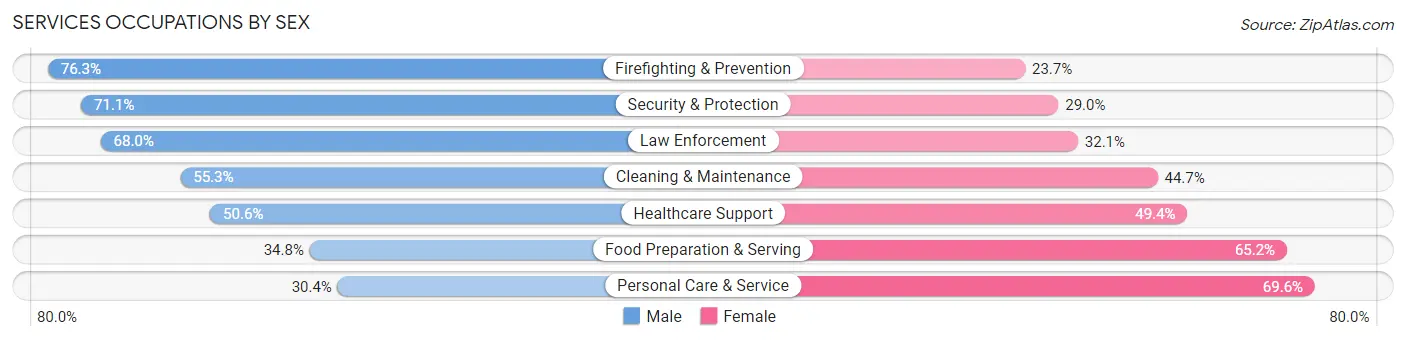
Services Occupations by Sex
Within the Services occupations in Watertown Town, the most male-oriented occupations are Firefighting & Prevention (76.3%), Security & Protection (71.1%), and Law Enforcement (67.9%), while the most female-oriented occupations are Personal Care & Service (69.6%), Food Preparation & Serving (65.2%), and Healthcare Support (49.4%).
| Occupation | Male | Female |
| Healthcare Support | 85 (50.6%) | 83 (49.4%) |
| Security & Protection | 292 (71.1%) | 119 (28.9%) |
| Firefighting & Prevention | 116 (76.3%) | 36 (23.7%) |
| Law Enforcement | 176 (67.9%) | 83 (32.1%) |
| Food Preparation & Serving | 233 (34.8%) | 436 (65.2%) |
| Cleaning & Maintenance | 166 (55.3%) | 134 (44.7%) |
| Personal Care & Service | 152 (30.4%) | 348 (69.6%) |
| Total (Category) | 928 (45.3%) | 1,120 (54.7%) |
| Total (Overall) | 10,866 (51.1%) | 10,397 (48.9%) |
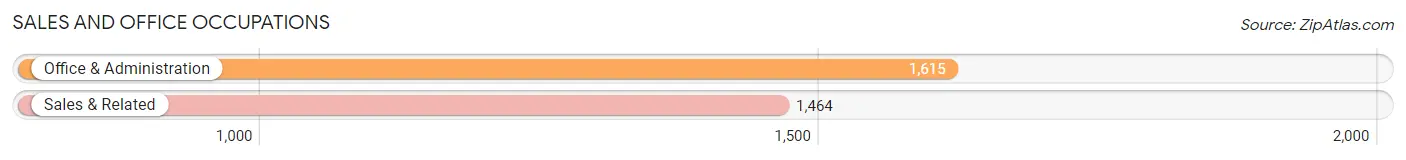
Sales and Office Occupations
The most common Sales and Office occupations in Watertown Town are Office & Administration (1,615 | 7.6%), and Sales & Related (1,464 | 6.9%).
Sales and Office Occupations by Sex
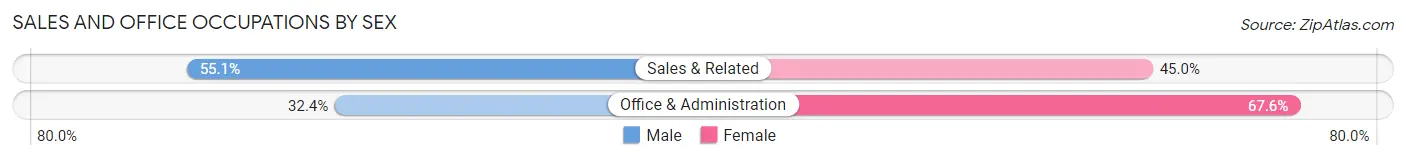
| Occupation | Male | Female |
| Sales & Related | 806 (55.0%) | 658 (45.0%) |
| Office & Administration | 523 (32.4%) | 1,092 (67.6%) |
| Total (Category) | 1,329 (43.2%) | 1,750 (56.8%) |
| Total (Overall) | 10,866 (51.1%) | 10,397 (48.9%) |
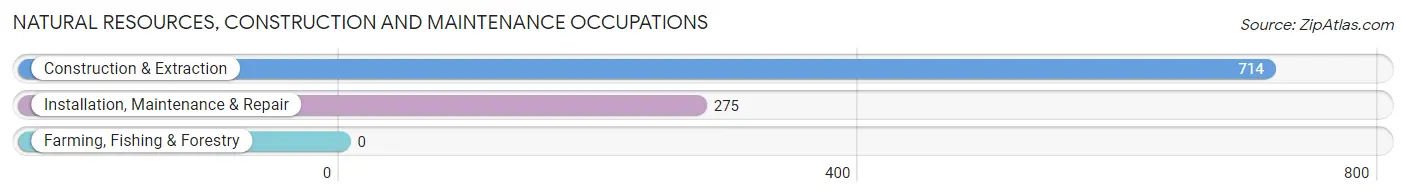
Natural Resources, Construction and Maintenance Occupations
The most common Natural Resources, Construction and Maintenance occupations in Watertown Town are Construction & Extraction (714 | 3.4%), and Installation, Maintenance & Repair (275 | 1.3%).
Natural Resources, Construction and Maintenance Occupations by Sex
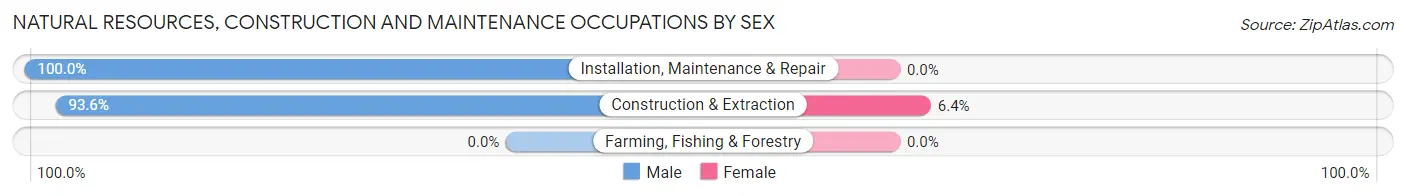
| Occupation | Male | Female |
| Farming, Fishing & Forestry | 0 (0.0%) | 0 (0.0%) |
| Construction & Extraction | 668 (93.6%) | 46 (6.4%) |
| Installation, Maintenance & Repair | 275 (100.0%) | 0 (0.0%) |
| Total (Category) | 943 (95.4%) | 46 (4.6%) |
| Total (Overall) | 10,866 (51.1%) | 10,397 (48.9%) |
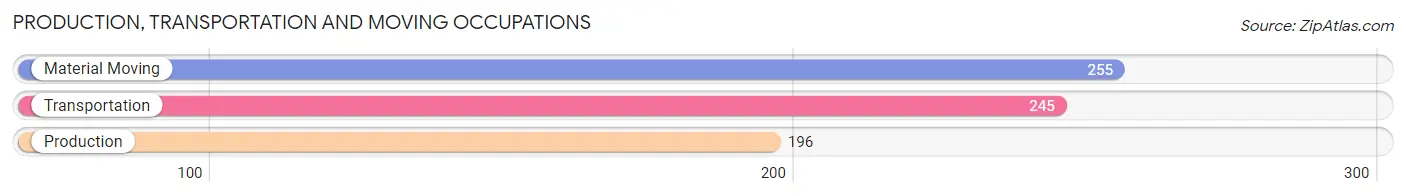
Production, Transportation and Moving Occupations
The most common Production, Transportation and Moving occupations in Watertown Town are Material Moving (255 | 1.2%), Transportation (245 | 1.1%), and Production (196 | 0.9%).
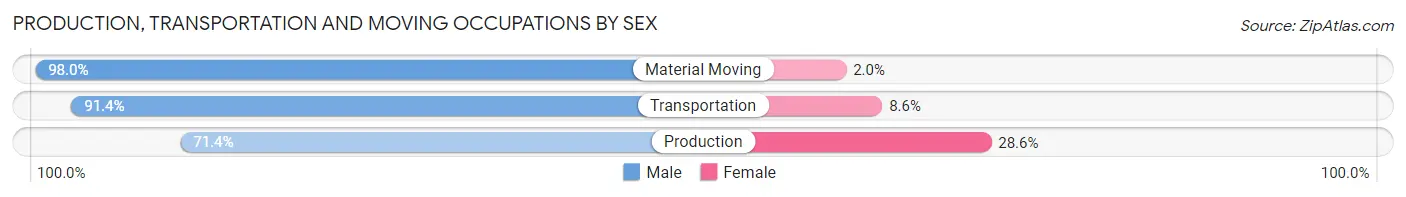
Production, Transportation and Moving Occupations by Sex
| Occupation | Male | Female |
| Production | 140 (71.4%) | 56 (28.6%) |
| Transportation | 224 (91.4%) | 21 (8.6%) |
| Material Moving | 250 (98.0%) | 5 (2.0%) |
| Total (Category) | 614 (88.2%) | 82 (11.8%) |
| Total (Overall) | 10,866 (51.1%) | 10,397 (48.9%) |
Employment Industries by Sex in Watertown Town
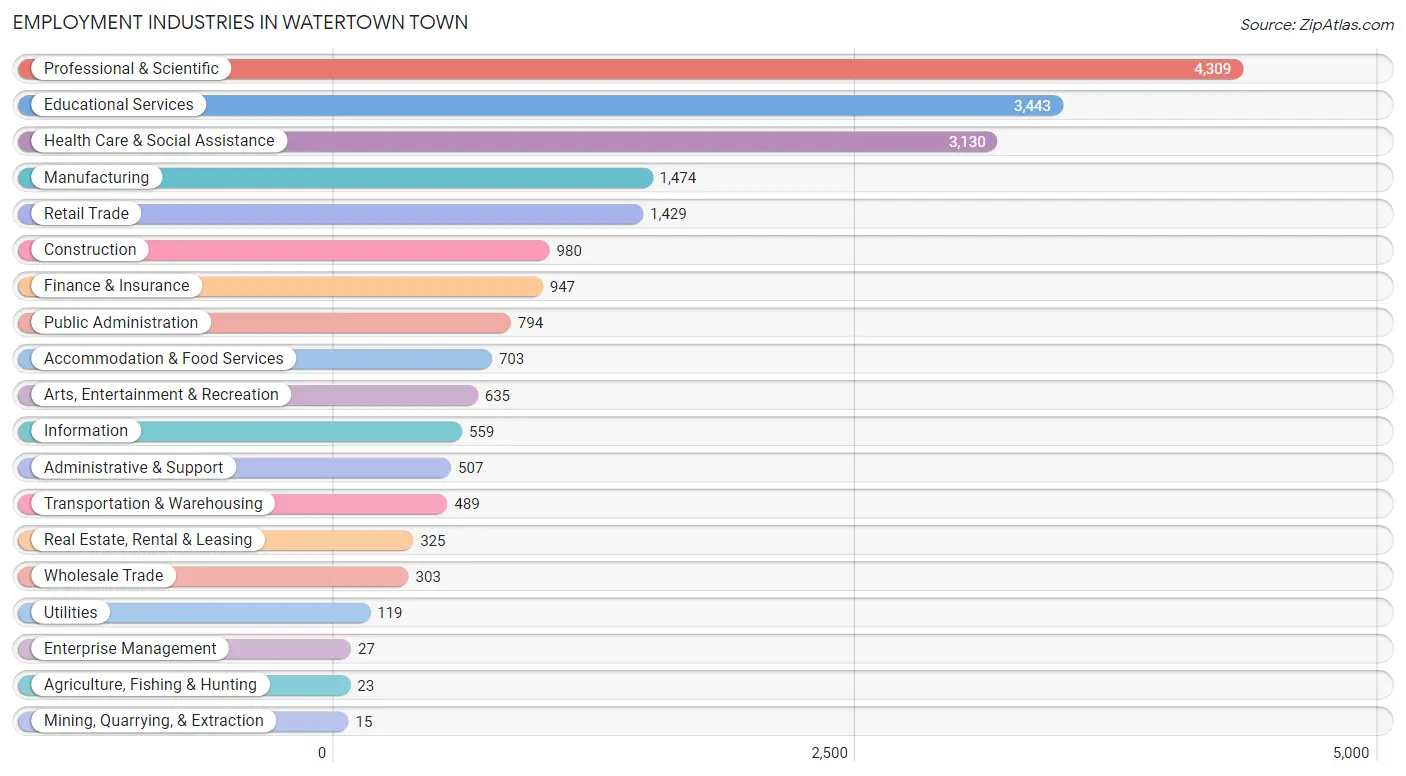
Employment Industries in Watertown Town
The major employment industries in Watertown Town include Professional & Scientific (4,309 | 20.3%), Educational Services (3,443 | 16.2%), Health Care & Social Assistance (3,130 | 14.7%), Manufacturing (1,474 | 6.9%), and Retail Trade (1,429 | 6.7%).
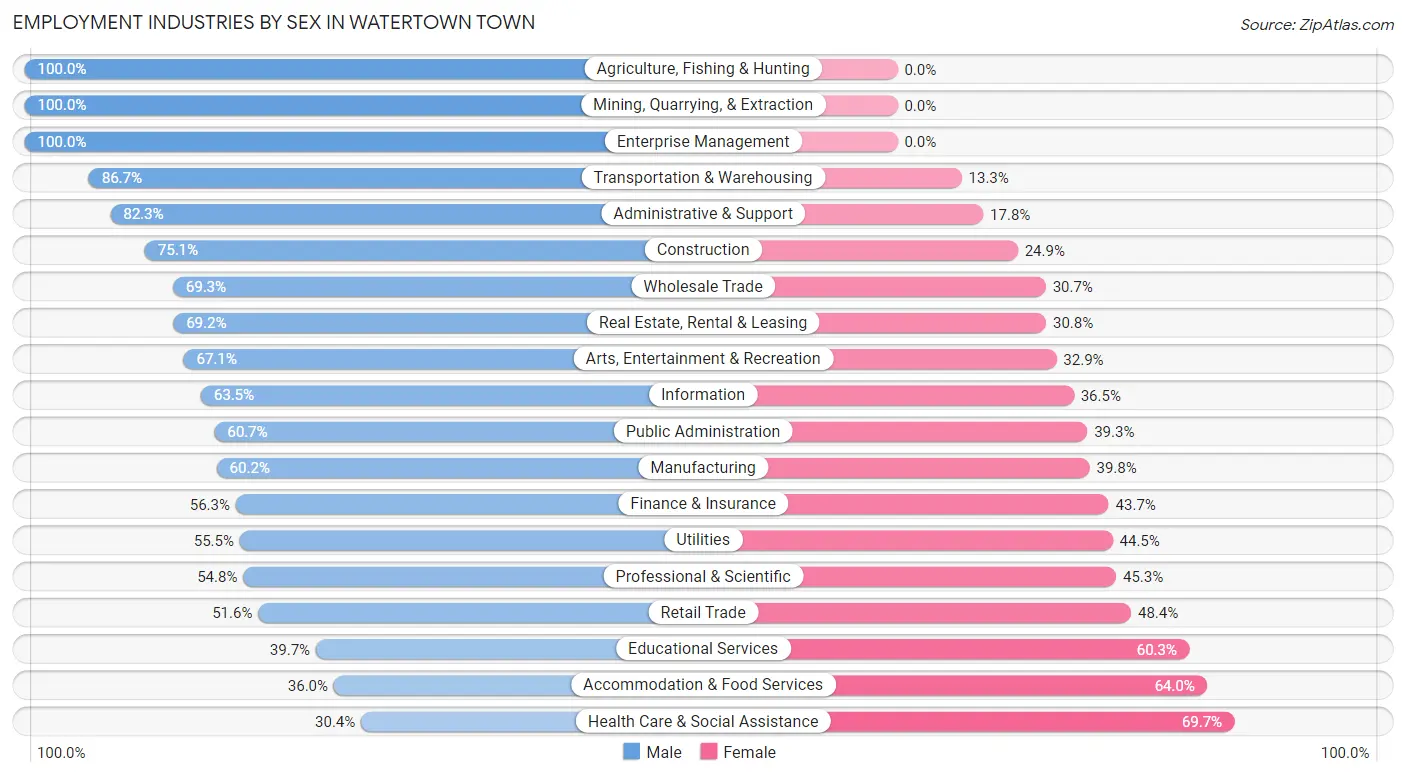
Employment Industries by Sex in Watertown Town
The Watertown Town industries that see more men than women are Agriculture, Fishing & Hunting (100.0%), Mining, Quarrying, & Extraction (100.0%), and Enterprise Management (100.0%), whereas the industries that tend to have a higher number of women are Health Care & Social Assistance (69.7%), Accommodation & Food Services (64.0%), and Educational Services (60.3%).
| Industry | Male | Female |
| Agriculture, Fishing & Hunting | 23 (100.0%) | 0 (0.0%) |
| Mining, Quarrying, & Extraction | 15 (100.0%) | 0 (0.0%) |
| Construction | 736 (75.1%) | 244 (24.9%) |
| Manufacturing | 888 (60.2%) | 586 (39.8%) |
| Wholesale Trade | 210 (69.3%) | 93 (30.7%) |
| Retail Trade | 738 (51.6%) | 691 (48.4%) |
| Transportation & Warehousing | 424 (86.7%) | 65 (13.3%) |
| Utilities | 66 (55.5%) | 53 (44.5%) |
| Information | 355 (63.5%) | 204 (36.5%) |
| Finance & Insurance | 533 (56.3%) | 414 (43.7%) |
| Real Estate, Rental & Leasing | 225 (69.2%) | 100 (30.8%) |
| Professional & Scientific | 2,359 (54.7%) | 1,950 (45.3%) |
| Enterprise Management | 27 (100.0%) | 0 (0.0%) |
| Administrative & Support | 417 (82.3%) | 90 (17.7%) |
| Educational Services | 1,367 (39.7%) | 2,076 (60.3%) |
| Health Care & Social Assistance | 950 (30.3%) | 2,180 (69.7%) |
| Arts, Entertainment & Recreation | 426 (67.1%) | 209 (32.9%) |
| Accommodation & Food Services | 253 (36.0%) | 450 (64.0%) |
| Public Administration | 482 (60.7%) | 312 (39.3%) |
| Total | 10,866 (51.1%) | 10,397 (48.9%) |
Education in Watertown Town
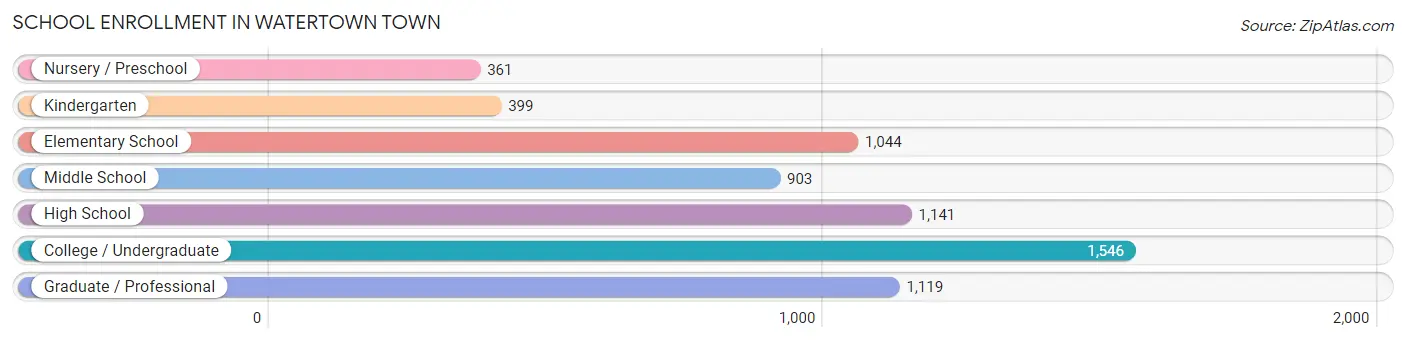
School Enrollment in Watertown Town
The most common levels of schooling among the 6,513 students in Watertown Town are college / undergraduate (1,546 | 23.7%), high school (1,141 | 17.5%), and graduate / professional (1,119 | 17.2%).
| School Level | # Students | % Students |
| Nursery / Preschool | 361 | 5.5% |
| Kindergarten | 399 | 6.1% |
| Elementary School | 1,044 | 16.0% |
| Middle School | 903 | 13.9% |
| High School | 1,141 | 17.5% |
| College / Undergraduate | 1,546 | 23.7% |
| Graduate / Professional | 1,119 | 17.2% |
| Total | 6,513 | 100.0% |
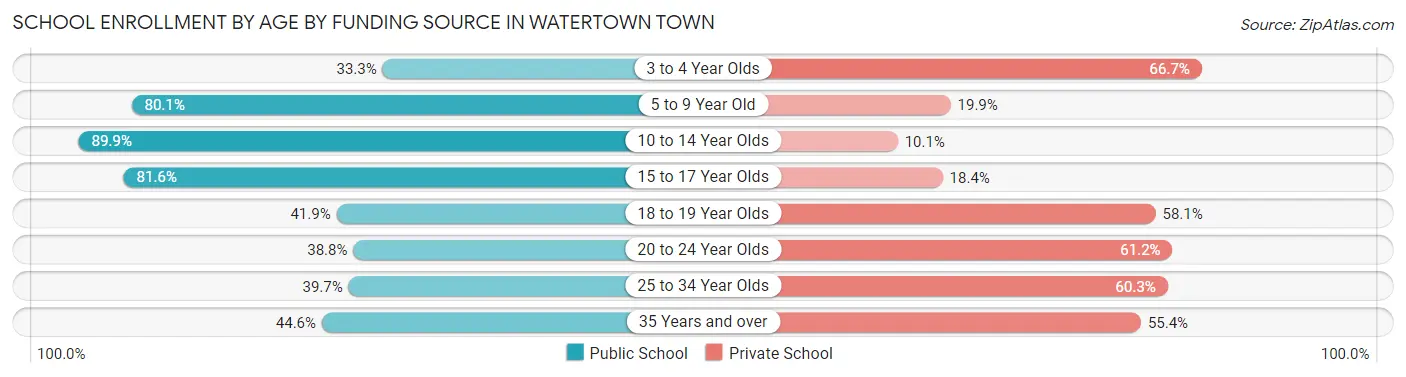
School Enrollment by Age by Funding Source in Watertown Town
Out of a total of 6,513 students who are enrolled in schools in Watertown Town, 2,527 (38.8%) attend a private institution, while the remaining 3,986 (61.2%) are enrolled in public schools. The age group of 3 to 4 year olds has the highest likelihood of being enrolled in private schools, with 218 (66.7% in the age bracket) enrolled. Conversely, the age group of 10 to 14 year olds has the lowest likelihood of being enrolled in a private school, with 1,010 (89.9% in the age bracket) attending a public institution.
| Age Bracket | Public School | Private School |
| 3 to 4 Year Olds | 109 (33.3%) | 218 (66.7%) |
| 5 to 9 Year Old | 1,061 (80.1%) | 264 (19.9%) |
| 10 to 14 Year Olds | 1,010 (89.9%) | 113 (10.1%) |
| 15 to 17 Year Olds | 575 (81.6%) | 130 (18.4%) |
| 18 to 19 Year Olds | 254 (41.9%) | 352 (58.1%) |
| 20 to 24 Year Olds | 390 (38.8%) | 616 (61.2%) |
| 25 to 34 Year Olds | 401 (39.7%) | 610 (60.3%) |
| 35 Years and over | 183 (44.6%) | 227 (55.4%) |
| Total | 3,986 (61.2%) | 2,527 (38.8%) |
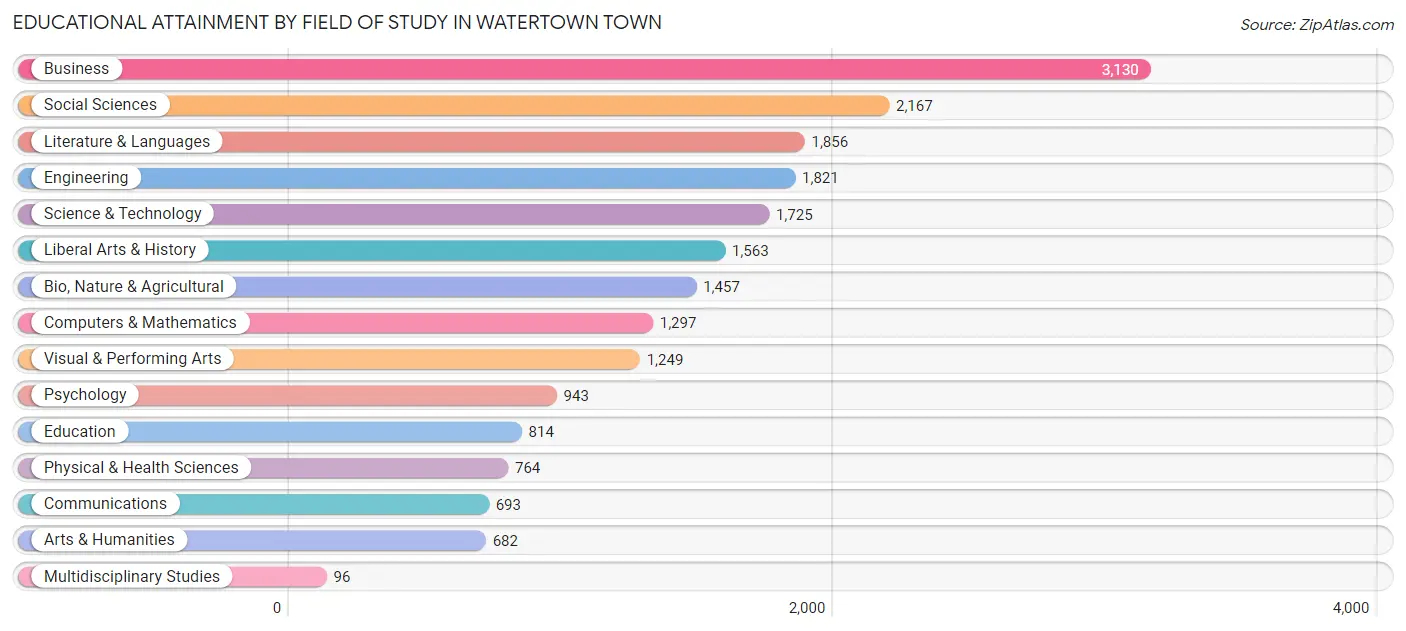
Educational Attainment by Field of Study in Watertown Town
Business (3,130 | 15.4%), social sciences (2,167 | 10.7%), literature & languages (1,856 | 9.2%), engineering (1,821 | 9.0%), and science & technology (1,725 | 8.5%) are the most common fields of study among 20,257 individuals in Watertown Town who have obtained a bachelor's degree or higher.
| Field of Study | # Graduates | % Graduates |
| Computers & Mathematics | 1,297 | 6.4% |
| Bio, Nature & Agricultural | 1,457 | 7.2% |
| Physical & Health Sciences | 764 | 3.8% |
| Psychology | 943 | 4.7% |
| Social Sciences | 2,167 | 10.7% |
| Engineering | 1,821 | 9.0% |
| Multidisciplinary Studies | 96 | 0.5% |
| Science & Technology | 1,725 | 8.5% |
| Business | 3,130 | 15.4% |
| Education | 814 | 4.0% |
| Literature & Languages | 1,856 | 9.2% |
| Liberal Arts & History | 1,563 | 7.7% |
| Visual & Performing Arts | 1,249 | 6.2% |
| Communications | 693 | 3.4% |
| Arts & Humanities | 682 | 3.4% |
| Total | 20,257 | 100.0% |
Transportation & Commute in Watertown Town
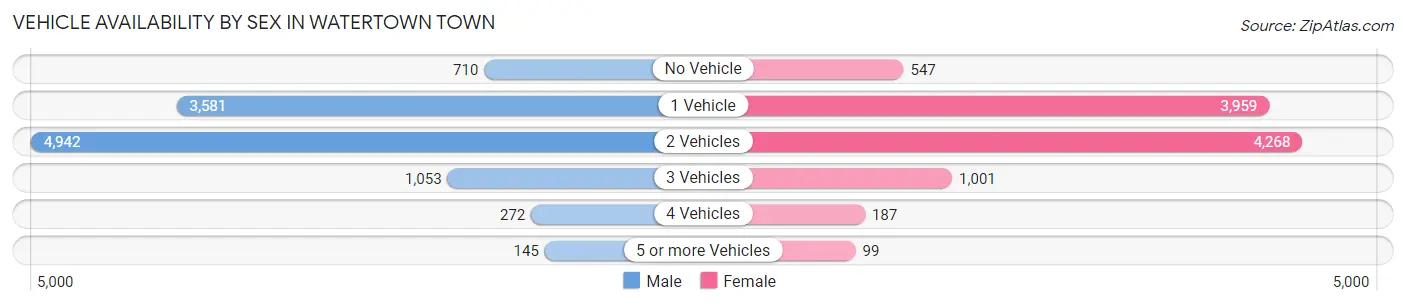
Vehicle Availability by Sex in Watertown Town
The most prevalent vehicle ownership categories in Watertown Town are males with 2 vehicles (4,942, accounting for 46.2%) and females with 2 vehicles (4,268, making up 49.1%).
| Vehicles Available | Male | Female |
| No Vehicle | 710 (6.6%) | 547 (5.4%) |
| 1 Vehicle | 3,581 (33.5%) | 3,959 (39.4%) |
| 2 Vehicles | 4,942 (46.2%) | 4,268 (42.4%) |
| 3 Vehicles | 1,053 (9.8%) | 1,001 (10.0%) |
| 4 Vehicles | 272 (2.5%) | 187 (1.9%) |
| 5 or more Vehicles | 145 (1.3%) | 99 (1.0%) |
| Total | 10,703 (100.0%) | 10,061 (100.0%) |
Commute Time in Watertown Town
The most frequently occuring commute durations in Watertown Town are 30 to 34 minutes (2,618 commuters, 16.2%), 20 to 24 minutes (2,341 commuters, 14.5%), and 10 to 14 minutes (1,841 commuters, 11.4%).
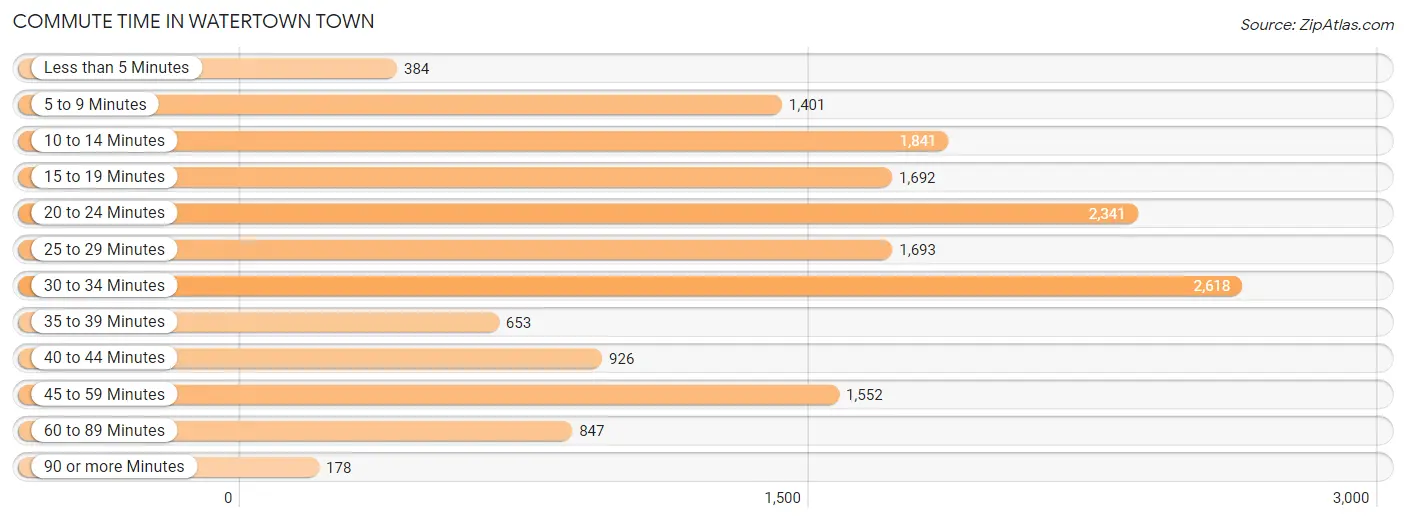
| Commute Time | # Commuters | % Commuters |
| Less than 5 Minutes | 384 | 2.4% |
| 5 to 9 Minutes | 1,401 | 8.7% |
| 10 to 14 Minutes | 1,841 | 11.4% |
| 15 to 19 Minutes | 1,692 | 10.5% |
| 20 to 24 Minutes | 2,341 | 14.5% |
| 25 to 29 Minutes | 1,693 | 10.5% |
| 30 to 34 Minutes | 2,618 | 16.2% |
| 35 to 39 Minutes | 653 | 4.1% |
| 40 to 44 Minutes | 926 | 5.7% |
| 45 to 59 Minutes | 1,552 | 9.6% |
| 60 to 89 Minutes | 847 | 5.2% |
| 90 or more Minutes | 178 | 1.1% |
Commute Time by Sex in Watertown Town
The most common commute times in Watertown Town are 30 to 34 minutes (1,433 commuters, 16.8%) for males and 20 to 24 minutes (1,199 commuters, 15.8%) for females.
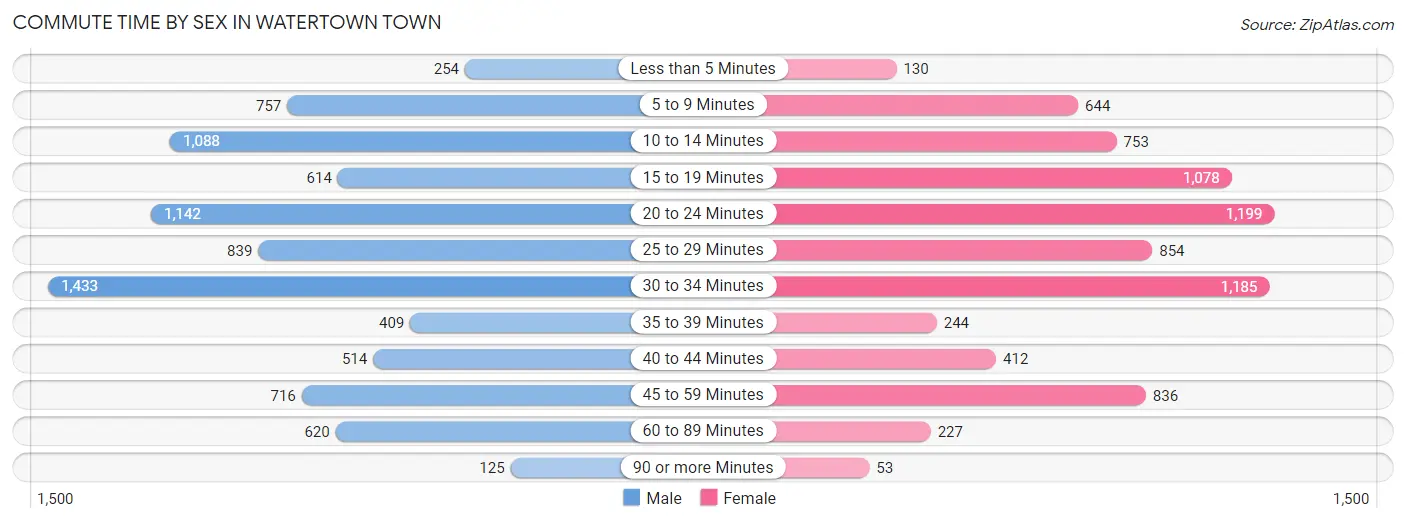
| Commute Time | Male | Female |
| Less than 5 Minutes | 254 (3.0%) | 130 (1.7%) |
| 5 to 9 Minutes | 757 (8.9%) | 644 (8.5%) |
| 10 to 14 Minutes | 1,088 (12.8%) | 753 (9.9%) |
| 15 to 19 Minutes | 614 (7.2%) | 1,078 (14.2%) |
| 20 to 24 Minutes | 1,142 (13.4%) | 1,199 (15.8%) |
| 25 to 29 Minutes | 839 (9.9%) | 854 (11.2%) |
| 30 to 34 Minutes | 1,433 (16.8%) | 1,185 (15.6%) |
| 35 to 39 Minutes | 409 (4.8%) | 244 (3.2%) |
| 40 to 44 Minutes | 514 (6.0%) | 412 (5.4%) |
| 45 to 59 Minutes | 716 (8.4%) | 836 (11.0%) |
| 60 to 89 Minutes | 620 (7.3%) | 227 (3.0%) |
| 90 or more Minutes | 125 (1.5%) | 53 (0.7%) |
Time of Departure to Work by Sex in Watertown Town
The most frequent times of departure to work in Watertown Town are 8:00 AM to 8:29 AM (1,366, 16.1%) for males and 7:30 AM to 7:59 AM (1,567, 20.6%) for females.
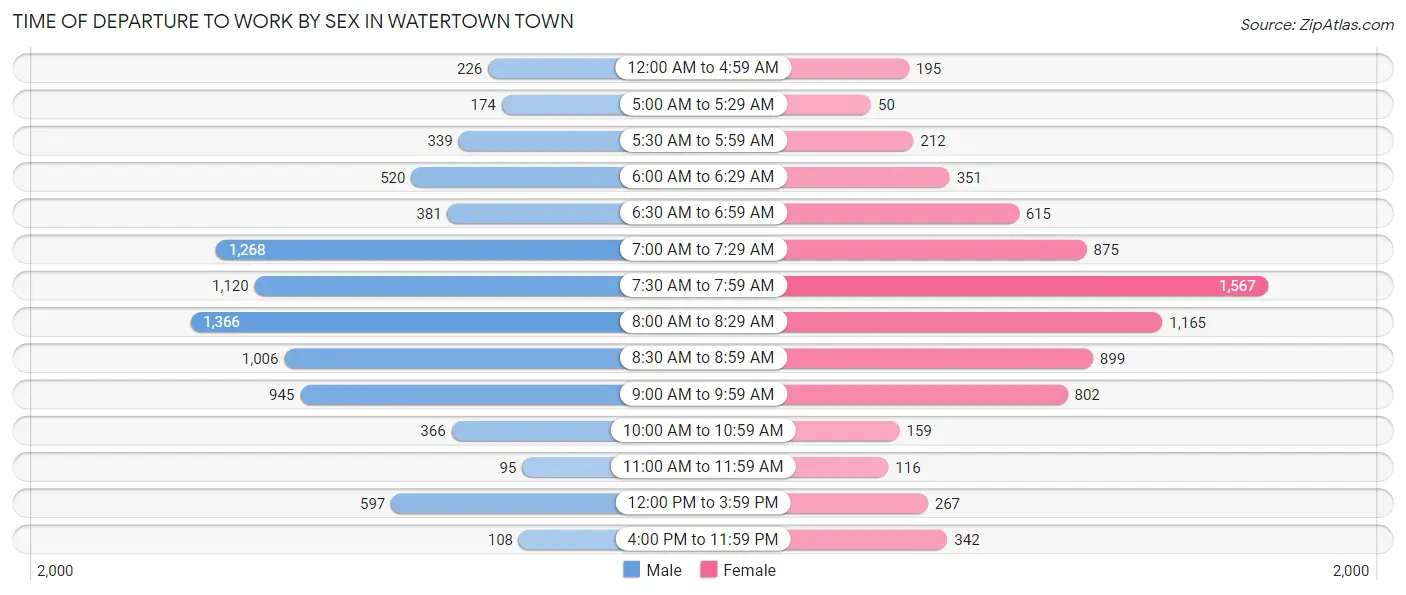
| Time of Departure | Male | Female |
| 12:00 AM to 4:59 AM | 226 (2.7%) | 195 (2.6%) |
| 5:00 AM to 5:29 AM | 174 (2.0%) | 50 (0.7%) |
| 5:30 AM to 5:59 AM | 339 (4.0%) | 212 (2.8%) |
| 6:00 AM to 6:29 AM | 520 (6.1%) | 351 (4.6%) |
| 6:30 AM to 6:59 AM | 381 (4.5%) | 615 (8.1%) |
| 7:00 AM to 7:29 AM | 1,268 (14.9%) | 875 (11.5%) |
| 7:30 AM to 7:59 AM | 1,120 (13.2%) | 1,567 (20.6%) |
| 8:00 AM to 8:29 AM | 1,366 (16.1%) | 1,165 (15.3%) |
| 8:30 AM to 8:59 AM | 1,006 (11.8%) | 899 (11.8%) |
| 9:00 AM to 9:59 AM | 945 (11.1%) | 802 (10.5%) |
| 10:00 AM to 10:59 AM | 366 (4.3%) | 159 (2.1%) |
| 11:00 AM to 11:59 AM | 95 (1.1%) | 116 (1.5%) |
| 12:00 PM to 3:59 PM | 597 (7.0%) | 267 (3.5%) |
| 4:00 PM to 11:59 PM | 108 (1.3%) | 342 (4.5%) |
| Total | 8,511 (100.0%) | 7,615 (100.0%) |
Housing Occupancy in Watertown Town
Occupancy by Ownership in Watertown Town
Of the total 15,944 dwellings in Watertown Town, owner-occupied units account for 8,174 (51.3%), while renter-occupied units make up 7,770 (48.7%).
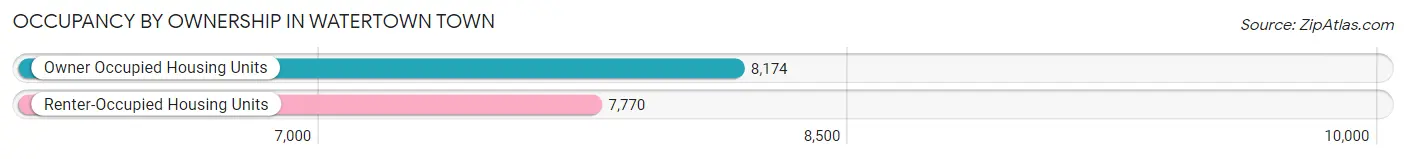
| Occupancy | # Housing Units | % Housing Units |
| Owner Occupied Housing Units | 8,174 | 51.3% |
| Renter-Occupied Housing Units | 7,770 | 48.7% |
| Total Occupied Housing Units | 15,944 | 100.0% |
Occupancy by Household Size in Watertown Town
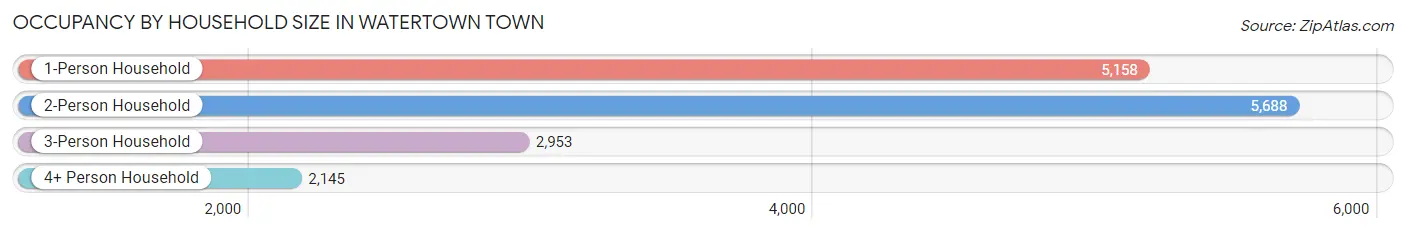
| Household Size | # Housing Units | % Housing Units |
| 1-Person Household | 5,158 | 32.4% |
| 2-Person Household | 5,688 | 35.7% |
| 3-Person Household | 2,953 | 18.5% |
| 4+ Person Household | 2,145 | 13.5% |
| Total Housing Units | 15,944 | 100.0% |
Occupancy by Ownership by Household Size in Watertown Town
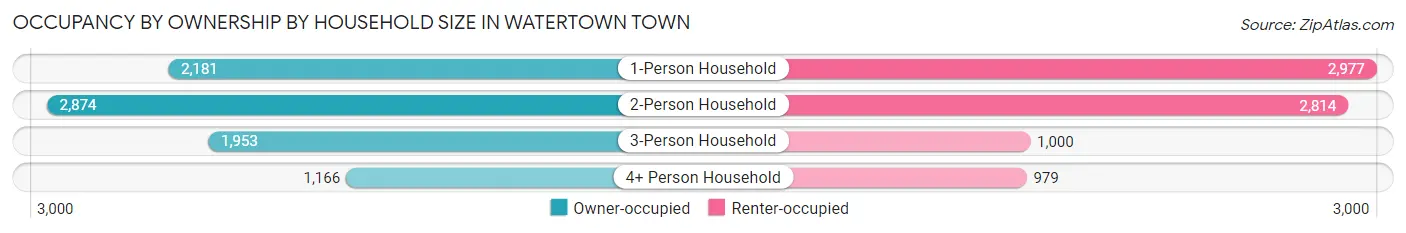
| Household Size | Owner-occupied | Renter-occupied |
| 1-Person Household | 2,181 (42.3%) | 2,977 (57.7%) |
| 2-Person Household | 2,874 (50.5%) | 2,814 (49.5%) |
| 3-Person Household | 1,953 (66.1%) | 1,000 (33.9%) |
| 4+ Person Household | 1,166 (54.4%) | 979 (45.6%) |
| Total Housing Units | 8,174 (51.3%) | 7,770 (48.7%) |
Occupancy by Educational Attainment in Watertown Town
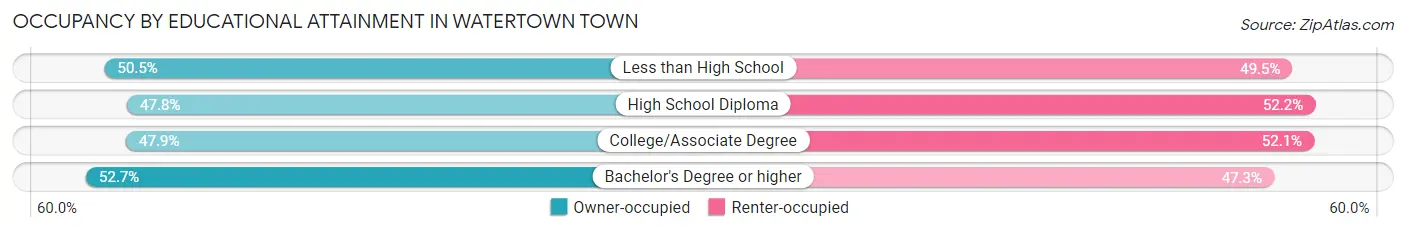
| Household Size | Owner-occupied | Renter-occupied |
| Less than High School | 301 (50.5%) | 295 (49.5%) |
| High School Diploma | 1,023 (47.8%) | 1,117 (52.2%) |
| College/Associate Degree | 1,113 (47.9%) | 1,209 (52.1%) |
| Bachelor's Degree or higher | 5,737 (52.7%) | 5,149 (47.3%) |
Occupancy by Age of Householder in Watertown Town
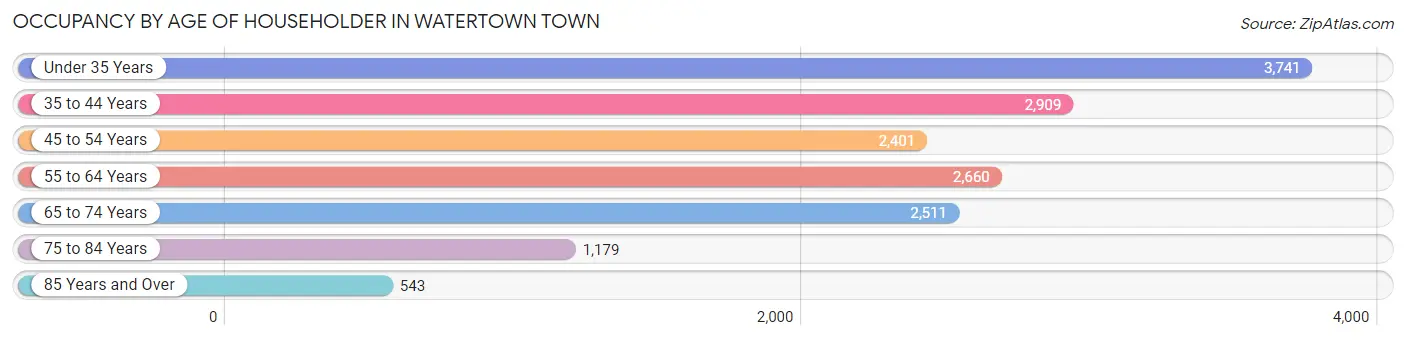
| Age Bracket | # Households | % Households |
| Under 35 Years | 3,741 | 23.5% |
| 35 to 44 Years | 2,909 | 18.2% |
| 45 to 54 Years | 2,401 | 15.1% |
| 55 to 64 Years | 2,660 | 16.7% |
| 65 to 74 Years | 2,511 | 15.8% |
| 75 to 84 Years | 1,179 | 7.4% |
| 85 Years and Over | 543 | 3.4% |
| Total | 15,944 | 100.0% |
Housing Finances in Watertown Town
Median Income by Occupancy in Watertown Town
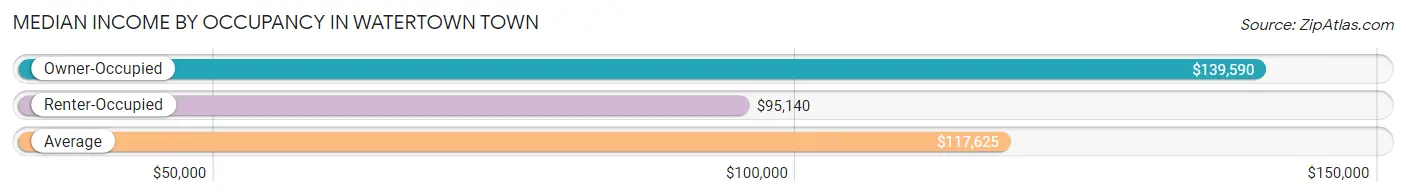
| Occupancy Type | # Households | Median Income |
| Owner-Occupied | 8,174 (51.3%) | $139,590 |
| Renter-Occupied | 7,770 (48.7%) | $95,140 |
| Average | 15,944 (100.0%) | $117,625 |
Occupancy by Householder Income Bracket in Watertown Town
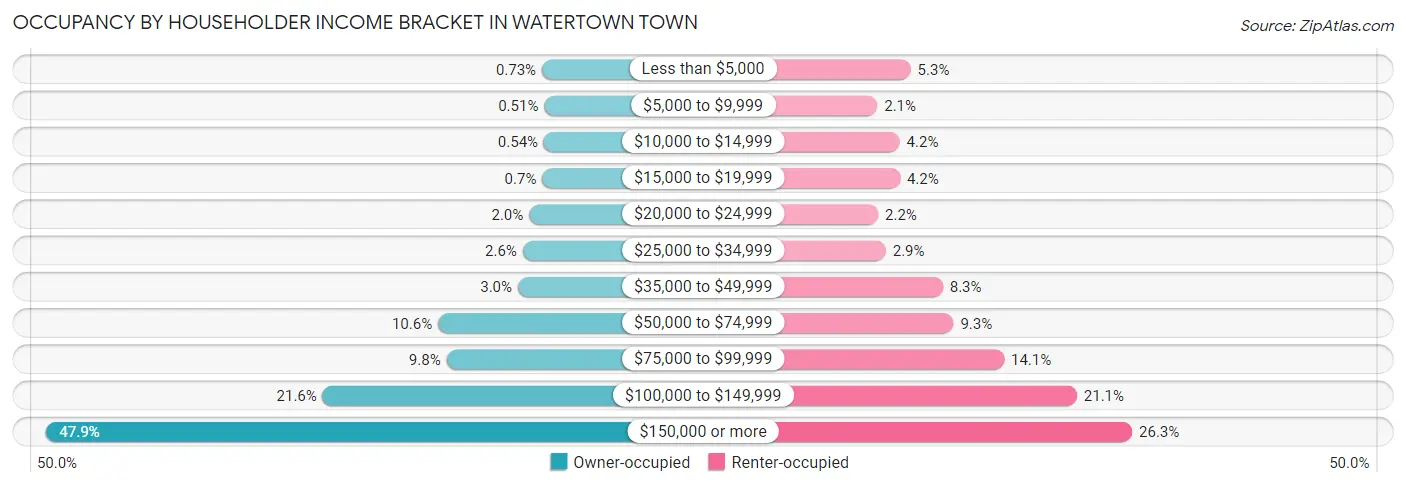
| Income Bracket | Owner-occupied | Renter-occupied |
| Less than $5,000 | 60 (0.7%) | 408 (5.2%) |
| $5,000 to $9,999 | 42 (0.5%) | 161 (2.1%) |
| $10,000 to $14,999 | 44 (0.5%) | 326 (4.2%) |
| $15,000 to $19,999 | 57 (0.7%) | 329 (4.2%) |
| $20,000 to $24,999 | 159 (1.9%) | 167 (2.1%) |
| $25,000 to $34,999 | 209 (2.6%) | 224 (2.9%) |
| $35,000 to $49,999 | 247 (3.0%) | 646 (8.3%) |
| $50,000 to $74,999 | 869 (10.6%) | 725 (9.3%) |
| $75,000 to $99,999 | 803 (9.8%) | 1,099 (14.1%) |
| $100,000 to $149,999 | 1,767 (21.6%) | 1,638 (21.1%) |
| $150,000 or more | 3,917 (47.9%) | 2,047 (26.3%) |
| Total | 8,174 (100.0%) | 7,770 (100.0%) |
Monthly Housing Cost Tiers in Watertown Town
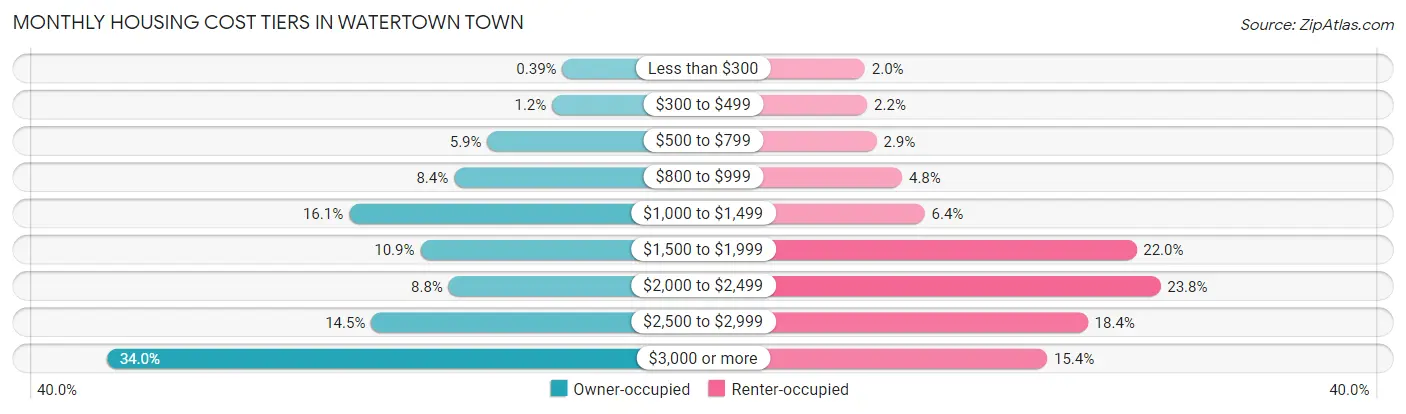
| Monthly Cost | Owner-occupied | Renter-occupied |
| Less than $300 | 32 (0.4%) | 157 (2.0%) |
| $300 to $499 | 94 (1.1%) | 170 (2.2%) |
| $500 to $799 | 484 (5.9%) | 224 (2.9%) |
| $800 to $999 | 684 (8.4%) | 370 (4.8%) |
| $1,000 to $1,499 | 1,317 (16.1%) | 499 (6.4%) |
| $1,500 to $1,999 | 888 (10.9%) | 1,710 (22.0%) |
| $2,000 to $2,499 | 717 (8.8%) | 1,848 (23.8%) |
| $2,500 to $2,999 | 1,183 (14.5%) | 1,432 (18.4%) |
| $3,000 or more | 2,775 (34.0%) | 1,200 (15.4%) |
| Total | 8,174 (100.0%) | 7,770 (100.0%) |
Physical Housing Characteristics in Watertown Town
Housing Structures in Watertown Town
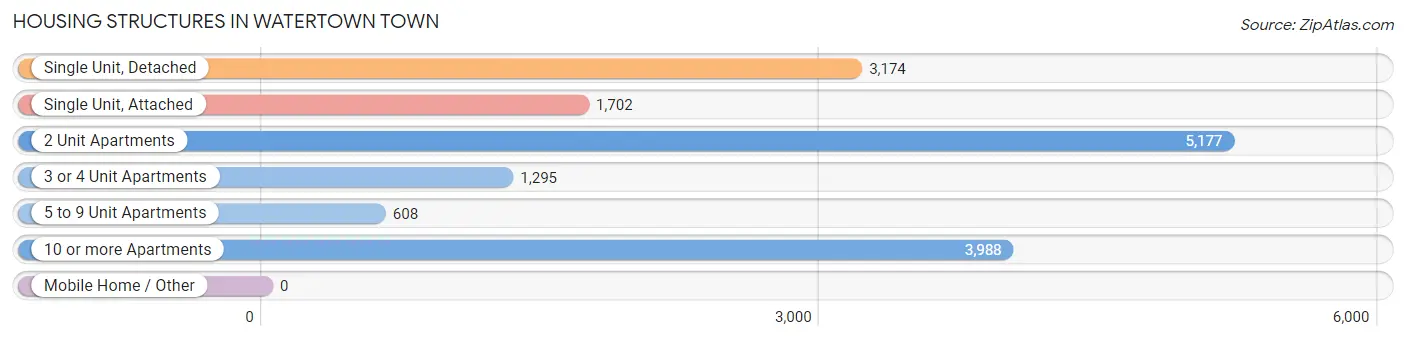
| Structure Type | # Housing Units | % Housing Units |
| Single Unit, Detached | 3,174 | 19.9% |
| Single Unit, Attached | 1,702 | 10.7% |
| 2 Unit Apartments | 5,177 | 32.5% |
| 3 or 4 Unit Apartments | 1,295 | 8.1% |
| 5 to 9 Unit Apartments | 608 | 3.8% |
| 10 or more Apartments | 3,988 | 25.0% |
| Mobile Home / Other | 0 | 0.0% |
| Total | 15,944 | 100.0% |
Housing Structures by Occupancy in Watertown Town
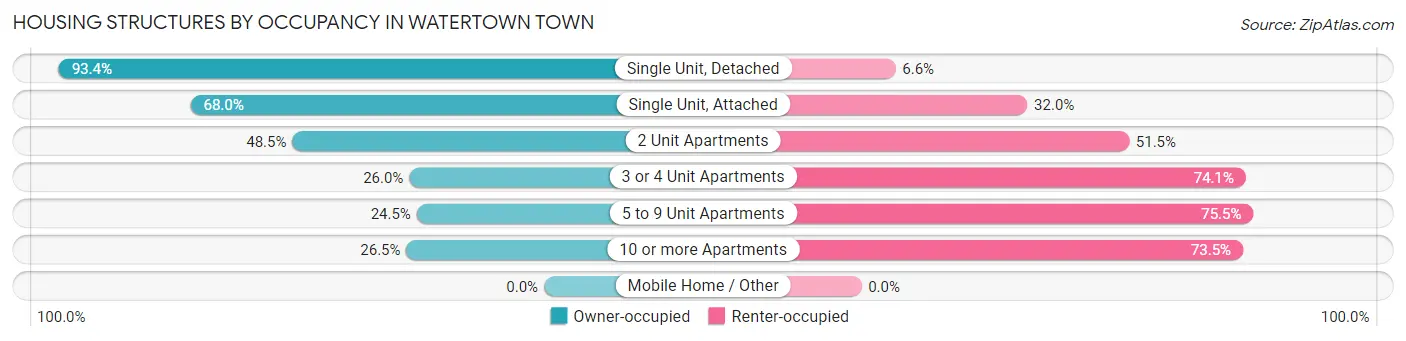
| Structure Type | Owner-occupied | Renter-occupied |
| Single Unit, Detached | 2,965 (93.4%) | 209 (6.6%) |
| Single Unit, Attached | 1,158 (68.0%) | 544 (32.0%) |
| 2 Unit Apartments | 2,509 (48.5%) | 2,668 (51.5%) |
| 3 or 4 Unit Apartments | 336 (26.0%) | 959 (74.1%) |
| 5 to 9 Unit Apartments | 149 (24.5%) | 459 (75.5%) |
| 10 or more Apartments | 1,057 (26.5%) | 2,931 (73.5%) |
| Mobile Home / Other | 0 (0.0%) | 0 (0.0%) |
| Total | 8,174 (51.3%) | 7,770 (48.7%) |
Housing Structures by Number of Rooms in Watertown Town
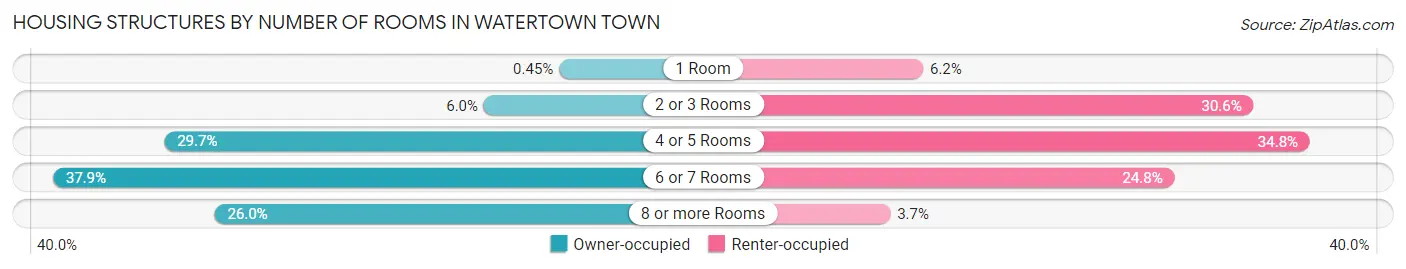
| Number of Rooms | Owner-occupied | Renter-occupied |
| 1 Room | 37 (0.4%) | 478 (6.1%) |
| 2 or 3 Rooms | 492 (6.0%) | 2,378 (30.6%) |
| 4 or 5 Rooms | 2,425 (29.7%) | 2,702 (34.8%) |
| 6 or 7 Rooms | 3,099 (37.9%) | 1,923 (24.7%) |
| 8 or more Rooms | 2,121 (26.0%) | 289 (3.7%) |
| Total | 8,174 (100.0%) | 7,770 (100.0%) |
Housing Structure by Heating Type in Watertown Town
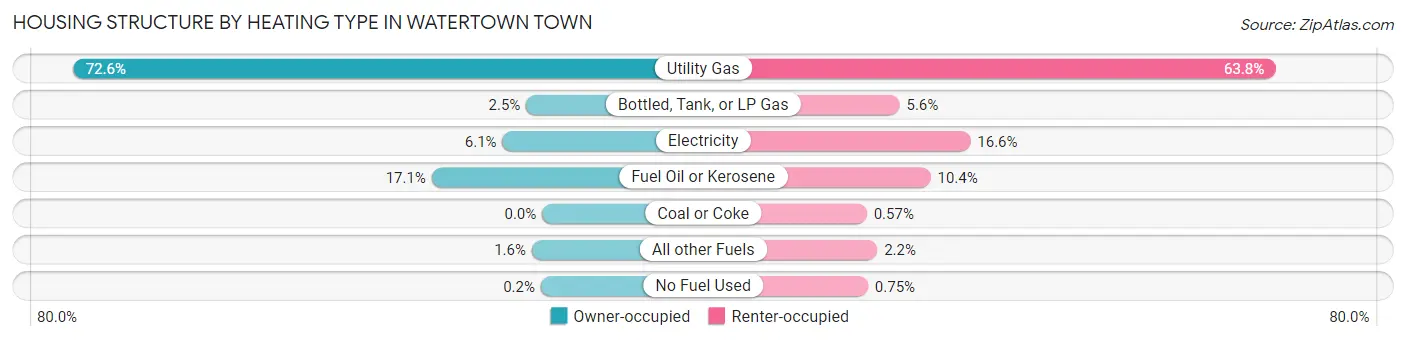
| Heating Type | Owner-occupied | Renter-occupied |
| Utility Gas | 5,931 (72.6%) | 4,960 (63.8%) |
| Bottled, Tank, or LP Gas | 201 (2.5%) | 438 (5.6%) |
| Electricity | 501 (6.1%) | 1,289 (16.6%) |
| Fuel Oil or Kerosene | 1,395 (17.1%) | 811 (10.4%) |
| Coal or Coke | 0 (0.0%) | 44 (0.6%) |
| All other Fuels | 130 (1.6%) | 170 (2.2%) |
| No Fuel Used | 16 (0.2%) | 58 (0.7%) |
| Total | 8,174 (100.0%) | 7,770 (100.0%) |
Household Vehicle Usage in Watertown Town
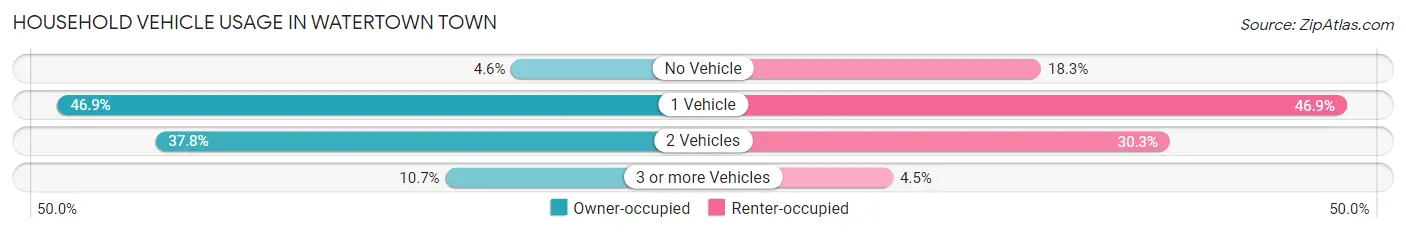
| Vehicles per Household | Owner-occupied | Renter-occupied |
| No Vehicle | 373 (4.6%) | 1,423 (18.3%) |
| 1 Vehicle | 3,836 (46.9%) | 3,640 (46.9%) |
| 2 Vehicles | 3,089 (37.8%) | 2,357 (30.3%) |
| 3 or more Vehicles | 876 (10.7%) | 350 (4.5%) |
| Total | 8,174 (100.0%) | 7,770 (100.0%) |
Real Estate & Mortgages in Watertown Town
Real Estate and Mortgage Overview in Watertown Town
| Characteristic | Without Mortgage | With Mortgage |
| Housing Units | 2,733 | 5,441 |
| Median Property Value | $686,700 | $739,300 |
| Median Household Income | $101,889 | $3,152 |
| Monthly Housing Costs | $1,042 | $2,775 |
| Real Estate Taxes | $6,618 | $29 |
Property Value by Mortgage Status in Watertown Town
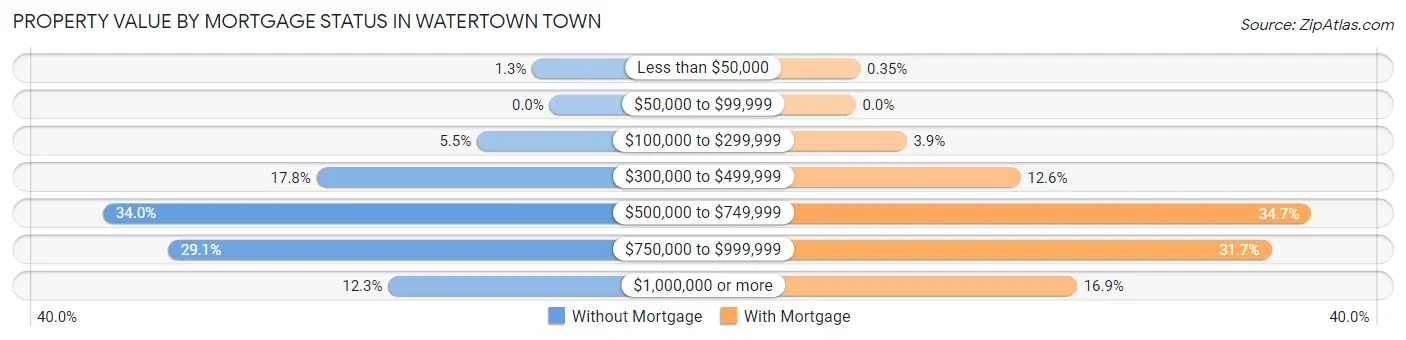
| Property Value | Without Mortgage | With Mortgage |
| Less than $50,000 | 36 (1.3%) | 19 (0.4%) |
| $50,000 to $99,999 | 0 (0.0%) | 0 (0.0%) |
| $100,000 to $299,999 | 151 (5.5%) | 211 (3.9%) |
| $300,000 to $499,999 | 485 (17.7%) | 683 (12.6%) |
| $500,000 to $749,999 | 930 (34.0%) | 1,888 (34.7%) |
| $750,000 to $999,999 | 795 (29.1%) | 1,723 (31.7%) |
| $1,000,000 or more | 336 (12.3%) | 917 (16.9%) |
| Total | 2,733 (100.0%) | 5,441 (100.0%) |
Household Income by Mortgage Status in Watertown Town
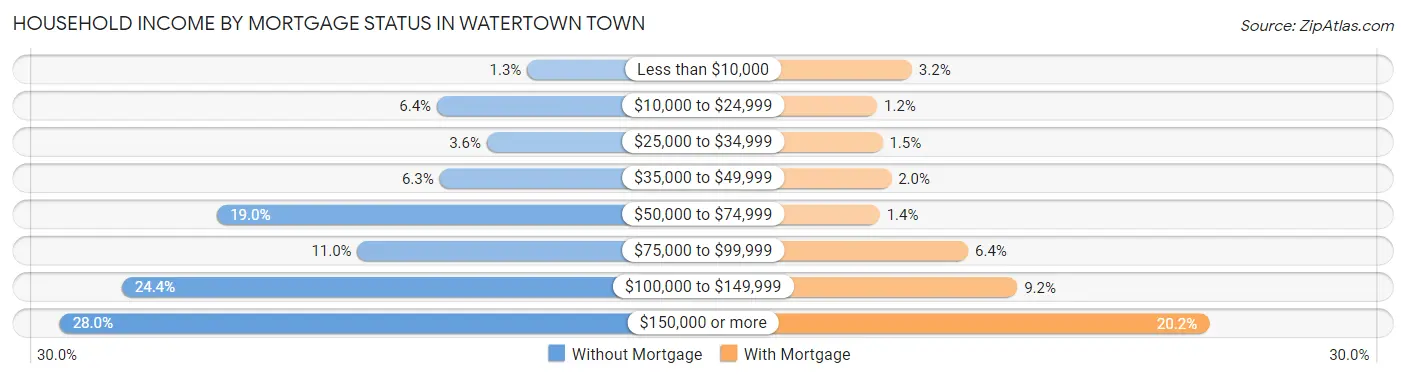
| Household Income | Without Mortgage | With Mortgage |
| Less than $10,000 | 35 (1.3%) | 175 (3.2%) |
| $10,000 to $24,999 | 176 (6.4%) | 67 (1.2%) |
| $25,000 to $34,999 | 98 (3.6%) | 84 (1.5%) |
| $35,000 to $49,999 | 172 (6.3%) | 111 (2.0%) |
| $50,000 to $74,999 | 519 (19.0%) | 75 (1.4%) |
| $75,000 to $99,999 | 300 (11.0%) | 350 (6.4%) |
| $100,000 to $149,999 | 668 (24.4%) | 503 (9.2%) |
| $150,000 or more | 765 (28.0%) | 1,099 (20.2%) |
| Total | 2,733 (100.0%) | 5,441 (100.0%) |
Property Value to Household Income Ratio in Watertown Town
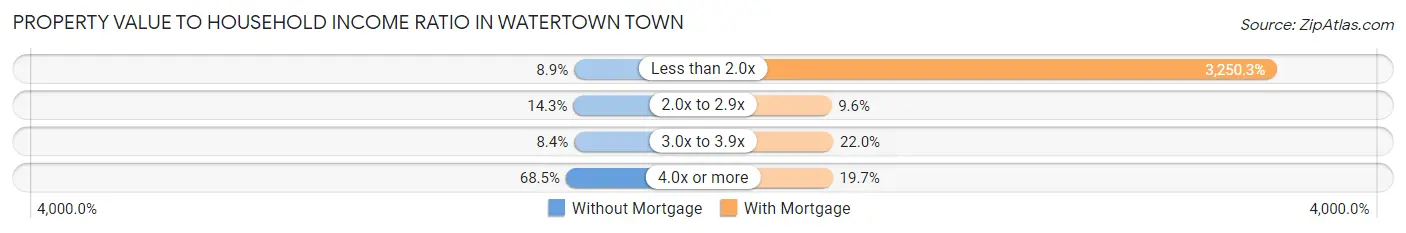
| Value-to-Income Ratio | Without Mortgage | With Mortgage |
| Less than 2.0x | 242 (8.8%) | 176,847 (3,250.3%) |
| 2.0x to 2.9x | 390 (14.3%) | 521 (9.6%) |
| 3.0x to 3.9x | 230 (8.4%) | 1,198 (22.0%) |
| 4.0x or more | 1,871 (68.5%) | 1,069 (19.7%) |
| Total | 2,733 (100.0%) | 5,441 (100.0%) |
Real Estate Taxes by Mortgage Status in Watertown Town
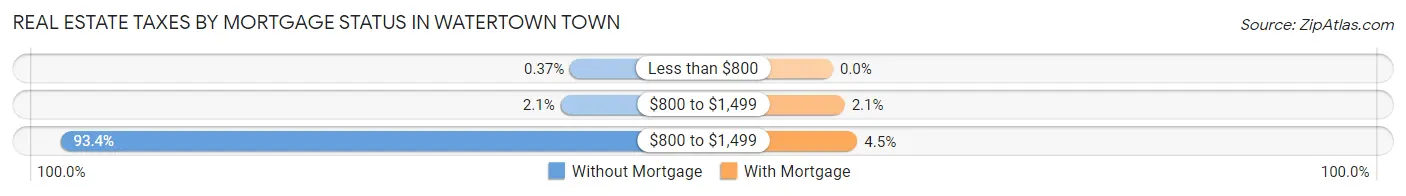
| Property Taxes | Without Mortgage | With Mortgage |
| Less than $800 | 10 (0.4%) | 0 (0.0%) |
| $800 to $1,499 | 58 (2.1%) | 116 (2.1%) |
| $800 to $1,499 | 2,553 (93.4%) | 242 (4.4%) |
| Total | 2,733 (100.0%) | 5,441 (100.0%) |
Health & Disability in Watertown Town
Health Insurance Coverage by Age in Watertown Town
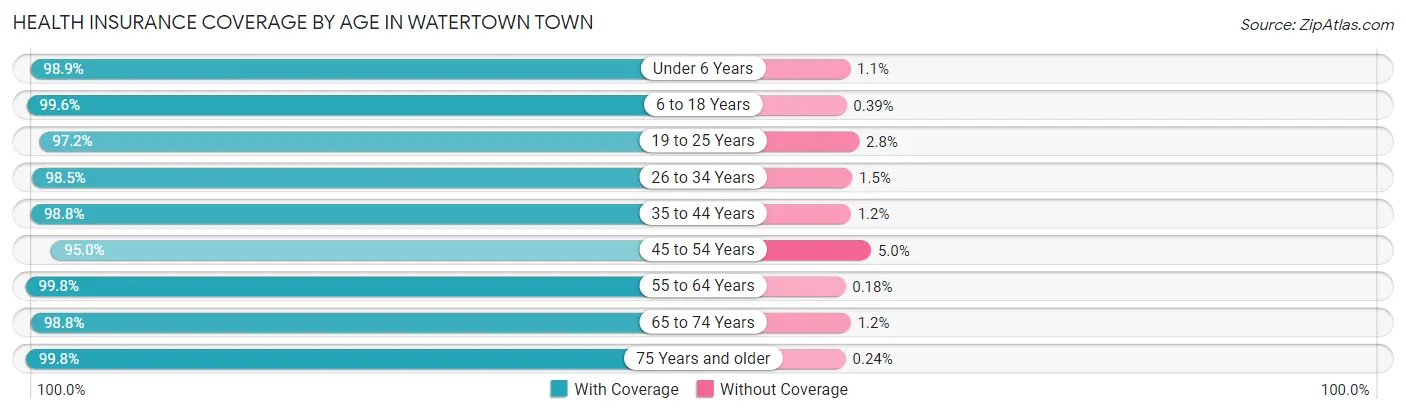
| Age Bracket | With Coverage | Without Coverage |
| Under 6 Years | 1,996 (98.9%) | 22 (1.1%) |
| 6 to 18 Years | 3,553 (99.6%) | 14 (0.4%) |
| 19 to 25 Years | 2,361 (97.2%) | 67 (2.8%) |
| 26 to 34 Years | 6,994 (98.5%) | 104 (1.5%) |
| 35 to 44 Years | 5,367 (98.8%) | 65 (1.2%) |
| 45 to 54 Years | 3,646 (95.0%) | 191 (5.0%) |
| 55 to 64 Years | 4,517 (99.8%) | 8 (0.2%) |
| 65 to 74 Years | 3,632 (98.8%) | 44 (1.2%) |
| 75 Years and older | 2,503 (99.8%) | 6 (0.2%) |
| Total | 34,569 (98.5%) | 521 (1.5%) |
Health Insurance Coverage by Citizenship Status in Watertown Town
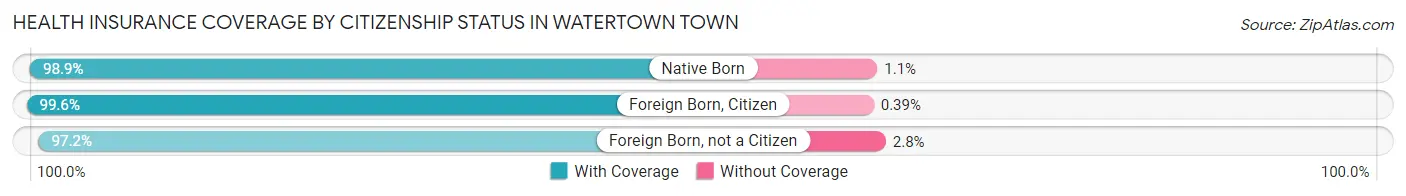
| Citizenship Status | With Coverage | Without Coverage |
| Native Born | 1,996 (98.9%) | 22 (1.1%) |
| Foreign Born, Citizen | 3,553 (99.6%) | 14 (0.4%) |
| Foreign Born, not a Citizen | 2,361 (97.2%) | 67 (2.8%) |
Health Insurance Coverage by Household Income in Watertown Town
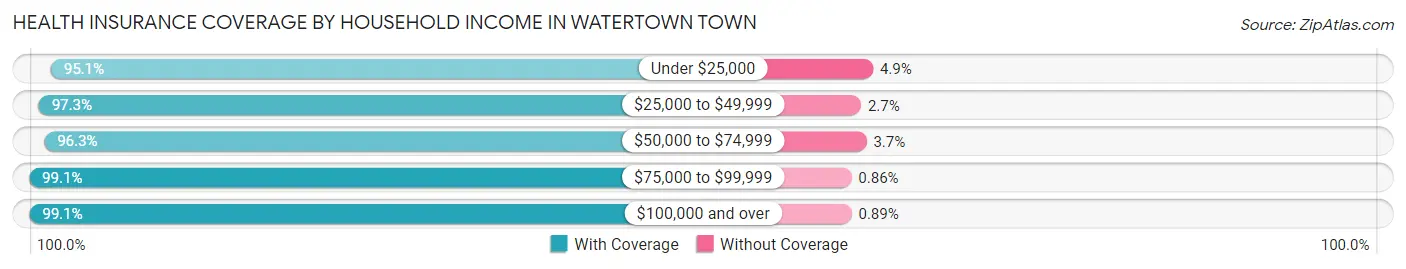
| Household Income | With Coverage | Without Coverage |
| Under $25,000 | 2,342 (95.1%) | 121 (4.9%) |
| $25,000 to $49,999 | 2,084 (97.3%) | 57 (2.7%) |
| $50,000 to $74,999 | 2,588 (96.3%) | 99 (3.7%) |
| $75,000 to $99,999 | 4,498 (99.1%) | 39 (0.9%) |
| $100,000 and over | 22,853 (99.1%) | 205 (0.9%) |
Public vs Private Health Insurance Coverage by Age in Watertown Town
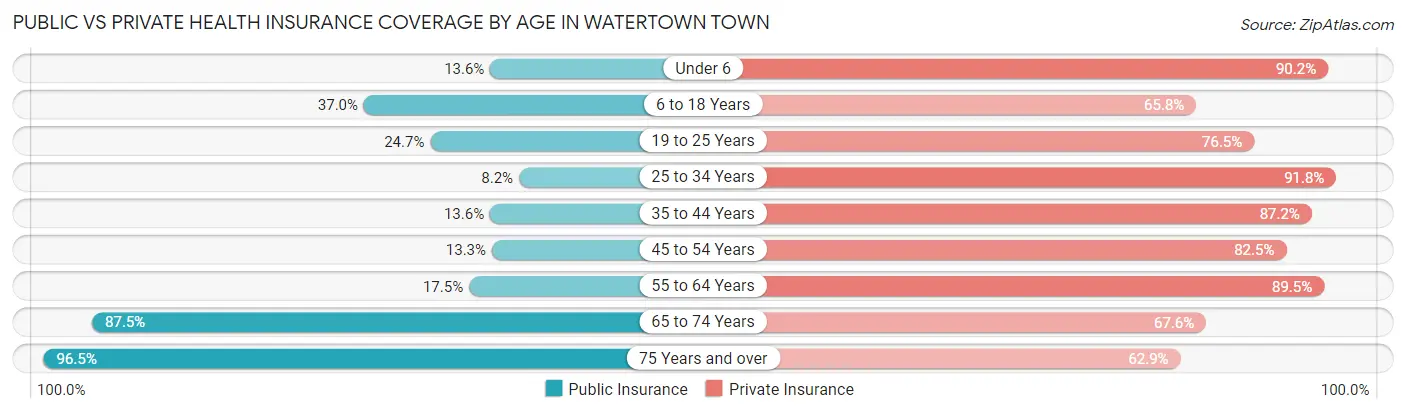
| Age Bracket | Public Insurance | Private Insurance |
| Under 6 | 274 (13.6%) | 1,821 (90.2%) |
| 6 to 18 Years | 1,321 (37.0%) | 2,346 (65.8%) |
| 19 to 25 Years | 600 (24.7%) | 1,858 (76.5%) |
| 25 to 34 Years | 585 (8.2%) | 6,513 (91.8%) |
| 35 to 44 Years | 740 (13.6%) | 4,737 (87.2%) |
| 45 to 54 Years | 509 (13.3%) | 3,165 (82.5%) |
| 55 to 64 Years | 793 (17.5%) | 4,050 (89.5%) |
| 65 to 74 Years | 3,216 (87.5%) | 2,485 (67.6%) |
| 75 Years and over | 2,421 (96.5%) | 1,577 (62.8%) |
| Total | 10,459 (29.8%) | 28,552 (81.4%) |
Disability Status by Sex by Age in Watertown Town
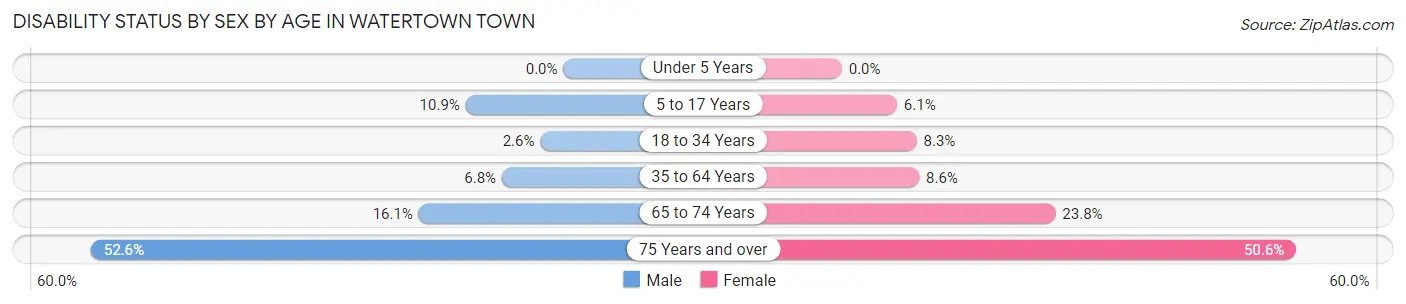
| Age Bracket | Male | Female |
| Under 5 Years | 0 (0.0%) | 0 (0.0%) |
| 5 to 17 Years | 167 (10.9%) | 115 (6.1%) |
| 18 to 34 Years | 135 (2.6%) | 390 (8.3%) |
| 35 to 64 Years | 433 (6.8%) | 642 (8.6%) |
| 65 to 74 Years | 278 (16.1%) | 464 (23.8%) |
| 75 Years and over | 613 (52.6%) | 680 (50.6%) |
Disability Class by Sex by Age in Watertown Town
Disability Class: Hearing Difficulty
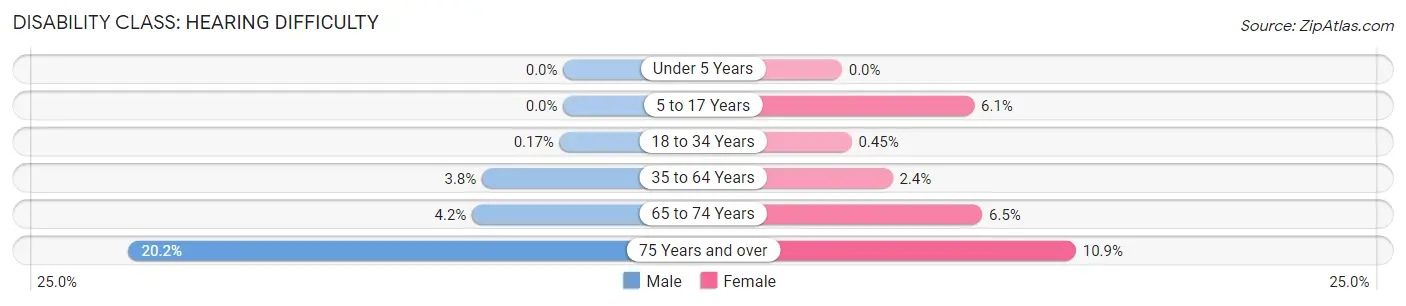
| Age Bracket | Male | Female |
| Under 5 Years | 0 (0.0%) | 0 (0.0%) |
| 5 to 17 Years | 0 (0.0%) | 115 (6.1%) |
| 18 to 34 Years | 9 (0.2%) | 21 (0.4%) |
| 35 to 64 Years | 239 (3.8%) | 175 (2.4%) |
| 65 to 74 Years | 73 (4.2%) | 127 (6.5%) |
| 75 Years and over | 235 (20.2%) | 146 (10.9%) |
Disability Class: Vision Difficulty
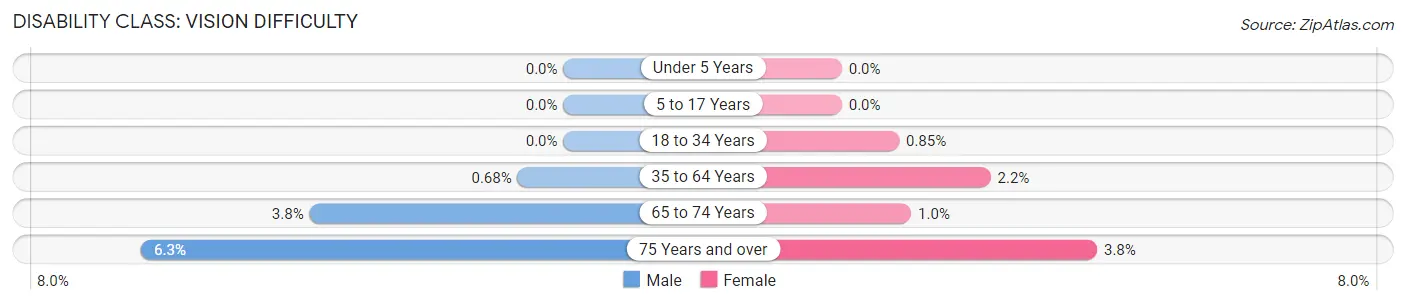
| Age Bracket | Male | Female |
| Under 5 Years | 0 (0.0%) | 0 (0.0%) |
| 5 to 17 Years | 0 (0.0%) | 0 (0.0%) |
| 18 to 34 Years | 0 (0.0%) | 40 (0.9%) |
| 35 to 64 Years | 43 (0.7%) | 165 (2.2%) |
| 65 to 74 Years | 65 (3.8%) | 20 (1.0%) |
| 75 Years and over | 73 (6.3%) | 51 (3.8%) |
Disability Class: Cognitive Difficulty
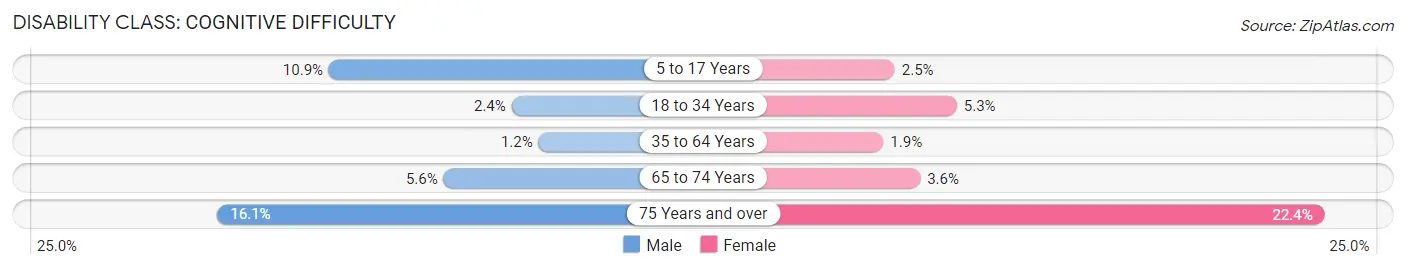
| Age Bracket | Male | Female |
| 5 to 17 Years | 167 (10.9%) | 46 (2.5%) |
| 18 to 34 Years | 126 (2.4%) | 250 (5.3%) |
| 35 to 64 Years | 73 (1.1%) | 144 (1.9%) |
| 65 to 74 Years | 96 (5.6%) | 71 (3.6%) |
| 75 Years and over | 187 (16.1%) | 301 (22.4%) |
Disability Class: Ambulatory Difficulty
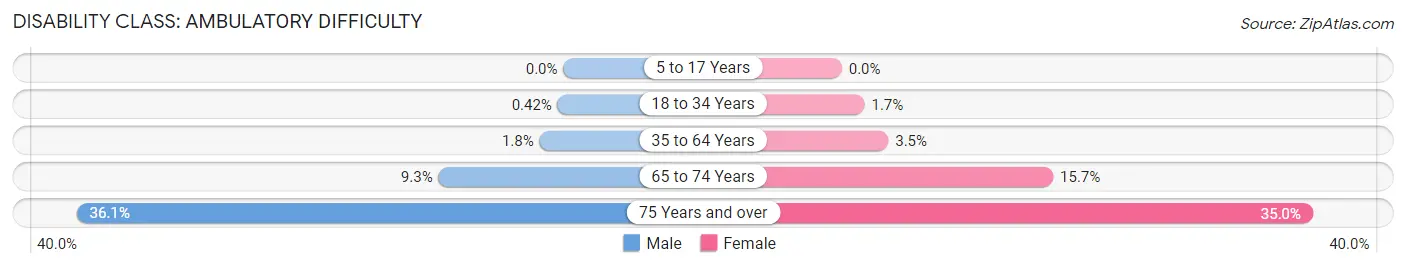
| Age Bracket | Male | Female |
| 5 to 17 Years | 0 (0.0%) | 0 (0.0%) |
| 18 to 34 Years | 22 (0.4%) | 79 (1.7%) |
| 35 to 64 Years | 112 (1.8%) | 257 (3.5%) |
| 65 to 74 Years | 160 (9.3%) | 306 (15.7%) |
| 75 Years and over | 421 (36.1%) | 470 (35.0%) |
Disability Class: Self-Care Difficulty
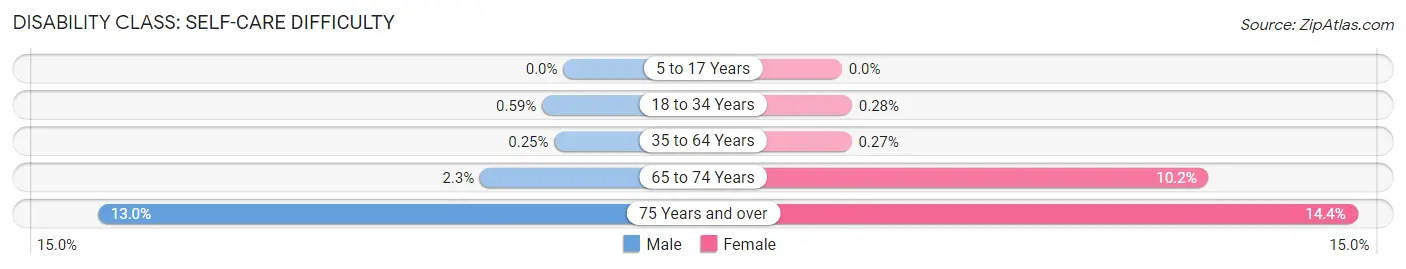
| Age Bracket | Male | Female |
| 5 to 17 Years | 0 (0.0%) | 0 (0.0%) |
| 18 to 34 Years | 31 (0.6%) | 13 (0.3%) |
| 35 to 64 Years | 16 (0.3%) | 20 (0.3%) |
| 65 to 74 Years | 40 (2.3%) | 199 (10.2%) |
| 75 Years and over | 151 (13.0%) | 193 (14.4%) |
Technology Access in Watertown Town
Computing Device Access in Watertown Town
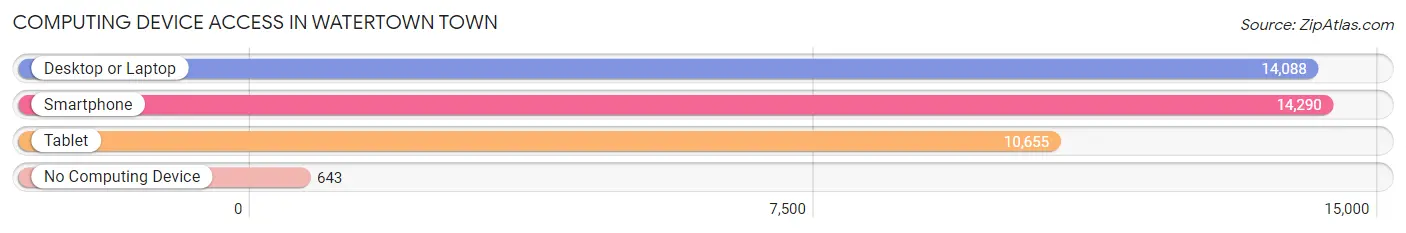
| Device Type | # Households | % Households |
| Desktop or Laptop | 14,088 | 88.4% |
| Smartphone | 14,290 | 89.6% |
| Tablet | 10,655 | 66.8% |
| No Computing Device | 643 | 4.0% |
| Total | 15,944 | 100.0% |
Internet Access in Watertown Town
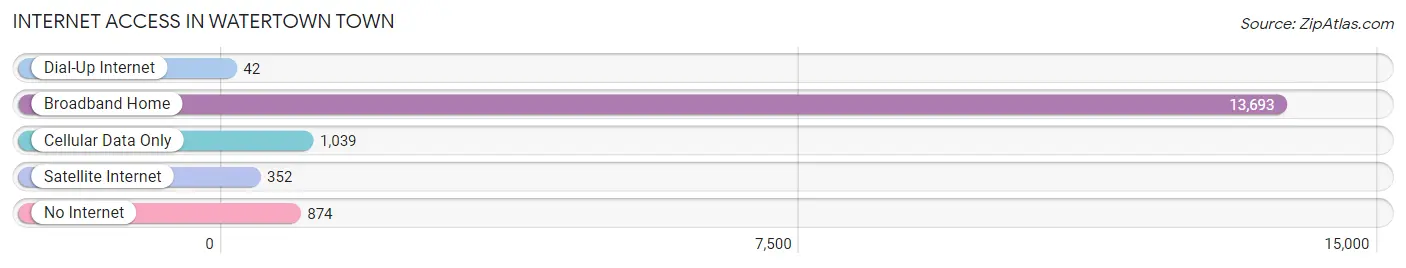
| Internet Type | # Households | % Households |
| Dial-Up Internet | 42 | 0.3% |
| Broadband Home | 13,693 | 85.9% |
| Cellular Data Only | 1,039 | 6.5% |
| Satellite Internet | 352 | 2.2% |
| No Internet | 874 | 5.5% |
| Total | 15,944 | 100.0% |
Watertown Town Summary
Watertown Town, MA is a city located in Middlesex County, Massachusetts, United States. It is part of the Greater Boston metropolitan area and is located just west of the Charles River. As of the 2010 census, the population of Watertown Town was 31,915.
History
Watertown Town was first settled in 1630 by English settlers, making it one of the oldest towns in Massachusetts. The town was originally part of Cambridge, but was incorporated as its own town in 1630. The town was named after Watertown, England, which was the hometown of many of the original settlers.
In the early years of the town, Watertown was primarily an agricultural community. The town was known for its apple orchards and was home to several mills. In the 19th century, the town began to industrialize and the population began to grow. The town was home to several factories, including the Watertown Arsenal, which was a major supplier of weapons and ammunition during the Civil War.
Geography
Watertown Town is located in eastern Massachusetts, just west of the Charles River. The town is bordered by Cambridge to the east, Belmont to the south, Waltham to the west, and Newton to the north. The town covers an area of 6.4 square miles and has a population density of 4,945 people per square mile.
The town is located in a hilly area and is home to several parks and open spaces. The Charles River runs through the town and is a popular spot for fishing, boating, and other recreational activities.
Economy
Watertown Town has a diverse economy that is driven by a mix of industries. The town is home to several large employers, including the Watertown Arsenal, which is a major supplier of weapons and ammunition to the US military. The town is also home to several technology companies, including Microsoft, Oracle, and IBM.
The town is also home to several retail stores, restaurants, and other businesses. The town is home to several shopping centers, including the Watertown Mall and the Watertown Square Shopping Center.
Demographics
As of the 2010 census, the population of Watertown Town was 31,915. The population is made up of a diverse mix of ethnicities, including White (76.2%), African American (7.2%), Asian (7.1%), and Hispanic or Latino (5.3%). The median household income in the town is $76,845 and the median home value is $541,000.
Conclusion
Watertown Town, MA is a city located in Middlesex County, Massachusetts, United States. It is part of the Greater Boston metropolitan area and is located just west of the Charles River. The town was first settled in 1630 by English settlers and has a diverse economy that is driven by a mix of industries. As of the 2010 census, the population of Watertown Town was 31,915 and the median household income in the town is $76,845. The town is home to several parks and open spaces and is a popular spot for fishing, boating, and other recreational activities.
Common Questions
What is Per Capita Income in Watertown Town?
Per Capita income in Watertown Town is $69,498.
What is the Median Family Income in Watertown Town?
Median Family Income in Watertown Town is $144,593.
What is the Median Household income in Watertown Town?
Median Household Income in Watertown Town is $117,625.
What is Income or Wage Gap in Watertown Town?
Income or Wage Gap in Watertown Town is 7.1%.
Women in Watertown Town earn 92.9 cents for every dollar earned by a man.
What is Inequality or Gini Index in Watertown Town?
Inequality or Gini Index in Watertown Town is 0.45.
What is the Total Population of Watertown Town?
Total Population of Watertown Town is 35,181.
What is the Total Male Population of Watertown Town?
Total Male Population of Watertown Town is 16,796.
What is the Total Female Population of Watertown Town?
Total Female Population of Watertown Town is 18,385.
What is the Ratio of Males per 100 Females in Watertown Town?
There are 91.36 Males per 100 Females in Watertown Town.
What is the Ratio of Females per 100 Males in Watertown Town?
There are 109.46 Females per 100 Males in Watertown Town.
What is the Median Population Age in Watertown Town?
Median Population Age in Watertown Town is 38.2 Years.
What is the Average Family Size in Watertown Town
Average Family Size in Watertown Town is 2.8 People.
What is the Average Household Size in Watertown Town
Average Household Size in Watertown Town is 2.2 People.
How Large is the Labor Force in Watertown Town?
There are 22,566 People in the Labor Forcein in Watertown Town.
What is the Percentage of People in the Labor Force in Watertown Town?
73.8% of People are in the Labor Force in Watertown Town.
What is the Unemployment Rate in Watertown Town?
Unemployment Rate in Watertown Town is 5.7%.