Marlborough, MA Map & Demographics
Marlborough Map
Marlborough Overview
$45,736
PER CAPITA INCOME
$118,158
AVG FAMILY INCOME
$94,199
AVG HOUSEHOLD INCOME
28.6%
WAGE / INCOME GAP [ % ]
71.4¢/ $1
WAGE / INCOME GAP [ $ ]
$8,717
FAMILY INCOME DEFICIT
0.43
INEQUALITY / GINI INDEX
41,391
TOTAL POPULATION
19,995
MALE POPULATION
21,396
FEMALE POPULATION
93.45
MALES / 100 FEMALES
107.01
FEMALES / 100 MALES
38.1
MEDIAN AGE
3.2
AVG FAMILY SIZE
2.5
AVG HOUSEHOLD SIZE
24,235
LABOR FORCE [ PEOPLE ]
72.0%
PERCENT IN LABOR FORCE
5.4%
UNEMPLOYMENT RATE
Marlborough Zip Codes
Income in Marlborough
Income Overview in Marlborough
Per Capita Income in Marlborough is $45,736, while median incomes of families and households are $118,158 and $94,199 respectively.
| Characteristic | Number | Measure |
| Per Capita Income | 41,391 | $45,736 |
| Median Family Income | 10,213 | $118,158 |
| Mean Family Income | 10,213 | $133,691 |
| Median Household Income | 16,524 | $94,199 |
| Mean Household Income | 16,524 | $113,956 |
| Income Deficit | 10,213 | $8,717 |
| Wage / Income Gap (%) | 41,391 | 28.58% |
| Wage / Income Gap ($) | 41,391 | 71.42¢ per $1 |
| Gini / Inequality Index | 41,391 | 0.43 |
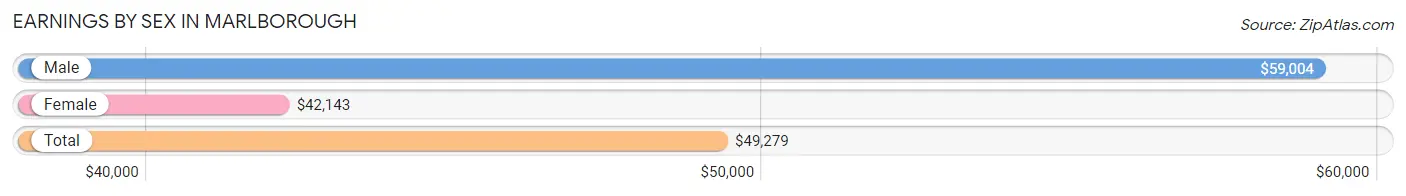
Earnings by Sex in Marlborough
Average Earnings in Marlborough are $49,279, $59,004 for men and $42,143 for women, a difference of 28.6%.
| Sex | Number | Average Earnings |
| Male | 12,555 (51.0%) | $59,004 |
| Female | 12,040 (48.9%) | $42,143 |
| Total | 24,595 (100.0%) | $49,279 |
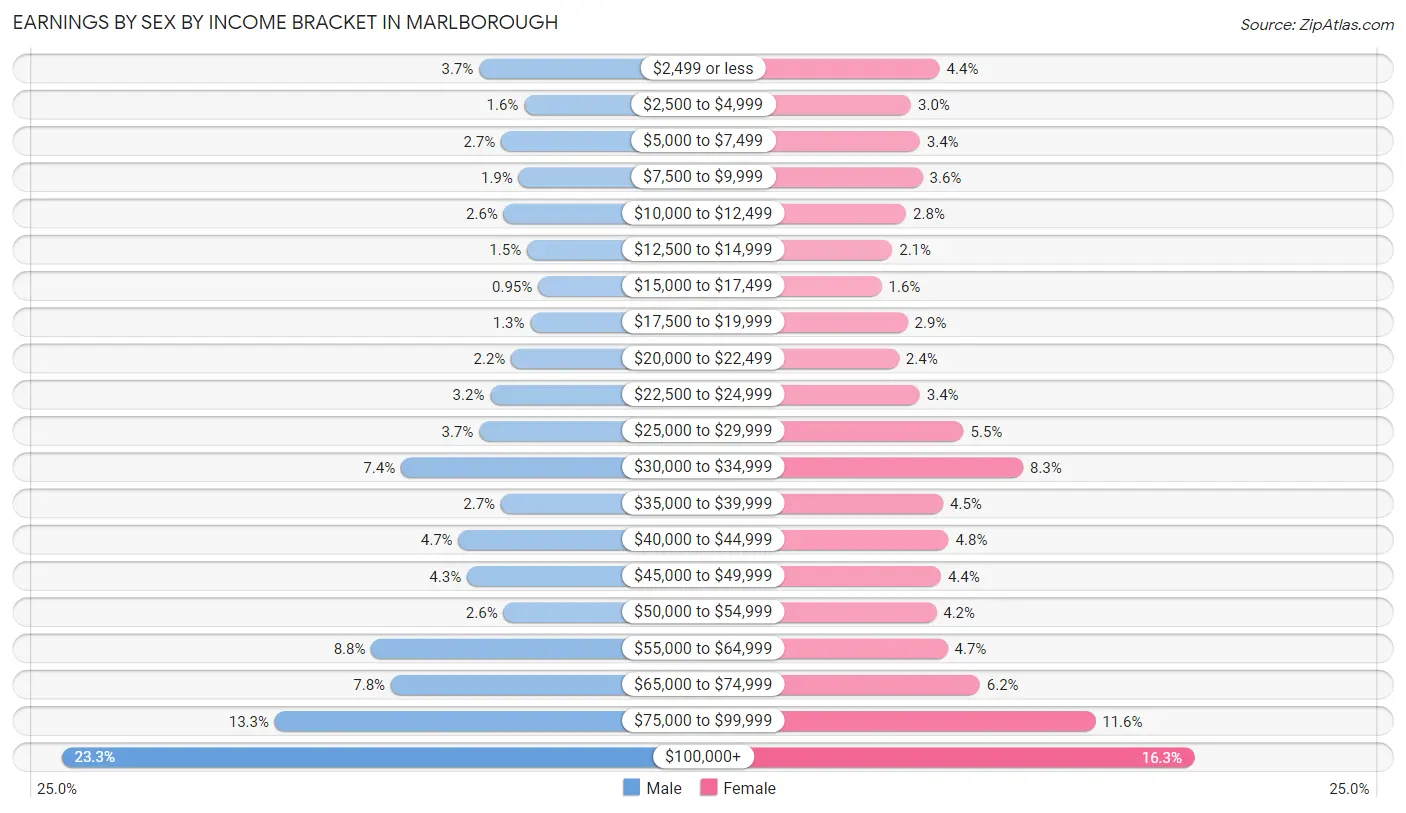
Earnings by Sex by Income Bracket in Marlborough
The most common earnings brackets in Marlborough are $100,000+ for men (2,922 | 23.3%) and $100,000+ for women (1,956 | 16.3%).
| Income | Male | Female |
| $2,499 or less | 466 (3.7%) | 524 (4.3%) |
| $2,500 to $4,999 | 201 (1.6%) | 363 (3.0%) |
| $5,000 to $7,499 | 337 (2.7%) | 412 (3.4%) |
| $7,500 to $9,999 | 233 (1.9%) | 427 (3.5%) |
| $10,000 to $12,499 | 321 (2.6%) | 335 (2.8%) |
| $12,500 to $14,999 | 185 (1.5%) | 256 (2.1%) |
| $15,000 to $17,499 | 119 (0.9%) | 196 (1.6%) |
| $17,500 to $19,999 | 165 (1.3%) | 343 (2.9%) |
| $20,000 to $22,499 | 278 (2.2%) | 294 (2.4%) |
| $22,500 to $24,999 | 400 (3.2%) | 412 (3.4%) |
| $25,000 to $29,999 | 466 (3.7%) | 658 (5.5%) |
| $30,000 to $34,999 | 925 (7.4%) | 993 (8.3%) |
| $35,000 to $39,999 | 338 (2.7%) | 543 (4.5%) |
| $40,000 to $44,999 | 588 (4.7%) | 574 (4.8%) |
| $45,000 to $49,999 | 537 (4.3%) | 531 (4.4%) |
| $50,000 to $54,999 | 323 (2.6%) | 504 (4.2%) |
| $55,000 to $64,999 | 1,100 (8.8%) | 568 (4.7%) |
| $65,000 to $74,999 | 984 (7.8%) | 750 (6.2%) |
| $75,000 to $99,999 | 1,667 (13.3%) | 1,401 (11.6%) |
| $100,000+ | 2,922 (23.3%) | 1,956 (16.3%) |
| Total | 12,555 (100.0%) | 12,040 (100.0%) |
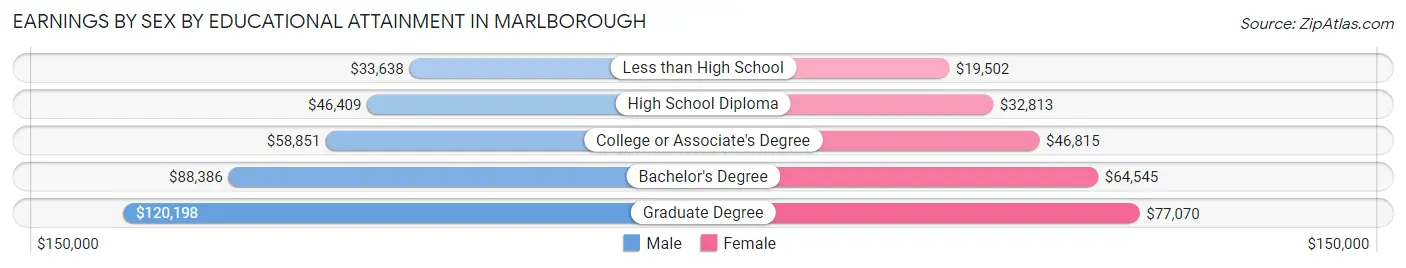
Earnings by Sex by Educational Attainment in Marlborough
Average earnings in Marlborough are $62,816 for men and $49,379 for women, a difference of 21.4%. Men with an educational attainment of graduate degree enjoy the highest average annual earnings of $120,198, while those with less than high school education earn the least with $33,638. Women with an educational attainment of graduate degree earn the most with the average annual earnings of $77,070, while those with less than high school education have the smallest earnings of $19,502.
| Educational Attainment | Male Income | Female Income |
| Less than High School | $33,638 | $19,502 |
| High School Diploma | $46,409 | $32,813 |
| College or Associate's Degree | $58,851 | $46,815 |
| Bachelor's Degree | $88,386 | $64,545 |
| Graduate Degree | $120,198 | $77,070 |
| Total | $62,816 | $49,379 |
Family Income in Marlborough
Family Income Brackets in Marlborough
According to the Marlborough family income data, there are 2,523 families falling into the $100,000 to $149,999 income range, which is the most common income bracket and makes up 24.7% of all families. Conversely, the $10,000 to $14,999 income bracket is the least frequent group with only 71 families (0.7%) belonging to this category.
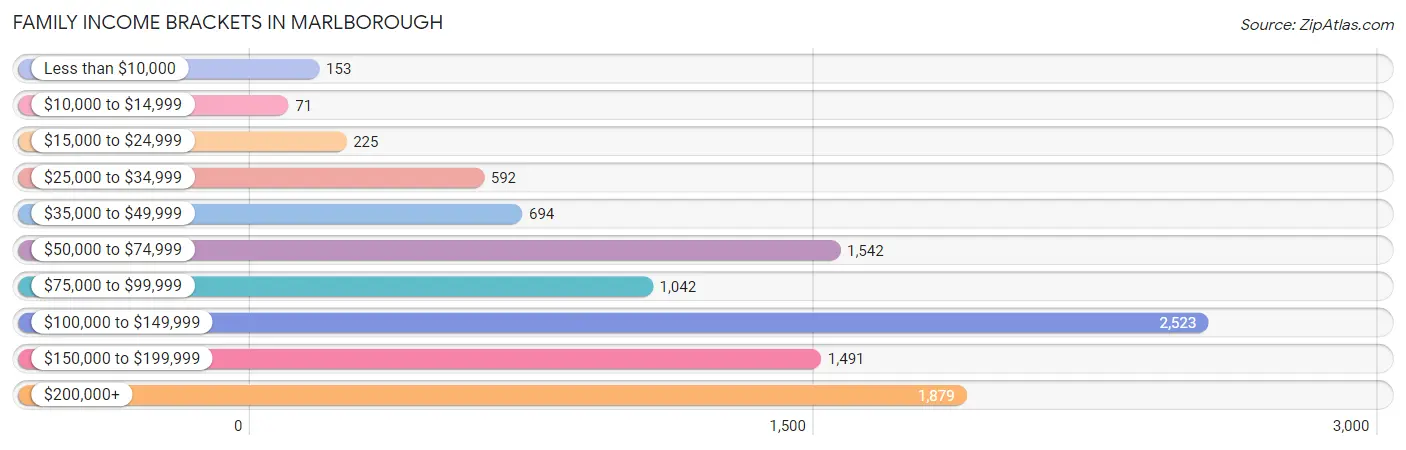
| Income Bracket | # Families | % Families |
| Less than $10,000 | 153 | 1.5% |
| $10,000 to $14,999 | 71 | 0.7% |
| $15,000 to $24,999 | 225 | 2.2% |
| $25,000 to $34,999 | 592 | 5.8% |
| $35,000 to $49,999 | 694 | 6.8% |
| $50,000 to $74,999 | 1,542 | 15.1% |
| $75,000 to $99,999 | 1,042 | 10.2% |
| $100,000 to $149,999 | 2,523 | 24.7% |
| $150,000 to $199,999 | 1,491 | 14.6% |
| $200,000+ | 1,879 | 18.4% |
Family Income by Famaliy Size in Marlborough
7+ person families (293 | 2.9%) account for the highest median family income in Marlborough with $162,516 per family, while 2-person families (4,402 | 43.1%) have the highest median income of $57,026 per family member.
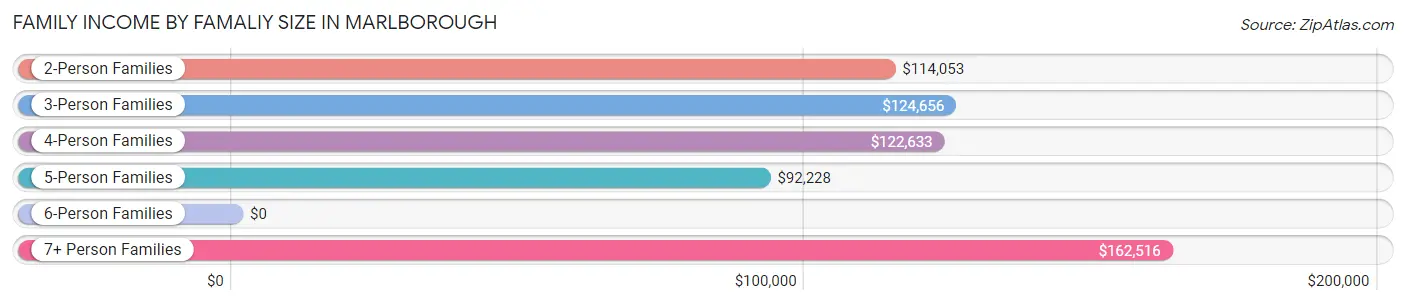
| Income Bracket | # Families | Median Income |
| 2-Person Families | 4,402 (43.1%) | $114,053 |
| 3-Person Families | 2,455 (24.0%) | $124,656 |
| 4-Person Families | 2,143 (21.0%) | $122,633 |
| 5-Person Families | 652 (6.4%) | $92,228 |
| 6-Person Families | 268 (2.6%) | $0 |
| 7+ Person Families | 293 (2.9%) | $162,516 |
| Total | 10,213 (100.0%) | $118,158 |
Family Income by Number of Earners in Marlborough
The median family income in Marlborough is $118,158, with families comprising 3+ earners (1,824) having the highest median family income of $146,429, while families with no earners (944) have the lowest median family income of $59,167, accounting for 17.9% and 9.2% of families, respectively.
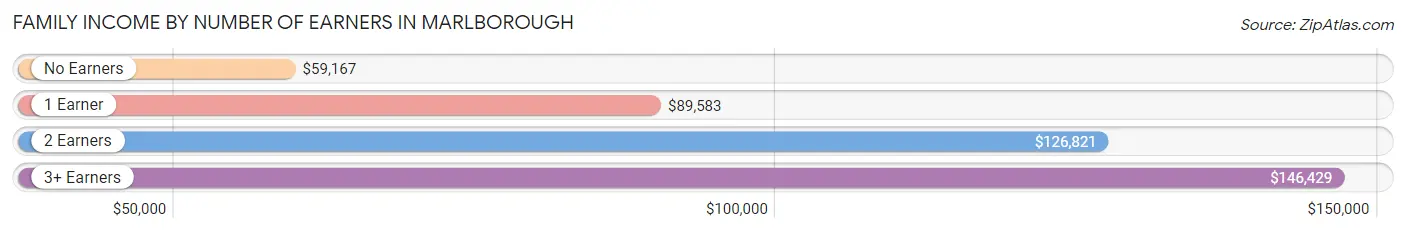
| Number of Earners | # Families | Median Income |
| No Earners | 944 (9.2%) | $59,167 |
| 1 Earner | 2,624 (25.7%) | $89,583 |
| 2 Earners | 4,821 (47.2%) | $126,821 |
| 3+ Earners | 1,824 (17.9%) | $146,429 |
| Total | 10,213 (100.0%) | $118,158 |
Household Income in Marlborough
Household Income Brackets in Marlborough
With 3,520 households falling in the category, the $100,000 to $149,999 income range is the most frequent in Marlborough, accounting for 21.3% of all households. In contrast, only 496 households (3.0%) fall into the less than $10,000 income bracket, making it the least populous group.
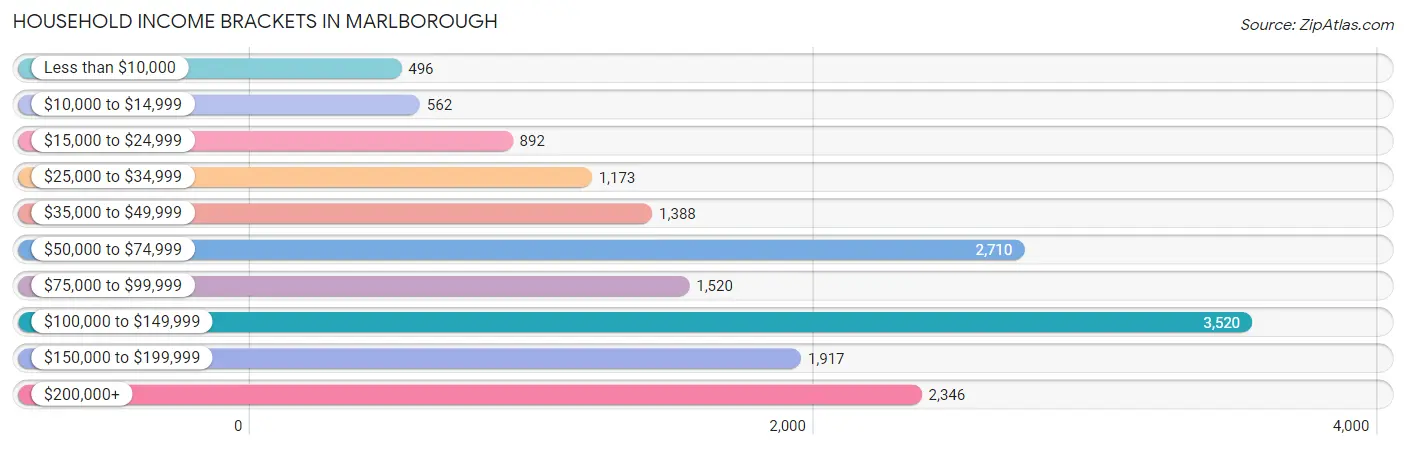
| Income Bracket | # Households | % Households |
| Less than $10,000 | 496 | 3.0% |
| $10,000 to $14,999 | 562 | 3.4% |
| $15,000 to $24,999 | 892 | 5.4% |
| $25,000 to $34,999 | 1,173 | 7.1% |
| $35,000 to $49,999 | 1,388 | 8.4% |
| $50,000 to $74,999 | 2,710 | 16.4% |
| $75,000 to $99,999 | 1,520 | 9.2% |
| $100,000 to $149,999 | 3,520 | 21.3% |
| $150,000 to $199,999 | 1,917 | 11.6% |
| $200,000+ | 2,346 | 14.2% |
Household Income by Householder Age in Marlborough
The median household income in Marlborough is $94,199, with the highest median household income of $114,328 found in the 45 to 64 years age bracket for the primary householder. A total of 6,391 households (38.7%) fall into this category. Meanwhile, the 15 to 24 years age bracket for the primary householder has the lowest median household income of $54,131, with 405 households (2.5%) in this group.
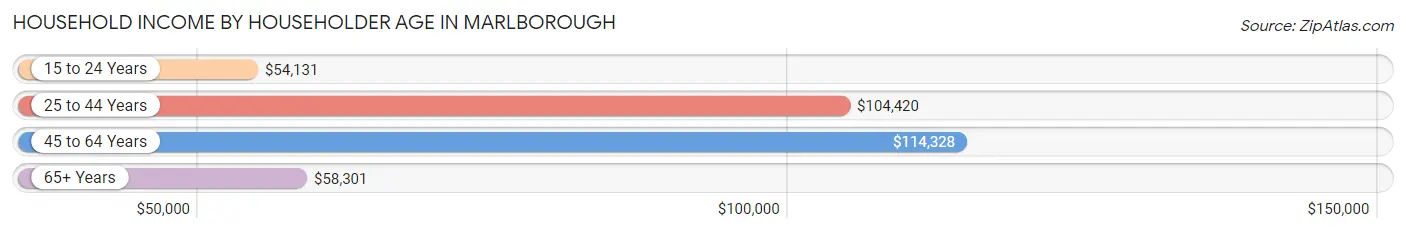
| Income Bracket | # Households | Median Income |
| 15 to 24 Years | 405 (2.5%) | $54,131 |
| 25 to 44 Years | 5,968 (36.1%) | $104,420 |
| 45 to 64 Years | 6,391 (38.7%) | $114,328 |
| 65+ Years | 3,760 (22.8%) | $58,301 |
| Total | 16,524 (100.0%) | $94,199 |
Poverty in Marlborough
Income Below Poverty by Sex and Age in Marlborough
With 8.7% poverty level for males and 8.9% for females among the residents of Marlborough, 5 year old males and 15 year old females are the most vulnerable to poverty, with 78 males (25.3%) and 78 females (40.6%) in their respective age groups living below the poverty level.
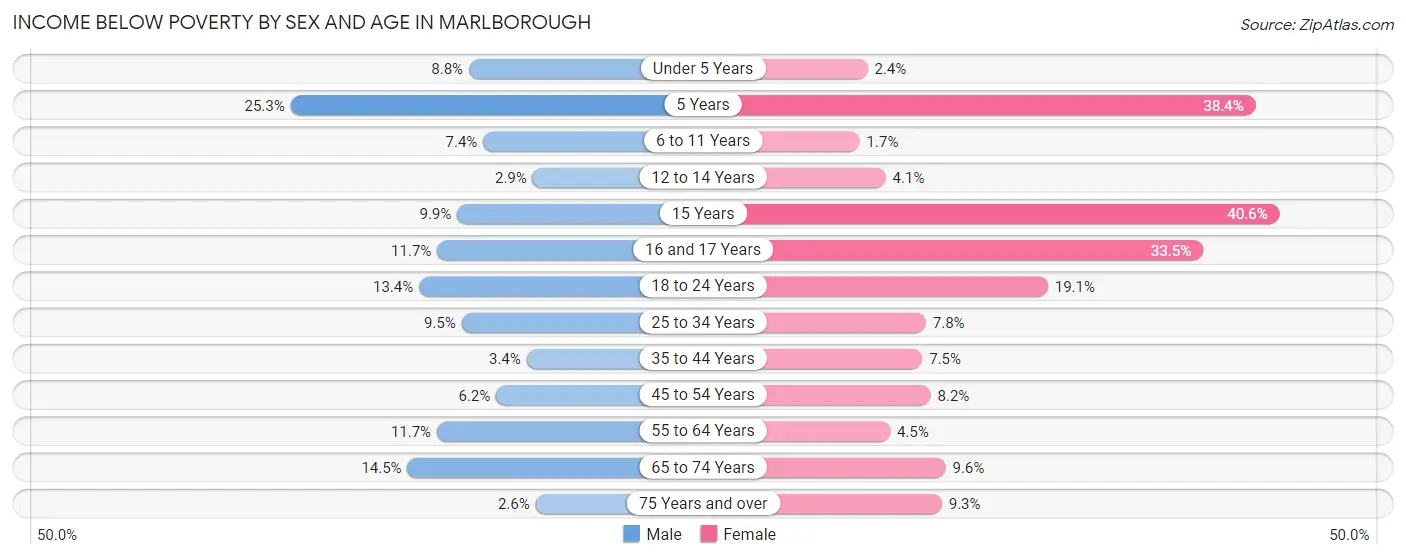
| Age Bracket | Male | Female |
| Under 5 Years | 130 (8.8%) | 39 (2.4%) |
| 5 Years | 78 (25.3%) | 91 (38.4%) |
| 6 to 11 Years | 93 (7.4%) | 20 (1.7%) |
| 12 to 14 Years | 16 (2.9%) | 24 (4.1%) |
| 15 Years | 14 (9.9%) | 78 (40.6%) |
| 16 and 17 Years | 37 (11.7%) | 120 (33.5%) |
| 18 to 24 Years | 181 (13.4%) | 388 (19.1%) |
| 25 to 34 Years | 332 (9.5%) | 256 (7.8%) |
| 35 to 44 Years | 96 (3.4%) | 230 (7.5%) |
| 45 to 54 Years | 165 (6.2%) | 231 (8.2%) |
| 55 to 64 Years | 309 (11.7%) | 121 (4.5%) |
| 65 to 74 Years | 248 (14.5%) | 161 (9.6%) |
| 75 Years and over | 28 (2.6%) | 119 (9.3%) |
| Total | 1,727 (8.7%) | 1,878 (8.9%) |
Income Above Poverty by Sex and Age in Marlborough
According to the poverty statistics in Marlborough, males aged 75 years and over and females aged 6 to 11 years are the age groups that are most secure financially, with 97.4% of males and 98.3% of females in these age groups living above the poverty line.
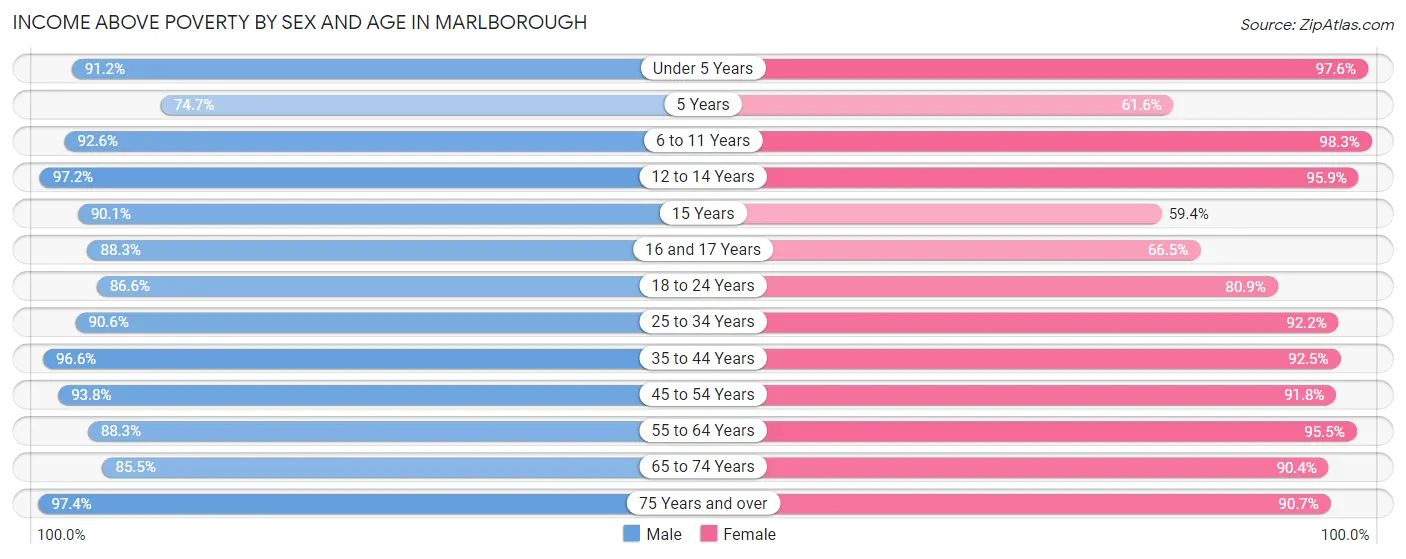
| Age Bracket | Male | Female |
| Under 5 Years | 1,354 (91.2%) | 1,603 (97.6%) |
| 5 Years | 230 (74.7%) | 146 (61.6%) |
| 6 to 11 Years | 1,157 (92.6%) | 1,184 (98.3%) |
| 12 to 14 Years | 545 (97.2%) | 565 (95.9%) |
| 15 Years | 128 (90.1%) | 114 (59.4%) |
| 16 and 17 Years | 279 (88.3%) | 238 (66.5%) |
| 18 to 24 Years | 1,171 (86.6%) | 1,641 (80.9%) |
| 25 to 34 Years | 3,183 (90.5%) | 3,026 (92.2%) |
| 35 to 44 Years | 2,722 (96.6%) | 2,850 (92.5%) |
| 45 to 54 Years | 2,480 (93.8%) | 2,574 (91.8%) |
| 55 to 64 Years | 2,325 (88.3%) | 2,587 (95.5%) |
| 65 to 74 Years | 1,466 (85.5%) | 1,510 (90.4%) |
| 75 Years and over | 1,059 (97.4%) | 1,163 (90.7%) |
| Total | 18,099 (91.3%) | 19,201 (91.1%) |
Income Below Poverty Among Married-Couple Families in Marlborough
The poverty statistics for married-couple families in Marlborough show that 2.4% or 190 of the total 7,822 families live below the poverty line. Families with 1 or 2 children have the highest poverty rate of 5.0%, comprising of 149 families. On the other hand, families with 3 or 4 children have the lowest poverty rate of 0.0%, which includes 0 families.
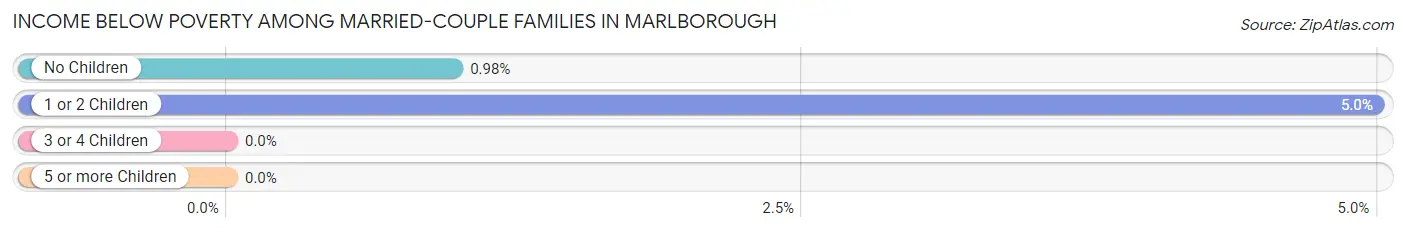
| Children | Above Poverty | Below Poverty |
| No Children | 4,144 (99.0%) | 41 (1.0%) |
| 1 or 2 Children | 2,838 (95.0%) | 149 (5.0%) |
| 3 or 4 Children | 614 (100.0%) | 0 (0.0%) |
| 5 or more Children | 36 (100.0%) | 0 (0.0%) |
| Total | 7,632 (97.6%) | 190 (2.4%) |
Income Below Poverty Among Single-Parent Households in Marlborough
According to the poverty data in Marlborough, 9.6% or 57 single-father households and 18.4% or 331 single-mother households are living below the poverty line. Among single-father households, those with 1 or 2 children have the highest poverty rate, with 41 households (18.5%) experiencing poverty. Likewise, among single-mother households, those with 3 or 4 children have the highest poverty rate, with 37 households (86.1%) falling below the poverty line.
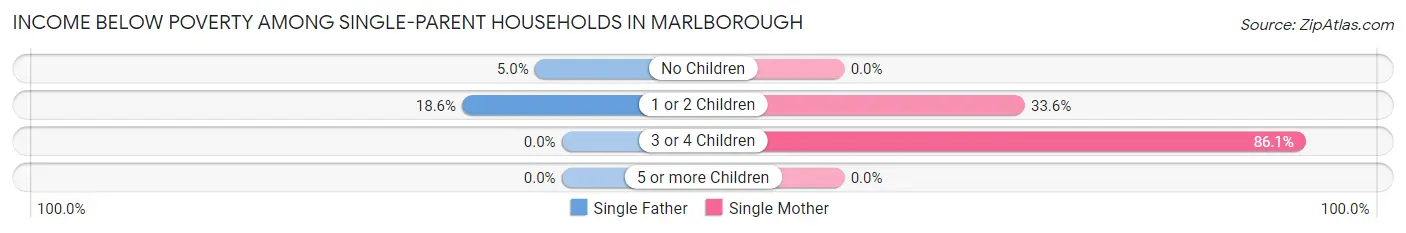
| Children | Single Father | Single Mother |
| No Children | 16 (5.0%) | 0 (0.0%) |
| 1 or 2 Children | 41 (18.5%) | 294 (33.6%) |
| 3 or 4 Children | 0 (0.0%) | 37 (86.1%) |
| 5 or more Children | 0 (0.0%) | 0 (0.0%) |
| Total | 57 (9.6%) | 331 (18.4%) |
Income Below Poverty Among Married-Couple vs Single-Parent Households in Marlborough
The poverty data for Marlborough shows that 190 of the married-couple family households (2.4%) and 388 of the single-parent households (16.2%) are living below the poverty level. Within the married-couple family households, those with 1 or 2 children have the highest poverty rate, with 149 households (5.0%) falling below the poverty line. Among the single-parent households, those with 3 or 4 children have the highest poverty rate, with 37 household (37.0%) living below poverty.
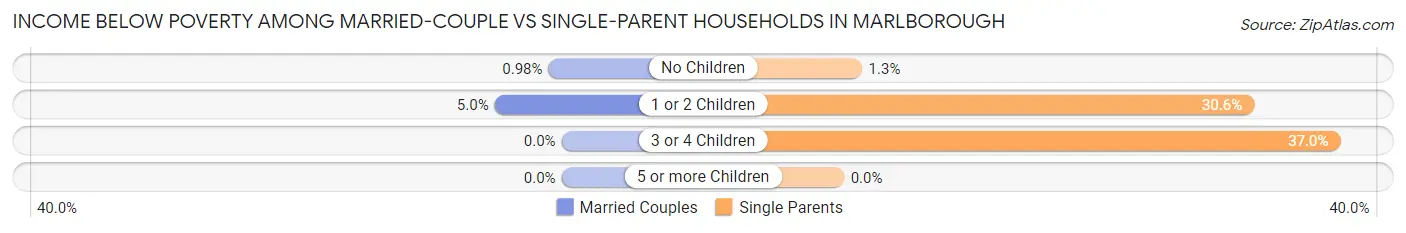
| Children | Married-Couple Families | Single-Parent Households |
| No Children | 41 (1.0%) | 16 (1.3%) |
| 1 or 2 Children | 149 (5.0%) | 335 (30.6%) |
| 3 or 4 Children | 0 (0.0%) | 37 (37.0%) |
| 5 or more Children | 0 (0.0%) | 0 (0.0%) |
| Total | 190 (2.4%) | 388 (16.2%) |
Race in Marlborough
The most populous races in Marlborough are White / Caucasian (26,801 | 64.7%), Hispanic or Latino (7,010 | 16.9%), and Some other Race (5,970 | 14.4%).
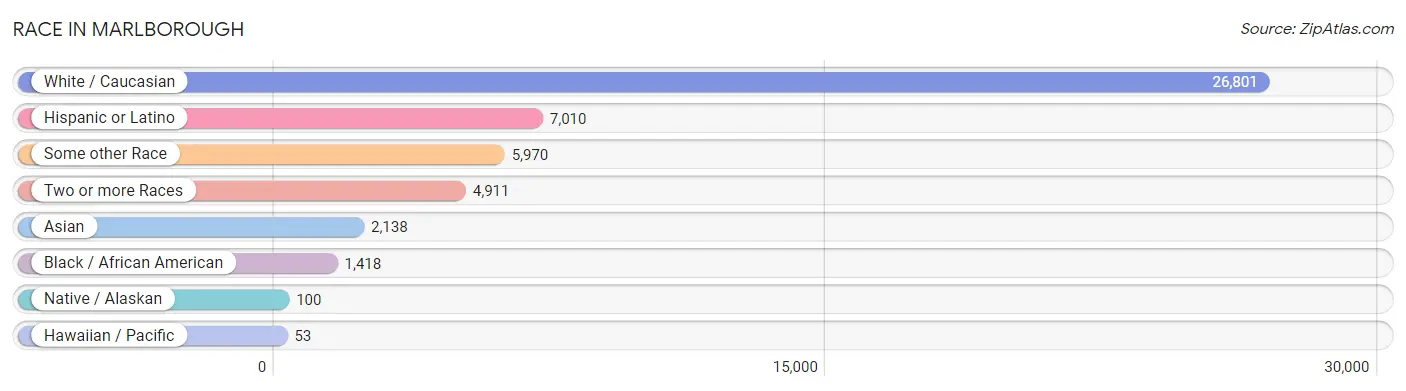
| Race | # Population | % Population |
| Asian | 2,138 | 5.2% |
| Black / African American | 1,418 | 3.4% |
| Hawaiian / Pacific | 53 | 0.1% |
| Hispanic or Latino | 7,010 | 16.9% |
| Native / Alaskan | 100 | 0.2% |
| White / Caucasian | 26,801 | 64.7% |
| Two or more Races | 4,911 | 11.9% |
| Some other Race | 5,970 | 14.4% |
| Total | 41,391 | 100.0% |
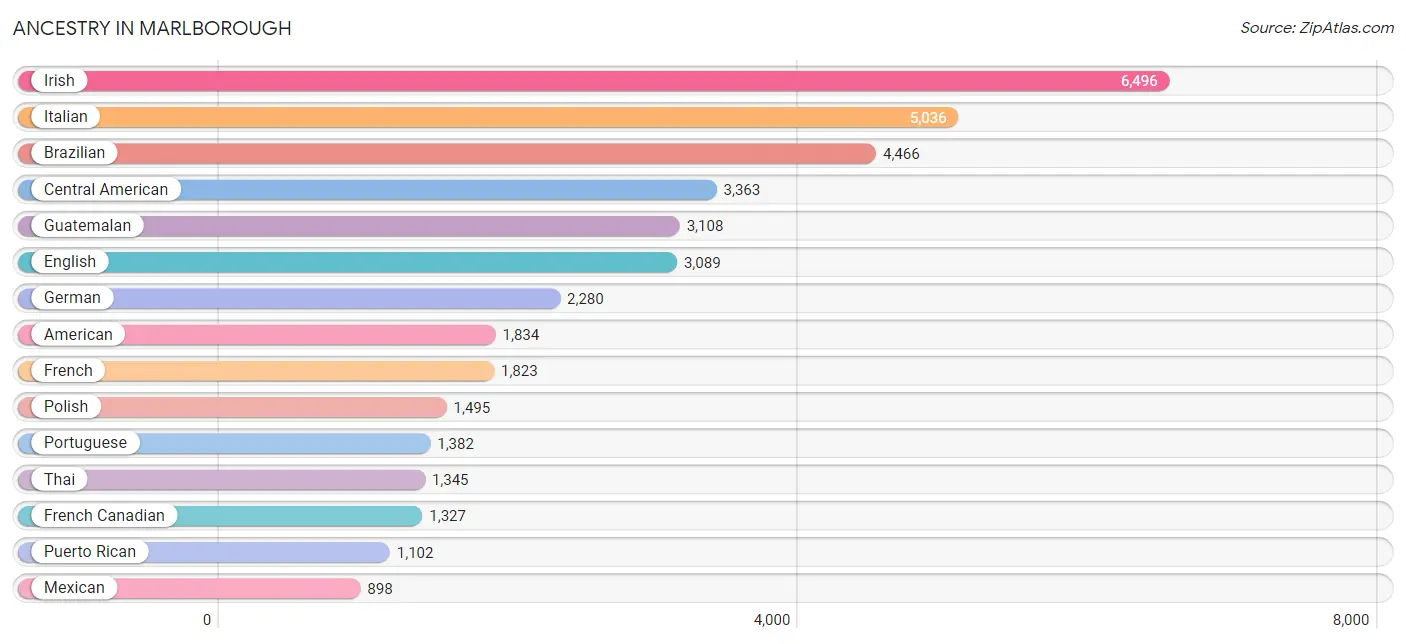
Ancestry in Marlborough
The most populous ancestries reported in Marlborough are Irish (6,496 | 15.7%), Italian (5,036 | 12.2%), Brazilian (4,466 | 10.8%), Central American (3,363 | 8.1%), and Guatemalan (3,108 | 7.5%), together accounting for 54.3% of all Marlborough residents.
| Ancestry | # Population | % Population |
| African | 28 | 0.1% |
| Albanian | 24 | 0.1% |
| American | 1,834 | 4.4% |
| Arab | 347 | 0.8% |
| Argentinean | 40 | 0.1% |
| Armenian | 483 | 1.2% |
| Australian | 43 | 0.1% |
| Austrian | 151 | 0.4% |
| Bangladeshi | 41 | 0.1% |
| Belgian | 11 | 0.0% |
| Bhutanese | 191 | 0.5% |
| Bolivian | 96 | 0.2% |
| Brazilian | 4,466 | 10.8% |
| British | 224 | 0.5% |
| British West Indian | 12 | 0.0% |
| Burmese | 49 | 0.1% |
| Canadian | 223 | 0.5% |
| Cape Verdean | 42 | 0.1% |
| Central American | 3,363 | 8.1% |
| Central American Indian | 99 | 0.2% |
| Cherokee | 95 | 0.2% |
| Chickasaw | 70 | 0.2% |
| Chilean | 71 | 0.2% |
| Colombian | 429 | 1.0% |
| Cree | 8 | 0.0% |
| Creek | 7 | 0.0% |
| Croatian | 35 | 0.1% |
| Cuban | 195 | 0.5% |
| Czech | 57 | 0.1% |
| Czechoslovakian | 36 | 0.1% |
| Danish | 69 | 0.2% |
| Dominican | 153 | 0.4% |
| Dutch | 153 | 0.4% |
| Eastern European | 144 | 0.4% |
| Ecuadorian | 64 | 0.2% |
| English | 3,089 | 7.5% |
| European | 391 | 0.9% |
| Finnish | 68 | 0.2% |
| French | 1,823 | 4.4% |
| French Canadian | 1,327 | 3.2% |
| German | 2,280 | 5.5% |
| Ghanaian | 43 | 0.1% |
| Greek | 723 | 1.8% |
| Guamanian / Chamorro | 53 | 0.1% |
| Guatemalan | 3,108 | 7.5% |
| Haitian | 111 | 0.3% |
| Honduran | 75 | 0.2% |
| Hungarian | 63 | 0.2% |
| Indian (Asian) | 547 | 1.3% |
| Iranian | 118 | 0.3% |
| Irish | 6,496 | 15.7% |
| Israeli | 16 | 0.0% |
| Italian | 5,036 | 12.2% |
| Jamaican | 15 | 0.0% |
| Korean | 262 | 0.6% |
| Latvian | 15 | 0.0% |
| Lebanese | 151 | 0.4% |
| Liberian | 85 | 0.2% |
| Lithuanian | 210 | 0.5% |
| Maltese | 43 | 0.1% |
| Mexican | 898 | 2.2% |
| Mexican American Indian | 163 | 0.4% |
| Moroccan | 155 | 0.4% |
| Nigerian | 297 | 0.7% |
| Northern European | 97 | 0.2% |
| Norwegian | 336 | 0.8% |
| Peruvian | 172 | 0.4% |
| Polish | 1,495 | 3.6% |
| Portuguese | 1,382 | 3.3% |
| Puerto Rican | 1,102 | 2.7% |
| Romanian | 1 | 0.0% |
| Russian | 521 | 1.3% |
| Salvadoran | 100 | 0.2% |
| Scandinavian | 51 | 0.1% |
| Scotch-Irish | 360 | 0.9% |
| Scottish | 571 | 1.4% |
| Seminole | 7 | 0.0% |
| Slavic | 27 | 0.1% |
| Slovak | 31 | 0.1% |
| Slovene | 22 | 0.1% |
| South African | 40 | 0.1% |
| South American | 889 | 2.1% |
| South American Indian | 16 | 0.0% |
| Spanish | 21 | 0.1% |
| Sri Lankan | 55 | 0.1% |
| Subsaharan African | 547 | 1.3% |
| Swedish | 392 | 0.9% |
| Swiss | 53 | 0.1% |
| Syrian | 33 | 0.1% |
| Thai | 1,345 | 3.3% |
| Ukrainian | 78 | 0.2% |
| Uruguayan | 17 | 0.0% |
| Vietnamese | 36 | 0.1% |
| Welsh | 169 | 0.4% |
| West Indian | 53 | 0.1% | View All 95 Rows |
Immigrants in Marlborough
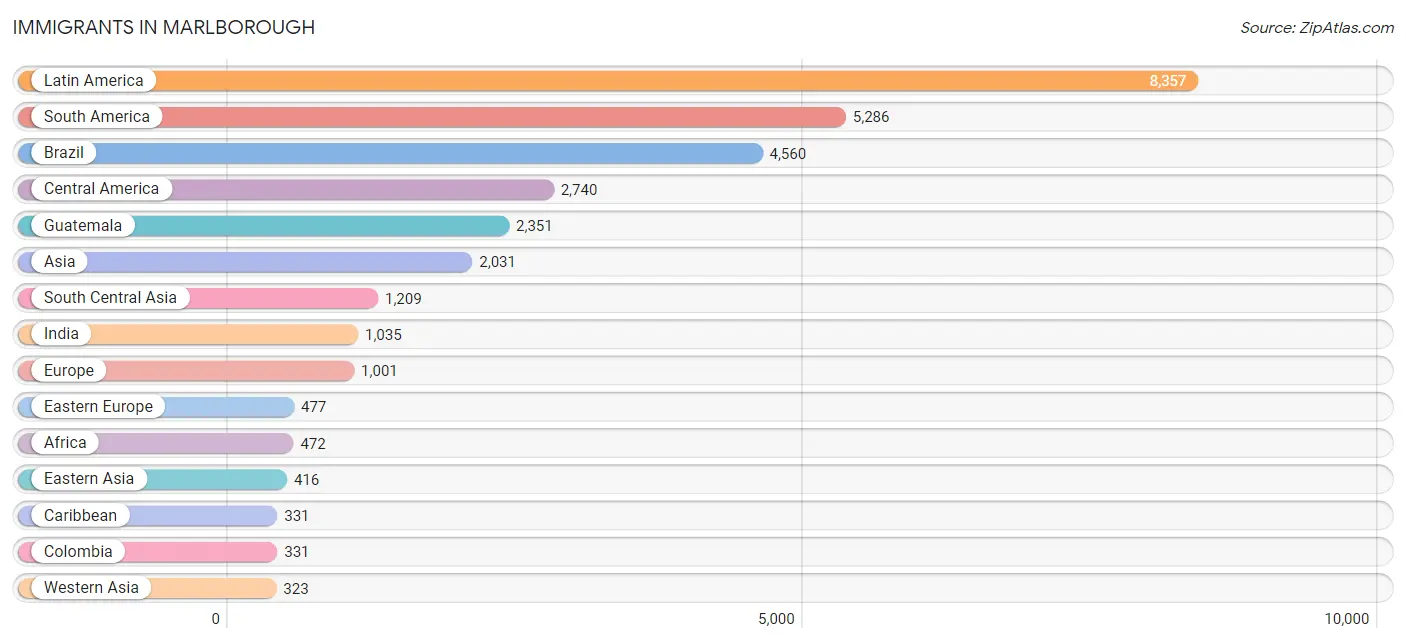
The most numerous immigrant groups reported in Marlborough came from Latin America (8,357 | 20.2%), South America (5,286 | 12.8%), Brazil (4,560 | 11.0%), Central America (2,740 | 6.6%), and Guatemala (2,351 | 5.7%), together accounting for 56.3% of all Marlborough residents.
| Immigration Origin | # Population | % Population |
| Africa | 472 | 1.1% |
| Argentina | 40 | 0.1% |
| Armenia | 249 | 0.6% |
| Asia | 2,031 | 4.9% |
| Australia | 48 | 0.1% |
| Austria | 14 | 0.0% |
| Azores | 23 | 0.1% |
| Belarus | 47 | 0.1% |
| Belgium | 11 | 0.0% |
| Bolivia | 132 | 0.3% |
| Brazil | 4,560 | 11.0% |
| Cabo Verde | 18 | 0.0% |
| Canada | 150 | 0.4% |
| Caribbean | 331 | 0.8% |
| Central America | 2,740 | 6.6% |
| Chile | 53 | 0.1% |
| China | 296 | 0.7% |
| Colombia | 331 | 0.8% |
| Costa Rica | 43 | 0.1% |
| Czechoslovakia | 13 | 0.0% |
| Denmark | 12 | 0.0% |
| Dominican Republic | 164 | 0.4% |
| Eastern Africa | 75 | 0.2% |
| Eastern Asia | 416 | 1.0% |
| Eastern Europe | 477 | 1.1% |
| Ecuador | 13 | 0.0% |
| El Salvador | 53 | 0.1% |
| England | 110 | 0.3% |
| Europe | 1,001 | 2.4% |
| France | 25 | 0.1% |
| Germany | 47 | 0.1% |
| Ghana | 43 | 0.1% |
| Greece | 18 | 0.0% |
| Guatemala | 2,351 | 5.7% |
| Haiti | 119 | 0.3% |
| Honduras | 61 | 0.2% |
| Hong Kong | 36 | 0.1% |
| Hungary | 23 | 0.1% |
| India | 1,035 | 2.5% |
| Iran | 144 | 0.4% |
| Ireland | 57 | 0.1% |
| Israel | 16 | 0.0% |
| Italy | 31 | 0.1% |
| Jamaica | 36 | 0.1% |
| Japan | 89 | 0.2% |
| Korea | 31 | 0.1% |
| Latin America | 8,357 | 20.2% |
| Lebanon | 40 | 0.1% |
| Liberia | 30 | 0.1% |
| Lithuania | 73 | 0.2% |
| Mexico | 232 | 0.6% |
| Morocco | 69 | 0.2% |
| Nigeria | 181 | 0.4% |
| Northern Africa | 69 | 0.2% |
| Northern Europe | 288 | 0.7% |
| Oceania | 48 | 0.1% |
| Pakistan | 30 | 0.1% |
| Peru | 140 | 0.3% |
| Philippines | 55 | 0.1% |
| Poland | 97 | 0.2% |
| Portugal | 78 | 0.2% |
| Romania | 1 | 0.0% |
| Russia | 168 | 0.4% |
| South Africa | 40 | 0.1% |
| South America | 5,286 | 12.8% |
| South Central Asia | 1,209 | 2.9% |
| South Eastern Asia | 83 | 0.2% |
| Southern Europe | 127 | 0.3% |
| Switzerland | 12 | 0.0% |
| Taiwan | 13 | 0.0% |
| Uganda | 58 | 0.1% |
| Ukraine | 55 | 0.1% |
| Uruguay | 17 | 0.0% |
| Vietnam | 28 | 0.1% |
| Western Africa | 272 | 0.7% |
| Western Asia | 323 | 0.8% |
| Western Europe | 109 | 0.3% | View All 77 Rows |
Sex and Age in Marlborough
Sex and Age in Marlborough
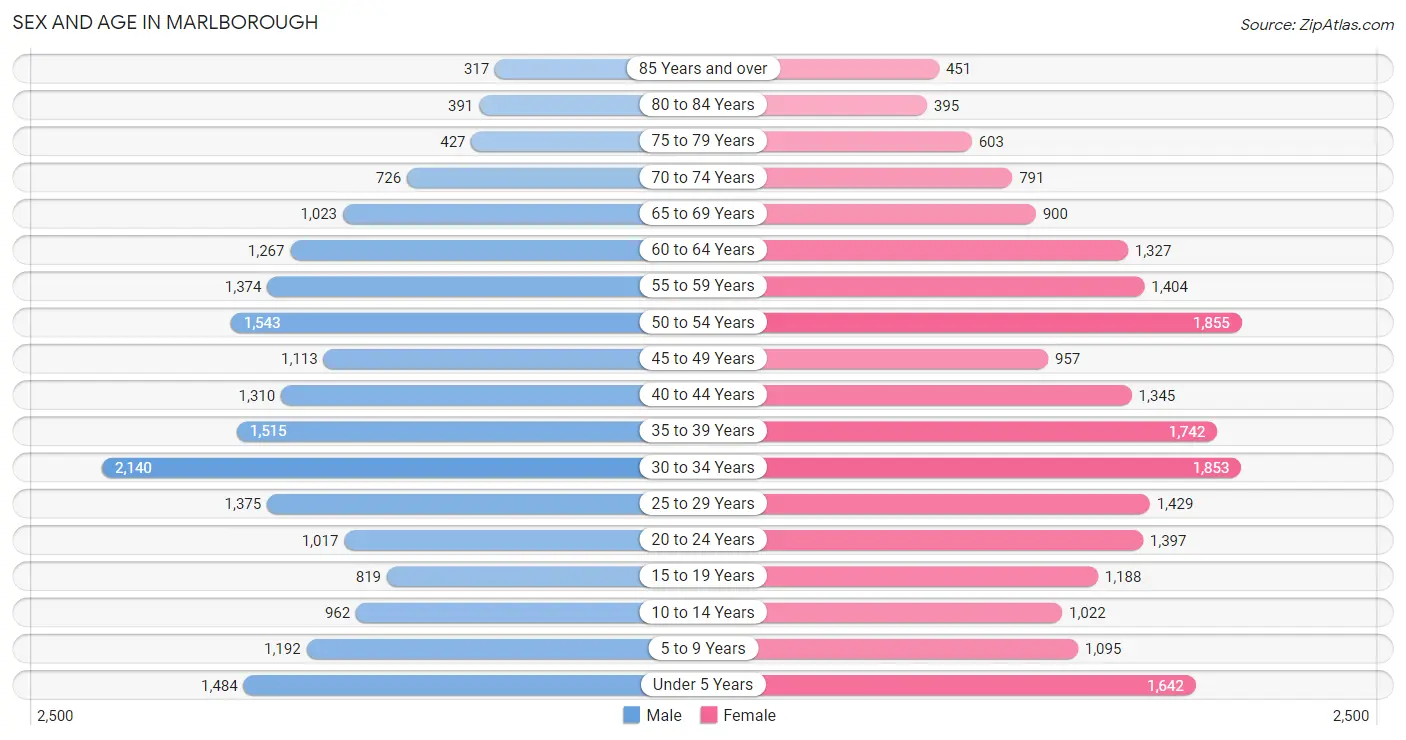
The most populous age groups in Marlborough are 30 to 34 Years (2,140 | 10.7%) for men and 50 to 54 Years (1,855 | 8.7%) for women.
| Age Bracket | Male | Female |
| Under 5 Years | 1,484 (7.4%) | 1,642 (7.7%) |
| 5 to 9 Years | 1,192 (6.0%) | 1,095 (5.1%) |
| 10 to 14 Years | 962 (4.8%) | 1,022 (4.8%) |
| 15 to 19 Years | 819 (4.1%) | 1,188 (5.6%) |
| 20 to 24 Years | 1,017 (5.1%) | 1,397 (6.5%) |
| 25 to 29 Years | 1,375 (6.9%) | 1,429 (6.7%) |
| 30 to 34 Years | 2,140 (10.7%) | 1,853 (8.7%) |
| 35 to 39 Years | 1,515 (7.6%) | 1,742 (8.1%) |
| 40 to 44 Years | 1,310 (6.6%) | 1,345 (6.3%) |
| 45 to 49 Years | 1,113 (5.6%) | 957 (4.5%) |
| 50 to 54 Years | 1,543 (7.7%) | 1,855 (8.7%) |
| 55 to 59 Years | 1,374 (6.9%) | 1,404 (6.6%) |
| 60 to 64 Years | 1,267 (6.3%) | 1,327 (6.2%) |
| 65 to 69 Years | 1,023 (5.1%) | 900 (4.2%) |
| 70 to 74 Years | 726 (3.6%) | 791 (3.7%) |
| 75 to 79 Years | 427 (2.1%) | 603 (2.8%) |
| 80 to 84 Years | 391 (2.0%) | 395 (1.8%) |
| 85 Years and over | 317 (1.6%) | 451 (2.1%) |
| Total | 19,995 (100.0%) | 21,396 (100.0%) |
Families and Households in Marlborough
Median Family Size in Marlborough
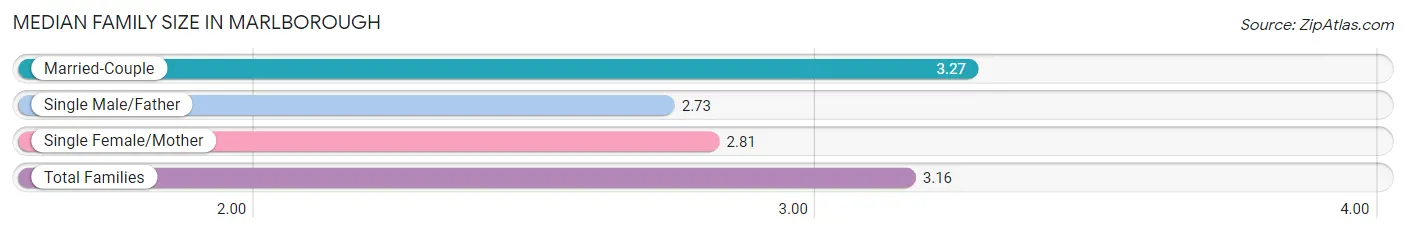
The median family size in Marlborough is 3.16 persons per family, with married-couple families (7,822 | 76.6%) accounting for the largest median family size of 3.27 persons per family. On the other hand, single male/father families (596 | 5.8%) represent the smallest median family size with 2.73 persons per family.
| Family Type | # Families | Family Size |
| Married-Couple | 7,822 (76.6%) | 3.27 |
| Single Male/Father | 596 (5.8%) | 2.73 |
| Single Female/Mother | 1,795 (17.6%) | 2.81 |
| Total Families | 10,213 (100.0%) | 3.16 |
Median Household Size in Marlborough
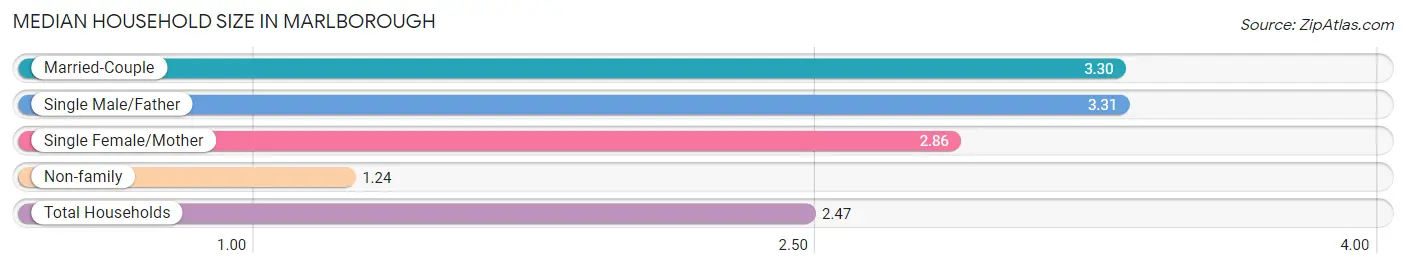
The median household size in Marlborough is 2.47 persons per household, with single male/father households (596 | 3.6%) accounting for the largest median household size of 3.31 persons per household. non-family households (6,311 | 38.2%) represent the smallest median household size with 1.24 persons per household.
| Household Type | # Households | Household Size |
| Married-Couple | 7,822 (47.3%) | 3.30 |
| Single Male/Father | 596 (3.6%) | 3.31 |
| Single Female/Mother | 1,795 (10.9%) | 2.86 |
| Non-family | 6,311 (38.2%) | 1.24 |
| Total Households | 16,524 (100.0%) | 2.47 |
Household Size by Marriage Status in Marlborough
Out of a total of 16,524 households in Marlborough, 10,213 (61.8%) are family households, while 6,311 (38.2%) are nonfamily households. The most numerous type of family households are 2-person households, comprising 4,209, and the most common type of nonfamily households are 1-person households, comprising 4,915.
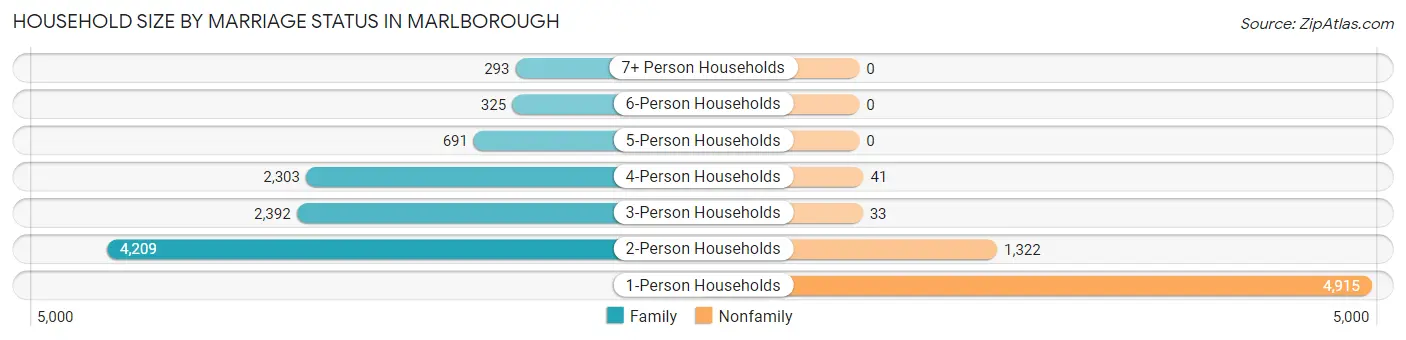
| Household Size | Family Households | Nonfamily Households |
| 1-Person Households | - | 4,915 (29.7%) |
| 2-Person Households | 4,209 (25.5%) | 1,322 (8.0%) |
| 3-Person Households | 2,392 (14.5%) | 33 (0.2%) |
| 4-Person Households | 2,303 (13.9%) | 41 (0.3%) |
| 5-Person Households | 691 (4.2%) | 0 (0.0%) |
| 6-Person Households | 325 (2.0%) | 0 (0.0%) |
| 7+ Person Households | 293 (1.8%) | 0 (0.0%) |
| Total | 10,213 (61.8%) | 6,311 (38.2%) |
Female Fertility in Marlborough
Fertility by Age in Marlborough
Average fertility rate in Marlborough is 74.0 births per 1,000 women. Women in the age bracket of 20 to 34 years have the highest fertility rate with 101.0 births per 1,000 women. Women in the age bracket of 20 to 34 years acount for 62.2% of all women with births.
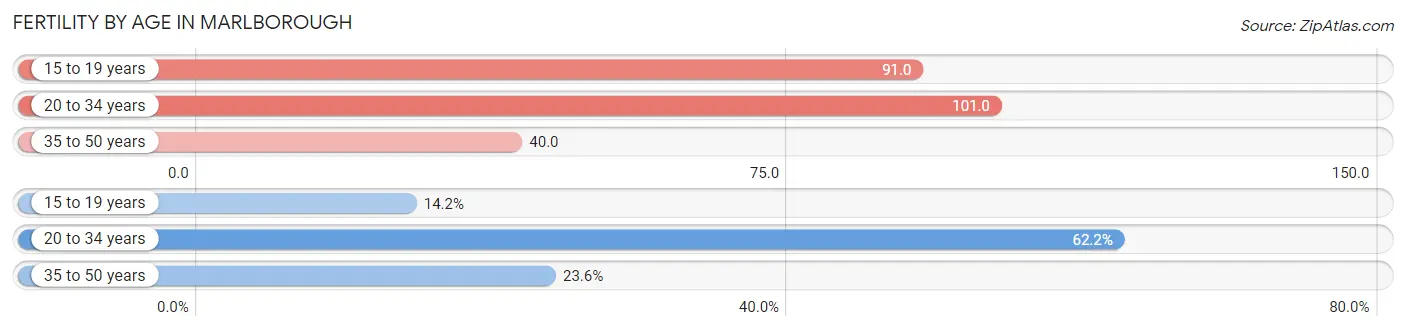
| Age Bracket | Women with Births | Births / 1,000 Women |
| 15 to 19 years | 108 (14.2%) | 91.0 |
| 20 to 34 years | 474 (62.2%) | 101.0 |
| 35 to 50 years | 180 (23.6%) | 40.0 |
| Total | 762 (100.0%) | 74.0 |
Fertility by Age by Marriage Status in Marlborough
76.2% of women with births (762) in Marlborough are married. The highest percentage of unmarried women with births falls into 20 to 34 years age bracket with 36.1% of them unmarried at the time of birth, while the lowest percentage of unmarried women with births belong to 15 to 19 years age bracket with 0.0% of them unmarried.
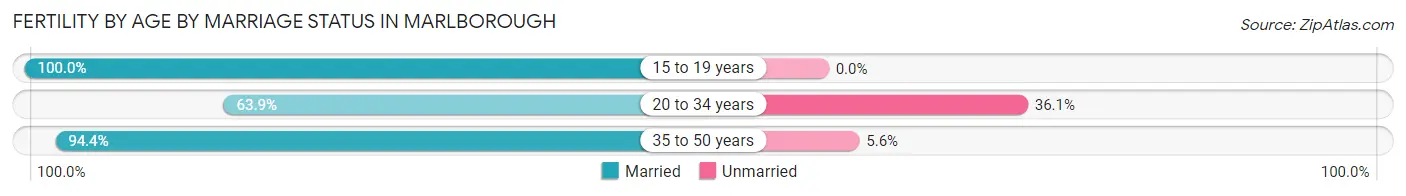
| Age Bracket | Married | Unmarried |
| 15 to 19 years | 108 (100.0%) | 0 (0.0%) |
| 20 to 34 years | 303 (63.9%) | 171 (36.1%) |
| 35 to 50 years | 170 (94.4%) | 10 (5.6%) |
| Total | 581 (76.2%) | 181 (23.7%) |
Fertility by Education in Marlborough
Average fertility rate in Marlborough is 74.0 births per 1,000 women. Women with the education attainment of high school diploma have the highest fertility rate of 145.0 births per 1,000 women, while women with the education attainment of bachelor's degree have the lowest fertility at 35.0 births per 1,000 women. Women with the education attainment of high school diploma represent 34.1% of all women with births.
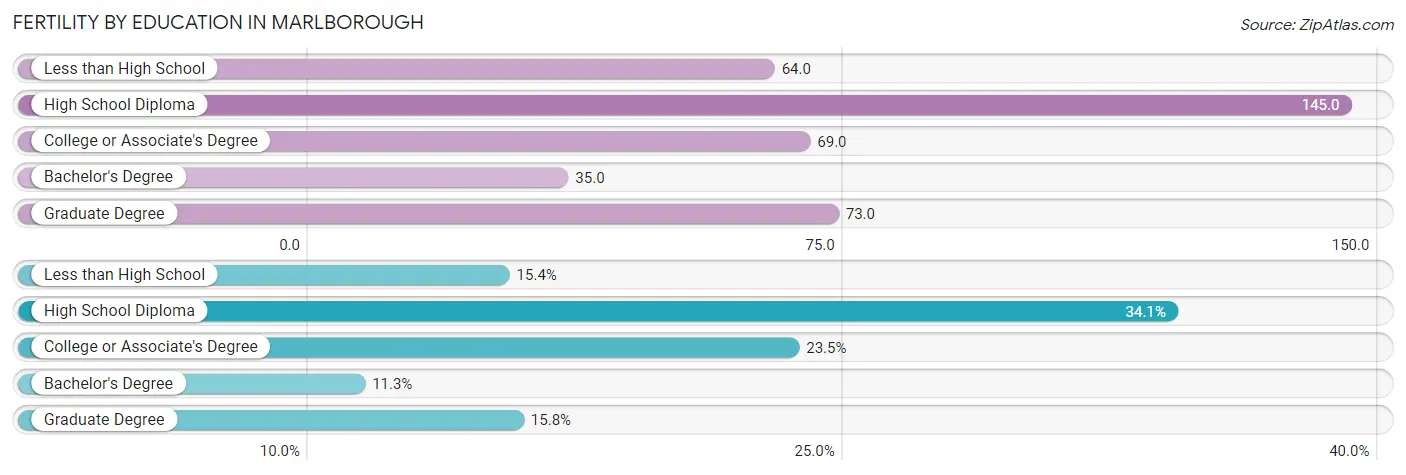
| Educational Attainment | Women with Births | Births / 1,000 Women |
| Less than High School | 117 (15.3%) | 64.0 |
| High School Diploma | 260 (34.1%) | 145.0 |
| College or Associate's Degree | 179 (23.5%) | 69.0 |
| Bachelor's Degree | 86 (11.3%) | 35.0 |
| Graduate Degree | 120 (15.8%) | 73.0 |
| Total | 762 (100.0%) | 74.0 |
Fertility by Education by Marriage Status in Marlborough
23.7% of women with births in Marlborough are unmarried. Women with the educational attainment of less than high school are most likely to be married with 100.0% of them married at childbirth, while women with the educational attainment of college or associate's degree are least likely to be married with 44.7% of them unmarried at childbirth.
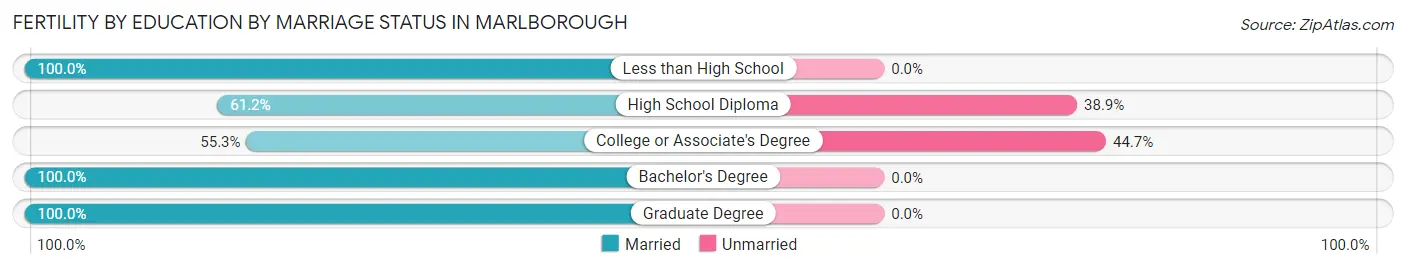
| Educational Attainment | Married | Unmarried |
| Less than High School | 117 (100.0%) | 0 (0.0%) |
| High School Diploma | 159 (61.2%) | 101 (38.9%) |
| College or Associate's Degree | 99 (55.3%) | 80 (44.7%) |
| Bachelor's Degree | 86 (100.0%) | 0 (0.0%) |
| Graduate Degree | 120 (100.0%) | 0 (0.0%) |
| Total | 581 (76.2%) | 181 (23.7%) |
Employment Characteristics in Marlborough
Employment by Class of Employer in Marlborough
Among the 22,075 employed individuals in Marlborough, private company employees (16,227 | 73.5%), self-employed (not incorporated) (1,619 | 7.3%), and not-for-profit organizations (1,391 | 6.3%) make up the most common classes of employment.
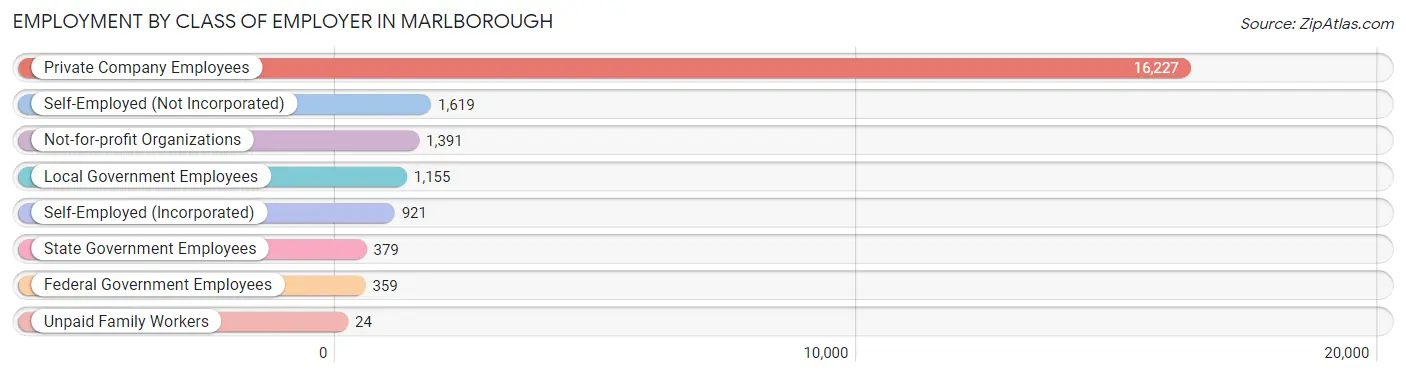
| Employer Class | # Employees | % Employees |
| Private Company Employees | 16,227 | 73.5% |
| Self-Employed (Incorporated) | 921 | 4.2% |
| Self-Employed (Not Incorporated) | 1,619 | 7.3% |
| Not-for-profit Organizations | 1,391 | 6.3% |
| Local Government Employees | 1,155 | 5.2% |
| State Government Employees | 379 | 1.7% |
| Federal Government Employees | 359 | 1.6% |
| Unpaid Family Workers | 24 | 0.1% |
| Total | 22,075 | 100.0% |
Employment Status by Age in Marlborough
According to the labor force statistics for Marlborough, out of the total population over 16 years of age (33,660), 72.0% or 24,235 individuals are in the labor force, with 5.4% or 1,309 of them unemployed. The age group with the highest labor force participation rate is 25 to 29 years, with 90.0% or 2,524 individuals in the labor force. Within the labor force, the 16 to 19 years age range has the highest percentage of unemployed individuals, with 14.1% or 100 of them being unemployed.
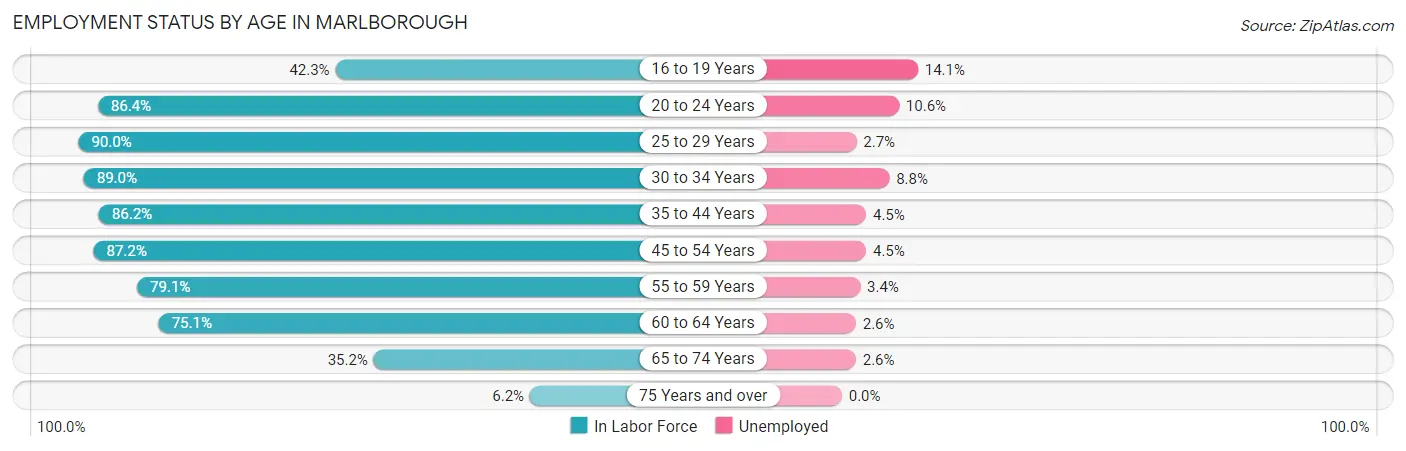
| Age Bracket | In Labor Force | Unemployed |
| 16 to 19 Years | 708 (42.3%) | 100 (14.1%) |
| 20 to 24 Years | 2,086 (86.4%) | 221 (10.6%) |
| 25 to 29 Years | 2,524 (90.0%) | 68 (2.7%) |
| 30 to 34 Years | 3,554 (89.0%) | 313 (8.8%) |
| 35 to 44 Years | 5,096 (86.2%) | 229 (4.5%) |
| 45 to 54 Years | 4,768 (87.2%) | 215 (4.5%) |
| 55 to 59 Years | 2,197 (79.1%) | 75 (3.4%) |
| 60 to 64 Years | 1,948 (75.1%) | 51 (2.6%) |
| 65 to 74 Years | 1,211 (35.2%) | 31 (2.6%) |
| 75 Years and over | 160 (6.2%) | 0 (0.0%) |
| Total | 24,235 (72.0%) | 1,309 (5.4%) |
Employment Status by Educational Attainment in Marlborough
According to labor force statistics for Marlborough, 85.3% of individuals (20,087) out of the total population between 25 and 64 years of age (23,549) are in the labor force, with 4.7% or 944 of them being unemployed. The group with the highest labor force participation rate are those with the educational attainment of bachelor's degree or higher, with 92.4% or 9,196 individuals in the labor force. Within the labor force, individuals with high school diploma education have the highest percentage of unemployment, with 6.9% or 348 of them being unemployed.
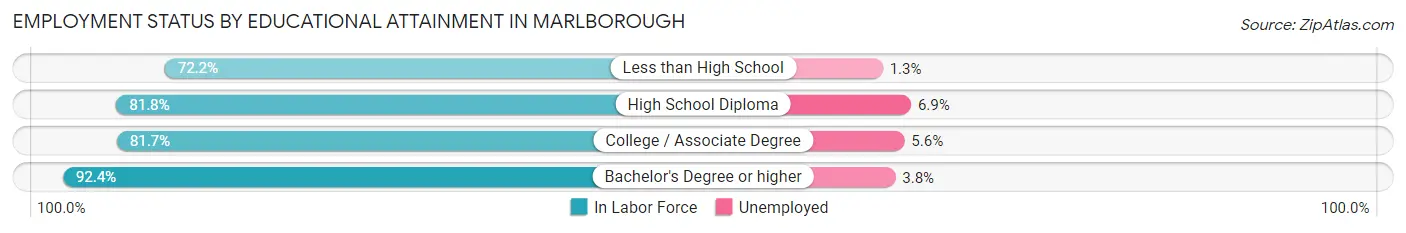
| Educational Attainment | In Labor Force | Unemployed |
| Less than High School | 1,703 (72.2%) | 31 (1.3%) |
| High School Diploma | 5,049 (81.8%) | 426 (6.9%) |
| College / Associate Degree | 4,139 (81.7%) | 284 (5.6%) |
| Bachelor's Degree or higher | 9,196 (92.4%) | 378 (3.8%) |
| Total | 20,087 (85.3%) | 1,107 (4.7%) |
Employment Occupations by Sex in Marlborough
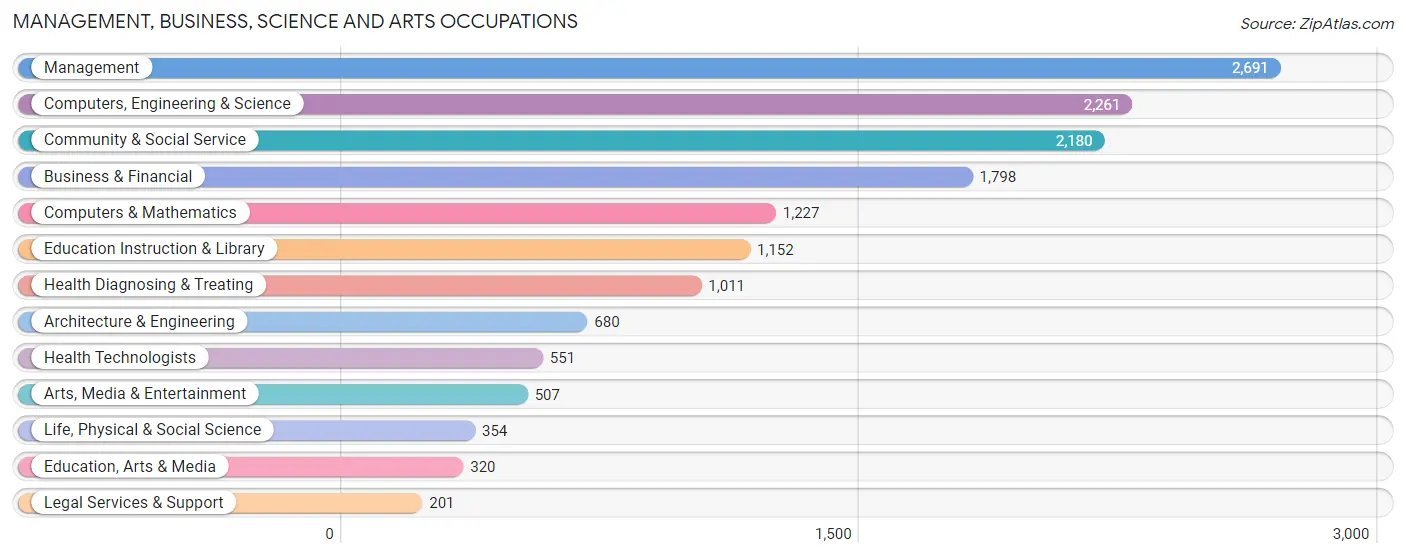
Management, Business, Science and Arts Occupations
The most common Management, Business, Science and Arts occupations in Marlborough are Management (2,691 | 11.7%), Computers, Engineering & Science (2,261 | 9.9%), Community & Social Service (2,180 | 9.5%), Business & Financial (1,798 | 7.8%), and Computers & Mathematics (1,227 | 5.3%).
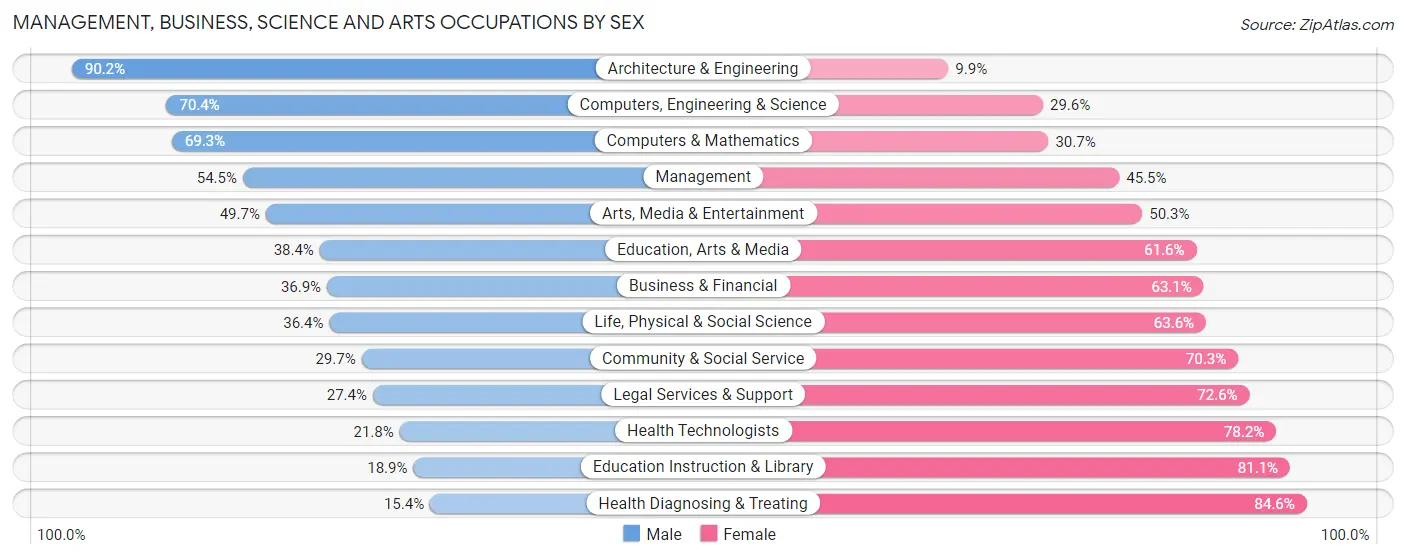
Management, Business, Science and Arts Occupations by Sex
Within the Management, Business, Science and Arts occupations in Marlborough, the most male-oriented occupations are Architecture & Engineering (90.1%), Computers, Engineering & Science (70.4%), and Computers & Mathematics (69.3%), while the most female-oriented occupations are Health Diagnosing & Treating (84.6%), Education Instruction & Library (81.1%), and Health Technologists (78.2%).
| Occupation | Male | Female |
| Management | 1,466 (54.5%) | 1,225 (45.5%) |
| Business & Financial | 664 (36.9%) | 1,134 (63.1%) |
| Computers, Engineering & Science | 1,592 (70.4%) | 669 (29.6%) |
| Computers & Mathematics | 850 (69.3%) | 377 (30.7%) |
| Architecture & Engineering | 613 (90.1%) | 67 (9.9%) |
| Life, Physical & Social Science | 129 (36.4%) | 225 (63.6%) |
| Community & Social Service | 648 (29.7%) | 1,532 (70.3%) |
| Education, Arts & Media | 123 (38.4%) | 197 (61.6%) |
| Legal Services & Support | 55 (27.4%) | 146 (72.6%) |
| Education Instruction & Library | 218 (18.9%) | 934 (81.1%) |
| Arts, Media & Entertainment | 252 (49.7%) | 255 (50.3%) |
| Health Diagnosing & Treating | 156 (15.4%) | 855 (84.6%) |
| Health Technologists | 120 (21.8%) | 431 (78.2%) |
| Total (Category) | 4,526 (45.5%) | 5,415 (54.5%) |
| Total (Overall) | 11,971 (52.2%) | 10,962 (47.8%) |
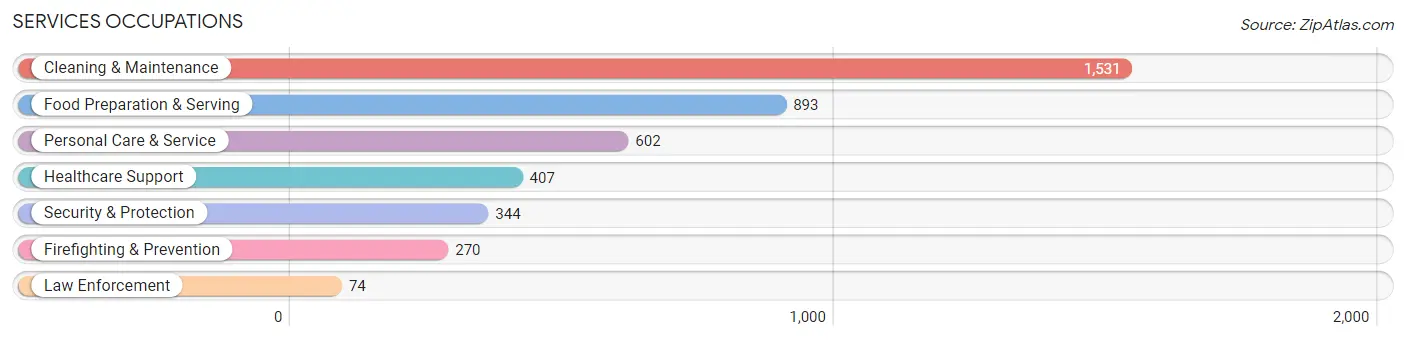
Services Occupations
The most common Services occupations in Marlborough are Cleaning & Maintenance (1,531 | 6.7%), Food Preparation & Serving (893 | 3.9%), Personal Care & Service (602 | 2.6%), Healthcare Support (407 | 1.8%), and Security & Protection (344 | 1.5%).
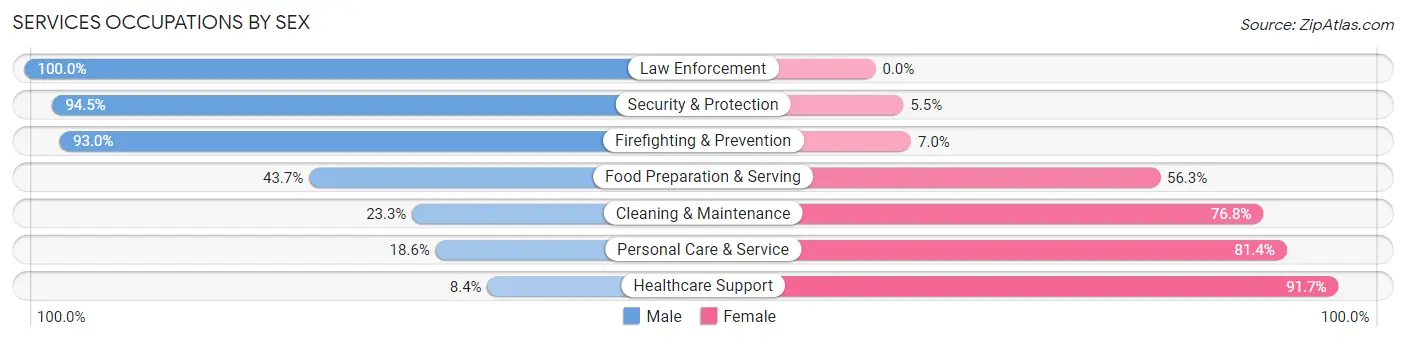
Services Occupations by Sex
Within the Services occupations in Marlborough, the most male-oriented occupations are Law Enforcement (100.0%), Security & Protection (94.5%), and Firefighting & Prevention (93.0%), while the most female-oriented occupations are Healthcare Support (91.6%), Personal Care & Service (81.4%), and Cleaning & Maintenance (76.7%).
| Occupation | Male | Female |
| Healthcare Support | 34 (8.4%) | 373 (91.6%) |
| Security & Protection | 325 (94.5%) | 19 (5.5%) |
| Firefighting & Prevention | 251 (93.0%) | 19 (7.0%) |
| Law Enforcement | 74 (100.0%) | 0 (0.0%) |
| Food Preparation & Serving | 390 (43.7%) | 503 (56.3%) |
| Cleaning & Maintenance | 356 (23.3%) | 1,175 (76.7%) |
| Personal Care & Service | 112 (18.6%) | 490 (81.4%) |
| Total (Category) | 1,217 (32.2%) | 2,560 (67.8%) |
| Total (Overall) | 11,971 (52.2%) | 10,962 (47.8%) |
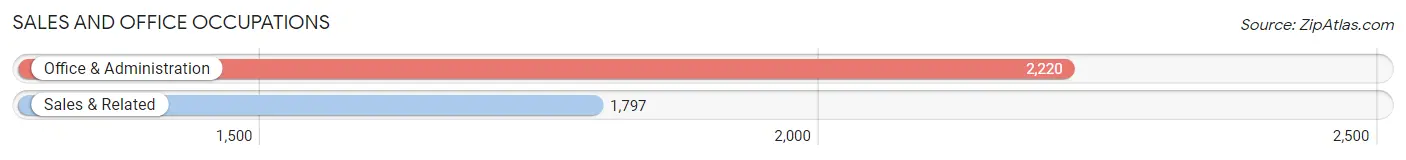
Sales and Office Occupations
The most common Sales and Office occupations in Marlborough are Office & Administration (2,220 | 9.7%), and Sales & Related (1,797 | 7.8%).
Sales and Office Occupations by Sex
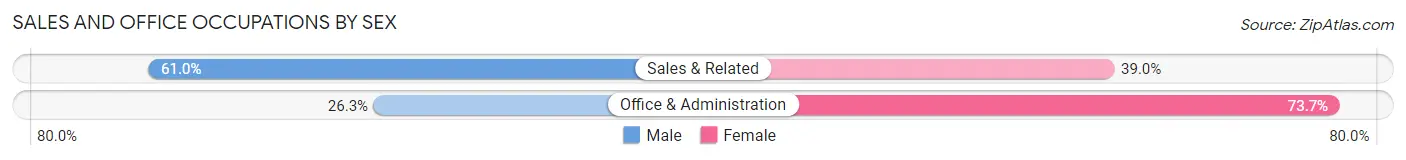
| Occupation | Male | Female |
| Sales & Related | 1,096 (61.0%) | 701 (39.0%) |
| Office & Administration | 583 (26.3%) | 1,637 (73.7%) |
| Total (Category) | 1,679 (41.8%) | 2,338 (58.2%) |
| Total (Overall) | 11,971 (52.2%) | 10,962 (47.8%) |
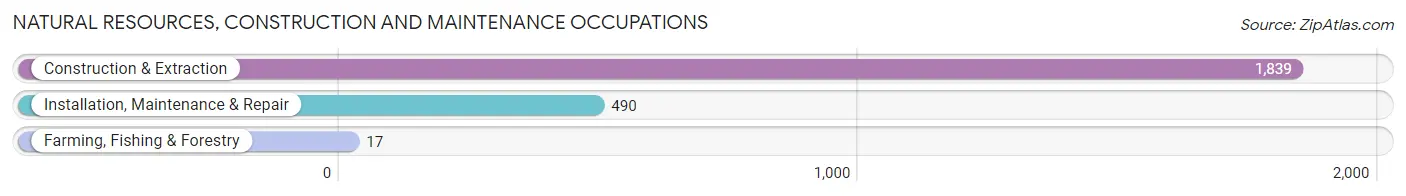
Natural Resources, Construction and Maintenance Occupations
The most common Natural Resources, Construction and Maintenance occupations in Marlborough are Construction & Extraction (1,839 | 8.0%), Installation, Maintenance & Repair (490 | 2.1%), and Farming, Fishing & Forestry (17 | 0.1%).
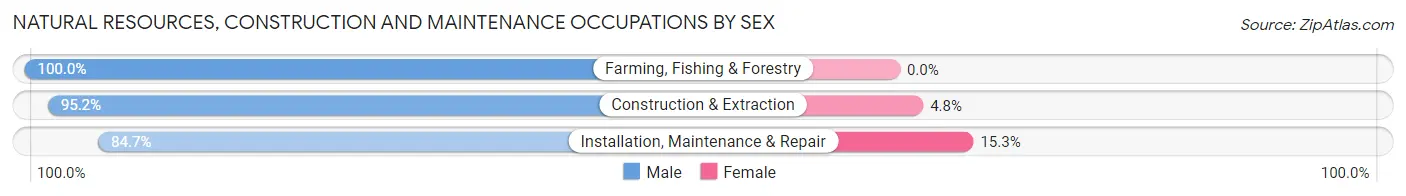
Natural Resources, Construction and Maintenance Occupations by Sex
| Occupation | Male | Female |
| Farming, Fishing & Forestry | 17 (100.0%) | 0 (0.0%) |
| Construction & Extraction | 1,750 (95.2%) | 89 (4.8%) |
| Installation, Maintenance & Repair | 415 (84.7%) | 75 (15.3%) |
| Total (Category) | 2,182 (93.0%) | 164 (7.0%) |
| Total (Overall) | 11,971 (52.2%) | 10,962 (47.8%) |
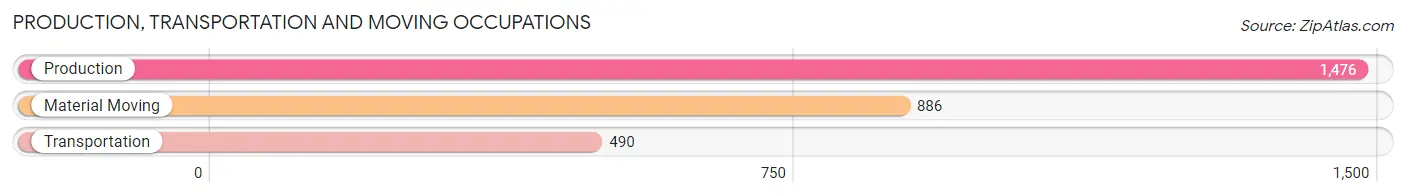
Production, Transportation and Moving Occupations
The most common Production, Transportation and Moving occupations in Marlborough are Production (1,476 | 6.4%), Material Moving (886 | 3.9%), and Transportation (490 | 2.1%).
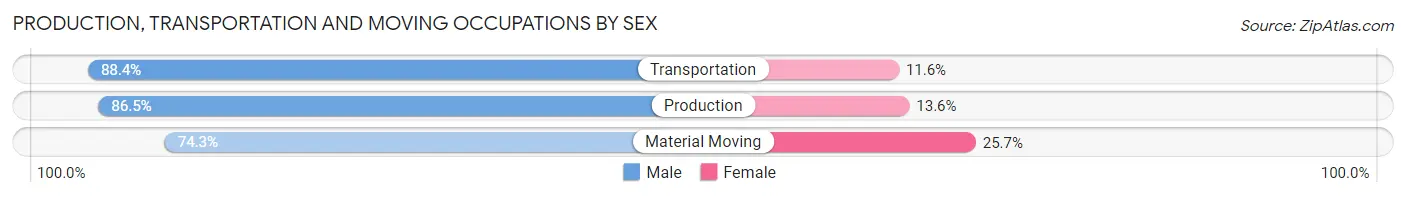
Production, Transportation and Moving Occupations by Sex
| Occupation | Male | Female |
| Production | 1,276 (86.5%) | 200 (13.6%) |
| Transportation | 433 (88.4%) | 57 (11.6%) |
| Material Moving | 658 (74.3%) | 228 (25.7%) |
| Total (Category) | 2,367 (83.0%) | 485 (17.0%) |
| Total (Overall) | 11,971 (52.2%) | 10,962 (47.8%) |
Employment Industries by Sex in Marlborough
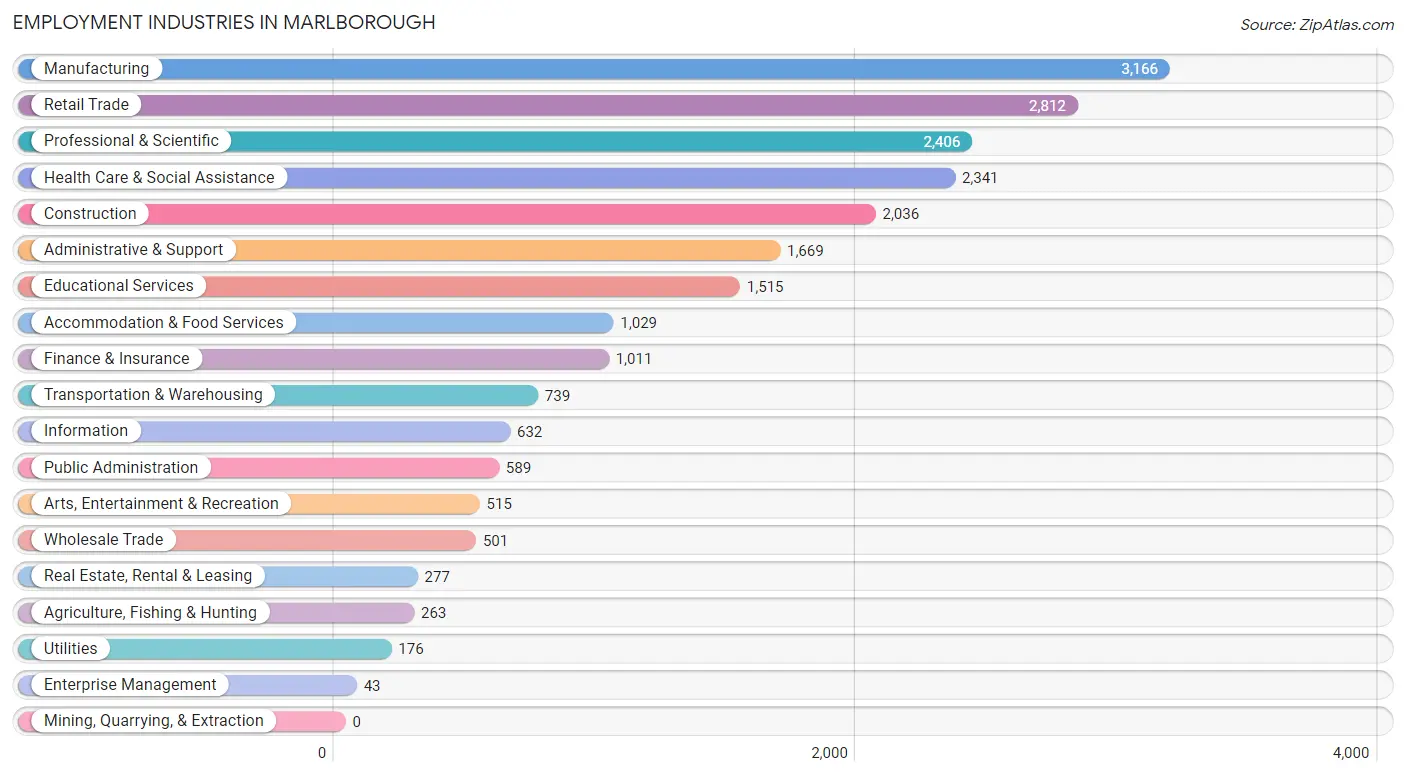
Employment Industries in Marlborough
The major employment industries in Marlborough include Manufacturing (3,166 | 13.8%), Retail Trade (2,812 | 12.3%), Professional & Scientific (2,406 | 10.5%), Health Care & Social Assistance (2,341 | 10.2%), and Construction (2,036 | 8.9%).
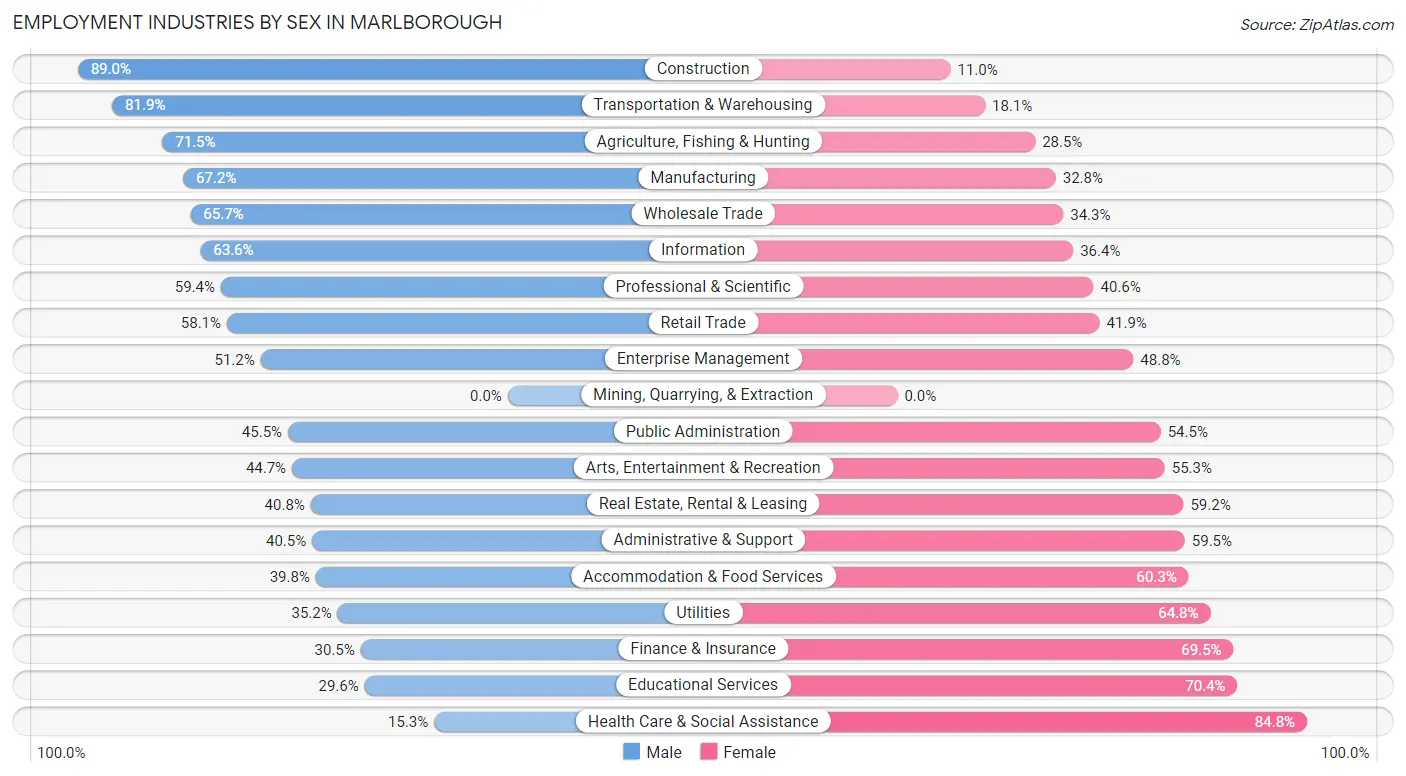
Employment Industries by Sex in Marlborough
The Marlborough industries that see more men than women are Construction (89.0%), Transportation & Warehousing (81.9%), and Agriculture, Fishing & Hunting (71.5%), whereas the industries that tend to have a higher number of women are Health Care & Social Assistance (84.8%), Educational Services (70.4%), and Finance & Insurance (69.5%).
| Industry | Male | Female |
| Agriculture, Fishing & Hunting | 188 (71.5%) | 75 (28.5%) |
| Mining, Quarrying, & Extraction | 0 (0.0%) | 0 (0.0%) |
| Construction | 1,812 (89.0%) | 224 (11.0%) |
| Manufacturing | 2,128 (67.2%) | 1,038 (32.8%) |
| Wholesale Trade | 329 (65.7%) | 172 (34.3%) |
| Retail Trade | 1,635 (58.1%) | 1,177 (41.9%) |
| Transportation & Warehousing | 605 (81.9%) | 134 (18.1%) |
| Utilities | 62 (35.2%) | 114 (64.8%) |
| Information | 402 (63.6%) | 230 (36.4%) |
| Finance & Insurance | 308 (30.5%) | 703 (69.5%) |
| Real Estate, Rental & Leasing | 113 (40.8%) | 164 (59.2%) |
| Professional & Scientific | 1,429 (59.4%) | 977 (40.6%) |
| Enterprise Management | 22 (51.2%) | 21 (48.8%) |
| Administrative & Support | 676 (40.5%) | 993 (59.5%) |
| Educational Services | 449 (29.6%) | 1,066 (70.4%) |
| Health Care & Social Assistance | 357 (15.2%) | 1,984 (84.8%) |
| Arts, Entertainment & Recreation | 230 (44.7%) | 285 (55.3%) |
| Accommodation & Food Services | 409 (39.8%) | 620 (60.3%) |
| Public Administration | 268 (45.5%) | 321 (54.5%) |
| Total | 11,971 (52.2%) | 10,962 (47.8%) |
Education in Marlborough
School Enrollment in Marlborough
The most common levels of schooling among the 8,013 students in Marlborough are middle school (1,672 | 20.9%), high school (1,548 | 19.3%), and elementary school (1,474 | 18.4%).
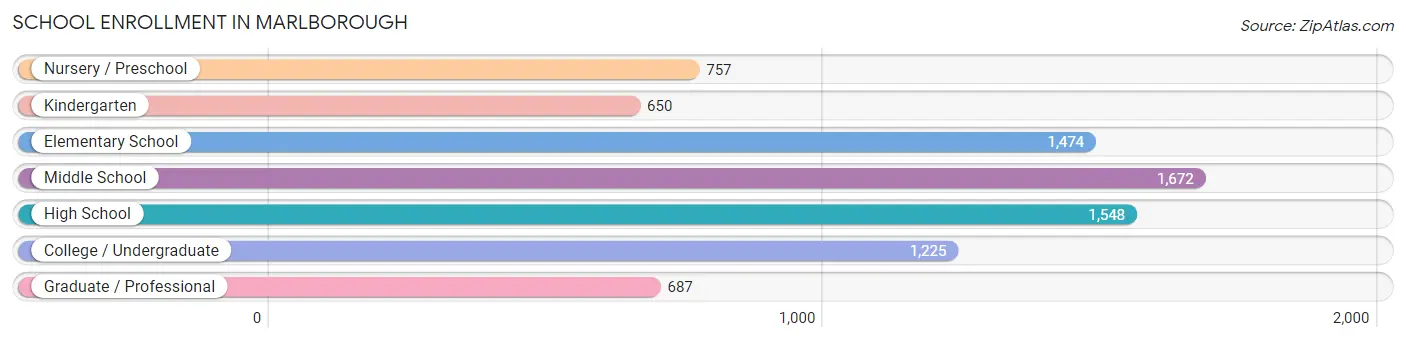
| School Level | # Students | % Students |
| Nursery / Preschool | 757 | 9.5% |
| Kindergarten | 650 | 8.1% |
| Elementary School | 1,474 | 18.4% |
| Middle School | 1,672 | 20.9% |
| High School | 1,548 | 19.3% |
| College / Undergraduate | 1,225 | 15.3% |
| Graduate / Professional | 687 | 8.6% |
| Total | 8,013 | 100.0% |
School Enrollment by Age by Funding Source in Marlborough
Out of a total of 8,013 students who are enrolled in schools in Marlborough, 1,779 (22.2%) attend a private institution, while the remaining 6,234 (77.8%) are enrolled in public schools. The age group of 35 years and over has the highest likelihood of being enrolled in private schools, with 394 (75.0% in the age bracket) enrolled. Conversely, the age group of 18 to 19 year olds has the lowest likelihood of being enrolled in a private school, with 514 (95.9% in the age bracket) attending a public institution.
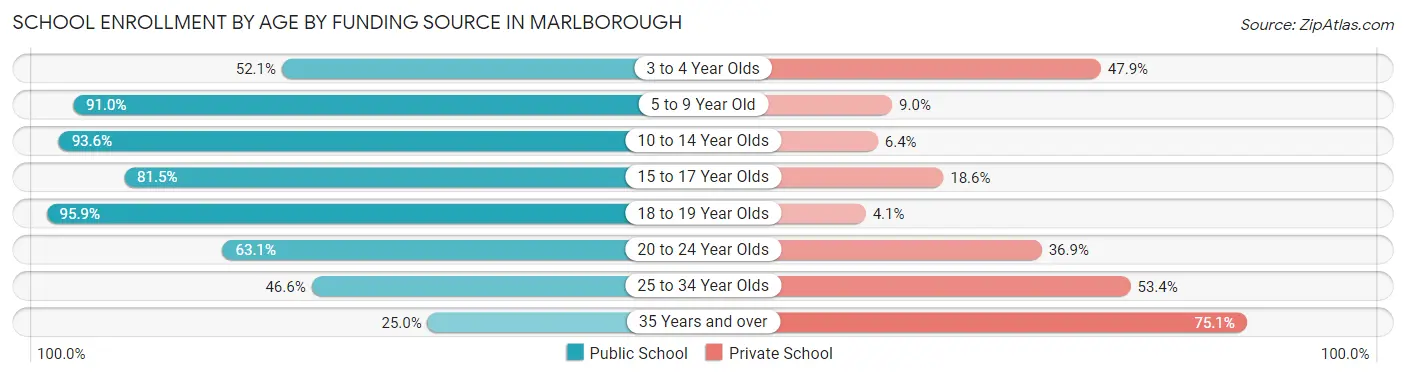
| Age Bracket | Public School | Private School |
| 3 to 4 Year Olds | 312 (52.1%) | 287 (47.9%) |
| 5 to 9 Year Old | 1,925 (91.0%) | 191 (9.0%) |
| 10 to 14 Year Olds | 1,839 (93.6%) | 125 (6.4%) |
| 15 to 17 Year Olds | 830 (81.5%) | 189 (18.5%) |
| 18 to 19 Year Olds | 514 (95.9%) | 22 (4.1%) |
| 20 to 24 Year Olds | 378 (63.1%) | 221 (36.9%) |
| 25 to 34 Year Olds | 305 (46.6%) | 350 (53.4%) |
| 35 Years and over | 131 (24.9%) | 394 (75.0%) |
| Total | 6,234 (77.8%) | 1,779 (22.2%) |
Educational Attainment by Field of Study in Marlborough
Business (2,516 | 19.7%), engineering (1,507 | 11.8%), science & technology (1,094 | 8.6%), education (997 | 7.8%), and bio, nature & agricultural (915 | 7.2%) are the most common fields of study among 12,769 individuals in Marlborough who have obtained a bachelor's degree or higher.
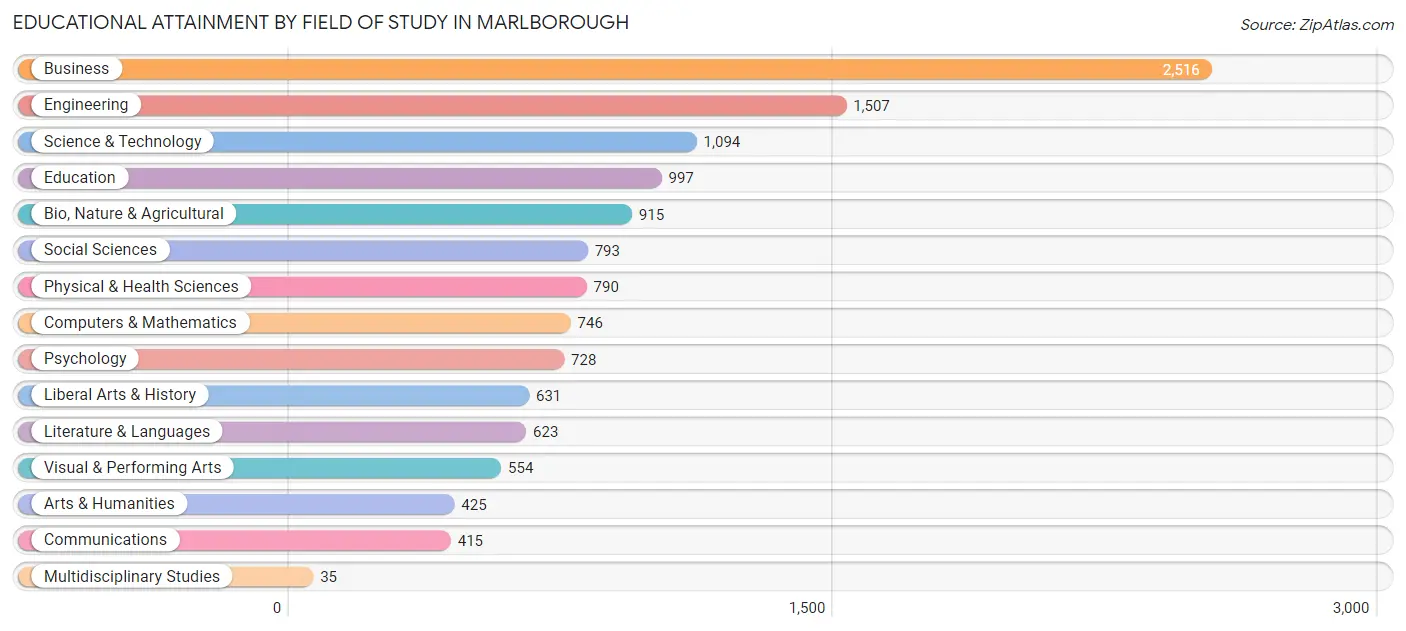
| Field of Study | # Graduates | % Graduates |
| Computers & Mathematics | 746 | 5.8% |
| Bio, Nature & Agricultural | 915 | 7.2% |
| Physical & Health Sciences | 790 | 6.2% |
| Psychology | 728 | 5.7% |
| Social Sciences | 793 | 6.2% |
| Engineering | 1,507 | 11.8% |
| Multidisciplinary Studies | 35 | 0.3% |
| Science & Technology | 1,094 | 8.6% |
| Business | 2,516 | 19.7% |
| Education | 997 | 7.8% |
| Literature & Languages | 623 | 4.9% |
| Liberal Arts & History | 631 | 4.9% |
| Visual & Performing Arts | 554 | 4.3% |
| Communications | 415 | 3.3% |
| Arts & Humanities | 425 | 3.3% |
| Total | 12,769 | 100.0% |
Transportation & Commute in Marlborough
Vehicle Availability by Sex in Marlborough
The most prevalent vehicle ownership categories in Marlborough are males with 2 vehicles (5,326, accounting for 45.3%) and females with 2 vehicles (4,788, making up 51.8%).
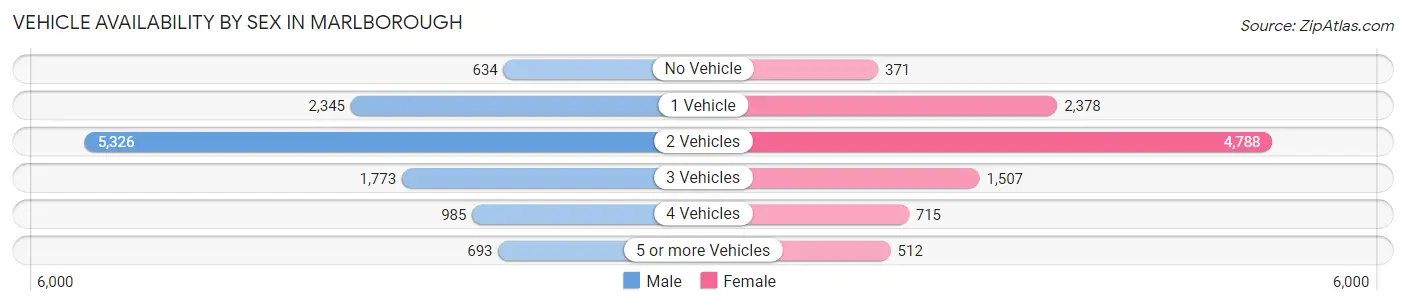
| Vehicles Available | Male | Female |
| No Vehicle | 634 (5.4%) | 371 (3.6%) |
| 1 Vehicle | 2,345 (20.0%) | 2,378 (23.2%) |
| 2 Vehicles | 5,326 (45.3%) | 4,788 (46.6%) |
| 3 Vehicles | 1,773 (15.1%) | 1,507 (14.7%) |
| 4 Vehicles | 985 (8.4%) | 715 (7.0%) |
| 5 or more Vehicles | 693 (5.9%) | 512 (5.0%) |
| Total | 11,756 (100.0%) | 10,271 (100.0%) |
Commute Time in Marlborough
The most frequently occuring commute durations in Marlborough are 10 to 14 minutes (2,523 commuters, 13.5%), 30 to 34 minutes (2,410 commuters, 12.9%), and 60 to 89 minutes (2,307 commuters, 12.4%).
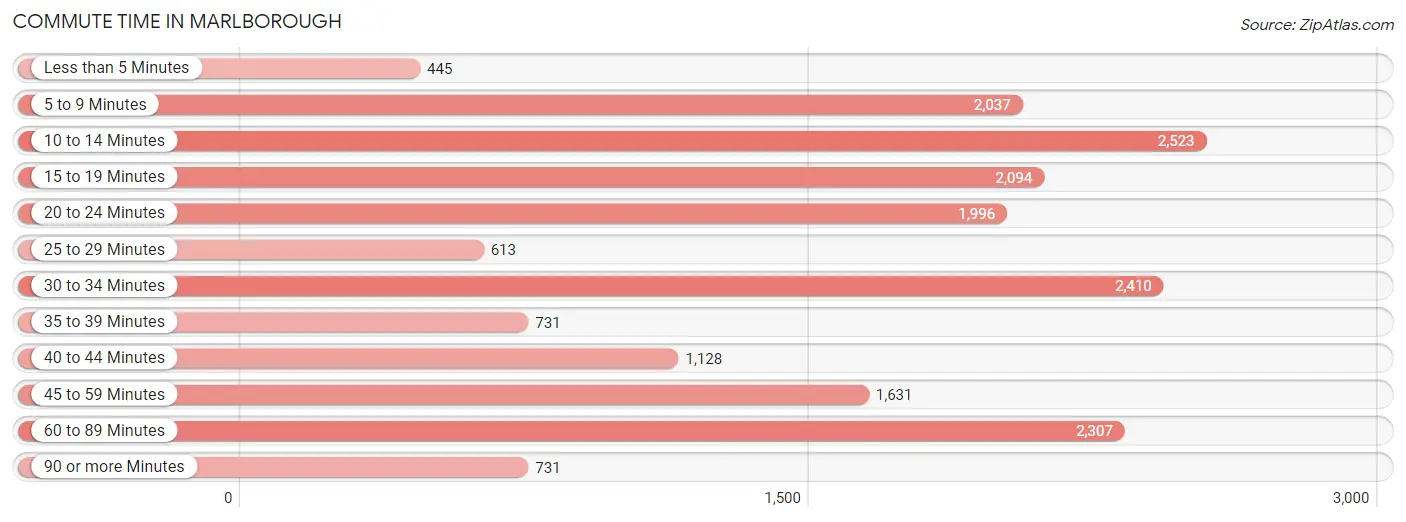
| Commute Time | # Commuters | % Commuters |
| Less than 5 Minutes | 445 | 2.4% |
| 5 to 9 Minutes | 2,037 | 10.9% |
| 10 to 14 Minutes | 2,523 | 13.5% |
| 15 to 19 Minutes | 2,094 | 11.2% |
| 20 to 24 Minutes | 1,996 | 10.7% |
| 25 to 29 Minutes | 613 | 3.3% |
| 30 to 34 Minutes | 2,410 | 12.9% |
| 35 to 39 Minutes | 731 | 3.9% |
| 40 to 44 Minutes | 1,128 | 6.0% |
| 45 to 59 Minutes | 1,631 | 8.7% |
| 60 to 89 Minutes | 2,307 | 12.4% |
| 90 or more Minutes | 731 | 3.9% |
Commute Time by Sex in Marlborough
The most common commute times in Marlborough are 10 to 14 minutes (1,447 commuters, 14.3%) for males and 30 to 34 minutes (1,539 commuters, 18.0%) for females.
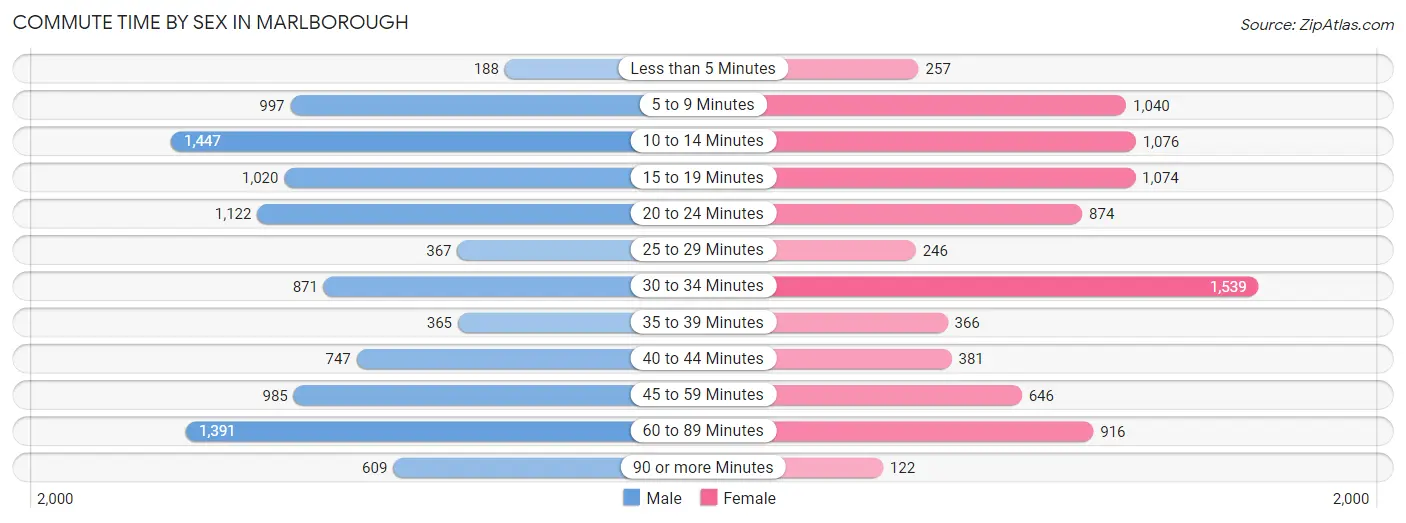
| Commute Time | Male | Female |
| Less than 5 Minutes | 188 (1.9%) | 257 (3.0%) |
| 5 to 9 Minutes | 997 (9.9%) | 1,040 (12.2%) |
| 10 to 14 Minutes | 1,447 (14.3%) | 1,076 (12.6%) |
| 15 to 19 Minutes | 1,020 (10.1%) | 1,074 (12.6%) |
| 20 to 24 Minutes | 1,122 (11.1%) | 874 (10.2%) |
| 25 to 29 Minutes | 367 (3.6%) | 246 (2.9%) |
| 30 to 34 Minutes | 871 (8.6%) | 1,539 (18.0%) |
| 35 to 39 Minutes | 365 (3.6%) | 366 (4.3%) |
| 40 to 44 Minutes | 747 (7.4%) | 381 (4.5%) |
| 45 to 59 Minutes | 985 (9.7%) | 646 (7.6%) |
| 60 to 89 Minutes | 1,391 (13.8%) | 916 (10.7%) |
| 90 or more Minutes | 609 (6.0%) | 122 (1.4%) |
Time of Departure to Work by Sex in Marlborough
The most frequent times of departure to work in Marlborough are 6:00 AM to 6:29 AM (1,616, 16.0%) for males and 7:00 AM to 7:29 AM (1,454, 17.0%) for females.
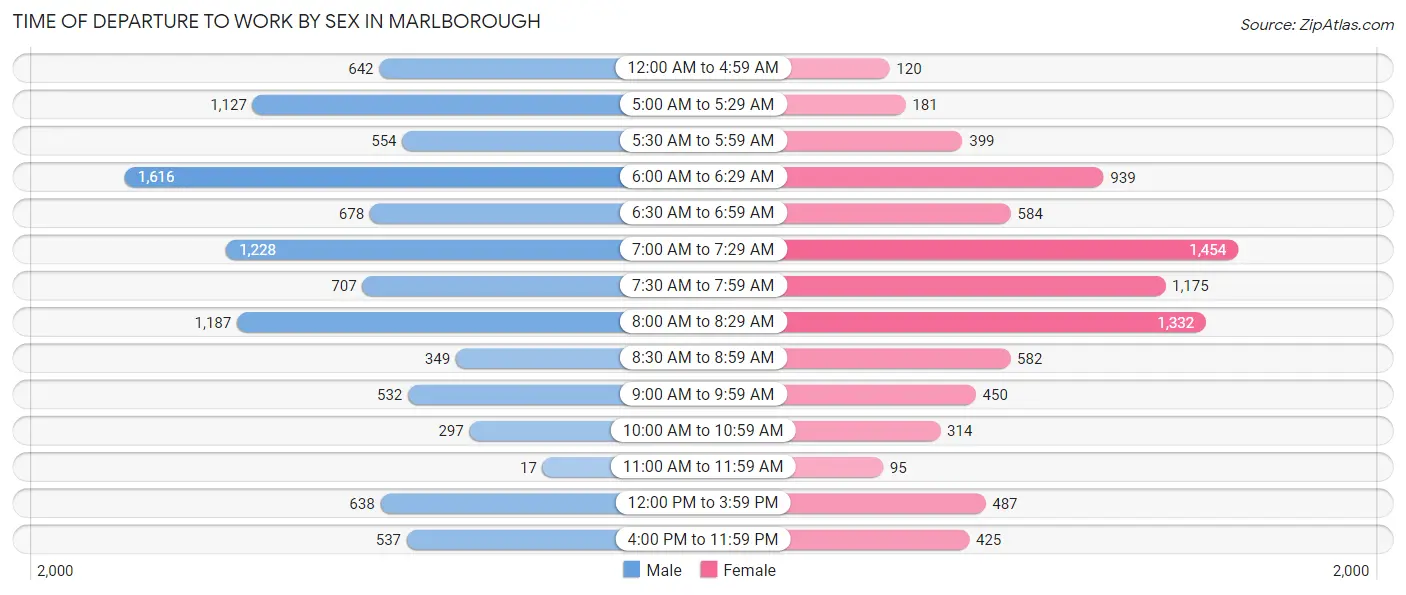
| Time of Departure | Male | Female |
| 12:00 AM to 4:59 AM | 642 (6.4%) | 120 (1.4%) |
| 5:00 AM to 5:29 AM | 1,127 (11.2%) | 181 (2.1%) |
| 5:30 AM to 5:59 AM | 554 (5.5%) | 399 (4.7%) |
| 6:00 AM to 6:29 AM | 1,616 (16.0%) | 939 (11.0%) |
| 6:30 AM to 6:59 AM | 678 (6.7%) | 584 (6.8%) |
| 7:00 AM to 7:29 AM | 1,228 (12.1%) | 1,454 (17.0%) |
| 7:30 AM to 7:59 AM | 707 (7.0%) | 1,175 (13.8%) |
| 8:00 AM to 8:29 AM | 1,187 (11.7%) | 1,332 (15.6%) |
| 8:30 AM to 8:59 AM | 349 (3.5%) | 582 (6.8%) |
| 9:00 AM to 9:59 AM | 532 (5.3%) | 450 (5.3%) |
| 10:00 AM to 10:59 AM | 297 (2.9%) | 314 (3.7%) |
| 11:00 AM to 11:59 AM | 17 (0.2%) | 95 (1.1%) |
| 12:00 PM to 3:59 PM | 638 (6.3%) | 487 (5.7%) |
| 4:00 PM to 11:59 PM | 537 (5.3%) | 425 (5.0%) |
| Total | 10,109 (100.0%) | 8,537 (100.0%) |
Housing Occupancy in Marlborough
Occupancy by Ownership in Marlborough
Of the total 16,524 dwellings in Marlborough, owner-occupied units account for 9,476 (57.4%), while renter-occupied units make up 7,048 (42.6%).

| Occupancy | # Housing Units | % Housing Units |
| Owner Occupied Housing Units | 9,476 | 57.4% |
| Renter-Occupied Housing Units | 7,048 | 42.6% |
| Total Occupied Housing Units | 16,524 | 100.0% |
Occupancy by Household Size in Marlborough
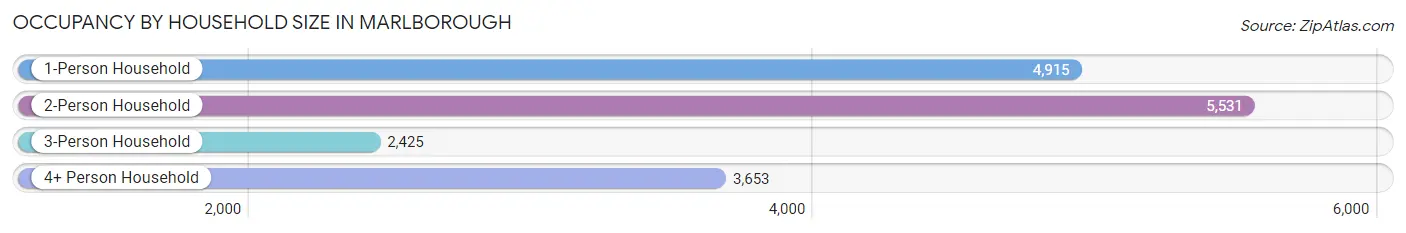
| Household Size | # Housing Units | % Housing Units |
| 1-Person Household | 4,915 | 29.7% |
| 2-Person Household | 5,531 | 33.5% |
| 3-Person Household | 2,425 | 14.7% |
| 4+ Person Household | 3,653 | 22.1% |
| Total Housing Units | 16,524 | 100.0% |
Occupancy by Ownership by Household Size in Marlborough
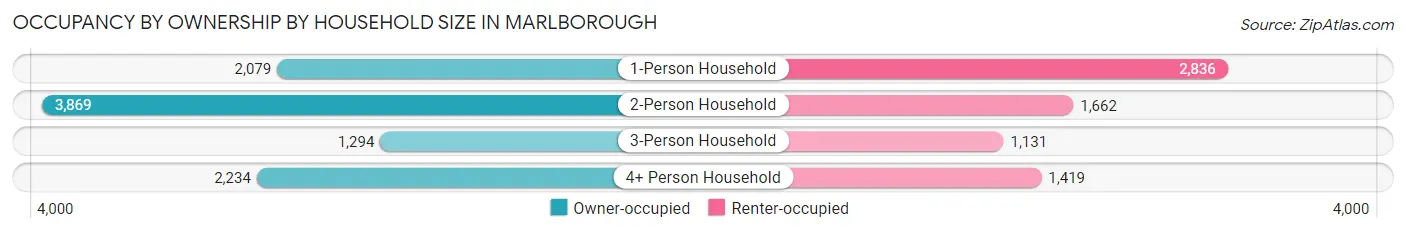
| Household Size | Owner-occupied | Renter-occupied |
| 1-Person Household | 2,079 (42.3%) | 2,836 (57.7%) |
| 2-Person Household | 3,869 (70.0%) | 1,662 (30.0%) |
| 3-Person Household | 1,294 (53.4%) | 1,131 (46.6%) |
| 4+ Person Household | 2,234 (61.2%) | 1,419 (38.8%) |
| Total Housing Units | 9,476 (57.4%) | 7,048 (42.6%) |
Occupancy by Educational Attainment in Marlborough
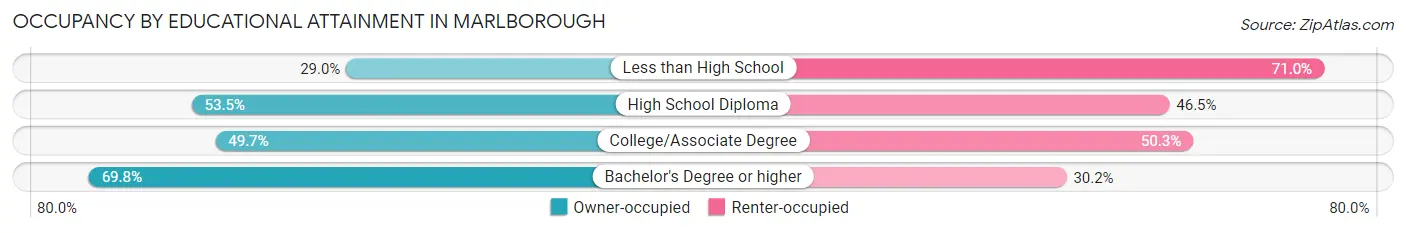
| Household Size | Owner-occupied | Renter-occupied |
| Less than High School | 447 (29.0%) | 1,095 (71.0%) |
| High School Diploma | 1,893 (53.5%) | 1,645 (46.5%) |
| College/Associate Degree | 2,116 (49.7%) | 2,138 (50.3%) |
| Bachelor's Degree or higher | 5,020 (69.8%) | 2,170 (30.2%) |
Occupancy by Age of Householder in Marlborough
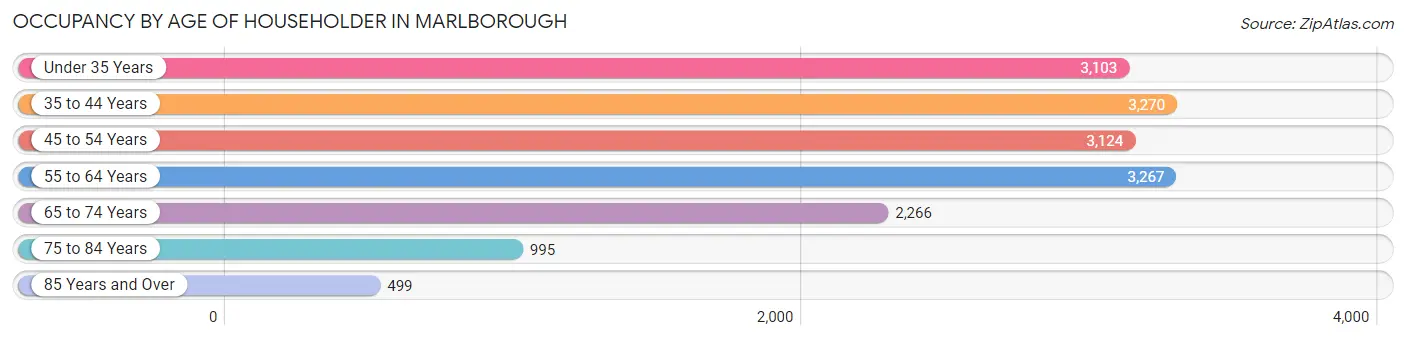
| Age Bracket | # Households | % Households |
| Under 35 Years | 3,103 | 18.8% |
| 35 to 44 Years | 3,270 | 19.8% |
| 45 to 54 Years | 3,124 | 18.9% |
| 55 to 64 Years | 3,267 | 19.8% |
| 65 to 74 Years | 2,266 | 13.7% |
| 75 to 84 Years | 995 | 6.0% |
| 85 Years and Over | 499 | 3.0% |
| Total | 16,524 | 100.0% |
Housing Finances in Marlborough
Median Income by Occupancy in Marlborough
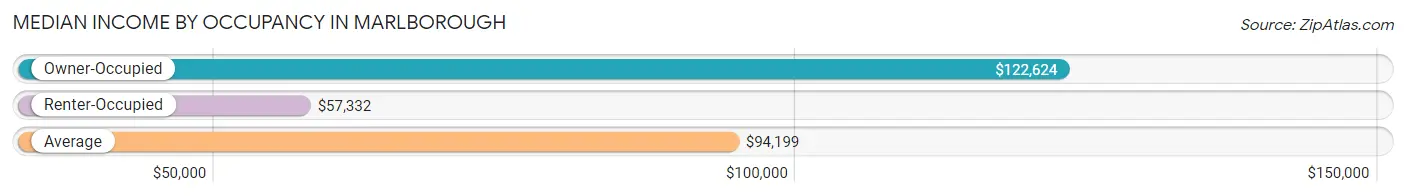
| Occupancy Type | # Households | Median Income |
| Owner-Occupied | 9,476 (57.4%) | $122,624 |
| Renter-Occupied | 7,048 (42.6%) | $57,332 |
| Average | 16,524 (100.0%) | $94,199 |
Occupancy by Householder Income Bracket in Marlborough
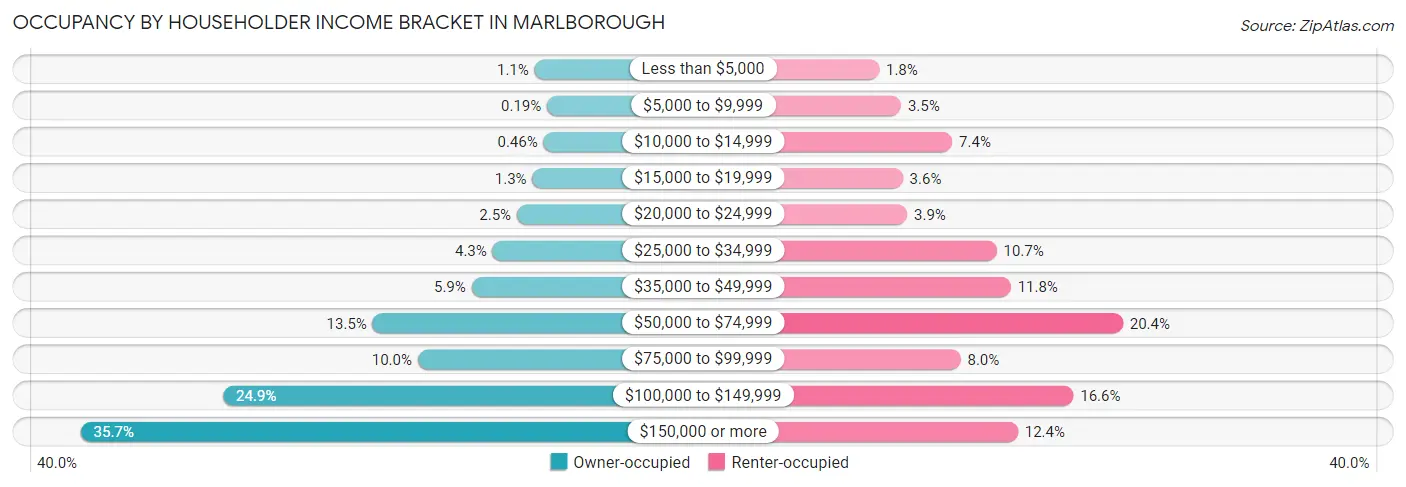
| Income Bracket | Owner-occupied | Renter-occupied |
| Less than $5,000 | 108 (1.1%) | 126 (1.8%) |
| $5,000 to $9,999 | 18 (0.2%) | 244 (3.5%) |
| $10,000 to $14,999 | 44 (0.5%) | 519 (7.4%) |
| $15,000 to $19,999 | 124 (1.3%) | 253 (3.6%) |
| $20,000 to $24,999 | 236 (2.5%) | 277 (3.9%) |
| $25,000 to $34,999 | 411 (4.3%) | 757 (10.7%) |
| $35,000 to $49,999 | 563 (5.9%) | 833 (11.8%) |
| $50,000 to $74,999 | 1,277 (13.5%) | 1,435 (20.4%) |
| $75,000 to $99,999 | 951 (10.0%) | 564 (8.0%) |
| $100,000 to $149,999 | 2,358 (24.9%) | 1,169 (16.6%) |
| $150,000 or more | 3,386 (35.7%) | 871 (12.4%) |
| Total | 9,476 (100.0%) | 7,048 (100.0%) |
Monthly Housing Cost Tiers in Marlborough
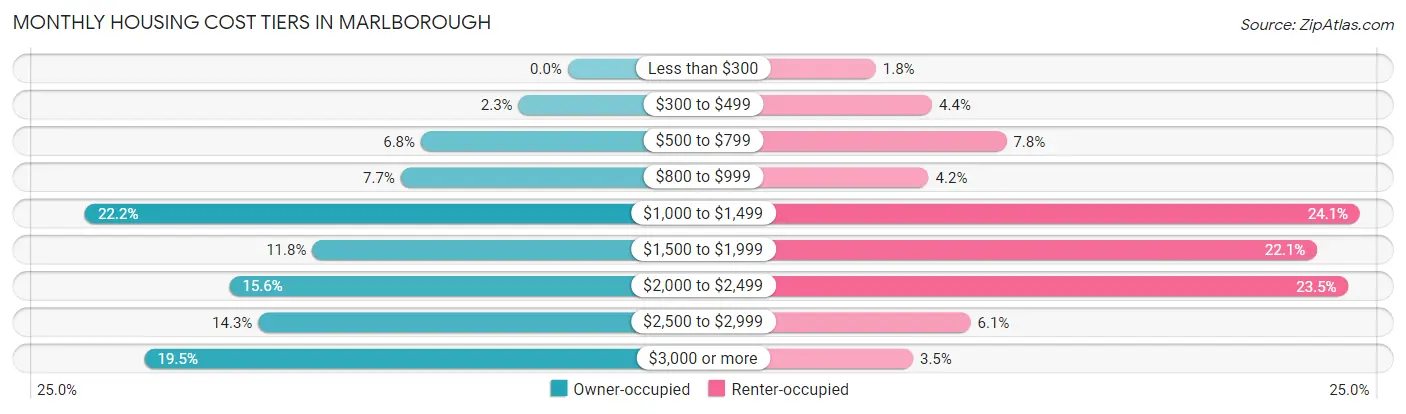
| Monthly Cost | Owner-occupied | Renter-occupied |
| Less than $300 | 0 (0.0%) | 125 (1.8%) |
| $300 to $499 | 215 (2.3%) | 307 (4.4%) |
| $500 to $799 | 641 (6.8%) | 548 (7.8%) |
| $800 to $999 | 729 (7.7%) | 296 (4.2%) |
| $1,000 to $1,499 | 2,106 (22.2%) | 1,695 (24.0%) |
| $1,500 to $1,999 | 1,114 (11.8%) | 1,556 (22.1%) |
| $2,000 to $2,499 | 1,475 (15.6%) | 1,658 (23.5%) |
| $2,500 to $2,999 | 1,350 (14.2%) | 432 (6.1%) |
| $3,000 or more | 1,846 (19.5%) | 245 (3.5%) |
| Total | 9,476 (100.0%) | 7,048 (100.0%) |
Physical Housing Characteristics in Marlborough
Housing Structures in Marlborough
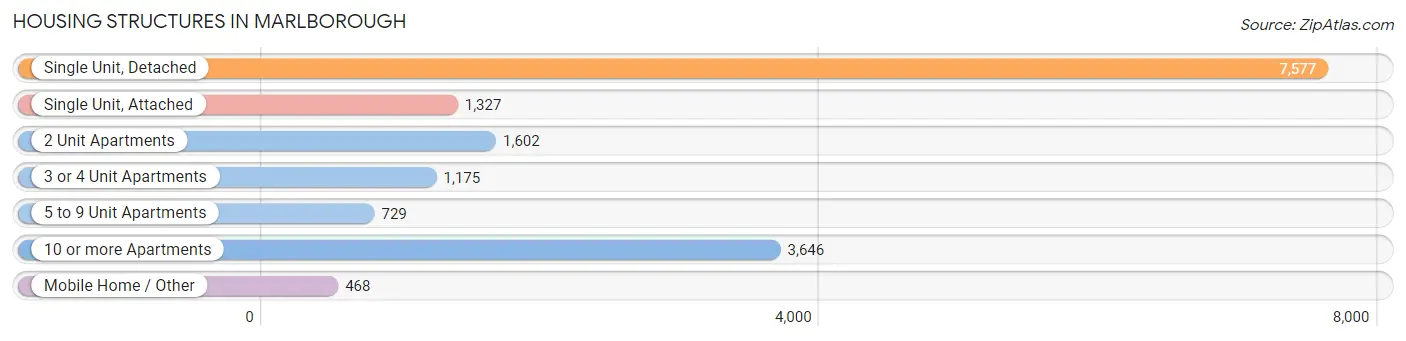
| Structure Type | # Housing Units | % Housing Units |
| Single Unit, Detached | 7,577 | 45.9% |
| Single Unit, Attached | 1,327 | 8.0% |
| 2 Unit Apartments | 1,602 | 9.7% |
| 3 or 4 Unit Apartments | 1,175 | 7.1% |
| 5 to 9 Unit Apartments | 729 | 4.4% |
| 10 or more Apartments | 3,646 | 22.1% |
| Mobile Home / Other | 468 | 2.8% |
| Total | 16,524 | 100.0% |
Housing Structures by Occupancy in Marlborough
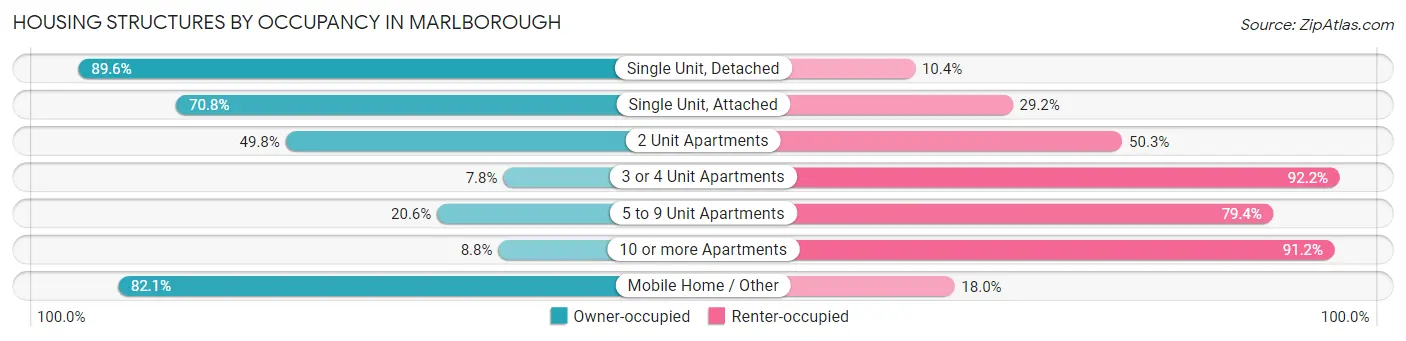
| Structure Type | Owner-occupied | Renter-occupied |
| Single Unit, Detached | 6,792 (89.6%) | 785 (10.4%) |
| Single Unit, Attached | 940 (70.8%) | 387 (29.2%) |
| 2 Unit Apartments | 797 (49.7%) | 805 (50.2%) |
| 3 or 4 Unit Apartments | 92 (7.8%) | 1,083 (92.2%) |
| 5 to 9 Unit Apartments | 150 (20.6%) | 579 (79.4%) |
| 10 or more Apartments | 321 (8.8%) | 3,325 (91.2%) |
| Mobile Home / Other | 384 (82.1%) | 84 (17.9%) |
| Total | 9,476 (57.4%) | 7,048 (42.6%) |
Housing Structures by Number of Rooms in Marlborough
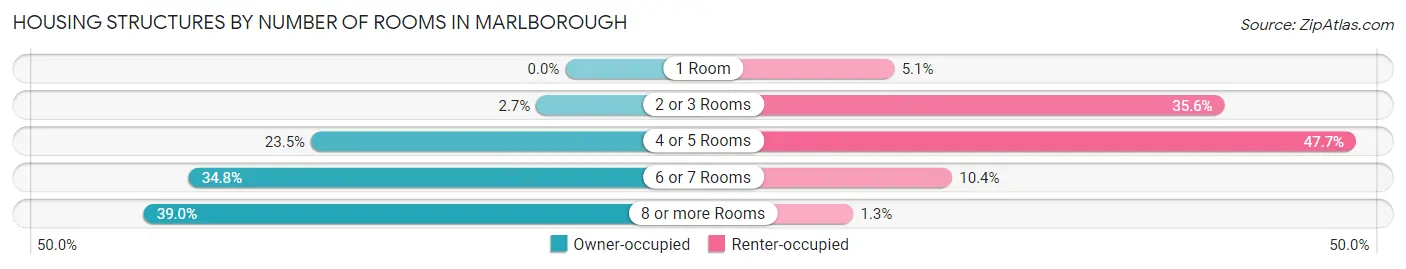
| Number of Rooms | Owner-occupied | Renter-occupied |
| 1 Room | 0 (0.0%) | 357 (5.1%) |
| 2 or 3 Rooms | 255 (2.7%) | 2,506 (35.6%) |
| 4 or 5 Rooms | 2,229 (23.5%) | 3,363 (47.7%) |
| 6 or 7 Rooms | 3,299 (34.8%) | 733 (10.4%) |
| 8 or more Rooms | 3,693 (39.0%) | 89 (1.3%) |
| Total | 9,476 (100.0%) | 7,048 (100.0%) |
Housing Structure by Heating Type in Marlborough
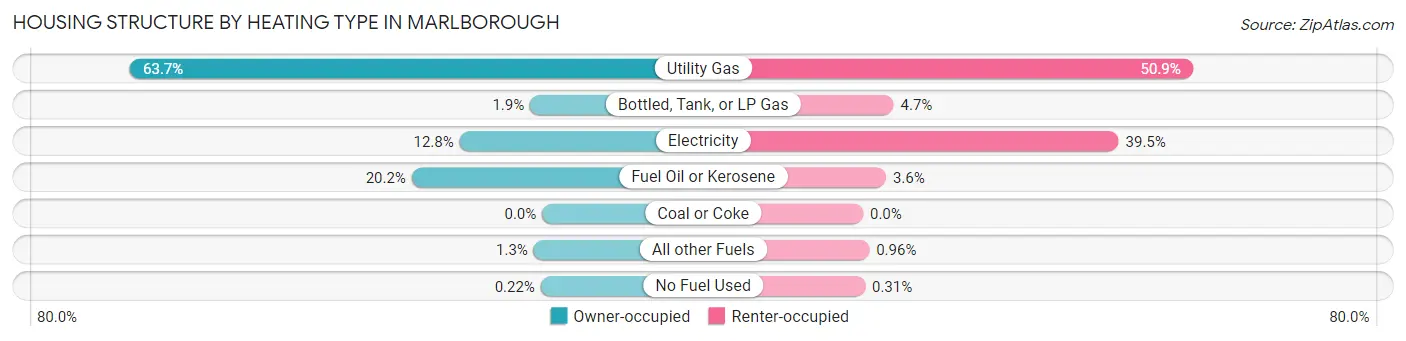
| Heating Type | Owner-occupied | Renter-occupied |
| Utility Gas | 6,037 (63.7%) | 3,590 (50.9%) |
| Bottled, Tank, or LP Gas | 176 (1.9%) | 333 (4.7%) |
| Electricity | 1,209 (12.8%) | 2,785 (39.5%) |
| Fuel Oil or Kerosene | 1,910 (20.2%) | 250 (3.5%) |
| Coal or Coke | 0 (0.0%) | 0 (0.0%) |
| All other Fuels | 123 (1.3%) | 68 (1.0%) |
| No Fuel Used | 21 (0.2%) | 22 (0.3%) |
| Total | 9,476 (100.0%) | 7,048 (100.0%) |
Household Vehicle Usage in Marlborough
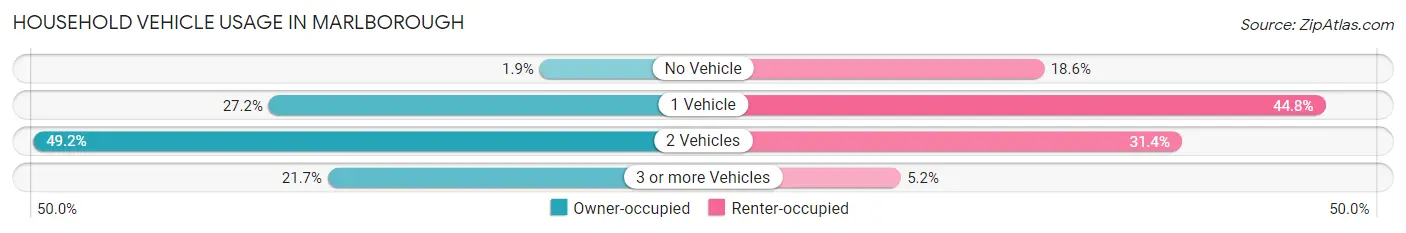
| Vehicles per Household | Owner-occupied | Renter-occupied |
| No Vehicle | 182 (1.9%) | 1,308 (18.6%) |
| 1 Vehicle | 2,578 (27.2%) | 3,160 (44.8%) |
| 2 Vehicles | 4,661 (49.2%) | 2,216 (31.4%) |
| 3 or more Vehicles | 2,055 (21.7%) | 364 (5.2%) |
| Total | 9,476 (100.0%) | 7,048 (100.0%) |
Real Estate & Mortgages in Marlborough
Real Estate and Mortgage Overview in Marlborough
| Characteristic | Without Mortgage | With Mortgage |
| Housing Units | 3,163 | 6,313 |
| Median Property Value | $424,200 | $447,100 |
| Median Household Income | $81,513 | $2,751 |
| Monthly Housing Costs | $1,034 | $1,846 |
| Real Estate Taxes | $5,830 | $56 |
Property Value by Mortgage Status in Marlborough
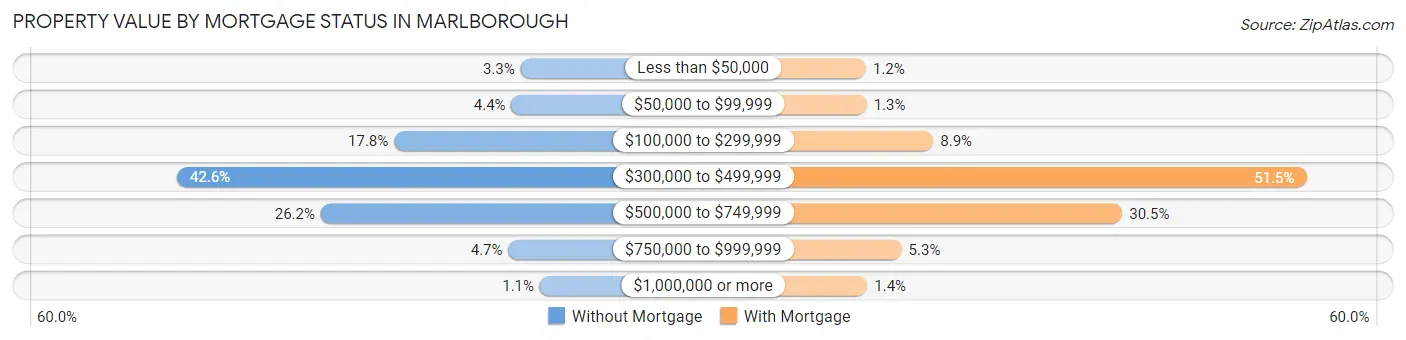
| Property Value | Without Mortgage | With Mortgage |
| Less than $50,000 | 105 (3.3%) | 76 (1.2%) |
| $50,000 to $99,999 | 138 (4.4%) | 81 (1.3%) |
| $100,000 to $299,999 | 562 (17.8%) | 561 (8.9%) |
| $300,000 to $499,999 | 1,347 (42.6%) | 3,252 (51.5%) |
| $500,000 to $749,999 | 827 (26.2%) | 1,925 (30.5%) |
| $750,000 to $999,999 | 149 (4.7%) | 333 (5.3%) |
| $1,000,000 or more | 35 (1.1%) | 85 (1.3%) |
| Total | 3,163 (100.0%) | 6,313 (100.0%) |
Household Income by Mortgage Status in Marlborough
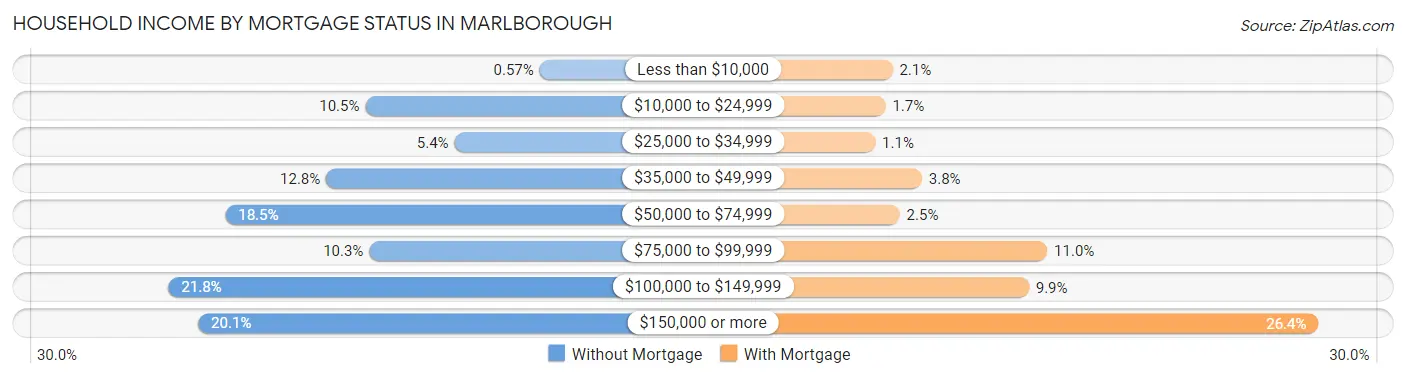
| Household Income | Without Mortgage | With Mortgage |
| Less than $10,000 | 18 (0.6%) | 133 (2.1%) |
| $10,000 to $24,999 | 333 (10.5%) | 108 (1.7%) |
| $25,000 to $34,999 | 172 (5.4%) | 71 (1.1%) |
| $35,000 to $49,999 | 404 (12.8%) | 239 (3.8%) |
| $50,000 to $74,999 | 586 (18.5%) | 159 (2.5%) |
| $75,000 to $99,999 | 326 (10.3%) | 691 (11.0%) |
| $100,000 to $149,999 | 689 (21.8%) | 625 (9.9%) |
| $150,000 or more | 635 (20.1%) | 1,669 (26.4%) |
| Total | 3,163 (100.0%) | 6,313 (100.0%) |
Property Value to Household Income Ratio in Marlborough
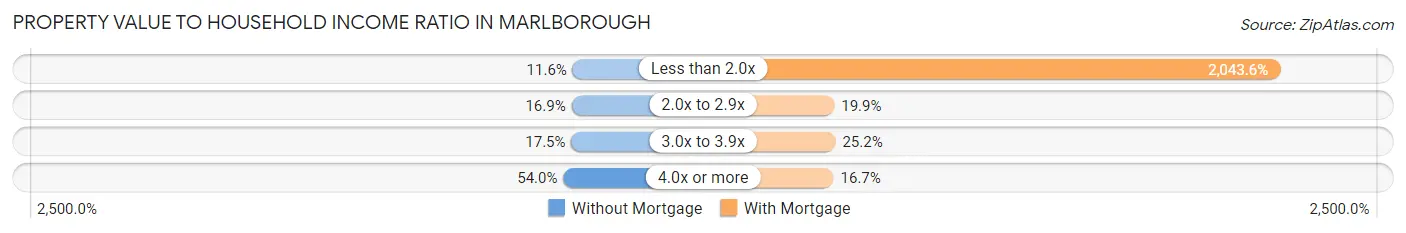
| Value-to-Income Ratio | Without Mortgage | With Mortgage |
| Less than 2.0x | 367 (11.6%) | 129,013 (2,043.6%) |
| 2.0x to 2.9x | 534 (16.9%) | 1,255 (19.9%) |
| 3.0x to 3.9x | 553 (17.5%) | 1,591 (25.2%) |
| 4.0x or more | 1,709 (54.0%) | 1,055 (16.7%) |
| Total | 3,163 (100.0%) | 6,313 (100.0%) |
Real Estate Taxes by Mortgage Status in Marlborough
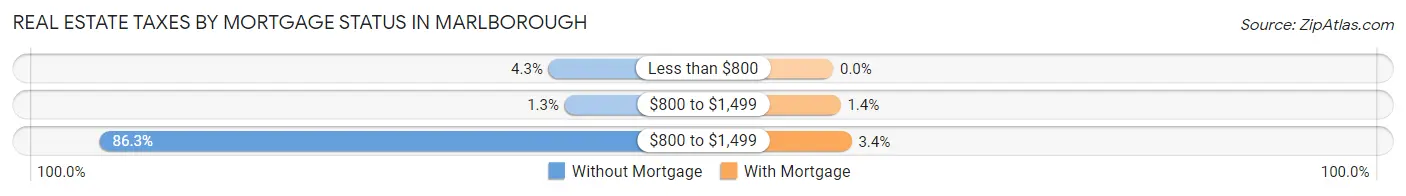
| Property Taxes | Without Mortgage | With Mortgage |
| Less than $800 | 135 (4.3%) | 0 (0.0%) |
| $800 to $1,499 | 42 (1.3%) | 86 (1.4%) |
| $800 to $1,499 | 2,729 (86.3%) | 213 (3.4%) |
| Total | 3,163 (100.0%) | 6,313 (100.0%) |
Health & Disability in Marlborough
Health Insurance Coverage by Age in Marlborough
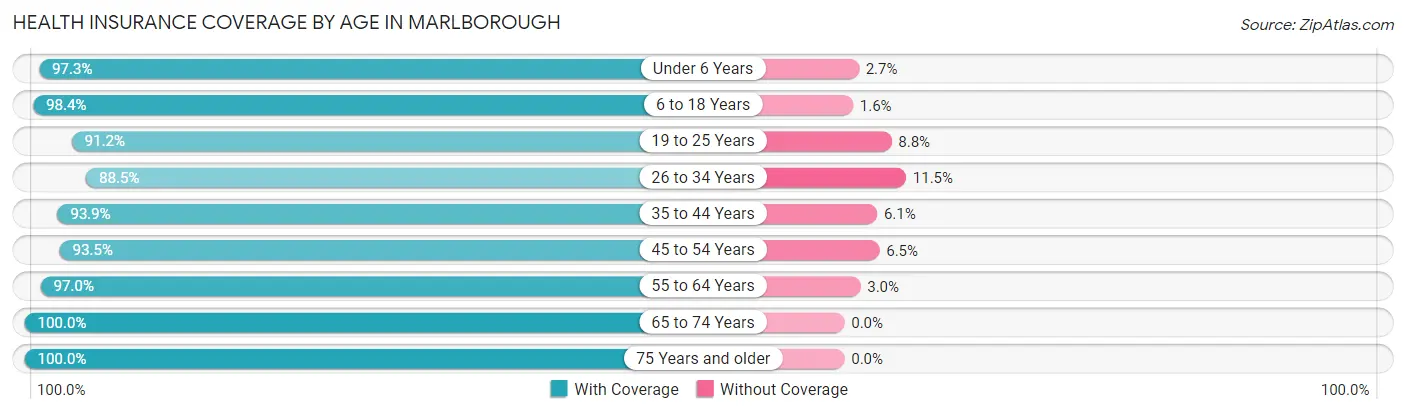
| Age Bracket | With Coverage | Without Coverage |
| Under 6 Years | 3,586 (97.3%) | 99 (2.7%) |
| 6 to 18 Years | 4,973 (98.4%) | 81 (1.6%) |
| 19 to 25 Years | 3,147 (91.2%) | 303 (8.8%) |
| 26 to 34 Years | 5,628 (88.5%) | 730 (11.5%) |
| 35 to 44 Years | 5,538 (93.9%) | 360 (6.1%) |
| 45 to 54 Years | 5,094 (93.5%) | 356 (6.5%) |
| 55 to 64 Years | 5,183 (97.0%) | 159 (3.0%) |
| 65 to 74 Years | 3,385 (100.0%) | 0 (0.0%) |
| 75 Years and older | 2,369 (100.0%) | 0 (0.0%) |
| Total | 38,903 (94.9%) | 2,088 (5.1%) |
Health Insurance Coverage by Citizenship Status in Marlborough
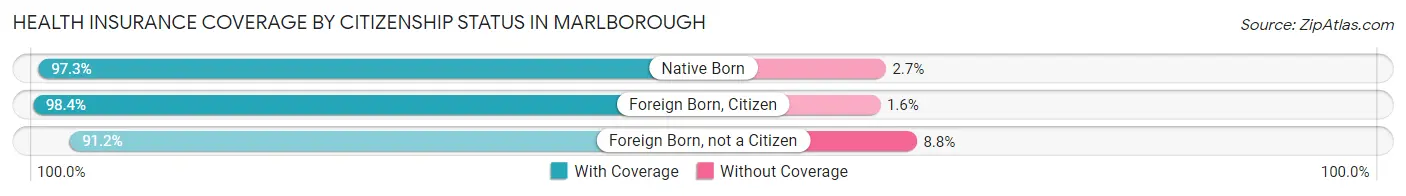
| Citizenship Status | With Coverage | Without Coverage |
| Native Born | 3,586 (97.3%) | 99 (2.7%) |
| Foreign Born, Citizen | 4,973 (98.4%) | 81 (1.6%) |
| Foreign Born, not a Citizen | 3,147 (91.2%) | 303 (8.8%) |
Health Insurance Coverage by Household Income in Marlborough
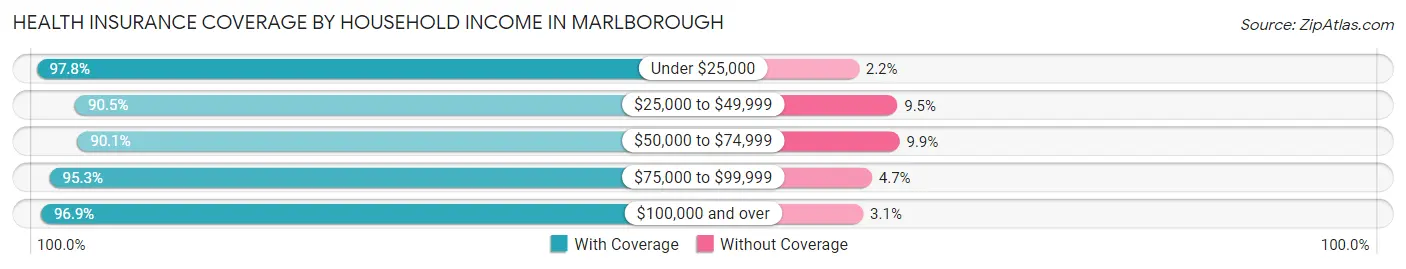
| Household Income | With Coverage | Without Coverage |
| Under $25,000 | 2,797 (97.8%) | 64 (2.2%) |
| $25,000 to $49,999 | 4,835 (90.5%) | 505 (9.5%) |
| $50,000 to $74,999 | 6,102 (90.1%) | 669 (9.9%) |
| $75,000 to $99,999 | 3,102 (95.3%) | 153 (4.7%) |
| $100,000 and over | 21,855 (96.9%) | 692 (3.1%) |
Public vs Private Health Insurance Coverage by Age in Marlborough
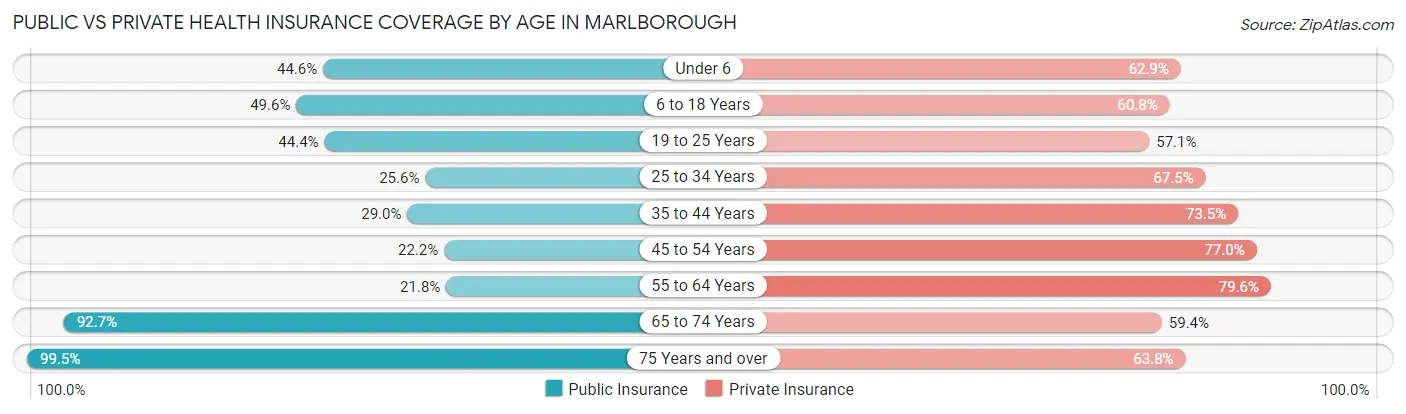
| Age Bracket | Public Insurance | Private Insurance |
| Under 6 | 1,644 (44.6%) | 2,318 (62.9%) |
| 6 to 18 Years | 2,506 (49.6%) | 3,075 (60.8%) |
| 19 to 25 Years | 1,530 (44.4%) | 1,969 (57.1%) |
| 25 to 34 Years | 1,630 (25.6%) | 4,293 (67.5%) |
| 35 to 44 Years | 1,708 (29.0%) | 4,337 (73.5%) |
| 45 to 54 Years | 1,207 (22.2%) | 4,195 (77.0%) |
| 55 to 64 Years | 1,162 (21.7%) | 4,254 (79.6%) |
| 65 to 74 Years | 3,139 (92.7%) | 2,011 (59.4%) |
| 75 Years and over | 2,358 (99.5%) | 1,511 (63.8%) |
| Total | 16,884 (41.2%) | 27,963 (68.2%) |
Disability Status by Sex by Age in Marlborough
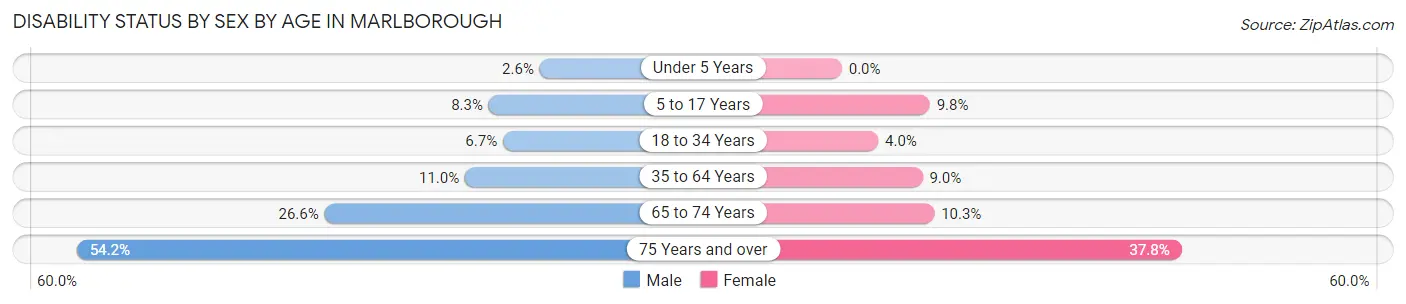
| Age Bracket | Male | Female |
| Under 5 Years | 39 (2.6%) | 0 (0.0%) |
| 5 to 17 Years | 215 (8.3%) | 261 (9.8%) |
| 18 to 34 Years | 327 (6.7%) | 214 (4.0%) |
| 35 to 64 Years | 887 (11.0%) | 772 (9.0%) |
| 65 to 74 Years | 456 (26.6%) | 172 (10.3%) |
| 75 Years and over | 589 (54.2%) | 485 (37.8%) |
Disability Class by Sex by Age in Marlborough
Disability Class: Hearing Difficulty
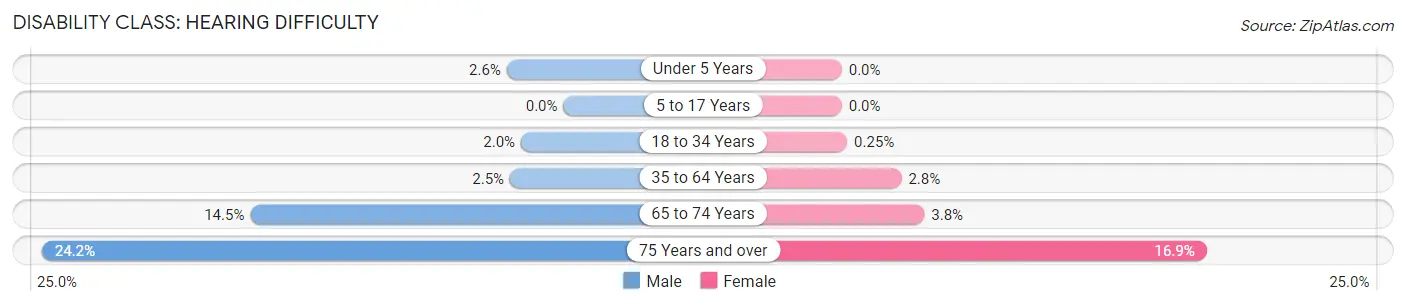
| Age Bracket | Male | Female |
| Under 5 Years | 39 (2.6%) | 0 (0.0%) |
| 5 to 17 Years | 0 (0.0%) | 0 (0.0%) |
| 18 to 34 Years | 96 (2.0%) | 13 (0.3%) |
| 35 to 64 Years | 201 (2.5%) | 238 (2.8%) |
| 65 to 74 Years | 249 (14.5%) | 64 (3.8%) |
| 75 Years and over | 263 (24.2%) | 217 (16.9%) |
Disability Class: Vision Difficulty
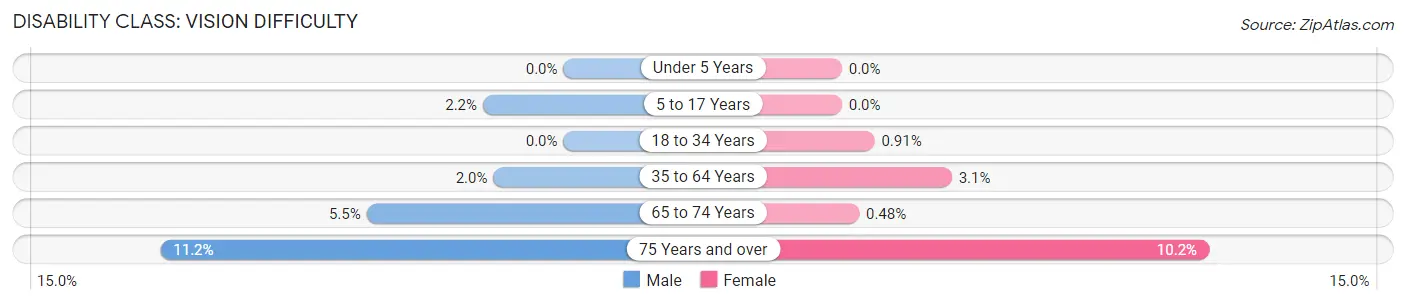
| Age Bracket | Male | Female |
| Under 5 Years | 0 (0.0%) | 0 (0.0%) |
| 5 to 17 Years | 58 (2.2%) | 0 (0.0%) |
| 18 to 34 Years | 0 (0.0%) | 48 (0.9%) |
| 35 to 64 Years | 158 (1.9%) | 263 (3.1%) |
| 65 to 74 Years | 94 (5.5%) | 8 (0.5%) |
| 75 Years and over | 122 (11.2%) | 131 (10.2%) |
Disability Class: Cognitive Difficulty
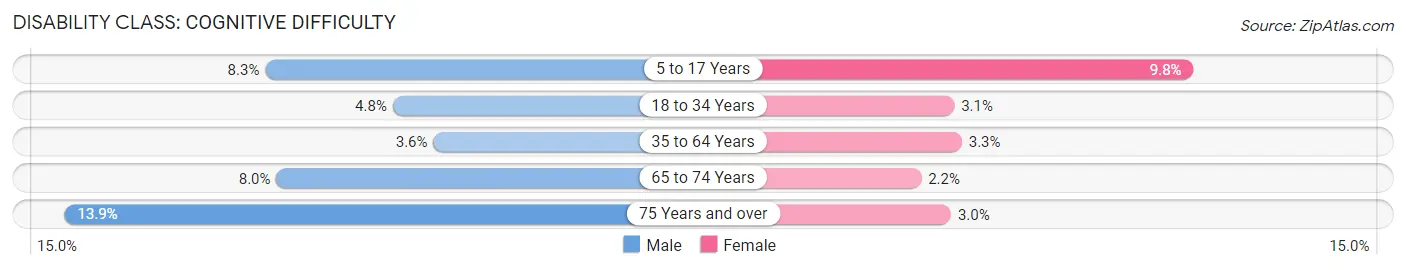
| Age Bracket | Male | Female |
| 5 to 17 Years | 215 (8.3%) | 261 (9.8%) |
| 18 to 34 Years | 231 (4.8%) | 166 (3.1%) |
| 35 to 64 Years | 293 (3.6%) | 287 (3.3%) |
| 65 to 74 Years | 137 (8.0%) | 37 (2.2%) |
| 75 Years and over | 151 (13.9%) | 39 (3.0%) |
Disability Class: Ambulatory Difficulty
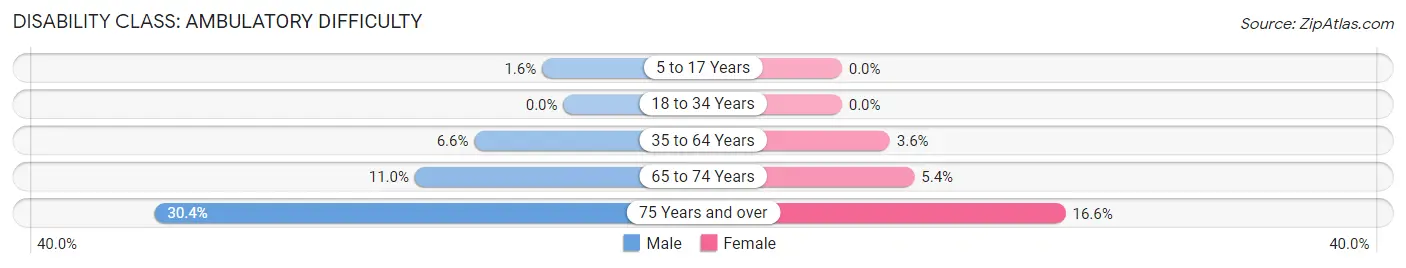
| Age Bracket | Male | Female |
| 5 to 17 Years | 41 (1.6%) | 0 (0.0%) |
| 18 to 34 Years | 0 (0.0%) | 0 (0.0%) |
| 35 to 64 Years | 535 (6.6%) | 307 (3.6%) |
| 65 to 74 Years | 189 (11.0%) | 90 (5.4%) |
| 75 Years and over | 330 (30.4%) | 213 (16.6%) |
Disability Class: Self-Care Difficulty
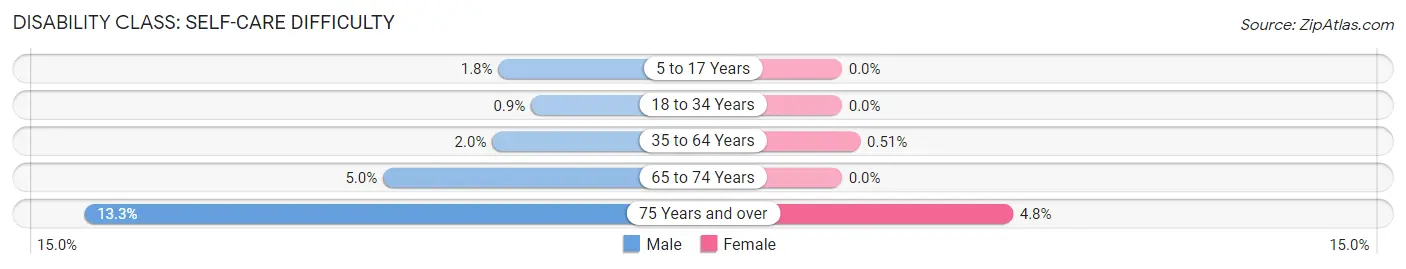
| Age Bracket | Male | Female |
| 5 to 17 Years | 47 (1.8%) | 0 (0.0%) |
| 18 to 34 Years | 44 (0.9%) | 0 (0.0%) |
| 35 to 64 Years | 160 (2.0%) | 44 (0.5%) |
| 65 to 74 Years | 86 (5.0%) | 0 (0.0%) |
| 75 Years and over | 145 (13.3%) | 61 (4.8%) |
Technology Access in Marlborough
Computing Device Access in Marlborough
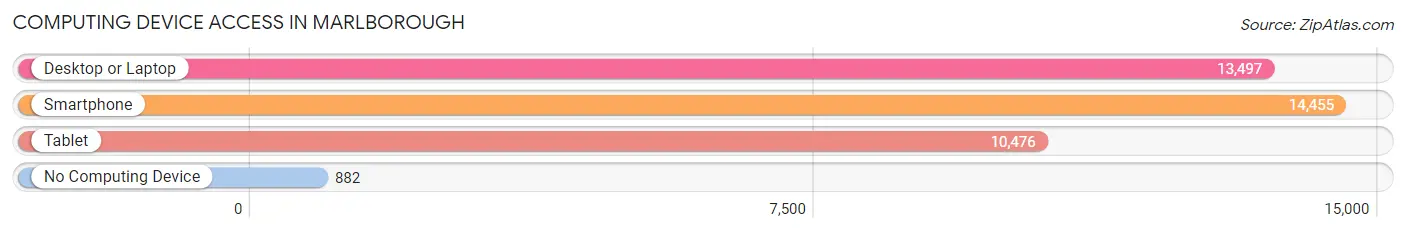
| Device Type | # Households | % Households |
| Desktop or Laptop | 13,497 | 81.7% |
| Smartphone | 14,455 | 87.5% |
| Tablet | 10,476 | 63.4% |
| No Computing Device | 882 | 5.3% |
| Total | 16,524 | 100.0% |
Internet Access in Marlborough
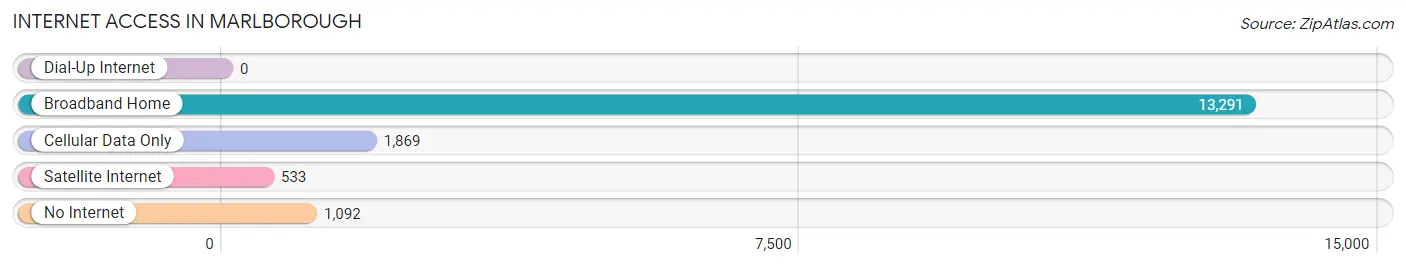
| Internet Type | # Households | % Households |
| Dial-Up Internet | 0 | 0.0% |
| Broadband Home | 13,291 | 80.4% |
| Cellular Data Only | 1,869 | 11.3% |
| Satellite Internet | 533 | 3.2% |
| No Internet | 1,092 | 6.6% |
| Total | 16,524 | 100.0% |
Marlborough Summary
Marlborough, Massachusetts is a city located in Middlesex County, Massachusetts, United States. It is situated approximately 20 miles west of Boston and is part of the Greater Boston metropolitan area. As of the 2010 census, the city had a population of 38,499. Marlborough is known for its historical significance, its diverse population, and its vibrant economy.
History
Marlborough was first settled in 1657 by English settlers from the Massachusetts Bay Colony. The town was originally known as the “Plantation of Marlborough” and was incorporated in 1660. The town was named after John Churchill, 1st Duke of Marlborough, an English soldier and statesman who served as commander-in-chief of the British Army during the War of the Spanish Succession.
During the American Revolution, Marlborough was a major center for military activity. The town was the site of the Battle of Marlborough in 1775, which was a major victory for the American forces. The town was also the site of the first military hospital in the United States, which was established in 1777.
In the 19th century, Marlborough became an important industrial center. The town was home to several factories, including the Marlborough Iron Works, which produced cannons and other weapons for the Union Army during the Civil War. The town was also home to several shoe factories, which produced shoes for the Union Army.
Geography
Marlborough is located in eastern Massachusetts, approximately 20 miles west of Boston. The city is situated on the banks of the Sudbury River, which flows through the city. The city is bordered by the towns of Northborough, Southborough, Hudson, and Berlin.
The city has a total area of 22.2 square miles, of which 21.9 square miles is land and 0.3 square miles is water. The city is located in a hilly region, with elevations ranging from 200 to 400 feet above sea level.
Economy
Marlborough is home to a diverse economy, with a variety of industries represented. The city is home to several major employers, including EMC Corporation, a data storage and cloud computing company; Raytheon, a defense contractor; and Boston Scientific, a medical device manufacturer.
The city is also home to several smaller businesses, including restaurants, retail stores, and professional services. The city is home to several shopping centers, including the Solomon Pond Mall and the Marlborough Plaza.
Demographics
As of the 2010 census, the city had a population of 38,499. The population is racially and ethnically diverse, with the largest racial/ethnic groups being White (77.2%), Hispanic or Latino (10.3%), and Asian (7.2%).
The median household income in Marlborough is $71,837, and the median family income is $83,837. The city has a poverty rate of 8.3%, which is lower than the national average.
Conclusion
Marlborough, Massachusetts is a city with a rich history, diverse population, and vibrant economy. The city is home to several major employers, including EMC Corporation, Raytheon, and Boston Scientific. The city is also home to a variety of smaller businesses, including restaurants, retail stores, and professional services. The city has a diverse population, with the largest racial/ethnic groups being White, Hispanic or Latino, and Asian. The median household income in Marlborough is $71,837, and the poverty rate is 8.3%. Marlborough is an important part of the Greater Boston metropolitan area and is an attractive place to live and work.
Common Questions
What is Per Capita Income in Marlborough?
Per Capita income in Marlborough is $45,736.
What is the Median Family Income in Marlborough?
Median Family Income in Marlborough is $118,158.
What is the Median Household income in Marlborough?
Median Household Income in Marlborough is $94,199.
What is Income or Wage Gap in Marlborough?
Income or Wage Gap in Marlborough is 28.6%.
Women in Marlborough earn 71.4 cents for every dollar earned by a man.
What is Family Income Deficit in Marlborough?
Family Income Deficit in Marlborough is $8,717.
Families that are below poverty line in Marlborough earn $8,717 less on average than the poverty threshold level.
What is Inequality or Gini Index in Marlborough?
Inequality or Gini Index in Marlborough is 0.43.
What is the Total Population of Marlborough?
Total Population of Marlborough is 41,391.
What is the Total Male Population of Marlborough?
Total Male Population of Marlborough is 19,995.
What is the Total Female Population of Marlborough?
Total Female Population of Marlborough is 21,396.
What is the Ratio of Males per 100 Females in Marlborough?
There are 93.45 Males per 100 Females in Marlborough.
What is the Ratio of Females per 100 Males in Marlborough?
There are 107.01 Females per 100 Males in Marlborough.
What is the Median Population Age in Marlborough?
Median Population Age in Marlborough is 38.1 Years.
What is the Average Family Size in Marlborough
Average Family Size in Marlborough is 3.2 People.
What is the Average Household Size in Marlborough
Average Household Size in Marlborough is 2.5 People.
How Large is the Labor Force in Marlborough?
There are 24,235 People in the Labor Forcein in Marlborough.
What is the Percentage of People in the Labor Force in Marlborough?
72.0% of People are in the Labor Force in Marlborough.
What is the Unemployment Rate in Marlborough?
Unemployment Rate in Marlborough is 5.4%.