Dover, MA Map & Demographics
Dover Map
Dover Overview
$152,767
PER CAPITA INCOME
$250,001
AVG FAMILY INCOME
$250,001
AVG HOUSEHOLD INCOME
62.5%
WAGE / INCOME GAP [ % ]
37.5¢/ $1
WAGE / INCOME GAP [ $ ]
0.52
INEQUALITY / GINI INDEX
2,512
TOTAL POPULATION
1,261
MALE POPULATION
1,251
FEMALE POPULATION
100.80
MALES / 100 FEMALES
99.21
FEMALES / 100 MALES
44.6
MEDIAN AGE
3.5
AVG FAMILY SIZE
3.2
AVG HOUSEHOLD SIZE
1,223
LABOR FORCE [ PEOPLE ]
64.5%
PERCENT IN LABOR FORCE
13.9%
UNEMPLOYMENT RATE
Dover Zip Codes
Income in Dover
Income Overview in Dover
Per Capita Income in Dover is $152,767, while median incomes of families and households are $250,001 and $250,001 respectively.
| Characteristic | Number | Measure |
| Per Capita Income | 2,512 | $152,767 |
| Median Family Income | 646 | $250,001 |
| Mean Family Income | 646 | $560,458 |
| Median Household Income | 781 | $250,001 |
| Mean Household Income | 781 | $484,787 |
| Income Deficit | 646 | $0 |
| Wage / Income Gap (%) | 2,512 | 62.49% |
| Wage / Income Gap ($) | 2,512 | 37.51¢ per $1 |
| Gini / Inequality Index | 2,512 | 0.52 |
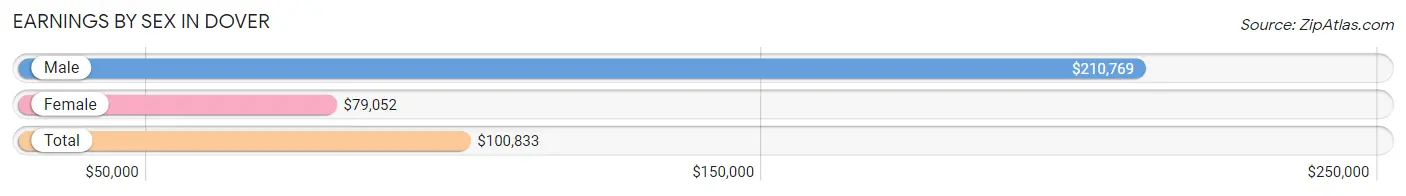
Earnings by Sex in Dover
Average Earnings in Dover are $100,833, $210,769 for men and $79,052 for women, a difference of 62.5%.
| Sex | Number | Average Earnings |
| Male | 646 (48.9%) | $210,769 |
| Female | 676 (51.1%) | $79,052 |
| Total | 1,322 (100.0%) | $100,833 |
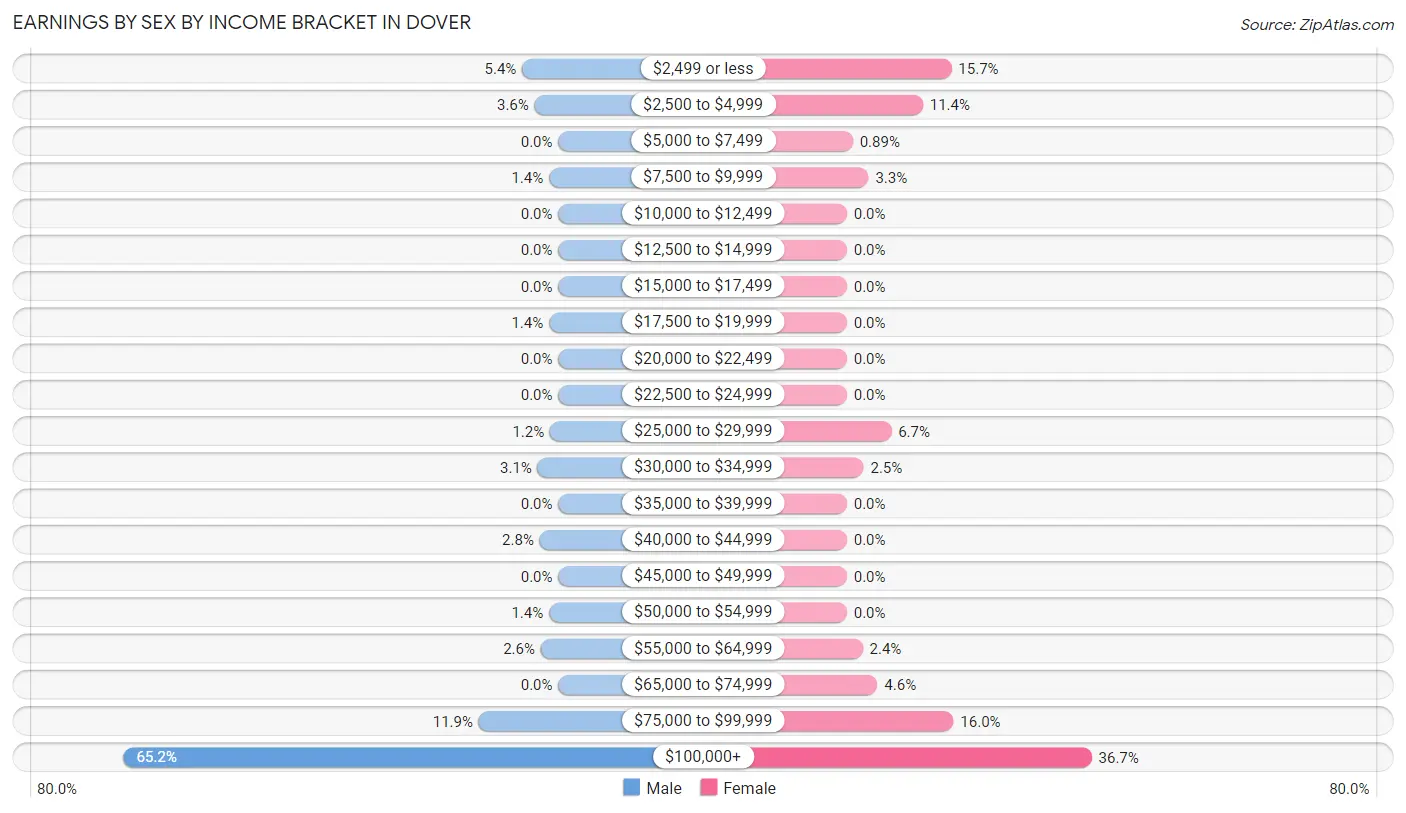
Earnings by Sex by Income Bracket in Dover
The most common earnings brackets in Dover are $100,000+ for men (421 | 65.2%) and $100,000+ for women (248 | 36.7%).
| Income | Male | Female |
| $2,499 or less | 35 (5.4%) | 106 (15.7%) |
| $2,500 to $4,999 | 23 (3.6%) | 77 (11.4%) |
| $5,000 to $7,499 | 0 (0.0%) | 6 (0.9%) |
| $7,500 to $9,999 | 9 (1.4%) | 22 (3.3%) |
| $10,000 to $12,499 | 0 (0.0%) | 0 (0.0%) |
| $12,500 to $14,999 | 0 (0.0%) | 0 (0.0%) |
| $15,000 to $17,499 | 0 (0.0%) | 0 (0.0%) |
| $17,500 to $19,999 | 9 (1.4%) | 0 (0.0%) |
| $20,000 to $22,499 | 0 (0.0%) | 0 (0.0%) |
| $22,500 to $24,999 | 0 (0.0%) | 0 (0.0%) |
| $25,000 to $29,999 | 8 (1.2%) | 45 (6.7%) |
| $30,000 to $34,999 | 20 (3.1%) | 17 (2.5%) |
| $35,000 to $39,999 | 0 (0.0%) | 0 (0.0%) |
| $40,000 to $44,999 | 18 (2.8%) | 0 (0.0%) |
| $45,000 to $49,999 | 0 (0.0%) | 0 (0.0%) |
| $50,000 to $54,999 | 9 (1.4%) | 0 (0.0%) |
| $55,000 to $64,999 | 17 (2.6%) | 16 (2.4%) |
| $65,000 to $74,999 | 0 (0.0%) | 31 (4.6%) |
| $75,000 to $99,999 | 77 (11.9%) | 108 (16.0%) |
| $100,000+ | 421 (65.2%) | 248 (36.7%) |
| Total | 646 (100.0%) | 676 (100.0%) |
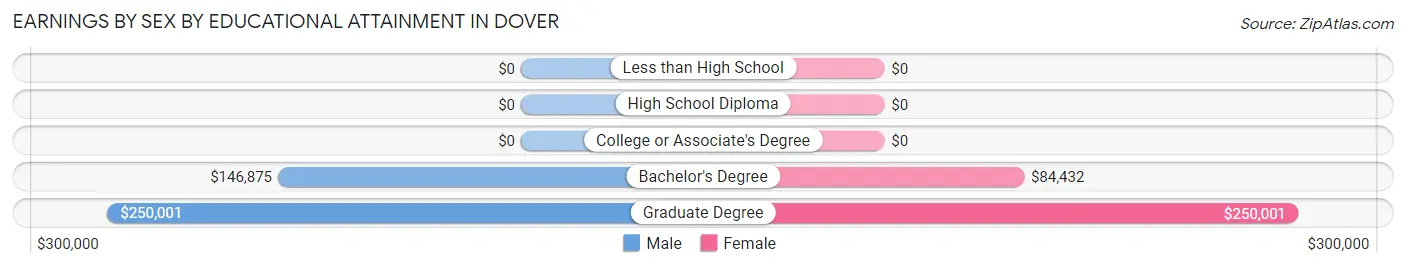
Earnings by Sex by Educational Attainment in Dover
Average earnings in Dover are $231,691 for men and $101,302 for women, a difference of 56.3%. Men with an educational attainment of graduate degree enjoy the highest average annual earnings of $250,001, while those with bachelor's degree education earn the least with $146,875. Women with an educational attainment of graduate degree earn the most with the average annual earnings of $250,001, while those with bachelor's degree education have the smallest earnings of $84,432.
| Educational Attainment | Male Income | Female Income |
| Less than High School | - | - |
| High School Diploma | - | - |
| College or Associate's Degree | - | - |
| Bachelor's Degree | $146,875 | $84,432 |
| Graduate Degree | $250,001 | $250,001 |
| Total | $231,691 | $101,302 |
Family Income in Dover
Family Income Brackets in Dover
According to the Dover family income data, there are 458 families falling into the $200,000+ income range, which is the most common income bracket and makes up 70.9% of all families.
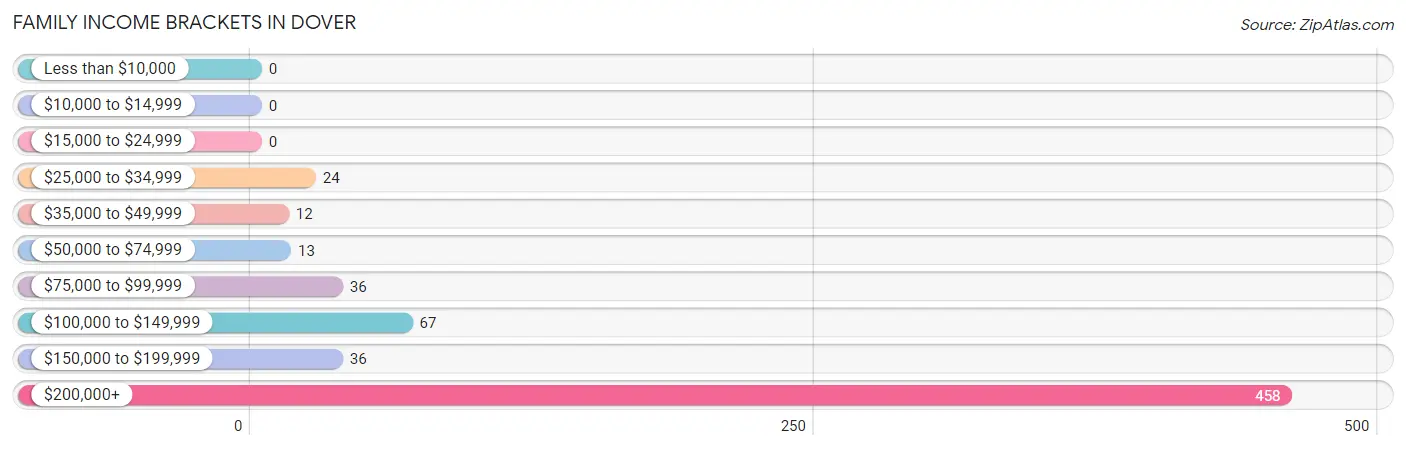
| Income Bracket | # Families | % Families |
| Less than $10,000 | 0 | 0.0% |
| $10,000 to $14,999 | 0 | 0.0% |
| $15,000 to $24,999 | 0 | 0.0% |
| $25,000 to $34,999 | 24 | 3.7% |
| $35,000 to $49,999 | 12 | 1.9% |
| $50,000 to $74,999 | 13 | 2.0% |
| $75,000 to $99,999 | 36 | 5.6% |
| $100,000 to $149,999 | 67 | 10.4% |
| $150,000 to $199,999 | 36 | 5.6% |
| $200,000+ | 458 | 70.9% |
Family Income by Famaliy Size in Dover
3-person families (100 | 15.5%) account for the highest median family income in Dover with $250,001 per family, while 2-person families (221 | 34.2%) have the highest median income of $107,216 per family member.
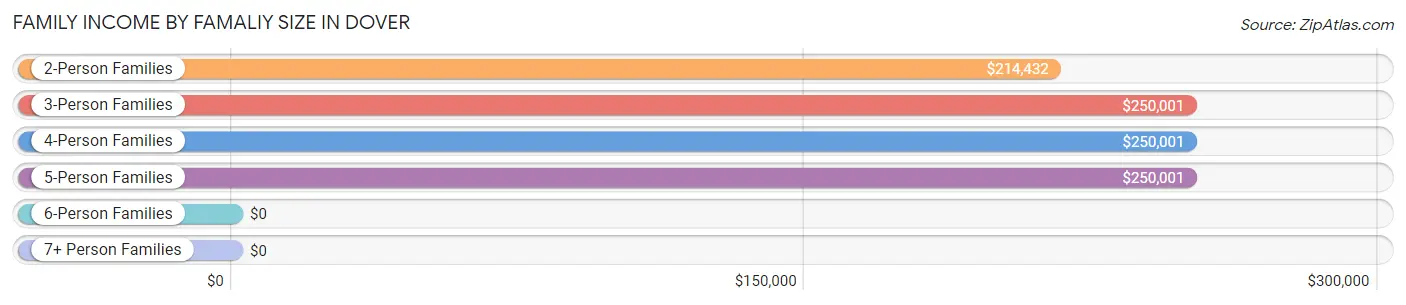
| Income Bracket | # Families | Median Income |
| 2-Person Families | 221 (34.2%) | $214,432 |
| 3-Person Families | 100 (15.5%) | $250,001 |
| 4-Person Families | 189 (29.3%) | $250,001 |
| 5-Person Families | 114 (17.6%) | $250,001 |
| 6-Person Families | 22 (3.4%) | $0 |
| 7+ Person Families | 0 (0.0%) | $0 |
| Total | 646 (100.0%) | $250,001 |
Family Income by Number of Earners in Dover
The median family income in Dover is $250,001, with families comprising 1 earner (134) having the highest median family income of $250,001, while families with no earners (72) have the lowest median family income of $106,250, accounting for 20.7% and 11.2% of families, respectively.
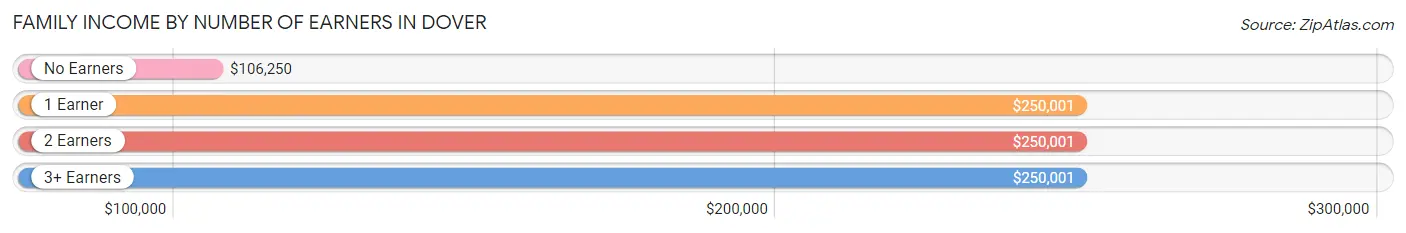
| Number of Earners | # Families | Median Income |
| No Earners | 72 (11.2%) | $106,250 |
| 1 Earner | 134 (20.7%) | $250,001 |
| 2 Earners | 308 (47.7%) | $250,001 |
| 3+ Earners | 132 (20.4%) | $250,001 |
| Total | 646 (100.0%) | $250,001 |
Household Income in Dover
Household Income Brackets in Dover
With 467 households falling in the category, the $200,000+ income range is the most frequent in Dover, accounting for 59.8% of all households.
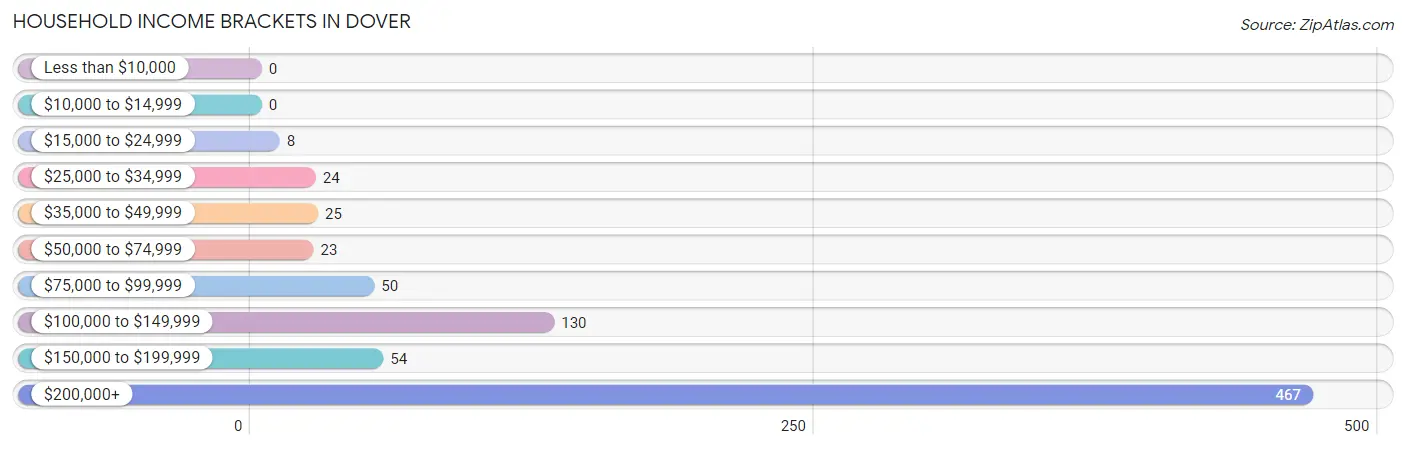
| Income Bracket | # Households | % Households |
| Less than $10,000 | 0 | 0.0% |
| $10,000 to $14,999 | 0 | 0.0% |
| $15,000 to $24,999 | 8 | 1.0% |
| $25,000 to $34,999 | 24 | 3.1% |
| $35,000 to $49,999 | 25 | 3.2% |
| $50,000 to $74,999 | 23 | 2.9% |
| $75,000 to $99,999 | 50 | 6.4% |
| $100,000 to $149,999 | 130 | 16.6% |
| $150,000 to $199,999 | 54 | 6.9% |
| $200,000+ | 467 | 59.8% |
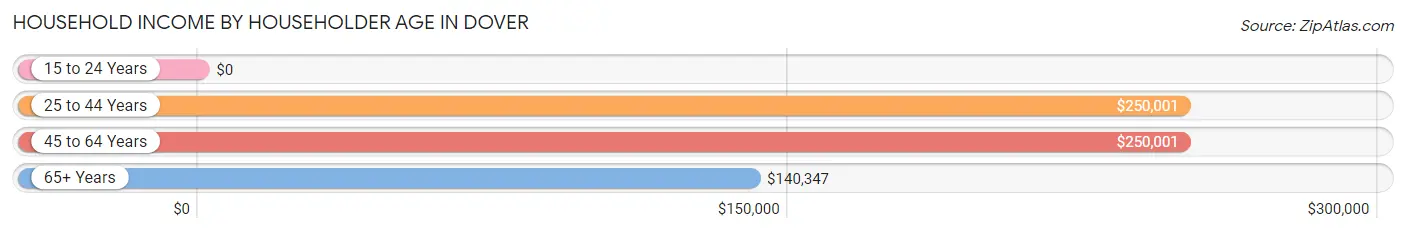
Household Income by Householder Age in Dover
The median household income in Dover is $250,001, with the highest median household income of $250,001 found in the 25 to 44 years age bracket for the primary householder. A total of 106 households (13.6%) fall into this category.
| Income Bracket | # Households | Median Income |
| 15 to 24 Years | 0 (0.0%) | $0 |
| 25 to 44 Years | 106 (13.6%) | $250,001 |
| 45 to 64 Years | 389 (49.8%) | $250,001 |
| 65+ Years | 286 (36.6%) | $140,347 |
| Total | 781 (100.0%) | $250,001 |
Poverty in Dover
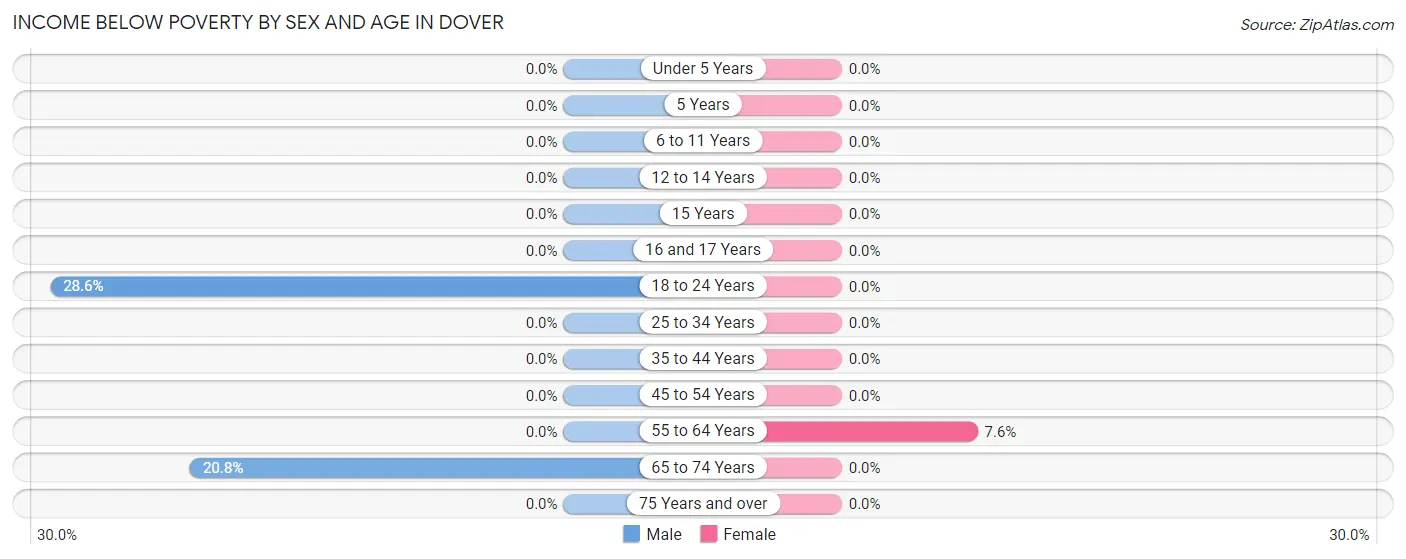
Income Below Poverty by Sex and Age in Dover
With 5.2% poverty level for males and 0.7% for females among the residents of Dover, 18 to 24 year old males and 55 to 64 year old females are the most vulnerable to poverty, with 28 males (28.6%) and 9 females (7.6%) in their respective age groups living below the poverty level.
| Age Bracket | Male | Female |
| Under 5 Years | 0 (0.0%) | 0 (0.0%) |
| 5 Years | 0 (0.0%) | 0 (0.0%) |
| 6 to 11 Years | 0 (0.0%) | 0 (0.0%) |
| 12 to 14 Years | 0 (0.0%) | 0 (0.0%) |
| 15 Years | 0 (0.0%) | 0 (0.0%) |
| 16 and 17 Years | 0 (0.0%) | 0 (0.0%) |
| 18 to 24 Years | 28 (28.6%) | 0 (0.0%) |
| 25 to 34 Years | 0 (0.0%) | 0 (0.0%) |
| 35 to 44 Years | 0 (0.0%) | 0 (0.0%) |
| 45 to 54 Years | 0 (0.0%) | 0 (0.0%) |
| 55 to 64 Years | 0 (0.0%) | 9 (7.6%) |
| 65 to 74 Years | 37 (20.8%) | 0 (0.0%) |
| 75 Years and over | 0 (0.0%) | 0 (0.0%) |
| Total | 65 (5.2%) | 9 (0.7%) |
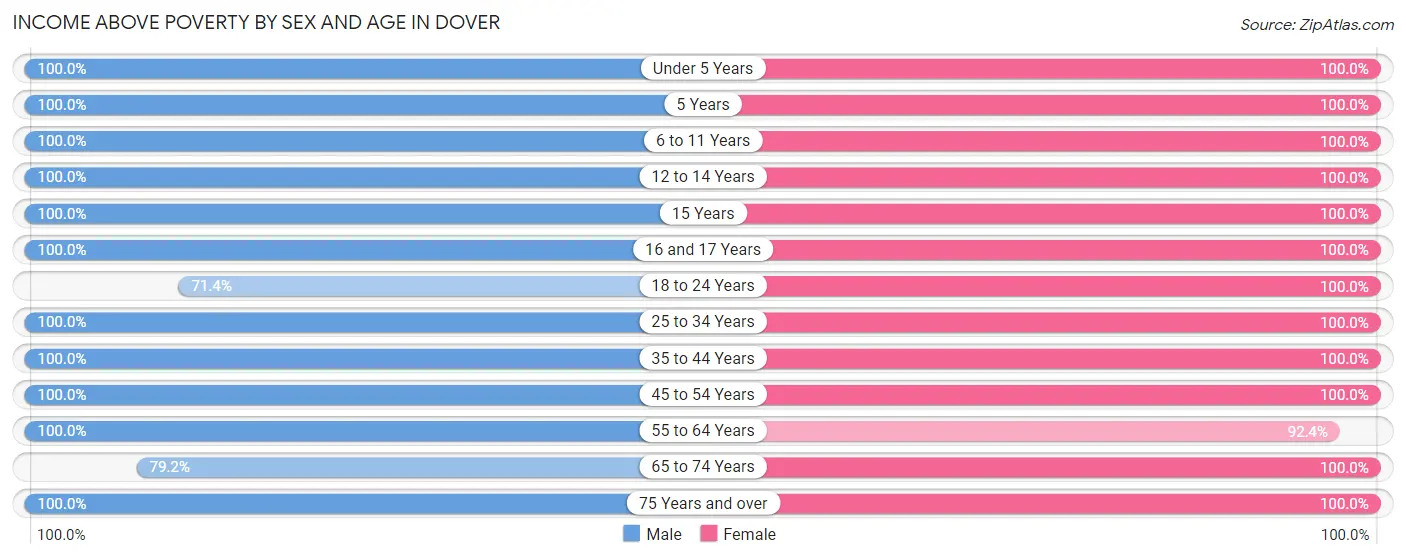
Income Above Poverty by Sex and Age in Dover
According to the poverty statistics in Dover, males aged under 5 years and females aged under 5 years are the age groups that are most secure financially, with 100.0% of males and 100.0% of females in these age groups living above the poverty line.
| Age Bracket | Male | Female |
| Under 5 Years | 11 (100.0%) | 53 (100.0%) |
| 5 Years | 37 (100.0%) | 6 (100.0%) |
| 6 to 11 Years | 162 (100.0%) | 64 (100.0%) |
| 12 to 14 Years | 125 (100.0%) | 78 (100.0%) |
| 15 Years | 47 (100.0%) | 22 (100.0%) |
| 16 and 17 Years | 48 (100.0%) | 32 (100.0%) |
| 18 to 24 Years | 70 (71.4%) | 181 (100.0%) |
| 25 to 34 Years | 28 (100.0%) | 52 (100.0%) |
| 35 to 44 Years | 73 (100.0%) | 131 (100.0%) |
| 45 to 54 Years | 237 (100.0%) | 251 (100.0%) |
| 55 to 64 Years | 143 (100.0%) | 110 (92.4%) |
| 65 to 74 Years | 141 (79.2%) | 154 (100.0%) |
| 75 Years and over | 69 (100.0%) | 102 (100.0%) |
| Total | 1,191 (94.8%) | 1,236 (99.3%) |
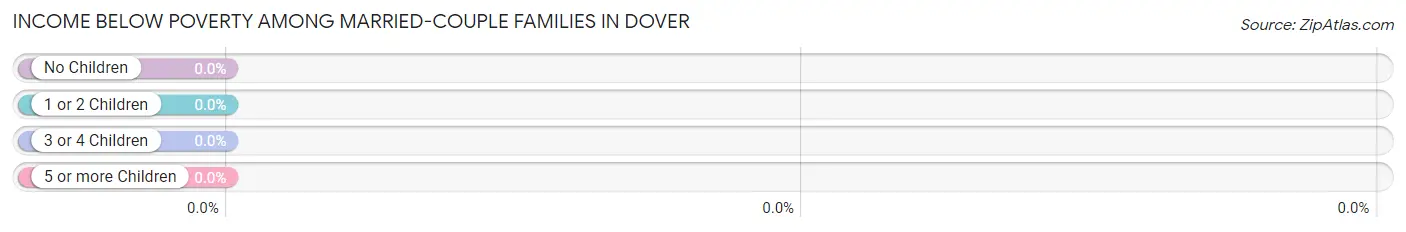
Income Below Poverty Among Married-Couple Families in Dover
| Children | Above Poverty | Below Poverty |
| No Children | 310 (100.0%) | 0 (0.0%) |
| 1 or 2 Children | 236 (100.0%) | 0 (0.0%) |
| 3 or 4 Children | 69 (100.0%) | 0 (0.0%) |
| 5 or more Children | 0 (0.0%) | 0 (0.0%) |
| Total | 615 (100.0%) | 0 (0.0%) |
Income Below Poverty Among Single-Parent Households in Dover
| Children | Single Father | Single Mother |
| No Children | 0 (0.0%) | 0 (0.0%) |
| 1 or 2 Children | 0 (0.0%) | 0 (0.0%) |
| 3 or 4 Children | 0 (0.0%) | 0 (0.0%) |
| 5 or more Children | 0 (0.0%) | 0 (0.0%) |
| Total | 0 (0.0%) | 0 (0.0%) |
Income Below Poverty Among Married-Couple vs Single-Parent Households in Dover
| Children | Married-Couple Families | Single-Parent Households |
| No Children | 0 (0.0%) | 0 (0.0%) |
| 1 or 2 Children | 0 (0.0%) | 0 (0.0%) |
| 3 or 4 Children | 0 (0.0%) | 0 (0.0%) |
| 5 or more Children | 0 (0.0%) | 0 (0.0%) |
| Total | 0 (0.0%) | 0 (0.0%) |
Race in Dover
The most populous races in Dover are White / Caucasian (1,861 | 74.1%), Asian (337 | 13.4%), and Two or more Races (264 | 10.5%).
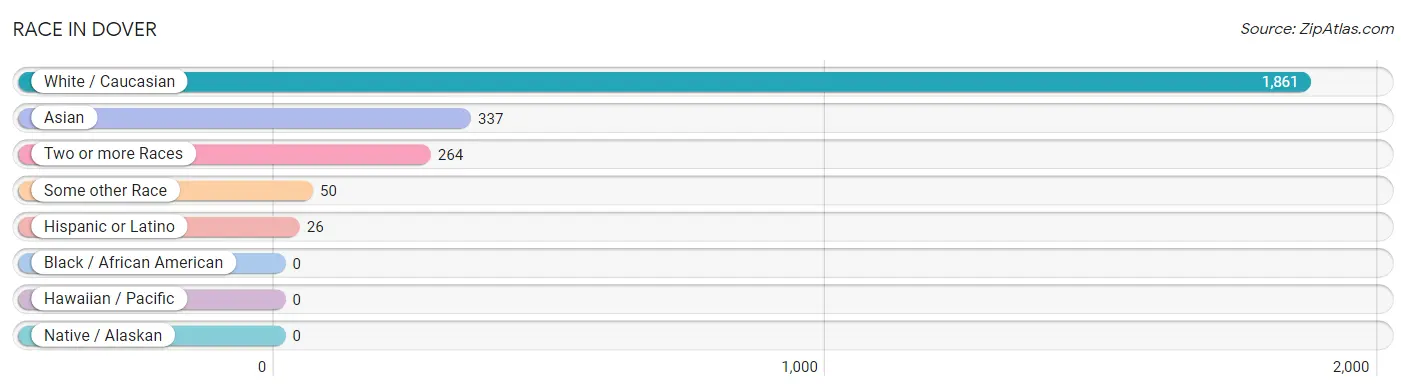
| Race | # Population | % Population |
| Asian | 337 | 13.4% |
| Black / African American | 0 | 0.0% |
| Hawaiian / Pacific | 0 | 0.0% |
| Hispanic or Latino | 26 | 1.0% |
| Native / Alaskan | 0 | 0.0% |
| White / Caucasian | 1,861 | 74.1% |
| Two or more Races | 264 | 10.5% |
| Some other Race | 50 | 2.0% |
| Total | 2,512 | 100.0% |
Ancestry in Dover
The most populous ancestries reported in Dover are Irish (708 | 28.2%), English (451 | 17.9%), German (384 | 15.3%), Italian (232 | 9.2%), and European (206 | 8.2%), together accounting for 78.9% of all Dover residents.
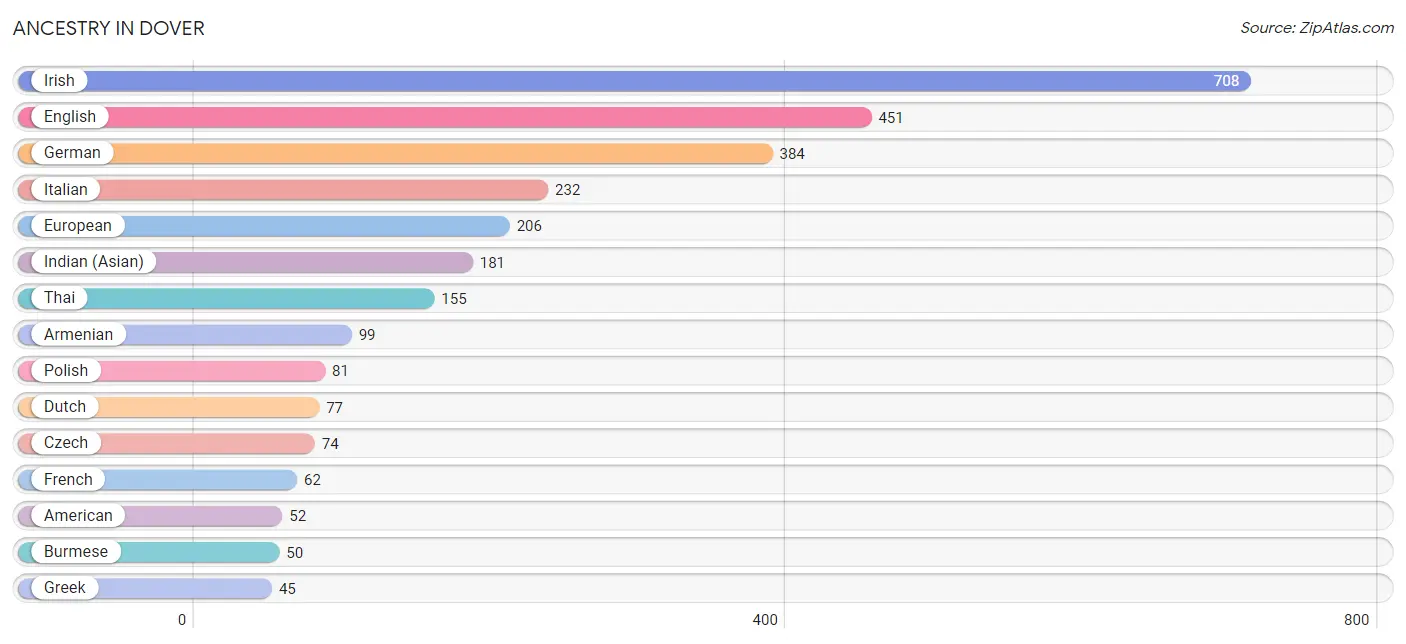
| Ancestry | # Population | % Population |
| American | 52 | 2.1% |
| Arab | 30 | 1.2% |
| Armenian | 99 | 3.9% |
| Austrian | 24 | 1.0% |
| British | 16 | 0.6% |
| Burmese | 50 | 2.0% |
| Czech | 74 | 2.9% |
| Dominican | 11 | 0.4% |
| Dutch | 77 | 3.1% |
| Eastern European | 36 | 1.4% |
| English | 451 | 17.9% |
| Estonian | 11 | 0.4% |
| European | 206 | 8.2% |
| Finnish | 21 | 0.8% |
| French | 62 | 2.5% |
| French Canadian | 14 | 0.6% |
| German | 384 | 15.3% |
| Greek | 45 | 1.8% |
| Hungarian | 4 | 0.2% |
| Indian (Asian) | 181 | 7.2% |
| Irish | 708 | 28.2% |
| Italian | 232 | 9.2% |
| Korean | 9 | 0.4% |
| Latvian | 22 | 0.9% |
| Lebanese | 30 | 1.2% |
| Lithuanian | 22 | 0.9% |
| Maltese | 25 | 1.0% |
| Northern European | 31 | 1.2% |
| Polish | 81 | 3.2% |
| Portuguese | 15 | 0.6% |
| Russian | 45 | 1.8% |
| Scotch-Irish | 32 | 1.3% |
| Scottish | 31 | 1.2% |
| Slavic | 11 | 0.4% |
| Spanish | 15 | 0.6% |
| Swedish | 31 | 1.2% |
| Swiss | 5 | 0.2% |
| Thai | 155 | 6.2% | View All 38 Rows |
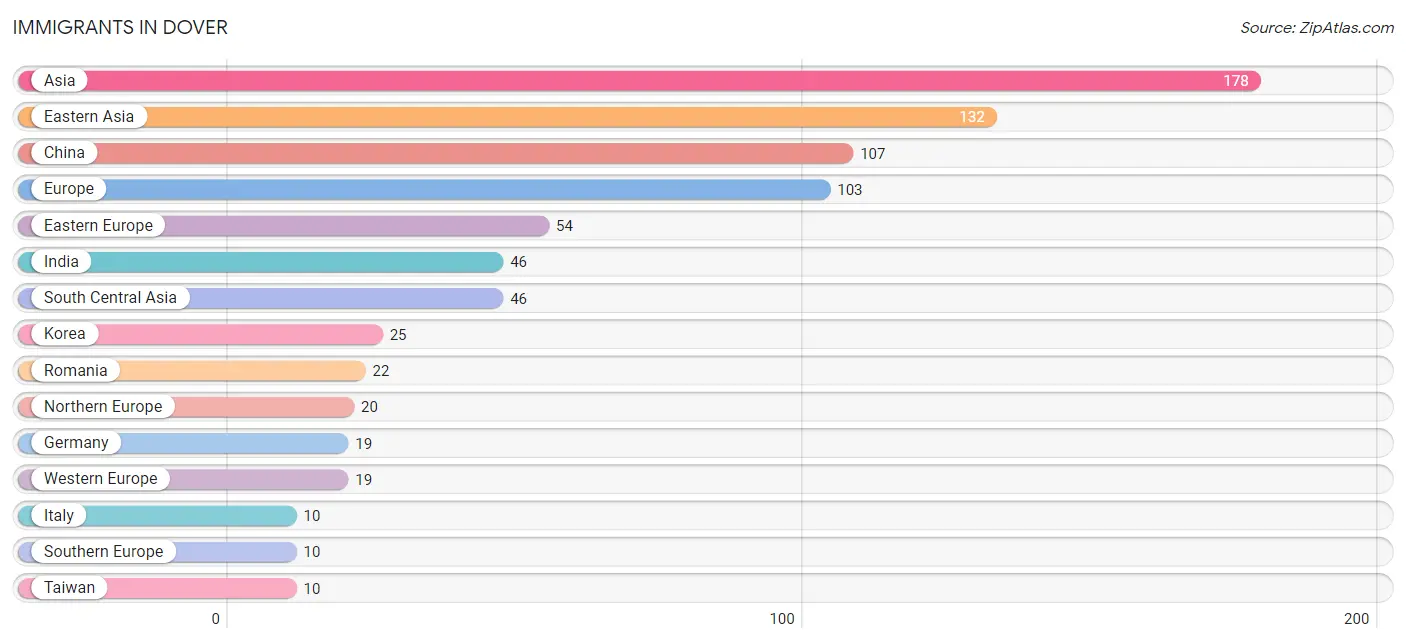
Immigrants in Dover
The most numerous immigrant groups reported in Dover came from Asia (178 | 7.1%), Eastern Asia (132 | 5.2%), China (107 | 4.3%), Europe (103 | 4.1%), and Eastern Europe (54 | 2.1%), together accounting for 22.9% of all Dover residents.
| Immigration Origin | # Population | % Population |
| Asia | 178 | 7.1% |
| Brazil | 7 | 0.3% |
| China | 107 | 4.3% |
| Eastern Asia | 132 | 5.2% |
| Eastern Europe | 54 | 2.1% |
| Europe | 103 | 4.1% |
| Germany | 19 | 0.8% |
| India | 46 | 1.8% |
| Italy | 10 | 0.4% |
| Korea | 25 | 1.0% |
| Latin America | 7 | 0.3% |
| Northern Europe | 20 | 0.8% |
| Poland | 9 | 0.4% |
| Romania | 22 | 0.9% |
| South America | 7 | 0.3% |
| South Central Asia | 46 | 1.8% |
| Southern Europe | 10 | 0.4% |
| Taiwan | 10 | 0.4% |
| Western Europe | 19 | 0.8% | View All 19 Rows |
Sex and Age in Dover
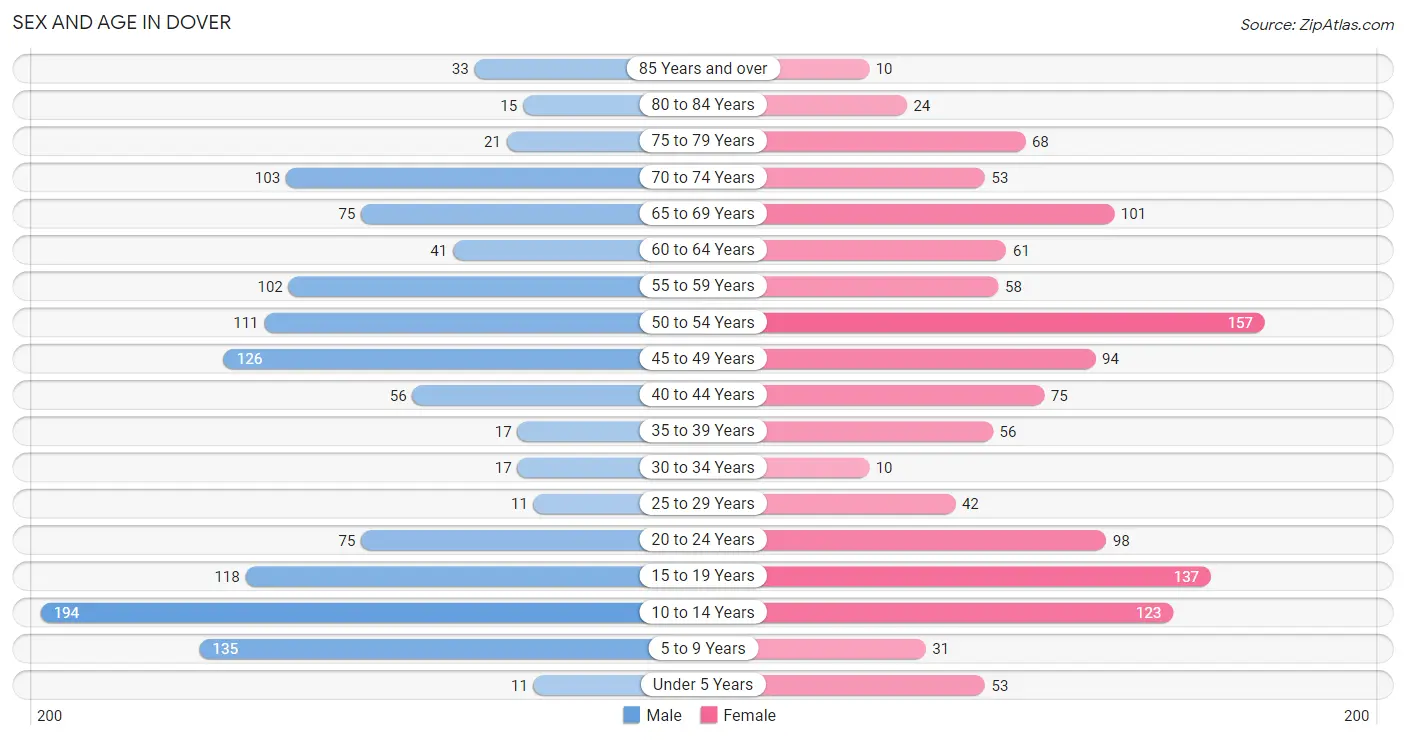
Sex and Age in Dover
The most populous age groups in Dover are 10 to 14 Years (194 | 15.4%) for men and 50 to 54 Years (157 | 12.6%) for women.
| Age Bracket | Male | Female |
| Under 5 Years | 11 (0.9%) | 53 (4.2%) |
| 5 to 9 Years | 135 (10.7%) | 31 (2.5%) |
| 10 to 14 Years | 194 (15.4%) | 123 (9.8%) |
| 15 to 19 Years | 118 (9.4%) | 137 (11.0%) |
| 20 to 24 Years | 75 (5.9%) | 98 (7.8%) |
| 25 to 29 Years | 11 (0.9%) | 42 (3.4%) |
| 30 to 34 Years | 17 (1.3%) | 10 (0.8%) |
| 35 to 39 Years | 17 (1.3%) | 56 (4.5%) |
| 40 to 44 Years | 56 (4.4%) | 75 (6.0%) |
| 45 to 49 Years | 126 (10.0%) | 94 (7.5%) |
| 50 to 54 Years | 111 (8.8%) | 157 (12.6%) |
| 55 to 59 Years | 102 (8.1%) | 58 (4.6%) |
| 60 to 64 Years | 41 (3.3%) | 61 (4.9%) |
| 65 to 69 Years | 75 (5.9%) | 101 (8.1%) |
| 70 to 74 Years | 103 (8.2%) | 53 (4.2%) |
| 75 to 79 Years | 21 (1.7%) | 68 (5.4%) |
| 80 to 84 Years | 15 (1.2%) | 24 (1.9%) |
| 85 Years and over | 33 (2.6%) | 10 (0.8%) |
| Total | 1,261 (100.0%) | 1,251 (100.0%) |
Families and Households in Dover
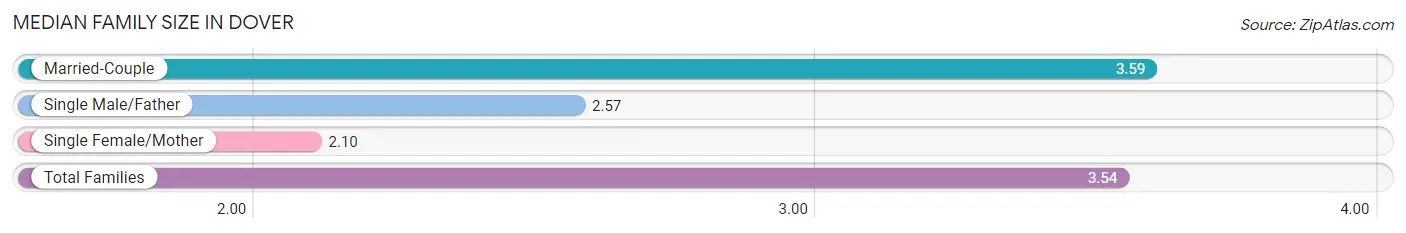
Median Family Size in Dover
The median family size in Dover is 3.54 persons per family, with married-couple families (615 | 95.2%) accounting for the largest median family size of 3.59 persons per family. On the other hand, single female/mother families (10 | 1.5%) represent the smallest median family size with 2.10 persons per family.
| Family Type | # Families | Family Size |
| Married-Couple | 615 (95.2%) | 3.59 |
| Single Male/Father | 21 (3.3%) | 2.57 |
| Single Female/Mother | 10 (1.5%) | 2.10 |
| Total Families | 646 (100.0%) | 3.54 |
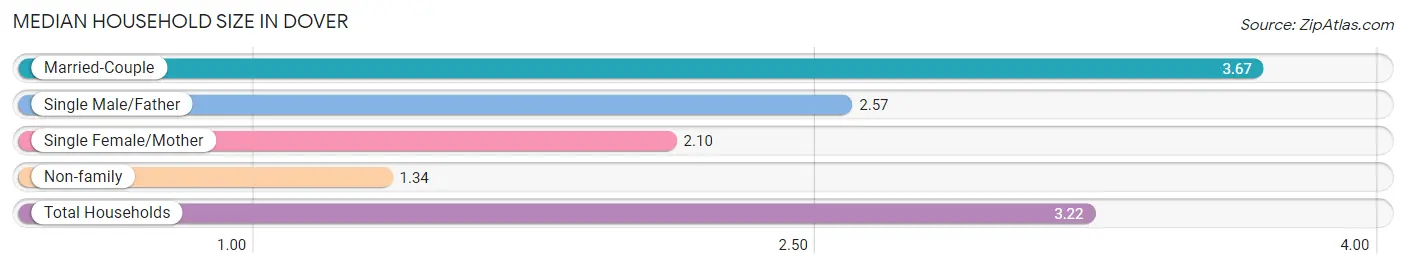
Median Household Size in Dover
The median household size in Dover is 3.22 persons per household, with married-couple households (615 | 78.7%) accounting for the largest median household size of 3.67 persons per household. non-family households (135 | 17.3%) represent the smallest median household size with 1.34 persons per household.
| Household Type | # Households | Household Size |
| Married-Couple | 615 (78.7%) | 3.67 |
| Single Male/Father | 21 (2.7%) | 2.57 |
| Single Female/Mother | 10 (1.3%) | 2.10 |
| Non-family | 135 (17.3%) | 1.34 |
| Total Households | 781 (100.0%) | 3.22 |
Household Size by Marriage Status in Dover
Out of a total of 781 households in Dover, 646 (82.7%) are family households, while 135 (17.3%) are nonfamily households. The most numerous type of family households are 2-person households, comprising 221, and the most common type of nonfamily households are 1-person households, comprising 90.
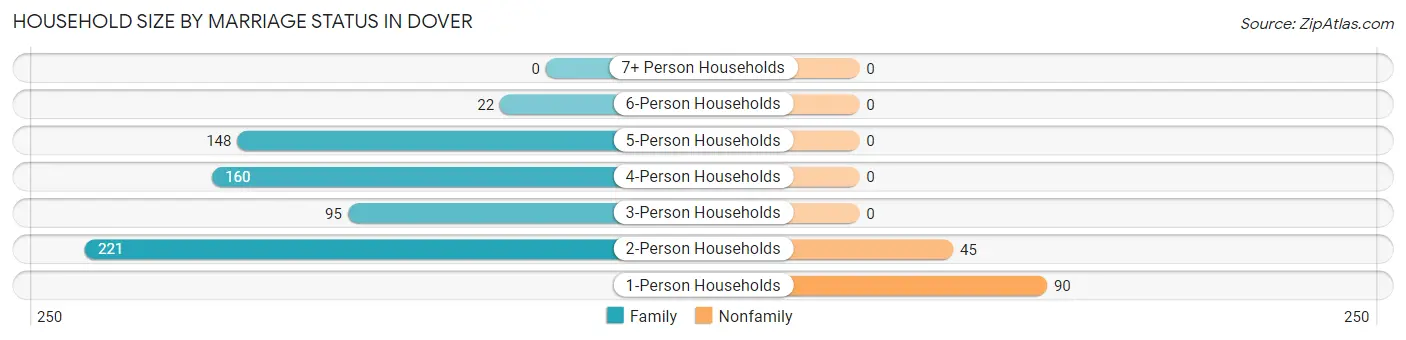
| Household Size | Family Households | Nonfamily Households |
| 1-Person Households | - | 90 (11.5%) |
| 2-Person Households | 221 (28.3%) | 45 (5.8%) |
| 3-Person Households | 95 (12.2%) | 0 (0.0%) |
| 4-Person Households | 160 (20.5%) | 0 (0.0%) |
| 5-Person Households | 148 (19.0%) | 0 (0.0%) |
| 6-Person Households | 22 (2.8%) | 0 (0.0%) |
| 7+ Person Households | 0 (0.0%) | 0 (0.0%) |
| Total | 646 (82.7%) | 135 (17.3%) |
Female Fertility in Dover
Fertility by Age in Dover
Average fertility rate in Dover is 9.0 births per 1,000 women. Women in the age bracket of 35 to 50 years have the highest fertility rate with 20.0 births per 1,000 women. Women in the age bracket of 35 to 50 years acount for 100.0% of all women with births.
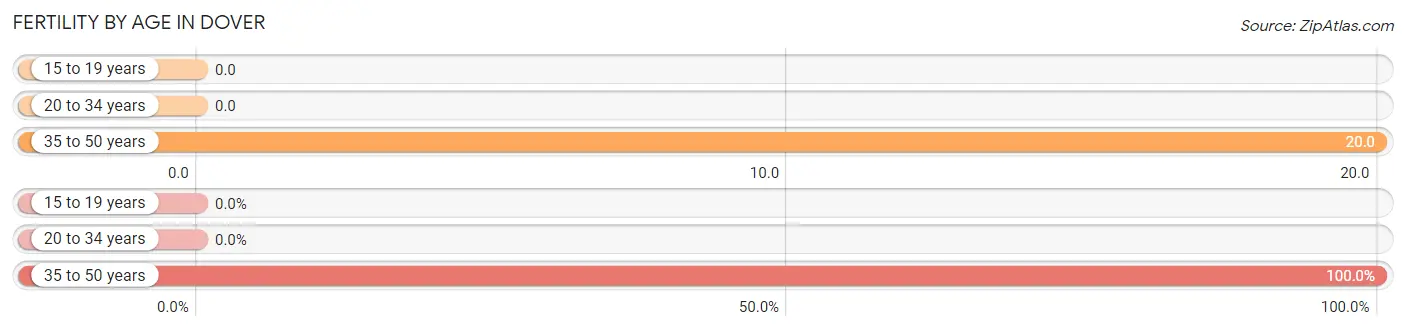
| Age Bracket | Women with Births | Births / 1,000 Women |
| 15 to 19 years | 0 (0.0%) | 0.0 |
| 20 to 34 years | 0 (0.0%) | 0.0 |
| 35 to 50 years | 5 (100.0%) | 20.0 |
| Total | 5 (100.0%) | 9.0 |
Fertility by Age by Marriage Status in Dover
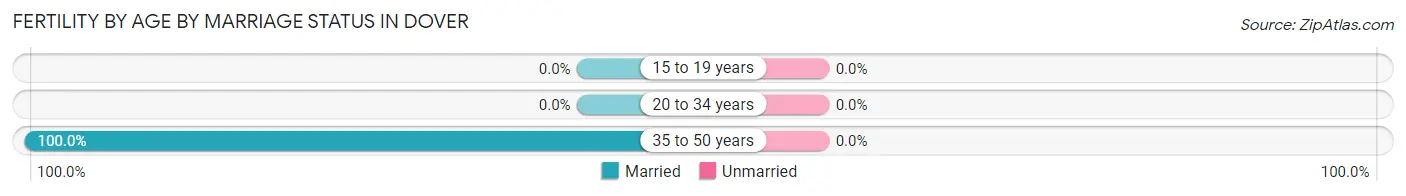
| Age Bracket | Married | Unmarried |
| 15 to 19 years | 0 (0.0%) | 0 (0.0%) |
| 20 to 34 years | 0 (0.0%) | 0 (0.0%) |
| 35 to 50 years | 5 (100.0%) | 0 (0.0%) |
| Total | 5 (100.0%) | 0 (0.0%) |
Fertility by Education in Dover
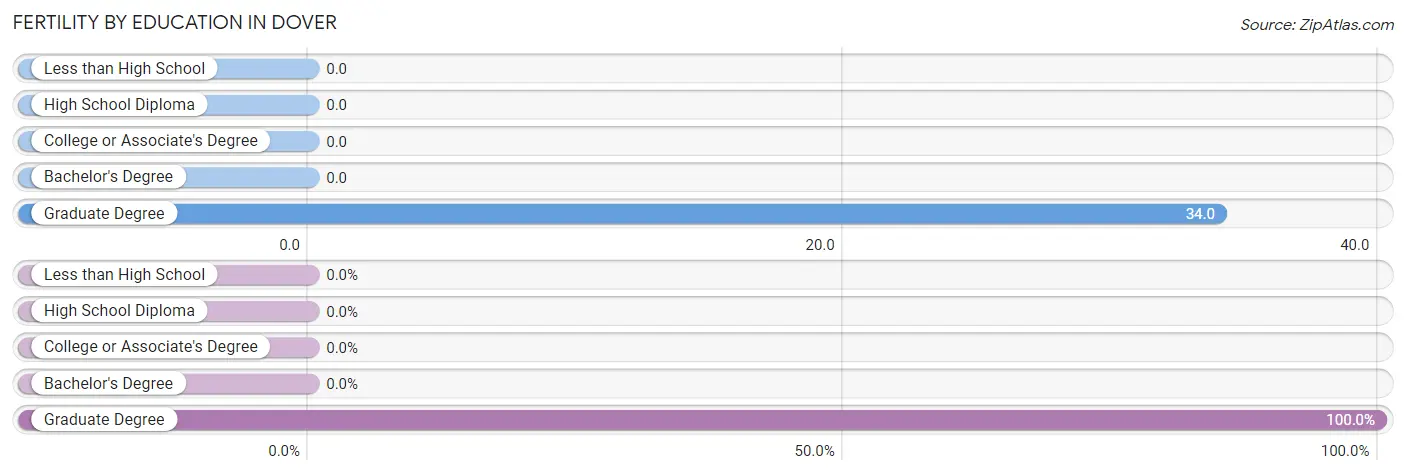
| Educational Attainment | Women with Births | Births / 1,000 Women |
| Less than High School | 0 (0.0%) | 0.0 |
| High School Diploma | 0 (0.0%) | 0.0 |
| College or Associate's Degree | 0 (0.0%) | 0.0 |
| Bachelor's Degree | 0 (0.0%) | 0.0 |
| Graduate Degree | 5 (100.0%) | 34.0 |
| Total | 5 (100.0%) | 9.0 |
Fertility by Education by Marriage Status in Dover
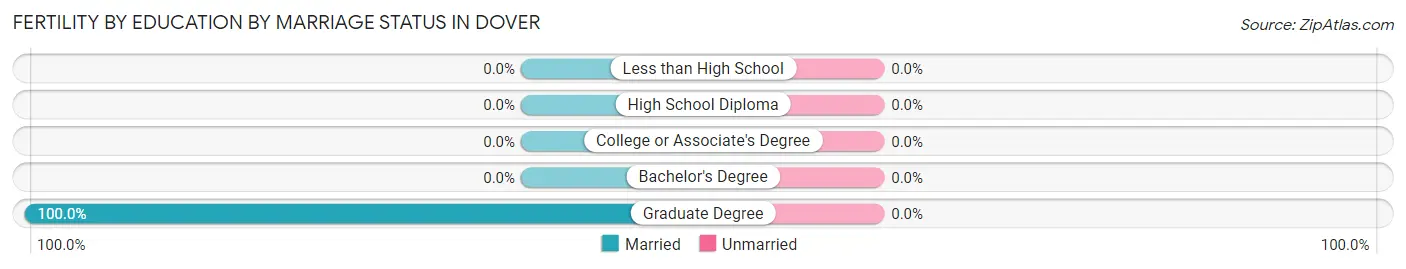
| Educational Attainment | Married | Unmarried |
| Less than High School | 0 (0.0%) | 0 (0.0%) |
| High School Diploma | 0 (0.0%) | 0 (0.0%) |
| College or Associate's Degree | 0 (0.0%) | 0 (0.0%) |
| Bachelor's Degree | 0 (0.0%) | 0 (0.0%) |
| Graduate Degree | 5 (100.0%) | 0 (0.0%) |
| Total | 5 (100.0%) | 0 (0.0%) |
Employment Characteristics in Dover
Employment by Class of Employer in Dover
Among the 1,037 employed individuals in Dover, private company employees (724 | 69.8%), not-for-profit organizations (148 | 14.3%), and self-employed (not incorporated) (67 | 6.5%) make up the most common classes of employment.
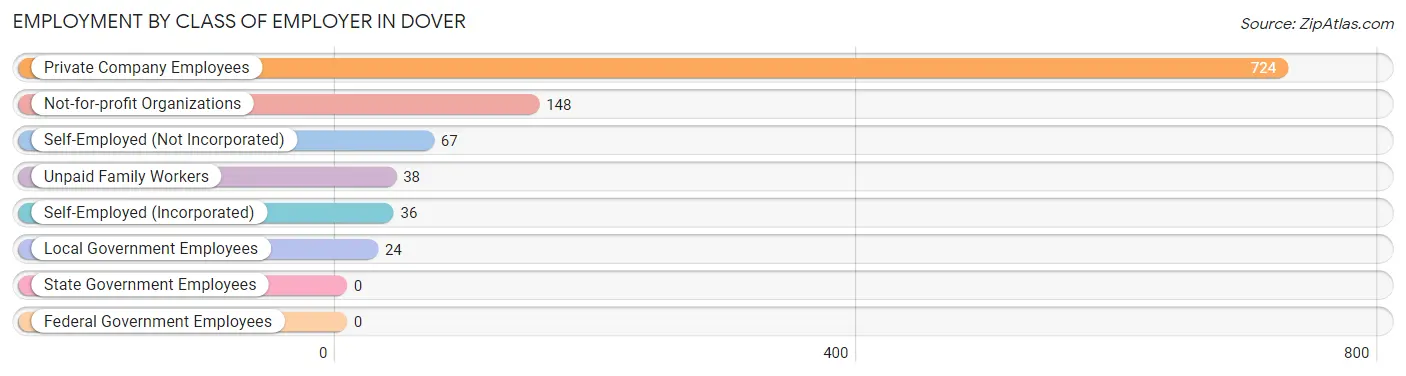
| Employer Class | # Employees | % Employees |
| Private Company Employees | 724 | 69.8% |
| Self-Employed (Incorporated) | 36 | 3.5% |
| Self-Employed (Not Incorporated) | 67 | 6.5% |
| Not-for-profit Organizations | 148 | 14.3% |
| Local Government Employees | 24 | 2.3% |
| State Government Employees | 0 | 0.0% |
| Federal Government Employees | 0 | 0.0% |
| Unpaid Family Workers | 38 | 3.7% |
| Total | 1,037 | 100.0% |
Employment Status by Age in Dover
According to the labor force statistics for Dover, out of the total population over 16 years of age (1,896), 64.5% or 1,223 individuals are in the labor force, with 13.9% or 170 of them unemployed. The age group with the highest labor force participation rate is 25 to 29 years, with 100.0% or 53 individuals in the labor force. Within the labor force, the 20 to 24 years age range has the highest percentage of unemployed individuals, with 55.2% or 80 of them being unemployed.
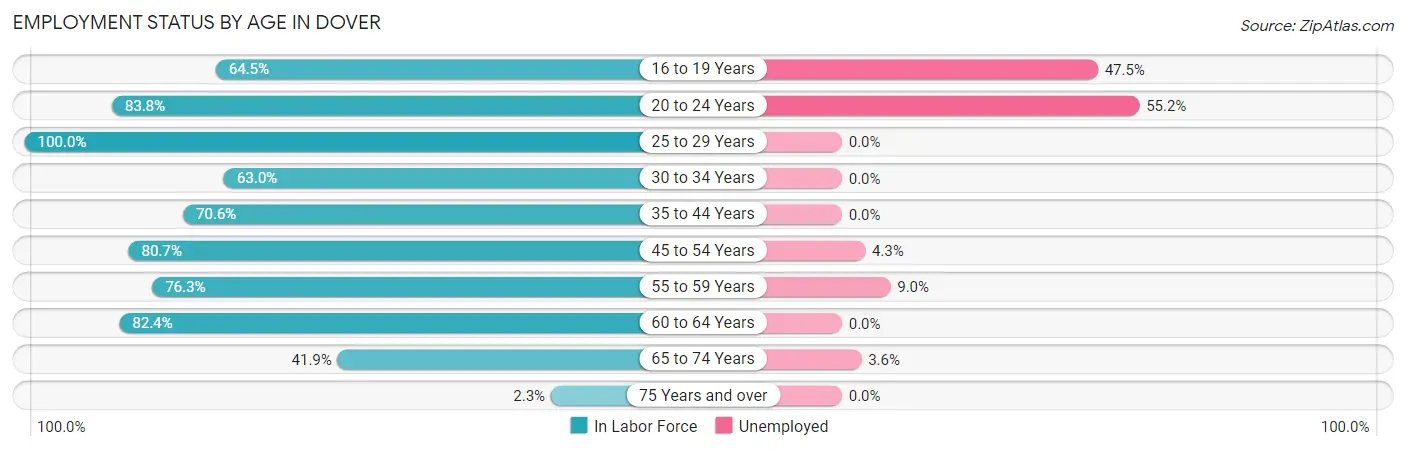
| Age Bracket | In Labor Force | Unemployed |
| 16 to 19 Years | 120 (64.5%) | 57 (47.5%) |
| 20 to 24 Years | 145 (83.8%) | 80 (55.2%) |
| 25 to 29 Years | 53 (100.0%) | 0 (0.0%) |
| 30 to 34 Years | 17 (63.0%) | 0 (0.0%) |
| 35 to 44 Years | 144 (70.6%) | 0 (0.0%) |
| 45 to 54 Years | 394 (80.7%) | 17 (4.3%) |
| 55 to 59 Years | 122 (76.3%) | 11 (9.0%) |
| 60 to 64 Years | 84 (82.4%) | 0 (0.0%) |
| 65 to 74 Years | 139 (41.9%) | 5 (3.6%) |
| 75 Years and over | 4 (2.3%) | 0 (0.0%) |
| Total | 1,223 (64.5%) | 170 (13.9%) |
Employment Status by Educational Attainment in Dover
According to labor force statistics for Dover, 78.7% of individuals (814) out of the total population between 25 and 64 years of age (1,034) are in the labor force, with 3.4% or 28 of them being unemployed. The group with the highest labor force participation rate are those with the educational attainment of high school diploma, with 100.0% or 5 individuals in the labor force. Within the labor force, individuals with bachelor's degree or higher education have the highest percentage of unemployment, with 3.6% or 28 of them being unemployed.
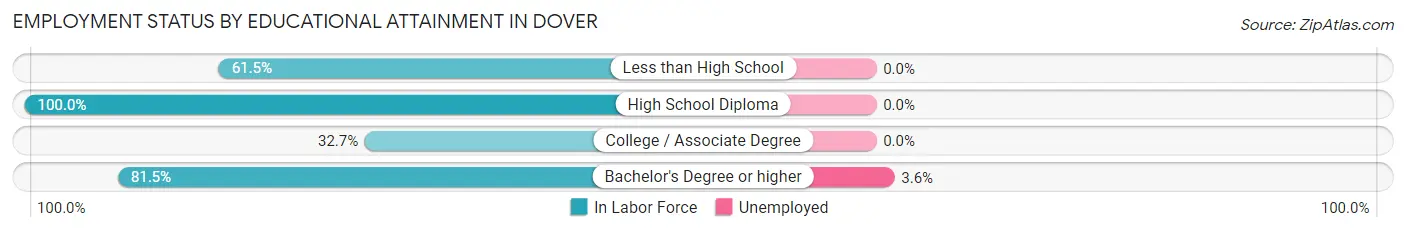
| Educational Attainment | In Labor Force | Unemployed |
| Less than High School | 8 (61.5%) | 0 (0.0%) |
| High School Diploma | 5 (100.0%) | 0 (0.0%) |
| College / Associate Degree | 18 (32.7%) | 0 (0.0%) |
| Bachelor's Degree or higher | 783 (81.5%) | 35 (3.6%) |
| Total | 814 (78.7%) | 35 (3.4%) |
Employment Occupations by Sex in Dover
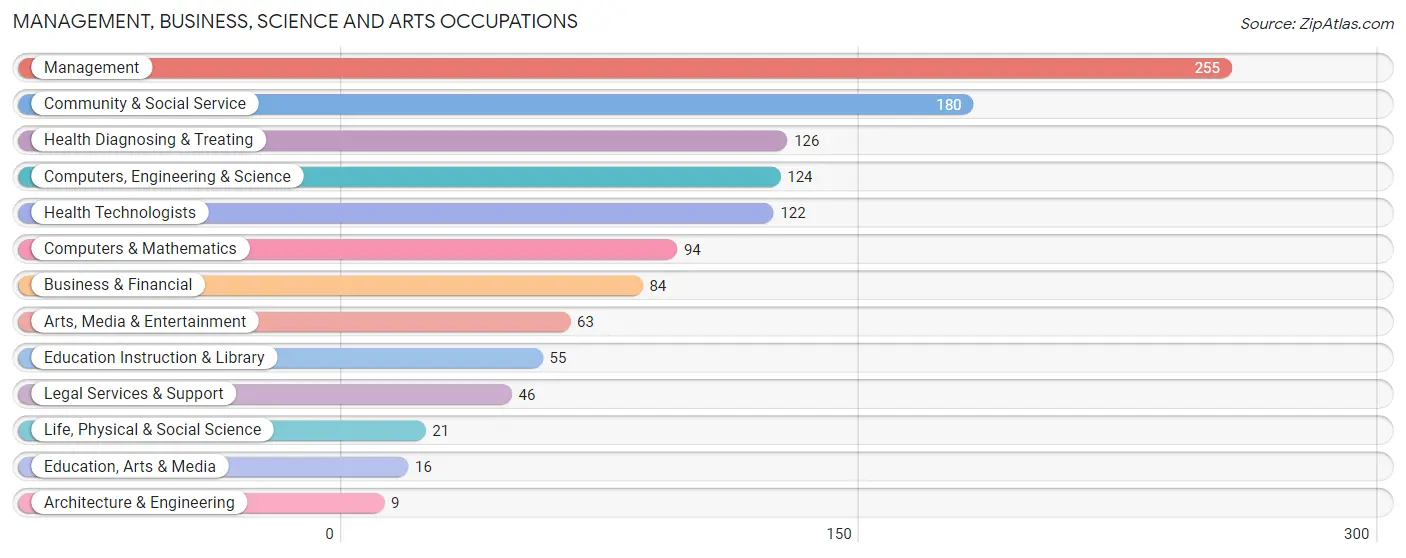
Management, Business, Science and Arts Occupations
The most common Management, Business, Science and Arts occupations in Dover are Management (255 | 24.2%), Community & Social Service (180 | 17.1%), Health Diagnosing & Treating (126 | 12.0%), Computers, Engineering & Science (124 | 11.8%), and Health Technologists (122 | 11.6%).
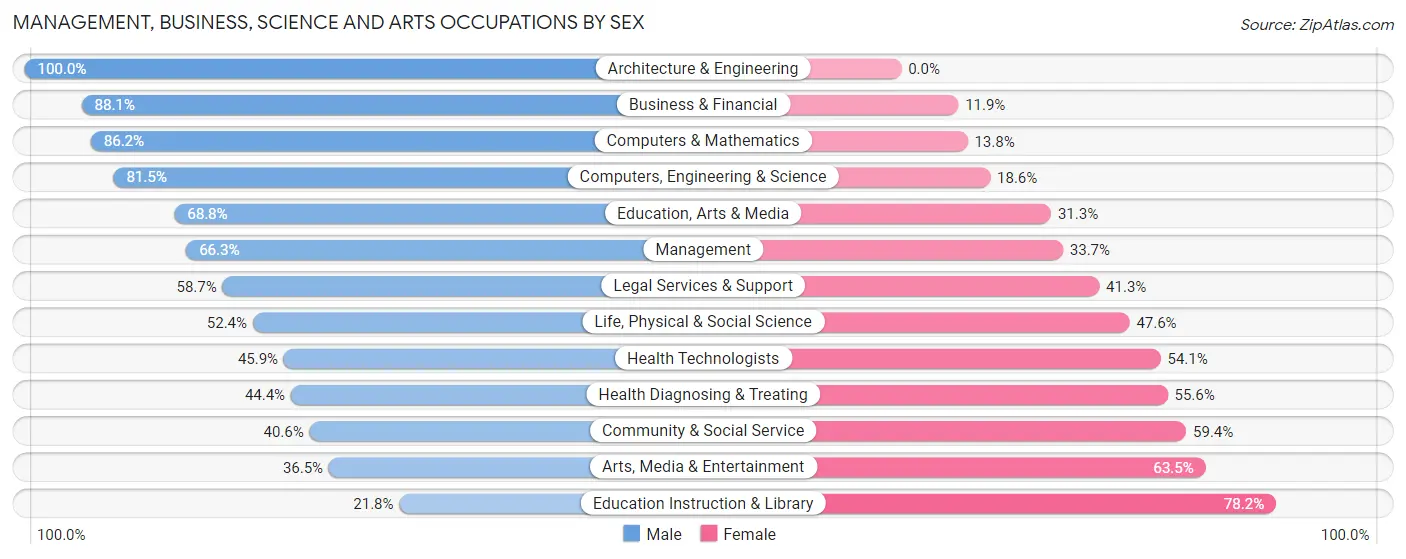
Management, Business, Science and Arts Occupations by Sex
Within the Management, Business, Science and Arts occupations in Dover, the most male-oriented occupations are Architecture & Engineering (100.0%), Business & Financial (88.1%), and Computers & Mathematics (86.2%), while the most female-oriented occupations are Education Instruction & Library (78.2%), Arts, Media & Entertainment (63.5%), and Community & Social Service (59.4%).
| Occupation | Male | Female |
| Management | 169 (66.3%) | 86 (33.7%) |
| Business & Financial | 74 (88.1%) | 10 (11.9%) |
| Computers, Engineering & Science | 101 (81.5%) | 23 (18.5%) |
| Computers & Mathematics | 81 (86.2%) | 13 (13.8%) |
| Architecture & Engineering | 9 (100.0%) | 0 (0.0%) |
| Life, Physical & Social Science | 11 (52.4%) | 10 (47.6%) |
| Community & Social Service | 73 (40.6%) | 107 (59.4%) |
| Education, Arts & Media | 11 (68.8%) | 5 (31.2%) |
| Legal Services & Support | 27 (58.7%) | 19 (41.3%) |
| Education Instruction & Library | 12 (21.8%) | 43 (78.2%) |
| Arts, Media & Entertainment | 23 (36.5%) | 40 (63.5%) |
| Health Diagnosing & Treating | 56 (44.4%) | 70 (55.6%) |
| Health Technologists | 56 (45.9%) | 66 (54.1%) |
| Total (Category) | 473 (61.5%) | 296 (38.5%) |
| Total (Overall) | 585 (55.6%) | 467 (44.4%) |
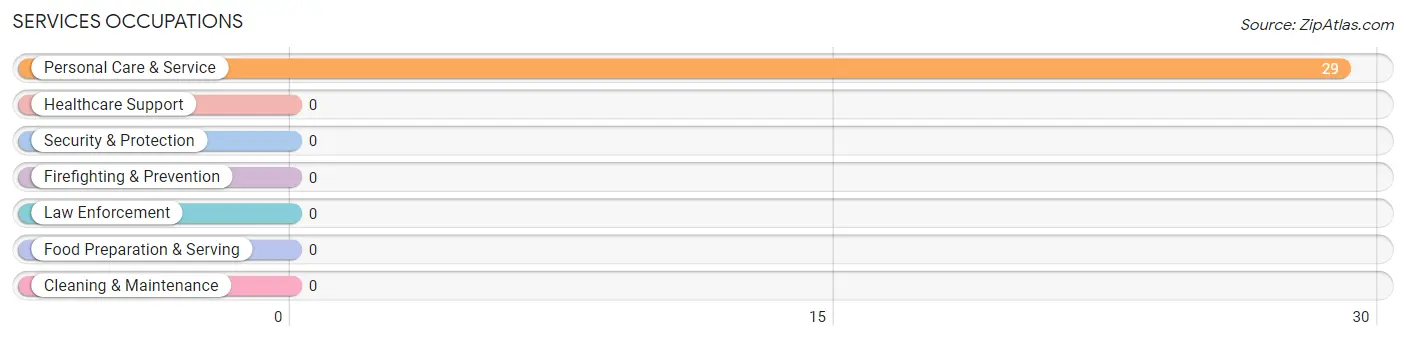
Services Occupations
The most common Services occupations in Dover are , and Personal Care & Service (29 | 2.8%).
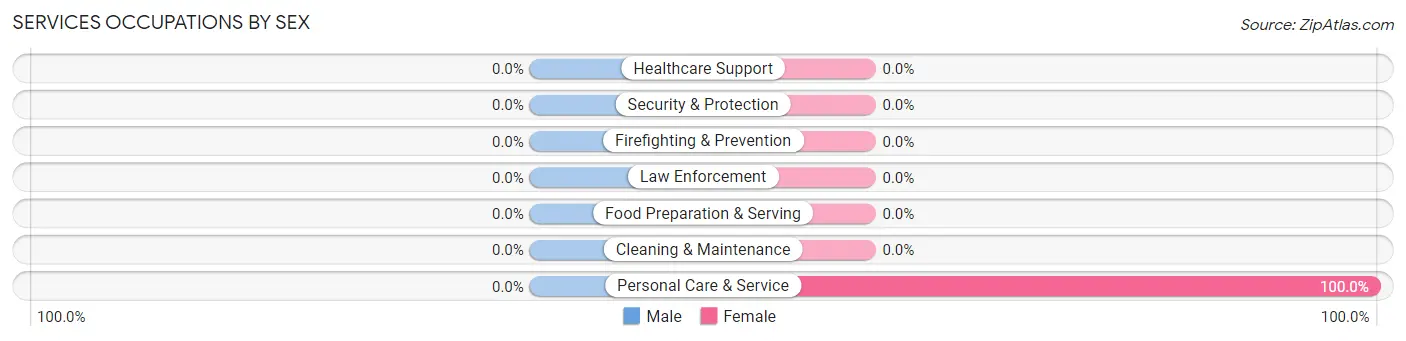
Services Occupations by Sex
| Occupation | Male | Female |
| Healthcare Support | 0 (0.0%) | 0 (0.0%) |
| Security & Protection | 0 (0.0%) | 0 (0.0%) |
| Firefighting & Prevention | 0 (0.0%) | 0 (0.0%) |
| Law Enforcement | 0 (0.0%) | 0 (0.0%) |
| Food Preparation & Serving | 0 (0.0%) | 0 (0.0%) |
| Cleaning & Maintenance | 0 (0.0%) | 0 (0.0%) |
| Personal Care & Service | 0 (0.0%) | 29 (100.0%) |
| Total (Category) | 0 (0.0%) | 29 (100.0%) |
| Total (Overall) | 585 (55.6%) | 467 (44.4%) |
Sales and Office Occupations
The most common Sales and Office occupations in Dover are Sales & Related (207 | 19.7%), and Office & Administration (12 | 1.1%).
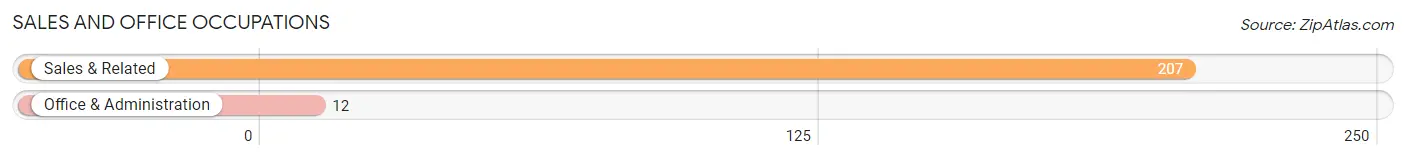
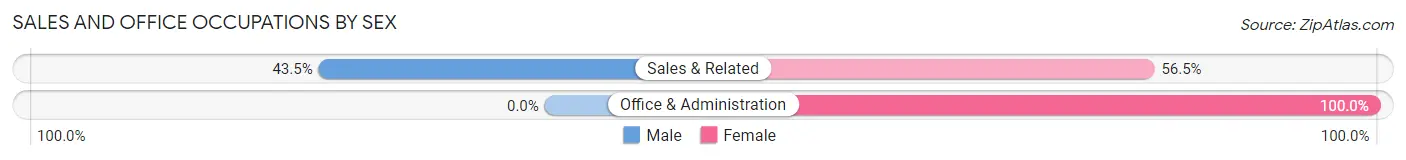
Sales and Office Occupations by Sex
| Occupation | Male | Female |
| Sales & Related | 90 (43.5%) | 117 (56.5%) |
| Office & Administration | 0 (0.0%) | 12 (100.0%) |
| Total (Category) | 90 (41.1%) | 129 (58.9%) |
| Total (Overall) | 585 (55.6%) | 467 (44.4%) |
Natural Resources, Construction and Maintenance Occupations
The most common Natural Resources, Construction and Maintenance occupations in Dover are , and Construction & Extraction (27 | 2.6%).
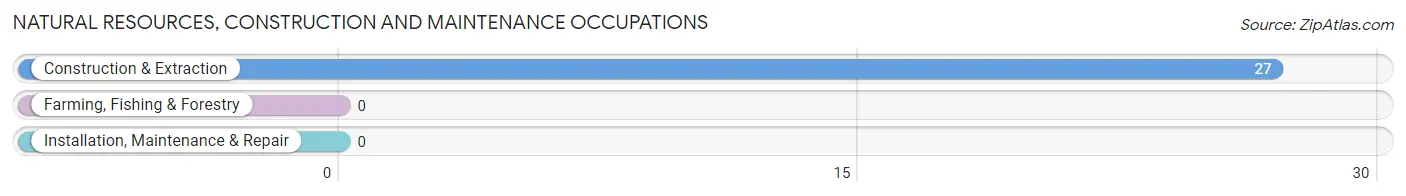
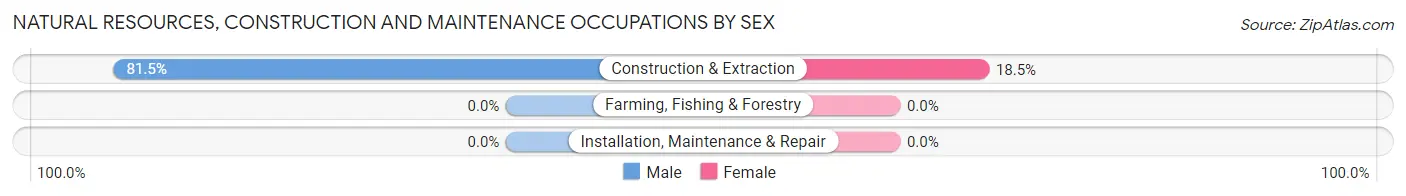
Natural Resources, Construction and Maintenance Occupations by Sex
| Occupation | Male | Female |
| Farming, Fishing & Forestry | 0 (0.0%) | 0 (0.0%) |
| Construction & Extraction | 22 (81.5%) | 5 (18.5%) |
| Installation, Maintenance & Repair | 0 (0.0%) | 0 (0.0%) |
| Total (Category) | 22 (81.5%) | 5 (18.5%) |
| Total (Overall) | 585 (55.6%) | 467 (44.4%) |
Production, Transportation and Moving Occupations
The most common Production, Transportation and Moving occupations in Dover are , and Production (8 | 0.8%).
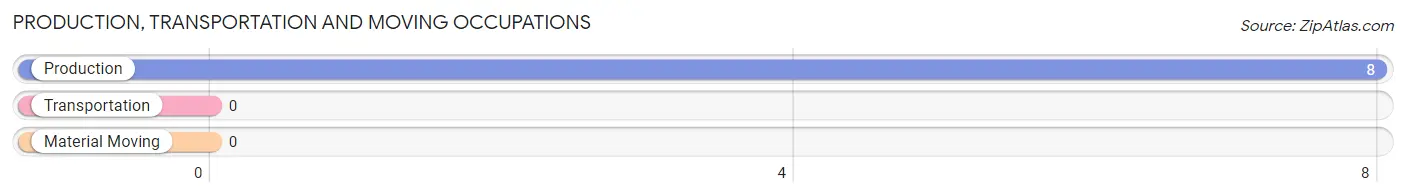
Production, Transportation and Moving Occupations by Sex
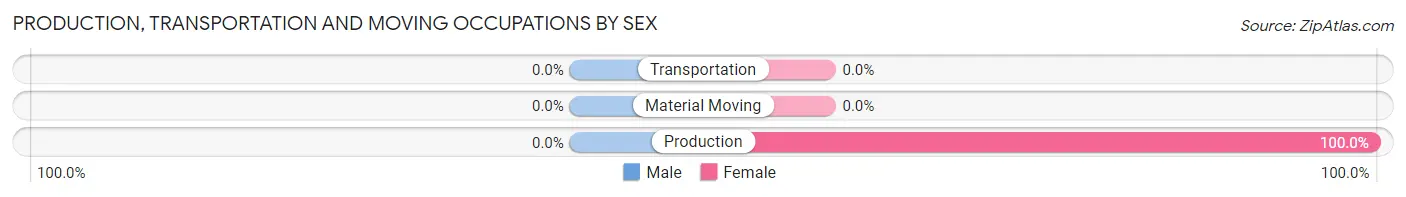
| Occupation | Male | Female |
| Production | 0 (0.0%) | 8 (100.0%) |
| Transportation | 0 (0.0%) | 0 (0.0%) |
| Material Moving | 0 (0.0%) | 0 (0.0%) |
| Total (Category) | 0 (0.0%) | 8 (100.0%) |
| Total (Overall) | 585 (55.6%) | 467 (44.4%) |
Employment Industries by Sex in Dover
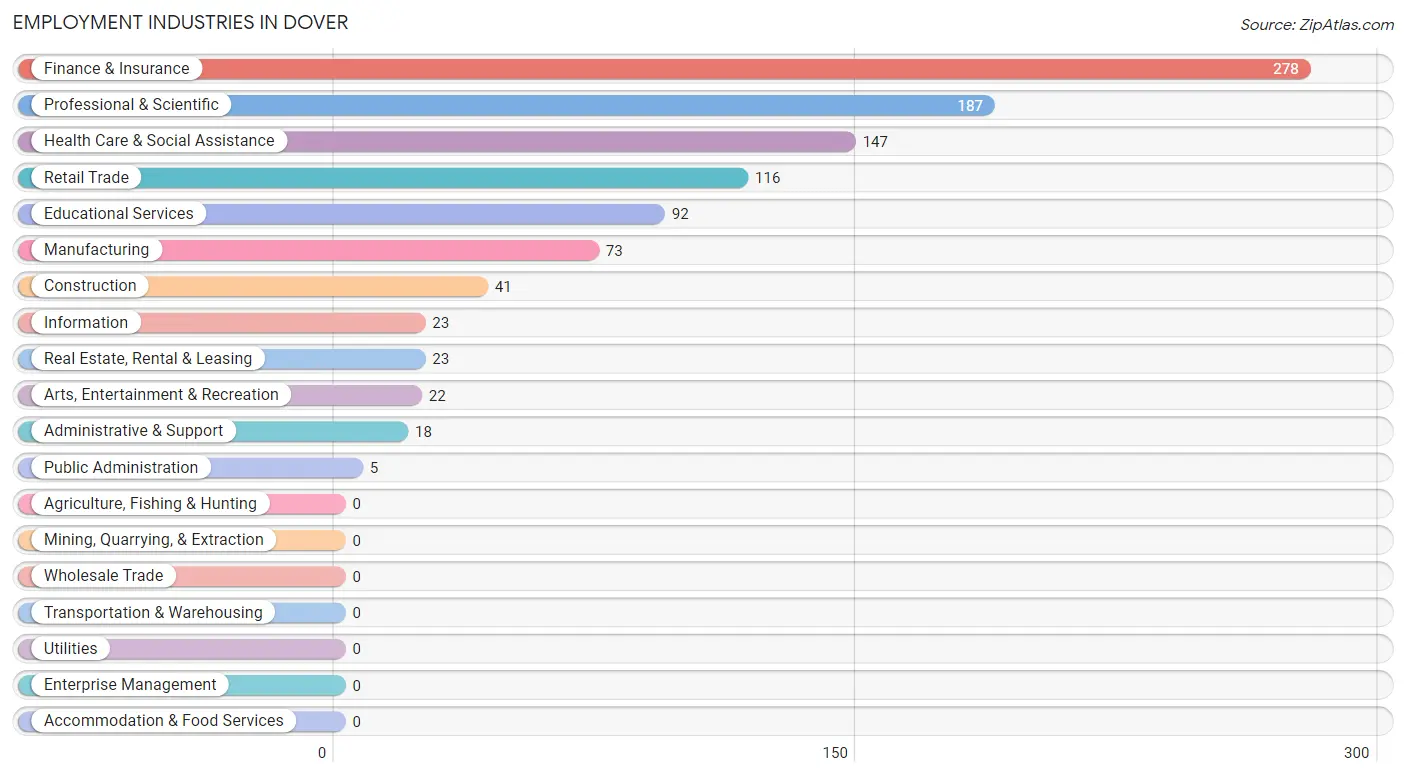
Employment Industries in Dover
The major employment industries in Dover include Finance & Insurance (278 | 26.4%), Professional & Scientific (187 | 17.8%), Health Care & Social Assistance (147 | 14.0%), Retail Trade (116 | 11.0%), and Educational Services (92 | 8.7%).
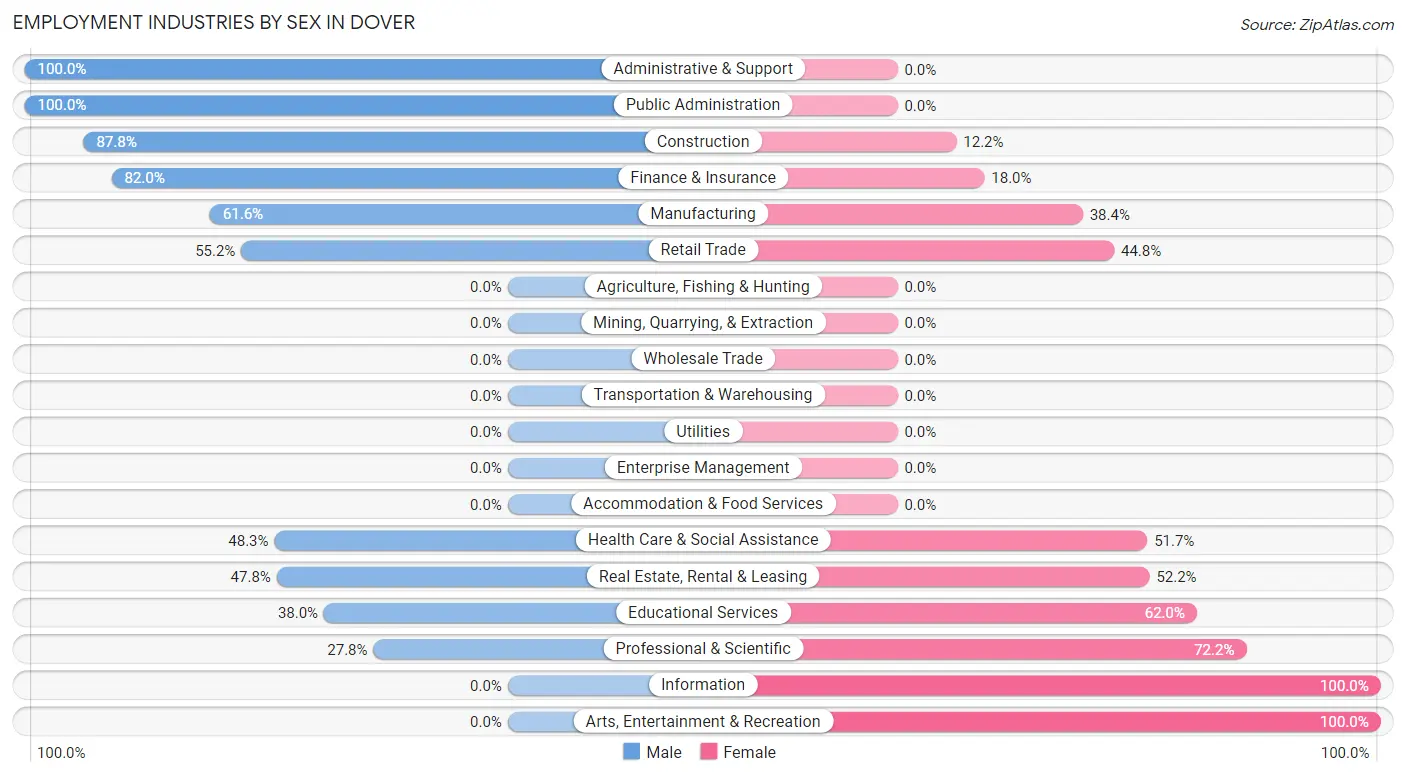
Employment Industries by Sex in Dover
The Dover industries that see more men than women are Administrative & Support (100.0%), Public Administration (100.0%), and Construction (87.8%), whereas the industries that tend to have a higher number of women are Information (100.0%), Arts, Entertainment & Recreation (100.0%), and Professional & Scientific (72.2%).
| Industry | Male | Female |
| Agriculture, Fishing & Hunting | 0 (0.0%) | 0 (0.0%) |
| Mining, Quarrying, & Extraction | 0 (0.0%) | 0 (0.0%) |
| Construction | 36 (87.8%) | 5 (12.2%) |
| Manufacturing | 45 (61.6%) | 28 (38.4%) |
| Wholesale Trade | 0 (0.0%) | 0 (0.0%) |
| Retail Trade | 64 (55.2%) | 52 (44.8%) |
| Transportation & Warehousing | 0 (0.0%) | 0 (0.0%) |
| Utilities | 0 (0.0%) | 0 (0.0%) |
| Information | 0 (0.0%) | 23 (100.0%) |
| Finance & Insurance | 228 (82.0%) | 50 (18.0%) |
| Real Estate, Rental & Leasing | 11 (47.8%) | 12 (52.2%) |
| Professional & Scientific | 52 (27.8%) | 135 (72.2%) |
| Enterprise Management | 0 (0.0%) | 0 (0.0%) |
| Administrative & Support | 18 (100.0%) | 0 (0.0%) |
| Educational Services | 35 (38.0%) | 57 (62.0%) |
| Health Care & Social Assistance | 71 (48.3%) | 76 (51.7%) |
| Arts, Entertainment & Recreation | 0 (0.0%) | 22 (100.0%) |
| Accommodation & Food Services | 0 (0.0%) | 0 (0.0%) |
| Public Administration | 5 (100.0%) | 0 (0.0%) |
| Total | 585 (55.6%) | 467 (44.4%) |
Education in Dover
School Enrollment in Dover
The most common levels of schooling among the 777 students in Dover are middle school (291 | 37.4%), high school (159 | 20.5%), and college / undergraduate (122 | 15.7%).
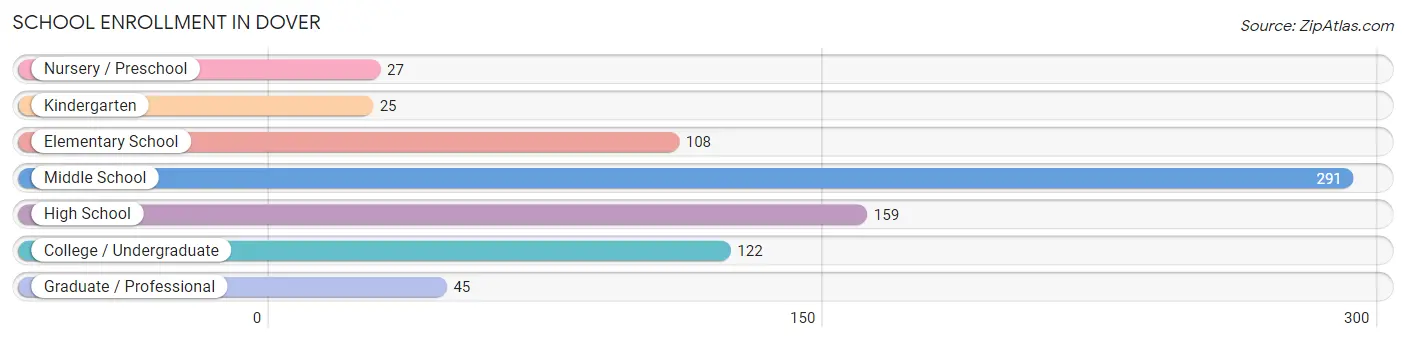
| School Level | # Students | % Students |
| Nursery / Preschool | 27 | 3.5% |
| Kindergarten | 25 | 3.2% |
| Elementary School | 108 | 13.9% |
| Middle School | 291 | 37.4% |
| High School | 159 | 20.5% |
| College / Undergraduate | 122 | 15.7% |
| Graduate / Professional | 45 | 5.8% |
| Total | 777 | 100.0% |
School Enrollment by Age by Funding Source in Dover
Out of a total of 777 students who are enrolled in schools in Dover, 250 (32.2%) attend a private institution, while the remaining 527 (67.8%) are enrolled in public schools. The age group of 3 to 4 year olds has the highest likelihood of being enrolled in private schools, with 5 (100.0% in the age bracket) enrolled. Conversely, the age group of 10 to 14 year olds has the lowest likelihood of being enrolled in a private school, with 259 (87.2% in the age bracket) attending a public institution.
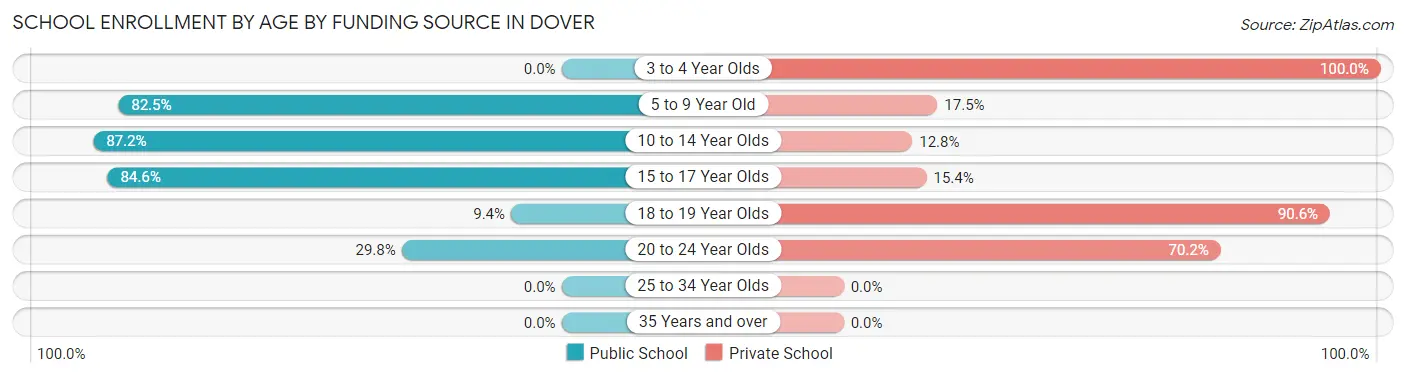
| Age Bracket | Public School | Private School |
| 3 to 4 Year Olds | 0 (0.0%) | 5 (100.0%) |
| 5 to 9 Year Old | 104 (82.5%) | 22 (17.5%) |
| 10 to 14 Year Olds | 259 (87.2%) | 38 (12.8%) |
| 15 to 17 Year Olds | 126 (84.6%) | 23 (15.4%) |
| 18 to 19 Year Olds | 10 (9.4%) | 96 (90.6%) |
| 20 to 24 Year Olds | 28 (29.8%) | 66 (70.2%) |
| 25 to 34 Year Olds | 0 (0.0%) | 0 (0.0%) |
| 35 Years and over | 0 (0.0%) | 0 (0.0%) |
| Total | 527 (67.8%) | 250 (32.2%) |
Educational Attainment by Field of Study in Dover
Social sciences (274 | 18.3%), business (261 | 17.4%), literature & languages (164 | 10.9%), bio, nature & agricultural (128 | 8.5%), and physical & health sciences (104 | 6.9%) are the most common fields of study among 1,499 individuals in Dover who have obtained a bachelor's degree or higher.
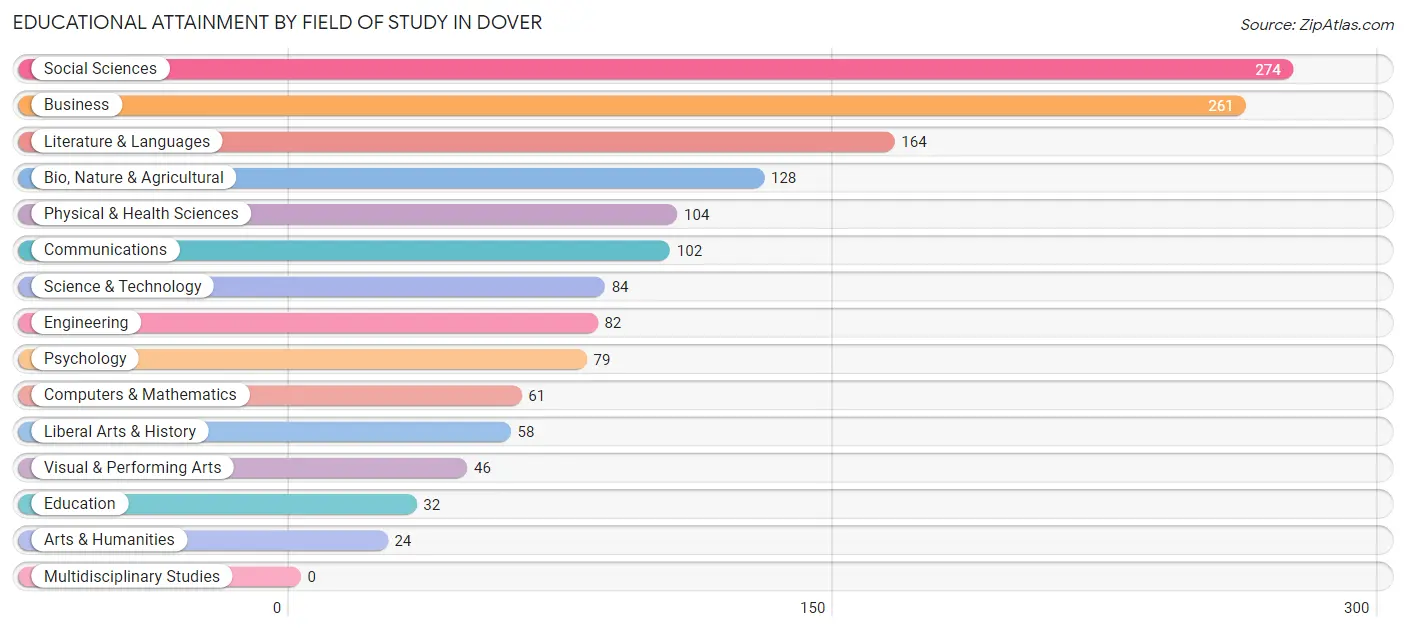
| Field of Study | # Graduates | % Graduates |
| Computers & Mathematics | 61 | 4.1% |
| Bio, Nature & Agricultural | 128 | 8.5% |
| Physical & Health Sciences | 104 | 6.9% |
| Psychology | 79 | 5.3% |
| Social Sciences | 274 | 18.3% |
| Engineering | 82 | 5.5% |
| Multidisciplinary Studies | 0 | 0.0% |
| Science & Technology | 84 | 5.6% |
| Business | 261 | 17.4% |
| Education | 32 | 2.1% |
| Literature & Languages | 164 | 10.9% |
| Liberal Arts & History | 58 | 3.9% |
| Visual & Performing Arts | 46 | 3.1% |
| Communications | 102 | 6.8% |
| Arts & Humanities | 24 | 1.6% |
| Total | 1,499 | 100.0% |
Transportation & Commute in Dover
Vehicle Availability by Sex in Dover
The most prevalent vehicle ownership categories in Dover are males with 2 vehicles (245, accounting for 41.9%) and females with 2 vehicles (204, making up 54.2%).
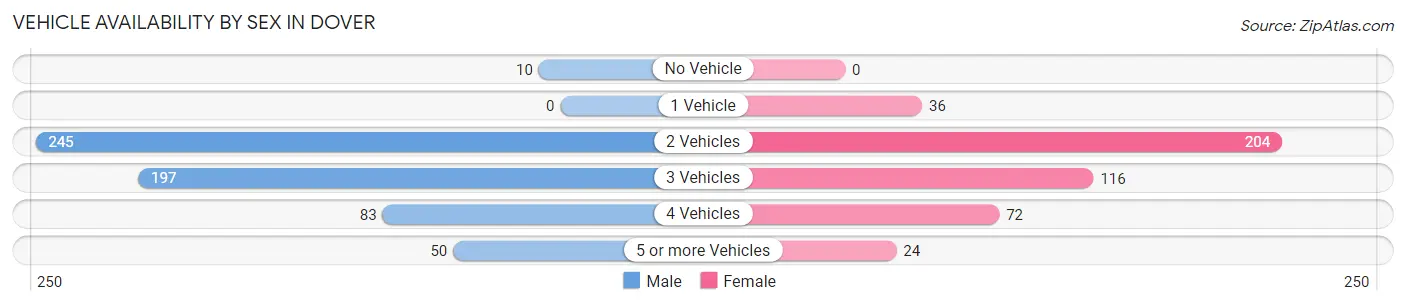
| Vehicles Available | Male | Female |
| No Vehicle | 10 (1.7%) | 0 (0.0%) |
| 1 Vehicle | 0 (0.0%) | 36 (8.0%) |
| 2 Vehicles | 245 (41.9%) | 204 (45.1%) |
| 3 Vehicles | 197 (33.7%) | 116 (25.7%) |
| 4 Vehicles | 83 (14.2%) | 72 (15.9%) |
| 5 or more Vehicles | 50 (8.6%) | 24 (5.3%) |
| Total | 585 (100.0%) | 452 (100.0%) |
Commute Time in Dover
The most frequently occuring commute durations in Dover are 40 to 44 minutes (119 commuters, 17.0%), 45 to 59 minutes (114 commuters, 16.3%), and 60 to 89 minutes (106 commuters, 15.1%).
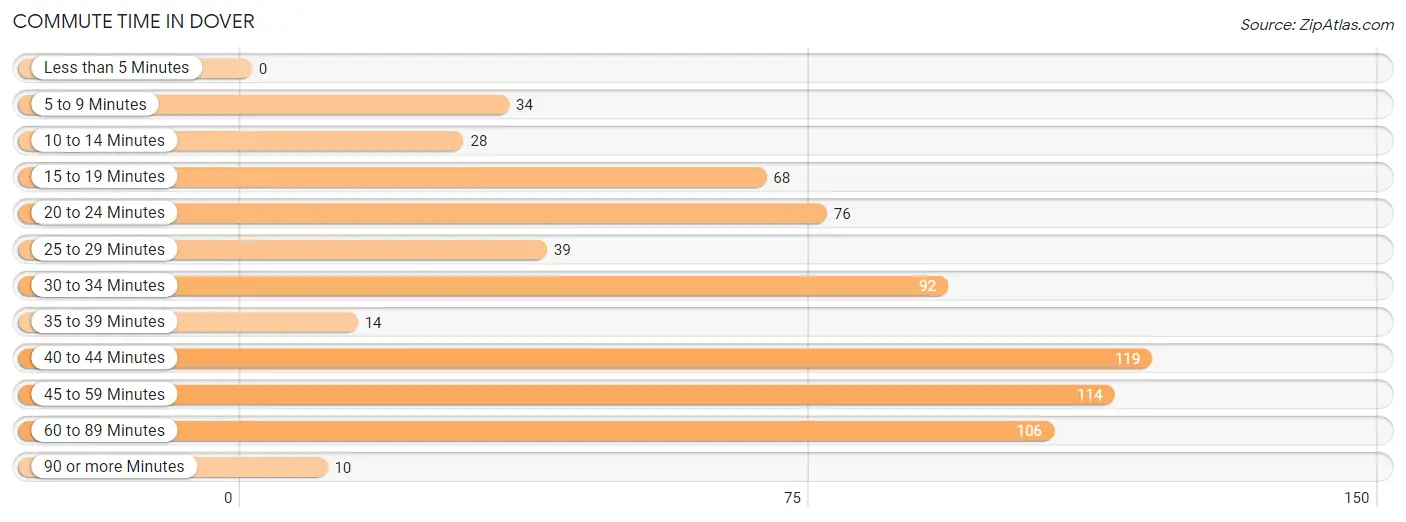
| Commute Time | # Commuters | % Commuters |
| Less than 5 Minutes | 0 | 0.0% |
| 5 to 9 Minutes | 34 | 4.9% |
| 10 to 14 Minutes | 28 | 4.0% |
| 15 to 19 Minutes | 68 | 9.7% |
| 20 to 24 Minutes | 76 | 10.9% |
| 25 to 29 Minutes | 39 | 5.6% |
| 30 to 34 Minutes | 92 | 13.1% |
| 35 to 39 Minutes | 14 | 2.0% |
| 40 to 44 Minutes | 119 | 17.0% |
| 45 to 59 Minutes | 114 | 16.3% |
| 60 to 89 Minutes | 106 | 15.1% |
| 90 or more Minutes | 10 | 1.4% |
Commute Time by Sex in Dover
The most common commute times in Dover are 40 to 44 minutes (119 commuters, 30.0%) for males and 60 to 89 minutes (63 commuters, 20.8%) for females.
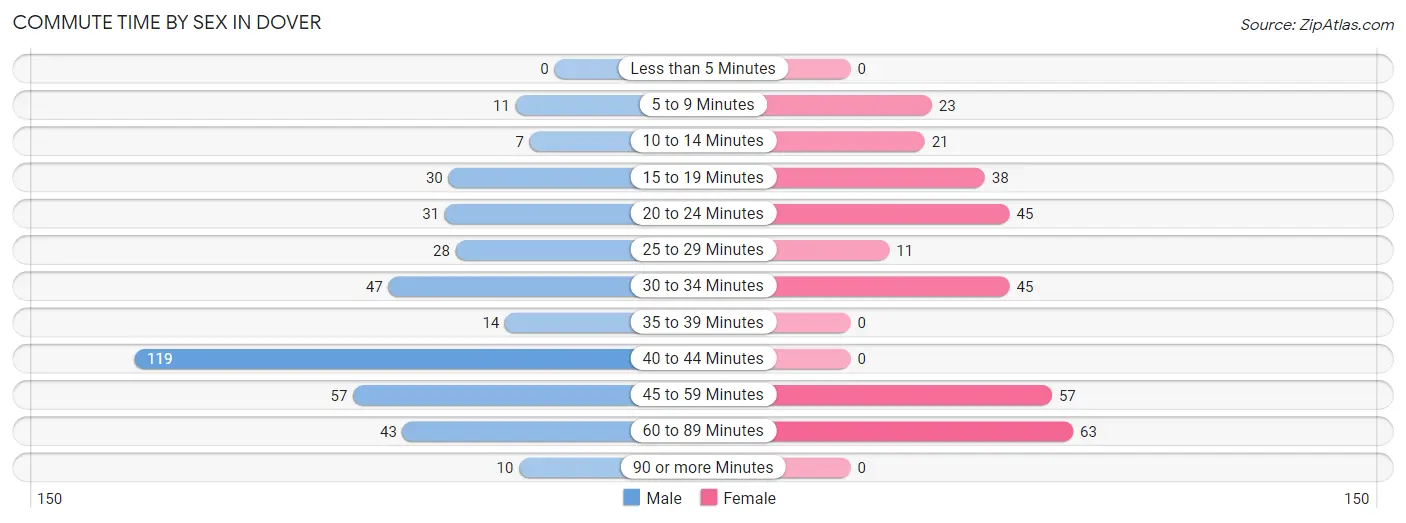
| Commute Time | Male | Female |
| Less than 5 Minutes | 0 (0.0%) | 0 (0.0%) |
| 5 to 9 Minutes | 11 (2.8%) | 23 (7.6%) |
| 10 to 14 Minutes | 7 (1.8%) | 21 (6.9%) |
| 15 to 19 Minutes | 30 (7.6%) | 38 (12.5%) |
| 20 to 24 Minutes | 31 (7.8%) | 45 (14.8%) |
| 25 to 29 Minutes | 28 (7.0%) | 11 (3.6%) |
| 30 to 34 Minutes | 47 (11.8%) | 45 (14.8%) |
| 35 to 39 Minutes | 14 (3.5%) | 0 (0.0%) |
| 40 to 44 Minutes | 119 (30.0%) | 0 (0.0%) |
| 45 to 59 Minutes | 57 (14.4%) | 57 (18.8%) |
| 60 to 89 Minutes | 43 (10.8%) | 63 (20.8%) |
| 90 or more Minutes | 10 (2.5%) | 0 (0.0%) |
Time of Departure to Work by Sex in Dover
The most frequent times of departure to work in Dover are 7:30 AM to 7:59 AM (81, 20.4%) for males and 7:30 AM to 7:59 AM (91, 30.0%) for females.
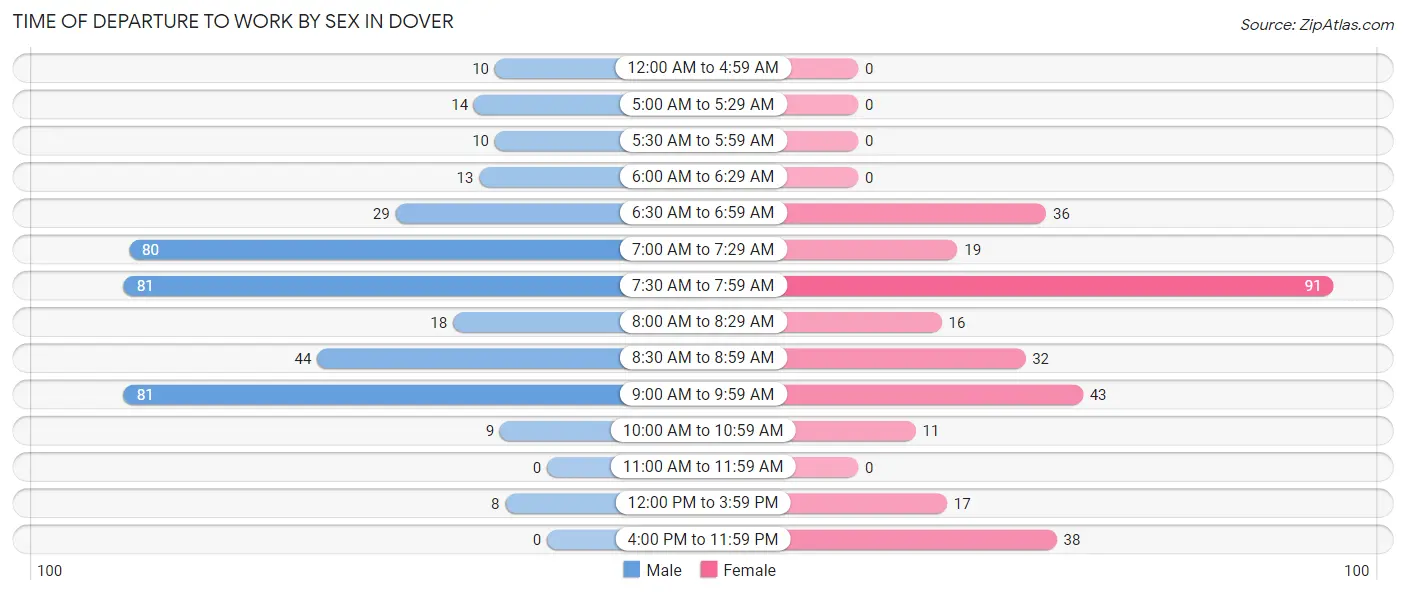
| Time of Departure | Male | Female |
| 12:00 AM to 4:59 AM | 10 (2.5%) | 0 (0.0%) |
| 5:00 AM to 5:29 AM | 14 (3.5%) | 0 (0.0%) |
| 5:30 AM to 5:59 AM | 10 (2.5%) | 0 (0.0%) |
| 6:00 AM to 6:29 AM | 13 (3.3%) | 0 (0.0%) |
| 6:30 AM to 6:59 AM | 29 (7.3%) | 36 (11.9%) |
| 7:00 AM to 7:29 AM | 80 (20.2%) | 19 (6.3%) |
| 7:30 AM to 7:59 AM | 81 (20.4%) | 91 (30.0%) |
| 8:00 AM to 8:29 AM | 18 (4.5%) | 16 (5.3%) |
| 8:30 AM to 8:59 AM | 44 (11.1%) | 32 (10.6%) |
| 9:00 AM to 9:59 AM | 81 (20.4%) | 43 (14.2%) |
| 10:00 AM to 10:59 AM | 9 (2.3%) | 11 (3.6%) |
| 11:00 AM to 11:59 AM | 0 (0.0%) | 0 (0.0%) |
| 12:00 PM to 3:59 PM | 8 (2.0%) | 17 (5.6%) |
| 4:00 PM to 11:59 PM | 0 (0.0%) | 38 (12.5%) |
| Total | 397 (100.0%) | 303 (100.0%) |
Housing Occupancy in Dover
Occupancy by Ownership in Dover
Of the total 781 dwellings in Dover, owner-occupied units account for 743 (95.1%), while renter-occupied units make up 38 (4.9%).
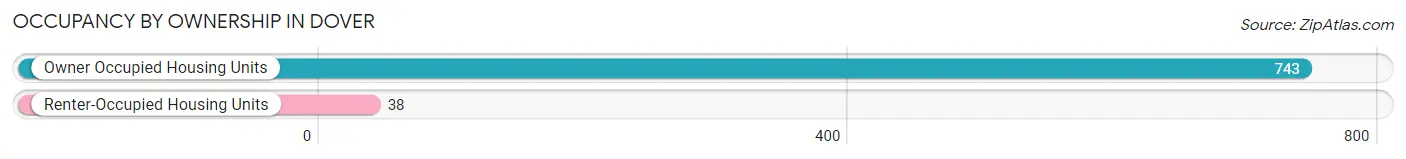
| Occupancy | # Housing Units | % Housing Units |
| Owner Occupied Housing Units | 743 | 95.1% |
| Renter-Occupied Housing Units | 38 | 4.9% |
| Total Occupied Housing Units | 781 | 100.0% |
Occupancy by Household Size in Dover
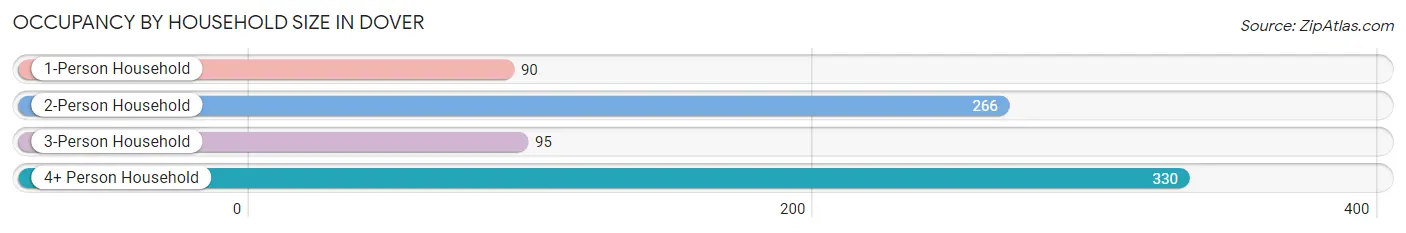
| Household Size | # Housing Units | % Housing Units |
| 1-Person Household | 90 | 11.5% |
| 2-Person Household | 266 | 34.1% |
| 3-Person Household | 95 | 12.2% |
| 4+ Person Household | 330 | 42.2% |
| Total Housing Units | 781 | 100.0% |
Occupancy by Ownership by Household Size in Dover
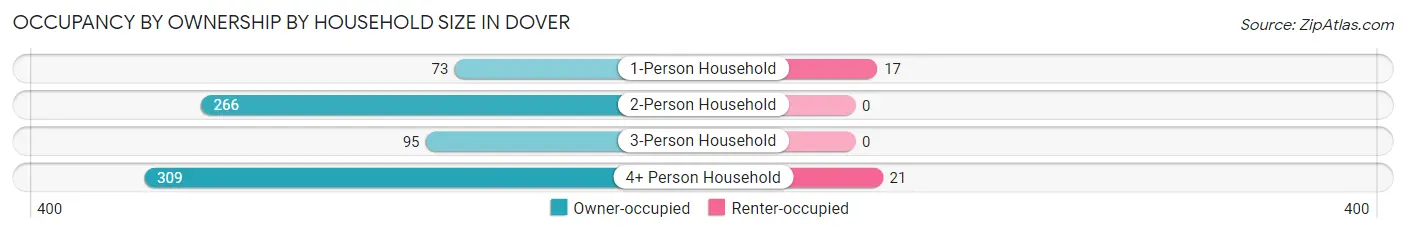
| Household Size | Owner-occupied | Renter-occupied |
| 1-Person Household | 73 (81.1%) | 17 (18.9%) |
| 2-Person Household | 266 (100.0%) | 0 (0.0%) |
| 3-Person Household | 95 (100.0%) | 0 (0.0%) |
| 4+ Person Household | 309 (93.6%) | 21 (6.4%) |
| Total Housing Units | 743 (95.1%) | 38 (4.9%) |
Occupancy by Educational Attainment in Dover
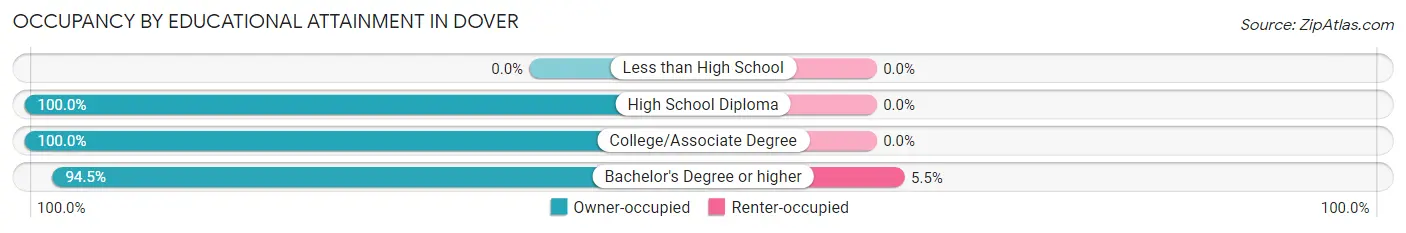
| Household Size | Owner-occupied | Renter-occupied |
| Less than High School | 0 (0.0%) | 0 (0.0%) |
| High School Diploma | 10 (100.0%) | 0 (0.0%) |
| College/Associate Degree | 85 (100.0%) | 0 (0.0%) |
| Bachelor's Degree or higher | 648 (94.5%) | 38 (5.5%) |
Occupancy by Age of Householder in Dover
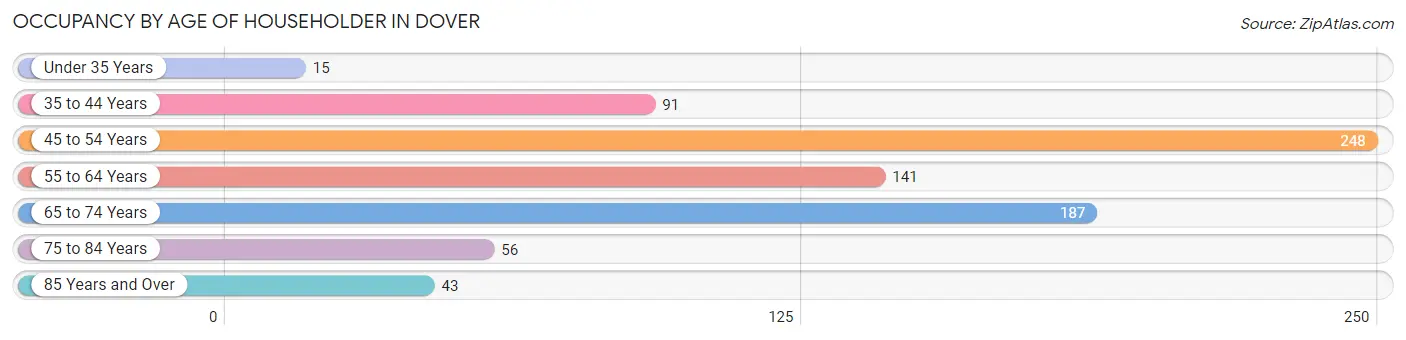
| Age Bracket | # Households | % Households |
| Under 35 Years | 15 | 1.9% |
| 35 to 44 Years | 91 | 11.7% |
| 45 to 54 Years | 248 | 31.8% |
| 55 to 64 Years | 141 | 18.0% |
| 65 to 74 Years | 187 | 23.9% |
| 75 to 84 Years | 56 | 7.2% |
| 85 Years and Over | 43 | 5.5% |
| Total | 781 | 100.0% |
Housing Finances in Dover
Median Income by Occupancy in Dover
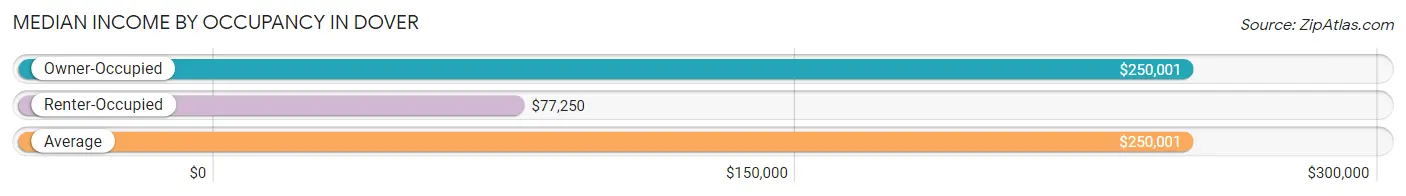
| Occupancy Type | # Households | Median Income |
| Owner-Occupied | 743 (95.1%) | $250,001 |
| Renter-Occupied | 38 (4.9%) | $77,250 |
| Average | 781 (100.0%) | $250,001 |
Occupancy by Householder Income Bracket in Dover
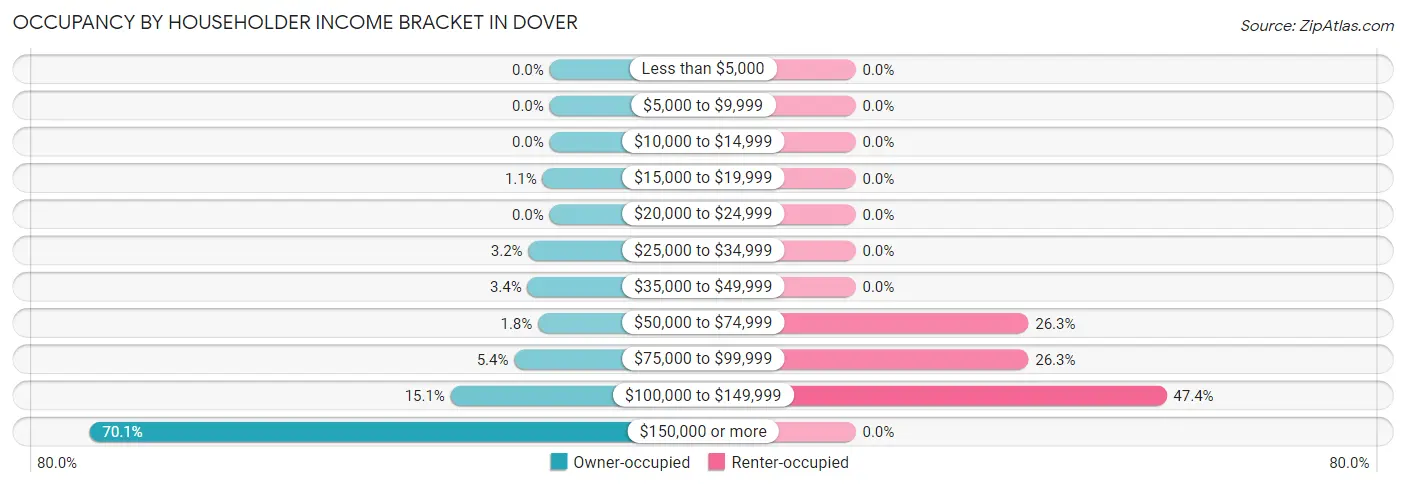
| Income Bracket | Owner-occupied | Renter-occupied |
| Less than $5,000 | 0 (0.0%) | 0 (0.0%) |
| $5,000 to $9,999 | 0 (0.0%) | 0 (0.0%) |
| $10,000 to $14,999 | 0 (0.0%) | 0 (0.0%) |
| $15,000 to $19,999 | 8 (1.1%) | 0 (0.0%) |
| $20,000 to $24,999 | 0 (0.0%) | 0 (0.0%) |
| $25,000 to $34,999 | 24 (3.2%) | 0 (0.0%) |
| $35,000 to $49,999 | 25 (3.4%) | 0 (0.0%) |
| $50,000 to $74,999 | 13 (1.8%) | 10 (26.3%) |
| $75,000 to $99,999 | 40 (5.4%) | 10 (26.3%) |
| $100,000 to $149,999 | 112 (15.1%) | 18 (47.4%) |
| $150,000 or more | 521 (70.1%) | 0 (0.0%) |
| Total | 743 (100.0%) | 38 (100.0%) |
Monthly Housing Cost Tiers in Dover
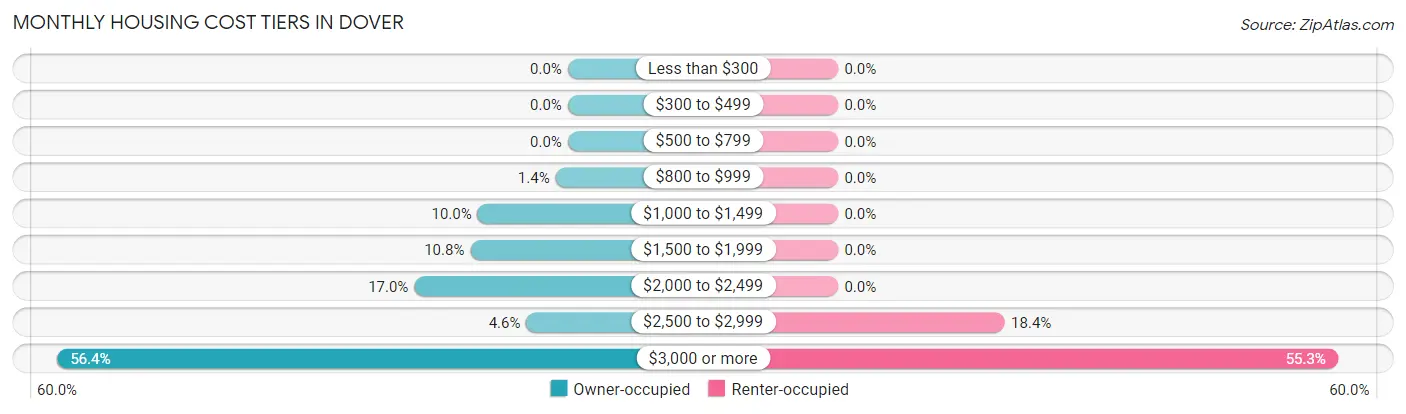
| Monthly Cost | Owner-occupied | Renter-occupied |
| Less than $300 | 0 (0.0%) | 0 (0.0%) |
| $300 to $499 | 0 (0.0%) | 0 (0.0%) |
| $500 to $799 | 0 (0.0%) | 0 (0.0%) |
| $800 to $999 | 10 (1.3%) | 0 (0.0%) |
| $1,000 to $1,499 | 74 (10.0%) | 0 (0.0%) |
| $1,500 to $1,999 | 80 (10.8%) | 0 (0.0%) |
| $2,000 to $2,499 | 126 (17.0%) | 0 (0.0%) |
| $2,500 to $2,999 | 34 (4.6%) | 7 (18.4%) |
| $3,000 or more | 419 (56.4%) | 21 (55.3%) |
| Total | 743 (100.0%) | 38 (100.0%) |
Physical Housing Characteristics in Dover
Housing Structures in Dover
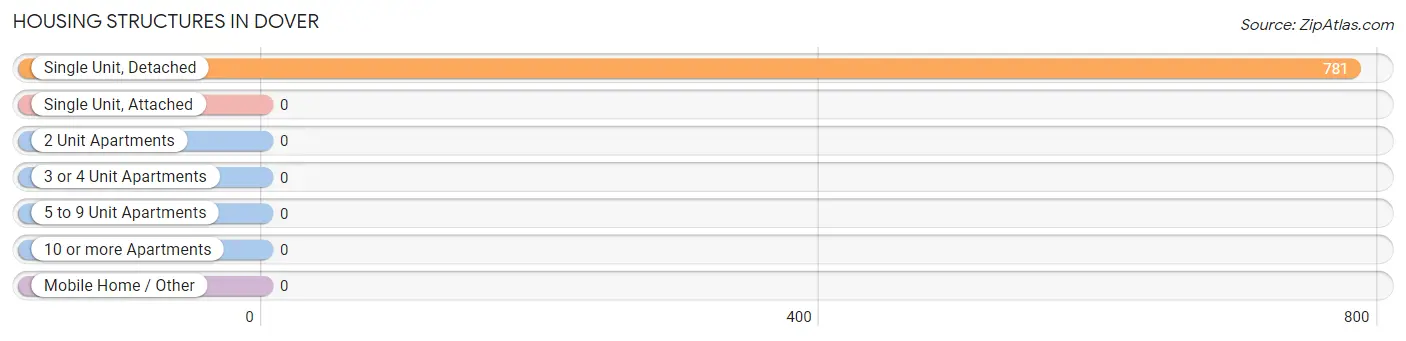
| Structure Type | # Housing Units | % Housing Units |
| Single Unit, Detached | 781 | 100.0% |
| Single Unit, Attached | 0 | 0.0% |
| 2 Unit Apartments | 0 | 0.0% |
| 3 or 4 Unit Apartments | 0 | 0.0% |
| 5 to 9 Unit Apartments | 0 | 0.0% |
| 10 or more Apartments | 0 | 0.0% |
| Mobile Home / Other | 0 | 0.0% |
| Total | 781 | 100.0% |
Housing Structures by Occupancy in Dover
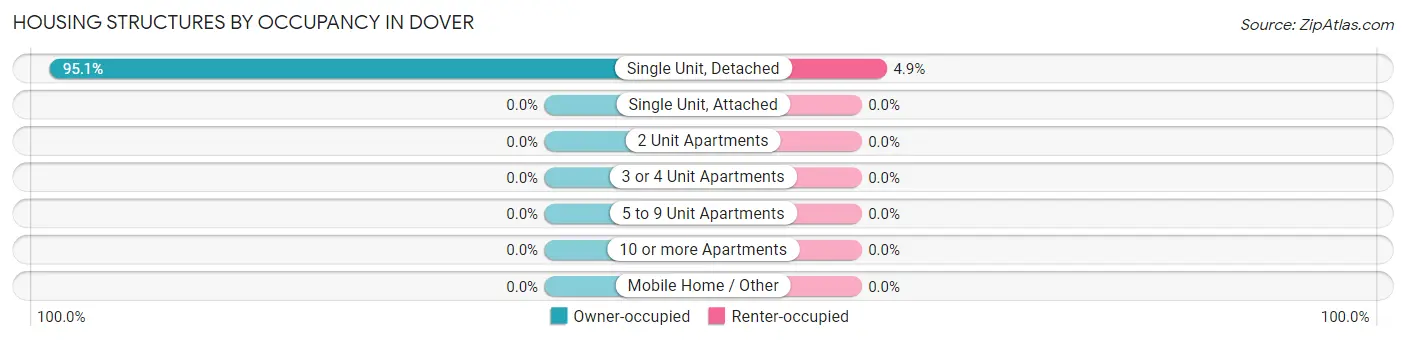
| Structure Type | Owner-occupied | Renter-occupied |
| Single Unit, Detached | 743 (95.1%) | 38 (4.9%) |
| Single Unit, Attached | 0 (0.0%) | 0 (0.0%) |
| 2 Unit Apartments | 0 (0.0%) | 0 (0.0%) |
| 3 or 4 Unit Apartments | 0 (0.0%) | 0 (0.0%) |
| 5 to 9 Unit Apartments | 0 (0.0%) | 0 (0.0%) |
| 10 or more Apartments | 0 (0.0%) | 0 (0.0%) |
| Mobile Home / Other | 0 (0.0%) | 0 (0.0%) |
| Total | 743 (95.1%) | 38 (4.9%) |
Housing Structures by Number of Rooms in Dover
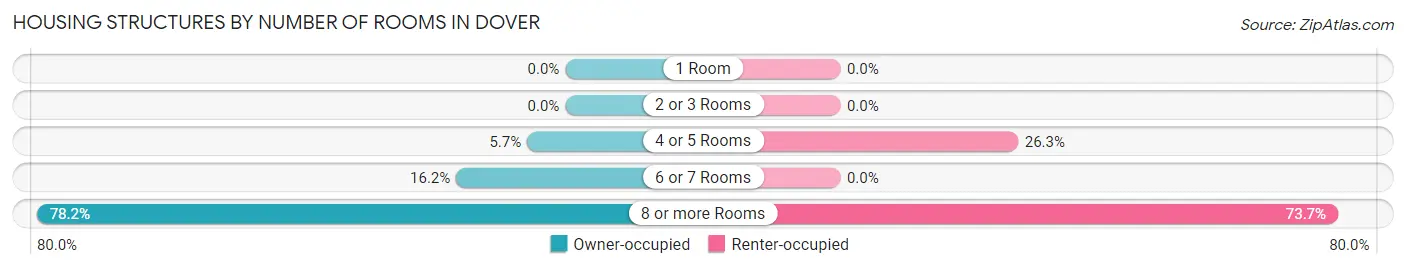
| Number of Rooms | Owner-occupied | Renter-occupied |
| 1 Room | 0 (0.0%) | 0 (0.0%) |
| 2 or 3 Rooms | 0 (0.0%) | 0 (0.0%) |
| 4 or 5 Rooms | 42 (5.7%) | 10 (26.3%) |
| 6 or 7 Rooms | 120 (16.2%) | 0 (0.0%) |
| 8 or more Rooms | 581 (78.2%) | 28 (73.7%) |
| Total | 743 (100.0%) | 38 (100.0%) |
Housing Structure by Heating Type in Dover
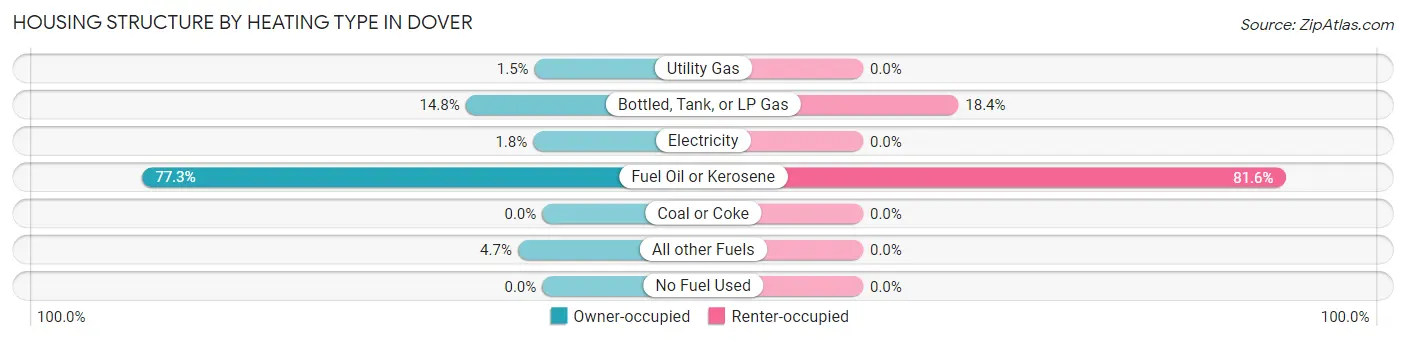
| Heating Type | Owner-occupied | Renter-occupied |
| Utility Gas | 11 (1.5%) | 0 (0.0%) |
| Bottled, Tank, or LP Gas | 110 (14.8%) | 7 (18.4%) |
| Electricity | 13 (1.8%) | 0 (0.0%) |
| Fuel Oil or Kerosene | 574 (77.2%) | 31 (81.6%) |
| Coal or Coke | 0 (0.0%) | 0 (0.0%) |
| All other Fuels | 35 (4.7%) | 0 (0.0%) |
| No Fuel Used | 0 (0.0%) | 0 (0.0%) |
| Total | 743 (100.0%) | 38 (100.0%) |
Household Vehicle Usage in Dover
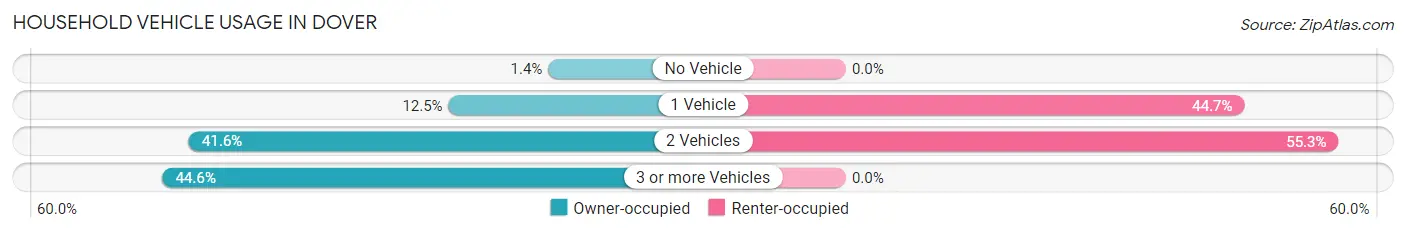
| Vehicles per Household | Owner-occupied | Renter-occupied |
| No Vehicle | 10 (1.3%) | 0 (0.0%) |
| 1 Vehicle | 93 (12.5%) | 17 (44.7%) |
| 2 Vehicles | 309 (41.6%) | 21 (55.3%) |
| 3 or more Vehicles | 331 (44.6%) | 0 (0.0%) |
| Total | 743 (100.0%) | 38 (100.0%) |
Real Estate & Mortgages in Dover
Real Estate and Mortgage Overview in Dover
| Characteristic | Without Mortgage | With Mortgage |
| Housing Units | 264 | 479 |
| Median Property Value | $1,110,500 | $1,248,600 |
| Median Household Income | $245,064 | $370 |
| Monthly Housing Costs | $1,501 | $386 |
| Real Estate Taxes | $10,001 | $0 |
Property Value by Mortgage Status in Dover
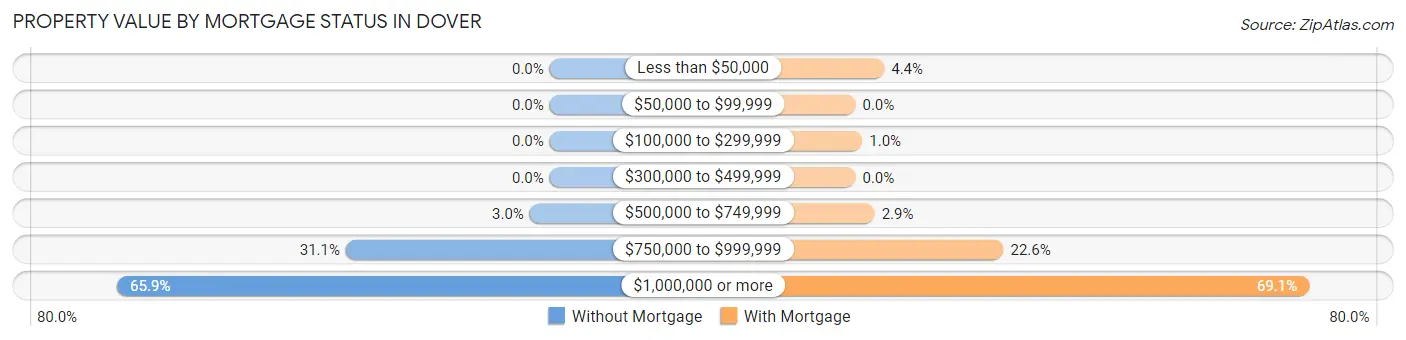
| Property Value | Without Mortgage | With Mortgage |
| Less than $50,000 | 0 (0.0%) | 21 (4.4%) |
| $50,000 to $99,999 | 0 (0.0%) | 0 (0.0%) |
| $100,000 to $299,999 | 0 (0.0%) | 5 (1.0%) |
| $300,000 to $499,999 | 0 (0.0%) | 0 (0.0%) |
| $500,000 to $749,999 | 8 (3.0%) | 14 (2.9%) |
| $750,000 to $999,999 | 82 (31.1%) | 108 (22.6%) |
| $1,000,000 or more | 174 (65.9%) | 331 (69.1%) |
| Total | 264 (100.0%) | 479 (100.0%) |
Household Income by Mortgage Status in Dover
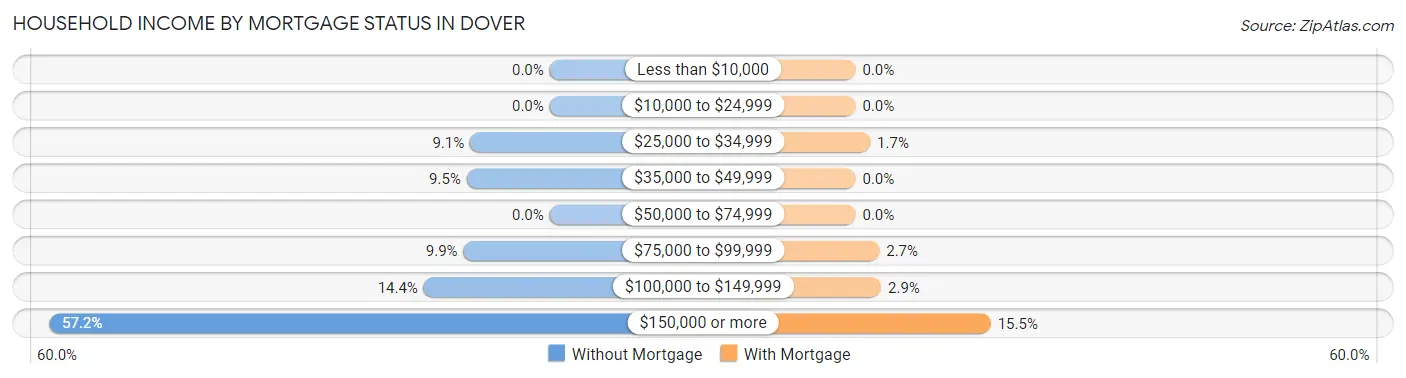
| Household Income | Without Mortgage | With Mortgage |
| Less than $10,000 | 0 (0.0%) | 0 (0.0%) |
| $10,000 to $24,999 | 0 (0.0%) | 0 (0.0%) |
| $25,000 to $34,999 | 24 (9.1%) | 8 (1.7%) |
| $35,000 to $49,999 | 25 (9.5%) | 0 (0.0%) |
| $50,000 to $74,999 | 0 (0.0%) | 0 (0.0%) |
| $75,000 to $99,999 | 26 (9.9%) | 13 (2.7%) |
| $100,000 to $149,999 | 38 (14.4%) | 14 (2.9%) |
| $150,000 or more | 151 (57.2%) | 74 (15.4%) |
| Total | 264 (100.0%) | 479 (100.0%) |
Property Value to Household Income Ratio in Dover
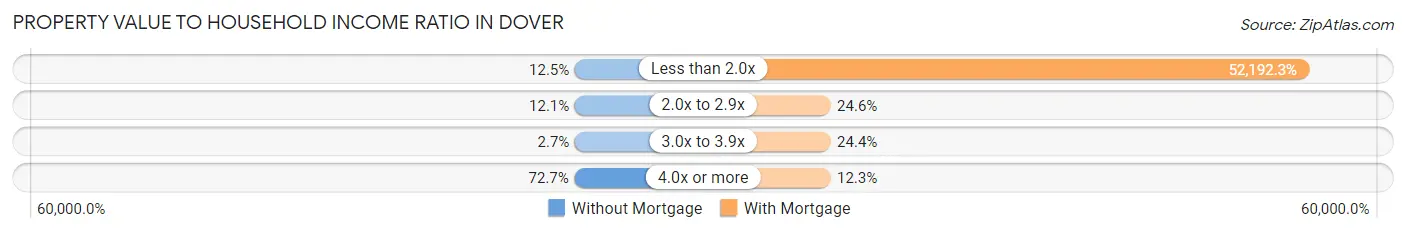
| Value-to-Income Ratio | Without Mortgage | With Mortgage |
| Less than 2.0x | 33 (12.5%) | 250,001 (52,192.3%) |
| 2.0x to 2.9x | 32 (12.1%) | 118 (24.6%) |
| 3.0x to 3.9x | 7 (2.6%) | 117 (24.4%) |
| 4.0x or more | 192 (72.7%) | 59 (12.3%) |
| Total | 264 (100.0%) | 479 (100.0%) |
Real Estate Taxes by Mortgage Status in Dover
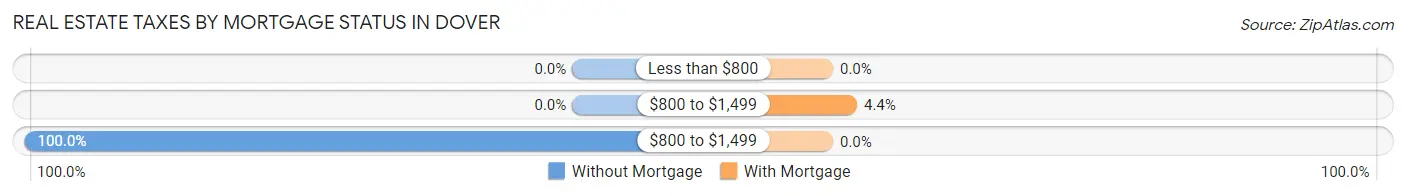
| Property Taxes | Without Mortgage | With Mortgage |
| Less than $800 | 0 (0.0%) | 0 (0.0%) |
| $800 to $1,499 | 0 (0.0%) | 21 (4.4%) |
| $800 to $1,499 | 264 (100.0%) | 0 (0.0%) |
| Total | 264 (100.0%) | 479 (100.0%) |
Health & Disability in Dover
Health Insurance Coverage by Age in Dover
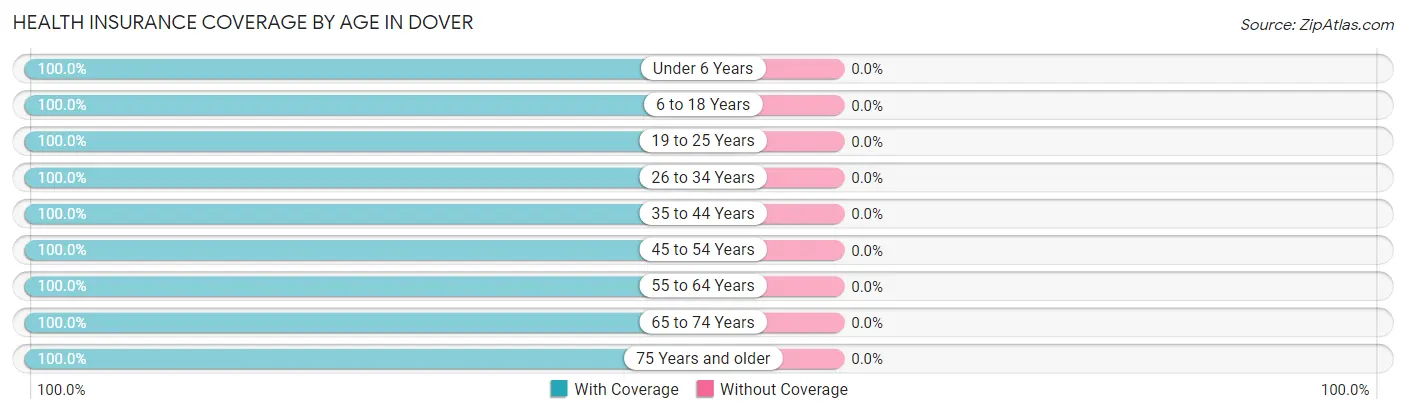
| Age Bracket | With Coverage | Without Coverage |
| Under 6 Years | 107 (100.0%) | 0 (0.0%) |
| 6 to 18 Years | 622 (100.0%) | 0 (0.0%) |
| 19 to 25 Years | 246 (100.0%) | 0 (0.0%) |
| 26 to 34 Years | 80 (100.0%) | 0 (0.0%) |
| 35 to 44 Years | 204 (100.0%) | 0 (0.0%) |
| 45 to 54 Years | 488 (100.0%) | 0 (0.0%) |
| 55 to 64 Years | 262 (100.0%) | 0 (0.0%) |
| 65 to 74 Years | 332 (100.0%) | 0 (0.0%) |
| 75 Years and older | 171 (100.0%) | 0 (0.0%) |
| Total | 2,512 (100.0%) | 0 (0.0%) |
Health Insurance Coverage by Citizenship Status in Dover
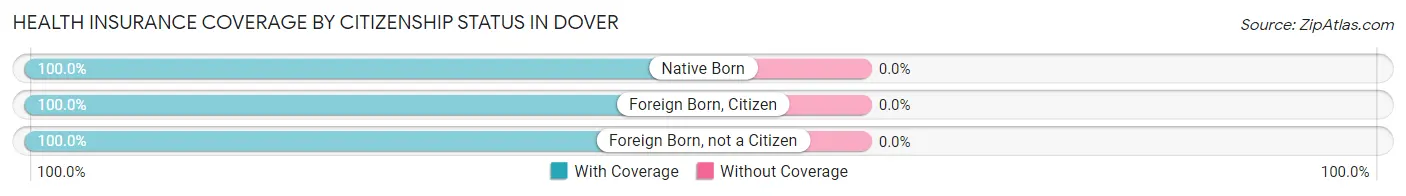
| Citizenship Status | With Coverage | Without Coverage |
| Native Born | 107 (100.0%) | 0 (0.0%) |
| Foreign Born, Citizen | 622 (100.0%) | 0 (0.0%) |
| Foreign Born, not a Citizen | 246 (100.0%) | 0 (0.0%) |
Health Insurance Coverage by Household Income in Dover
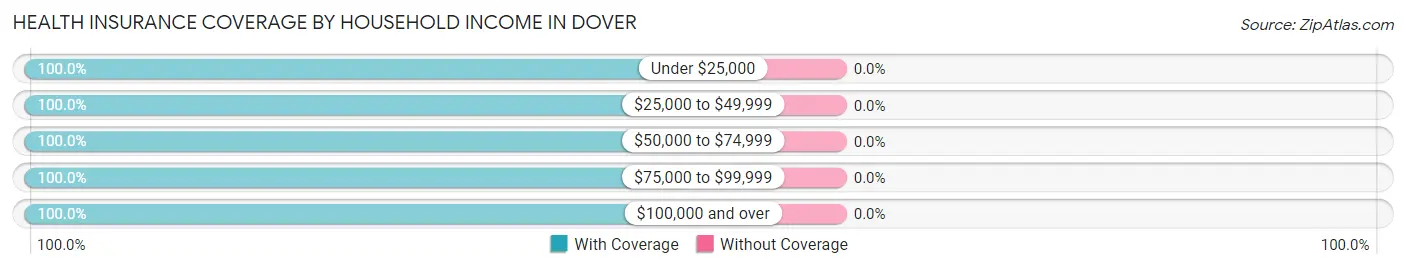
| Household Income | With Coverage | Without Coverage |
| Under $25,000 | 8 (100.0%) | 0 (0.0%) |
| $25,000 to $49,999 | 87 (100.0%) | 0 (0.0%) |
| $50,000 to $74,999 | 38 (100.0%) | 0 (0.0%) |
| $75,000 to $99,999 | 150 (100.0%) | 0 (0.0%) |
| $100,000 and over | 2,229 (100.0%) | 0 (0.0%) |
Public vs Private Health Insurance Coverage by Age in Dover
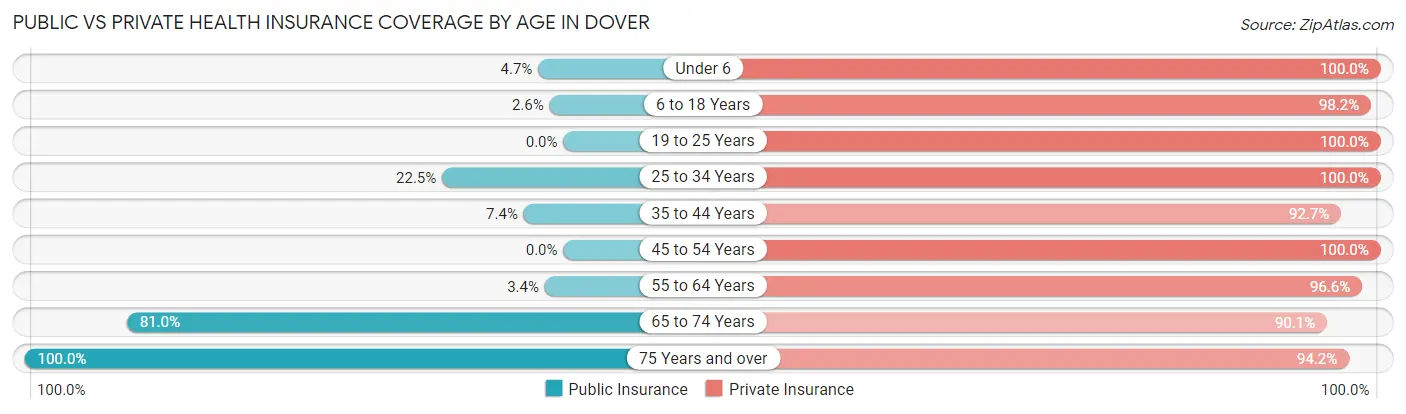
| Age Bracket | Public Insurance | Private Insurance |
| Under 6 | 5 (4.7%) | 107 (100.0%) |
| 6 to 18 Years | 16 (2.6%) | 611 (98.2%) |
| 19 to 25 Years | 0 (0.0%) | 246 (100.0%) |
| 25 to 34 Years | 18 (22.5%) | 80 (100.0%) |
| 35 to 44 Years | 15 (7.3%) | 189 (92.6%) |
| 45 to 54 Years | 0 (0.0%) | 488 (100.0%) |
| 55 to 64 Years | 9 (3.4%) | 253 (96.6%) |
| 65 to 74 Years | 269 (81.0%) | 299 (90.1%) |
| 75 Years and over | 171 (100.0%) | 161 (94.2%) |
| Total | 503 (20.0%) | 2,434 (96.9%) |
Disability Status by Sex by Age in Dover
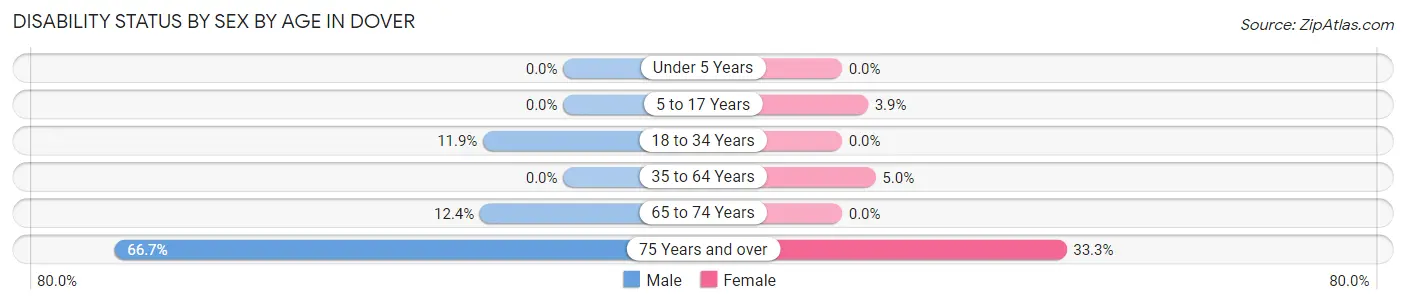
| Age Bracket | Male | Female |
| Under 5 Years | 0 (0.0%) | 0 (0.0%) |
| 5 to 17 Years | 0 (0.0%) | 8 (3.8%) |
| 18 to 34 Years | 15 (11.9%) | 0 (0.0%) |
| 35 to 64 Years | 0 (0.0%) | 25 (5.0%) |
| 65 to 74 Years | 22 (12.4%) | 0 (0.0%) |
| 75 Years and over | 46 (66.7%) | 34 (33.3%) |
Disability Class by Sex by Age in Dover
Disability Class: Hearing Difficulty
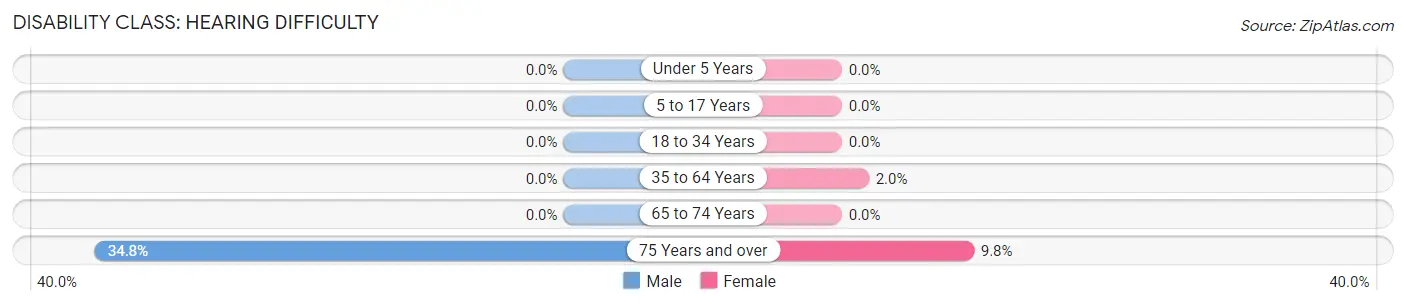
| Age Bracket | Male | Female |
| Under 5 Years | 0 (0.0%) | 0 (0.0%) |
| 5 to 17 Years | 0 (0.0%) | 0 (0.0%) |
| 18 to 34 Years | 0 (0.0%) | 0 (0.0%) |
| 35 to 64 Years | 0 (0.0%) | 10 (2.0%) |
| 65 to 74 Years | 0 (0.0%) | 0 (0.0%) |
| 75 Years and over | 24 (34.8%) | 10 (9.8%) |
Disability Class: Vision Difficulty
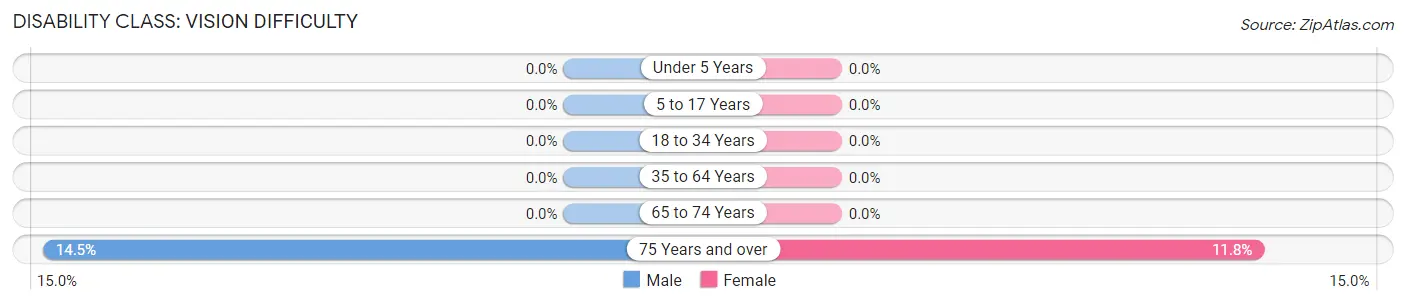
| Age Bracket | Male | Female |
| Under 5 Years | 0 (0.0%) | 0 (0.0%) |
| 5 to 17 Years | 0 (0.0%) | 0 (0.0%) |
| 18 to 34 Years | 0 (0.0%) | 0 (0.0%) |
| 35 to 64 Years | 0 (0.0%) | 0 (0.0%) |
| 65 to 74 Years | 0 (0.0%) | 0 (0.0%) |
| 75 Years and over | 10 (14.5%) | 12 (11.8%) |
Disability Class: Cognitive Difficulty
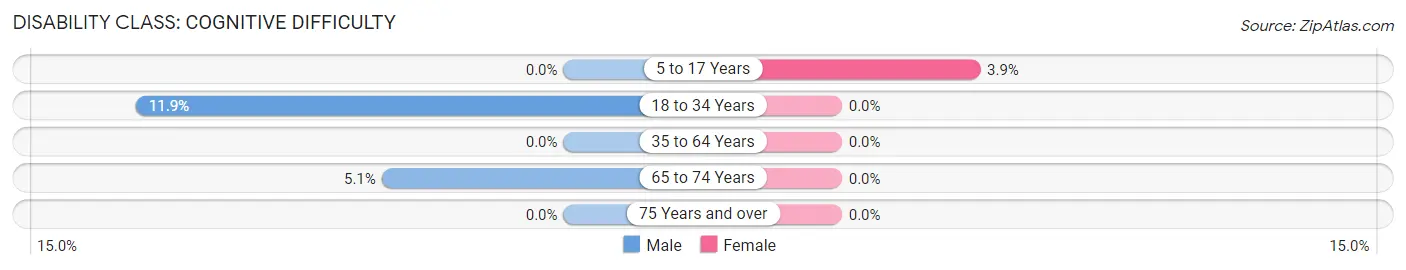
| Age Bracket | Male | Female |
| 5 to 17 Years | 0 (0.0%) | 8 (3.8%) |
| 18 to 34 Years | 15 (11.9%) | 0 (0.0%) |
| 35 to 64 Years | 0 (0.0%) | 0 (0.0%) |
| 65 to 74 Years | 9 (5.1%) | 0 (0.0%) |
| 75 Years and over | 0 (0.0%) | 0 (0.0%) |
Disability Class: Ambulatory Difficulty
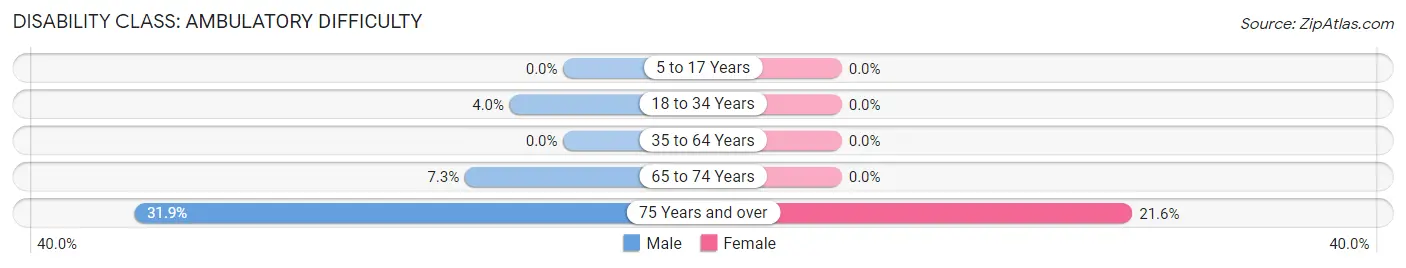
| Age Bracket | Male | Female |
| 5 to 17 Years | 0 (0.0%) | 0 (0.0%) |
| 18 to 34 Years | 5 (4.0%) | 0 (0.0%) |
| 35 to 64 Years | 0 (0.0%) | 0 (0.0%) |
| 65 to 74 Years | 13 (7.3%) | 0 (0.0%) |
| 75 Years and over | 22 (31.9%) | 22 (21.6%) |
Disability Class: Self-Care Difficulty
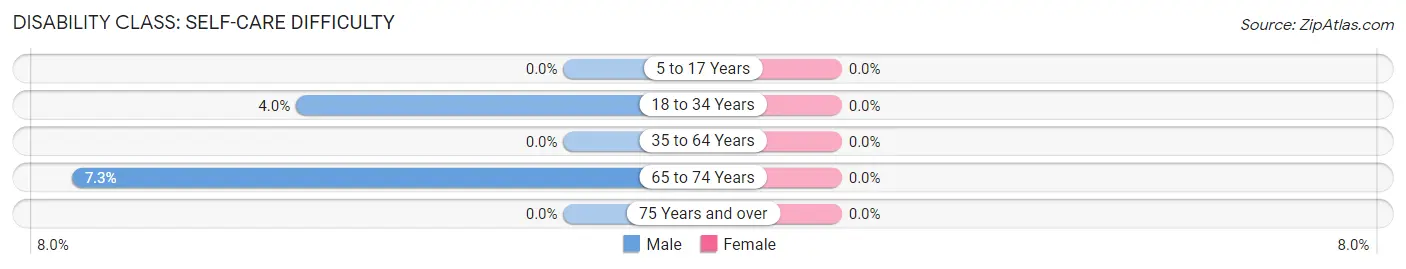
| Age Bracket | Male | Female |
| 5 to 17 Years | 0 (0.0%) | 0 (0.0%) |
| 18 to 34 Years | 5 (4.0%) | 0 (0.0%) |
| 35 to 64 Years | 0 (0.0%) | 0 (0.0%) |
| 65 to 74 Years | 13 (7.3%) | 0 (0.0%) |
| 75 Years and over | 0 (0.0%) | 0 (0.0%) |
Technology Access in Dover
Computing Device Access in Dover
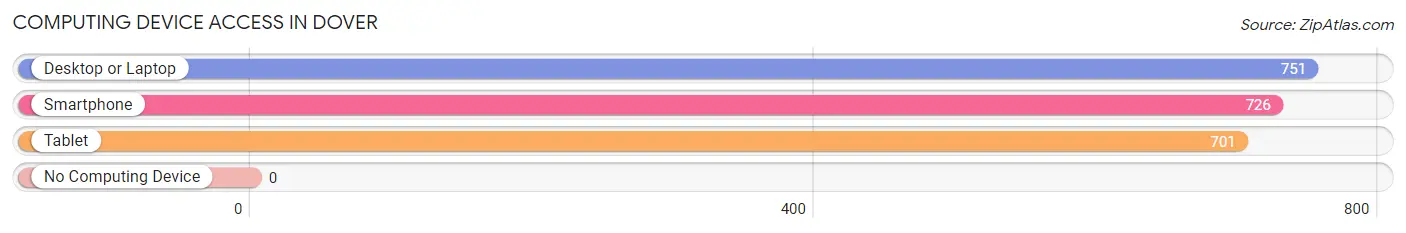
| Device Type | # Households | % Households |
| Desktop or Laptop | 751 | 96.2% |
| Smartphone | 726 | 93.0% |
| Tablet | 701 | 89.8% |
| No Computing Device | 0 | 0.0% |
| Total | 781 | 100.0% |
Internet Access in Dover
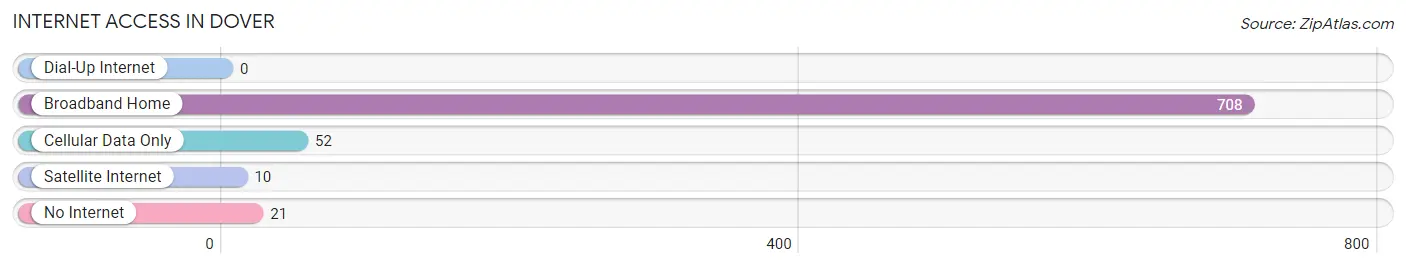
| Internet Type | # Households | % Households |
| Dial-Up Internet | 0 | 0.0% |
| Broadband Home | 708 | 90.6% |
| Cellular Data Only | 52 | 6.7% |
| Satellite Internet | 10 | 1.3% |
| No Internet | 21 | 2.7% |
| Total | 781 | 100.0% |
Dover Summary
Dover, Massachusetts is a small town located in Norfolk County, approximately 20 miles southwest of Boston. It is bordered by the towns of Needham, Wellesley, Natick, Sherborn, and Medfield. The town has a population of 6,279 people, according to the 2010 census.
History
Dover was first settled in 1640 by settlers from Dedham, Massachusetts. The town was originally part of Dedham until it was officially incorporated in 1784. The town was named after Dover, England, and was originally a farming community. In the 19th century, Dover became a popular summer resort for wealthy Bostonians, and many of the town’s grand homes were built during this time.
Geography
Dover is located in eastern Massachusetts, in Norfolk County. It is bordered by the towns of Needham, Wellesley, Natick, Sherborn, and Medfield. The town is located on the Charles River, and is home to several ponds and lakes, including Lake Cochituate, Lake Waban, and Noanet Pond. The town is mostly rural, with a few small villages and hamlets.
Economy
Dover’s economy is largely based on agriculture and tourism. The town is home to several farms, including the Dover Country Store, which sells local produce and other goods. The town is also home to several small businesses, including restaurants, retail stores, and professional services.
Demographics
According to the 2010 census, Dover has a population of 6,279 people. The median household income is $150,000, and the median age is 44. The town is predominantly white (94.3%), with small percentages of Asian (2.2%), African American (1.2%), and Hispanic (1.2%) residents.
Conclusion
Dover, Massachusetts is a small town located in Norfolk County, approximately 20 miles southwest of Boston. It was first settled in 1640 and was originally a farming community. Today, the town’s economy is largely based on agriculture and tourism, and the population is predominantly white. Dover is a beautiful town with a rich history and a bright future.
Common Questions
What is Per Capita Income in Dover?
Per Capita income in Dover is $152,767.
What is the Median Family Income in Dover?
Median Family Income in Dover is $250,001.
What is the Median Household income in Dover?
Median Household Income in Dover is $250,001.
What is Income or Wage Gap in Dover?
Income or Wage Gap in Dover is 62.5%.
Women in Dover earn 37.5 cents for every dollar earned by a man.
What is Inequality or Gini Index in Dover?
Inequality or Gini Index in Dover is 0.52.
What is the Total Population of Dover?
Total Population of Dover is 2,512.
What is the Total Male Population of Dover?
Total Male Population of Dover is 1,261.
What is the Total Female Population of Dover?
Total Female Population of Dover is 1,251.
What is the Ratio of Males per 100 Females in Dover?
There are 100.80 Males per 100 Females in Dover.
What is the Ratio of Females per 100 Males in Dover?
There are 99.21 Females per 100 Males in Dover.
What is the Median Population Age in Dover?
Median Population Age in Dover is 44.6 Years.
What is the Average Family Size in Dover
Average Family Size in Dover is 3.5 People.
What is the Average Household Size in Dover
Average Household Size in Dover is 3.2 People.
How Large is the Labor Force in Dover?
There are 1,223 People in the Labor Forcein in Dover.
What is the Percentage of People in the Labor Force in Dover?
64.5% of People are in the Labor Force in Dover.
What is the Unemployment Rate in Dover?
Unemployment Rate in Dover is 13.9%.