West Chatham, MA Map & Demographics
West Chatham Map
West Chatham Overview
$62,581
PER CAPITA INCOME
$146,625
AVG FAMILY INCOME
$130,213
AVG HOUSEHOLD INCOME
0.46
INEQUALITY / GINI INDEX
1,633
TOTAL POPULATION
874
MALE POPULATION
759
FEMALE POPULATION
115.15
MALES / 100 FEMALES
86.84
FEMALES / 100 MALES
61.2
MEDIAN AGE
2.6
AVG FAMILY SIZE
2.3
AVG HOUSEHOLD SIZE
728
LABOR FORCE [ PEOPLE ]
50.8%
PERCENT IN LABOR FORCE
6.2%
UNEMPLOYMENT RATE
West Chatham Area Codes
Income in West Chatham
Income Overview in West Chatham
Per Capita Income in West Chatham is $62,581, while median incomes of families and households are $146,625 and $130,213 respectively.
| Characteristic | Number | Measure |
| Per Capita Income | 1,633 | $62,581 |
| Median Family Income | 560 | $146,625 |
| Mean Family Income | 560 | $162,260 |
| Median Household Income | 724 | $130,213 |
| Mean Household Income | 724 | $145,833 |
| Income Deficit | 560 | $0 |
| Wage / Income Gap (%) | 1,633 | 0.00% |
| Wage / Income Gap ($) | 1,633 | 100.00¢ per $1 |
| Gini / Inequality Index | 1,633 | 0.46 |
Earnings by Sex in West Chatham
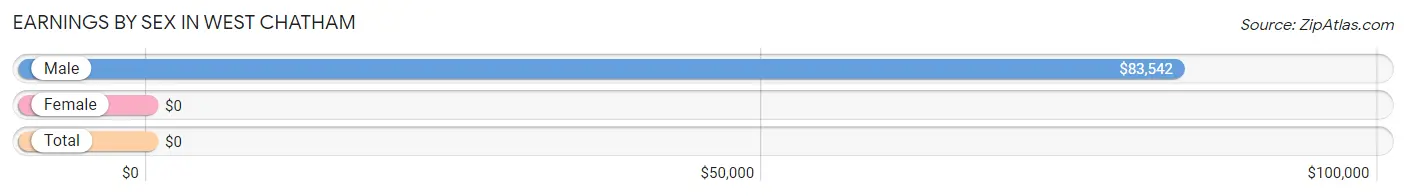
| Sex | Number | Average Earnings |
| Male | 400 (50.2%) | $83,542 |
| Female | 397 (49.8%) | $0 |
| Total | 797 (100.0%) | $0 |
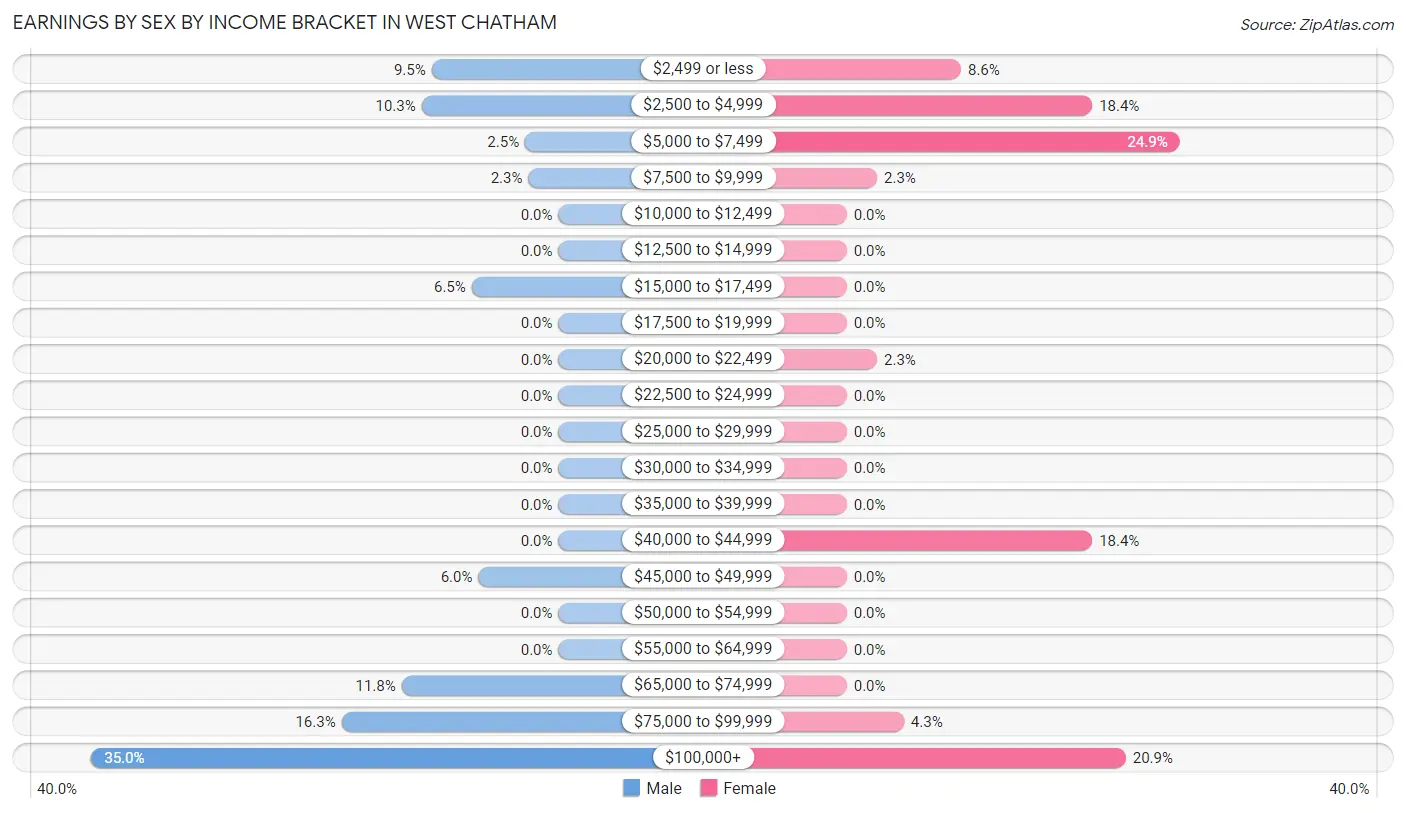
Earnings by Sex by Income Bracket in West Chatham
The most common earnings brackets in West Chatham are $100,000+ for men (140 | 35.0%) and $5,000 to $7,499 for women (99 | 24.9%).
| Income | Male | Female |
| $2,499 or less | 38 (9.5%) | 34 (8.6%) |
| $2,500 to $4,999 | 41 (10.2%) | 73 (18.4%) |
| $5,000 to $7,499 | 10 (2.5%) | 99 (24.9%) |
| $7,500 to $9,999 | 9 (2.2%) | 9 (2.3%) |
| $10,000 to $12,499 | 0 (0.0%) | 0 (0.0%) |
| $12,500 to $14,999 | 0 (0.0%) | 0 (0.0%) |
| $15,000 to $17,499 | 26 (6.5%) | 0 (0.0%) |
| $17,500 to $19,999 | 0 (0.0%) | 0 (0.0%) |
| $20,000 to $22,499 | 0 (0.0%) | 9 (2.3%) |
| $22,500 to $24,999 | 0 (0.0%) | 0 (0.0%) |
| $25,000 to $29,999 | 0 (0.0%) | 0 (0.0%) |
| $30,000 to $34,999 | 0 (0.0%) | 0 (0.0%) |
| $35,000 to $39,999 | 0 (0.0%) | 0 (0.0%) |
| $40,000 to $44,999 | 0 (0.0%) | 73 (18.4%) |
| $45,000 to $49,999 | 24 (6.0%) | 0 (0.0%) |
| $50,000 to $54,999 | 0 (0.0%) | 0 (0.0%) |
| $55,000 to $64,999 | 0 (0.0%) | 0 (0.0%) |
| $65,000 to $74,999 | 47 (11.7%) | 0 (0.0%) |
| $75,000 to $99,999 | 65 (16.3%) | 17 (4.3%) |
| $100,000+ | 140 (35.0%) | 83 (20.9%) |
| Total | 400 (100.0%) | 397 (100.0%) |
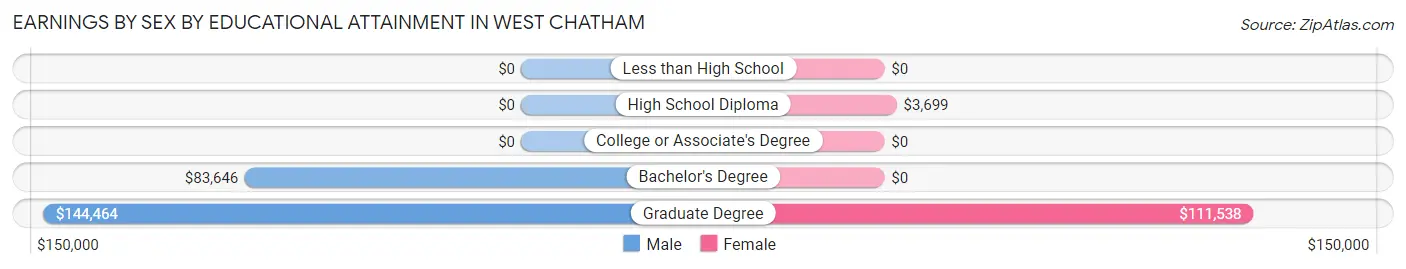
Earnings by Sex by Educational Attainment in West Chatham
Average earnings in West Chatham are $92,039 for men and $40,822 for women, a difference of 55.6%. Men with an educational attainment of graduate degree enjoy the highest average annual earnings of $144,464, while those with bachelor's degree education earn the least with $83,646. Women with an educational attainment of graduate degree earn the most with the average annual earnings of $111,538, while those with high school diploma education have the smallest earnings of $3,699.
| Educational Attainment | Male Income | Female Income |
| Less than High School | - | - |
| High School Diploma | - | - |
| College or Associate's Degree | - | - |
| Bachelor's Degree | $83,646 | $0 |
| Graduate Degree | $144,464 | $111,538 |
| Total | $92,039 | $40,822 |
Family Income in West Chatham
Family Income Brackets in West Chatham
According to the West Chatham family income data, there are 195 families falling into the $200,000+ income range, which is the most common income bracket and makes up 34.8% of all families.
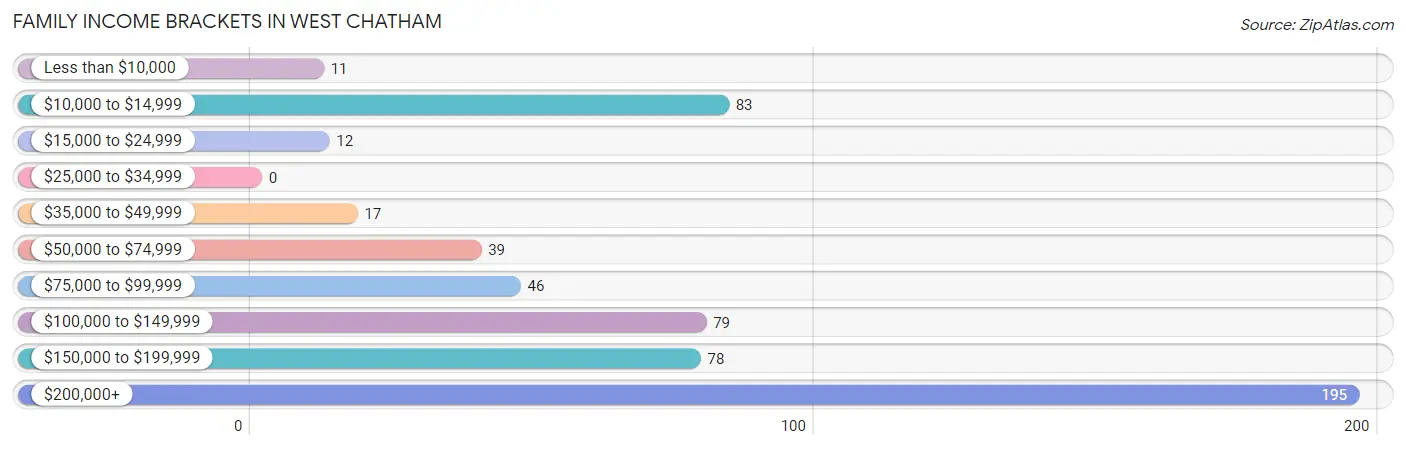
| Income Bracket | # Families | % Families |
| Less than $10,000 | 11 | 2.0% |
| $10,000 to $14,999 | 83 | 14.8% |
| $15,000 to $24,999 | 12 | 2.1% |
| $25,000 to $34,999 | 0 | 0.0% |
| $35,000 to $49,999 | 17 | 3.0% |
| $50,000 to $74,999 | 39 | 7.0% |
| $75,000 to $99,999 | 46 | 8.2% |
| $100,000 to $149,999 | 79 | 14.1% |
| $150,000 to $199,999 | 78 | 13.9% |
| $200,000+ | 195 | 34.8% |
Family Income by Famaliy Size in West Chatham
2-person families (389 | 69.5%) account for the highest median family income in West Chatham with $146,438 per family, while 2-person families (389 | 69.5%) have the highest median income of $73,219 per family member.
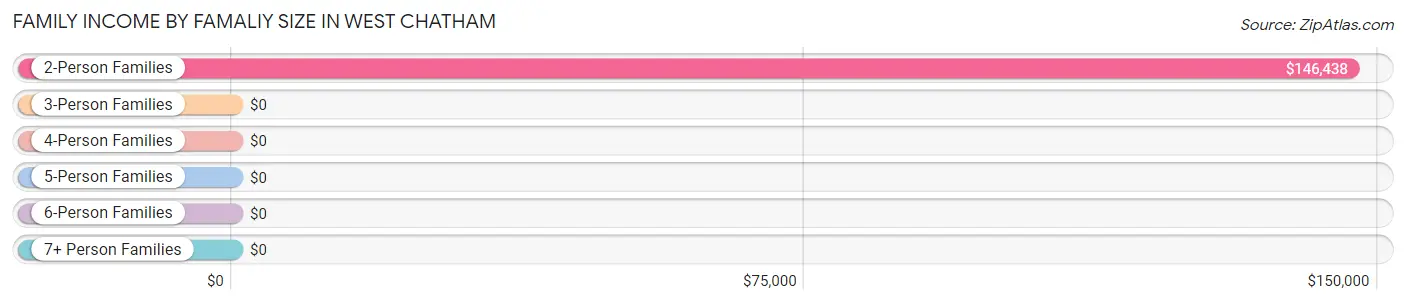
| Income Bracket | # Families | Median Income |
| 2-Person Families | 389 (69.5%) | $146,438 |
| 3-Person Families | 137 (24.5%) | $0 |
| 4-Person Families | 0 (0.0%) | $0 |
| 5-Person Families | 34 (6.1%) | $0 |
| 6-Person Families | 0 (0.0%) | $0 |
| 7+ Person Families | 0 (0.0%) | $0 |
| Total | 560 (100.0%) | $146,625 |
Family Income by Number of Earners in West Chatham
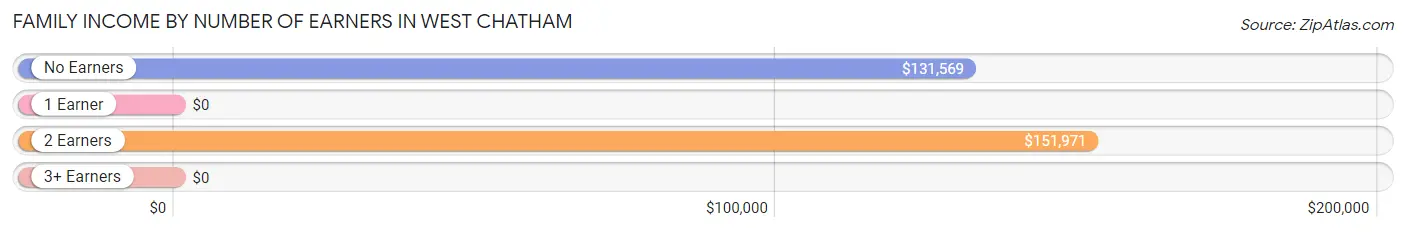
| Number of Earners | # Families | Median Income |
| No Earners | 153 (27.3%) | $131,569 |
| 1 Earner | 114 (20.4%) | $0 |
| 2 Earners | 293 (52.3%) | $151,971 |
| 3+ Earners | 0 (0.0%) | $0 |
| Total | 560 (100.0%) | $146,625 |
Household Income in West Chatham
Household Income Brackets in West Chatham
With 241 households falling in the category, the $200,000+ income range is the most frequent in West Chatham, accounting for 33.3% of all households. In contrast, only 12 households (1.7%) fall into the $25,000 to $34,999 income bracket, making it the least populous group.
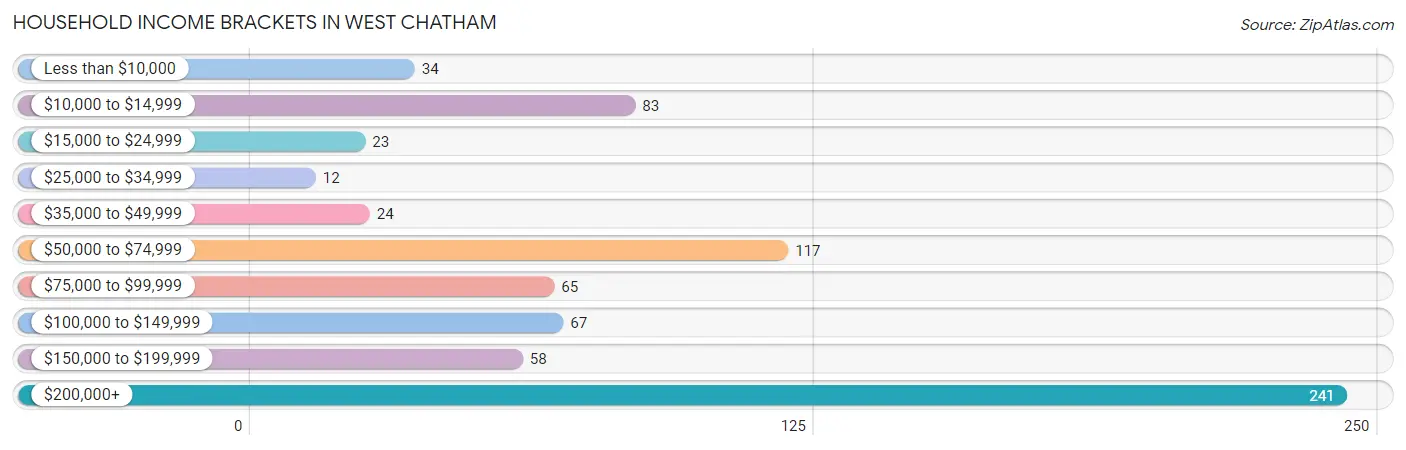
| Income Bracket | # Households | % Households |
| Less than $10,000 | 34 | 4.7% |
| $10,000 to $14,999 | 83 | 11.5% |
| $15,000 to $24,999 | 23 | 3.2% |
| $25,000 to $34,999 | 12 | 1.7% |
| $35,000 to $49,999 | 24 | 3.3% |
| $50,000 to $74,999 | 117 | 16.2% |
| $75,000 to $99,999 | 65 | 9.0% |
| $100,000 to $149,999 | 67 | 9.3% |
| $150,000 to $199,999 | 58 | 8.0% |
| $200,000+ | 241 | 33.3% |
Household Income by Householder Age in West Chatham
The median household income in West Chatham is $130,213, with the highest median household income of $223,214 found in the 45 to 64 years age bracket for the primary householder. A total of 172 households (23.8%) fall into this category.
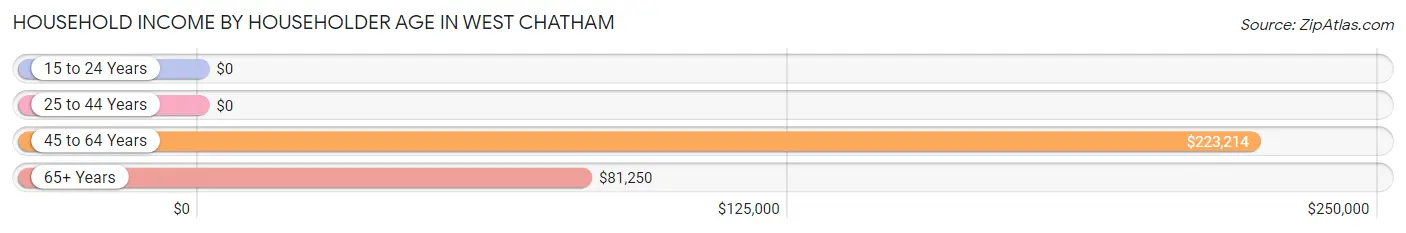
| Income Bracket | # Households | Median Income |
| 15 to 24 Years | 0 (0.0%) | $0 |
| 25 to 44 Years | 160 (22.1%) | $0 |
| 45 to 64 Years | 172 (23.8%) | $223,214 |
| 65+ Years | 392 (54.1%) | $81,250 |
| Total | 724 (100.0%) | $130,213 |
Poverty in West Chatham
Income Below Poverty by Sex and Age in West Chatham
With 11.0% poverty level for males and 28.5% for females among the residents of West Chatham, 6 to 11 year old males and 18 to 24 year old females are the most vulnerable to poverty, with 56 males (100.0%) and 99 females (100.0%) in their respective age groups living below the poverty level.
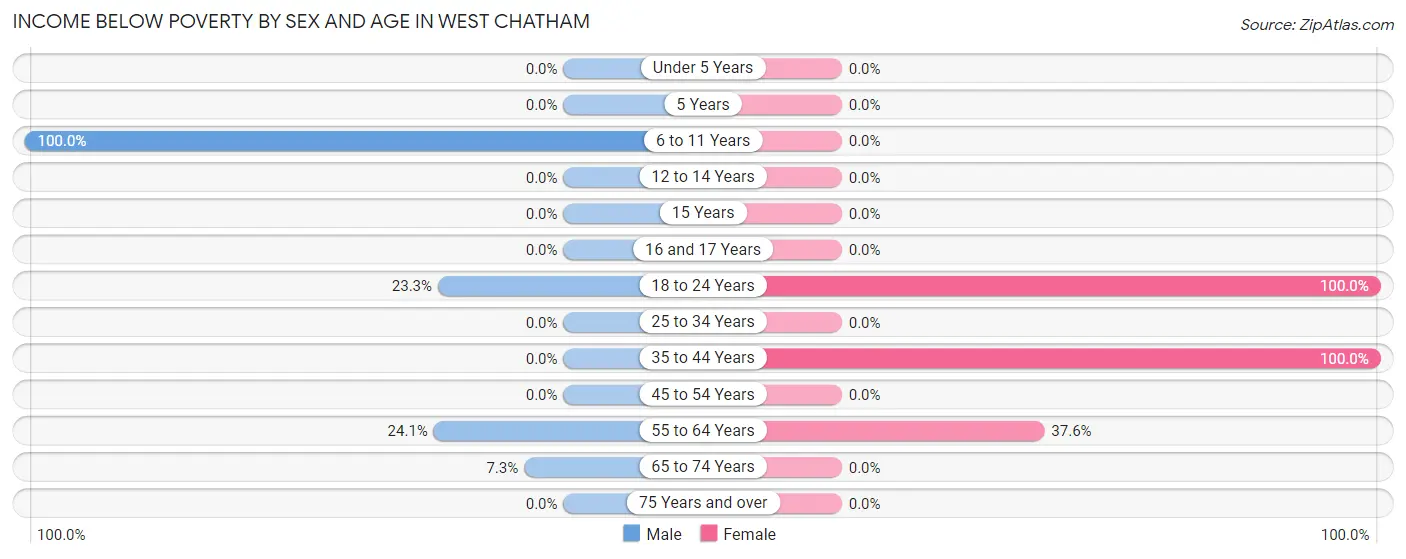
| Age Bracket | Male | Female |
| Under 5 Years | 0 (0.0%) | 0 (0.0%) |
| 5 Years | 0 (0.0%) | 0 (0.0%) |
| 6 to 11 Years | 56 (100.0%) | 0 (0.0%) |
| 12 to 14 Years | 0 (0.0%) | 0 (0.0%) |
| 15 Years | 0 (0.0%) | 0 (0.0%) |
| 16 and 17 Years | 0 (0.0%) | 0 (0.0%) |
| 18 to 24 Years | 17 (23.3%) | 99 (100.0%) |
| 25 to 34 Years | 0 (0.0%) | 0 (0.0%) |
| 35 to 44 Years | 0 (0.0%) | 73 (100.0%) |
| 45 to 54 Years | 0 (0.0%) | 0 (0.0%) |
| 55 to 64 Years | 13 (24.1%) | 44 (37.6%) |
| 65 to 74 Years | 10 (7.3%) | 0 (0.0%) |
| 75 Years and over | 0 (0.0%) | 0 (0.0%) |
| Total | 96 (11.0%) | 216 (28.5%) |
Income Above Poverty by Sex and Age in West Chatham
According to the poverty statistics in West Chatham, males aged under 5 years and females aged 25 to 34 years are the age groups that are most secure financially, with 100.0% of males and 100.0% of females in these age groups living above the poverty line.
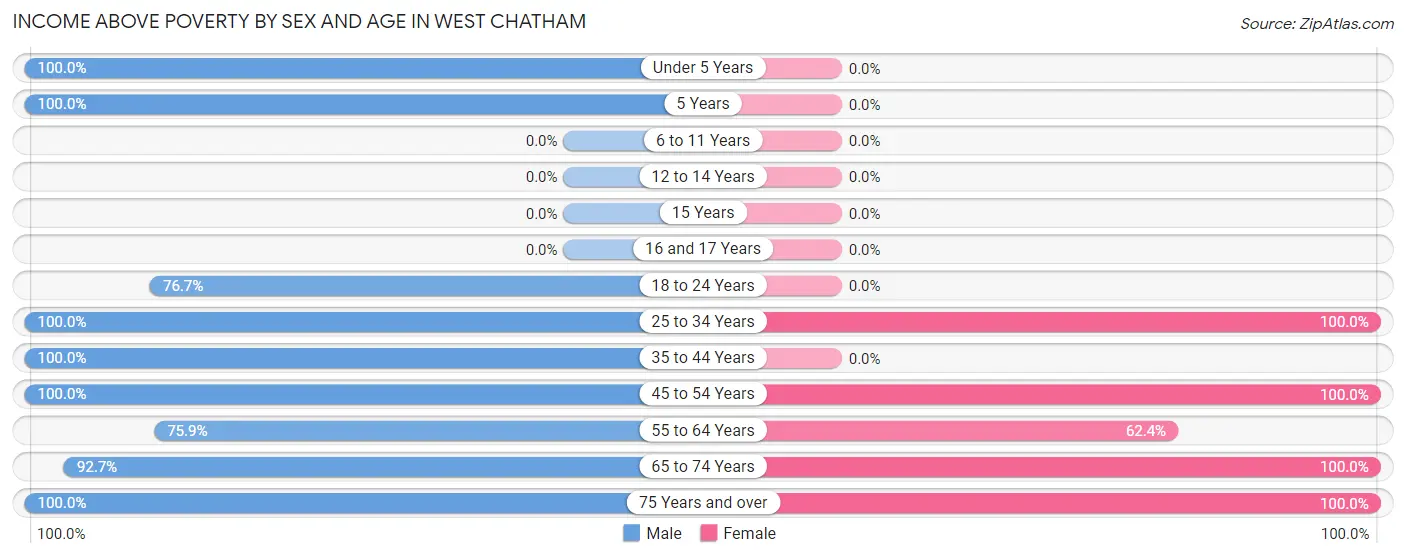
| Age Bracket | Male | Female |
| Under 5 Years | 112 (100.0%) | 0 (0.0%) |
| 5 Years | 31 (100.0%) | 0 (0.0%) |
| 6 to 11 Years | 0 (0.0%) | 0 (0.0%) |
| 12 to 14 Years | 0 (0.0%) | 0 (0.0%) |
| 15 Years | 0 (0.0%) | 0 (0.0%) |
| 16 and 17 Years | 0 (0.0%) | 0 (0.0%) |
| 18 to 24 Years | 56 (76.7%) | 0 (0.0%) |
| 25 to 34 Years | 31 (100.0%) | 50 (100.0%) |
| 35 to 44 Years | 87 (100.0%) | 0 (0.0%) |
| 45 to 54 Years | 82 (100.0%) | 29 (100.0%) |
| 55 to 64 Years | 41 (75.9%) | 73 (62.4%) |
| 65 to 74 Years | 127 (92.7%) | 165 (100.0%) |
| 75 Years and over | 211 (100.0%) | 226 (100.0%) |
| Total | 778 (89.0%) | 543 (71.5%) |
Income Below Poverty Among Married-Couple Families in West Chatham
The poverty statistics for married-couple families in West Chatham show that 4.8% or 21 of the total 437 families live below the poverty line. Families with no children have the highest poverty rate of 5.7%, comprising of 21 families. On the other hand, families with 1 or 2 children have the lowest poverty rate of 0.0%, which includes 0 families.
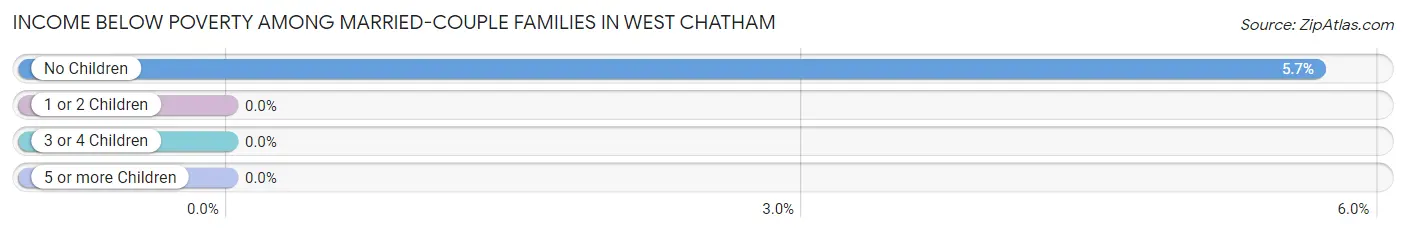
| Children | Above Poverty | Below Poverty |
| No Children | 349 (94.3%) | 21 (5.7%) |
| 1 or 2 Children | 67 (100.0%) | 0 (0.0%) |
| 3 or 4 Children | 0 (0.0%) | 0 (0.0%) |
| 5 or more Children | 0 (0.0%) | 0 (0.0%) |
| Total | 416 (95.2%) | 21 (4.8%) |
Income Below Poverty Among Single-Parent Households in West Chatham
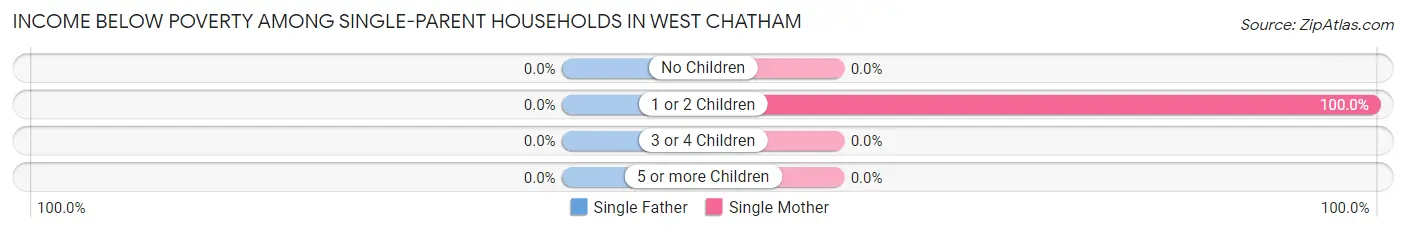
| Children | Single Father | Single Mother |
| No Children | 0 (0.0%) | 0 (0.0%) |
| 1 or 2 Children | 0 (0.0%) | 73 (100.0%) |
| 3 or 4 Children | 0 (0.0%) | 0 (0.0%) |
| 5 or more Children | 0 (0.0%) | 0 (0.0%) |
| Total | 0 (0.0%) | 73 (59.4%) |
Income Below Poverty Among Married-Couple vs Single-Parent Households in West Chatham
The poverty data for West Chatham shows that 21 of the married-couple family households (4.8%) and 73 of the single-parent households (59.4%) are living below the poverty level. Within the married-couple family households, those with no children have the highest poverty rate, with 21 households (5.7%) falling below the poverty line. Among the single-parent households, those with 1 or 2 children have the highest poverty rate, with 73 household (100.0%) living below poverty.
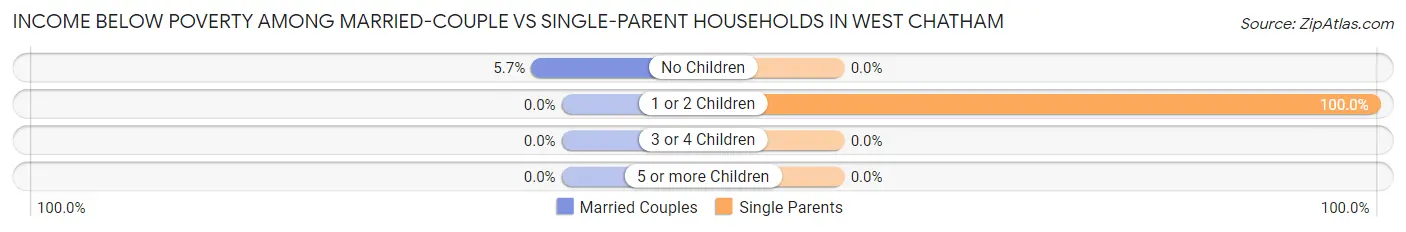
| Children | Married-Couple Families | Single-Parent Households |
| No Children | 21 (5.7%) | 0 (0.0%) |
| 1 or 2 Children | 0 (0.0%) | 73 (100.0%) |
| 3 or 4 Children | 0 (0.0%) | 0 (0.0%) |
| 5 or more Children | 0 (0.0%) | 0 (0.0%) |
| Total | 21 (4.8%) | 73 (59.4%) |
Race in West Chatham
The most populous races in West Chatham are White / Caucasian (1,276 | 78.1%), Two or more Races (182 | 11.2%), and Asian (162 | 9.9%).
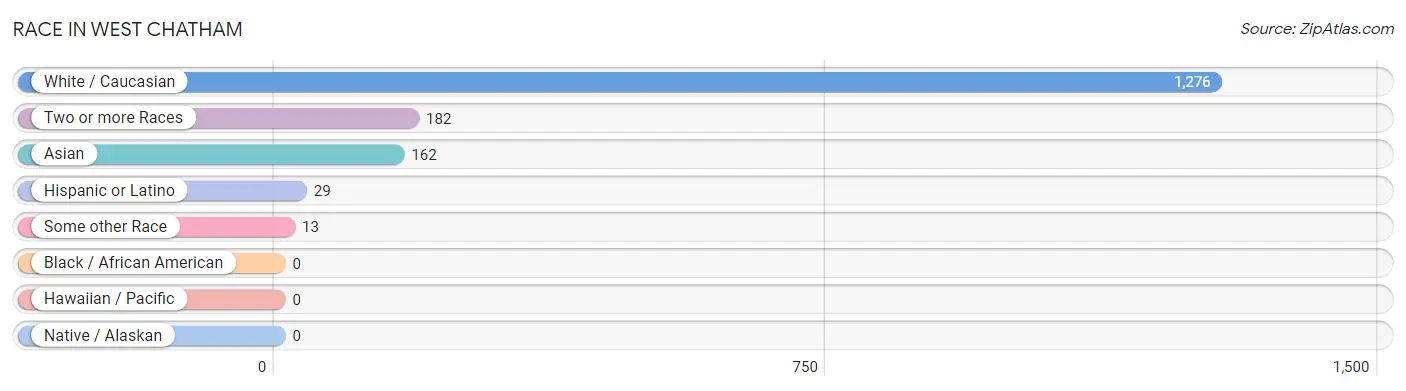
| Race | # Population | % Population |
| Asian | 162 | 9.9% |
| Black / African American | 0 | 0.0% |
| Hawaiian / Pacific | 0 | 0.0% |
| Hispanic or Latino | 29 | 1.8% |
| Native / Alaskan | 0 | 0.0% |
| White / Caucasian | 1,276 | 78.1% |
| Two or more Races | 182 | 11.2% |
| Some other Race | 13 | 0.8% |
| Total | 1,633 | 100.0% |
Ancestry in West Chatham
The most populous ancestries reported in West Chatham are Irish (307 | 18.8%), English (242 | 14.8%), Scottish (175 | 10.7%), Italian (168 | 10.3%), and German (167 | 10.2%), together accounting for 64.9% of all West Chatham residents.
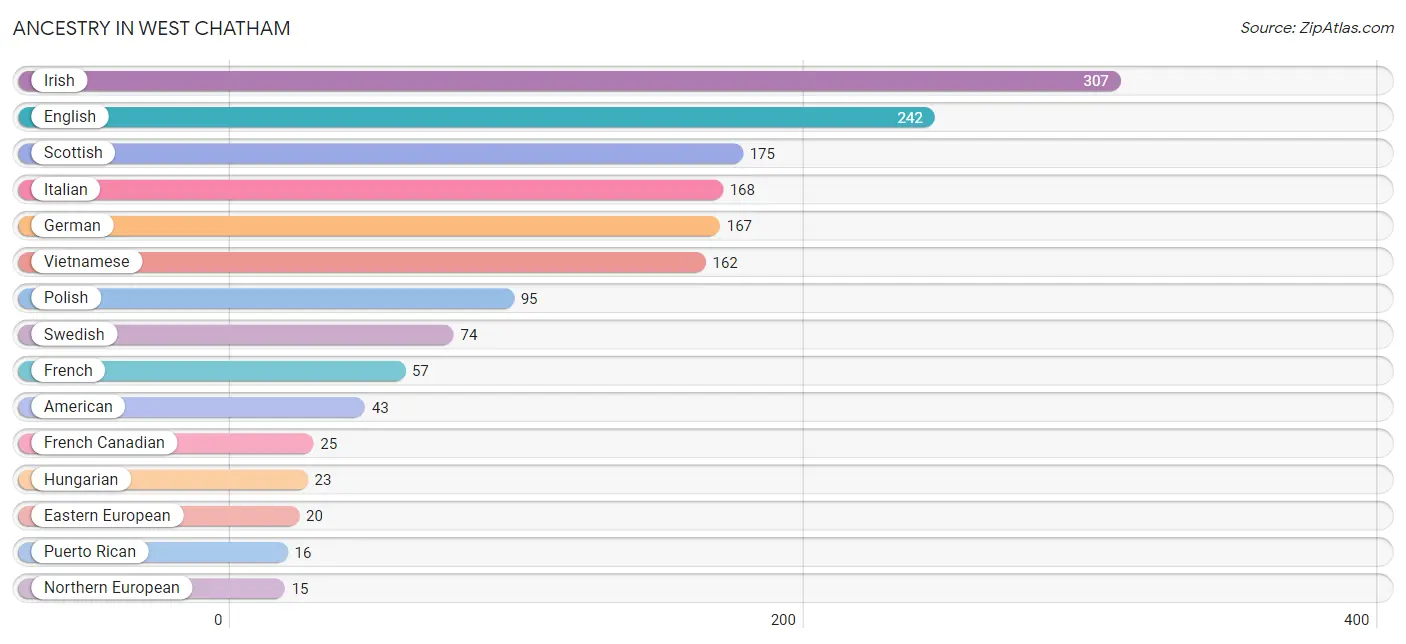
| Ancestry | # Population | % Population |
| American | 43 | 2.6% |
| Czech | 11 | 0.7% |
| Dutch | 10 | 0.6% |
| Eastern European | 20 | 1.2% |
| English | 242 | 14.8% |
| French | 57 | 3.5% |
| French Canadian | 25 | 1.5% |
| German | 167 | 10.2% |
| Hungarian | 23 | 1.4% |
| Irish | 307 | 18.8% |
| Italian | 168 | 10.3% |
| Mexican | 13 | 0.8% |
| Northern European | 15 | 0.9% |
| Polish | 95 | 5.8% |
| Puerto Rican | 16 | 1.0% |
| Scotch-Irish | 11 | 0.7% |
| Scottish | 175 | 10.7% |
| Swedish | 74 | 4.5% |
| Vietnamese | 162 | 9.9% |
| Welsh | 12 | 0.7% | View All 20 Rows |
Immigrants in West Chatham
The most numerous immigrant groups reported in West Chatham came from Central America (79 | 4.8%), Latin America (79 | 4.8%), Mexico (79 | 4.8%), Asia (50 | 3.1%), and Bangladesh (50 | 3.1%), together accounting for 20.6% of all West Chatham residents.
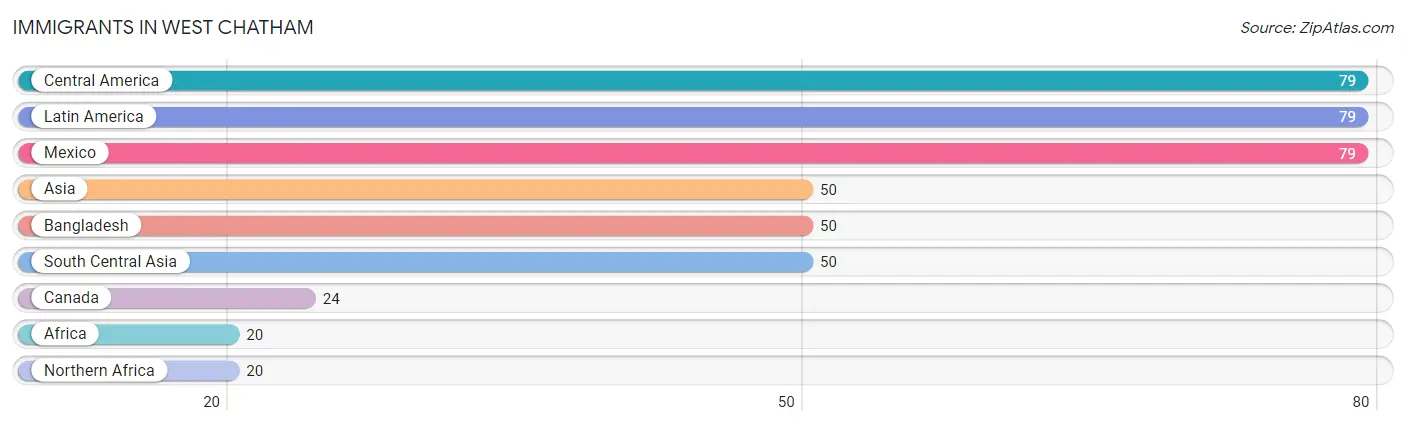
| Immigration Origin | # Population | % Population |
| Africa | 20 | 1.2% |
| Asia | 50 | 3.1% |
| Bangladesh | 50 | 3.1% |
| Canada | 24 | 1.5% |
| Central America | 79 | 4.8% |
| Latin America | 79 | 4.8% |
| Mexico | 79 | 4.8% |
| Northern Africa | 20 | 1.2% |
| South Central Asia | 50 | 3.1% | View All 9 Rows |
Sex and Age in West Chatham
Sex and Age in West Chatham
The most populous age groups in West Chatham are Under 5 Years (112 | 12.8%) for men and 85 Years and over (121 | 15.9%) for women.
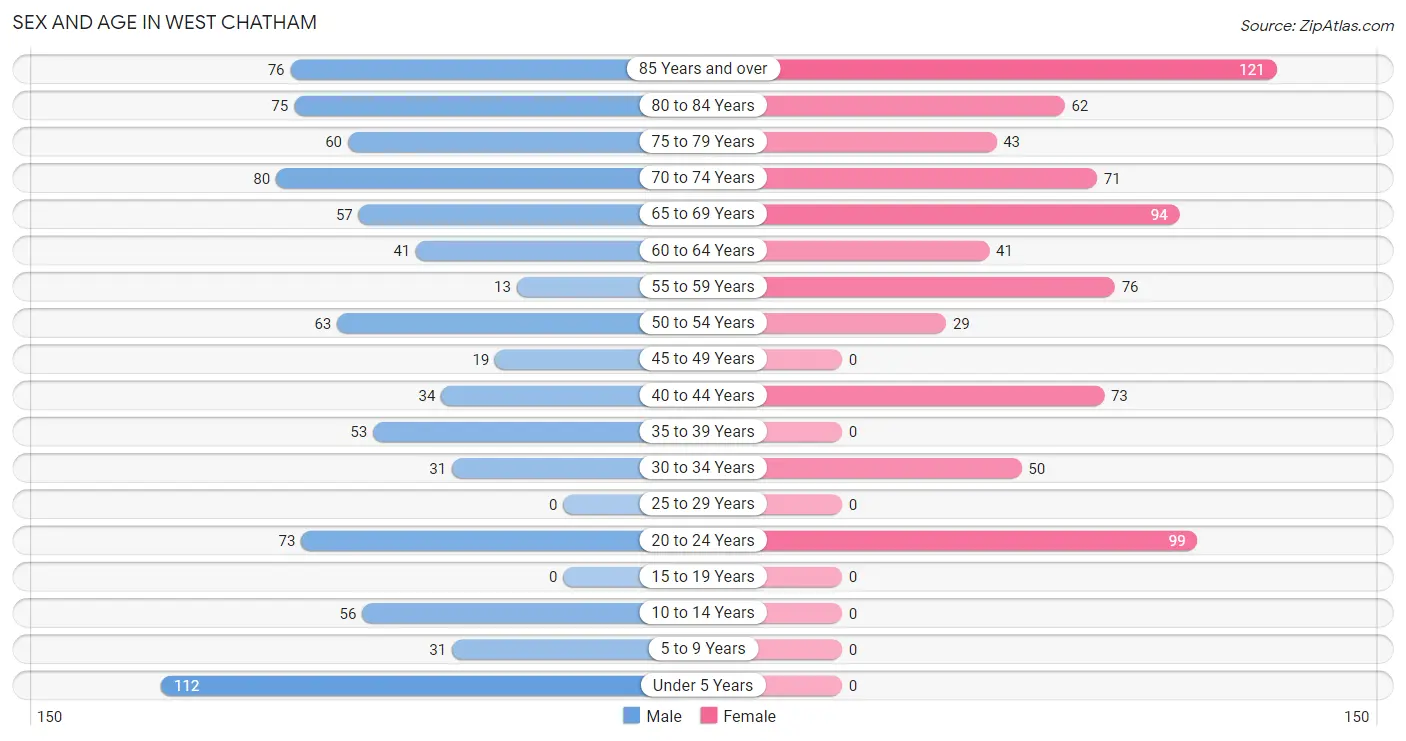
| Age Bracket | Male | Female |
| Under 5 Years | 112 (12.8%) | 0 (0.0%) |
| 5 to 9 Years | 31 (3.5%) | 0 (0.0%) |
| 10 to 14 Years | 56 (6.4%) | 0 (0.0%) |
| 15 to 19 Years | 0 (0.0%) | 0 (0.0%) |
| 20 to 24 Years | 73 (8.4%) | 99 (13.0%) |
| 25 to 29 Years | 0 (0.0%) | 0 (0.0%) |
| 30 to 34 Years | 31 (3.5%) | 50 (6.6%) |
| 35 to 39 Years | 53 (6.1%) | 0 (0.0%) |
| 40 to 44 Years | 34 (3.9%) | 73 (9.6%) |
| 45 to 49 Years | 19 (2.2%) | 0 (0.0%) |
| 50 to 54 Years | 63 (7.2%) | 29 (3.8%) |
| 55 to 59 Years | 13 (1.5%) | 76 (10.0%) |
| 60 to 64 Years | 41 (4.7%) | 41 (5.4%) |
| 65 to 69 Years | 57 (6.5%) | 94 (12.4%) |
| 70 to 74 Years | 80 (9.1%) | 71 (9.3%) |
| 75 to 79 Years | 60 (6.9%) | 43 (5.7%) |
| 80 to 84 Years | 75 (8.6%) | 62 (8.2%) |
| 85 Years and over | 76 (8.7%) | 121 (15.9%) |
| Total | 874 (100.0%) | 759 (100.0%) |
Families and Households in West Chatham
Median Family Size in West Chatham
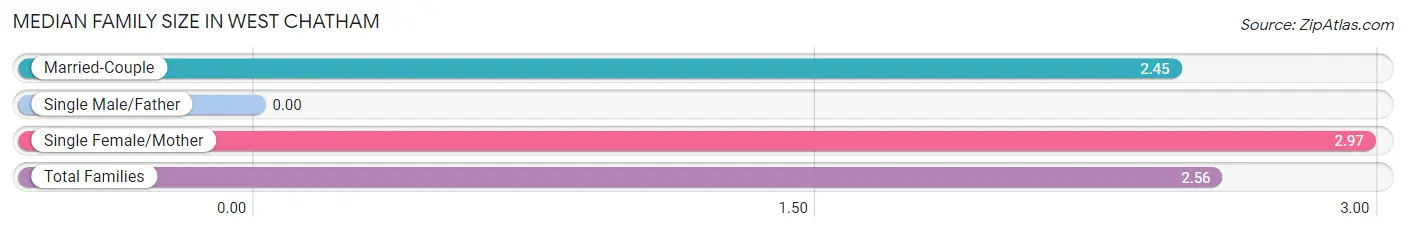
| Family Type | # Families | Family Size |
| Married-Couple | 437 (78.0%) | 2.45 |
| Single Male/Father | 0 (0.0%) | - |
| Single Female/Mother | 123 (22.0%) | 2.97 |
| Total Families | 560 (100.0%) | 2.56 |
Median Household Size in West Chatham
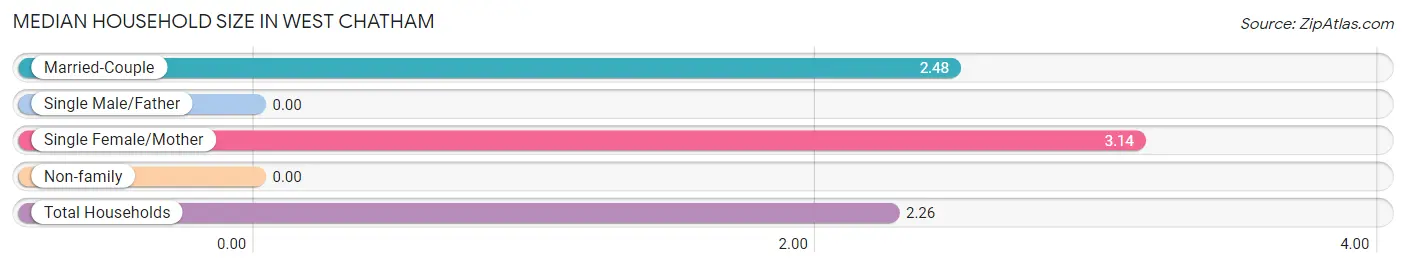
| Household Type | # Households | Household Size |
| Married-Couple | 437 (60.4%) | 2.48 |
| Single Male/Father | 0 (0.0%) | - |
| Single Female/Mother | 123 (17.0%) | 3.14 |
| Non-family | 164 (22.7%) | - |
| Total Households | 724 (100.0%) | 2.26 |
Household Size by Marriage Status in West Chatham
Out of a total of 724 households in West Chatham, 560 (77.3%) are family households, while 164 (22.7%) are nonfamily households. The most numerous type of family households are 2-person households, comprising 377, and the most common type of nonfamily households are 1-person households, comprising 164.
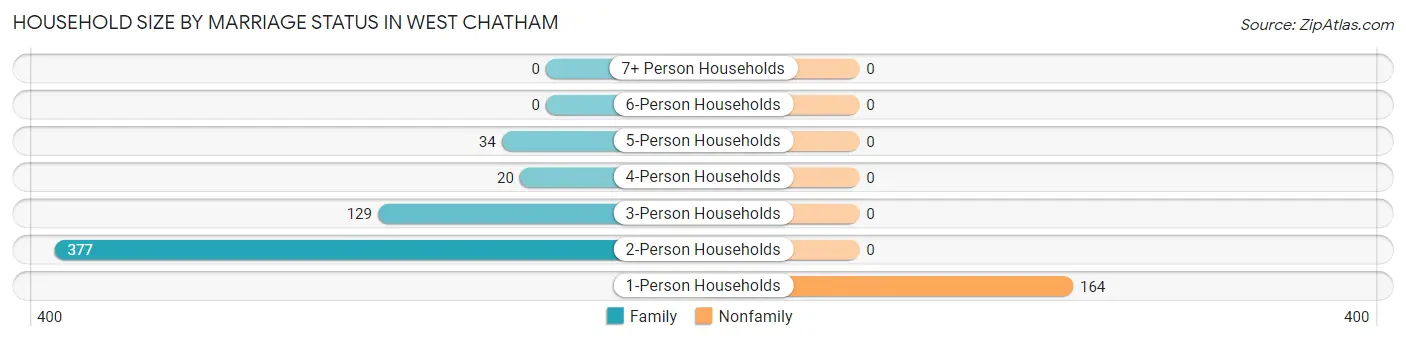
| Household Size | Family Households | Nonfamily Households |
| 1-Person Households | - | 164 (22.7%) |
| 2-Person Households | 377 (52.1%) | 0 (0.0%) |
| 3-Person Households | 129 (17.8%) | 0 (0.0%) |
| 4-Person Households | 20 (2.8%) | 0 (0.0%) |
| 5-Person Households | 34 (4.7%) | 0 (0.0%) |
| 6-Person Households | 0 (0.0%) | 0 (0.0%) |
| 7+ Person Households | 0 (0.0%) | 0 (0.0%) |
| Total | 560 (77.3%) | 164 (22.7%) |
Female Fertility in West Chatham
Fertility by Age in West Chatham
| Age Bracket | Women with Births | Births / 1,000 Women |
| 15 to 19 years | 0 (0.0%) | 0.0 |
| 20 to 34 years | 0 (0.0%) | 0.0 |
| 35 to 50 years | 0 (0.0%) | 0.0 |
| Total | 0 (0.0%) | 0.0 |
Fertility by Age by Marriage Status in West Chatham
| Age Bracket | Married | Unmarried |
| 15 to 19 years | 0 (0.0%) | 0 (0.0%) |
| 20 to 34 years | 0 (0.0%) | 0 (0.0%) |
| 35 to 50 years | 0 (0.0%) | 0 (0.0%) |
| Total | 0 (0.0%) | 0 (0.0%) |
Fertility by Education in West Chatham
| Educational Attainment | Women with Births | Births / 1,000 Women |
| Less than High School | 0 (0.0%) | 0.0 |
| High School Diploma | 0 (0.0%) | 0.0 |
| College or Associate's Degree | 0 (0.0%) | 0.0 |
| Bachelor's Degree | 0 (0.0%) | 0.0 |
| Graduate Degree | 0 (0.0%) | 0.0 |
| Total | 0 (0.0%) | 0.0 |
Fertility by Education by Marriage Status in West Chatham
| Educational Attainment | Married | Unmarried |
| Less than High School | 0 (0.0%) | 0 (0.0%) |
| High School Diploma | 0 (0.0%) | 0 (0.0%) |
| College or Associate's Degree | 0 (0.0%) | 0 (0.0%) |
| Bachelor's Degree | 0 (0.0%) | 0 (0.0%) |
| Graduate Degree | 0 (0.0%) | 0 (0.0%) |
| Total | 0 (0.0%) | 0 (0.0%) |
Employment Characteristics in West Chatham
Employment by Class of Employer in West Chatham
Among the 683 employed individuals in West Chatham, private company employees (474 | 69.4%), self-employed (incorporated) (69 | 10.1%), and not-for-profit organizations (65 | 9.5%) make up the most common classes of employment.
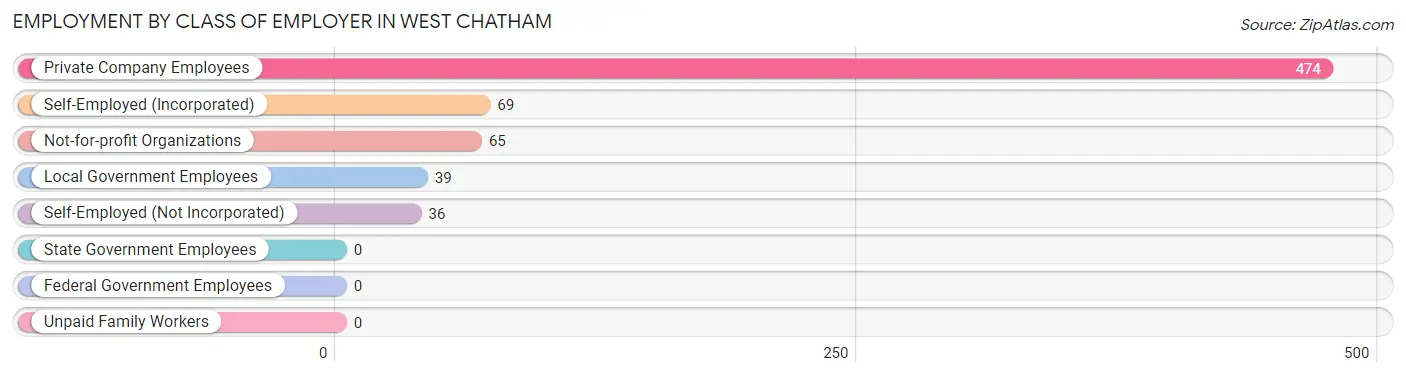
| Employer Class | # Employees | % Employees |
| Private Company Employees | 474 | 69.4% |
| Self-Employed (Incorporated) | 69 | 10.1% |
| Self-Employed (Not Incorporated) | 36 | 5.3% |
| Not-for-profit Organizations | 65 | 9.5% |
| Local Government Employees | 39 | 5.7% |
| State Government Employees | 0 | 0.0% |
| Federal Government Employees | 0 | 0.0% |
| Unpaid Family Workers | 0 | 0.0% |
| Total | 683 | 100.0% |
Employment Status by Age in West Chatham
According to the labor force statistics for West Chatham, out of the total population over 16 years of age (1,434), 50.8% or 728 individuals are in the labor force, with 6.2% or 45 of them unemployed. The age group with the highest labor force participation rate is 30 to 34 years, with 100.0% or 81 individuals in the labor force. Within the labor force, the 20 to 24 years age range has the highest percentage of unemployed individuals, with 19.4% or 28 of them being unemployed.
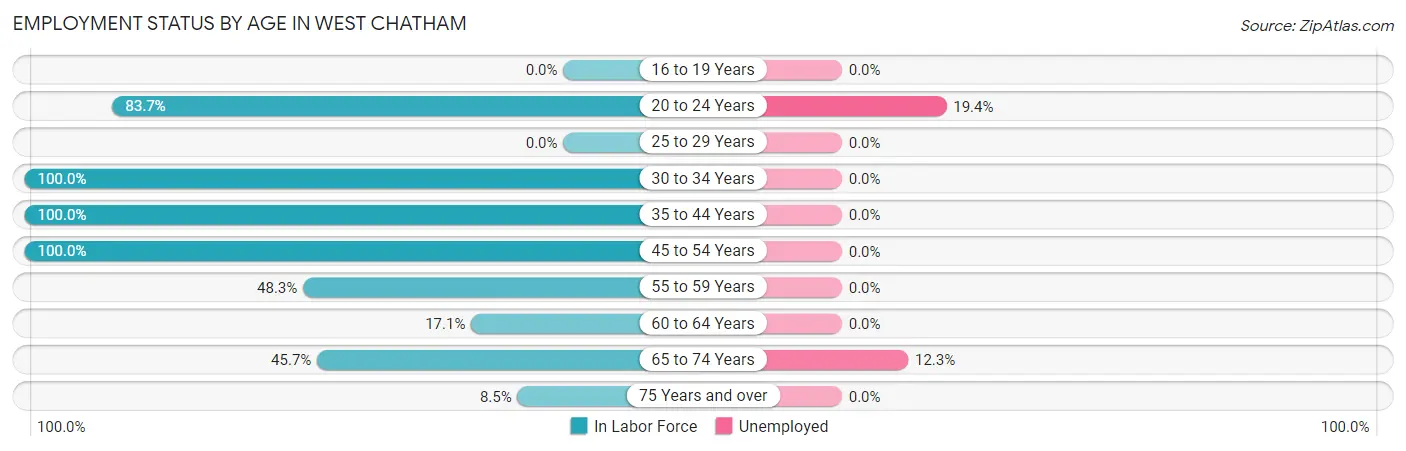
| Age Bracket | In Labor Force | Unemployed |
| 16 to 19 Years | 0 (0.0%) | 0 (0.0%) |
| 20 to 24 Years | 144 (83.7%) | 28 (19.4%) |
| 25 to 29 Years | 0 (0.0%) | 0 (0.0%) |
| 30 to 34 Years | 81 (100.0%) | 0 (0.0%) |
| 35 to 44 Years | 160 (100.0%) | 0 (0.0%) |
| 45 to 54 Years | 111 (100.0%) | 0 (0.0%) |
| 55 to 59 Years | 43 (48.3%) | 0 (0.0%) |
| 60 to 64 Years | 14 (17.1%) | 0 (0.0%) |
| 65 to 74 Years | 138 (45.7%) | 17 (12.3%) |
| 75 Years and over | 37 (8.5%) | 0 (0.0%) |
| Total | 728 (50.8%) | 45 (6.2%) |
Employment Status by Educational Attainment in West Chatham
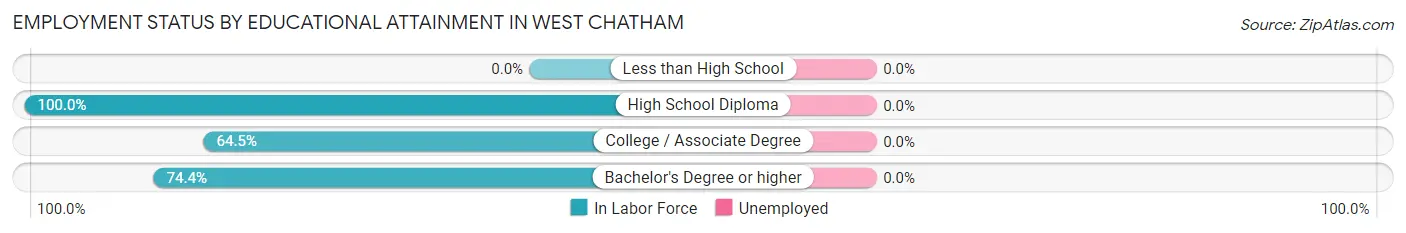
| Educational Attainment | In Labor Force | Unemployed |
| Less than High School | 0 (0.0%) | 0 (0.0%) |
| High School Diploma | 89 (100.0%) | 0 (0.0%) |
| College / Associate Degree | 20 (64.5%) | 0 (0.0%) |
| Bachelor's Degree or higher | 300 (74.4%) | 0 (0.0%) |
| Total | 409 (78.2%) | 0 (0.0%) |
Employment Occupations by Sex in West Chatham
Management, Business, Science and Arts Occupations
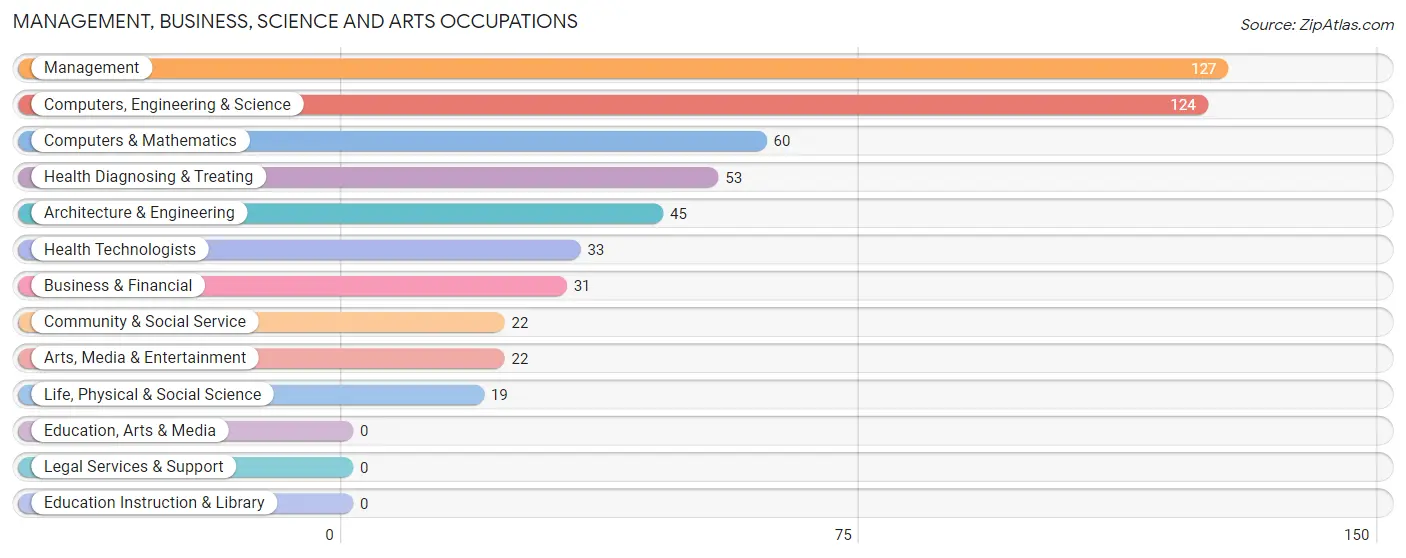
The most common Management, Business, Science and Arts occupations in West Chatham are Management (127 | 18.6%), Computers, Engineering & Science (124 | 18.2%), Computers & Mathematics (60 | 8.8%), Health Diagnosing & Treating (53 | 7.8%), and Architecture & Engineering (45 | 6.6%).
Management, Business, Science and Arts Occupations by Sex
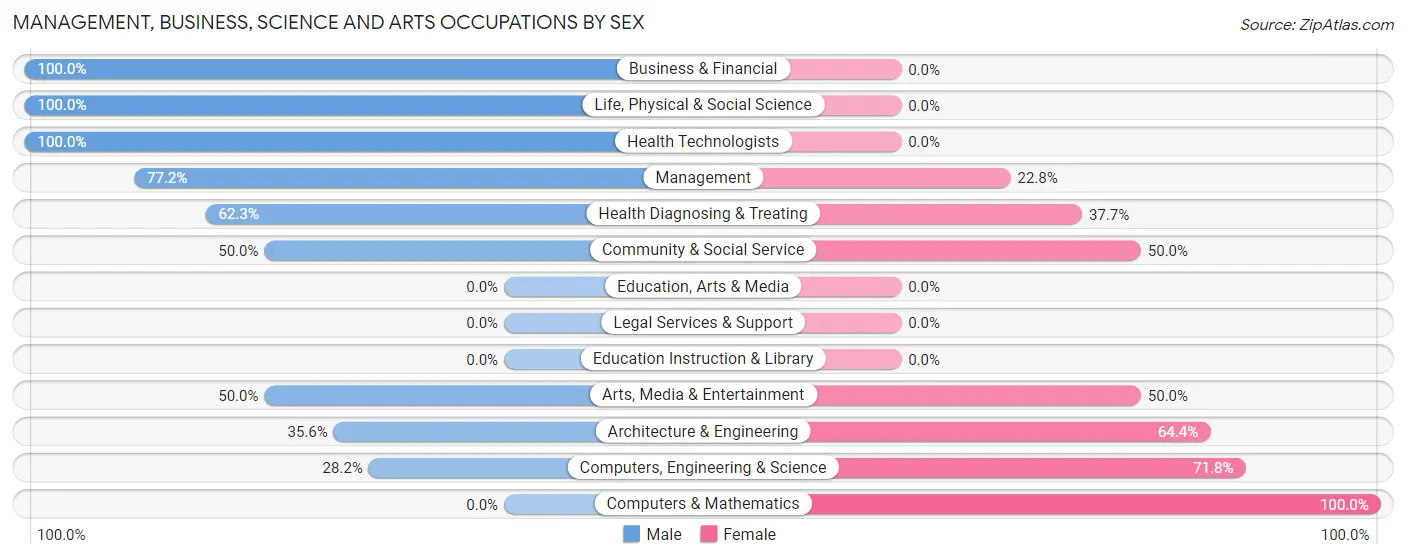
Within the Management, Business, Science and Arts occupations in West Chatham, the most male-oriented occupations are Business & Financial (100.0%), Life, Physical & Social Science (100.0%), and Health Technologists (100.0%), while the most female-oriented occupations are Computers & Mathematics (100.0%), Computers, Engineering & Science (71.8%), and Architecture & Engineering (64.4%).
| Occupation | Male | Female |
| Management | 98 (77.2%) | 29 (22.8%) |
| Business & Financial | 31 (100.0%) | 0 (0.0%) |
| Computers, Engineering & Science | 35 (28.2%) | 89 (71.8%) |
| Computers & Mathematics | 0 (0.0%) | 60 (100.0%) |
| Architecture & Engineering | 16 (35.6%) | 29 (64.4%) |
| Life, Physical & Social Science | 19 (100.0%) | 0 (0.0%) |
| Community & Social Service | 11 (50.0%) | 11 (50.0%) |
| Education, Arts & Media | 0 (0.0%) | 0 (0.0%) |
| Legal Services & Support | 0 (0.0%) | 0 (0.0%) |
| Education Instruction & Library | 0 (0.0%) | 0 (0.0%) |
| Arts, Media & Entertainment | 11 (50.0%) | 11 (50.0%) |
| Health Diagnosing & Treating | 33 (62.3%) | 20 (37.7%) |
| Health Technologists | 33 (100.0%) | 0 (0.0%) |
| Total (Category) | 208 (58.3%) | 149 (41.7%) |
| Total (Overall) | 329 (48.2%) | 354 (51.8%) |
Services Occupations
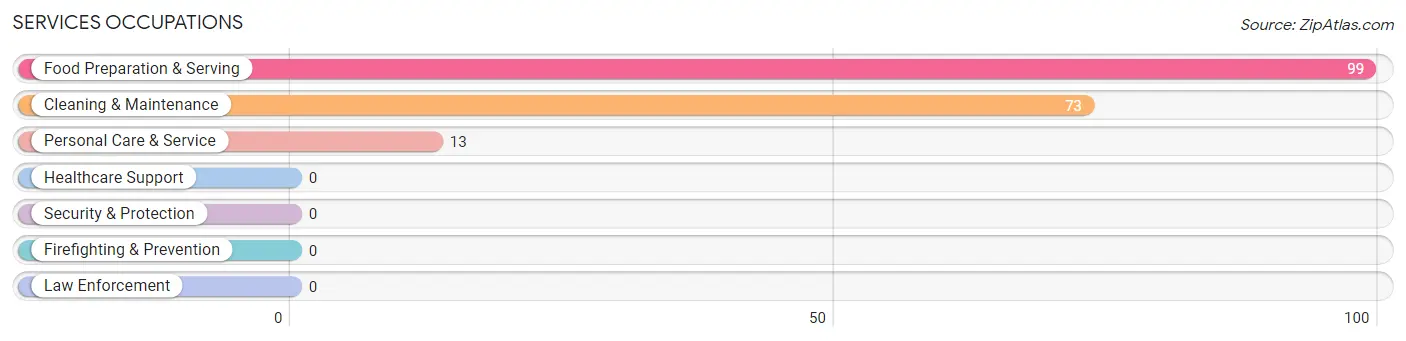
The most common Services occupations in West Chatham are Food Preparation & Serving (99 | 14.5%), Cleaning & Maintenance (73 | 10.7%), and Personal Care & Service (13 | 1.9%).
Services Occupations by Sex
| Occupation | Male | Female |
| Healthcare Support | 0 (0.0%) | 0 (0.0%) |
| Security & Protection | 0 (0.0%) | 0 (0.0%) |
| Firefighting & Prevention | 0 (0.0%) | 0 (0.0%) |
| Law Enforcement | 0 (0.0%) | 0 (0.0%) |
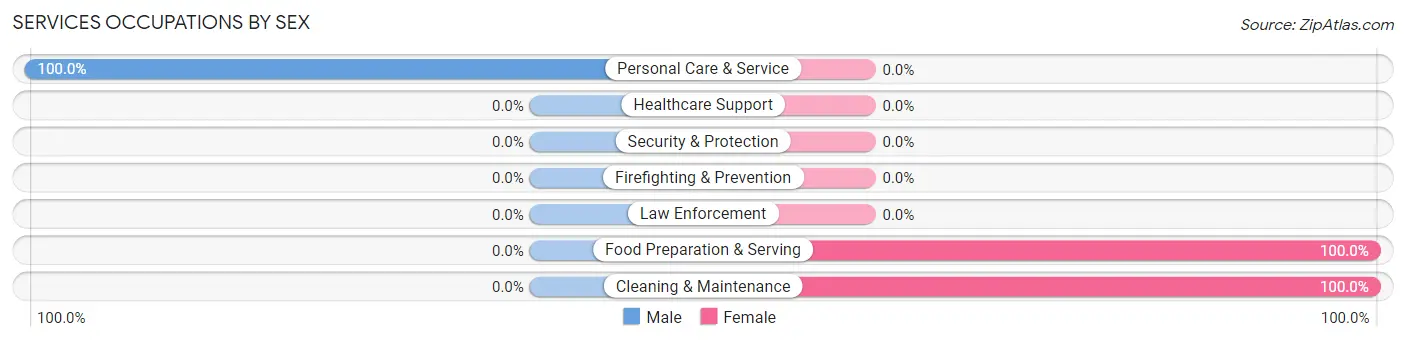
| Food Preparation & Serving | 0 (0.0%) | 99 (100.0%) |
| Cleaning & Maintenance | 0 (0.0%) | 73 (100.0%) |
| Personal Care & Service | 13 (100.0%) | 0 (0.0%) |
| Total (Category) | 13 (7.0%) | 172 (93.0%) |
| Total (Overall) | 329 (48.2%) | 354 (51.8%) |
Sales and Office Occupations
The most common Sales and Office occupations in West Chatham are Office & Administration (68 | 10.0%), and Sales & Related (17 | 2.5%).
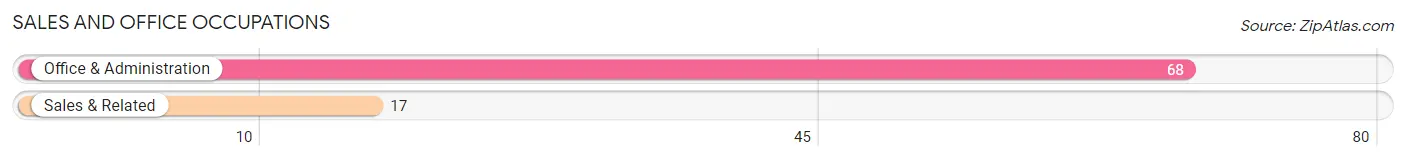
Sales and Office Occupations by Sex
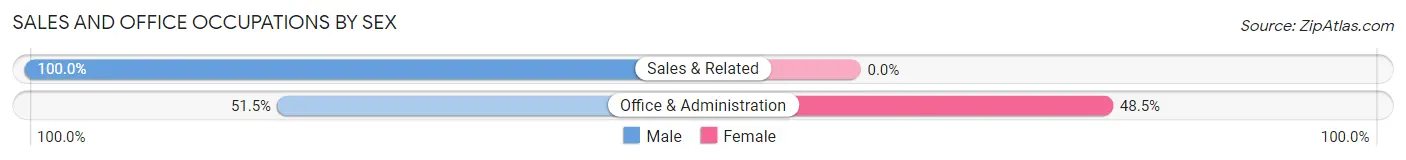
| Occupation | Male | Female |
| Sales & Related | 17 (100.0%) | 0 (0.0%) |
| Office & Administration | 35 (51.5%) | 33 (48.5%) |
| Total (Category) | 52 (61.2%) | 33 (38.8%) |
| Total (Overall) | 329 (48.2%) | 354 (51.8%) |
Natural Resources, Construction and Maintenance Occupations
The most common Natural Resources, Construction and Maintenance occupations in West Chatham are , and Construction & Extraction (56 | 8.2%).
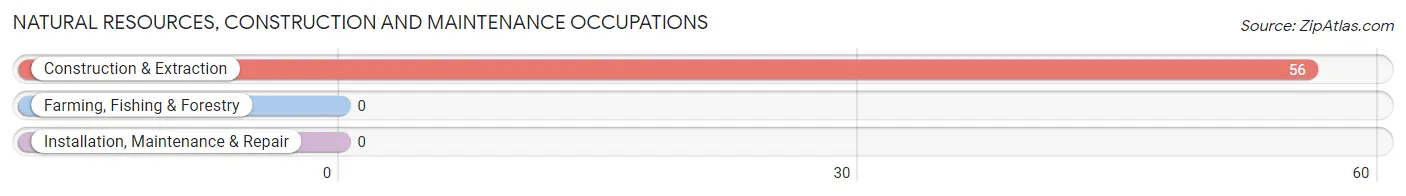
Natural Resources, Construction and Maintenance Occupations by Sex
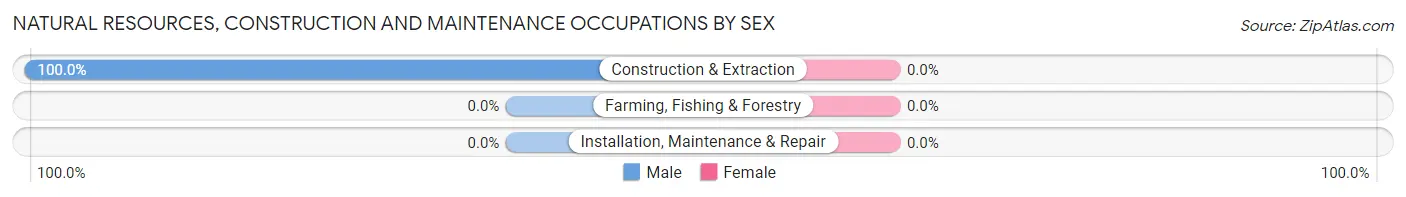
| Occupation | Male | Female |
| Farming, Fishing & Forestry | 0 (0.0%) | 0 (0.0%) |
| Construction & Extraction | 56 (100.0%) | 0 (0.0%) |
| Installation, Maintenance & Repair | 0 (0.0%) | 0 (0.0%) |
| Total (Category) | 56 (100.0%) | 0 (0.0%) |
| Total (Overall) | 329 (48.2%) | 354 (51.8%) |
Production, Transportation and Moving Occupations
Production, Transportation and Moving Occupations by Sex
| Occupation | Male | Female |
| Production | 0 (0.0%) | 0 (0.0%) |
| Transportation | 0 (0.0%) | 0 (0.0%) |
| Material Moving | 0 (0.0%) | 0 (0.0%) |
| Total (Category) | 0 (0.0%) | 0 (0.0%) |
| Total (Overall) | 329 (48.2%) | 354 (51.8%) |
Employment Industries by Sex in West Chatham
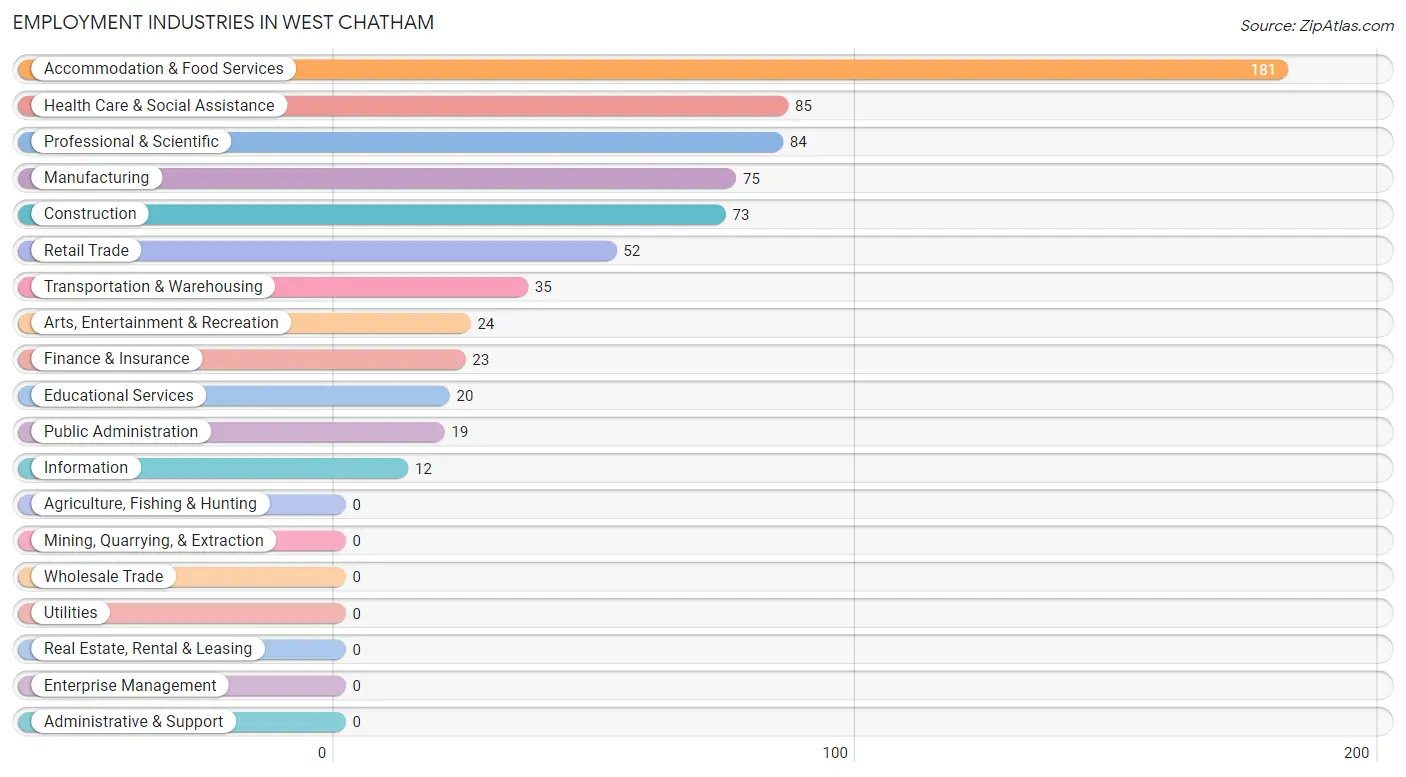
Employment Industries in West Chatham
The major employment industries in West Chatham include Accommodation & Food Services (181 | 26.5%), Health Care & Social Assistance (85 | 12.4%), Professional & Scientific (84 | 12.3%), Manufacturing (75 | 11.0%), and Construction (73 | 10.7%).
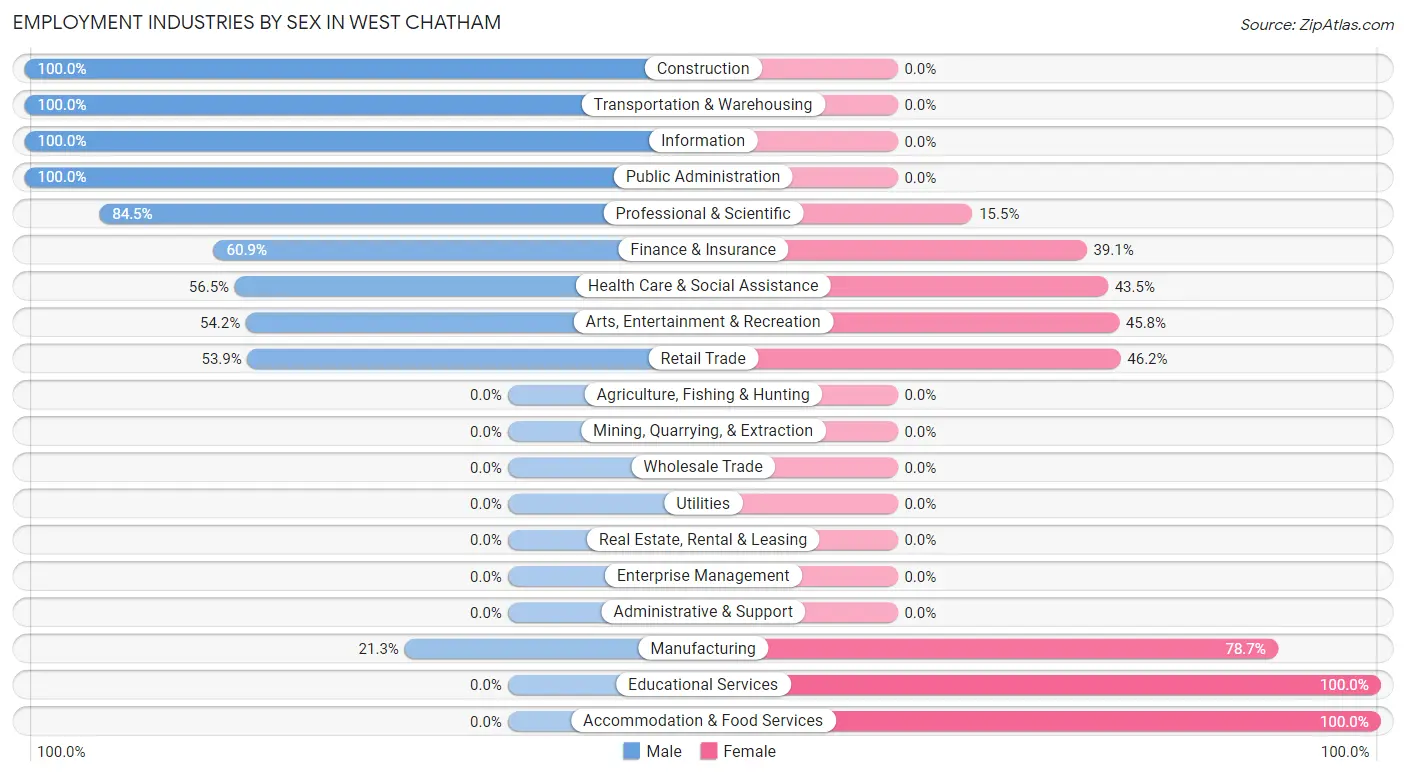
Employment Industries by Sex in West Chatham
The West Chatham industries that see more men than women are Construction (100.0%), Transportation & Warehousing (100.0%), and Information (100.0%), whereas the industries that tend to have a higher number of women are Educational Services (100.0%), Accommodation & Food Services (100.0%), and Manufacturing (78.7%).
| Industry | Male | Female |
| Agriculture, Fishing & Hunting | 0 (0.0%) | 0 (0.0%) |
| Mining, Quarrying, & Extraction | 0 (0.0%) | 0 (0.0%) |
| Construction | 73 (100.0%) | 0 (0.0%) |
| Manufacturing | 16 (21.3%) | 59 (78.7%) |
| Wholesale Trade | 0 (0.0%) | 0 (0.0%) |
| Retail Trade | 28 (53.8%) | 24 (46.2%) |
| Transportation & Warehousing | 35 (100.0%) | 0 (0.0%) |
| Utilities | 0 (0.0%) | 0 (0.0%) |
| Information | 12 (100.0%) | 0 (0.0%) |
| Finance & Insurance | 14 (60.9%) | 9 (39.1%) |
| Real Estate, Rental & Leasing | 0 (0.0%) | 0 (0.0%) |
| Professional & Scientific | 71 (84.5%) | 13 (15.5%) |
| Enterprise Management | 0 (0.0%) | 0 (0.0%) |
| Administrative & Support | 0 (0.0%) | 0 (0.0%) |
| Educational Services | 0 (0.0%) | 20 (100.0%) |
| Health Care & Social Assistance | 48 (56.5%) | 37 (43.5%) |
| Arts, Entertainment & Recreation | 13 (54.2%) | 11 (45.8%) |
| Accommodation & Food Services | 0 (0.0%) | 181 (100.0%) |
| Public Administration | 19 (100.0%) | 0 (0.0%) |
| Total | 329 (48.2%) | 354 (51.8%) |
Education in West Chatham
School Enrollment in West Chatham
The most common levels of schooling among the 148 students in West Chatham are college / undergraduate (61 | 41.2%), middle school (56 | 37.8%), and nursery / preschool (31 | 20.9%).
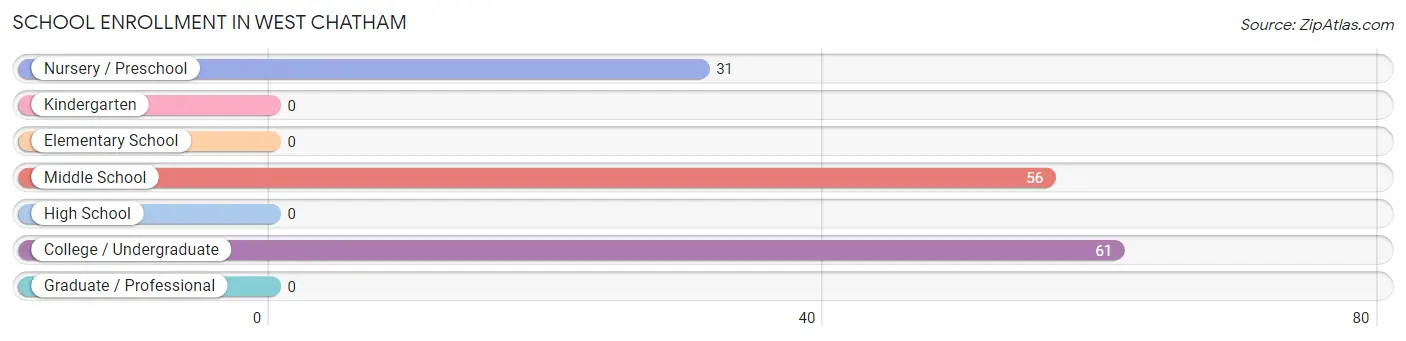
| School Level | # Students | % Students |
| Nursery / Preschool | 31 | 20.9% |
| Kindergarten | 0 | 0.0% |
| Elementary School | 0 | 0.0% |
| Middle School | 56 | 37.8% |
| High School | 0 | 0.0% |
| College / Undergraduate | 61 | 41.2% |
| Graduate / Professional | 0 | 0.0% |
| Total | 148 | 100.0% |
School Enrollment by Age by Funding Source in West Chatham
Out of a total of 148 students who are enrolled in schools in West Chatham, 59 (39.9%) attend a private institution, while the remaining 89 (60.1%) are enrolled in public schools. The age group of 5 to 9 year old has the highest likelihood of being enrolled in private schools, with 31 (100.0% in the age bracket) enrolled. Conversely, the age group of 10 to 14 year olds has the lowest likelihood of being enrolled in a private school, with 56 (100.0% in the age bracket) attending a public institution.
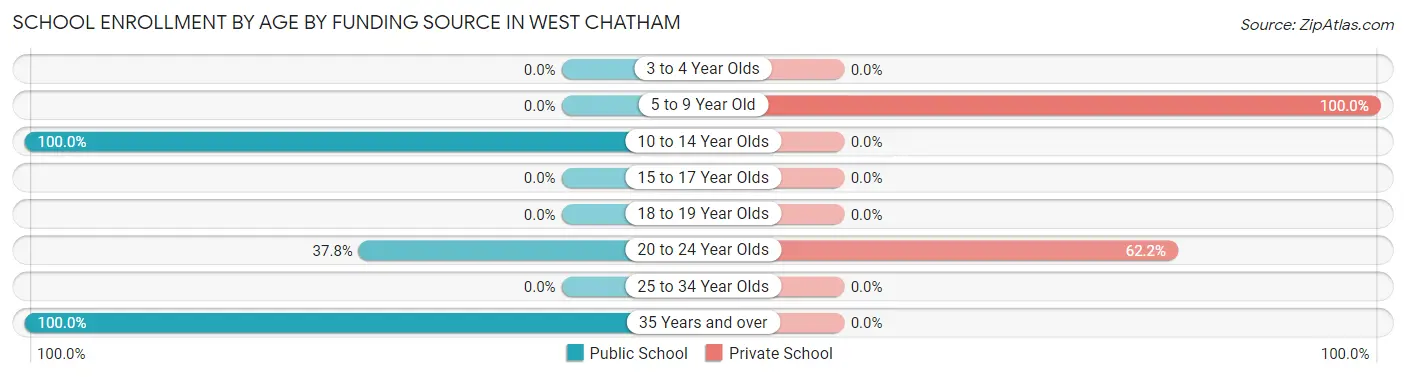
| Age Bracket | Public School | Private School |
| 3 to 4 Year Olds | 0 (0.0%) | 0 (0.0%) |
| 5 to 9 Year Old | 0 (0.0%) | 31 (100.0%) |
| 10 to 14 Year Olds | 56 (100.0%) | 0 (0.0%) |
| 15 to 17 Year Olds | 0 (0.0%) | 0 (0.0%) |
| 18 to 19 Year Olds | 0 (0.0%) | 0 (0.0%) |
| 20 to 24 Year Olds | 17 (37.8%) | 28 (62.2%) |
| 25 to 34 Year Olds | 0 (0.0%) | 0 (0.0%) |
| 35 Years and over | 16 (100.0%) | 0 (0.0%) |
| Total | 89 (60.1%) | 59 (39.9%) |
Educational Attainment by Field of Study in West Chatham
Education (284 | 28.5%), social sciences (165 | 16.6%), bio, nature & agricultural (82 | 8.2%), arts & humanities (75 | 7.5%), and liberal arts & history (70 | 7.0%) are the most common fields of study among 997 individuals in West Chatham who have obtained a bachelor's degree or higher.
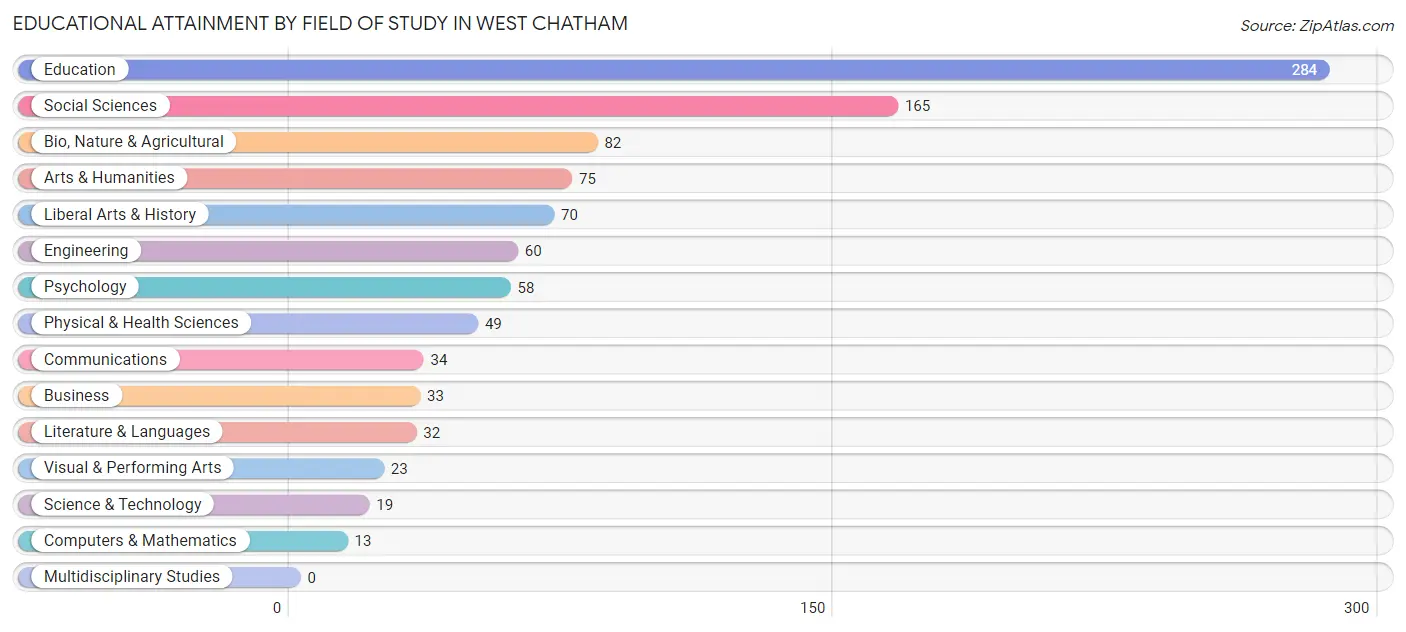
| Field of Study | # Graduates | % Graduates |
| Computers & Mathematics | 13 | 1.3% |
| Bio, Nature & Agricultural | 82 | 8.2% |
| Physical & Health Sciences | 49 | 4.9% |
| Psychology | 58 | 5.8% |
| Social Sciences | 165 | 16.6% |
| Engineering | 60 | 6.0% |
| Multidisciplinary Studies | 0 | 0.0% |
| Science & Technology | 19 | 1.9% |
| Business | 33 | 3.3% |
| Education | 284 | 28.5% |
| Literature & Languages | 32 | 3.2% |
| Liberal Arts & History | 70 | 7.0% |
| Visual & Performing Arts | 23 | 2.3% |
| Communications | 34 | 3.4% |
| Arts & Humanities | 75 | 7.5% |
| Total | 997 | 100.0% |
Transportation & Commute in West Chatham
Vehicle Availability by Sex in West Chatham
The most prevalent vehicle ownership categories in West Chatham are males with 2 vehicles (203, accounting for 61.7%) and females with 2 vehicles (297, making up 57.3%).
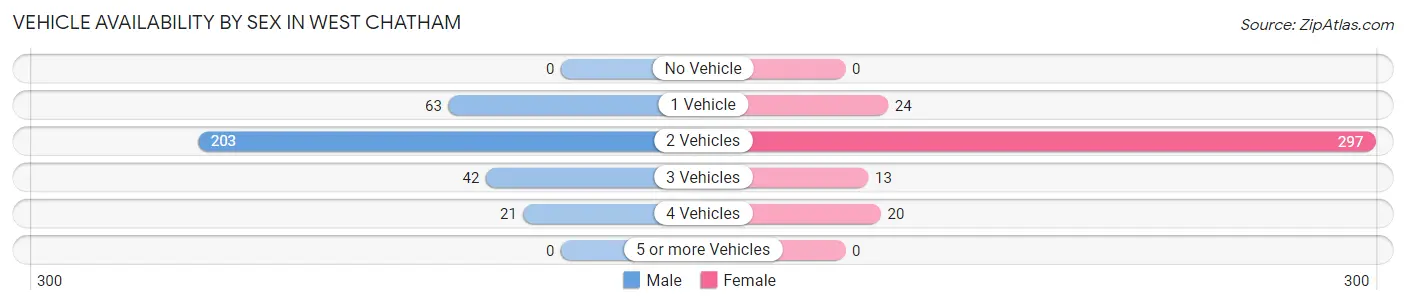
| Vehicles Available | Male | Female |
| No Vehicle | 0 (0.0%) | 0 (0.0%) |
| 1 Vehicle | 63 (19.2%) | 24 (6.8%) |
| 2 Vehicles | 203 (61.7%) | 297 (83.9%) |
| 3 Vehicles | 42 (12.8%) | 13 (3.7%) |
| 4 Vehicles | 21 (6.4%) | 20 (5.7%) |
| 5 or more Vehicles | 0 (0.0%) | 0 (0.0%) |
| Total | 329 (100.0%) | 354 (100.0%) |
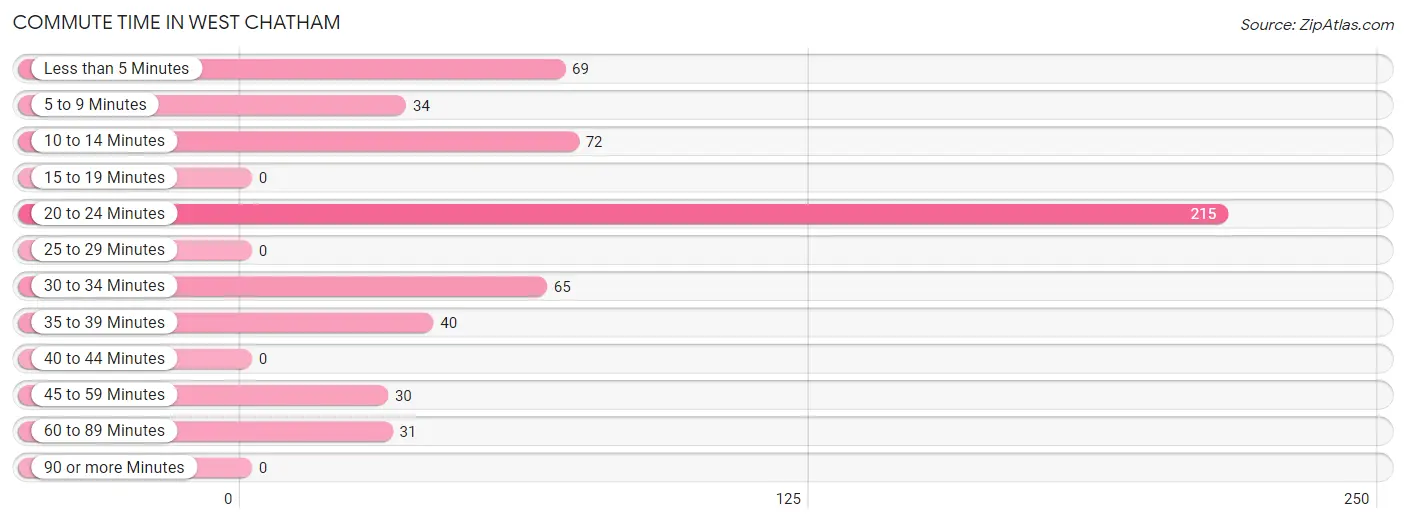
Commute Time in West Chatham
The most frequently occuring commute durations in West Chatham are 20 to 24 minutes (215 commuters, 38.7%), 10 to 14 minutes (72 commuters, 13.0%), and less than 5 minutes (69 commuters, 12.4%).
| Commute Time | # Commuters | % Commuters |
| Less than 5 Minutes | 69 | 12.4% |
| 5 to 9 Minutes | 34 | 6.1% |
| 10 to 14 Minutes | 72 | 13.0% |
| 15 to 19 Minutes | 0 | 0.0% |
| 20 to 24 Minutes | 215 | 38.7% |
| 25 to 29 Minutes | 0 | 0.0% |
| 30 to 34 Minutes | 65 | 11.7% |
| 35 to 39 Minutes | 40 | 7.2% |
| 40 to 44 Minutes | 0 | 0.0% |
| 45 to 59 Minutes | 30 | 5.4% |
| 60 to 89 Minutes | 31 | 5.6% |
| 90 or more Minutes | 0 | 0.0% |
Commute Time by Sex in West Chatham
The most common commute times in West Chatham are 10 to 14 minutes (72 commuters, 30.0%) for males and 20 to 24 minutes (196 commuters, 62.0%) for females.
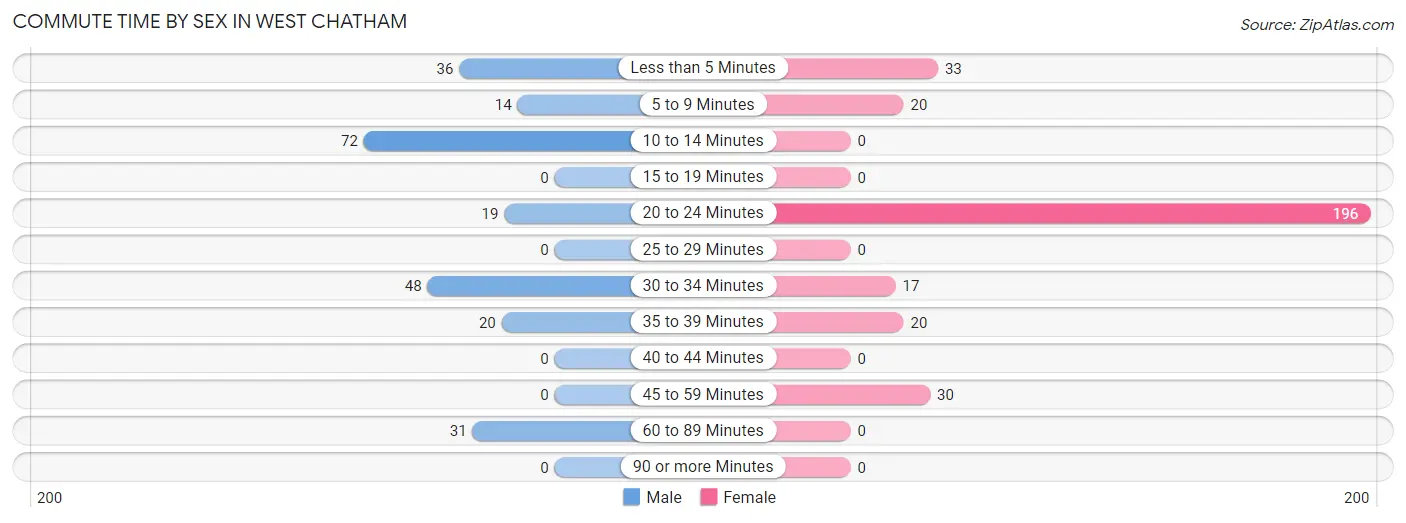
| Commute Time | Male | Female |
| Less than 5 Minutes | 36 (15.0%) | 33 (10.4%) |
| 5 to 9 Minutes | 14 (5.8%) | 20 (6.3%) |
| 10 to 14 Minutes | 72 (30.0%) | 0 (0.0%) |
| 15 to 19 Minutes | 0 (0.0%) | 0 (0.0%) |
| 20 to 24 Minutes | 19 (7.9%) | 196 (62.0%) |
| 25 to 29 Minutes | 0 (0.0%) | 0 (0.0%) |
| 30 to 34 Minutes | 48 (20.0%) | 17 (5.4%) |
| 35 to 39 Minutes | 20 (8.3%) | 20 (6.3%) |
| 40 to 44 Minutes | 0 (0.0%) | 0 (0.0%) |
| 45 to 59 Minutes | 0 (0.0%) | 30 (9.5%) |
| 60 to 89 Minutes | 31 (12.9%) | 0 (0.0%) |
| 90 or more Minutes | 0 (0.0%) | 0 (0.0%) |
Time of Departure to Work by Sex in West Chatham
The most frequent times of departure to work in West Chatham are 7:30 AM to 7:59 AM (46, 19.2%) for males and 7:30 AM to 7:59 AM (143, 45.3%) for females.
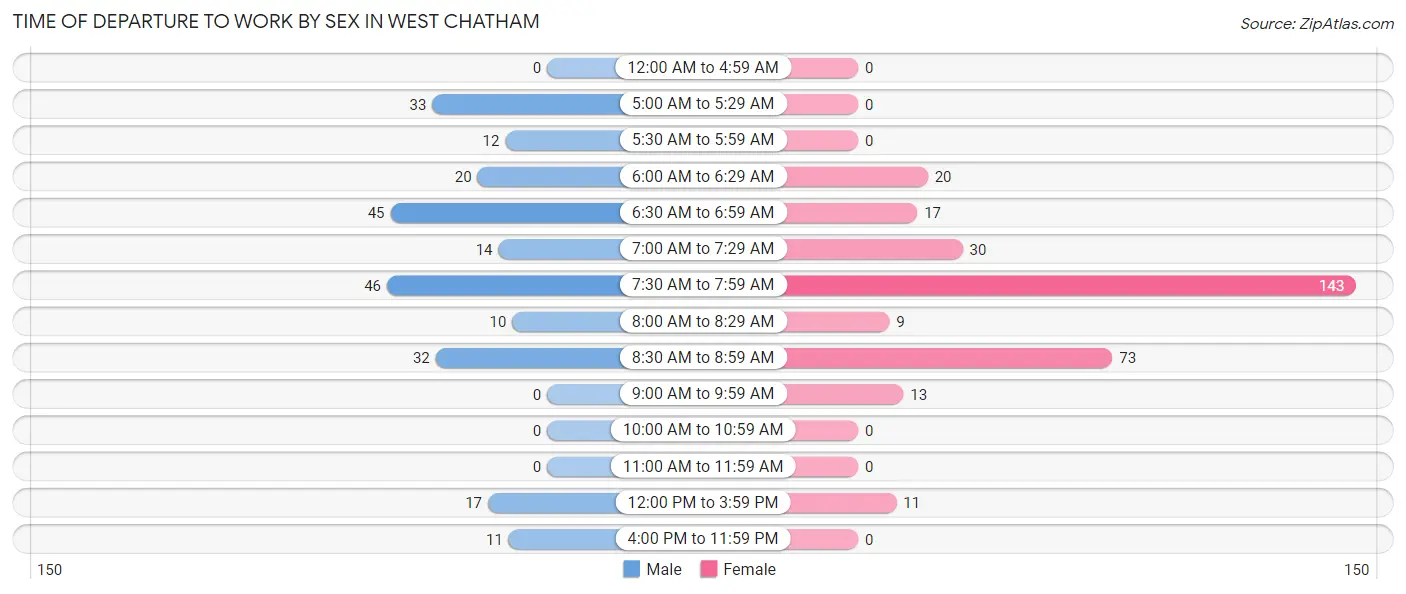
| Time of Departure | Male | Female |
| 12:00 AM to 4:59 AM | 0 (0.0%) | 0 (0.0%) |
| 5:00 AM to 5:29 AM | 33 (13.8%) | 0 (0.0%) |
| 5:30 AM to 5:59 AM | 12 (5.0%) | 0 (0.0%) |
| 6:00 AM to 6:29 AM | 20 (8.3%) | 20 (6.3%) |
| 6:30 AM to 6:59 AM | 45 (18.8%) | 17 (5.4%) |
| 7:00 AM to 7:29 AM | 14 (5.8%) | 30 (9.5%) |
| 7:30 AM to 7:59 AM | 46 (19.2%) | 143 (45.3%) |
| 8:00 AM to 8:29 AM | 10 (4.2%) | 9 (2.9%) |
| 8:30 AM to 8:59 AM | 32 (13.3%) | 73 (23.1%) |
| 9:00 AM to 9:59 AM | 0 (0.0%) | 13 (4.1%) |
| 10:00 AM to 10:59 AM | 0 (0.0%) | 0 (0.0%) |
| 11:00 AM to 11:59 AM | 0 (0.0%) | 0 (0.0%) |
| 12:00 PM to 3:59 PM | 17 (7.1%) | 11 (3.5%) |
| 4:00 PM to 11:59 PM | 11 (4.6%) | 0 (0.0%) |
| Total | 240 (100.0%) | 316 (100.0%) |
Housing Occupancy in West Chatham
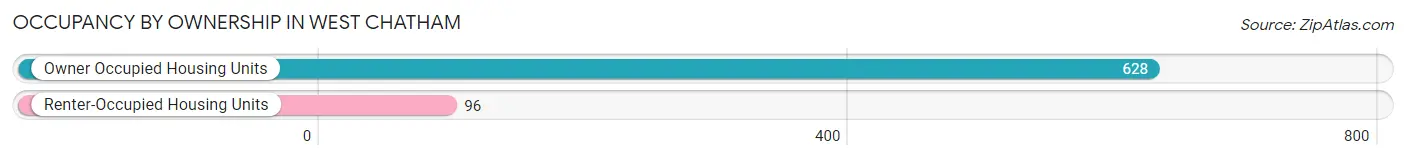
Occupancy by Ownership in West Chatham
Of the total 724 dwellings in West Chatham, owner-occupied units account for 628 (86.7%), while renter-occupied units make up 96 (13.3%).
| Occupancy | # Housing Units | % Housing Units |
| Owner Occupied Housing Units | 628 | 86.7% |
| Renter-Occupied Housing Units | 96 | 13.3% |
| Total Occupied Housing Units | 724 | 100.0% |
Occupancy by Household Size in West Chatham
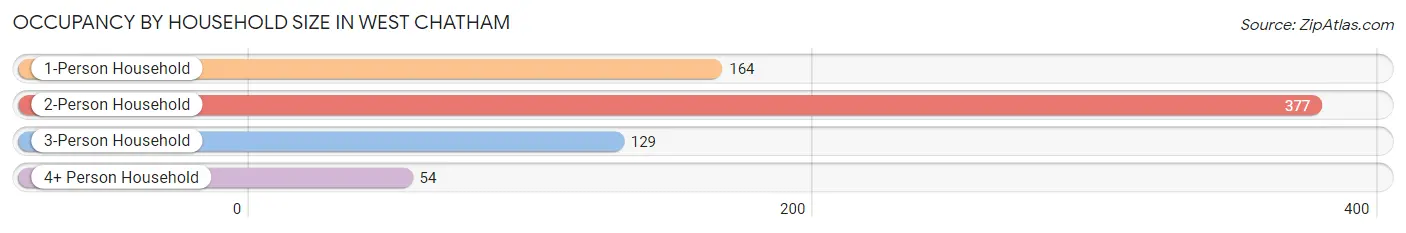
| Household Size | # Housing Units | % Housing Units |
| 1-Person Household | 164 | 22.7% |
| 2-Person Household | 377 | 52.1% |
| 3-Person Household | 129 | 17.8% |
| 4+ Person Household | 54 | 7.5% |
| Total Housing Units | 724 | 100.0% |
Occupancy by Ownership by Household Size in West Chatham
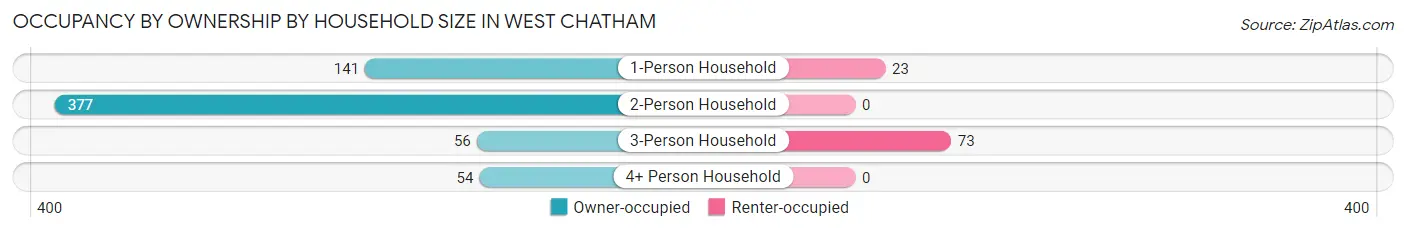
| Household Size | Owner-occupied | Renter-occupied |
| 1-Person Household | 141 (86.0%) | 23 (14.0%) |
| 2-Person Household | 377 (100.0%) | 0 (0.0%) |
| 3-Person Household | 56 (43.4%) | 73 (56.6%) |
| 4+ Person Household | 54 (100.0%) | 0 (0.0%) |
| Total Housing Units | 628 (86.7%) | 96 (13.3%) |
Occupancy by Educational Attainment in West Chatham
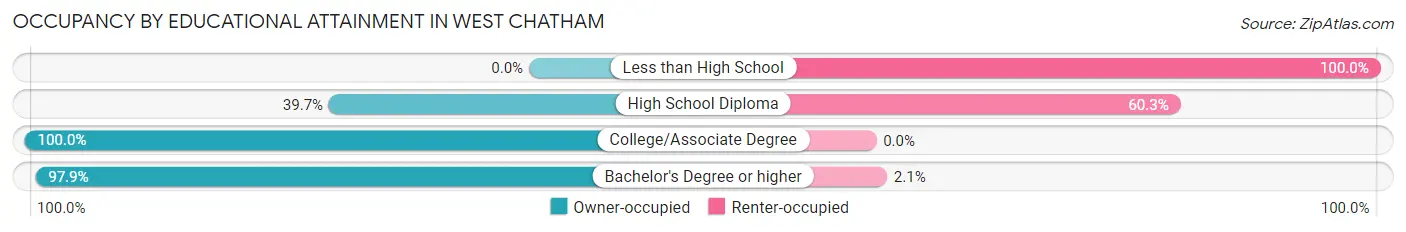
| Household Size | Owner-occupied | Renter-occupied |
| Less than High School | 0 (0.0%) | 11 (100.0%) |
| High School Diploma | 48 (39.7%) | 73 (60.3%) |
| College/Associate Degree | 29 (100.0%) | 0 (0.0%) |
| Bachelor's Degree or higher | 551 (97.9%) | 12 (2.1%) |
Occupancy by Age of Householder in West Chatham
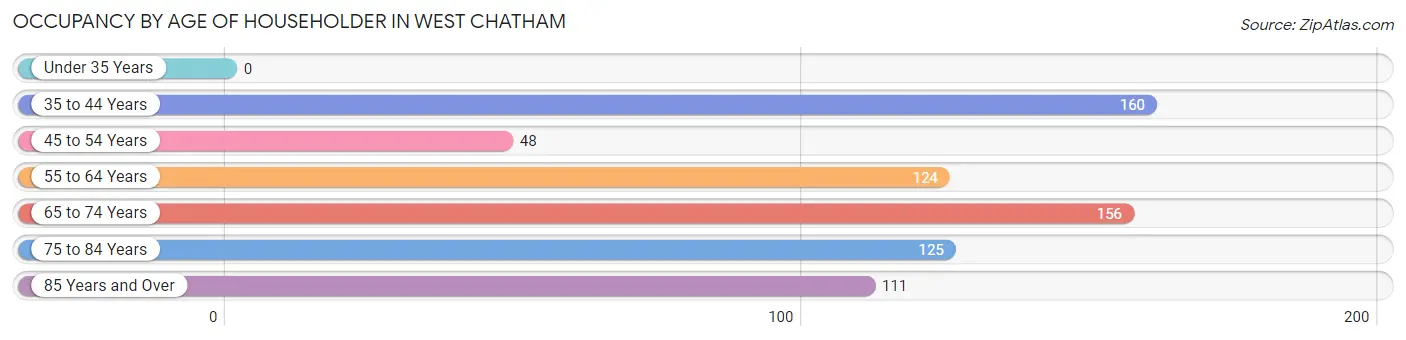
| Age Bracket | # Households | % Households |
| Under 35 Years | 0 | 0.0% |
| 35 to 44 Years | 160 | 22.1% |
| 45 to 54 Years | 48 | 6.6% |
| 55 to 64 Years | 124 | 17.1% |
| 65 to 74 Years | 156 | 21.5% |
| 75 to 84 Years | 125 | 17.3% |
| 85 Years and Over | 111 | 15.3% |
| Total | 724 | 100.0% |
Housing Finances in West Chatham
Median Income by Occupancy in West Chatham
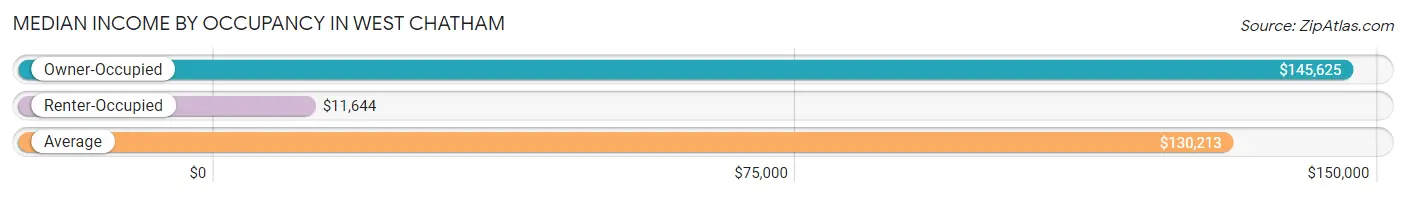
| Occupancy Type | # Households | Median Income |
| Owner-Occupied | 628 (86.7%) | $145,625 |
| Renter-Occupied | 96 (13.3%) | $11,644 |
| Average | 724 (100.0%) | $130,213 |
Occupancy by Householder Income Bracket in West Chatham
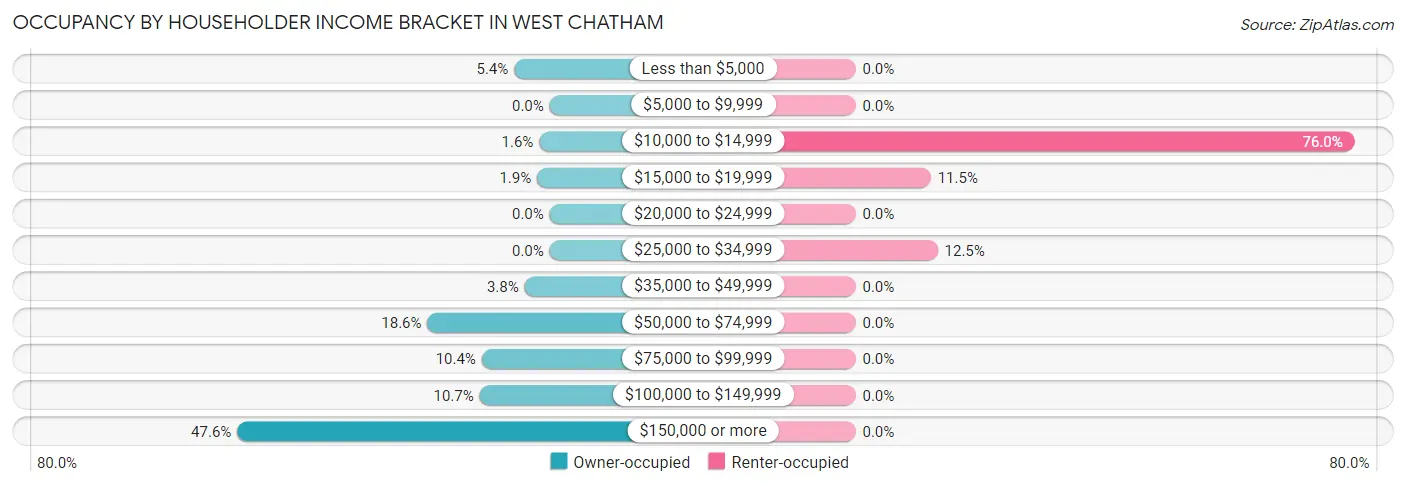
| Income Bracket | Owner-occupied | Renter-occupied |
| Less than $5,000 | 34 (5.4%) | 0 (0.0%) |
| $5,000 to $9,999 | 0 (0.0%) | 0 (0.0%) |
| $10,000 to $14,999 | 10 (1.6%) | 73 (76.0%) |
| $15,000 to $19,999 | 12 (1.9%) | 11 (11.5%) |
| $20,000 to $24,999 | 0 (0.0%) | 0 (0.0%) |
| $25,000 to $34,999 | 0 (0.0%) | 12 (12.5%) |
| $35,000 to $49,999 | 24 (3.8%) | 0 (0.0%) |
| $50,000 to $74,999 | 117 (18.6%) | 0 (0.0%) |
| $75,000 to $99,999 | 65 (10.3%) | 0 (0.0%) |
| $100,000 to $149,999 | 67 (10.7%) | 0 (0.0%) |
| $150,000 or more | 299 (47.6%) | 0 (0.0%) |
| Total | 628 (100.0%) | 96 (100.0%) |
Monthly Housing Cost Tiers in West Chatham
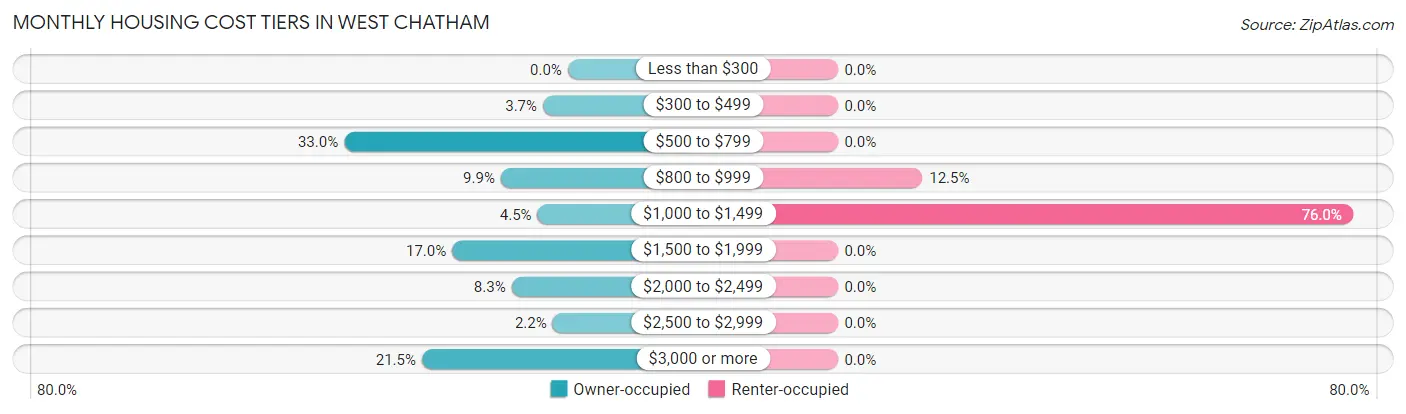
| Monthly Cost | Owner-occupied | Renter-occupied |
| Less than $300 | 0 (0.0%) | 0 (0.0%) |
| $300 to $499 | 23 (3.7%) | 0 (0.0%) |
| $500 to $799 | 207 (33.0%) | 0 (0.0%) |
| $800 to $999 | 62 (9.9%) | 12 (12.5%) |
| $1,000 to $1,499 | 28 (4.5%) | 73 (76.0%) |
| $1,500 to $1,999 | 107 (17.0%) | 0 (0.0%) |
| $2,000 to $2,499 | 52 (8.3%) | 0 (0.0%) |
| $2,500 to $2,999 | 14 (2.2%) | 0 (0.0%) |
| $3,000 or more | 135 (21.5%) | 0 (0.0%) |
| Total | 628 (100.0%) | 96 (100.0%) |
Physical Housing Characteristics in West Chatham
Housing Structures in West Chatham
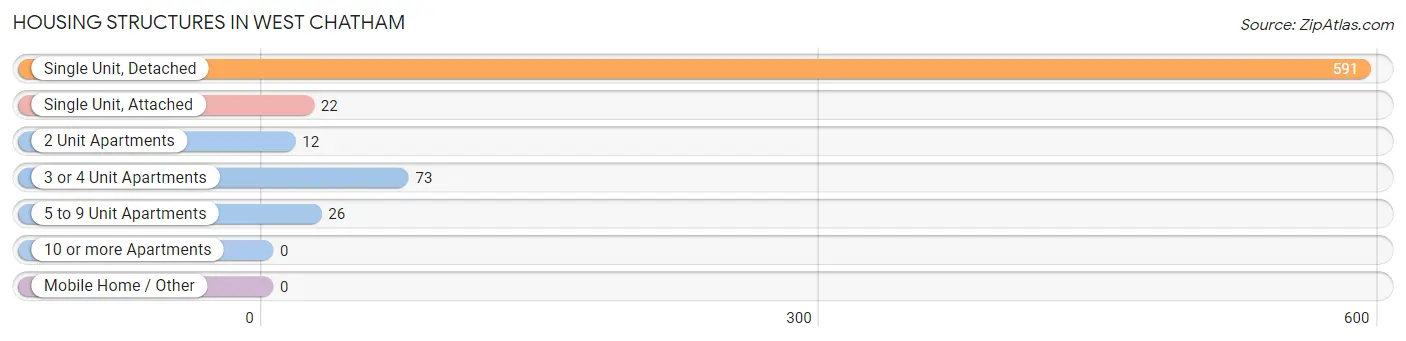
| Structure Type | # Housing Units | % Housing Units |
| Single Unit, Detached | 591 | 81.6% |
| Single Unit, Attached | 22 | 3.0% |
| 2 Unit Apartments | 12 | 1.7% |
| 3 or 4 Unit Apartments | 73 | 10.1% |
| 5 to 9 Unit Apartments | 26 | 3.6% |
| 10 or more Apartments | 0 | 0.0% |
| Mobile Home / Other | 0 | 0.0% |
| Total | 724 | 100.0% |
Housing Structures by Occupancy in West Chatham
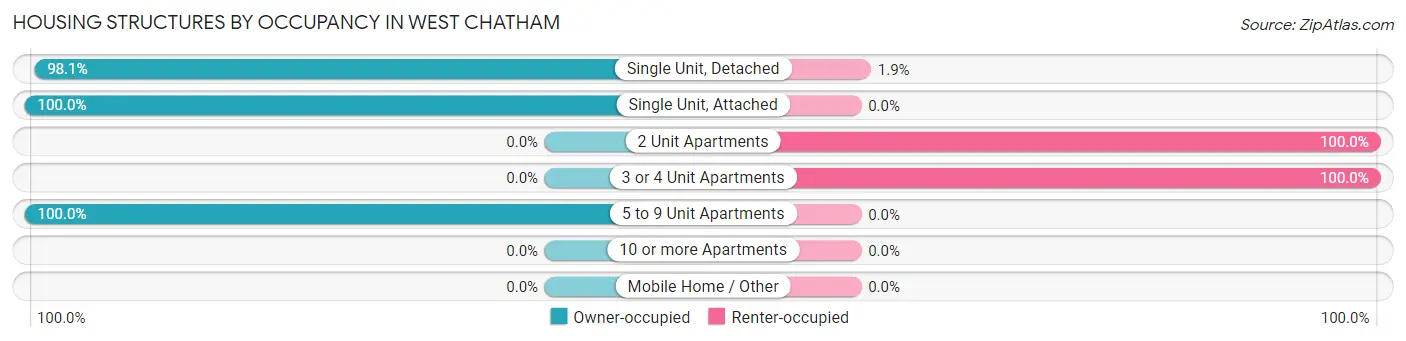
| Structure Type | Owner-occupied | Renter-occupied |
| Single Unit, Detached | 580 (98.1%) | 11 (1.9%) |
| Single Unit, Attached | 22 (100.0%) | 0 (0.0%) |
| 2 Unit Apartments | 0 (0.0%) | 12 (100.0%) |
| 3 or 4 Unit Apartments | 0 (0.0%) | 73 (100.0%) |
| 5 to 9 Unit Apartments | 26 (100.0%) | 0 (0.0%) |
| 10 or more Apartments | 0 (0.0%) | 0 (0.0%) |
| Mobile Home / Other | 0 (0.0%) | 0 (0.0%) |
| Total | 628 (86.7%) | 96 (13.3%) |
Housing Structures by Number of Rooms in West Chatham
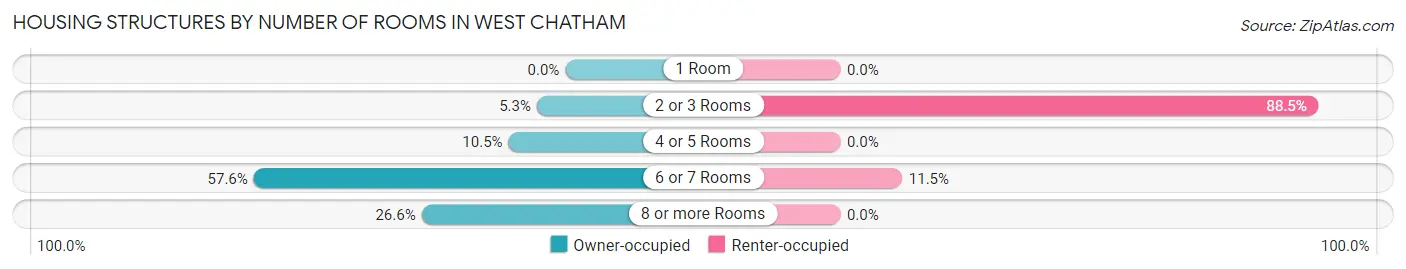
| Number of Rooms | Owner-occupied | Renter-occupied |
| 1 Room | 0 (0.0%) | 0 (0.0%) |
| 2 or 3 Rooms | 33 (5.2%) | 85 (88.5%) |
| 4 or 5 Rooms | 66 (10.5%) | 0 (0.0%) |
| 6 or 7 Rooms | 362 (57.6%) | 11 (11.5%) |
| 8 or more Rooms | 167 (26.6%) | 0 (0.0%) |
| Total | 628 (100.0%) | 96 (100.0%) |
Housing Structure by Heating Type in West Chatham
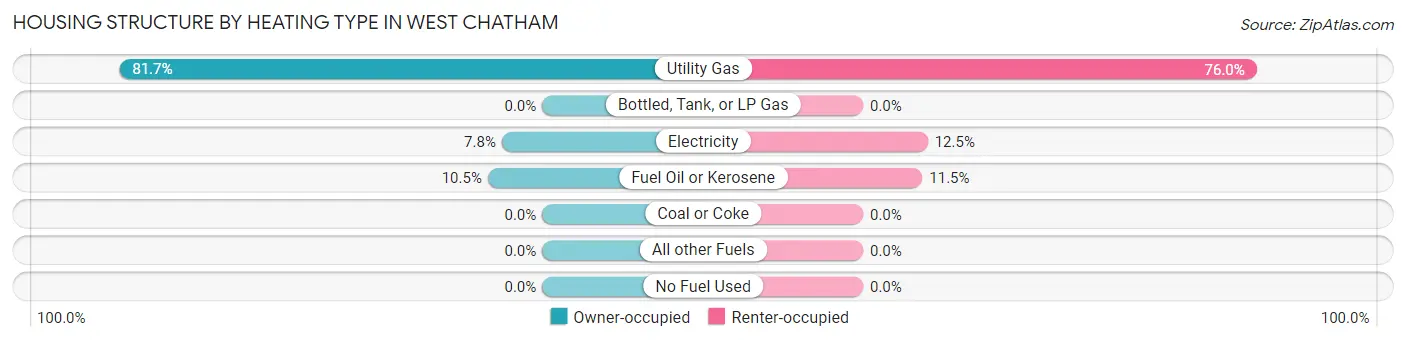
| Heating Type | Owner-occupied | Renter-occupied |
| Utility Gas | 513 (81.7%) | 73 (76.0%) |
| Bottled, Tank, or LP Gas | 0 (0.0%) | 0 (0.0%) |
| Electricity | 49 (7.8%) | 12 (12.5%) |
| Fuel Oil or Kerosene | 66 (10.5%) | 11 (11.5%) |
| Coal or Coke | 0 (0.0%) | 0 (0.0%) |
| All other Fuels | 0 (0.0%) | 0 (0.0%) |
| No Fuel Used | 0 (0.0%) | 0 (0.0%) |
| Total | 628 (100.0%) | 96 (100.0%) |
Household Vehicle Usage in West Chatham
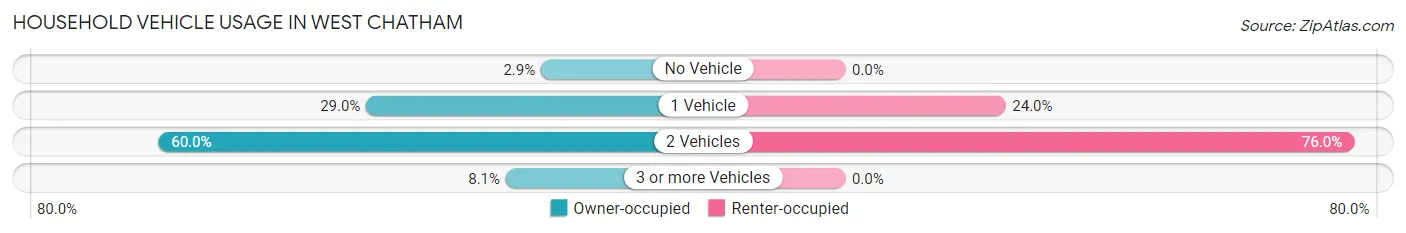
| Vehicles per Household | Owner-occupied | Renter-occupied |
| No Vehicle | 18 (2.9%) | 0 (0.0%) |
| 1 Vehicle | 182 (29.0%) | 23 (24.0%) |
| 2 Vehicles | 377 (60.0%) | 73 (76.0%) |
| 3 or more Vehicles | 51 (8.1%) | 0 (0.0%) |
| Total | 628 (100.0%) | 96 (100.0%) |
Real Estate & Mortgages in West Chatham
Real Estate and Mortgage Overview in West Chatham
| Characteristic | Without Mortgage | With Mortgage |
| Housing Units | 287 | 341 |
| Median Property Value | $758,600 | $670,400 |
| Median Household Income | $91,625 | $206 |
| Monthly Housing Costs | $672 | $135 |
| Real Estate Taxes | $3,152 | $0 |
Property Value by Mortgage Status in West Chatham
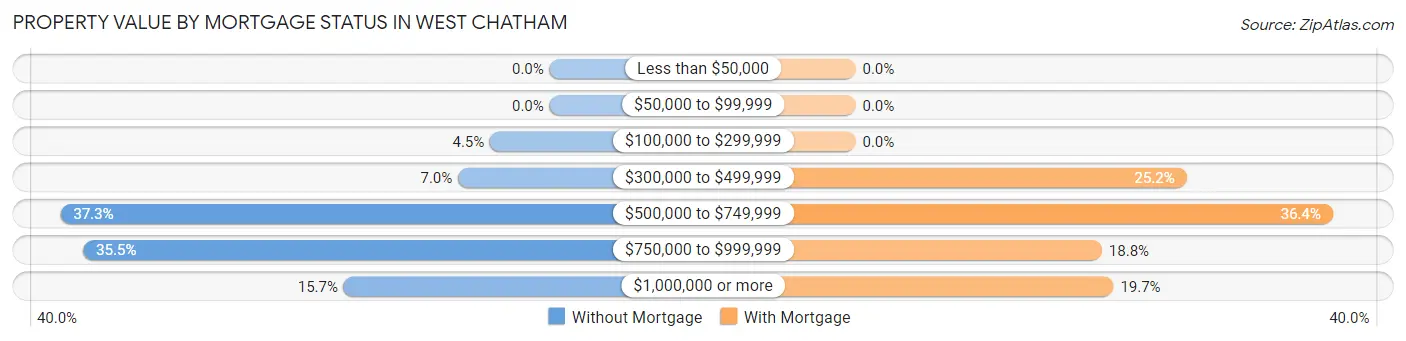
| Property Value | Without Mortgage | With Mortgage |
| Less than $50,000 | 0 (0.0%) | 0 (0.0%) |
| $50,000 to $99,999 | 0 (0.0%) | 0 (0.0%) |
| $100,000 to $299,999 | 13 (4.5%) | 0 (0.0%) |
| $300,000 to $499,999 | 20 (7.0%) | 86 (25.2%) |
| $500,000 to $749,999 | 107 (37.3%) | 124 (36.4%) |
| $750,000 to $999,999 | 102 (35.5%) | 64 (18.8%) |
| $1,000,000 or more | 45 (15.7%) | 67 (19.7%) |
| Total | 287 (100.0%) | 341 (100.0%) |
Household Income by Mortgage Status in West Chatham
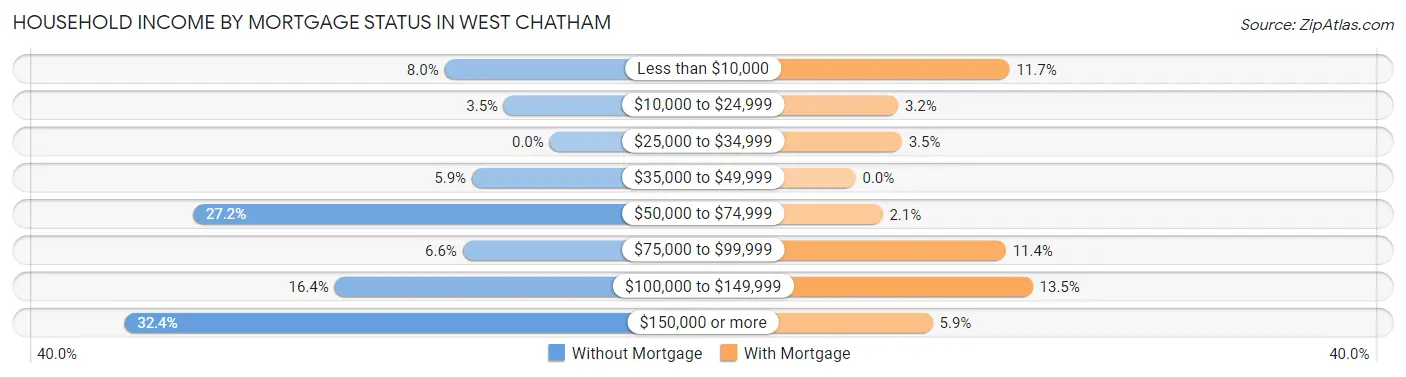
| Household Income | Without Mortgage | With Mortgage |
| Less than $10,000 | 23 (8.0%) | 40 (11.7%) |
| $10,000 to $24,999 | 10 (3.5%) | 11 (3.2%) |
| $25,000 to $34,999 | 0 (0.0%) | 12 (3.5%) |
| $35,000 to $49,999 | 17 (5.9%) | 0 (0.0%) |
| $50,000 to $74,999 | 78 (27.2%) | 7 (2.1%) |
| $75,000 to $99,999 | 19 (6.6%) | 39 (11.4%) |
| $100,000 to $149,999 | 47 (16.4%) | 46 (13.5%) |
| $150,000 or more | 93 (32.4%) | 20 (5.9%) |
| Total | 287 (100.0%) | 341 (100.0%) |
Property Value to Household Income Ratio in West Chatham
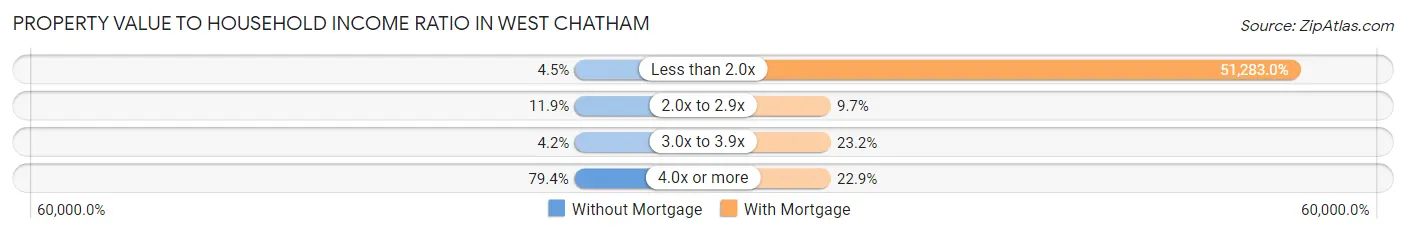
| Value-to-Income Ratio | Without Mortgage | With Mortgage |
| Less than 2.0x | 13 (4.5%) | 174,875 (51,283.0%) |
| 2.0x to 2.9x | 34 (11.8%) | 33 (9.7%) |
| 3.0x to 3.9x | 12 (4.2%) | 79 (23.2%) |
| 4.0x or more | 228 (79.4%) | 78 (22.9%) |
| Total | 287 (100.0%) | 341 (100.0%) |
Real Estate Taxes by Mortgage Status in West Chatham
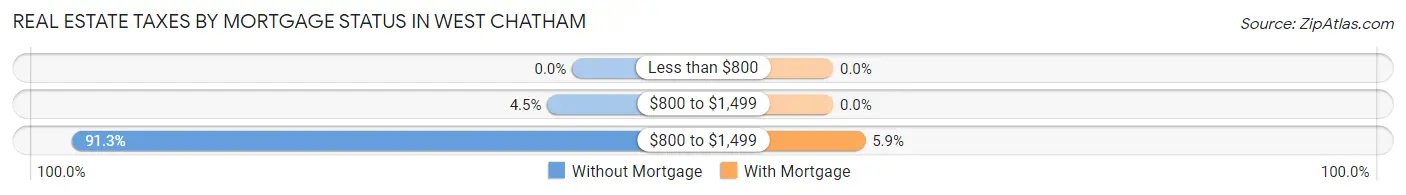
| Property Taxes | Without Mortgage | With Mortgage |
| Less than $800 | 0 (0.0%) | 0 (0.0%) |
| $800 to $1,499 | 13 (4.5%) | 0 (0.0%) |
| $800 to $1,499 | 262 (91.3%) | 20 (5.9%) |
| Total | 287 (100.0%) | 341 (100.0%) |
Health & Disability in West Chatham
Health Insurance Coverage by Age in West Chatham
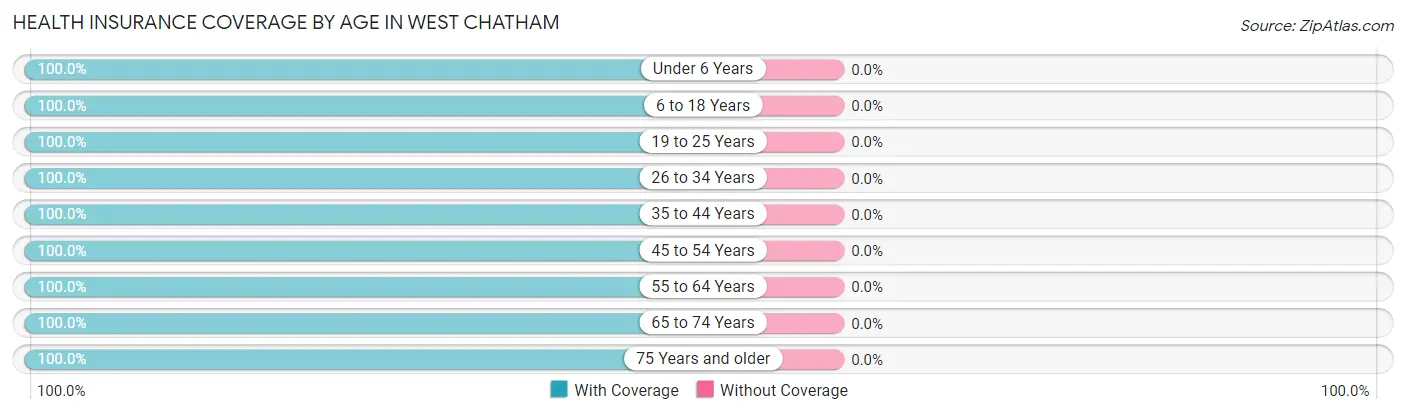
| Age Bracket | With Coverage | Without Coverage |
| Under 6 Years | 143 (100.0%) | 0 (0.0%) |
| 6 to 18 Years | 56 (100.0%) | 0 (0.0%) |
| 19 to 25 Years | 172 (100.0%) | 0 (0.0%) |
| 26 to 34 Years | 81 (100.0%) | 0 (0.0%) |
| 35 to 44 Years | 160 (100.0%) | 0 (0.0%) |
| 45 to 54 Years | 111 (100.0%) | 0 (0.0%) |
| 55 to 64 Years | 171 (100.0%) | 0 (0.0%) |
| 65 to 74 Years | 302 (100.0%) | 0 (0.0%) |
| 75 Years and older | 437 (100.0%) | 0 (0.0%) |
| Total | 1,633 (100.0%) | 0 (0.0%) |
Health Insurance Coverage by Citizenship Status in West Chatham
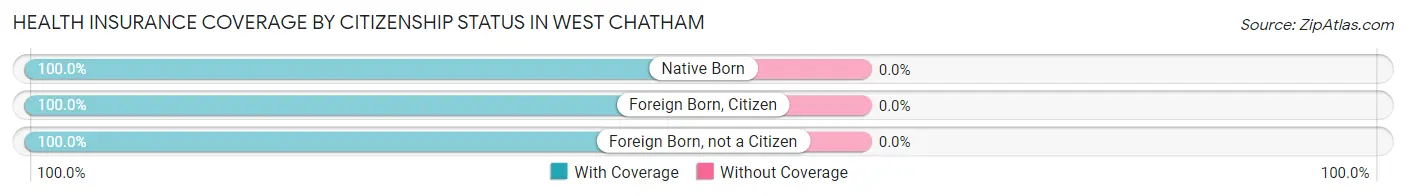
| Citizenship Status | With Coverage | Without Coverage |
| Native Born | 143 (100.0%) | 0 (0.0%) |
| Foreign Born, Citizen | 56 (100.0%) | 0 (0.0%) |
| Foreign Born, not a Citizen | 172 (100.0%) | 0 (0.0%) |
Health Insurance Coverage by Household Income in West Chatham
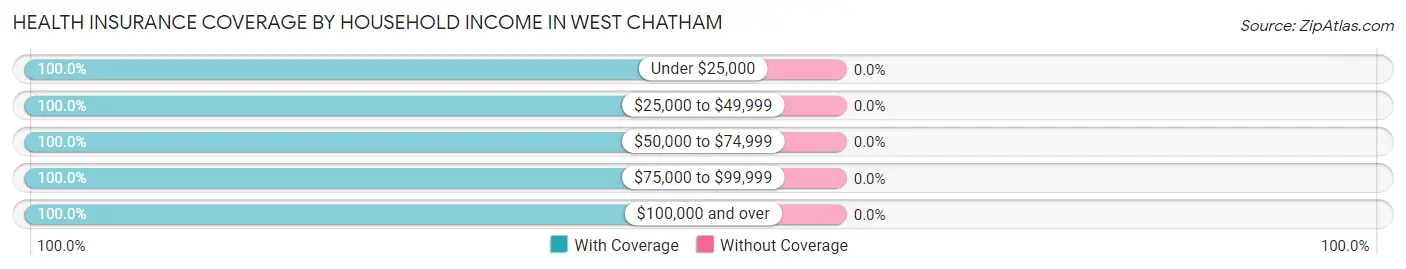
| Household Income | With Coverage | Without Coverage |
| Under $25,000 | 346 (100.0%) | 0 (0.0%) |
| $25,000 to $49,999 | 54 (100.0%) | 0 (0.0%) |
| $50,000 to $74,999 | 156 (100.0%) | 0 (0.0%) |
| $75,000 to $99,999 | 115 (100.0%) | 0 (0.0%) |
| $100,000 and over | 962 (100.0%) | 0 (0.0%) |
Public vs Private Health Insurance Coverage by Age in West Chatham
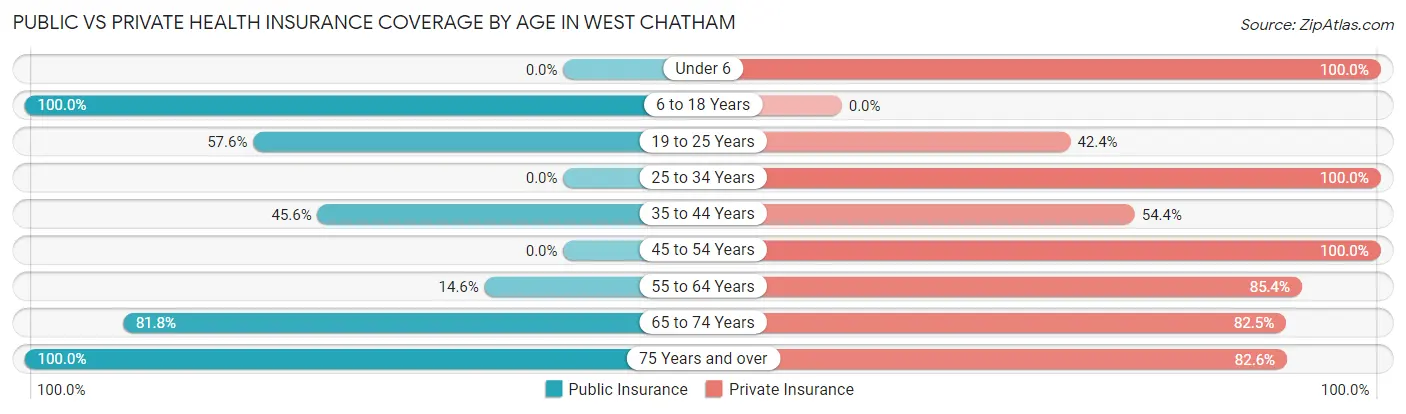
| Age Bracket | Public Insurance | Private Insurance |
| Under 6 | 0 (0.0%) | 143 (100.0%) |
| 6 to 18 Years | 56 (100.0%) | 0 (0.0%) |
| 19 to 25 Years | 99 (57.6%) | 73 (42.4%) |
| 25 to 34 Years | 0 (0.0%) | 81 (100.0%) |
| 35 to 44 Years | 73 (45.6%) | 87 (54.4%) |
| 45 to 54 Years | 0 (0.0%) | 111 (100.0%) |
| 55 to 64 Years | 25 (14.6%) | 146 (85.4%) |
| 65 to 74 Years | 247 (81.8%) | 249 (82.5%) |
| 75 Years and over | 437 (100.0%) | 361 (82.6%) |
| Total | 937 (57.4%) | 1,251 (76.6%) |
Disability Status by Sex by Age in West Chatham
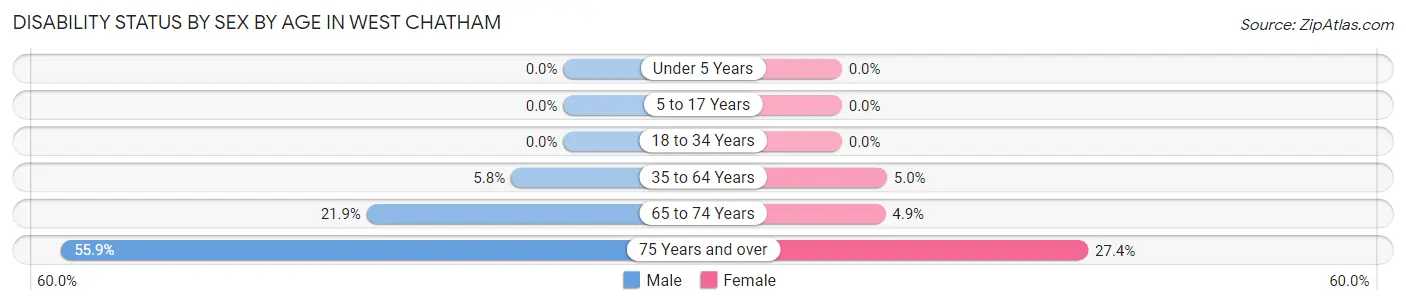
| Age Bracket | Male | Female |
| Under 5 Years | 0 (0.0%) | 0 (0.0%) |
| 5 to 17 Years | 0 (0.0%) | 0 (0.0%) |
| 18 to 34 Years | 0 (0.0%) | 0 (0.0%) |
| 35 to 64 Years | 13 (5.8%) | 11 (5.0%) |
| 65 to 74 Years | 30 (21.9%) | 8 (4.9%) |
| 75 Years and over | 118 (55.9%) | 62 (27.4%) |
Disability Class by Sex by Age in West Chatham
Disability Class: Hearing Difficulty
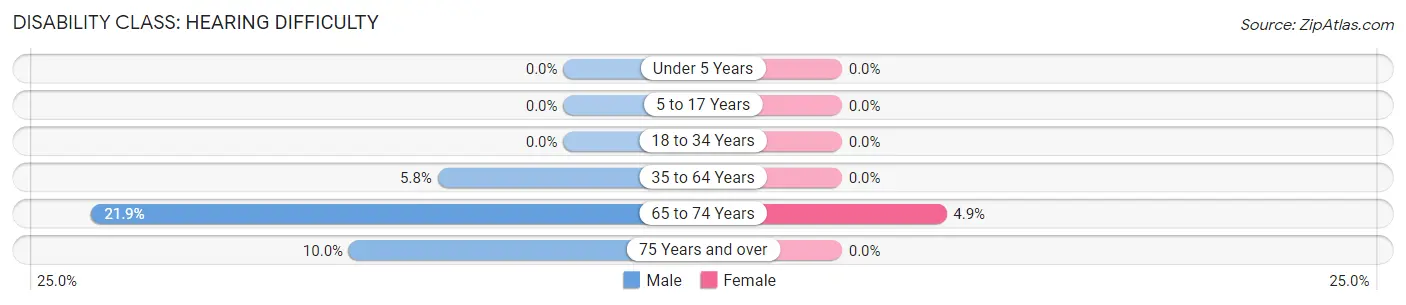
| Age Bracket | Male | Female |
| Under 5 Years | 0 (0.0%) | 0 (0.0%) |
| 5 to 17 Years | 0 (0.0%) | 0 (0.0%) |
| 18 to 34 Years | 0 (0.0%) | 0 (0.0%) |
| 35 to 64 Years | 13 (5.8%) | 0 (0.0%) |
| 65 to 74 Years | 30 (21.9%) | 8 (4.9%) |
| 75 Years and over | 21 (10.0%) | 0 (0.0%) |
Disability Class: Vision Difficulty
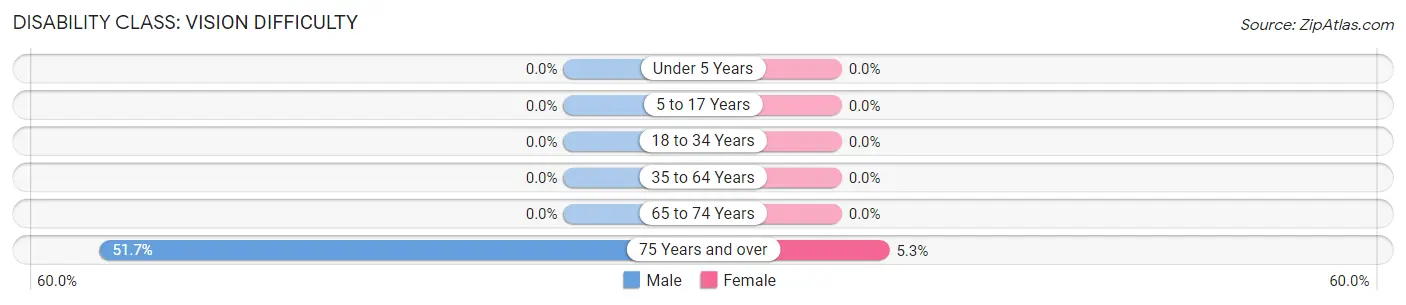
| Age Bracket | Male | Female |
| Under 5 Years | 0 (0.0%) | 0 (0.0%) |
| 5 to 17 Years | 0 (0.0%) | 0 (0.0%) |
| 18 to 34 Years | 0 (0.0%) | 0 (0.0%) |
| 35 to 64 Years | 0 (0.0%) | 0 (0.0%) |
| 65 to 74 Years | 0 (0.0%) | 0 (0.0%) |
| 75 Years and over | 109 (51.7%) | 12 (5.3%) |
Disability Class: Cognitive Difficulty
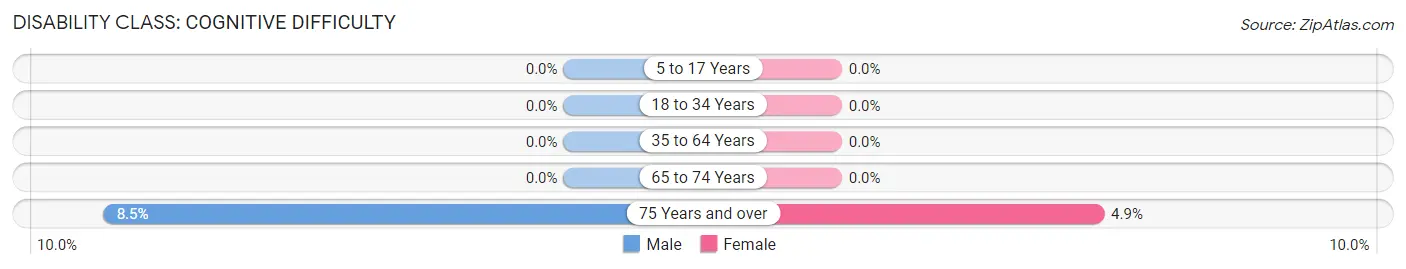
| Age Bracket | Male | Female |
| 5 to 17 Years | 0 (0.0%) | 0 (0.0%) |
| 18 to 34 Years | 0 (0.0%) | 0 (0.0%) |
| 35 to 64 Years | 0 (0.0%) | 0 (0.0%) |
| 65 to 74 Years | 0 (0.0%) | 0 (0.0%) |
| 75 Years and over | 18 (8.5%) | 11 (4.9%) |
Disability Class: Ambulatory Difficulty
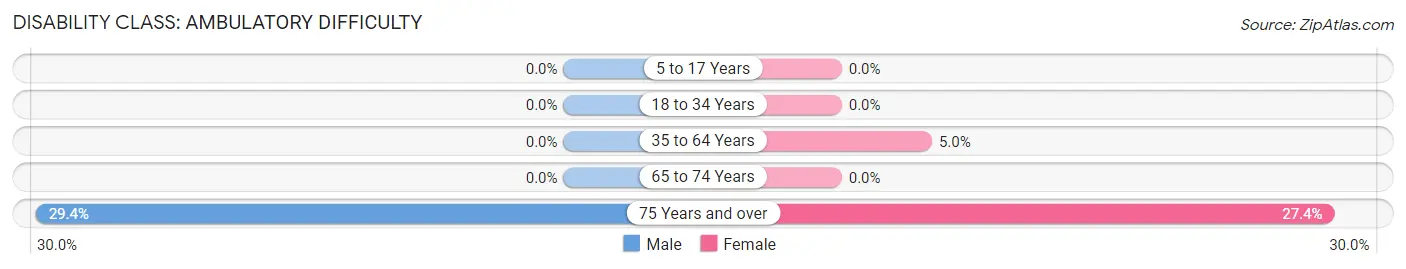
| Age Bracket | Male | Female |
| 5 to 17 Years | 0 (0.0%) | 0 (0.0%) |
| 18 to 34 Years | 0 (0.0%) | 0 (0.0%) |
| 35 to 64 Years | 0 (0.0%) | 11 (5.0%) |
| 65 to 74 Years | 0 (0.0%) | 0 (0.0%) |
| 75 Years and over | 62 (29.4%) | 62 (27.4%) |
Disability Class: Self-Care Difficulty
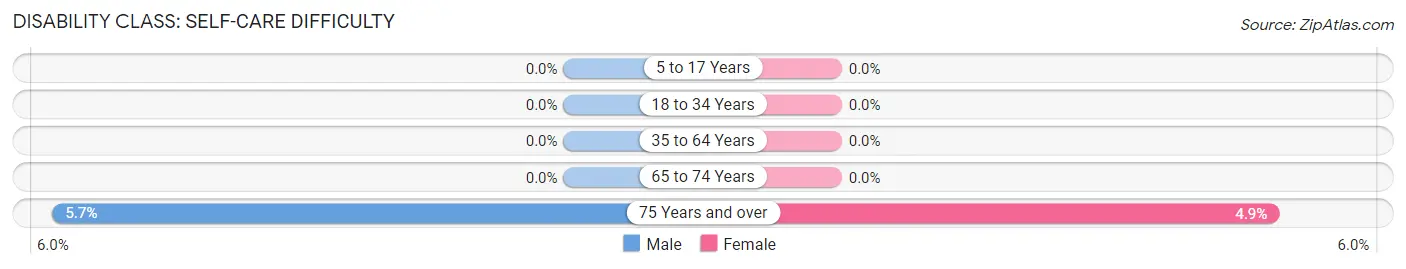
| Age Bracket | Male | Female |
| 5 to 17 Years | 0 (0.0%) | 0 (0.0%) |
| 18 to 34 Years | 0 (0.0%) | 0 (0.0%) |
| 35 to 64 Years | 0 (0.0%) | 0 (0.0%) |
| 65 to 74 Years | 0 (0.0%) | 0 (0.0%) |
| 75 Years and over | 12 (5.7%) | 11 (4.9%) |
Technology Access in West Chatham
Computing Device Access in West Chatham
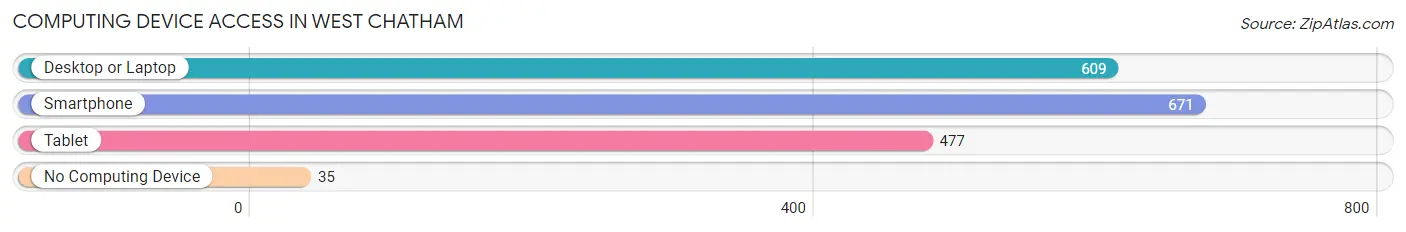
| Device Type | # Households | % Households |
| Desktop or Laptop | 609 | 84.1% |
| Smartphone | 671 | 92.7% |
| Tablet | 477 | 65.9% |
| No Computing Device | 35 | 4.8% |
| Total | 724 | 100.0% |
Internet Access in West Chatham
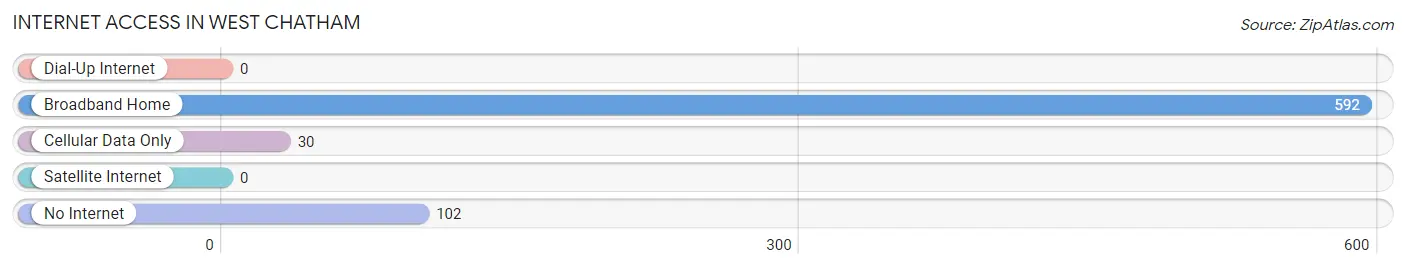
| Internet Type | # Households | % Households |
| Dial-Up Internet | 0 | 0.0% |
| Broadband Home | 592 | 81.8% |
| Cellular Data Only | 30 | 4.1% |
| Satellite Internet | 0 | 0.0% |
| No Internet | 102 | 14.1% |
| Total | 724 | 100.0% |
West Chatham Summary
West Chatham is a small town located in the southeastern corner of Massachusetts, in the county of Barnstable. It is bordered by the towns of Chatham, Harwich, Brewster, Orleans, and Eastham. The town has a population of approximately 4,000 people, and is a popular summer destination for tourists.
History
West Chatham was first settled in 1656 by a group of English settlers from the Plymouth Colony. The town was originally part of the town of Chatham, but was incorporated as its own town in 1810. The town was named after Chatham, England, and was originally known as West Parish.
The town was primarily an agricultural community, with the main crops being cranberries and potatoes. The town also had a thriving fishing industry, with many of the townspeople working as fishermen.
In the late 19th century, the town began to develop as a summer resort destination. The town was known for its beautiful beaches and scenic views, and many wealthy families began to build summer homes in the area.
Geography
West Chatham is located in the southeastern corner of Massachusetts, in the county of Barnstable. It is bordered by the towns of Chatham, Harwich, Brewster, Orleans, and Eastham. The town is located on the Atlantic Ocean, and is home to several beaches, including Cockle Cove Beach, Harding's Beach, and Oyster Pond Beach.
The town is located on the Cape Cod Bay, and is home to several small islands, including Monomoy Island, South Monomoy Island, and North Monomoy Island. The town is also home to several ponds, including Oyster Pond, Mill Pond, and Long Pond.
Economy
The economy of West Chatham is largely based on tourism. The town is a popular summer destination for tourists, and is home to several hotels, restaurants, and shops. The town is also home to several marinas, which provide services to boaters and fishermen.
The town is also home to several cranberry bogs, which are used to produce cranberry products. The town is also home to several farms, which produce potatoes, corn, and other vegetables.
Demographics
As of the 2010 census, the population of West Chatham was 4,125. The racial makeup of the town was 97.2% White, 0.7% African American, 0.3% Native American, 0.4% Asian, 0.1% Pacific Islander, 0.3% from other races, and 1.0% from two or more races. Hispanic or Latino of any race were 1.2% of the population.
The median household income in West Chatham was $63,750, and the median family income was $76,250. The per capita income for the town was $35,945. About 5.2% of families and 7.2% of the population were below the poverty line, including 8.3% of those under age 18 and 4.2% of those age 65 or over.
Common Questions
What is Per Capita Income in West Chatham?
Per Capita income in West Chatham is $62,581.
What is the Median Family Income in West Chatham?
Median Family Income in West Chatham is $146,625.
What is the Median Household income in West Chatham?
Median Household Income in West Chatham is $130,213.
What is Inequality or Gini Index in West Chatham?
Inequality or Gini Index in West Chatham is 0.46.
What is the Total Population of West Chatham?
Total Population of West Chatham is 1,633.
What is the Total Male Population of West Chatham?
Total Male Population of West Chatham is 874.
What is the Total Female Population of West Chatham?
Total Female Population of West Chatham is 759.
What is the Ratio of Males per 100 Females in West Chatham?
There are 115.15 Males per 100 Females in West Chatham.
What is the Ratio of Females per 100 Males in West Chatham?
There are 86.84 Females per 100 Males in West Chatham.
What is the Median Population Age in West Chatham?
Median Population Age in West Chatham is 61.2 Years.
What is the Average Family Size in West Chatham
Average Family Size in West Chatham is 2.6 People.
What is the Average Household Size in West Chatham
Average Household Size in West Chatham is 2.3 People.
How Large is the Labor Force in West Chatham?
There are 728 People in the Labor Forcein in West Chatham.
What is the Percentage of People in the Labor Force in West Chatham?
50.8% of People are in the Labor Force in West Chatham.
What is the Unemployment Rate in West Chatham?
Unemployment Rate in West Chatham is 6.2%.