Needham, MA Map & Demographics
Needham Map
Needham Overview
$95,376
PER CAPITA INCOME
$245,838
AVG FAMILY INCOME
$206,261
AVG HOUSEHOLD INCOME
55.6%
WAGE / INCOME GAP [ % ]
44.4¢/ $1
WAGE / INCOME GAP [ $ ]
$14,693
FAMILY INCOME DEFICIT
0.47
INEQUALITY / GINI INDEX
31,957
TOTAL POPULATION
15,177
MALE POPULATION
16,780
FEMALE POPULATION
90.45
MALES / 100 FEMALES
110.56
FEMALES / 100 MALES
43.3
MEDIAN AGE
3.1
AVG FAMILY SIZE
2.8
AVG HOUSEHOLD SIZE
16,458
LABOR FORCE [ PEOPLE ]
67.8%
PERCENT IN LABOR FORCE
5.2%
UNEMPLOYMENT RATE
Needham Zip Codes
Income in Needham
Income Overview in Needham
Per Capita Income in Needham is $95,376, while median incomes of families and households are $245,838 and $206,261 respectively.
| Characteristic | Number | Measure |
| Per Capita Income | 31,957 | $95,376 |
| Median Family Income | 9,042 | $245,838 |
| Mean Family Income | 9,042 | $304,664 |
| Median Household Income | 11,312 | $206,261 |
| Mean Household Income | 11,312 | $267,951 |
| Income Deficit | 9,042 | $14,693 |
| Wage / Income Gap (%) | 31,957 | 55.62% |
| Wage / Income Gap ($) | 31,957 | 44.38¢ per $1 |
| Gini / Inequality Index | 31,957 | 0.47 |
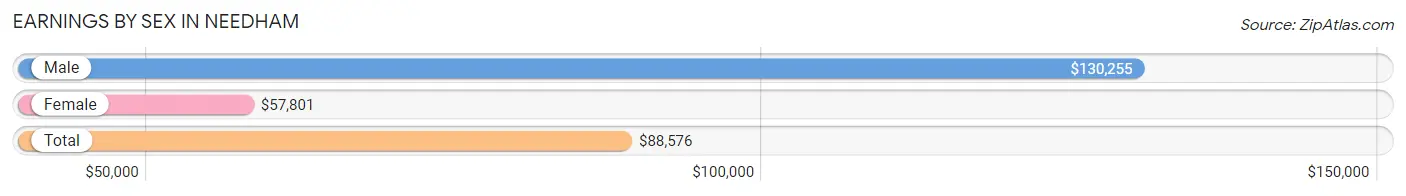
Earnings by Sex in Needham
Average Earnings in Needham are $88,576, $130,255 for men and $57,801 for women, a difference of 55.6%.
| Sex | Number | Average Earnings |
| Male | 9,313 (52.6%) | $130,255 |
| Female | 8,388 (47.4%) | $57,801 |
| Total | 17,701 (100.0%) | $88,576 |
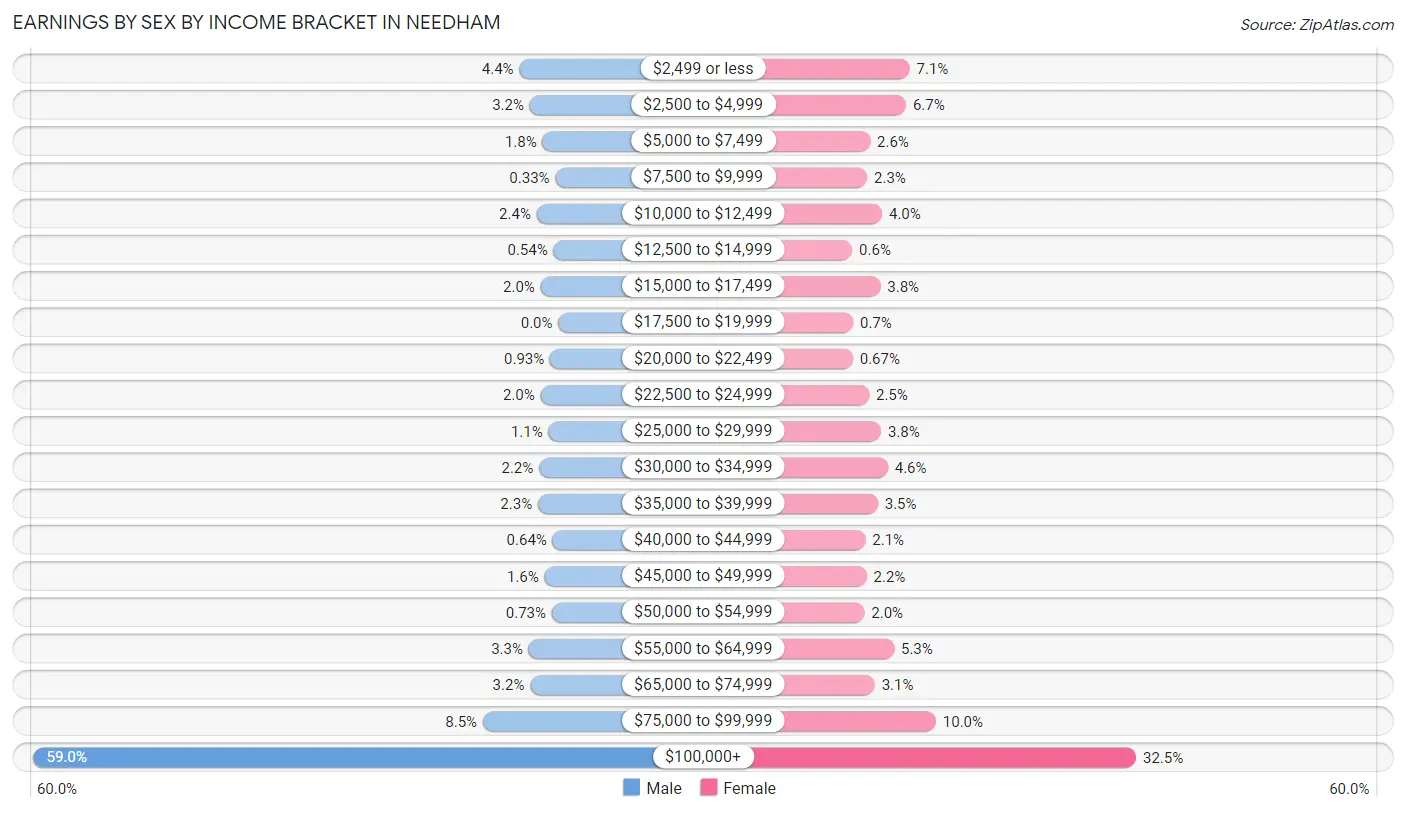
Earnings by Sex by Income Bracket in Needham
The most common earnings brackets in Needham are $100,000+ for men (5,494 | 59.0%) and $100,000+ for women (2,728 | 32.5%).
| Income | Male | Female |
| $2,499 or less | 408 (4.4%) | 592 (7.1%) |
| $2,500 to $4,999 | 299 (3.2%) | 558 (6.7%) |
| $5,000 to $7,499 | 166 (1.8%) | 220 (2.6%) |
| $7,500 to $9,999 | 31 (0.3%) | 191 (2.3%) |
| $10,000 to $12,499 | 226 (2.4%) | 332 (4.0%) |
| $12,500 to $14,999 | 50 (0.5%) | 50 (0.6%) |
| $15,000 to $17,499 | 185 (2.0%) | 316 (3.8%) |
| $17,500 to $19,999 | 0 (0.0%) | 59 (0.7%) |
| $20,000 to $22,499 | 87 (0.9%) | 56 (0.7%) |
| $22,500 to $24,999 | 186 (2.0%) | 210 (2.5%) |
| $25,000 to $29,999 | 102 (1.1%) | 322 (3.8%) |
| $30,000 to $34,999 | 201 (2.2%) | 387 (4.6%) |
| $35,000 to $39,999 | 213 (2.3%) | 292 (3.5%) |
| $40,000 to $44,999 | 60 (0.6%) | 175 (2.1%) |
| $45,000 to $49,999 | 144 (1.5%) | 187 (2.2%) |
| $50,000 to $54,999 | 68 (0.7%) | 165 (2.0%) |
| $55,000 to $64,999 | 309 (3.3%) | 445 (5.3%) |
| $65,000 to $74,999 | 294 (3.2%) | 263 (3.1%) |
| $75,000 to $99,999 | 790 (8.5%) | 840 (10.0%) |
| $100,000+ | 5,494 (59.0%) | 2,728 (32.5%) |
| Total | 9,313 (100.0%) | 8,388 (100.0%) |
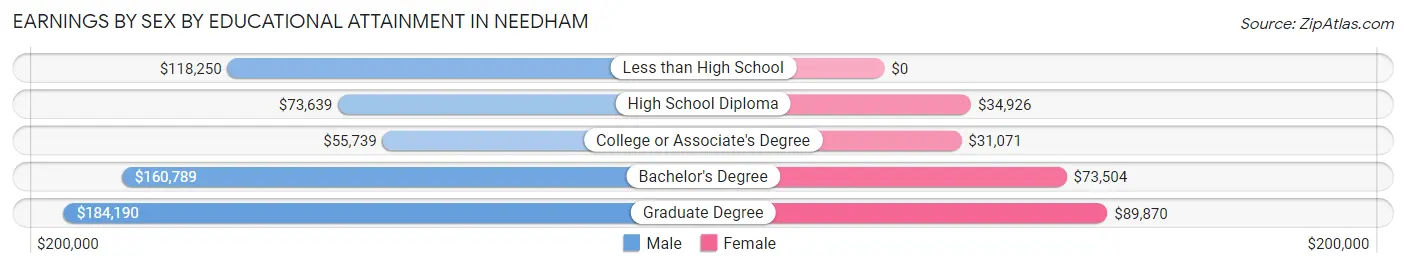
Earnings by Sex by Educational Attainment in Needham
Average earnings in Needham are $160,208 for men and $72,963 for women, a difference of 54.5%. Men with an educational attainment of graduate degree enjoy the highest average annual earnings of $184,190, while those with college or associate's degree education earn the least with $55,739. Women with an educational attainment of graduate degree earn the most with the average annual earnings of $89,870, while those with college or associate's degree education have the smallest earnings of $31,071.
| Educational Attainment | Male Income | Female Income |
| Less than High School | $118,250 | $0 |
| High School Diploma | $73,639 | $34,926 |
| College or Associate's Degree | $55,739 | $31,071 |
| Bachelor's Degree | $160,789 | $73,504 |
| Graduate Degree | $184,190 | $89,870 |
| Total | $160,208 | $72,963 |
Family Income in Needham
Family Income Brackets in Needham
According to the Needham family income data, there are 5,543 families falling into the $200,000+ income range, which is the most common income bracket and makes up 61.3% of all families. Conversely, the $10,000 to $14,999 income bracket is the least frequent group with only 18 families (0.2%) belonging to this category.
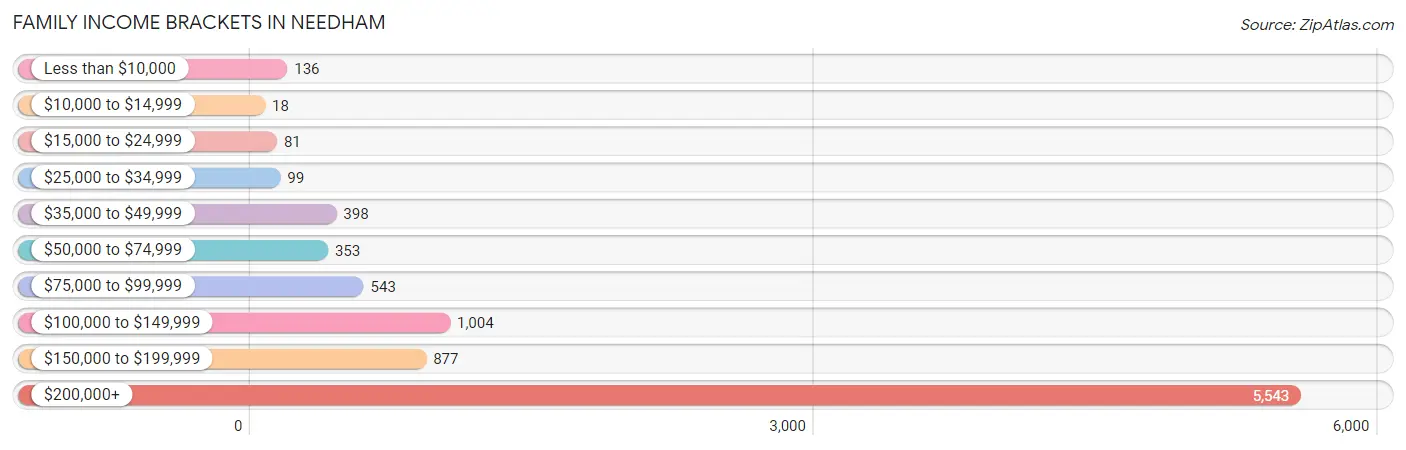
| Income Bracket | # Families | % Families |
| Less than $10,000 | 136 | 1.5% |
| $10,000 to $14,999 | 18 | 0.2% |
| $15,000 to $24,999 | 81 | 0.9% |
| $25,000 to $34,999 | 99 | 1.1% |
| $35,000 to $49,999 | 398 | 4.4% |
| $50,000 to $74,999 | 353 | 3.9% |
| $75,000 to $99,999 | 543 | 6.0% |
| $100,000 to $149,999 | 1,004 | 11.1% |
| $150,000 to $199,999 | 877 | 9.7% |
| $200,000+ | 5,543 | 61.3% |
Family Income by Famaliy Size in Needham
4-person families (2,765 | 30.6%) account for the highest median family income in Needham with $250,001 per family, while 3-person families (1,609 | 17.8%) have the highest median income of $82,804 per family member.
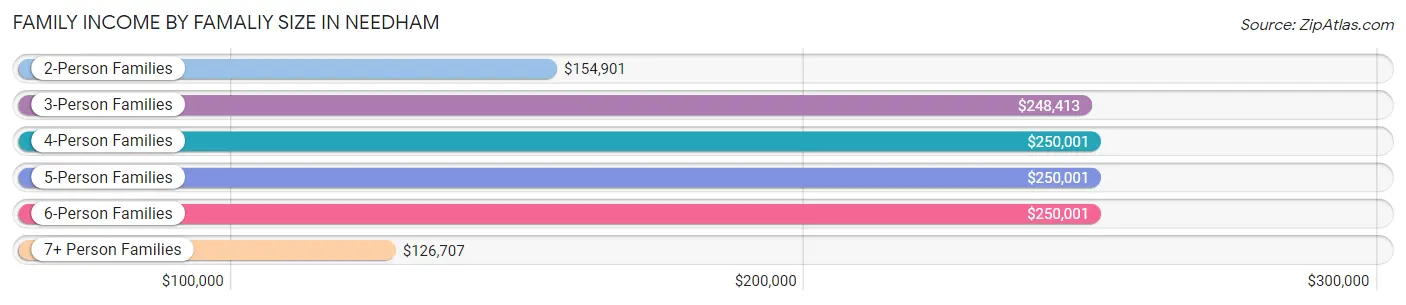
| Income Bracket | # Families | Median Income |
| 2-Person Families | 3,655 (40.4%) | $154,901 |
| 3-Person Families | 1,609 (17.8%) | $248,413 |
| 4-Person Families | 2,765 (30.6%) | $250,001 |
| 5-Person Families | 812 (9.0%) | $250,001 |
| 6-Person Families | 145 (1.6%) | $250,001 |
| 7+ Person Families | 56 (0.6%) | $126,707 |
| Total | 9,042 (100.0%) | $245,838 |
Family Income by Number of Earners in Needham
The median family income in Needham is $245,838, with families comprising 2 earners (4,938) having the highest median family income of $250,001, while families with no earners (1,076) have the lowest median family income of $94,429, accounting for 54.6% and 11.9% of families, respectively.
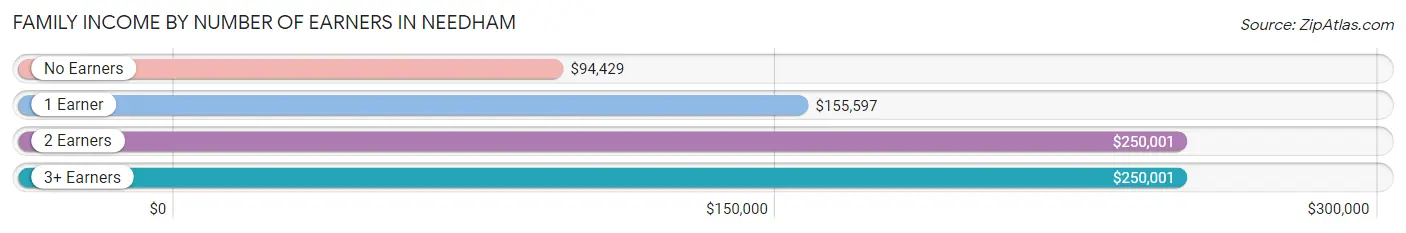
| Number of Earners | # Families | Median Income |
| No Earners | 1,076 (11.9%) | $94,429 |
| 1 Earner | 1,791 (19.8%) | $155,597 |
| 2 Earners | 4,938 (54.6%) | $250,001 |
| 3+ Earners | 1,237 (13.7%) | $250,001 |
| Total | 9,042 (100.0%) | $245,838 |
Household Income in Needham
Household Income Brackets in Needham
With 5,848 households falling in the category, the $200,000+ income range is the most frequent in Needham, accounting for 51.7% of all households. In contrast, only 90 households (0.8%) fall into the $10,000 to $14,999 income bracket, making it the least populous group.
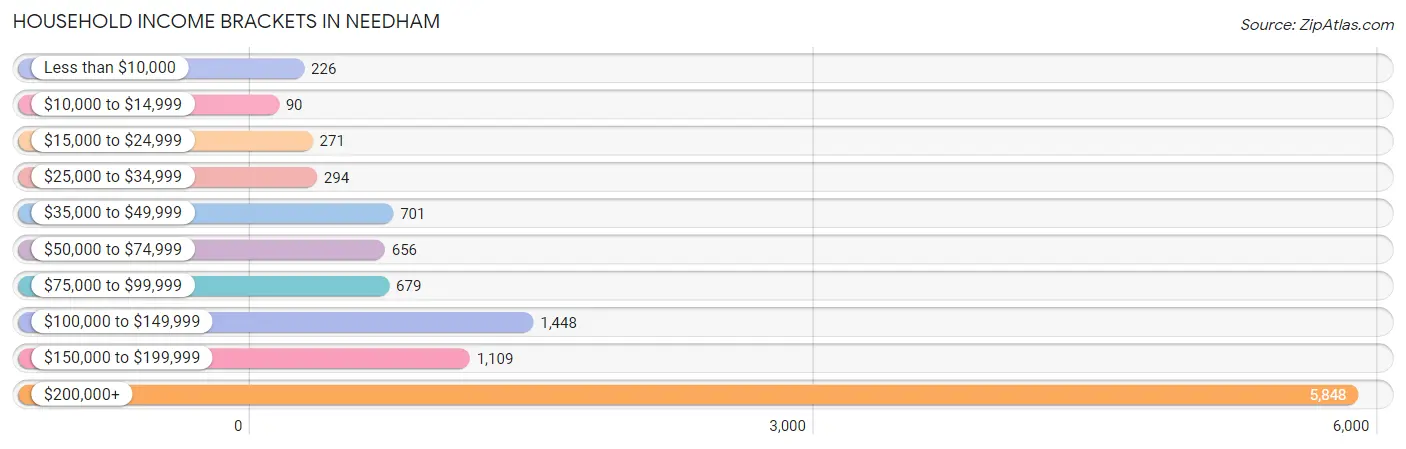
| Income Bracket | # Households | % Households |
| Less than $10,000 | 226 | 2.0% |
| $10,000 to $14,999 | 90 | 0.8% |
| $15,000 to $24,999 | 271 | 2.4% |
| $25,000 to $34,999 | 294 | 2.6% |
| $35,000 to $49,999 | 701 | 6.2% |
| $50,000 to $74,999 | 656 | 5.8% |
| $75,000 to $99,999 | 679 | 6.0% |
| $100,000 to $149,999 | 1,448 | 12.8% |
| $150,000 to $199,999 | 1,109 | 9.8% |
| $200,000+ | 5,848 | 51.7% |
Household Income by Householder Age in Needham
The median household income in Needham is $206,261, with the highest median household income of $250,001 found in the 25 to 44 years age bracket for the primary householder. A total of 2,843 households (25.1%) fall into this category. Meanwhile, the 15 to 24 years age bracket for the primary householder has the lowest median household income of $0, with 90 households (0.8%) in this group.
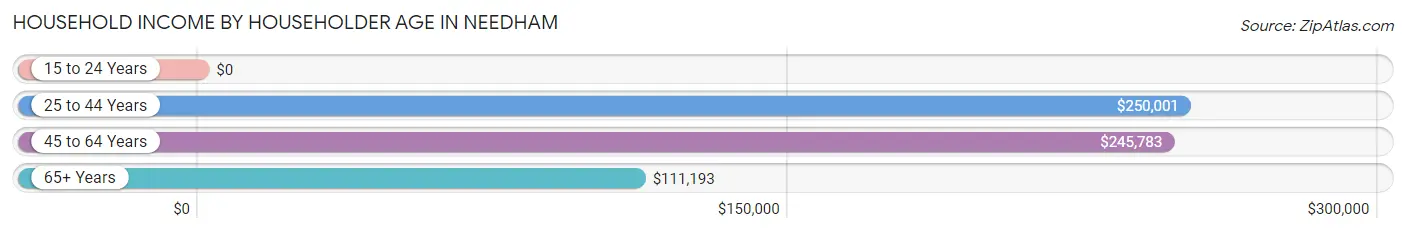
| Income Bracket | # Households | Median Income |
| 15 to 24 Years | 90 (0.8%) | $0 |
| 25 to 44 Years | 2,843 (25.1%) | $250,001 |
| 45 to 64 Years | 4,894 (43.3%) | $245,783 |
| 65+ Years | 3,485 (30.8%) | $111,193 |
| Total | 11,312 (100.0%) | $206,261 |
Poverty in Needham
Income Below Poverty by Sex and Age in Needham
With 2.1% poverty level for males and 3.4% for females among the residents of Needham, 18 to 24 year old males and 18 to 24 year old females are the most vulnerable to poverty, with 63 males (7.2%) and 92 females (11.9%) in their respective age groups living below the poverty level.
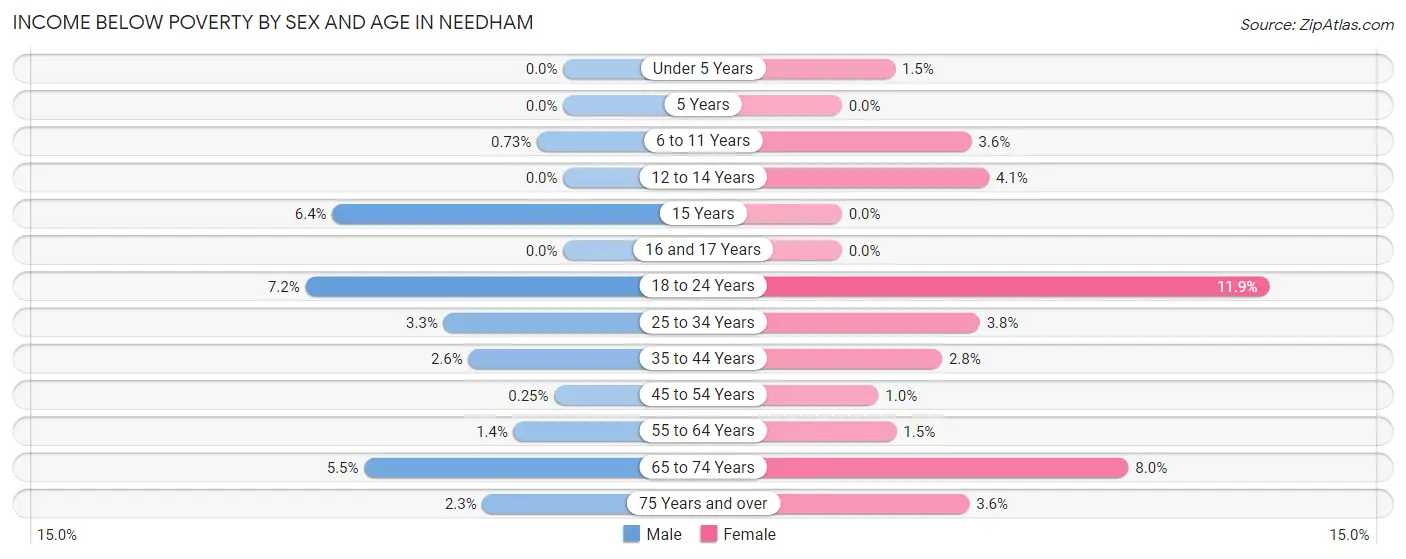
| Age Bracket | Male | Female |
| Under 5 Years | 0 (0.0%) | 12 (1.5%) |
| 5 Years | 0 (0.0%) | 0 (0.0%) |
| 6 to 11 Years | 11 (0.7%) | 69 (3.6%) |
| 12 to 14 Years | 0 (0.0%) | 37 (4.1%) |
| 15 Years | 18 (6.4%) | 0 (0.0%) |
| 16 and 17 Years | 0 (0.0%) | 0 (0.0%) |
| 18 to 24 Years | 63 (7.2%) | 92 (11.9%) |
| 25 to 34 Years | 30 (3.3%) | 33 (3.8%) |
| 35 to 44 Years | 53 (2.6%) | 66 (2.8%) |
| 45 to 54 Years | 6 (0.3%) | 23 (1.0%) |
| 55 to 64 Years | 31 (1.4%) | 34 (1.5%) |
| 65 to 74 Years | 76 (5.5%) | 126 (8.0%) |
| 75 Years and over | 25 (2.2%) | 54 (3.5%) |
| Total | 313 (2.1%) | 546 (3.4%) |
Income Above Poverty by Sex and Age in Needham
According to the poverty statistics in Needham, males aged under 5 years and females aged 5 years are the age groups that are most secure financially, with 100.0% of males and 100.0% of females in these age groups living above the poverty line.
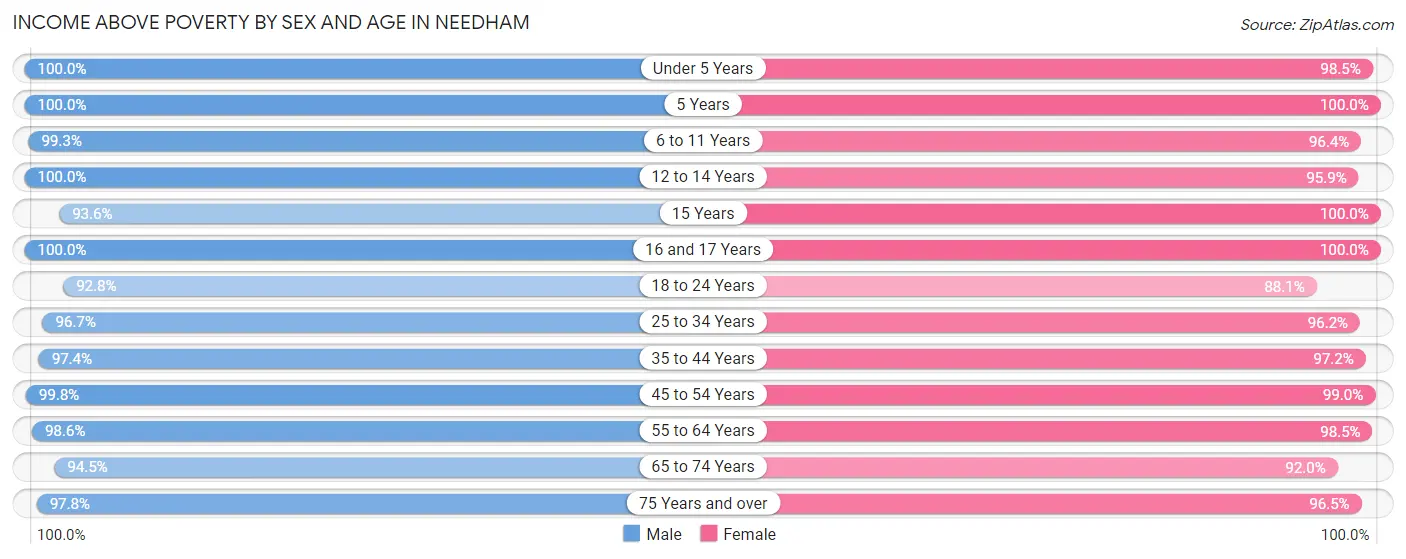
| Age Bracket | Male | Female |
| Under 5 Years | 662 (100.0%) | 801 (98.5%) |
| 5 Years | 137 (100.0%) | 235 (100.0%) |
| 6 to 11 Years | 1,494 (99.3%) | 1,841 (96.4%) |
| 12 to 14 Years | 902 (100.0%) | 866 (95.9%) |
| 15 Years | 262 (93.6%) | 272 (100.0%) |
| 16 and 17 Years | 528 (100.0%) | 577 (100.0%) |
| 18 to 24 Years | 815 (92.8%) | 681 (88.1%) |
| 25 to 34 Years | 870 (96.7%) | 827 (96.2%) |
| 35 to 44 Years | 1,955 (97.4%) | 2,302 (97.2%) |
| 45 to 54 Years | 2,407 (99.8%) | 2,235 (99.0%) |
| 55 to 64 Years | 2,217 (98.6%) | 2,210 (98.5%) |
| 65 to 74 Years | 1,296 (94.5%) | 1,452 (92.0%) |
| 75 Years and over | 1,085 (97.8%) | 1,466 (96.5%) |
| Total | 14,630 (97.9%) | 15,765 (96.7%) |
Income Below Poverty Among Married-Couple Families in Needham
The poverty statistics for married-couple families in Needham show that 1.8% or 147 of the total 8,071 families live below the poverty line. Families with 3 or 4 children have the highest poverty rate of 4.4%, comprising of 37 families. On the other hand, families with 1 or 2 children have the lowest poverty rate of 0.0%, which includes 0 families.
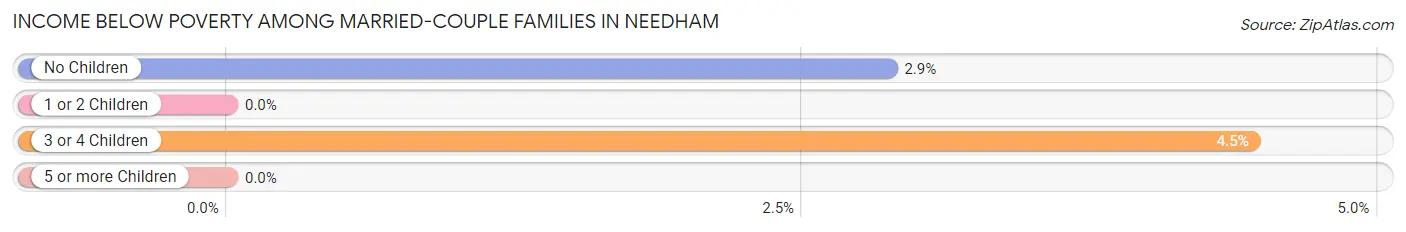
| Children | Above Poverty | Below Poverty |
| No Children | 3,719 (97.1%) | 110 (2.9%) |
| 1 or 2 Children | 3,411 (100.0%) | 0 (0.0%) |
| 3 or 4 Children | 794 (95.6%) | 37 (4.4%) |
| 5 or more Children | 0 (0.0%) | 0 (0.0%) |
| Total | 7,924 (98.2%) | 147 (1.8%) |
Income Below Poverty Among Single-Parent Households in Needham
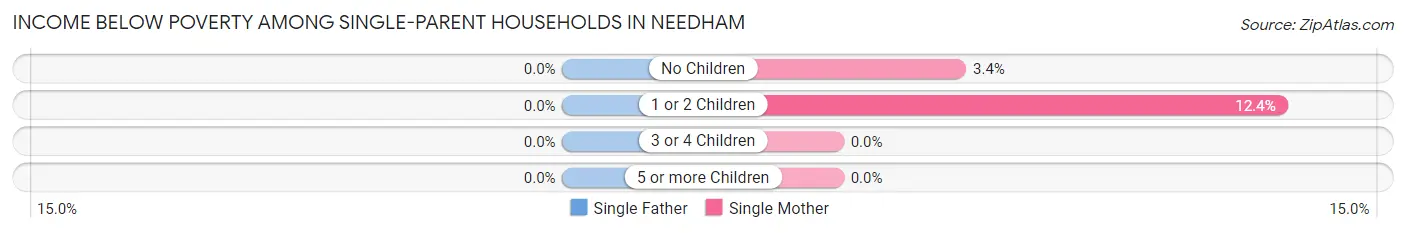
| Children | Single Father | Single Mother |
| No Children | 0 (0.0%) | 15 (3.4%) |
| 1 or 2 Children | 0 (0.0%) | 30 (12.4%) |
| 3 or 4 Children | 0 (0.0%) | 0 (0.0%) |
| 5 or more Children | 0 (0.0%) | 0 (0.0%) |
| Total | 0 (0.0%) | 45 (5.8%) |
Income Below Poverty Among Married-Couple vs Single-Parent Households in Needham
The poverty data for Needham shows that 147 of the married-couple family households (1.8%) and 45 of the single-parent households (4.6%) are living below the poverty level. Within the married-couple family households, those with 3 or 4 children have the highest poverty rate, with 37 households (4.4%) falling below the poverty line. Among the single-parent households, those with 1 or 2 children have the highest poverty rate, with 30 household (9.6%) living below poverty.
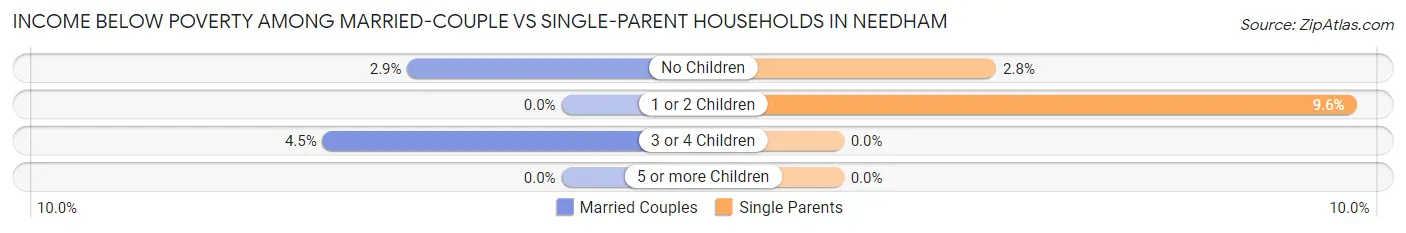
| Children | Married-Couple Families | Single-Parent Households |
| No Children | 110 (2.9%) | 15 (2.8%) |
| 1 or 2 Children | 0 (0.0%) | 30 (9.6%) |
| 3 or 4 Children | 37 (4.4%) | 0 (0.0%) |
| 5 or more Children | 0 (0.0%) | 0 (0.0%) |
| Total | 147 (1.8%) | 45 (4.6%) |
Race in Needham
The most populous races in Needham are White / Caucasian (26,794 | 83.8%), Asian (3,055 | 9.6%), and Two or more Races (1,218 | 3.8%).
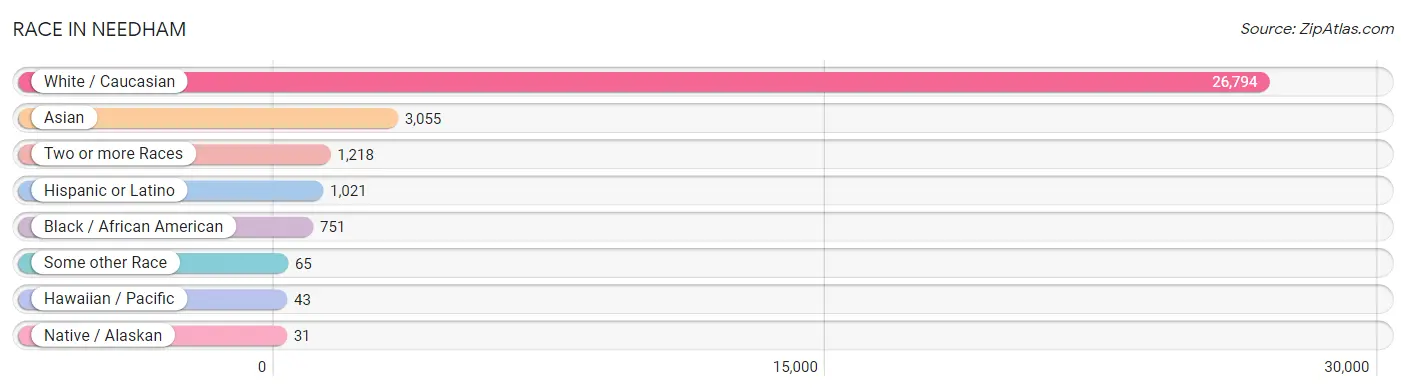
| Race | # Population | % Population |
| Asian | 3,055 | 9.6% |
| Black / African American | 751 | 2.4% |
| Hawaiian / Pacific | 43 | 0.1% |
| Hispanic or Latino | 1,021 | 3.2% |
| Native / Alaskan | 31 | 0.1% |
| White / Caucasian | 26,794 | 83.8% |
| Two or more Races | 1,218 | 3.8% |
| Some other Race | 65 | 0.2% |
| Total | 31,957 | 100.0% |
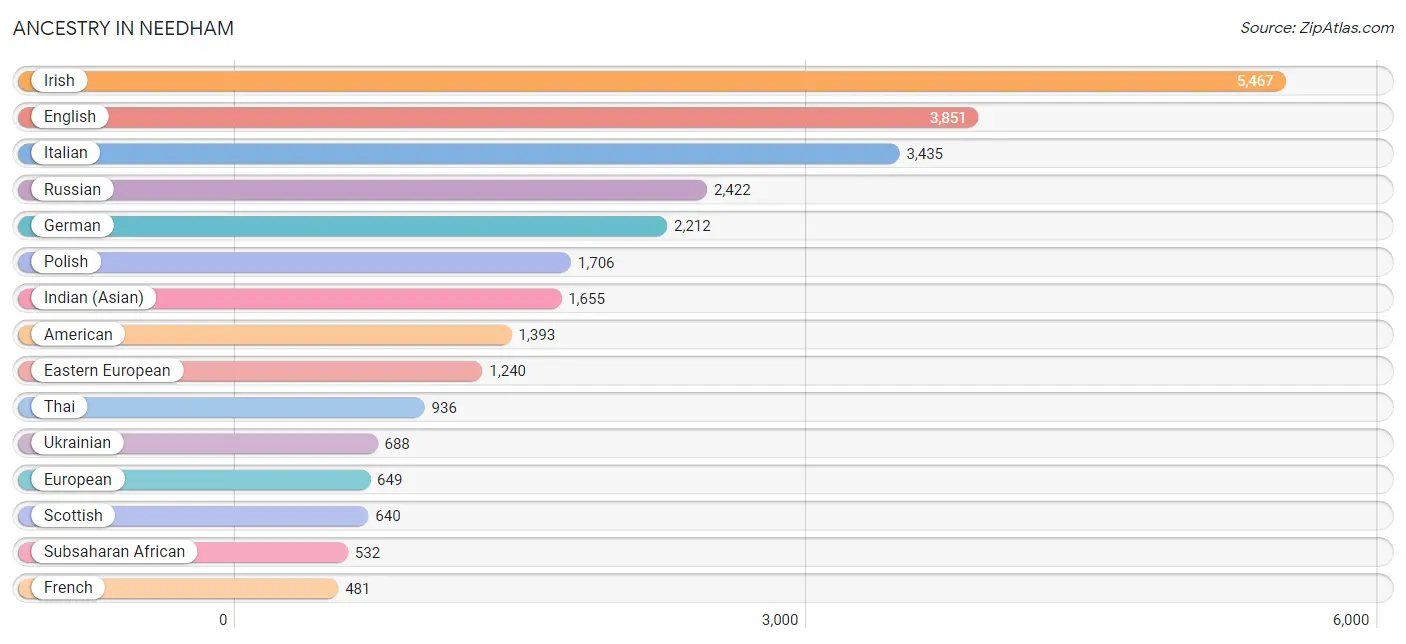
Ancestry in Needham
The most populous ancestries reported in Needham are Irish (5,467 | 17.1%), English (3,851 | 12.0%), Italian (3,435 | 10.7%), Russian (2,422 | 7.6%), and German (2,212 | 6.9%), together accounting for 54.4% of all Needham residents.
| Ancestry | # Population | % Population |
| African | 255 | 0.8% |
| American | 1,393 | 4.4% |
| Arab | 320 | 1.0% |
| Argentinean | 55 | 0.2% |
| Armenian | 68 | 0.2% |
| Australian | 72 | 0.2% |
| Austrian | 191 | 0.6% |
| Basque | 15 | 0.1% |
| Belgian | 17 | 0.1% |
| Bhutanese | 91 | 0.3% |
| Bolivian | 9 | 0.0% |
| Brazilian | 56 | 0.2% |
| British | 360 | 1.1% |
| Bulgarian | 88 | 0.3% |
| Burmese | 313 | 1.0% |
| Canadian | 209 | 0.6% |
| Cape Verdean | 58 | 0.2% |
| Central American | 119 | 0.4% |
| Cherokee | 7 | 0.0% |
| Chilean | 15 | 0.1% |
| Colombian | 8 | 0.0% |
| Croatian | 6 | 0.0% |
| Cuban | 28 | 0.1% |
| Cypriot | 25 | 0.1% |
| Czech | 136 | 0.4% |
| Dutch | 74 | 0.2% |
| Eastern European | 1,240 | 3.9% |
| Ecuadorian | 63 | 0.2% |
| Egyptian | 111 | 0.4% |
| English | 3,851 | 12.0% |
| European | 649 | 2.0% |
| Filipino | 86 | 0.3% |
| Finnish | 87 | 0.3% |
| French | 481 | 1.5% |
| French Canadian | 326 | 1.0% |
| German | 2,212 | 6.9% |
| Greek | 469 | 1.5% |
| Guamanian / Chamorro | 43 | 0.1% |
| Guatemalan | 62 | 0.2% |
| Haitian | 57 | 0.2% |
| Honduran | 54 | 0.2% |
| Hungarian | 194 | 0.6% |
| Indian (Asian) | 1,655 | 5.2% |
| Indonesian | 2 | 0.0% |
| Irish | 5,467 | 17.1% |
| Israeli | 114 | 0.4% |
| Italian | 3,435 | 10.7% |
| Jamaican | 26 | 0.1% |
| Korean | 33 | 0.1% |
| Latvian | 94 | 0.3% |
| Lebanese | 177 | 0.5% |
| Lithuanian | 91 | 0.3% |
| Mexican | 180 | 0.6% |
| Mexican American Indian | 5 | 0.0% |
| Mongolian | 21 | 0.1% |
| Nigerian | 94 | 0.3% |
| Northern European | 139 | 0.4% |
| Norwegian | 210 | 0.7% |
| Okinawan | 6 | 0.0% |
| Pakistani | 133 | 0.4% |
| Peruvian | 91 | 0.3% |
| Polish | 1,706 | 5.3% |
| Portuguese | 365 | 1.1% |
| Puerto Rican | 96 | 0.3% |
| Romanian | 153 | 0.5% |
| Russian | 2,422 | 7.6% |
| Salvadoran | 3 | 0.0% |
| Scotch-Irish | 253 | 0.8% |
| Scottish | 640 | 2.0% |
| Serbian | 11 | 0.0% |
| Slovak | 155 | 0.5% |
| South African | 42 | 0.1% |
| South American | 454 | 1.4% |
| Spaniard | 103 | 0.3% |
| Spanish | 14 | 0.0% |
| Sri Lankan | 59 | 0.2% |
| Subsaharan African | 532 | 1.7% |
| Swedish | 410 | 1.3% |
| Swiss | 38 | 0.1% |
| Syrian | 21 | 0.1% |
| Thai | 936 | 2.9% |
| U.S. Virgin Islander | 1 | 0.0% |
| Ukrainian | 688 | 2.1% |
| Venezuelan | 213 | 0.7% |
| Vietnamese | 5 | 0.0% |
| Welsh | 160 | 0.5% | View All 86 Rows |
Immigrants in Needham
The most numerous immigrant groups reported in Needham came from Europe (2,074 | 6.5%), Asia (1,903 | 5.9%), Eastern Europe (1,243 | 3.9%), Eastern Asia (1,042 | 3.3%), and China (882 | 2.8%), together accounting for 22.3% of all Needham residents.
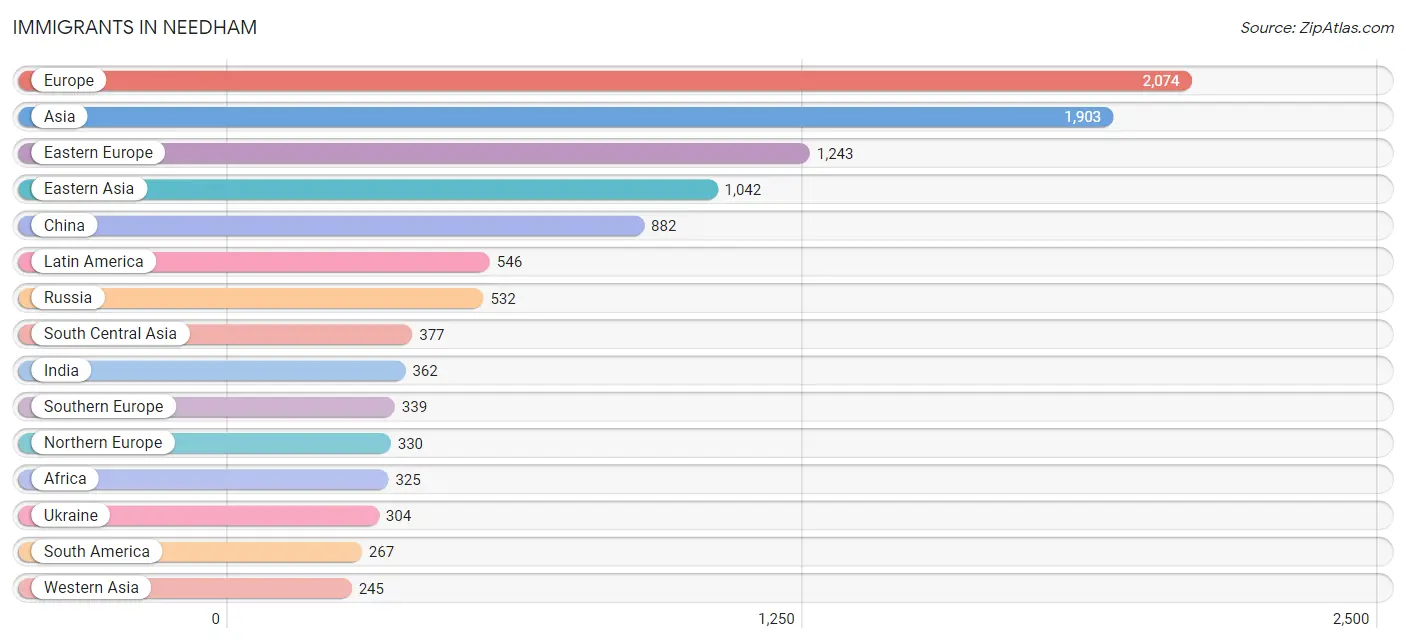
| Immigration Origin | # Population | % Population |
| Africa | 325 | 1.0% |
| Argentina | 14 | 0.0% |
| Asia | 1,903 | 5.9% |
| Australia | 34 | 0.1% |
| Austria | 8 | 0.0% |
| Azores | 25 | 0.1% |
| Bangladesh | 15 | 0.1% |
| Belarus | 87 | 0.3% |
| Brazil | 54 | 0.2% |
| Bulgaria | 45 | 0.1% |
| Canada | 158 | 0.5% |
| Caribbean | 149 | 0.5% |
| Central America | 130 | 0.4% |
| Chile | 15 | 0.1% |
| China | 882 | 2.8% |
| Cuba | 4 | 0.0% |
| Eastern Africa | 158 | 0.5% |
| Eastern Asia | 1,042 | 3.3% |
| Eastern Europe | 1,243 | 3.9% |
| Ecuador | 63 | 0.2% |
| Egypt | 76 | 0.2% |
| England | 32 | 0.1% |
| Europe | 2,074 | 6.5% |
| France | 24 | 0.1% |
| Germany | 106 | 0.3% |
| Greece | 114 | 0.4% |
| Guatemala | 19 | 0.1% |
| Haiti | 39 | 0.1% |
| Honduras | 19 | 0.1% |
| Hong Kong | 150 | 0.5% |
| India | 362 | 1.1% |
| Ireland | 15 | 0.1% |
| Israel | 224 | 0.7% |
| Italy | 107 | 0.3% |
| Jamaica | 81 | 0.3% |
| Kenya | 158 | 0.5% |
| Korea | 160 | 0.5% |
| Latin America | 546 | 1.7% |
| Latvia | 57 | 0.2% |
| Lebanon | 10 | 0.0% |
| Malaysia | 21 | 0.1% |
| Mexico | 92 | 0.3% |
| Netherlands | 24 | 0.1% |
| Nigeria | 56 | 0.2% |
| Northern Africa | 76 | 0.2% |
| Northern Europe | 330 | 1.0% |
| Oceania | 34 | 0.1% |
| Peru | 31 | 0.1% |
| Poland | 31 | 0.1% |
| Portugal | 25 | 0.1% |
| Romania | 18 | 0.1% |
| Russia | 532 | 1.7% |
| South Africa | 35 | 0.1% |
| South America | 267 | 0.8% |
| South Central Asia | 377 | 1.2% |
| South Eastern Asia | 222 | 0.7% |
| Southern Europe | 339 | 1.1% |
| Spain | 93 | 0.3% |
| Taiwan | 82 | 0.3% |
| Thailand | 133 | 0.4% |
| Turkey | 11 | 0.0% |
| Ukraine | 304 | 0.9% |
| Uruguay | 17 | 0.1% |
| Venezuela | 73 | 0.2% |
| Vietnam | 66 | 0.2% |
| Western Africa | 56 | 0.2% |
| Western Asia | 245 | 0.8% |
| Western Europe | 162 | 0.5% | View All 68 Rows |
Sex and Age in Needham
Sex and Age in Needham
The most populous age groups in Needham are 10 to 14 Years (1,449 | 9.6%) for men and 5 to 9 Years (1,553 | 9.3%) for women.
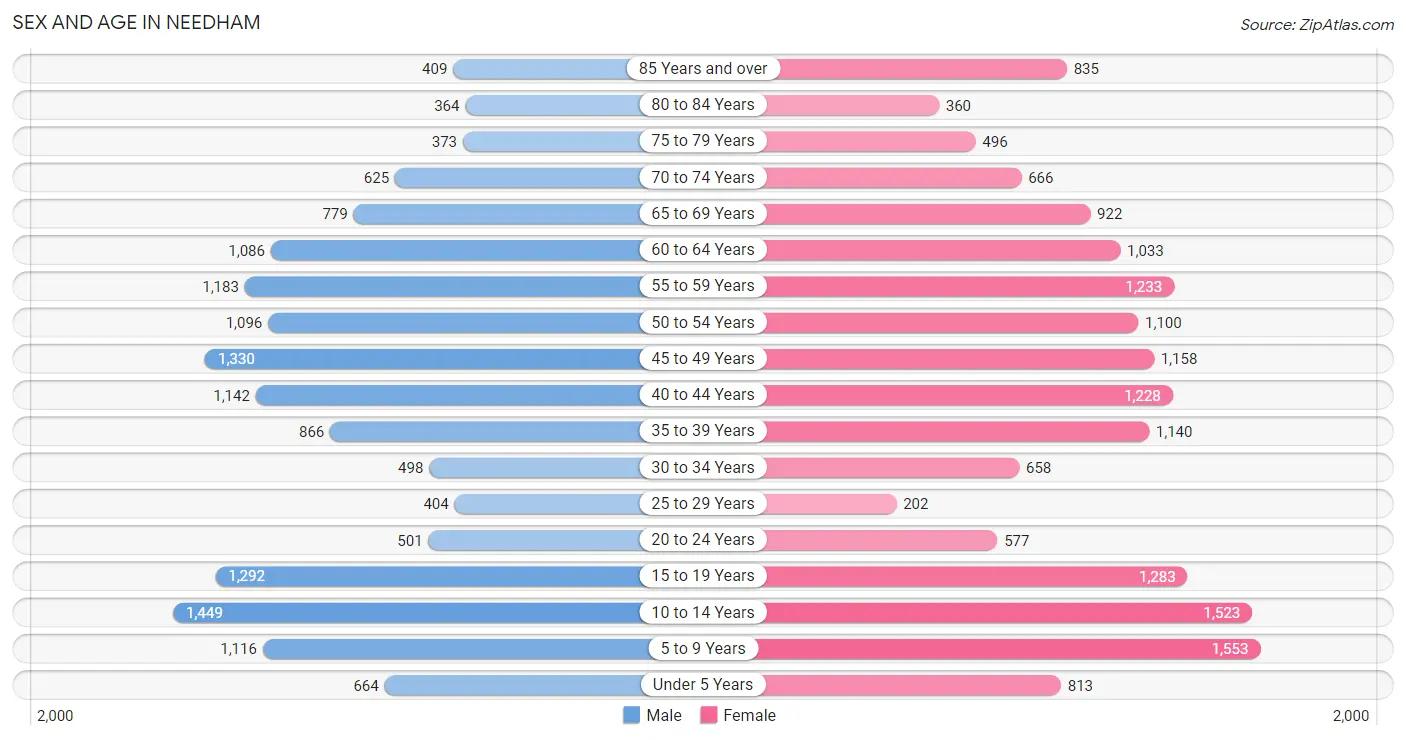
| Age Bracket | Male | Female |
| Under 5 Years | 664 (4.4%) | 813 (4.9%) |
| 5 to 9 Years | 1,116 (7.3%) | 1,553 (9.3%) |
| 10 to 14 Years | 1,449 (9.6%) | 1,523 (9.1%) |
| 15 to 19 Years | 1,292 (8.5%) | 1,283 (7.6%) |
| 20 to 24 Years | 501 (3.3%) | 577 (3.4%) |
| 25 to 29 Years | 404 (2.7%) | 202 (1.2%) |
| 30 to 34 Years | 498 (3.3%) | 658 (3.9%) |
| 35 to 39 Years | 866 (5.7%) | 1,140 (6.8%) |
| 40 to 44 Years | 1,142 (7.5%) | 1,228 (7.3%) |
| 45 to 49 Years | 1,330 (8.8%) | 1,158 (6.9%) |
| 50 to 54 Years | 1,096 (7.2%) | 1,100 (6.6%) |
| 55 to 59 Years | 1,183 (7.8%) | 1,233 (7.3%) |
| 60 to 64 Years | 1,086 (7.2%) | 1,033 (6.2%) |
| 65 to 69 Years | 779 (5.1%) | 922 (5.5%) |
| 70 to 74 Years | 625 (4.1%) | 666 (4.0%) |
| 75 to 79 Years | 373 (2.5%) | 496 (3.0%) |
| 80 to 84 Years | 364 (2.4%) | 360 (2.1%) |
| 85 Years and over | 409 (2.7%) | 835 (5.0%) |
| Total | 15,177 (100.0%) | 16,780 (100.0%) |
Families and Households in Needham
Median Family Size in Needham
The median family size in Needham is 3.14 persons per family, with married-couple families (8,071 | 89.3%) accounting for the largest median family size of 3.22 persons per family. On the other hand, single female/mother families (782 | 8.6%) represent the smallest median family size with 2.35 persons per family.
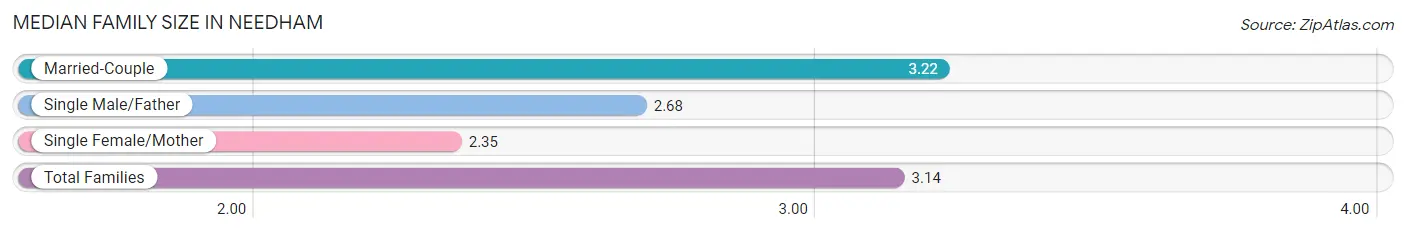
| Family Type | # Families | Family Size |
| Married-Couple | 8,071 (89.3%) | 3.22 |
| Single Male/Father | 189 (2.1%) | 2.68 |
| Single Female/Mother | 782 (8.6%) | 2.35 |
| Total Families | 9,042 (100.0%) | 3.14 |
Median Household Size in Needham
The median household size in Needham is 2.76 persons per household, with married-couple households (8,071 | 71.4%) accounting for the largest median household size of 3.23 persons per household. non-family households (2,270 | 20.1%) represent the smallest median household size with 1.19 persons per household.
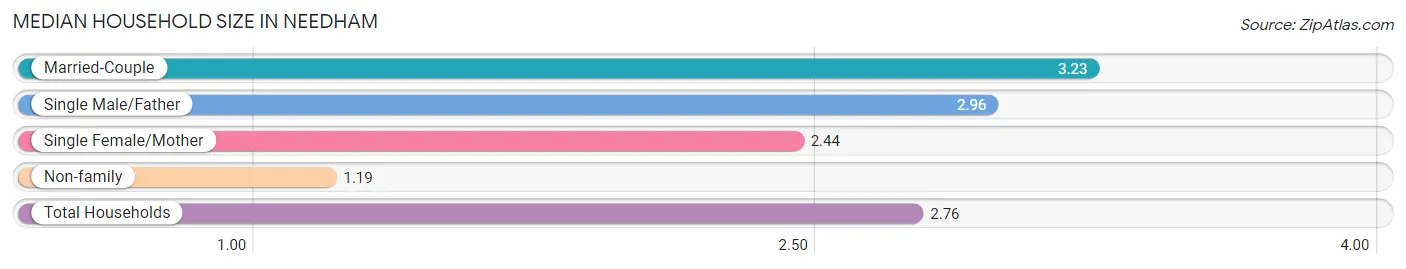
| Household Type | # Households | Household Size |
| Married-Couple | 8,071 (71.4%) | 3.23 |
| Single Male/Father | 189 (1.7%) | 2.96 |
| Single Female/Mother | 782 (6.9%) | 2.44 |
| Non-family | 2,270 (20.1%) | 1.19 |
| Total Households | 11,312 (100.0%) | 2.76 |
Household Size by Marriage Status in Needham
Out of a total of 11,312 households in Needham, 9,042 (79.9%) are family households, while 2,270 (20.1%) are nonfamily households. The most numerous type of family households are 2-person households, comprising 3,602, and the most common type of nonfamily households are 1-person households, comprising 1,939.
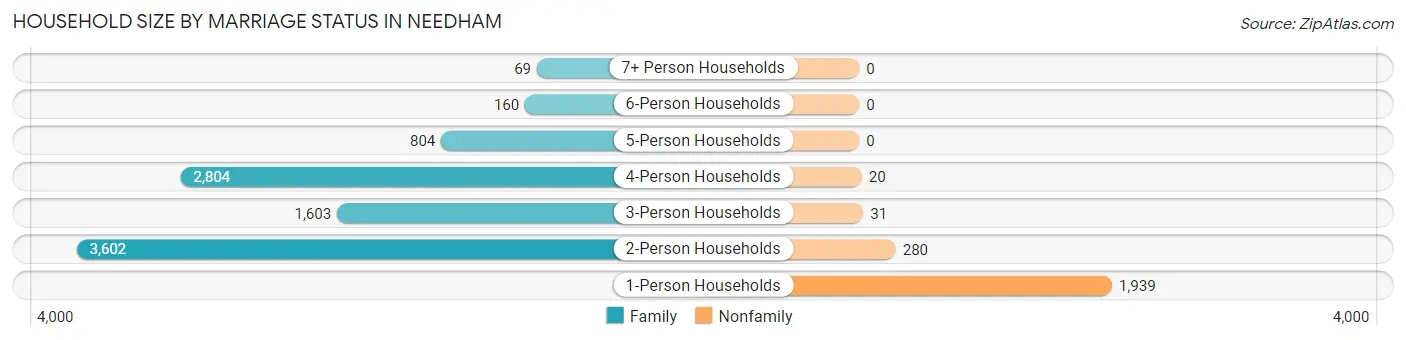
| Household Size | Family Households | Nonfamily Households |
| 1-Person Households | - | 1,939 (17.1%) |
| 2-Person Households | 3,602 (31.8%) | 280 (2.5%) |
| 3-Person Households | 1,603 (14.2%) | 31 (0.3%) |
| 4-Person Households | 2,804 (24.8%) | 20 (0.2%) |
| 5-Person Households | 804 (7.1%) | 0 (0.0%) |
| 6-Person Households | 160 (1.4%) | 0 (0.0%) |
| 7+ Person Households | 69 (0.6%) | 0 (0.0%) |
| Total | 9,042 (79.9%) | 2,270 (20.1%) |
Female Fertility in Needham
Fertility by Age in Needham
Average fertility rate in Needham is 34.0 births per 1,000 women. Women in the age bracket of 20 to 34 years have the highest fertility rate with 96.0 births per 1,000 women. Women in the age bracket of 20 to 34 years acount for 63.0% of all women with births.
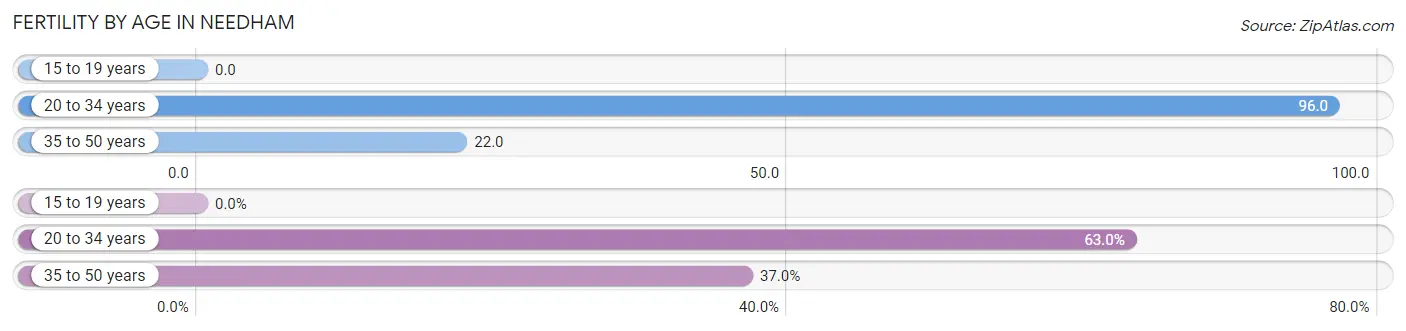
| Age Bracket | Women with Births | Births / 1,000 Women |
| 15 to 19 years | 0 (0.0%) | 0.0 |
| 20 to 34 years | 138 (63.0%) | 96.0 |
| 35 to 50 years | 81 (37.0%) | 22.0 |
| Total | 219 (100.0%) | 34.0 |
Fertility by Age by Marriage Status in Needham
76.7% of women with births (219) in Needham are married. The highest percentage of unmarried women with births falls into 20 to 34 years age bracket with 37.0% of them unmarried at the time of birth, while the lowest percentage of unmarried women with births belong to 35 to 50 years age bracket with 0.0% of them unmarried.
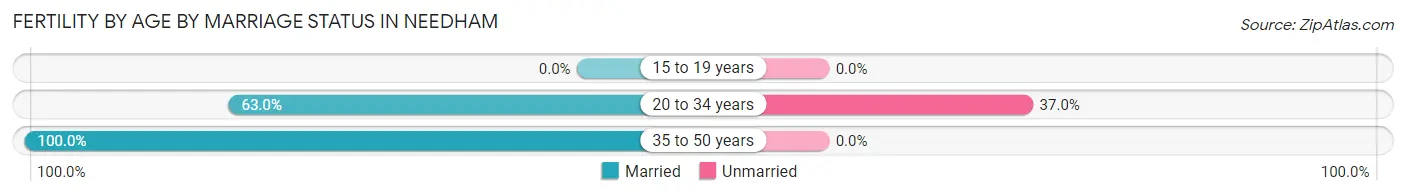
| Age Bracket | Married | Unmarried |
| 15 to 19 years | 0 (0.0%) | 0 (0.0%) |
| 20 to 34 years | 87 (63.0%) | 51 (37.0%) |
| 35 to 50 years | 81 (100.0%) | 0 (0.0%) |
| Total | 168 (76.7%) | 51 (23.3%) |
Fertility by Education in Needham
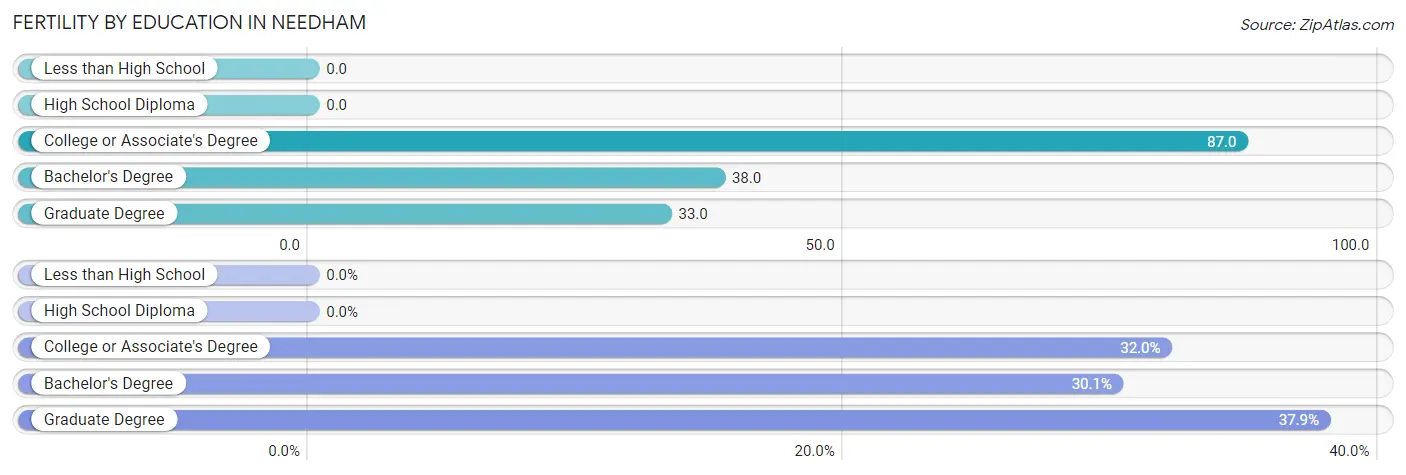
| Educational Attainment | Women with Births | Births / 1,000 Women |
| Less than High School | 0 (0.0%) | 0.0 |
| High School Diploma | 0 (0.0%) | 0.0 |
| College or Associate's Degree | 70 (32.0%) | 87.0 |
| Bachelor's Degree | 66 (30.1%) | 38.0 |
| Graduate Degree | 83 (37.9%) | 33.0 |
| Total | 219 (100.0%) | 34.0 |
Fertility by Education by Marriage Status in Needham
23.3% of women with births in Needham are unmarried. Women with the educational attainment of bachelor's degree are most likely to be married with 100.0% of them married at childbirth, while women with the educational attainment of college or associate's degree are least likely to be married with 72.9% of them unmarried at childbirth.
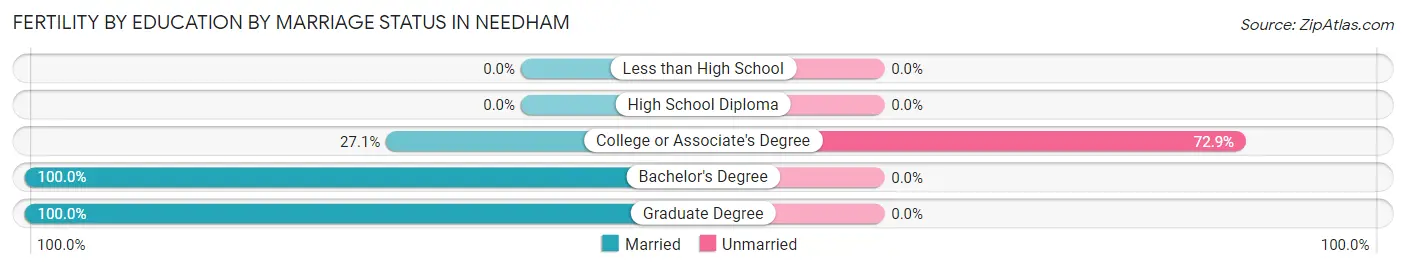
| Educational Attainment | Married | Unmarried |
| Less than High School | 0 (0.0%) | 0 (0.0%) |
| High School Diploma | 0 (0.0%) | 0 (0.0%) |
| College or Associate's Degree | 19 (27.1%) | 51 (72.9%) |
| Bachelor's Degree | 66 (100.0%) | 0 (0.0%) |
| Graduate Degree | 83 (100.0%) | 0 (0.0%) |
| Total | 168 (76.7%) | 51 (23.3%) |
Employment Characteristics in Needham
Employment by Class of Employer in Needham
Among the 15,315 employed individuals in Needham, private company employees (9,283 | 60.6%), not-for-profit organizations (2,679 | 17.5%), and self-employed (not incorporated) (1,147 | 7.5%) make up the most common classes of employment.
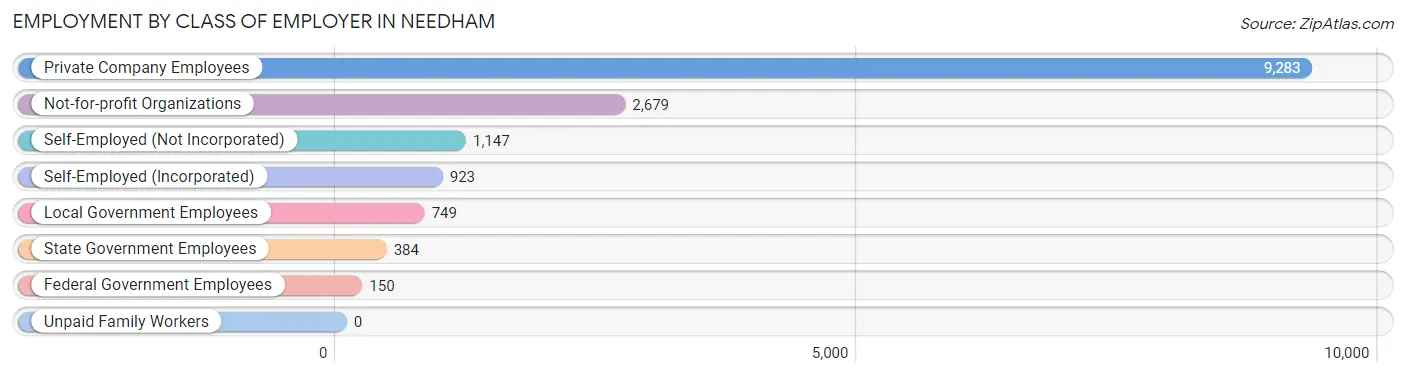
| Employer Class | # Employees | % Employees |
| Private Company Employees | 9,283 | 60.6% |
| Self-Employed (Incorporated) | 923 | 6.0% |
| Self-Employed (Not Incorporated) | 1,147 | 7.5% |
| Not-for-profit Organizations | 2,679 | 17.5% |
| Local Government Employees | 749 | 4.9% |
| State Government Employees | 384 | 2.5% |
| Federal Government Employees | 150 | 1.0% |
| Unpaid Family Workers | 0 | 0.0% |
| Total | 15,315 | 100.0% |
Employment Status by Age in Needham
According to the labor force statistics for Needham, out of the total population over 16 years of age (24,275), 67.8% or 16,458 individuals are in the labor force, with 5.2% or 856 of them unemployed. The age group with the highest labor force participation rate is 25 to 29 years, with 92.7% or 562 individuals in the labor force. Within the labor force, the 25 to 29 years age range has the highest percentage of unemployed individuals, with 18.1% or 102 of them being unemployed.
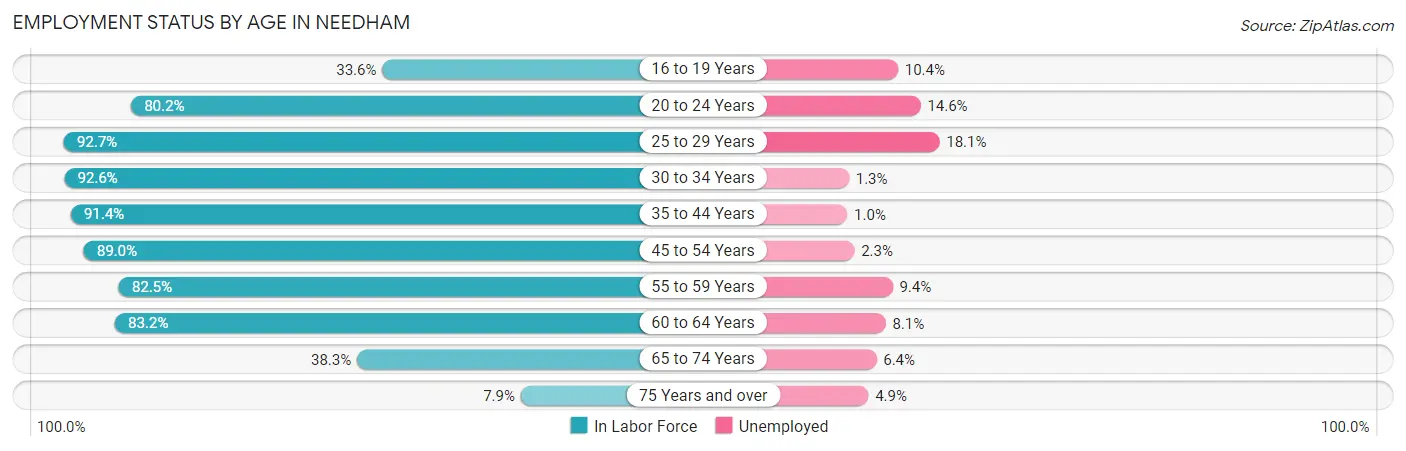
| Age Bracket | In Labor Force | Unemployed |
| 16 to 19 Years | 676 (33.6%) | 70 (10.4%) |
| 20 to 24 Years | 865 (80.2%) | 126 (14.6%) |
| 25 to 29 Years | 562 (92.7%) | 102 (18.1%) |
| 30 to 34 Years | 1,070 (92.6%) | 14 (1.3%) |
| 35 to 44 Years | 4,000 (91.4%) | 40 (1.0%) |
| 45 to 54 Years | 4,169 (89.0%) | 96 (2.3%) |
| 55 to 59 Years | 1,993 (82.5%) | 187 (9.4%) |
| 60 to 64 Years | 1,763 (83.2%) | 143 (8.1%) |
| 65 to 74 Years | 1,146 (38.3%) | 73 (6.4%) |
| 75 Years and over | 224 (7.9%) | 11 (4.9%) |
| Total | 16,458 (67.8%) | 856 (5.2%) |
Employment Status by Educational Attainment in Needham
According to labor force statistics for Needham, 88.3% of individuals (13,560) out of the total population between 25 and 64 years of age (15,357) are in the labor force, with 4.3% or 583 of them being unemployed. The group with the highest labor force participation rate are those with the educational attainment of college / associate degree, with 89.6% or 1,073 individuals in the labor force. Within the labor force, individuals with college / associate degree education have the highest percentage of unemployment, with 4.6% or 49 of them being unemployed.
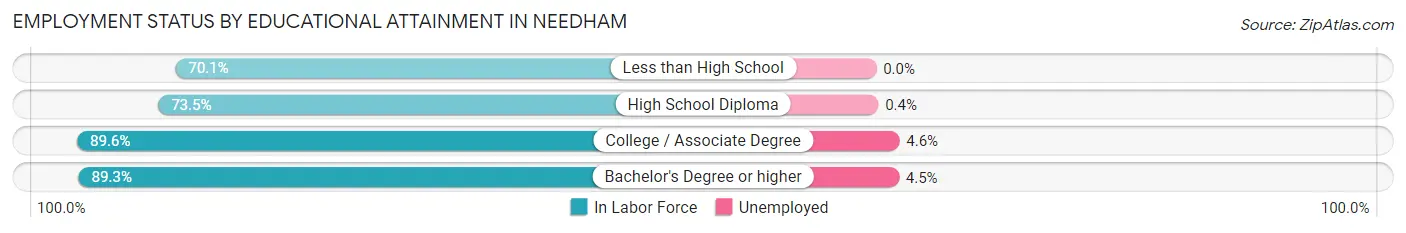
| Educational Attainment | In Labor Force | Unemployed |
| Less than High School | 169 (70.1%) | 0 (0.0%) |
| High School Diploma | 540 (73.5%) | 3 (0.4%) |
| College / Associate Degree | 1,073 (89.6%) | 55 (4.6%) |
| Bachelor's Degree or higher | 11,773 (89.3%) | 593 (4.5%) |
| Total | 13,560 (88.3%) | 660 (4.3%) |
Employment Occupations by Sex in Needham
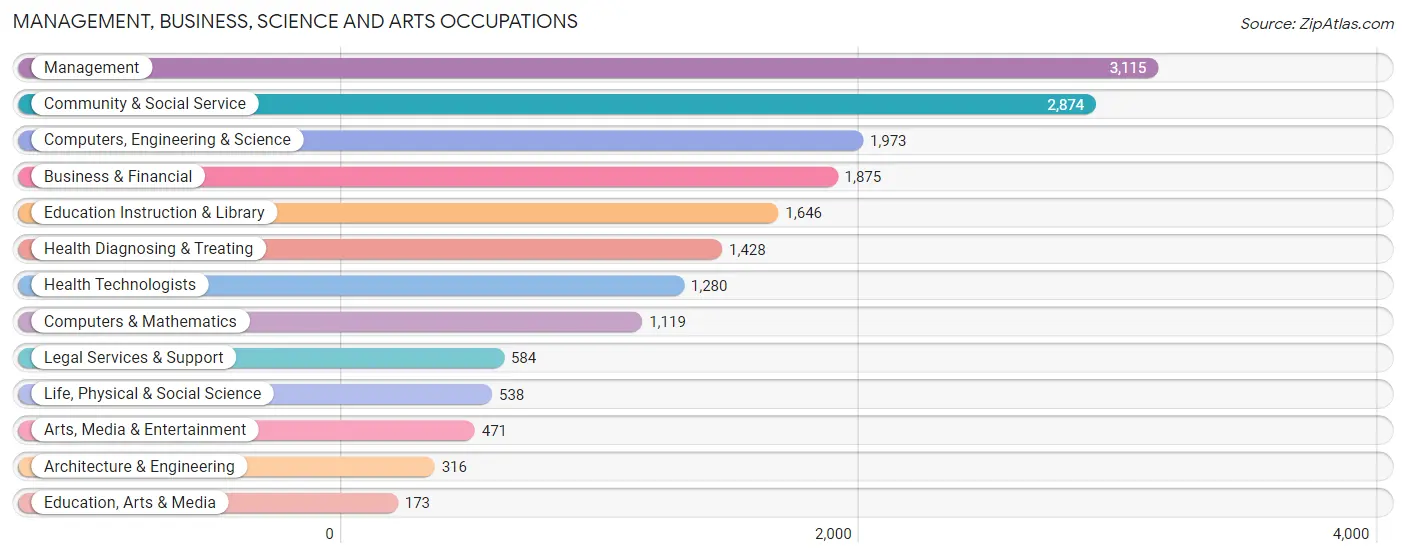
Management, Business, Science and Arts Occupations
The most common Management, Business, Science and Arts occupations in Needham are Management (3,115 | 20.0%), Community & Social Service (2,874 | 18.4%), Computers, Engineering & Science (1,973 | 12.6%), Business & Financial (1,875 | 12.0%), and Education Instruction & Library (1,646 | 10.5%).
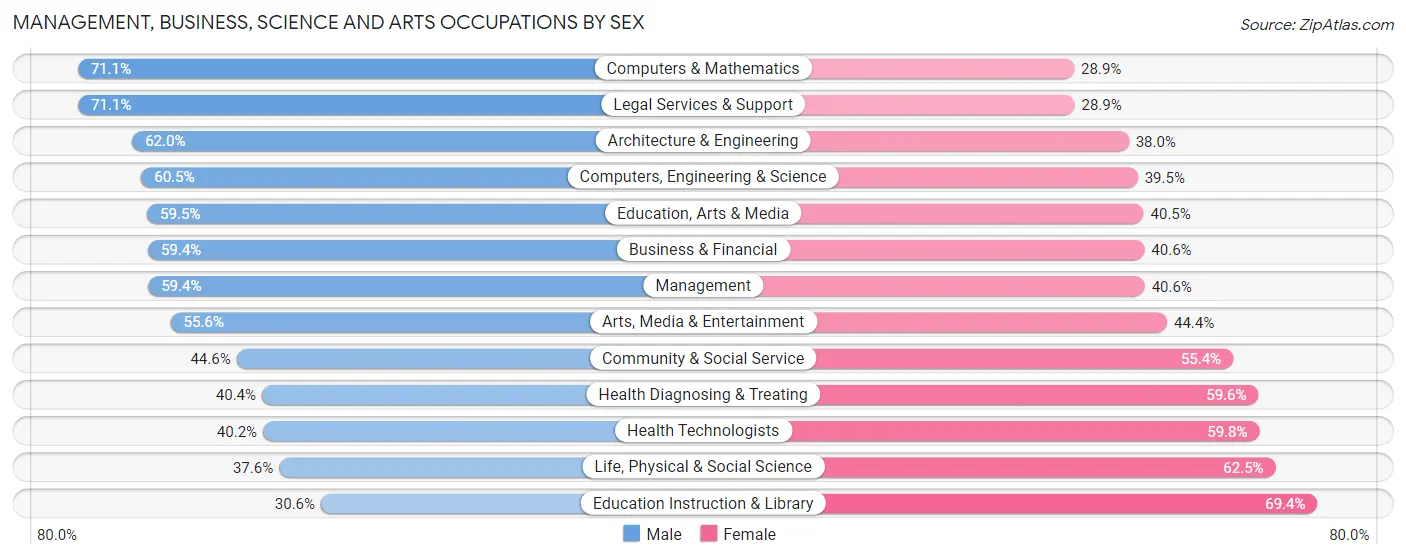
Management, Business, Science and Arts Occupations by Sex
Within the Management, Business, Science and Arts occupations in Needham, the most male-oriented occupations are Computers & Mathematics (71.1%), Legal Services & Support (71.1%), and Architecture & Engineering (62.0%), while the most female-oriented occupations are Education Instruction & Library (69.4%), Life, Physical & Social Science (62.5%), and Health Technologists (59.8%).
| Occupation | Male | Female |
| Management | 1,849 (59.4%) | 1,266 (40.6%) |
| Business & Financial | 1,114 (59.4%) | 761 (40.6%) |
| Computers, Engineering & Science | 1,194 (60.5%) | 779 (39.5%) |
| Computers & Mathematics | 796 (71.1%) | 323 (28.9%) |
| Architecture & Engineering | 196 (62.0%) | 120 (38.0%) |
| Life, Physical & Social Science | 202 (37.6%) | 336 (62.5%) |
| Community & Social Service | 1,283 (44.6%) | 1,591 (55.4%) |
| Education, Arts & Media | 103 (59.5%) | 70 (40.5%) |
| Legal Services & Support | 415 (71.1%) | 169 (28.9%) |
| Education Instruction & Library | 503 (30.6%) | 1,143 (69.4%) |
| Arts, Media & Entertainment | 262 (55.6%) | 209 (44.4%) |
| Health Diagnosing & Treating | 577 (40.4%) | 851 (59.6%) |
| Health Technologists | 515 (40.2%) | 765 (59.8%) |
| Total (Category) | 6,017 (53.4%) | 5,248 (46.6%) |
| Total (Overall) | 8,463 (54.2%) | 7,143 (45.8%) |
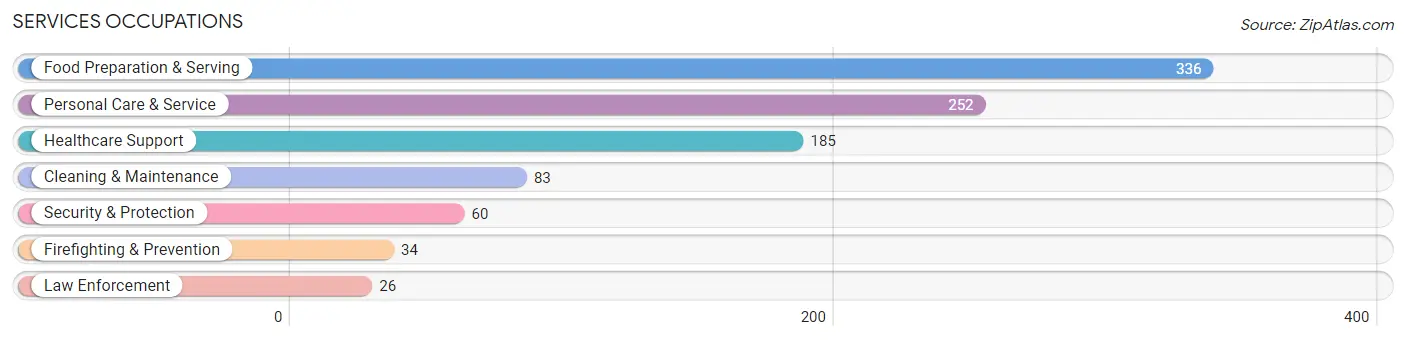
Services Occupations
The most common Services occupations in Needham are Food Preparation & Serving (336 | 2.1%), Personal Care & Service (252 | 1.6%), Healthcare Support (185 | 1.2%), Cleaning & Maintenance (83 | 0.5%), and Security & Protection (60 | 0.4%).
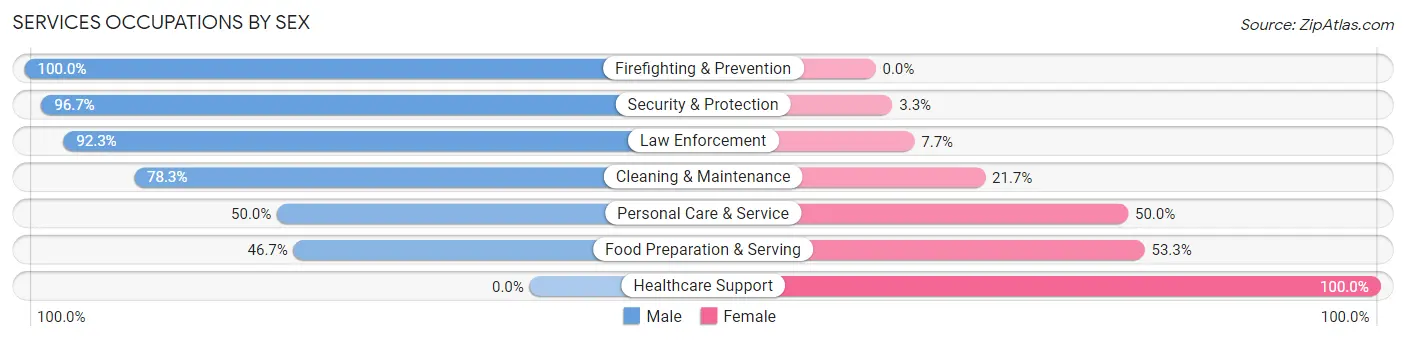
Services Occupations by Sex
Within the Services occupations in Needham, the most male-oriented occupations are Firefighting & Prevention (100.0%), Security & Protection (96.7%), and Law Enforcement (92.3%), while the most female-oriented occupations are Healthcare Support (100.0%), Food Preparation & Serving (53.3%), and Personal Care & Service (50.0%).
| Occupation | Male | Female |
| Healthcare Support | 0 (0.0%) | 185 (100.0%) |
| Security & Protection | 58 (96.7%) | 2 (3.3%) |
| Firefighting & Prevention | 34 (100.0%) | 0 (0.0%) |
| Law Enforcement | 24 (92.3%) | 2 (7.7%) |
| Food Preparation & Serving | 157 (46.7%) | 179 (53.3%) |
| Cleaning & Maintenance | 65 (78.3%) | 18 (21.7%) |
| Personal Care & Service | 126 (50.0%) | 126 (50.0%) |
| Total (Category) | 406 (44.3%) | 510 (55.7%) |
| Total (Overall) | 8,463 (54.2%) | 7,143 (45.8%) |
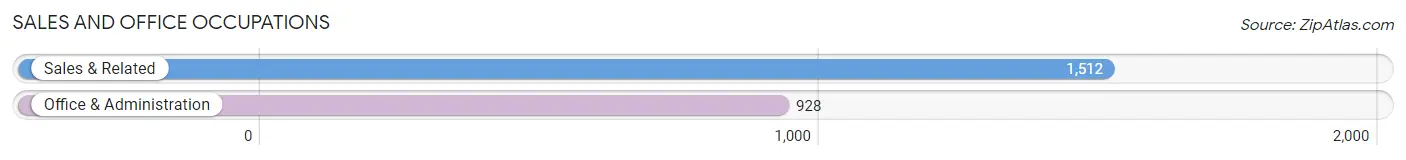
Sales and Office Occupations
The most common Sales and Office occupations in Needham are Sales & Related (1,512 | 9.7%), and Office & Administration (928 | 5.9%).
Sales and Office Occupations by Sex
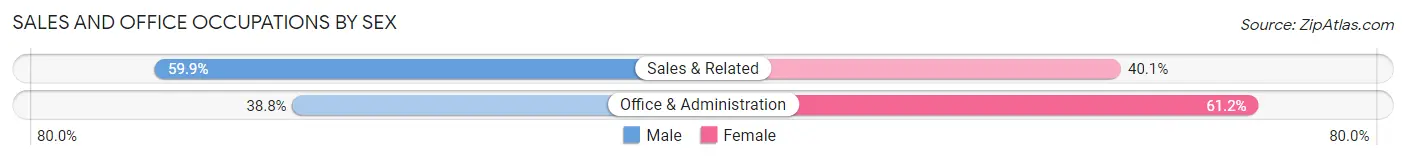
| Occupation | Male | Female |
| Sales & Related | 906 (59.9%) | 606 (40.1%) |
| Office & Administration | 360 (38.8%) | 568 (61.2%) |
| Total (Category) | 1,266 (51.9%) | 1,174 (48.1%) |
| Total (Overall) | 8,463 (54.2%) | 7,143 (45.8%) |
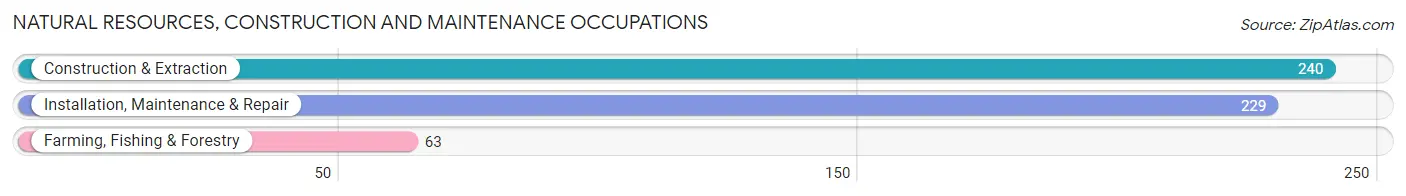
Natural Resources, Construction and Maintenance Occupations
The most common Natural Resources, Construction and Maintenance occupations in Needham are Construction & Extraction (240 | 1.5%), Installation, Maintenance & Repair (229 | 1.5%), and Farming, Fishing & Forestry (63 | 0.4%).
Natural Resources, Construction and Maintenance Occupations by Sex
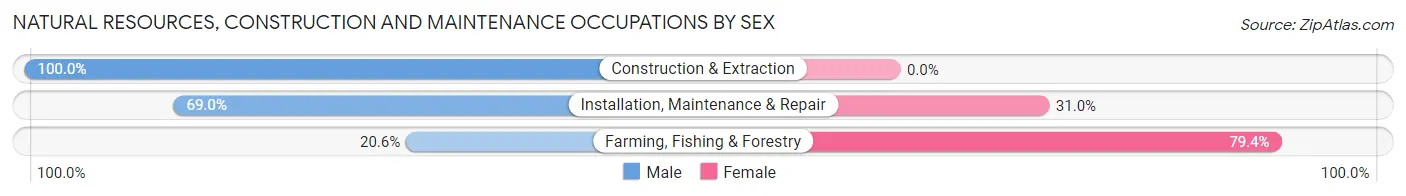
| Occupation | Male | Female |
| Farming, Fishing & Forestry | 13 (20.6%) | 50 (79.4%) |
| Construction & Extraction | 240 (100.0%) | 0 (0.0%) |
| Installation, Maintenance & Repair | 158 (69.0%) | 71 (31.0%) |
| Total (Category) | 411 (77.3%) | 121 (22.7%) |
| Total (Overall) | 8,463 (54.2%) | 7,143 (45.8%) |
Production, Transportation and Moving Occupations
The most common Production, Transportation and Moving occupations in Needham are Transportation (237 | 1.5%), Material Moving (143 | 0.9%), and Production (73 | 0.5%).
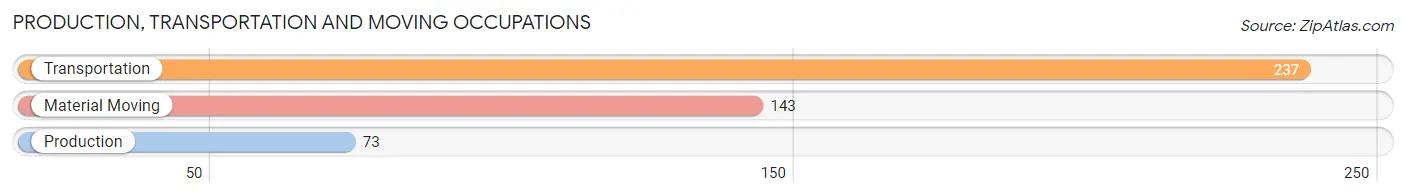
Production, Transportation and Moving Occupations by Sex
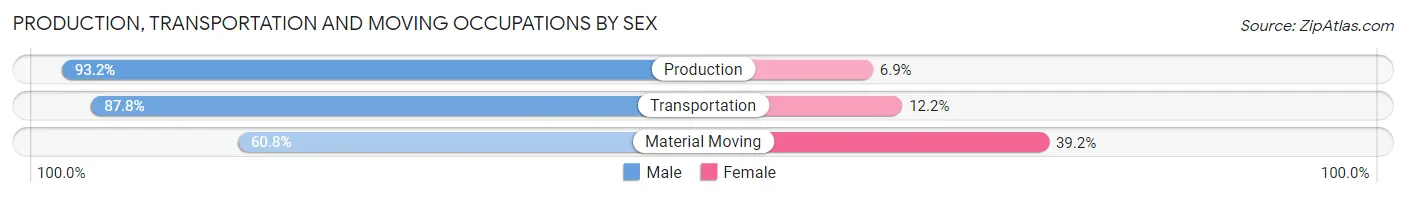
| Occupation | Male | Female |
| Production | 68 (93.1%) | 5 (6.9%) |
| Transportation | 208 (87.8%) | 29 (12.2%) |
| Material Moving | 87 (60.8%) | 56 (39.2%) |
| Total (Category) | 363 (80.1%) | 90 (19.9%) |
| Total (Overall) | 8,463 (54.2%) | 7,143 (45.8%) |
Employment Industries by Sex in Needham
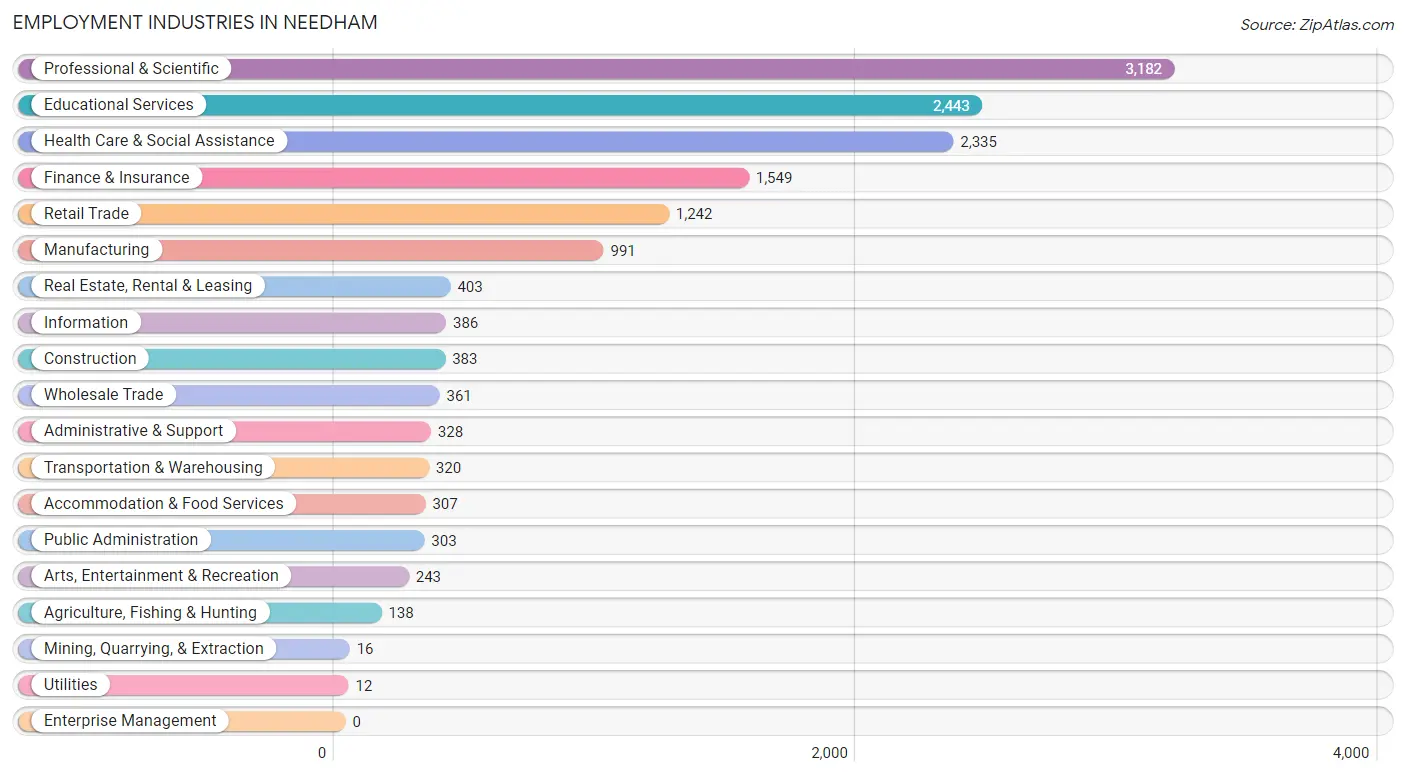
Employment Industries in Needham
The major employment industries in Needham include Professional & Scientific (3,182 | 20.4%), Educational Services (2,443 | 15.7%), Health Care & Social Assistance (2,335 | 15.0%), Finance & Insurance (1,549 | 9.9%), and Retail Trade (1,242 | 8.0%).
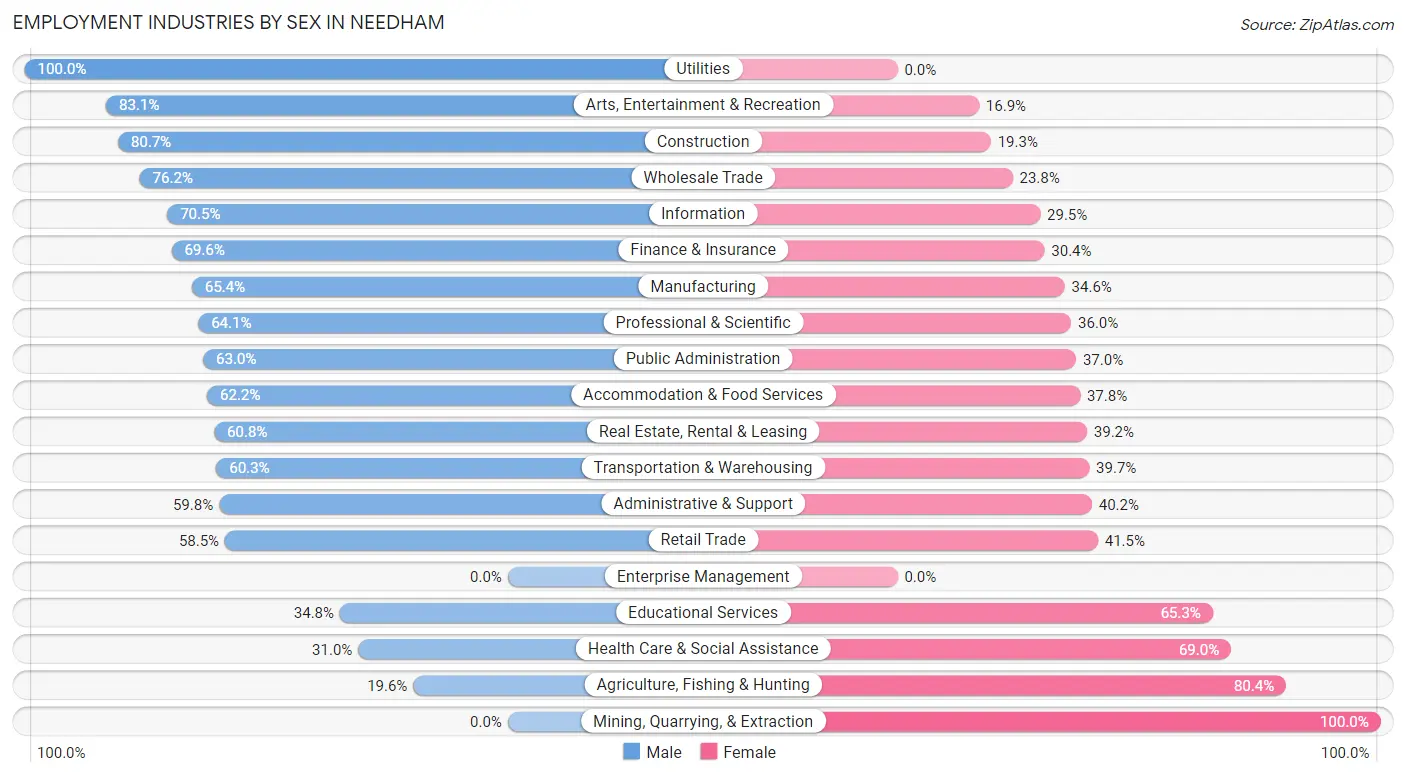
Employment Industries by Sex in Needham
The Needham industries that see more men than women are Utilities (100.0%), Arts, Entertainment & Recreation (83.1%), and Construction (80.7%), whereas the industries that tend to have a higher number of women are Mining, Quarrying, & Extraction (100.0%), Agriculture, Fishing & Hunting (80.4%), and Health Care & Social Assistance (69.0%).
| Industry | Male | Female |
| Agriculture, Fishing & Hunting | 27 (19.6%) | 111 (80.4%) |
| Mining, Quarrying, & Extraction | 0 (0.0%) | 16 (100.0%) |
| Construction | 309 (80.7%) | 74 (19.3%) |
| Manufacturing | 648 (65.4%) | 343 (34.6%) |
| Wholesale Trade | 275 (76.2%) | 86 (23.8%) |
| Retail Trade | 727 (58.5%) | 515 (41.5%) |
| Transportation & Warehousing | 193 (60.3%) | 127 (39.7%) |
| Utilities | 12 (100.0%) | 0 (0.0%) |
| Information | 272 (70.5%) | 114 (29.5%) |
| Finance & Insurance | 1,078 (69.6%) | 471 (30.4%) |
| Real Estate, Rental & Leasing | 245 (60.8%) | 158 (39.2%) |
| Professional & Scientific | 2,038 (64.0%) | 1,144 (35.9%) |
| Enterprise Management | 0 (0.0%) | 0 (0.0%) |
| Administrative & Support | 196 (59.8%) | 132 (40.2%) |
| Educational Services | 849 (34.7%) | 1,594 (65.2%) |
| Health Care & Social Assistance | 723 (31.0%) | 1,612 (69.0%) |
| Arts, Entertainment & Recreation | 202 (83.1%) | 41 (16.9%) |
| Accommodation & Food Services | 191 (62.2%) | 116 (37.8%) |
| Public Administration | 191 (63.0%) | 112 (37.0%) |
| Total | 8,463 (54.2%) | 7,143 (45.8%) |
Education in Needham
School Enrollment in Needham
The most common levels of schooling among the 9,602 students in Needham are high school (2,311 | 24.1%), elementary school (2,263 | 23.6%), and middle school (2,247 | 23.4%).
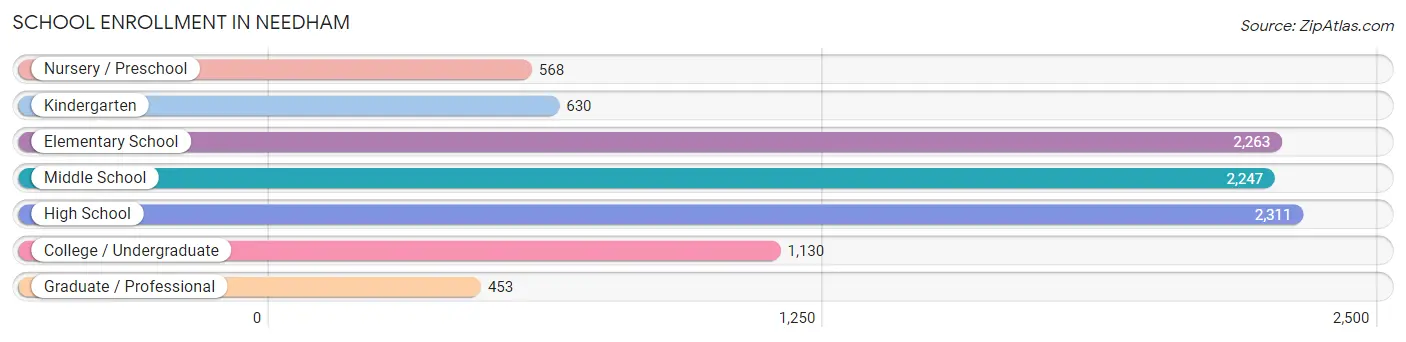
| School Level | # Students | % Students |
| Nursery / Preschool | 568 | 5.9% |
| Kindergarten | 630 | 6.6% |
| Elementary School | 2,263 | 23.6% |
| Middle School | 2,247 | 23.4% |
| High School | 2,311 | 24.1% |
| College / Undergraduate | 1,130 | 11.8% |
| Graduate / Professional | 453 | 4.7% |
| Total | 9,602 | 100.0% |
School Enrollment by Age by Funding Source in Needham
Out of a total of 9,602 students who are enrolled in schools in Needham, 2,737 (28.5%) attend a private institution, while the remaining 6,865 (71.5%) are enrolled in public schools. The age group of 3 to 4 year olds has the highest likelihood of being enrolled in private schools, with 436 (95.0% in the age bracket) enrolled. Conversely, the age group of 10 to 14 year olds has the lowest likelihood of being enrolled in a private school, with 2,571 (89.2% in the age bracket) attending a public institution.
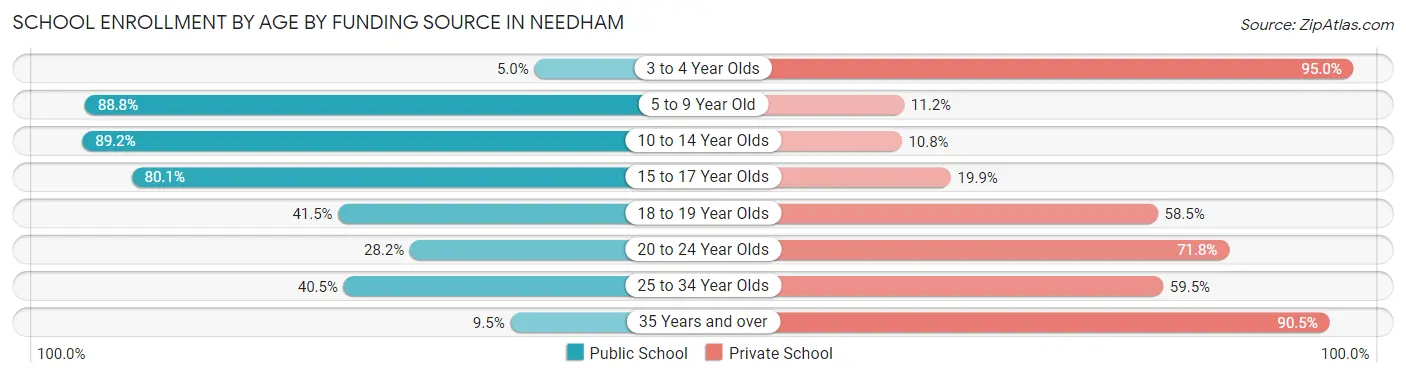
| Age Bracket | Public School | Private School |
| 3 to 4 Year Olds | 23 (5.0%) | 436 (95.0%) |
| 5 to 9 Year Old | 2,326 (88.8%) | 294 (11.2%) |
| 10 to 14 Year Olds | 2,571 (89.2%) | 310 (10.8%) |
| 15 to 17 Year Olds | 1,326 (80.1%) | 330 (19.9%) |
| 18 to 19 Year Olds | 361 (41.5%) | 508 (58.5%) |
| 20 to 24 Year Olds | 150 (28.2%) | 382 (71.8%) |
| 25 to 34 Year Olds | 75 (40.5%) | 110 (59.5%) |
| 35 Years and over | 38 (9.5%) | 362 (90.5%) |
| Total | 6,865 (71.5%) | 2,737 (28.5%) |
Educational Attainment by Field of Study in Needham
Business (2,923 | 15.7%), social sciences (2,855 | 15.3%), engineering (1,424 | 7.6%), computers & mathematics (1,294 | 6.9%), and bio, nature & agricultural (1,194 | 6.4%) are the most common fields of study among 18,676 individuals in Needham who have obtained a bachelor's degree or higher.
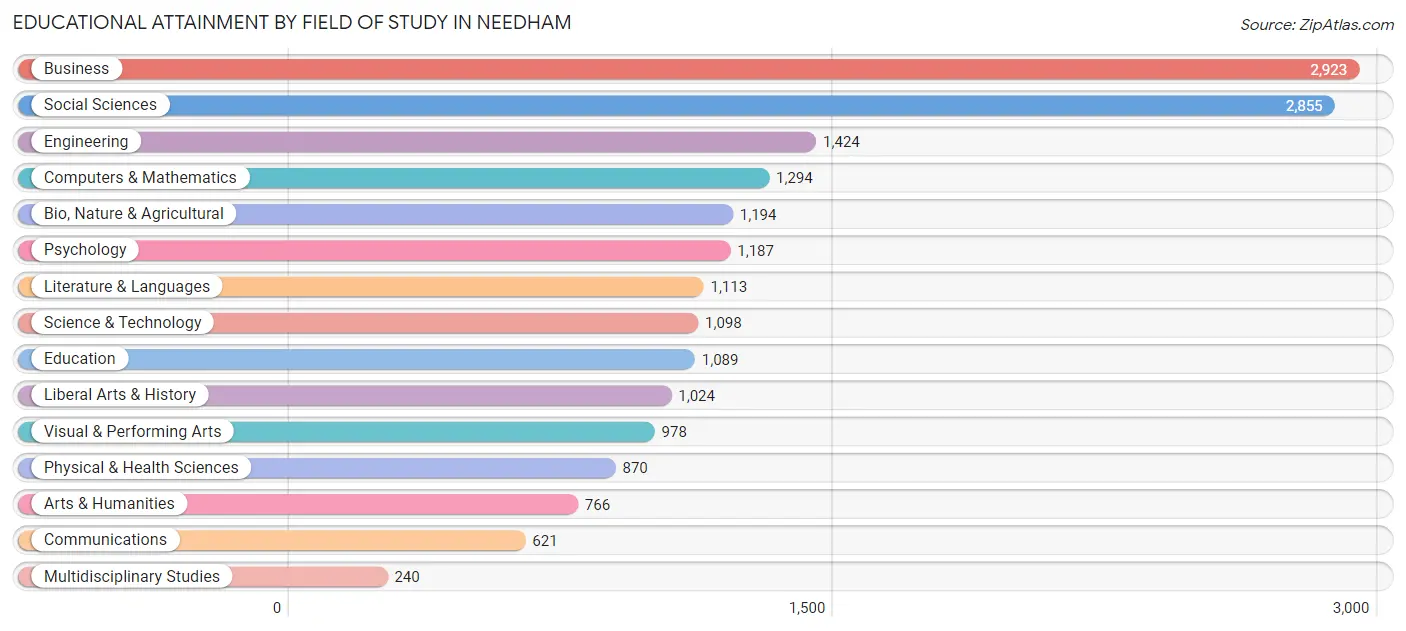
| Field of Study | # Graduates | % Graduates |
| Computers & Mathematics | 1,294 | 6.9% |
| Bio, Nature & Agricultural | 1,194 | 6.4% |
| Physical & Health Sciences | 870 | 4.7% |
| Psychology | 1,187 | 6.4% |
| Social Sciences | 2,855 | 15.3% |
| Engineering | 1,424 | 7.6% |
| Multidisciplinary Studies | 240 | 1.3% |
| Science & Technology | 1,098 | 5.9% |
| Business | 2,923 | 15.7% |
| Education | 1,089 | 5.8% |
| Literature & Languages | 1,113 | 6.0% |
| Liberal Arts & History | 1,024 | 5.5% |
| Visual & Performing Arts | 978 | 5.2% |
| Communications | 621 | 3.3% |
| Arts & Humanities | 766 | 4.1% |
| Total | 18,676 | 100.0% |
Transportation & Commute in Needham
Vehicle Availability by Sex in Needham
The most prevalent vehicle ownership categories in Needham are males with 2 vehicles (4,940, accounting for 59.3%) and females with 2 vehicles (4,207, making up 72.2%).
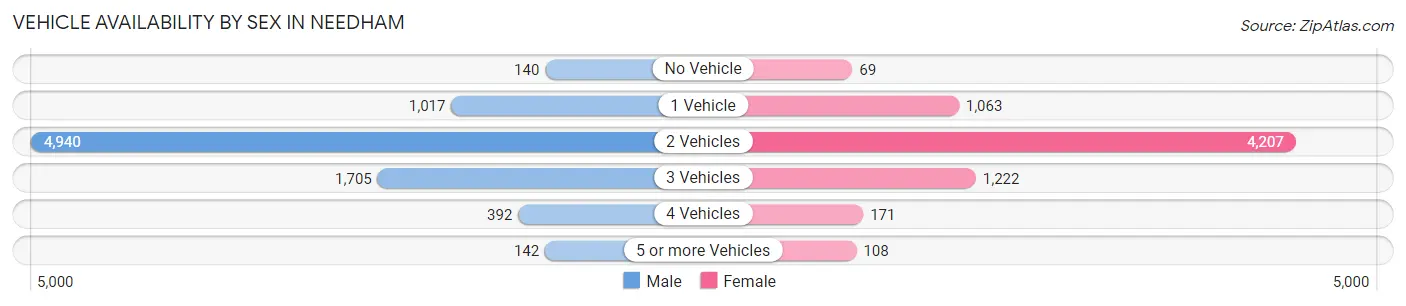
| Vehicles Available | Male | Female |
| No Vehicle | 140 (1.7%) | 69 (1.0%) |
| 1 Vehicle | 1,017 (12.2%) | 1,063 (15.5%) |
| 2 Vehicles | 4,940 (59.3%) | 4,207 (61.5%) |
| 3 Vehicles | 1,705 (20.4%) | 1,222 (17.9%) |
| 4 Vehicles | 392 (4.7%) | 171 (2.5%) |
| 5 or more Vehicles | 142 (1.7%) | 108 (1.6%) |
| Total | 8,336 (100.0%) | 6,840 (100.0%) |
Commute Time in Needham
The most frequently occuring commute durations in Needham are 45 to 59 minutes (1,794 commuters, 15.7%), 30 to 34 minutes (1,436 commuters, 12.6%), and 15 to 19 minutes (1,337 commuters, 11.7%).
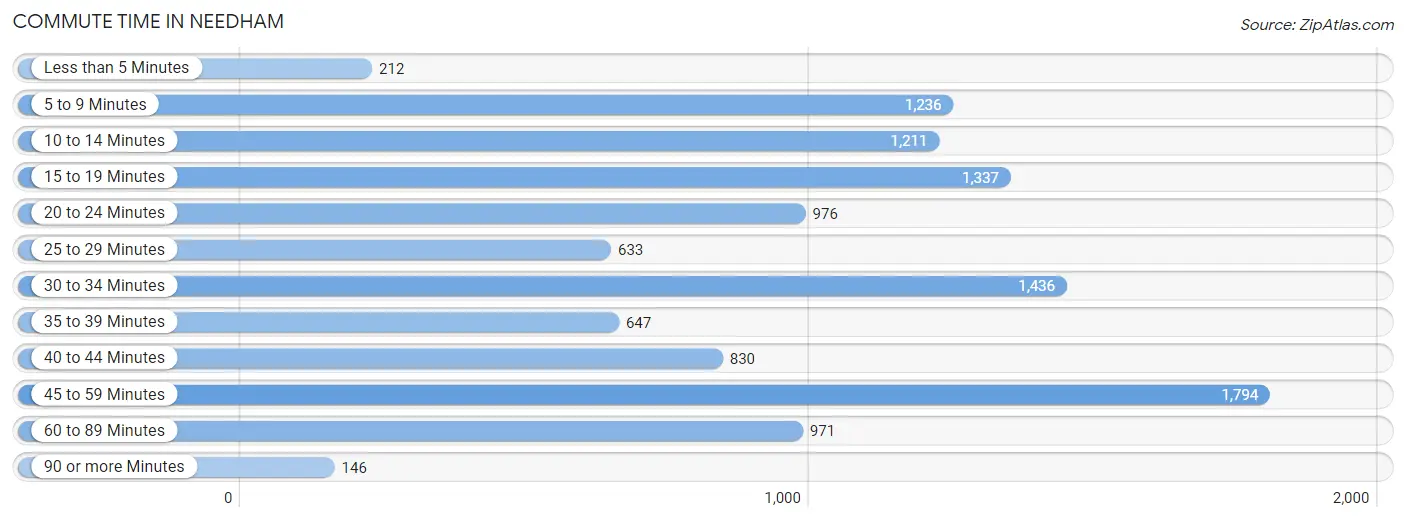
| Commute Time | # Commuters | % Commuters |
| Less than 5 Minutes | 212 | 1.8% |
| 5 to 9 Minutes | 1,236 | 10.8% |
| 10 to 14 Minutes | 1,211 | 10.6% |
| 15 to 19 Minutes | 1,337 | 11.7% |
| 20 to 24 Minutes | 976 | 8.5% |
| 25 to 29 Minutes | 633 | 5.5% |
| 30 to 34 Minutes | 1,436 | 12.6% |
| 35 to 39 Minutes | 647 | 5.7% |
| 40 to 44 Minutes | 830 | 7.3% |
| 45 to 59 Minutes | 1,794 | 15.7% |
| 60 to 89 Minutes | 971 | 8.5% |
| 90 or more Minutes | 146 | 1.3% |
Commute Time by Sex in Needham
The most common commute times in Needham are 45 to 59 minutes (1,113 commuters, 18.1%) for males and 15 to 19 minutes (799 commuters, 15.1%) for females.
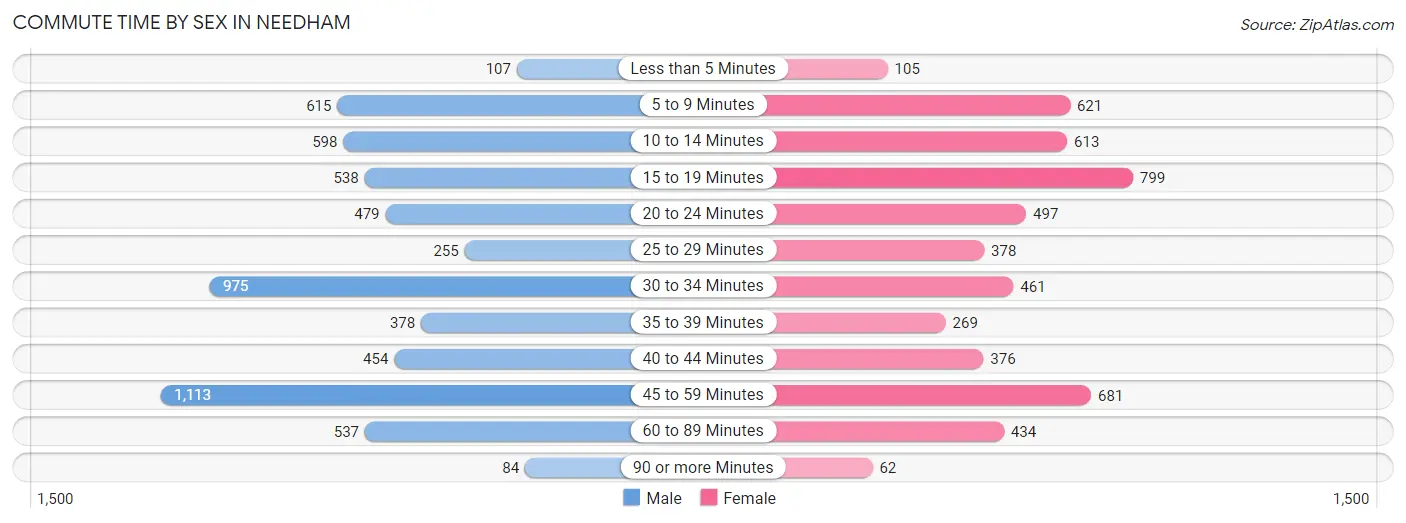
| Commute Time | Male | Female |
| Less than 5 Minutes | 107 (1.7%) | 105 (2.0%) |
| 5 to 9 Minutes | 615 (10.0%) | 621 (11.7%) |
| 10 to 14 Minutes | 598 (9.8%) | 613 (11.6%) |
| 15 to 19 Minutes | 538 (8.8%) | 799 (15.1%) |
| 20 to 24 Minutes | 479 (7.8%) | 497 (9.4%) |
| 25 to 29 Minutes | 255 (4.2%) | 378 (7.1%) |
| 30 to 34 Minutes | 975 (15.9%) | 461 (8.7%) |
| 35 to 39 Minutes | 378 (6.2%) | 269 (5.1%) |
| 40 to 44 Minutes | 454 (7.4%) | 376 (7.1%) |
| 45 to 59 Minutes | 1,113 (18.1%) | 681 (12.9%) |
| 60 to 89 Minutes | 537 (8.8%) | 434 (8.2%) |
| 90 or more Minutes | 84 (1.4%) | 62 (1.2%) |
Time of Departure to Work by Sex in Needham
The most frequent times of departure to work in Needham are 8:00 AM to 8:29 AM (1,129, 18.4%) for males and 8:00 AM to 8:29 AM (1,260, 23.8%) for females.
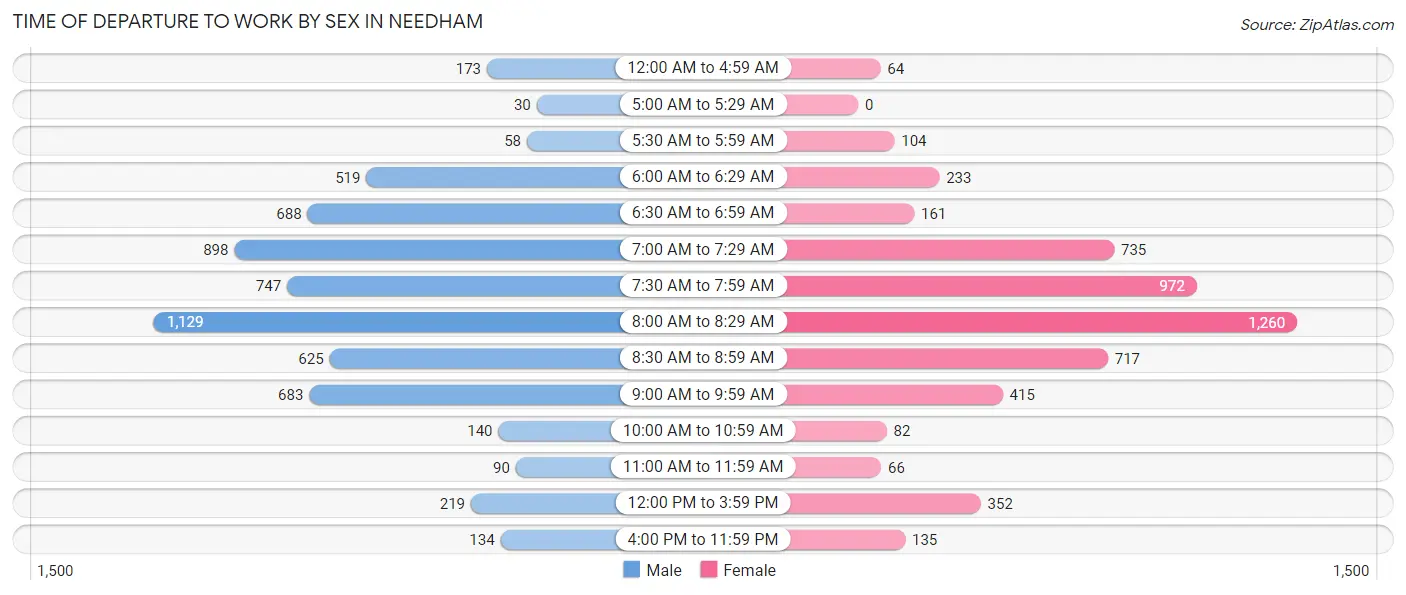
| Time of Departure | Male | Female |
| 12:00 AM to 4:59 AM | 173 (2.8%) | 64 (1.2%) |
| 5:00 AM to 5:29 AM | 30 (0.5%) | 0 (0.0%) |
| 5:30 AM to 5:59 AM | 58 (0.9%) | 104 (2.0%) |
| 6:00 AM to 6:29 AM | 519 (8.5%) | 233 (4.4%) |
| 6:30 AM to 6:59 AM | 688 (11.2%) | 161 (3.0%) |
| 7:00 AM to 7:29 AM | 898 (14.6%) | 735 (13.9%) |
| 7:30 AM to 7:59 AM | 747 (12.2%) | 972 (18.3%) |
| 8:00 AM to 8:29 AM | 1,129 (18.4%) | 1,260 (23.8%) |
| 8:30 AM to 8:59 AM | 625 (10.2%) | 717 (13.5%) |
| 9:00 AM to 9:59 AM | 683 (11.1%) | 415 (7.8%) |
| 10:00 AM to 10:59 AM | 140 (2.3%) | 82 (1.5%) |
| 11:00 AM to 11:59 AM | 90 (1.5%) | 66 (1.3%) |
| 12:00 PM to 3:59 PM | 219 (3.6%) | 352 (6.7%) |
| 4:00 PM to 11:59 PM | 134 (2.2%) | 135 (2.5%) |
| Total | 6,133 (100.0%) | 5,296 (100.0%) |
Housing Occupancy in Needham
Occupancy by Ownership in Needham
Of the total 11,312 dwellings in Needham, owner-occupied units account for 9,707 (85.8%), while renter-occupied units make up 1,605 (14.2%).
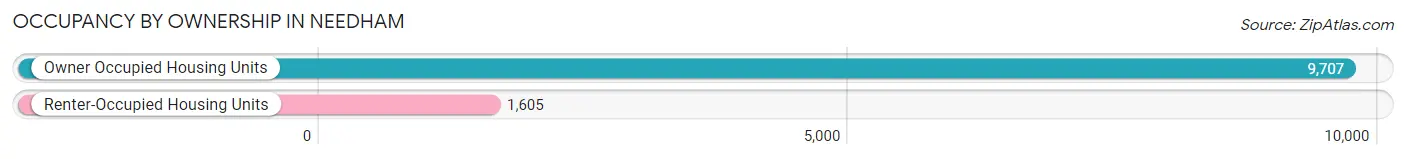
| Occupancy | # Housing Units | % Housing Units |
| Owner Occupied Housing Units | 9,707 | 85.8% |
| Renter-Occupied Housing Units | 1,605 | 14.2% |
| Total Occupied Housing Units | 11,312 | 100.0% |
Occupancy by Household Size in Needham
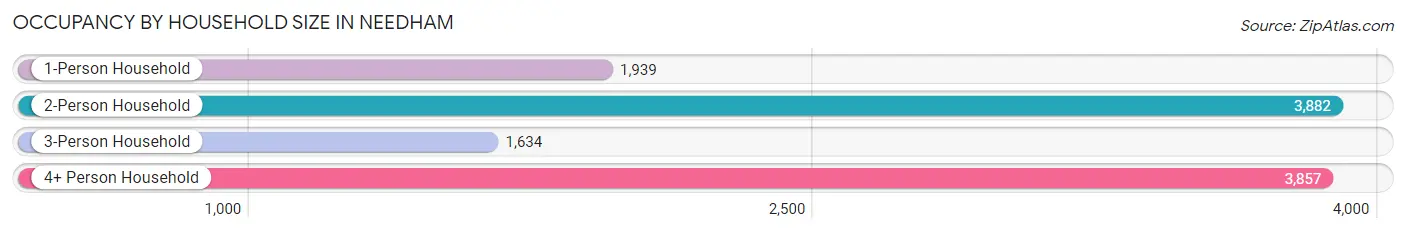
| Household Size | # Housing Units | % Housing Units |
| 1-Person Household | 1,939 | 17.1% |
| 2-Person Household | 3,882 | 34.3% |
| 3-Person Household | 1,634 | 14.4% |
| 4+ Person Household | 3,857 | 34.1% |
| Total Housing Units | 11,312 | 100.0% |
Occupancy by Ownership by Household Size in Needham
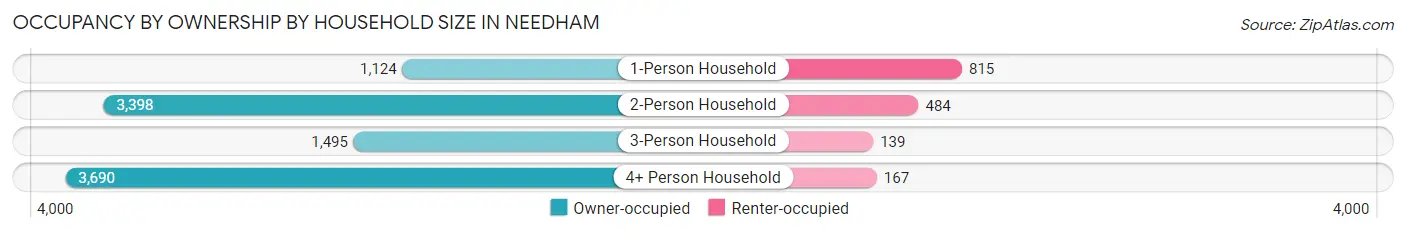
| Household Size | Owner-occupied | Renter-occupied |
| 1-Person Household | 1,124 (58.0%) | 815 (42.0%) |
| 2-Person Household | 3,398 (87.5%) | 484 (12.5%) |
| 3-Person Household | 1,495 (91.5%) | 139 (8.5%) |
| 4+ Person Household | 3,690 (95.7%) | 167 (4.3%) |
| Total Housing Units | 9,707 (85.8%) | 1,605 (14.2%) |
Occupancy by Educational Attainment in Needham
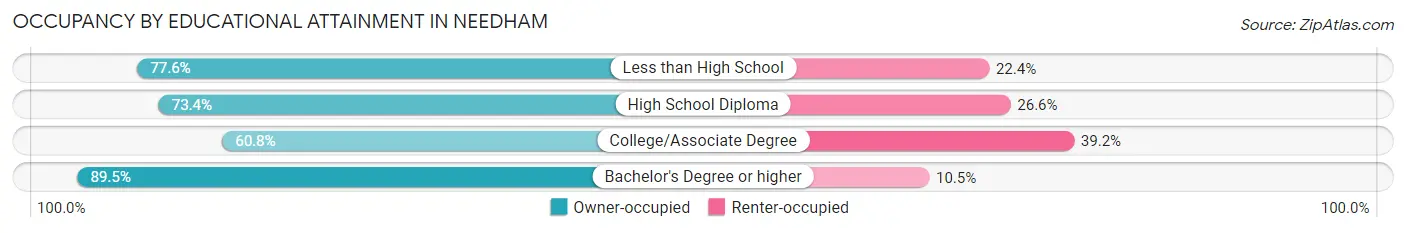
| Household Size | Owner-occupied | Renter-occupied |
| Less than High School | 59 (77.6%) | 17 (22.4%) |
| High School Diploma | 466 (73.4%) | 169 (26.6%) |
| College/Associate Degree | 650 (60.8%) | 419 (39.2%) |
| Bachelor's Degree or higher | 8,532 (89.5%) | 1,000 (10.5%) |
Occupancy by Age of Householder in Needham
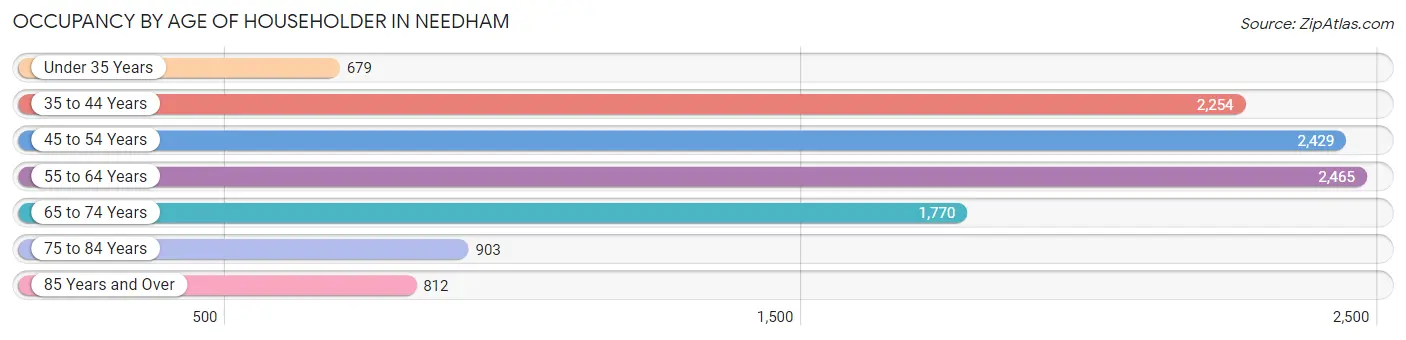
| Age Bracket | # Households | % Households |
| Under 35 Years | 679 | 6.0% |
| 35 to 44 Years | 2,254 | 19.9% |
| 45 to 54 Years | 2,429 | 21.5% |
| 55 to 64 Years | 2,465 | 21.8% |
| 65 to 74 Years | 1,770 | 15.7% |
| 75 to 84 Years | 903 | 8.0% |
| 85 Years and Over | 812 | 7.2% |
| Total | 11,312 | 100.0% |
Housing Finances in Needham
Median Income by Occupancy in Needham
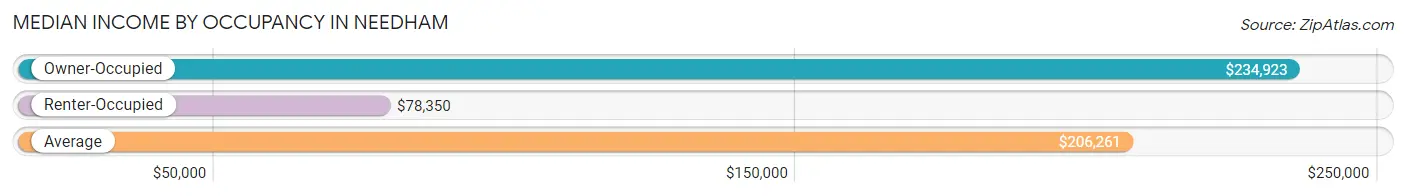
| Occupancy Type | # Households | Median Income |
| Owner-Occupied | 9,707 (85.8%) | $234,923 |
| Renter-Occupied | 1,605 (14.2%) | $78,350 |
| Average | 11,312 (100.0%) | $206,261 |
Occupancy by Householder Income Bracket in Needham
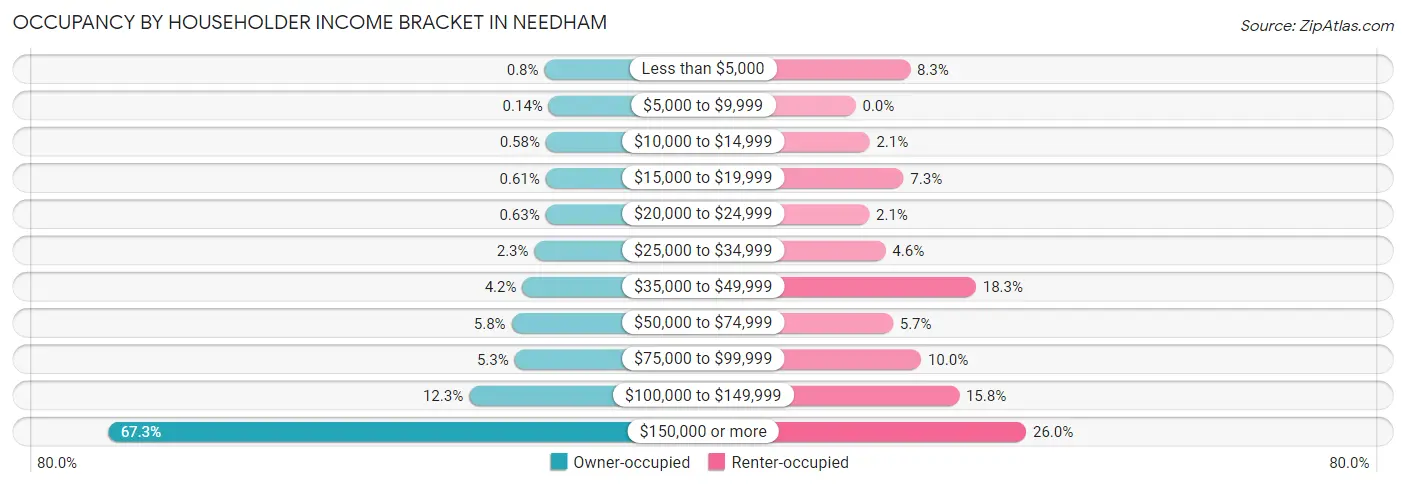
| Income Bracket | Owner-occupied | Renter-occupied |
| Less than $5,000 | 78 (0.8%) | 133 (8.3%) |
| $5,000 to $9,999 | 14 (0.1%) | 0 (0.0%) |
| $10,000 to $14,999 | 56 (0.6%) | 34 (2.1%) |
| $15,000 to $19,999 | 59 (0.6%) | 117 (7.3%) |
| $20,000 to $24,999 | 61 (0.6%) | 33 (2.1%) |
| $25,000 to $34,999 | 225 (2.3%) | 73 (4.5%) |
| $35,000 to $49,999 | 404 (4.2%) | 294 (18.3%) |
| $50,000 to $74,999 | 564 (5.8%) | 91 (5.7%) |
| $75,000 to $99,999 | 518 (5.3%) | 160 (10.0%) |
| $100,000 to $149,999 | 1,192 (12.3%) | 253 (15.8%) |
| $150,000 or more | 6,536 (67.3%) | 417 (26.0%) |
| Total | 9,707 (100.0%) | 1,605 (100.0%) |
Monthly Housing Cost Tiers in Needham
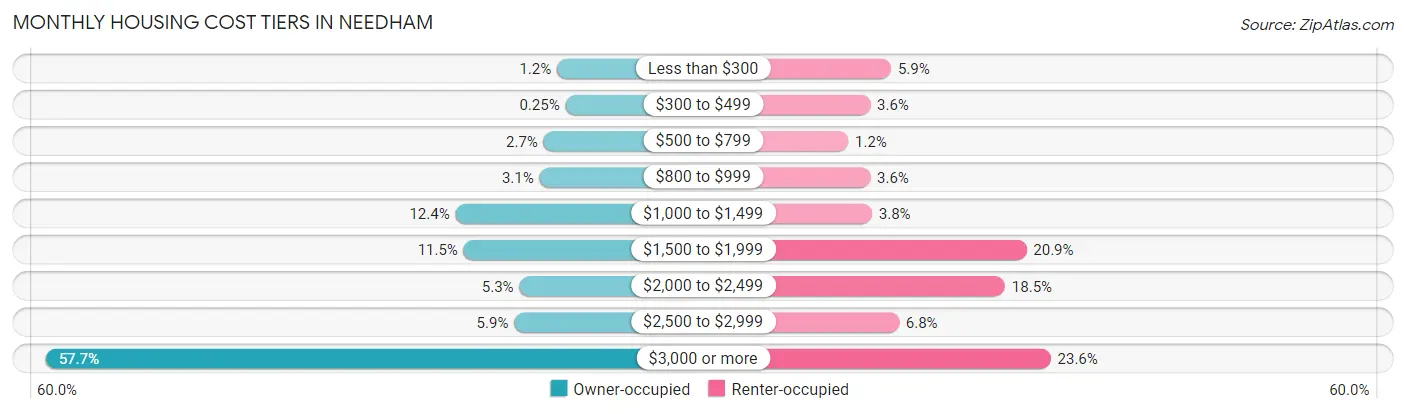
| Monthly Cost | Owner-occupied | Renter-occupied |
| Less than $300 | 115 (1.2%) | 95 (5.9%) |
| $300 to $499 | 24 (0.3%) | 58 (3.6%) |
| $500 to $799 | 258 (2.7%) | 19 (1.2%) |
| $800 to $999 | 302 (3.1%) | 58 (3.6%) |
| $1,000 to $1,499 | 1,204 (12.4%) | 61 (3.8%) |
| $1,500 to $1,999 | 1,115 (11.5%) | 335 (20.9%) |
| $2,000 to $2,499 | 518 (5.3%) | 297 (18.5%) |
| $2,500 to $2,999 | 574 (5.9%) | 109 (6.8%) |
| $3,000 or more | 5,597 (57.7%) | 378 (23.5%) |
| Total | 9,707 (100.0%) | 1,605 (100.0%) |
Physical Housing Characteristics in Needham
Housing Structures in Needham
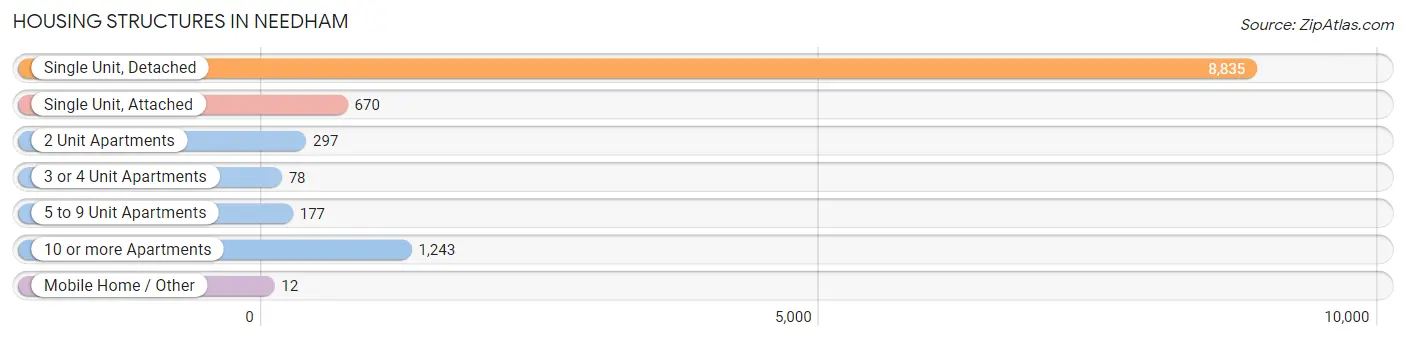
| Structure Type | # Housing Units | % Housing Units |
| Single Unit, Detached | 8,835 | 78.1% |
| Single Unit, Attached | 670 | 5.9% |
| 2 Unit Apartments | 297 | 2.6% |
| 3 or 4 Unit Apartments | 78 | 0.7% |
| 5 to 9 Unit Apartments | 177 | 1.6% |
| 10 or more Apartments | 1,243 | 11.0% |
| Mobile Home / Other | 12 | 0.1% |
| Total | 11,312 | 100.0% |
Housing Structures by Occupancy in Needham
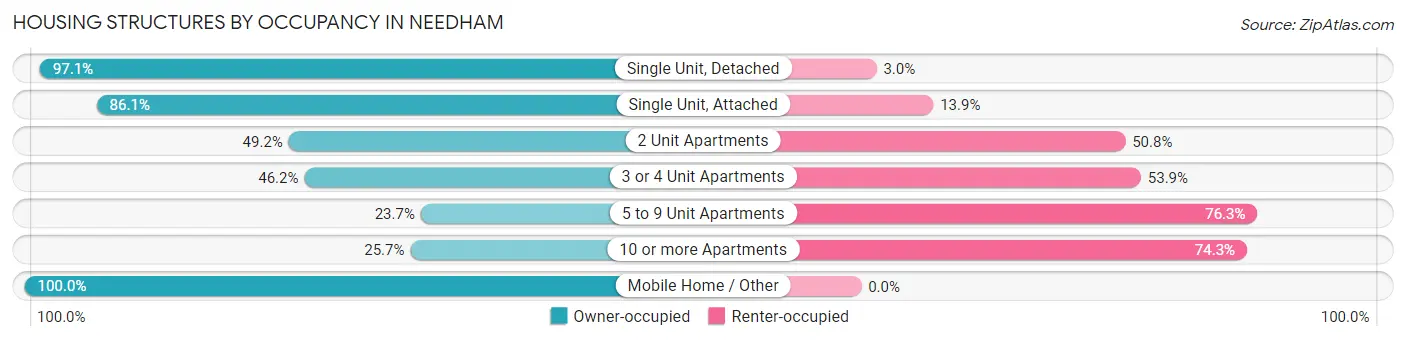
| Structure Type | Owner-occupied | Renter-occupied |
| Single Unit, Detached | 8,574 (97.1%) | 261 (2.9%) |
| Single Unit, Attached | 577 (86.1%) | 93 (13.9%) |
| 2 Unit Apartments | 146 (49.2%) | 151 (50.8%) |
| 3 or 4 Unit Apartments | 36 (46.2%) | 42 (53.8%) |
| 5 to 9 Unit Apartments | 42 (23.7%) | 135 (76.3%) |
| 10 or more Apartments | 320 (25.7%) | 923 (74.3%) |
| Mobile Home / Other | 12 (100.0%) | 0 (0.0%) |
| Total | 9,707 (85.8%) | 1,605 (14.2%) |
Housing Structures by Number of Rooms in Needham
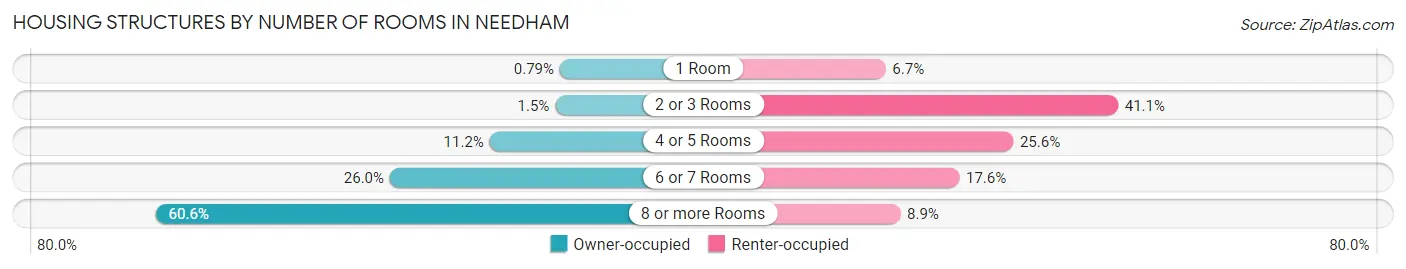
| Number of Rooms | Owner-occupied | Renter-occupied |
| 1 Room | 77 (0.8%) | 108 (6.7%) |
| 2 or 3 Rooms | 144 (1.5%) | 660 (41.1%) |
| 4 or 5 Rooms | 1,085 (11.2%) | 411 (25.6%) |
| 6 or 7 Rooms | 2,519 (26.0%) | 283 (17.6%) |
| 8 or more Rooms | 5,882 (60.6%) | 143 (8.9%) |
| Total | 9,707 (100.0%) | 1,605 (100.0%) |
Housing Structure by Heating Type in Needham
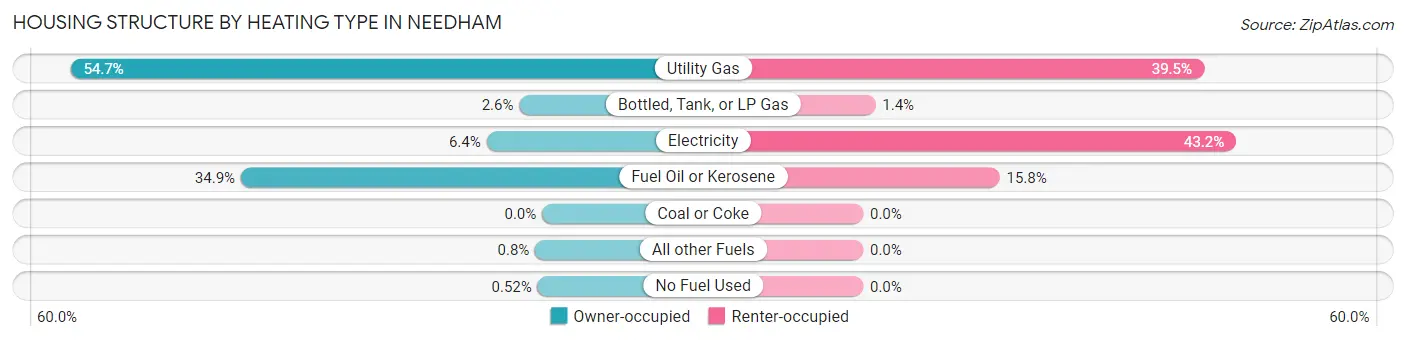
| Heating Type | Owner-occupied | Renter-occupied |
| Utility Gas | 5,308 (54.7%) | 634 (39.5%) |
| Bottled, Tank, or LP Gas | 256 (2.6%) | 23 (1.4%) |
| Electricity | 625 (6.4%) | 694 (43.2%) |
| Fuel Oil or Kerosene | 3,390 (34.9%) | 254 (15.8%) |
| Coal or Coke | 0 (0.0%) | 0 (0.0%) |
| All other Fuels | 78 (0.8%) | 0 (0.0%) |
| No Fuel Used | 50 (0.5%) | 0 (0.0%) |
| Total | 9,707 (100.0%) | 1,605 (100.0%) |
Household Vehicle Usage in Needham
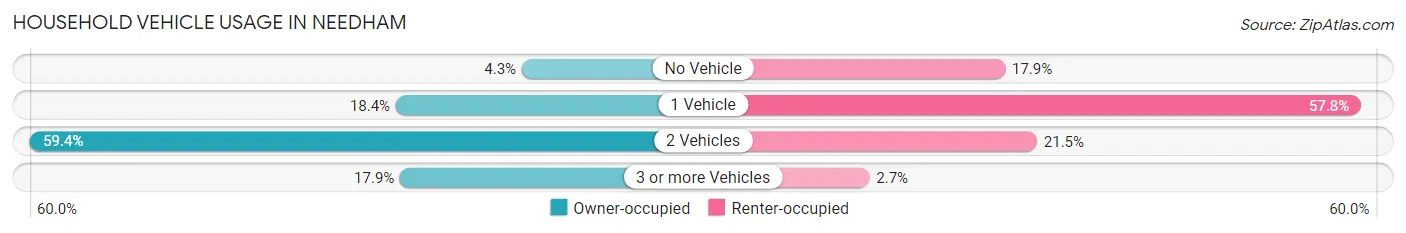
| Vehicles per Household | Owner-occupied | Renter-occupied |
| No Vehicle | 416 (4.3%) | 288 (17.9%) |
| 1 Vehicle | 1,786 (18.4%) | 928 (57.8%) |
| 2 Vehicles | 5,765 (59.4%) | 345 (21.5%) |
| 3 or more Vehicles | 1,740 (17.9%) | 44 (2.7%) |
| Total | 9,707 (100.0%) | 1,605 (100.0%) |
Real Estate & Mortgages in Needham
Real Estate and Mortgage Overview in Needham
| Characteristic | Without Mortgage | With Mortgage |
| Housing Units | 3,173 | 6,534 |
| Median Property Value | $927,300 | $1,159,900 |
| Median Household Income | $138,540 | $5,091 |
| Monthly Housing Costs | $1,411 | $5,458 |
| Real Estate Taxes | $10,001 | $39 |
Property Value by Mortgage Status in Needham
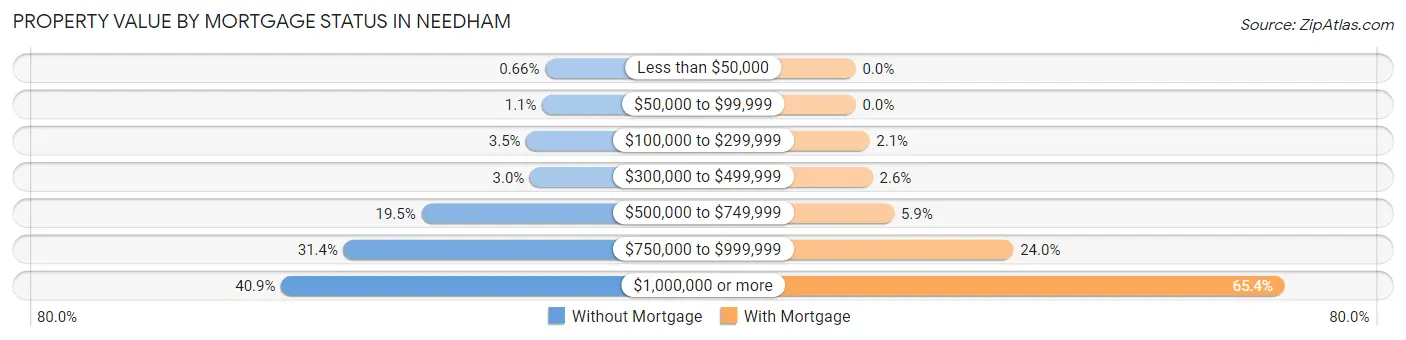
| Property Value | Without Mortgage | With Mortgage |
| Less than $50,000 | 21 (0.7%) | 0 (0.0%) |
| $50,000 to $99,999 | 35 (1.1%) | 0 (0.0%) |
| $100,000 to $299,999 | 112 (3.5%) | 138 (2.1%) |
| $300,000 to $499,999 | 94 (3.0%) | 170 (2.6%) |
| $500,000 to $749,999 | 619 (19.5%) | 382 (5.9%) |
| $750,000 to $999,999 | 995 (31.4%) | 1,570 (24.0%) |
| $1,000,000 or more | 1,297 (40.9%) | 4,274 (65.4%) |
| Total | 3,173 (100.0%) | 6,534 (100.0%) |
Household Income by Mortgage Status in Needham
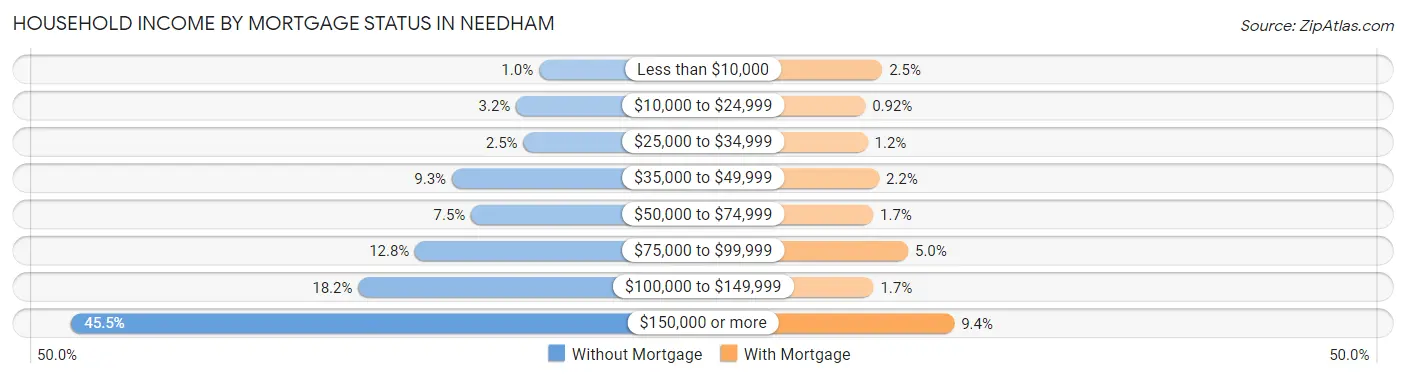
| Household Income | Without Mortgage | With Mortgage |
| Less than $10,000 | 32 (1.0%) | 166 (2.5%) |
| $10,000 to $24,999 | 101 (3.2%) | 60 (0.9%) |
| $25,000 to $34,999 | 79 (2.5%) | 75 (1.1%) |
| $35,000 to $49,999 | 295 (9.3%) | 146 (2.2%) |
| $50,000 to $74,999 | 237 (7.5%) | 109 (1.7%) |
| $75,000 to $99,999 | 406 (12.8%) | 327 (5.0%) |
| $100,000 to $149,999 | 578 (18.2%) | 112 (1.7%) |
| $150,000 or more | 1,445 (45.5%) | 614 (9.4%) |
| Total | 3,173 (100.0%) | 6,534 (100.0%) |
Property Value to Household Income Ratio in Needham
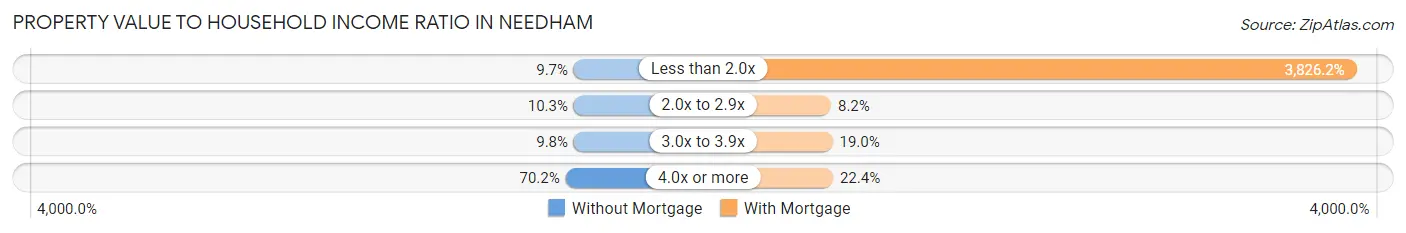
| Value-to-Income Ratio | Without Mortgage | With Mortgage |
| Less than 2.0x | 307 (9.7%) | 250,001 (3,826.2%) |
| 2.0x to 2.9x | 328 (10.3%) | 536 (8.2%) |
| 3.0x to 3.9x | 312 (9.8%) | 1,238 (19.0%) |
| 4.0x or more | 2,226 (70.2%) | 1,461 (22.4%) |
| Total | 3,173 (100.0%) | 6,534 (100.0%) |
Real Estate Taxes by Mortgage Status in Needham
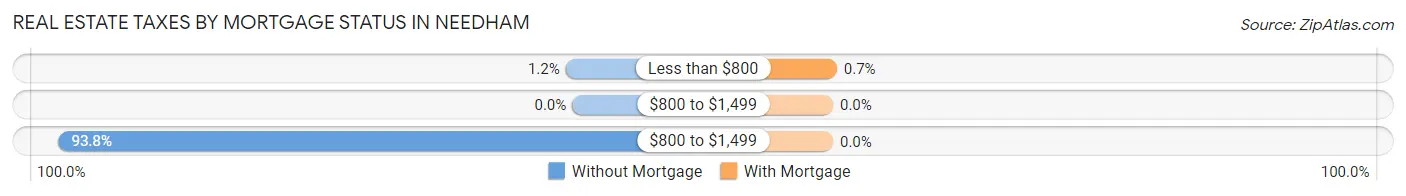
| Property Taxes | Without Mortgage | With Mortgage |
| Less than $800 | 38 (1.2%) | 46 (0.7%) |
| $800 to $1,499 | 0 (0.0%) | 0 (0.0%) |
| $800 to $1,499 | 2,976 (93.8%) | 0 (0.0%) |
| Total | 3,173 (100.0%) | 6,534 (100.0%) |
Health & Disability in Needham
Health Insurance Coverage by Age in Needham
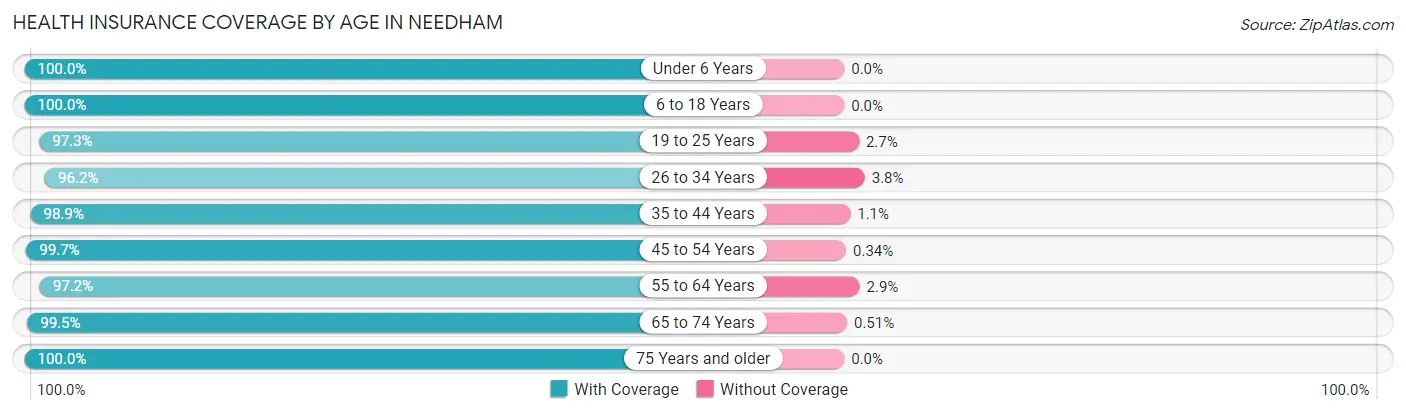
| Age Bracket | With Coverage | Without Coverage |
| Under 6 Years | 1,849 (100.0%) | 0 (0.0%) |
| 6 to 18 Years | 7,411 (100.0%) | 0 (0.0%) |
| 19 to 25 Years | 1,455 (97.3%) | 41 (2.7%) |
| 26 to 34 Years | 1,664 (96.2%) | 66 (3.8%) |
| 35 to 44 Years | 4,327 (98.9%) | 49 (1.1%) |
| 45 to 54 Years | 4,655 (99.7%) | 16 (0.3%) |
| 55 to 64 Years | 4,364 (97.2%) | 128 (2.9%) |
| 65 to 74 Years | 2,935 (99.5%) | 15 (0.5%) |
| 75 Years and older | 2,630 (100.0%) | 0 (0.0%) |
| Total | 31,290 (99.0%) | 315 (1.0%) |
Health Insurance Coverage by Citizenship Status in Needham
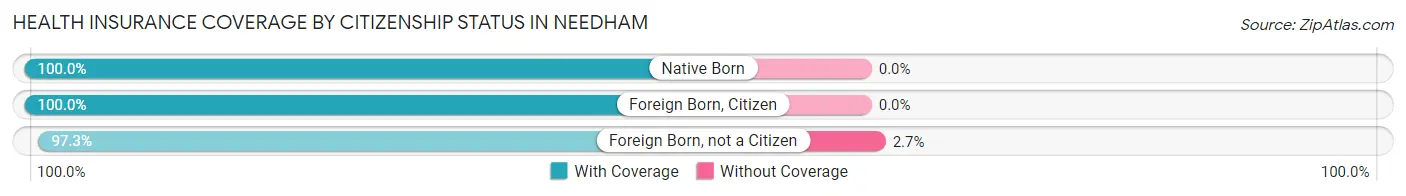
| Citizenship Status | With Coverage | Without Coverage |
| Native Born | 1,849 (100.0%) | 0 (0.0%) |
| Foreign Born, Citizen | 7,411 (100.0%) | 0 (0.0%) |
| Foreign Born, not a Citizen | 1,455 (97.3%) | 41 (2.7%) |
Health Insurance Coverage by Household Income in Needham
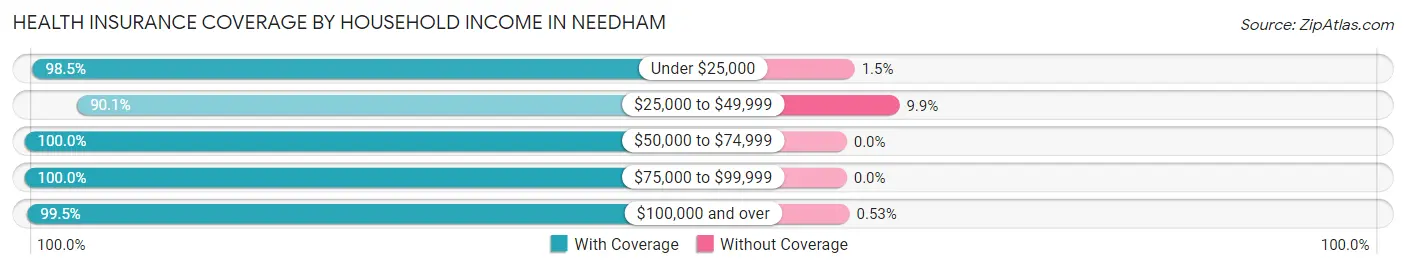
| Household Income | With Coverage | Without Coverage |
| Under $25,000 | 995 (98.5%) | 15 (1.5%) |
| $25,000 to $49,999 | 1,480 (90.1%) | 162 (9.9%) |
| $50,000 to $74,999 | 1,156 (100.0%) | 0 (0.0%) |
| $75,000 to $99,999 | 1,347 (100.0%) | 0 (0.0%) |
| $100,000 and over | 25,946 (99.5%) | 138 (0.5%) |
Public vs Private Health Insurance Coverage by Age in Needham
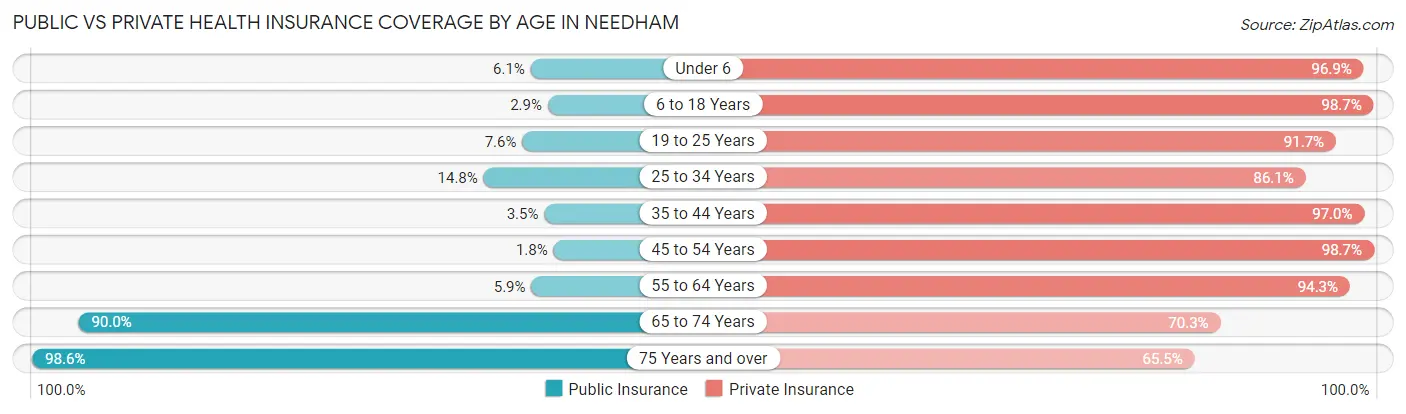
| Age Bracket | Public Insurance | Private Insurance |
| Under 6 | 112 (6.1%) | 1,791 (96.9%) |
| 6 to 18 Years | 214 (2.9%) | 7,315 (98.7%) |
| 19 to 25 Years | 114 (7.6%) | 1,372 (91.7%) |
| 25 to 34 Years | 256 (14.8%) | 1,489 (86.1%) |
| 35 to 44 Years | 155 (3.5%) | 4,244 (97.0%) |
| 45 to 54 Years | 85 (1.8%) | 4,612 (98.7%) |
| 55 to 64 Years | 267 (5.9%) | 4,236 (94.3%) |
| 65 to 74 Years | 2,655 (90.0%) | 2,073 (70.3%) |
| 75 Years and over | 2,593 (98.6%) | 1,722 (65.5%) |
| Total | 6,451 (20.4%) | 28,854 (91.3%) |
Disability Status by Sex by Age in Needham

| Age Bracket | Male | Female |
| Under 5 Years | 0 (0.0%) | 52 (6.4%) |
| 5 to 17 Years | 77 (2.3%) | 11 (0.3%) |
| 18 to 34 Years | 223 (12.0%) | 37 (2.0%) |
| 35 to 64 Years | 128 (1.9%) | 144 (2.1%) |
| 65 to 74 Years | 115 (8.4%) | 202 (12.8%) |
| 75 Years and over | 409 (36.8%) | 858 (56.5%) |
Disability Class by Sex by Age in Needham
Disability Class: Hearing Difficulty
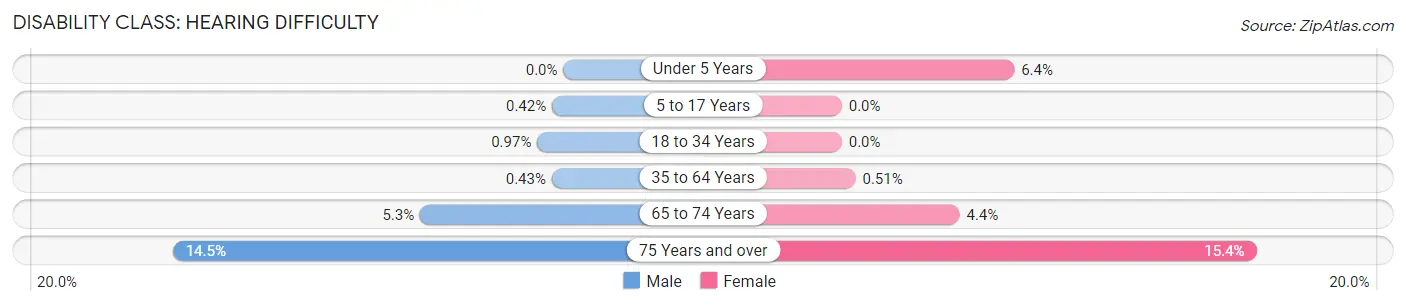
| Age Bracket | Male | Female |
| Under 5 Years | 0 (0.0%) | 52 (6.4%) |
| 5 to 17 Years | 14 (0.4%) | 0 (0.0%) |
| 18 to 34 Years | 18 (1.0%) | 0 (0.0%) |
| 35 to 64 Years | 29 (0.4%) | 35 (0.5%) |
| 65 to 74 Years | 73 (5.3%) | 69 (4.4%) |
| 75 Years and over | 161 (14.5%) | 234 (15.4%) |
Disability Class: Vision Difficulty
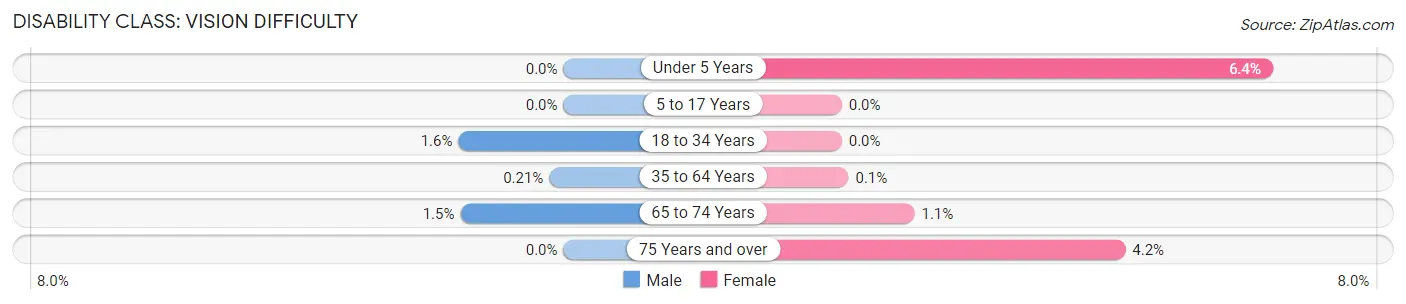
| Age Bracket | Male | Female |
| Under 5 Years | 0 (0.0%) | 52 (6.4%) |
| 5 to 17 Years | 0 (0.0%) | 0 (0.0%) |
| 18 to 34 Years | 29 (1.6%) | 0 (0.0%) |
| 35 to 64 Years | 14 (0.2%) | 7 (0.1%) |
| 65 to 74 Years | 21 (1.5%) | 17 (1.1%) |
| 75 Years and over | 0 (0.0%) | 64 (4.2%) |
Disability Class: Cognitive Difficulty
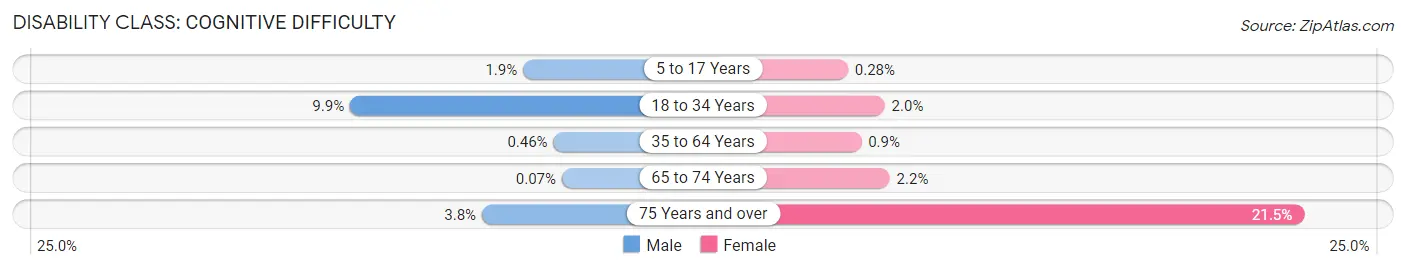
| Age Bracket | Male | Female |
| 5 to 17 Years | 63 (1.9%) | 11 (0.3%) |
| 18 to 34 Years | 184 (9.9%) | 37 (2.0%) |
| 35 to 64 Years | 31 (0.5%) | 62 (0.9%) |
| 65 to 74 Years | 1 (0.1%) | 35 (2.2%) |
| 75 Years and over | 42 (3.8%) | 326 (21.4%) |
Disability Class: Ambulatory Difficulty
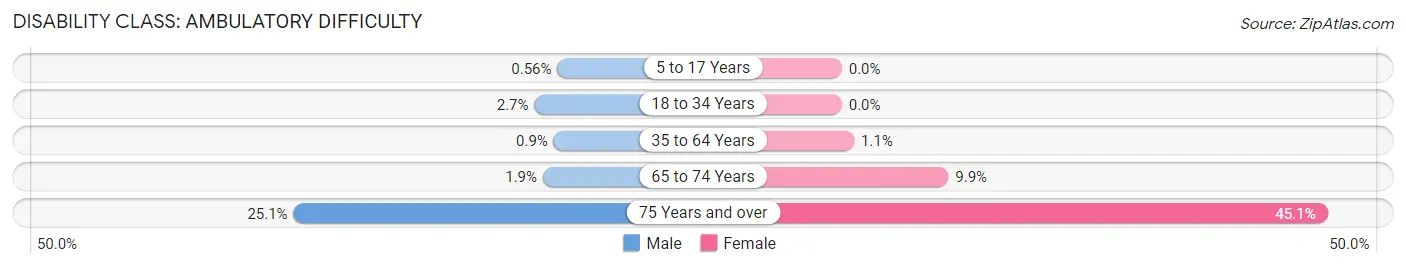
| Age Bracket | Male | Female |
| 5 to 17 Years | 19 (0.6%) | 0 (0.0%) |
| 18 to 34 Years | 50 (2.7%) | 0 (0.0%) |
| 35 to 64 Years | 60 (0.9%) | 78 (1.1%) |
| 65 to 74 Years | 26 (1.9%) | 156 (9.9%) |
| 75 Years and over | 278 (25.1%) | 685 (45.1%) |
Disability Class: Self-Care Difficulty
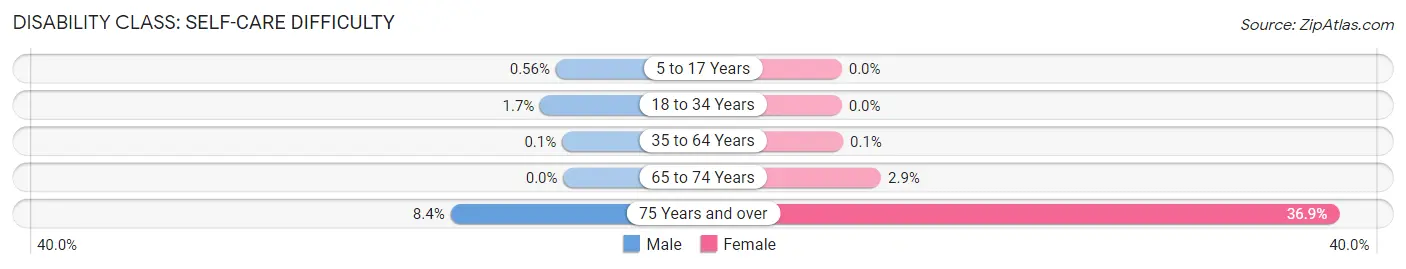
| Age Bracket | Male | Female |
| 5 to 17 Years | 19 (0.6%) | 0 (0.0%) |
| 18 to 34 Years | 32 (1.7%) | 0 (0.0%) |
| 35 to 64 Years | 7 (0.1%) | 7 (0.1%) |
| 65 to 74 Years | 0 (0.0%) | 46 (2.9%) |
| 75 Years and over | 93 (8.4%) | 561 (36.9%) |
Technology Access in Needham
Computing Device Access in Needham
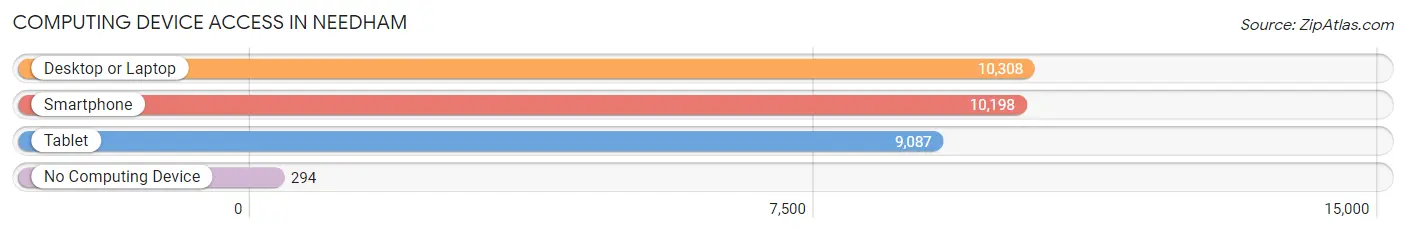
| Device Type | # Households | % Households |
| Desktop or Laptop | 10,308 | 91.1% |
| Smartphone | 10,198 | 90.1% |
| Tablet | 9,087 | 80.3% |
| No Computing Device | 294 | 2.6% |
| Total | 11,312 | 100.0% |
Internet Access in Needham
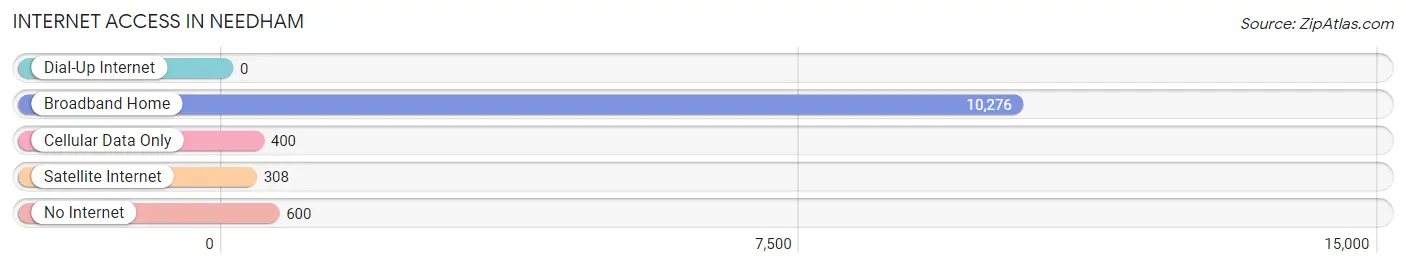
| Internet Type | # Households | % Households |
| Dial-Up Internet | 0 | 0.0% |
| Broadband Home | 10,276 | 90.8% |
| Cellular Data Only | 400 | 3.5% |
| Satellite Internet | 308 | 2.7% |
| No Internet | 600 | 5.3% |
| Total | 11,312 | 100.0% |
Needham Summary
Needham is a town located in Norfolk County, Massachusetts, United States. It is part of the Greater Boston area and is located approximately 20 miles southwest of downtown Boston. As of the 2010 census, the population of Needham was 28,886.
History
Needham was first settled in 1680 by settlers from Dedham, Massachusetts. The town was officially incorporated in 1711 and was named after the town of Needham Market in Suffolk, England. The town was originally an agricultural community, but by the mid-19th century, it had become a thriving industrial center. The town was home to several factories, including the Needham Button Company, which produced buttons for the military during the Civil War.
In the late 19th century, Needham began to experience a period of rapid growth and development. The town was connected to Boston by the Boston and Albany Railroad in 1844, and the Needham Branch Railroad was built in 1848. This allowed for the development of several new industries, including the Needham Manufacturing Company, which produced a variety of products, including furniture, tools, and machinery.
Geography
Needham is located in eastern Massachusetts, approximately 20 miles southwest of downtown Boston. The town is bordered by Wellesley to the north, Dedham to the east, Newton to the south, and Westwood to the west. The Charles River forms the western boundary of the town.
The town has a total area of 10.3 square miles, of which 10.2 square miles is land and 0.1 square miles is water. The town is mostly flat, with some hills in the northern and eastern parts of town.
Economy
Needham has a diverse economy, with a mix of manufacturing, retail, and service industries. The town is home to several large employers, including Boston Scientific, TripAdvisor, and the Needham Public Schools.
The town is also home to several small businesses, including restaurants, shops, and professional services. The town is also home to several technology companies, including TripAdvisor, Boston Scientific, and the Needham Public Schools.
Demographics
As of the 2010 census, the population of Needham was 28,886. The racial makeup of the town was 87.3% White, 4.2% Asian, 3.2% African American, 0.3% Native American, 0.1% Pacific Islander, and 4.9% from other races. Hispanic or Latino of any race were 5.2% of the population.
The median household income in Needham was $128,845, and the median family income was $152,945. The per capita income for the town was $63,945. About 3.2% of families and 4.3% of the population were below the poverty line, including 4.7% of those under age 18 and 4.2% of those age 65 or over.
Common Questions
What is Per Capita Income in Needham?
Per Capita income in Needham is $95,376.
What is the Median Family Income in Needham?
Median Family Income in Needham is $245,838.
What is the Median Household income in Needham?
Median Household Income in Needham is $206,261.
What is Income or Wage Gap in Needham?
Income or Wage Gap in Needham is 55.6%.
Women in Needham earn 44.4 cents for every dollar earned by a man.
What is Family Income Deficit in Needham?
Family Income Deficit in Needham is $14,693.
Families that are below poverty line in Needham earn $14,693 less on average than the poverty threshold level.
What is Inequality or Gini Index in Needham?
Inequality or Gini Index in Needham is 0.47.
What is the Total Population of Needham?
Total Population of Needham is 31,957.
What is the Total Male Population of Needham?
Total Male Population of Needham is 15,177.
What is the Total Female Population of Needham?
Total Female Population of Needham is 16,780.
What is the Ratio of Males per 100 Females in Needham?
There are 90.45 Males per 100 Females in Needham.
What is the Ratio of Females per 100 Males in Needham?
There are 110.56 Females per 100 Males in Needham.
What is the Median Population Age in Needham?
Median Population Age in Needham is 43.3 Years.
What is the Average Family Size in Needham
Average Family Size in Needham is 3.1 People.
What is the Average Household Size in Needham
Average Household Size in Needham is 2.8 People.
How Large is the Labor Force in Needham?
There are 16,458 People in the Labor Forcein in Needham.
What is the Percentage of People in the Labor Force in Needham?
67.8% of People are in the Labor Force in Needham.
What is the Unemployment Rate in Needham?
Unemployment Rate in Needham is 5.2%.