Marion Center, MA Map & Demographics
Marion Center Map
Marion Center Overview
$97,213
PER CAPITA INCOME
$131,250
AVG FAMILY INCOME
$97,500
AVG HOUSEHOLD INCOME
26.0%
WAGE / INCOME GAP [ % ]
74.0¢/ $1
WAGE / INCOME GAP [ $ ]
0.64
INEQUALITY / GINI INDEX
980
TOTAL POPULATION
489
MALE POPULATION
491
FEMALE POPULATION
99.59
MALES / 100 FEMALES
100.41
FEMALES / 100 MALES
49.7
MEDIAN AGE
2.7
AVG FAMILY SIZE
2.2
AVG HOUSEHOLD SIZE
422
LABOR FORCE [ PEOPLE ]
47.2%
PERCENT IN LABOR FORCE
8.1%
UNEMPLOYMENT RATE
Income in Marion Center
Income Overview in Marion Center
Per Capita Income in Marion Center is $97,213, while median incomes of families and households are $131,250 and $97,500 respectively.
| Characteristic | Number | Measure |
| Per Capita Income | 980 | $97,213 |
| Median Family Income | 225 | $131,250 |
| Mean Family Income | 225 | $356,769 |
| Median Household Income | 372 | $97,500 |
| Mean Household Income | 372 | $245,110 |
| Income Deficit | 225 | $0 |
| Wage / Income Gap (%) | 980 | 25.96% |
| Wage / Income Gap ($) | 980 | 74.04¢ per $1 |
| Gini / Inequality Index | 980 | 0.64 |
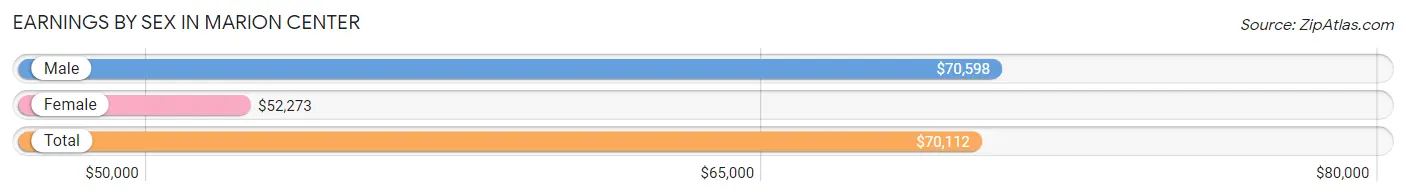
Earnings by Sex in Marion Center
Average Earnings in Marion Center are $70,112, $70,598 for men and $52,273 for women, a difference of 26.0%.
| Sex | Number | Average Earnings |
| Male | 328 (62.6%) | $70,598 |
| Female | 196 (37.4%) | $52,273 |
| Total | 524 (100.0%) | $70,112 |
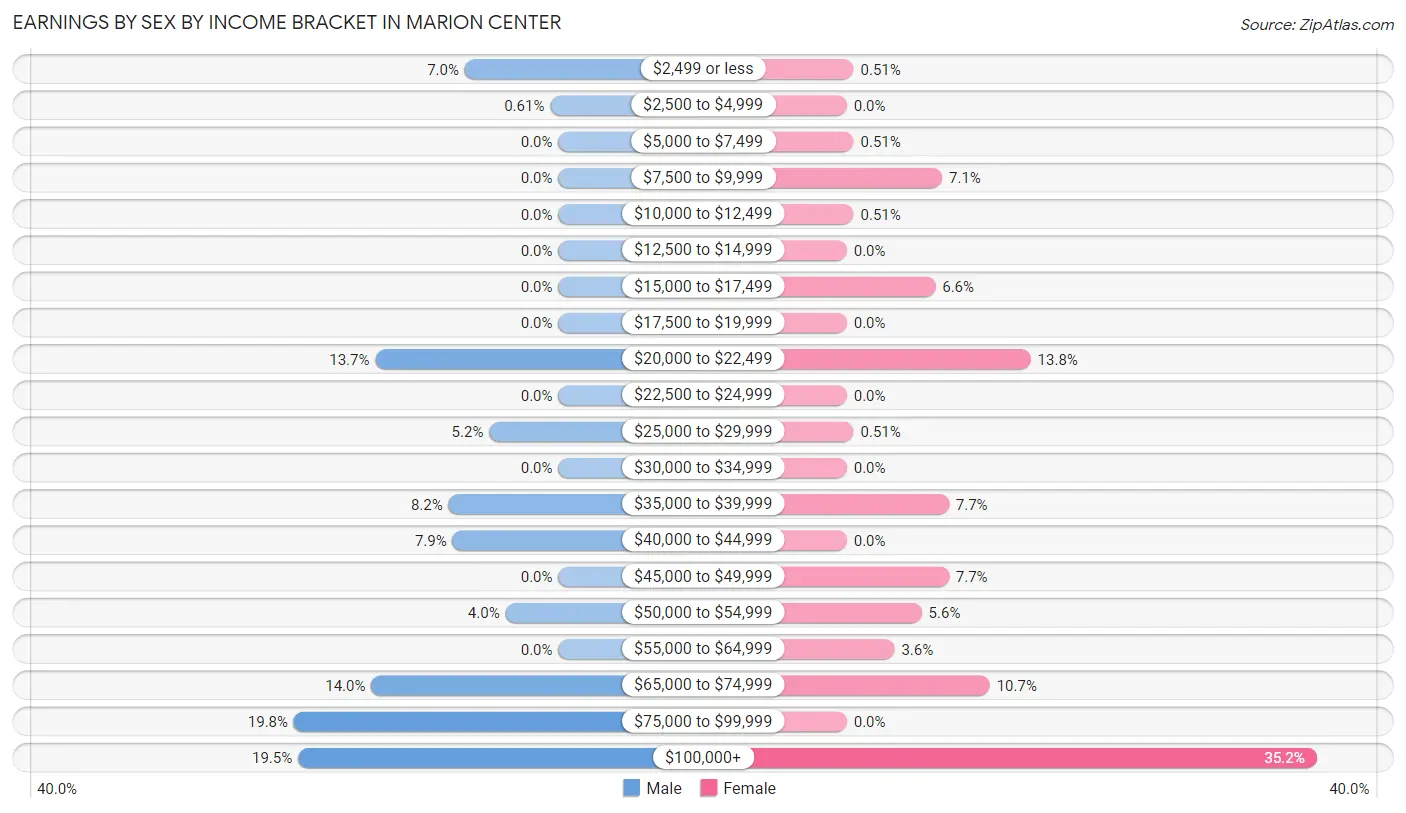
Earnings by Sex by Income Bracket in Marion Center
The most common earnings brackets in Marion Center are $75,000 to $99,999 for men (65 | 19.8%) and $100,000+ for women (69 | 35.2%).
| Income | Male | Female |
| $2,499 or less | 23 (7.0%) | 1 (0.5%) |
| $2,500 to $4,999 | 2 (0.6%) | 0 (0.0%) |
| $5,000 to $7,499 | 0 (0.0%) | 1 (0.5%) |
| $7,500 to $9,999 | 0 (0.0%) | 14 (7.1%) |
| $10,000 to $12,499 | 0 (0.0%) | 1 (0.5%) |
| $12,500 to $14,999 | 0 (0.0%) | 0 (0.0%) |
| $15,000 to $17,499 | 0 (0.0%) | 13 (6.6%) |
| $17,500 to $19,999 | 0 (0.0%) | 0 (0.0%) |
| $20,000 to $22,499 | 45 (13.7%) | 27 (13.8%) |
| $22,500 to $24,999 | 0 (0.0%) | 0 (0.0%) |
| $25,000 to $29,999 | 17 (5.2%) | 1 (0.5%) |
| $30,000 to $34,999 | 0 (0.0%) | 0 (0.0%) |
| $35,000 to $39,999 | 27 (8.2%) | 15 (7.6%) |
| $40,000 to $44,999 | 26 (7.9%) | 0 (0.0%) |
| $45,000 to $49,999 | 0 (0.0%) | 15 (7.6%) |
| $50,000 to $54,999 | 13 (4.0%) | 11 (5.6%) |
| $55,000 to $64,999 | 0 (0.0%) | 7 (3.6%) |
| $65,000 to $74,999 | 46 (14.0%) | 21 (10.7%) |
| $75,000 to $99,999 | 65 (19.8%) | 0 (0.0%) |
| $100,000+ | 64 (19.5%) | 69 (35.2%) |
| Total | 328 (100.0%) | 196 (100.0%) |
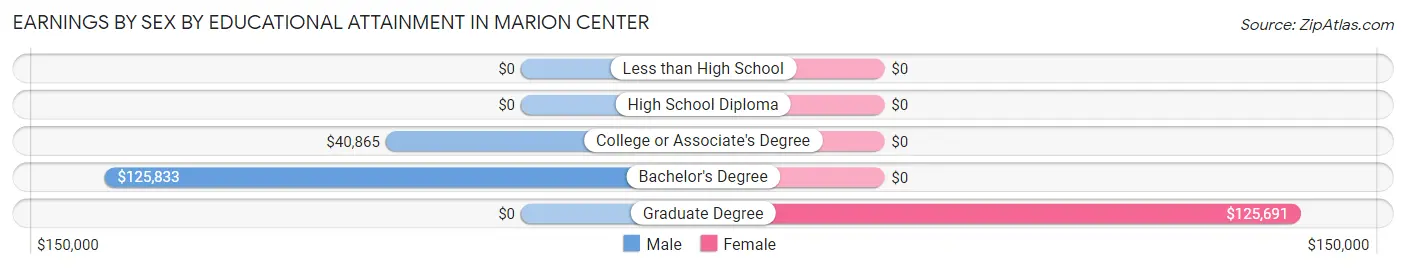
Earnings by Sex by Educational Attainment in Marion Center
Average earnings in Marion Center are $73,750 for men and $62,857 for women, a difference of 14.8%. Men with an educational attainment of bachelor's degree enjoy the highest average annual earnings of $125,833, while those with college or associate's degree education earn the least with $40,865. Women with an educational attainment of graduate degree earn the most with the average annual earnings of $125,691, while those with graduate degree education have the smallest earnings of $125,691.
| Educational Attainment | Male Income | Female Income |
| Less than High School | - | - |
| High School Diploma | - | - |
| College or Associate's Degree | $40,865 | $0 |
| Bachelor's Degree | $125,833 | $0 |
| Graduate Degree | - | - |
| Total | $73,750 | $62,857 |
Family Income in Marion Center
Family Income Brackets in Marion Center
According to the Marion Center family income data, there are 80 families falling into the $200,000+ income range, which is the most common income bracket and makes up 35.6% of all families.
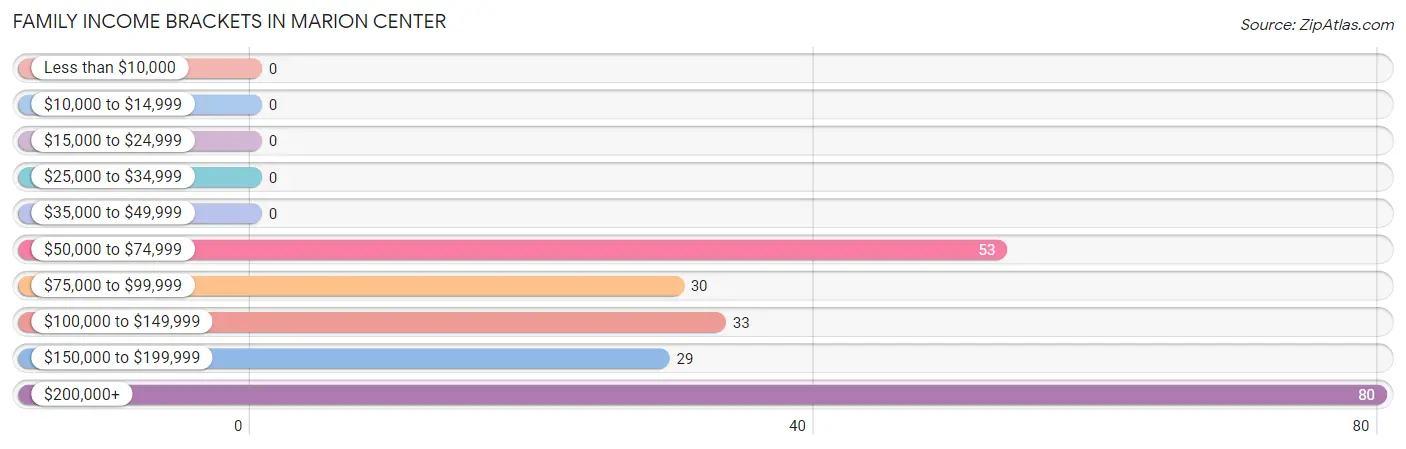
| Income Bracket | # Families | % Families |
| Less than $10,000 | 0 | 0.0% |
| $10,000 to $14,999 | 0 | 0.0% |
| $15,000 to $24,999 | 0 | 0.0% |
| $25,000 to $34,999 | 0 | 0.0% |
| $35,000 to $49,999 | 0 | 0.0% |
| $50,000 to $74,999 | 53 | 23.6% |
| $75,000 to $99,999 | 30 | 13.3% |
| $100,000 to $149,999 | 33 | 14.7% |
| $150,000 to $199,999 | 29 | 12.9% |
| $200,000+ | 80 | 35.6% |
Family Income by Famaliy Size in Marion Center
3-person families (91 | 40.4%) account for the highest median family income in Marion Center with $246,020 per family, while 3-person families (91 | 40.4%) have the highest median income of $82,007 per family member.
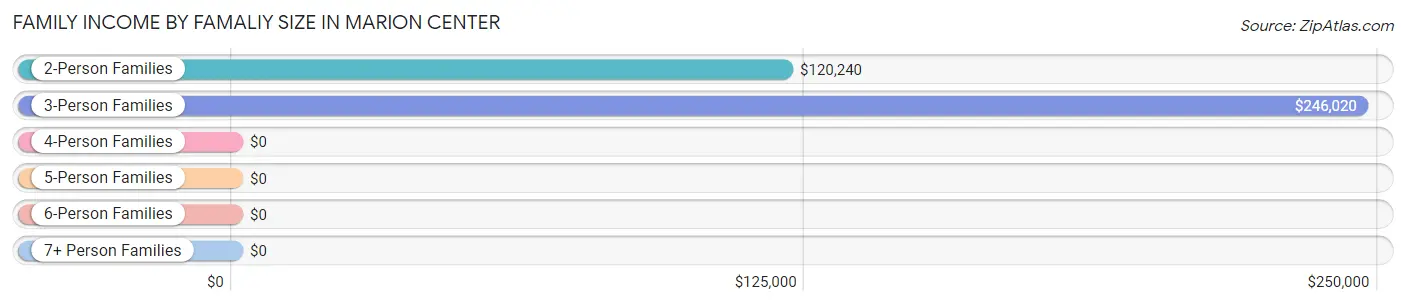
| Income Bracket | # Families | Median Income |
| 2-Person Families | 111 (49.3%) | $120,240 |
| 3-Person Families | 91 (40.4%) | $246,020 |
| 4-Person Families | 23 (10.2%) | $0 |
| 5-Person Families | 0 (0.0%) | $0 |
| 6-Person Families | 0 (0.0%) | $0 |
| 7+ Person Families | 0 (0.0%) | $0 |
| Total | 225 (100.0%) | $131,250 |
Family Income by Number of Earners in Marion Center
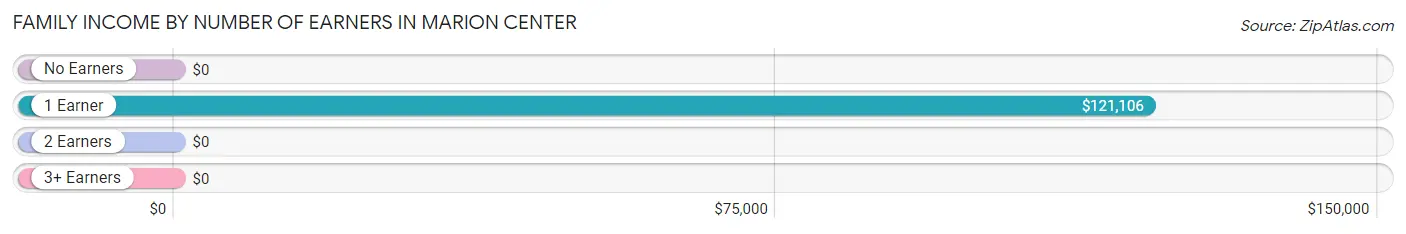
| Number of Earners | # Families | Median Income |
| No Earners | 46 (20.4%) | $0 |
| 1 Earner | 71 (31.6%) | $121,106 |
| 2 Earners | 57 (25.3%) | $0 |
| 3+ Earners | 51 (22.7%) | $0 |
| Total | 225 (100.0%) | $131,250 |
Household Income in Marion Center
Household Income Brackets in Marion Center
With 80 households falling in the category, the $200,000+ income range is the most frequent in Marion Center, accounting for 21.5% of all households.
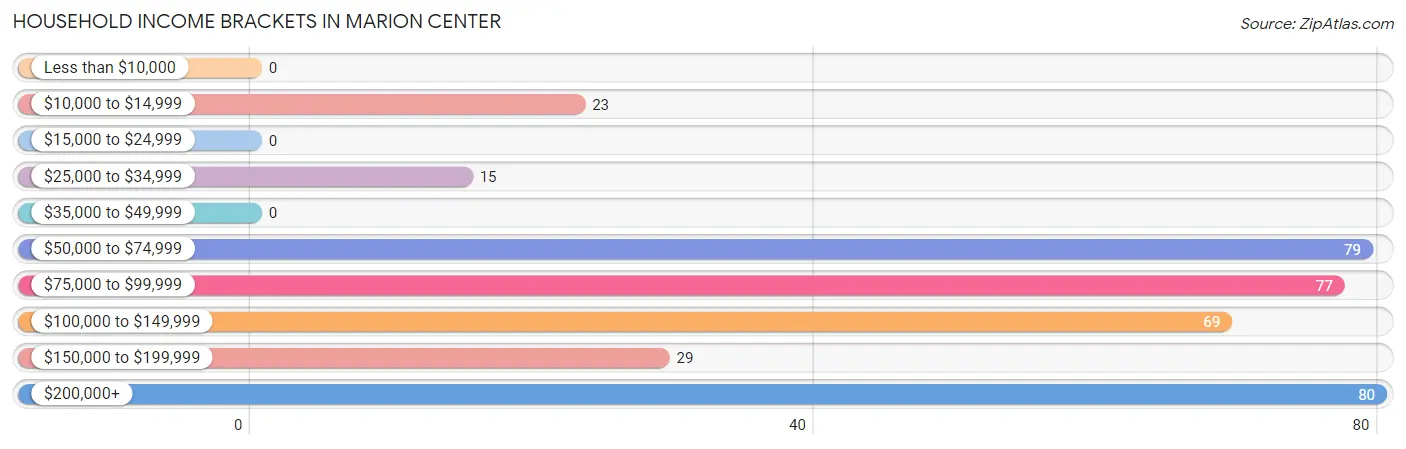
| Income Bracket | # Households | % Households |
| Less than $10,000 | 0 | 0.0% |
| $10,000 to $14,999 | 23 | 6.2% |
| $15,000 to $24,999 | 0 | 0.0% |
| $25,000 to $34,999 | 15 | 4.0% |
| $35,000 to $49,999 | 0 | 0.0% |
| $50,000 to $74,999 | 79 | 21.2% |
| $75,000 to $99,999 | 77 | 20.7% |
| $100,000 to $149,999 | 69 | 18.5% |
| $150,000 to $199,999 | 29 | 7.8% |
| $200,000+ | 80 | 21.5% |
Household Income by Householder Age in Marion Center
The median household income in Marion Center is $97,500, with the highest median household income of $245,658 found in the 45 to 64 years age bracket for the primary householder. A total of 102 households (27.4%) fall into this category.
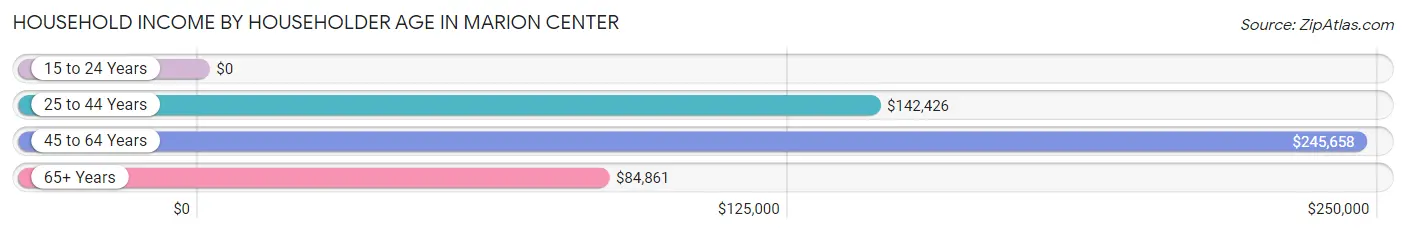
| Income Bracket | # Households | Median Income |
| 15 to 24 Years | 0 (0.0%) | $0 |
| 25 to 44 Years | 47 (12.6%) | $142,426 |
| 45 to 64 Years | 102 (27.4%) | $245,658 |
| 65+ Years | 223 (60.0%) | $84,861 |
| Total | 372 (100.0%) | $97,500 |
Poverty in Marion Center
Income Below Poverty by Sex and Age in Marion Center
With 4.9% poverty level for males and 20.9% for females among the residents of Marion Center, 45 to 54 year old males and 25 to 34 year old females are the most vulnerable to poverty, with 24 males (40.0%) and 73 females (100.0%) in their respective age groups living below the poverty level.
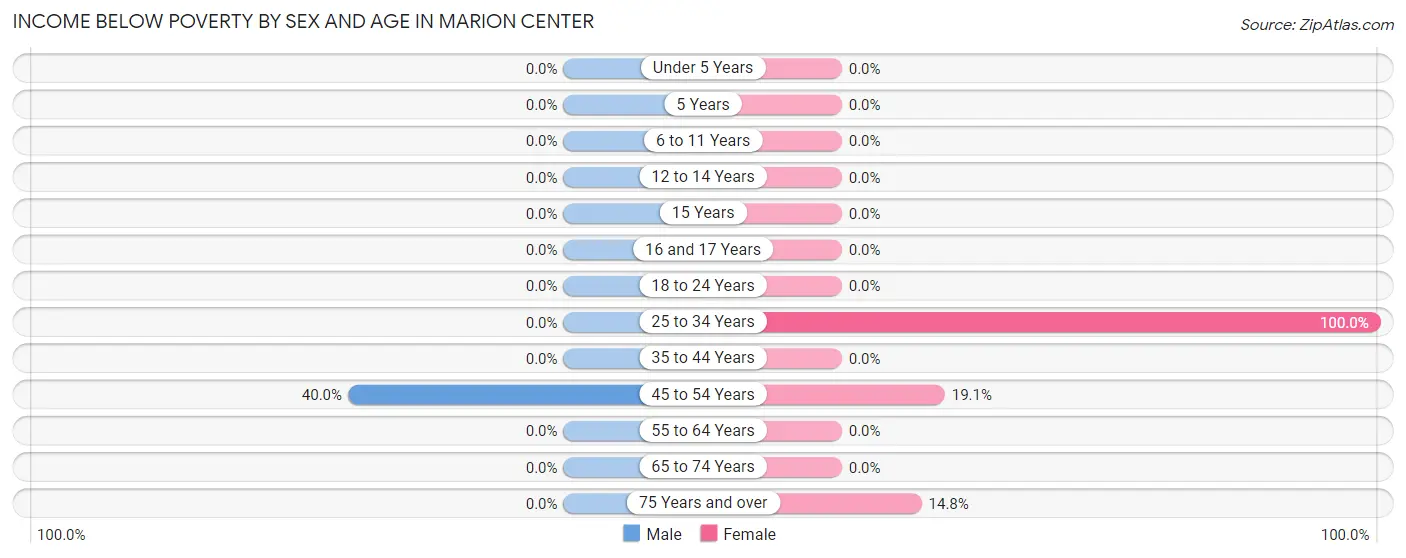
| Age Bracket | Male | Female |
| Under 5 Years | 0 (0.0%) | 0 (0.0%) |
| 5 Years | 0 (0.0%) | 0 (0.0%) |
| 6 to 11 Years | 0 (0.0%) | 0 (0.0%) |
| 12 to 14 Years | 0 (0.0%) | 0 (0.0%) |
| 15 Years | 0 (0.0%) | 0 (0.0%) |
| 16 and 17 Years | 0 (0.0%) | 0 (0.0%) |
| 18 to 24 Years | 0 (0.0%) | 0 (0.0%) |
| 25 to 34 Years | 0 (0.0%) | 73 (100.0%) |
| 35 to 44 Years | 0 (0.0%) | 0 (0.0%) |
| 45 to 54 Years | 24 (40.0%) | 13 (19.1%) |
| 55 to 64 Years | 0 (0.0%) | 0 (0.0%) |
| 65 to 74 Years | 0 (0.0%) | 0 (0.0%) |
| 75 Years and over | 0 (0.0%) | 16 (14.8%) |
| Total | 24 (4.9%) | 102 (20.9%) |
Income Above Poverty by Sex and Age in Marion Center
According to the poverty statistics in Marion Center, males aged under 5 years and females aged under 5 years are the age groups that are most secure financially, with 100.0% of males and 100.0% of females in these age groups living above the poverty line.
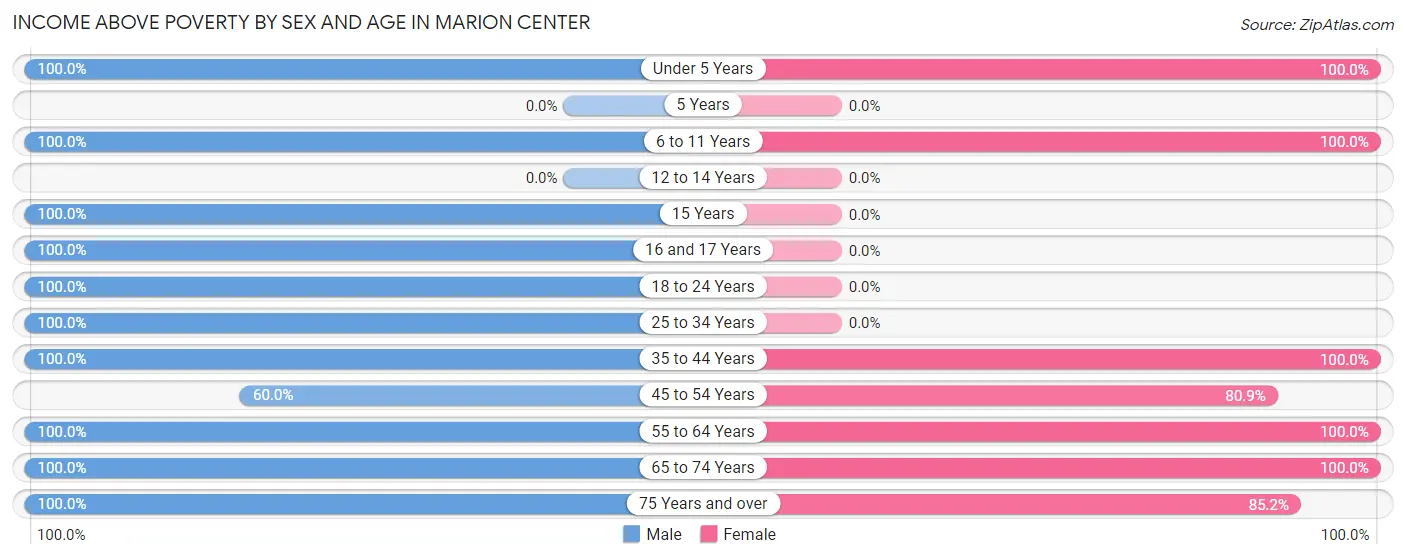
| Age Bracket | Male | Female |
| Under 5 Years | 36 (100.0%) | 19 (100.0%) |
| 5 Years | 0 (0.0%) | 0 (0.0%) |
| 6 to 11 Years | 11 (100.0%) | 5 (100.0%) |
| 12 to 14 Years | 0 (0.0%) | 0 (0.0%) |
| 15 Years | 14 (100.0%) | 0 (0.0%) |
| 16 and 17 Years | 23 (100.0%) | 0 (0.0%) |
| 18 to 24 Years | 45 (100.0%) | 0 (0.0%) |
| 25 to 34 Years | 46 (100.0%) | 0 (0.0%) |
| 35 to 44 Years | 56 (100.0%) | 77 (100.0%) |
| 45 to 54 Years | 36 (60.0%) | 55 (80.9%) |
| 55 to 64 Years | 103 (100.0%) | 33 (100.0%) |
| 65 to 74 Years | 52 (100.0%) | 104 (100.0%) |
| 75 Years and over | 40 (100.0%) | 92 (85.2%) |
| Total | 462 (95.1%) | 385 (79.1%) |
Income Below Poverty Among Married-Couple Families in Marion Center
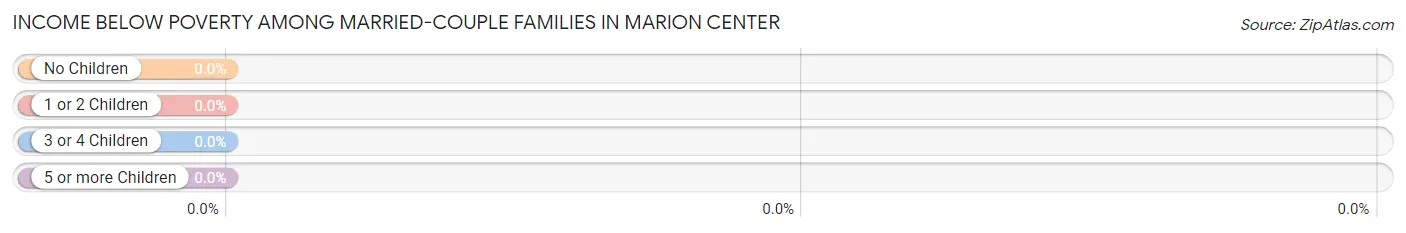
| Children | Above Poverty | Below Poverty |
| No Children | 138 (100.0%) | 0 (0.0%) |
| 1 or 2 Children | 46 (100.0%) | 0 (0.0%) |
| 3 or 4 Children | 0 (0.0%) | 0 (0.0%) |
| 5 or more Children | 0 (0.0%) | 0 (0.0%) |
| Total | 184 (100.0%) | 0 (0.0%) |
Income Below Poverty Among Single-Parent Households in Marion Center
| Children | Single Father | Single Mother |
| No Children | 0 (0.0%) | 0 (0.0%) |
| 1 or 2 Children | 0 (0.0%) | 0 (0.0%) |
| 3 or 4 Children | 0 (0.0%) | 0 (0.0%) |
| 5 or more Children | 0 (0.0%) | 0 (0.0%) |
| Total | 0 (0.0%) | 0 (0.0%) |
Income Below Poverty Among Married-Couple vs Single-Parent Households in Marion Center
| Children | Married-Couple Families | Single-Parent Households |
| No Children | 0 (0.0%) | 0 (0.0%) |
| 1 or 2 Children | 0 (0.0%) | 0 (0.0%) |
| 3 or 4 Children | 0 (0.0%) | 0 (0.0%) |
| 5 or more Children | 0 (0.0%) | 0 (0.0%) |
| Total | 0 (0.0%) | 0 (0.0%) |
Race in Marion Center
The most populous races in Marion Center are White / Caucasian (773 | 78.9%), Black / African American (101 | 10.3%), and Asian (58 | 5.9%).
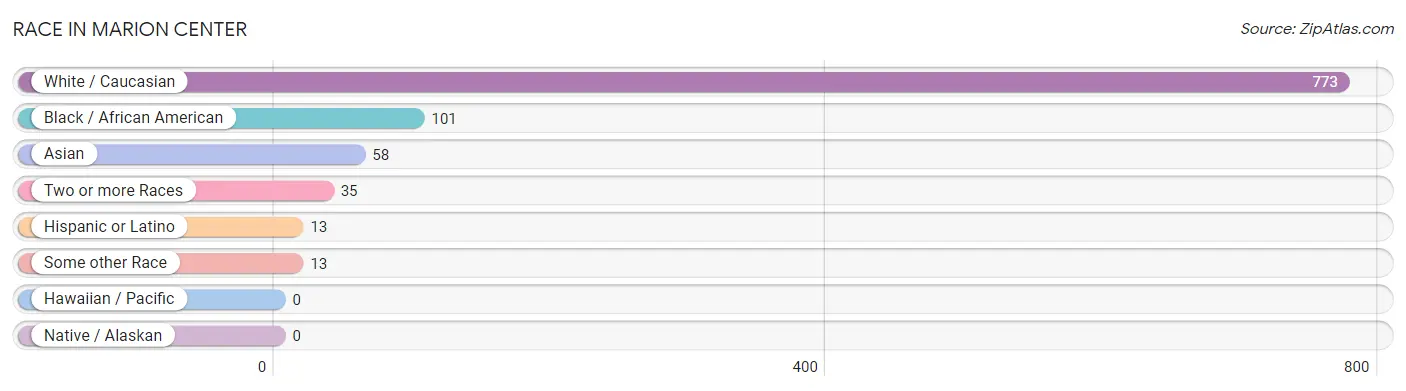
| Race | # Population | % Population |
| Asian | 58 | 5.9% |
| Black / African American | 101 | 10.3% |
| Hawaiian / Pacific | 0 | 0.0% |
| Hispanic or Latino | 13 | 1.3% |
| Native / Alaskan | 0 | 0.0% |
| White / Caucasian | 773 | 78.9% |
| Two or more Races | 35 | 3.6% |
| Some other Race | 13 | 1.3% |
| Total | 980 | 100.0% |
Ancestry in Marion Center
The most populous ancestries reported in Marion Center are Irish (227 | 23.2%), English (206 | 21.0%), German (106 | 10.8%), Italian (102 | 10.4%), and Scottish (69 | 7.0%), together accounting for 72.4% of all Marion Center residents.
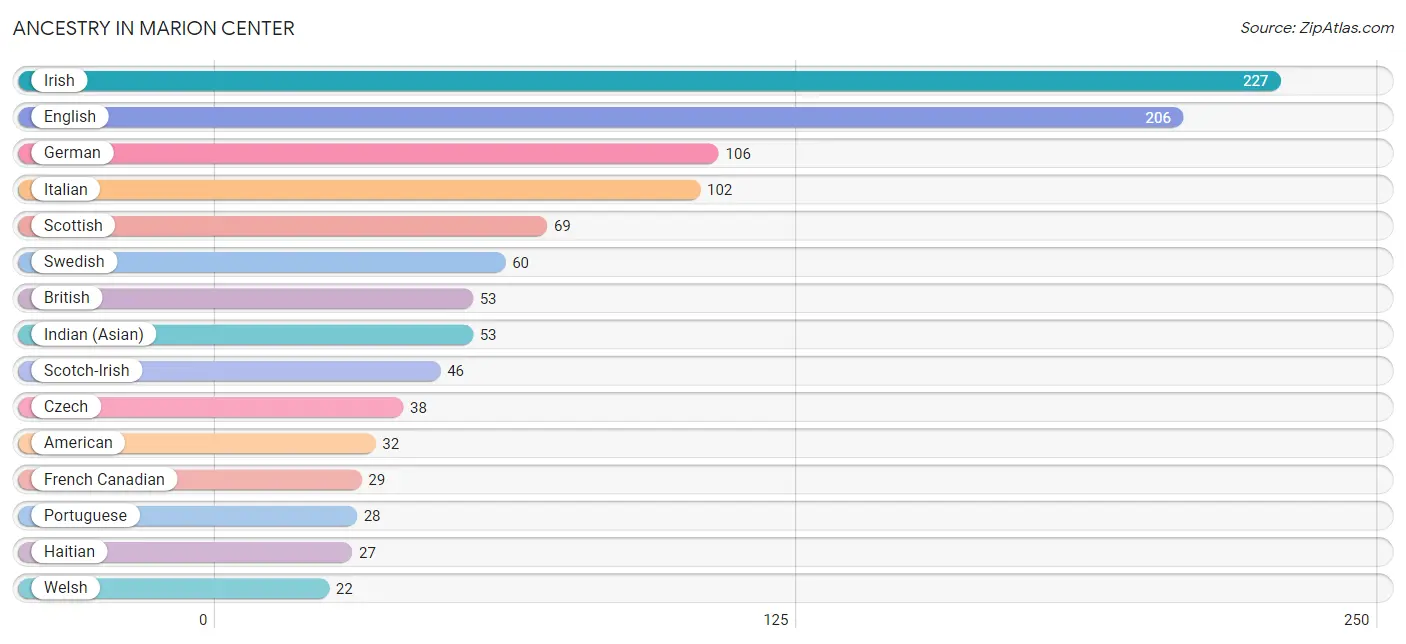
| Ancestry | # Population | % Population |
| American | 32 | 3.3% |
| Arab | 15 | 1.5% |
| British | 53 | 5.4% |
| Burmese | 14 | 1.4% |
| Cape Verdean | 7 | 0.7% |
| Czech | 38 | 3.9% |
| English | 206 | 21.0% |
| French Canadian | 29 | 3.0% |
| German | 106 | 10.8% |
| Haitian | 27 | 2.8% |
| Indian (Asian) | 53 | 5.4% |
| Irish | 227 | 23.2% |
| Italian | 102 | 10.4% |
| Lebanese | 15 | 1.5% |
| Norwegian | 10 | 1.0% |
| Peruvian | 13 | 1.3% |
| Portuguese | 28 | 2.9% |
| Scotch-Irish | 46 | 4.7% |
| Scottish | 69 | 7.0% |
| South American | 13 | 1.3% |
| Subsaharan African | 7 | 0.7% |
| Swedish | 60 | 6.1% |
| Welsh | 22 | 2.2% | View All 23 Rows |
Immigrants in Marion Center
The most numerous immigrant groups reported in Marion Center came from Latin America (113 | 11.5%), Caribbean (100 | 10.2%), Haiti (100 | 10.2%), Asia (53 | 5.4%), and China (53 | 5.4%), together accounting for 42.7% of all Marion Center residents.
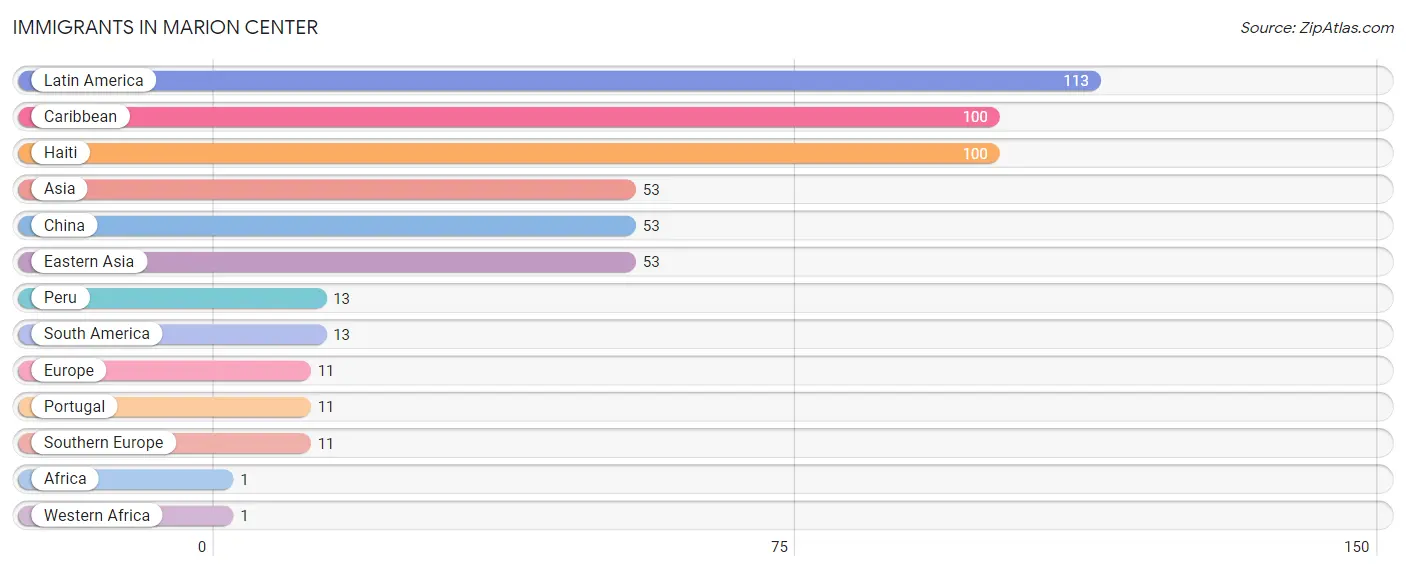
| Immigration Origin | # Population | % Population |
| Africa | 1 | 0.1% |
| Asia | 53 | 5.4% |
| Caribbean | 100 | 10.2% |
| China | 53 | 5.4% |
| Eastern Asia | 53 | 5.4% |
| Europe | 11 | 1.1% |
| Haiti | 100 | 10.2% |
| Latin America | 113 | 11.5% |
| Peru | 13 | 1.3% |
| Portugal | 11 | 1.1% |
| South America | 13 | 1.3% |
| Southern Europe | 11 | 1.1% |
| Western Africa | 1 | 0.1% | View All 13 Rows |
Sex and Age in Marion Center
Sex and Age in Marion Center
The most populous age groups in Marion Center are 15 to 19 Years (83 | 17.0%) for men and 30 to 34 Years (73 | 14.9%) for women.
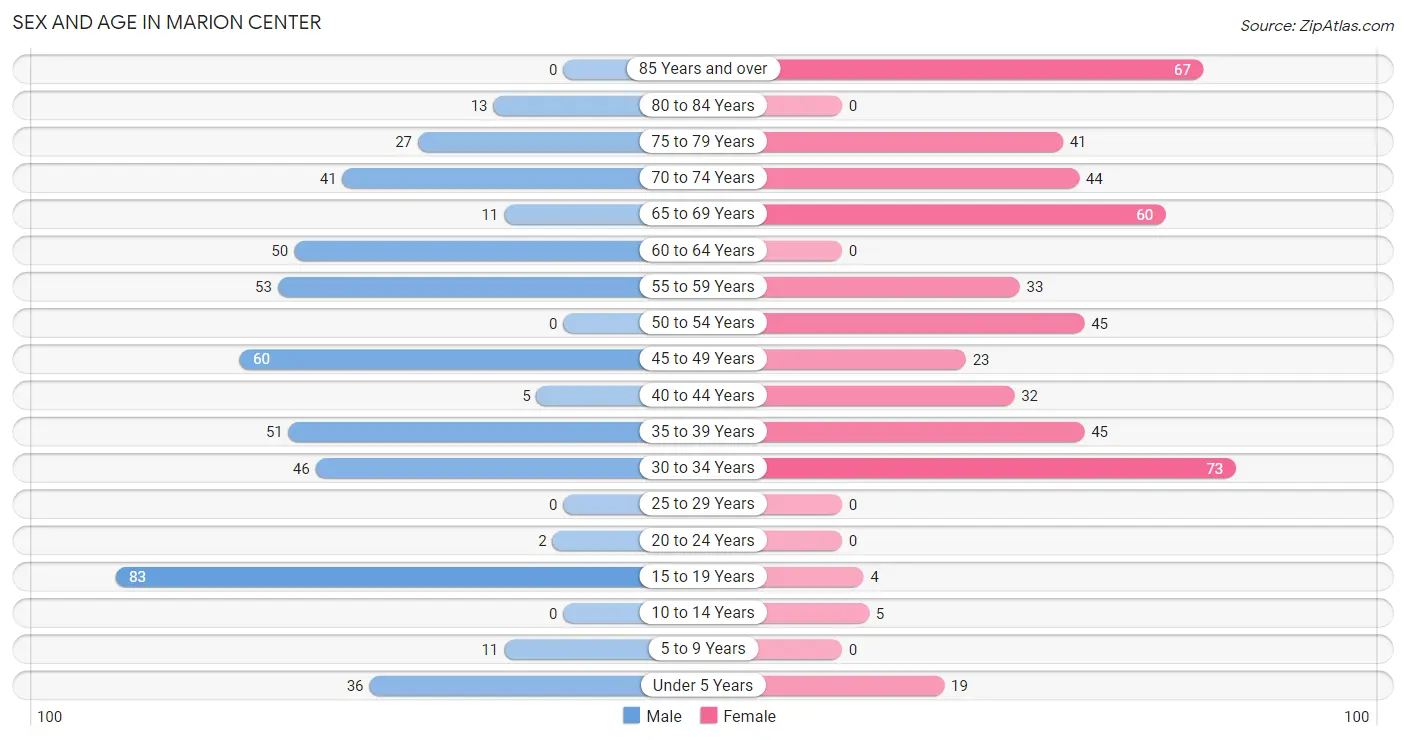
| Age Bracket | Male | Female |
| Under 5 Years | 36 (7.4%) | 19 (3.9%) |
| 5 to 9 Years | 11 (2.2%) | 0 (0.0%) |
| 10 to 14 Years | 0 (0.0%) | 5 (1.0%) |
| 15 to 19 Years | 83 (17.0%) | 4 (0.8%) |
| 20 to 24 Years | 2 (0.4%) | 0 (0.0%) |
| 25 to 29 Years | 0 (0.0%) | 0 (0.0%) |
| 30 to 34 Years | 46 (9.4%) | 73 (14.9%) |
| 35 to 39 Years | 51 (10.4%) | 45 (9.2%) |
| 40 to 44 Years | 5 (1.0%) | 32 (6.5%) |
| 45 to 49 Years | 60 (12.3%) | 23 (4.7%) |
| 50 to 54 Years | 0 (0.0%) | 45 (9.2%) |
| 55 to 59 Years | 53 (10.8%) | 33 (6.7%) |
| 60 to 64 Years | 50 (10.2%) | 0 (0.0%) |
| 65 to 69 Years | 11 (2.2%) | 60 (12.2%) |
| 70 to 74 Years | 41 (8.4%) | 44 (9.0%) |
| 75 to 79 Years | 27 (5.5%) | 41 (8.4%) |
| 80 to 84 Years | 13 (2.7%) | 0 (0.0%) |
| 85 Years and over | 0 (0.0%) | 67 (13.7%) |
| Total | 489 (100.0%) | 491 (100.0%) |
Families and Households in Marion Center
Median Family Size in Marion Center
The median family size in Marion Center is 2.70 persons per family, with married-couple families (184 | 81.8%) accounting for the largest median family size of 2.82 persons per family. On the other hand, single female/mother families (26 | 11.6%) represent the smallest median family size with 2.04 persons per family.

| Family Type | # Families | Family Size |
| Married-Couple | 184 (81.8%) | 2.82 |
| Single Male/Father | 15 (6.7%) | 2.40 |
| Single Female/Mother | 26 (11.6%) | 2.04 |
| Total Families | 225 (100.0%) | 2.70 |
Median Household Size in Marion Center
The median household size in Marion Center is 2.19 persons per household, with married-couple households (184 | 49.5%) accounting for the largest median household size of 2.82 persons per household. non-family households (147 | 39.5%) represent the smallest median household size with 1.41 persons per household.
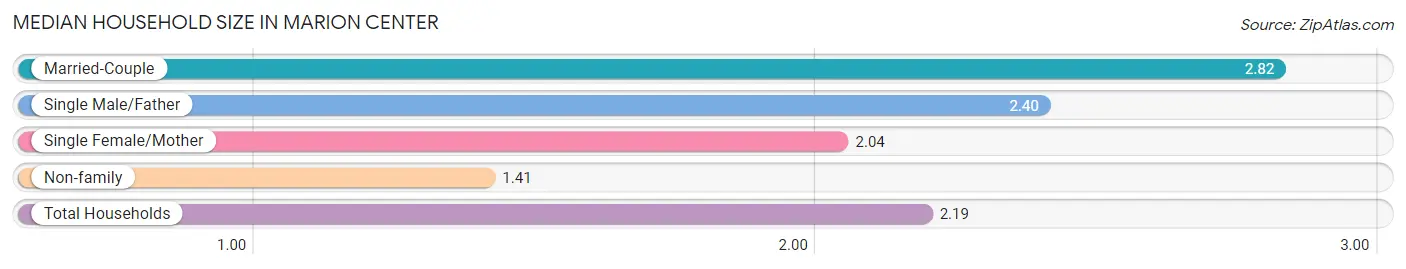
| Household Type | # Households | Household Size |
| Married-Couple | 184 (49.5%) | 2.82 |
| Single Male/Father | 15 (4.0%) | 2.40 |
| Single Female/Mother | 26 (7.0%) | 2.04 |
| Non-family | 147 (39.5%) | 1.41 |
| Total Households | 372 (100.0%) | 2.19 |
Household Size by Marriage Status in Marion Center
Out of a total of 372 households in Marion Center, 225 (60.5%) are family households, while 147 (39.5%) are nonfamily households. The most numerous type of family households are 2-person households, comprising 111, and the most common type of nonfamily households are 1-person households, comprising 111.
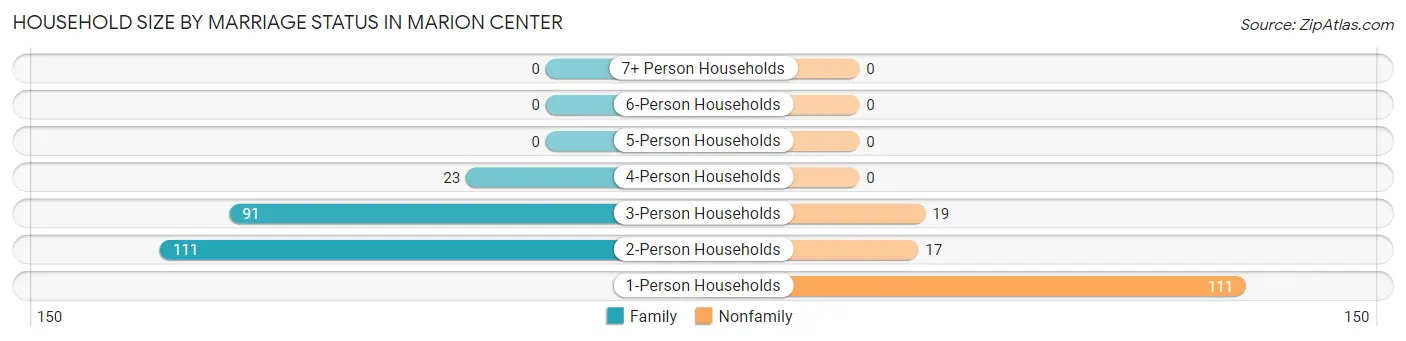
| Household Size | Family Households | Nonfamily Households |
| 1-Person Households | - | 111 (29.8%) |
| 2-Person Households | 111 (29.8%) | 17 (4.6%) |
| 3-Person Households | 91 (24.5%) | 19 (5.1%) |
| 4-Person Households | 23 (6.2%) | 0 (0.0%) |
| 5-Person Households | 0 (0.0%) | 0 (0.0%) |
| 6-Person Households | 0 (0.0%) | 0 (0.0%) |
| 7+ Person Households | 0 (0.0%) | 0 (0.0%) |
| Total | 225 (60.5%) | 147 (39.5%) |
Female Fertility in Marion Center
Fertility by Age in Marion Center
Average fertility rate in Marion Center is 237.0 births per 1,000 women. Women in the age bracket of 35 to 50 years have the highest fertility rate with 420.0 births per 1,000 women. Women in the age bracket of 35 to 50 years acount for 100.0% of all women with births.
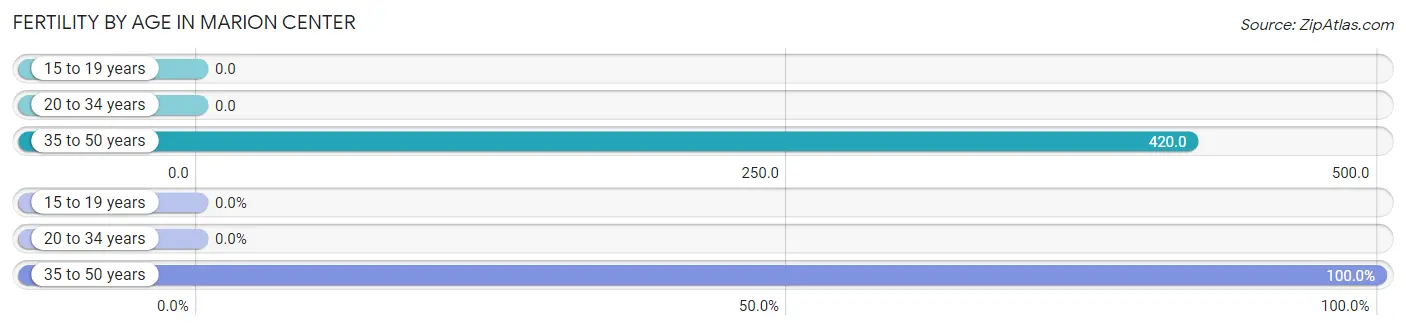
| Age Bracket | Women with Births | Births / 1,000 Women |
| 15 to 19 years | 0 (0.0%) | 0.0 |
| 20 to 34 years | 0 (0.0%) | 0.0 |
| 35 to 50 years | 42 (100.0%) | 420.0 |
| Total | 42 (100.0%) | 237.0 |
Fertility by Age by Marriage Status in Marion Center
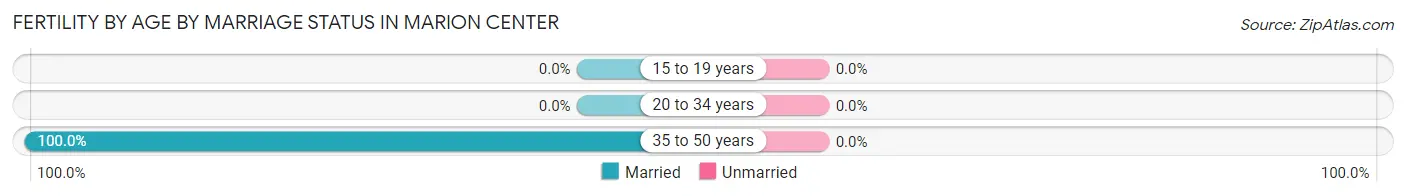
| Age Bracket | Married | Unmarried |
| 15 to 19 years | 0 (0.0%) | 0 (0.0%) |
| 20 to 34 years | 0 (0.0%) | 0 (0.0%) |
| 35 to 50 years | 42 (100.0%) | 0 (0.0%) |
| Total | 42 (100.0%) | 0 (0.0%) |
Fertility by Education in Marion Center
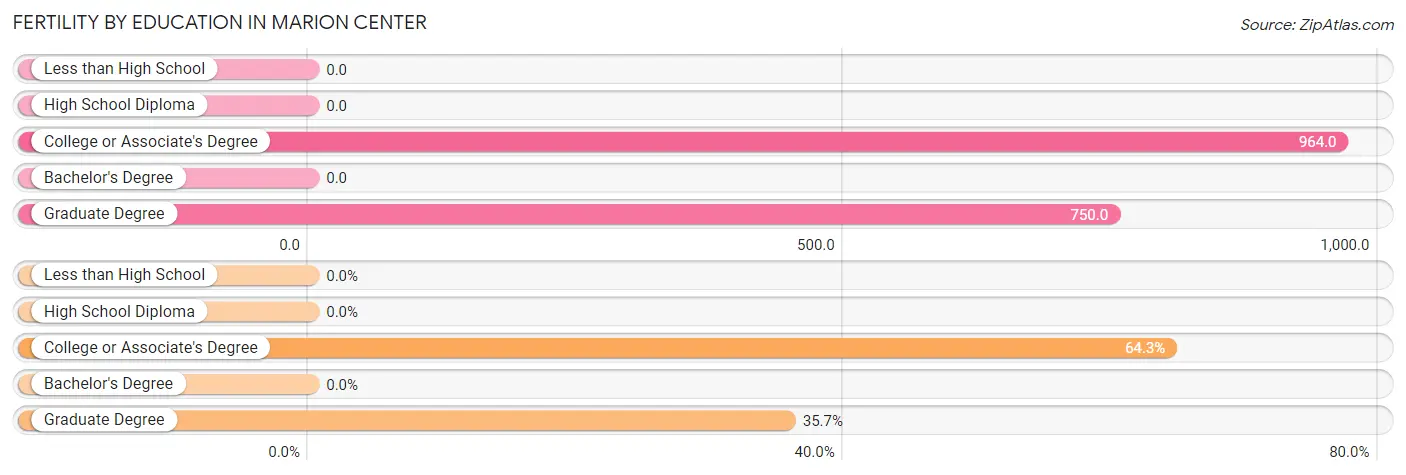
| Educational Attainment | Women with Births | Births / 1,000 Women |
| Less than High School | 0 (0.0%) | 0.0 |
| High School Diploma | 0 (0.0%) | 0.0 |
| College or Associate's Degree | 27 (64.3%) | 964.0 |
| Bachelor's Degree | 0 (0.0%) | 0.0 |
| Graduate Degree | 15 (35.7%) | 750.0 |
| Total | 42 (100.0%) | 237.0 |
Fertility by Education by Marriage Status in Marion Center
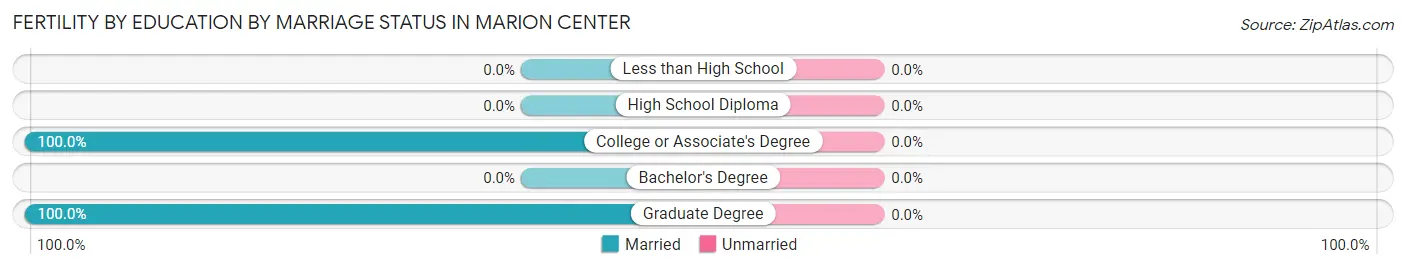
| Educational Attainment | Married | Unmarried |
| Less than High School | 0 (0.0%) | 0 (0.0%) |
| High School Diploma | 0 (0.0%) | 0 (0.0%) |
| College or Associate's Degree | 27 (100.0%) | 0 (0.0%) |
| Bachelor's Degree | 0 (0.0%) | 0 (0.0%) |
| Graduate Degree | 15 (100.0%) | 0 (0.0%) |
| Total | 42 (100.0%) | 0 (0.0%) |
Employment Characteristics in Marion Center
Employment by Class of Employer in Marion Center
Among the 387 employed individuals in Marion Center, private company employees (171 | 44.2%), not-for-profit organizations (135 | 34.9%), and state government employees (39 | 10.1%) make up the most common classes of employment.
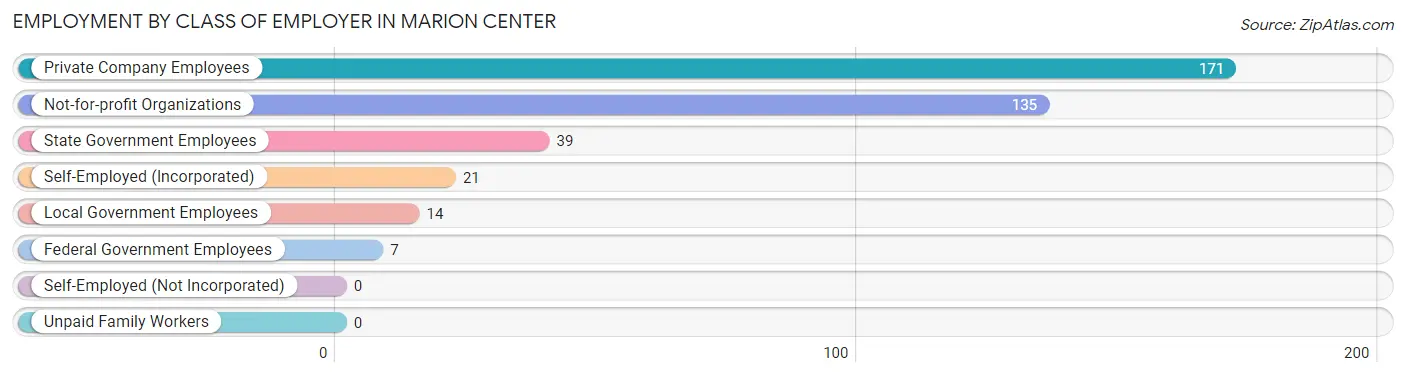
| Employer Class | # Employees | % Employees |
| Private Company Employees | 171 | 44.2% |
| Self-Employed (Incorporated) | 21 | 5.4% |
| Self-Employed (Not Incorporated) | 0 | 0.0% |
| Not-for-profit Organizations | 135 | 34.9% |
| Local Government Employees | 14 | 3.6% |
| State Government Employees | 39 | 10.1% |
| Federal Government Employees | 7 | 1.8% |
| Unpaid Family Workers | 0 | 0.0% |
| Total | 387 | 100.0% |
Employment Status by Age in Marion Center
According to the labor force statistics for Marion Center, out of the total population over 16 years of age (895), 47.2% or 422 individuals are in the labor force, with 8.1% or 34 of them unemployed. The age group with the highest labor force participation rate is 20 to 24 years, with 100.0% or 2 individuals in the labor force. Within the labor force, the 35 to 44 years age range has the highest percentage of unemployed individuals, with 20.3% or 27 of them being unemployed.
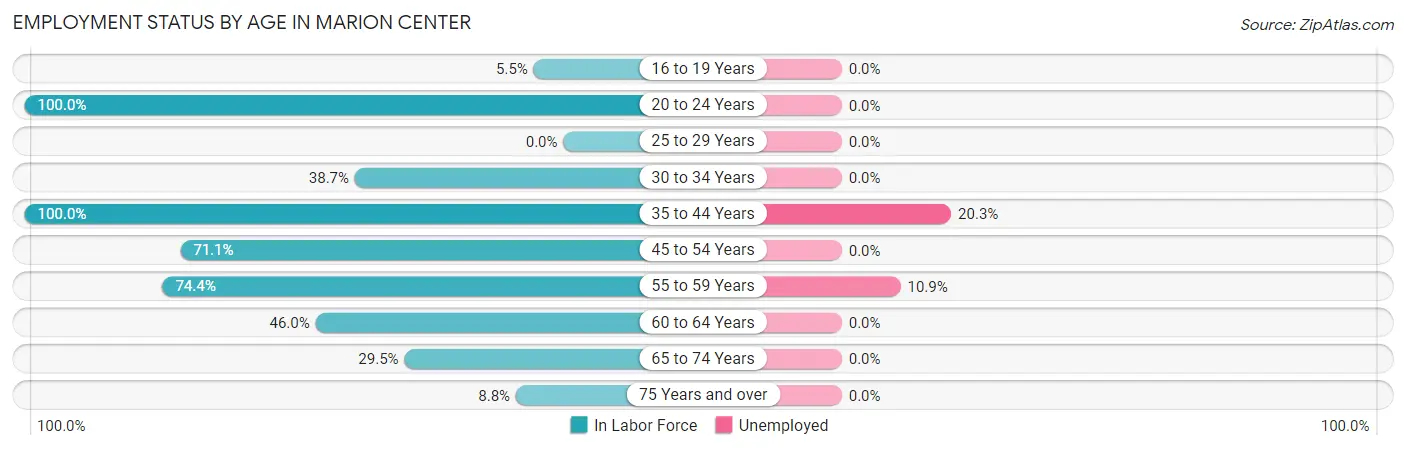
| Age Bracket | In Labor Force | Unemployed |
| 16 to 19 Years | 4 (5.5%) | 0 (0.0%) |
| 20 to 24 Years | 2 (100.0%) | 0 (0.0%) |
| 25 to 29 Years | 0 (0.0%) | 0 (0.0%) |
| 30 to 34 Years | 46 (38.7%) | 0 (0.0%) |
| 35 to 44 Years | 133 (100.0%) | 27 (20.3%) |
| 45 to 54 Years | 91 (71.1%) | 0 (0.0%) |
| 55 to 59 Years | 64 (74.4%) | 7 (10.9%) |
| 60 to 64 Years | 23 (46.0%) | 0 (0.0%) |
| 65 to 74 Years | 46 (29.5%) | 0 (0.0%) |
| 75 Years and over | 13 (8.8%) | 0 (0.0%) |
| Total | 422 (47.2%) | 34 (8.1%) |
Employment Status by Educational Attainment in Marion Center
According to labor force statistics for Marion Center, 69.2% of individuals (357) out of the total population between 25 and 64 years of age (516) are in the labor force, with 9.5% or 34 of them being unemployed. The group with the highest labor force participation rate are those with the educational attainment of bachelor's degree or higher, with 88.1% or 258 individuals in the labor force. Within the labor force, individuals with college / associate degree education have the highest percentage of unemployment, with 37.5% or 27 of them being unemployed.
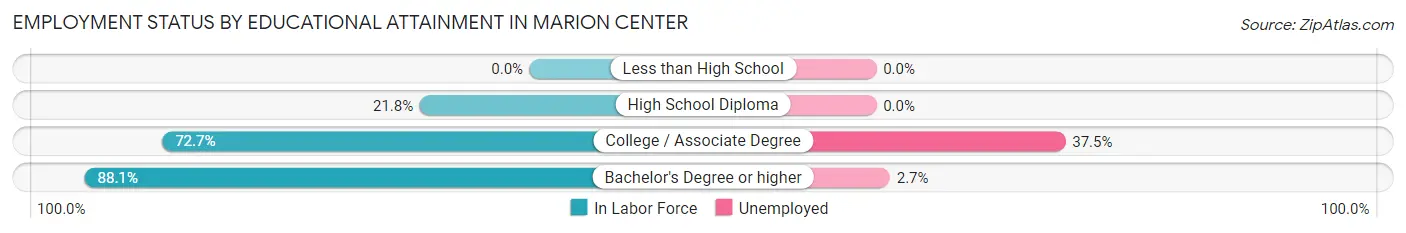
| Educational Attainment | In Labor Force | Unemployed |
| Less than High School | 0 (0.0%) | 0 (0.0%) |
| High School Diploma | 27 (21.8%) | 0 (0.0%) |
| College / Associate Degree | 72 (72.7%) | 37 (37.5%) |
| Bachelor's Degree or higher | 258 (88.1%) | 8 (2.7%) |
| Total | 357 (69.2%) | 49 (9.5%) |
Employment Occupations by Sex in Marion Center
Management, Business, Science and Arts Occupations
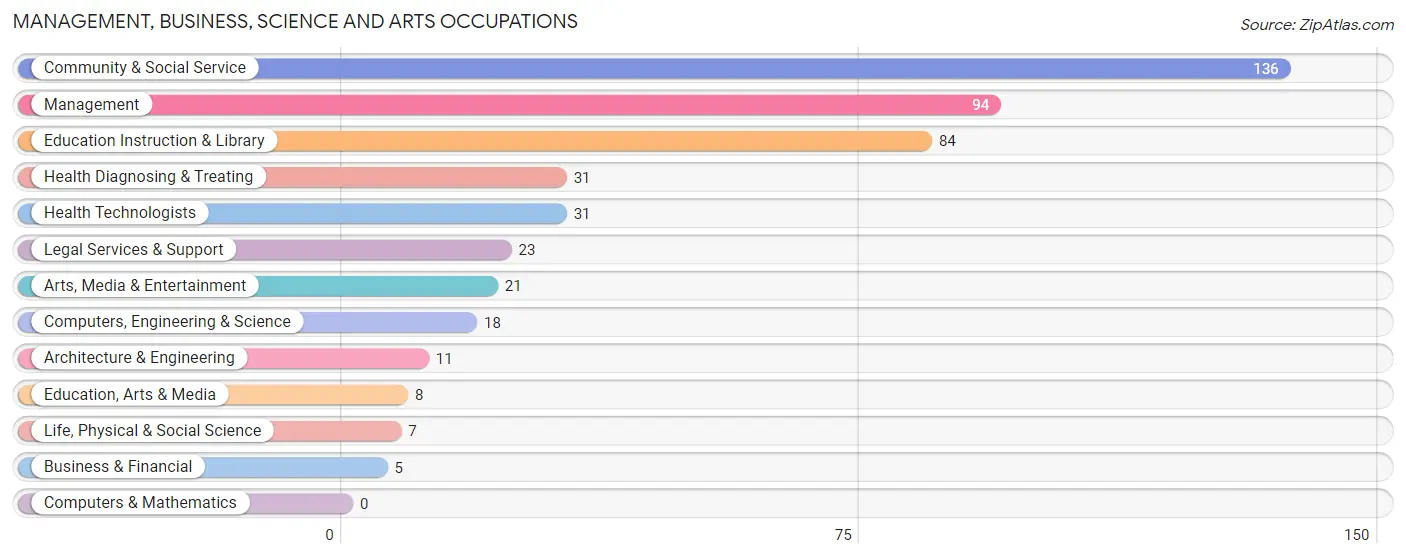
The most common Management, Business, Science and Arts occupations in Marion Center are Community & Social Service (136 | 35.0%), Management (94 | 24.2%), Education Instruction & Library (84 | 21.6%), Health Diagnosing & Treating (31 | 8.0%), and Health Technologists (31 | 8.0%).
Management, Business, Science and Arts Occupations by Sex
Within the Management, Business, Science and Arts occupations in Marion Center, the most male-oriented occupations are Business & Financial (100.0%), Life, Physical & Social Science (100.0%), and Education, Arts & Media (100.0%), while the most female-oriented occupations are Architecture & Engineering (100.0%), Arts, Media & Entertainment (100.0%), and Health Diagnosing & Treating (100.0%).
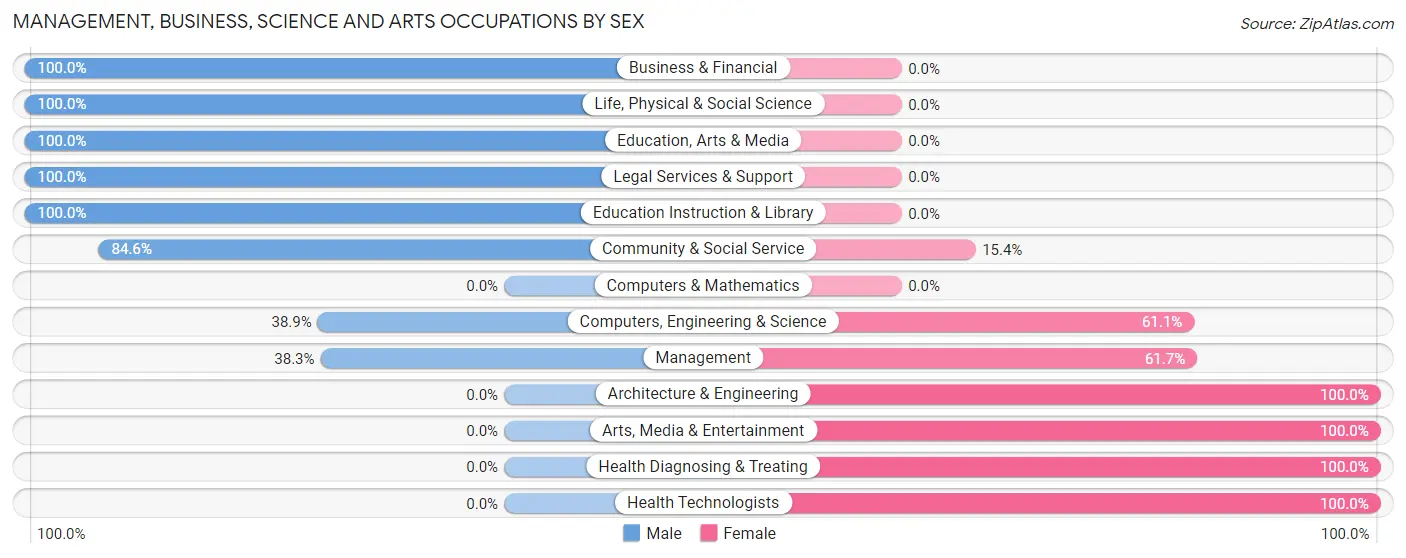
| Occupation | Male | Female |
| Management | 36 (38.3%) | 58 (61.7%) |
| Business & Financial | 5 (100.0%) | 0 (0.0%) |
| Computers, Engineering & Science | 7 (38.9%) | 11 (61.1%) |
| Computers & Mathematics | 0 (0.0%) | 0 (0.0%) |
| Architecture & Engineering | 0 (0.0%) | 11 (100.0%) |
| Life, Physical & Social Science | 7 (100.0%) | 0 (0.0%) |
| Community & Social Service | 115 (84.6%) | 21 (15.4%) |
| Education, Arts & Media | 8 (100.0%) | 0 (0.0%) |
| Legal Services & Support | 23 (100.0%) | 0 (0.0%) |
| Education Instruction & Library | 84 (100.0%) | 0 (0.0%) |
| Arts, Media & Entertainment | 0 (0.0%) | 21 (100.0%) |
| Health Diagnosing & Treating | 0 (0.0%) | 31 (100.0%) |
| Health Technologists | 0 (0.0%) | 31 (100.0%) |
| Total (Category) | 163 (57.4%) | 121 (42.6%) |
| Total (Overall) | 233 (60.1%) | 155 (40.0%) |
Services Occupations
The most common Services occupations in Marion Center are Food Preparation & Serving (3 | 0.8%), Security & Protection (1 | 0.3%), and Firefighting & Prevention (1 | 0.3%).
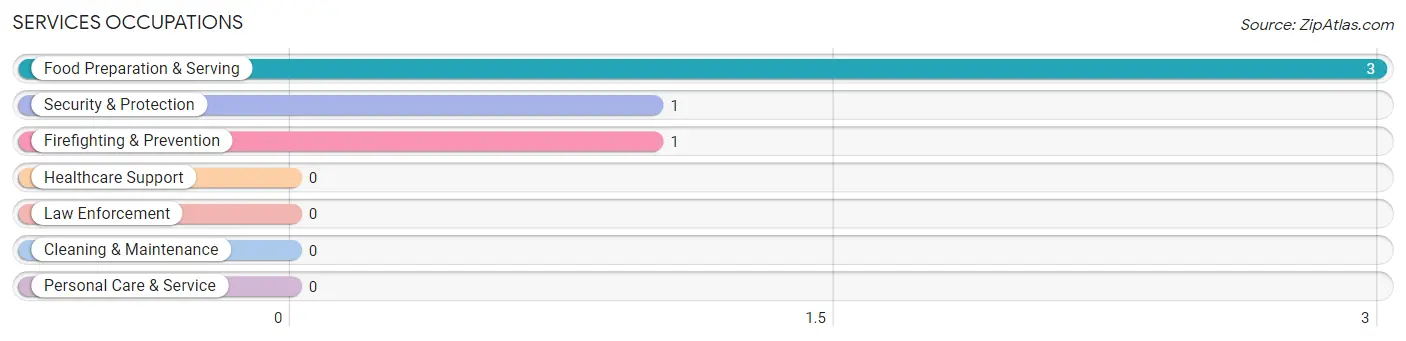
Services Occupations by Sex
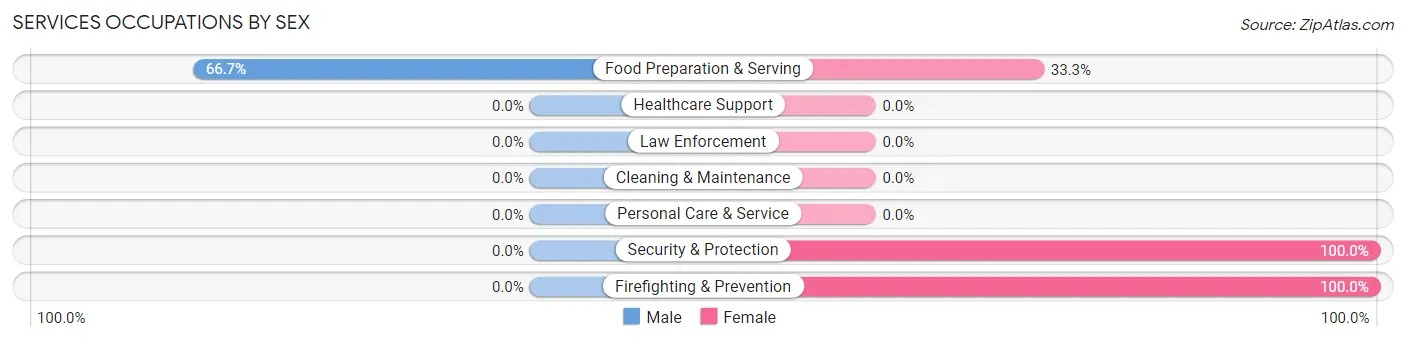
| Occupation | Male | Female |
| Healthcare Support | 0 (0.0%) | 0 (0.0%) |
| Security & Protection | 0 (0.0%) | 1 (100.0%) |
| Firefighting & Prevention | 0 (0.0%) | 1 (100.0%) |
| Law Enforcement | 0 (0.0%) | 0 (0.0%) |
| Food Preparation & Serving | 2 (66.7%) | 1 (33.3%) |
| Cleaning & Maintenance | 0 (0.0%) | 0 (0.0%) |
| Personal Care & Service | 0 (0.0%) | 0 (0.0%) |
| Total (Category) | 2 (50.0%) | 2 (50.0%) |
| Total (Overall) | 233 (60.1%) | 155 (40.0%) |
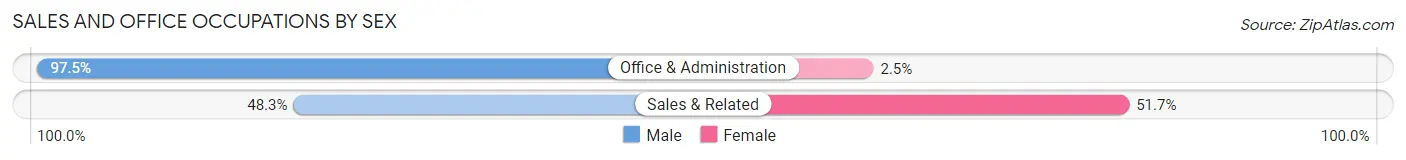
Sales and Office Occupations
The most common Sales and Office occupations in Marion Center are Sales & Related (60 | 15.5%), and Office & Administration (40 | 10.3%).
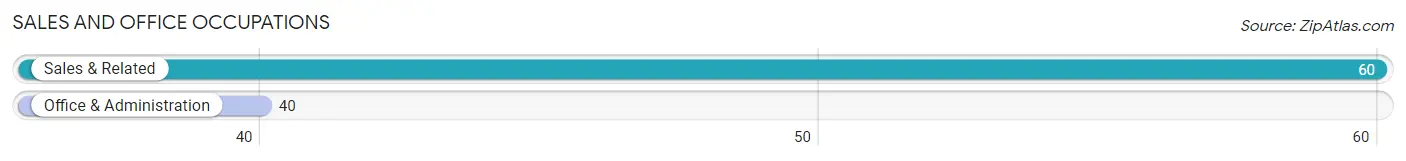
Sales and Office Occupations by Sex
| Occupation | Male | Female |
| Sales & Related | 29 (48.3%) | 31 (51.7%) |
| Office & Administration | 39 (97.5%) | 1 (2.5%) |
| Total (Category) | 68 (68.0%) | 32 (32.0%) |
| Total (Overall) | 233 (60.1%) | 155 (40.0%) |
Natural Resources, Construction and Maintenance Occupations
Natural Resources, Construction and Maintenance Occupations by Sex
| Occupation | Male | Female |
| Farming, Fishing & Forestry | 0 (0.0%) | 0 (0.0%) |
| Construction & Extraction | 0 (0.0%) | 0 (0.0%) |
| Installation, Maintenance & Repair | 0 (0.0%) | 0 (0.0%) |
| Total (Category) | 0 (0.0%) | 0 (0.0%) |
| Total (Overall) | 233 (60.1%) | 155 (40.0%) |
Production, Transportation and Moving Occupations
Production, Transportation and Moving Occupations by Sex
| Occupation | Male | Female |
| Production | 0 (0.0%) | 0 (0.0%) |
| Transportation | 0 (0.0%) | 0 (0.0%) |
| Material Moving | 0 (0.0%) | 0 (0.0%) |
| Total (Category) | 0 (0.0%) | 0 (0.0%) |
| Total (Overall) | 233 (60.1%) | 155 (40.0%) |
Employment Industries by Sex in Marion Center
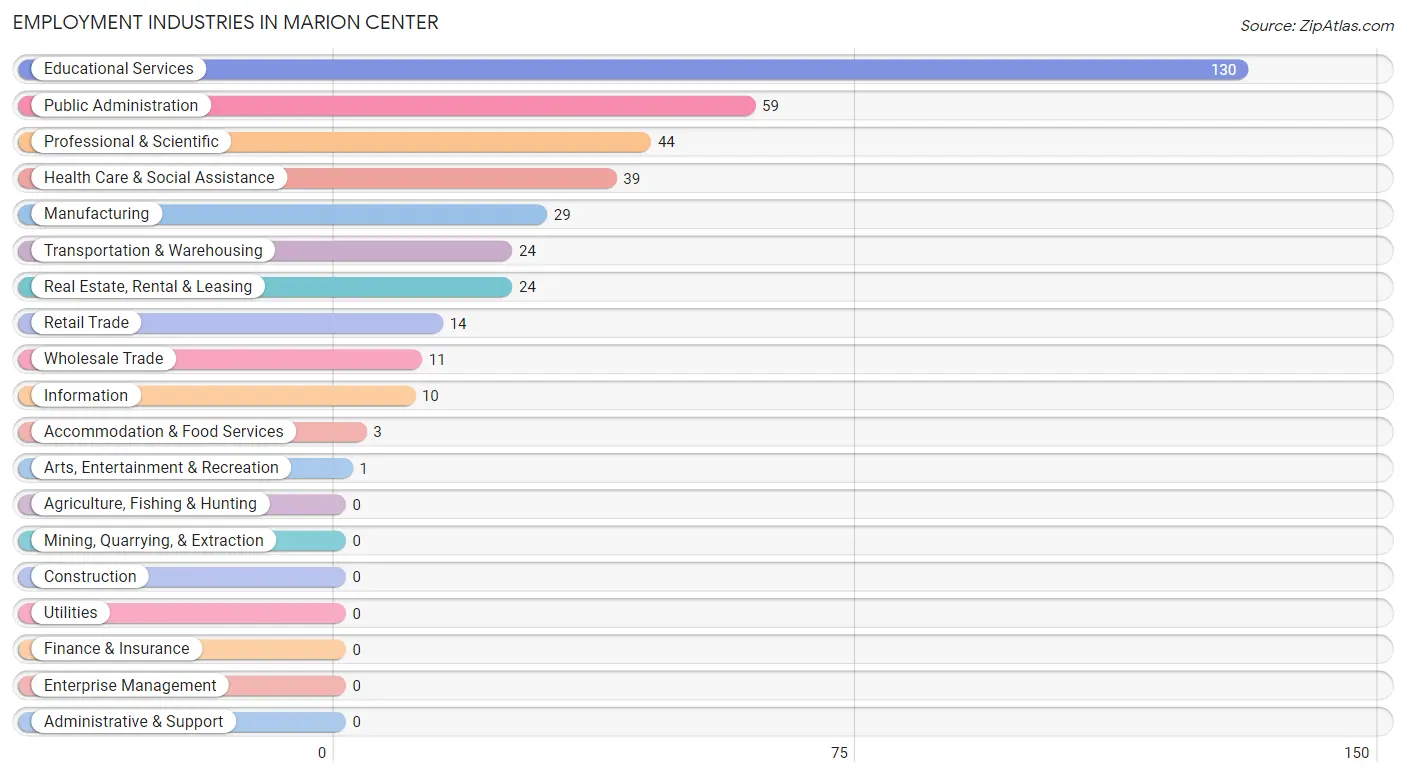
Employment Industries in Marion Center
The major employment industries in Marion Center include Educational Services (130 | 33.5%), Public Administration (59 | 15.2%), Professional & Scientific (44 | 11.3%), Health Care & Social Assistance (39 | 10.1%), and Manufacturing (29 | 7.5%).
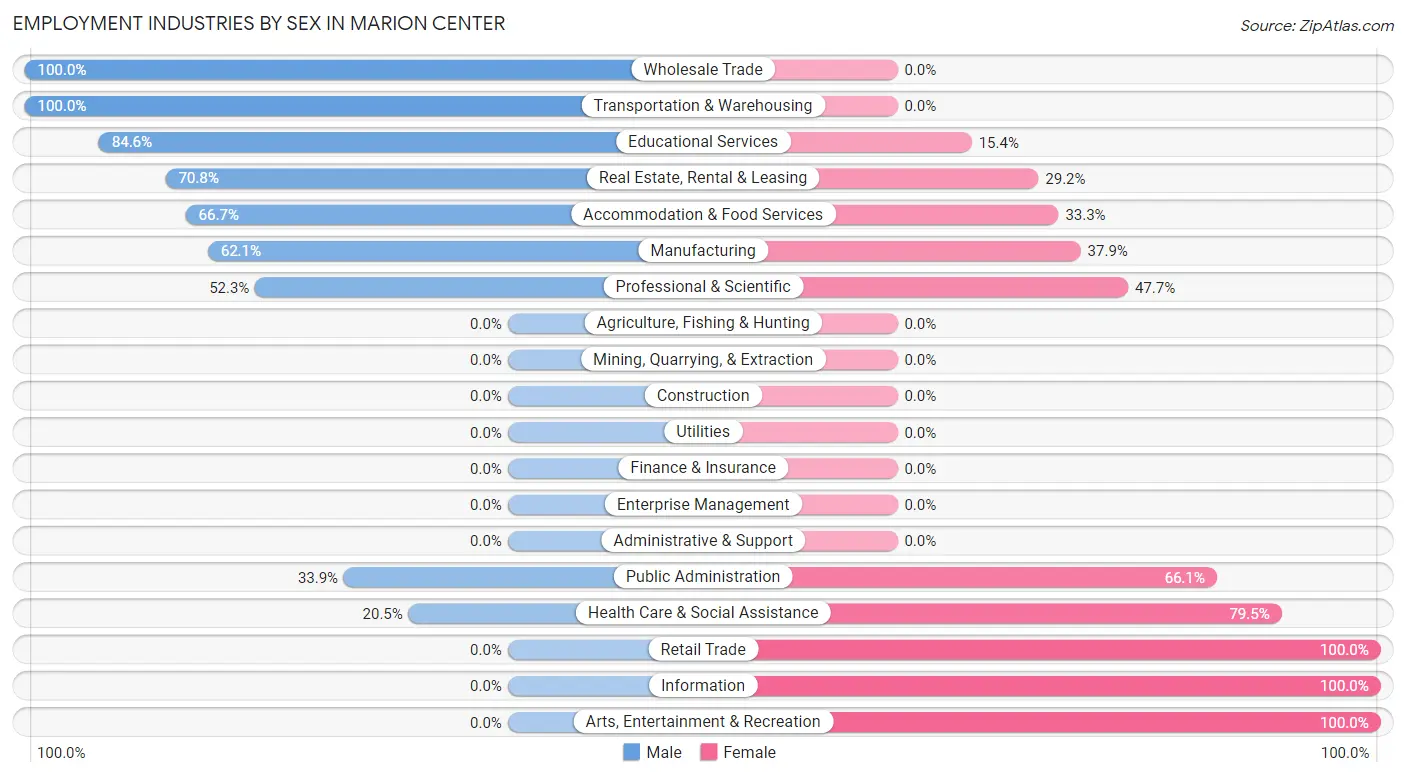
Employment Industries by Sex in Marion Center
The Marion Center industries that see more men than women are Wholesale Trade (100.0%), Transportation & Warehousing (100.0%), and Educational Services (84.6%), whereas the industries that tend to have a higher number of women are Retail Trade (100.0%), Information (100.0%), and Arts, Entertainment & Recreation (100.0%).
| Industry | Male | Female |
| Agriculture, Fishing & Hunting | 0 (0.0%) | 0 (0.0%) |
| Mining, Quarrying, & Extraction | 0 (0.0%) | 0 (0.0%) |
| Construction | 0 (0.0%) | 0 (0.0%) |
| Manufacturing | 18 (62.1%) | 11 (37.9%) |
| Wholesale Trade | 11 (100.0%) | 0 (0.0%) |
| Retail Trade | 0 (0.0%) | 14 (100.0%) |
| Transportation & Warehousing | 24 (100.0%) | 0 (0.0%) |
| Utilities | 0 (0.0%) | 0 (0.0%) |
| Information | 0 (0.0%) | 10 (100.0%) |
| Finance & Insurance | 0 (0.0%) | 0 (0.0%) |
| Real Estate, Rental & Leasing | 17 (70.8%) | 7 (29.2%) |
| Professional & Scientific | 23 (52.3%) | 21 (47.7%) |
| Enterprise Management | 0 (0.0%) | 0 (0.0%) |
| Administrative & Support | 0 (0.0%) | 0 (0.0%) |
| Educational Services | 110 (84.6%) | 20 (15.4%) |
| Health Care & Social Assistance | 8 (20.5%) | 31 (79.5%) |
| Arts, Entertainment & Recreation | 0 (0.0%) | 1 (100.0%) |
| Accommodation & Food Services | 2 (66.7%) | 1 (33.3%) |
| Public Administration | 20 (33.9%) | 39 (66.1%) |
| Total | 233 (60.1%) | 155 (40.0%) |
Education in Marion Center
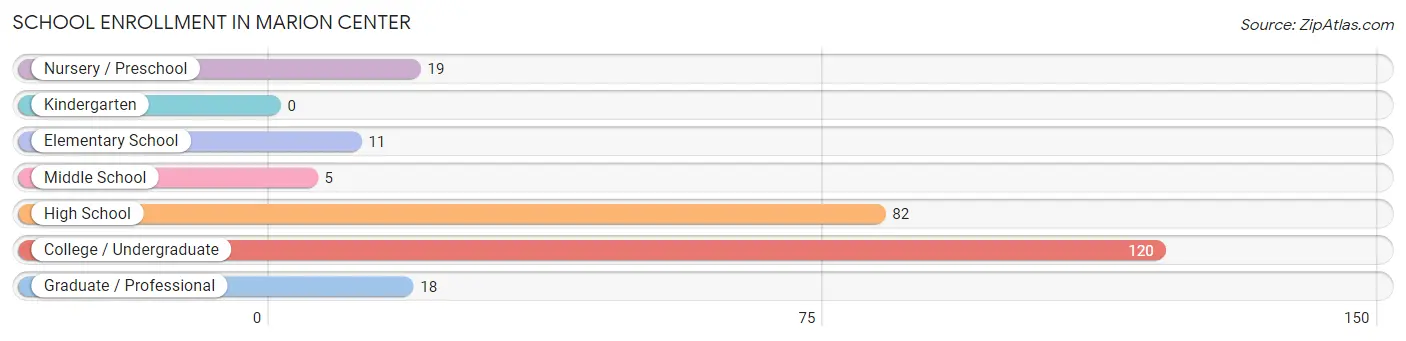
School Enrollment in Marion Center
The most common levels of schooling among the 255 students in Marion Center are college / undergraduate (120 | 47.1%), high school (82 | 32.2%), and nursery / preschool (19 | 7.4%).
| School Level | # Students | % Students |
| Nursery / Preschool | 19 | 7.4% |
| Kindergarten | 0 | 0.0% |
| Elementary School | 11 | 4.3% |
| Middle School | 5 | 2.0% |
| High School | 82 | 32.2% |
| College / Undergraduate | 120 | 47.1% |
| Graduate / Professional | 18 | 7.1% |
| Total | 255 | 100.0% |
School Enrollment by Age by Funding Source in Marion Center
Out of a total of 255 students who are enrolled in schools in Marion Center, 160 (62.7%) attend a private institution, while the remaining 95 (37.3%) are enrolled in public schools. The age group of 3 to 4 year olds has the highest likelihood of being enrolled in private schools, with 19 (100.0% in the age bracket) enrolled. Conversely, the age group of 5 to 9 year old has the lowest likelihood of being enrolled in a private school, with 11 (100.0% in the age bracket) attending a public institution.
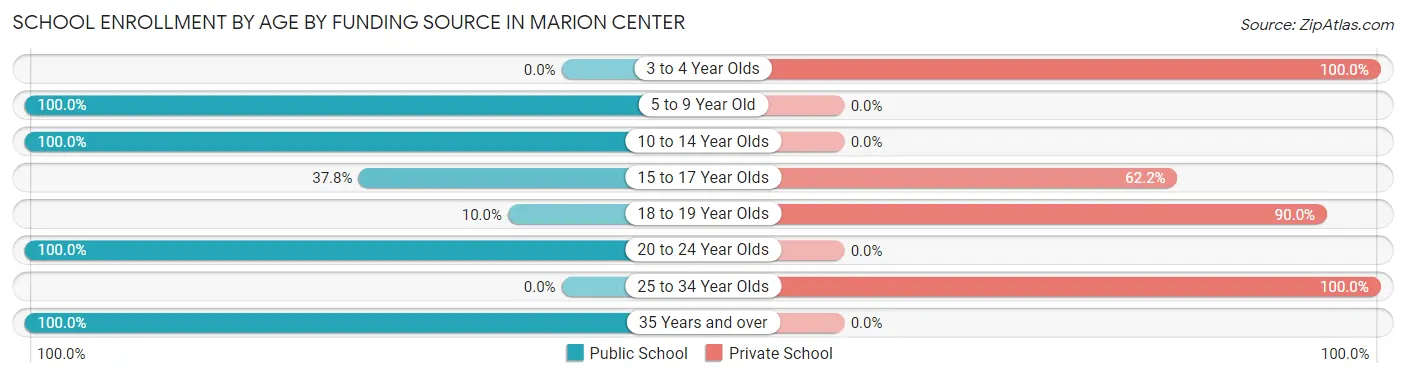
| Age Bracket | Public School | Private School |
| 3 to 4 Year Olds | 0 (0.0%) | 19 (100.0%) |
| 5 to 9 Year Old | 11 (100.0%) | 0 (0.0%) |
| 10 to 14 Year Olds | 5 (100.0%) | 0 (0.0%) |
| 15 to 17 Year Olds | 14 (37.8%) | 23 (62.2%) |
| 18 to 19 Year Olds | 5 (10.0%) | 45 (90.0%) |
| 20 to 24 Year Olds | 2 (100.0%) | 0 (0.0%) |
| 25 to 34 Year Olds | 0 (0.0%) | 73 (100.0%) |
| 35 Years and over | 58 (100.0%) | 0 (0.0%) |
| Total | 95 (37.3%) | 160 (62.7%) |
Educational Attainment by Field of Study in Marion Center
Education (97 | 22.2%), science & technology (59 | 13.5%), literature & languages (59 | 13.5%), engineering (42 | 9.6%), and business (40 | 9.1%) are the most common fields of study among 437 individuals in Marion Center who have obtained a bachelor's degree or higher.
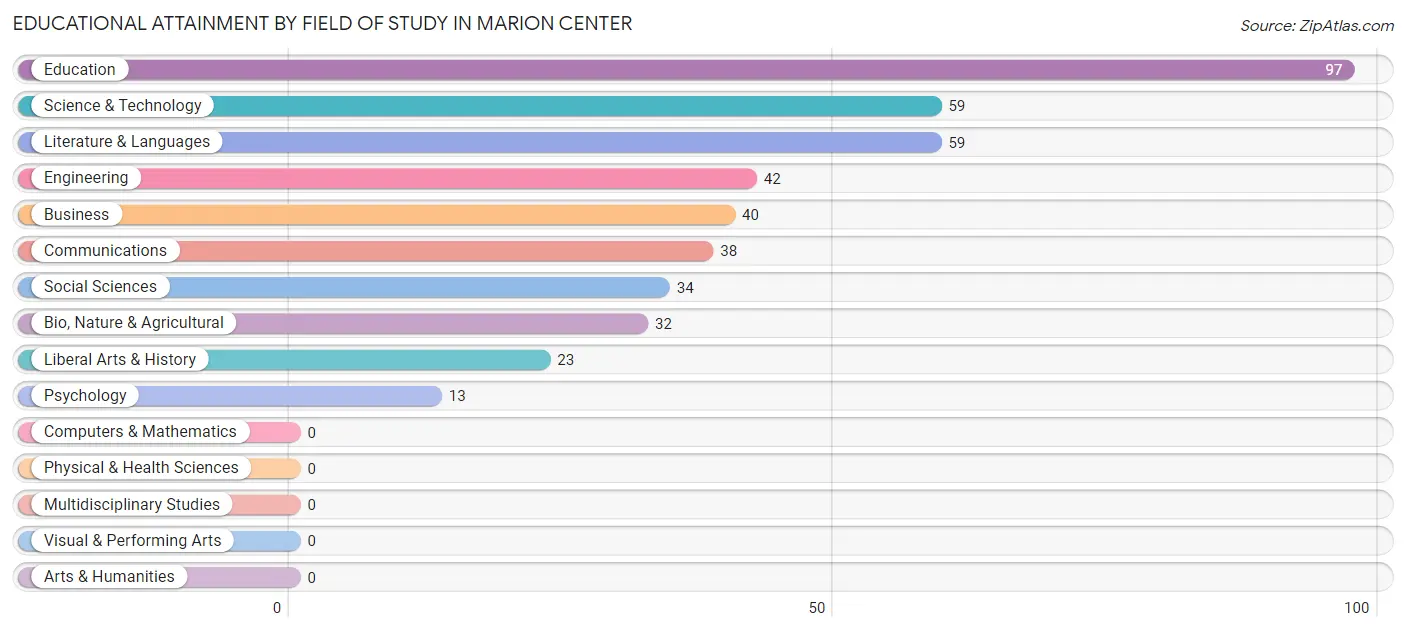
| Field of Study | # Graduates | % Graduates |
| Computers & Mathematics | 0 | 0.0% |
| Bio, Nature & Agricultural | 32 | 7.3% |
| Physical & Health Sciences | 0 | 0.0% |
| Psychology | 13 | 3.0% |
| Social Sciences | 34 | 7.8% |
| Engineering | 42 | 9.6% |
| Multidisciplinary Studies | 0 | 0.0% |
| Science & Technology | 59 | 13.5% |
| Business | 40 | 9.1% |
| Education | 97 | 22.2% |
| Literature & Languages | 59 | 13.5% |
| Liberal Arts & History | 23 | 5.3% |
| Visual & Performing Arts | 0 | 0.0% |
| Communications | 38 | 8.7% |
| Arts & Humanities | 0 | 0.0% |
| Total | 437 | 100.0% |
Transportation & Commute in Marion Center
Vehicle Availability by Sex in Marion Center
The most prevalent vehicle ownership categories in Marion Center are males with 2 vehicles (67, accounting for 36.2%) and females with 2 vehicles (78, making up 44.4%).
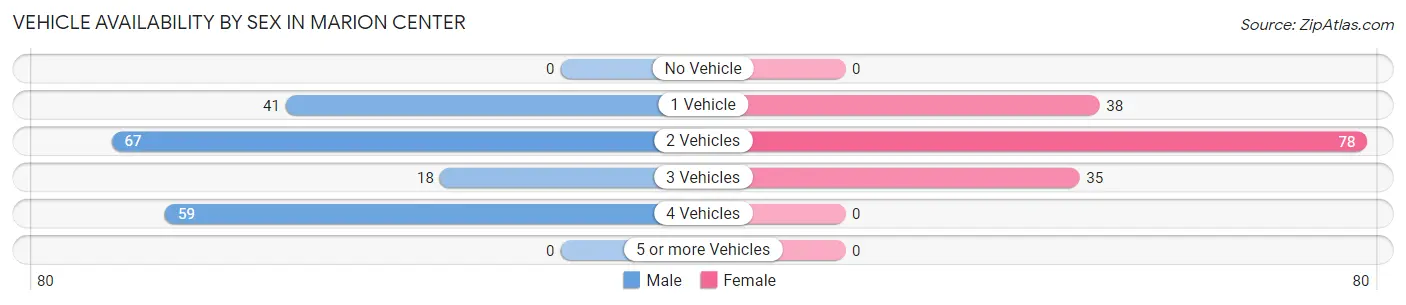
| Vehicles Available | Male | Female |
| No Vehicle | 0 (0.0%) | 0 (0.0%) |
| 1 Vehicle | 41 (22.2%) | 38 (25.2%) |
| 2 Vehicles | 67 (36.2%) | 78 (51.7%) |
| 3 Vehicles | 18 (9.7%) | 35 (23.2%) |
| 4 Vehicles | 59 (31.9%) | 0 (0.0%) |
| 5 or more Vehicles | 0 (0.0%) | 0 (0.0%) |
| Total | 185 (100.0%) | 151 (100.0%) |
Commute Time in Marion Center
The most frequently occuring commute durations in Marion Center are 45 to 59 minutes (66 commuters, 23.7%), less than 5 minutes (56 commuters, 20.1%), and 60 to 89 minutes (49 commuters, 17.6%).
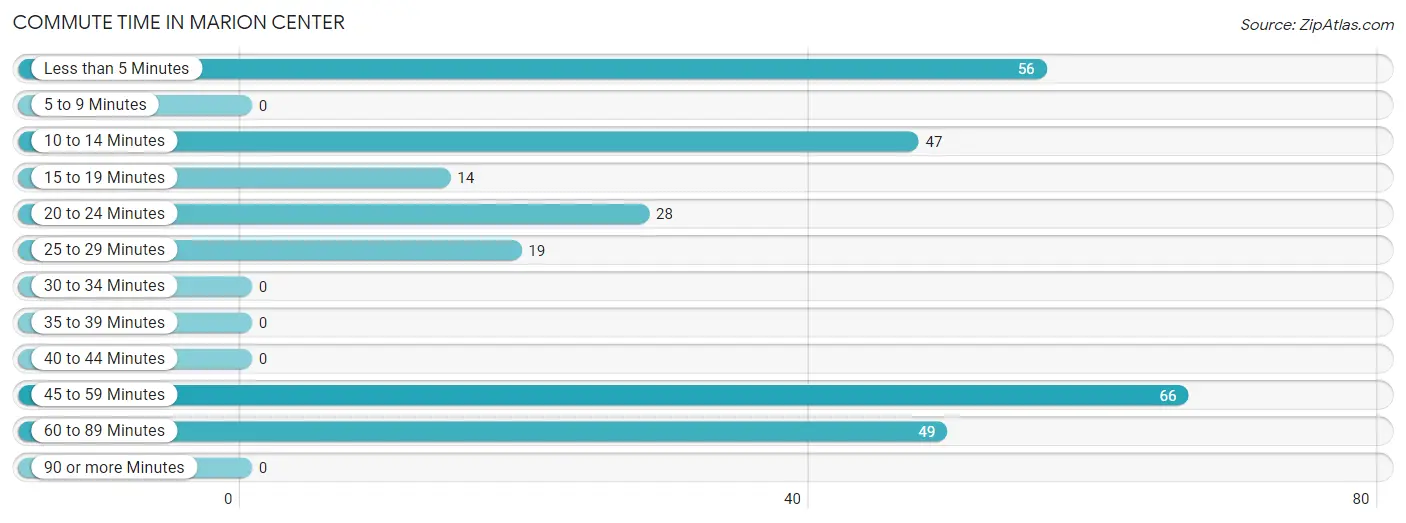
| Commute Time | # Commuters | % Commuters |
| Less than 5 Minutes | 56 | 20.1% |
| 5 to 9 Minutes | 0 | 0.0% |
| 10 to 14 Minutes | 47 | 16.9% |
| 15 to 19 Minutes | 14 | 5.0% |
| 20 to 24 Minutes | 28 | 10.0% |
| 25 to 29 Minutes | 19 | 6.8% |
| 30 to 34 Minutes | 0 | 0.0% |
| 35 to 39 Minutes | 0 | 0.0% |
| 40 to 44 Minutes | 0 | 0.0% |
| 45 to 59 Minutes | 66 | 23.7% |
| 60 to 89 Minutes | 49 | 17.6% |
| 90 or more Minutes | 0 | 0.0% |
Commute Time by Sex in Marion Center
The most common commute times in Marion Center are 45 to 59 minutes (49 commuters, 29.7%) for males and 60 to 89 minutes (38 commuters, 33.3%) for females.
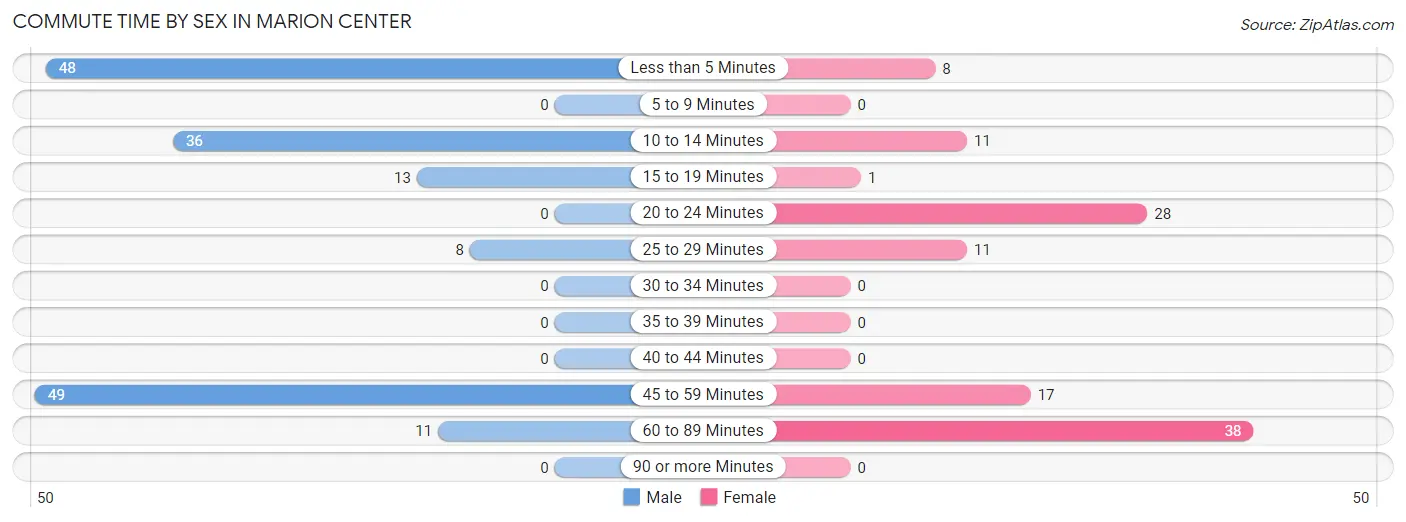
| Commute Time | Male | Female |
| Less than 5 Minutes | 48 (29.1%) | 8 (7.0%) |
| 5 to 9 Minutes | 0 (0.0%) | 0 (0.0%) |
| 10 to 14 Minutes | 36 (21.8%) | 11 (9.7%) |
| 15 to 19 Minutes | 13 (7.9%) | 1 (0.9%) |
| 20 to 24 Minutes | 0 (0.0%) | 28 (24.6%) |
| 25 to 29 Minutes | 8 (4.9%) | 11 (9.7%) |
| 30 to 34 Minutes | 0 (0.0%) | 0 (0.0%) |
| 35 to 39 Minutes | 0 (0.0%) | 0 (0.0%) |
| 40 to 44 Minutes | 0 (0.0%) | 0 (0.0%) |
| 45 to 59 Minutes | 49 (29.7%) | 17 (14.9%) |
| 60 to 89 Minutes | 11 (6.7%) | 38 (33.3%) |
| 90 or more Minutes | 0 (0.0%) | 0 (0.0%) |
Time of Departure to Work by Sex in Marion Center
The most frequent times of departure to work in Marion Center are 9:00 AM to 9:59 AM (46, 27.9%) for males and 6:30 AM to 6:59 AM (38, 33.3%) for females.
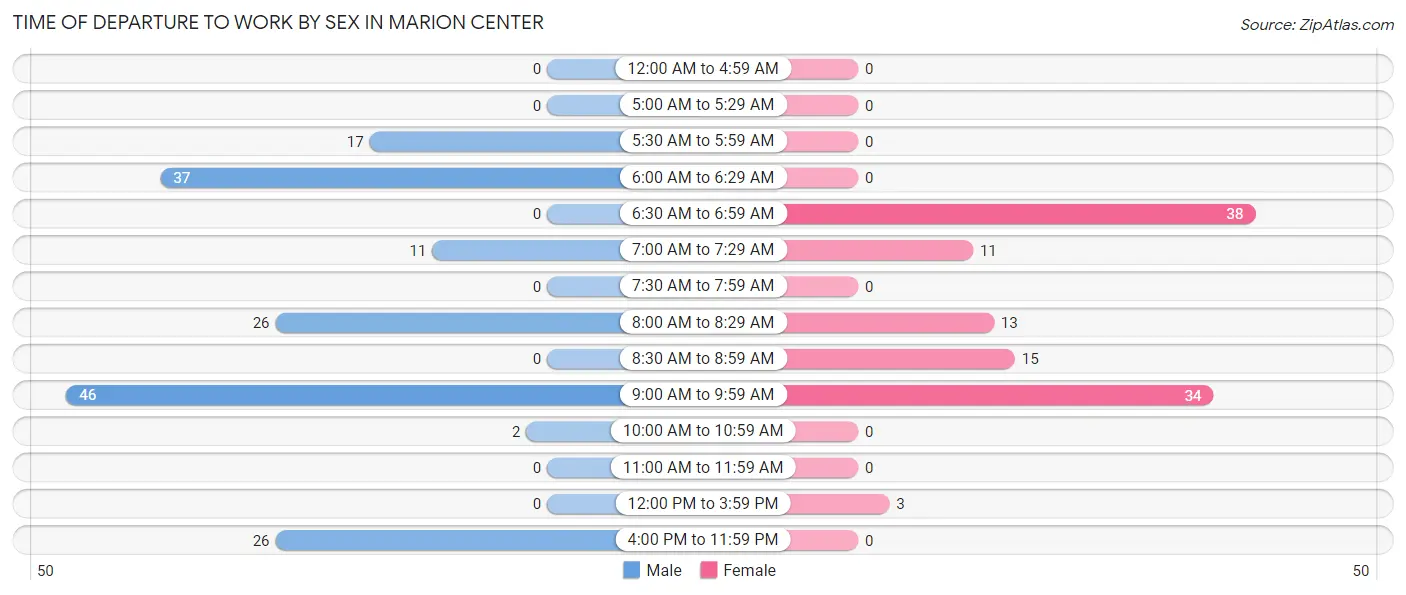
| Time of Departure | Male | Female |
| 12:00 AM to 4:59 AM | 0 (0.0%) | 0 (0.0%) |
| 5:00 AM to 5:29 AM | 0 (0.0%) | 0 (0.0%) |
| 5:30 AM to 5:59 AM | 17 (10.3%) | 0 (0.0%) |
| 6:00 AM to 6:29 AM | 37 (22.4%) | 0 (0.0%) |
| 6:30 AM to 6:59 AM | 0 (0.0%) | 38 (33.3%) |
| 7:00 AM to 7:29 AM | 11 (6.7%) | 11 (9.7%) |
| 7:30 AM to 7:59 AM | 0 (0.0%) | 0 (0.0%) |
| 8:00 AM to 8:29 AM | 26 (15.8%) | 13 (11.4%) |
| 8:30 AM to 8:59 AM | 0 (0.0%) | 15 (13.2%) |
| 9:00 AM to 9:59 AM | 46 (27.9%) | 34 (29.8%) |
| 10:00 AM to 10:59 AM | 2 (1.2%) | 0 (0.0%) |
| 11:00 AM to 11:59 AM | 0 (0.0%) | 0 (0.0%) |
| 12:00 PM to 3:59 PM | 0 (0.0%) | 3 (2.6%) |
| 4:00 PM to 11:59 PM | 26 (15.8%) | 0 (0.0%) |
| Total | 165 (100.0%) | 114 (100.0%) |
Housing Occupancy in Marion Center
Occupancy by Ownership in Marion Center
Of the total 372 dwellings in Marion Center, owner-occupied units account for 248 (66.7%), while renter-occupied units make up 124 (33.3%).
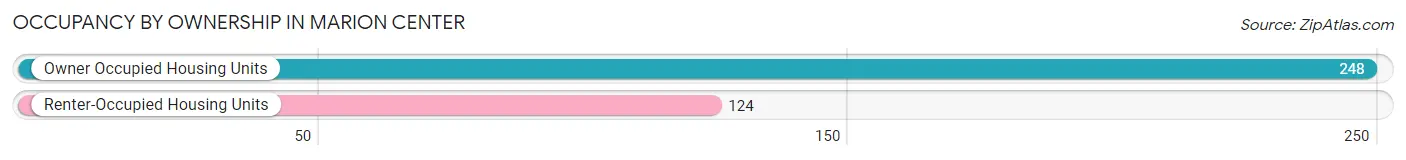
| Occupancy | # Housing Units | % Housing Units |
| Owner Occupied Housing Units | 248 | 66.7% |
| Renter-Occupied Housing Units | 124 | 33.3% |
| Total Occupied Housing Units | 372 | 100.0% |
Occupancy by Household Size in Marion Center
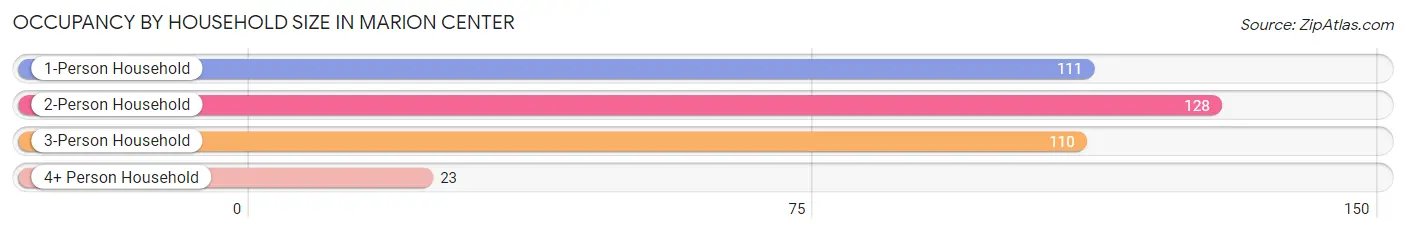
| Household Size | # Housing Units | % Housing Units |
| 1-Person Household | 111 | 29.8% |
| 2-Person Household | 128 | 34.4% |
| 3-Person Household | 110 | 29.6% |
| 4+ Person Household | 23 | 6.2% |
| Total Housing Units | 372 | 100.0% |
Occupancy by Ownership by Household Size in Marion Center
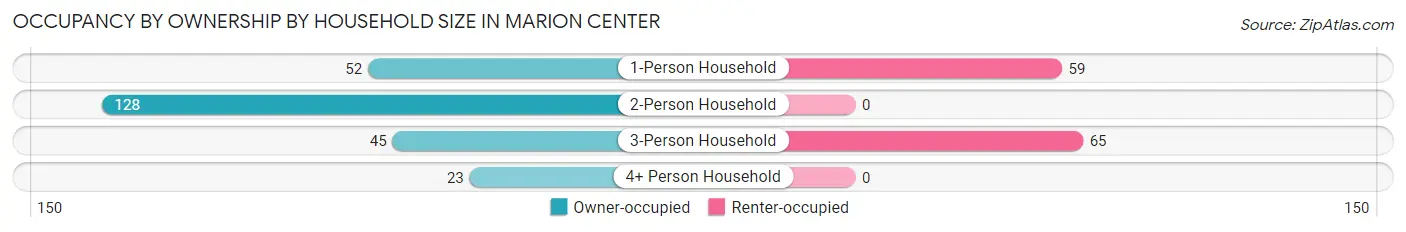
| Household Size | Owner-occupied | Renter-occupied |
| 1-Person Household | 52 (46.9%) | 59 (53.1%) |
| 2-Person Household | 128 (100.0%) | 0 (0.0%) |
| 3-Person Household | 45 (40.9%) | 65 (59.1%) |
| 4+ Person Household | 23 (100.0%) | 0 (0.0%) |
| Total Housing Units | 248 (66.7%) | 124 (33.3%) |
Occupancy by Educational Attainment in Marion Center
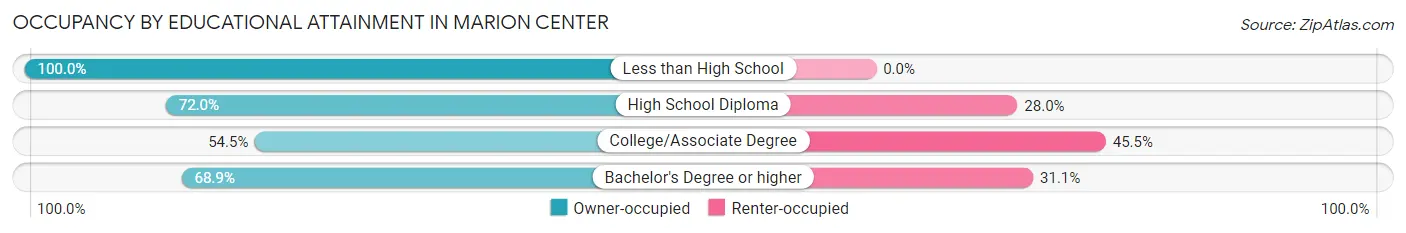
| Household Size | Owner-occupied | Renter-occupied |
| Less than High School | 28 (100.0%) | 0 (0.0%) |
| High School Diploma | 18 (72.0%) | 7 (28.0%) |
| College/Associate Degree | 67 (54.5%) | 56 (45.5%) |
| Bachelor's Degree or higher | 135 (68.9%) | 61 (31.1%) |
Occupancy by Age of Householder in Marion Center
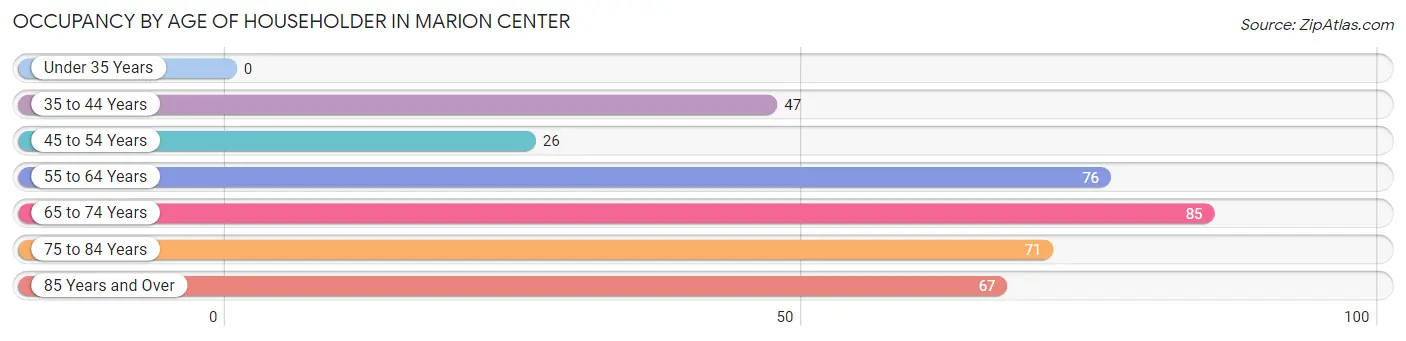
| Age Bracket | # Households | % Households |
| Under 35 Years | 0 | 0.0% |
| 35 to 44 Years | 47 | 12.6% |
| 45 to 54 Years | 26 | 7.0% |
| 55 to 64 Years | 76 | 20.4% |
| 65 to 74 Years | 85 | 22.9% |
| 75 to 84 Years | 71 | 19.1% |
| 85 Years and Over | 67 | 18.0% |
| Total | 372 | 100.0% |
Housing Finances in Marion Center
Median Income by Occupancy in Marion Center
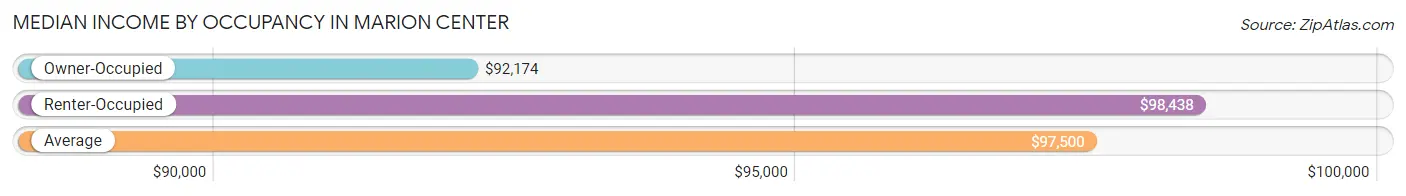
| Occupancy Type | # Households | Median Income |
| Owner-Occupied | 248 (66.7%) | $92,174 |
| Renter-Occupied | 124 (33.3%) | $98,438 |
| Average | 372 (100.0%) | $97,500 |
Occupancy by Householder Income Bracket in Marion Center
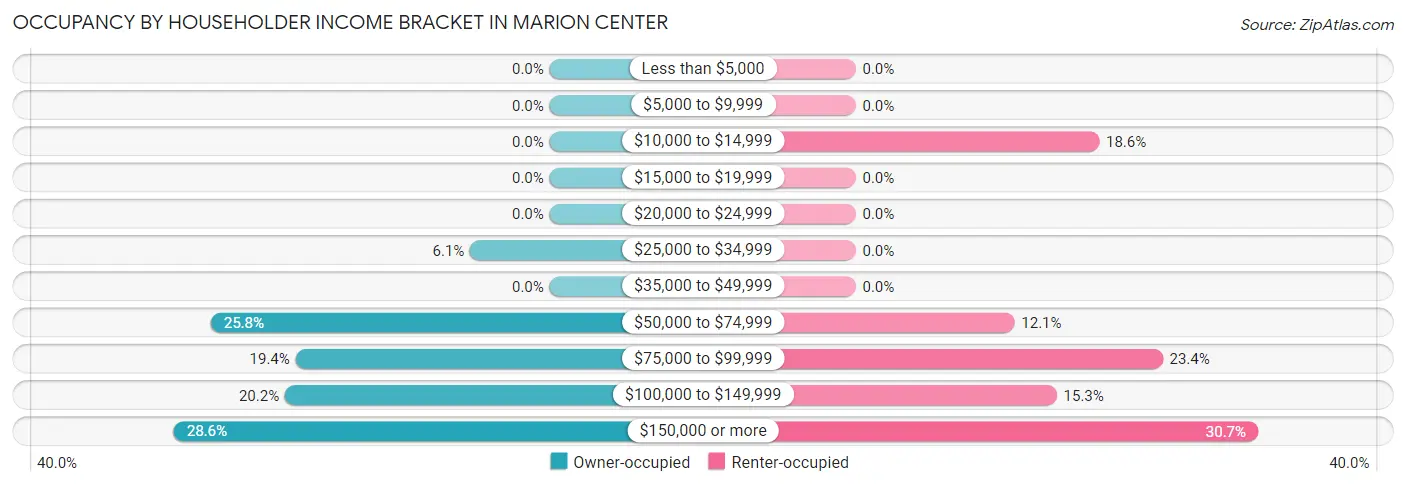
| Income Bracket | Owner-occupied | Renter-occupied |
| Less than $5,000 | 0 (0.0%) | 0 (0.0%) |
| $5,000 to $9,999 | 0 (0.0%) | 0 (0.0%) |
| $10,000 to $14,999 | 0 (0.0%) | 23 (18.5%) |
| $15,000 to $19,999 | 0 (0.0%) | 0 (0.0%) |
| $20,000 to $24,999 | 0 (0.0%) | 0 (0.0%) |
| $25,000 to $34,999 | 15 (6.0%) | 0 (0.0%) |
| $35,000 to $49,999 | 0 (0.0%) | 0 (0.0%) |
| $50,000 to $74,999 | 64 (25.8%) | 15 (12.1%) |
| $75,000 to $99,999 | 48 (19.4%) | 29 (23.4%) |
| $100,000 to $149,999 | 50 (20.2%) | 19 (15.3%) |
| $150,000 or more | 71 (28.6%) | 38 (30.6%) |
| Total | 248 (100.0%) | 124 (100.0%) |
Monthly Housing Cost Tiers in Marion Center
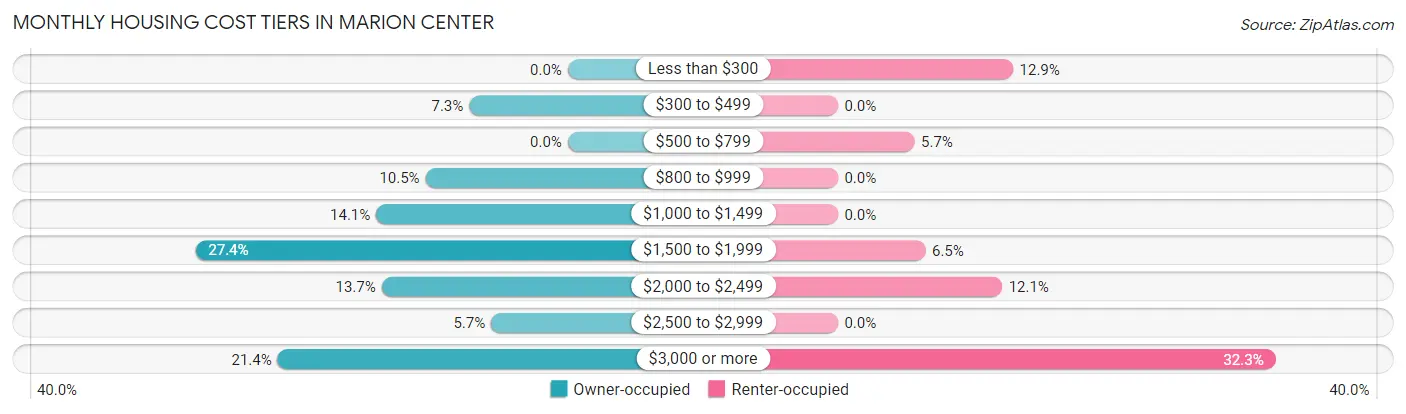
| Monthly Cost | Owner-occupied | Renter-occupied |
| Less than $300 | 0 (0.0%) | 16 (12.9%) |
| $300 to $499 | 18 (7.3%) | 0 (0.0%) |
| $500 to $799 | 0 (0.0%) | 7 (5.7%) |
| $800 to $999 | 26 (10.5%) | 0 (0.0%) |
| $1,000 to $1,499 | 35 (14.1%) | 0 (0.0%) |
| $1,500 to $1,999 | 68 (27.4%) | 8 (6.5%) |
| $2,000 to $2,499 | 34 (13.7%) | 15 (12.1%) |
| $2,500 to $2,999 | 14 (5.7%) | 0 (0.0%) |
| $3,000 or more | 53 (21.4%) | 40 (32.3%) |
| Total | 248 (100.0%) | 124 (100.0%) |
Physical Housing Characteristics in Marion Center
Housing Structures in Marion Center
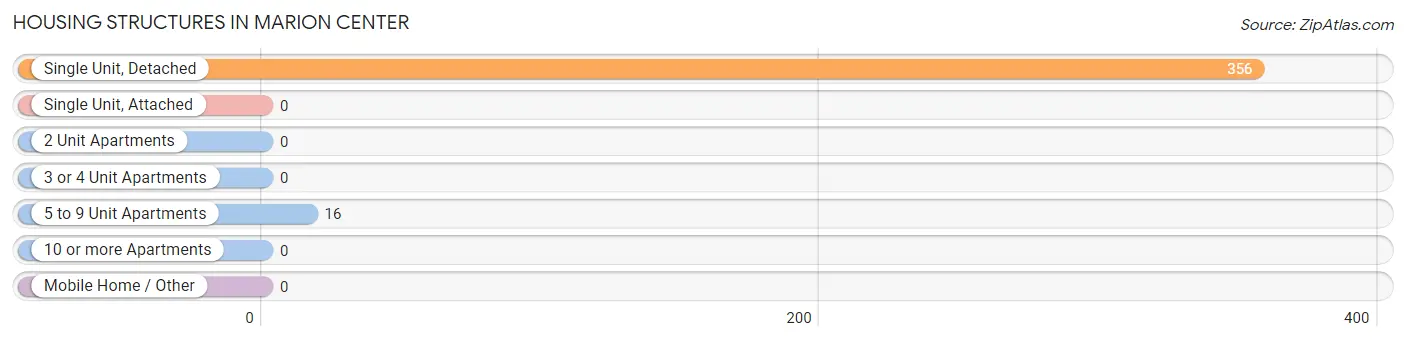
| Structure Type | # Housing Units | % Housing Units |
| Single Unit, Detached | 356 | 95.7% |
| Single Unit, Attached | 0 | 0.0% |
| 2 Unit Apartments | 0 | 0.0% |
| 3 or 4 Unit Apartments | 0 | 0.0% |
| 5 to 9 Unit Apartments | 16 | 4.3% |
| 10 or more Apartments | 0 | 0.0% |
| Mobile Home / Other | 0 | 0.0% |
| Total | 372 | 100.0% |
Housing Structures by Occupancy in Marion Center
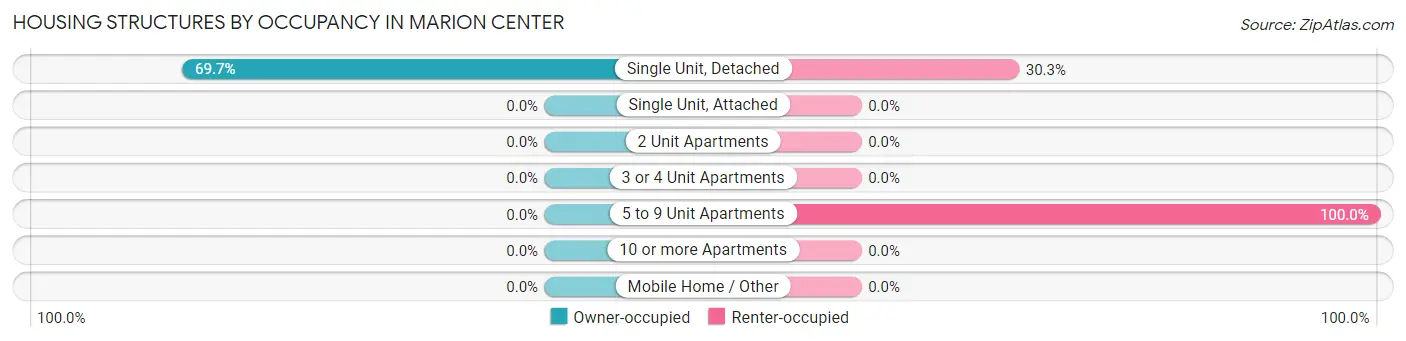
| Structure Type | Owner-occupied | Renter-occupied |
| Single Unit, Detached | 248 (69.7%) | 108 (30.3%) |
| Single Unit, Attached | 0 (0.0%) | 0 (0.0%) |
| 2 Unit Apartments | 0 (0.0%) | 0 (0.0%) |
| 3 or 4 Unit Apartments | 0 (0.0%) | 0 (0.0%) |
| 5 to 9 Unit Apartments | 0 (0.0%) | 16 (100.0%) |
| 10 or more Apartments | 0 (0.0%) | 0 (0.0%) |
| Mobile Home / Other | 0 (0.0%) | 0 (0.0%) |
| Total | 248 (66.7%) | 124 (33.3%) |
Housing Structures by Number of Rooms in Marion Center
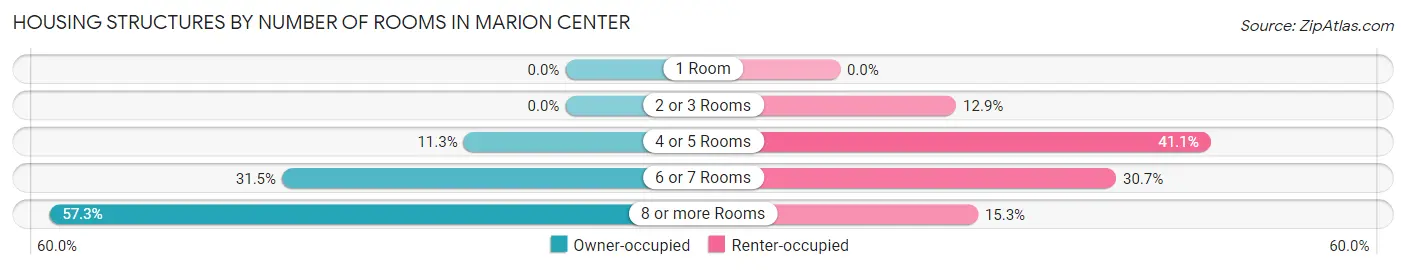
| Number of Rooms | Owner-occupied | Renter-occupied |
| 1 Room | 0 (0.0%) | 0 (0.0%) |
| 2 or 3 Rooms | 0 (0.0%) | 16 (12.9%) |
| 4 or 5 Rooms | 28 (11.3%) | 51 (41.1%) |
| 6 or 7 Rooms | 78 (31.5%) | 38 (30.6%) |
| 8 or more Rooms | 142 (57.3%) | 19 (15.3%) |
| Total | 248 (100.0%) | 124 (100.0%) |
Housing Structure by Heating Type in Marion Center
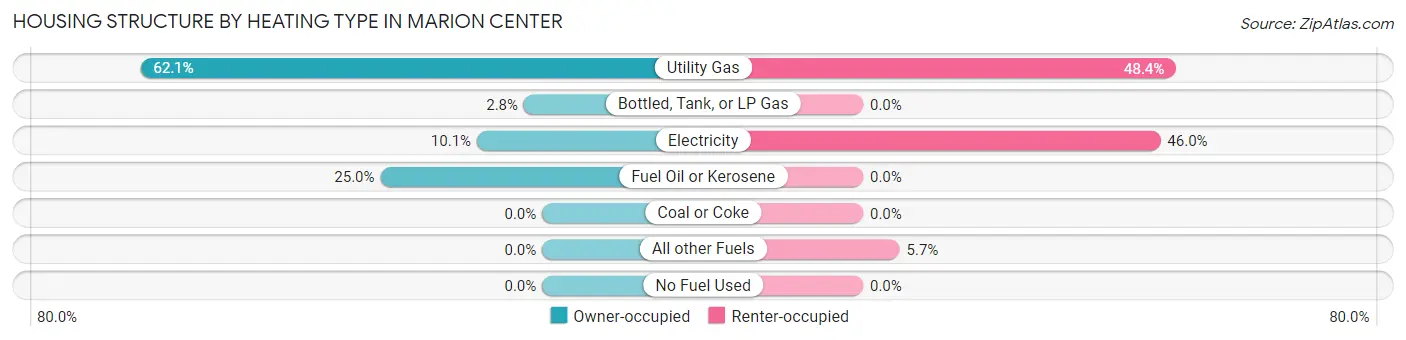
| Heating Type | Owner-occupied | Renter-occupied |
| Utility Gas | 154 (62.1%) | 60 (48.4%) |
| Bottled, Tank, or LP Gas | 7 (2.8%) | 0 (0.0%) |
| Electricity | 25 (10.1%) | 57 (46.0%) |
| Fuel Oil or Kerosene | 62 (25.0%) | 0 (0.0%) |
| Coal or Coke | 0 (0.0%) | 0 (0.0%) |
| All other Fuels | 0 (0.0%) | 7 (5.7%) |
| No Fuel Used | 0 (0.0%) | 0 (0.0%) |
| Total | 248 (100.0%) | 124 (100.0%) |
Household Vehicle Usage in Marion Center
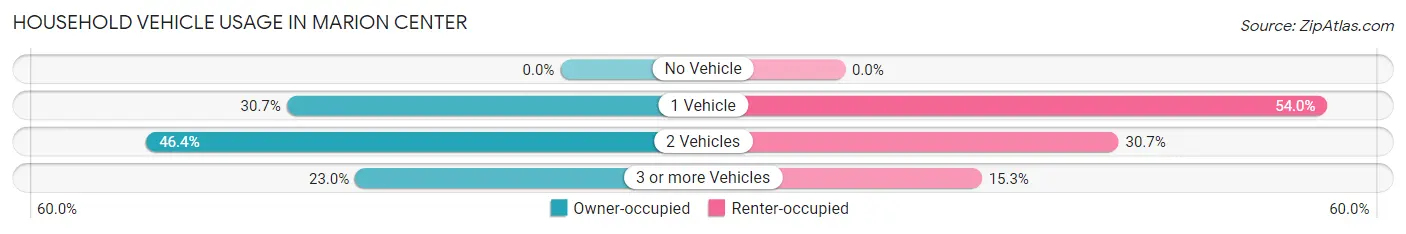
| Vehicles per Household | Owner-occupied | Renter-occupied |
| No Vehicle | 0 (0.0%) | 0 (0.0%) |
| 1 Vehicle | 76 (30.6%) | 67 (54.0%) |
| 2 Vehicles | 115 (46.4%) | 38 (30.6%) |
| 3 or more Vehicles | 57 (23.0%) | 19 (15.3%) |
| Total | 248 (100.0%) | 124 (100.0%) |
Real Estate & Mortgages in Marion Center
Real Estate and Mortgage Overview in Marion Center
| Characteristic | Without Mortgage | With Mortgage |
| Housing Units | 114 | 134 |
| Median Property Value | $647,100 | $516,900 |
| Median Household Income | $91,630 | $48 |
| Monthly Housing Costs | $1,227 | $30 |
| Real Estate Taxes | $6,950 | $0 |
Property Value by Mortgage Status in Marion Center
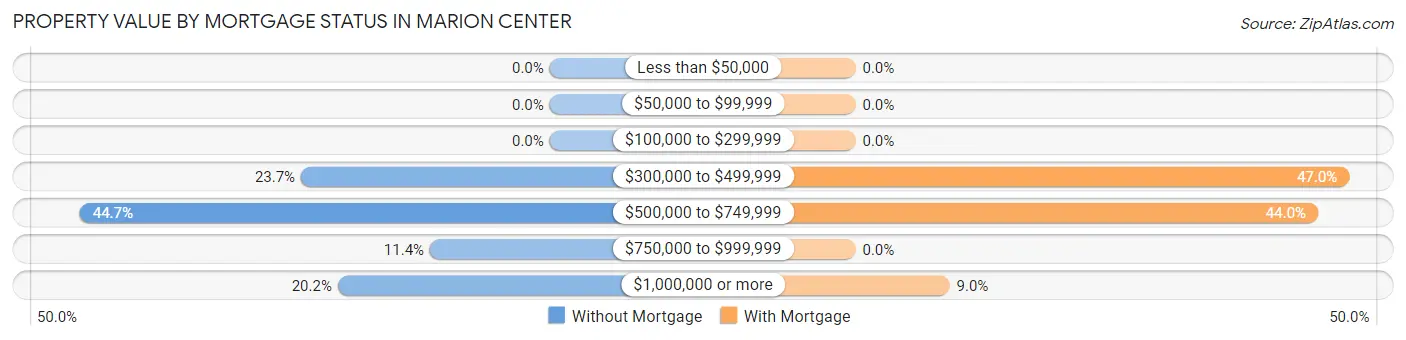
| Property Value | Without Mortgage | With Mortgage |
| Less than $50,000 | 0 (0.0%) | 0 (0.0%) |
| $50,000 to $99,999 | 0 (0.0%) | 0 (0.0%) |
| $100,000 to $299,999 | 0 (0.0%) | 0 (0.0%) |
| $300,000 to $499,999 | 27 (23.7%) | 63 (47.0%) |
| $500,000 to $749,999 | 51 (44.7%) | 59 (44.0%) |
| $750,000 to $999,999 | 13 (11.4%) | 0 (0.0%) |
| $1,000,000 or more | 23 (20.2%) | 12 (9.0%) |
| Total | 114 (100.0%) | 134 (100.0%) |
Household Income by Mortgage Status in Marion Center
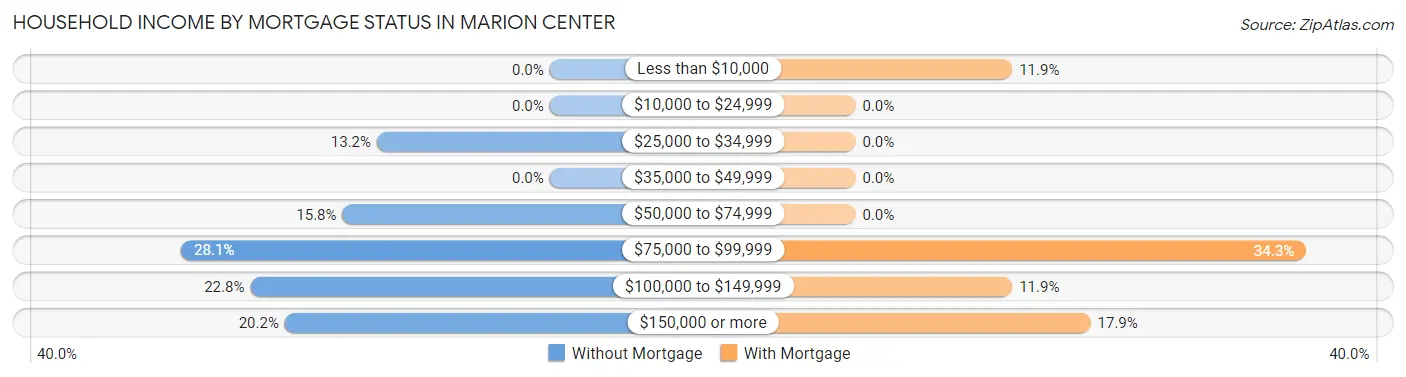
| Household Income | Without Mortgage | With Mortgage |
| Less than $10,000 | 0 (0.0%) | 16 (11.9%) |
| $10,000 to $24,999 | 0 (0.0%) | 0 (0.0%) |
| $25,000 to $34,999 | 15 (13.2%) | 0 (0.0%) |
| $35,000 to $49,999 | 0 (0.0%) | 0 (0.0%) |
| $50,000 to $74,999 | 18 (15.8%) | 0 (0.0%) |
| $75,000 to $99,999 | 32 (28.1%) | 46 (34.3%) |
| $100,000 to $149,999 | 26 (22.8%) | 16 (11.9%) |
| $150,000 or more | 23 (20.2%) | 24 (17.9%) |
| Total | 114 (100.0%) | 134 (100.0%) |
Property Value to Household Income Ratio in Marion Center
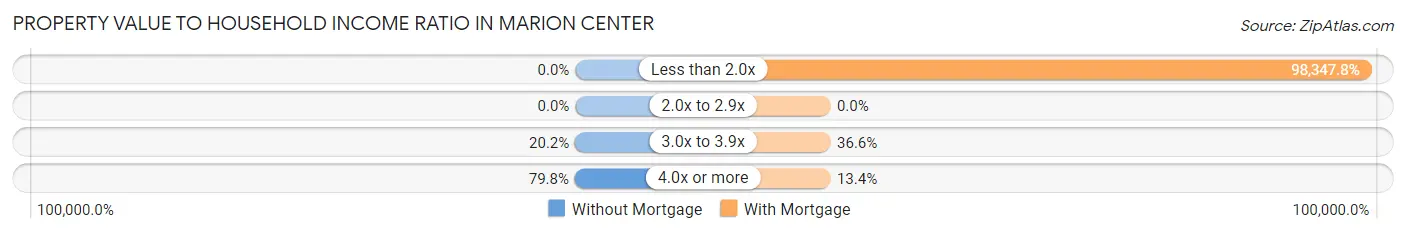
| Value-to-Income Ratio | Without Mortgage | With Mortgage |
| Less than 2.0x | 0 (0.0%) | 131,786 (98,347.8%) |
| 2.0x to 2.9x | 0 (0.0%) | 0 (0.0%) |
| 3.0x to 3.9x | 23 (20.2%) | 49 (36.6%) |
| 4.0x or more | 91 (79.8%) | 18 (13.4%) |
| Total | 114 (100.0%) | 134 (100.0%) |
Real Estate Taxes by Mortgage Status in Marion Center
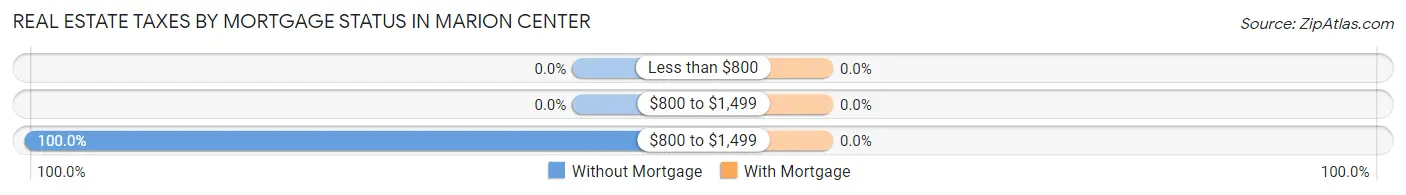
| Property Taxes | Without Mortgage | With Mortgage |
| Less than $800 | 0 (0.0%) | 0 (0.0%) |
| $800 to $1,499 | 0 (0.0%) | 0 (0.0%) |
| $800 to $1,499 | 114 (100.0%) | 0 (0.0%) |
| Total | 114 (100.0%) | 134 (100.0%) |
Health & Disability in Marion Center
Health Insurance Coverage by Age in Marion Center
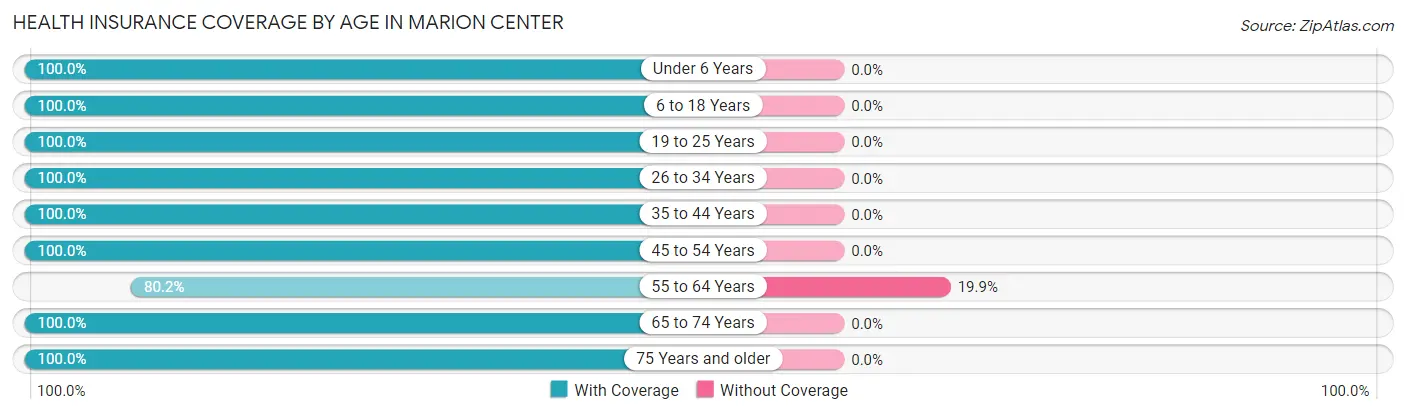
| Age Bracket | With Coverage | Without Coverage |
| Under 6 Years | 55 (100.0%) | 0 (0.0%) |
| 6 to 18 Years | 102 (100.0%) | 0 (0.0%) |
| 19 to 25 Years | 3 (100.0%) | 0 (0.0%) |
| 26 to 34 Years | 119 (100.0%) | 0 (0.0%) |
| 35 to 44 Years | 133 (100.0%) | 0 (0.0%) |
| 45 to 54 Years | 128 (100.0%) | 0 (0.0%) |
| 55 to 64 Years | 109 (80.1%) | 27 (19.9%) |
| 65 to 74 Years | 156 (100.0%) | 0 (0.0%) |
| 75 Years and older | 148 (100.0%) | 0 (0.0%) |
| Total | 953 (97.2%) | 27 (2.8%) |
Health Insurance Coverage by Citizenship Status in Marion Center
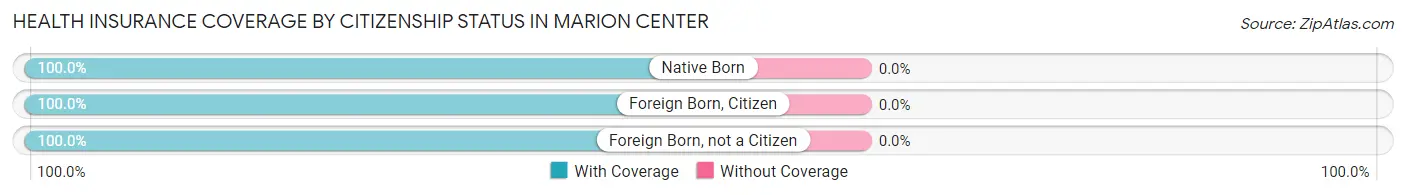
| Citizenship Status | With Coverage | Without Coverage |
| Native Born | 55 (100.0%) | 0 (0.0%) |
| Foreign Born, Citizen | 102 (100.0%) | 0 (0.0%) |
| Foreign Born, not a Citizen | 3 (100.0%) | 0 (0.0%) |
Health Insurance Coverage by Household Income in Marion Center
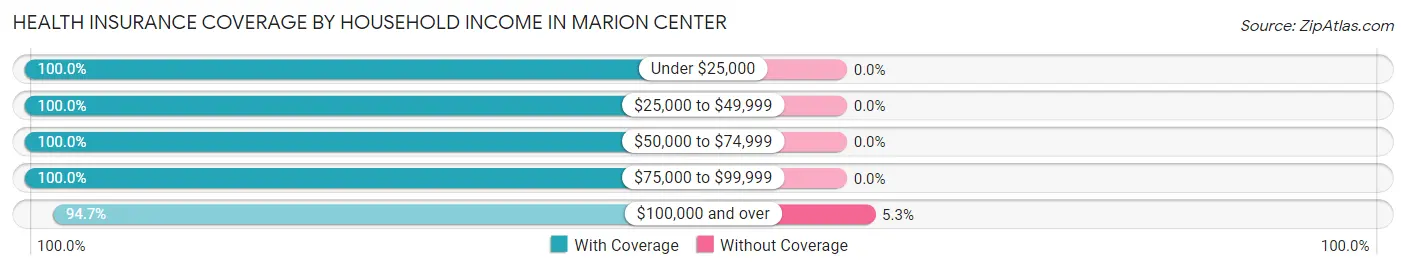
| Household Income | With Coverage | Without Coverage |
| Under $25,000 | 23 (100.0%) | 0 (0.0%) |
| $25,000 to $49,999 | 15 (100.0%) | 0 (0.0%) |
| $50,000 to $74,999 | 130 (100.0%) | 0 (0.0%) |
| $75,000 to $99,999 | 138 (100.0%) | 0 (0.0%) |
| $100,000 and over | 481 (94.7%) | 27 (5.3%) |
Public vs Private Health Insurance Coverage by Age in Marion Center
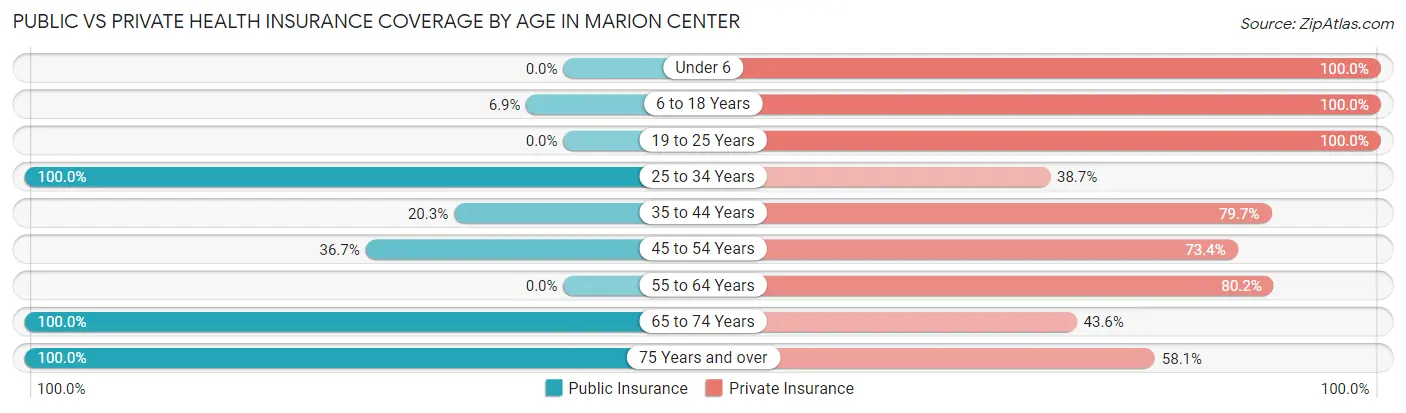
| Age Bracket | Public Insurance | Private Insurance |
| Under 6 | 0 (0.0%) | 55 (100.0%) |
| 6 to 18 Years | 7 (6.9%) | 102 (100.0%) |
| 19 to 25 Years | 0 (0.0%) | 3 (100.0%) |
| 25 to 34 Years | 119 (100.0%) | 46 (38.7%) |
| 35 to 44 Years | 27 (20.3%) | 106 (79.7%) |
| 45 to 54 Years | 47 (36.7%) | 94 (73.4%) |
| 55 to 64 Years | 0 (0.0%) | 109 (80.1%) |
| 65 to 74 Years | 156 (100.0%) | 68 (43.6%) |
| 75 Years and over | 148 (100.0%) | 86 (58.1%) |
| Total | 504 (51.4%) | 669 (68.3%) |
Disability Status by Sex by Age in Marion Center
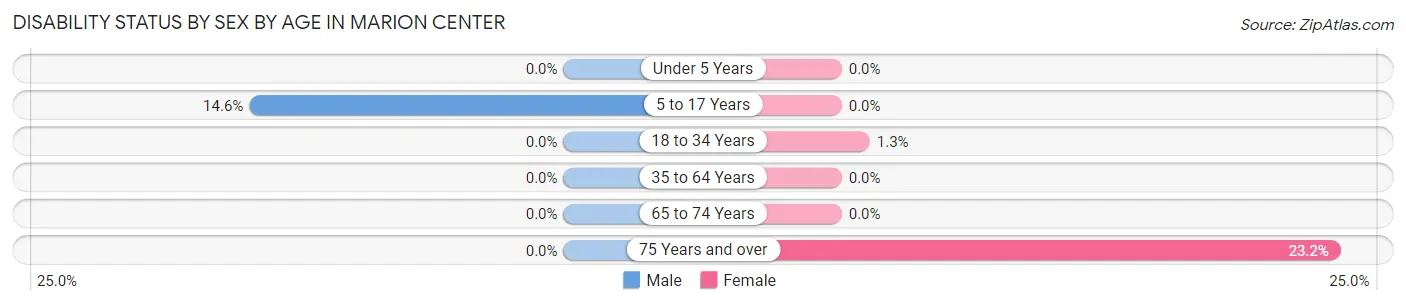
| Age Bracket | Male | Female |
| Under 5 Years | 0 (0.0%) | 0 (0.0%) |
| 5 to 17 Years | 7 (14.6%) | 0 (0.0%) |
| 18 to 34 Years | 0 (0.0%) | 1 (1.3%) |
| 35 to 64 Years | 0 (0.0%) | 0 (0.0%) |
| 65 to 74 Years | 0 (0.0%) | 0 (0.0%) |
| 75 Years and over | 0 (0.0%) | 25 (23.2%) |
Disability Class by Sex by Age in Marion Center
Disability Class: Hearing Difficulty
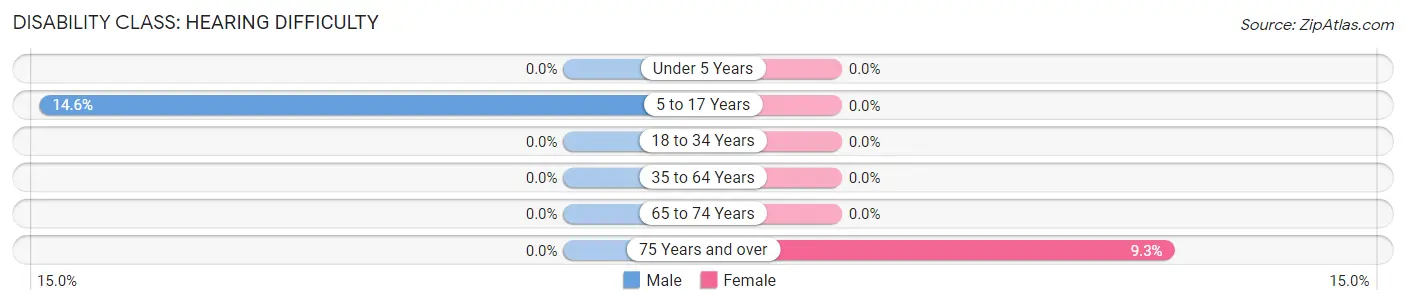
| Age Bracket | Male | Female |
| Under 5 Years | 0 (0.0%) | 0 (0.0%) |
| 5 to 17 Years | 7 (14.6%) | 0 (0.0%) |
| 18 to 34 Years | 0 (0.0%) | 0 (0.0%) |
| 35 to 64 Years | 0 (0.0%) | 0 (0.0%) |
| 65 to 74 Years | 0 (0.0%) | 0 (0.0%) |
| 75 Years and over | 0 (0.0%) | 10 (9.3%) |
Disability Class: Vision Difficulty
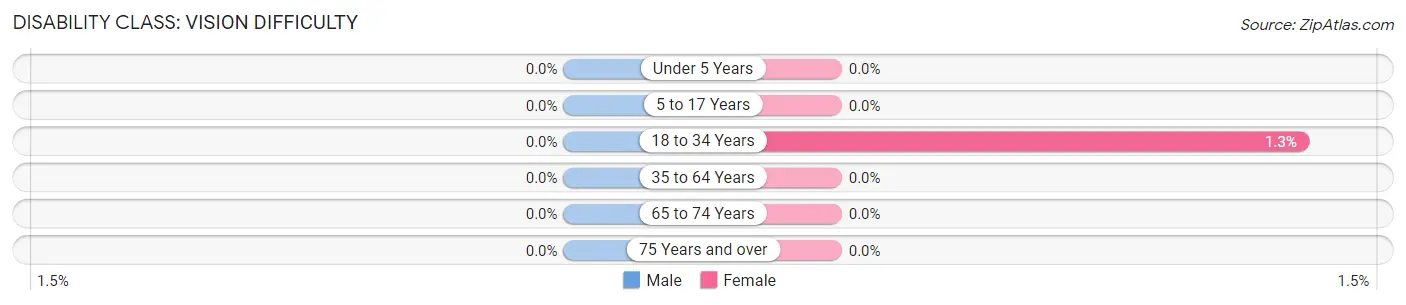
| Age Bracket | Male | Female |
| Under 5 Years | 0 (0.0%) | 0 (0.0%) |
| 5 to 17 Years | 0 (0.0%) | 0 (0.0%) |
| 18 to 34 Years | 0 (0.0%) | 1 (1.3%) |
| 35 to 64 Years | 0 (0.0%) | 0 (0.0%) |
| 65 to 74 Years | 0 (0.0%) | 0 (0.0%) |
| 75 Years and over | 0 (0.0%) | 0 (0.0%) |
Disability Class: Cognitive Difficulty
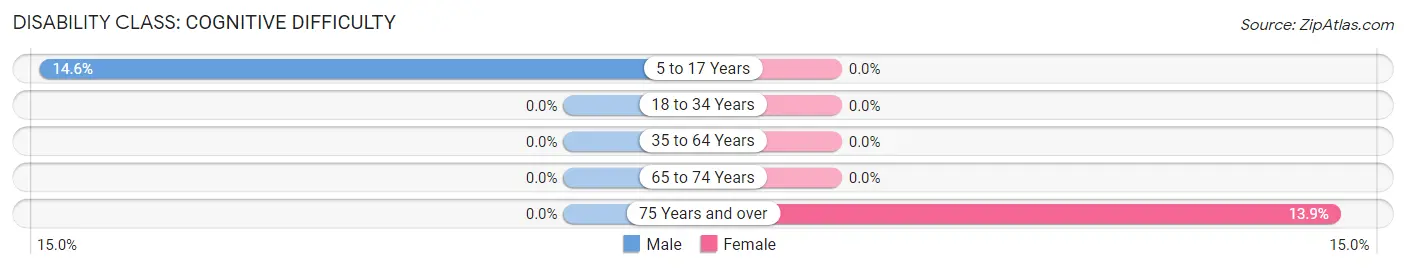
| Age Bracket | Male | Female |
| 5 to 17 Years | 7 (14.6%) | 0 (0.0%) |
| 18 to 34 Years | 0 (0.0%) | 0 (0.0%) |
| 35 to 64 Years | 0 (0.0%) | 0 (0.0%) |
| 65 to 74 Years | 0 (0.0%) | 0 (0.0%) |
| 75 Years and over | 0 (0.0%) | 15 (13.9%) |
Disability Class: Ambulatory Difficulty
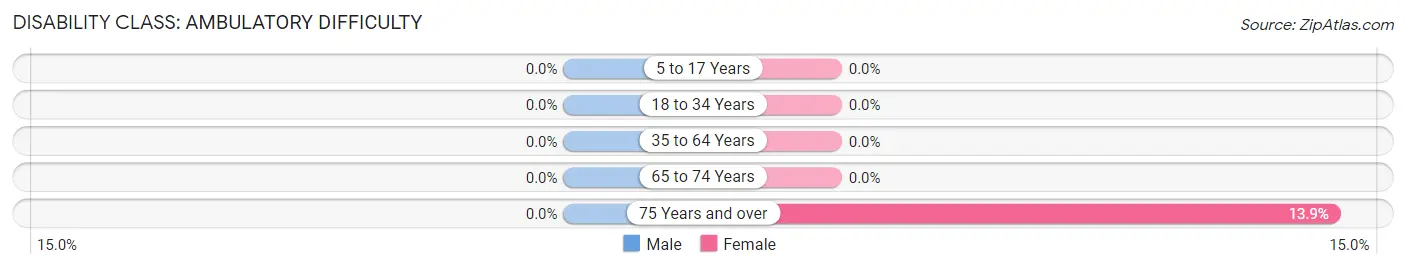
| Age Bracket | Male | Female |
| 5 to 17 Years | 0 (0.0%) | 0 (0.0%) |
| 18 to 34 Years | 0 (0.0%) | 0 (0.0%) |
| 35 to 64 Years | 0 (0.0%) | 0 (0.0%) |
| 65 to 74 Years | 0 (0.0%) | 0 (0.0%) |
| 75 Years and over | 0 (0.0%) | 15 (13.9%) |
Disability Class: Self-Care Difficulty
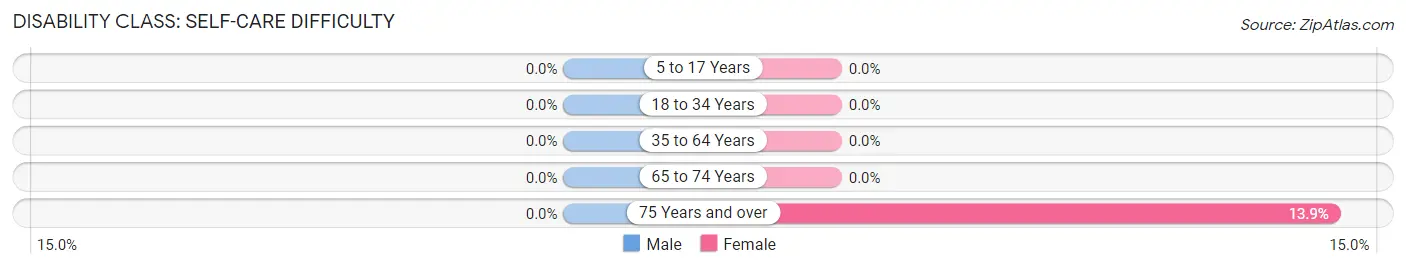
| Age Bracket | Male | Female |
| 5 to 17 Years | 0 (0.0%) | 0 (0.0%) |
| 18 to 34 Years | 0 (0.0%) | 0 (0.0%) |
| 35 to 64 Years | 0 (0.0%) | 0 (0.0%) |
| 65 to 74 Years | 0 (0.0%) | 0 (0.0%) |
| 75 Years and over | 0 (0.0%) | 15 (13.9%) |
Technology Access in Marion Center
Computing Device Access in Marion Center
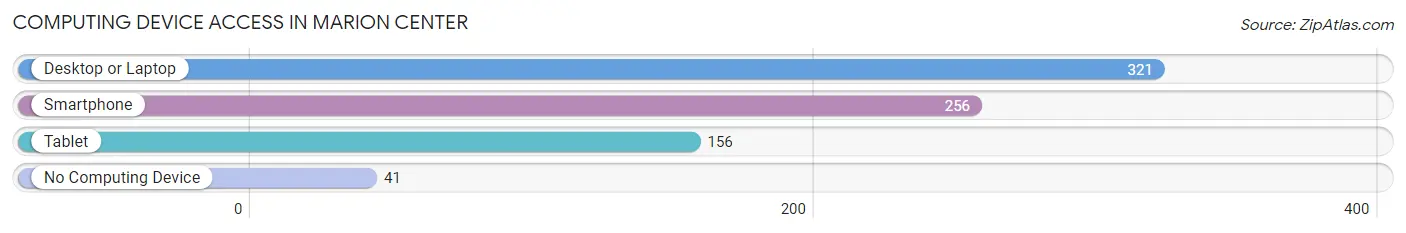
| Device Type | # Households | % Households |
| Desktop or Laptop | 321 | 86.3% |
| Smartphone | 256 | 68.8% |
| Tablet | 156 | 41.9% |
| No Computing Device | 41 | 11.0% |
| Total | 372 | 100.0% |
Internet Access in Marion Center
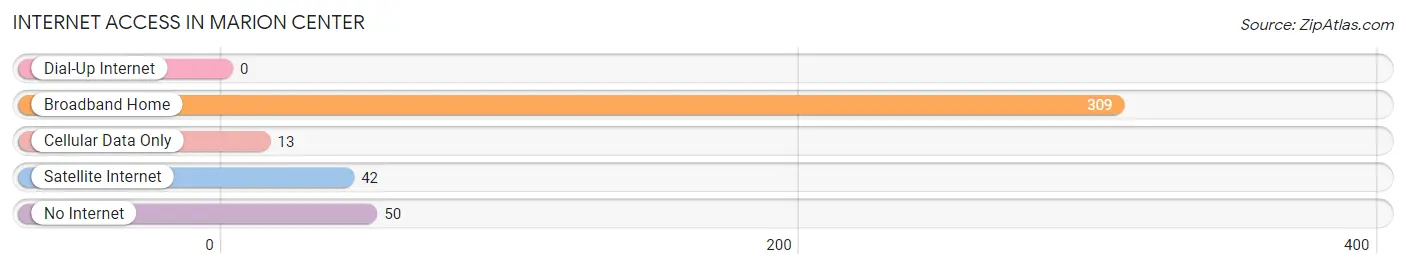
| Internet Type | # Households | % Households |
| Dial-Up Internet | 0 | 0.0% |
| Broadband Home | 309 | 83.1% |
| Cellular Data Only | 13 | 3.5% |
| Satellite Internet | 42 | 11.3% |
| No Internet | 50 | 13.4% |
| Total | 372 | 100.0% |
Marion Center Summary
Marion Center is a small town located in Plymouth County, Massachusetts. It is situated on the banks of the Taunton River, about 25 miles south of Boston. The town was first settled in 1678 and incorporated in 1717. As of the 2010 census, the population of Marion Center was 1,845.
Geography
Marion Center is located at 41°45'N 70°51'W (41.75, -70.85). It is bordered by the towns of Rochester to the north, Mattapoisett to the east, Wareham to the south, and Carver to the west. The town has a total area of 8.2 square miles, of which 8.1 square miles is land and 0.1 square miles is water.
The town is located on the banks of the Taunton River, which is part of the Narragansett Bay watershed. The town is also home to several ponds, including Long Pond, Great Quittacas Pond, and Little Quittacas Pond.
Demographics
As of the 2010 census, there were 1,845 people, 717 households, and 517 families residing in the town. The population density was 227.3 people per square mile. There were 771 housing units at an average density of 95.2 per square mile. The racial makeup of the town was 97.2% White, 0.7% African American, 0.2% Native American, 0.4% Asian, 0.1% Pacific Islander, 0.4% from other races, and 1.0% from two or more races. Hispanic or Latino of any race were 1.2% of the population.
There were 717 households, out of which 33.2% had children under the age of 18 living with them, 56.2% were married couples living together, 10.7% had a female householder with no husband present, and 28.7% were non-families. 22.7% of all households were made up of individuals, and 9.2% had someone living alone who was 65 years of age or older. The average household size was 2.57 and the average family size was 3.02.
The median age in the town was 41.2 years. 24.2% of residents were under the age of 18; 6.7% were between the ages of 18 and 24; 24.3% were from 25 to 44; 30.3% were from 45 to 64; and 14.5% were 65 years of age or older. The gender makeup of the town was 48.7% male and 51.3% female.
Economy
Marion Center is a primarily residential community, with a small commercial center located in the center of town. The town is home to several small businesses, including a grocery store, a hardware store, a pharmacy, and a few restaurants. The town is also home to a number of small manufacturing companies, including a plastics manufacturer and a metal fabrication shop.
The town is also home to a number of farms, including a dairy farm, a vegetable farm, and a cranberry bog. The town is also home to a number of recreational facilities, including a golf course, a public beach, and a number of parks.
The median household income in the town was $60,938, and the median family income was $71,250. About 5.2% of families and 6.7% of the population were below the poverty line, including 8.2% of those under age 18 and 5.3% of those age 65 or over.
Conclusion
Marion Center is a small town located in Plymouth County, Massachusetts. It is situated on the banks of the Taunton River, about 25 miles south of Boston. The town was first settled in 1678 and incorporated in 1717. As of the 2010 census, the population of Marion Center was 1,845. The town is primarily residential, with a small commercial center located in the center of town. The town is home to several small businesses, farms, and recreational facilities. The median household income in the town was $60,938, and the median family income was $71,250.
Common Questions
What is Per Capita Income in Marion Center?
Per Capita income in Marion Center is $97,213.
What is the Median Family Income in Marion Center?
Median Family Income in Marion Center is $131,250.
What is the Median Household income in Marion Center?
Median Household Income in Marion Center is $97,500.
What is Income or Wage Gap in Marion Center?
Income or Wage Gap in Marion Center is 26.0%.
Women in Marion Center earn 74.0 cents for every dollar earned by a man.
What is Inequality or Gini Index in Marion Center?
Inequality or Gini Index in Marion Center is 0.64.
What is the Total Population of Marion Center?
Total Population of Marion Center is 980.
What is the Total Male Population of Marion Center?
Total Male Population of Marion Center is 489.
What is the Total Female Population of Marion Center?
Total Female Population of Marion Center is 491.
What is the Ratio of Males per 100 Females in Marion Center?
There are 99.59 Males per 100 Females in Marion Center.
What is the Ratio of Females per 100 Males in Marion Center?
There are 100.41 Females per 100 Males in Marion Center.
What is the Median Population Age in Marion Center?
Median Population Age in Marion Center is 49.7 Years.
What is the Average Family Size in Marion Center
Average Family Size in Marion Center is 2.7 People.
What is the Average Household Size in Marion Center
Average Household Size in Marion Center is 2.2 People.
How Large is the Labor Force in Marion Center?
There are 422 People in the Labor Forcein in Marion Center.
What is the Percentage of People in the Labor Force in Marion Center?
47.2% of People are in the Labor Force in Marion Center.
What is the Unemployment Rate in Marion Center?
Unemployment Rate in Marion Center is 8.1%.