Quincy, MA Map & Demographics
Quincy Map
Quincy Overview
$50,115
PER CAPITA INCOME
$110,424
AVG FAMILY INCOME
$90,668
AVG HOUSEHOLD INCOME
15.6%
WAGE / INCOME GAP [ % ]
84.4¢/ $1
WAGE / INCOME GAP [ $ ]
$9,734
FAMILY INCOME DEFICIT
0.44
INEQUALITY / GINI INDEX
100,981
TOTAL POPULATION
51,002
MALE POPULATION
49,979
FEMALE POPULATION
102.05
MALES / 100 FEMALES
97.99
FEMALES / 100 MALES
38.3
MEDIAN AGE
3.0
AVG FAMILY SIZE
2.2
AVG HOUSEHOLD SIZE
61,873
LABOR FORCE [ PEOPLE ]
70.7%
PERCENT IN LABOR FORCE
6.7%
UNEMPLOYMENT RATE
Income in Quincy
Income Overview in Quincy
Per Capita Income in Quincy is $50,115, while median incomes of families and households are $110,424 and $90,668 respectively.
| Characteristic | Number | Measure |
| Per Capita Income | 100,981 | $50,115 |
| Median Family Income | 23,134 | $110,424 |
| Mean Family Income | 23,134 | $135,875 |
| Median Household Income | 44,956 | $90,668 |
| Mean Household Income | 44,956 | $113,386 |
| Income Deficit | 23,134 | $9,734 |
| Wage / Income Gap (%) | 100,981 | 15.59% |
| Wage / Income Gap ($) | 100,981 | 84.41¢ per $1 |
| Gini / Inequality Index | 100,981 | 0.44 |
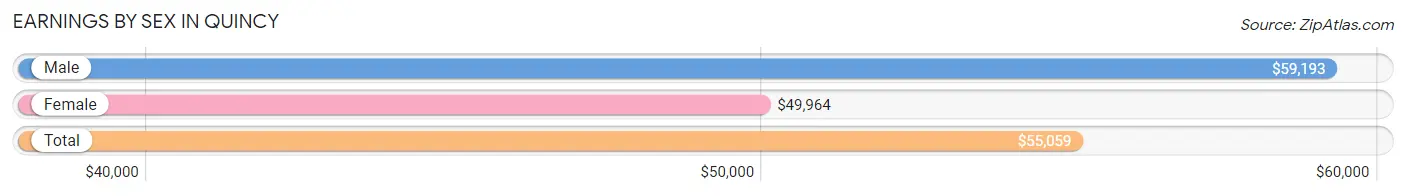
Earnings by Sex in Quincy
Average Earnings in Quincy are $55,059, $59,193 for men and $49,964 for women, a difference of 15.6%.
| Sex | Number | Average Earnings |
| Male | 32,591 (52.2%) | $59,193 |
| Female | 29,787 (47.7%) | $49,964 |
| Total | 62,378 (100.0%) | $55,059 |
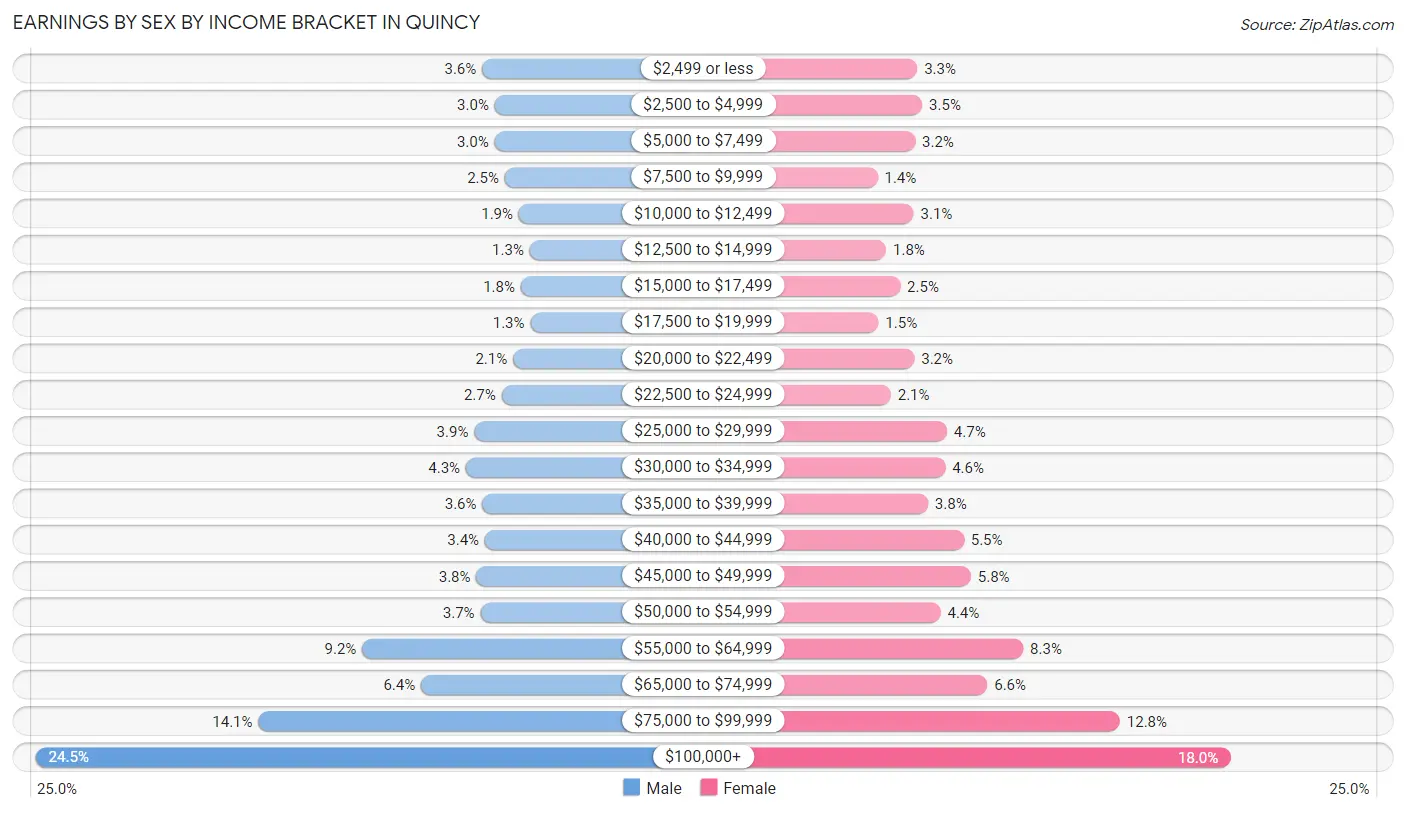
Earnings by Sex by Income Bracket in Quincy
The most common earnings brackets in Quincy are $100,000+ for men (7,979 | 24.5%) and $100,000+ for women (5,346 | 17.9%).
| Income | Male | Female |
| $2,499 or less | 1,162 (3.6%) | 982 (3.3%) |
| $2,500 to $4,999 | 971 (3.0%) | 1,050 (3.5%) |
| $5,000 to $7,499 | 973 (3.0%) | 954 (3.2%) |
| $7,500 to $9,999 | 819 (2.5%) | 430 (1.4%) |
| $10,000 to $12,499 | 604 (1.8%) | 931 (3.1%) |
| $12,500 to $14,999 | 437 (1.3%) | 549 (1.8%) |
| $15,000 to $17,499 | 575 (1.8%) | 745 (2.5%) |
| $17,500 to $19,999 | 427 (1.3%) | 442 (1.5%) |
| $20,000 to $22,499 | 691 (2.1%) | 942 (3.2%) |
| $22,500 to $24,999 | 868 (2.7%) | 613 (2.1%) |
| $25,000 to $29,999 | 1,283 (3.9%) | 1,397 (4.7%) |
| $30,000 to $34,999 | 1,412 (4.3%) | 1,373 (4.6%) |
| $35,000 to $39,999 | 1,159 (3.6%) | 1,133 (3.8%) |
| $40,000 to $44,999 | 1,121 (3.4%) | 1,631 (5.5%) |
| $45,000 to $49,999 | 1,253 (3.8%) | 1,732 (5.8%) |
| $50,000 to $54,999 | 1,188 (3.6%) | 1,308 (4.4%) |
| $55,000 to $64,999 | 2,995 (9.2%) | 2,459 (8.3%) |
| $65,000 to $74,999 | 2,094 (6.4%) | 1,961 (6.6%) |
| $75,000 to $99,999 | 4,580 (14.1%) | 3,809 (12.8%) |
| $100,000+ | 7,979 (24.5%) | 5,346 (17.9%) |
| Total | 32,591 (100.0%) | 29,787 (100.0%) |
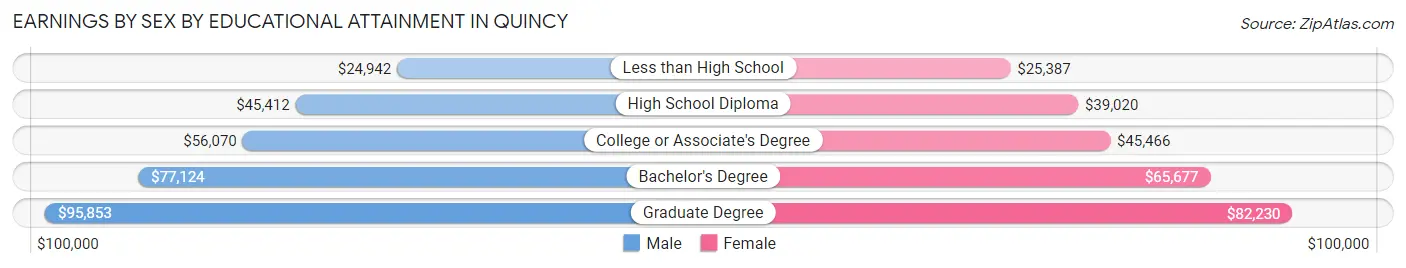
Earnings by Sex by Educational Attainment in Quincy
Average earnings in Quincy are $63,219 for men and $54,851 for women, a difference of 13.2%. Men with an educational attainment of graduate degree enjoy the highest average annual earnings of $95,853, while those with less than high school education earn the least with $24,942. Women with an educational attainment of graduate degree earn the most with the average annual earnings of $82,230, while those with less than high school education have the smallest earnings of $25,387.
| Educational Attainment | Male Income | Female Income |
| Less than High School | $24,942 | $25,387 |
| High School Diploma | $45,412 | $39,020 |
| College or Associate's Degree | $56,070 | $45,466 |
| Bachelor's Degree | $77,124 | $65,677 |
| Graduate Degree | $95,853 | $82,230 |
| Total | $63,219 | $54,851 |
Family Income in Quincy
Family Income Brackets in Quincy
According to the Quincy family income data, there are 4,974 families falling into the $100,000 to $149,999 income range, which is the most common income bracket and makes up 21.5% of all families. Conversely, the $10,000 to $14,999 income bracket is the least frequent group with only 416 families (1.8%) belonging to this category.
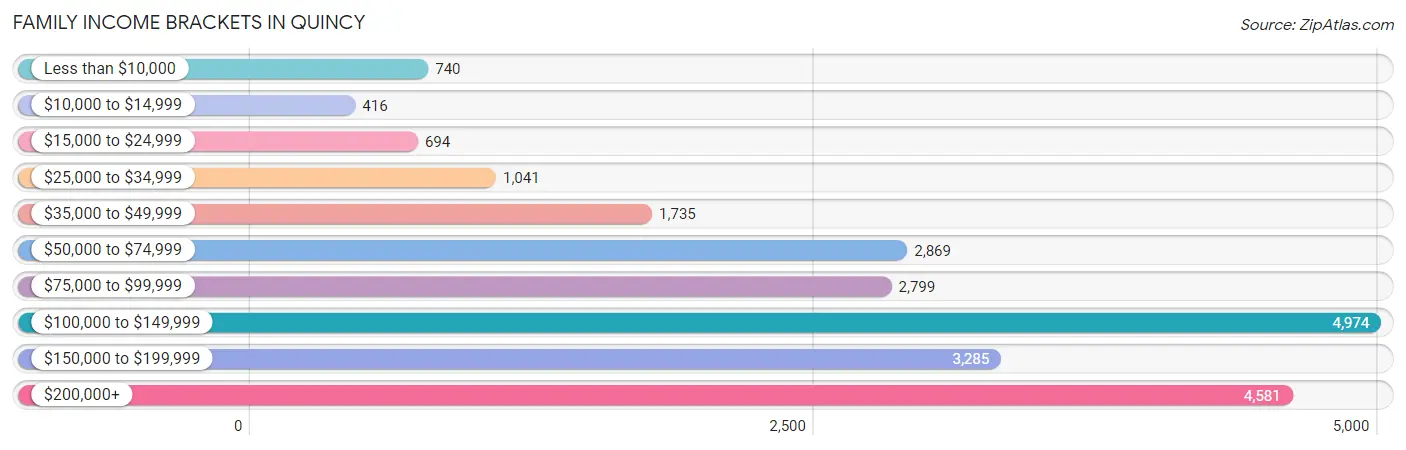
| Income Bracket | # Families | % Families |
| Less than $10,000 | 740 | 3.2% |
| $10,000 to $14,999 | 416 | 1.8% |
| $15,000 to $24,999 | 694 | 3.0% |
| $25,000 to $34,999 | 1,041 | 4.5% |
| $35,000 to $49,999 | 1,735 | 7.5% |
| $50,000 to $74,999 | 2,869 | 12.4% |
| $75,000 to $99,999 | 2,799 | 12.1% |
| $100,000 to $149,999 | 4,974 | 21.5% |
| $150,000 to $199,999 | 3,285 | 14.2% |
| $200,000+ | 4,581 | 19.8% |
Family Income by Famaliy Size in Quincy
7+ person families (398 | 1.7%) account for the highest median family income in Quincy with $172,708 per family, while 2-person families (10,357 | 44.8%) have the highest median income of $48,528 per family member.
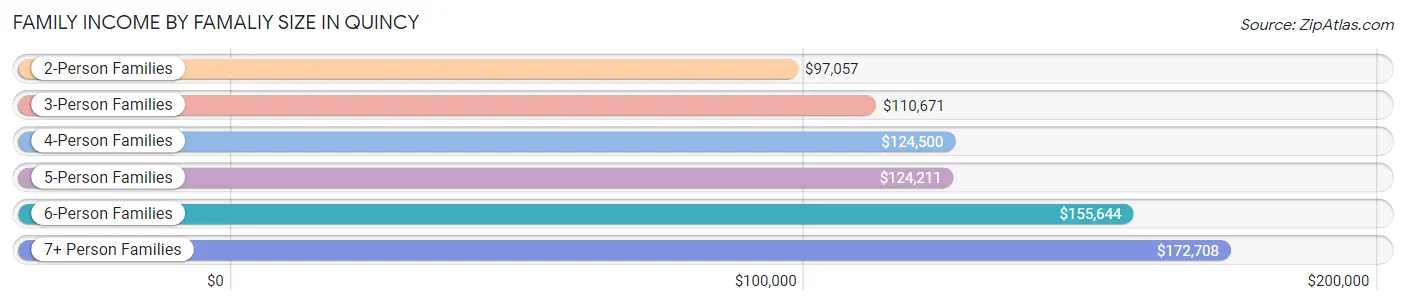
| Income Bracket | # Families | Median Income |
| 2-Person Families | 10,357 (44.8%) | $97,057 |
| 3-Person Families | 6,018 (26.0%) | $110,671 |
| 4-Person Families | 4,404 (19.0%) | $124,500 |
| 5-Person Families | 1,404 (6.1%) | $124,211 |
| 6-Person Families | 553 (2.4%) | $155,644 |
| 7+ Person Families | 398 (1.7%) | $172,708 |
| Total | 23,134 (100.0%) | $110,424 |
Family Income by Number of Earners in Quincy
The median family income in Quincy is $110,424, with families comprising 3+ earners (3,188) having the highest median family income of $170,667, while families with no earners (2,759) have the lowest median family income of $45,494, accounting for 13.8% and 11.9% of families, respectively.
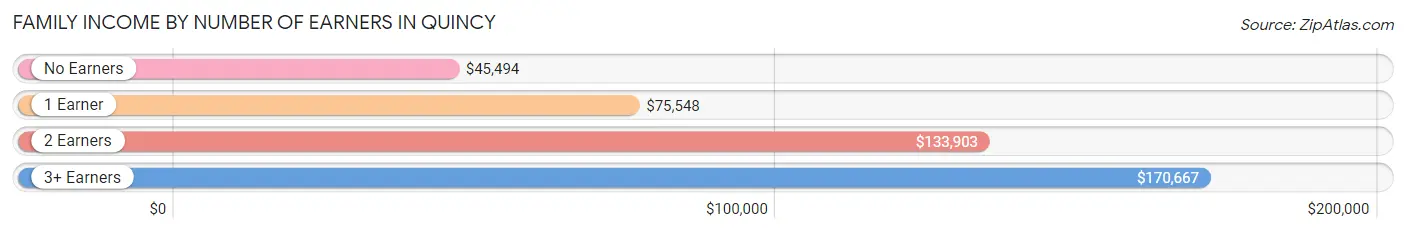
| Number of Earners | # Families | Median Income |
| No Earners | 2,759 (11.9%) | $45,494 |
| 1 Earner | 6,036 (26.1%) | $75,548 |
| 2 Earners | 11,151 (48.2%) | $133,903 |
| 3+ Earners | 3,188 (13.8%) | $170,667 |
| Total | 23,134 (100.0%) | $110,424 |
Household Income in Quincy
Household Income Brackets in Quincy
With 8,856 households falling in the category, the $100,000 to $149,999 income range is the most frequent in Quincy, accounting for 19.7% of all households. In contrast, only 1,529 households (3.4%) fall into the $10,000 to $14,999 income bracket, making it the least populous group.
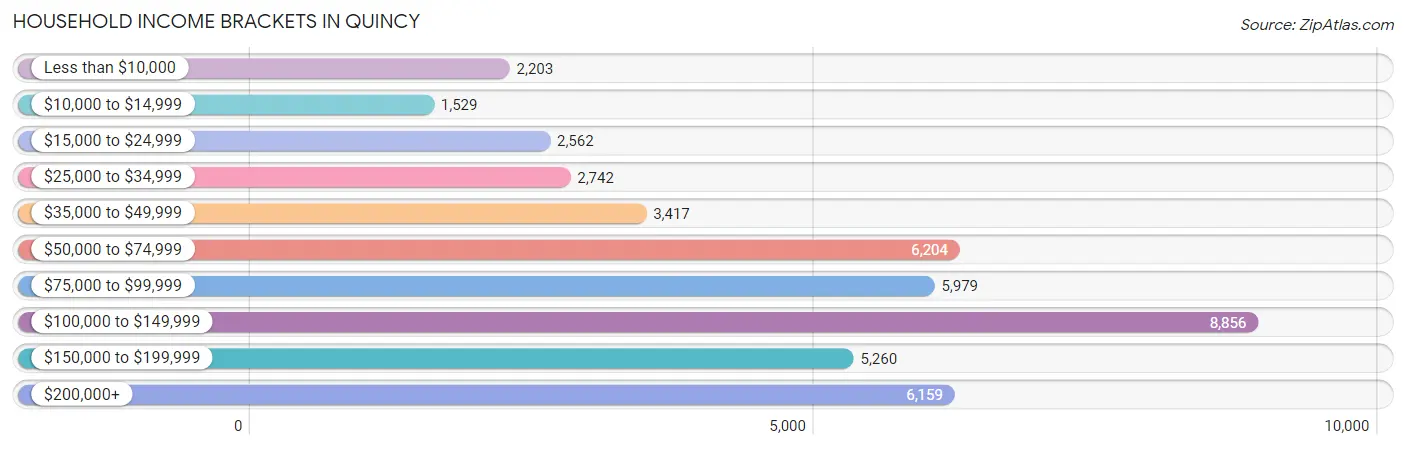
| Income Bracket | # Households | % Households |
| Less than $10,000 | 2,203 | 4.9% |
| $10,000 to $14,999 | 1,529 | 3.4% |
| $15,000 to $24,999 | 2,562 | 5.7% |
| $25,000 to $34,999 | 2,742 | 6.1% |
| $35,000 to $49,999 | 3,417 | 7.6% |
| $50,000 to $74,999 | 6,204 | 13.8% |
| $75,000 to $99,999 | 5,979 | 13.3% |
| $100,000 to $149,999 | 8,856 | 19.7% |
| $150,000 to $199,999 | 5,260 | 11.7% |
| $200,000+ | 6,159 | 13.7% |
Household Income by Householder Age in Quincy
The median household income in Quincy is $90,668, with the highest median household income of $109,821 found in the 25 to 44 years age bracket for the primary householder. A total of 18,436 households (41.0%) fall into this category. Meanwhile, the 65+ years age bracket for the primary householder has the lowest median household income of $47,780, with 10,749 households (23.9%) in this group.
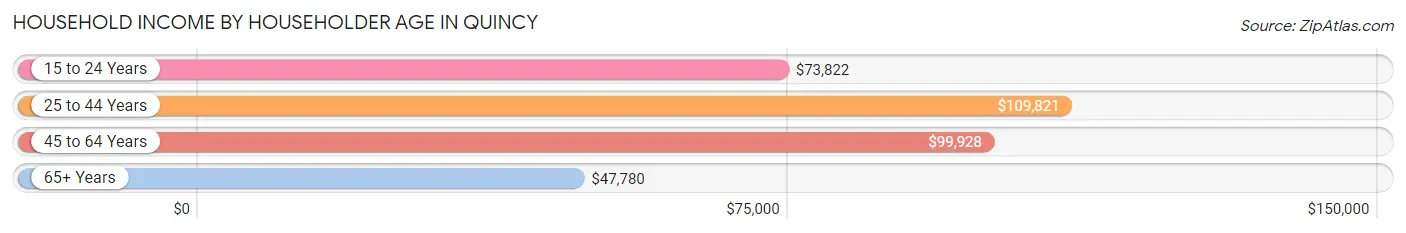
| Income Bracket | # Households | Median Income |
| 15 to 24 Years | 1,410 (3.1%) | $73,822 |
| 25 to 44 Years | 18,436 (41.0%) | $109,821 |
| 45 to 64 Years | 14,361 (31.9%) | $99,928 |
| 65+ Years | 10,749 (23.9%) | $47,780 |
| Total | 44,956 (100.0%) | $90,668 |
Poverty in Quincy
Income Below Poverty by Sex and Age in Quincy
With 11.0% poverty level for males and 11.3% for females among the residents of Quincy, 15 year old males and 16 and 17 year old females are the most vulnerable to poverty, with 174 males (46.9%) and 231 females (27.5%) in their respective age groups living below the poverty level.
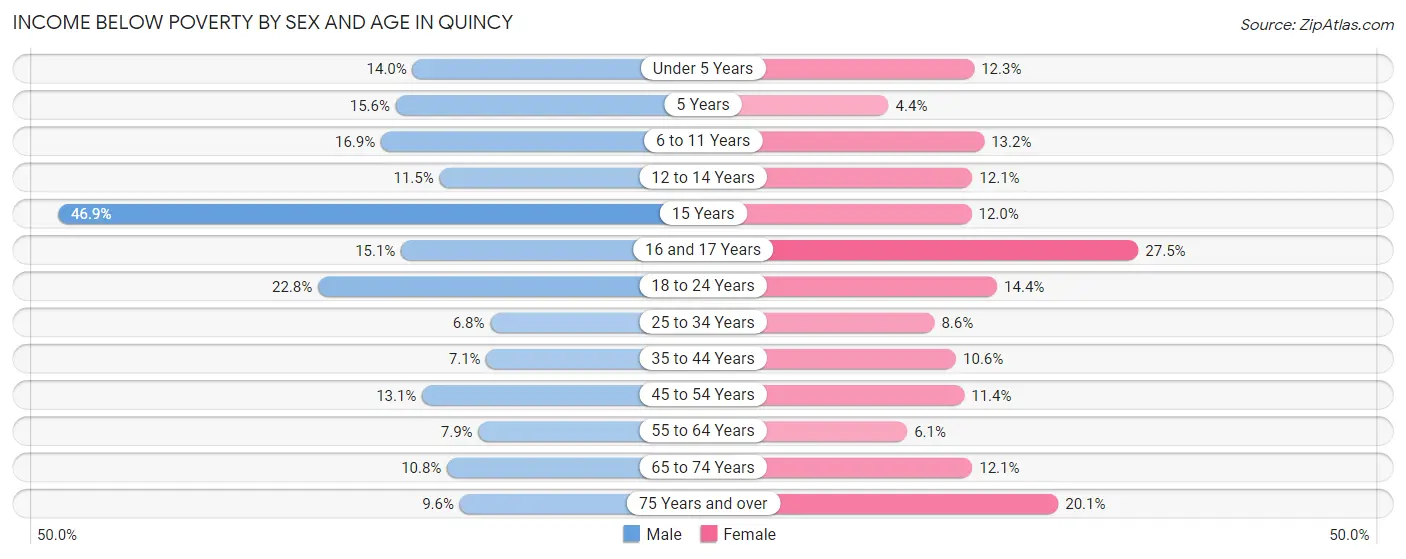
| Age Bracket | Male | Female |
| Under 5 Years | 394 (14.0%) | 273 (12.3%) |
| 5 Years | 58 (15.5%) | 15 (4.3%) |
| 6 to 11 Years | 430 (16.9%) | 293 (13.2%) |
| 12 to 14 Years | 150 (11.5%) | 121 (12.1%) |
| 15 Years | 174 (46.9%) | 23 (12.0%) |
| 16 and 17 Years | 126 (15.0%) | 231 (27.5%) |
| 18 to 24 Years | 892 (22.8%) | 504 (14.4%) |
| 25 to 34 Years | 748 (6.8%) | 906 (8.6%) |
| 35 to 44 Years | 533 (7.1%) | 800 (10.6%) |
| 45 to 54 Years | 785 (13.1%) | 626 (11.4%) |
| 55 to 64 Years | 496 (7.9%) | 405 (6.1%) |
| 65 to 74 Years | 530 (10.8%) | 585 (12.1%) |
| 75 Years and over | 263 (9.6%) | 812 (20.1%) |
| Total | 5,579 (11.0%) | 5,594 (11.3%) |
Income Above Poverty by Sex and Age in Quincy
According to the poverty statistics in Quincy, males aged 25 to 34 years and females aged 5 years are the age groups that are most secure financially, with 93.2% of males and 95.7% of females in these age groups living above the poverty line.
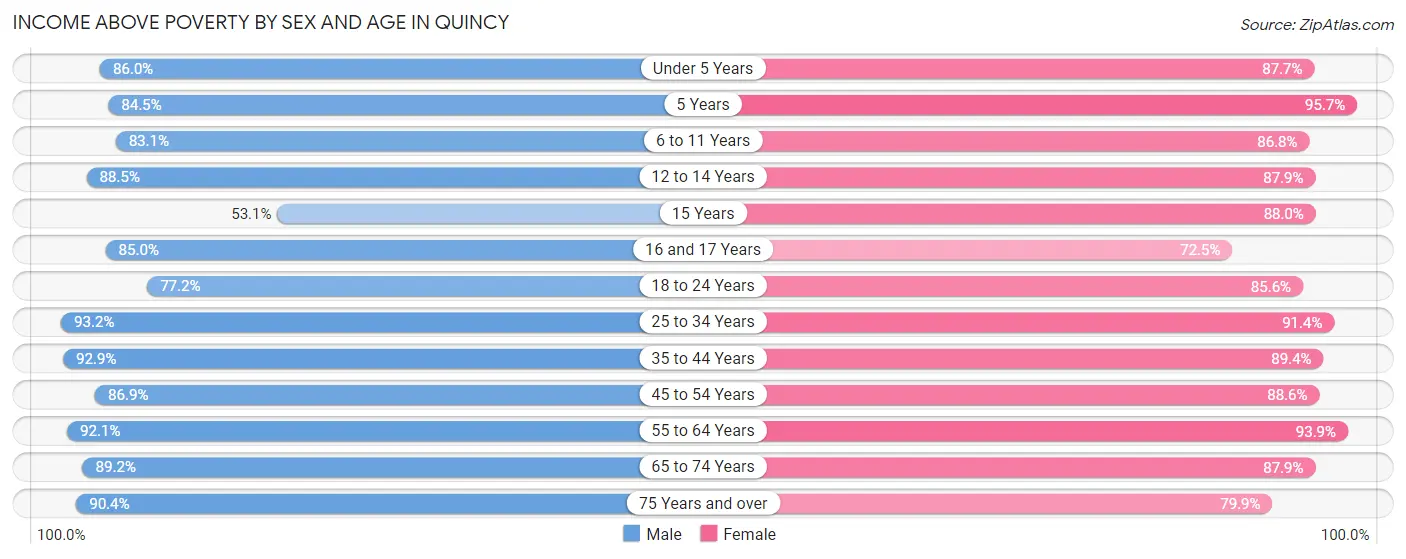
| Age Bracket | Male | Female |
| Under 5 Years | 2,422 (86.0%) | 1,949 (87.7%) |
| 5 Years | 315 (84.5%) | 330 (95.7%) |
| 6 to 11 Years | 2,112 (83.1%) | 1,923 (86.8%) |
| 12 to 14 Years | 1,156 (88.5%) | 877 (87.9%) |
| 15 Years | 197 (53.1%) | 168 (88.0%) |
| 16 and 17 Years | 711 (85.0%) | 608 (72.5%) |
| 18 to 24 Years | 3,026 (77.2%) | 2,991 (85.6%) |
| 25 to 34 Years | 10,282 (93.2%) | 9,631 (91.4%) |
| 35 to 44 Years | 6,933 (92.9%) | 6,740 (89.4%) |
| 45 to 54 Years | 5,206 (86.9%) | 4,881 (88.6%) |
| 55 to 64 Years | 5,800 (92.1%) | 6,270 (93.9%) |
| 65 to 74 Years | 4,388 (89.2%) | 4,244 (87.9%) |
| 75 Years and over | 2,475 (90.4%) | 3,230 (79.9%) |
| Total | 45,023 (89.0%) | 43,842 (88.7%) |
Income Below Poverty Among Married-Couple Families in Quincy
The poverty statistics for married-couple families in Quincy show that 5.8% or 1,008 of the total 17,358 families live below the poverty line. Families with 3 or 4 children have the highest poverty rate of 17.9%, comprising of 124 families. On the other hand, families with 5 or more children have the lowest poverty rate of 0.0%, which includes 0 families.
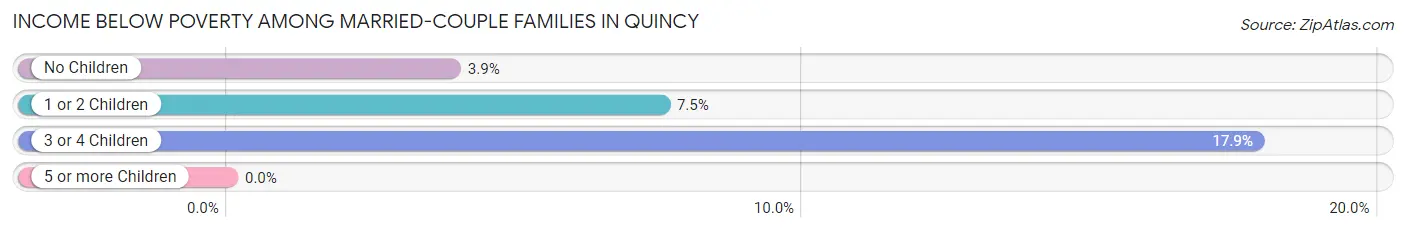
| Children | Above Poverty | Below Poverty |
| No Children | 9,699 (96.1%) | 392 (3.9%) |
| 1 or 2 Children | 6,049 (92.5%) | 492 (7.5%) |
| 3 or 4 Children | 570 (82.1%) | 124 (17.9%) |
| 5 or more Children | 32 (100.0%) | 0 (0.0%) |
| Total | 16,350 (94.2%) | 1,008 (5.8%) |
Income Below Poverty Among Single-Parent Households in Quincy
According to the poverty data in Quincy, 17.5% or 341 single-father households and 18.4% or 704 single-mother households are living below the poverty line. Among single-father households, those with 3 or 4 children have the highest poverty rate, with 14 households (100.0%) experiencing poverty. Likewise, among single-mother households, those with 3 or 4 children have the highest poverty rate, with 89 households (66.4%) falling below the poverty line.
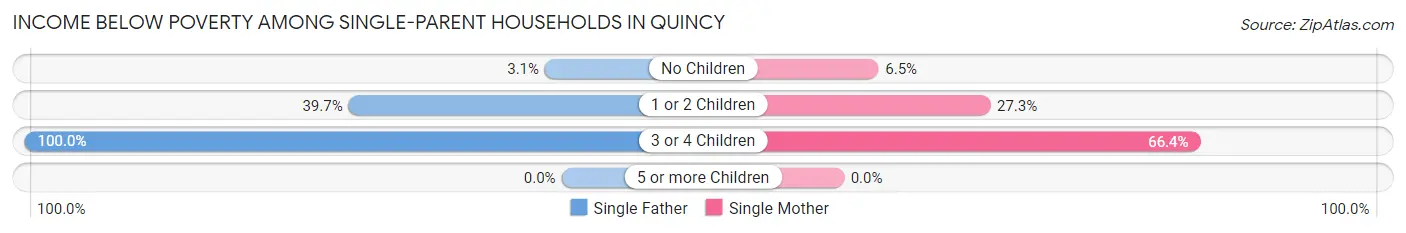
| Children | Single Father | Single Mother |
| No Children | 37 (3.1%) | 122 (6.5%) |
| 1 or 2 Children | 290 (39.7%) | 493 (27.3%) |
| 3 or 4 Children | 14 (100.0%) | 89 (66.4%) |
| 5 or more Children | 0 (0.0%) | 0 (0.0%) |
| Total | 341 (17.5%) | 704 (18.4%) |
Income Below Poverty Among Married-Couple vs Single-Parent Households in Quincy
The poverty data for Quincy shows that 1,008 of the married-couple family households (5.8%) and 1,045 of the single-parent households (18.1%) are living below the poverty level. Within the married-couple family households, those with 3 or 4 children have the highest poverty rate, with 124 households (17.9%) falling below the poverty line. Among the single-parent households, those with 3 or 4 children have the highest poverty rate, with 103 household (69.6%) living below poverty.
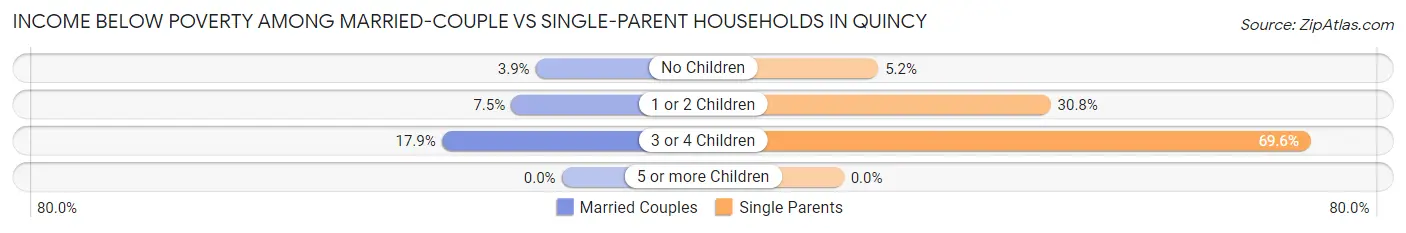
| Children | Married-Couple Families | Single-Parent Households |
| No Children | 392 (3.9%) | 159 (5.1%) |
| 1 or 2 Children | 492 (7.5%) | 783 (30.8%) |
| 3 or 4 Children | 124 (17.9%) | 103 (69.6%) |
| 5 or more Children | 0 (0.0%) | 0 (0.0%) |
| Total | 1,008 (5.8%) | 1,045 (18.1%) |
Race in Quincy
The most populous races in Quincy are White / Caucasian (58,126 | 57.6%), Asian (29,193 | 28.9%), and Black / African American (6,464 | 6.4%).
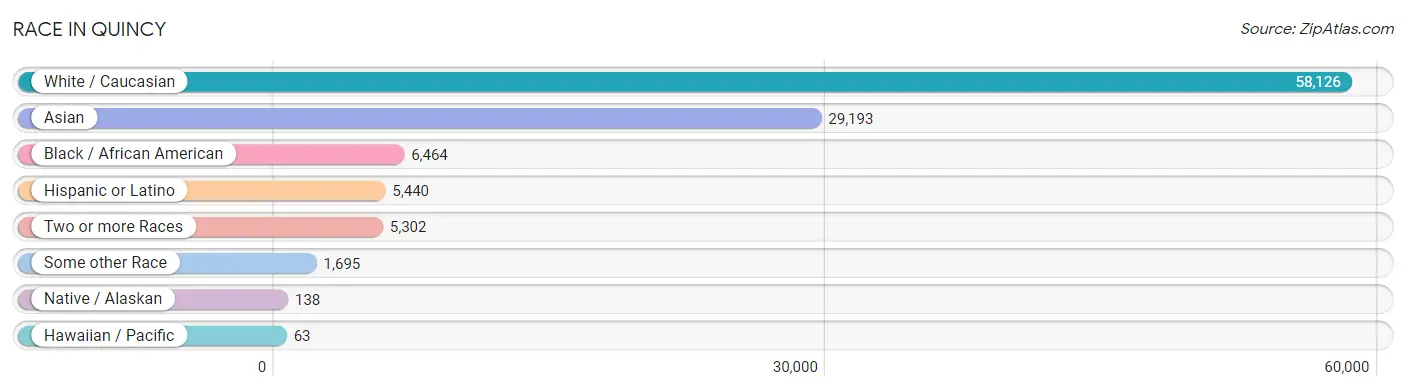
| Race | # Population | % Population |
| Asian | 29,193 | 28.9% |
| Black / African American | 6,464 | 6.4% |
| Hawaiian / Pacific | 63 | 0.1% |
| Hispanic or Latino | 5,440 | 5.4% |
| Native / Alaskan | 138 | 0.1% |
| White / Caucasian | 58,126 | 57.6% |
| Two or more Races | 5,302 | 5.2% |
| Some other Race | 1,695 | 1.7% |
| Total | 100,981 | 100.0% |
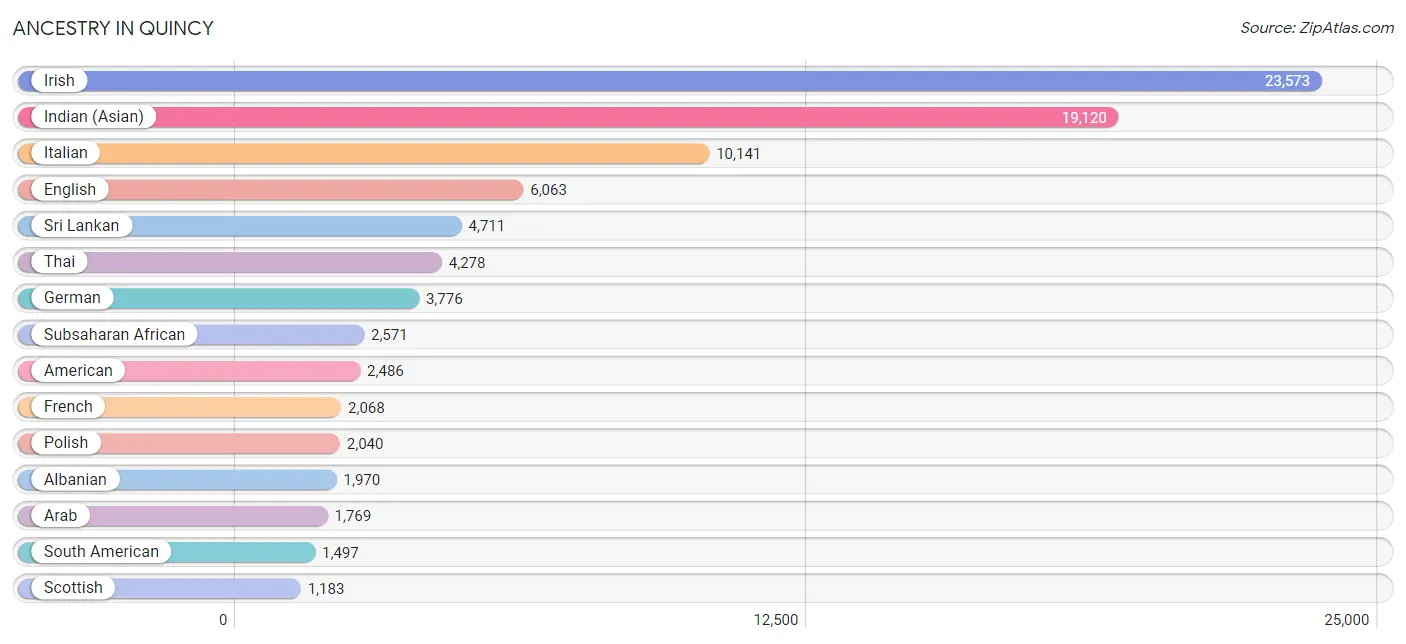
Ancestry in Quincy
The most populous ancestries reported in Quincy are Irish (23,573 | 23.3%), Indian (Asian) (19,120 | 18.9%), Italian (10,141 | 10.0%), English (6,063 | 6.0%), and Sri Lankan (4,711 | 4.7%), together accounting for 63.0% of all Quincy residents.
| Ancestry | # Population | % Population |
| African | 933 | 0.9% |
| Albanian | 1,970 | 1.9% |
| Alsatian | 10 | 0.0% |
| American | 2,486 | 2.5% |
| Arab | 1,769 | 1.8% |
| Argentinean | 34 | 0.0% |
| Armenian | 157 | 0.2% |
| Austrian | 100 | 0.1% |
| Bahamian | 54 | 0.1% |
| Bangladeshi | 51 | 0.1% |
| Barbadian | 44 | 0.0% |
| Belgian | 95 | 0.1% |
| Bhutanese | 340 | 0.3% |
| Blackfeet | 18 | 0.0% |
| Bolivian | 72 | 0.1% |
| Brazilian | 918 | 0.9% |
| British | 285 | 0.3% |
| British West Indian | 34 | 0.0% |
| Bulgarian | 40 | 0.0% |
| Burmese | 302 | 0.3% |
| Cambodian | 37 | 0.0% |
| Canadian | 397 | 0.4% |
| Cape Verdean | 672 | 0.7% |
| Central American | 740 | 0.7% |
| Central American Indian | 18 | 0.0% |
| Cherokee | 43 | 0.0% |
| Chilean | 52 | 0.1% |
| Chippewa | 5 | 0.0% |
| Colombian | 321 | 0.3% |
| Costa Rican | 113 | 0.1% |
| Croatian | 46 | 0.1% |
| Cuban | 115 | 0.1% |
| Czech | 278 | 0.3% |
| Czechoslovakian | 43 | 0.0% |
| Danish | 163 | 0.2% |
| Dominican | 766 | 0.8% |
| Dutch | 315 | 0.3% |
| Eastern European | 175 | 0.2% |
| Ecuadorian | 144 | 0.1% |
| Egyptian | 357 | 0.4% |
| English | 6,063 | 6.0% |
| Ethiopian | 58 | 0.1% |
| European | 778 | 0.8% |
| Filipino | 47 | 0.1% |
| Finnish | 261 | 0.3% |
| French | 2,068 | 2.1% |
| French Canadian | 1,138 | 1.1% |
| German | 3,776 | 3.7% |
| Ghanaian | 44 | 0.0% |
| Greek | 815 | 0.8% |
| Guamanian / Chamorro | 42 | 0.0% |
| Guatemalan | 318 | 0.3% |
| Guyanese | 25 | 0.0% |
| Haitian | 601 | 0.6% |
| Honduran | 184 | 0.2% |
| Hungarian | 113 | 0.1% |
| Indian (Asian) | 19,120 | 18.9% |
| Indonesian | 165 | 0.2% |
| Iranian | 146 | 0.1% |
| Iraqi | 22 | 0.0% |
| Irish | 23,573 | 23.3% |
| Iroquois | 31 | 0.0% |
| Israeli | 95 | 0.1% |
| Italian | 10,141 | 10.0% |
| Jamaican | 262 | 0.3% |
| Japanese | 72 | 0.1% |
| Jordanian | 14 | 0.0% |
| Kenyan | 96 | 0.1% |
| Korean | 1,083 | 1.1% |
| Laotian | 64 | 0.1% |
| Latvian | 57 | 0.1% |
| Lebanese | 496 | 0.5% |
| Lithuanian | 459 | 0.4% |
| Macedonian | 80 | 0.1% |
| Malaysian | 6 | 0.0% |
| Maltese | 10 | 0.0% |
| Mexican | 359 | 0.4% |
| Mexican American Indian | 44 | 0.0% |
| Moroccan | 354 | 0.4% |
| Native Hawaiian | 78 | 0.1% |
| New Zealander | 11 | 0.0% |
| Nicaraguan | 28 | 0.0% |
| Nigerian | 703 | 0.7% |
| Northern European | 21 | 0.0% |
| Norwegian | 573 | 0.6% |
| Paiute | 12 | 0.0% |
| Pakistani | 209 | 0.2% |
| Palestinian | 16 | 0.0% |
| Paraguayan | 9 | 0.0% |
| Pennsylvania German | 7 | 0.0% |
| Peruvian | 704 | 0.7% |
| Polish | 2,040 | 2.0% |
| Portuguese | 913 | 0.9% |
| Puerto Rican | 904 | 0.9% |
| Romanian | 68 | 0.1% |
| Russian | 728 | 0.7% |
| Salvadoran | 97 | 0.1% |
| Scandinavian | 33 | 0.0% |
| Scotch-Irish | 453 | 0.4% |
| Scottish | 1,183 | 1.2% |
| Serbian | 21 | 0.0% |
| Sioux | 26 | 0.0% |
| Slovak | 68 | 0.1% |
| South American | 1,497 | 1.5% |
| Spaniard | 386 | 0.4% |
| Spanish | 121 | 0.1% |
| Sri Lankan | 4,711 | 4.7% |
| Subsaharan African | 2,571 | 2.5% |
| Sudanese | 15 | 0.0% |
| Swedish | 1,159 | 1.1% |
| Swiss | 162 | 0.2% |
| Syrian | 27 | 0.0% |
| Thai | 4,278 | 4.2% |
| Tongan | 48 | 0.1% |
| Trinidadian and Tobagonian | 263 | 0.3% |
| Turkish | 200 | 0.2% |
| Ugandan | 50 | 0.1% |
| Ukrainian | 194 | 0.2% |
| Uruguayan | 12 | 0.0% |
| Venezuelan | 149 | 0.2% |
| Vietnamese | 56 | 0.1% |
| Welsh | 144 | 0.1% |
| West Indian | 74 | 0.1% | View All 123 Rows |
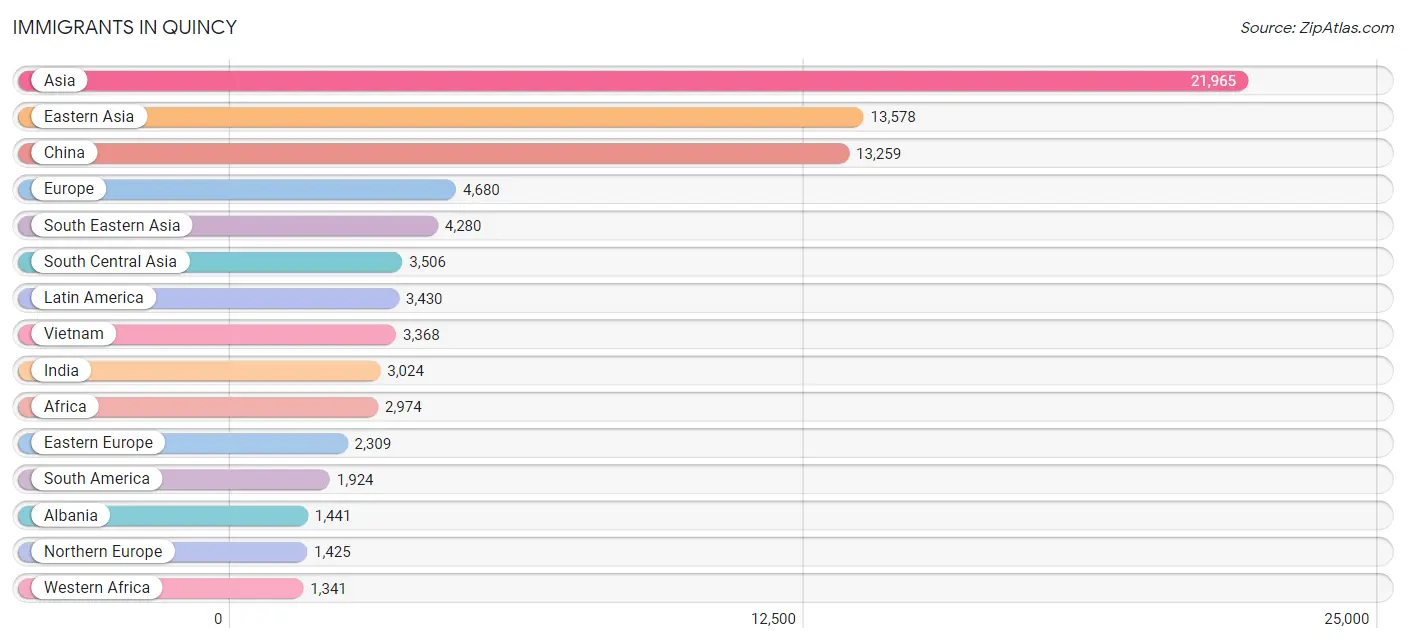
Immigrants in Quincy
The most numerous immigrant groups reported in Quincy came from Asia (21,965 | 21.7%), Eastern Asia (13,578 | 13.5%), China (13,259 | 13.1%), Europe (4,680 | 4.6%), and South Eastern Asia (4,280 | 4.2%), together accounting for 57.2% of all Quincy residents.
| Immigration Origin | # Population | % Population |
| Africa | 2,974 | 2.9% |
| Albania | 1,441 | 1.4% |
| Argentina | 34 | 0.0% |
| Armenia | 17 | 0.0% |
| Asia | 21,965 | 21.7% |
| Bangladesh | 158 | 0.2% |
| Barbados | 23 | 0.0% |
| Bosnia and Herzegovina | 28 | 0.0% |
| Brazil | 989 | 1.0% |
| Bulgaria | 20 | 0.0% |
| Cabo Verde | 777 | 0.8% |
| Cambodia | 28 | 0.0% |
| Canada | 262 | 0.3% |
| Caribbean | 1,141 | 1.1% |
| Central America | 365 | 0.4% |
| Chile | 91 | 0.1% |
| China | 13,259 | 13.1% |
| Colombia | 223 | 0.2% |
| Costa Rica | 153 | 0.2% |
| Cuba | 55 | 0.1% |
| Czechoslovakia | 126 | 0.1% |
| Dominica | 12 | 0.0% |
| Dominican Republic | 292 | 0.3% |
| Eastern Africa | 120 | 0.1% |
| Eastern Asia | 13,578 | 13.5% |
| Eastern Europe | 2,309 | 2.3% |
| Ecuador | 110 | 0.1% |
| Egypt | 431 | 0.4% |
| El Salvador | 23 | 0.0% |
| England | 225 | 0.2% |
| Ethiopia | 43 | 0.0% |
| Europe | 4,680 | 4.6% |
| France | 78 | 0.1% |
| Germany | 167 | 0.2% |
| Ghana | 121 | 0.1% |
| Greece | 107 | 0.1% |
| Guatemala | 66 | 0.1% |
| Haiti | 430 | 0.4% |
| Honduras | 40 | 0.0% |
| Hong Kong | 1,112 | 1.1% |
| India | 3,024 | 3.0% |
| Indonesia | 65 | 0.1% |
| Iran | 71 | 0.1% |
| Iraq | 110 | 0.1% |
| Ireland | 1,090 | 1.1% |
| Israel | 15 | 0.0% |
| Italy | 176 | 0.2% |
| Jamaica | 152 | 0.2% |
| Japan | 118 | 0.1% |
| Jordan | 53 | 0.1% |
| Kenya | 65 | 0.1% |
| Korea | 164 | 0.2% |
| Kuwait | 107 | 0.1% |
| Laos | 6 | 0.0% |
| Latin America | 3,430 | 3.4% |
| Latvia | 25 | 0.0% |
| Lebanon | 89 | 0.1% |
| Lithuania | 9 | 0.0% |
| Malaysia | 48 | 0.1% |
| Mexico | 83 | 0.1% |
| Middle Africa | 40 | 0.0% |
| Moldova | 29 | 0.0% |
| Morocco | 780 | 0.8% |
| Nepal | 109 | 0.1% |
| Nigeria | 416 | 0.4% |
| North Macedonia | 10 | 0.0% |
| Northern Africa | 1,237 | 1.2% |
| Northern Europe | 1,425 | 1.4% |
| Oceania | 48 | 0.1% |
| Pakistan | 136 | 0.1% |
| Peru | 244 | 0.2% |
| Philippines | 518 | 0.5% |
| Poland | 108 | 0.1% |
| Portugal | 64 | 0.1% |
| Romania | 30 | 0.0% |
| Russia | 258 | 0.3% |
| Scotland | 25 | 0.0% |
| Senegal | 27 | 0.0% |
| Serbia | 21 | 0.0% |
| Singapore | 23 | 0.0% |
| South Africa | 89 | 0.1% |
| South America | 1,924 | 1.9% |
| South Central Asia | 3,506 | 3.5% |
| South Eastern Asia | 4,280 | 4.2% |
| Southern Europe | 621 | 0.6% |
| Spain | 274 | 0.3% |
| Sudan | 15 | 0.0% |
| Sweden | 13 | 0.0% |
| Switzerland | 69 | 0.1% |
| Taiwan | 63 | 0.1% |
| Thailand | 106 | 0.1% |
| Trinidad and Tobago | 177 | 0.2% |
| Turkey | 160 | 0.2% |
| Uganda | 12 | 0.0% |
| Ukraine | 63 | 0.1% |
| Uruguay | 12 | 0.0% |
| Uzbekistan | 8 | 0.0% |
| Venezuela | 214 | 0.2% |
| Vietnam | 3,368 | 3.3% |
| Western Africa | 1,341 | 1.3% |
| Western Asia | 601 | 0.6% |
| Western Europe | 325 | 0.3% | View All 102 Rows |
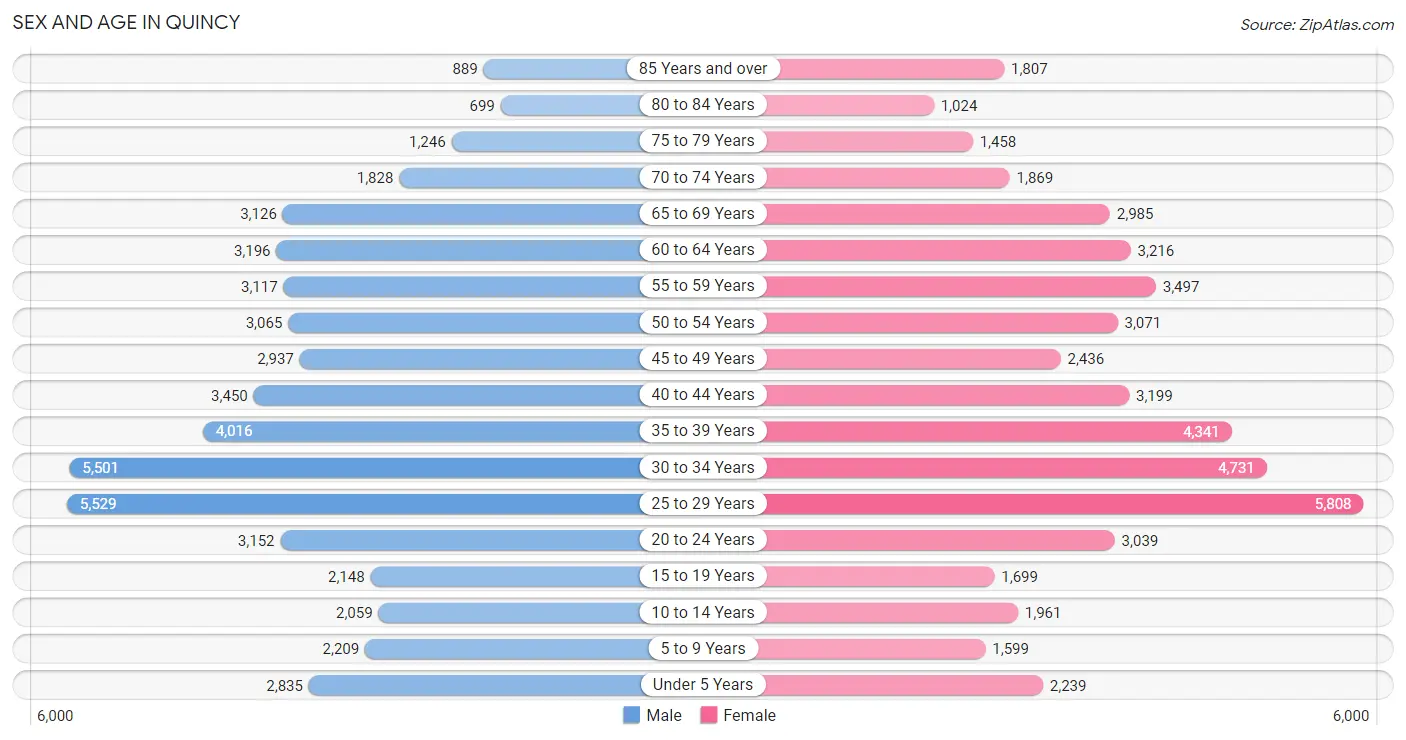
Sex and Age in Quincy
Sex and Age in Quincy
The most populous age groups in Quincy are 25 to 29 Years (5,529 | 10.8%) for men and 25 to 29 Years (5,808 | 11.6%) for women.
| Age Bracket | Male | Female |
| Under 5 Years | 2,835 (5.6%) | 2,239 (4.5%) |
| 5 to 9 Years | 2,209 (4.3%) | 1,599 (3.2%) |
| 10 to 14 Years | 2,059 (4.0%) | 1,961 (3.9%) |
| 15 to 19 Years | 2,148 (4.2%) | 1,699 (3.4%) |
| 20 to 24 Years | 3,152 (6.2%) | 3,039 (6.1%) |
| 25 to 29 Years | 5,529 (10.8%) | 5,808 (11.6%) |
| 30 to 34 Years | 5,501 (10.8%) | 4,731 (9.5%) |
| 35 to 39 Years | 4,016 (7.9%) | 4,341 (8.7%) |
| 40 to 44 Years | 3,450 (6.8%) | 3,199 (6.4%) |
| 45 to 49 Years | 2,937 (5.8%) | 2,436 (4.9%) |
| 50 to 54 Years | 3,065 (6.0%) | 3,071 (6.1%) |
| 55 to 59 Years | 3,117 (6.1%) | 3,497 (7.0%) |
| 60 to 64 Years | 3,196 (6.3%) | 3,216 (6.4%) |
| 65 to 69 Years | 3,126 (6.1%) | 2,985 (6.0%) |
| 70 to 74 Years | 1,828 (3.6%) | 1,869 (3.7%) |
| 75 to 79 Years | 1,246 (2.4%) | 1,458 (2.9%) |
| 80 to 84 Years | 699 (1.4%) | 1,024 (2.1%) |
| 85 Years and over | 889 (1.7%) | 1,807 (3.6%) |
| Total | 51,002 (100.0%) | 49,979 (100.0%) |
Families and Households in Quincy
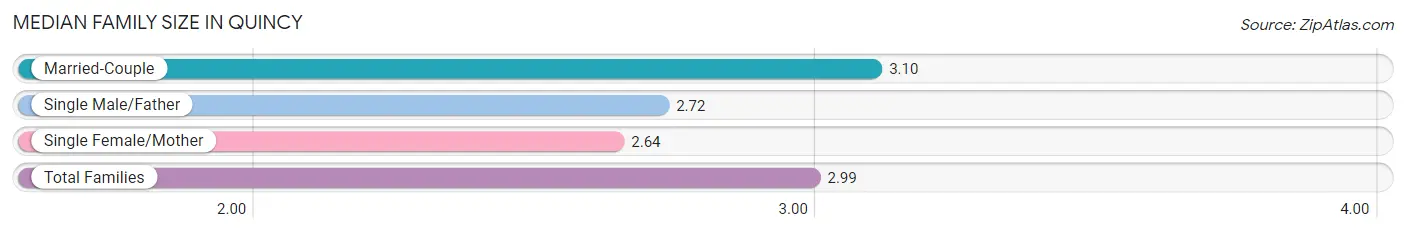
Median Family Size in Quincy
The median family size in Quincy is 2.99 persons per family, with married-couple families (17,358 | 75.0%) accounting for the largest median family size of 3.1 persons per family. On the other hand, single female/mother families (3,832 | 16.6%) represent the smallest median family size with 2.64 persons per family.
| Family Type | # Families | Family Size |
| Married-Couple | 17,358 (75.0%) | 3.10 |
| Single Male/Father | 1,944 (8.4%) | 2.72 |
| Single Female/Mother | 3,832 (16.6%) | 2.64 |
| Total Families | 23,134 (100.0%) | 2.99 |
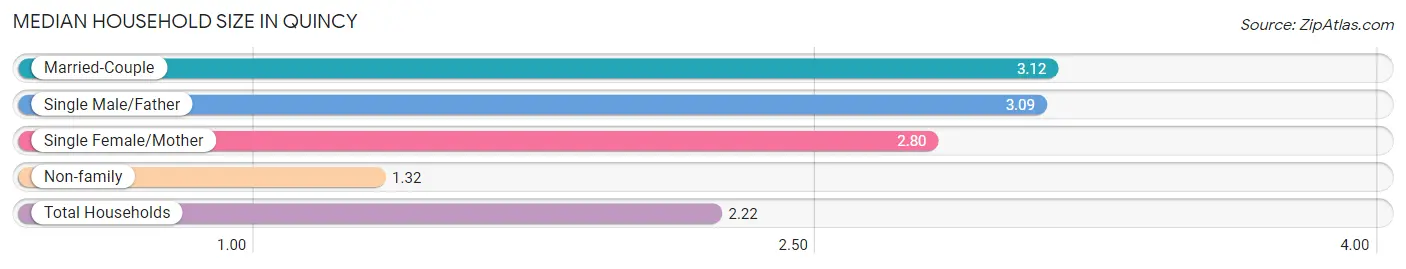
Median Household Size in Quincy
The median household size in Quincy is 2.22 persons per household, with married-couple households (17,358 | 38.6%) accounting for the largest median household size of 3.12 persons per household. non-family households (21,822 | 48.5%) represent the smallest median household size with 1.32 persons per household.
| Household Type | # Households | Household Size |
| Married-Couple | 17,358 (38.6%) | 3.12 |
| Single Male/Father | 1,944 (4.3%) | 3.09 |
| Single Female/Mother | 3,832 (8.5%) | 2.80 |
| Non-family | 21,822 (48.5%) | 1.32 |
| Total Households | 44,956 (100.0%) | 2.22 |
Household Size by Marriage Status in Quincy
Out of a total of 44,956 households in Quincy, 23,134 (51.5%) are family households, while 21,822 (48.5%) are nonfamily households. The most numerous type of family households are 2-person households, comprising 9,510, and the most common type of nonfamily households are 1-person households, comprising 16,205.
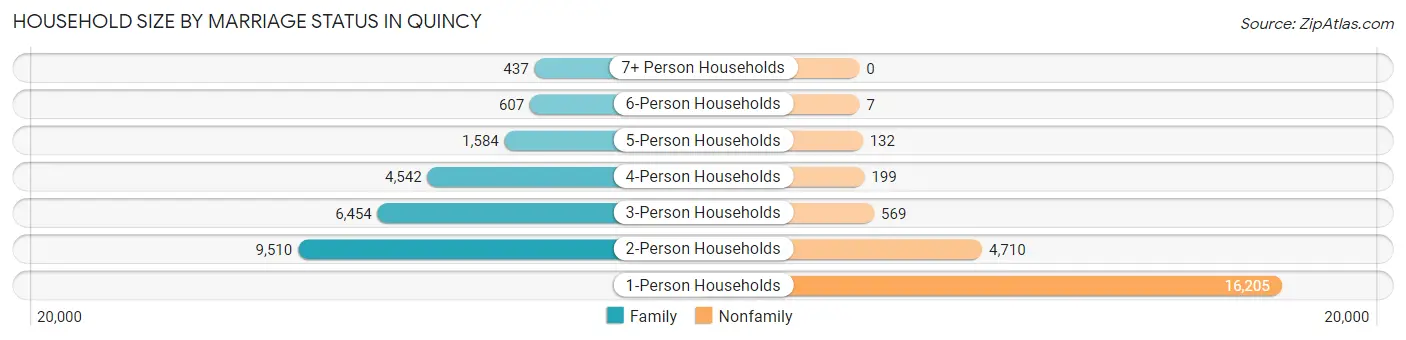
| Household Size | Family Households | Nonfamily Households |
| 1-Person Households | - | 16,205 (36.0%) |
| 2-Person Households | 9,510 (21.1%) | 4,710 (10.5%) |
| 3-Person Households | 6,454 (14.4%) | 569 (1.3%) |
| 4-Person Households | 4,542 (10.1%) | 199 (0.4%) |
| 5-Person Households | 1,584 (3.5%) | 132 (0.3%) |
| 6-Person Households | 607 (1.3%) | 7 (0.0%) |
| 7+ Person Households | 437 (1.0%) | 0 (0.0%) |
| Total | 23,134 (51.5%) | 21,822 (48.5%) |
Female Fertility in Quincy
Fertility by Age in Quincy
Average fertility rate in Quincy is 36.0 births per 1,000 women. Women in the age bracket of 20 to 34 years have the highest fertility rate with 46.0 births per 1,000 women. Women in the age bracket of 20 to 34 years acount for 67.9% of all women with births.
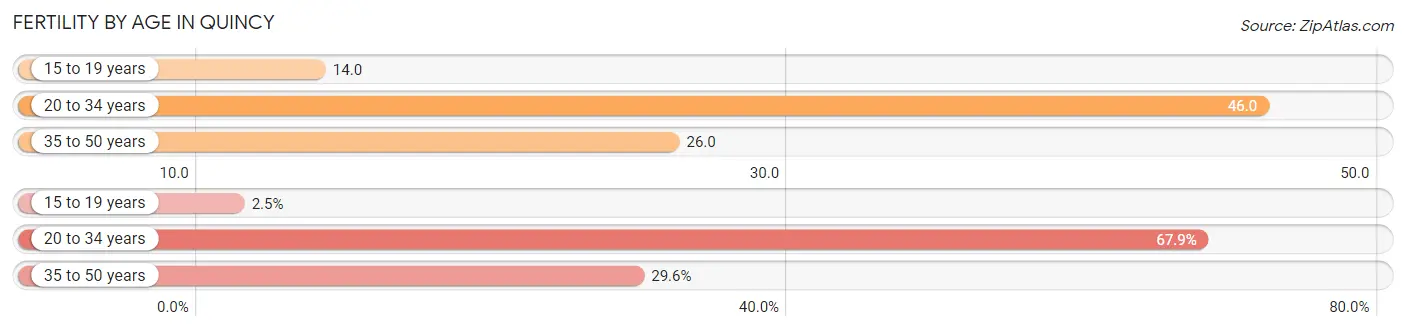
| Age Bracket | Women with Births | Births / 1,000 Women |
| 15 to 19 years | 23 (2.5%) | 14.0 |
| 20 to 34 years | 626 (67.9%) | 46.0 |
| 35 to 50 years | 273 (29.6%) | 26.0 |
| Total | 922 (100.0%) | 36.0 |
Fertility by Age by Marriage Status in Quincy
83.6% of women with births (922) in Quincy are married. The highest percentage of unmarried women with births falls into 15 to 19 years age bracket with 100.0% of them unmarried at the time of birth, while the lowest percentage of unmarried women with births belong to 35 to 50 years age bracket with 13.2% of them unmarried.
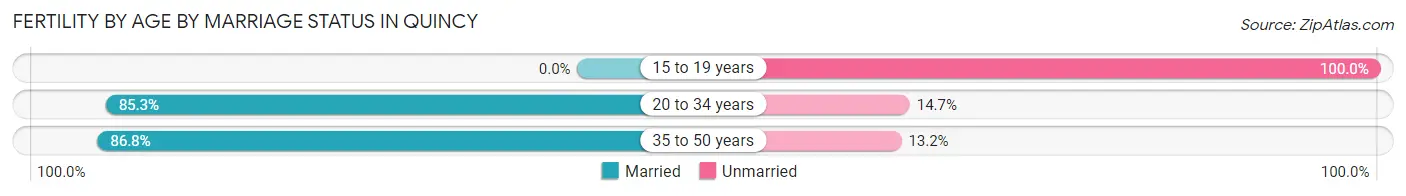
| Age Bracket | Married | Unmarried |
| 15 to 19 years | 0 (0.0%) | 23 (100.0%) |
| 20 to 34 years | 534 (85.3%) | 92 (14.7%) |
| 35 to 50 years | 237 (86.8%) | 36 (13.2%) |
| Total | 771 (83.6%) | 151 (16.4%) |
Fertility by Education in Quincy
Average fertility rate in Quincy is 36.0 births per 1,000 women. Women with the education attainment of graduate degree have the highest fertility rate of 66.0 births per 1,000 women, while women with the education attainment of college or associate's degree have the lowest fertility at 16.0 births per 1,000 women. Women with the education attainment of graduate degree represent 42.8% of all women with births.
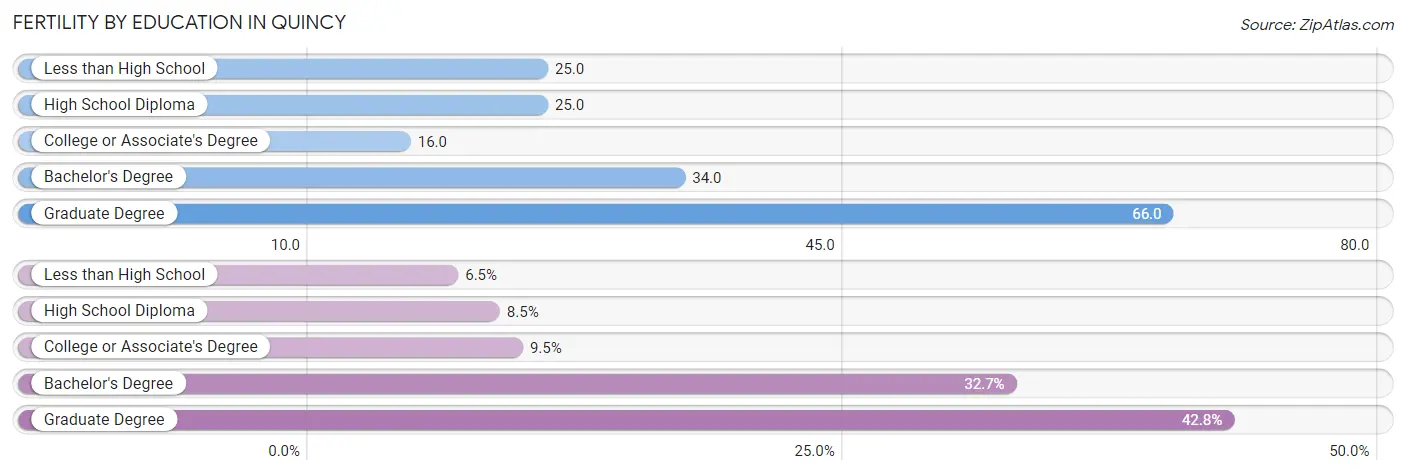
| Educational Attainment | Women with Births | Births / 1,000 Women |
| Less than High School | 60 (6.5%) | 25.0 |
| High School Diploma | 78 (8.5%) | 25.0 |
| College or Associate's Degree | 88 (9.5%) | 16.0 |
| Bachelor's Degree | 301 (32.7%) | 34.0 |
| Graduate Degree | 395 (42.8%) | 66.0 |
| Total | 922 (100.0%) | 36.0 |
Fertility by Education by Marriage Status in Quincy
16.4% of women with births in Quincy are unmarried. Women with the educational attainment of less than high school are most likely to be married with 100.0% of them married at childbirth, while women with the educational attainment of high school diploma are least likely to be married with 51.3% of them unmarried at childbirth.
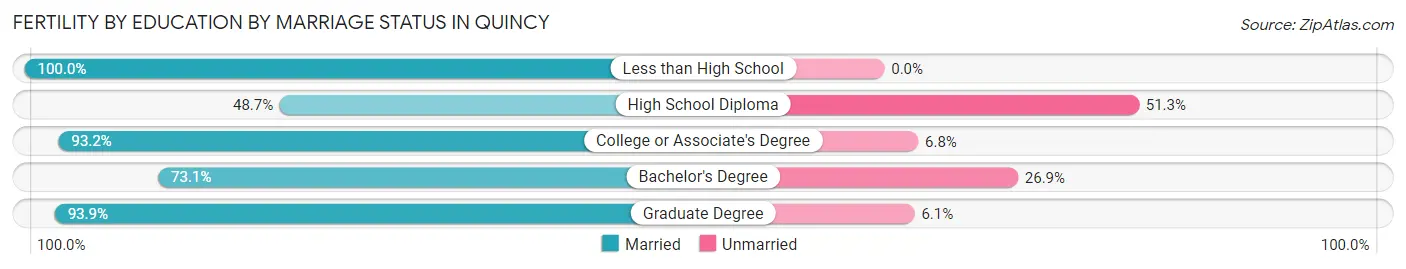
| Educational Attainment | Married | Unmarried |
| Less than High School | 60 (100.0%) | 0 (0.0%) |
| High School Diploma | 38 (48.7%) | 40 (51.3%) |
| College or Associate's Degree | 82 (93.2%) | 6 (6.8%) |
| Bachelor's Degree | 220 (73.1%) | 81 (26.9%) |
| Graduate Degree | 371 (93.9%) | 24 (6.1%) |
| Total | 771 (83.6%) | 151 (16.4%) |
Employment Characteristics in Quincy
Employment by Class of Employer in Quincy
Among the 56,147 employed individuals in Quincy, private company employees (39,102 | 69.6%), not-for-profit organizations (7,347 | 13.1%), and self-employed (not incorporated) (2,492 | 4.4%) make up the most common classes of employment.
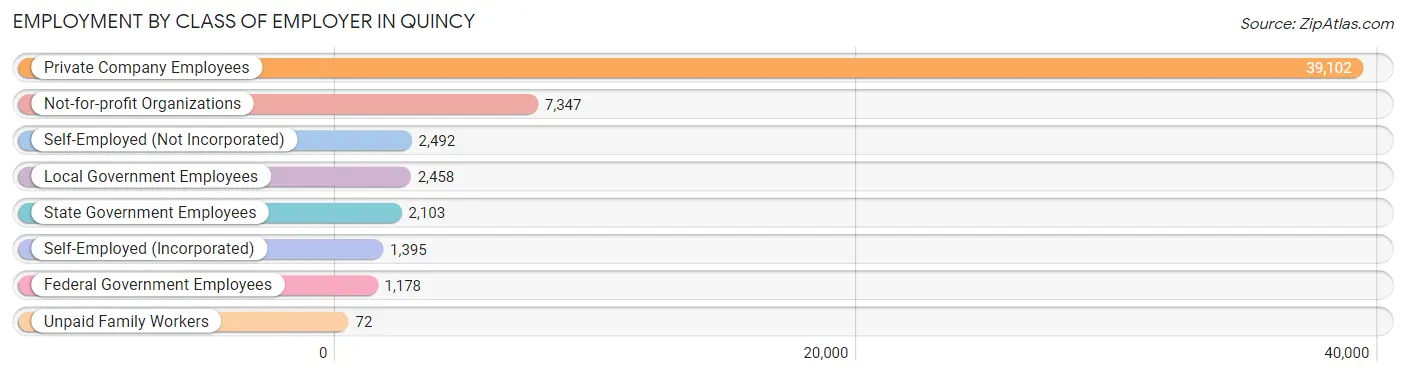
| Employer Class | # Employees | % Employees |
| Private Company Employees | 39,102 | 69.6% |
| Self-Employed (Incorporated) | 1,395 | 2.5% |
| Self-Employed (Not Incorporated) | 2,492 | 4.4% |
| Not-for-profit Organizations | 7,347 | 13.1% |
| Local Government Employees | 2,458 | 4.4% |
| State Government Employees | 2,103 | 3.7% |
| Federal Government Employees | 1,178 | 2.1% |
| Unpaid Family Workers | 72 | 0.1% |
| Total | 56,147 | 100.0% |
Employment Status by Age in Quincy
According to the labor force statistics for Quincy, out of the total population over 16 years of age (87,515), 70.7% or 61,873 individuals are in the labor force, with 6.7% or 4,145 of them unemployed. The age group with the highest labor force participation rate is 30 to 34 years, with 92.8% or 9,495 individuals in the labor force. Within the labor force, the 20 to 24 years age range has the highest percentage of unemployed individuals, with 14.4% or 722 of them being unemployed.
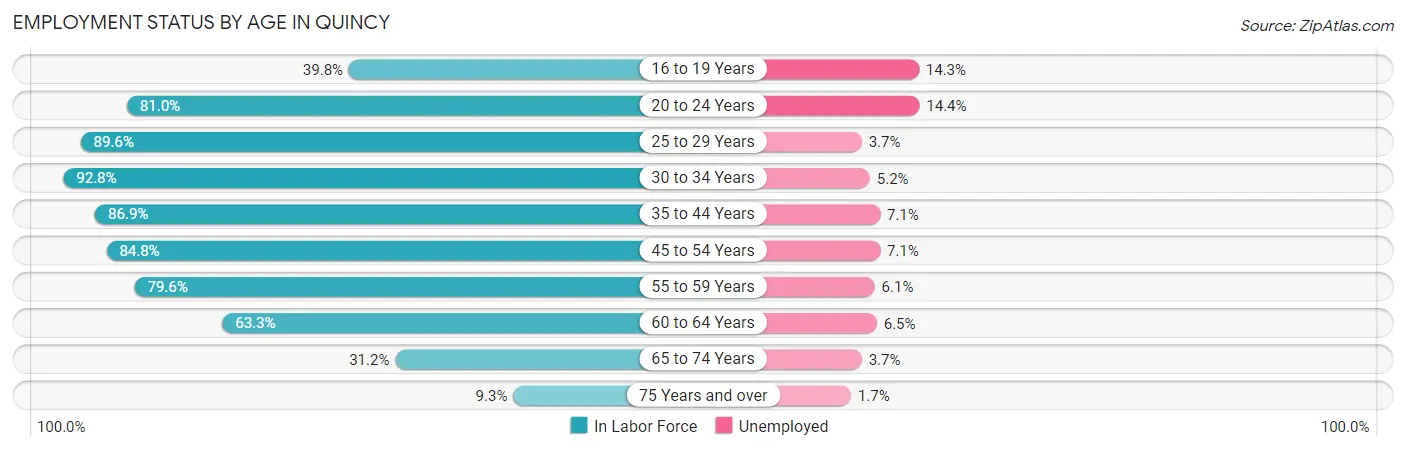
| Age Bracket | In Labor Force | Unemployed |
| 16 to 19 Years | 1,307 (39.8%) | 187 (14.3%) |
| 20 to 24 Years | 5,015 (81.0%) | 722 (14.4%) |
| 25 to 29 Years | 10,158 (89.6%) | 376 (3.7%) |
| 30 to 34 Years | 9,495 (92.8%) | 494 (5.2%) |
| 35 to 44 Years | 13,040 (86.9%) | 926 (7.1%) |
| 45 to 54 Years | 9,760 (84.8%) | 693 (7.1%) |
| 55 to 59 Years | 5,265 (79.6%) | 321 (6.1%) |
| 60 to 64 Years | 4,059 (63.3%) | 264 (6.5%) |
| 65 to 74 Years | 3,060 (31.2%) | 113 (3.7%) |
| 75 Years and over | 662 (9.3%) | 11 (1.7%) |
| Total | 61,873 (70.7%) | 4,145 (6.7%) |
Employment Status by Educational Attainment in Quincy
According to labor force statistics for Quincy, 84.8% of individuals (51,821) out of the total population between 25 and 64 years of age (61,110) are in the labor force, with 6.0% or 3,109 of them being unemployed. The group with the highest labor force participation rate are those with the educational attainment of bachelor's degree or higher, with 89.2% or 28,350 individuals in the labor force. Within the labor force, individuals with high school diploma education have the highest percentage of unemployment, with 12.4% or 1,054 of them being unemployed.
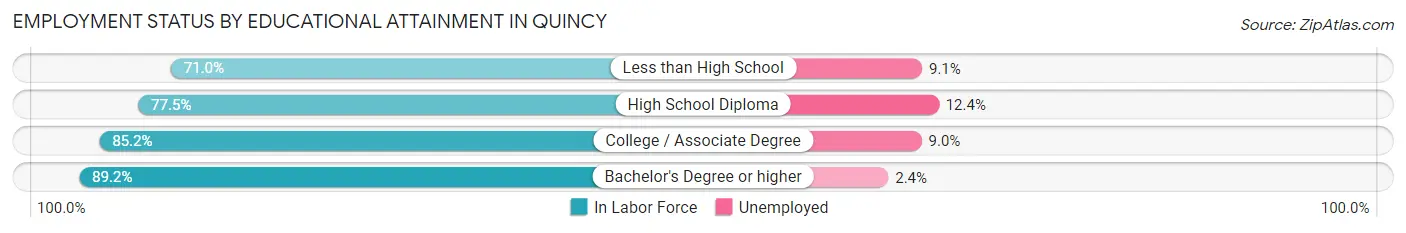
| Educational Attainment | In Labor Force | Unemployed |
| Less than High School | 3,478 (71.0%) | 446 (9.1%) |
| High School Diploma | 8,504 (77.5%) | 1,361 (12.4%) |
| College / Associate Degree | 11,465 (85.2%) | 1,211 (9.0%) |
| Bachelor's Degree or higher | 28,350 (89.2%) | 763 (2.4%) |
| Total | 51,821 (84.8%) | 3,667 (6.0%) |
Employment Occupations by Sex in Quincy
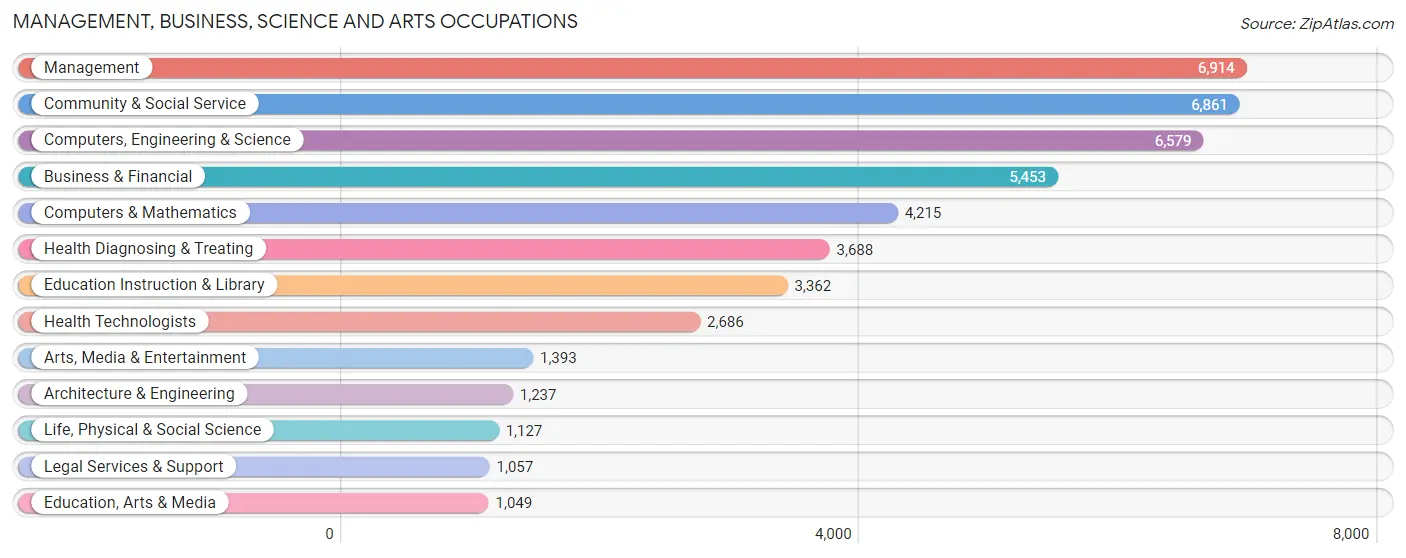
Management, Business, Science and Arts Occupations
The most common Management, Business, Science and Arts occupations in Quincy are Management (6,914 | 12.0%), Community & Social Service (6,861 | 11.9%), Computers, Engineering & Science (6,579 | 11.4%), Business & Financial (5,453 | 9.5%), and Computers & Mathematics (4,215 | 7.3%).
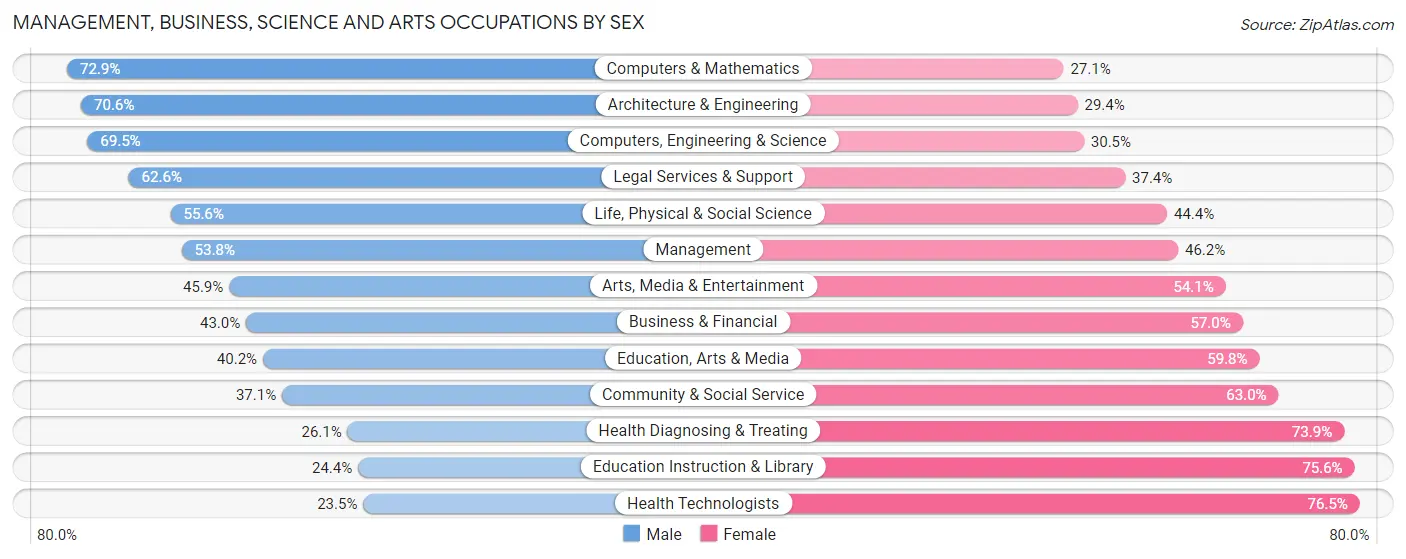
Management, Business, Science and Arts Occupations by Sex
Within the Management, Business, Science and Arts occupations in Quincy, the most male-oriented occupations are Computers & Mathematics (72.9%), Architecture & Engineering (70.6%), and Computers, Engineering & Science (69.5%), while the most female-oriented occupations are Health Technologists (76.5%), Education Instruction & Library (75.6%), and Health Diagnosing & Treating (73.9%).
| Occupation | Male | Female |
| Management | 3,719 (53.8%) | 3,195 (46.2%) |
| Business & Financial | 2,347 (43.0%) | 3,106 (57.0%) |
| Computers, Engineering & Science | 4,573 (69.5%) | 2,006 (30.5%) |
| Computers & Mathematics | 3,073 (72.9%) | 1,142 (27.1%) |
| Architecture & Engineering | 873 (70.6%) | 364 (29.4%) |
| Life, Physical & Social Science | 627 (55.6%) | 500 (44.4%) |
| Community & Social Service | 2,542 (37.0%) | 4,319 (62.9%) |
| Education, Arts & Media | 422 (40.2%) | 627 (59.8%) |
| Legal Services & Support | 662 (62.6%) | 395 (37.4%) |
| Education Instruction & Library | 819 (24.4%) | 2,543 (75.6%) |
| Arts, Media & Entertainment | 639 (45.9%) | 754 (54.1%) |
| Health Diagnosing & Treating | 963 (26.1%) | 2,725 (73.9%) |
| Health Technologists | 631 (23.5%) | 2,055 (76.5%) |
| Total (Category) | 14,144 (47.9%) | 15,351 (52.0%) |
| Total (Overall) | 29,489 (51.2%) | 28,086 (48.8%) |
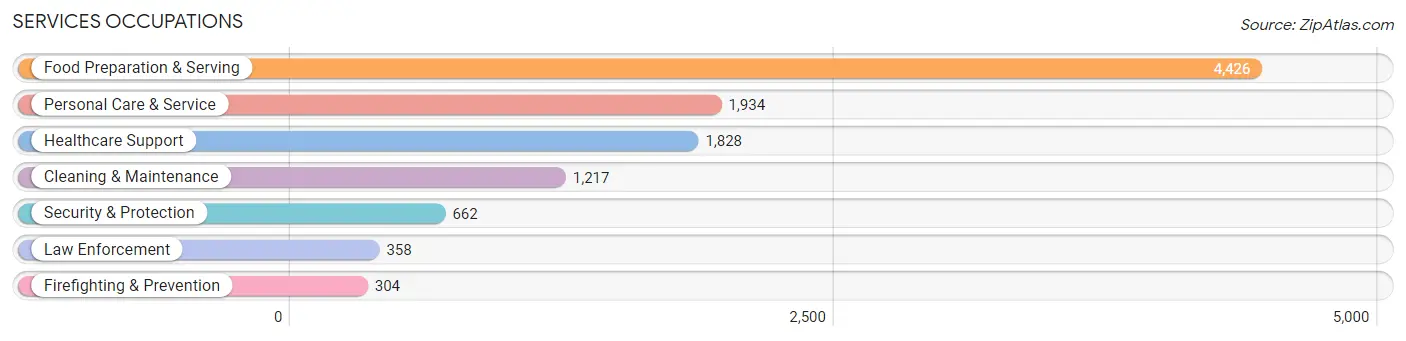
Services Occupations
The most common Services occupations in Quincy are Food Preparation & Serving (4,426 | 7.7%), Personal Care & Service (1,934 | 3.4%), Healthcare Support (1,828 | 3.2%), Cleaning & Maintenance (1,217 | 2.1%), and Security & Protection (662 | 1.1%).
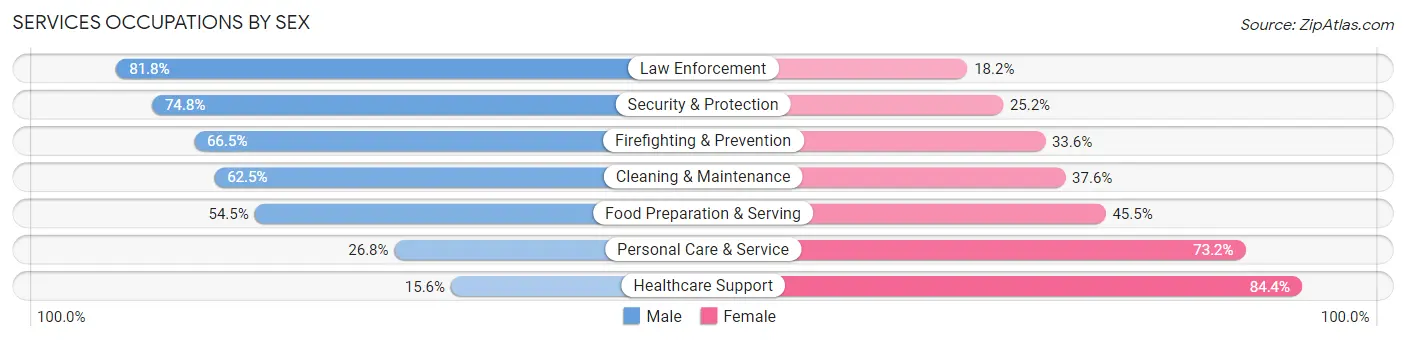
Services Occupations by Sex
Within the Services occupations in Quincy, the most male-oriented occupations are Law Enforcement (81.8%), Security & Protection (74.8%), and Firefighting & Prevention (66.4%), while the most female-oriented occupations are Healthcare Support (84.4%), Personal Care & Service (73.2%), and Food Preparation & Serving (45.5%).
| Occupation | Male | Female |
| Healthcare Support | 285 (15.6%) | 1,543 (84.4%) |
| Security & Protection | 495 (74.8%) | 167 (25.2%) |
| Firefighting & Prevention | 202 (66.4%) | 102 (33.6%) |
| Law Enforcement | 293 (81.8%) | 65 (18.2%) |
| Food Preparation & Serving | 2,411 (54.5%) | 2,015 (45.5%) |
| Cleaning & Maintenance | 760 (62.5%) | 457 (37.6%) |
| Personal Care & Service | 518 (26.8%) | 1,416 (73.2%) |
| Total (Category) | 4,469 (44.4%) | 5,598 (55.6%) |
| Total (Overall) | 29,489 (51.2%) | 28,086 (48.8%) |
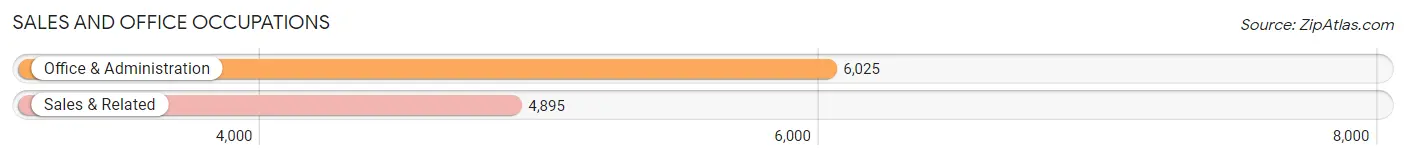
Sales and Office Occupations
The most common Sales and Office occupations in Quincy are Office & Administration (6,025 | 10.5%), and Sales & Related (4,895 | 8.5%).
Sales and Office Occupations by Sex
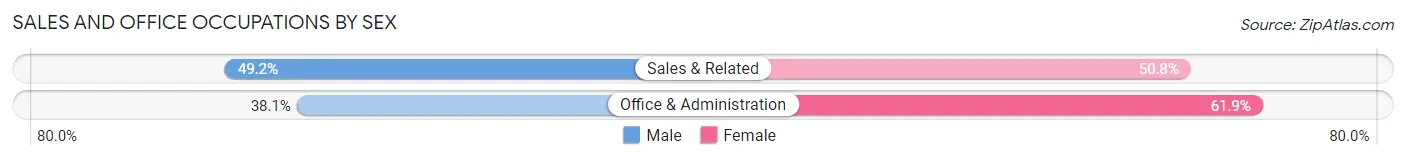
| Occupation | Male | Female |
| Sales & Related | 2,408 (49.2%) | 2,487 (50.8%) |
| Office & Administration | 2,298 (38.1%) | 3,727 (61.9%) |
| Total (Category) | 4,706 (43.1%) | 6,214 (56.9%) |
| Total (Overall) | 29,489 (51.2%) | 28,086 (48.8%) |
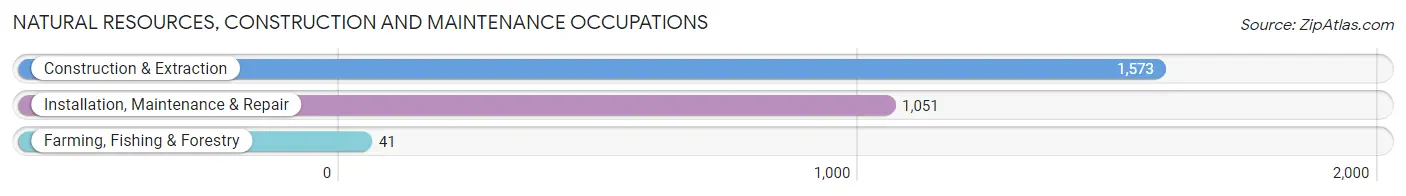
Natural Resources, Construction and Maintenance Occupations
The most common Natural Resources, Construction and Maintenance occupations in Quincy are Construction & Extraction (1,573 | 2.7%), Installation, Maintenance & Repair (1,051 | 1.8%), and Farming, Fishing & Forestry (41 | 0.1%).
Natural Resources, Construction and Maintenance Occupations by Sex
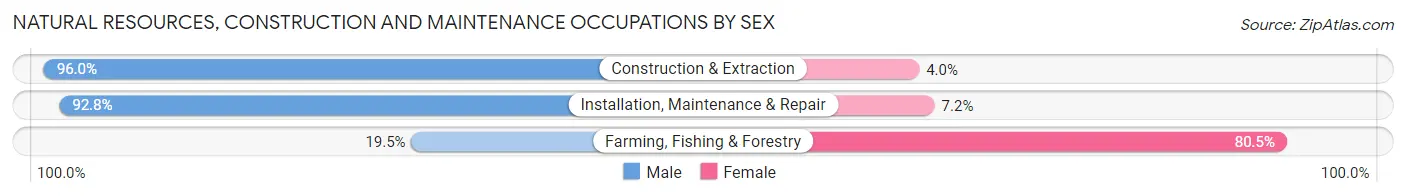
| Occupation | Male | Female |
| Farming, Fishing & Forestry | 8 (19.5%) | 33 (80.5%) |
| Construction & Extraction | 1,510 (96.0%) | 63 (4.0%) |
| Installation, Maintenance & Repair | 975 (92.8%) | 76 (7.2%) |
| Total (Category) | 2,493 (93.5%) | 172 (6.5%) |
| Total (Overall) | 29,489 (51.2%) | 28,086 (48.8%) |
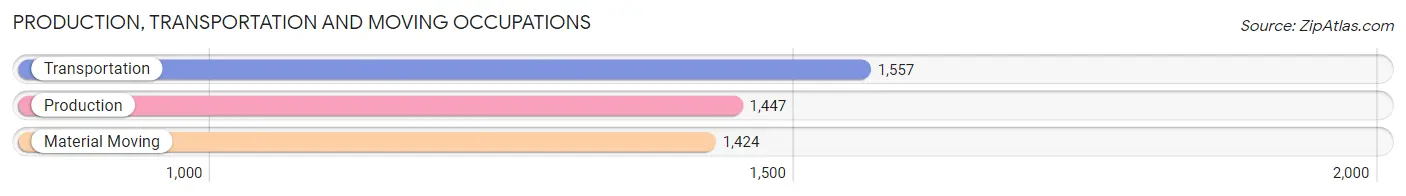
Production, Transportation and Moving Occupations
The most common Production, Transportation and Moving occupations in Quincy are Transportation (1,557 | 2.7%), Production (1,447 | 2.5%), and Material Moving (1,424 | 2.5%).
Production, Transportation and Moving Occupations by Sex
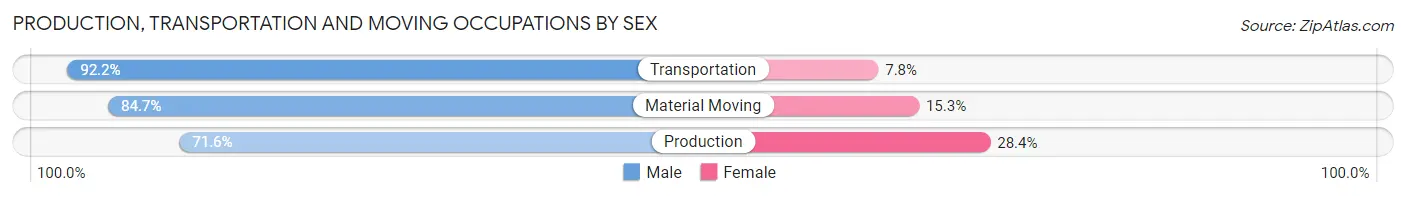
| Occupation | Male | Female |
| Production | 1,036 (71.6%) | 411 (28.4%) |
| Transportation | 1,435 (92.2%) | 122 (7.8%) |
| Material Moving | 1,206 (84.7%) | 218 (15.3%) |
| Total (Category) | 3,677 (83.0%) | 751 (17.0%) |
| Total (Overall) | 29,489 (51.2%) | 28,086 (48.8%) |
Employment Industries by Sex in Quincy
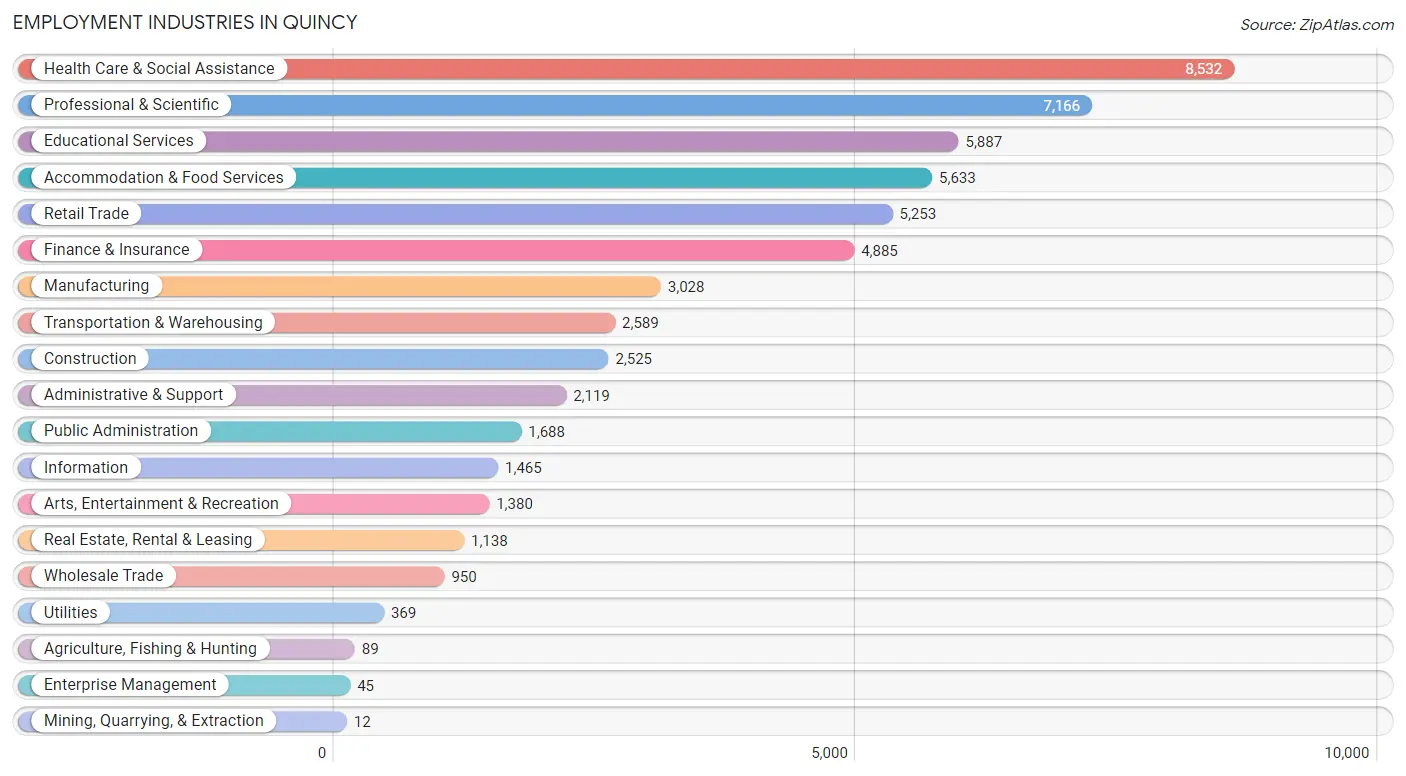
Employment Industries in Quincy
The major employment industries in Quincy include Health Care & Social Assistance (8,532 | 14.8%), Professional & Scientific (7,166 | 12.4%), Educational Services (5,887 | 10.2%), Accommodation & Food Services (5,633 | 9.8%), and Retail Trade (5,253 | 9.1%).
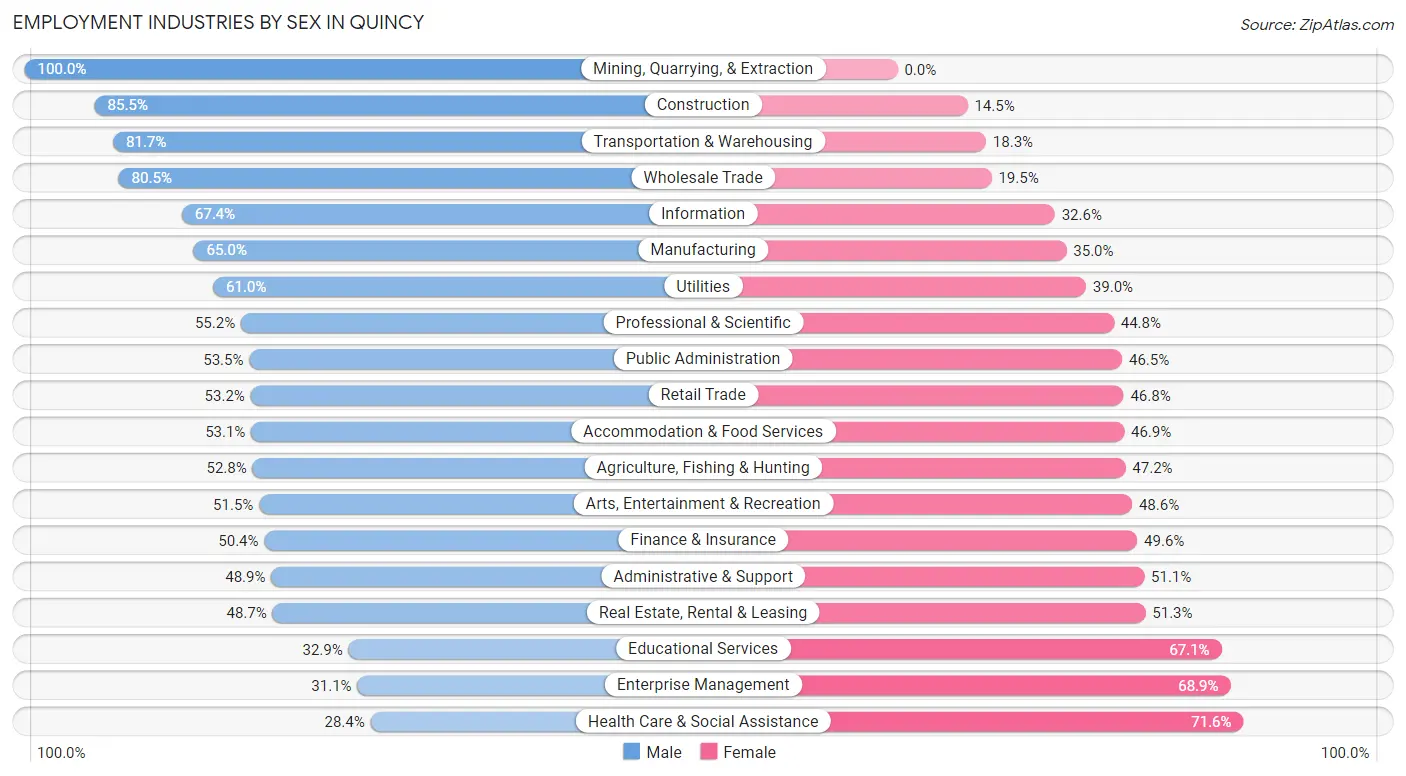
Employment Industries by Sex in Quincy
The Quincy industries that see more men than women are Mining, Quarrying, & Extraction (100.0%), Construction (85.5%), and Transportation & Warehousing (81.7%), whereas the industries that tend to have a higher number of women are Health Care & Social Assistance (71.6%), Enterprise Management (68.9%), and Educational Services (67.1%).
| Industry | Male | Female |
| Agriculture, Fishing & Hunting | 47 (52.8%) | 42 (47.2%) |
| Mining, Quarrying, & Extraction | 12 (100.0%) | 0 (0.0%) |
| Construction | 2,159 (85.5%) | 366 (14.5%) |
| Manufacturing | 1,969 (65.0%) | 1,059 (35.0%) |
| Wholesale Trade | 765 (80.5%) | 185 (19.5%) |
| Retail Trade | 2,795 (53.2%) | 2,458 (46.8%) |
| Transportation & Warehousing | 2,115 (81.7%) | 474 (18.3%) |
| Utilities | 225 (61.0%) | 144 (39.0%) |
| Information | 988 (67.4%) | 477 (32.6%) |
| Finance & Insurance | 2,461 (50.4%) | 2,424 (49.6%) |
| Real Estate, Rental & Leasing | 554 (48.7%) | 584 (51.3%) |
| Professional & Scientific | 3,956 (55.2%) | 3,210 (44.8%) |
| Enterprise Management | 14 (31.1%) | 31 (68.9%) |
| Administrative & Support | 1,037 (48.9%) | 1,082 (51.1%) |
| Educational Services | 1,939 (32.9%) | 3,948 (67.1%) |
| Health Care & Social Assistance | 2,423 (28.4%) | 6,109 (71.6%) |
| Arts, Entertainment & Recreation | 710 (51.4%) | 670 (48.5%) |
| Accommodation & Food Services | 2,991 (53.1%) | 2,642 (46.9%) |
| Public Administration | 903 (53.5%) | 785 (46.5%) |
| Total | 29,489 (51.2%) | 28,086 (48.8%) |
Education in Quincy
School Enrollment in Quincy
The most common levels of schooling among the 19,790 students in Quincy are college / undergraduate (4,677 | 23.6%), high school (3,264 | 16.5%), and middle school (3,153 | 15.9%).
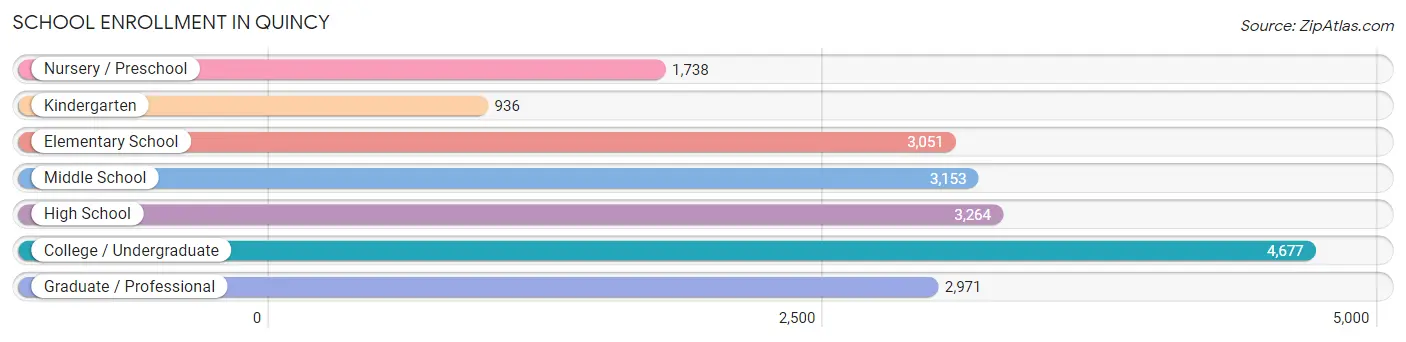
| School Level | # Students | % Students |
| Nursery / Preschool | 1,738 | 8.8% |
| Kindergarten | 936 | 4.7% |
| Elementary School | 3,051 | 15.4% |
| Middle School | 3,153 | 15.9% |
| High School | 3,264 | 16.5% |
| College / Undergraduate | 4,677 | 23.6% |
| Graduate / Professional | 2,971 | 15.0% |
| Total | 19,790 | 100.0% |
School Enrollment by Age by Funding Source in Quincy
Out of a total of 19,790 students who are enrolled in schools in Quincy, 5,779 (29.2%) attend a private institution, while the remaining 14,011 (70.8%) are enrolled in public schools. The age group of 3 to 4 year olds has the highest likelihood of being enrolled in private schools, with 1,046 (65.3% in the age bracket) enrolled. Conversely, the age group of 10 to 14 year olds has the lowest likelihood of being enrolled in a private school, with 3,611 (92.8% in the age bracket) attending a public institution.
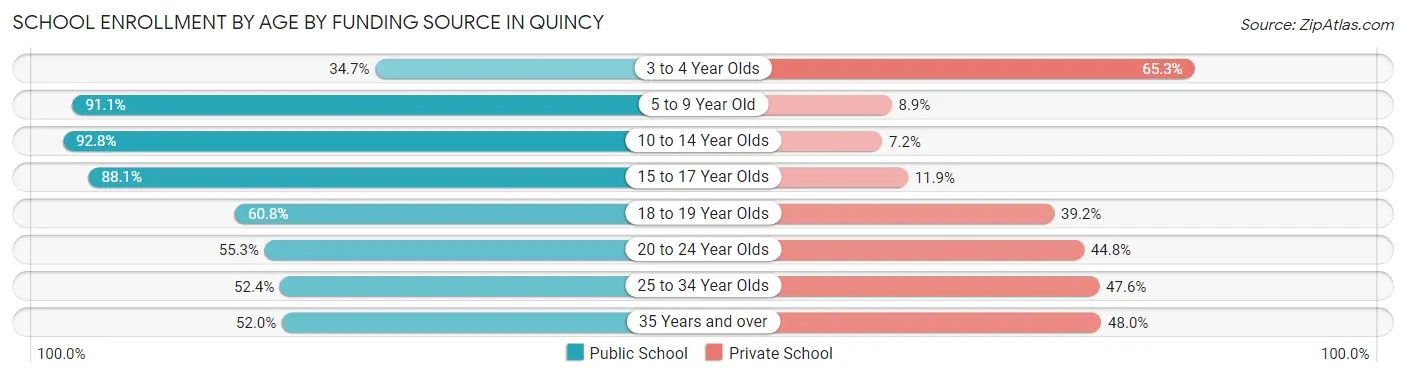
| Age Bracket | Public School | Private School |
| 3 to 4 Year Olds | 555 (34.7%) | 1,046 (65.3%) |
| 5 to 9 Year Old | 3,361 (91.1%) | 329 (8.9%) |
| 10 to 14 Year Olds | 3,611 (92.8%) | 279 (7.2%) |
| 15 to 17 Year Olds | 1,845 (88.1%) | 250 (11.9%) |
| 18 to 19 Year Olds | 819 (60.8%) | 528 (39.2%) |
| 20 to 24 Year Olds | 1,453 (55.2%) | 1,177 (44.8%) |
| 25 to 34 Year Olds | 1,556 (52.4%) | 1,413 (47.6%) |
| 35 Years and over | 816 (52.0%) | 752 (48.0%) |
| Total | 14,011 (70.8%) | 5,779 (29.2%) |
Educational Attainment by Field of Study in Quincy
Business (7,902 | 19.9%), social sciences (4,092 | 10.3%), science & technology (3,321 | 8.4%), computers & mathematics (2,954 | 7.4%), and engineering (2,850 | 7.2%) are the most common fields of study among 39,692 individuals in Quincy who have obtained a bachelor's degree or higher.
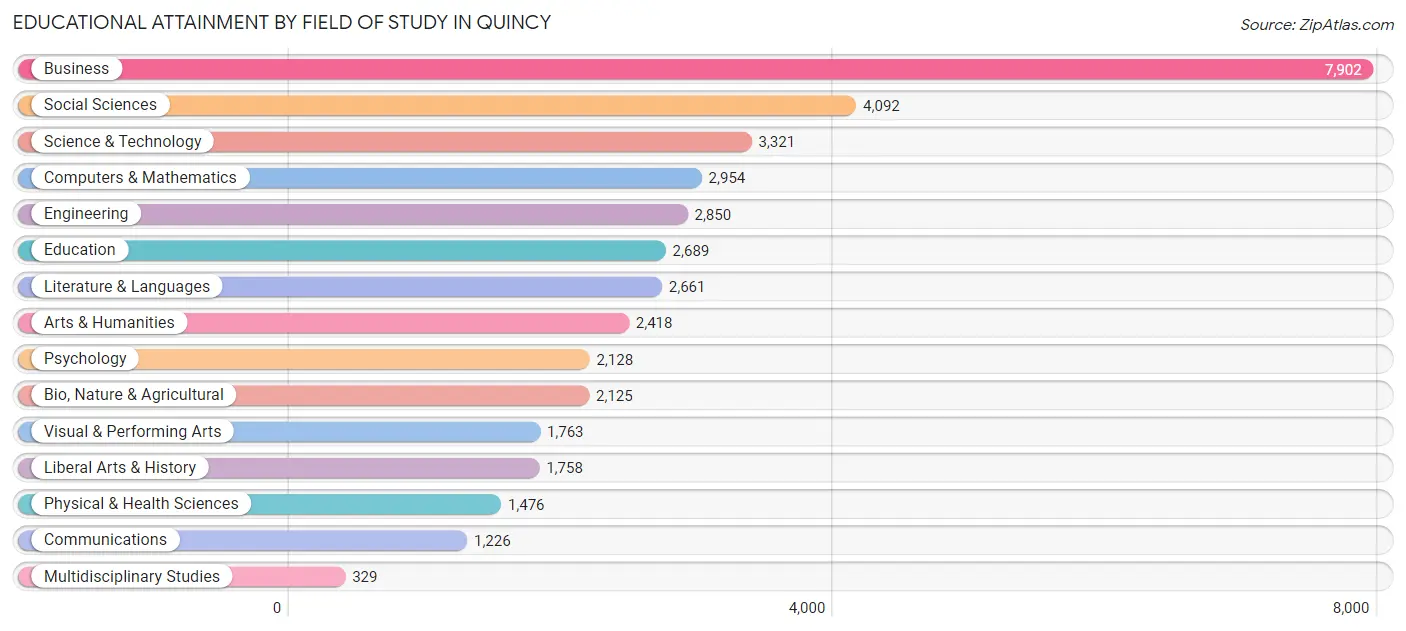
| Field of Study | # Graduates | % Graduates |
| Computers & Mathematics | 2,954 | 7.4% |
| Bio, Nature & Agricultural | 2,125 | 5.3% |
| Physical & Health Sciences | 1,476 | 3.7% |
| Psychology | 2,128 | 5.4% |
| Social Sciences | 4,092 | 10.3% |
| Engineering | 2,850 | 7.2% |
| Multidisciplinary Studies | 329 | 0.8% |
| Science & Technology | 3,321 | 8.4% |
| Business | 7,902 | 19.9% |
| Education | 2,689 | 6.8% |
| Literature & Languages | 2,661 | 6.7% |
| Liberal Arts & History | 1,758 | 4.4% |
| Visual & Performing Arts | 1,763 | 4.4% |
| Communications | 1,226 | 3.1% |
| Arts & Humanities | 2,418 | 6.1% |
| Total | 39,692 | 100.0% |
Transportation & Commute in Quincy
Vehicle Availability by Sex in Quincy
The most prevalent vehicle ownership categories in Quincy are males with 1 vehicle (11,232, accounting for 39.0%) and females with 1 vehicle (10,224, making up 41.5%).
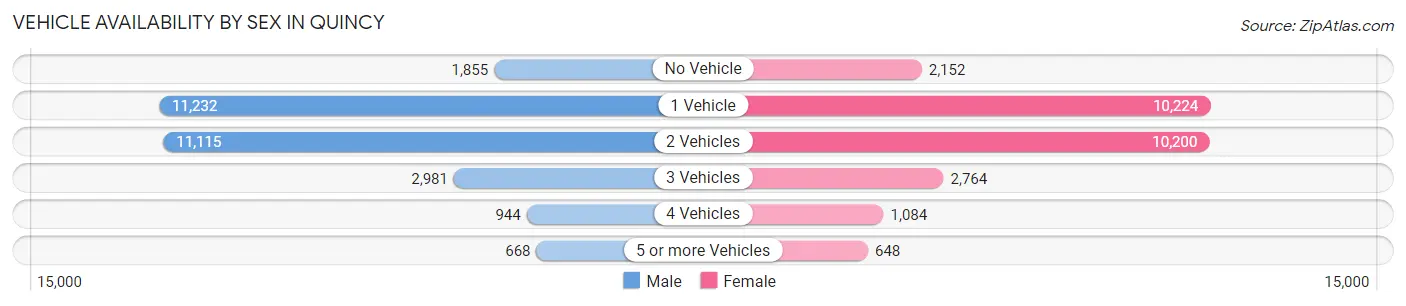
| Vehicles Available | Male | Female |
| No Vehicle | 1,855 (6.4%) | 2,152 (8.0%) |
| 1 Vehicle | 11,232 (39.0%) | 10,224 (37.8%) |
| 2 Vehicles | 11,115 (38.6%) | 10,200 (37.7%) |
| 3 Vehicles | 2,981 (10.3%) | 2,764 (10.2%) |
| 4 Vehicles | 944 (3.3%) | 1,084 (4.0%) |
| 5 or more Vehicles | 668 (2.3%) | 648 (2.4%) |
| Total | 28,795 (100.0%) | 27,072 (100.0%) |
Commute Time in Quincy
The most frequently occuring commute durations in Quincy are 30 to 34 minutes (7,752 commuters, 16.3%), 45 to 59 minutes (7,441 commuters, 15.6%), and 60 to 89 minutes (6,138 commuters, 12.9%).
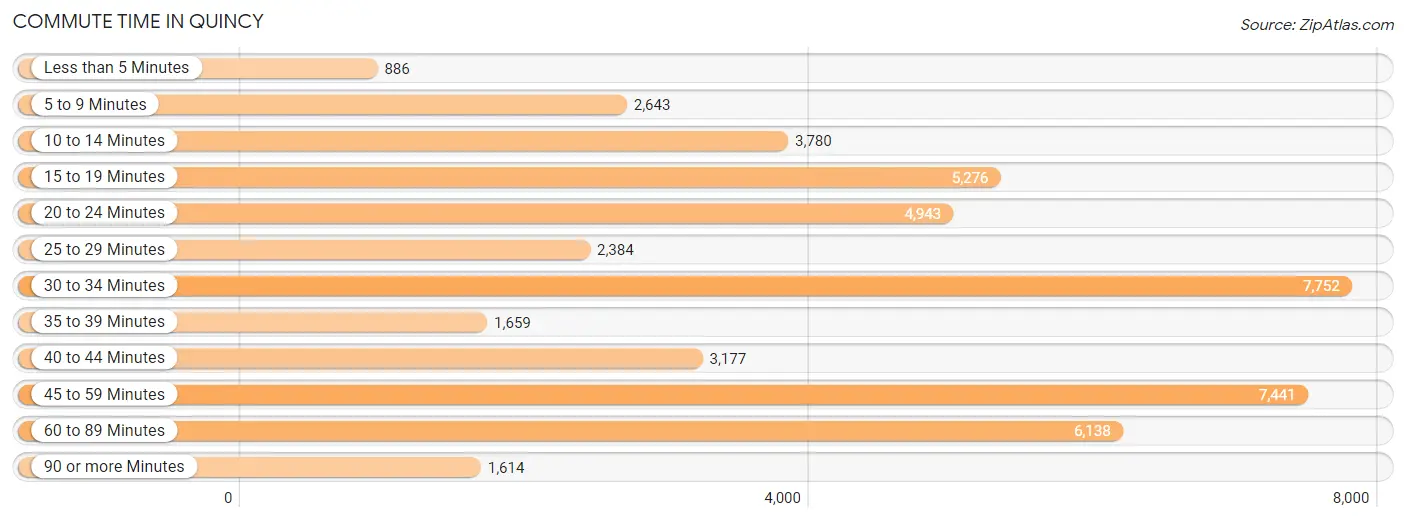
| Commute Time | # Commuters | % Commuters |
| Less than 5 Minutes | 886 | 1.9% |
| 5 to 9 Minutes | 2,643 | 5.5% |
| 10 to 14 Minutes | 3,780 | 7.9% |
| 15 to 19 Minutes | 5,276 | 11.1% |
| 20 to 24 Minutes | 4,943 | 10.4% |
| 25 to 29 Minutes | 2,384 | 5.0% |
| 30 to 34 Minutes | 7,752 | 16.3% |
| 35 to 39 Minutes | 1,659 | 3.5% |
| 40 to 44 Minutes | 3,177 | 6.7% |
| 45 to 59 Minutes | 7,441 | 15.6% |
| 60 to 89 Minutes | 6,138 | 12.9% |
| 90 or more Minutes | 1,614 | 3.4% |
Commute Time by Sex in Quincy
The most common commute times in Quincy are 30 to 34 minutes (4,235 commuters, 17.2%) for males and 30 to 34 minutes (3,517 commuters, 15.3%) for females.
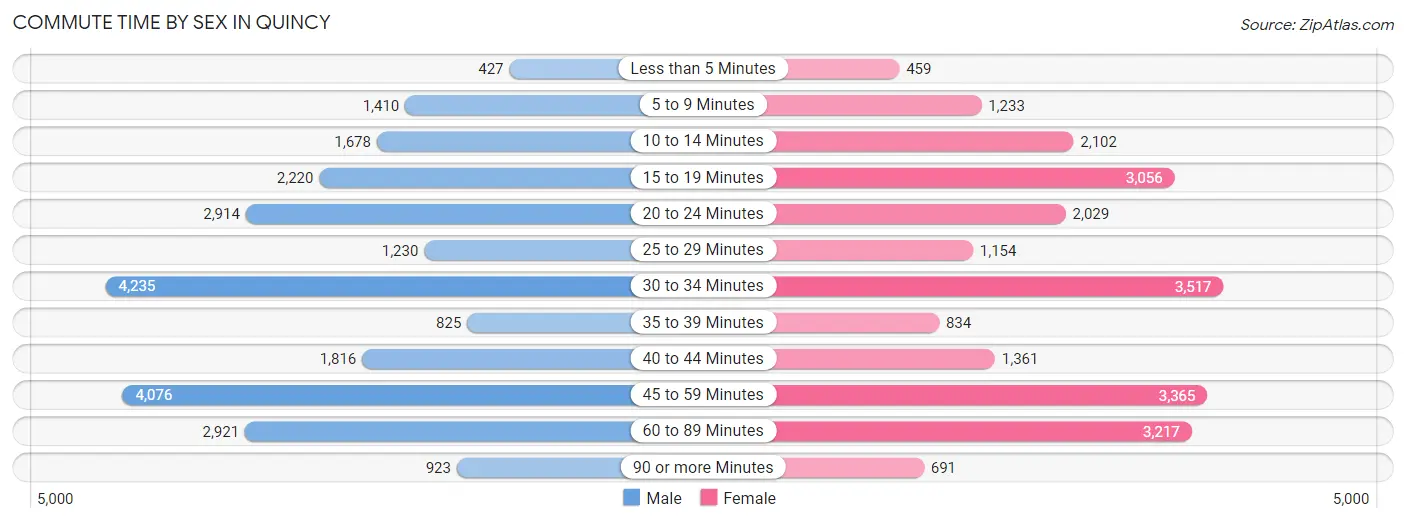
| Commute Time | Male | Female |
| Less than 5 Minutes | 427 (1.7%) | 459 (2.0%) |
| 5 to 9 Minutes | 1,410 (5.7%) | 1,233 (5.4%) |
| 10 to 14 Minutes | 1,678 (6.8%) | 2,102 (9.1%) |
| 15 to 19 Minutes | 2,220 (9.0%) | 3,056 (13.3%) |
| 20 to 24 Minutes | 2,914 (11.8%) | 2,029 (8.8%) |
| 25 to 29 Minutes | 1,230 (5.0%) | 1,154 (5.0%) |
| 30 to 34 Minutes | 4,235 (17.2%) | 3,517 (15.3%) |
| 35 to 39 Minutes | 825 (3.3%) | 834 (3.6%) |
| 40 to 44 Minutes | 1,816 (7.4%) | 1,361 (5.9%) |
| 45 to 59 Minutes | 4,076 (16.5%) | 3,365 (14.6%) |
| 60 to 89 Minutes | 2,921 (11.8%) | 3,217 (14.0%) |
| 90 or more Minutes | 923 (3.7%) | 691 (3.0%) |
Time of Departure to Work by Sex in Quincy
The most frequent times of departure to work in Quincy are 8:00 AM to 8:29 AM (2,916, 11.8%) for males and 7:30 AM to 7:59 AM (3,388, 14.7%) for females.
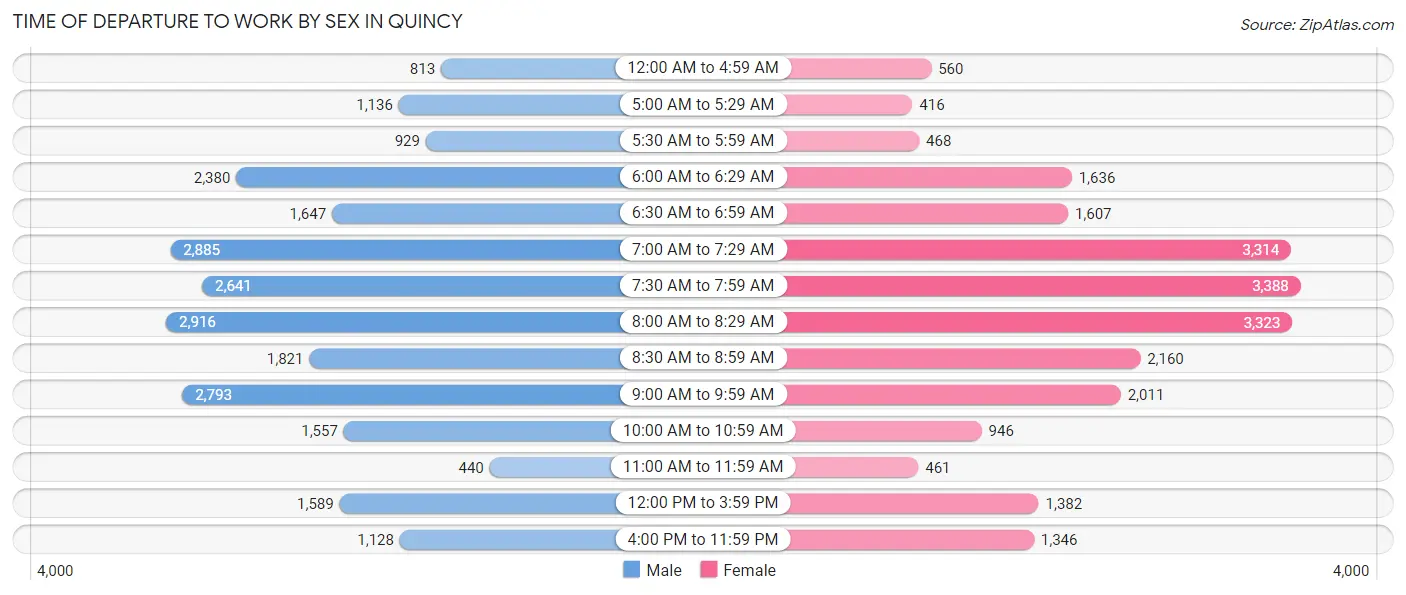
| Time of Departure | Male | Female |
| 12:00 AM to 4:59 AM | 813 (3.3%) | 560 (2.4%) |
| 5:00 AM to 5:29 AM | 1,136 (4.6%) | 416 (1.8%) |
| 5:30 AM to 5:59 AM | 929 (3.8%) | 468 (2.0%) |
| 6:00 AM to 6:29 AM | 2,380 (9.7%) | 1,636 (7.1%) |
| 6:30 AM to 6:59 AM | 1,647 (6.7%) | 1,607 (7.0%) |
| 7:00 AM to 7:29 AM | 2,885 (11.7%) | 3,314 (14.4%) |
| 7:30 AM to 7:59 AM | 2,641 (10.7%) | 3,388 (14.7%) |
| 8:00 AM to 8:29 AM | 2,916 (11.8%) | 3,323 (14.4%) |
| 8:30 AM to 8:59 AM | 1,821 (7.4%) | 2,160 (9.4%) |
| 9:00 AM to 9:59 AM | 2,793 (11.3%) | 2,011 (8.7%) |
| 10:00 AM to 10:59 AM | 1,557 (6.3%) | 946 (4.1%) |
| 11:00 AM to 11:59 AM | 440 (1.8%) | 461 (2.0%) |
| 12:00 PM to 3:59 PM | 1,589 (6.4%) | 1,382 (6.0%) |
| 4:00 PM to 11:59 PM | 1,128 (4.6%) | 1,346 (5.9%) |
| Total | 24,675 (100.0%) | 23,018 (100.0%) |
Housing Occupancy in Quincy
Occupancy by Ownership in Quincy
Of the total 44,956 dwellings in Quincy, owner-occupied units account for 19,742 (43.9%), while renter-occupied units make up 25,214 (56.1%).
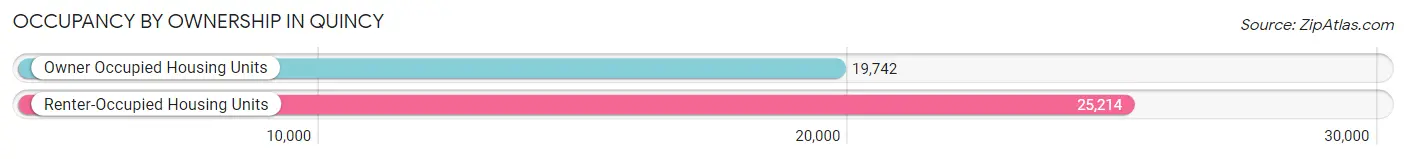
| Occupancy | # Housing Units | % Housing Units |
| Owner Occupied Housing Units | 19,742 | 43.9% |
| Renter-Occupied Housing Units | 25,214 | 56.1% |
| Total Occupied Housing Units | 44,956 | 100.0% |
Occupancy by Household Size in Quincy
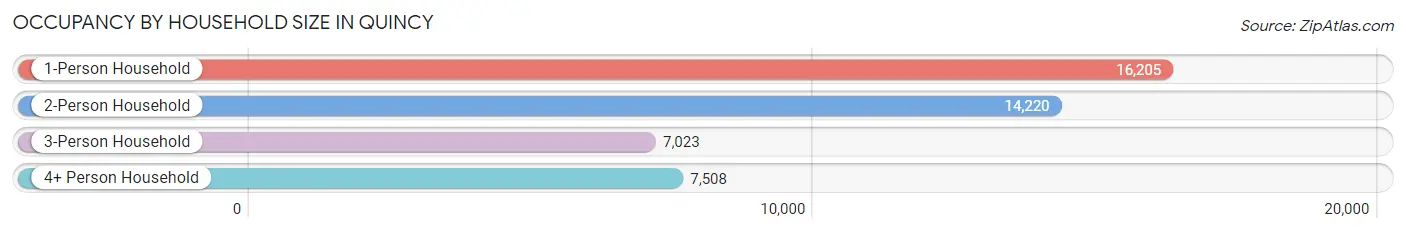
| Household Size | # Housing Units | % Housing Units |
| 1-Person Household | 16,205 | 36.0% |
| 2-Person Household | 14,220 | 31.6% |
| 3-Person Household | 7,023 | 15.6% |
| 4+ Person Household | 7,508 | 16.7% |
| Total Housing Units | 44,956 | 100.0% |
Occupancy by Ownership by Household Size in Quincy
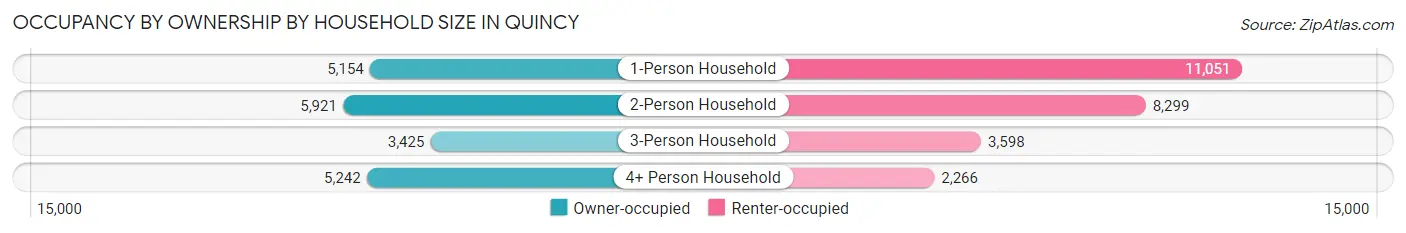
| Household Size | Owner-occupied | Renter-occupied |
| 1-Person Household | 5,154 (31.8%) | 11,051 (68.2%) |
| 2-Person Household | 5,921 (41.6%) | 8,299 (58.4%) |
| 3-Person Household | 3,425 (48.8%) | 3,598 (51.2%) |
| 4+ Person Household | 5,242 (69.8%) | 2,266 (30.2%) |
| Total Housing Units | 19,742 (43.9%) | 25,214 (56.1%) |
Occupancy by Educational Attainment in Quincy
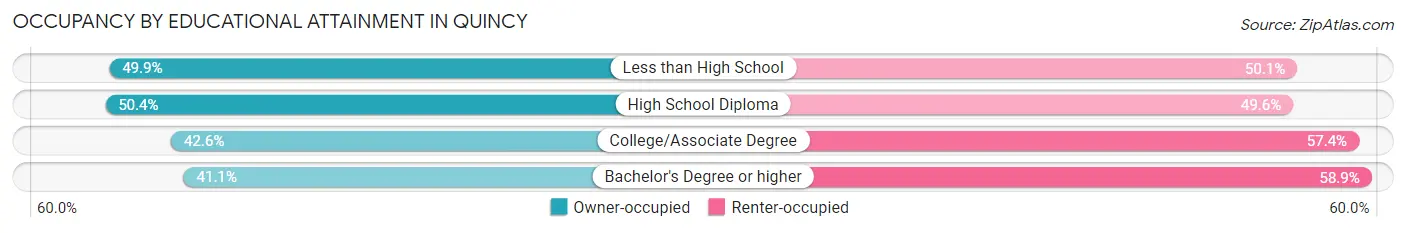
| Household Size | Owner-occupied | Renter-occupied |
| Less than High School | 1,904 (49.9%) | 1,909 (50.1%) |
| High School Diploma | 4,233 (50.4%) | 4,164 (49.6%) |
| College/Associate Degree | 4,349 (42.6%) | 5,864 (57.4%) |
| Bachelor's Degree or higher | 9,256 (41.1%) | 13,277 (58.9%) |
Occupancy by Age of Householder in Quincy
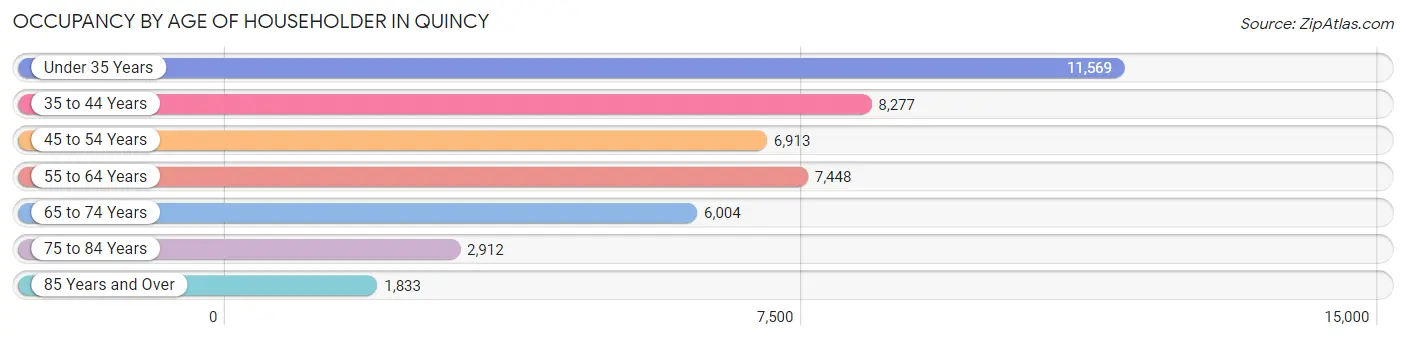
| Age Bracket | # Households | % Households |
| Under 35 Years | 11,569 | 25.7% |
| 35 to 44 Years | 8,277 | 18.4% |
| 45 to 54 Years | 6,913 | 15.4% |
| 55 to 64 Years | 7,448 | 16.6% |
| 65 to 74 Years | 6,004 | 13.4% |
| 75 to 84 Years | 2,912 | 6.5% |
| 85 Years and Over | 1,833 | 4.1% |
| Total | 44,956 | 100.0% |
Housing Finances in Quincy
Median Income by Occupancy in Quincy
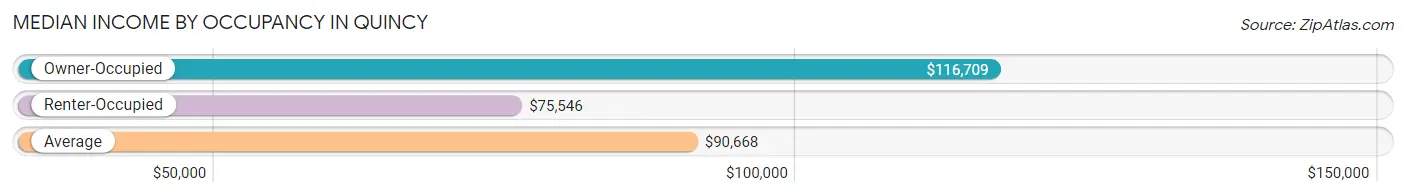
| Occupancy Type | # Households | Median Income |
| Owner-Occupied | 19,742 (43.9%) | $116,709 |
| Renter-Occupied | 25,214 (56.1%) | $75,546 |
| Average | 44,956 (100.0%) | $90,668 |
Occupancy by Householder Income Bracket in Quincy
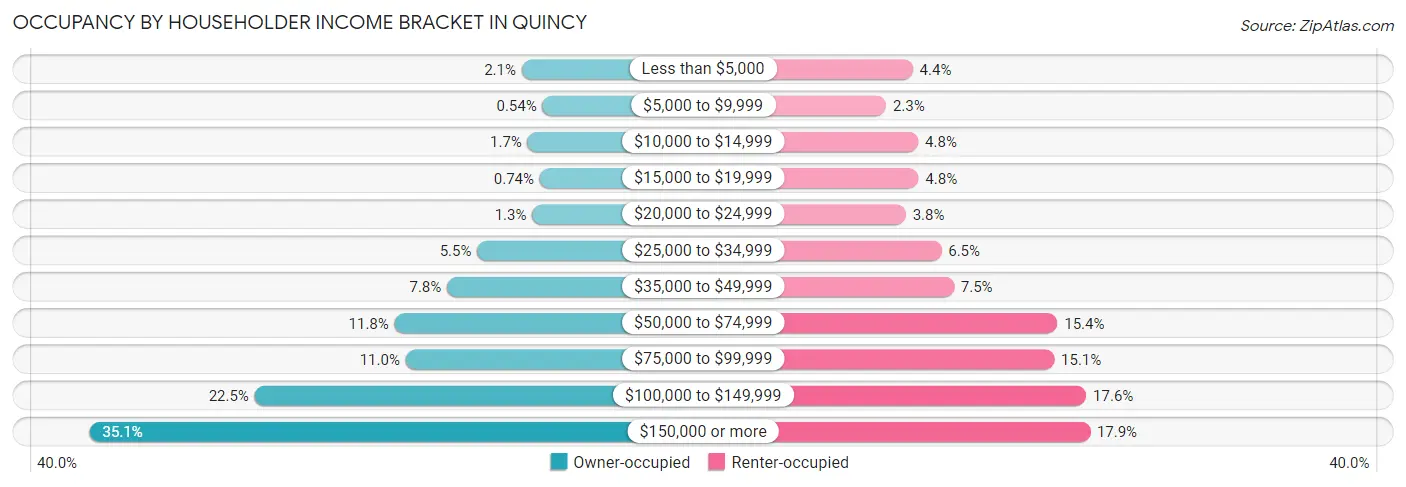
| Income Bracket | Owner-occupied | Renter-occupied |
| Less than $5,000 | 418 (2.1%) | 1,096 (4.3%) |
| $5,000 to $9,999 | 106 (0.5%) | 584 (2.3%) |
| $10,000 to $14,999 | 330 (1.7%) | 1,202 (4.8%) |
| $15,000 to $19,999 | 147 (0.7%) | 1,209 (4.8%) |
| $20,000 to $24,999 | 260 (1.3%) | 964 (3.8%) |
| $25,000 to $34,999 | 1,087 (5.5%) | 1,647 (6.5%) |
| $35,000 to $49,999 | 1,542 (7.8%) | 1,889 (7.5%) |
| $50,000 to $74,999 | 2,331 (11.8%) | 3,875 (15.4%) |
| $75,000 to $99,999 | 2,163 (11.0%) | 3,816 (15.1%) |
| $100,000 to $149,999 | 4,437 (22.5%) | 4,429 (17.6%) |
| $150,000 or more | 6,921 (35.1%) | 4,503 (17.9%) |
| Total | 19,742 (100.0%) | 25,214 (100.0%) |
Monthly Housing Cost Tiers in Quincy
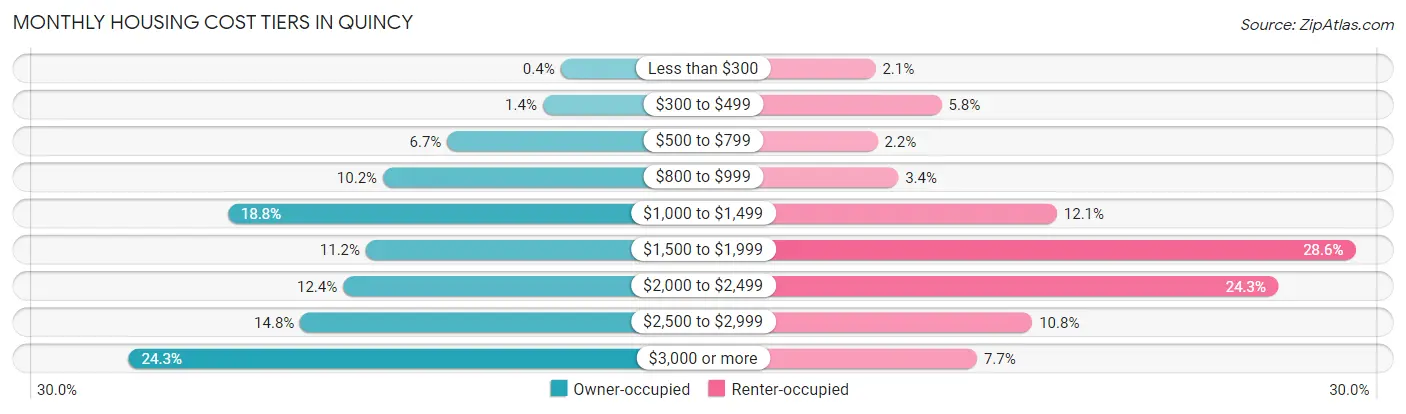
| Monthly Cost | Owner-occupied | Renter-occupied |
| Less than $300 | 78 (0.4%) | 530 (2.1%) |
| $300 to $499 | 273 (1.4%) | 1,451 (5.8%) |
| $500 to $799 | 1,315 (6.7%) | 558 (2.2%) |
| $800 to $999 | 2,016 (10.2%) | 848 (3.4%) |
| $1,000 to $1,499 | 3,705 (18.8%) | 3,055 (12.1%) |
| $1,500 to $1,999 | 2,201 (11.2%) | 7,211 (28.6%) |
| $2,000 to $2,499 | 2,449 (12.4%) | 6,131 (24.3%) |
| $2,500 to $2,999 | 2,917 (14.8%) | 2,713 (10.8%) |
| $3,000 or more | 4,788 (24.2%) | 1,943 (7.7%) |
| Total | 19,742 (100.0%) | 25,214 (100.0%) |
Physical Housing Characteristics in Quincy
Housing Structures in Quincy
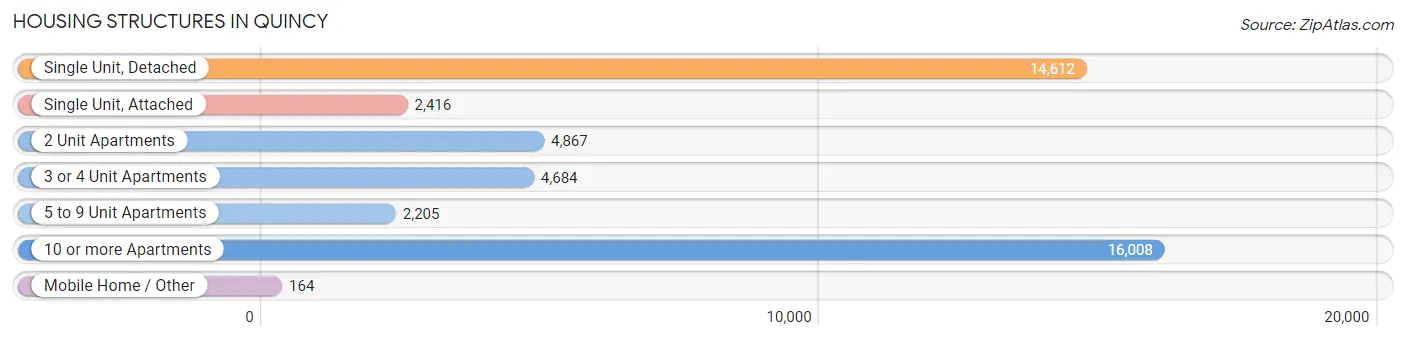
| Structure Type | # Housing Units | % Housing Units |
| Single Unit, Detached | 14,612 | 32.5% |
| Single Unit, Attached | 2,416 | 5.4% |
| 2 Unit Apartments | 4,867 | 10.8% |
| 3 or 4 Unit Apartments | 4,684 | 10.4% |
| 5 to 9 Unit Apartments | 2,205 | 4.9% |
| 10 or more Apartments | 16,008 | 35.6% |
| Mobile Home / Other | 164 | 0.4% |
| Total | 44,956 | 100.0% |
Housing Structures by Occupancy in Quincy
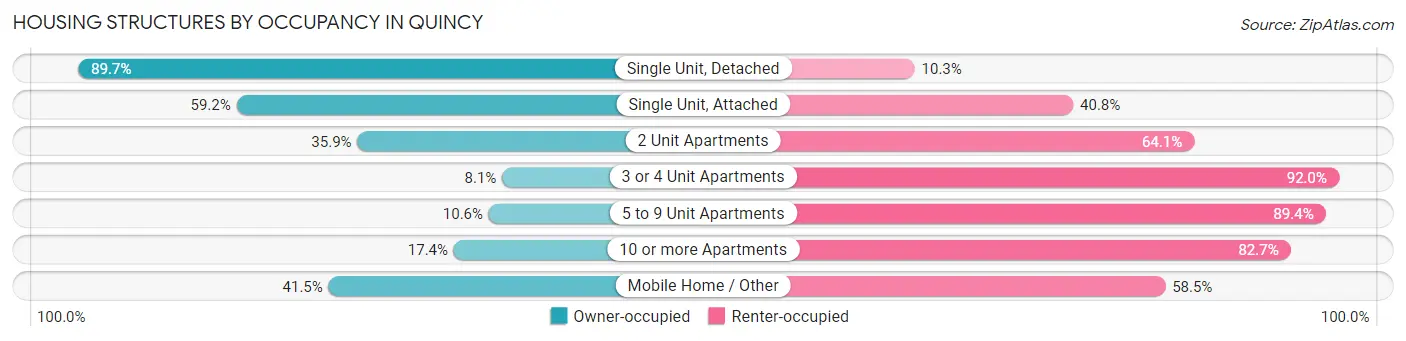
| Structure Type | Owner-occupied | Renter-occupied |
| Single Unit, Detached | 13,108 (89.7%) | 1,504 (10.3%) |
| Single Unit, Attached | 1,430 (59.2%) | 986 (40.8%) |
| 2 Unit Apartments | 1,748 (35.9%) | 3,119 (64.1%) |
| 3 or 4 Unit Apartments | 377 (8.1%) | 4,307 (91.9%) |
| 5 to 9 Unit Apartments | 234 (10.6%) | 1,971 (89.4%) |
| 10 or more Apartments | 2,777 (17.3%) | 13,231 (82.7%) |
| Mobile Home / Other | 68 (41.5%) | 96 (58.5%) |
| Total | 19,742 (43.9%) | 25,214 (56.1%) |
Housing Structures by Number of Rooms in Quincy
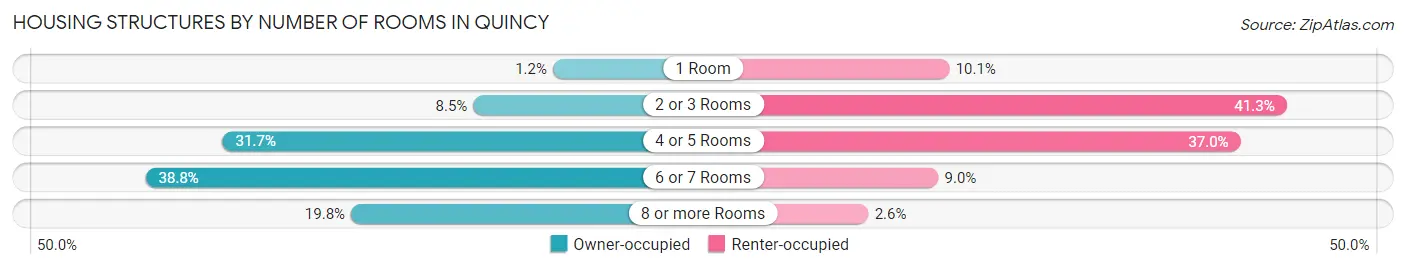
| Number of Rooms | Owner-occupied | Renter-occupied |
| 1 Room | 228 (1.1%) | 2,537 (10.1%) |
| 2 or 3 Rooms | 1,680 (8.5%) | 10,413 (41.3%) |
| 4 or 5 Rooms | 6,257 (31.7%) | 9,339 (37.0%) |
| 6 or 7 Rooms | 7,664 (38.8%) | 2,276 (9.0%) |
| 8 or more Rooms | 3,913 (19.8%) | 649 (2.6%) |
| Total | 19,742 (100.0%) | 25,214 (100.0%) |
Housing Structure by Heating Type in Quincy
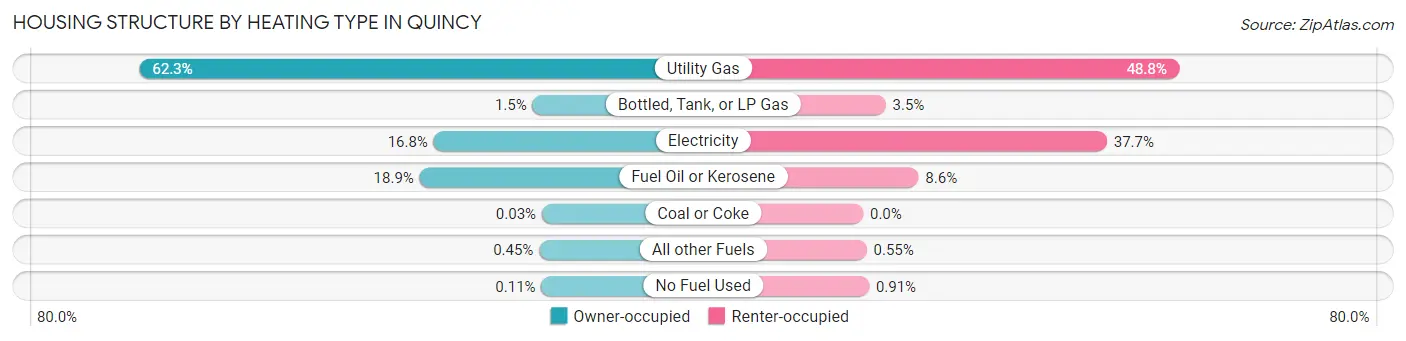
| Heating Type | Owner-occupied | Renter-occupied |
| Utility Gas | 12,289 (62.3%) | 12,305 (48.8%) |
| Bottled, Tank, or LP Gas | 293 (1.5%) | 881 (3.5%) |
| Electricity | 3,308 (16.8%) | 9,500 (37.7%) |
| Fuel Oil or Kerosene | 3,737 (18.9%) | 2,159 (8.6%) |
| Coal or Coke | 5 (0.0%) | 0 (0.0%) |
| All other Fuels | 89 (0.4%) | 139 (0.5%) |
| No Fuel Used | 21 (0.1%) | 230 (0.9%) |
| Total | 19,742 (100.0%) | 25,214 (100.0%) |
Household Vehicle Usage in Quincy
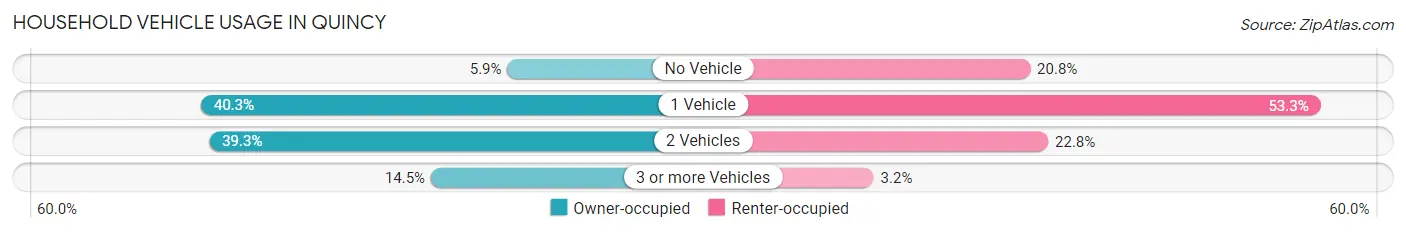
| Vehicles per Household | Owner-occupied | Renter-occupied |
| No Vehicle | 1,169 (5.9%) | 5,232 (20.7%) |
| 1 Vehicle | 7,949 (40.3%) | 13,431 (53.3%) |
| 2 Vehicles | 7,766 (39.3%) | 5,739 (22.8%) |
| 3 or more Vehicles | 2,858 (14.5%) | 812 (3.2%) |
| Total | 19,742 (100.0%) | 25,214 (100.0%) |
Real Estate & Mortgages in Quincy
Real Estate and Mortgage Overview in Quincy
| Characteristic | Without Mortgage | With Mortgage |
| Housing Units | 7,478 | 12,264 |
| Median Property Value | $563,500 | $563,000 |
| Median Household Income | $84,205 | $4,961 |
| Monthly Housing Costs | $1,020 | $4,762 |
| Real Estate Taxes | $6,298 | $251 |
Property Value by Mortgage Status in Quincy
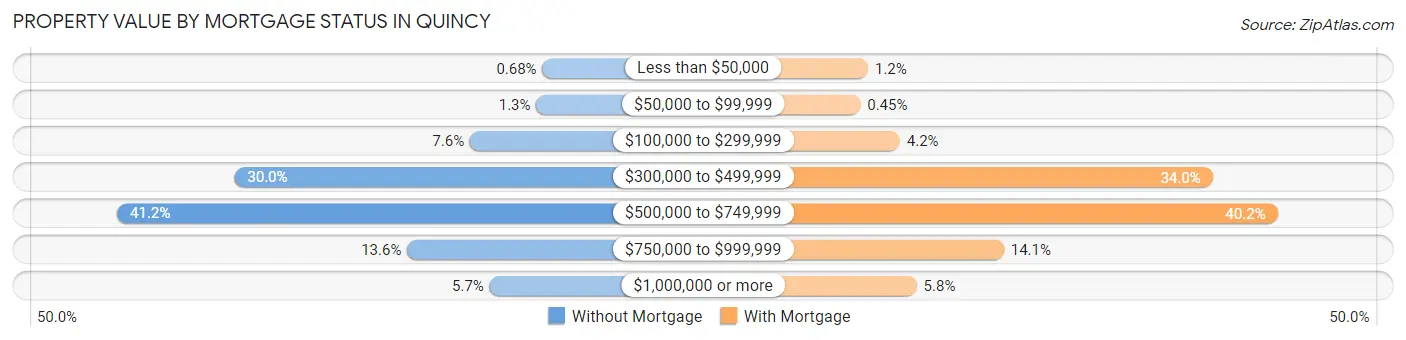
| Property Value | Without Mortgage | With Mortgage |
| Less than $50,000 | 51 (0.7%) | 146 (1.2%) |
| $50,000 to $99,999 | 94 (1.3%) | 55 (0.4%) |
| $100,000 to $299,999 | 567 (7.6%) | 517 (4.2%) |
| $300,000 to $499,999 | 2,245 (30.0%) | 4,171 (34.0%) |
| $500,000 to $749,999 | 3,080 (41.2%) | 4,929 (40.2%) |
| $750,000 to $999,999 | 1,014 (13.6%) | 1,732 (14.1%) |
| $1,000,000 or more | 427 (5.7%) | 714 (5.8%) |
| Total | 7,478 (100.0%) | 12,264 (100.0%) |
Household Income by Mortgage Status in Quincy
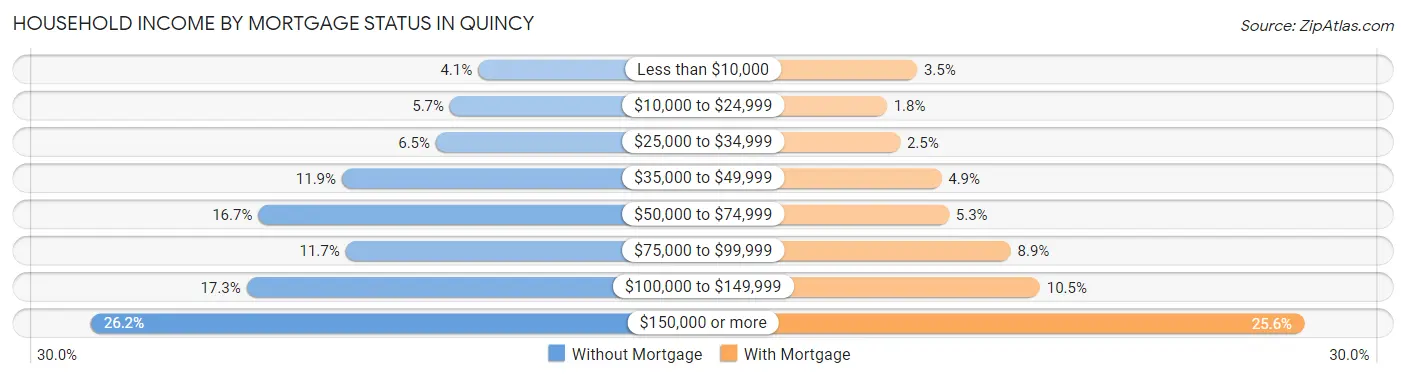
| Household Income | Without Mortgage | With Mortgage |
| Less than $10,000 | 306 (4.1%) | 430 (3.5%) |
| $10,000 to $24,999 | 426 (5.7%) | 218 (1.8%) |
| $25,000 to $34,999 | 486 (6.5%) | 311 (2.5%) |
| $35,000 to $49,999 | 888 (11.9%) | 601 (4.9%) |
| $50,000 to $74,999 | 1,245 (16.7%) | 654 (5.3%) |
| $75,000 to $99,999 | 872 (11.7%) | 1,086 (8.9%) |
| $100,000 to $149,999 | 1,295 (17.3%) | 1,291 (10.5%) |
| $150,000 or more | 1,960 (26.2%) | 3,142 (25.6%) |
| Total | 7,478 (100.0%) | 12,264 (100.0%) |
Property Value to Household Income Ratio in Quincy
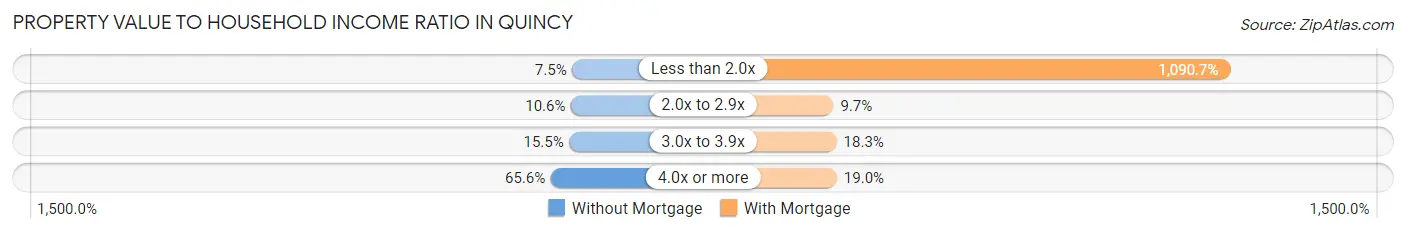
| Value-to-Income Ratio | Without Mortgage | With Mortgage |
| Less than 2.0x | 557 (7.4%) | 133,761 (1,090.7%) |
| 2.0x to 2.9x | 794 (10.6%) | 1,194 (9.7%) |
| 3.0x to 3.9x | 1,162 (15.5%) | 2,248 (18.3%) |
| 4.0x or more | 4,907 (65.6%) | 2,335 (19.0%) |
| Total | 7,478 (100.0%) | 12,264 (100.0%) |
Real Estate Taxes by Mortgage Status in Quincy
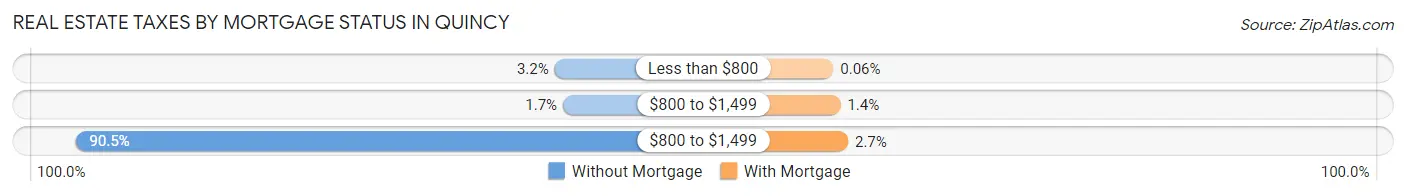
| Property Taxes | Without Mortgage | With Mortgage |
| Less than $800 | 239 (3.2%) | 7 (0.1%) |
| $800 to $1,499 | 126 (1.7%) | 165 (1.3%) |
| $800 to $1,499 | 6,770 (90.5%) | 336 (2.7%) |
| Total | 7,478 (100.0%) | 12,264 (100.0%) |
Health & Disability in Quincy
Health Insurance Coverage by Age in Quincy
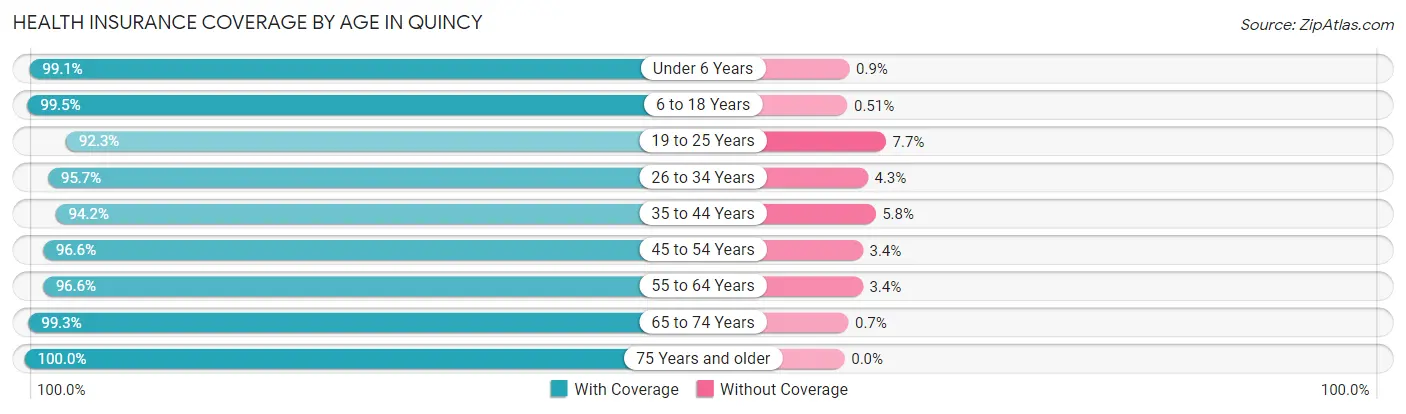
| Age Bracket | With Coverage | Without Coverage |
| Under 6 Years | 5,740 (99.1%) | 52 (0.9%) |
| 6 to 18 Years | 10,113 (99.5%) | 52 (0.5%) |
| 19 to 25 Years | 8,630 (92.3%) | 721 (7.7%) |
| 26 to 34 Years | 18,262 (95.7%) | 826 (4.3%) |
| 35 to 44 Years | 14,122 (94.2%) | 865 (5.8%) |
| 45 to 54 Years | 11,088 (96.6%) | 390 (3.4%) |
| 55 to 64 Years | 12,533 (96.6%) | 438 (3.4%) |
| 65 to 74 Years | 9,679 (99.3%) | 68 (0.7%) |
| 75 Years and older | 6,780 (100.0%) | 0 (0.0%) |
| Total | 96,947 (96.6%) | 3,412 (3.4%) |
Health Insurance Coverage by Citizenship Status in Quincy
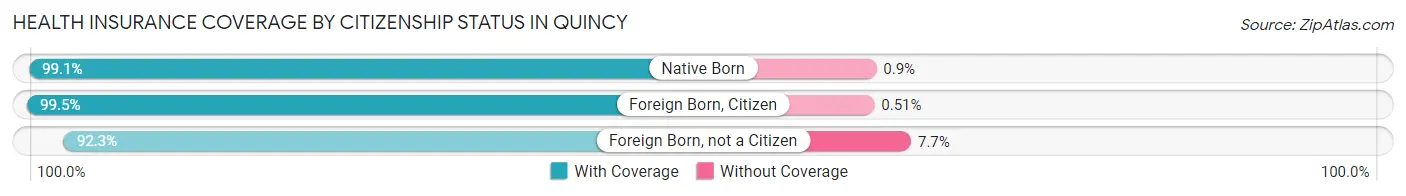
| Citizenship Status | With Coverage | Without Coverage |
| Native Born | 5,740 (99.1%) | 52 (0.9%) |
| Foreign Born, Citizen | 10,113 (99.5%) | 52 (0.5%) |
| Foreign Born, not a Citizen | 8,630 (92.3%) | 721 (7.7%) |
Health Insurance Coverage by Household Income in Quincy
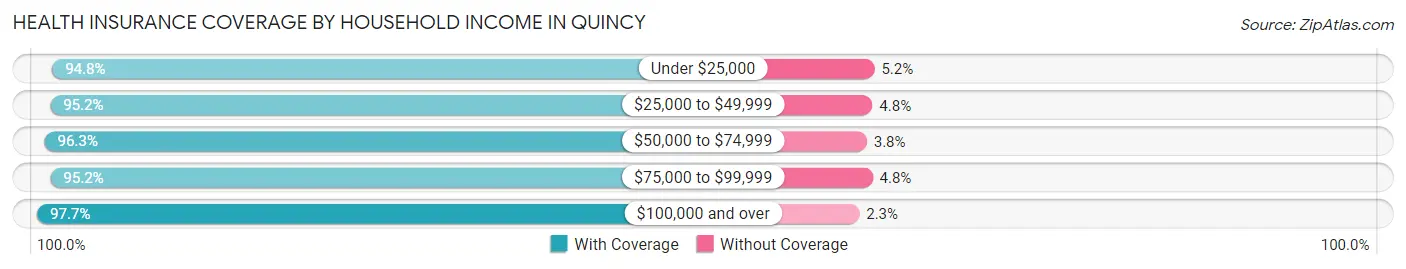
| Household Income | With Coverage | Without Coverage |
| Under $25,000 | 8,865 (94.8%) | 484 (5.2%) |
| $25,000 to $49,999 | 11,494 (95.2%) | 579 (4.8%) |
| $50,000 to $74,999 | 11,816 (96.3%) | 460 (3.7%) |
| $75,000 to $99,999 | 12,021 (95.2%) | 612 (4.8%) |
| $100,000 and over | 51,977 (97.7%) | 1,243 (2.3%) |
Public vs Private Health Insurance Coverage by Age in Quincy
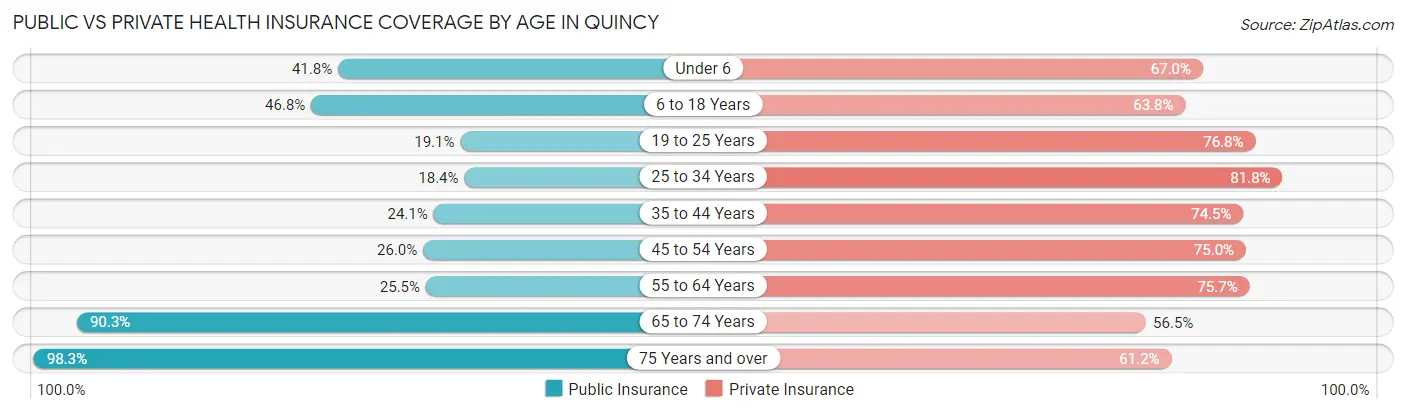
| Age Bracket | Public Insurance | Private Insurance |
| Under 6 | 2,423 (41.8%) | 3,881 (67.0%) |
| 6 to 18 Years | 4,758 (46.8%) | 6,480 (63.7%) |
| 19 to 25 Years | 1,789 (19.1%) | 7,178 (76.8%) |
| 25 to 34 Years | 3,509 (18.4%) | 15,611 (81.8%) |
| 35 to 44 Years | 3,611 (24.1%) | 11,169 (74.5%) |
| 45 to 54 Years | 2,988 (26.0%) | 8,608 (75.0%) |
| 55 to 64 Years | 3,310 (25.5%) | 9,815 (75.7%) |
| 65 to 74 Years | 8,800 (90.3%) | 5,506 (56.5%) |
| 75 Years and over | 6,664 (98.3%) | 4,147 (61.2%) |
| Total | 37,852 (37.7%) | 72,395 (72.1%) |
Disability Status by Sex by Age in Quincy
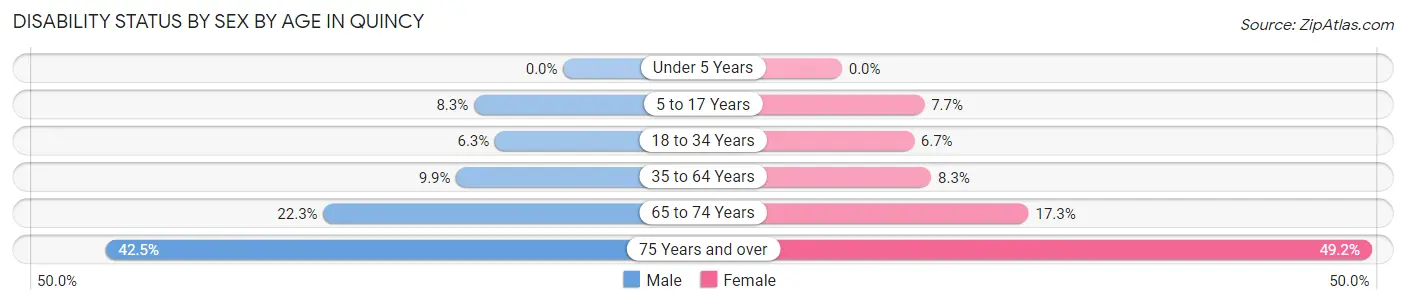
| Age Bracket | Male | Female |
| Under 5 Years | 0 (0.0%) | 0 (0.0%) |
| 5 to 17 Years | 454 (8.3%) | 351 (7.6%) |
| 18 to 34 Years | 950 (6.3%) | 953 (6.7%) |
| 35 to 64 Years | 1,958 (9.9%) | 1,634 (8.3%) |
| 65 to 74 Years | 1,095 (22.3%) | 837 (17.3%) |
| 75 Years and over | 1,163 (42.5%) | 1,988 (49.2%) |
Disability Class by Sex by Age in Quincy
Disability Class: Hearing Difficulty
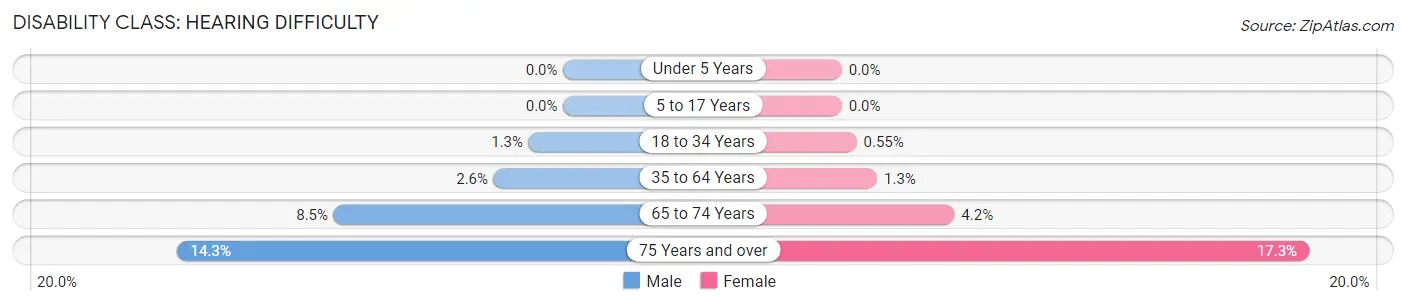
| Age Bracket | Male | Female |
| Under 5 Years | 0 (0.0%) | 0 (0.0%) |
| 5 to 17 Years | 0 (0.0%) | 0 (0.0%) |
| 18 to 34 Years | 192 (1.3%) | 79 (0.5%) |
| 35 to 64 Years | 508 (2.6%) | 259 (1.3%) |
| 65 to 74 Years | 419 (8.5%) | 202 (4.2%) |
| 75 Years and over | 392 (14.3%) | 701 (17.3%) |
Disability Class: Vision Difficulty
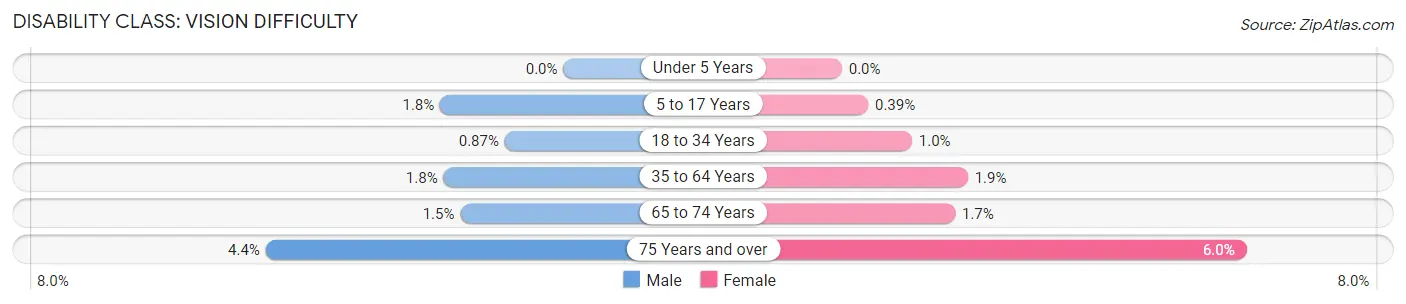
| Age Bracket | Male | Female |
| Under 5 Years | 0 (0.0%) | 0 (0.0%) |
| 5 to 17 Years | 100 (1.8%) | 18 (0.4%) |
| 18 to 34 Years | 131 (0.9%) | 148 (1.0%) |
| 35 to 64 Years | 350 (1.8%) | 368 (1.9%) |
| 65 to 74 Years | 75 (1.5%) | 81 (1.7%) |
| 75 Years and over | 121 (4.4%) | 243 (6.0%) |
Disability Class: Cognitive Difficulty
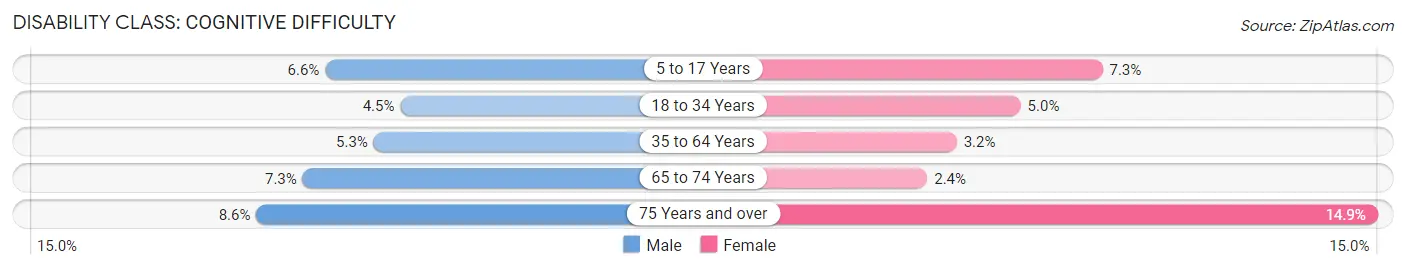
| Age Bracket | Male | Female |
| 5 to 17 Years | 363 (6.6%) | 333 (7.3%) |
| 18 to 34 Years | 682 (4.5%) | 710 (5.0%) |
| 35 to 64 Years | 1,040 (5.3%) | 631 (3.2%) |
| 65 to 74 Years | 357 (7.3%) | 115 (2.4%) |
| 75 Years and over | 234 (8.6%) | 603 (14.9%) |
Disability Class: Ambulatory Difficulty
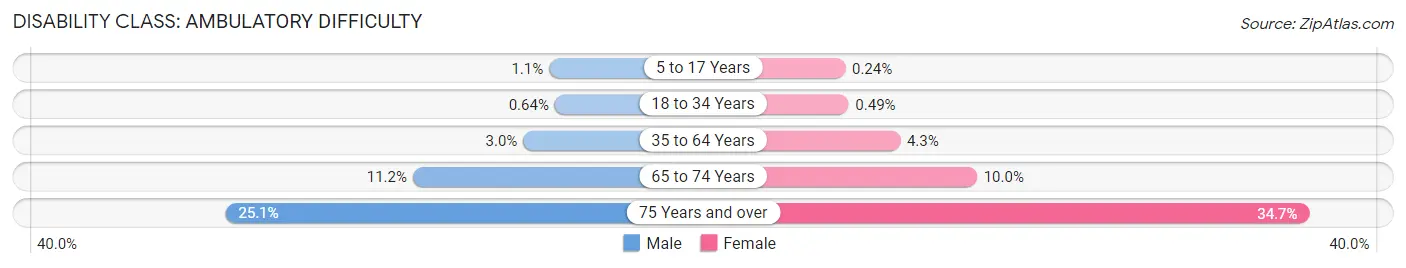
| Age Bracket | Male | Female |
| 5 to 17 Years | 58 (1.1%) | 11 (0.2%) |
| 18 to 34 Years | 96 (0.6%) | 70 (0.5%) |
| 35 to 64 Years | 588 (3.0%) | 852 (4.3%) |
| 65 to 74 Years | 550 (11.2%) | 484 (10.0%) |
| 75 Years and over | 687 (25.1%) | 1,403 (34.7%) |
Disability Class: Self-Care Difficulty
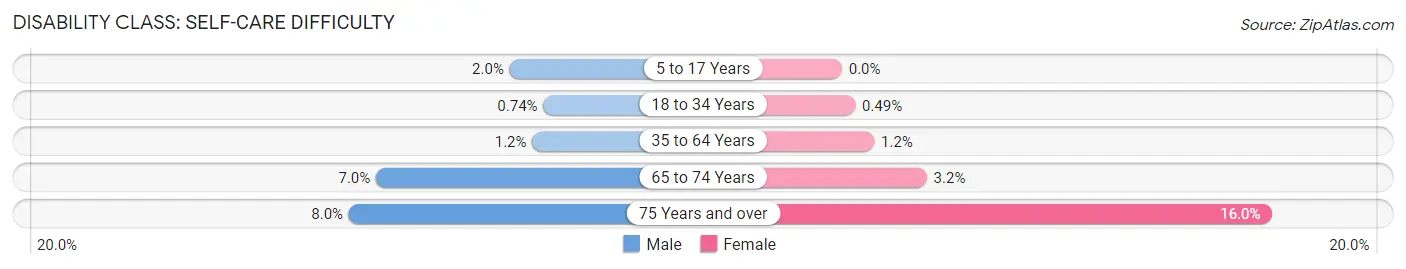
| Age Bracket | Male | Female |
| 5 to 17 Years | 109 (2.0%) | 0 (0.0%) |
| 18 to 34 Years | 111 (0.7%) | 70 (0.5%) |
| 35 to 64 Years | 226 (1.1%) | 236 (1.2%) |
| 65 to 74 Years | 342 (7.0%) | 152 (3.2%) |
| 75 Years and over | 218 (8.0%) | 646 (16.0%) |
Technology Access in Quincy
Computing Device Access in Quincy
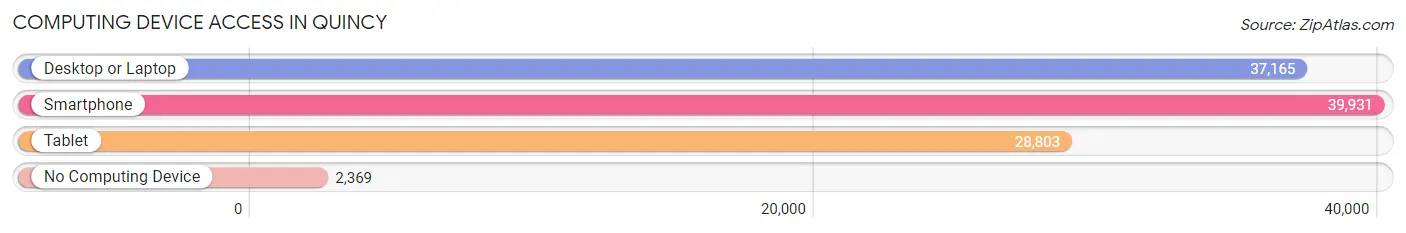
| Device Type | # Households | % Households |
| Desktop or Laptop | 37,165 | 82.7% |
| Smartphone | 39,931 | 88.8% |
| Tablet | 28,803 | 64.1% |
| No Computing Device | 2,369 | 5.3% |
| Total | 44,956 | 100.0% |
Internet Access in Quincy
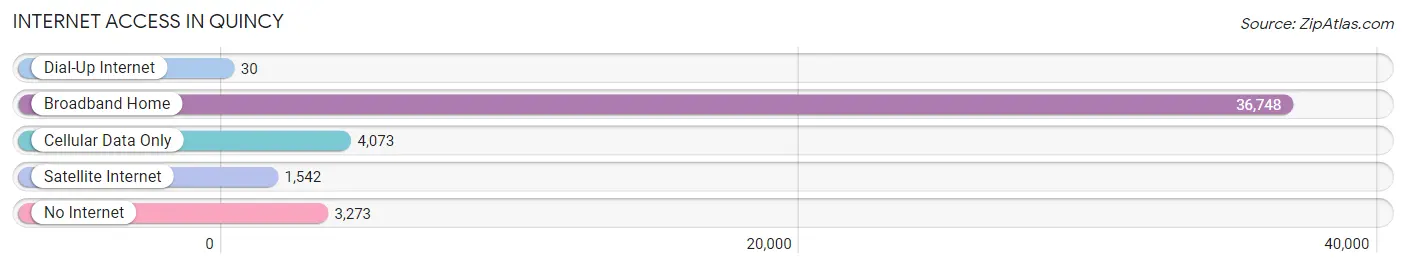
| Internet Type | # Households | % Households |
| Dial-Up Internet | 30 | 0.1% |
| Broadband Home | 36,748 | 81.7% |
| Cellular Data Only | 4,073 | 9.1% |
| Satellite Internet | 1,542 | 3.4% |
| No Internet | 3,273 | 7.3% |
| Total | 44,956 | 100.0% |
Quincy Summary
Quincy, Massachusetts is a city located in Norfolk County, just south of Boston. It is the 8th largest city in the state, with a population of 92,271 as of the 2010 census. The city is named after Colonel John Quincy, who was the mother of President John Adams. Quincy is known for its rich history, diverse geography, vibrant economy, and diverse demographics.
History
Quincy was first settled in 1625 by Captain Wollaston, who named the area Mount Wollaston. The area was later renamed Merry Mount, and then Quincy, after Colonel John Quincy. The city was officially incorporated in 1792.
During the Revolutionary War, Quincy was a major center of activity. The city was the site of the Battle of Quincy, which was fought between the British and American forces in 1775. The city was also the site of the first public school in the United States, which was established in 1798.
In the 19th century, Quincy became a major industrial center. The city was home to several granite quarries, which provided the stone for many of the buildings in Boston. The city was also home to several shipbuilding companies, which built ships for the US Navy.
Geography
Quincy is located in Norfolk County, just south of Boston. The city is bordered by the towns of Braintree, Milton, Randolph, Weymouth, and Hingham. The city is located on the Neponset River, which flows into Boston Harbor.
The city is divided into several neighborhoods, including Adams Shore, Atlantic, Germantown, Houghs Neck, Montclair, North Quincy, Quincy Center, Quincy Point, South Quincy, Squantum, and West Quincy.
The city has a total area of 19.5 square miles, of which 18.2 square miles is land and 1.3 square miles is water. The city is located on the Atlantic Ocean, and is home to several beaches, including Wollaston Beach, Quincy Beach, and Squantum Beach.
Economy
Quincy has a vibrant economy, with a variety of industries. The city is home to several large employers, including Stop & Shop, Quincy Medical Center, and the Quincy Public Schools. The city is also home to several technology companies, including Vertex Pharmaceuticals, EMC Corporation, and LogMeIn.
The city is also home to several educational institutions, including Quincy College, Eastern Nazarene College, and Quincy University.
Demographics
As of the 2010 census, the population of Quincy was 92,271. The city has a diverse population, with a variety of ethnic and racial backgrounds. The largest racial group is White (77.2%), followed by Asian (10.2%), African American (5.7%), and Hispanic or Latino (4.7%).
The median household income in Quincy is $63,845, and the median family income is $76,845. The city has a poverty rate of 11.3%, which is lower than the national average.
Conclusion
Quincy, Massachusetts is a city with a rich history, diverse geography, vibrant economy, and diverse demographics. The city is home to several large employers, educational institutions, and technology companies. The city has a diverse population, with a variety of ethnic and racial backgrounds. The city has a median household income of $63,845, and a poverty rate of 11.3%. Quincy is a great place to live, work, and visit.
Common Questions
What is Per Capita Income in Quincy?
Per Capita income in Quincy is $50,115.
What is the Median Family Income in Quincy?
Median Family Income in Quincy is $110,424.
What is the Median Household income in Quincy?
Median Household Income in Quincy is $90,668.
What is Income or Wage Gap in Quincy?
Income or Wage Gap in Quincy is 15.6%.
Women in Quincy earn 84.4 cents for every dollar earned by a man.
What is Family Income Deficit in Quincy?
Family Income Deficit in Quincy is $9,734.
Families that are below poverty line in Quincy earn $9,734 less on average than the poverty threshold level.
What is Inequality or Gini Index in Quincy?
Inequality or Gini Index in Quincy is 0.44.
What is the Total Population of Quincy?
Total Population of Quincy is 100,981.
What is the Total Male Population of Quincy?
Total Male Population of Quincy is 51,002.
What is the Total Female Population of Quincy?
Total Female Population of Quincy is 49,979.
What is the Ratio of Males per 100 Females in Quincy?
There are 102.05 Males per 100 Females in Quincy.
What is the Ratio of Females per 100 Males in Quincy?
There are 97.99 Females per 100 Males in Quincy.
What is the Median Population Age in Quincy?
Median Population Age in Quincy is 38.3 Years.
What is the Average Family Size in Quincy
Average Family Size in Quincy is 3.0 People.
What is the Average Household Size in Quincy
Average Household Size in Quincy is 2.2 People.
How Large is the Labor Force in Quincy?
There are 61,873 People in the Labor Forcein in Quincy.
What is the Percentage of People in the Labor Force in Quincy?
70.7% of People are in the Labor Force in Quincy.
What is the Unemployment Rate in Quincy?
Unemployment Rate in Quincy is 6.7%.