Beverly, MA Map & Demographics
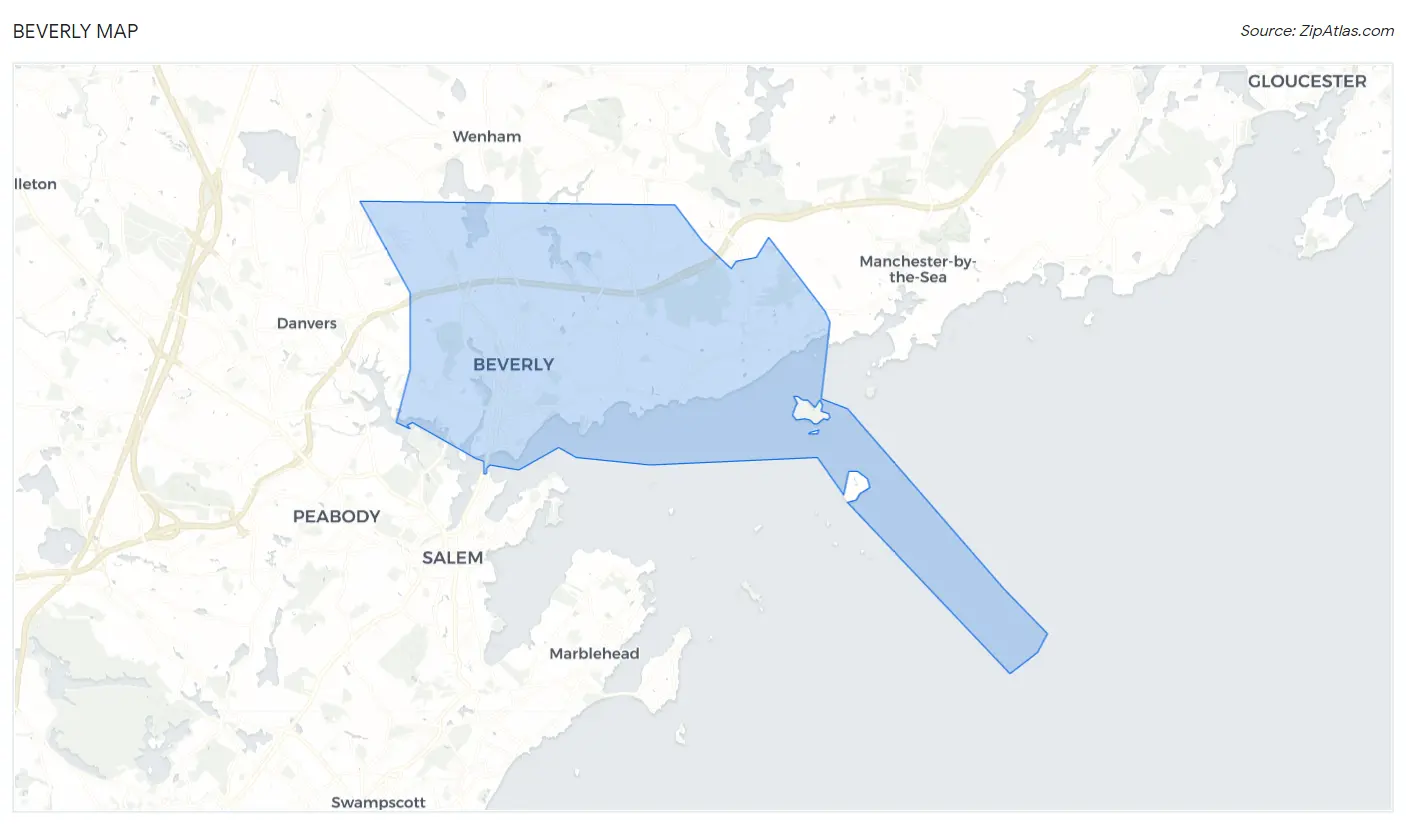
Beverly Map
Beverly Overview
$56,102
PER CAPITA INCOME
$139,677
AVG FAMILY INCOME
$99,525
AVG HOUSEHOLD INCOME
38.2%
WAGE / INCOME GAP [ % ]
61.8¢/ $1
WAGE / INCOME GAP [ $ ]
0.48
INEQUALITY / GINI INDEX
42,414
TOTAL POPULATION
20,361
MALE POPULATION
22,053
FEMALE POPULATION
92.33
MALES / 100 FEMALES
108.31
FEMALES / 100 MALES
40.3
MEDIAN AGE
2.9
AVG FAMILY SIZE
2.3
AVG HOUSEHOLD SIZE
23,963
LABOR FORCE [ PEOPLE ]
68.4%
PERCENT IN LABOR FORCE
3.3%
UNEMPLOYMENT RATE
Beverly Zip Codes
Income in Beverly
Income Overview in Beverly
Per Capita Income in Beverly is $56,102, while median incomes of families and households are $139,677 and $99,525 respectively.
| Characteristic | Number | Measure |
| Per Capita Income | 42,414 | $56,102 |
| Median Family Income | 10,067 | $139,677 |
| Mean Family Income | 10,067 | $174,326 |
| Median Household Income | 16,909 | $99,525 |
| Mean Household Income | 16,909 | $137,479 |
| Income Deficit | 10,067 | $0 |
| Wage / Income Gap (%) | 42,414 | 38.18% |
| Wage / Income Gap ($) | 42,414 | 61.82¢ per $1 |
| Gini / Inequality Index | 42,414 | 0.48 |
Earnings by Sex in Beverly
Average Earnings in Beverly are $59,025, $73,607 for men and $45,505 for women, a difference of 38.2%.
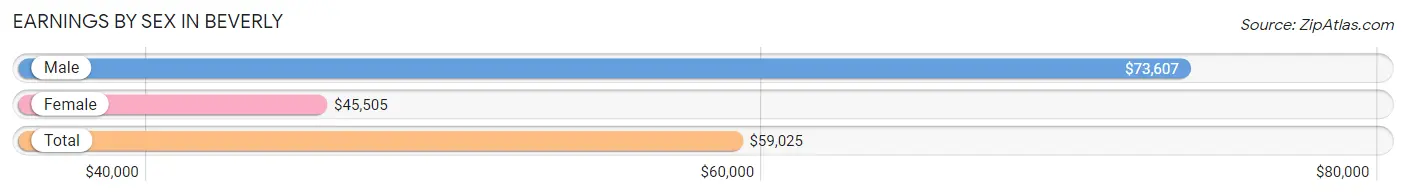
| Sex | Number | Average Earnings |
| Male | 12,599 (49.0%) | $73,607 |
| Female | 13,126 (51.0%) | $45,505 |
| Total | 25,725 (100.0%) | $59,025 |
Earnings by Sex by Income Bracket in Beverly
The most common earnings brackets in Beverly are $100,000+ for men (4,070 | 32.3%) and $100,000+ for women (2,668 | 20.3%).
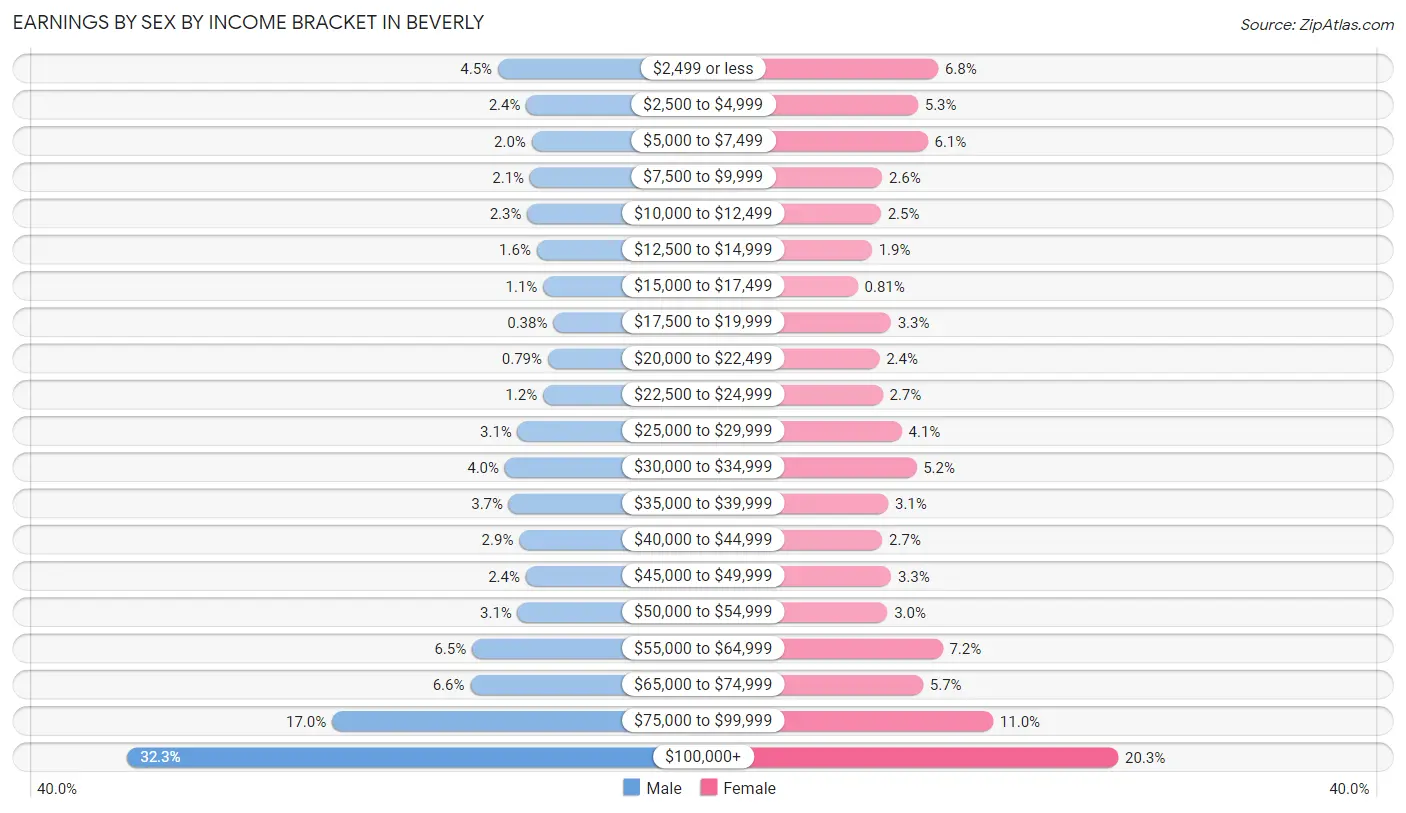
| Income | Male | Female |
| $2,499 or less | 571 (4.5%) | 897 (6.8%) |
| $2,500 to $4,999 | 303 (2.4%) | 698 (5.3%) |
| $5,000 to $7,499 | 252 (2.0%) | 794 (6.0%) |
| $7,500 to $9,999 | 268 (2.1%) | 346 (2.6%) |
| $10,000 to $12,499 | 294 (2.3%) | 334 (2.5%) |
| $12,500 to $14,999 | 204 (1.6%) | 246 (1.9%) |
| $15,000 to $17,499 | 144 (1.1%) | 106 (0.8%) |
| $17,500 to $19,999 | 48 (0.4%) | 432 (3.3%) |
| $20,000 to $22,499 | 100 (0.8%) | 319 (2.4%) |
| $22,500 to $24,999 | 145 (1.1%) | 352 (2.7%) |
| $25,000 to $29,999 | 384 (3.0%) | 540 (4.1%) |
| $30,000 to $34,999 | 505 (4.0%) | 682 (5.2%) |
| $35,000 to $39,999 | 467 (3.7%) | 405 (3.1%) |
| $40,000 to $44,999 | 369 (2.9%) | 348 (2.6%) |
| $45,000 to $49,999 | 308 (2.4%) | 435 (3.3%) |
| $50,000 to $54,999 | 384 (3.0%) | 398 (3.0%) |
| $55,000 to $64,999 | 815 (6.5%) | 941 (7.2%) |
| $65,000 to $74,999 | 831 (6.6%) | 748 (5.7%) |
| $75,000 to $99,999 | 2,137 (17.0%) | 1,437 (11.0%) |
| $100,000+ | 4,070 (32.3%) | 2,668 (20.3%) |
| Total | 12,599 (100.0%) | 13,126 (100.0%) |
Earnings by Sex by Educational Attainment in Beverly
Average earnings in Beverly are $83,442 for men and $59,070 for women, a difference of 29.2%. Men with an educational attainment of bachelor's degree enjoy the highest average annual earnings of $101,862, while those with high school diploma education earn the least with $54,114. Women with an educational attainment of graduate degree earn the most with the average annual earnings of $85,109, while those with high school diploma education have the smallest earnings of $33,778.
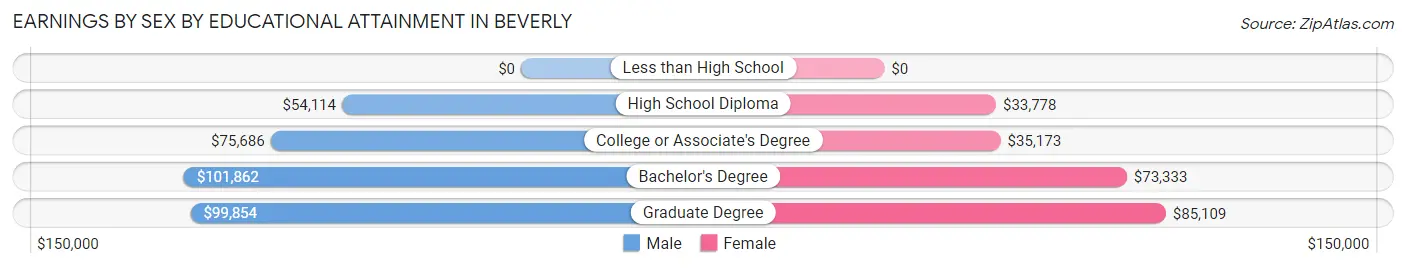
| Educational Attainment | Male Income | Female Income |
| Less than High School | - | - |
| High School Diploma | $54,114 | $33,778 |
| College or Associate's Degree | $75,686 | $35,173 |
| Bachelor's Degree | $101,862 | $73,333 |
| Graduate Degree | $99,854 | $85,109 |
| Total | $83,442 | $59,070 |
Family Income in Beverly
Family Income Brackets in Beverly
According to the Beverly family income data, there are 3,272 families falling into the $200,000+ income range, which is the most common income bracket and makes up 32.5% of all families. Conversely, the $10,000 to $14,999 income bracket is the least frequent group with only 121 families (1.2%) belonging to this category.

| Income Bracket | # Families | % Families |
| Less than $10,000 | 312 | 3.1% |
| $10,000 to $14,999 | 121 | 1.2% |
| $15,000 to $24,999 | 332 | 3.3% |
| $25,000 to $34,999 | 332 | 3.3% |
| $35,000 to $49,999 | 574 | 5.7% |
| $50,000 to $74,999 | 846 | 8.4% |
| $75,000 to $99,999 | 1,138 | 11.3% |
| $100,000 to $149,999 | 1,732 | 17.2% |
| $150,000 to $199,999 | 1,419 | 14.1% |
| $200,000+ | 3,272 | 32.5% |
Family Income by Famaliy Size in Beverly
4-person families (2,218 | 22.0%) account for the highest median family income in Beverly with $199,539 per family, while 2-person families (4,813 | 47.8%) have the highest median income of $54,916 per family member.
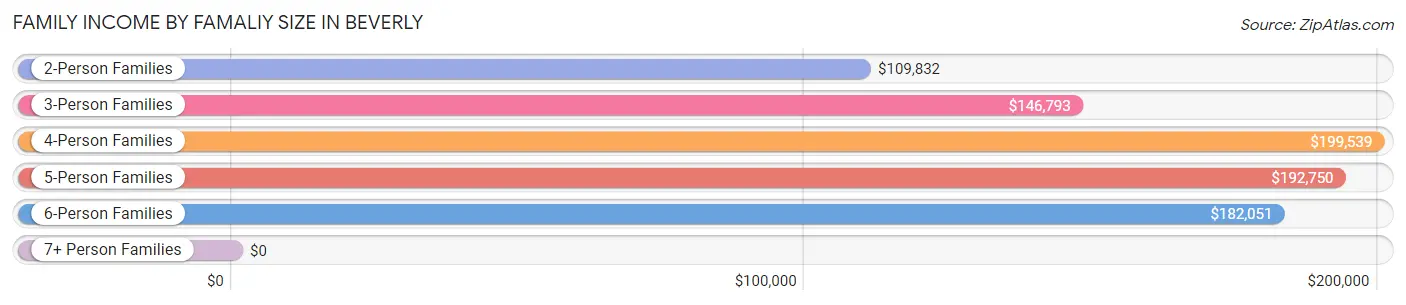
| Income Bracket | # Families | Median Income |
| 2-Person Families | 4,813 (47.8%) | $109,832 |
| 3-Person Families | 2,351 (23.4%) | $146,793 |
| 4-Person Families | 2,218 (22.0%) | $199,539 |
| 5-Person Families | 521 (5.2%) | $192,750 |
| 6-Person Families | 158 (1.6%) | $182,051 |
| 7+ Person Families | 6 (0.1%) | $0 |
| Total | 10,067 (100.0%) | $139,677 |
Family Income by Number of Earners in Beverly
The median family income in Beverly is $139,677, with families comprising 3+ earners (1,223) having the highest median family income of $223,207, while families with no earners (1,419) have the lowest median family income of $44,856, accounting for 12.1% and 14.1% of families, respectively.
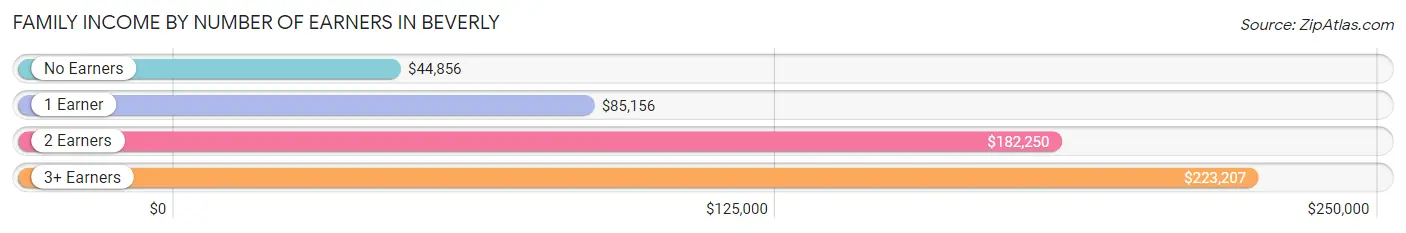
| Number of Earners | # Families | Median Income |
| No Earners | 1,419 (14.1%) | $44,856 |
| 1 Earner | 2,357 (23.4%) | $85,156 |
| 2 Earners | 5,068 (50.3%) | $182,250 |
| 3+ Earners | 1,223 (12.1%) | $223,207 |
| Total | 10,067 (100.0%) | $139,677 |
Household Income in Beverly
Household Income Brackets in Beverly
With 3,619 households falling in the category, the $200,000+ income range is the most frequent in Beverly, accounting for 21.4% of all households. In contrast, only 609 households (3.6%) fall into the $10,000 to $14,999 income bracket, making it the least populous group.
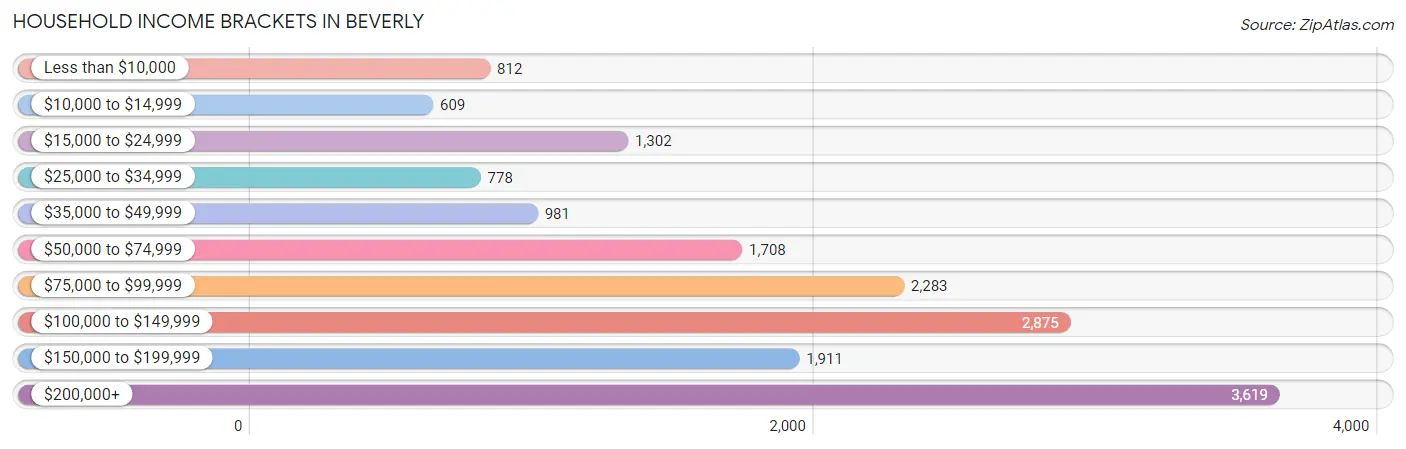
| Income Bracket | # Households | % Households |
| Less than $10,000 | 812 | 4.8% |
| $10,000 to $14,999 | 609 | 3.6% |
| $15,000 to $24,999 | 1,302 | 7.7% |
| $25,000 to $34,999 | 778 | 4.6% |
| $35,000 to $49,999 | 981 | 5.8% |
| $50,000 to $74,999 | 1,708 | 10.1% |
| $75,000 to $99,999 | 2,283 | 13.5% |
| $100,000 to $149,999 | 2,875 | 17.0% |
| $150,000 to $199,999 | 1,911 | 11.3% |
| $200,000+ | 3,619 | 21.4% |
Household Income by Householder Age in Beverly
The median household income in Beverly is $99,525, with the highest median household income of $131,888 found in the 45 to 64 years age bracket for the primary householder. A total of 6,676 households (39.5%) fall into this category. Meanwhile, the 65+ years age bracket for the primary householder has the lowest median household income of $60,394, with 4,807 households (28.4%) in this group.
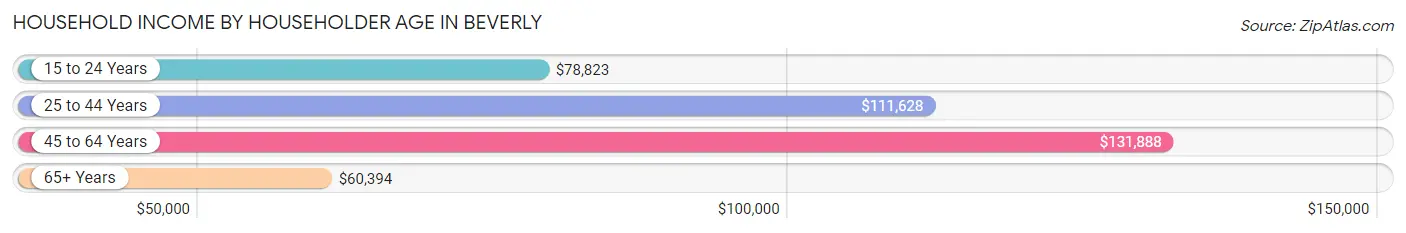
| Income Bracket | # Households | Median Income |
| 15 to 24 Years | 487 (2.9%) | $78,823 |
| 25 to 44 Years | 4,939 (29.2%) | $111,628 |
| 45 to 64 Years | 6,676 (39.5%) | $131,888 |
| 65+ Years | 4,807 (28.4%) | $60,394 |
| Total | 16,909 (100.0%) | $99,525 |
Poverty in Beverly
Income Below Poverty by Sex and Age in Beverly
With 8.1% poverty level for males and 12.9% for females among the residents of Beverly, 6 to 11 year old males and 12 to 14 year old females are the most vulnerable to poverty, with 256 males (18.2%) and 203 females (30.5%) in their respective age groups living below the poverty level.
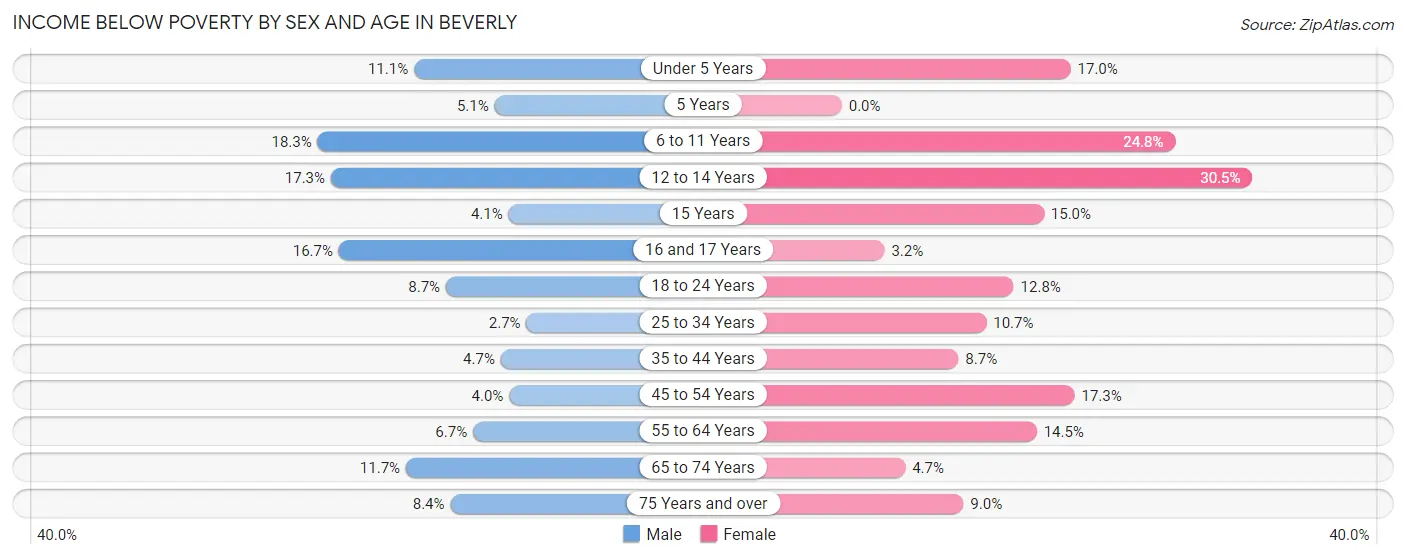
| Age Bracket | Male | Female |
| Under 5 Years | 151 (11.1%) | 158 (17.0%) |
| 5 Years | 9 (5.1%) | 0 (0.0%) |
| 6 to 11 Years | 256 (18.2%) | 315 (24.8%) |
| 12 to 14 Years | 126 (17.3%) | 203 (30.5%) |
| 15 Years | 9 (4.1%) | 36 (15.0%) |
| 16 and 17 Years | 45 (16.7%) | 14 (3.2%) |
| 18 to 24 Years | 96 (8.7%) | 174 (12.8%) |
| 25 to 34 Years | 71 (2.7%) | 297 (10.7%) |
| 35 to 44 Years | 101 (4.6%) | 221 (8.7%) |
| 45 to 54 Years | 107 (4.0%) | 430 (17.3%) |
| 55 to 64 Years | 180 (6.7%) | 505 (14.5%) |
| 65 to 74 Years | 258 (11.7%) | 106 (4.7%) |
| 75 Years and over | 118 (8.4%) | 138 (9.0%) |
| Total | 1,527 (8.1%) | 2,597 (12.9%) |
Income Above Poverty by Sex and Age in Beverly
According to the poverty statistics in Beverly, males aged 25 to 34 years and females aged 5 years are the age groups that are most secure financially, with 97.3% of males and 100.0% of females in these age groups living above the poverty line.
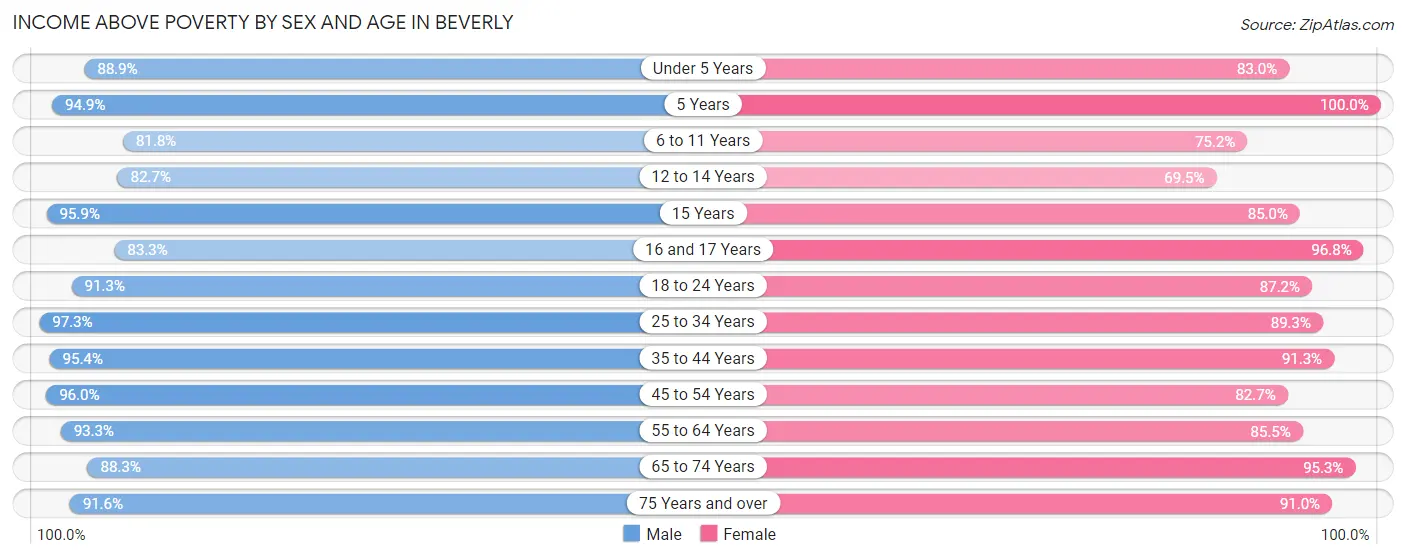
| Age Bracket | Male | Female |
| Under 5 Years | 1,210 (88.9%) | 772 (83.0%) |
| 5 Years | 167 (94.9%) | 193 (100.0%) |
| 6 to 11 Years | 1,147 (81.8%) | 957 (75.2%) |
| 12 to 14 Years | 604 (82.7%) | 463 (69.5%) |
| 15 Years | 212 (95.9%) | 204 (85.0%) |
| 16 and 17 Years | 225 (83.3%) | 427 (96.8%) |
| 18 to 24 Years | 1,005 (91.3%) | 1,190 (87.2%) |
| 25 to 34 Years | 2,516 (97.3%) | 2,472 (89.3%) |
| 35 to 44 Years | 2,070 (95.4%) | 2,330 (91.3%) |
| 45 to 54 Years | 2,553 (96.0%) | 2,058 (82.7%) |
| 55 to 64 Years | 2,503 (93.3%) | 2,984 (85.5%) |
| 65 to 74 Years | 1,949 (88.3%) | 2,145 (95.3%) |
| 75 Years and over | 1,289 (91.6%) | 1,391 (91.0%) |
| Total | 17,450 (91.9%) | 17,586 (87.1%) |
Income Below Poverty Among Married-Couple Families in Beverly
The poverty statistics for married-couple families in Beverly show that 2.3% or 184 of the total 7,978 families live below the poverty line. Families with no children have the highest poverty rate of 3.2%, comprising of 154 families. On the other hand, families with 3 or 4 children have the lowest poverty rate of 0.0%, which includes 0 families.
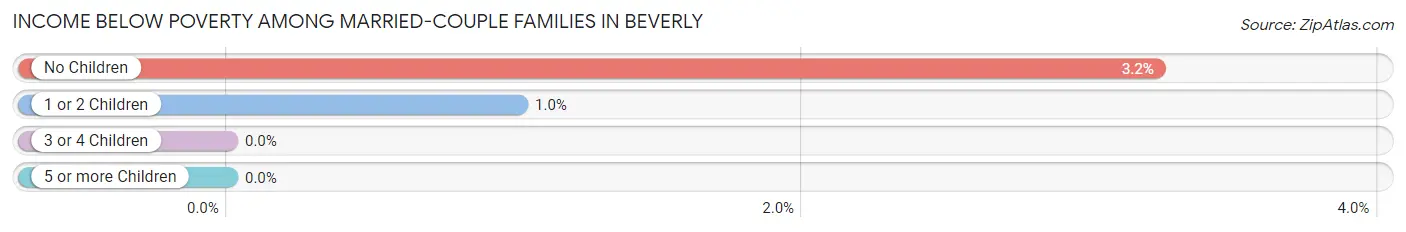
| Children | Above Poverty | Below Poverty |
| No Children | 4,621 (96.8%) | 154 (3.2%) |
| 1 or 2 Children | 2,930 (99.0%) | 30 (1.0%) |
| 3 or 4 Children | 243 (100.0%) | 0 (0.0%) |
| 5 or more Children | 0 (0.0%) | 0 (0.0%) |
| Total | 7,794 (97.7%) | 184 (2.3%) |
Income Below Poverty Among Single-Parent Households in Beverly
According to the poverty data in Beverly, 11.1% or 50 single-father households and 32.5% or 532 single-mother households are living below the poverty line. Among single-father households, those with 1 or 2 children have the highest poverty rate, with 50 households (24.0%) experiencing poverty. Likewise, among single-mother households, those with 3 or 4 children have the highest poverty rate, with 259 households (73.2%) falling below the poverty line.
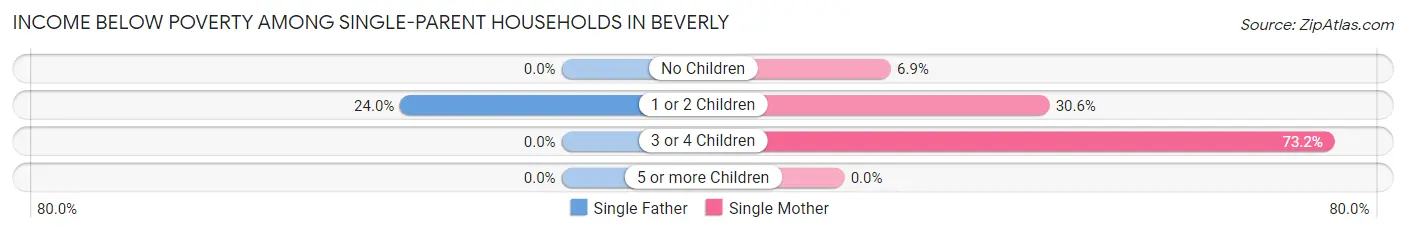
| Children | Single Father | Single Mother |
| No Children | 0 (0.0%) | 35 (6.9%) |
| 1 or 2 Children | 50 (24.0%) | 238 (30.5%) |
| 3 or 4 Children | 0 (0.0%) | 259 (73.2%) |
| 5 or more Children | 0 (0.0%) | 0 (0.0%) |
| Total | 50 (11.1%) | 532 (32.5%) |
Income Below Poverty Among Married-Couple vs Single-Parent Households in Beverly
The poverty data for Beverly shows that 184 of the married-couple family households (2.3%) and 582 of the single-parent households (27.9%) are living below the poverty level. Within the married-couple family households, those with no children have the highest poverty rate, with 154 households (3.2%) falling below the poverty line. Among the single-parent households, those with 3 or 4 children have the highest poverty rate, with 259 household (69.4%) living below poverty.
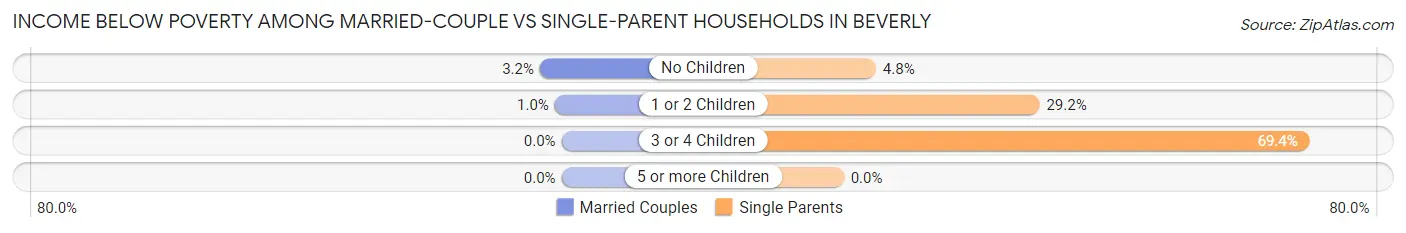
| Children | Married-Couple Families | Single-Parent Households |
| No Children | 154 (3.2%) | 35 (4.8%) |
| 1 or 2 Children | 30 (1.0%) | 288 (29.2%) |
| 3 or 4 Children | 0 (0.0%) | 259 (69.4%) |
| 5 or more Children | 0 (0.0%) | 0 (0.0%) |
| Total | 184 (2.3%) | 582 (27.9%) |
Race in Beverly
The most populous races in Beverly are White / Caucasian (37,173 | 87.6%), Hispanic or Latino (2,741 | 6.5%), and Two or more Races (2,274 | 5.4%).
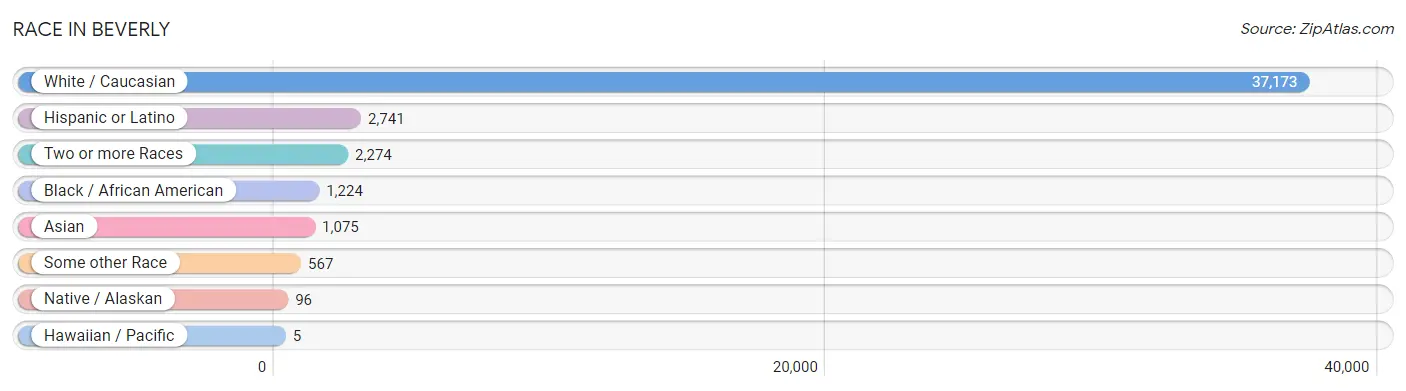
| Race | # Population | % Population |
| Asian | 1,075 | 2.5% |
| Black / African American | 1,224 | 2.9% |
| Hawaiian / Pacific | 5 | 0.0% |
| Hispanic or Latino | 2,741 | 6.5% |
| Native / Alaskan | 96 | 0.2% |
| White / Caucasian | 37,173 | 87.6% |
| Two or more Races | 2,274 | 5.4% |
| Some other Race | 567 | 1.3% |
| Total | 42,414 | 100.0% |
Ancestry in Beverly
The most populous ancestries reported in Beverly are Irish (9,432 | 22.2%), Italian (6,758 | 15.9%), English (5,529 | 13.0%), German (2,737 | 6.5%), and French (2,447 | 5.8%), together accounting for 63.4% of all Beverly residents.
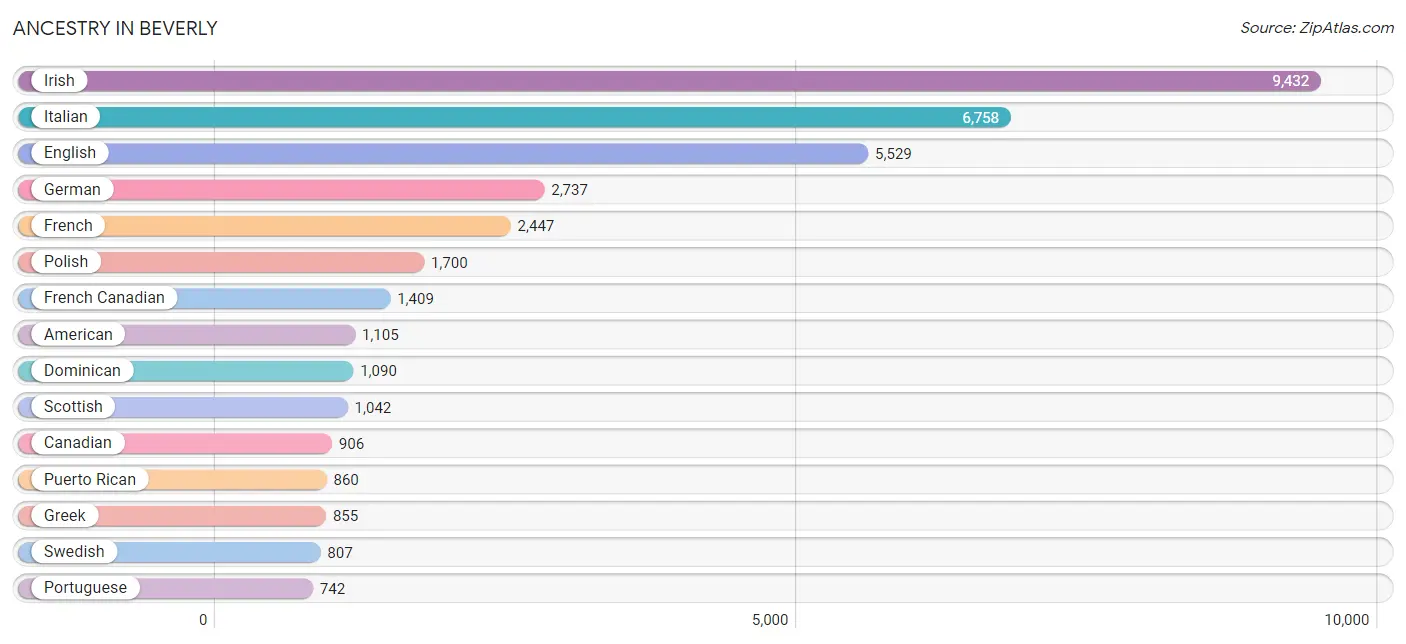
| Ancestry | # Population | % Population |
| African | 100 | 0.2% |
| Albanian | 221 | 0.5% |
| American | 1,105 | 2.6% |
| Arab | 487 | 1.1% |
| Argentinean | 24 | 0.1% |
| Armenian | 149 | 0.4% |
| Australian | 34 | 0.1% |
| Austrian | 122 | 0.3% |
| Belgian | 4 | 0.0% |
| Belizean | 7 | 0.0% |
| Bhutanese | 112 | 0.3% |
| Brazilian | 417 | 1.0% |
| British | 256 | 0.6% |
| Burmese | 198 | 0.5% |
| Canadian | 906 | 2.1% |
| Cape Verdean | 78 | 0.2% |
| Central American | 233 | 0.5% |
| Central American Indian | 42 | 0.1% |
| Chilean | 8 | 0.0% |
| Colombian | 47 | 0.1% |
| Costa Rican | 87 | 0.2% |
| Croatian | 8 | 0.0% |
| Cuban | 112 | 0.3% |
| Czech | 112 | 0.3% |
| Dominican | 1,090 | 2.6% |
| Dutch | 279 | 0.7% |
| Eastern European | 140 | 0.3% |
| Ecuadorian | 48 | 0.1% |
| Egyptian | 4 | 0.0% |
| English | 5,529 | 13.0% |
| European | 692 | 1.6% |
| Finnish | 117 | 0.3% |
| French | 2,447 | 5.8% |
| French Canadian | 1,409 | 3.3% |
| German | 2,737 | 6.5% |
| Greek | 855 | 2.0% |
| Guamanian / Chamorro | 5 | 0.0% |
| Guatemalan | 3 | 0.0% |
| Haitian | 169 | 0.4% |
| Honduran | 54 | 0.1% |
| Hungarian | 203 | 0.5% |
| Icelander | 56 | 0.1% |
| Indian (Asian) | 323 | 0.8% |
| Irish | 9,432 | 22.2% |
| Iroquois | 45 | 0.1% |
| Israeli | 10 | 0.0% |
| Italian | 6,758 | 15.9% |
| Jamaican | 19 | 0.0% |
| Japanese | 73 | 0.2% |
| Jordanian | 15 | 0.0% |
| Kenyan | 26 | 0.1% |
| Korean | 223 | 0.5% |
| Latvian | 36 | 0.1% |
| Lebanese | 121 | 0.3% |
| Lithuanian | 121 | 0.3% |
| Mexican | 163 | 0.4% |
| Mexican American Indian | 46 | 0.1% |
| Moroccan | 287 | 0.7% |
| Nigerian | 75 | 0.2% |
| Northern European | 139 | 0.3% |
| Norwegian | 647 | 1.5% |
| Pakistani | 6 | 0.0% |
| Pennsylvania German | 22 | 0.1% |
| Peruvian | 35 | 0.1% |
| Polish | 1,700 | 4.0% |
| Portuguese | 742 | 1.8% |
| Puerto Rican | 860 | 2.0% |
| Romanian | 40 | 0.1% |
| Russian | 532 | 1.3% |
| Salvadoran | 89 | 0.2% |
| Scandinavian | 89 | 0.2% |
| Scotch-Irish | 285 | 0.7% |
| Scottish | 1,042 | 2.5% |
| Slavic | 9 | 0.0% |
| Slovak | 29 | 0.1% |
| South African | 40 | 0.1% |
| South American | 162 | 0.4% |
| Spaniard | 43 | 0.1% |
| Sri Lankan | 205 | 0.5% |
| Subsaharan African | 439 | 1.0% |
| Swedish | 807 | 1.9% |
| Swiss | 49 | 0.1% |
| Syrian | 27 | 0.1% |
| Thai | 163 | 0.4% |
| Trinidadian and Tobagonian | 7 | 0.0% |
| Turkish | 20 | 0.1% |
| Ugandan | 38 | 0.1% |
| Ukrainian | 184 | 0.4% |
| Vietnamese | 12 | 0.0% |
| Welsh | 333 | 0.8% |
| West Indian | 42 | 0.1% |
| Yugoslavian | 186 | 0.4% |
| Zimbabwean | 21 | 0.1% | View All 93 Rows |
Immigrants in Beverly
The most numerous immigrant groups reported in Beverly came from Latin America (1,520 | 3.6%), Europe (1,136 | 2.7%), Asia (708 | 1.7%), South America (687 | 1.6%), and Caribbean (668 | 1.6%), together accounting for 11.1% of all Beverly residents.
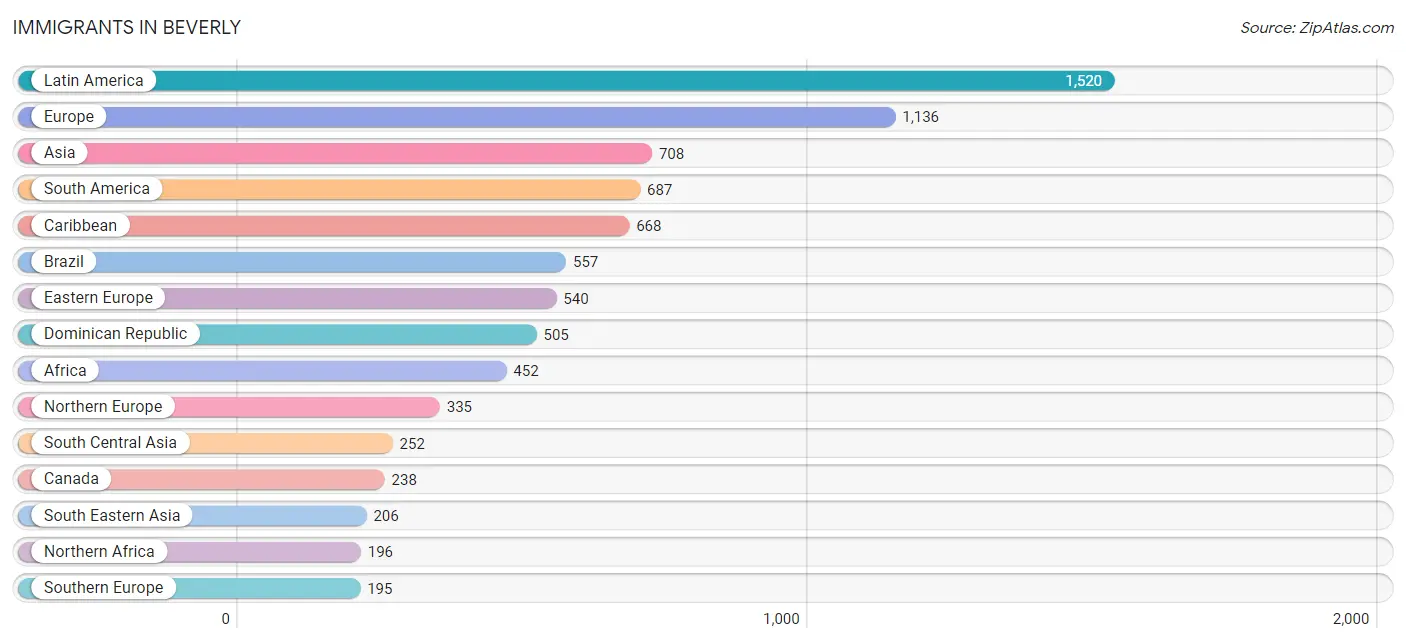
| Immigration Origin | # Population | % Population |
| Afghanistan | 65 | 0.2% |
| Africa | 452 | 1.1% |
| Albania | 190 | 0.4% |
| Argentina | 9 | 0.0% |
| Asia | 708 | 1.7% |
| Australia | 126 | 0.3% |
| Azores | 16 | 0.0% |
| Bangladesh | 12 | 0.0% |
| Bosnia and Herzegovina | 54 | 0.1% |
| Brazil | 557 | 1.3% |
| Canada | 238 | 0.6% |
| Caribbean | 668 | 1.6% |
| Central America | 165 | 0.4% |
| Chile | 8 | 0.0% |
| China | 17 | 0.0% |
| Colombia | 22 | 0.1% |
| Costa Rica | 87 | 0.2% |
| Cuba | 92 | 0.2% |
| Czechoslovakia | 46 | 0.1% |
| Dominican Republic | 505 | 1.2% |
| Eastern Africa | 129 | 0.3% |
| Eastern Asia | 159 | 0.4% |
| Eastern Europe | 540 | 1.3% |
| Ecuador | 44 | 0.1% |
| Egypt | 19 | 0.0% |
| El Salvador | 21 | 0.1% |
| England | 27 | 0.1% |
| Europe | 1,136 | 2.7% |
| Germany | 43 | 0.1% |
| Ghana | 17 | 0.0% |
| Greece | 38 | 0.1% |
| Guatemala | 3 | 0.0% |
| Haiti | 61 | 0.1% |
| Honduras | 54 | 0.1% |
| Hungary | 29 | 0.1% |
| India | 175 | 0.4% |
| Iraq | 28 | 0.1% |
| Ireland | 138 | 0.3% |
| Italy | 38 | 0.1% |
| Japan | 15 | 0.0% |
| Jordan | 15 | 0.0% |
| Kenya | 24 | 0.1% |
| Korea | 127 | 0.3% |
| Kuwait | 24 | 0.1% |
| Latin America | 1,520 | 3.6% |
| Lebanon | 8 | 0.0% |
| Middle Africa | 26 | 0.1% |
| Morocco | 177 | 0.4% |
| Netherlands | 4 | 0.0% |
| Nigeria | 75 | 0.2% |
| Northern Africa | 196 | 0.5% |
| Northern Europe | 335 | 0.8% |
| Oceania | 126 | 0.3% |
| Peru | 47 | 0.1% |
| Philippines | 139 | 0.3% |
| Poland | 61 | 0.1% |
| Portugal | 112 | 0.3% |
| Russia | 80 | 0.2% |
| Saudi Arabia | 16 | 0.0% |
| Scotland | 34 | 0.1% |
| Singapore | 12 | 0.0% |
| South America | 687 | 1.6% |
| South Central Asia | 252 | 0.6% |
| South Eastern Asia | 206 | 0.5% |
| Southern Europe | 195 | 0.5% |
| Spain | 7 | 0.0% |
| Sweden | 43 | 0.1% |
| Switzerland | 19 | 0.0% |
| Trinidad and Tobago | 10 | 0.0% |
| Uganda | 50 | 0.1% |
| Ukraine | 80 | 0.2% |
| Vietnam | 55 | 0.1% |
| Western Africa | 92 | 0.2% |
| Western Asia | 91 | 0.2% |
| Western Europe | 66 | 0.2% |
| Zaire | 26 | 0.1% |
| Zimbabwe | 37 | 0.1% | View All 77 Rows |
Sex and Age in Beverly
Sex and Age in Beverly
The most populous age groups in Beverly are 45 to 49 Years (1,506 | 7.4%) for men and 20 to 24 Years (2,142 | 9.7%) for women.
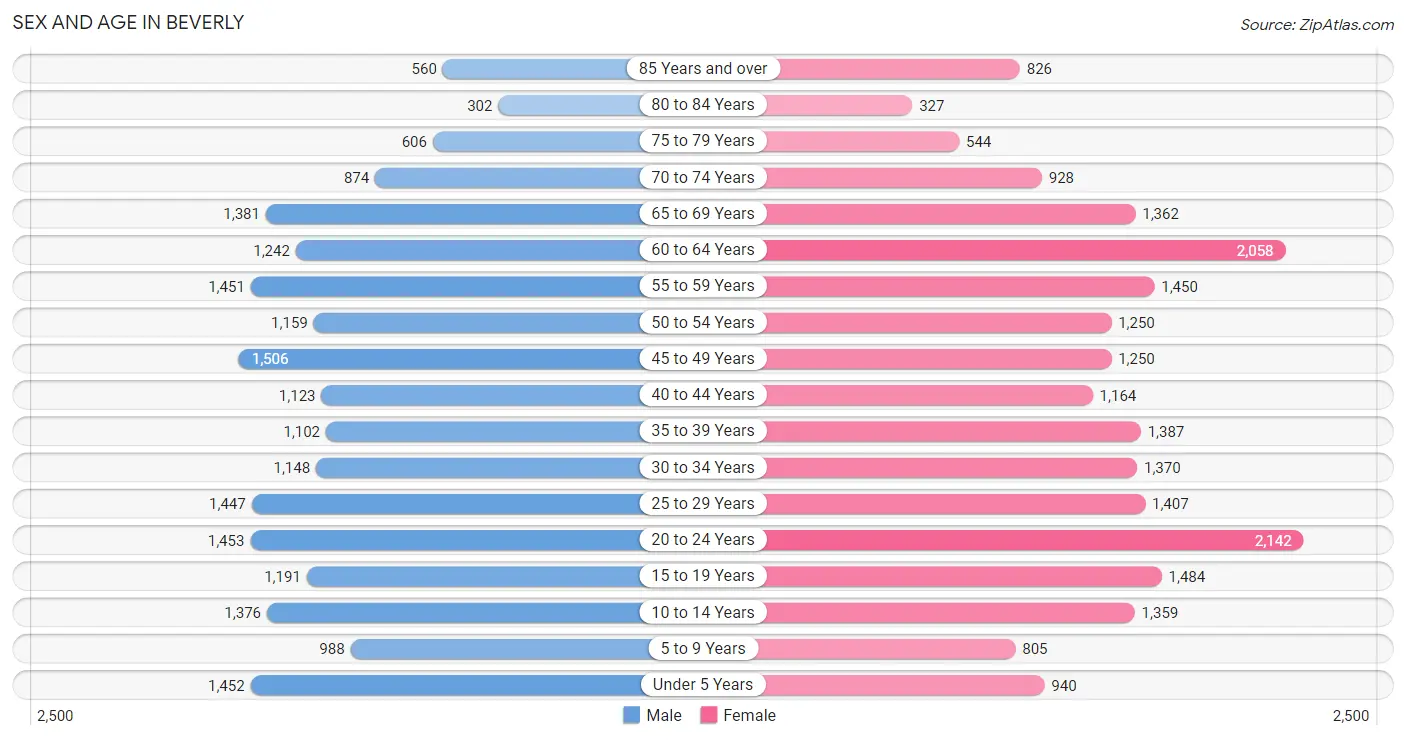
| Age Bracket | Male | Female |
| Under 5 Years | 1,452 (7.1%) | 940 (4.3%) |
| 5 to 9 Years | 988 (4.9%) | 805 (3.6%) |
| 10 to 14 Years | 1,376 (6.8%) | 1,359 (6.2%) |
| 15 to 19 Years | 1,191 (5.9%) | 1,484 (6.7%) |
| 20 to 24 Years | 1,453 (7.1%) | 2,142 (9.7%) |
| 25 to 29 Years | 1,447 (7.1%) | 1,407 (6.4%) |
| 30 to 34 Years | 1,148 (5.6%) | 1,370 (6.2%) |
| 35 to 39 Years | 1,102 (5.4%) | 1,387 (6.3%) |
| 40 to 44 Years | 1,123 (5.5%) | 1,164 (5.3%) |
| 45 to 49 Years | 1,506 (7.4%) | 1,250 (5.7%) |
| 50 to 54 Years | 1,159 (5.7%) | 1,250 (5.7%) |
| 55 to 59 Years | 1,451 (7.1%) | 1,450 (6.6%) |
| 60 to 64 Years | 1,242 (6.1%) | 2,058 (9.3%) |
| 65 to 69 Years | 1,381 (6.8%) | 1,362 (6.2%) |
| 70 to 74 Years | 874 (4.3%) | 928 (4.2%) |
| 75 to 79 Years | 606 (3.0%) | 544 (2.5%) |
| 80 to 84 Years | 302 (1.5%) | 327 (1.5%) |
| 85 Years and over | 560 (2.8%) | 826 (3.7%) |
| Total | 20,361 (100.0%) | 22,053 (100.0%) |
Families and Households in Beverly
Median Family Size in Beverly
The median family size in Beverly is 2.93 persons per family, with single female/mother families (1,639 | 16.3%) accounting for the largest median family size of 3.1 persons per family. On the other hand, single male/father families (450 | 4.5%) represent the smallest median family size with 2.42 persons per family.
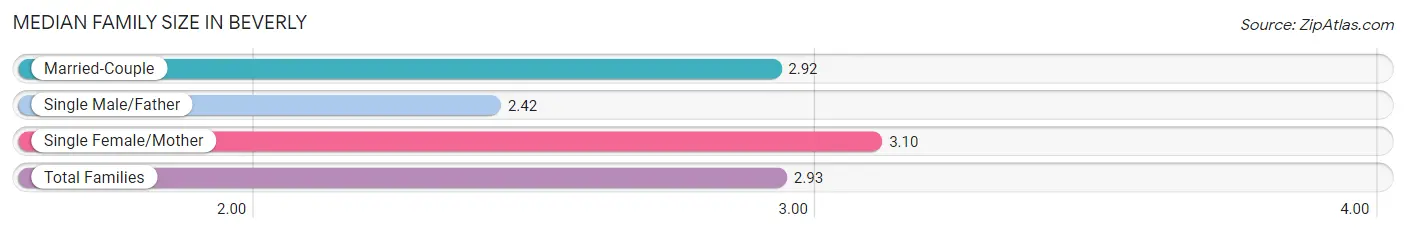
| Family Type | # Families | Family Size |
| Married-Couple | 7,978 (79.2%) | 2.92 |
| Single Male/Father | 450 (4.5%) | 2.42 |
| Single Female/Mother | 1,639 (16.3%) | 3.10 |
| Total Families | 10,067 (100.0%) | 2.93 |
Median Household Size in Beverly
The median household size in Beverly is 2.31 persons per household, with single female/mother households (1,639 | 9.7%) accounting for the largest median household size of 3.23 persons per household. non-family households (6,842 | 40.5%) represent the smallest median household size with 1.30 persons per household.
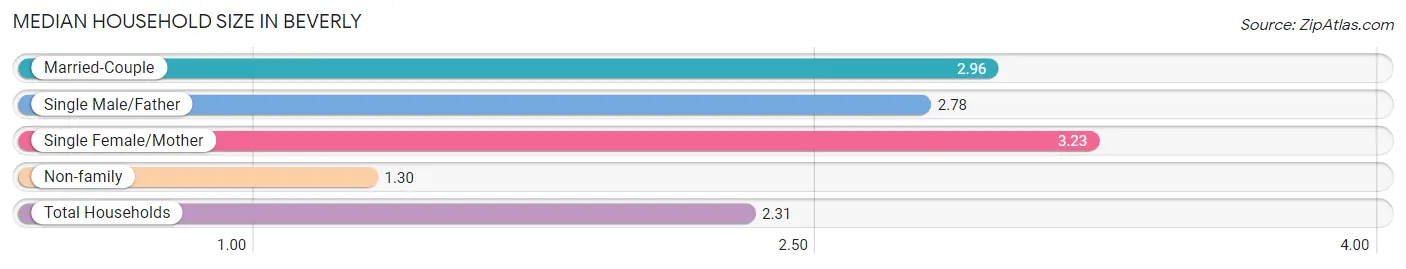
| Household Type | # Households | Household Size |
| Married-Couple | 7,978 (47.2%) | 2.96 |
| Single Male/Father | 450 (2.7%) | 2.78 |
| Single Female/Mother | 1,639 (9.7%) | 3.23 |
| Non-family | 6,842 (40.5%) | 1.30 |
| Total Households | 16,909 (100.0%) | 2.31 |
Household Size by Marriage Status in Beverly
Out of a total of 16,909 households in Beverly, 10,067 (59.5%) are family households, while 6,842 (40.5%) are nonfamily households. The most numerous type of family households are 2-person households, comprising 4,477, and the most common type of nonfamily households are 1-person households, comprising 5,268.
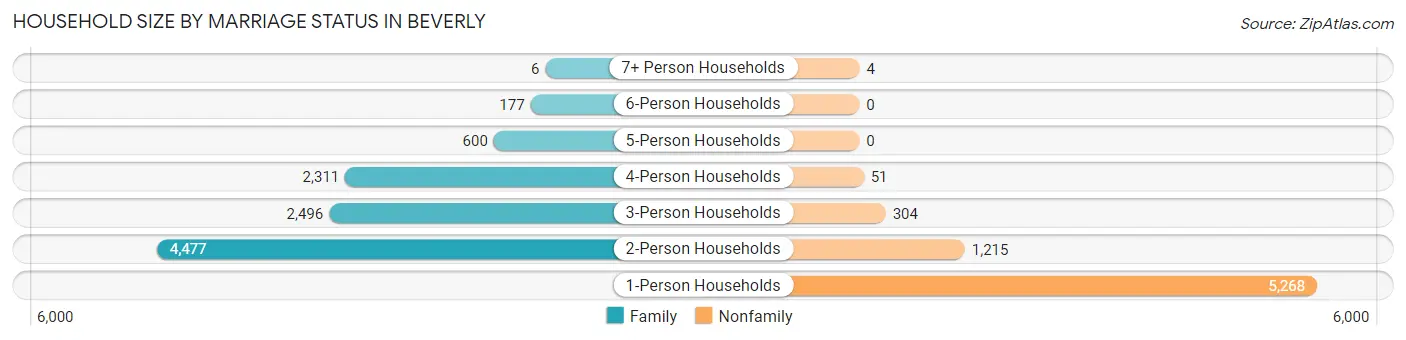
| Household Size | Family Households | Nonfamily Households |
| 1-Person Households | - | 5,268 (31.2%) |
| 2-Person Households | 4,477 (26.5%) | 1,215 (7.2%) |
| 3-Person Households | 2,496 (14.8%) | 304 (1.8%) |
| 4-Person Households | 2,311 (13.7%) | 51 (0.3%) |
| 5-Person Households | 600 (3.5%) | 0 (0.0%) |
| 6-Person Households | 177 (1.1%) | 0 (0.0%) |
| 7+ Person Households | 6 (0.0%) | 4 (0.0%) |
| Total | 10,067 (59.5%) | 6,842 (40.5%) |
Female Fertility in Beverly
Fertility by Age in Beverly
Average fertility rate in Beverly is 46.0 births per 1,000 women. Women in the age bracket of 20 to 34 years have the highest fertility rate with 79.0 births per 1,000 women. Women in the age bracket of 20 to 34 years acount for 81.7% of all women with births.
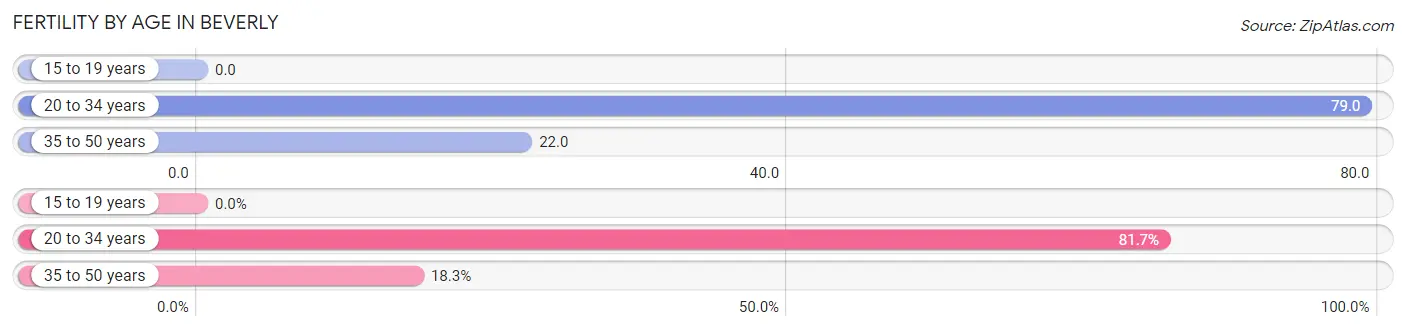
| Age Bracket | Women with Births | Births / 1,000 Women |
| 15 to 19 years | 0 (0.0%) | 0.0 |
| 20 to 34 years | 388 (81.7%) | 79.0 |
| 35 to 50 years | 87 (18.3%) | 22.0 |
| Total | 475 (100.0%) | 46.0 |
Fertility by Age by Marriage Status in Beverly
72.4% of women with births (475) in Beverly are married. The highest percentage of unmarried women with births falls into 35 to 50 years age bracket with 46.0% of them unmarried at the time of birth, while the lowest percentage of unmarried women with births belong to 20 to 34 years age bracket with 23.5% of them unmarried.
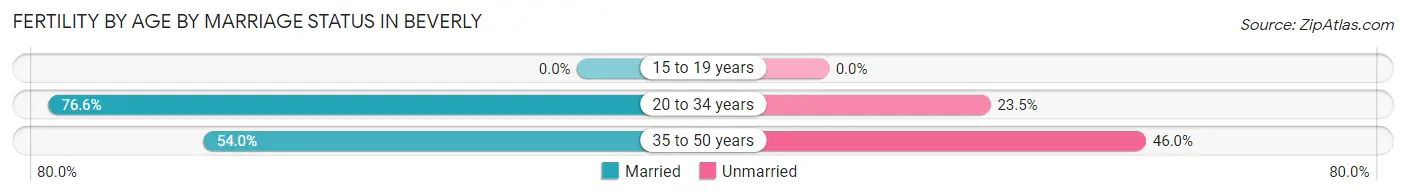
| Age Bracket | Married | Unmarried |
| 15 to 19 years | 0 (0.0%) | 0 (0.0%) |
| 20 to 34 years | 297 (76.5%) | 91 (23.4%) |
| 35 to 50 years | 47 (54.0%) | 40 (46.0%) |
| Total | 344 (72.4%) | 131 (27.6%) |
Fertility by Education in Beverly
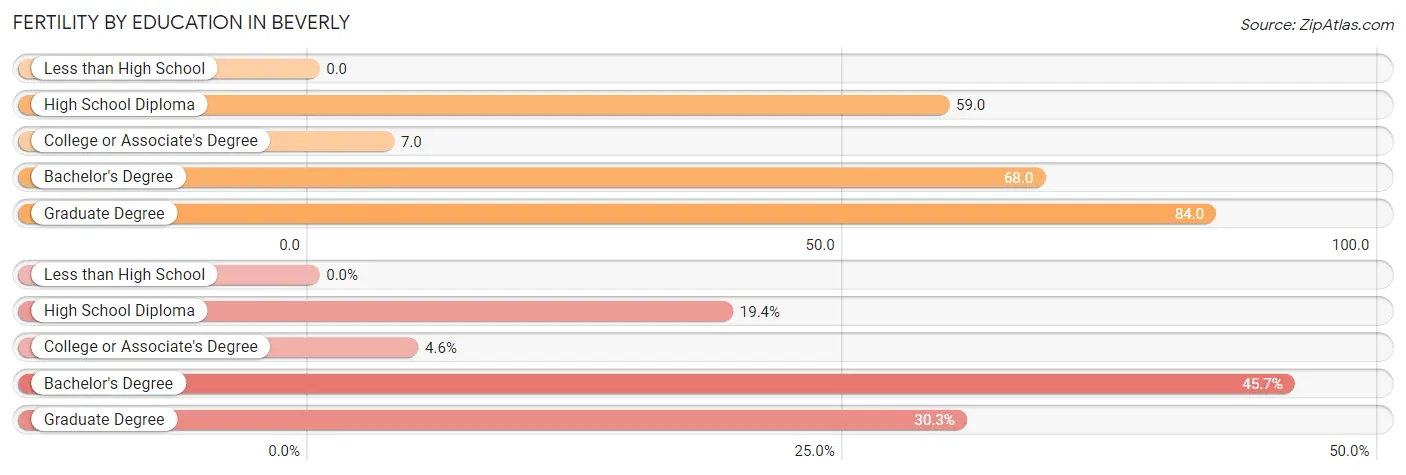
| Educational Attainment | Women with Births | Births / 1,000 Women |
| Less than High School | 0 (0.0%) | 0.0 |
| High School Diploma | 92 (19.4%) | 59.0 |
| College or Associate's Degree | 22 (4.6%) | 7.0 |
| Bachelor's Degree | 217 (45.7%) | 68.0 |
| Graduate Degree | 144 (30.3%) | 84.0 |
| Total | 475 (100.0%) | 46.0 |
Fertility by Education by Marriage Status in Beverly
27.6% of women with births in Beverly are unmarried. Women with the educational attainment of bachelor's degree are most likely to be married with 94.0% of them married at childbirth, while women with the educational attainment of high school diploma are least likely to be married with 100.0% of them unmarried at childbirth.
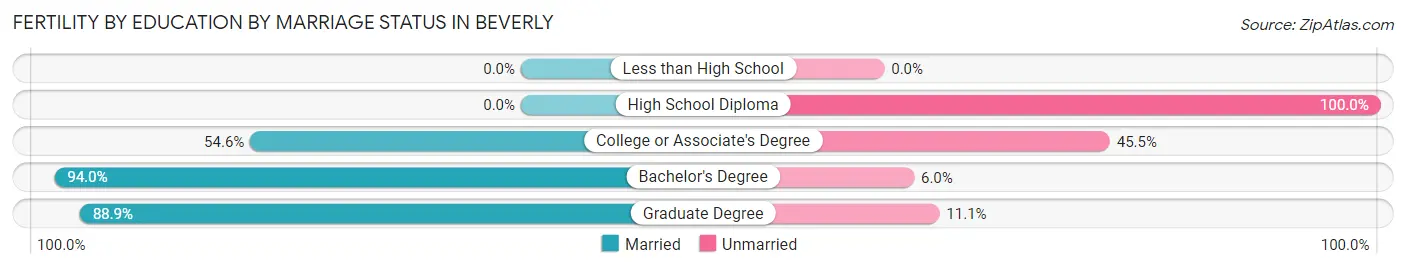
| Educational Attainment | Married | Unmarried |
| Less than High School | 0 (0.0%) | 0 (0.0%) |
| High School Diploma | 0 (0.0%) | 92 (100.0%) |
| College or Associate's Degree | 12 (54.5%) | 10 (45.5%) |
| Bachelor's Degree | 204 (94.0%) | 13 (6.0%) |
| Graduate Degree | 128 (88.9%) | 16 (11.1%) |
| Total | 344 (72.4%) | 131 (27.6%) |
Employment Characteristics in Beverly
Employment by Class of Employer in Beverly
Among the 22,684 employed individuals in Beverly, private company employees (14,758 | 65.1%), not-for-profit organizations (3,525 | 15.5%), and local government employees (1,544 | 6.8%) make up the most common classes of employment.
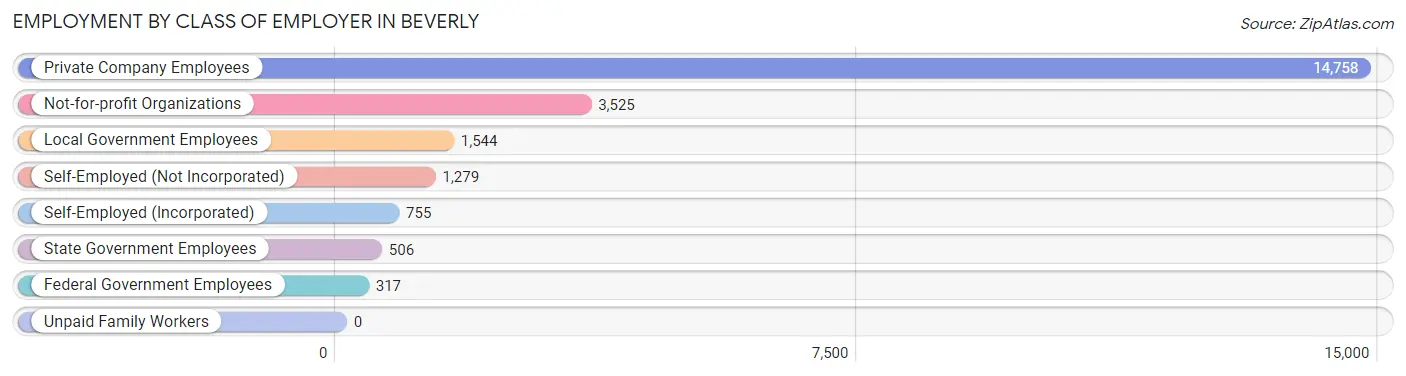
| Employer Class | # Employees | % Employees |
| Private Company Employees | 14,758 | 65.1% |
| Self-Employed (Incorporated) | 755 | 3.3% |
| Self-Employed (Not Incorporated) | 1,279 | 5.6% |
| Not-for-profit Organizations | 3,525 | 15.5% |
| Local Government Employees | 1,544 | 6.8% |
| State Government Employees | 506 | 2.2% |
| Federal Government Employees | 317 | 1.4% |
| Unpaid Family Workers | 0 | 0.0% |
| Total | 22,684 | 100.0% |
Employment Status by Age in Beverly
According to the labor force statistics for Beverly, out of the total population over 16 years of age (35,033), 68.4% or 23,963 individuals are in the labor force, with 3.3% or 791 of them unemployed. The age group with the highest labor force participation rate is 25 to 29 years, with 91.8% or 2,620 individuals in the labor force. Within the labor force, the 16 to 19 years age range has the highest percentage of unemployed individuals, with 5.9% or 53 of them being unemployed.
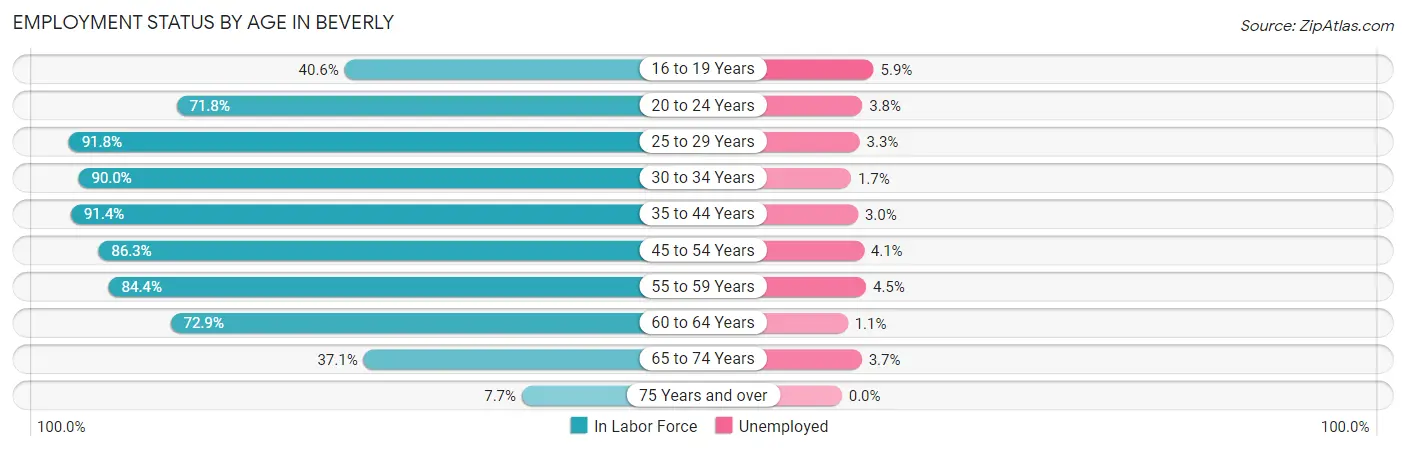
| Age Bracket | In Labor Force | Unemployed |
| 16 to 19 Years | 899 (40.6%) | 53 (5.9%) |
| 20 to 24 Years | 2,581 (71.8%) | 98 (3.8%) |
| 25 to 29 Years | 2,620 (91.8%) | 86 (3.3%) |
| 30 to 34 Years | 2,266 (90.0%) | 39 (1.7%) |
| 35 to 44 Years | 4,365 (91.4%) | 131 (3.0%) |
| 45 to 54 Years | 4,457 (86.3%) | 183 (4.1%) |
| 55 to 59 Years | 2,448 (84.4%) | 110 (4.5%) |
| 60 to 64 Years | 2,406 (72.9%) | 26 (1.1%) |
| 65 to 74 Years | 1,686 (37.1%) | 62 (3.7%) |
| 75 Years and over | 244 (7.7%) | 0 (0.0%) |
| Total | 23,963 (68.4%) | 791 (3.3%) |
Employment Status by Educational Attainment in Beverly
According to labor force statistics for Beverly, 86.3% of individuals (18,567) out of the total population between 25 and 64 years of age (21,514) are in the labor force, with 3.1% or 576 of them being unemployed. The group with the highest labor force participation rate are those with the educational attainment of bachelor's degree or higher, with 90.3% or 11,263 individuals in the labor force. Within the labor force, individuals with high school diploma education have the highest percentage of unemployment, with 5.6% or 160 of them being unemployed.
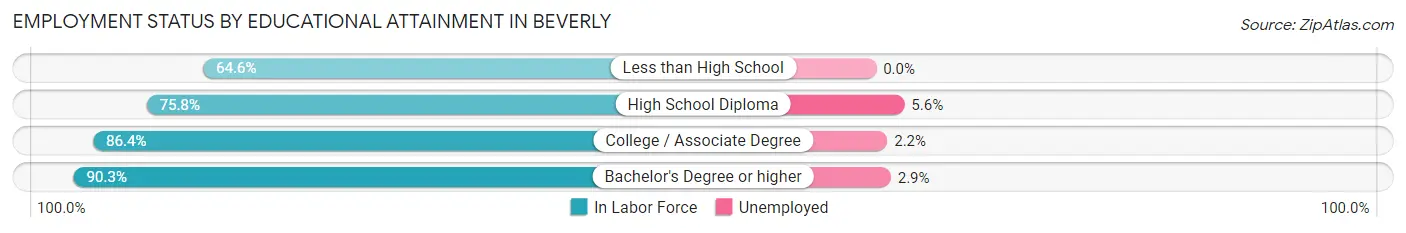
| Educational Attainment | In Labor Force | Unemployed |
| Less than High School | 338 (64.6%) | 0 (0.0%) |
| High School Diploma | 2,853 (75.8%) | 211 (5.6%) |
| College / Associate Degree | 4,107 (86.4%) | 105 (2.2%) |
| Bachelor's Degree or higher | 11,263 (90.3%) | 362 (2.9%) |
| Total | 18,567 (86.3%) | 667 (3.1%) |
Employment Occupations by Sex in Beverly
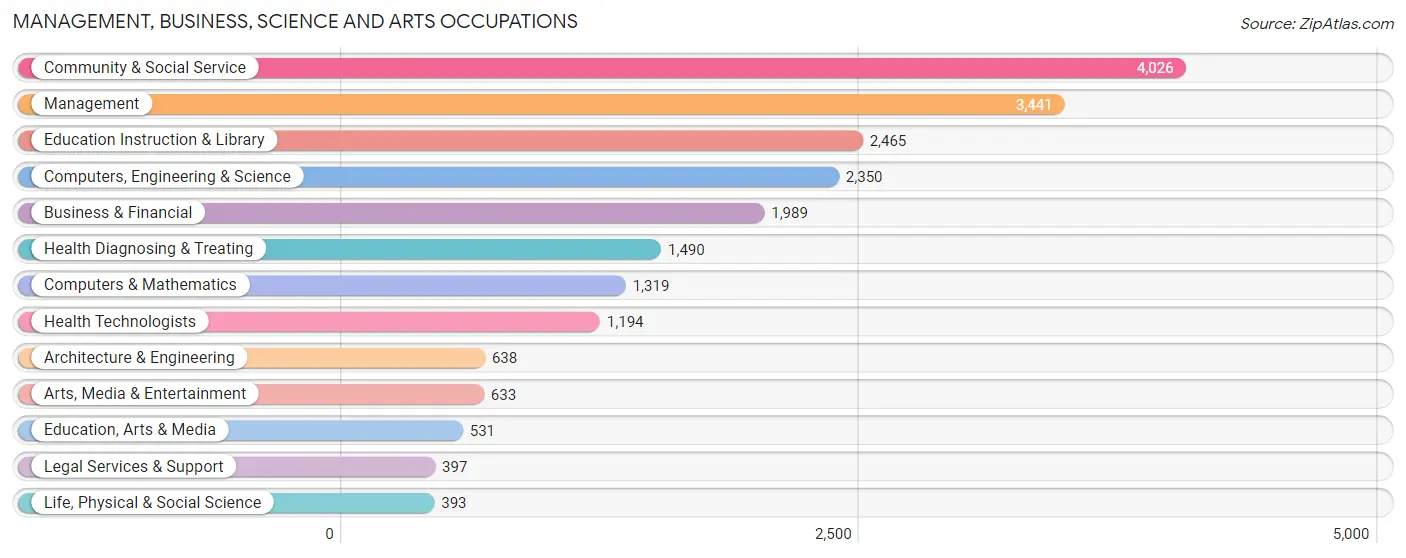
Management, Business, Science and Arts Occupations
The most common Management, Business, Science and Arts occupations in Beverly are Community & Social Service (4,026 | 17.4%), Management (3,441 | 14.9%), Education Instruction & Library (2,465 | 10.6%), Computers, Engineering & Science (2,350 | 10.2%), and Business & Financial (1,989 | 8.6%).
Management, Business, Science and Arts Occupations by Sex
Within the Management, Business, Science and Arts occupations in Beverly, the most male-oriented occupations are Architecture & Engineering (90.9%), Computers & Mathematics (87.2%), and Computers, Engineering & Science (80.8%), while the most female-oriented occupations are Health Technologists (84.5%), Health Diagnosing & Treating (79.1%), and Education Instruction & Library (72.5%).
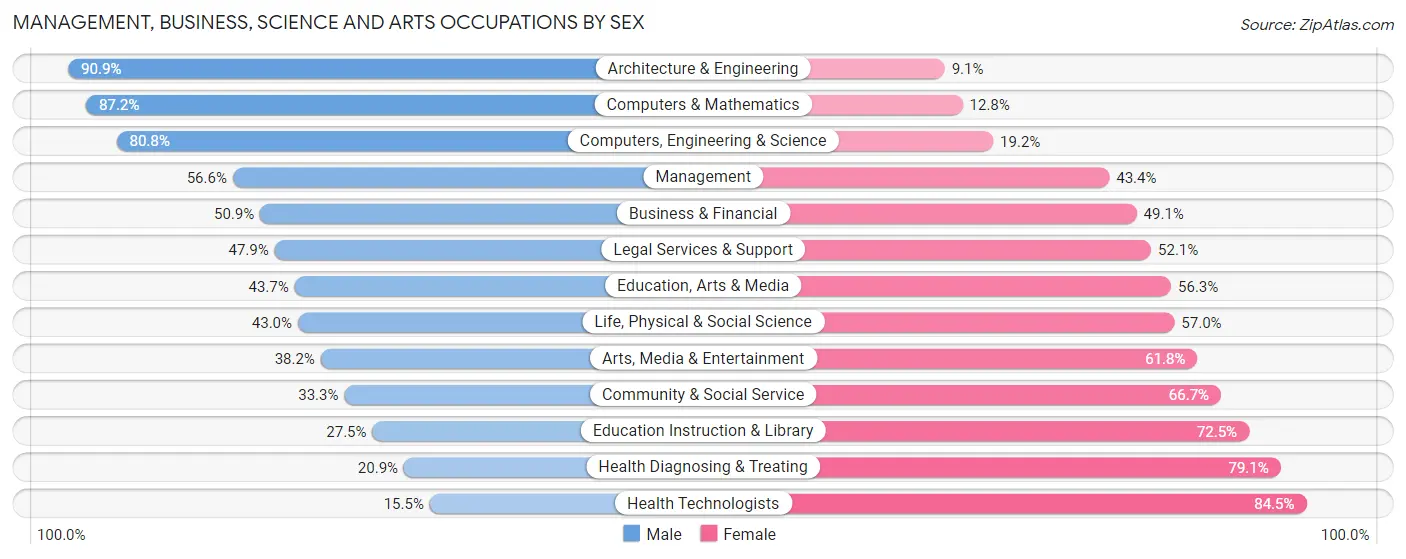
| Occupation | Male | Female |
| Management | 1,947 (56.6%) | 1,494 (43.4%) |
| Business & Financial | 1,012 (50.9%) | 977 (49.1%) |
| Computers, Engineering & Science | 1,899 (80.8%) | 451 (19.2%) |
| Computers & Mathematics | 1,150 (87.2%) | 169 (12.8%) |
| Architecture & Engineering | 580 (90.9%) | 58 (9.1%) |
| Life, Physical & Social Science | 169 (43.0%) | 224 (57.0%) |
| Community & Social Service | 1,341 (33.3%) | 2,685 (66.7%) |
| Education, Arts & Media | 232 (43.7%) | 299 (56.3%) |
| Legal Services & Support | 190 (47.9%) | 207 (52.1%) |
| Education Instruction & Library | 677 (27.5%) | 1,788 (72.5%) |
| Arts, Media & Entertainment | 242 (38.2%) | 391 (61.8%) |
| Health Diagnosing & Treating | 311 (20.9%) | 1,179 (79.1%) |
| Health Technologists | 185 (15.5%) | 1,009 (84.5%) |
| Total (Category) | 6,510 (49.0%) | 6,786 (51.0%) |
| Total (Overall) | 11,521 (49.8%) | 11,631 (50.2%) |
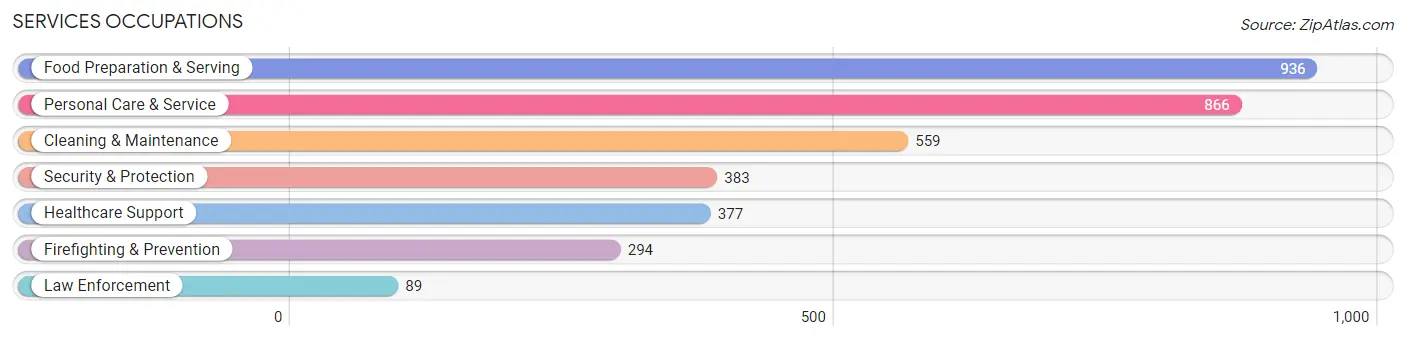
Services Occupations
The most common Services occupations in Beverly are Food Preparation & Serving (936 | 4.0%), Personal Care & Service (866 | 3.7%), Cleaning & Maintenance (559 | 2.4%), Security & Protection (383 | 1.7%), and Healthcare Support (377 | 1.6%).
Services Occupations by Sex
Within the Services occupations in Beverly, the most male-oriented occupations are Law Enforcement (94.4%), Security & Protection (80.4%), and Firefighting & Prevention (76.2%), while the most female-oriented occupations are Personal Care & Service (86.7%), Healthcare Support (83.0%), and Food Preparation & Serving (55.6%).
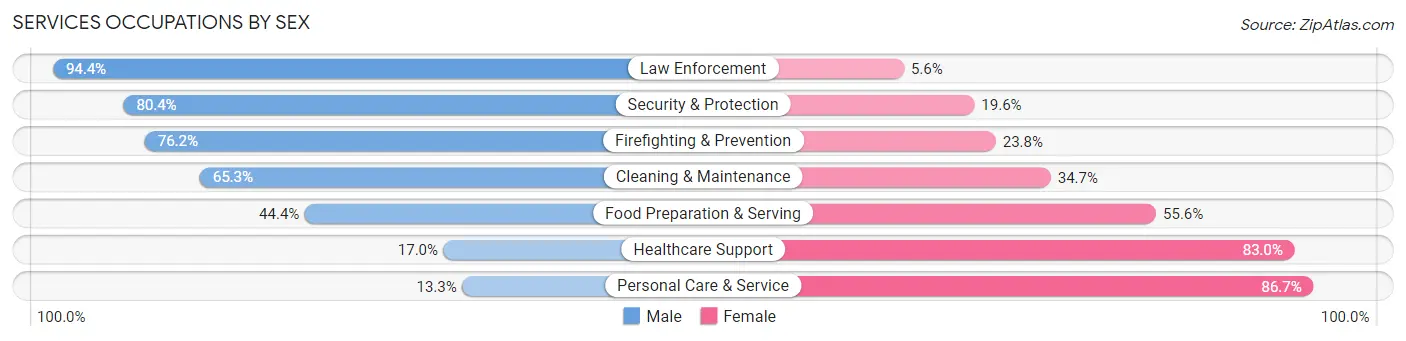
| Occupation | Male | Female |
| Healthcare Support | 64 (17.0%) | 313 (83.0%) |
| Security & Protection | 308 (80.4%) | 75 (19.6%) |
| Firefighting & Prevention | 224 (76.2%) | 70 (23.8%) |
| Law Enforcement | 84 (94.4%) | 5 (5.6%) |
| Food Preparation & Serving | 416 (44.4%) | 520 (55.6%) |
| Cleaning & Maintenance | 365 (65.3%) | 194 (34.7%) |
| Personal Care & Service | 115 (13.3%) | 751 (86.7%) |
| Total (Category) | 1,268 (40.6%) | 1,853 (59.4%) |
| Total (Overall) | 11,521 (49.8%) | 11,631 (50.2%) |
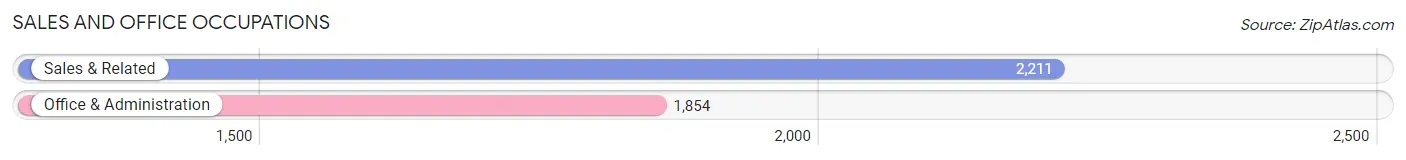
Sales and Office Occupations
The most common Sales and Office occupations in Beverly are Sales & Related (2,211 | 9.6%), and Office & Administration (1,854 | 8.0%).
Sales and Office Occupations by Sex
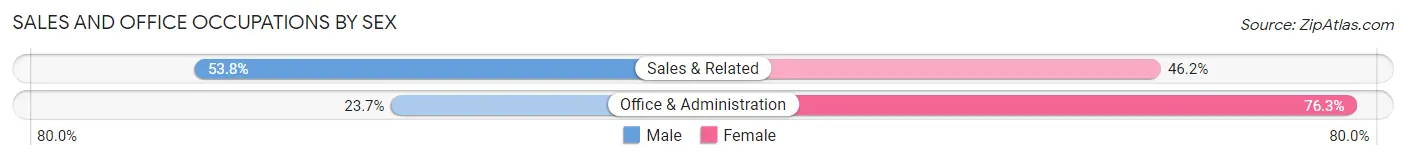
| Occupation | Male | Female |
| Sales & Related | 1,189 (53.8%) | 1,022 (46.2%) |
| Office & Administration | 440 (23.7%) | 1,414 (76.3%) |
| Total (Category) | 1,629 (40.1%) | 2,436 (59.9%) |
| Total (Overall) | 11,521 (49.8%) | 11,631 (50.2%) |
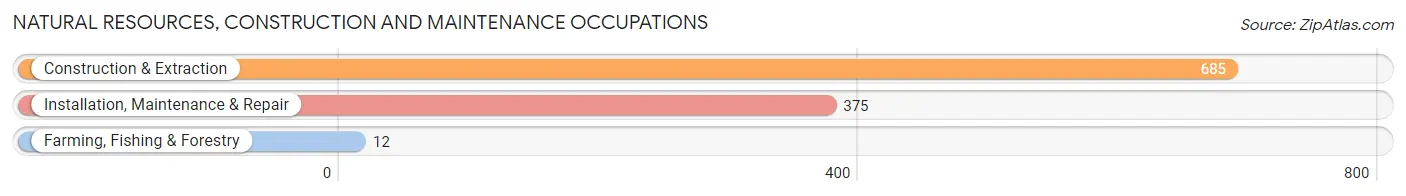
Natural Resources, Construction and Maintenance Occupations
The most common Natural Resources, Construction and Maintenance occupations in Beverly are Construction & Extraction (685 | 3.0%), Installation, Maintenance & Repair (375 | 1.6%), and Farming, Fishing & Forestry (12 | 0.1%).
Natural Resources, Construction and Maintenance Occupations by Sex
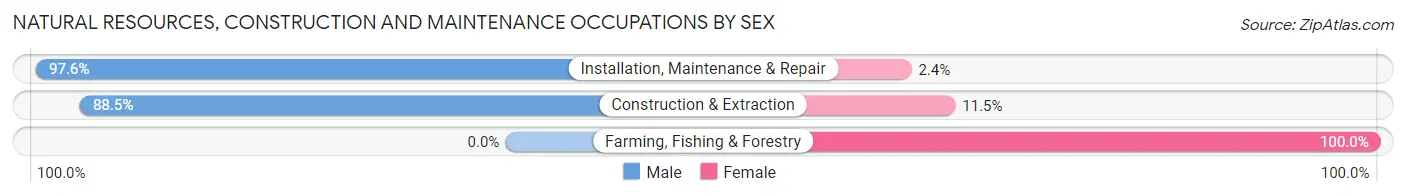
| Occupation | Male | Female |
| Farming, Fishing & Forestry | 0 (0.0%) | 12 (100.0%) |
| Construction & Extraction | 606 (88.5%) | 79 (11.5%) |
| Installation, Maintenance & Repair | 366 (97.6%) | 9 (2.4%) |
| Total (Category) | 972 (90.7%) | 100 (9.3%) |
| Total (Overall) | 11,521 (49.8%) | 11,631 (50.2%) |
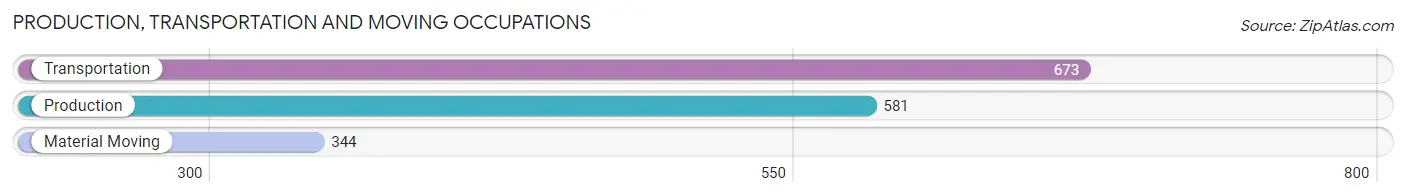
Production, Transportation and Moving Occupations
The most common Production, Transportation and Moving occupations in Beverly are Transportation (673 | 2.9%), Production (581 | 2.5%), and Material Moving (344 | 1.5%).
Production, Transportation and Moving Occupations by Sex
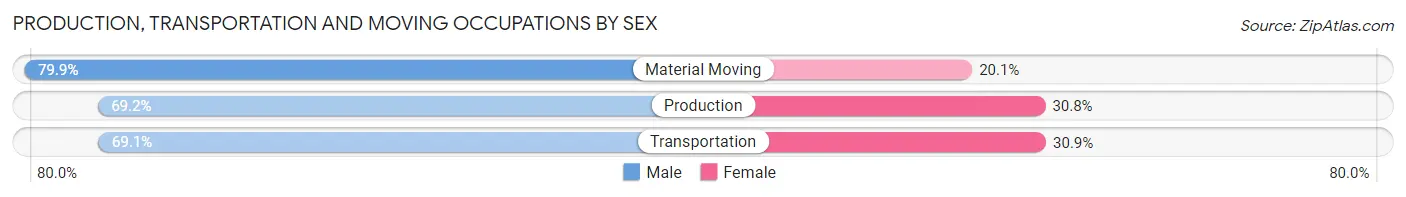
| Occupation | Male | Female |
| Production | 402 (69.2%) | 179 (30.8%) |
| Transportation | 465 (69.1%) | 208 (30.9%) |
| Material Moving | 275 (79.9%) | 69 (20.1%) |
| Total (Category) | 1,142 (71.5%) | 456 (28.5%) |
| Total (Overall) | 11,521 (49.8%) | 11,631 (50.2%) |
Employment Industries by Sex in Beverly
Employment Industries in Beverly
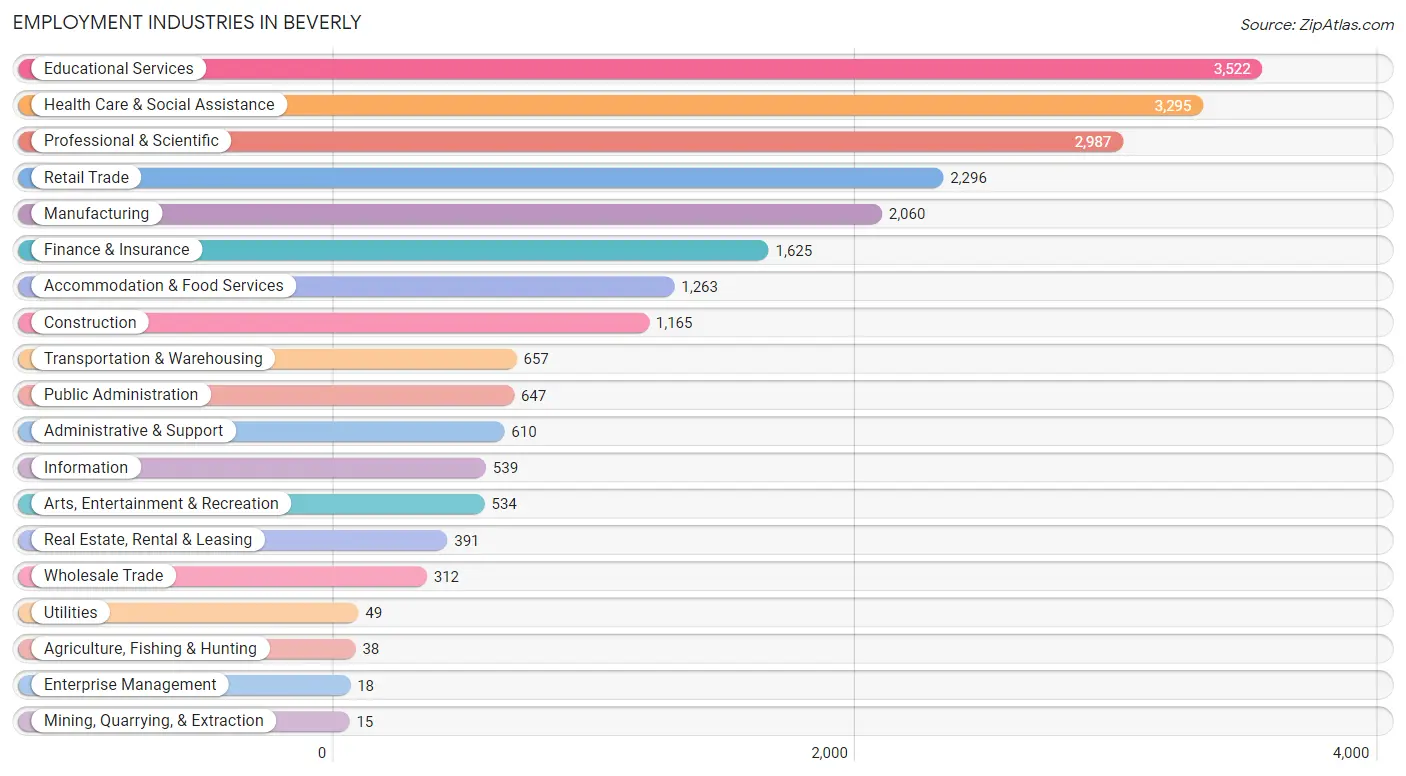
The major employment industries in Beverly include Educational Services (3,522 | 15.2%), Health Care & Social Assistance (3,295 | 14.2%), Professional & Scientific (2,987 | 12.9%), Retail Trade (2,296 | 9.9%), and Manufacturing (2,060 | 8.9%).
Employment Industries by Sex in Beverly
The Beverly industries that see more men than women are Mining, Quarrying, & Extraction (100.0%), Construction (89.6%), and Transportation & Warehousing (79.0%), whereas the industries that tend to have a higher number of women are Health Care & Social Assistance (75.2%), Utilities (73.5%), and Educational Services (67.2%).
| Industry | Male | Female |
| Agriculture, Fishing & Hunting | 29 (76.3%) | 9 (23.7%) |
| Mining, Quarrying, & Extraction | 15 (100.0%) | 0 (0.0%) |
| Construction | 1,044 (89.6%) | 121 (10.4%) |
| Manufacturing | 1,508 (73.2%) | 552 (26.8%) |
| Wholesale Trade | 226 (72.4%) | 86 (27.6%) |
| Retail Trade | 1,164 (50.7%) | 1,132 (49.3%) |
| Transportation & Warehousing | 519 (79.0%) | 138 (21.0%) |
| Utilities | 13 (26.5%) | 36 (73.5%) |
| Information | 260 (48.2%) | 279 (51.8%) |
| Finance & Insurance | 853 (52.5%) | 772 (47.5%) |
| Real Estate, Rental & Leasing | 230 (58.8%) | 161 (41.2%) |
| Professional & Scientific | 1,716 (57.5%) | 1,271 (42.5%) |
| Enterprise Management | 9 (50.0%) | 9 (50.0%) |
| Administrative & Support | 339 (55.6%) | 271 (44.4%) |
| Educational Services | 1,156 (32.8%) | 2,366 (67.2%) |
| Health Care & Social Assistance | 816 (24.8%) | 2,479 (75.2%) |
| Arts, Entertainment & Recreation | 301 (56.4%) | 233 (43.6%) |
| Accommodation & Food Services | 501 (39.7%) | 762 (60.3%) |
| Public Administration | 418 (64.6%) | 229 (35.4%) |
| Total | 11,521 (49.8%) | 11,631 (50.2%) |
Education in Beverly
School Enrollment in Beverly
The most common levels of schooling among the 10,914 students in Beverly are college / undergraduate (3,756 | 34.4%), middle school (2,217 | 20.3%), and high school (1,543 | 14.1%).
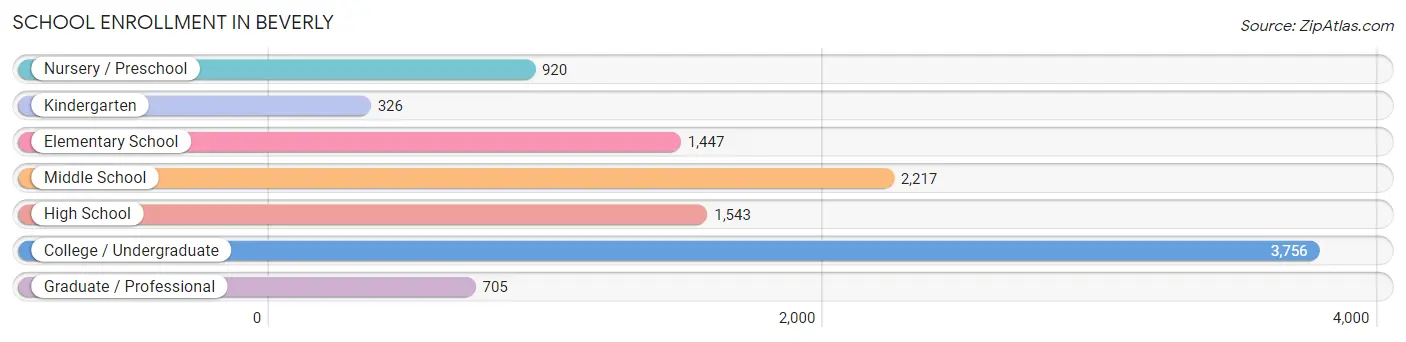
| School Level | # Students | % Students |
| Nursery / Preschool | 920 | 8.4% |
| Kindergarten | 326 | 3.0% |
| Elementary School | 1,447 | 13.3% |
| Middle School | 2,217 | 20.3% |
| High School | 1,543 | 14.1% |
| College / Undergraduate | 3,756 | 34.4% |
| Graduate / Professional | 705 | 6.5% |
| Total | 10,914 | 100.0% |
School Enrollment by Age by Funding Source in Beverly
Out of a total of 10,914 students who are enrolled in schools in Beverly, 4,311 (39.5%) attend a private institution, while the remaining 6,603 (60.5%) are enrolled in public schools. The age group of 18 to 19 year olds has the highest likelihood of being enrolled in private schools, with 912 (69.0% in the age bracket) enrolled. Conversely, the age group of 10 to 14 year olds has the lowest likelihood of being enrolled in a private school, with 2,219 (83.6% in the age bracket) attending a public institution.
| Age Bracket | Public School | Private School |
| 3 to 4 Year Olds | 279 (39.5%) | 428 (60.5%) |
| 5 to 9 Year Old | 1,327 (77.3%) | 390 (22.7%) |
| 10 to 14 Year Olds | 2,219 (83.6%) | 434 (16.4%) |
| 15 to 17 Year Olds | 932 (79.4%) | 241 (20.5%) |
| 18 to 19 Year Olds | 409 (31.0%) | 912 (69.0%) |
| 20 to 24 Year Olds | 826 (36.2%) | 1,458 (63.8%) |
| 25 to 34 Year Olds | 299 (57.8%) | 218 (42.2%) |
| 35 Years and over | 310 (57.2%) | 232 (42.8%) |
| Total | 6,603 (60.5%) | 4,311 (39.5%) |
Educational Attainment by Field of Study in Beverly
Business (3,215 | 19.6%), social sciences (1,493 | 9.1%), liberal arts & history (1,416 | 8.6%), education (1,273 | 7.7%), and literature & languages (1,259 | 7.7%) are the most common fields of study among 16,439 individuals in Beverly who have obtained a bachelor's degree or higher.
| Field of Study | # Graduates | % Graduates |
| Computers & Mathematics | 615 | 3.7% |
| Bio, Nature & Agricultural | 902 | 5.5% |
| Physical & Health Sciences | 467 | 2.8% |
| Psychology | 669 | 4.1% |
| Social Sciences | 1,493 | 9.1% |
| Engineering | 1,157 | 7.0% |
| Multidisciplinary Studies | 121 | 0.7% |
| Science & Technology | 1,249 | 7.6% |
| Business | 3,215 | 19.6% |
| Education | 1,273 | 7.7% |
| Literature & Languages | 1,259 | 7.7% |
| Liberal Arts & History | 1,416 | 8.6% |
| Visual & Performing Arts | 1,002 | 6.1% |
| Communications | 691 | 4.2% |
| Arts & Humanities | 910 | 5.5% |
| Total | 16,439 | 100.0% |
Transportation & Commute in Beverly
Vehicle Availability by Sex in Beverly
The most prevalent vehicle ownership categories in Beverly are males with 2 vehicles (5,690, accounting for 52.5%) and females with 2 vehicles (4,599, making up 53.6%).
| Vehicles Available | Male | Female |
| No Vehicle | 244 (2.2%) | 379 (3.6%) |
| 1 Vehicle | 2,270 (20.9%) | 3,252 (30.6%) |
| 2 Vehicles | 5,690 (52.5%) | 4,599 (43.3%) |
| 3 Vehicles | 1,496 (13.8%) | 1,501 (14.1%) |
| 4 Vehicles | 881 (8.1%) | 758 (7.1%) |
| 5 or more Vehicles | 256 (2.4%) | 128 (1.2%) |
| Total | 10,837 (100.0%) | 10,617 (100.0%) |
Commute Time in Beverly
The most frequently occuring commute durations in Beverly are 10 to 14 minutes (3,109 commuters, 16.5%), 15 to 19 minutes (2,482 commuters, 13.1%), and 60 to 89 minutes (2,140 commuters, 11.3%).
| Commute Time | # Commuters | % Commuters |
| Less than 5 Minutes | 738 | 3.9% |
| 5 to 9 Minutes | 2,066 | 10.9% |
| 10 to 14 Minutes | 3,109 | 16.5% |
| 15 to 19 Minutes | 2,482 | 13.1% |
| 20 to 24 Minutes | 1,752 | 9.3% |
| 25 to 29 Minutes | 797 | 4.2% |
| 30 to 34 Minutes | 1,982 | 10.5% |
| 35 to 39 Minutes | 394 | 2.1% |
| 40 to 44 Minutes | 913 | 4.8% |
| 45 to 59 Minutes | 1,456 | 7.7% |
| 60 to 89 Minutes | 2,140 | 11.3% |
| 90 or more Minutes | 1,060 | 5.6% |
Commute Time by Sex in Beverly
The most common commute times in Beverly are 10 to 14 minutes (1,514 commuters, 16.1%) for males and 10 to 14 minutes (1,595 commuters, 16.8%) for females.
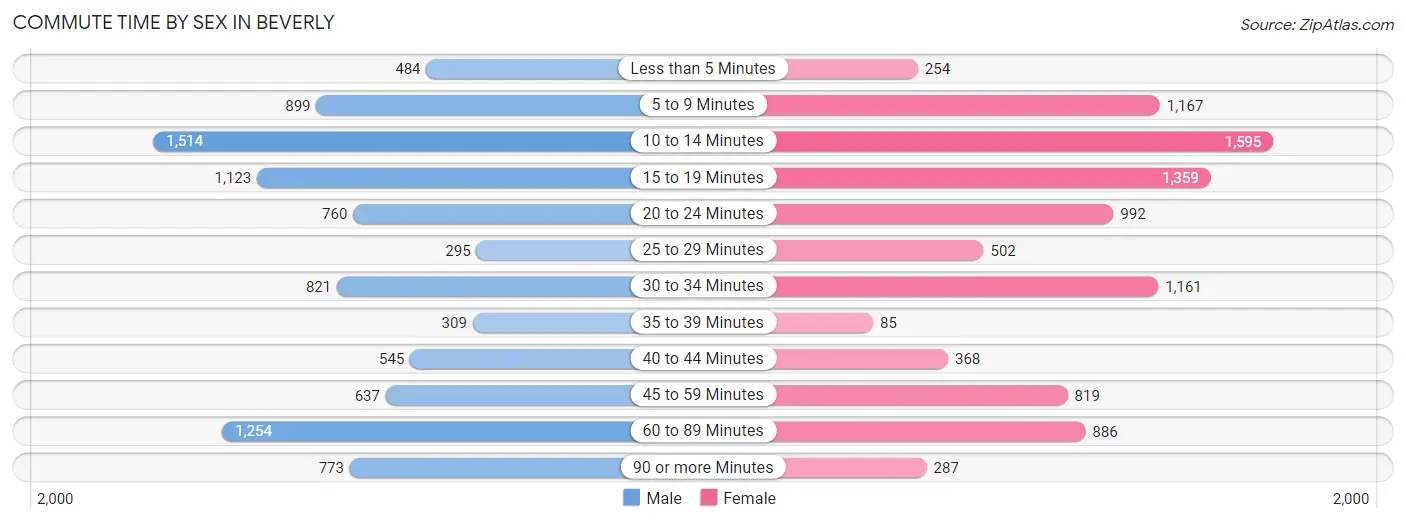
| Commute Time | Male | Female |
| Less than 5 Minutes | 484 (5.1%) | 254 (2.7%) |
| 5 to 9 Minutes | 899 (9.6%) | 1,167 (12.3%) |
| 10 to 14 Minutes | 1,514 (16.1%) | 1,595 (16.8%) |
| 15 to 19 Minutes | 1,123 (11.9%) | 1,359 (14.3%) |
| 20 to 24 Minutes | 760 (8.1%) | 992 (10.5%) |
| 25 to 29 Minutes | 295 (3.1%) | 502 (5.3%) |
| 30 to 34 Minutes | 821 (8.7%) | 1,161 (12.2%) |
| 35 to 39 Minutes | 309 (3.3%) | 85 (0.9%) |
| 40 to 44 Minutes | 545 (5.8%) | 368 (3.9%) |
| 45 to 59 Minutes | 637 (6.8%) | 819 (8.6%) |
| 60 to 89 Minutes | 1,254 (13.3%) | 886 (9.3%) |
| 90 or more Minutes | 773 (8.2%) | 287 (3.0%) |
Time of Departure to Work by Sex in Beverly
The most frequent times of departure to work in Beverly are 7:30 AM to 7:59 AM (1,432, 15.2%) for males and 8:00 AM to 8:29 AM (1,390, 14.7%) for females.
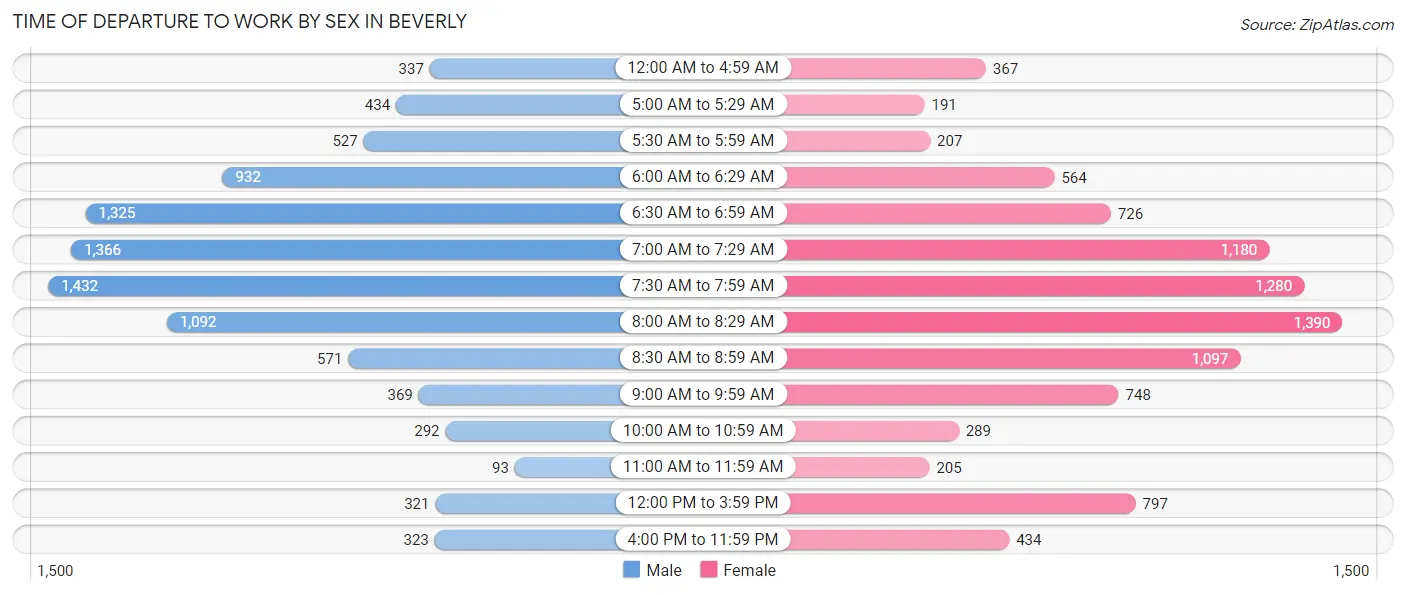
| Time of Departure | Male | Female |
| 12:00 AM to 4:59 AM | 337 (3.6%) | 367 (3.9%) |
| 5:00 AM to 5:29 AM | 434 (4.6%) | 191 (2.0%) |
| 5:30 AM to 5:59 AM | 527 (5.6%) | 207 (2.2%) |
| 6:00 AM to 6:29 AM | 932 (9.9%) | 564 (5.9%) |
| 6:30 AM to 6:59 AM | 1,325 (14.1%) | 726 (7.7%) |
| 7:00 AM to 7:29 AM | 1,366 (14.5%) | 1,180 (12.4%) |
| 7:30 AM to 7:59 AM | 1,432 (15.2%) | 1,280 (13.5%) |
| 8:00 AM to 8:29 AM | 1,092 (11.6%) | 1,390 (14.7%) |
| 8:30 AM to 8:59 AM | 571 (6.1%) | 1,097 (11.6%) |
| 9:00 AM to 9:59 AM | 369 (3.9%) | 748 (7.9%) |
| 10:00 AM to 10:59 AM | 292 (3.1%) | 289 (3.0%) |
| 11:00 AM to 11:59 AM | 93 (1.0%) | 205 (2.2%) |
| 12:00 PM to 3:59 PM | 321 (3.4%) | 797 (8.4%) |
| 4:00 PM to 11:59 PM | 323 (3.4%) | 434 (4.6%) |
| Total | 9,414 (100.0%) | 9,475 (100.0%) |
Housing Occupancy in Beverly
Occupancy by Ownership in Beverly
Of the total 16,909 dwellings in Beverly, owner-occupied units account for 10,159 (60.1%), while renter-occupied units make up 6,750 (39.9%).
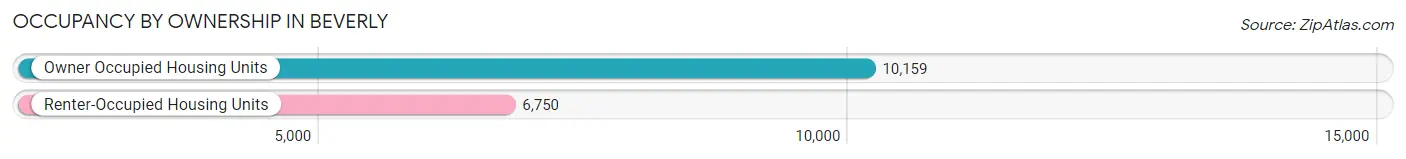
| Occupancy | # Housing Units | % Housing Units |
| Owner Occupied Housing Units | 10,159 | 60.1% |
| Renter-Occupied Housing Units | 6,750 | 39.9% |
| Total Occupied Housing Units | 16,909 | 100.0% |
Occupancy by Household Size in Beverly
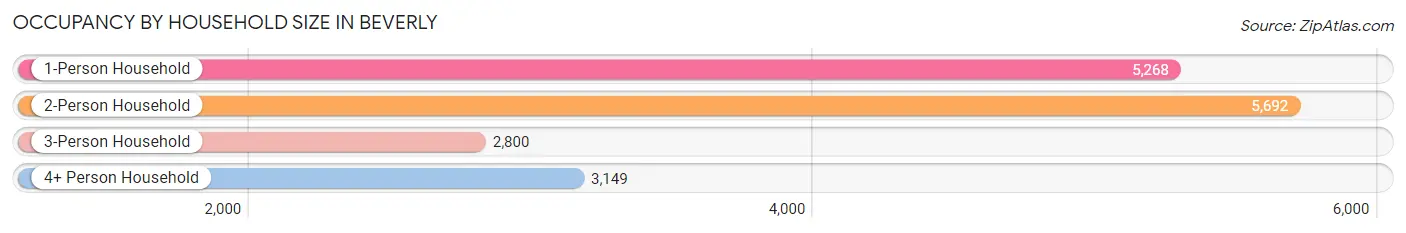
| Household Size | # Housing Units | % Housing Units |
| 1-Person Household | 5,268 | 31.2% |
| 2-Person Household | 5,692 | 33.7% |
| 3-Person Household | 2,800 | 16.6% |
| 4+ Person Household | 3,149 | 18.6% |
| Total Housing Units | 16,909 | 100.0% |
Occupancy by Ownership by Household Size in Beverly
| Household Size | Owner-occupied | Renter-occupied |
| 1-Person Household | 2,148 (40.8%) | 3,120 (59.2%) |
| 2-Person Household | 3,758 (66.0%) | 1,934 (34.0%) |
| 3-Person Household | 1,839 (65.7%) | 961 (34.3%) |
| 4+ Person Household | 2,414 (76.7%) | 735 (23.3%) |
| Total Housing Units | 10,159 (60.1%) | 6,750 (39.9%) |
Occupancy by Educational Attainment in Beverly
| Household Size | Owner-occupied | Renter-occupied |
| Less than High School | 182 (43.0%) | 241 (57.0%) |
| High School Diploma | 1,409 (41.3%) | 2,004 (58.7%) |
| College/Associate Degree | 2,064 (49.9%) | 2,072 (50.1%) |
| Bachelor's Degree or higher | 6,504 (72.8%) | 2,433 (27.2%) |
Occupancy by Age of Householder in Beverly
| Age Bracket | # Households | % Households |
| Under 35 Years | 2,813 | 16.6% |
| 35 to 44 Years | 2,613 | 15.4% |
| 45 to 54 Years | 2,975 | 17.6% |
| 55 to 64 Years | 3,701 | 21.9% |
| 65 to 74 Years | 2,748 | 16.3% |
| 75 to 84 Years | 1,175 | 7.0% |
| 85 Years and Over | 884 | 5.2% |
| Total | 16,909 | 100.0% |
Housing Finances in Beverly
Median Income by Occupancy in Beverly
| Occupancy Type | # Households | Median Income |
| Owner-Occupied | 10,159 (60.1%) | $145,717 |
| Renter-Occupied | 6,750 (39.9%) | $49,693 |
| Average | 16,909 (100.0%) | $99,525 |
Occupancy by Householder Income Bracket in Beverly
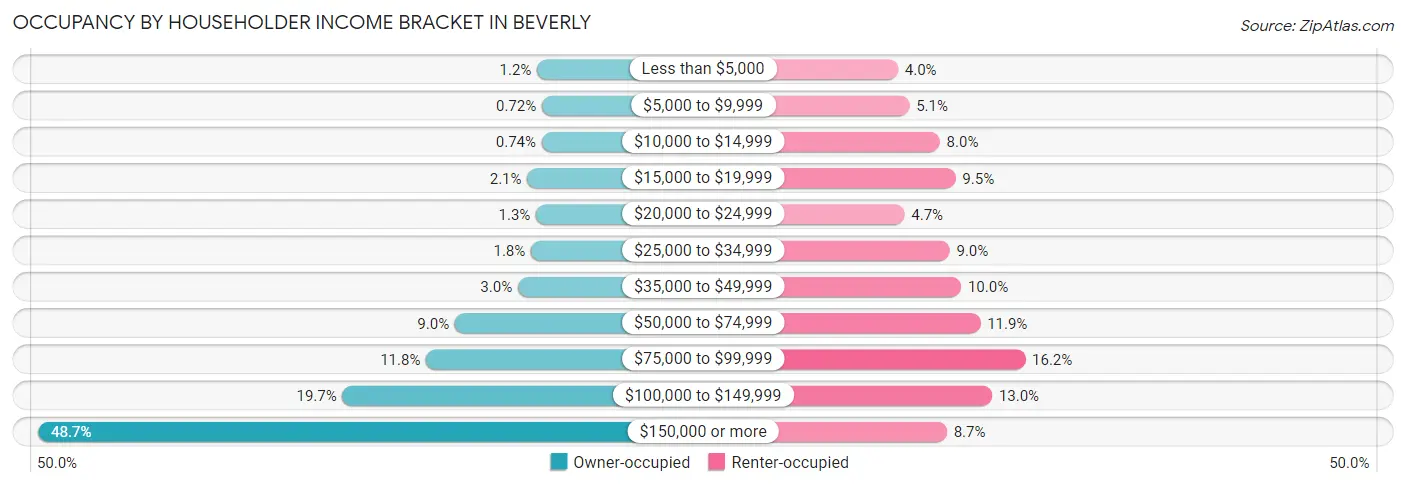
| Income Bracket | Owner-occupied | Renter-occupied |
| Less than $5,000 | 120 (1.2%) | 272 (4.0%) |
| $5,000 to $9,999 | 73 (0.7%) | 345 (5.1%) |
| $10,000 to $14,999 | 75 (0.7%) | 541 (8.0%) |
| $15,000 to $19,999 | 215 (2.1%) | 642 (9.5%) |
| $20,000 to $24,999 | 130 (1.3%) | 314 (4.6%) |
| $25,000 to $34,999 | 179 (1.8%) | 604 (8.9%) |
| $35,000 to $49,999 | 306 (3.0%) | 678 (10.0%) |
| $50,000 to $74,999 | 915 (9.0%) | 801 (11.9%) |
| $75,000 to $99,999 | 1,194 (11.7%) | 1,090 (16.2%) |
| $100,000 to $149,999 | 2,003 (19.7%) | 877 (13.0%) |
| $150,000 or more | 4,949 (48.7%) | 586 (8.7%) |
| Total | 10,159 (100.0%) | 6,750 (100.0%) |
Monthly Housing Cost Tiers in Beverly
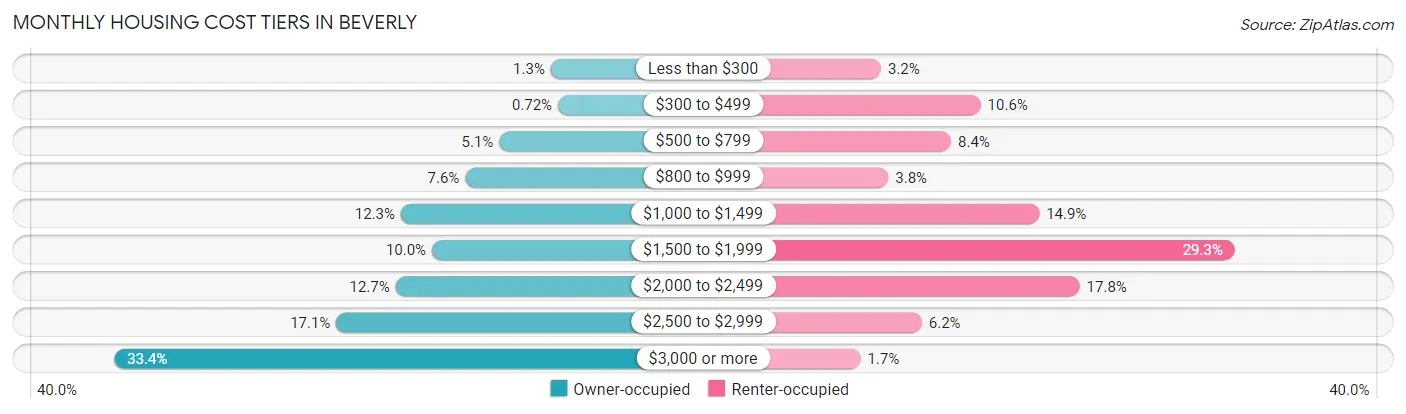
| Monthly Cost | Owner-occupied | Renter-occupied |
| Less than $300 | 127 (1.3%) | 217 (3.2%) |
| $300 to $499 | 73 (0.7%) | 712 (10.5%) |
| $500 to $799 | 513 (5.1%) | 565 (8.4%) |
| $800 to $999 | 767 (7.5%) | 253 (3.7%) |
| $1,000 to $1,499 | 1,249 (12.3%) | 1,003 (14.9%) |
| $1,500 to $1,999 | 1,016 (10.0%) | 1,975 (29.3%) |
| $2,000 to $2,499 | 1,288 (12.7%) | 1,204 (17.8%) |
| $2,500 to $2,999 | 1,732 (17.1%) | 420 (6.2%) |
| $3,000 or more | 3,394 (33.4%) | 115 (1.7%) |
| Total | 10,159 (100.0%) | 6,750 (100.0%) |
Physical Housing Characteristics in Beverly
Housing Structures in Beverly
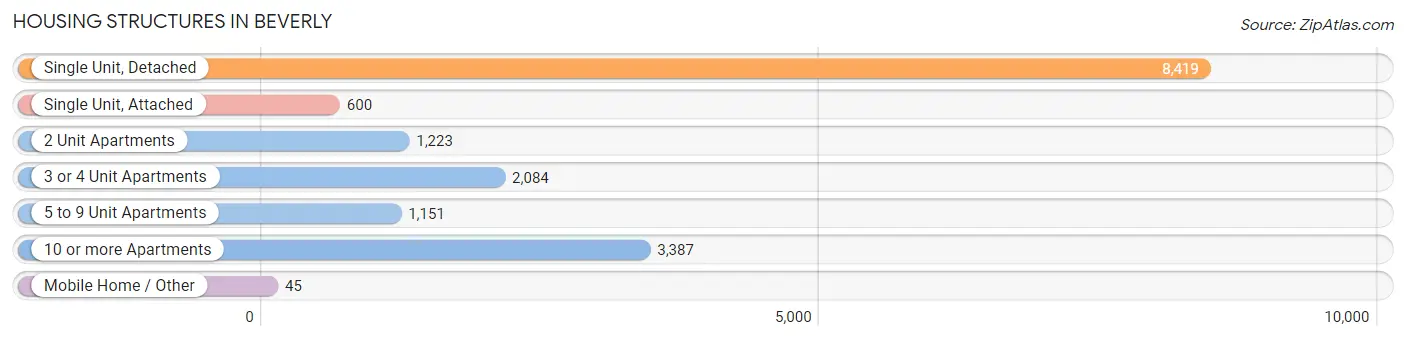
| Structure Type | # Housing Units | % Housing Units |
| Single Unit, Detached | 8,419 | 49.8% |
| Single Unit, Attached | 600 | 3.5% |
| 2 Unit Apartments | 1,223 | 7.2% |
| 3 or 4 Unit Apartments | 2,084 | 12.3% |
| 5 to 9 Unit Apartments | 1,151 | 6.8% |
| 10 or more Apartments | 3,387 | 20.0% |
| Mobile Home / Other | 45 | 0.3% |
| Total | 16,909 | 100.0% |
Housing Structures by Occupancy in Beverly
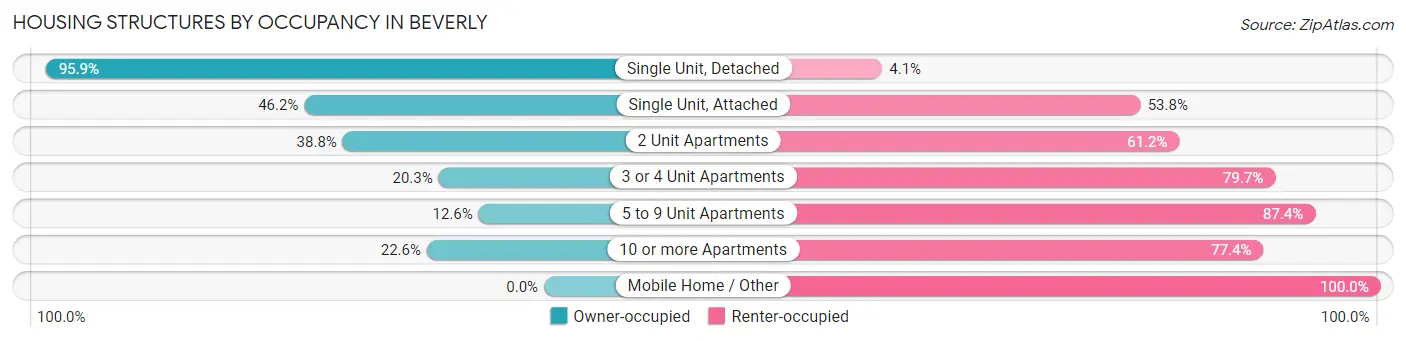
| Structure Type | Owner-occupied | Renter-occupied |
| Single Unit, Detached | 8,076 (95.9%) | 343 (4.1%) |
| Single Unit, Attached | 277 (46.2%) | 323 (53.8%) |
| 2 Unit Apartments | 474 (38.8%) | 749 (61.2%) |
| 3 or 4 Unit Apartments | 423 (20.3%) | 1,661 (79.7%) |
| 5 to 9 Unit Apartments | 145 (12.6%) | 1,006 (87.4%) |
| 10 or more Apartments | 764 (22.6%) | 2,623 (77.4%) |
| Mobile Home / Other | 0 (0.0%) | 45 (100.0%) |
| Total | 10,159 (60.1%) | 6,750 (39.9%) |
Housing Structures by Number of Rooms in Beverly
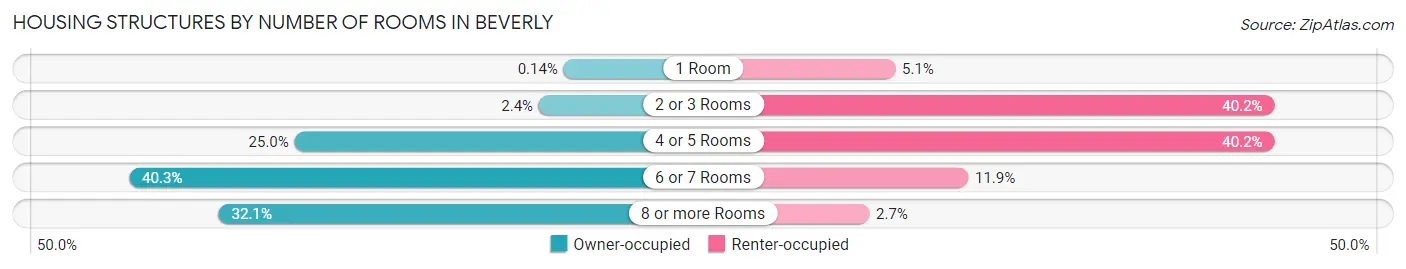
| Number of Rooms | Owner-occupied | Renter-occupied |
| 1 Room | 14 (0.1%) | 344 (5.1%) |
| 2 or 3 Rooms | 247 (2.4%) | 2,712 (40.2%) |
| 4 or 5 Rooms | 2,543 (25.0%) | 2,712 (40.2%) |
| 6 or 7 Rooms | 4,098 (40.3%) | 800 (11.8%) |
| 8 or more Rooms | 3,257 (32.1%) | 182 (2.7%) |
| Total | 10,159 (100.0%) | 6,750 (100.0%) |
Housing Structure by Heating Type in Beverly
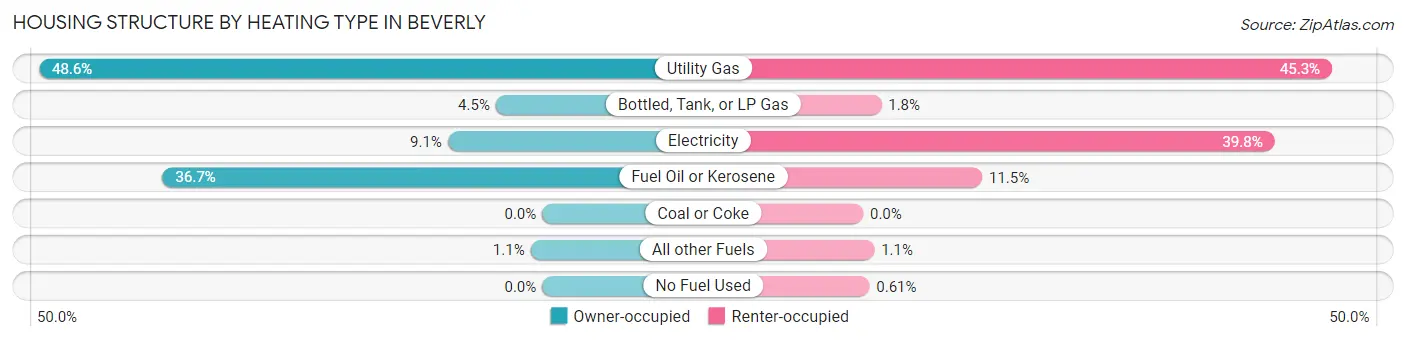
| Heating Type | Owner-occupied | Renter-occupied |
| Utility Gas | 4,938 (48.6%) | 3,058 (45.3%) |
| Bottled, Tank, or LP Gas | 455 (4.5%) | 119 (1.8%) |
| Electricity | 926 (9.1%) | 2,683 (39.8%) |
| Fuel Oil or Kerosene | 3,726 (36.7%) | 776 (11.5%) |
| Coal or Coke | 0 (0.0%) | 0 (0.0%) |
| All other Fuels | 114 (1.1%) | 73 (1.1%) |
| No Fuel Used | 0 (0.0%) | 41 (0.6%) |
| Total | 10,159 (100.0%) | 6,750 (100.0%) |
Household Vehicle Usage in Beverly
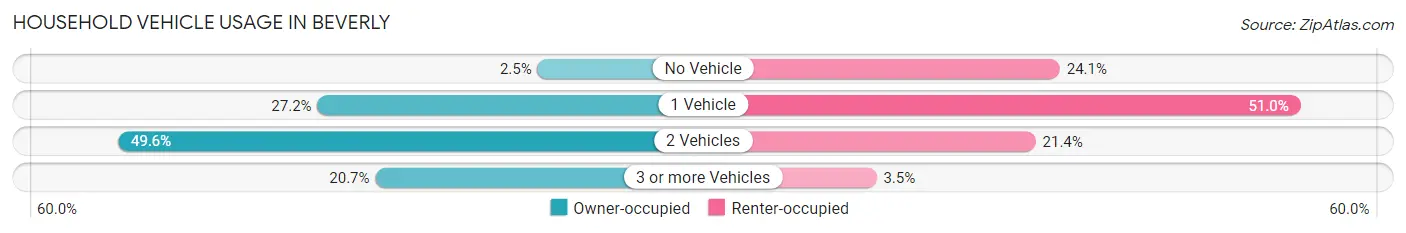
| Vehicles per Household | Owner-occupied | Renter-occupied |
| No Vehicle | 258 (2.5%) | 1,625 (24.1%) |
| 1 Vehicle | 2,763 (27.2%) | 3,445 (51.0%) |
| 2 Vehicles | 5,034 (49.5%) | 1,442 (21.4%) |
| 3 or more Vehicles | 2,104 (20.7%) | 238 (3.5%) |
| Total | 10,159 (100.0%) | 6,750 (100.0%) |
Real Estate & Mortgages in Beverly
Real Estate and Mortgage Overview in Beverly
| Characteristic | Without Mortgage | With Mortgage |
| Housing Units | 2,495 | 7,664 |
| Median Property Value | $528,300 | $584,500 |
| Median Household Income | $91,345 | $4,360 |
| Monthly Housing Costs | $976 | $3,374 |
| Real Estate Taxes | $6,263 | $37 |
Property Value by Mortgage Status in Beverly
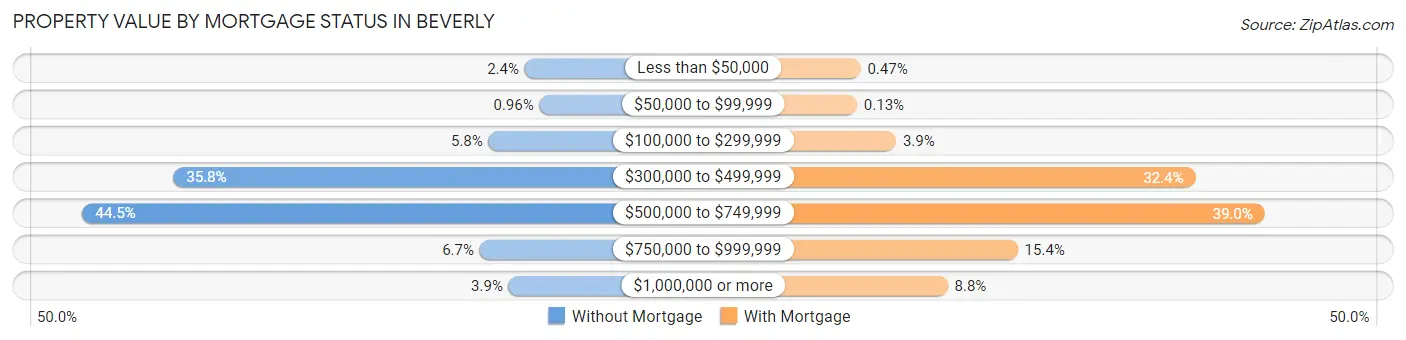
| Property Value | Without Mortgage | With Mortgage |
| Less than $50,000 | 59 (2.4%) | 36 (0.5%) |
| $50,000 to $99,999 | 24 (1.0%) | 10 (0.1%) |
| $100,000 to $299,999 | 145 (5.8%) | 295 (3.8%) |
| $300,000 to $499,999 | 894 (35.8%) | 2,481 (32.4%) |
| $500,000 to $749,999 | 1,110 (44.5%) | 2,987 (39.0%) |
| $750,000 to $999,999 | 166 (6.7%) | 1,183 (15.4%) |
| $1,000,000 or more | 97 (3.9%) | 672 (8.8%) |
| Total | 2,495 (100.0%) | 7,664 (100.0%) |
Household Income by Mortgage Status in Beverly
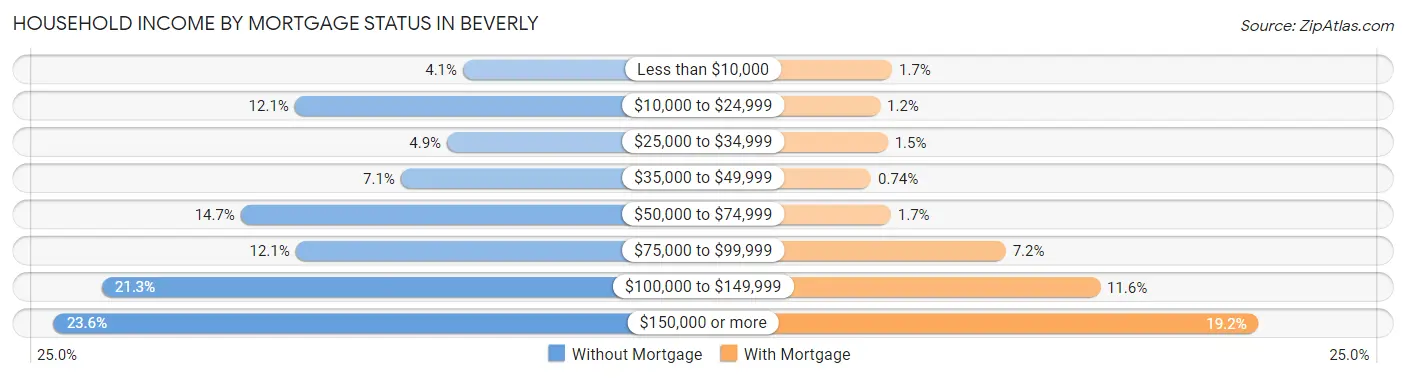
| Household Income | Without Mortgage | With Mortgage |
| Less than $10,000 | 103 (4.1%) | 133 (1.7%) |
| $10,000 to $24,999 | 303 (12.1%) | 90 (1.2%) |
| $25,000 to $34,999 | 122 (4.9%) | 117 (1.5%) |
| $35,000 to $49,999 | 177 (7.1%) | 57 (0.7%) |
| $50,000 to $74,999 | 367 (14.7%) | 129 (1.7%) |
| $75,000 to $99,999 | 302 (12.1%) | 548 (7.1%) |
| $100,000 to $149,999 | 532 (21.3%) | 892 (11.6%) |
| $150,000 or more | 589 (23.6%) | 1,471 (19.2%) |
| Total | 2,495 (100.0%) | 7,664 (100.0%) |
Property Value to Household Income Ratio in Beverly
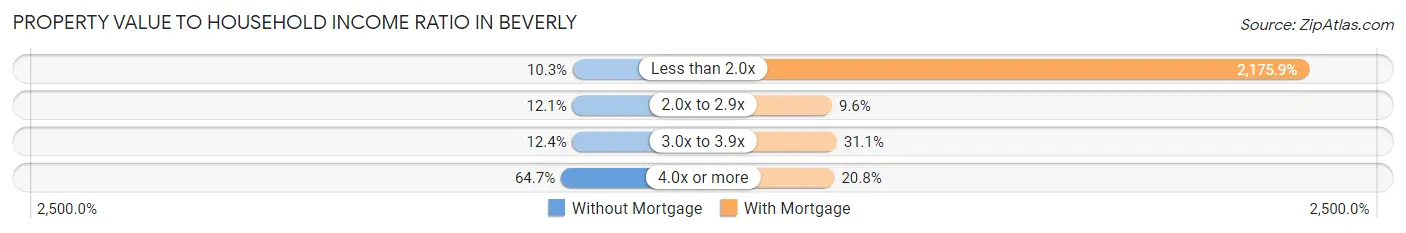
| Value-to-Income Ratio | Without Mortgage | With Mortgage |
| Less than 2.0x | 257 (10.3%) | 166,757 (2,175.9%) |
| 2.0x to 2.9x | 302 (12.1%) | 737 (9.6%) |
| 3.0x to 3.9x | 310 (12.4%) | 2,381 (31.1%) |
| 4.0x or more | 1,614 (64.7%) | 1,591 (20.8%) |
| Total | 2,495 (100.0%) | 7,664 (100.0%) |
Real Estate Taxes by Mortgage Status in Beverly
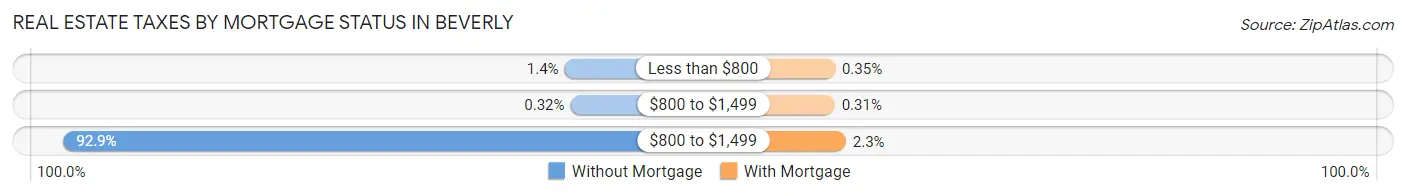
| Property Taxes | Without Mortgage | With Mortgage |
| Less than $800 | 35 (1.4%) | 27 (0.4%) |
| $800 to $1,499 | 8 (0.3%) | 24 (0.3%) |
| $800 to $1,499 | 2,318 (92.9%) | 179 (2.3%) |
| Total | 2,495 (100.0%) | 7,664 (100.0%) |
Health & Disability in Beverly
Health Insurance Coverage by Age in Beverly
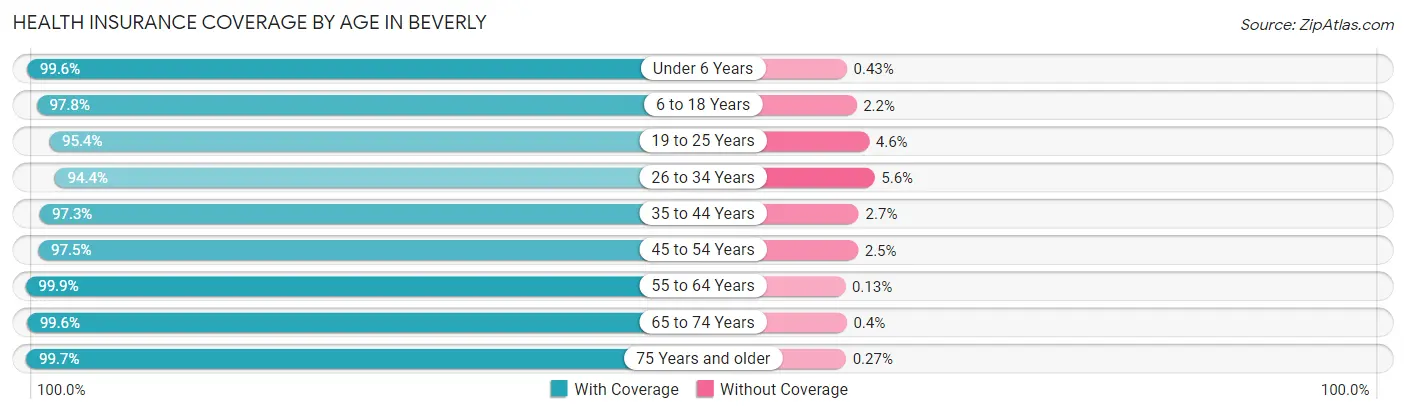
| Age Bracket | With Coverage | Without Coverage |
| Under 6 Years | 2,749 (99.6%) | 12 (0.4%) |
| 6 to 18 Years | 5,819 (97.8%) | 132 (2.2%) |
| 19 to 25 Years | 4,622 (95.4%) | 222 (4.6%) |
| 26 to 34 Years | 4,629 (94.4%) | 275 (5.6%) |
| 35 to 44 Years | 4,648 (97.3%) | 128 (2.7%) |
| 45 to 54 Years | 5,019 (97.5%) | 129 (2.5%) |
| 55 to 64 Years | 6,167 (99.9%) | 8 (0.1%) |
| 65 to 74 Years | 4,440 (99.6%) | 18 (0.4%) |
| 75 Years and older | 2,928 (99.7%) | 8 (0.3%) |
| Total | 41,021 (97.8%) | 932 (2.2%) |
Health Insurance Coverage by Citizenship Status in Beverly
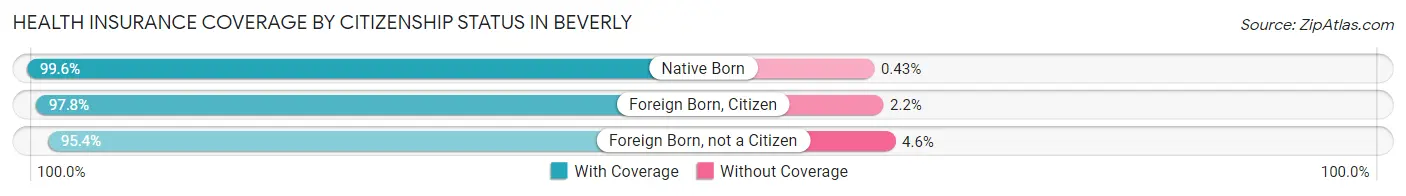
| Citizenship Status | With Coverage | Without Coverage |
| Native Born | 2,749 (99.6%) | 12 (0.4%) |
| Foreign Born, Citizen | 5,819 (97.8%) | 132 (2.2%) |
| Foreign Born, not a Citizen | 4,622 (95.4%) | 222 (4.6%) |
Health Insurance Coverage by Household Income in Beverly
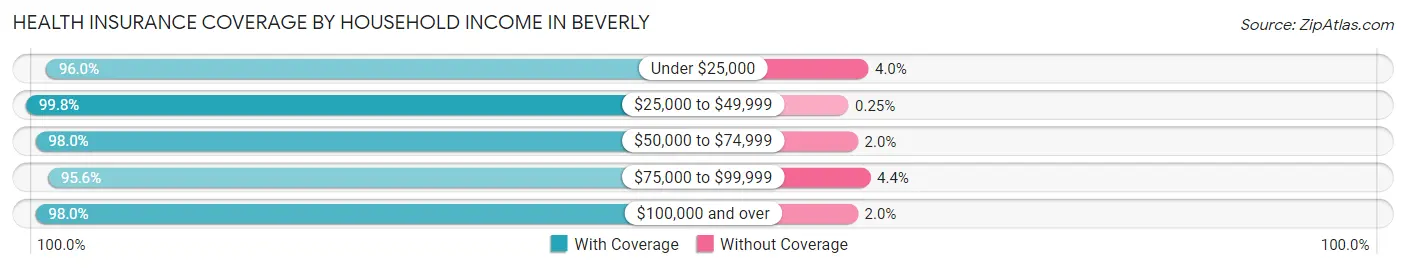
| Household Income | With Coverage | Without Coverage |
| Under $25,000 | 3,646 (96.0%) | 151 (4.0%) |
| $25,000 to $49,999 | 3,656 (99.8%) | 9 (0.3%) |
| $50,000 to $74,999 | 3,141 (98.0%) | 65 (2.0%) |
| $75,000 to $99,999 | 4,473 (95.6%) | 204 (4.4%) |
| $100,000 and over | 23,245 (98.0%) | 480 (2.0%) |
Public vs Private Health Insurance Coverage by Age in Beverly
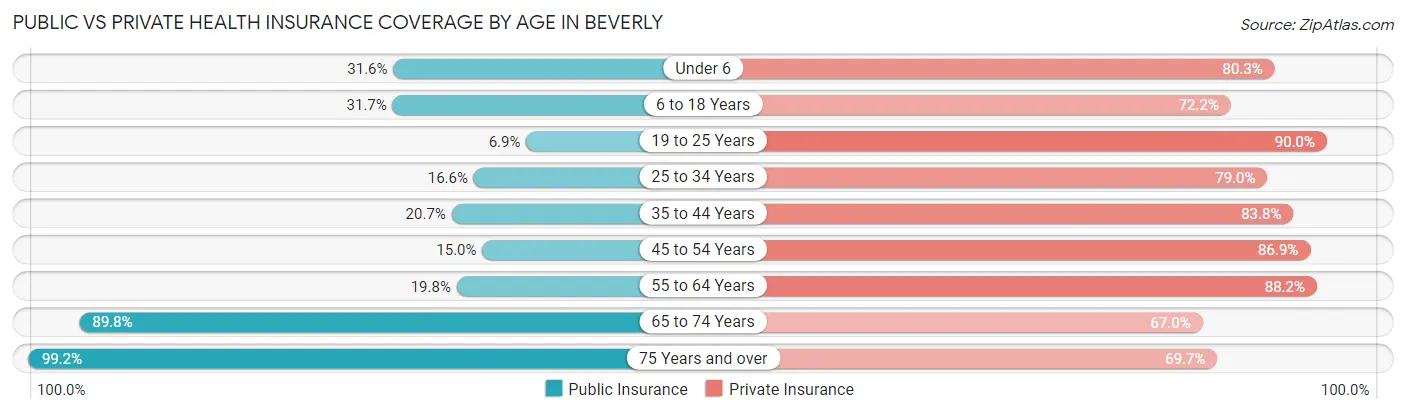
| Age Bracket | Public Insurance | Private Insurance |
| Under 6 | 871 (31.6%) | 2,218 (80.3%) |
| 6 to 18 Years | 1,886 (31.7%) | 4,296 (72.2%) |
| 19 to 25 Years | 333 (6.9%) | 4,361 (90.0%) |
| 25 to 34 Years | 815 (16.6%) | 3,873 (79.0%) |
| 35 to 44 Years | 990 (20.7%) | 4,002 (83.8%) |
| 45 to 54 Years | 774 (15.0%) | 4,475 (86.9%) |
| 55 to 64 Years | 1,222 (19.8%) | 5,444 (88.2%) |
| 65 to 74 Years | 4,005 (89.8%) | 2,985 (67.0%) |
| 75 Years and over | 2,913 (99.2%) | 2,046 (69.7%) |
| Total | 13,809 (32.9%) | 33,700 (80.3%) |
Disability Status by Sex by Age in Beverly
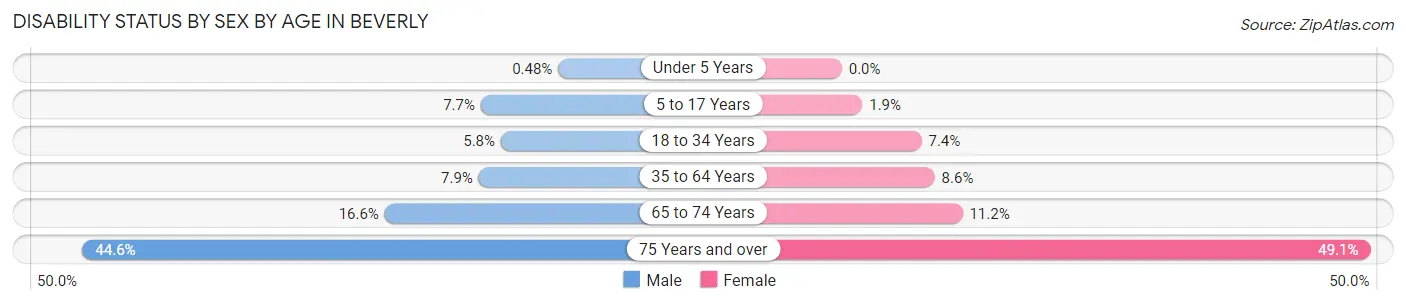
| Age Bracket | Male | Female |
| Under 5 Years | 7 (0.5%) | 0 (0.0%) |
| 5 to 17 Years | 218 (7.7%) | 54 (1.9%) |
| 18 to 34 Years | 272 (5.8%) | 421 (7.4%) |
| 35 to 64 Years | 595 (7.9%) | 735 (8.6%) |
| 65 to 74 Years | 366 (16.6%) | 252 (11.2%) |
| 75 Years and over | 628 (44.6%) | 750 (49.0%) |
Disability Class by Sex by Age in Beverly
Disability Class: Hearing Difficulty
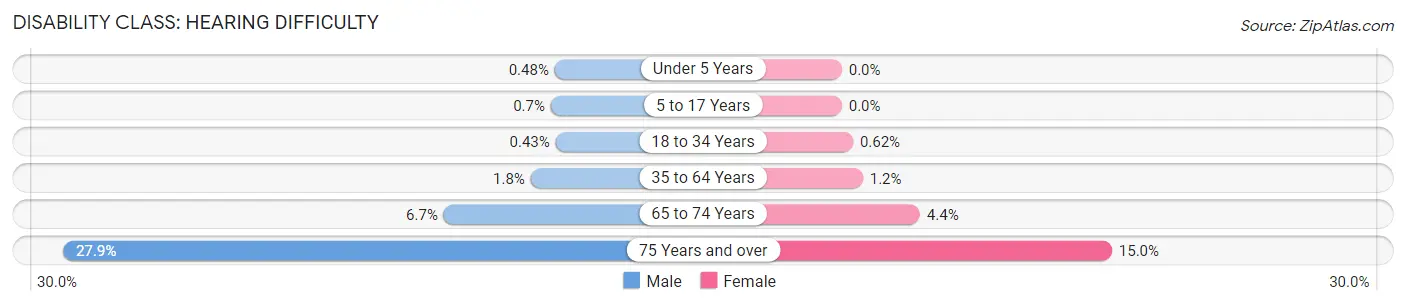
| Age Bracket | Male | Female |
| Under 5 Years | 7 (0.5%) | 0 (0.0%) |
| 5 to 17 Years | 20 (0.7%) | 0 (0.0%) |
| 18 to 34 Years | 20 (0.4%) | 35 (0.6%) |
| 35 to 64 Years | 138 (1.8%) | 100 (1.2%) |
| 65 to 74 Years | 147 (6.7%) | 98 (4.3%) |
| 75 Years and over | 392 (27.9%) | 230 (15.0%) |
Disability Class: Vision Difficulty
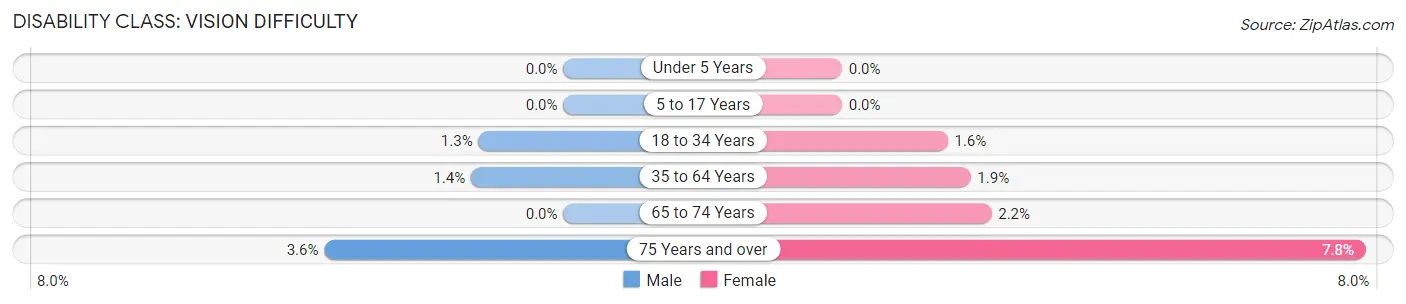
| Age Bracket | Male | Female |
| Under 5 Years | 0 (0.0%) | 0 (0.0%) |
| 5 to 17 Years | 0 (0.0%) | 0 (0.0%) |
| 18 to 34 Years | 59 (1.3%) | 89 (1.6%) |
| 35 to 64 Years | 104 (1.4%) | 163 (1.9%) |
| 65 to 74 Years | 0 (0.0%) | 50 (2.2%) |
| 75 Years and over | 50 (3.5%) | 119 (7.8%) |
Disability Class: Cognitive Difficulty
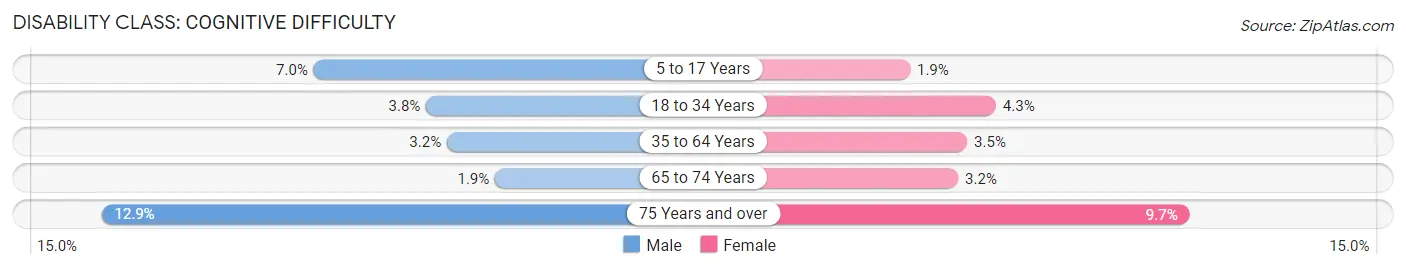
| Age Bracket | Male | Female |
| 5 to 17 Years | 198 (7.0%) | 54 (1.9%) |
| 18 to 34 Years | 179 (3.8%) | 244 (4.3%) |
| 35 to 64 Years | 245 (3.2%) | 298 (3.5%) |
| 65 to 74 Years | 42 (1.9%) | 73 (3.2%) |
| 75 Years and over | 181 (12.9%) | 148 (9.7%) |
Disability Class: Ambulatory Difficulty
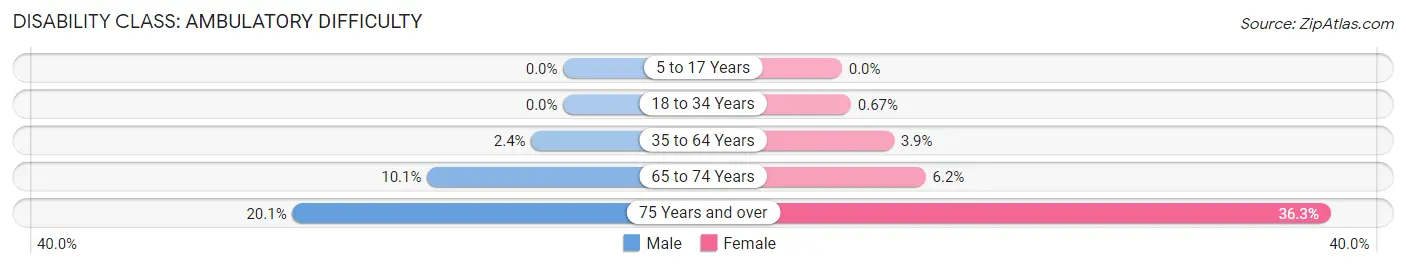
| Age Bracket | Male | Female |
| 5 to 17 Years | 0 (0.0%) | 0 (0.0%) |
| 18 to 34 Years | 0 (0.0%) | 38 (0.7%) |
| 35 to 64 Years | 179 (2.4%) | 329 (3.9%) |
| 65 to 74 Years | 223 (10.1%) | 140 (6.2%) |
| 75 Years and over | 283 (20.1%) | 555 (36.3%) |
Disability Class: Self-Care Difficulty
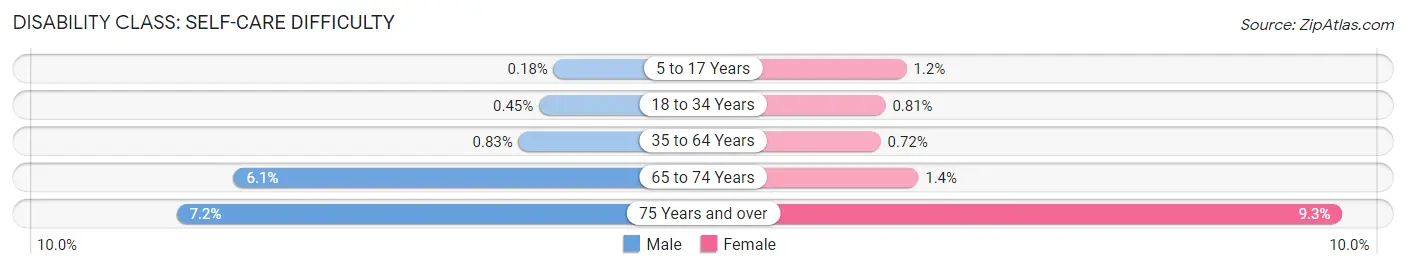
| Age Bracket | Male | Female |
| 5 to 17 Years | 5 (0.2%) | 34 (1.2%) |
| 18 to 34 Years | 21 (0.4%) | 46 (0.8%) |
| 35 to 64 Years | 63 (0.8%) | 61 (0.7%) |
| 65 to 74 Years | 135 (6.1%) | 32 (1.4%) |
| 75 Years and over | 101 (7.2%) | 142 (9.3%) |
Technology Access in Beverly
Computing Device Access in Beverly
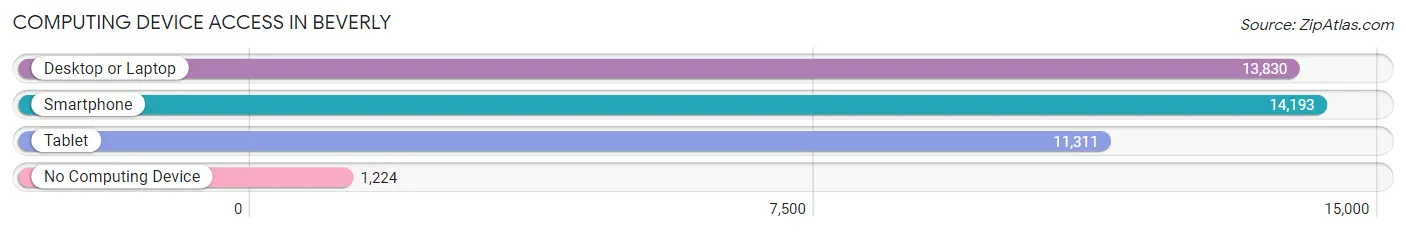
| Device Type | # Households | % Households |
| Desktop or Laptop | 13,830 | 81.8% |
| Smartphone | 14,193 | 83.9% |
| Tablet | 11,311 | 66.9% |
| No Computing Device | 1,224 | 7.2% |
| Total | 16,909 | 100.0% |
Internet Access in Beverly
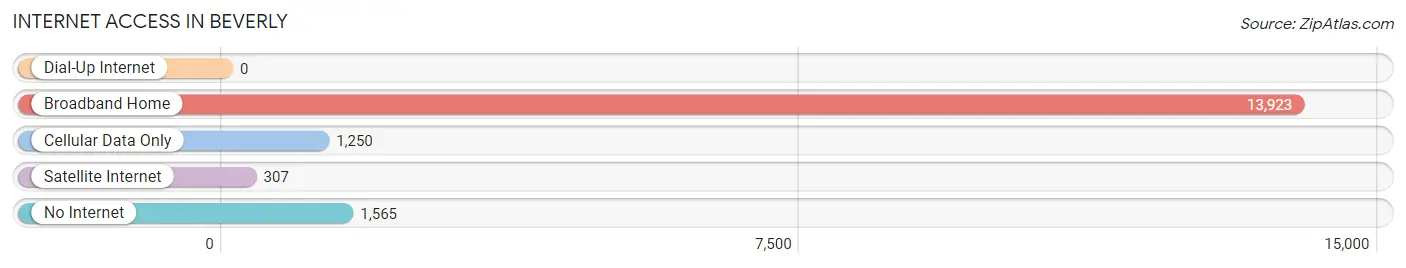
| Internet Type | # Households | % Households |
| Dial-Up Internet | 0 | 0.0% |
| Broadband Home | 13,923 | 82.3% |
| Cellular Data Only | 1,250 | 7.4% |
| Satellite Internet | 307 | 1.8% |
| No Internet | 1,565 | 9.3% |
| Total | 16,909 | 100.0% |
Beverly Summary
Beverly, Massachusetts is a city located in Essex County, Massachusetts, United States. It is located on the North Shore of Massachusetts Bay, approximately 25 miles north of Boston. As of the 2010 census, the population of Beverly was 39,502.
History
Beverly was first settled in 1626 by Roger Conant and a group of settlers from Salem. The area was originally known as the Naumkeag Plantation, and was part of Salem until 1775 when it was incorporated as a separate town. The town was named after the English town of Beverley, in Yorkshire, England.
In the 19th century, Beverly became a popular summer resort for wealthy Bostonians. The town was home to several large estates, including the Cabot Estate, the Hamilton Hall Estate, and the Lynch Estate.
Geography
Beverly is located at 42°33′N 70°53′W (42.55, -70.88). According to the United States Census Bureau, the city has a total area of 10.2 square miles (26.4 km2), of which 9.9 square miles (25.6 km2) is land and 0.3 square miles (0.8 km2) (2.90%) is water.
Beverly is bordered by Salem to the south, Danvers to the west, Wenham to the north, and Manchester-by-the-Sea to the east. The city is located on the North Shore of Massachusetts Bay, approximately 25 miles north of Boston.
Economy
Beverly is home to a variety of businesses, including manufacturing, retail, and service industries. The city is also home to several large employers, including General Electric, North Shore Medical Center, and Beverly Hospital.
Demographics
As of the 2010 census, there were 39,502 people, 15,845 households, and 10,072 families residing in the city. The population density was 3,988.7 people per square mile (1,541.2/km2). There were 16,845 housing units at an average density of 1,701.2 per square mile (656.2/km2). The racial makeup of the city was 92.2% White, 2.3% African American, 0.2% Native American, 2.7% Asian, 0.0% Pacific Islander, 1.2% from other races, and 1.5% from two or more races. Hispanic or Latino of any race were 3.7% of the population.
The median income for a household in the city was $62,837, and the median income for a family was $77,837. Males had a median income of $51,837 versus $41,837 for females. The per capita income for the city was $30,837. About 4.2% of families and 6.2% of the population were below the poverty line, including 8.2% of those under age 18 and 5.2% of those age 65 or over.
Common Questions
What is Per Capita Income in Beverly?
Per Capita income in Beverly is $56,102.
What is the Median Family Income in Beverly?
Median Family Income in Beverly is $139,677.
What is the Median Household income in Beverly?
Median Household Income in Beverly is $99,525.
What is Income or Wage Gap in Beverly?
Income or Wage Gap in Beverly is 38.2%.
Women in Beverly earn 61.8 cents for every dollar earned by a man.
What is Inequality or Gini Index in Beverly?
Inequality or Gini Index in Beverly is 0.48.
What is the Total Population of Beverly?
Total Population of Beverly is 42,414.
What is the Total Male Population of Beverly?
Total Male Population of Beverly is 20,361.
What is the Total Female Population of Beverly?
Total Female Population of Beverly is 22,053.
What is the Ratio of Males per 100 Females in Beverly?
There are 92.33 Males per 100 Females in Beverly.
What is the Ratio of Females per 100 Males in Beverly?
There are 108.31 Females per 100 Males in Beverly.
What is the Median Population Age in Beverly?
Median Population Age in Beverly is 40.3 Years.
What is the Average Family Size in Beverly
Average Family Size in Beverly is 2.9 People.
What is the Average Household Size in Beverly
Average Household Size in Beverly is 2.3 People.
How Large is the Labor Force in Beverly?
There are 23,963 People in the Labor Forcein in Beverly.
What is the Percentage of People in the Labor Force in Beverly?
68.4% of People are in the Labor Force in Beverly.
What is the Unemployment Rate in Beverly?
Unemployment Rate in Beverly is 3.3%.