Lynnfield, MA Map & Demographics
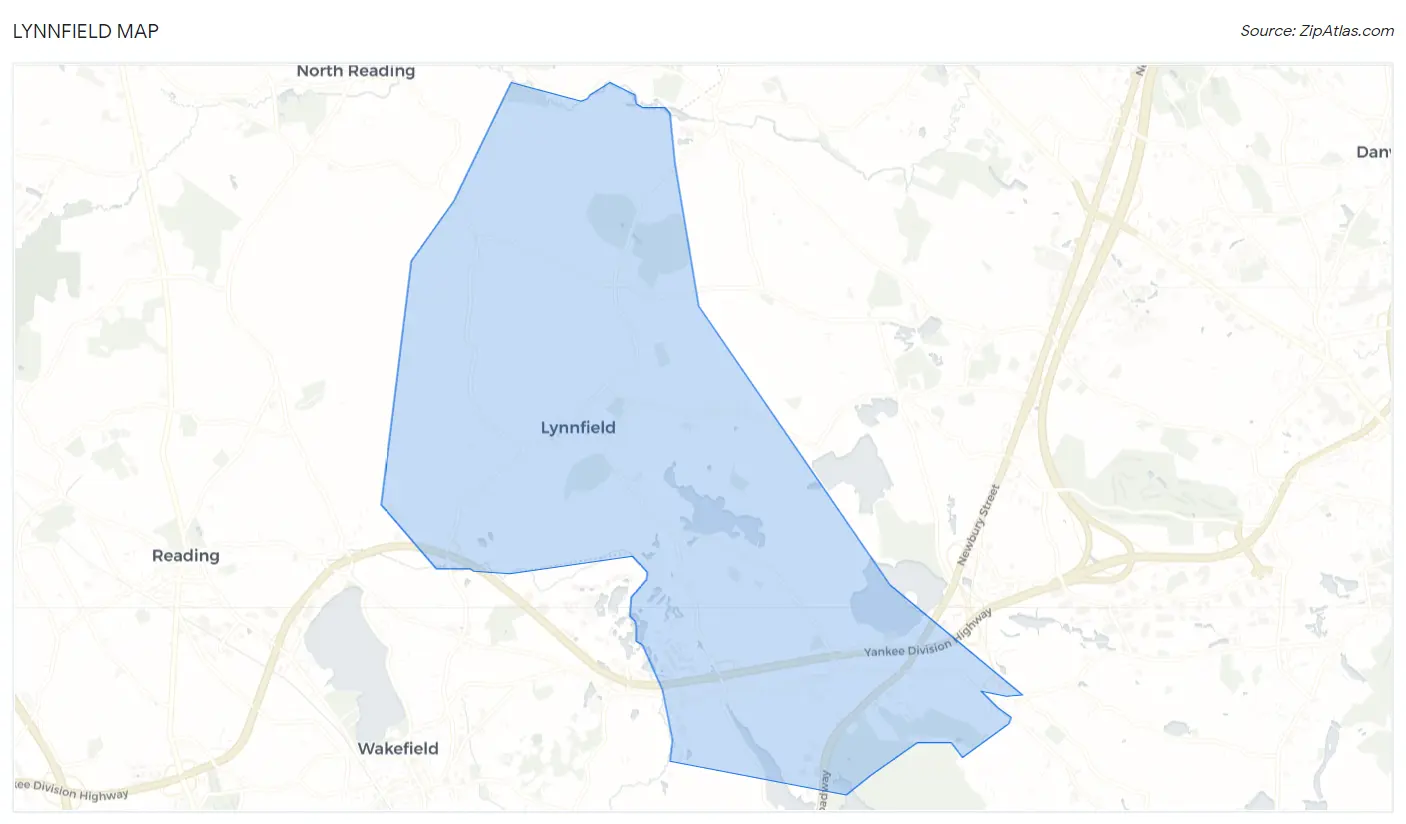
Lynnfield Map
Lynnfield Overview
$73,239
PER CAPITA INCOME
$180,081
AVG FAMILY INCOME
$160,931
AVG HOUSEHOLD INCOME
35.7%
WAGE / INCOME GAP [ % ]
64.3¢/ $1
WAGE / INCOME GAP [ $ ]
0.48
INEQUALITY / GINI INDEX
12,925
TOTAL POPULATION
6,174
MALE POPULATION
6,751
FEMALE POPULATION
91.45
MALES / 100 FEMALES
109.35
FEMALES / 100 MALES
40.9
MEDIAN AGE
3.2
AVG FAMILY SIZE
2.8
AVG HOUSEHOLD SIZE
6,830
LABOR FORCE [ PEOPLE ]
69.0%
PERCENT IN LABOR FORCE
4.5%
UNEMPLOYMENT RATE
Lynnfield Zip Codes
Lynnfield Area Codes
Income in Lynnfield
Income Overview in Lynnfield
Per Capita Income in Lynnfield is $73,239, while median incomes of families and households are $180,081 and $160,931 respectively.
| Characteristic | Number | Measure |
| Per Capita Income | 12,925 | $73,239 |
| Median Family Income | 3,690 | $180,081 |
| Mean Family Income | 3,690 | $227,994 |
| Median Household Income | 4,642 | $160,931 |
| Mean Household Income | 4,642 | $203,022 |
| Income Deficit | 3,690 | $0 |
| Wage / Income Gap (%) | 12,925 | 35.71% |
| Wage / Income Gap ($) | 12,925 | 64.29¢ per $1 |
| Gini / Inequality Index | 12,925 | 0.48 |
Earnings by Sex in Lynnfield
Average Earnings in Lynnfield are $78,193, $93,667 for men and $60,223 for women, a difference of 35.7%.
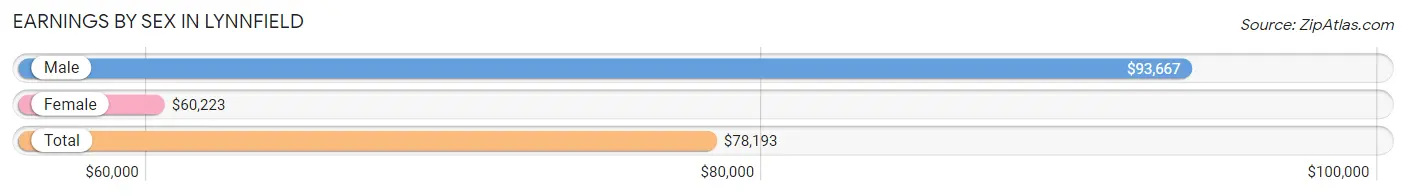
| Sex | Number | Average Earnings |
| Male | 3,612 (51.0%) | $93,667 |
| Female | 3,474 (49.0%) | $60,223 |
| Total | 7,086 (100.0%) | $78,193 |
Earnings by Sex by Income Bracket in Lynnfield
The most common earnings brackets in Lynnfield are $100,000+ for men (1,670 | 46.2%) and $100,000+ for women (1,081 | 31.1%).
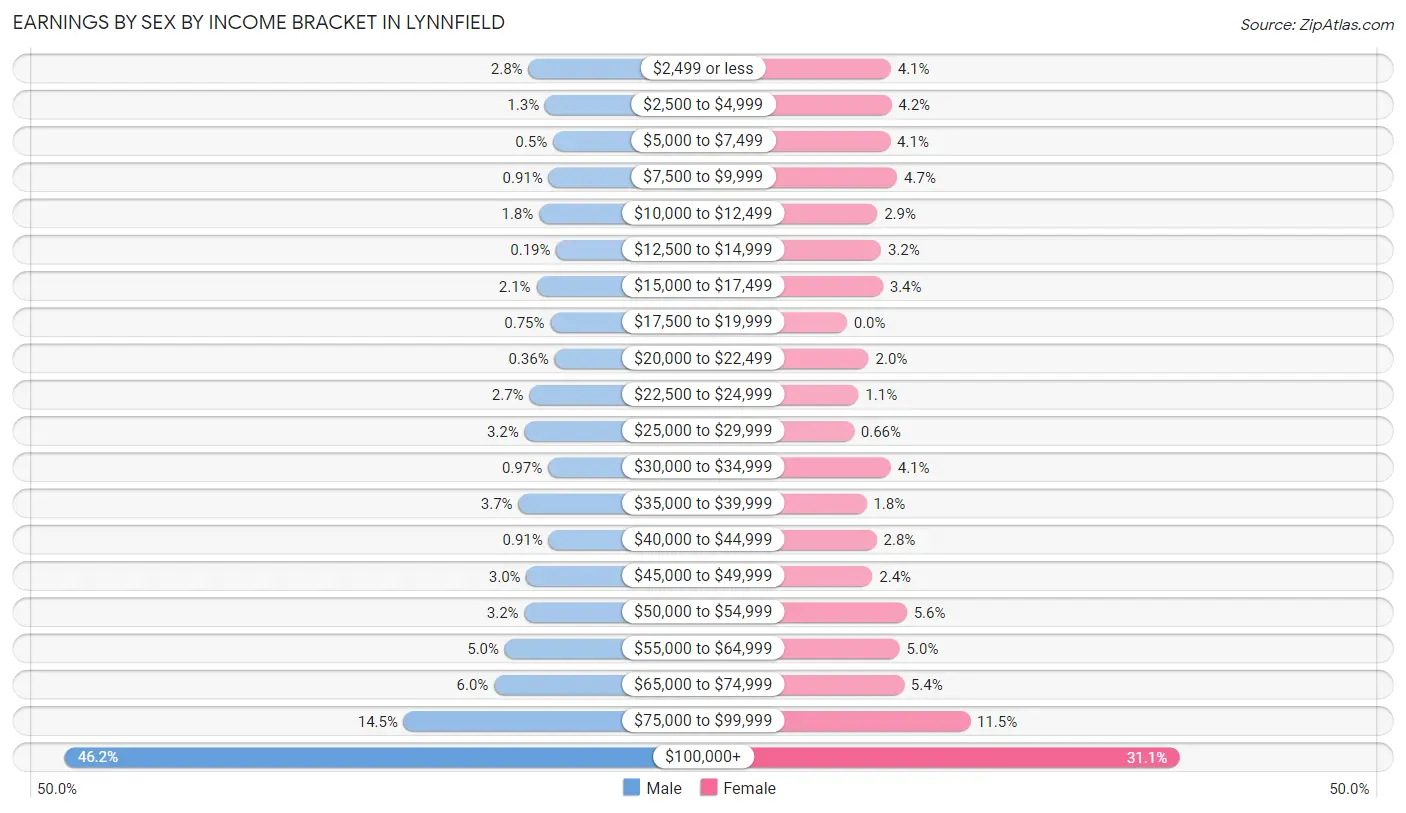
| Income | Male | Female |
| $2,499 or less | 101 (2.8%) | 143 (4.1%) |
| $2,500 to $4,999 | 45 (1.3%) | 145 (4.2%) |
| $5,000 to $7,499 | 18 (0.5%) | 141 (4.1%) |
| $7,500 to $9,999 | 33 (0.9%) | 164 (4.7%) |
| $10,000 to $12,499 | 65 (1.8%) | 99 (2.9%) |
| $12,500 to $14,999 | 7 (0.2%) | 111 (3.2%) |
| $15,000 to $17,499 | 74 (2.1%) | 117 (3.4%) |
| $17,500 to $19,999 | 27 (0.7%) | 0 (0.0%) |
| $20,000 to $22,499 | 13 (0.4%) | 71 (2.0%) |
| $22,500 to $24,999 | 98 (2.7%) | 38 (1.1%) |
| $25,000 to $29,999 | 114 (3.2%) | 23 (0.7%) |
| $30,000 to $34,999 | 35 (1.0%) | 143 (4.1%) |
| $35,000 to $39,999 | 135 (3.7%) | 64 (1.8%) |
| $40,000 to $44,999 | 33 (0.9%) | 97 (2.8%) |
| $45,000 to $49,999 | 108 (3.0%) | 83 (2.4%) |
| $50,000 to $54,999 | 115 (3.2%) | 195 (5.6%) |
| $55,000 to $64,999 | 181 (5.0%) | 172 (5.0%) |
| $65,000 to $74,999 | 217 (6.0%) | 186 (5.3%) |
| $75,000 to $99,999 | 523 (14.5%) | 401 (11.5%) |
| $100,000+ | 1,670 (46.2%) | 1,081 (31.1%) |
| Total | 3,612 (100.0%) | 3,474 (100.0%) |
Earnings by Sex by Educational Attainment in Lynnfield
Average earnings in Lynnfield are $101,591 for men and $74,500 for women, a difference of 26.7%. Men with an educational attainment of graduate degree enjoy the highest average annual earnings of $127,083, while those with college or associate's degree education earn the least with $57,734. Women with an educational attainment of graduate degree earn the most with the average annual earnings of $112,326, while those with high school diploma education have the smallest earnings of $34,112.
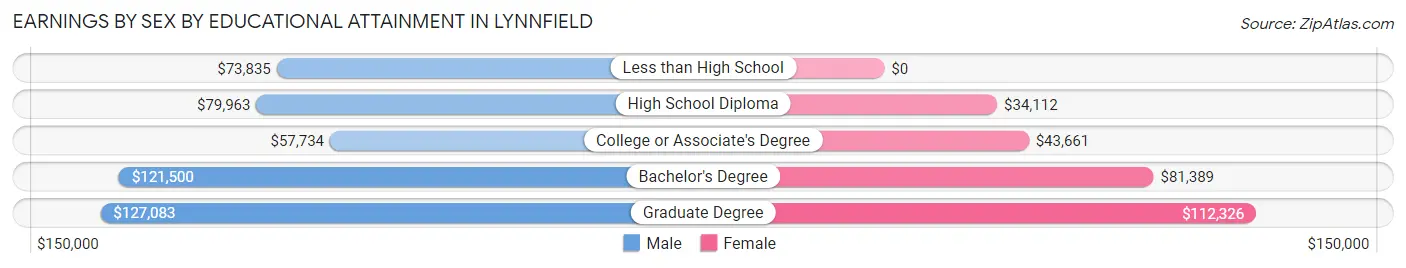
| Educational Attainment | Male Income | Female Income |
| Less than High School | $73,835 | $0 |
| High School Diploma | $79,963 | $34,112 |
| College or Associate's Degree | $57,734 | $43,661 |
| Bachelor's Degree | $121,500 | $81,389 |
| Graduate Degree | $127,083 | $112,326 |
| Total | $101,591 | $74,500 |
Family Income in Lynnfield
Family Income Brackets in Lynnfield
According to the Lynnfield family income data, there are 1,624 families falling into the $200,000+ income range, which is the most common income bracket and makes up 44.0% of all families. Conversely, the $10,000 to $14,999 income bracket is the least frequent group with only 7 families (0.2%) belonging to this category.
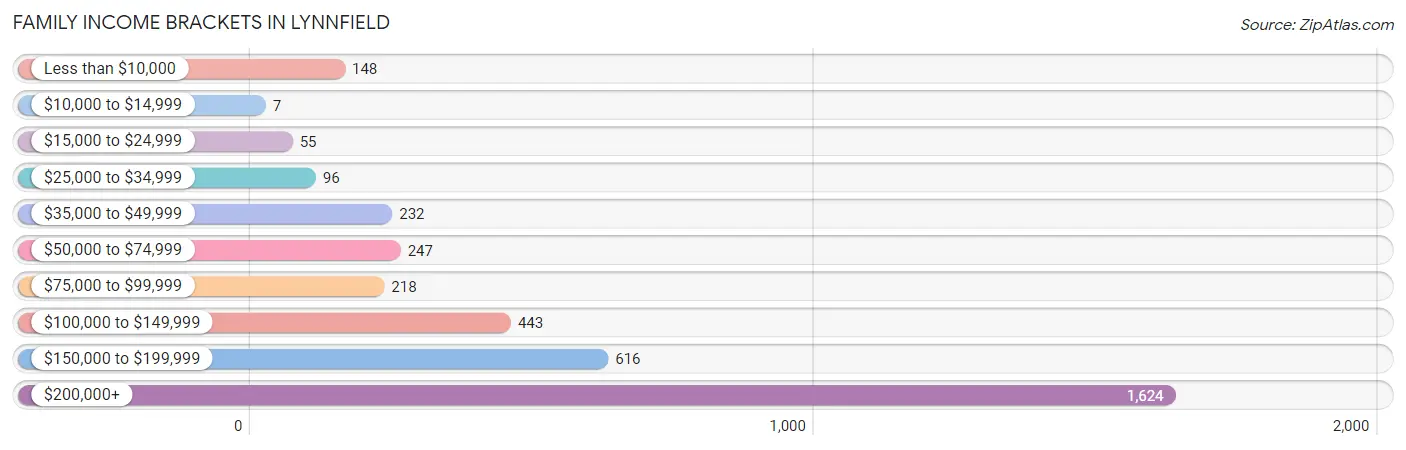
| Income Bracket | # Families | % Families |
| Less than $10,000 | 148 | 4.0% |
| $10,000 to $14,999 | 7 | 0.2% |
| $15,000 to $24,999 | 55 | 1.5% |
| $25,000 to $34,999 | 96 | 2.6% |
| $35,000 to $49,999 | 232 | 6.3% |
| $50,000 to $74,999 | 247 | 6.7% |
| $75,000 to $99,999 | 218 | 5.9% |
| $100,000 to $149,999 | 443 | 12.0% |
| $150,000 to $199,999 | 616 | 16.7% |
| $200,000+ | 1,624 | 44.0% |
Family Income by Famaliy Size in Lynnfield
5-person families (474 | 12.9%) account for the highest median family income in Lynnfield with $250,001 per family, while 2-person families (1,379 | 37.4%) have the highest median income of $63,438 per family member.
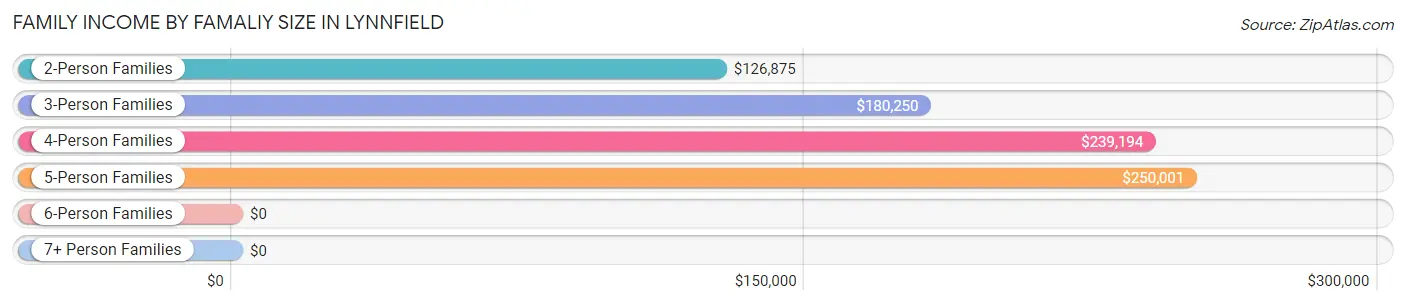
| Income Bracket | # Families | Median Income |
| 2-Person Families | 1,379 (37.4%) | $126,875 |
| 3-Person Families | 1,013 (27.5%) | $180,250 |
| 4-Person Families | 787 (21.3%) | $239,194 |
| 5-Person Families | 474 (12.9%) | $250,001 |
| 6-Person Families | 29 (0.8%) | $0 |
| 7+ Person Families | 8 (0.2%) | $0 |
| Total | 3,690 (100.0%) | $180,081 |
Family Income by Number of Earners in Lynnfield
The median family income in Lynnfield is $180,081, with families comprising 3+ earners (526) having the highest median family income of $250,001, while families with no earners (379) have the lowest median family income of $49,095, accounting for 14.2% and 10.3% of families, respectively.
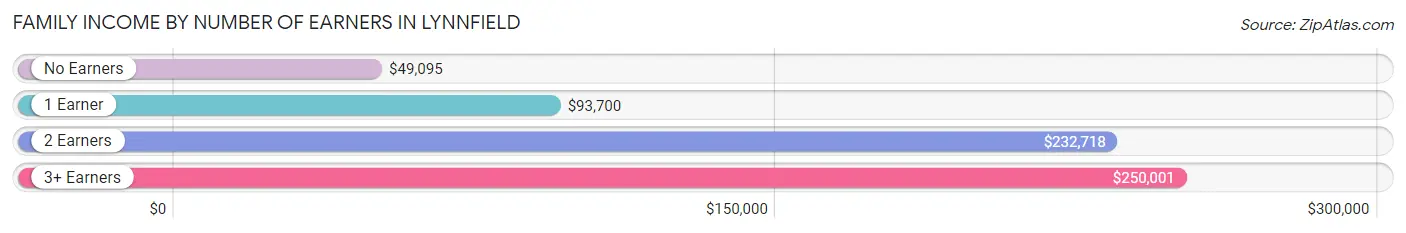
| Number of Earners | # Families | Median Income |
| No Earners | 379 (10.3%) | $49,095 |
| 1 Earner | 926 (25.1%) | $93,700 |
| 2 Earners | 1,859 (50.4%) | $232,718 |
| 3+ Earners | 526 (14.2%) | $250,001 |
| Total | 3,690 (100.0%) | $180,081 |
Household Income in Lynnfield
Household Income Brackets in Lynnfield
With 1,727 households falling in the category, the $200,000+ income range is the most frequent in Lynnfield, accounting for 37.2% of all households. In contrast, only 9 households (0.2%) fall into the $10,000 to $14,999 income bracket, making it the least populous group.
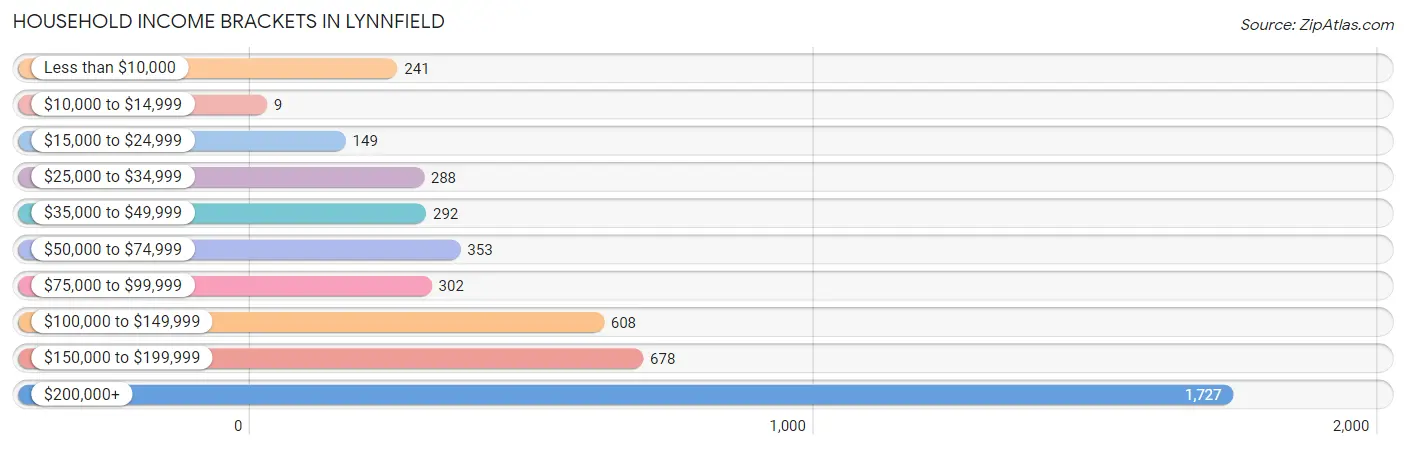
| Income Bracket | # Households | % Households |
| Less than $10,000 | 241 | 5.2% |
| $10,000 to $14,999 | 9 | 0.2% |
| $15,000 to $24,999 | 149 | 3.2% |
| $25,000 to $34,999 | 288 | 6.2% |
| $35,000 to $49,999 | 292 | 6.3% |
| $50,000 to $74,999 | 353 | 7.6% |
| $75,000 to $99,999 | 302 | 6.5% |
| $100,000 to $149,999 | 608 | 13.1% |
| $150,000 to $199,999 | 678 | 14.6% |
| $200,000+ | 1,727 | 37.2% |
Household Income by Householder Age in Lynnfield
The median household income in Lynnfield is $160,931, with the highest median household income of $191,641 found in the 25 to 44 years age bracket for the primary householder. A total of 1,365 households (29.4%) fall into this category.
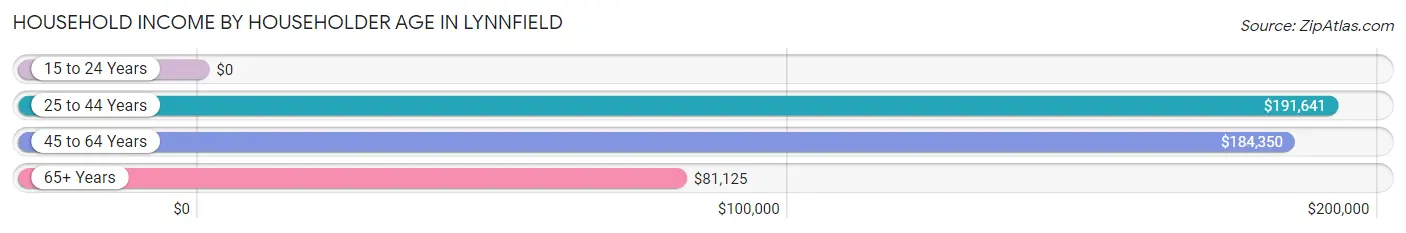
| Income Bracket | # Households | Median Income |
| 15 to 24 Years | 0 (0.0%) | $0 |
| 25 to 44 Years | 1,365 (29.4%) | $191,641 |
| 45 to 64 Years | 1,715 (36.9%) | $184,350 |
| 65+ Years | 1,562 (33.7%) | $81,125 |
| Total | 4,642 (100.0%) | $160,931 |
Poverty in Lynnfield
Income Below Poverty by Sex and Age in Lynnfield
With 5.9% poverty level for males and 6.7% for females among the residents of Lynnfield, 16 and 17 year old males and 35 to 44 year old females are the most vulnerable to poverty, with 24 males (20.3%) and 151 females (18.3%) in their respective age groups living below the poverty level.
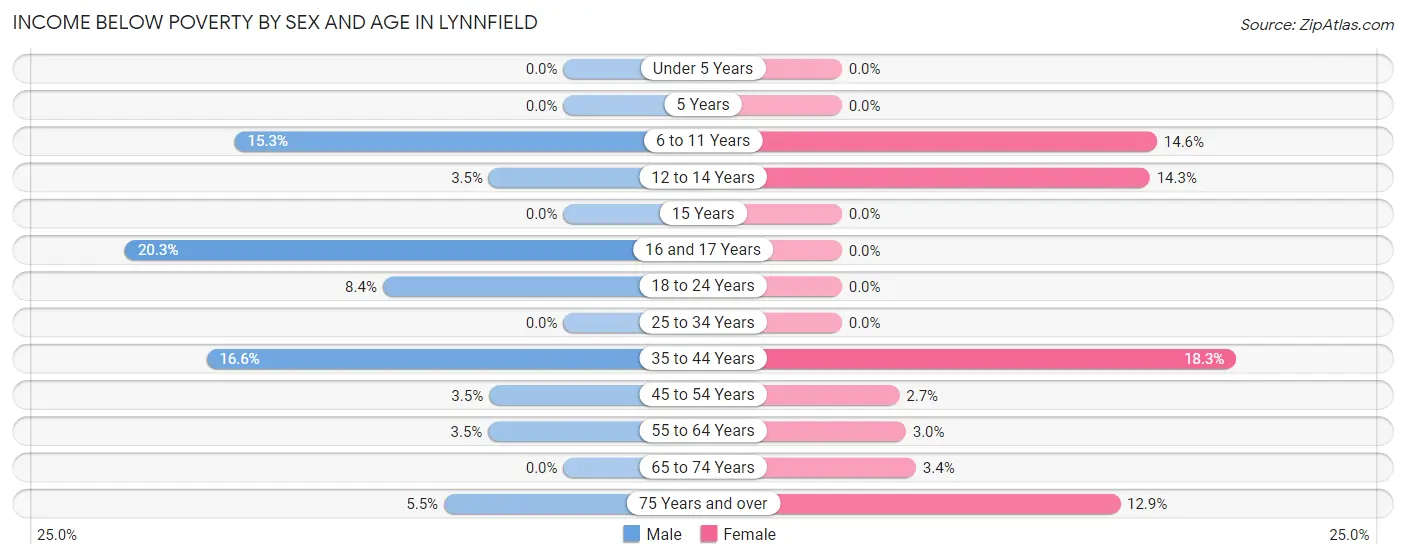
| Age Bracket | Male | Female |
| Under 5 Years | 0 (0.0%) | 0 (0.0%) |
| 5 Years | 0 (0.0%) | 0 (0.0%) |
| 6 to 11 Years | 72 (15.2%) | 101 (14.6%) |
| 12 to 14 Years | 10 (3.5%) | 35 (14.3%) |
| 15 Years | 0 (0.0%) | 0 (0.0%) |
| 16 and 17 Years | 24 (20.3%) | 0 (0.0%) |
| 18 to 24 Years | 29 (8.4%) | 0 (0.0%) |
| 25 to 34 Years | 0 (0.0%) | 0 (0.0%) |
| 35 to 44 Years | 151 (16.6%) | 151 (18.3%) |
| 45 to 54 Years | 29 (3.5%) | 23 (2.7%) |
| 55 to 64 Years | 25 (3.5%) | 26 (3.0%) |
| 65 to 74 Years | 0 (0.0%) | 27 (3.4%) |
| 75 Years and over | 24 (5.5%) | 86 (12.9%) |
| Total | 364 (5.9%) | 449 (6.7%) |
Income Above Poverty by Sex and Age in Lynnfield
According to the poverty statistics in Lynnfield, males aged under 5 years and females aged under 5 years are the age groups that are most secure financially, with 100.0% of males and 100.0% of females in these age groups living above the poverty line.
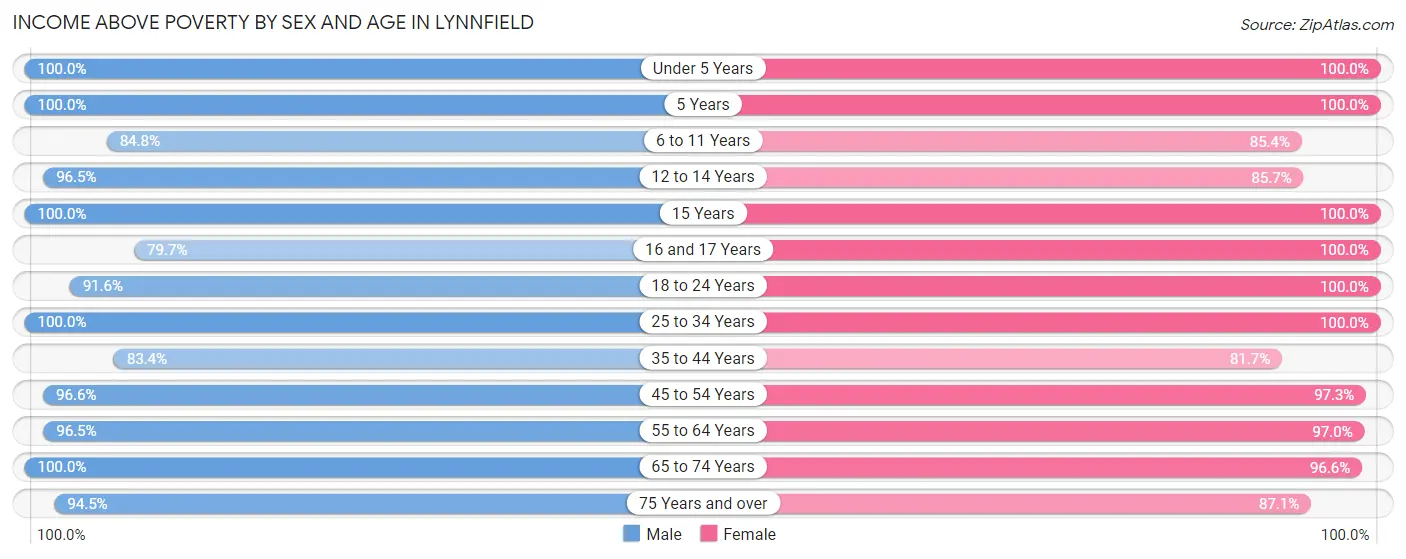
| Age Bracket | Male | Female |
| Under 5 Years | 583 (100.0%) | 330 (100.0%) |
| 5 Years | 181 (100.0%) | 100 (100.0%) |
| 6 to 11 Years | 400 (84.8%) | 590 (85.4%) |
| 12 to 14 Years | 279 (96.5%) | 210 (85.7%) |
| 15 Years | 37 (100.0%) | 98 (100.0%) |
| 16 and 17 Years | 94 (79.7%) | 209 (100.0%) |
| 18 to 24 Years | 317 (91.6%) | 463 (100.0%) |
| 25 to 34 Years | 637 (100.0%) | 599 (100.0%) |
| 35 to 44 Years | 761 (83.4%) | 674 (81.7%) |
| 45 to 54 Years | 812 (96.6%) | 840 (97.3%) |
| 55 to 64 Years | 691 (96.5%) | 850 (97.0%) |
| 65 to 74 Years | 609 (100.0%) | 759 (96.6%) |
| 75 Years and over | 409 (94.5%) | 580 (87.1%) |
| Total | 5,810 (94.1%) | 6,302 (93.3%) |
Income Below Poverty Among Married-Couple Families in Lynnfield
The poverty statistics for married-couple families in Lynnfield show that 6.1% or 194 of the total 3,200 families live below the poverty line. Families with 1 or 2 children have the highest poverty rate of 11.9%, comprising of 149 families. On the other hand, families with no children have the lowest poverty rate of 1.5%, which includes 24 families.
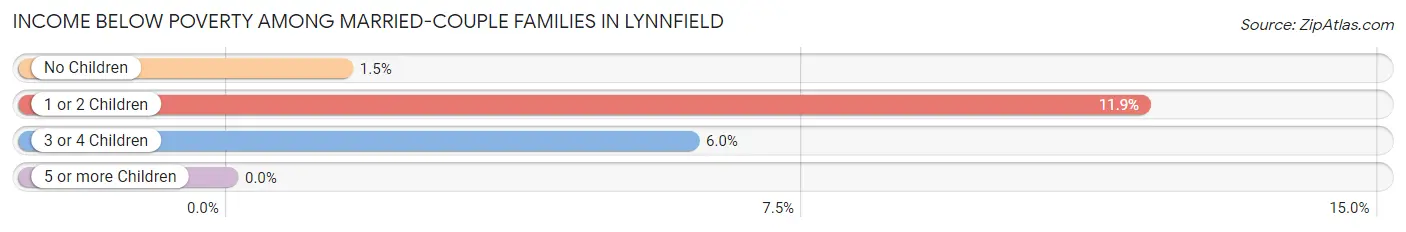
| Children | Above Poverty | Below Poverty |
| No Children | 1,577 (98.5%) | 24 (1.5%) |
| 1 or 2 Children | 1,101 (88.1%) | 149 (11.9%) |
| 3 or 4 Children | 328 (94.0%) | 21 (6.0%) |
| 5 or more Children | 0 (0.0%) | 0 (0.0%) |
| Total | 3,006 (93.9%) | 194 (6.1%) |
Income Below Poverty Among Single-Parent Households in Lynnfield
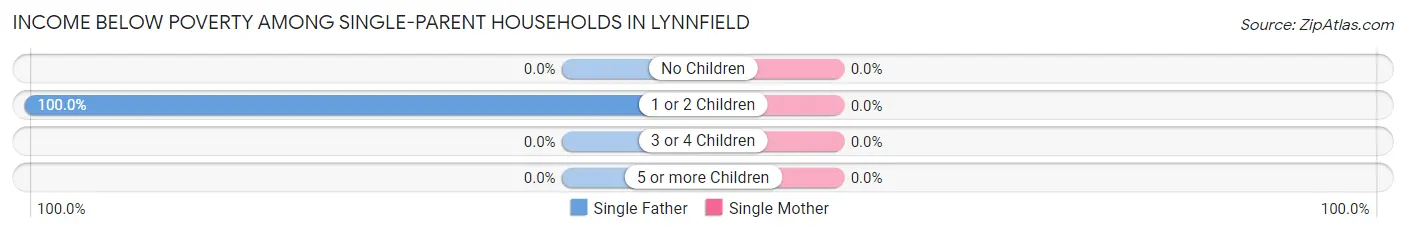
| Children | Single Father | Single Mother |
| No Children | 0 (0.0%) | 0 (0.0%) |
| 1 or 2 Children | 11 (100.0%) | 0 (0.0%) |
| 3 or 4 Children | 0 (0.0%) | 0 (0.0%) |
| 5 or more Children | 0 (0.0%) | 0 (0.0%) |
| Total | 11 (17.2%) | 0 (0.0%) |
Income Below Poverty Among Married-Couple vs Single-Parent Households in Lynnfield
The poverty data for Lynnfield shows that 194 of the married-couple family households (6.1%) and 11 of the single-parent households (2.2%) are living below the poverty level. Within the married-couple family households, those with 1 or 2 children have the highest poverty rate, with 149 households (11.9%) falling below the poverty line. Among the single-parent households, those with 1 or 2 children have the highest poverty rate, with 11 household (4.5%) living below poverty.
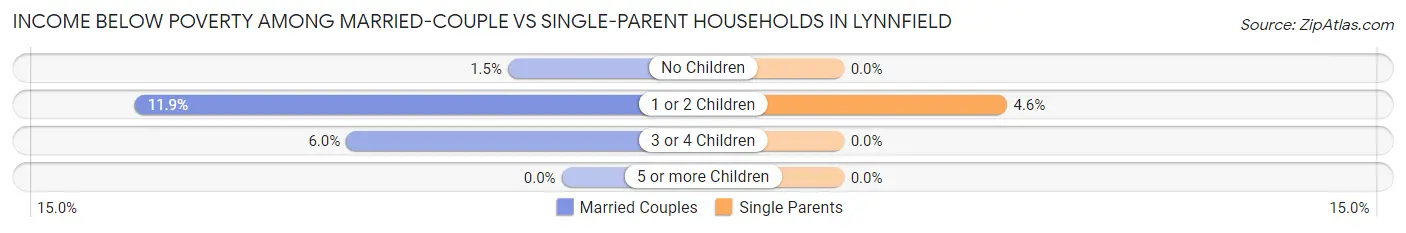
| Children | Married-Couple Families | Single-Parent Households |
| No Children | 24 (1.5%) | 0 (0.0%) |
| 1 or 2 Children | 149 (11.9%) | 11 (4.5%) |
| 3 or 4 Children | 21 (6.0%) | 0 (0.0%) |
| 5 or more Children | 0 (0.0%) | 0 (0.0%) |
| Total | 194 (6.1%) | 11 (2.2%) |
Race in Lynnfield
The most populous races in Lynnfield are White / Caucasian (10,620 | 82.2%), Asian (1,071 | 8.3%), and Hispanic or Latino (593 | 4.6%).
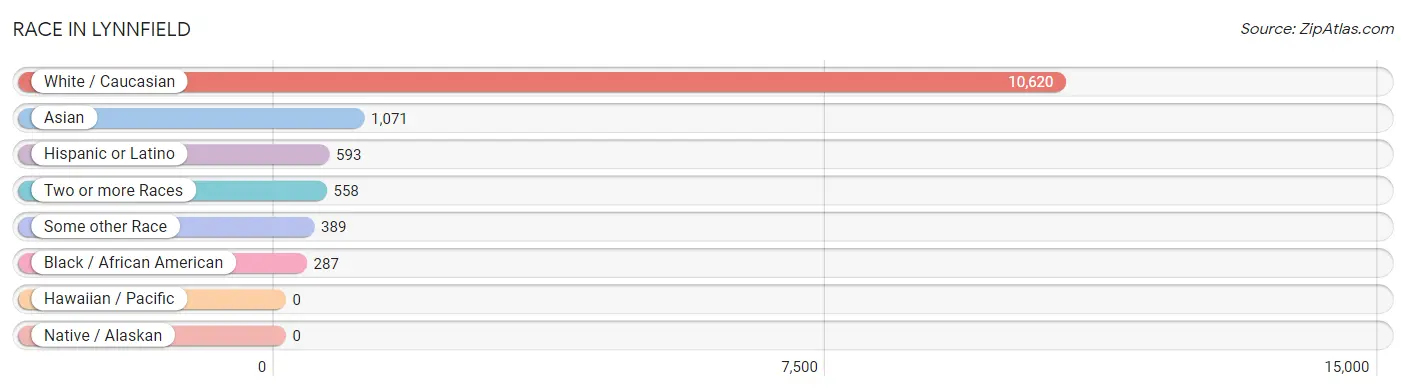
| Race | # Population | % Population |
| Asian | 1,071 | 8.3% |
| Black / African American | 287 | 2.2% |
| Hawaiian / Pacific | 0 | 0.0% |
| Hispanic or Latino | 593 | 4.6% |
| Native / Alaskan | 0 | 0.0% |
| White / Caucasian | 10,620 | 82.2% |
| Two or more Races | 558 | 4.3% |
| Some other Race | 389 | 3.0% |
| Total | 12,925 | 100.0% |
Ancestry in Lynnfield
The most populous ancestries reported in Lynnfield are Irish (3,342 | 25.9%), Italian (3,060 | 23.7%), English (1,702 | 13.2%), German (708 | 5.5%), and Indian (Asian) (700 | 5.4%), together accounting for 73.6% of all Lynnfield residents.
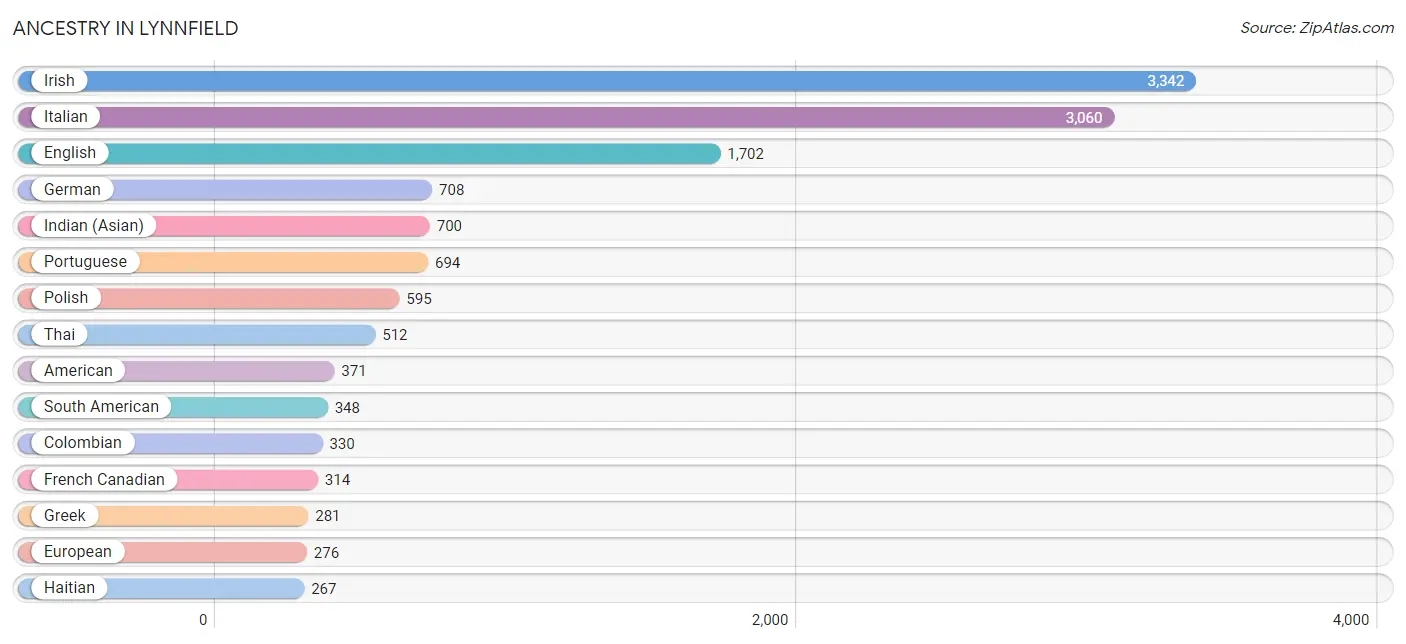
| Ancestry | # Population | % Population |
| Albanian | 11 | 0.1% |
| American | 371 | 2.9% |
| Arab | 70 | 0.5% |
| Armenian | 68 | 0.5% |
| Austrian | 51 | 0.4% |
| Bhutanese | 37 | 0.3% |
| Brazilian | 47 | 0.4% |
| British | 136 | 1.1% |
| Bulgarian | 44 | 0.3% |
| Burmese | 27 | 0.2% |
| Canadian | 190 | 1.5% |
| Central American | 29 | 0.2% |
| Colombian | 330 | 2.5% |
| Croatian | 10 | 0.1% |
| Cuban | 72 | 0.6% |
| Czech | 69 | 0.5% |
| Danish | 32 | 0.3% |
| Dominican | 84 | 0.6% |
| Ecuadorian | 18 | 0.1% |
| English | 1,702 | 13.2% |
| European | 276 | 2.1% |
| French | 246 | 1.9% |
| French American Indian | 35 | 0.3% |
| French Canadian | 314 | 2.4% |
| German | 708 | 5.5% |
| Greek | 281 | 2.2% |
| Guatemalan | 29 | 0.2% |
| Haitian | 267 | 2.1% |
| Hungarian | 7 | 0.1% |
| Indian (Asian) | 700 | 5.4% |
| Iranian | 22 | 0.2% |
| Irish | 3,342 | 25.9% |
| Italian | 3,060 | 23.7% |
| Japanese | 53 | 0.4% |
| Korean | 16 | 0.1% |
| Lebanese | 39 | 0.3% |
| Lithuanian | 130 | 1.0% |
| Mexican | 12 | 0.1% |
| Northern European | 93 | 0.7% |
| Norwegian | 24 | 0.2% |
| Polish | 595 | 4.6% |
| Portuguese | 694 | 5.4% |
| Puerto Rican | 25 | 0.2% |
| Russian | 198 | 1.5% |
| Scotch-Irish | 28 | 0.2% |
| Scottish | 119 | 0.9% |
| Serbian | 53 | 0.4% |
| Slavic | 7 | 0.1% |
| Slovak | 24 | 0.2% |
| South American | 348 | 2.7% |
| Spaniard | 13 | 0.1% |
| Spanish | 10 | 0.1% |
| Sri Lankan | 28 | 0.2% |
| Swedish | 51 | 0.4% |
| Syrian | 31 | 0.2% |
| Thai | 512 | 4.0% |
| Turkish | 14 | 0.1% |
| Welsh | 55 | 0.4% | View All 58 Rows |
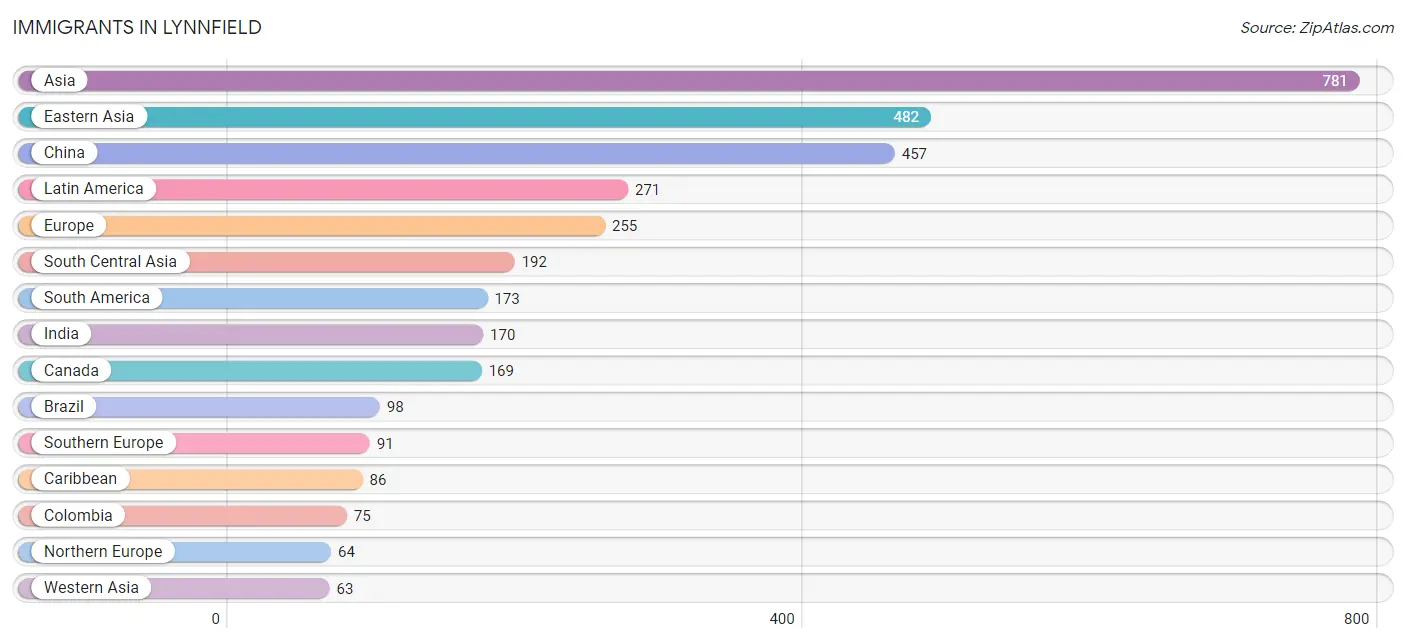
Immigrants in Lynnfield
The most numerous immigrant groups reported in Lynnfield came from Asia (781 | 6.0%), Eastern Asia (482 | 3.7%), China (457 | 3.5%), Latin America (271 | 2.1%), and Europe (255 | 2.0%), together accounting for 17.4% of all Lynnfield residents.
| Immigration Origin | # Population | % Population |
| Africa | 8 | 0.1% |
| Asia | 781 | 6.0% |
| Brazil | 98 | 0.8% |
| Bulgaria | 18 | 0.1% |
| Canada | 169 | 1.3% |
| Caribbean | 86 | 0.7% |
| Central America | 12 | 0.1% |
| China | 457 | 3.5% |
| Colombia | 75 | 0.6% |
| Czechoslovakia | 8 | 0.1% |
| Dominican Republic | 29 | 0.2% |
| Eastern Asia | 482 | 3.7% |
| Eastern Europe | 61 | 0.5% |
| England | 7 | 0.1% |
| Europe | 255 | 2.0% |
| France | 12 | 0.1% |
| Germany | 27 | 0.2% |
| Haiti | 57 | 0.4% |
| India | 170 | 1.3% |
| Iran | 22 | 0.2% |
| Ireland | 18 | 0.1% |
| Italy | 45 | 0.4% |
| Japan | 11 | 0.1% |
| Korea | 14 | 0.1% |
| Latin America | 271 | 2.1% |
| Lebanon | 28 | 0.2% |
| Mexico | 12 | 0.1% |
| Northern Europe | 64 | 0.5% |
| Philippines | 16 | 0.1% |
| Poland | 22 | 0.2% |
| Portugal | 33 | 0.3% |
| Serbia | 13 | 0.1% |
| South Africa | 8 | 0.1% |
| South America | 173 | 1.3% |
| South Central Asia | 192 | 1.5% |
| South Eastern Asia | 44 | 0.3% |
| Southern Europe | 91 | 0.7% |
| Spain | 13 | 0.1% |
| Syria | 21 | 0.2% |
| Thailand | 18 | 0.1% |
| Turkey | 14 | 0.1% |
| Vietnam | 10 | 0.1% |
| Western Asia | 63 | 0.5% |
| Western Europe | 39 | 0.3% | View All 44 Rows |
Sex and Age in Lynnfield
Sex and Age in Lynnfield
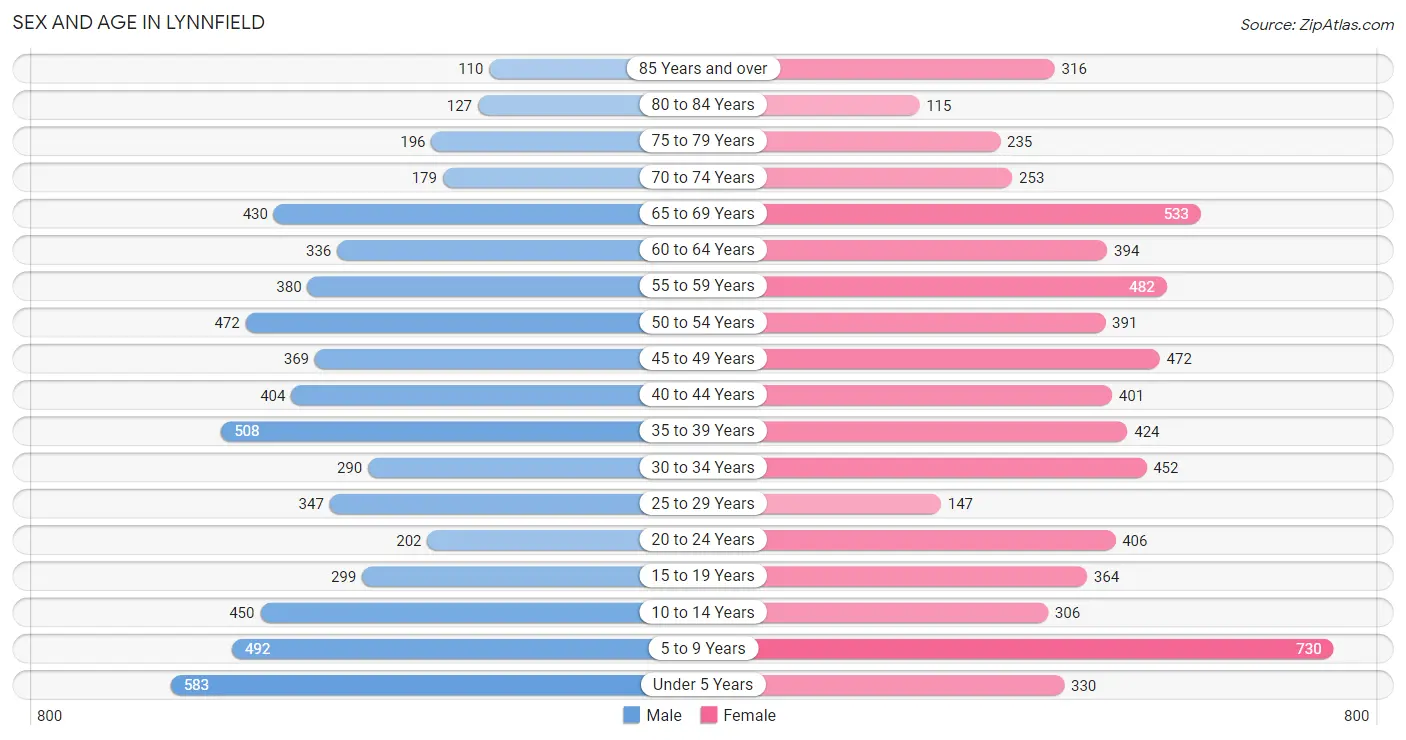
The most populous age groups in Lynnfield are Under 5 Years (583 | 9.4%) for men and 5 to 9 Years (730 | 10.8%) for women.
| Age Bracket | Male | Female |
| Under 5 Years | 583 (9.4%) | 330 (4.9%) |
| 5 to 9 Years | 492 (8.0%) | 730 (10.8%) |
| 10 to 14 Years | 450 (7.3%) | 306 (4.5%) |
| 15 to 19 Years | 299 (4.8%) | 364 (5.4%) |
| 20 to 24 Years | 202 (3.3%) | 406 (6.0%) |
| 25 to 29 Years | 347 (5.6%) | 147 (2.2%) |
| 30 to 34 Years | 290 (4.7%) | 452 (6.7%) |
| 35 to 39 Years | 508 (8.2%) | 424 (6.3%) |
| 40 to 44 Years | 404 (6.5%) | 401 (5.9%) |
| 45 to 49 Years | 369 (6.0%) | 472 (7.0%) |
| 50 to 54 Years | 472 (7.6%) | 391 (5.8%) |
| 55 to 59 Years | 380 (6.1%) | 482 (7.1%) |
| 60 to 64 Years | 336 (5.4%) | 394 (5.8%) |
| 65 to 69 Years | 430 (7.0%) | 533 (7.9%) |
| 70 to 74 Years | 179 (2.9%) | 253 (3.7%) |
| 75 to 79 Years | 196 (3.2%) | 235 (3.5%) |
| 80 to 84 Years | 127 (2.1%) | 115 (1.7%) |
| 85 Years and over | 110 (1.8%) | 316 (4.7%) |
| Total | 6,174 (100.0%) | 6,751 (100.0%) |
Families and Households in Lynnfield
Median Family Size in Lynnfield
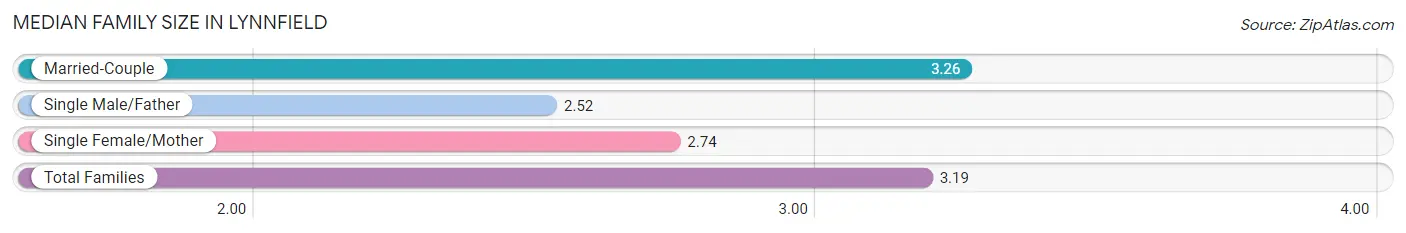
The median family size in Lynnfield is 3.19 persons per family, with married-couple families (3,200 | 86.7%) accounting for the largest median family size of 3.26 persons per family. On the other hand, single male/father families (64 | 1.7%) represent the smallest median family size with 2.52 persons per family.
| Family Type | # Families | Family Size |
| Married-Couple | 3,200 (86.7%) | 3.26 |
| Single Male/Father | 64 (1.7%) | 2.52 |
| Single Female/Mother | 426 (11.5%) | 2.74 |
| Total Families | 3,690 (100.0%) | 3.19 |
Median Household Size in Lynnfield
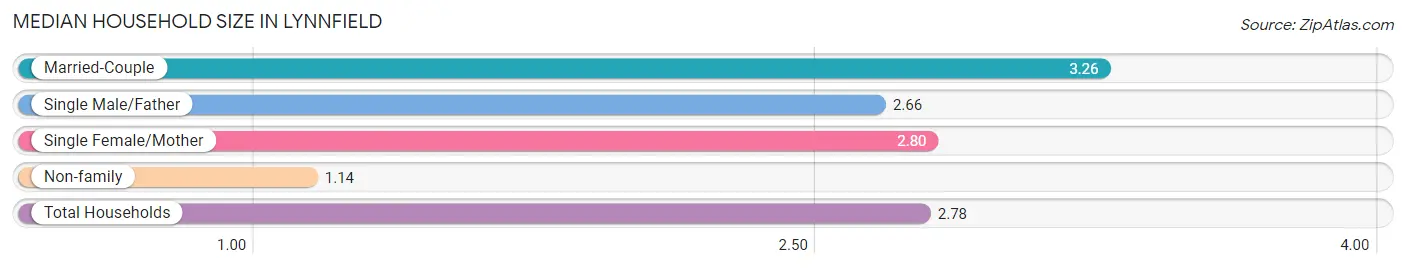
The median household size in Lynnfield is 2.78 persons per household, with married-couple households (3,200 | 68.9%) accounting for the largest median household size of 3.26 persons per household. non-family households (952 | 20.5%) represent the smallest median household size with 1.14 persons per household.
| Household Type | # Households | Household Size |
| Married-Couple | 3,200 (68.9%) | 3.26 |
| Single Male/Father | 64 (1.4%) | 2.66 |
| Single Female/Mother | 426 (9.2%) | 2.80 |
| Non-family | 952 (20.5%) | 1.14 |
| Total Households | 4,642 (100.0%) | 2.78 |
Household Size by Marriage Status in Lynnfield
Out of a total of 4,642 households in Lynnfield, 3,690 (79.5%) are family households, while 952 (20.5%) are nonfamily households. The most numerous type of family households are 2-person households, comprising 1,358, and the most common type of nonfamily households are 1-person households, comprising 835.
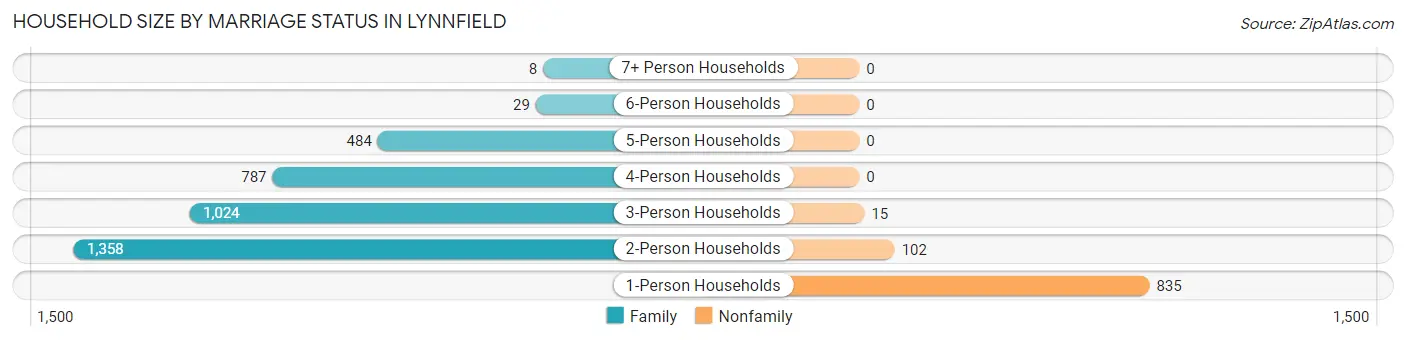
| Household Size | Family Households | Nonfamily Households |
| 1-Person Households | - | 835 (18.0%) |
| 2-Person Households | 1,358 (29.2%) | 102 (2.2%) |
| 3-Person Households | 1,024 (22.1%) | 15 (0.3%) |
| 4-Person Households | 787 (17.0%) | 0 (0.0%) |
| 5-Person Households | 484 (10.4%) | 0 (0.0%) |
| 6-Person Households | 29 (0.6%) | 0 (0.0%) |
| 7+ Person Households | 8 (0.2%) | 0 (0.0%) |
| Total | 3,690 (79.5%) | 952 (20.5%) |
Female Fertility in Lynnfield
Fertility by Age in Lynnfield
Average fertility rate in Lynnfield is 54.0 births per 1,000 women. Women in the age bracket of 20 to 34 years have the highest fertility rate with 128.0 births per 1,000 women. Women in the age bracket of 20 to 34 years acount for 87.2% of all women with births.
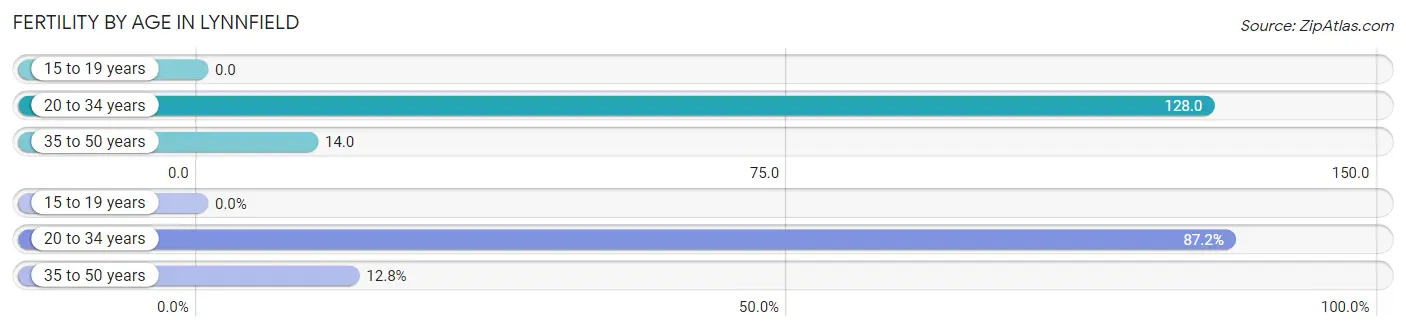
| Age Bracket | Women with Births | Births / 1,000 Women |
| 15 to 19 years | 0 (0.0%) | 0.0 |
| 20 to 34 years | 129 (87.2%) | 128.0 |
| 35 to 50 years | 19 (12.8%) | 14.0 |
| Total | 148 (100.0%) | 54.0 |
Fertility by Age by Marriage Status in Lynnfield
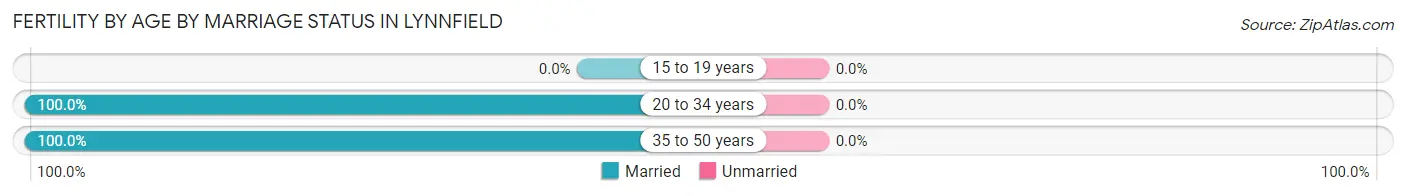
| Age Bracket | Married | Unmarried |
| 15 to 19 years | 0 (0.0%) | 0 (0.0%) |
| 20 to 34 years | 129 (100.0%) | 0 (0.0%) |
| 35 to 50 years | 19 (100.0%) | 0 (0.0%) |
| Total | 148 (100.0%) | 0 (0.0%) |
Fertility by Education in Lynnfield
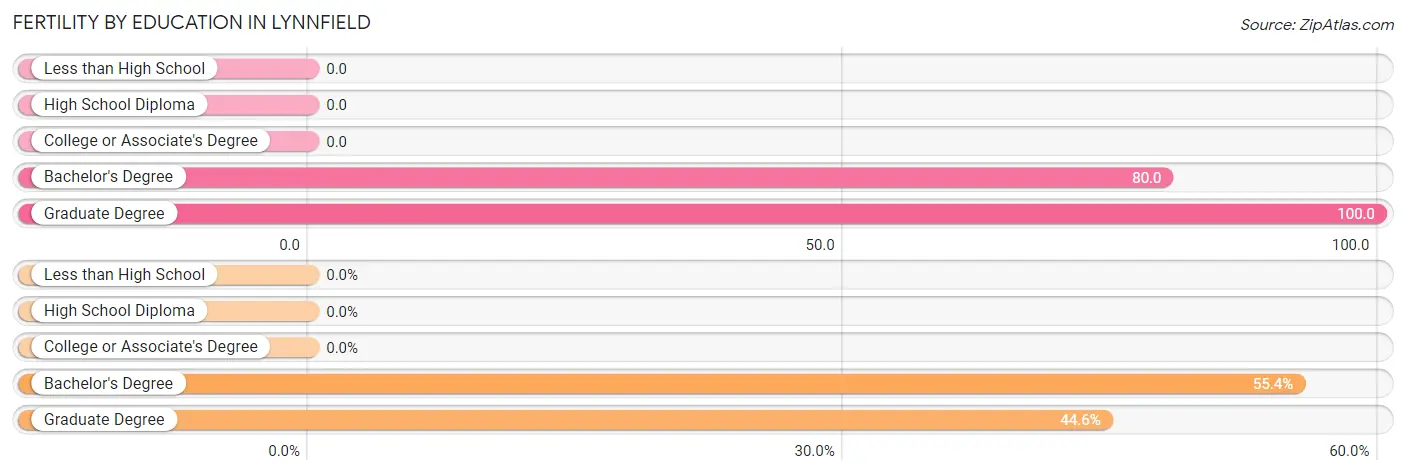
| Educational Attainment | Women with Births | Births / 1,000 Women |
| Less than High School | 0 (0.0%) | 0.0 |
| High School Diploma | 0 (0.0%) | 0.0 |
| College or Associate's Degree | 0 (0.0%) | 0.0 |
| Bachelor's Degree | 82 (55.4%) | 80.0 |
| Graduate Degree | 66 (44.6%) | 100.0 |
| Total | 148 (100.0%) | 54.0 |
Fertility by Education by Marriage Status in Lynnfield
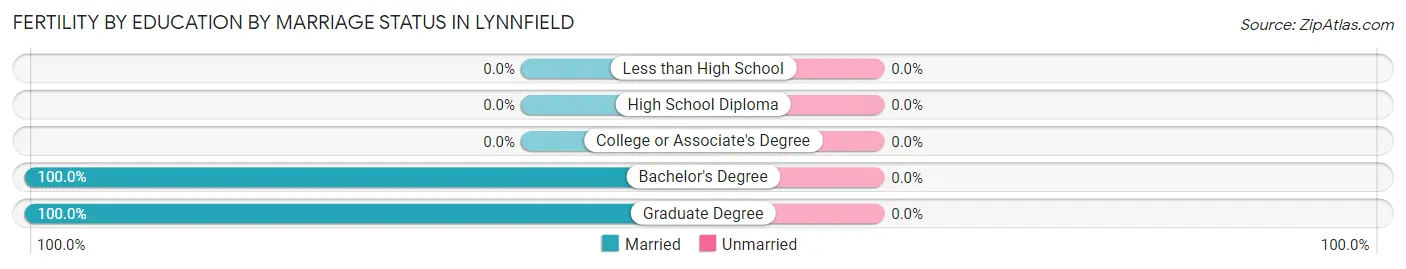
| Educational Attainment | Married | Unmarried |
| Less than High School | 0 (0.0%) | 0 (0.0%) |
| High School Diploma | 0 (0.0%) | 0 (0.0%) |
| College or Associate's Degree | 0 (0.0%) | 0 (0.0%) |
| Bachelor's Degree | 82 (100.0%) | 0 (0.0%) |
| Graduate Degree | 66 (100.0%) | 0 (0.0%) |
| Total | 148 (100.0%) | 0 (0.0%) |
Employment Characteristics in Lynnfield
Employment by Class of Employer in Lynnfield
Among the 6,348 employed individuals in Lynnfield, private company employees (4,021 | 63.3%), not-for-profit organizations (655 | 10.3%), and self-employed (incorporated) (524 | 8.3%) make up the most common classes of employment.
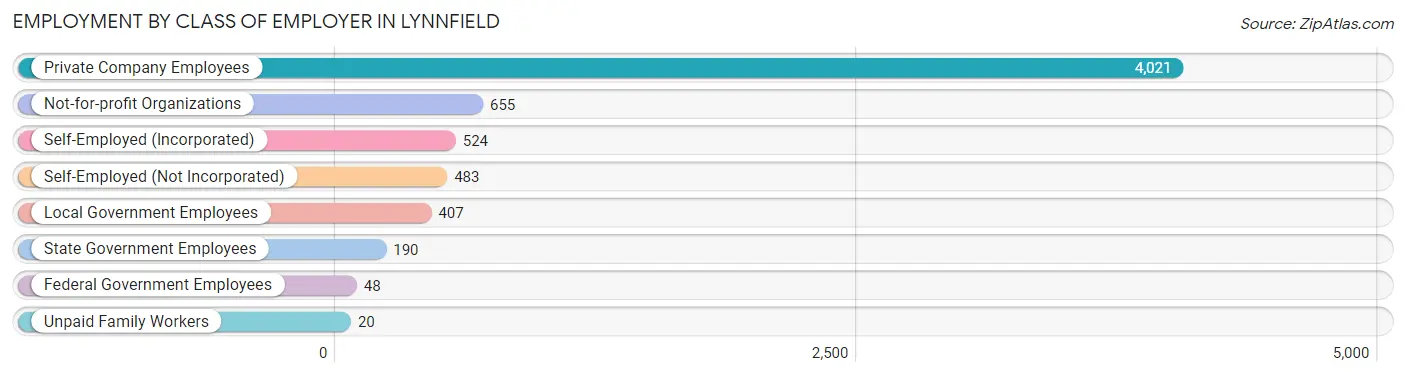
| Employer Class | # Employees | % Employees |
| Private Company Employees | 4,021 | 63.3% |
| Self-Employed (Incorporated) | 524 | 8.3% |
| Self-Employed (Not Incorporated) | 483 | 7.6% |
| Not-for-profit Organizations | 655 | 10.3% |
| Local Government Employees | 407 | 6.4% |
| State Government Employees | 190 | 3.0% |
| Federal Government Employees | 48 | 0.8% |
| Unpaid Family Workers | 20 | 0.3% |
| Total | 6,348 | 100.0% |
Employment Status by Age in Lynnfield
According to the labor force statistics for Lynnfield, out of the total population over 16 years of age (9,899), 69.0% or 6,830 individuals are in the labor force, with 4.5% or 307 of them unemployed. The age group with the highest labor force participation rate is 25 to 29 years, with 95.7% or 473 individuals in the labor force. Within the labor force, the 16 to 19 years age range has the highest percentage of unemployed individuals, with 59.1% or 104 of them being unemployed.
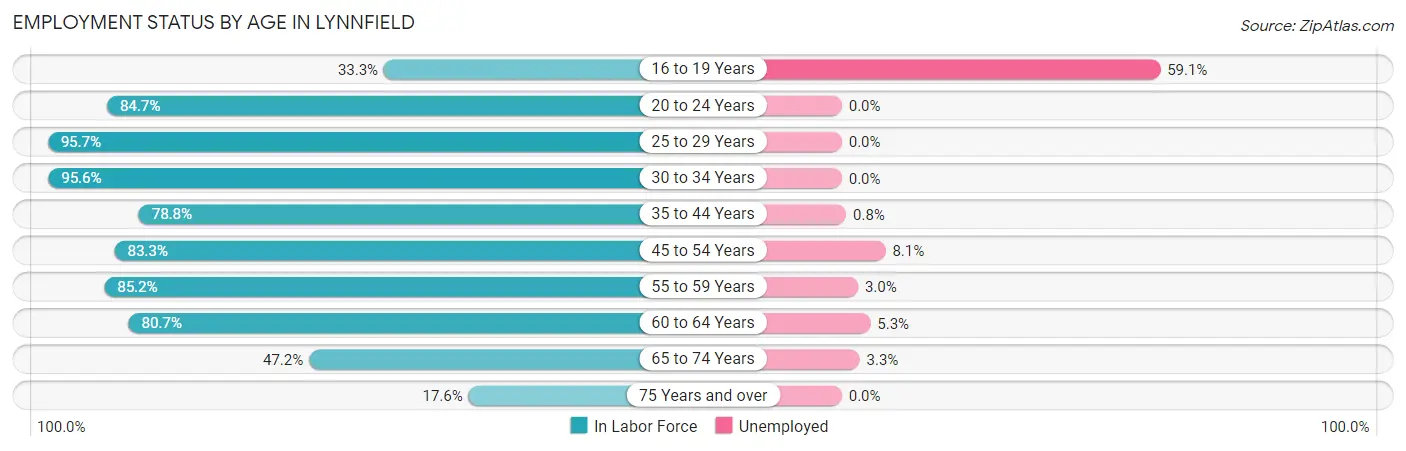
| Age Bracket | In Labor Force | Unemployed |
| 16 to 19 Years | 176 (33.3%) | 104 (59.1%) |
| 20 to 24 Years | 515 (84.7%) | 0 (0.0%) |
| 25 to 29 Years | 473 (95.7%) | 0 (0.0%) |
| 30 to 34 Years | 709 (95.6%) | 0 (0.0%) |
| 35 to 44 Years | 1,369 (78.8%) | 11 (0.8%) |
| 45 to 54 Years | 1,419 (83.3%) | 115 (8.1%) |
| 55 to 59 Years | 734 (85.2%) | 22 (3.0%) |
| 60 to 64 Years | 589 (80.7%) | 31 (5.3%) |
| 65 to 74 Years | 658 (47.2%) | 22 (3.3%) |
| 75 Years and over | 193 (17.6%) | 0 (0.0%) |
| Total | 6,830 (69.0%) | 307 (4.5%) |
Employment Status by Educational Attainment in Lynnfield
According to labor force statistics for Lynnfield, 84.4% of individuals (5,291) out of the total population between 25 and 64 years of age (6,269) are in the labor force, with 3.4% or 180 of them being unemployed. The group with the highest labor force participation rate are those with the educational attainment of bachelor's degree or higher, with 90.3% or 3,816 individuals in the labor force. Within the labor force, individuals with less than high school education have the highest percentage of unemployment, with 46.5% or 40 of them being unemployed.
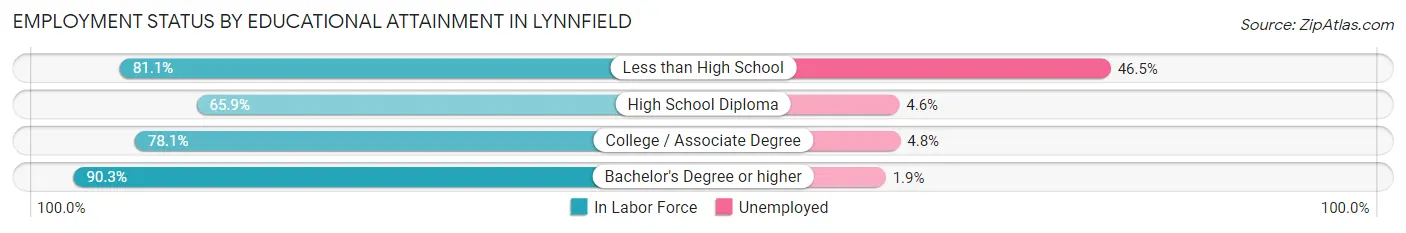
| Educational Attainment | In Labor Force | Unemployed |
| Less than High School | 86 (81.1%) | 49 (46.5%) |
| High School Diploma | 675 (65.9%) | 47 (4.6%) |
| College / Associate Degree | 713 (78.1%) | 44 (4.8%) |
| Bachelor's Degree or higher | 3,816 (90.3%) | 80 (1.9%) |
| Total | 5,291 (84.4%) | 213 (3.4%) |
Employment Occupations by Sex in Lynnfield
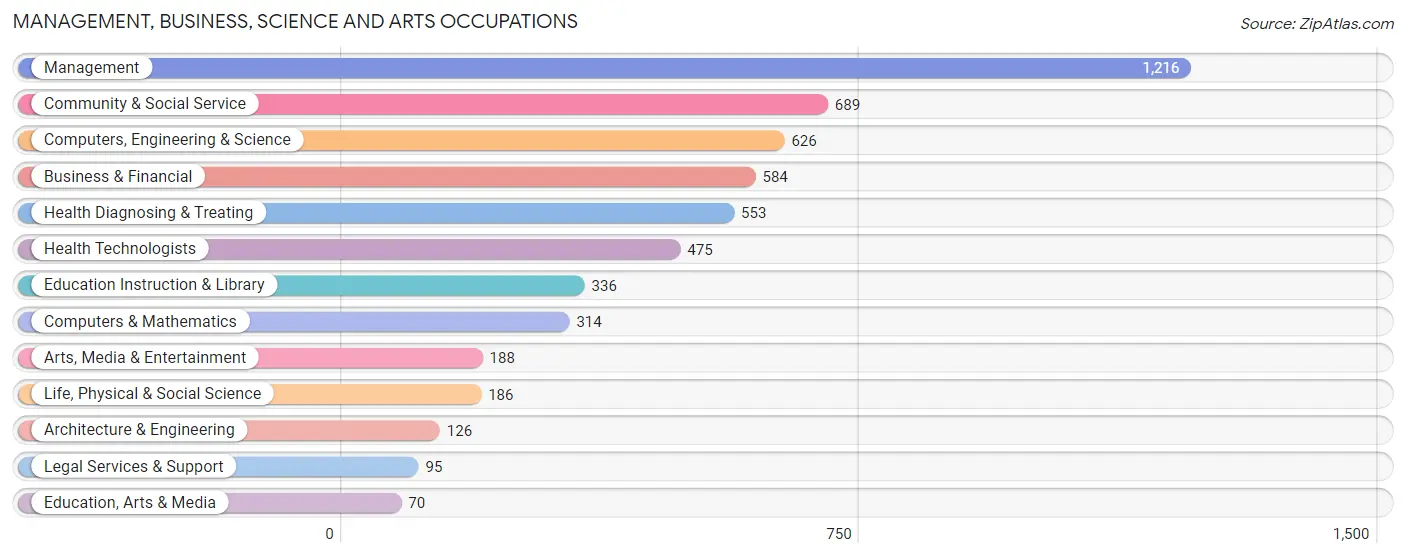
Management, Business, Science and Arts Occupations
The most common Management, Business, Science and Arts occupations in Lynnfield are Management (1,216 | 18.6%), Community & Social Service (689 | 10.5%), Computers, Engineering & Science (626 | 9.6%), Business & Financial (584 | 8.9%), and Health Diagnosing & Treating (553 | 8.5%).
Management, Business, Science and Arts Occupations by Sex
Within the Management, Business, Science and Arts occupations in Lynnfield, the most male-oriented occupations are Architecture & Engineering (100.0%), Legal Services & Support (87.4%), and Management (67.5%), while the most female-oriented occupations are Education, Arts & Media (100.0%), Life, Physical & Social Science (94.6%), and Health Technologists (81.7%).
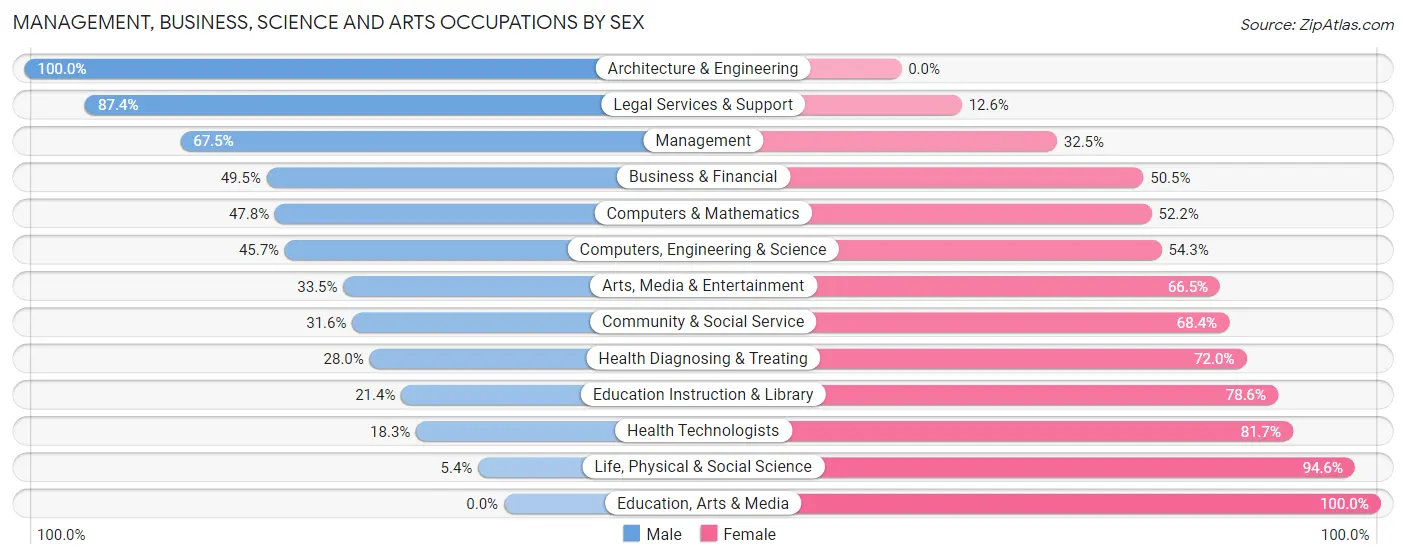
| Occupation | Male | Female |
| Management | 821 (67.5%) | 395 (32.5%) |
| Business & Financial | 289 (49.5%) | 295 (50.5%) |
| Computers, Engineering & Science | 286 (45.7%) | 340 (54.3%) |
| Computers & Mathematics | 150 (47.8%) | 164 (52.2%) |
| Architecture & Engineering | 126 (100.0%) | 0 (0.0%) |
| Life, Physical & Social Science | 10 (5.4%) | 176 (94.6%) |
| Community & Social Service | 218 (31.6%) | 471 (68.4%) |
| Education, Arts & Media | 0 (0.0%) | 70 (100.0%) |
| Legal Services & Support | 83 (87.4%) | 12 (12.6%) |
| Education Instruction & Library | 72 (21.4%) | 264 (78.6%) |
| Arts, Media & Entertainment | 63 (33.5%) | 125 (66.5%) |
| Health Diagnosing & Treating | 155 (28.0%) | 398 (72.0%) |
| Health Technologists | 87 (18.3%) | 388 (81.7%) |
| Total (Category) | 1,769 (48.2%) | 1,899 (51.8%) |
| Total (Overall) | 3,392 (51.9%) | 3,138 (48.1%) |
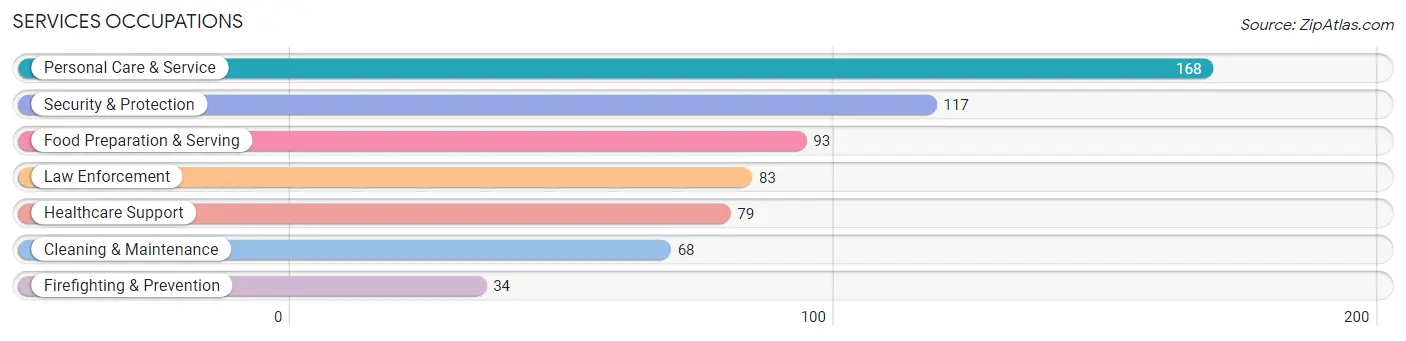
Services Occupations
The most common Services occupations in Lynnfield are Personal Care & Service (168 | 2.6%), Security & Protection (117 | 1.8%), Food Preparation & Serving (93 | 1.4%), Law Enforcement (83 | 1.3%), and Healthcare Support (79 | 1.2%).
Services Occupations by Sex
Within the Services occupations in Lynnfield, the most male-oriented occupations are Law Enforcement (100.0%), Security & Protection (90.6%), and Firefighting & Prevention (67.6%), while the most female-oriented occupations are Healthcare Support (100.0%), Food Preparation & Serving (62.4%), and Personal Care & Service (60.7%).
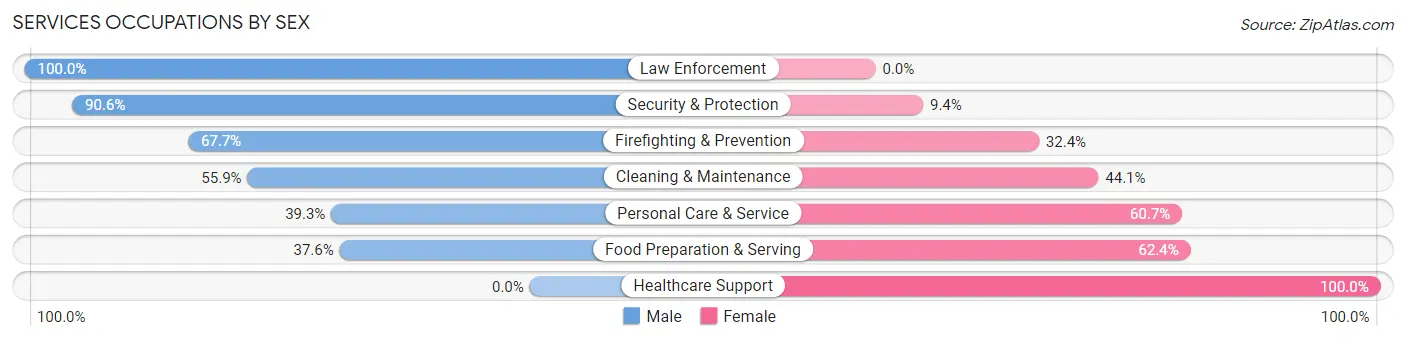
| Occupation | Male | Female |
| Healthcare Support | 0 (0.0%) | 79 (100.0%) |
| Security & Protection | 106 (90.6%) | 11 (9.4%) |
| Firefighting & Prevention | 23 (67.6%) | 11 (32.4%) |
| Law Enforcement | 83 (100.0%) | 0 (0.0%) |
| Food Preparation & Serving | 35 (37.6%) | 58 (62.4%) |
| Cleaning & Maintenance | 38 (55.9%) | 30 (44.1%) |
| Personal Care & Service | 66 (39.3%) | 102 (60.7%) |
| Total (Category) | 245 (46.7%) | 280 (53.3%) |
| Total (Overall) | 3,392 (51.9%) | 3,138 (48.1%) |
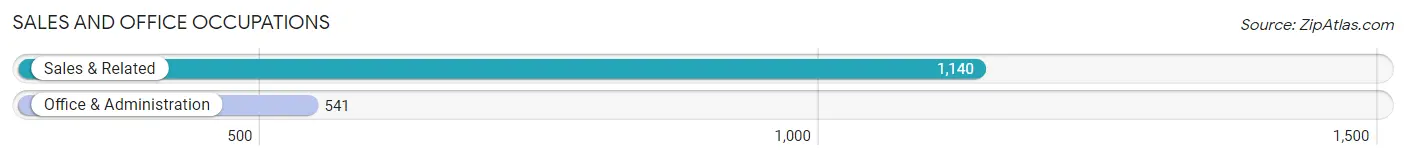
Sales and Office Occupations
The most common Sales and Office occupations in Lynnfield are Sales & Related (1,140 | 17.5%), and Office & Administration (541 | 8.3%).
Sales and Office Occupations by Sex
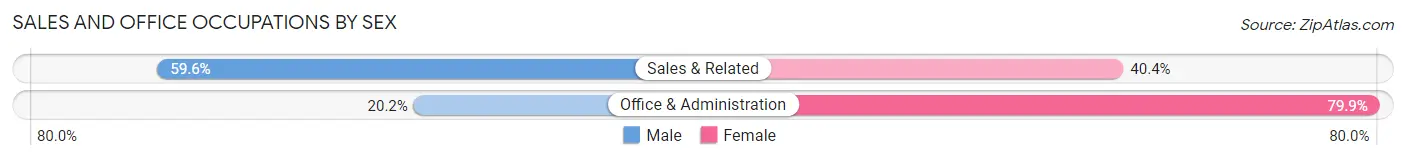
| Occupation | Male | Female |
| Sales & Related | 679 (59.6%) | 461 (40.4%) |
| Office & Administration | 109 (20.2%) | 432 (79.8%) |
| Total (Category) | 788 (46.9%) | 893 (53.1%) |
| Total (Overall) | 3,392 (51.9%) | 3,138 (48.1%) |
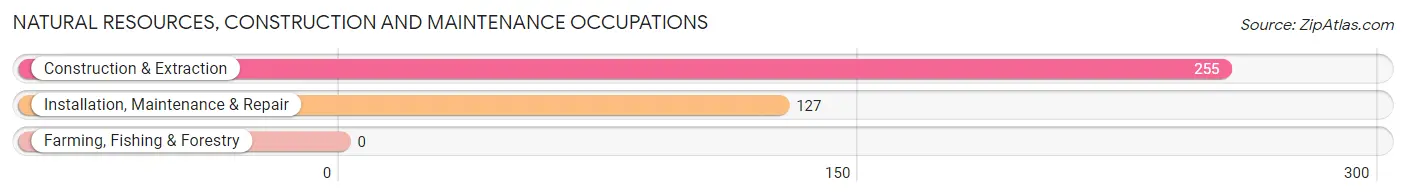
Natural Resources, Construction and Maintenance Occupations
The most common Natural Resources, Construction and Maintenance occupations in Lynnfield are Construction & Extraction (255 | 3.9%), and Installation, Maintenance & Repair (127 | 1.9%).
Natural Resources, Construction and Maintenance Occupations by Sex
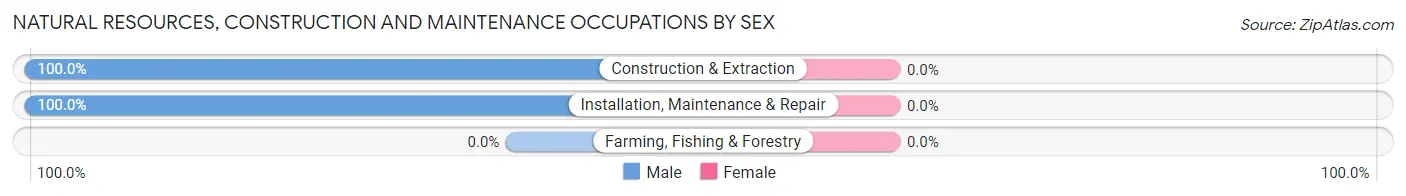
| Occupation | Male | Female |
| Farming, Fishing & Forestry | 0 (0.0%) | 0 (0.0%) |
| Construction & Extraction | 255 (100.0%) | 0 (0.0%) |
| Installation, Maintenance & Repair | 127 (100.0%) | 0 (0.0%) |
| Total (Category) | 382 (100.0%) | 0 (0.0%) |
| Total (Overall) | 3,392 (51.9%) | 3,138 (48.1%) |
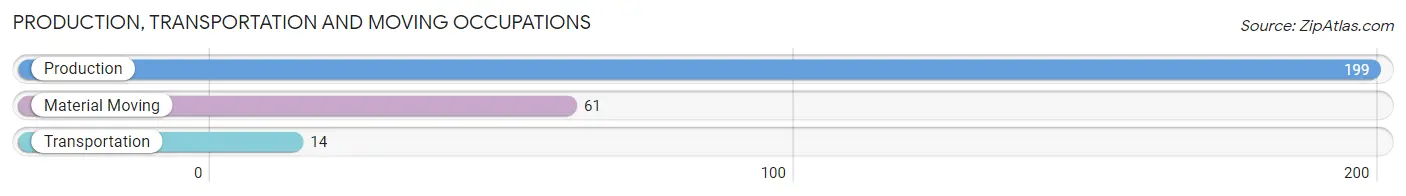
Production, Transportation and Moving Occupations
The most common Production, Transportation and Moving occupations in Lynnfield are Production (199 | 3.0%), Material Moving (61 | 0.9%), and Transportation (14 | 0.2%).
Production, Transportation and Moving Occupations by Sex
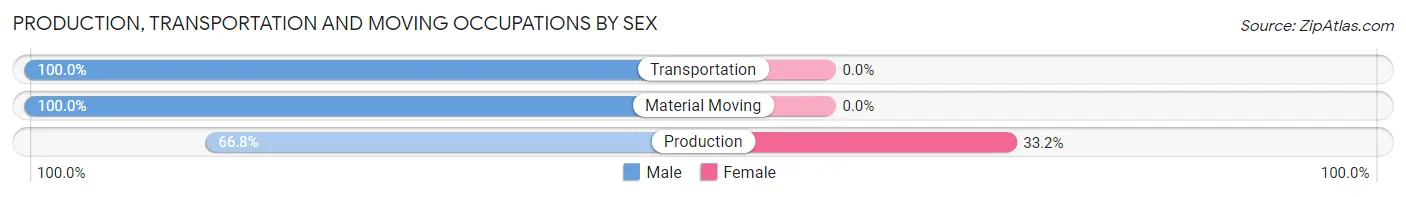
| Occupation | Male | Female |
| Production | 133 (66.8%) | 66 (33.2%) |
| Transportation | 14 (100.0%) | 0 (0.0%) |
| Material Moving | 61 (100.0%) | 0 (0.0%) |
| Total (Category) | 208 (75.9%) | 66 (24.1%) |
| Total (Overall) | 3,392 (51.9%) | 3,138 (48.1%) |
Employment Industries by Sex in Lynnfield
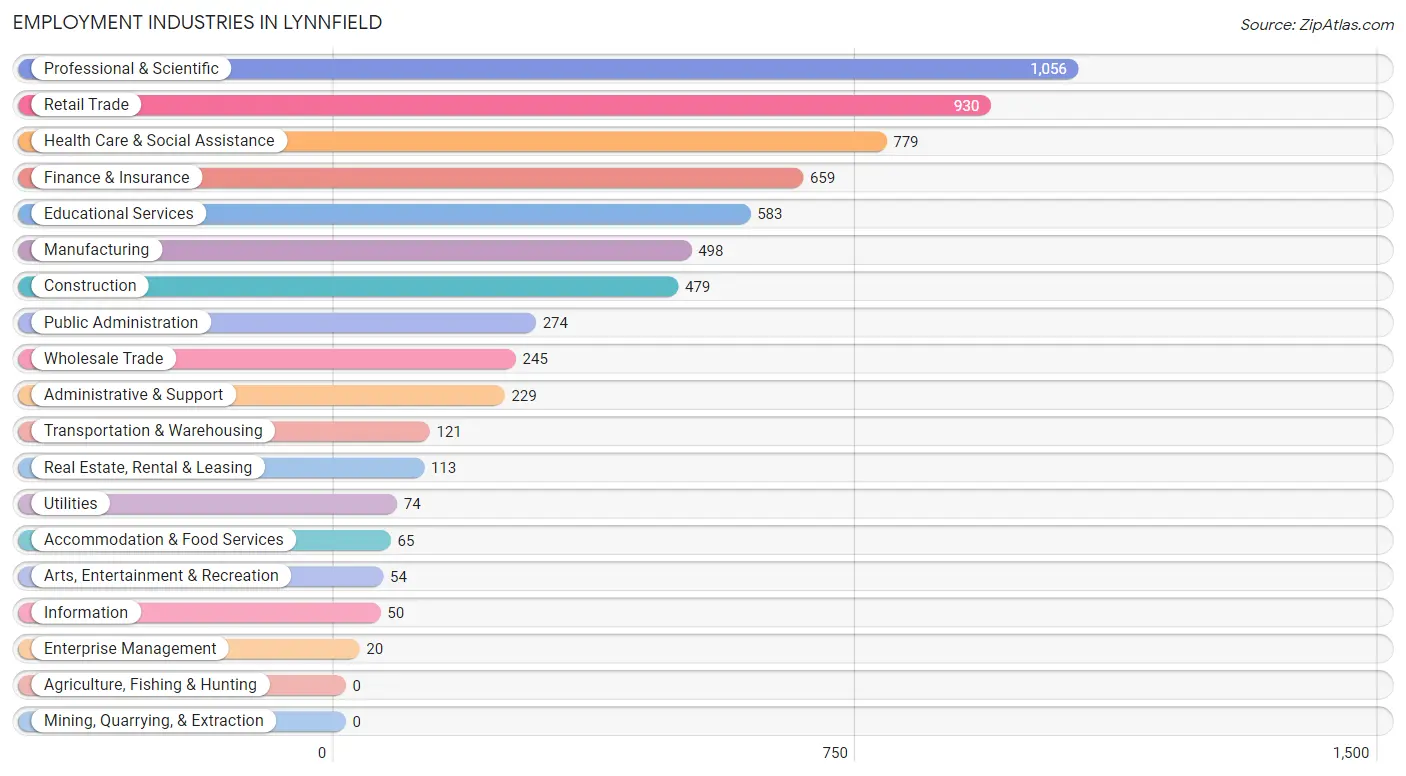
Employment Industries in Lynnfield
The major employment industries in Lynnfield include Professional & Scientific (1,056 | 16.2%), Retail Trade (930 | 14.2%), Health Care & Social Assistance (779 | 11.9%), Finance & Insurance (659 | 10.1%), and Educational Services (583 | 8.9%).
Employment Industries by Sex in Lynnfield
The Lynnfield industries that see more men than women are Enterprise Management (100.0%), Construction (97.9%), and Transportation & Warehousing (91.7%), whereas the industries that tend to have a higher number of women are Health Care & Social Assistance (83.1%), Information (70.0%), and Educational Services (63.1%).
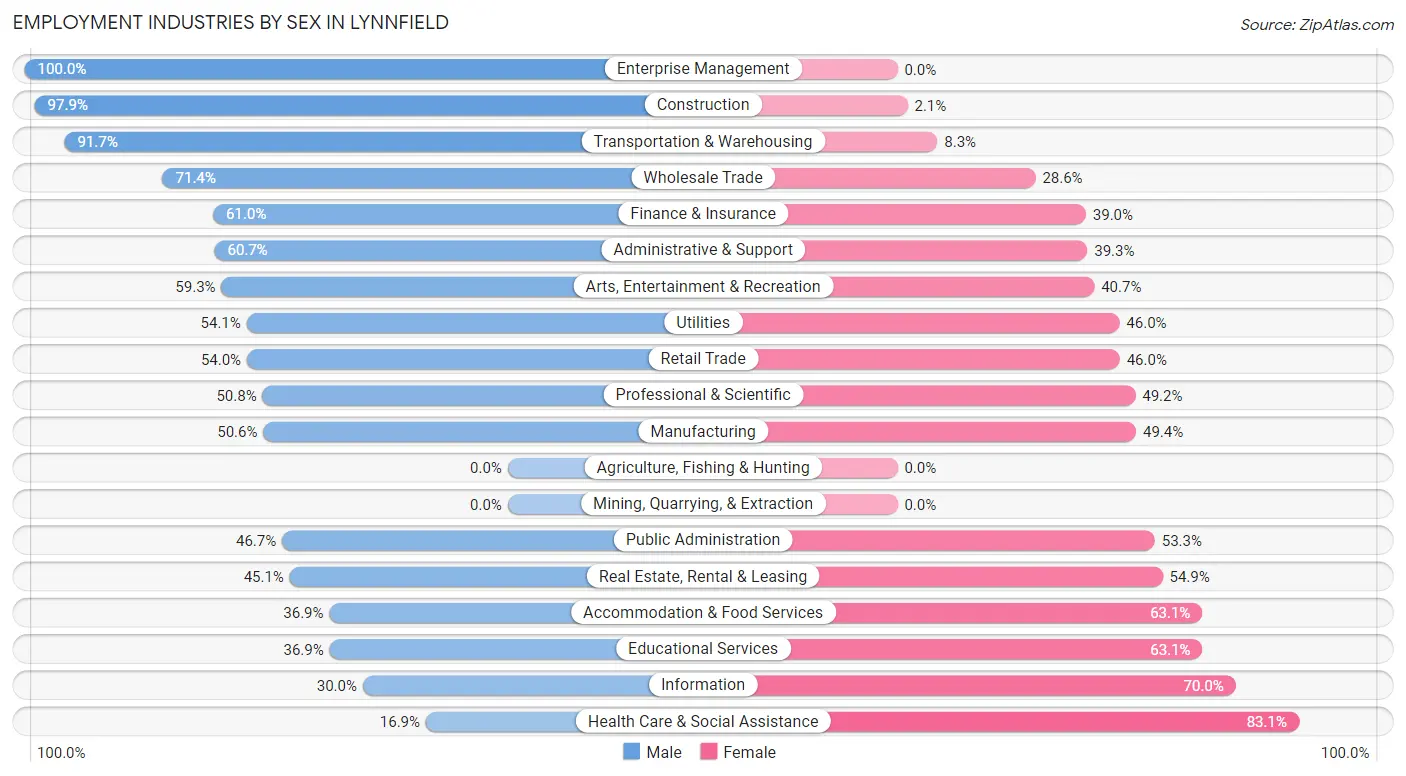
| Industry | Male | Female |
| Agriculture, Fishing & Hunting | 0 (0.0%) | 0 (0.0%) |
| Mining, Quarrying, & Extraction | 0 (0.0%) | 0 (0.0%) |
| Construction | 469 (97.9%) | 10 (2.1%) |
| Manufacturing | 252 (50.6%) | 246 (49.4%) |
| Wholesale Trade | 175 (71.4%) | 70 (28.6%) |
| Retail Trade | 502 (54.0%) | 428 (46.0%) |
| Transportation & Warehousing | 111 (91.7%) | 10 (8.3%) |
| Utilities | 40 (54.0%) | 34 (46.0%) |
| Information | 15 (30.0%) | 35 (70.0%) |
| Finance & Insurance | 402 (61.0%) | 257 (39.0%) |
| Real Estate, Rental & Leasing | 51 (45.1%) | 62 (54.9%) |
| Professional & Scientific | 536 (50.8%) | 520 (49.2%) |
| Enterprise Management | 20 (100.0%) | 0 (0.0%) |
| Administrative & Support | 139 (60.7%) | 90 (39.3%) |
| Educational Services | 215 (36.9%) | 368 (63.1%) |
| Health Care & Social Assistance | 132 (16.9%) | 647 (83.1%) |
| Arts, Entertainment & Recreation | 32 (59.3%) | 22 (40.7%) |
| Accommodation & Food Services | 24 (36.9%) | 41 (63.1%) |
| Public Administration | 128 (46.7%) | 146 (53.3%) |
| Total | 3,392 (51.9%) | 3,138 (48.1%) |
Education in Lynnfield
School Enrollment in Lynnfield
The most common levels of schooling among the 3,308 students in Lynnfield are elementary school (912 | 27.6%), middle school (684 | 20.7%), and high school (597 | 18.0%).
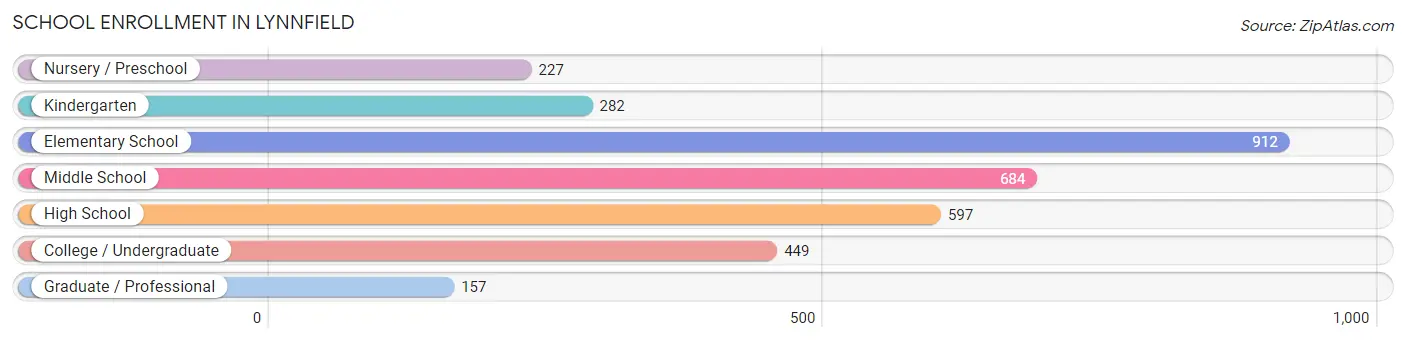
| School Level | # Students | % Students |
| Nursery / Preschool | 227 | 6.9% |
| Kindergarten | 282 | 8.5% |
| Elementary School | 912 | 27.6% |
| Middle School | 684 | 20.7% |
| High School | 597 | 18.0% |
| College / Undergraduate | 449 | 13.6% |
| Graduate / Professional | 157 | 4.8% |
| Total | 3,308 | 100.0% |
School Enrollment by Age by Funding Source in Lynnfield
Out of a total of 3,308 students who are enrolled in schools in Lynnfield, 801 (24.2%) attend a private institution, while the remaining 2,507 (75.8%) are enrolled in public schools. The age group of 25 to 34 year olds has the highest likelihood of being enrolled in private schools, with 77 (70.0% in the age bracket) enrolled. Conversely, the age group of 10 to 14 year olds has the lowest likelihood of being enrolled in a private school, with 668 (88.4% in the age bracket) attending a public institution.
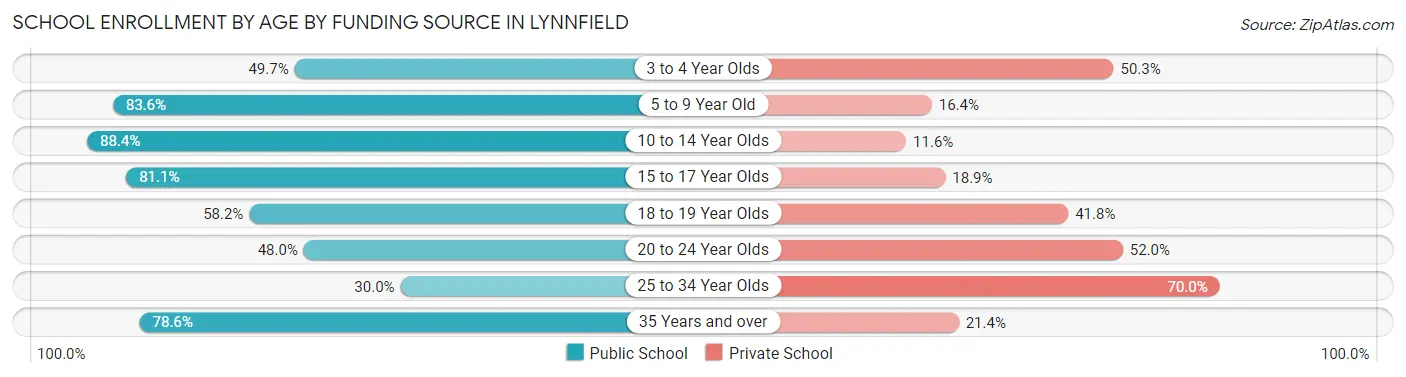
| Age Bracket | Public School | Private School |
| 3 to 4 Year Olds | 92 (49.7%) | 93 (50.3%) |
| 5 to 9 Year Old | 1,012 (83.6%) | 199 (16.4%) |
| 10 to 14 Year Olds | 668 (88.4%) | 88 (11.6%) |
| 15 to 17 Year Olds | 368 (81.1%) | 86 (18.9%) |
| 18 to 19 Year Olds | 89 (58.2%) | 64 (41.8%) |
| 20 to 24 Year Olds | 157 (48.0%) | 170 (52.0%) |
| 25 to 34 Year Olds | 33 (30.0%) | 77 (70.0%) |
| 35 Years and over | 88 (78.6%) | 24 (21.4%) |
| Total | 2,507 (75.8%) | 801 (24.2%) |
Educational Attainment by Field of Study in Lynnfield
Business (1,933 | 34.4%), social sciences (595 | 10.6%), education (418 | 7.4%), bio, nature & agricultural (375 | 6.7%), and engineering (350 | 6.2%) are the most common fields of study among 5,617 individuals in Lynnfield who have obtained a bachelor's degree or higher.
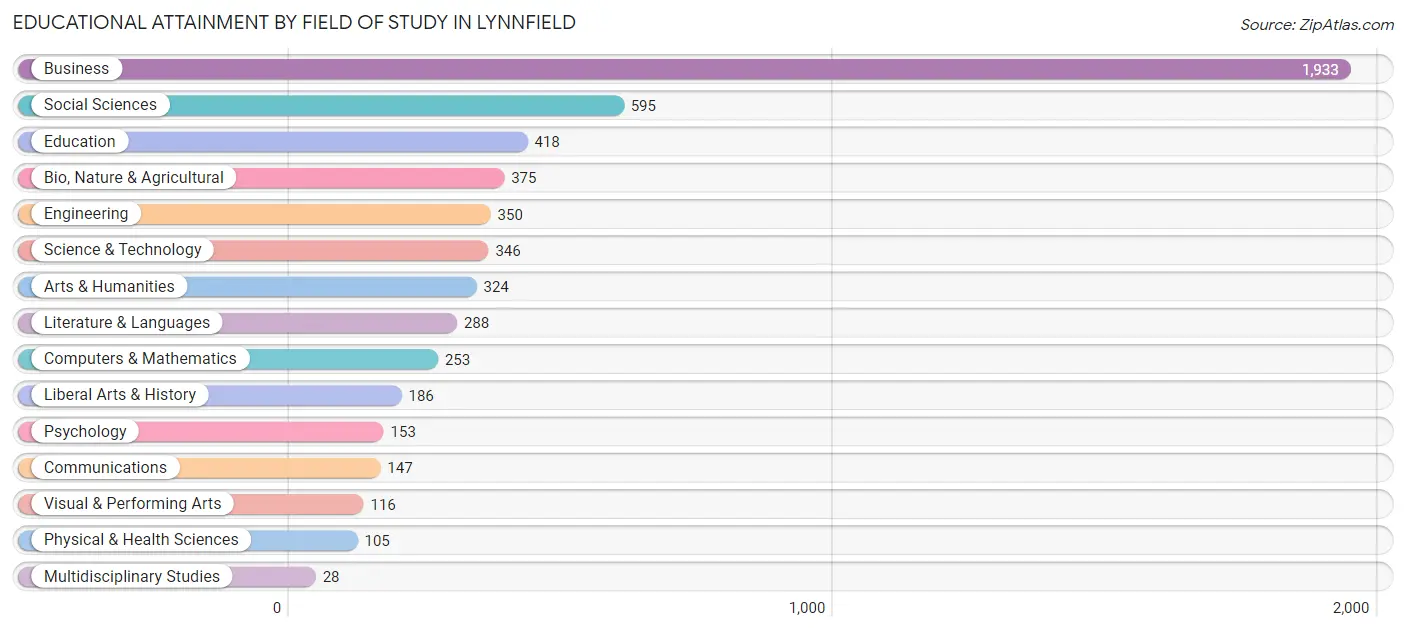
| Field of Study | # Graduates | % Graduates |
| Computers & Mathematics | 253 | 4.5% |
| Bio, Nature & Agricultural | 375 | 6.7% |
| Physical & Health Sciences | 105 | 1.9% |
| Psychology | 153 | 2.7% |
| Social Sciences | 595 | 10.6% |
| Engineering | 350 | 6.2% |
| Multidisciplinary Studies | 28 | 0.5% |
| Science & Technology | 346 | 6.2% |
| Business | 1,933 | 34.4% |
| Education | 418 | 7.4% |
| Literature & Languages | 288 | 5.1% |
| Liberal Arts & History | 186 | 3.3% |
| Visual & Performing Arts | 116 | 2.1% |
| Communications | 147 | 2.6% |
| Arts & Humanities | 324 | 5.8% |
| Total | 5,617 | 100.0% |
Transportation & Commute in Lynnfield
Vehicle Availability by Sex in Lynnfield
The most prevalent vehicle ownership categories in Lynnfield are males with 2 vehicles (1,766, accounting for 52.6%) and females with 2 vehicles (1,688, making up 59.0%).
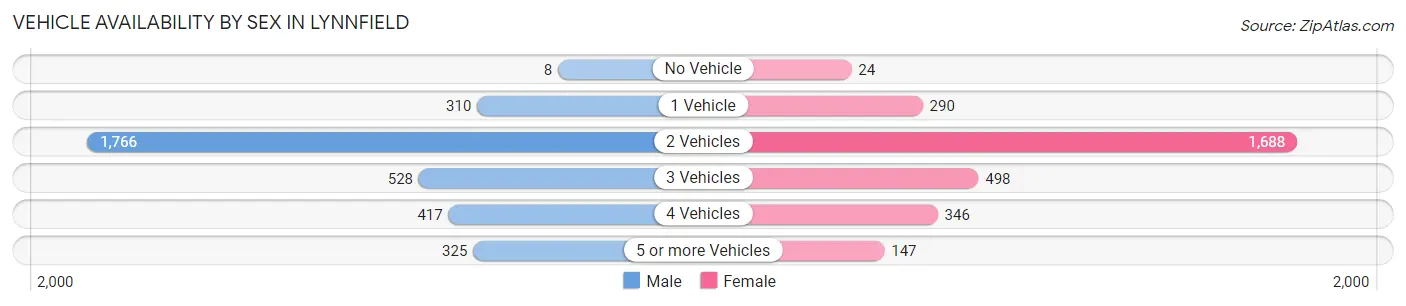
| Vehicles Available | Male | Female |
| No Vehicle | 8 (0.2%) | 24 (0.8%) |
| 1 Vehicle | 310 (9.2%) | 290 (9.7%) |
| 2 Vehicles | 1,766 (52.6%) | 1,688 (56.4%) |
| 3 Vehicles | 528 (15.7%) | 498 (16.6%) |
| 4 Vehicles | 417 (12.4%) | 346 (11.6%) |
| 5 or more Vehicles | 325 (9.7%) | 147 (4.9%) |
| Total | 3,354 (100.0%) | 2,993 (100.0%) |
Commute Time in Lynnfield
The most frequently occuring commute durations in Lynnfield are 30 to 34 minutes (844 commuters, 17.0%), 45 to 59 minutes (701 commuters, 14.1%), and 20 to 24 minutes (663 commuters, 13.3%).
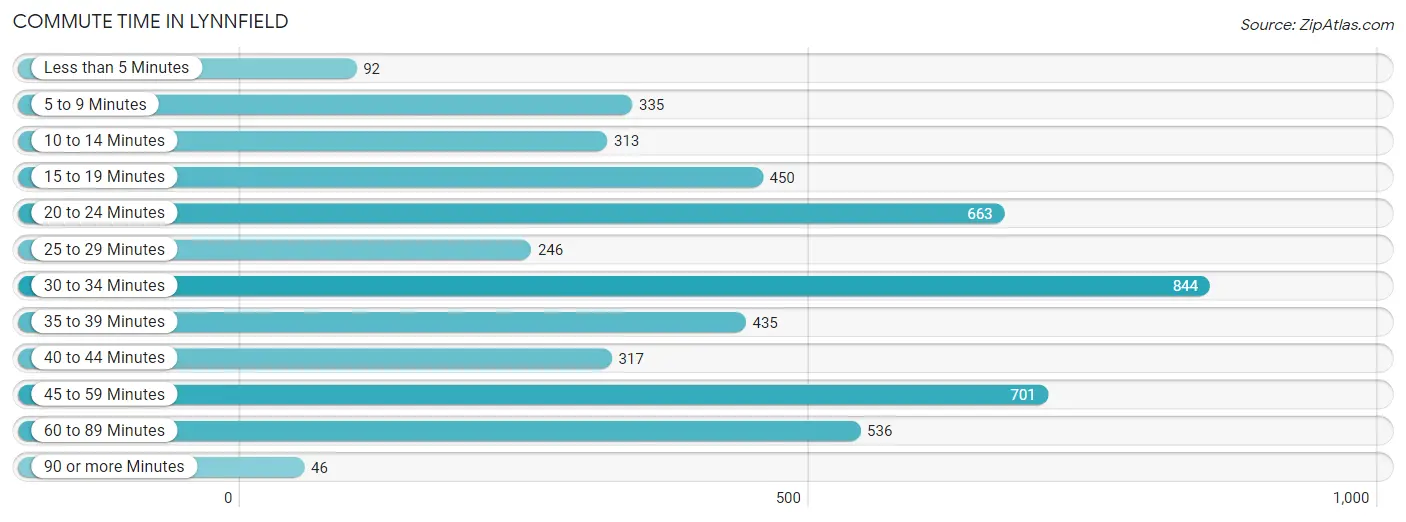
| Commute Time | # Commuters | % Commuters |
| Less than 5 Minutes | 92 | 1.8% |
| 5 to 9 Minutes | 335 | 6.7% |
| 10 to 14 Minutes | 313 | 6.3% |
| 15 to 19 Minutes | 450 | 9.0% |
| 20 to 24 Minutes | 663 | 13.3% |
| 25 to 29 Minutes | 246 | 4.9% |
| 30 to 34 Minutes | 844 | 17.0% |
| 35 to 39 Minutes | 435 | 8.7% |
| 40 to 44 Minutes | 317 | 6.4% |
| 45 to 59 Minutes | 701 | 14.1% |
| 60 to 89 Minutes | 536 | 10.8% |
| 90 or more Minutes | 46 | 0.9% |
Commute Time by Sex in Lynnfield
The most common commute times in Lynnfield are 30 to 34 minutes (627 commuters, 23.0%) for males and 20 to 24 minutes (433 commuters, 19.3%) for females.
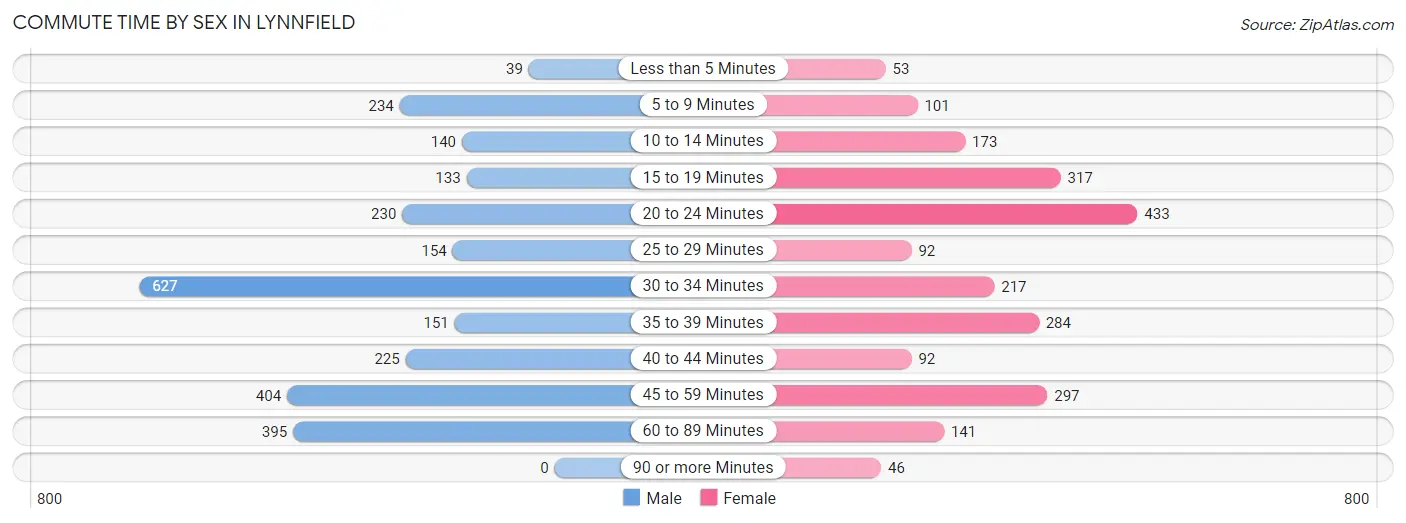
| Commute Time | Male | Female |
| Less than 5 Minutes | 39 (1.4%) | 53 (2.4%) |
| 5 to 9 Minutes | 234 (8.6%) | 101 (4.5%) |
| 10 to 14 Minutes | 140 (5.1%) | 173 (7.7%) |
| 15 to 19 Minutes | 133 (4.9%) | 317 (14.1%) |
| 20 to 24 Minutes | 230 (8.4%) | 433 (19.3%) |
| 25 to 29 Minutes | 154 (5.6%) | 92 (4.1%) |
| 30 to 34 Minutes | 627 (23.0%) | 217 (9.7%) |
| 35 to 39 Minutes | 151 (5.5%) | 284 (12.6%) |
| 40 to 44 Minutes | 225 (8.2%) | 92 (4.1%) |
| 45 to 59 Minutes | 404 (14.8%) | 297 (13.2%) |
| 60 to 89 Minutes | 395 (14.5%) | 141 (6.3%) |
| 90 or more Minutes | 0 (0.0%) | 46 (2.1%) |
Time of Departure to Work by Sex in Lynnfield
The most frequent times of departure to work in Lynnfield are 7:00 AM to 7:29 AM (466, 17.1%) for males and 8:30 AM to 8:59 AM (375, 16.7%) for females.
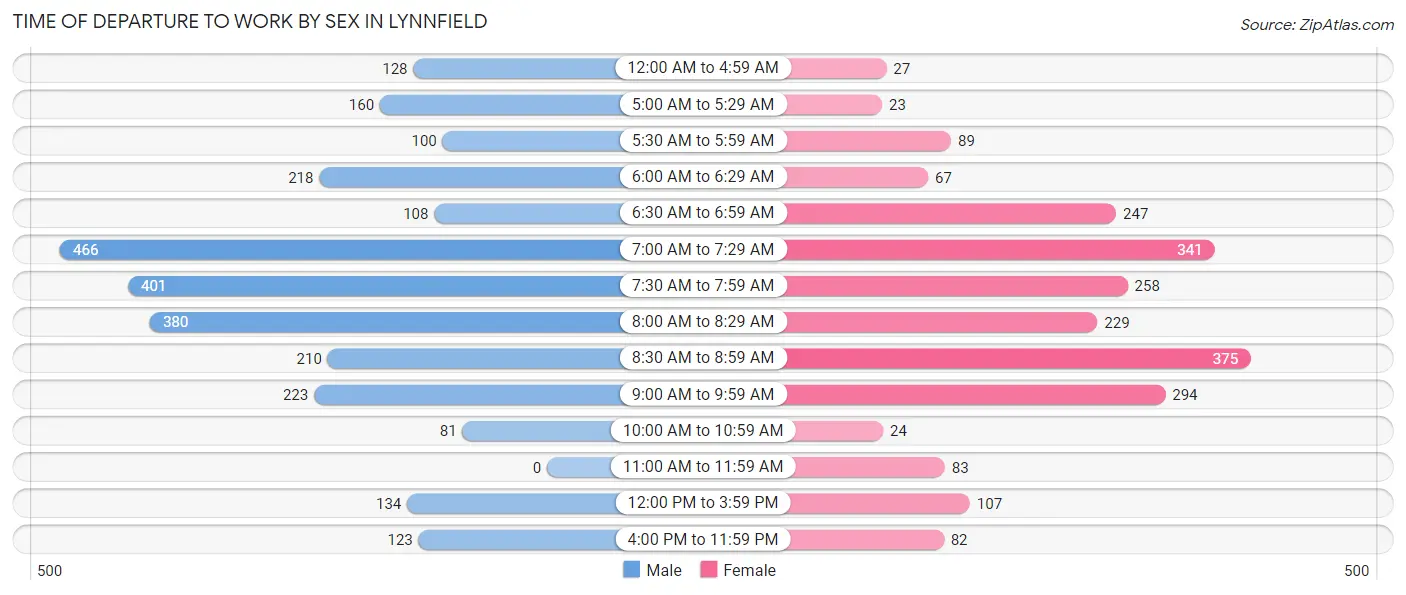
| Time of Departure | Male | Female |
| 12:00 AM to 4:59 AM | 128 (4.7%) | 27 (1.2%) |
| 5:00 AM to 5:29 AM | 160 (5.9%) | 23 (1.0%) |
| 5:30 AM to 5:59 AM | 100 (3.7%) | 89 (4.0%) |
| 6:00 AM to 6:29 AM | 218 (8.0%) | 67 (3.0%) |
| 6:30 AM to 6:59 AM | 108 (4.0%) | 247 (11.0%) |
| 7:00 AM to 7:29 AM | 466 (17.1%) | 341 (15.2%) |
| 7:30 AM to 7:59 AM | 401 (14.7%) | 258 (11.5%) |
| 8:00 AM to 8:29 AM | 380 (13.9%) | 229 (10.2%) |
| 8:30 AM to 8:59 AM | 210 (7.7%) | 375 (16.7%) |
| 9:00 AM to 9:59 AM | 223 (8.2%) | 294 (13.1%) |
| 10:00 AM to 10:59 AM | 81 (3.0%) | 24 (1.1%) |
| 11:00 AM to 11:59 AM | 0 (0.0%) | 83 (3.7%) |
| 12:00 PM to 3:59 PM | 134 (4.9%) | 107 (4.8%) |
| 4:00 PM to 11:59 PM | 123 (4.5%) | 82 (3.6%) |
| Total | 2,732 (100.0%) | 2,246 (100.0%) |
Housing Occupancy in Lynnfield
Occupancy by Ownership in Lynnfield
Of the total 4,642 dwellings in Lynnfield, owner-occupied units account for 3,962 (85.4%), while renter-occupied units make up 680 (14.6%).
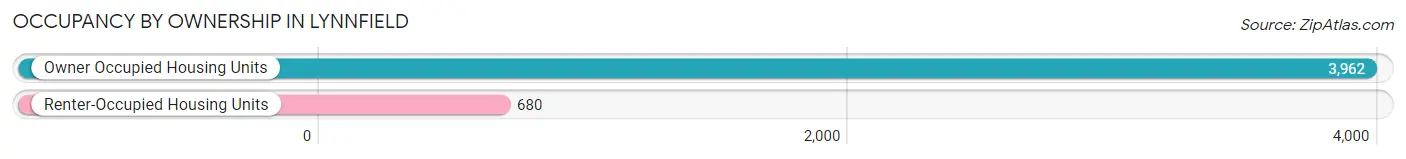
| Occupancy | # Housing Units | % Housing Units |
| Owner Occupied Housing Units | 3,962 | 85.4% |
| Renter-Occupied Housing Units | 680 | 14.6% |
| Total Occupied Housing Units | 4,642 | 100.0% |
Occupancy by Household Size in Lynnfield
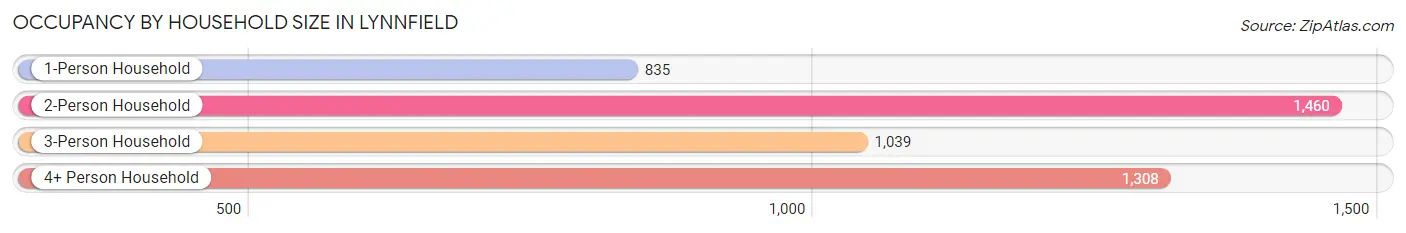
| Household Size | # Housing Units | % Housing Units |
| 1-Person Household | 835 | 18.0% |
| 2-Person Household | 1,460 | 31.5% |
| 3-Person Household | 1,039 | 22.4% |
| 4+ Person Household | 1,308 | 28.2% |
| Total Housing Units | 4,642 | 100.0% |
Occupancy by Ownership by Household Size in Lynnfield
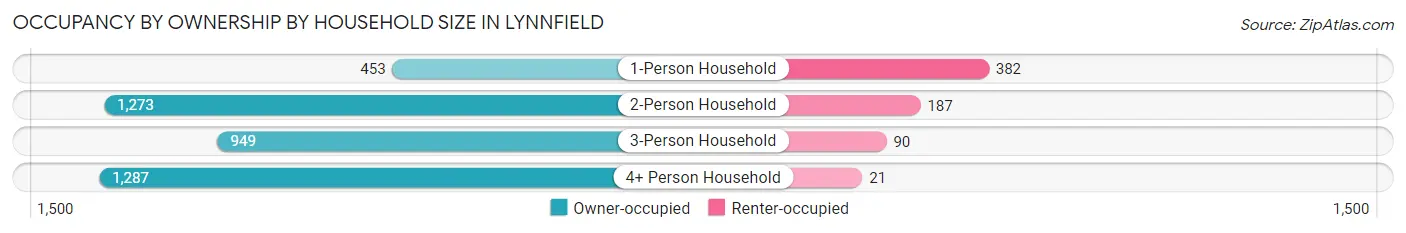
| Household Size | Owner-occupied | Renter-occupied |
| 1-Person Household | 453 (54.2%) | 382 (45.8%) |
| 2-Person Household | 1,273 (87.2%) | 187 (12.8%) |
| 3-Person Household | 949 (91.3%) | 90 (8.7%) |
| 4+ Person Household | 1,287 (98.4%) | 21 (1.6%) |
| Total Housing Units | 3,962 (85.4%) | 680 (14.6%) |
Occupancy by Educational Attainment in Lynnfield
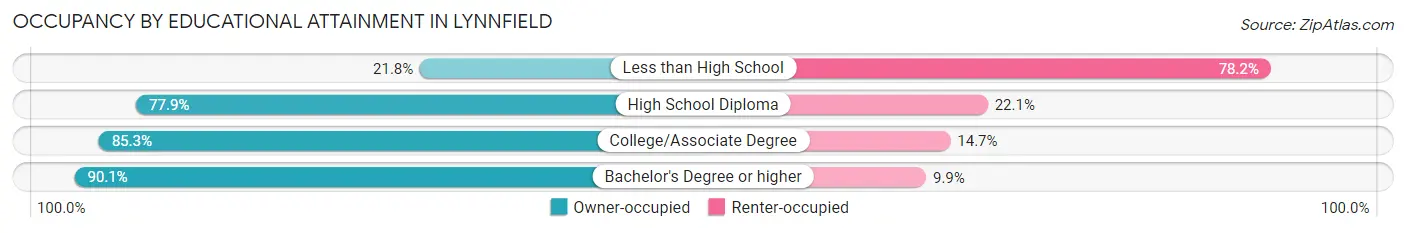
| Household Size | Owner-occupied | Renter-occupied |
| Less than High School | 22 (21.8%) | 79 (78.2%) |
| High School Diploma | 729 (77.9%) | 207 (22.1%) |
| College/Associate Degree | 661 (85.3%) | 114 (14.7%) |
| Bachelor's Degree or higher | 2,550 (90.1%) | 280 (9.9%) |
Occupancy by Age of Householder in Lynnfield
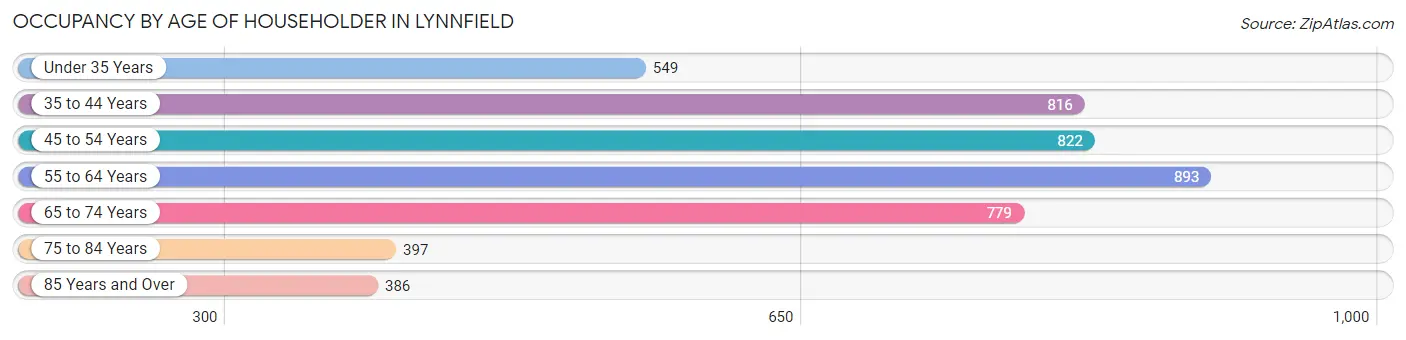
| Age Bracket | # Households | % Households |
| Under 35 Years | 549 | 11.8% |
| 35 to 44 Years | 816 | 17.6% |
| 45 to 54 Years | 822 | 17.7% |
| 55 to 64 Years | 893 | 19.2% |
| 65 to 74 Years | 779 | 16.8% |
| 75 to 84 Years | 397 | 8.6% |
| 85 Years and Over | 386 | 8.3% |
| Total | 4,642 | 100.0% |
Housing Finances in Lynnfield
Median Income by Occupancy in Lynnfield
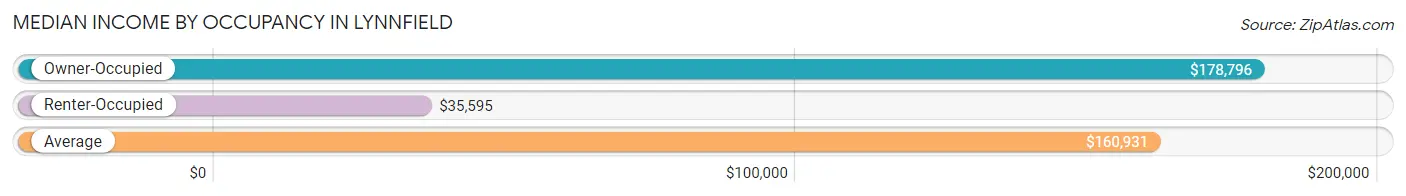
| Occupancy Type | # Households | Median Income |
| Owner-Occupied | 3,962 (85.4%) | $178,796 |
| Renter-Occupied | 680 (14.6%) | $35,595 |
| Average | 4,642 (100.0%) | $160,931 |
Occupancy by Householder Income Bracket in Lynnfield
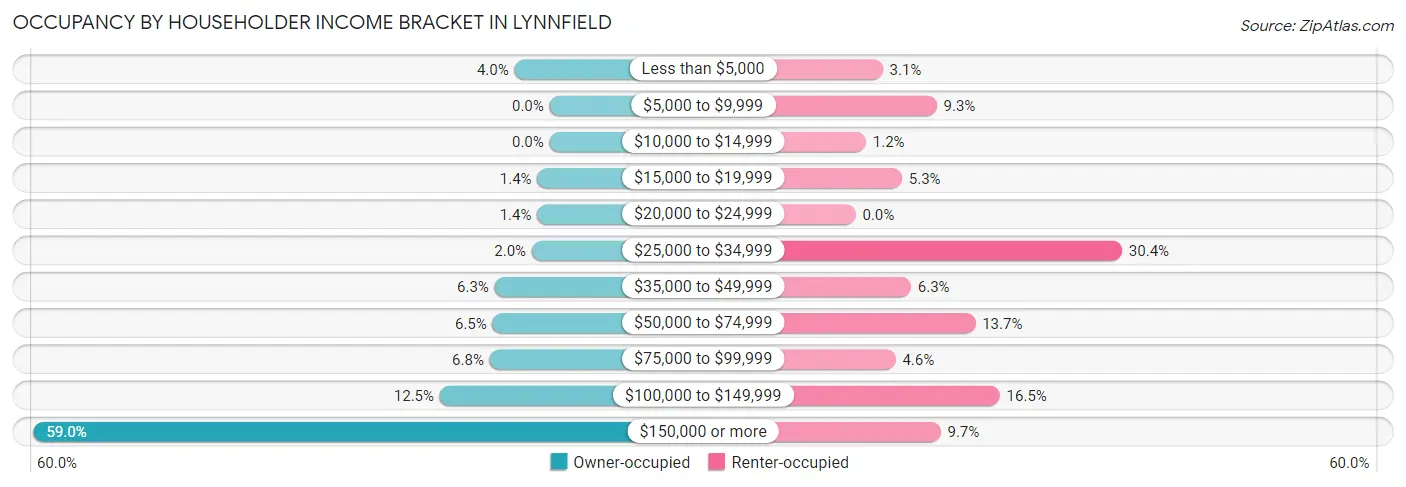
| Income Bracket | Owner-occupied | Renter-occupied |
| Less than $5,000 | 159 (4.0%) | 21 (3.1%) |
| $5,000 to $9,999 | 0 (0.0%) | 63 (9.3%) |
| $10,000 to $14,999 | 0 (0.0%) | 8 (1.2%) |
| $15,000 to $19,999 | 55 (1.4%) | 36 (5.3%) |
| $20,000 to $24,999 | 56 (1.4%) | 0 (0.0%) |
| $25,000 to $34,999 | 80 (2.0%) | 207 (30.4%) |
| $35,000 to $49,999 | 249 (6.3%) | 43 (6.3%) |
| $50,000 to $74,999 | 258 (6.5%) | 93 (13.7%) |
| $75,000 to $99,999 | 271 (6.8%) | 31 (4.6%) |
| $100,000 to $149,999 | 497 (12.5%) | 112 (16.5%) |
| $150,000 or more | 2,337 (59.0%) | 66 (9.7%) |
| Total | 3,962 (100.0%) | 680 (100.0%) |
Monthly Housing Cost Tiers in Lynnfield
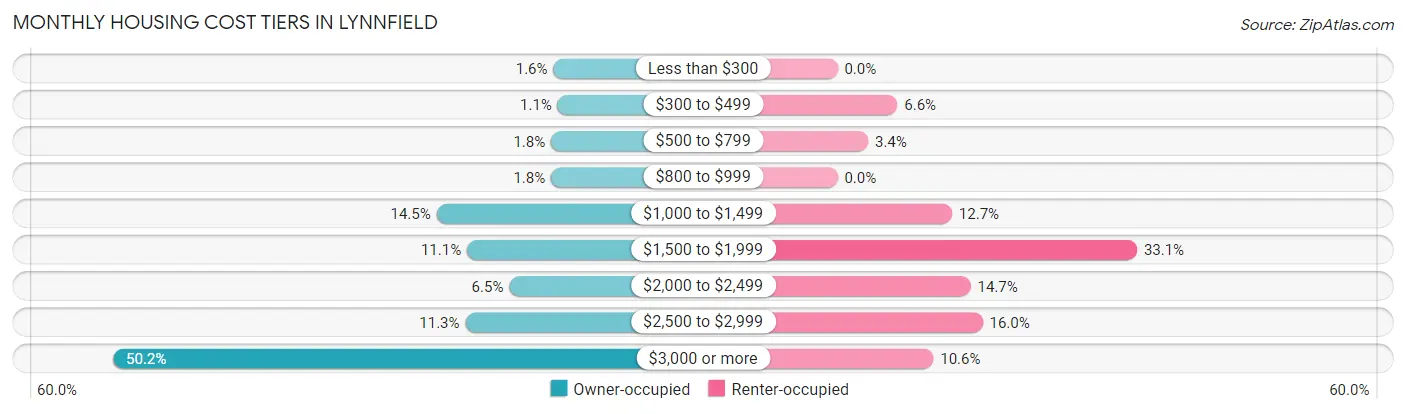
| Monthly Cost | Owner-occupied | Renter-occupied |
| Less than $300 | 63 (1.6%) | 0 (0.0%) |
| $300 to $499 | 44 (1.1%) | 45 (6.6%) |
| $500 to $799 | 73 (1.8%) | 23 (3.4%) |
| $800 to $999 | 73 (1.8%) | 0 (0.0%) |
| $1,000 to $1,499 | 574 (14.5%) | 86 (12.7%) |
| $1,500 to $1,999 | 441 (11.1%) | 225 (33.1%) |
| $2,000 to $2,499 | 256 (6.5%) | 100 (14.7%) |
| $2,500 to $2,999 | 448 (11.3%) | 109 (16.0%) |
| $3,000 or more | 1,990 (50.2%) | 72 (10.6%) |
| Total | 3,962 (100.0%) | 680 (100.0%) |
Physical Housing Characteristics in Lynnfield
Housing Structures in Lynnfield
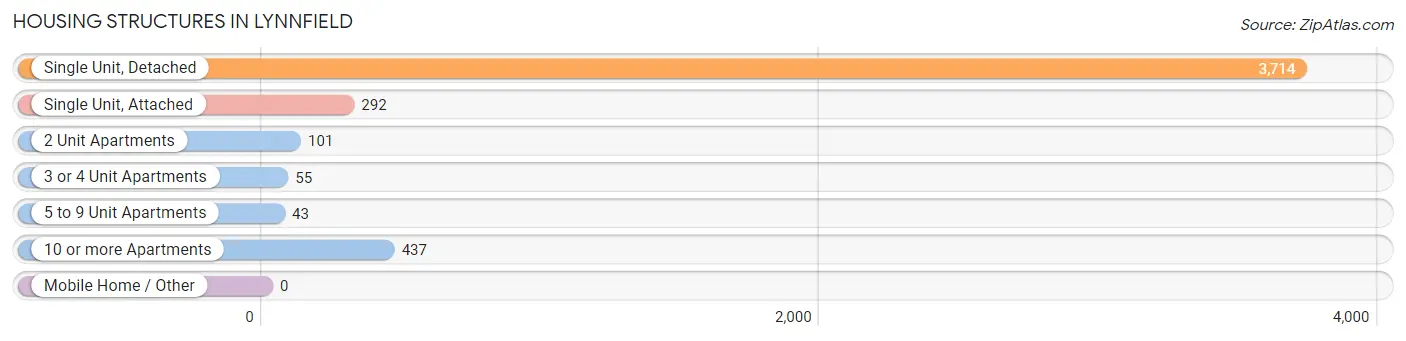
| Structure Type | # Housing Units | % Housing Units |
| Single Unit, Detached | 3,714 | 80.0% |
| Single Unit, Attached | 292 | 6.3% |
| 2 Unit Apartments | 101 | 2.2% |
| 3 or 4 Unit Apartments | 55 | 1.2% |
| 5 to 9 Unit Apartments | 43 | 0.9% |
| 10 or more Apartments | 437 | 9.4% |
| Mobile Home / Other | 0 | 0.0% |
| Total | 4,642 | 100.0% |
Housing Structures by Occupancy in Lynnfield
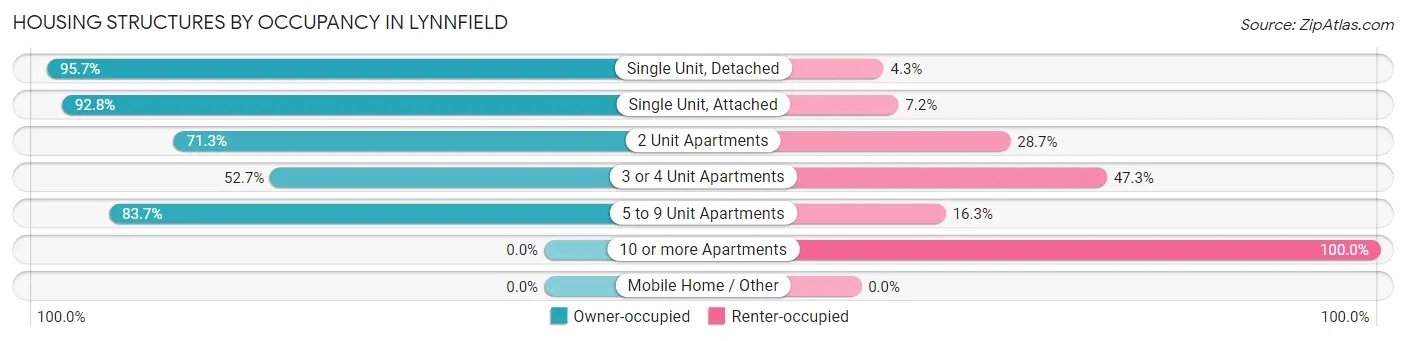
| Structure Type | Owner-occupied | Renter-occupied |
| Single Unit, Detached | 3,554 (95.7%) | 160 (4.3%) |
| Single Unit, Attached | 271 (92.8%) | 21 (7.2%) |
| 2 Unit Apartments | 72 (71.3%) | 29 (28.7%) |
| 3 or 4 Unit Apartments | 29 (52.7%) | 26 (47.3%) |
| 5 to 9 Unit Apartments | 36 (83.7%) | 7 (16.3%) |
| 10 or more Apartments | 0 (0.0%) | 437 (100.0%) |
| Mobile Home / Other | 0 (0.0%) | 0 (0.0%) |
| Total | 3,962 (85.4%) | 680 (14.6%) |
Housing Structures by Number of Rooms in Lynnfield
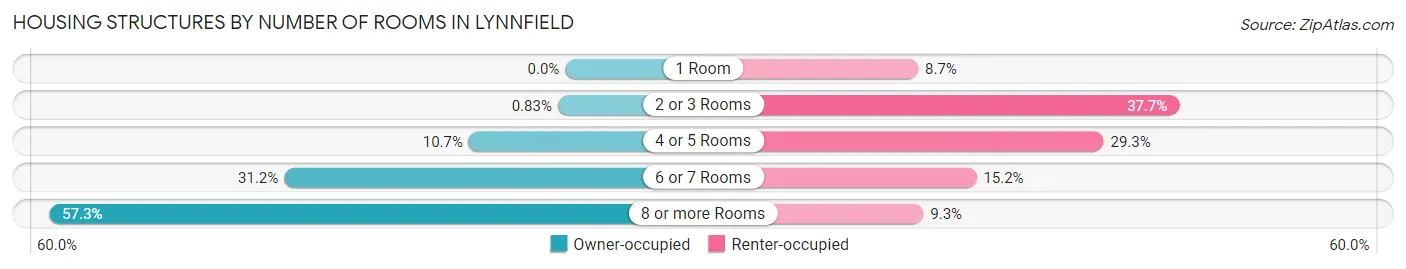
| Number of Rooms | Owner-occupied | Renter-occupied |
| 1 Room | 0 (0.0%) | 59 (8.7%) |
| 2 or 3 Rooms | 33 (0.8%) | 256 (37.7%) |
| 4 or 5 Rooms | 424 (10.7%) | 199 (29.3%) |
| 6 or 7 Rooms | 1,236 (31.2%) | 103 (15.1%) |
| 8 or more Rooms | 2,269 (57.3%) | 63 (9.3%) |
| Total | 3,962 (100.0%) | 680 (100.0%) |
Housing Structure by Heating Type in Lynnfield
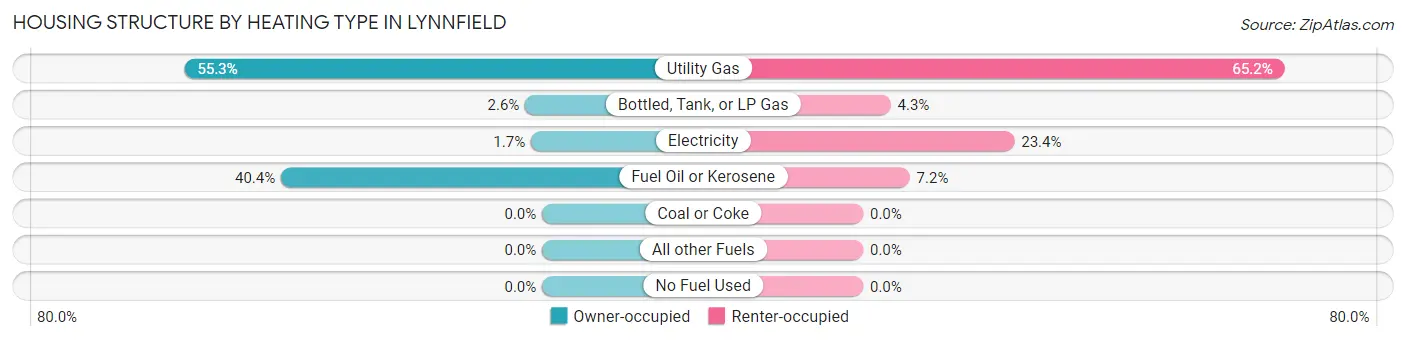
| Heating Type | Owner-occupied | Renter-occupied |
| Utility Gas | 2,191 (55.3%) | 443 (65.1%) |
| Bottled, Tank, or LP Gas | 104 (2.6%) | 29 (4.3%) |
| Electricity | 68 (1.7%) | 159 (23.4%) |
| Fuel Oil or Kerosene | 1,599 (40.4%) | 49 (7.2%) |
| Coal or Coke | 0 (0.0%) | 0 (0.0%) |
| All other Fuels | 0 (0.0%) | 0 (0.0%) |
| No Fuel Used | 0 (0.0%) | 0 (0.0%) |
| Total | 3,962 (100.0%) | 680 (100.0%) |
Household Vehicle Usage in Lynnfield
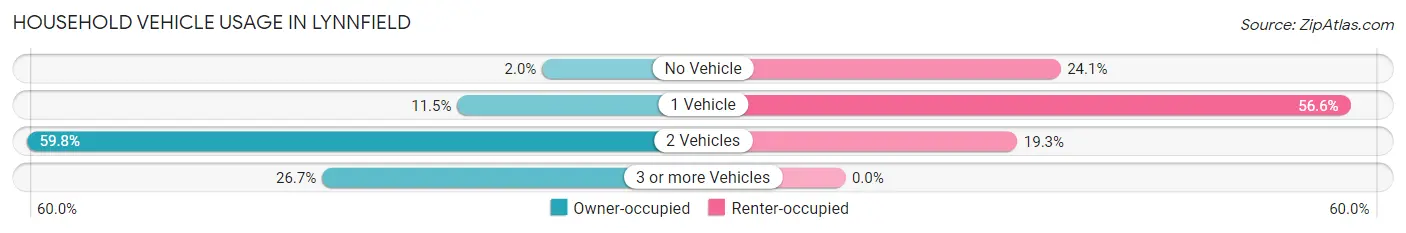
| Vehicles per Household | Owner-occupied | Renter-occupied |
| No Vehicle | 80 (2.0%) | 164 (24.1%) |
| 1 Vehicle | 457 (11.5%) | 385 (56.6%) |
| 2 Vehicles | 2,368 (59.8%) | 131 (19.3%) |
| 3 or more Vehicles | 1,057 (26.7%) | 0 (0.0%) |
| Total | 3,962 (100.0%) | 680 (100.0%) |
Real Estate & Mortgages in Lynnfield
Real Estate and Mortgage Overview in Lynnfield
| Characteristic | Without Mortgage | With Mortgage |
| Housing Units | 1,105 | 2,857 |
| Median Property Value | $823,100 | $879,900 |
| Median Household Income | $103,542 | $1,955 |
| Monthly Housing Costs | $1,282 | $1,990 |
| Real Estate Taxes | $9,731 | $40 |
Property Value by Mortgage Status in Lynnfield
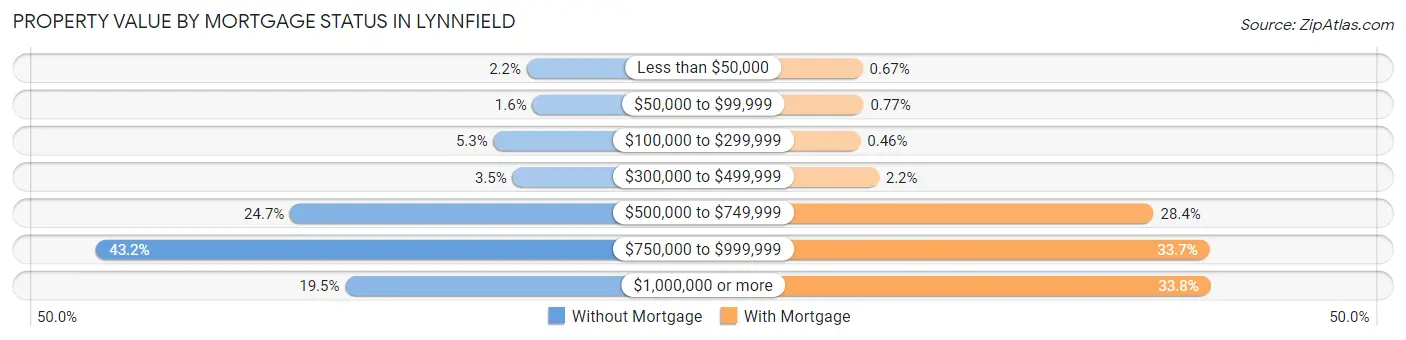
| Property Value | Without Mortgage | With Mortgage |
| Less than $50,000 | 24 (2.2%) | 19 (0.7%) |
| $50,000 to $99,999 | 18 (1.6%) | 22 (0.8%) |
| $100,000 to $299,999 | 59 (5.3%) | 13 (0.5%) |
| $300,000 to $499,999 | 39 (3.5%) | 63 (2.2%) |
| $500,000 to $749,999 | 273 (24.7%) | 811 (28.4%) |
| $750,000 to $999,999 | 477 (43.2%) | 963 (33.7%) |
| $1,000,000 or more | 215 (19.5%) | 966 (33.8%) |
| Total | 1,105 (100.0%) | 2,857 (100.0%) |
Household Income by Mortgage Status in Lynnfield
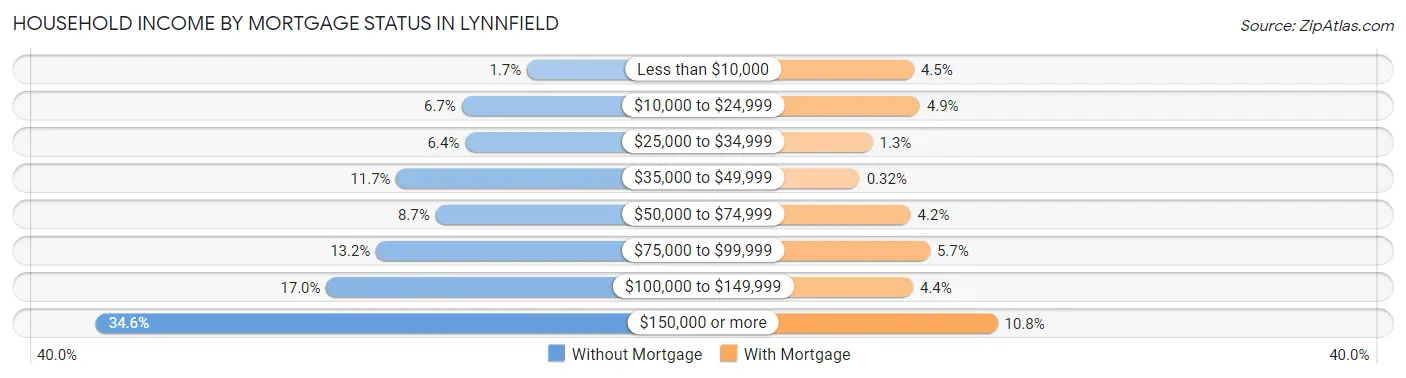
| Household Income | Without Mortgage | With Mortgage |
| Less than $10,000 | 19 (1.7%) | 127 (4.4%) |
| $10,000 to $24,999 | 74 (6.7%) | 140 (4.9%) |
| $25,000 to $34,999 | 71 (6.4%) | 37 (1.3%) |
| $35,000 to $49,999 | 129 (11.7%) | 9 (0.3%) |
| $50,000 to $74,999 | 96 (8.7%) | 120 (4.2%) |
| $75,000 to $99,999 | 146 (13.2%) | 162 (5.7%) |
| $100,000 to $149,999 | 188 (17.0%) | 125 (4.4%) |
| $150,000 or more | 382 (34.6%) | 309 (10.8%) |
| Total | 1,105 (100.0%) | 2,857 (100.0%) |
Property Value to Household Income Ratio in Lynnfield
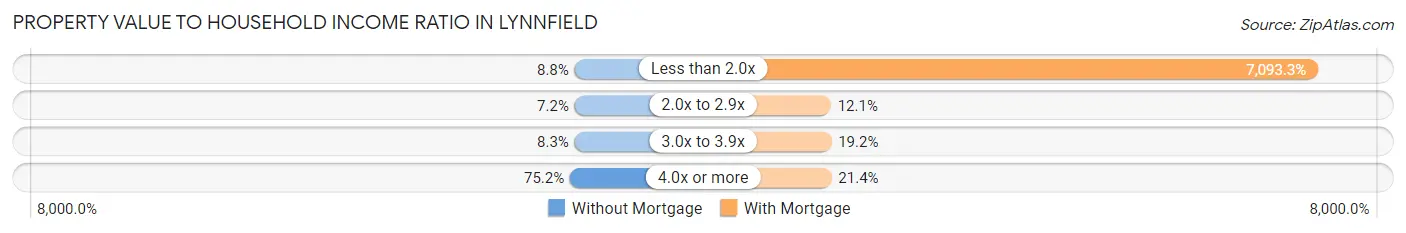
| Value-to-Income Ratio | Without Mortgage | With Mortgage |
| Less than 2.0x | 97 (8.8%) | 202,656 (7,093.3%) |
| 2.0x to 2.9x | 79 (7.1%) | 345 (12.1%) |
| 3.0x to 3.9x | 92 (8.3%) | 549 (19.2%) |
| 4.0x or more | 831 (75.2%) | 610 (21.3%) |
| Total | 1,105 (100.0%) | 2,857 (100.0%) |
Real Estate Taxes by Mortgage Status in Lynnfield
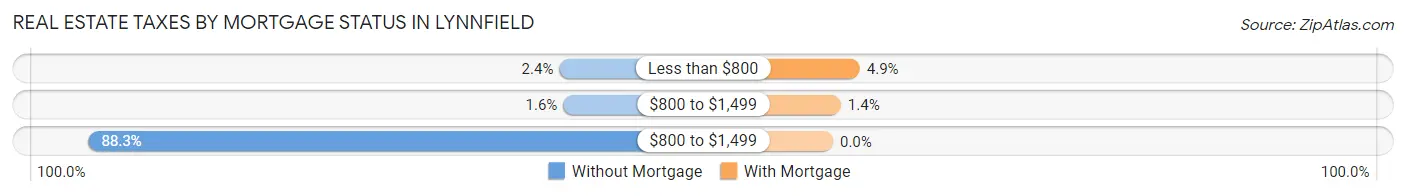
| Property Taxes | Without Mortgage | With Mortgage |
| Less than $800 | 26 (2.4%) | 140 (4.9%) |
| $800 to $1,499 | 18 (1.6%) | 41 (1.4%) |
| $800 to $1,499 | 976 (88.3%) | 0 (0.0%) |
| Total | 1,105 (100.0%) | 2,857 (100.0%) |
Health & Disability in Lynnfield
Health Insurance Coverage by Age in Lynnfield
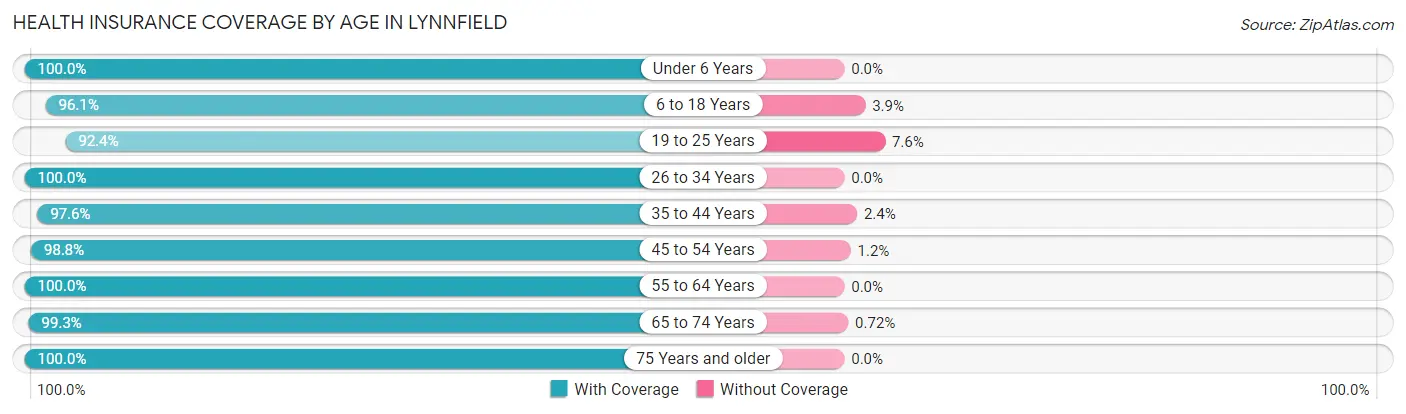
| Age Bracket | With Coverage | Without Coverage |
| Under 6 Years | 1,194 (100.0%) | 0 (0.0%) |
| 6 to 18 Years | 2,218 (96.1%) | 90 (3.9%) |
| 19 to 25 Years | 743 (92.4%) | 61 (7.6%) |
| 26 to 34 Years | 1,092 (100.0%) | 0 (0.0%) |
| 35 to 44 Years | 1,696 (97.6%) | 41 (2.4%) |
| 45 to 54 Years | 1,684 (98.8%) | 20 (1.2%) |
| 55 to 64 Years | 1,592 (100.0%) | 0 (0.0%) |
| 65 to 74 Years | 1,385 (99.3%) | 10 (0.7%) |
| 75 Years and older | 1,099 (100.0%) | 0 (0.0%) |
| Total | 12,703 (98.3%) | 222 (1.7%) |
Health Insurance Coverage by Citizenship Status in Lynnfield
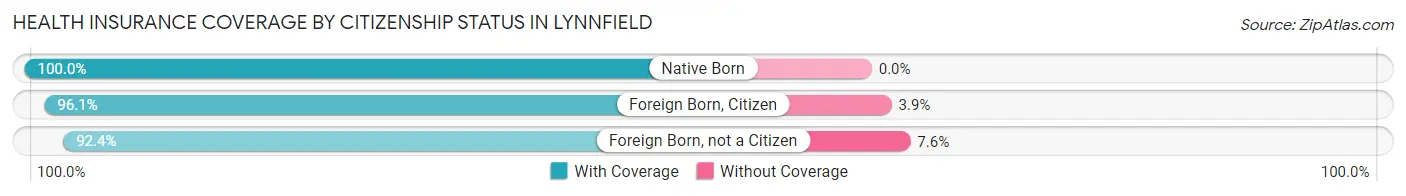
| Citizenship Status | With Coverage | Without Coverage |
| Native Born | 1,194 (100.0%) | 0 (0.0%) |
| Foreign Born, Citizen | 2,218 (96.1%) | 90 (3.9%) |
| Foreign Born, not a Citizen | 743 (92.4%) | 61 (7.6%) |
Health Insurance Coverage by Household Income in Lynnfield
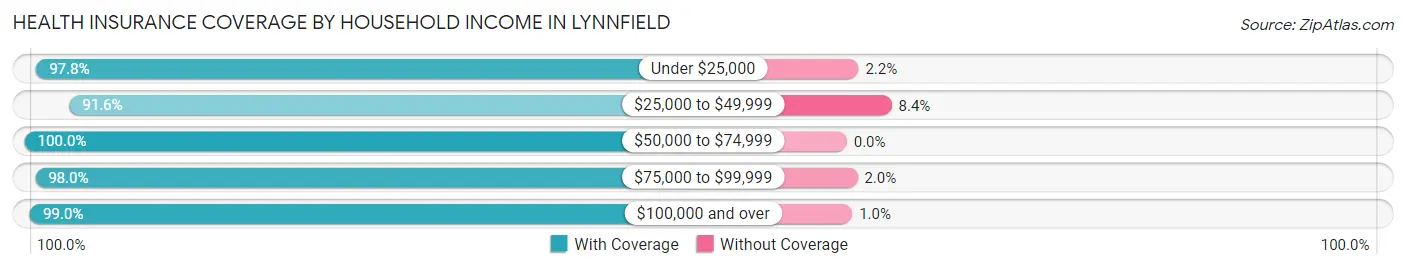
| Household Income | With Coverage | Without Coverage |
| Under $25,000 | 849 (97.8%) | 19 (2.2%) |
| $25,000 to $49,999 | 1,015 (91.6%) | 93 (8.4%) |
| $50,000 to $74,999 | 730 (100.0%) | 0 (0.0%) |
| $75,000 to $99,999 | 588 (98.0%) | 12 (2.0%) |
| $100,000 and over | 9,488 (99.0%) | 98 (1.0%) |
Public vs Private Health Insurance Coverage by Age in Lynnfield
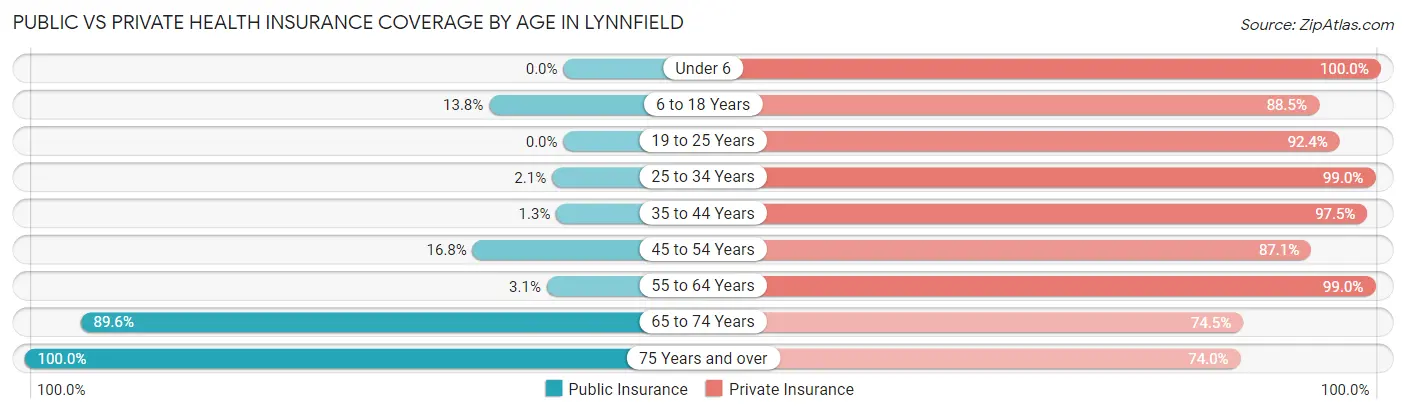
| Age Bracket | Public Insurance | Private Insurance |
| Under 6 | 0 (0.0%) | 1,194 (100.0%) |
| 6 to 18 Years | 318 (13.8%) | 2,043 (88.5%) |
| 19 to 25 Years | 0 (0.0%) | 743 (92.4%) |
| 25 to 34 Years | 23 (2.1%) | 1,081 (99.0%) |
| 35 to 44 Years | 23 (1.3%) | 1,694 (97.5%) |
| 45 to 54 Years | 287 (16.8%) | 1,484 (87.1%) |
| 55 to 64 Years | 49 (3.1%) | 1,576 (99.0%) |
| 65 to 74 Years | 1,250 (89.6%) | 1,039 (74.5%) |
| 75 Years and over | 1,099 (100.0%) | 813 (74.0%) |
| Total | 3,049 (23.6%) | 11,667 (90.3%) |
Disability Status by Sex by Age in Lynnfield
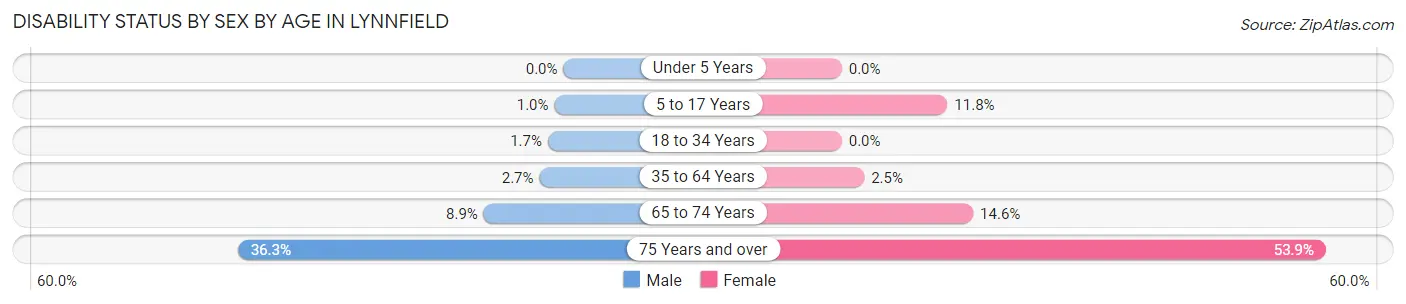
| Age Bracket | Male | Female |
| Under 5 Years | 0 (0.0%) | 0 (0.0%) |
| 5 to 17 Years | 11 (1.0%) | 158 (11.8%) |
| 18 to 34 Years | 17 (1.7%) | 0 (0.0%) |
| 35 to 64 Years | 66 (2.7%) | 64 (2.5%) |
| 65 to 74 Years | 54 (8.9%) | 115 (14.6%) |
| 75 Years and over | 157 (36.3%) | 359 (53.9%) |
Disability Class by Sex by Age in Lynnfield
Disability Class: Hearing Difficulty
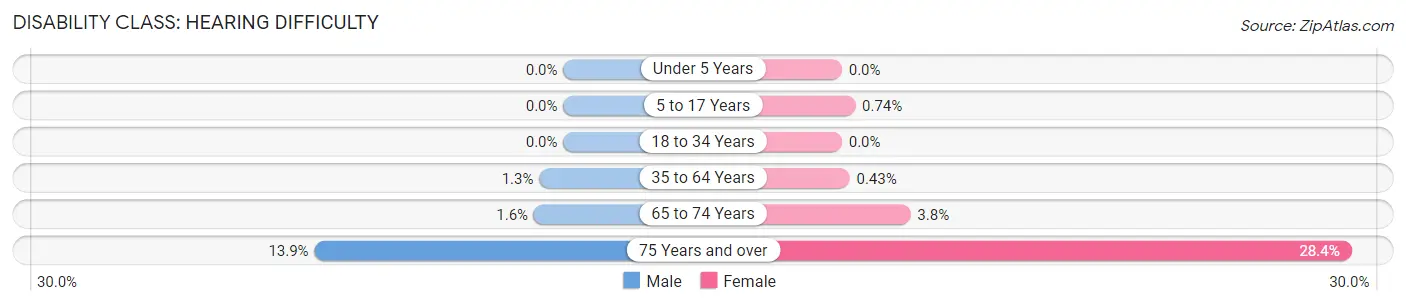
| Age Bracket | Male | Female |
| Under 5 Years | 0 (0.0%) | 0 (0.0%) |
| 5 to 17 Years | 0 (0.0%) | 10 (0.7%) |
| 18 to 34 Years | 0 (0.0%) | 0 (0.0%) |
| 35 to 64 Years | 33 (1.3%) | 11 (0.4%) |
| 65 to 74 Years | 10 (1.6%) | 30 (3.8%) |
| 75 Years and over | 60 (13.9%) | 189 (28.4%) |
Disability Class: Vision Difficulty
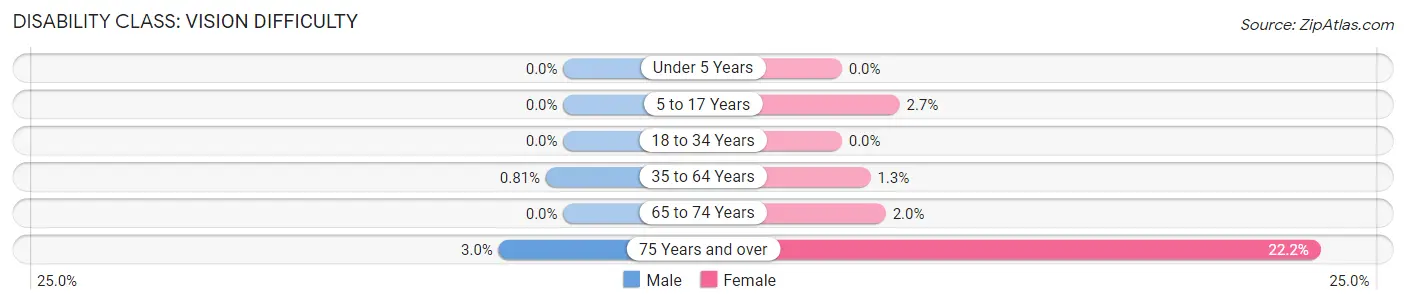
| Age Bracket | Male | Female |
| Under 5 Years | 0 (0.0%) | 0 (0.0%) |
| 5 to 17 Years | 0 (0.0%) | 36 (2.7%) |
| 18 to 34 Years | 0 (0.0%) | 0 (0.0%) |
| 35 to 64 Years | 20 (0.8%) | 34 (1.3%) |
| 65 to 74 Years | 0 (0.0%) | 16 (2.0%) |
| 75 Years and over | 13 (3.0%) | 148 (22.2%) |
Disability Class: Cognitive Difficulty
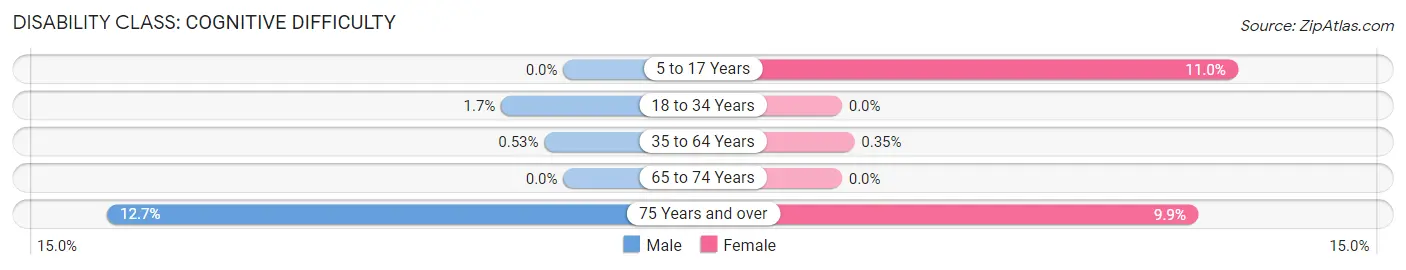
| Age Bracket | Male | Female |
| 5 to 17 Years | 0 (0.0%) | 148 (11.0%) |
| 18 to 34 Years | 17 (1.7%) | 0 (0.0%) |
| 35 to 64 Years | 13 (0.5%) | 9 (0.4%) |
| 65 to 74 Years | 0 (0.0%) | 0 (0.0%) |
| 75 Years and over | 55 (12.7%) | 66 (9.9%) |
Disability Class: Ambulatory Difficulty
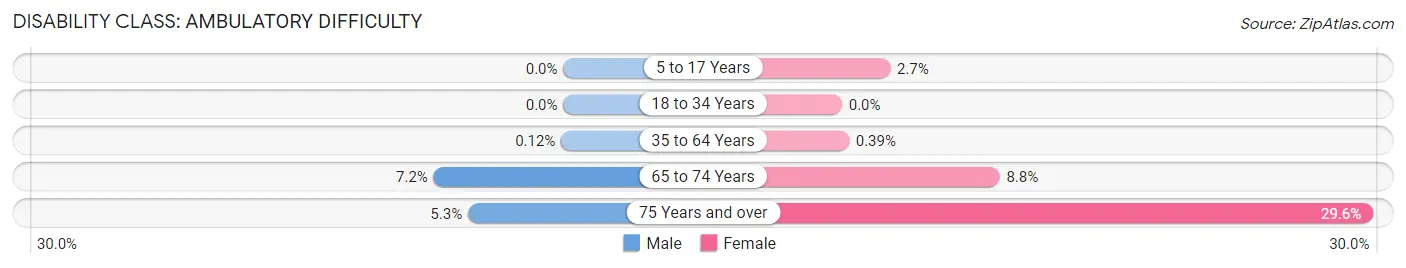
| Age Bracket | Male | Female |
| 5 to 17 Years | 0 (0.0%) | 36 (2.7%) |
| 18 to 34 Years | 0 (0.0%) | 0 (0.0%) |
| 35 to 64 Years | 3 (0.1%) | 10 (0.4%) |
| 65 to 74 Years | 44 (7.2%) | 69 (8.8%) |
| 75 Years and over | 23 (5.3%) | 197 (29.6%) |
Disability Class: Self-Care Difficulty
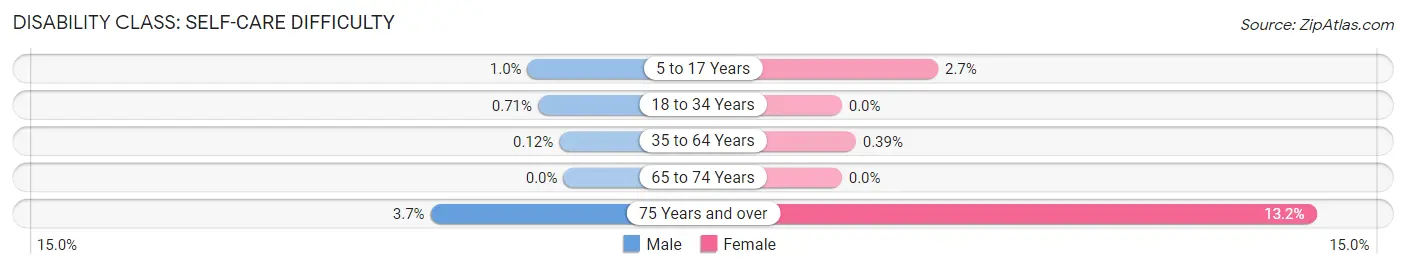
| Age Bracket | Male | Female |
| 5 to 17 Years | 11 (1.0%) | 36 (2.7%) |
| 18 to 34 Years | 7 (0.7%) | 0 (0.0%) |
| 35 to 64 Years | 3 (0.1%) | 10 (0.4%) |
| 65 to 74 Years | 0 (0.0%) | 0 (0.0%) |
| 75 Years and over | 16 (3.7%) | 88 (13.2%) |
Technology Access in Lynnfield
Computing Device Access in Lynnfield
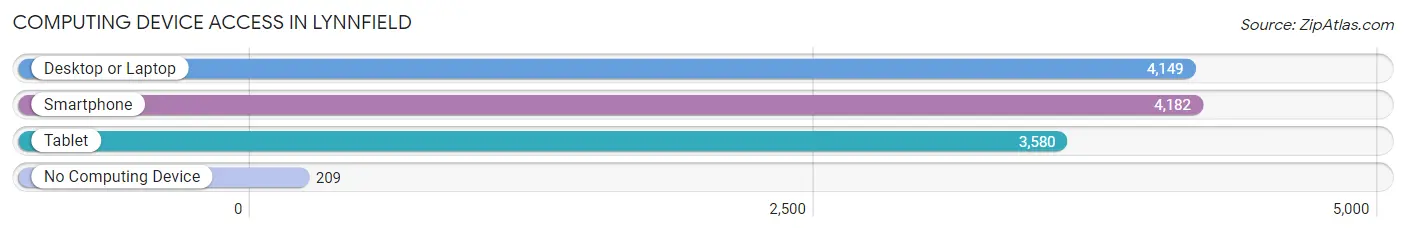
| Device Type | # Households | % Households |
| Desktop or Laptop | 4,149 | 89.4% |
| Smartphone | 4,182 | 90.1% |
| Tablet | 3,580 | 77.1% |
| No Computing Device | 209 | 4.5% |
| Total | 4,642 | 100.0% |
Internet Access in Lynnfield
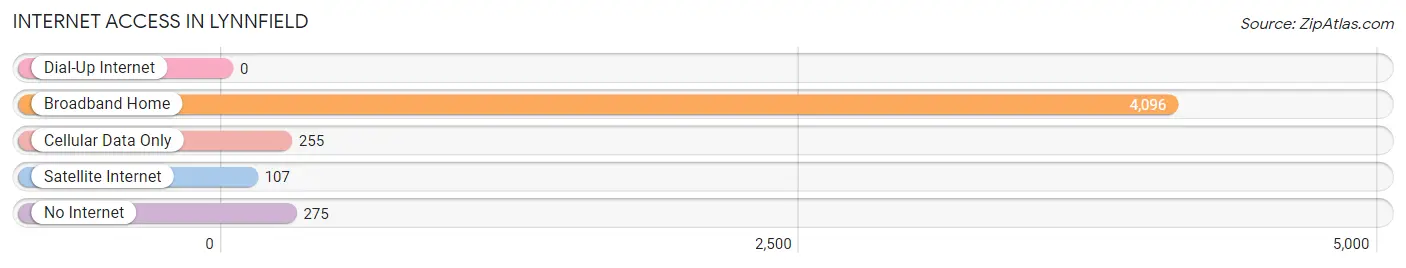
| Internet Type | # Households | % Households |
| Dial-Up Internet | 0 | 0.0% |
| Broadband Home | 4,096 | 88.2% |
| Cellular Data Only | 255 | 5.5% |
| Satellite Internet | 107 | 2.3% |
| No Internet | 275 | 5.9% |
| Total | 4,642 | 100.0% |
Lynnfield Summary
Lynnfield, Massachusetts is a small town located in the northeastern part of the state, about 20 miles north of Boston. It is bordered by the towns of Reading, Wakefield, Saugus, and Lynn. The town has a population of 11,596 as of the 2010 census, and is part of the Greater Boston metropolitan area.
History
The area that is now Lynnfield was originally inhabited by the Agawam Indians, who were part of the Algonquin tribe. The first European settlers arrived in the area in 1638, and the town was officially incorporated in 1782. The town was named after Lynn, England, which was the hometown of many of the early settlers.
In the 19th century, Lynnfield was a rural farming community, with a few small mills and factories. The town was also known for its shoe and leather industry, which was centered around the Saugus River. The town also had a thriving dairy industry, and was home to several large farms.
Geography
Lynnfield is located in northeastern Massachusetts, about 20 miles north of Boston. It is bordered by the towns of Reading, Wakefield, Saugus, and Lynn. The town has a total area of 8.3 square miles, of which 8.2 square miles is land and 0.1 square miles is water. The town is located in the Ipswich River watershed, and is home to several small ponds and lakes, including Lake Quannapowitt and Lynnfield Pond.
Economy
The economy of Lynnfield is largely based on retail and services. The town is home to several large shopping centers, including MarketStreet Lynnfield and the Lynnfield Marketplace. The town is also home to several corporate offices, including the headquarters of the Stop & Shop Supermarket Company.
The town is also home to several small businesses, including restaurants, cafes, and specialty shops. The town is also home to several technology companies, including the software company, LogMeIn.
Demographics
As of the 2010 census, there were 11,596 people, 4,541 households, and 3,541 families residing in the town. The population density was 1,417.2 people per square mile. The racial makeup of the town was 94.2% White, 1.2% African American, 0.2% Native American, 2.3% Asian, 0.1% Pacific Islander, 0.7% from other races, and 1.3% from two or more races. Hispanic or Latino of any race were 2.7% of the population.
The median income for a household in the town was $107,945, and the median income for a family was $125,945. The per capita income for the town was $50,945. About 2.2% of families and 3.2% of the population were below the poverty line, including 3.7% of those under age 18 and 2.2% of those age 65 or over.
Common Questions
What is Per Capita Income in Lynnfield?
Per Capita income in Lynnfield is $73,239.
What is the Median Family Income in Lynnfield?
Median Family Income in Lynnfield is $180,081.
What is the Median Household income in Lynnfield?
Median Household Income in Lynnfield is $160,931.
What is Income or Wage Gap in Lynnfield?
Income or Wage Gap in Lynnfield is 35.7%.
Women in Lynnfield earn 64.3 cents for every dollar earned by a man.
What is Inequality or Gini Index in Lynnfield?
Inequality or Gini Index in Lynnfield is 0.48.
What is the Total Population of Lynnfield?
Total Population of Lynnfield is 12,925.
What is the Total Male Population of Lynnfield?
Total Male Population of Lynnfield is 6,174.
What is the Total Female Population of Lynnfield?
Total Female Population of Lynnfield is 6,751.
What is the Ratio of Males per 100 Females in Lynnfield?
There are 91.45 Males per 100 Females in Lynnfield.
What is the Ratio of Females per 100 Males in Lynnfield?
There are 109.35 Females per 100 Males in Lynnfield.
What is the Median Population Age in Lynnfield?
Median Population Age in Lynnfield is 40.9 Years.
What is the Average Family Size in Lynnfield
Average Family Size in Lynnfield is 3.2 People.
What is the Average Household Size in Lynnfield
Average Household Size in Lynnfield is 2.8 People.
How Large is the Labor Force in Lynnfield?
There are 6,830 People in the Labor Forcein in Lynnfield.
What is the Percentage of People in the Labor Force in Lynnfield?
69.0% of People are in the Labor Force in Lynnfield.
What is the Unemployment Rate in Lynnfield?
Unemployment Rate in Lynnfield is 4.5%.