Brookline, MA Map & Demographics
Brookline Map
Brookline Overview
$91,184
PER CAPITA INCOME
$209,618
AVG FAMILY INCOME
$130,600
AVG HOUSEHOLD INCOME
35.9%
WAGE / INCOME GAP [ % ]
64.1¢/ $1
WAGE / INCOME GAP [ $ ]
$11,063
FAMILY INCOME DEFICIT
0.54
INEQUALITY / GINI INDEX
62,698
TOTAL POPULATION
28,743
MALE POPULATION
33,955
FEMALE POPULATION
84.65
MALES / 100 FEMALES
118.13
FEMALES / 100 MALES
35.1
MEDIAN AGE
3.0
AVG FAMILY SIZE
2.3
AVG HOUSEHOLD SIZE
37,293
LABOR FORCE [ PEOPLE ]
71.8%
PERCENT IN LABOR FORCE
3.5%
UNEMPLOYMENT RATE
Income in Brookline
Income Overview in Brookline
Per Capita Income in Brookline is $91,184, while median incomes of families and households are $209,618 and $130,600 respectively.
| Characteristic | Number | Measure |
| Per Capita Income | 62,698 | $91,184 |
| Median Family Income | 13,244 | $209,618 |
| Mean Family Income | 13,244 | $301,920 |
| Median Household Income | 26,919 | $130,600 |
| Mean Household Income | 26,919 | $211,322 |
| Income Deficit | 13,244 | $11,063 |
| Wage / Income Gap (%) | 62,698 | 35.89% |
| Wage / Income Gap ($) | 62,698 | 64.11¢ per $1 |
| Gini / Inequality Index | 62,698 | 0.54 |
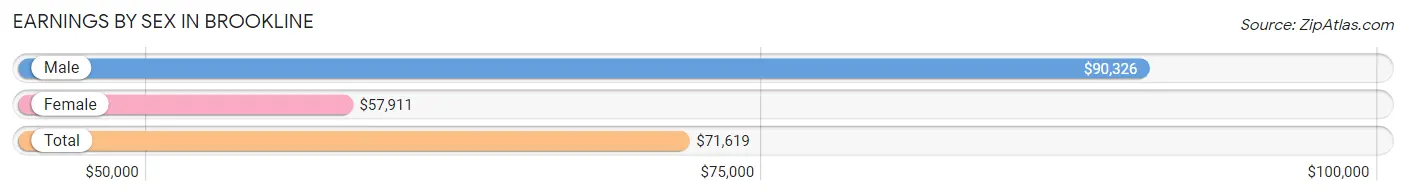
Earnings by Sex in Brookline
Average Earnings in Brookline are $71,619, $90,326 for men and $57,911 for women, a difference of 35.9%.
| Sex | Number | Average Earnings |
| Male | 18,563 (47.1%) | $90,326 |
| Female | 20,863 (52.9%) | $57,911 |
| Total | 39,426 (100.0%) | $71,619 |
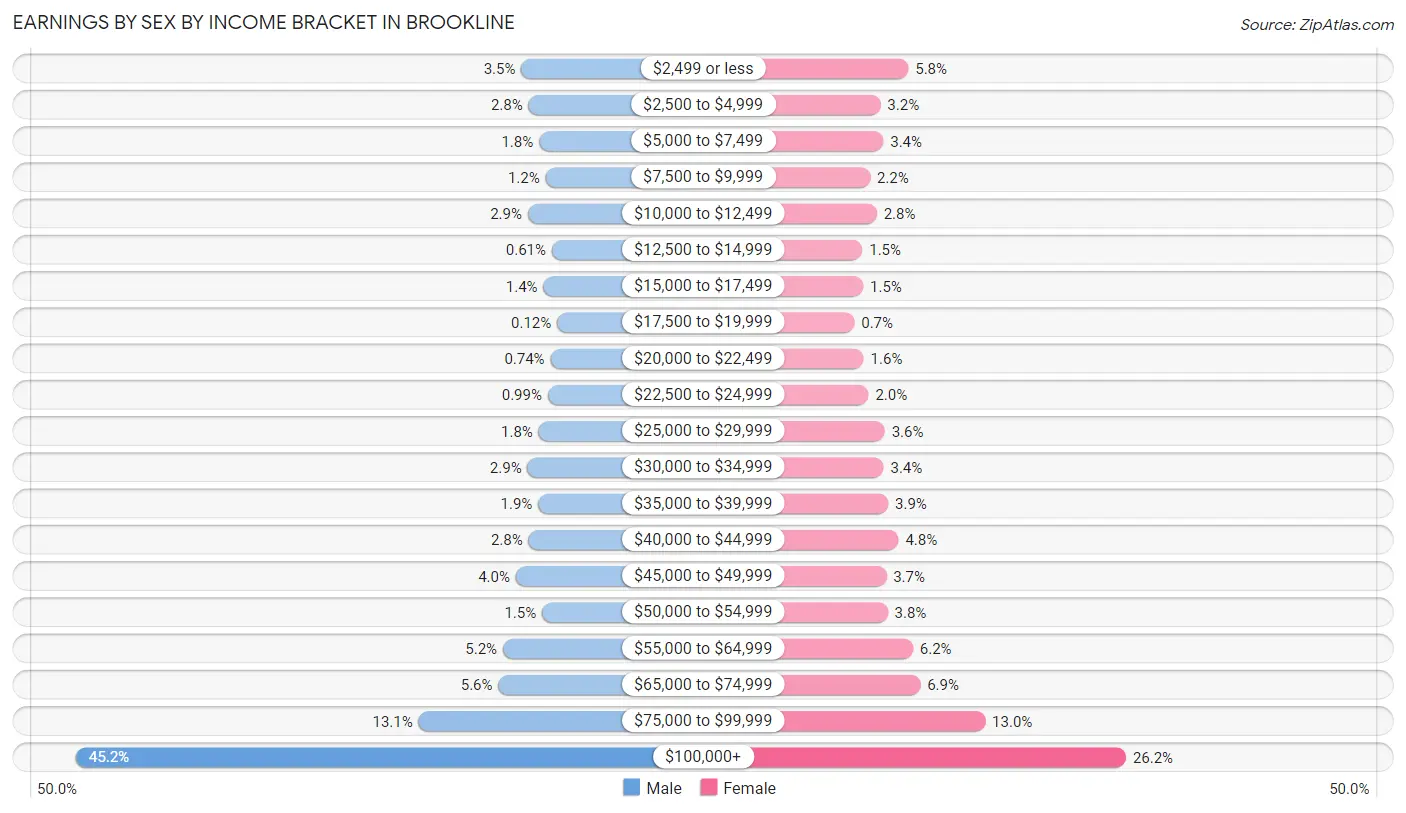
Earnings by Sex by Income Bracket in Brookline
The most common earnings brackets in Brookline are $100,000+ for men (8,389 | 45.2%) and $100,000+ for women (5,456 | 26.2%).
| Income | Male | Female |
| $2,499 or less | 644 (3.5%) | 1,202 (5.8%) |
| $2,500 to $4,999 | 517 (2.8%) | 658 (3.2%) |
| $5,000 to $7,499 | 336 (1.8%) | 713 (3.4%) |
| $7,500 to $9,999 | 222 (1.2%) | 453 (2.2%) |
| $10,000 to $12,499 | 530 (2.9%) | 585 (2.8%) |
| $12,500 to $14,999 | 113 (0.6%) | 302 (1.5%) |
| $15,000 to $17,499 | 260 (1.4%) | 320 (1.5%) |
| $17,500 to $19,999 | 22 (0.1%) | 147 (0.7%) |
| $20,000 to $22,499 | 138 (0.7%) | 329 (1.6%) |
| $22,500 to $24,999 | 183 (1.0%) | 424 (2.0%) |
| $25,000 to $29,999 | 341 (1.8%) | 741 (3.5%) |
| $30,000 to $34,999 | 537 (2.9%) | 717 (3.4%) |
| $35,000 to $39,999 | 350 (1.9%) | 808 (3.9%) |
| $40,000 to $44,999 | 518 (2.8%) | 1,009 (4.8%) |
| $45,000 to $49,999 | 740 (4.0%) | 770 (3.7%) |
| $50,000 to $54,999 | 284 (1.5%) | 798 (3.8%) |
| $55,000 to $64,999 | 964 (5.2%) | 1,291 (6.2%) |
| $65,000 to $74,999 | 1,044 (5.6%) | 1,436 (6.9%) |
| $75,000 to $99,999 | 2,431 (13.1%) | 2,704 (13.0%) |
| $100,000+ | 8,389 (45.2%) | 5,456 (26.2%) |
| Total | 18,563 (100.0%) | 20,863 (100.0%) |
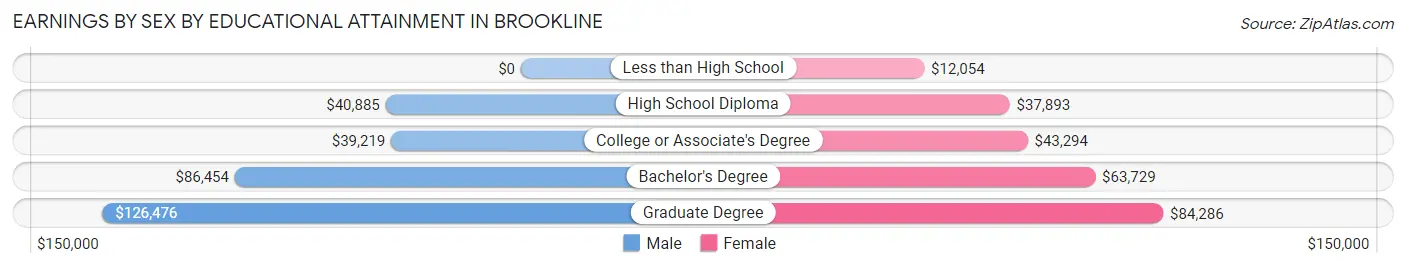
Earnings by Sex by Educational Attainment in Brookline
Average earnings in Brookline are $109,406 for men and $71,123 for women, a difference of 35.0%. Men with an educational attainment of graduate degree enjoy the highest average annual earnings of $126,476, while those with college or associate's degree education earn the least with $39,219. Women with an educational attainment of graduate degree earn the most with the average annual earnings of $84,286, while those with less than high school education have the smallest earnings of $12,054.
| Educational Attainment | Male Income | Female Income |
| Less than High School | - | - |
| High School Diploma | $40,885 | $37,893 |
| College or Associate's Degree | $39,219 | $43,294 |
| Bachelor's Degree | $86,454 | $63,729 |
| Graduate Degree | $126,476 | $84,286 |
| Total | $109,406 | $71,123 |
Family Income in Brookline
Family Income Brackets in Brookline
According to the Brookline family income data, there are 6,860 families falling into the $200,000+ income range, which is the most common income bracket and makes up 51.8% of all families. Conversely, the $10,000 to $14,999 income bracket is the least frequent group with only 66 families (0.5%) belonging to this category.
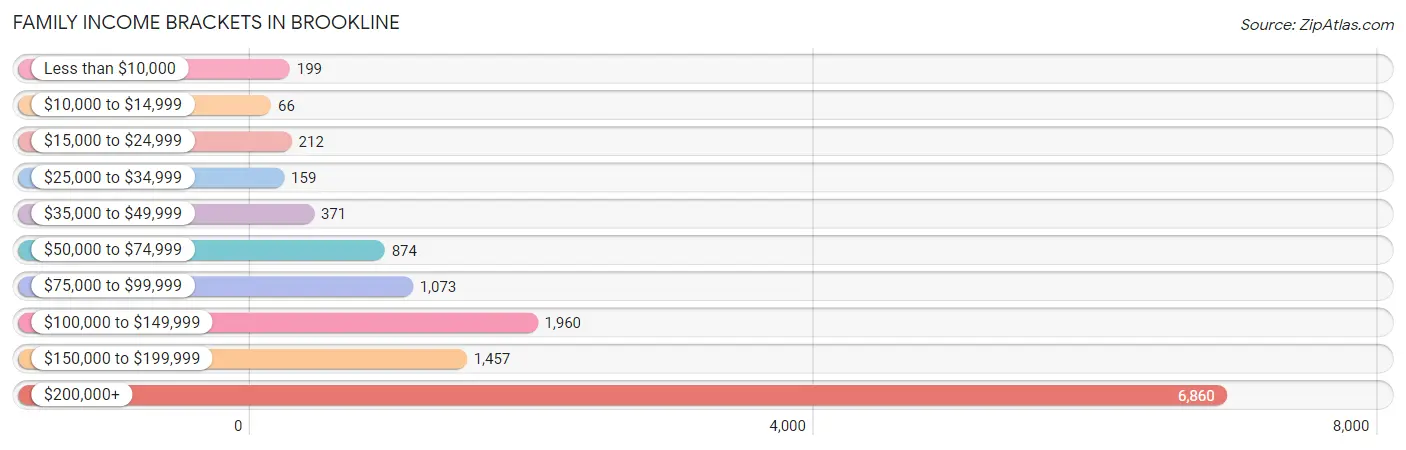
| Income Bracket | # Families | % Families |
| Less than $10,000 | 199 | 1.5% |
| $10,000 to $14,999 | 66 | 0.5% |
| $15,000 to $24,999 | 212 | 1.6% |
| $25,000 to $34,999 | 159 | 1.2% |
| $35,000 to $49,999 | 371 | 2.8% |
| $50,000 to $74,999 | 874 | 6.6% |
| $75,000 to $99,999 | 1,073 | 8.1% |
| $100,000 to $149,999 | 1,960 | 14.8% |
| $150,000 to $199,999 | 1,457 | 11.0% |
| $200,000+ | 6,860 | 51.8% |
Family Income by Famaliy Size in Brookline
3-person families (2,674 | 20.2%) account for the highest median family income in Brookline with $250,001 per family, while 3-person families (2,674 | 20.2%) have the highest median income of $83,334 per family member.
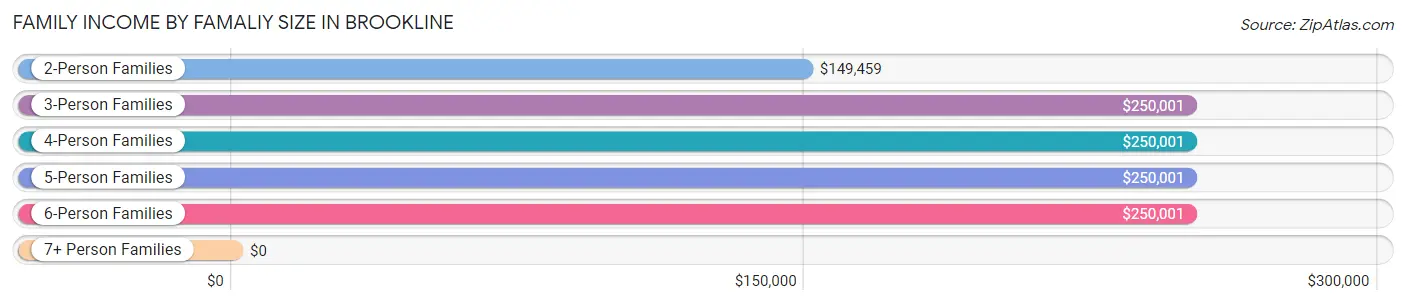
| Income Bracket | # Families | Median Income |
| 2-Person Families | 6,262 (47.3%) | $149,459 |
| 3-Person Families | 2,674 (20.2%) | $250,001 |
| 4-Person Families | 3,064 (23.1%) | $250,001 |
| 5-Person Families | 1,007 (7.6%) | $250,001 |
| 6-Person Families | 167 (1.3%) | $250,001 |
| 7+ Person Families | 70 (0.5%) | $0 |
| Total | 13,244 (100.0%) | $209,618 |
Family Income by Number of Earners in Brookline
The median family income in Brookline is $209,618, with families comprising 2 earners (7,449) having the highest median family income of $250,001, while families with no earners (1,343) have the lowest median family income of $80,723, accounting for 56.2% and 10.1% of families, respectively.
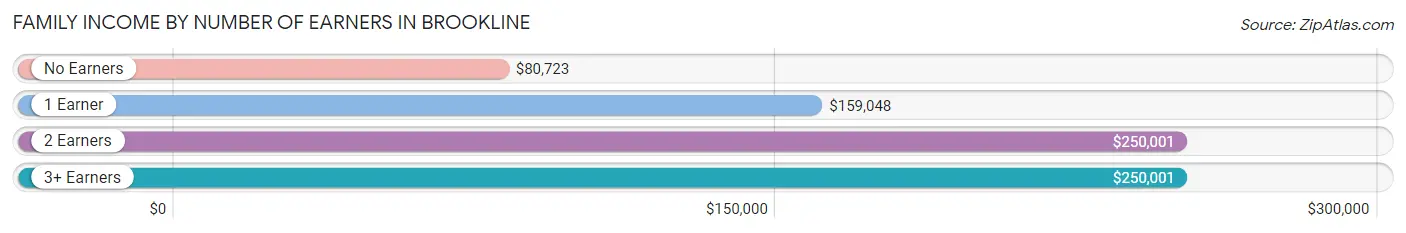
| Number of Earners | # Families | Median Income |
| No Earners | 1,343 (10.1%) | $80,723 |
| 1 Earner | 3,538 (26.7%) | $159,048 |
| 2 Earners | 7,449 (56.2%) | $250,001 |
| 3+ Earners | 914 (6.9%) | $250,001 |
| Total | 13,244 (100.0%) | $209,618 |
Household Income in Brookline
Household Income Brackets in Brookline
With 9,018 households falling in the category, the $200,000+ income range is the most frequent in Brookline, accounting for 33.5% of all households. In contrast, only 592 households (2.2%) fall into the $15,000 to $24,999 income bracket, making it the least populous group.
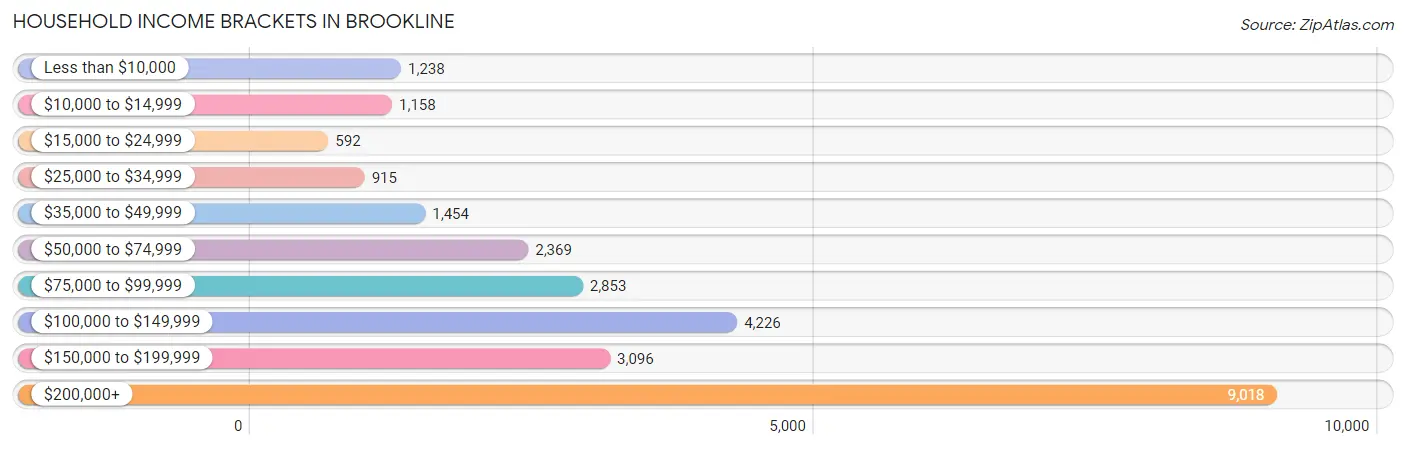
| Income Bracket | # Households | % Households |
| Less than $10,000 | 1,238 | 4.6% |
| $10,000 to $14,999 | 1,158 | 4.3% |
| $15,000 to $24,999 | 592 | 2.2% |
| $25,000 to $34,999 | 915 | 3.4% |
| $35,000 to $49,999 | 1,454 | 5.4% |
| $50,000 to $74,999 | 2,369 | 8.8% |
| $75,000 to $99,999 | 2,853 | 10.6% |
| $100,000 to $149,999 | 4,226 | 15.7% |
| $150,000 to $199,999 | 3,096 | 11.5% |
| $200,000+ | 9,018 | 33.5% |
Household Income by Householder Age in Brookline
The median household income in Brookline is $130,600, with the highest median household income of $216,656 found in the 45 to 64 years age bracket for the primary householder. A total of 7,764 households (28.8%) fall into this category. Meanwhile, the 15 to 24 years age bracket for the primary householder has the lowest median household income of $82,543, with 2,585 households (9.6%) in this group.
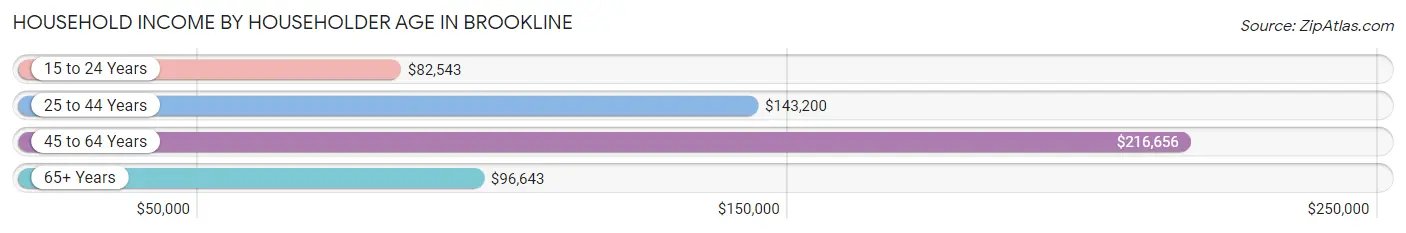
| Income Bracket | # Households | Median Income |
| 15 to 24 Years | 2,585 (9.6%) | $82,543 |
| 25 to 44 Years | 9,964 (37.0%) | $143,200 |
| 45 to 64 Years | 7,764 (28.8%) | $216,656 |
| 65+ Years | 6,606 (24.5%) | $96,643 |
| Total | 26,919 (100.0%) | $130,600 |
Poverty in Brookline
Income Below Poverty by Sex and Age in Brookline
With 8.8% poverty level for males and 11.2% for females among the residents of Brookline, 18 to 24 year old males and 18 to 24 year old females are the most vulnerable to poverty, with 1,127 males (31.1%) and 1,263 females (30.2%) in their respective age groups living below the poverty level.
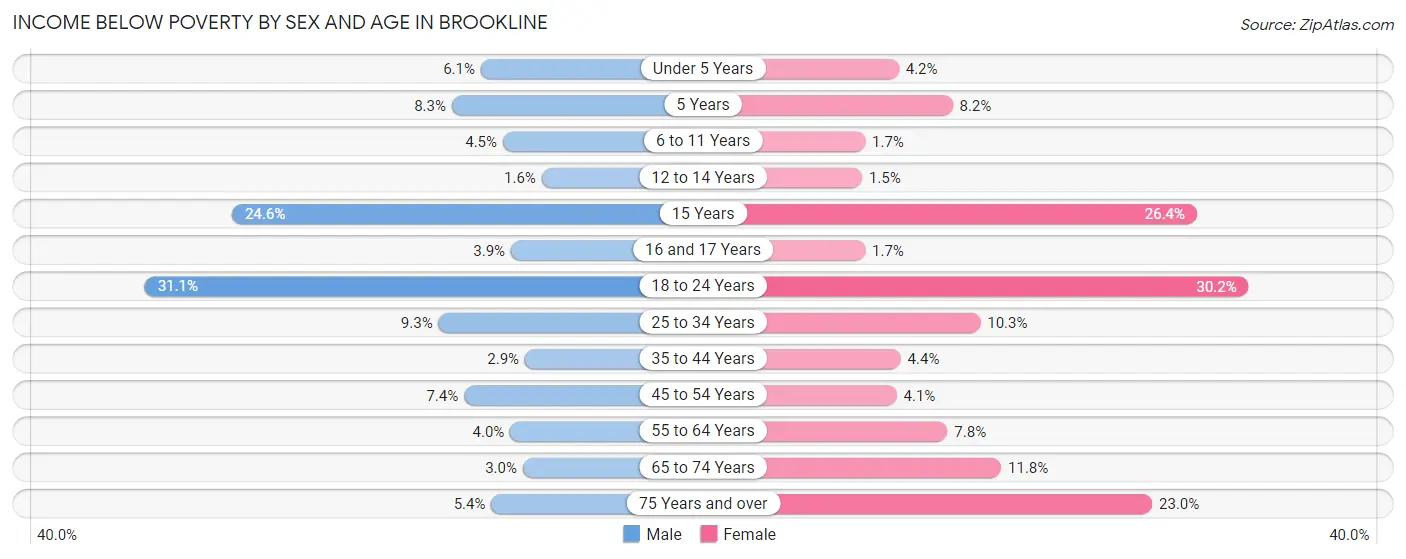
| Age Bracket | Male | Female |
| Under 5 Years | 104 (6.1%) | 81 (4.2%) |
| 5 Years | 25 (8.3%) | 25 (8.2%) |
| 6 to 11 Years | 82 (4.5%) | 34 (1.7%) |
| 12 to 14 Years | 20 (1.6%) | 11 (1.5%) |
| 15 Years | 61 (24.6%) | 97 (26.4%) |
| 16 and 17 Years | 29 (3.9%) | 8 (1.7%) |
| 18 to 24 Years | 1,127 (31.1%) | 1,263 (30.2%) |
| 25 to 34 Years | 424 (9.3%) | 622 (10.3%) |
| 35 to 44 Years | 114 (2.9%) | 191 (4.4%) |
| 45 to 54 Years | 241 (7.4%) | 156 (4.1%) |
| 55 to 64 Years | 112 (4.0%) | 249 (7.8%) |
| 65 to 74 Years | 68 (3.0%) | 379 (11.8%) |
| 75 Years and over | 90 (5.3%) | 599 (23.0%) |
| Total | 2,497 (8.8%) | 3,715 (11.2%) |
Income Above Poverty by Sex and Age in Brookline
According to the poverty statistics in Brookline, males aged 12 to 14 years and females aged 12 to 14 years are the age groups that are most secure financially, with 98.4% of males and 98.5% of females in these age groups living above the poverty line.
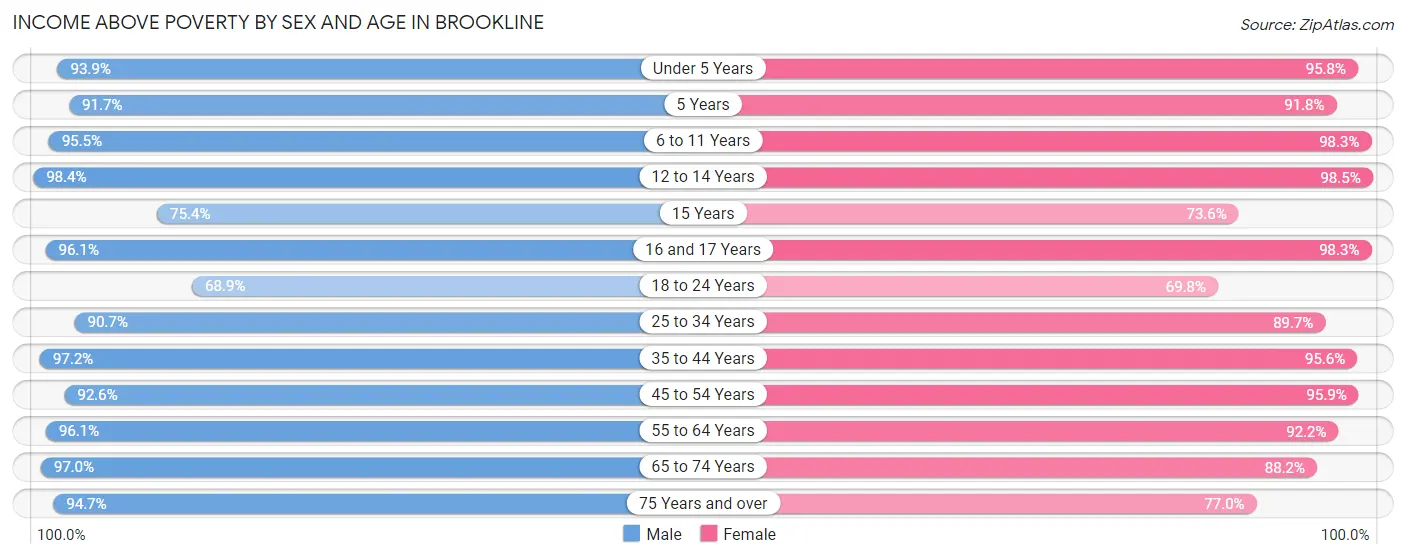
| Age Bracket | Male | Female |
| Under 5 Years | 1,593 (93.9%) | 1,833 (95.8%) |
| 5 Years | 277 (91.7%) | 279 (91.8%) |
| 6 to 11 Years | 1,746 (95.5%) | 1,927 (98.3%) |
| 12 to 14 Years | 1,224 (98.4%) | 721 (98.5%) |
| 15 Years | 187 (75.4%) | 271 (73.6%) |
| 16 and 17 Years | 717 (96.1%) | 454 (98.3%) |
| 18 to 24 Years | 2,499 (68.9%) | 2,919 (69.8%) |
| 25 to 34 Years | 4,149 (90.7%) | 5,429 (89.7%) |
| 35 to 44 Years | 3,881 (97.2%) | 4,177 (95.6%) |
| 45 to 54 Years | 3,027 (92.6%) | 3,676 (95.9%) |
| 55 to 64 Years | 2,723 (96.1%) | 2,927 (92.2%) |
| 65 to 74 Years | 2,189 (97.0%) | 2,824 (88.2%) |
| 75 Years and over | 1,592 (94.7%) | 2,001 (77.0%) |
| Total | 25,804 (91.2%) | 29,438 (88.8%) |
Income Below Poverty Among Married-Couple Families in Brookline
The poverty statistics for married-couple families in Brookline show that 1.7% or 183 of the total 11,103 families live below the poverty line. Families with 3 or 4 children have the highest poverty rate of 4.5%, comprising of 42 families. On the other hand, families with 5 or more children have the lowest poverty rate of 0.0%, which includes 0 families.
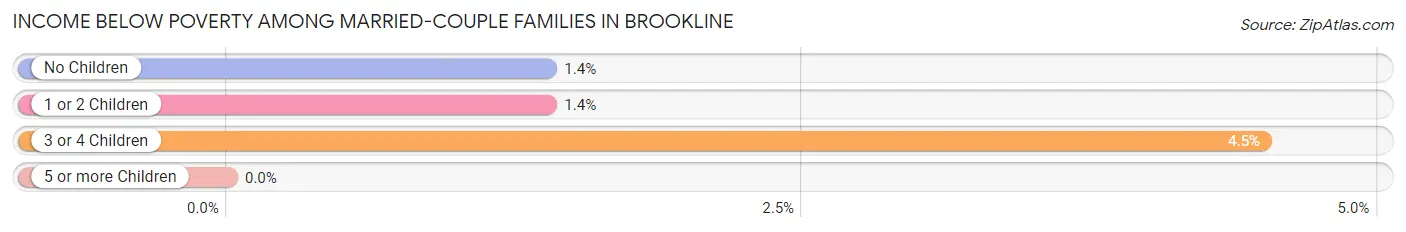
| Children | Above Poverty | Below Poverty |
| No Children | 5,517 (98.6%) | 78 (1.4%) |
| 1 or 2 Children | 4,466 (98.6%) | 63 (1.4%) |
| 3 or 4 Children | 891 (95.5%) | 42 (4.5%) |
| 5 or more Children | 46 (100.0%) | 0 (0.0%) |
| Total | 10,920 (98.4%) | 183 (1.7%) |
Income Below Poverty Among Single-Parent Households in Brookline
According to the poverty data in Brookline, 10.4% or 56 single-father households and 11.8% or 189 single-mother households are living below the poverty line. Among single-father households, those with 1 or 2 children have the highest poverty rate, with 39 households (18.1%) experiencing poverty. Likewise, among single-mother households, those with 3 or 4 children have the highest poverty rate, with 11 households (31.4%) falling below the poverty line.
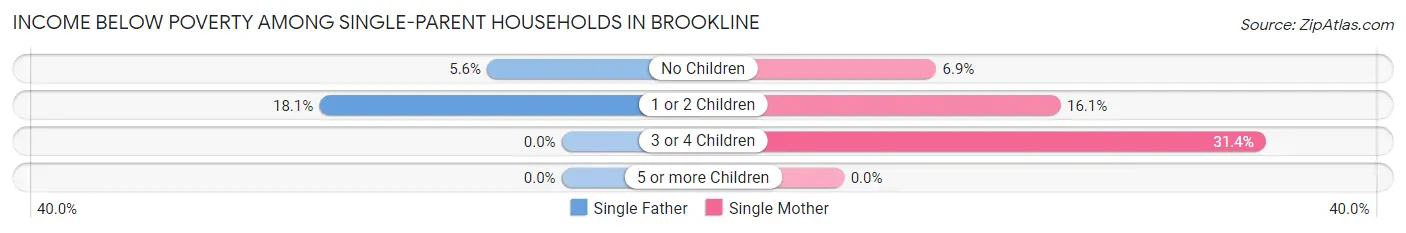
| Children | Single Father | Single Mother |
| No Children | 17 (5.6%) | 55 (6.9%) |
| 1 or 2 Children | 39 (18.1%) | 123 (16.1%) |
| 3 or 4 Children | 0 (0.0%) | 11 (31.4%) |
| 5 or more Children | 0 (0.0%) | 0 (0.0%) |
| Total | 56 (10.4%) | 189 (11.8%) |
Income Below Poverty Among Married-Couple vs Single-Parent Households in Brookline
The poverty data for Brookline shows that 183 of the married-couple family households (1.7%) and 245 of the single-parent households (11.4%) are living below the poverty level. Within the married-couple family households, those with 3 or 4 children have the highest poverty rate, with 42 households (4.5%) falling below the poverty line. Among the single-parent households, those with 3 or 4 children have the highest poverty rate, with 11 household (20.7%) living below poverty.
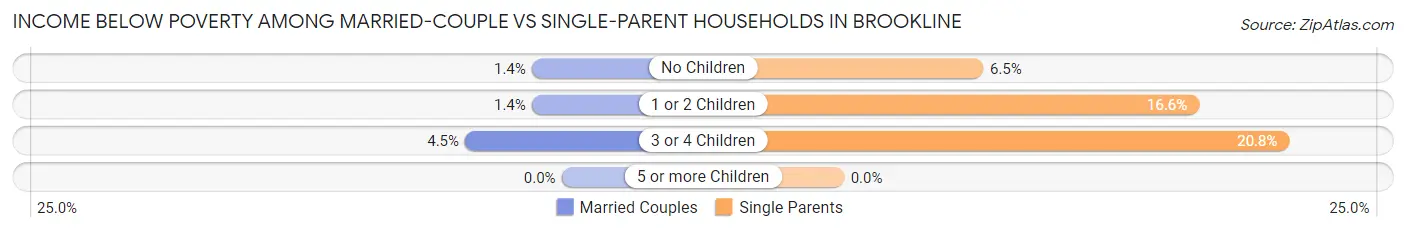
| Children | Married-Couple Families | Single-Parent Households |
| No Children | 78 (1.4%) | 72 (6.5%) |
| 1 or 2 Children | 63 (1.4%) | 162 (16.6%) |
| 3 or 4 Children | 42 (4.5%) | 11 (20.7%) |
| 5 or more Children | 0 (0.0%) | 0 (0.0%) |
| Total | 183 (1.7%) | 245 (11.4%) |
Race in Brookline
The most populous races in Brookline are White / Caucasian (43,008 | 68.6%), Asian (11,529 | 18.4%), and Two or more Races (5,310 | 8.5%).
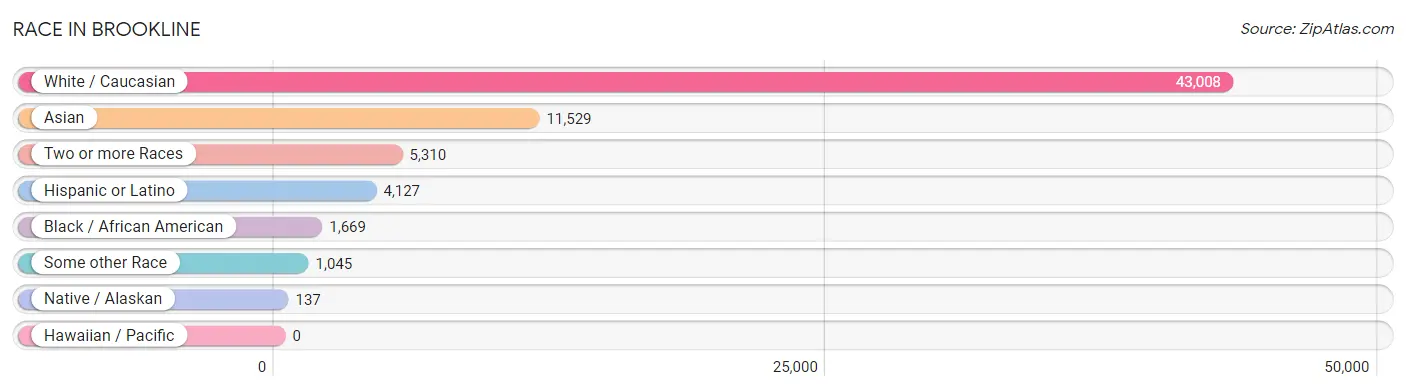
| Race | # Population | % Population |
| Asian | 11,529 | 18.4% |
| Black / African American | 1,669 | 2.7% |
| Hawaiian / Pacific | 0 | 0.0% |
| Hispanic or Latino | 4,127 | 6.6% |
| Native / Alaskan | 137 | 0.2% |
| White / Caucasian | 43,008 | 68.6% |
| Two or more Races | 5,310 | 8.5% |
| Some other Race | 1,045 | 1.7% |
| Total | 62,698 | 100.0% |
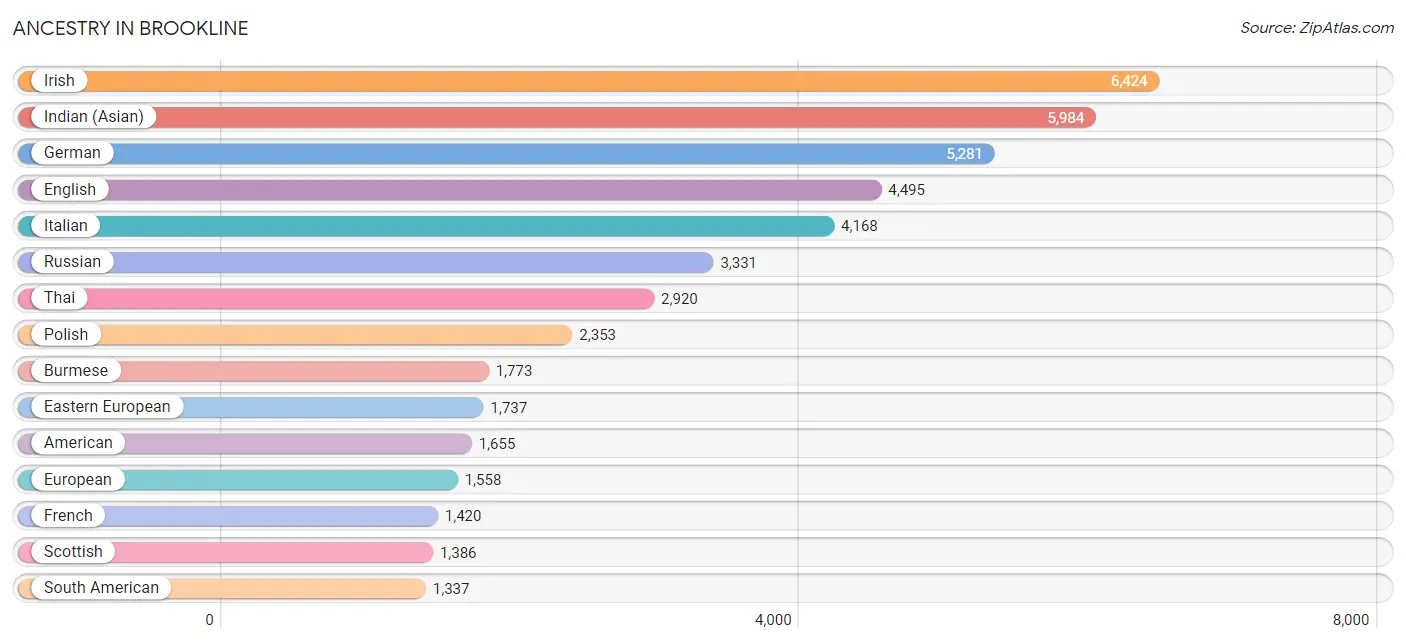
Ancestry in Brookline
The most populous ancestries reported in Brookline are Irish (6,424 | 10.2%), Indian (Asian) (5,984 | 9.5%), German (5,281 | 8.4%), English (4,495 | 7.2%), and Italian (4,168 | 6.7%), together accounting for 42.0% of all Brookline residents.
| Ancestry | # Population | % Population |
| Afghan | 46 | 0.1% |
| African | 46 | 0.1% |
| Albanian | 250 | 0.4% |
| Alsatian | 11 | 0.0% |
| American | 1,655 | 2.6% |
| Apache | 14 | 0.0% |
| Arab | 1,241 | 2.0% |
| Argentinean | 211 | 0.3% |
| Armenian | 174 | 0.3% |
| Assyrian / Chaldean / Syriac | 9 | 0.0% |
| Australian | 60 | 0.1% |
| Austrian | 203 | 0.3% |
| Barbadian | 17 | 0.0% |
| Belgian | 104 | 0.2% |
| Bhutanese | 1,051 | 1.7% |
| Blackfeet | 12 | 0.0% |
| Bolivian | 36 | 0.1% |
| Brazilian | 269 | 0.4% |
| British | 478 | 0.8% |
| Bulgarian | 156 | 0.3% |
| Burmese | 1,773 | 2.8% |
| Cambodian | 72 | 0.1% |
| Canadian | 341 | 0.5% |
| Cape Verdean | 11 | 0.0% |
| Celtic | 5 | 0.0% |
| Central American | 156 | 0.3% |
| Central American Indian | 12 | 0.0% |
| Cherokee | 54 | 0.1% |
| Chilean | 81 | 0.1% |
| Choctaw | 13 | 0.0% |
| Colombian | 544 | 0.9% |
| Croatian | 112 | 0.2% |
| Cuban | 298 | 0.5% |
| Cypriot | 11 | 0.0% |
| Czech | 138 | 0.2% |
| Danish | 298 | 0.5% |
| Dominican | 325 | 0.5% |
| Dutch | 398 | 0.6% |
| Eastern European | 1,737 | 2.8% |
| Ecuadorian | 105 | 0.2% |
| Egyptian | 114 | 0.2% |
| English | 4,495 | 7.2% |
| Ethiopian | 128 | 0.2% |
| European | 1,558 | 2.5% |
| Filipino | 273 | 0.4% |
| Finnish | 183 | 0.3% |
| French | 1,420 | 2.3% |
| French Canadian | 769 | 1.2% |
| German | 5,281 | 8.4% |
| Ghanaian | 4 | 0.0% |
| Greek | 382 | 0.6% |
| Guatemalan | 92 | 0.2% |
| Haitian | 54 | 0.1% |
| Hungarian | 398 | 0.6% |
| Indian (Asian) | 5,984 | 9.5% |
| Iranian | 483 | 0.8% |
| Iraqi | 17 | 0.0% |
| Irish | 6,424 | 10.2% |
| Iroquois | 12 | 0.0% |
| Israeli | 1,301 | 2.1% |
| Italian | 4,168 | 6.7% |
| Jamaican | 121 | 0.2% |
| Japanese | 141 | 0.2% |
| Jordanian | 144 | 0.2% |
| Kenyan | 8 | 0.0% |
| Korean | 567 | 0.9% |
| Laotian | 140 | 0.2% |
| Latvian | 122 | 0.2% |
| Lebanese | 288 | 0.5% |
| Liberian | 7 | 0.0% |
| Lithuanian | 349 | 0.6% |
| Macedonian | 9 | 0.0% |
| Mexican | 582 | 0.9% |
| Mongolian | 127 | 0.2% |
| Moroccan | 144 | 0.2% |
| Native Hawaiian | 7 | 0.0% |
| Nigerian | 86 | 0.1% |
| Northern European | 142 | 0.2% |
| Norwegian | 315 | 0.5% |
| Okinawan | 6 | 0.0% |
| Pakistani | 161 | 0.3% |
| Panamanian | 4 | 0.0% |
| Paraguayan | 8 | 0.0% |
| Pennsylvania German | 14 | 0.0% |
| Peruvian | 107 | 0.2% |
| Polish | 2,353 | 3.7% |
| Portuguese | 696 | 1.1% |
| Puerto Rican | 759 | 1.2% |
| Romanian | 339 | 0.5% |
| Russian | 3,331 | 5.3% |
| Salvadoran | 60 | 0.1% |
| Scandinavian | 107 | 0.2% |
| Scotch-Irish | 398 | 0.6% |
| Scottish | 1,386 | 2.2% |
| Seminole | 11 | 0.0% |
| Serbian | 75 | 0.1% |
| Sioux | 7 | 0.0% |
| Slavic | 121 | 0.2% |
| Slovak | 70 | 0.1% |
| South African | 34 | 0.1% |
| South American | 1,337 | 2.1% |
| South American Indian | 88 | 0.1% |
| Spaniard | 453 | 0.7% |
| Spanish | 120 | 0.2% |
| Sri Lankan | 313 | 0.5% |
| Subsaharan African | 409 | 0.6% |
| Sudanese | 12 | 0.0% |
| Swedish | 662 | 1.1% |
| Swiss | 289 | 0.5% |
| Syrian | 70 | 0.1% |
| Thai | 2,920 | 4.7% |
| Tohono O'Odham | 8 | 0.0% |
| Trinidadian and Tobagonian | 9 | 0.0% |
| Turkish | 110 | 0.2% |
| Ugandan | 16 | 0.0% |
| Ukrainian | 610 | 1.0% |
| Venezuelan | 221 | 0.4% |
| Welsh | 308 | 0.5% |
| West Indian | 23 | 0.0% |
| Yaqui | 13 | 0.0% |
| Zimbabwean | 18 | 0.0% | View All 121 Rows |
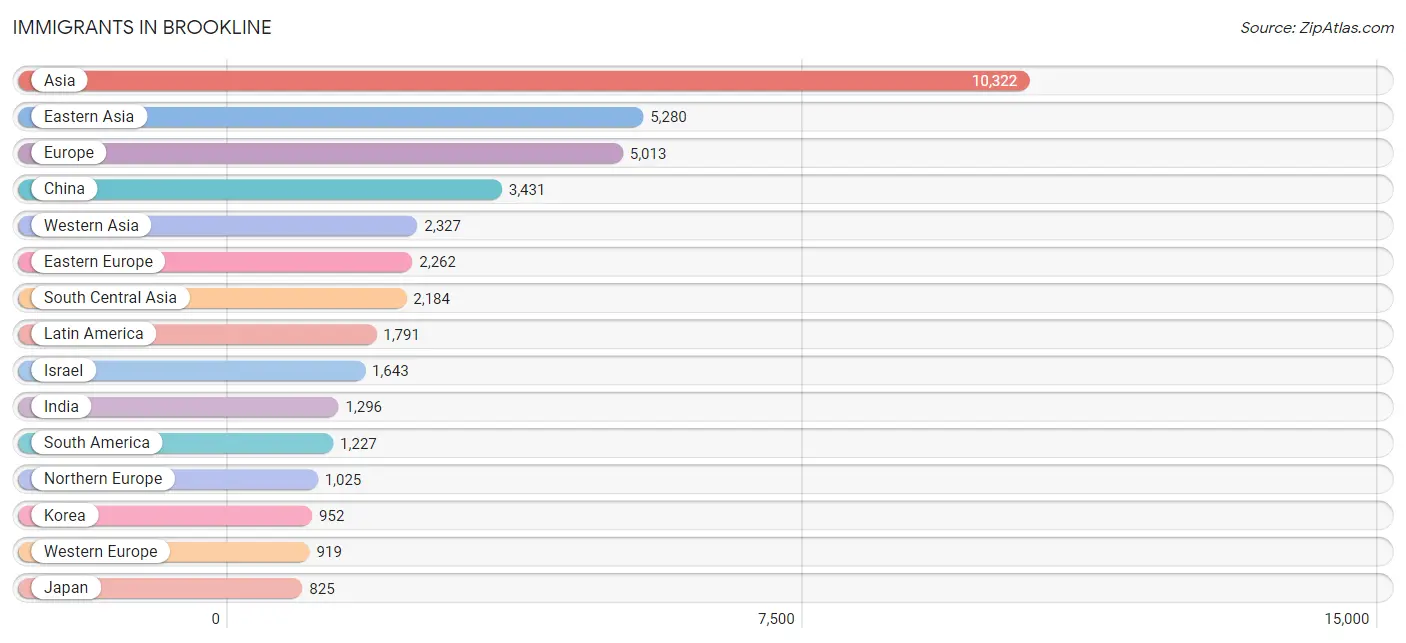
Immigrants in Brookline
The most numerous immigrant groups reported in Brookline came from Asia (10,322 | 16.5%), Eastern Asia (5,280 | 8.4%), Europe (5,013 | 8.0%), China (3,431 | 5.5%), and Western Asia (2,327 | 3.7%), together accounting for 42.1% of all Brookline residents.
| Immigration Origin | # Population | % Population |
| Afghanistan | 46 | 0.1% |
| Africa | 581 | 0.9% |
| Albania | 235 | 0.4% |
| Argentina | 149 | 0.2% |
| Asia | 10,322 | 16.5% |
| Austria | 51 | 0.1% |
| Bangladesh | 11 | 0.0% |
| Belarus | 115 | 0.2% |
| Belgium | 60 | 0.1% |
| Bolivia | 36 | 0.1% |
| Brazil | 399 | 0.6% |
| Bulgaria | 98 | 0.2% |
| Cambodia | 59 | 0.1% |
| Canada | 639 | 1.0% |
| Caribbean | 375 | 0.6% |
| Central America | 189 | 0.3% |
| Chile | 81 | 0.1% |
| China | 3,431 | 5.5% |
| Colombia | 358 | 0.6% |
| Croatia | 35 | 0.1% |
| Cuba | 146 | 0.2% |
| Czechoslovakia | 40 | 0.1% |
| Denmark | 186 | 0.3% |
| Dominican Republic | 145 | 0.2% |
| Eastern Africa | 173 | 0.3% |
| Eastern Asia | 5,280 | 8.4% |
| Eastern Europe | 2,262 | 3.6% |
| Ecuador | 21 | 0.0% |
| Egypt | 130 | 0.2% |
| El Salvador | 1 | 0.0% |
| England | 138 | 0.2% |
| Ethiopia | 95 | 0.2% |
| Europe | 5,013 | 8.0% |
| France | 256 | 0.4% |
| Germany | 307 | 0.5% |
| Ghana | 28 | 0.0% |
| Greece | 76 | 0.1% |
| Guatemala | 23 | 0.0% |
| Haiti | 65 | 0.1% |
| Hong Kong | 308 | 0.5% |
| Hungary | 93 | 0.2% |
| India | 1,296 | 2.1% |
| Indonesia | 12 | 0.0% |
| Iran | 327 | 0.5% |
| Iraq | 16 | 0.0% |
| Ireland | 132 | 0.2% |
| Israel | 1,643 | 2.6% |
| Italy | 327 | 0.5% |
| Jamaica | 10 | 0.0% |
| Japan | 825 | 1.3% |
| Jordan | 144 | 0.2% |
| Kazakhstan | 7 | 0.0% |
| Kenya | 38 | 0.1% |
| Korea | 952 | 1.5% |
| Kuwait | 14 | 0.0% |
| Latin America | 1,791 | 2.9% |
| Latvia | 83 | 0.1% |
| Lebanon | 75 | 0.1% |
| Liberia | 16 | 0.0% |
| Lithuania | 21 | 0.0% |
| Malaysia | 67 | 0.1% |
| Mexico | 154 | 0.3% |
| Middle Africa | 19 | 0.0% |
| Morocco | 50 | 0.1% |
| Nepal | 63 | 0.1% |
| Netherlands | 159 | 0.3% |
| Northern Africa | 233 | 0.4% |
| Northern Europe | 1,025 | 1.6% |
| Norway | 12 | 0.0% |
| Pakistan | 287 | 0.5% |
| Panama | 11 | 0.0% |
| Peru | 92 | 0.2% |
| Philippines | 68 | 0.1% |
| Poland | 139 | 0.2% |
| Portugal | 73 | 0.1% |
| Romania | 146 | 0.2% |
| Russia | 576 | 0.9% |
| Saudi Arabia | 65 | 0.1% |
| Serbia | 56 | 0.1% |
| Singapore | 68 | 0.1% |
| South Africa | 76 | 0.1% |
| South America | 1,227 | 2.0% |
| South Central Asia | 2,184 | 3.5% |
| South Eastern Asia | 515 | 0.8% |
| Southern Europe | 807 | 1.3% |
| Spain | 331 | 0.5% |
| Sri Lanka | 118 | 0.2% |
| Sudan | 45 | 0.1% |
| Sweden | 5 | 0.0% |
| Switzerland | 86 | 0.1% |
| Taiwan | 301 | 0.5% |
| Thailand | 128 | 0.2% |
| Turkey | 98 | 0.2% |
| Uganda | 22 | 0.0% |
| Ukraine | 448 | 0.7% |
| Uzbekistan | 29 | 0.1% |
| Venezuela | 91 | 0.2% |
| Vietnam | 79 | 0.1% |
| Western Africa | 80 | 0.1% |
| Western Asia | 2,327 | 3.7% |
| Western Europe | 919 | 1.5% |
| Zaire | 19 | 0.0% |
| Zimbabwe | 18 | 0.0% | View All 103 Rows |
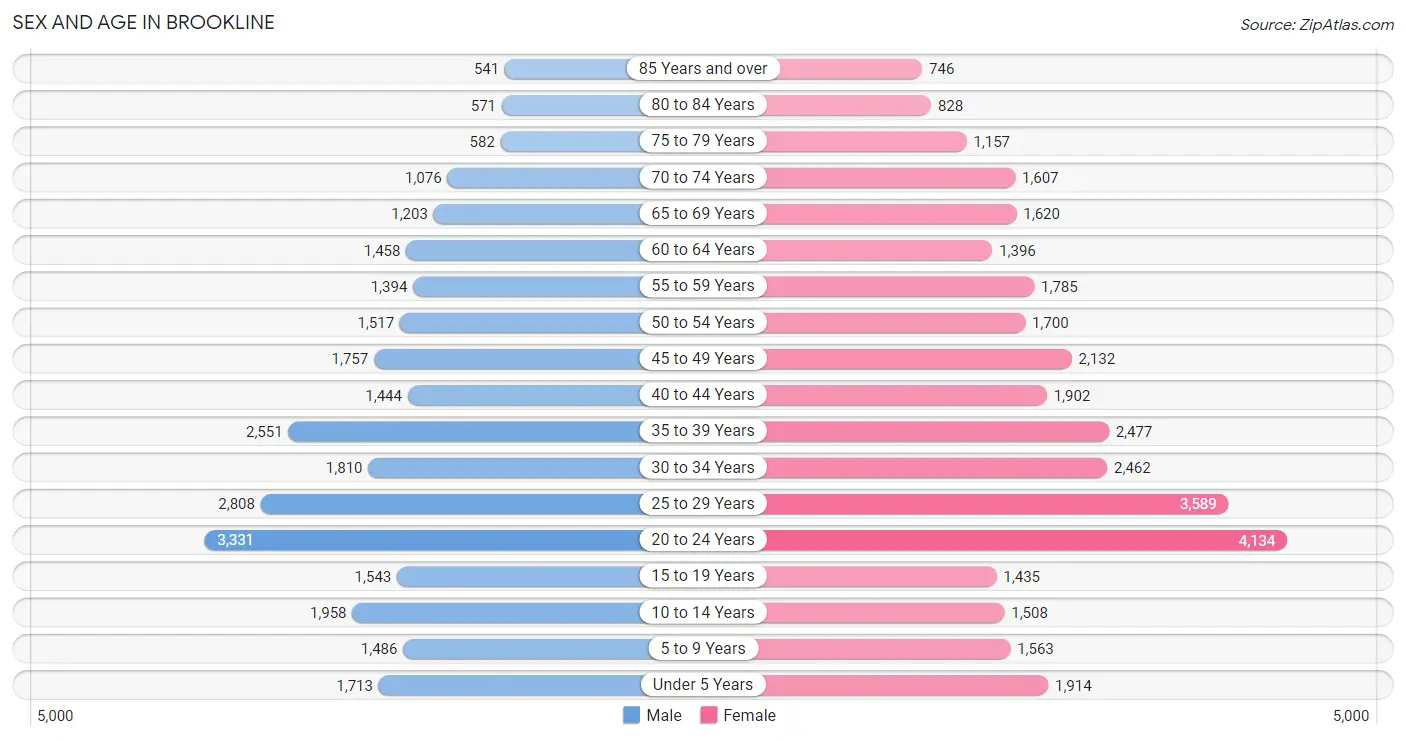
Sex and Age in Brookline
Sex and Age in Brookline
The most populous age groups in Brookline are 20 to 24 Years (3,331 | 11.6%) for men and 20 to 24 Years (4,134 | 12.2%) for women.
| Age Bracket | Male | Female |
| Under 5 Years | 1,713 (6.0%) | 1,914 (5.6%) |
| 5 to 9 Years | 1,486 (5.2%) | 1,563 (4.6%) |
| 10 to 14 Years | 1,958 (6.8%) | 1,508 (4.4%) |
| 15 to 19 Years | 1,543 (5.4%) | 1,435 (4.2%) |
| 20 to 24 Years | 3,331 (11.6%) | 4,134 (12.2%) |
| 25 to 29 Years | 2,808 (9.8%) | 3,589 (10.6%) |
| 30 to 34 Years | 1,810 (6.3%) | 2,462 (7.2%) |
| 35 to 39 Years | 2,551 (8.9%) | 2,477 (7.3%) |
| 40 to 44 Years | 1,444 (5.0%) | 1,902 (5.6%) |
| 45 to 49 Years | 1,757 (6.1%) | 2,132 (6.3%) |
| 50 to 54 Years | 1,517 (5.3%) | 1,700 (5.0%) |
| 55 to 59 Years | 1,394 (4.9%) | 1,785 (5.3%) |
| 60 to 64 Years | 1,458 (5.1%) | 1,396 (4.1%) |
| 65 to 69 Years | 1,203 (4.2%) | 1,620 (4.8%) |
| 70 to 74 Years | 1,076 (3.7%) | 1,607 (4.7%) |
| 75 to 79 Years | 582 (2.0%) | 1,157 (3.4%) |
| 80 to 84 Years | 571 (2.0%) | 828 (2.4%) |
| 85 Years and over | 541 (1.9%) | 746 (2.2%) |
| Total | 28,743 (100.0%) | 33,955 (100.0%) |
Families and Households in Brookline
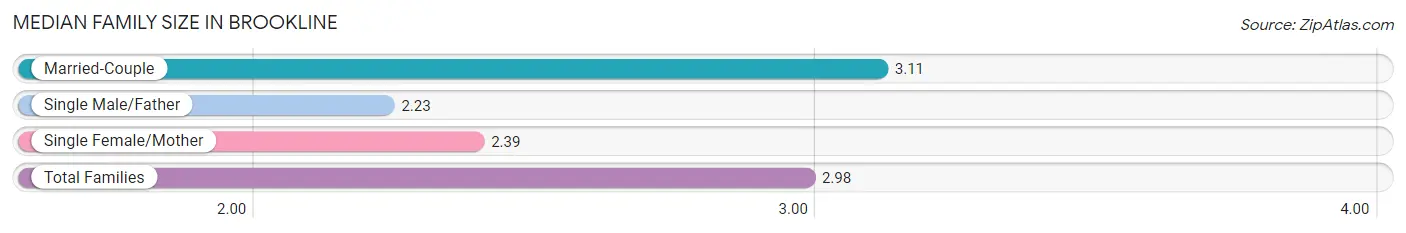
Median Family Size in Brookline
The median family size in Brookline is 2.98 persons per family, with married-couple families (11,103 | 83.8%) accounting for the largest median family size of 3.11 persons per family. On the other hand, single male/father families (540 | 4.1%) represent the smallest median family size with 2.23 persons per family.
| Family Type | # Families | Family Size |
| Married-Couple | 11,103 (83.8%) | 3.11 |
| Single Male/Father | 540 (4.1%) | 2.23 |
| Single Female/Mother | 1,601 (12.1%) | 2.39 |
| Total Families | 13,244 (100.0%) | 2.98 |
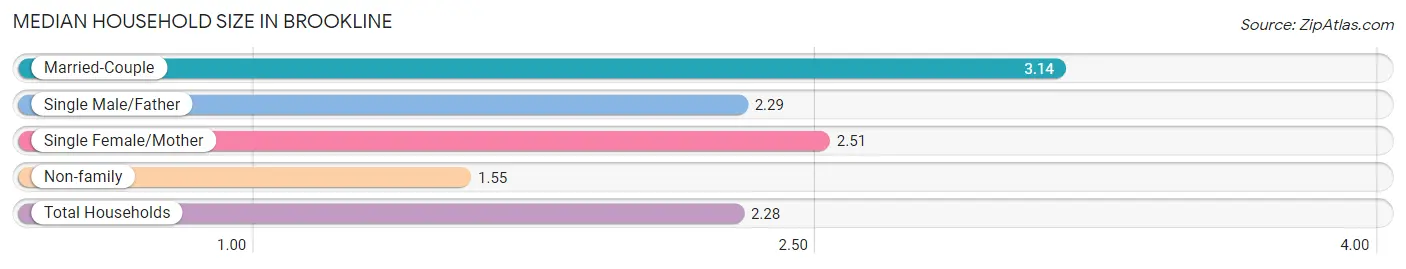
Median Household Size in Brookline
The median household size in Brookline is 2.28 persons per household, with married-couple households (11,103 | 41.2%) accounting for the largest median household size of 3.14 persons per household. non-family households (13,675 | 50.8%) represent the smallest median household size with 1.55 persons per household.
| Household Type | # Households | Household Size |
| Married-Couple | 11,103 (41.2%) | 3.14 |
| Single Male/Father | 540 (2.0%) | 2.29 |
| Single Female/Mother | 1,601 (5.9%) | 2.51 |
| Non-family | 13,675 (50.8%) | 1.55 |
| Total Households | 26,919 (100.0%) | 2.28 |
Household Size by Marriage Status in Brookline
Out of a total of 26,919 households in Brookline, 13,244 (49.2%) are family households, while 13,675 (50.8%) are nonfamily households. The most numerous type of family households are 2-person households, comprising 6,157, and the most common type of nonfamily households are 1-person households, comprising 8,677.
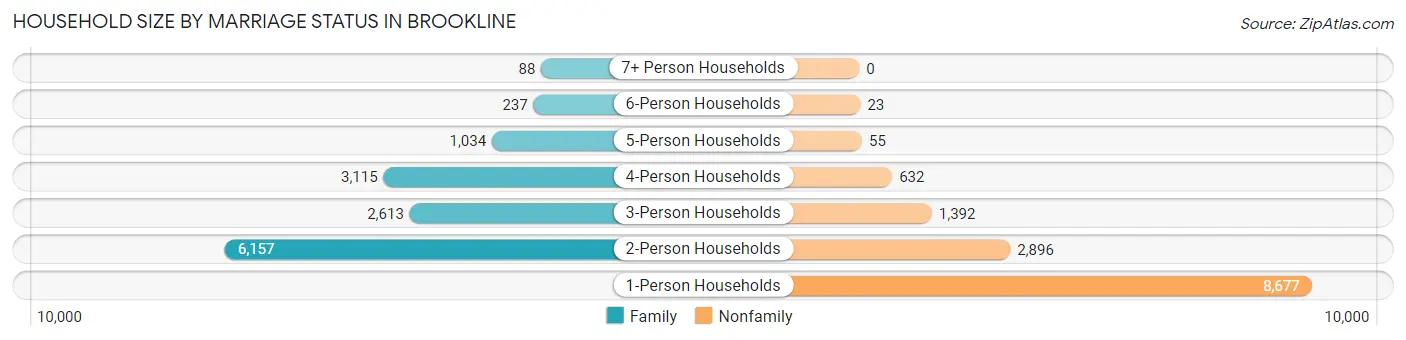
| Household Size | Family Households | Nonfamily Households |
| 1-Person Households | - | 8,677 (32.2%) |
| 2-Person Households | 6,157 (22.9%) | 2,896 (10.8%) |
| 3-Person Households | 2,613 (9.7%) | 1,392 (5.2%) |
| 4-Person Households | 3,115 (11.6%) | 632 (2.4%) |
| 5-Person Households | 1,034 (3.8%) | 55 (0.2%) |
| 6-Person Households | 237 (0.9%) | 23 (0.1%) |
| 7+ Person Households | 88 (0.3%) | 0 (0.0%) |
| Total | 13,244 (49.2%) | 13,675 (50.8%) |
Female Fertility in Brookline
Fertility by Age in Brookline
Average fertility rate in Brookline is 38.0 births per 1,000 women. Women in the age bracket of 35 to 50 years have the highest fertility rate with 53.0 births per 1,000 women. Women in the age bracket of 35 to 50 years acount for 52.9% of all women with births.
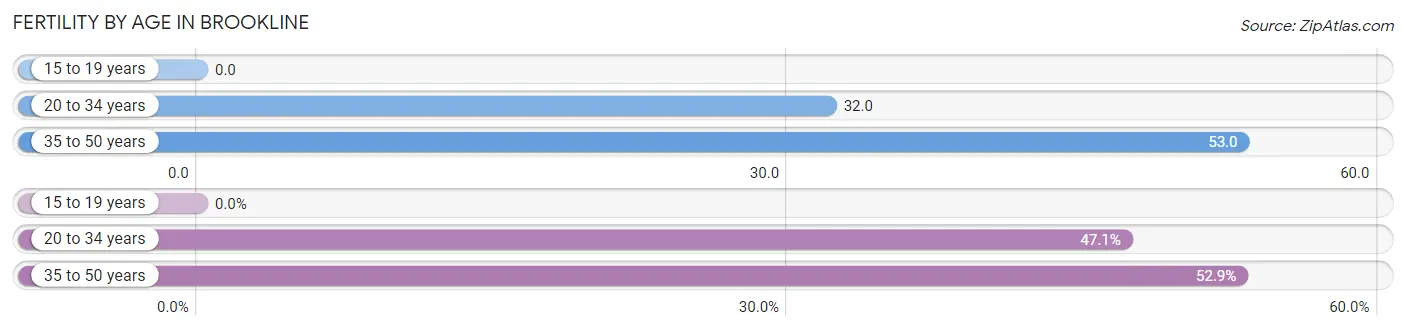
| Age Bracket | Women with Births | Births / 1,000 Women |
| 15 to 19 years | 0 (0.0%) | 0.0 |
| 20 to 34 years | 328 (47.1%) | 32.0 |
| 35 to 50 years | 369 (52.9%) | 53.0 |
| Total | 697 (100.0%) | 38.0 |
Fertility by Age by Marriage Status in Brookline
93.8% of women with births (697) in Brookline are married. The highest percentage of unmarried women with births falls into 20 to 34 years age bracket with 13.1% of them unmarried at the time of birth, while the lowest percentage of unmarried women with births belong to 35 to 50 years age bracket with 0.0% of them unmarried.
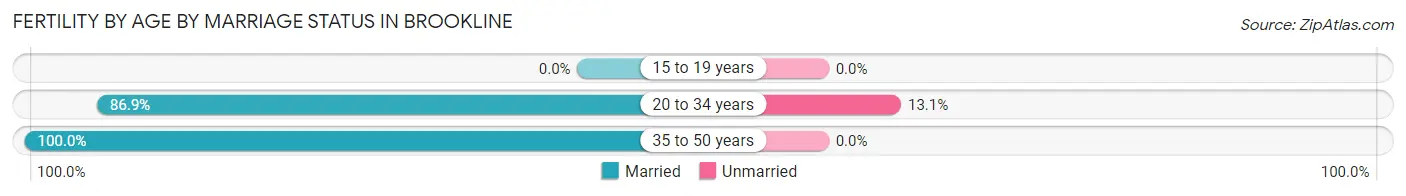
| Age Bracket | Married | Unmarried |
| 15 to 19 years | 0 (0.0%) | 0 (0.0%) |
| 20 to 34 years | 285 (86.9%) | 43 (13.1%) |
| 35 to 50 years | 369 (100.0%) | 0 (0.0%) |
| Total | 654 (93.8%) | 43 (6.2%) |
Fertility by Education in Brookline
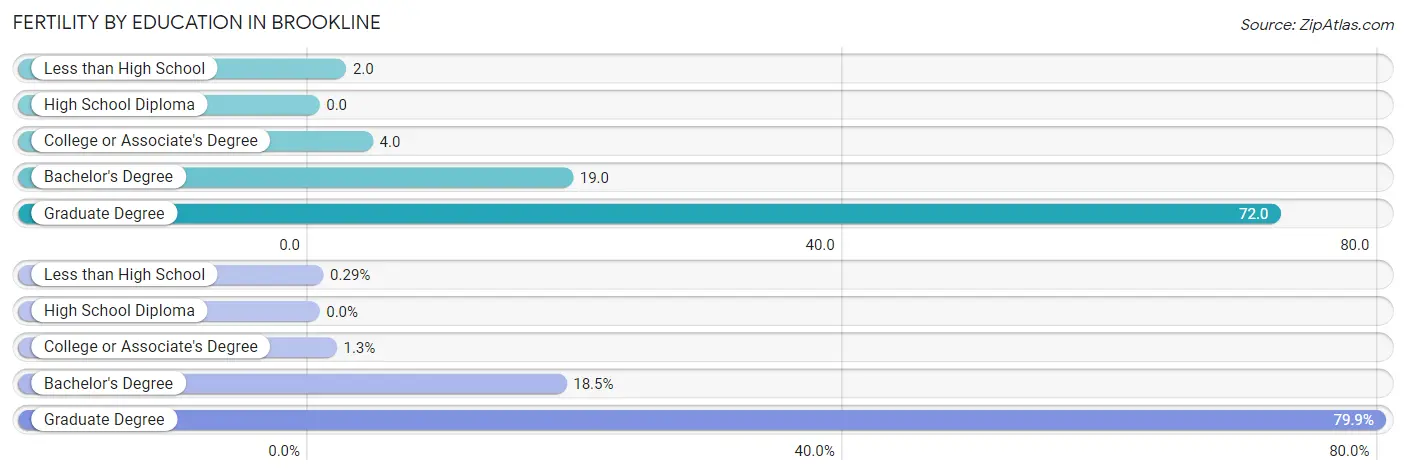
| Educational Attainment | Women with Births | Births / 1,000 Women |
| Less than High School | 2 (0.3%) | 2.0 |
| High School Diploma | 0 (0.0%) | 0.0 |
| College or Associate's Degree | 9 (1.3%) | 4.0 |
| Bachelor's Degree | 129 (18.5%) | 19.0 |
| Graduate Degree | 557 (79.9%) | 72.0 |
| Total | 697 (100.0%) | 38.0 |
Fertility by Education by Marriage Status in Brookline
6.2% of women with births in Brookline are unmarried. Women with the educational attainment of college or associate's degree are most likely to be married with 100.0% of them married at childbirth, while women with the educational attainment of less than high school are least likely to be married with 100.0% of them unmarried at childbirth.
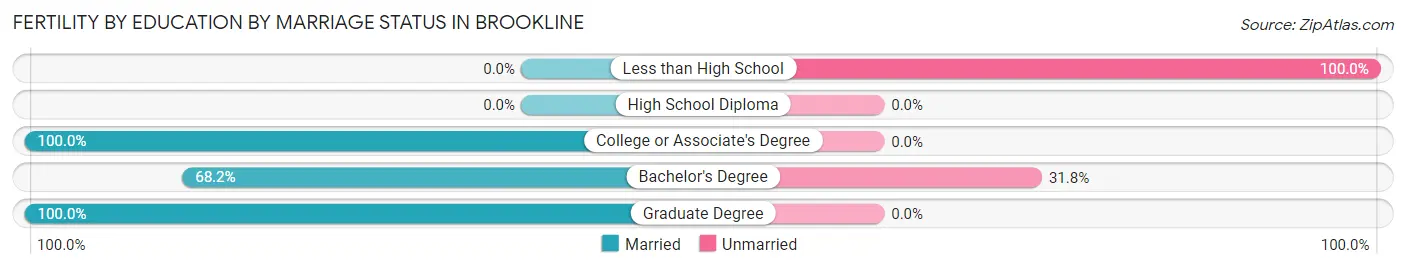
| Educational Attainment | Married | Unmarried |
| Less than High School | 0 (0.0%) | 2 (100.0%) |
| High School Diploma | 0 (0.0%) | 0 (0.0%) |
| College or Associate's Degree | 9 (100.0%) | 0 (0.0%) |
| Bachelor's Degree | 88 (68.2%) | 41 (31.8%) |
| Graduate Degree | 557 (100.0%) | 0 (0.0%) |
| Total | 654 (93.8%) | 43 (6.2%) |
Employment Characteristics in Brookline
Employment by Class of Employer in Brookline
Among the 35,474 employed individuals in Brookline, private company employees (19,146 | 54.0%), not-for-profit organizations (10,432 | 29.4%), and self-employed (not incorporated) (1,979 | 5.6%) make up the most common classes of employment.
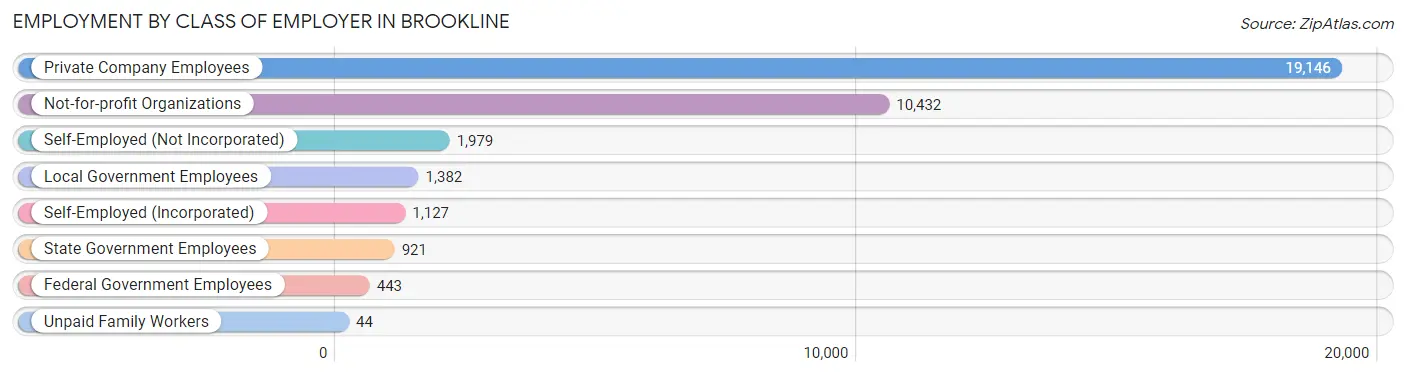
| Employer Class | # Employees | % Employees |
| Private Company Employees | 19,146 | 54.0% |
| Self-Employed (Incorporated) | 1,127 | 3.2% |
| Self-Employed (Not Incorporated) | 1,979 | 5.6% |
| Not-for-profit Organizations | 10,432 | 29.4% |
| Local Government Employees | 1,382 | 3.9% |
| State Government Employees | 921 | 2.6% |
| Federal Government Employees | 443 | 1.3% |
| Unpaid Family Workers | 44 | 0.1% |
| Total | 35,474 | 100.0% |
Employment Status by Age in Brookline
According to the labor force statistics for Brookline, out of the total population over 16 years of age (51,940), 71.8% or 37,293 individuals are in the labor force, with 3.5% or 1,305 of them unemployed. The age group with the highest labor force participation rate is 30 to 34 years, with 90.9% or 3,883 individuals in the labor force. Within the labor force, the 16 to 19 years age range has the highest percentage of unemployed individuals, with 14.1% or 71 of them being unemployed.
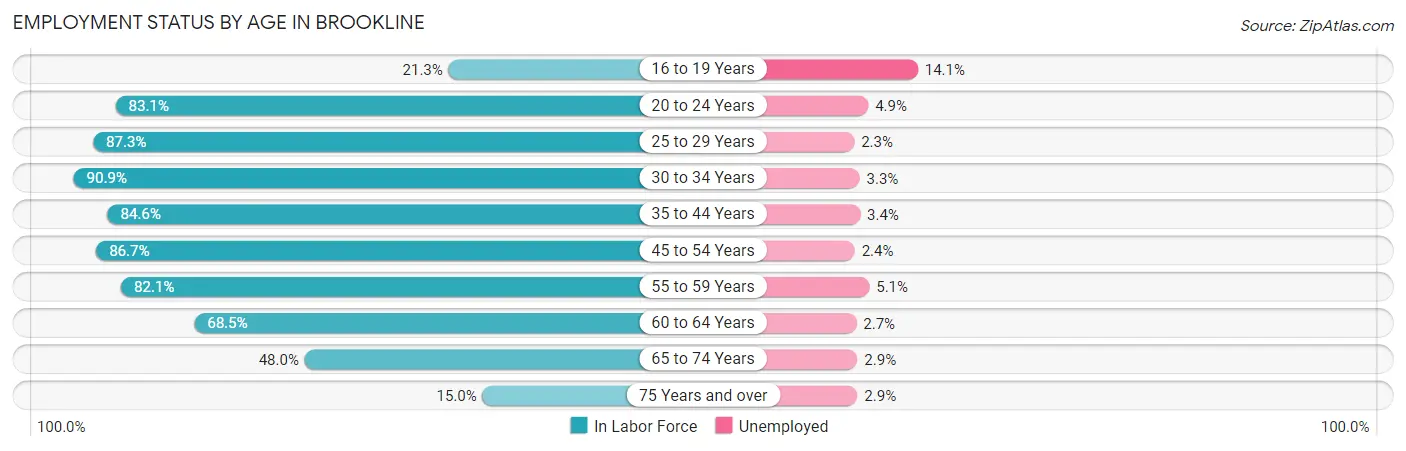
| Age Bracket | In Labor Force | Unemployed |
| 16 to 19 Years | 503 (21.3%) | 71 (14.1%) |
| 20 to 24 Years | 6,203 (83.1%) | 304 (4.9%) |
| 25 to 29 Years | 5,585 (87.3%) | 128 (2.3%) |
| 30 to 34 Years | 3,883 (90.9%) | 128 (3.3%) |
| 35 to 44 Years | 7,084 (84.6%) | 241 (3.4%) |
| 45 to 54 Years | 6,161 (86.7%) | 148 (2.4%) |
| 55 to 59 Years | 2,610 (82.1%) | 133 (5.1%) |
| 60 to 64 Years | 1,955 (68.5%) | 53 (2.7%) |
| 65 to 74 Years | 2,643 (48.0%) | 77 (2.9%) |
| 75 Years and over | 664 (15.0%) | 19 (2.9%) |
| Total | 37,293 (71.8%) | 1,305 (3.5%) |
Employment Status by Educational Attainment in Brookline
According to labor force statistics for Brookline, 84.8% of individuals (27,290) out of the total population between 25 and 64 years of age (32,182) are in the labor force, with 3.0% or 819 of them being unemployed. The group with the highest labor force participation rate are those with the educational attainment of bachelor's degree or higher, with 88.6% or 24,995 individuals in the labor force. Within the labor force, individuals with high school diploma education have the highest percentage of unemployment, with 19.8% or 148 of them being unemployed.
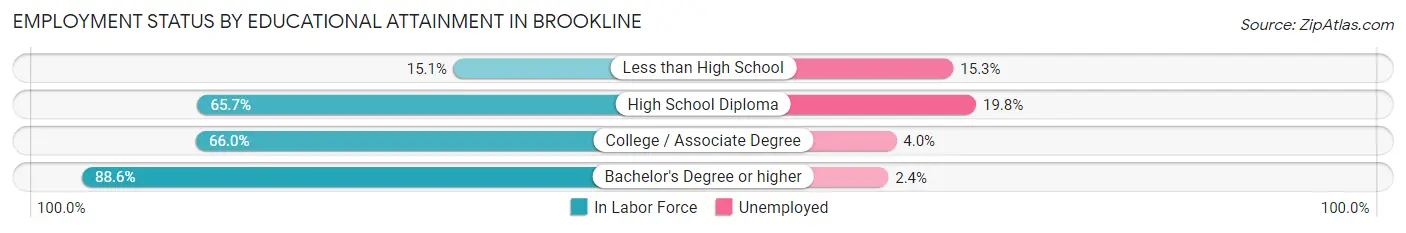
| Educational Attainment | In Labor Force | Unemployed |
| Less than High School | 98 (15.1%) | 99 (15.3%) |
| High School Diploma | 748 (65.7%) | 225 (19.8%) |
| College / Associate Degree | 1,442 (66.0%) | 87 (4.0%) |
| Bachelor's Degree or higher | 24,995 (88.6%) | 677 (2.4%) |
| Total | 27,290 (84.8%) | 965 (3.0%) |
Employment Occupations by Sex in Brookline
Management, Business, Science and Arts Occupations
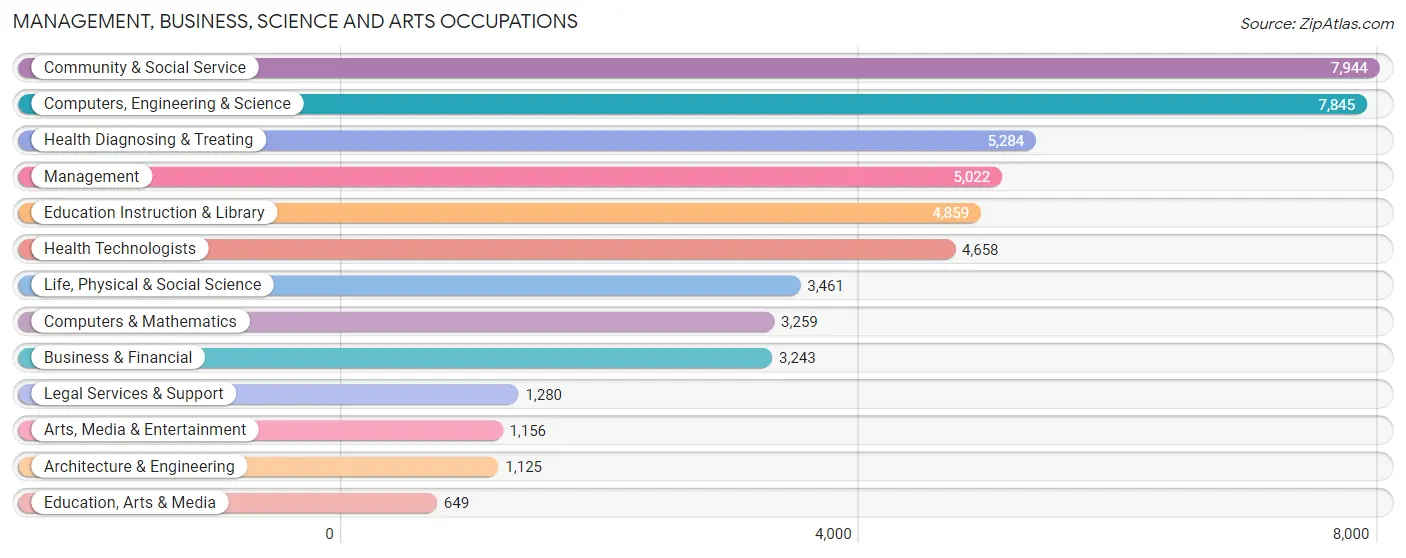
The most common Management, Business, Science and Arts occupations in Brookline are Community & Social Service (7,944 | 22.1%), Computers, Engineering & Science (7,845 | 21.8%), Health Diagnosing & Treating (5,284 | 14.7%), Management (5,022 | 14.0%), and Education Instruction & Library (4,859 | 13.5%).
Management, Business, Science and Arts Occupations by Sex
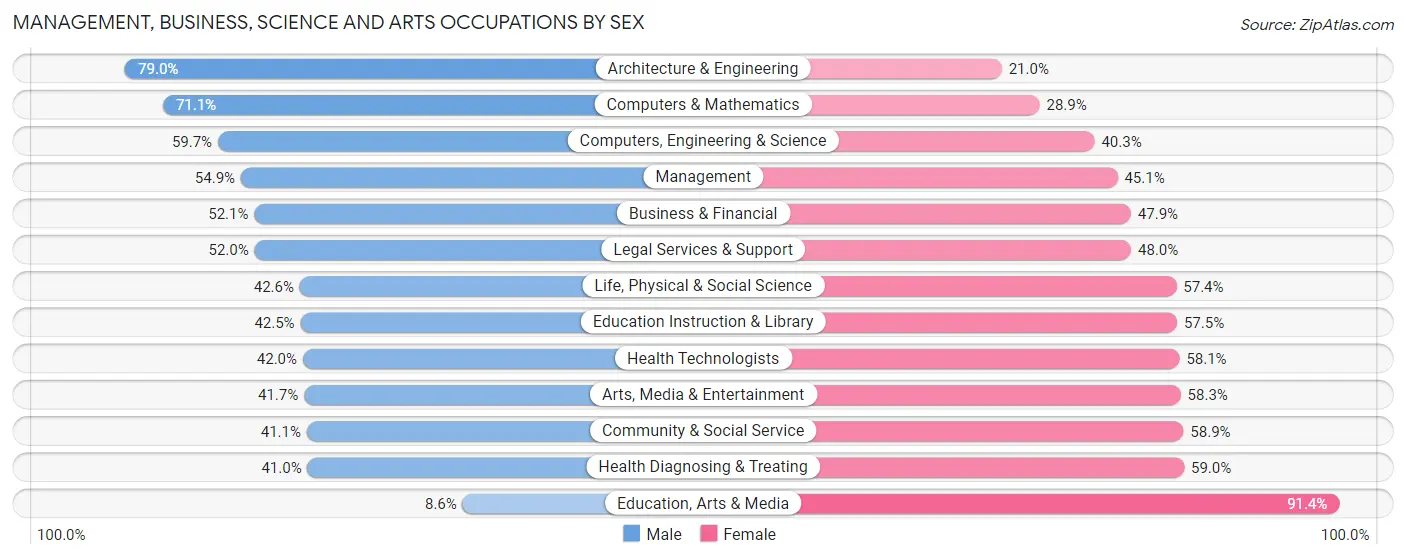
Within the Management, Business, Science and Arts occupations in Brookline, the most male-oriented occupations are Architecture & Engineering (79.0%), Computers & Mathematics (71.1%), and Computers, Engineering & Science (59.7%), while the most female-oriented occupations are Education, Arts & Media (91.4%), Health Diagnosing & Treating (59.0%), and Community & Social Service (58.9%).
| Occupation | Male | Female |
| Management | 2,756 (54.9%) | 2,266 (45.1%) |
| Business & Financial | 1,689 (52.1%) | 1,554 (47.9%) |
| Computers, Engineering & Science | 4,681 (59.7%) | 3,164 (40.3%) |
| Computers & Mathematics | 2,318 (71.1%) | 941 (28.9%) |
| Architecture & Engineering | 889 (79.0%) | 236 (21.0%) |
| Life, Physical & Social Science | 1,474 (42.6%) | 1,987 (57.4%) |
| Community & Social Service | 3,267 (41.1%) | 4,677 (58.9%) |
| Education, Arts & Media | 56 (8.6%) | 593 (91.4%) |
| Legal Services & Support | 666 (52.0%) | 614 (48.0%) |
| Education Instruction & Library | 2,063 (42.5%) | 2,796 (57.5%) |
| Arts, Media & Entertainment | 482 (41.7%) | 674 (58.3%) |
| Health Diagnosing & Treating | 2,166 (41.0%) | 3,118 (59.0%) |
| Health Technologists | 1,954 (41.9%) | 2,704 (58.1%) |
| Total (Category) | 14,559 (49.6%) | 14,779 (50.4%) |
| Total (Overall) | 17,065 (47.4%) | 18,901 (52.5%) |
Services Occupations
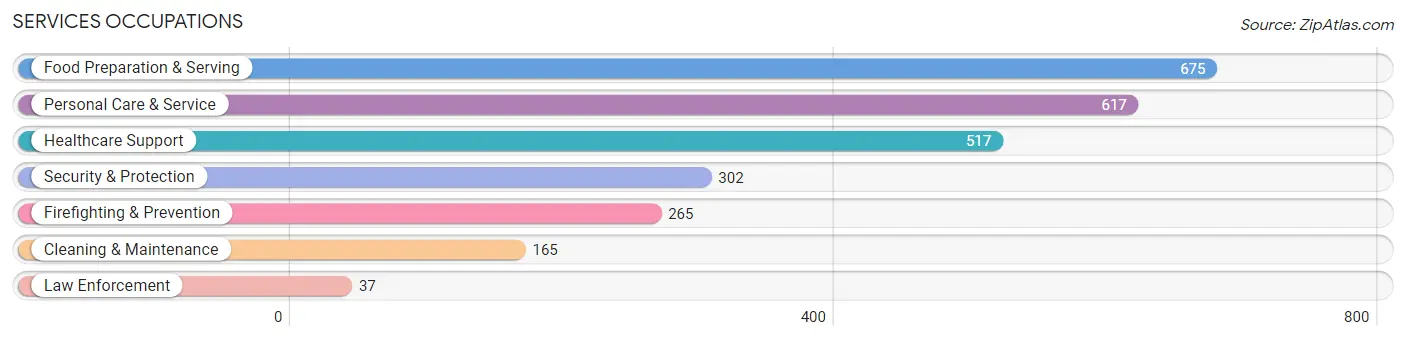
The most common Services occupations in Brookline are Food Preparation & Serving (675 | 1.9%), Personal Care & Service (617 | 1.7%), Healthcare Support (517 | 1.4%), Security & Protection (302 | 0.8%), and Firefighting & Prevention (265 | 0.7%).
Services Occupations by Sex
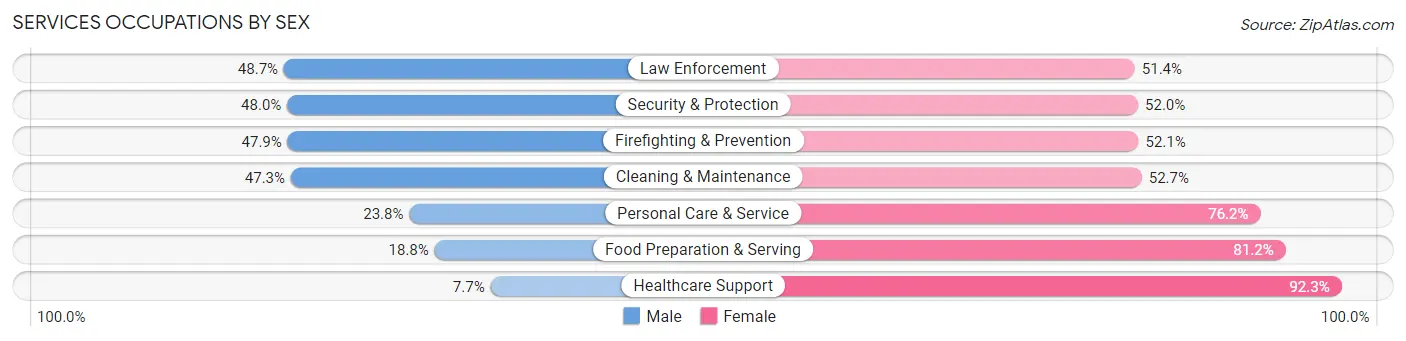
Within the Services occupations in Brookline, the most male-oriented occupations are Law Enforcement (48.6%), Security & Protection (48.0%), and Firefighting & Prevention (47.9%), while the most female-oriented occupations are Healthcare Support (92.3%), Food Preparation & Serving (81.2%), and Personal Care & Service (76.2%).
| Occupation | Male | Female |
| Healthcare Support | 40 (7.7%) | 477 (92.3%) |
| Security & Protection | 145 (48.0%) | 157 (52.0%) |
| Firefighting & Prevention | 127 (47.9%) | 138 (52.1%) |
| Law Enforcement | 18 (48.6%) | 19 (51.3%) |
| Food Preparation & Serving | 127 (18.8%) | 548 (81.2%) |
| Cleaning & Maintenance | 78 (47.3%) | 87 (52.7%) |
| Personal Care & Service | 147 (23.8%) | 470 (76.2%) |
| Total (Category) | 537 (23.6%) | 1,739 (76.4%) |
| Total (Overall) | 17,065 (47.4%) | 18,901 (52.5%) |
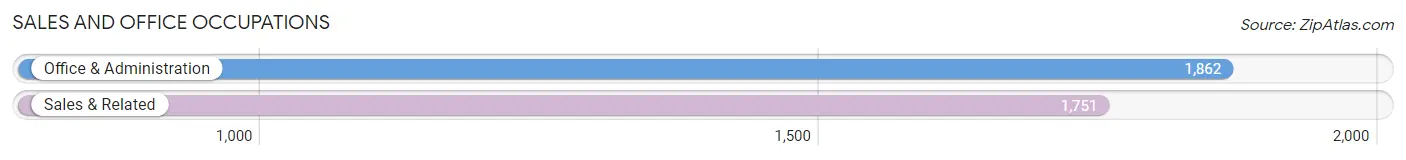
Sales and Office Occupations
The most common Sales and Office occupations in Brookline are Office & Administration (1,862 | 5.2%), and Sales & Related (1,751 | 4.9%).
Sales and Office Occupations by Sex
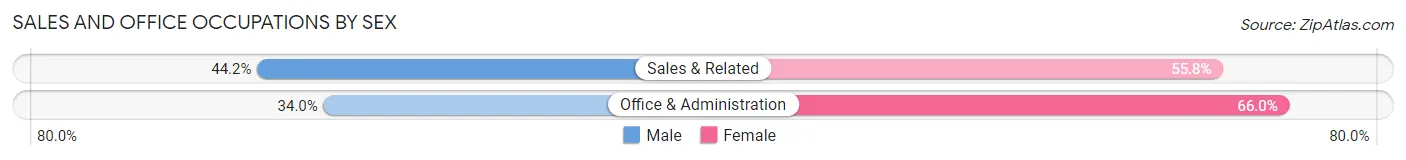
| Occupation | Male | Female |
| Sales & Related | 774 (44.2%) | 977 (55.8%) |
| Office & Administration | 633 (34.0%) | 1,229 (66.0%) |
| Total (Category) | 1,407 (38.9%) | 2,206 (61.1%) |
| Total (Overall) | 17,065 (47.4%) | 18,901 (52.5%) |
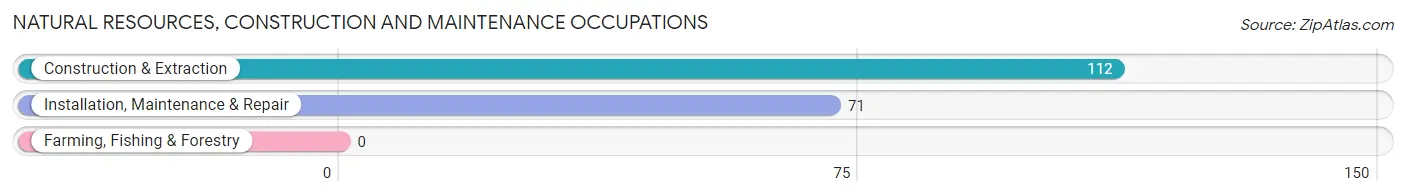
Natural Resources, Construction and Maintenance Occupations
The most common Natural Resources, Construction and Maintenance occupations in Brookline are Construction & Extraction (112 | 0.3%), and Installation, Maintenance & Repair (71 | 0.2%).
Natural Resources, Construction and Maintenance Occupations by Sex
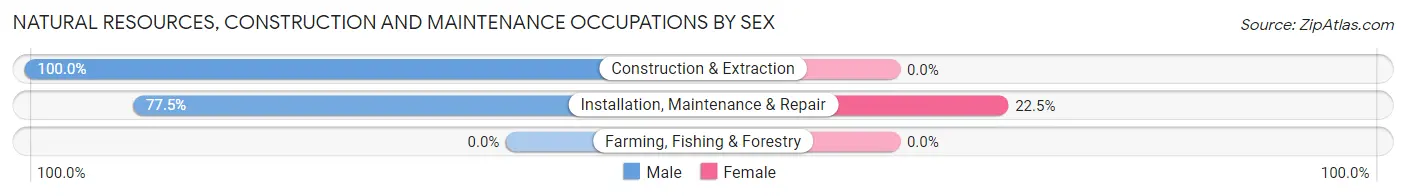
| Occupation | Male | Female |
| Farming, Fishing & Forestry | 0 (0.0%) | 0 (0.0%) |
| Construction & Extraction | 112 (100.0%) | 0 (0.0%) |
| Installation, Maintenance & Repair | 55 (77.5%) | 16 (22.5%) |
| Total (Category) | 167 (91.3%) | 16 (8.7%) |
| Total (Overall) | 17,065 (47.4%) | 18,901 (52.5%) |
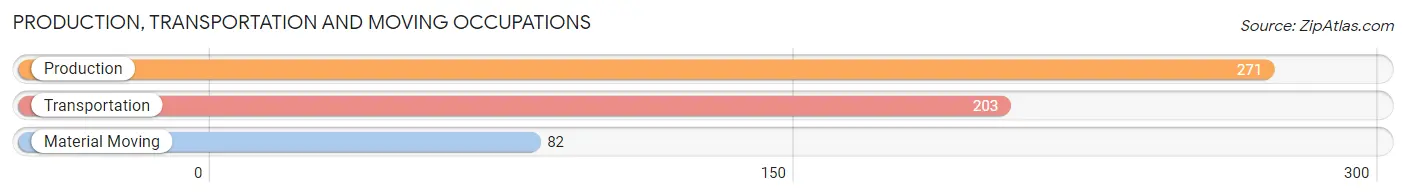
Production, Transportation and Moving Occupations
The most common Production, Transportation and Moving occupations in Brookline are Production (271 | 0.7%), Transportation (203 | 0.6%), and Material Moving (82 | 0.2%).
Production, Transportation and Moving Occupations by Sex
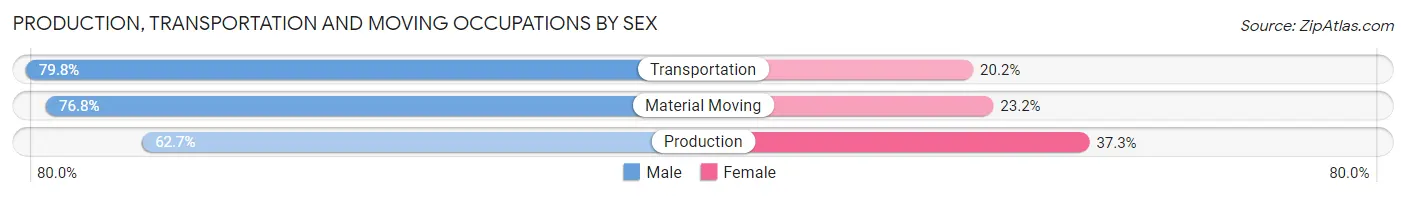
| Occupation | Male | Female |
| Production | 170 (62.7%) | 101 (37.3%) |
| Transportation | 162 (79.8%) | 41 (20.2%) |
| Material Moving | 63 (76.8%) | 19 (23.2%) |
| Total (Category) | 395 (71.0%) | 161 (29.0%) |
| Total (Overall) | 17,065 (47.4%) | 18,901 (52.5%) |
Employment Industries by Sex in Brookline
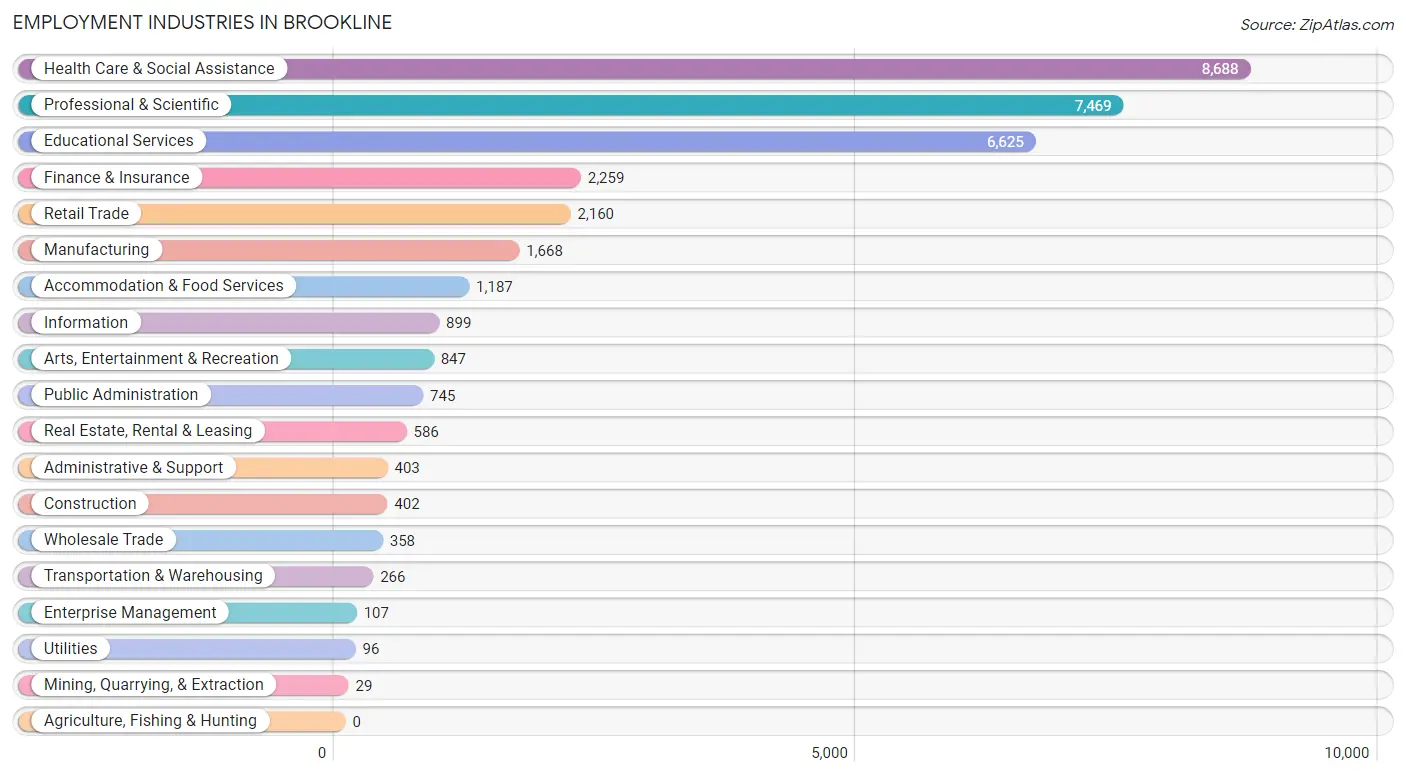
Employment Industries in Brookline
The major employment industries in Brookline include Health Care & Social Assistance (8,688 | 24.2%), Professional & Scientific (7,469 | 20.8%), Educational Services (6,625 | 18.4%), Finance & Insurance (2,259 | 6.3%), and Retail Trade (2,160 | 6.0%).
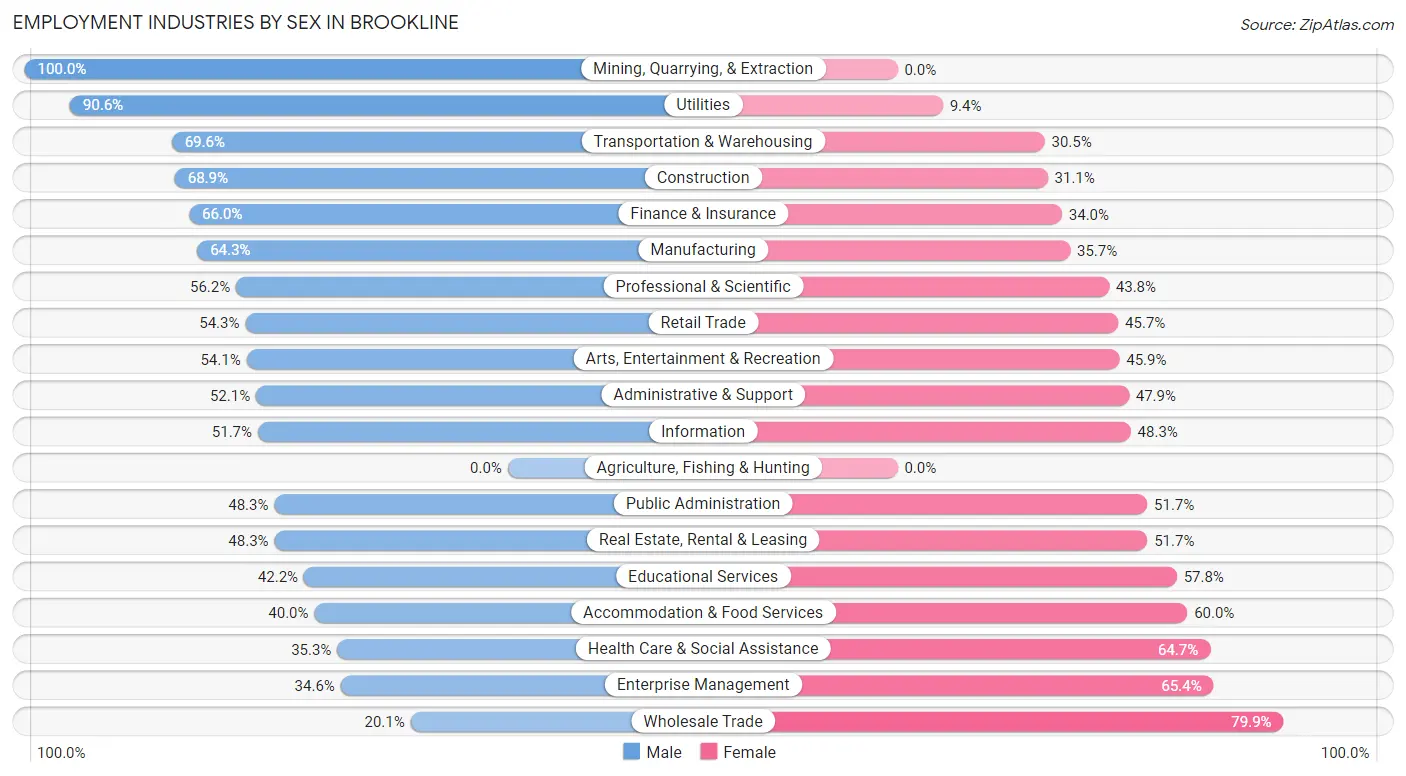
Employment Industries by Sex in Brookline
The Brookline industries that see more men than women are Mining, Quarrying, & Extraction (100.0%), Utilities (90.6%), and Transportation & Warehousing (69.6%), whereas the industries that tend to have a higher number of women are Wholesale Trade (79.9%), Enterprise Management (65.4%), and Health Care & Social Assistance (64.7%).
| Industry | Male | Female |
| Agriculture, Fishing & Hunting | 0 (0.0%) | 0 (0.0%) |
| Mining, Quarrying, & Extraction | 29 (100.0%) | 0 (0.0%) |
| Construction | 277 (68.9%) | 125 (31.1%) |
| Manufacturing | 1,072 (64.3%) | 596 (35.7%) |
| Wholesale Trade | 72 (20.1%) | 286 (79.9%) |
| Retail Trade | 1,173 (54.3%) | 987 (45.7%) |
| Transportation & Warehousing | 185 (69.6%) | 81 (30.4%) |
| Utilities | 87 (90.6%) | 9 (9.4%) |
| Information | 465 (51.7%) | 434 (48.3%) |
| Finance & Insurance | 1,490 (66.0%) | 769 (34.0%) |
| Real Estate, Rental & Leasing | 283 (48.3%) | 303 (51.7%) |
| Professional & Scientific | 4,200 (56.2%) | 3,269 (43.8%) |
| Enterprise Management | 37 (34.6%) | 70 (65.4%) |
| Administrative & Support | 210 (52.1%) | 193 (47.9%) |
| Educational Services | 2,795 (42.2%) | 3,830 (57.8%) |
| Health Care & Social Assistance | 3,067 (35.3%) | 5,621 (64.7%) |
| Arts, Entertainment & Recreation | 458 (54.1%) | 389 (45.9%) |
| Accommodation & Food Services | 475 (40.0%) | 712 (60.0%) |
| Public Administration | 360 (48.3%) | 385 (51.7%) |
| Total | 17,065 (47.4%) | 18,901 (52.5%) |
Education in Brookline
School Enrollment in Brookline
The most common levels of schooling among the 16,473 students in Brookline are college / undergraduate (3,553 | 21.6%), graduate / professional (3,174 | 19.3%), and middle school (2,883 | 17.5%).
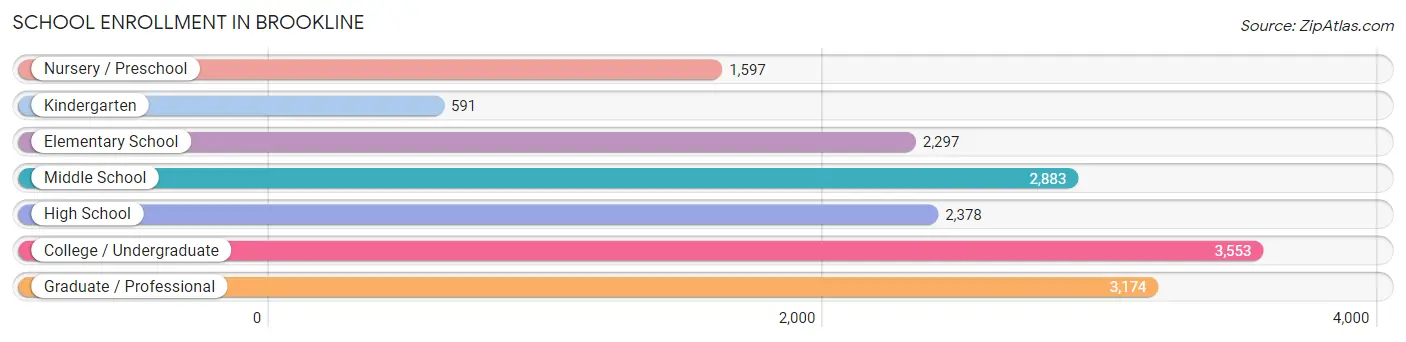
| School Level | # Students | % Students |
| Nursery / Preschool | 1,597 | 9.7% |
| Kindergarten | 591 | 3.6% |
| Elementary School | 2,297 | 13.9% |
| Middle School | 2,883 | 17.5% |
| High School | 2,378 | 14.4% |
| College / Undergraduate | 3,553 | 21.6% |
| Graduate / Professional | 3,174 | 19.3% |
| Total | 16,473 | 100.0% |
School Enrollment by Age by Funding Source in Brookline
Out of a total of 16,473 students who are enrolled in schools in Brookline, 8,269 (50.2%) attend a private institution, while the remaining 8,204 (49.8%) are enrolled in public schools. The age group of 25 to 34 year olds has the highest likelihood of being enrolled in private schools, with 1,750 (84.7% in the age bracket) enrolled. Conversely, the age group of 10 to 14 year olds has the lowest likelihood of being enrolled in a private school, with 2,921 (84.5% in the age bracket) attending a public institution.
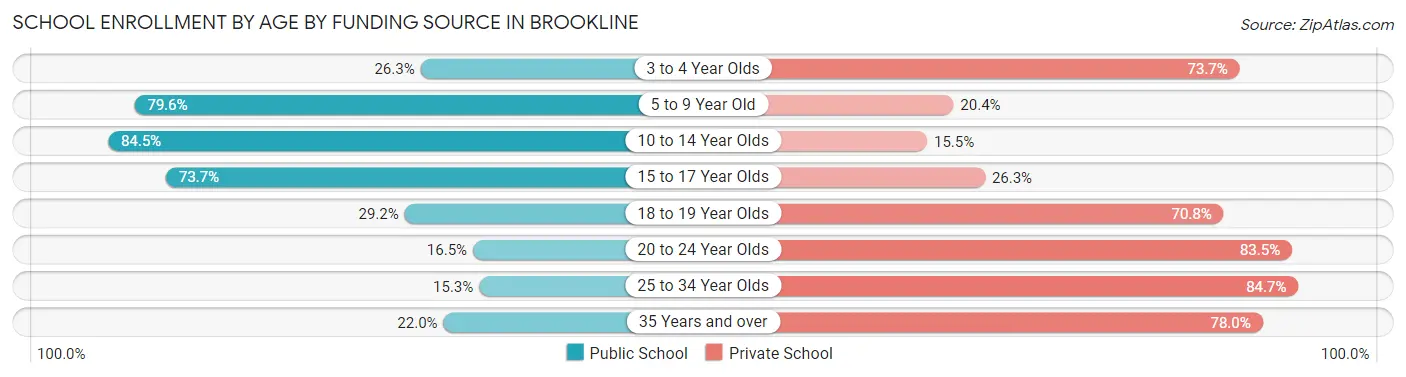
| Age Bracket | Public School | Private School |
| 3 to 4 Year Olds | 348 (26.3%) | 977 (73.7%) |
| 5 to 9 Year Old | 2,281 (79.6%) | 586 (20.4%) |
| 10 to 14 Year Olds | 2,921 (84.5%) | 537 (15.5%) |
| 15 to 17 Year Olds | 1,353 (73.7%) | 483 (26.3%) |
| 18 to 19 Year Olds | 321 (29.2%) | 777 (70.8%) |
| 20 to 24 Year Olds | 521 (16.5%) | 2,637 (83.5%) |
| 25 to 34 Year Olds | 317 (15.3%) | 1,750 (84.7%) |
| 35 Years and over | 146 (22.0%) | 518 (78.0%) |
| Total | 8,204 (49.8%) | 8,269 (50.2%) |
Educational Attainment by Field of Study in Brookline
Bio, nature & agricultural (5,400 | 13.6%), social sciences (5,165 | 13.0%), business (3,714 | 9.3%), engineering (3,616 | 9.1%), and liberal arts & history (3,014 | 7.6%) are the most common fields of study among 39,837 individuals in Brookline who have obtained a bachelor's degree or higher.
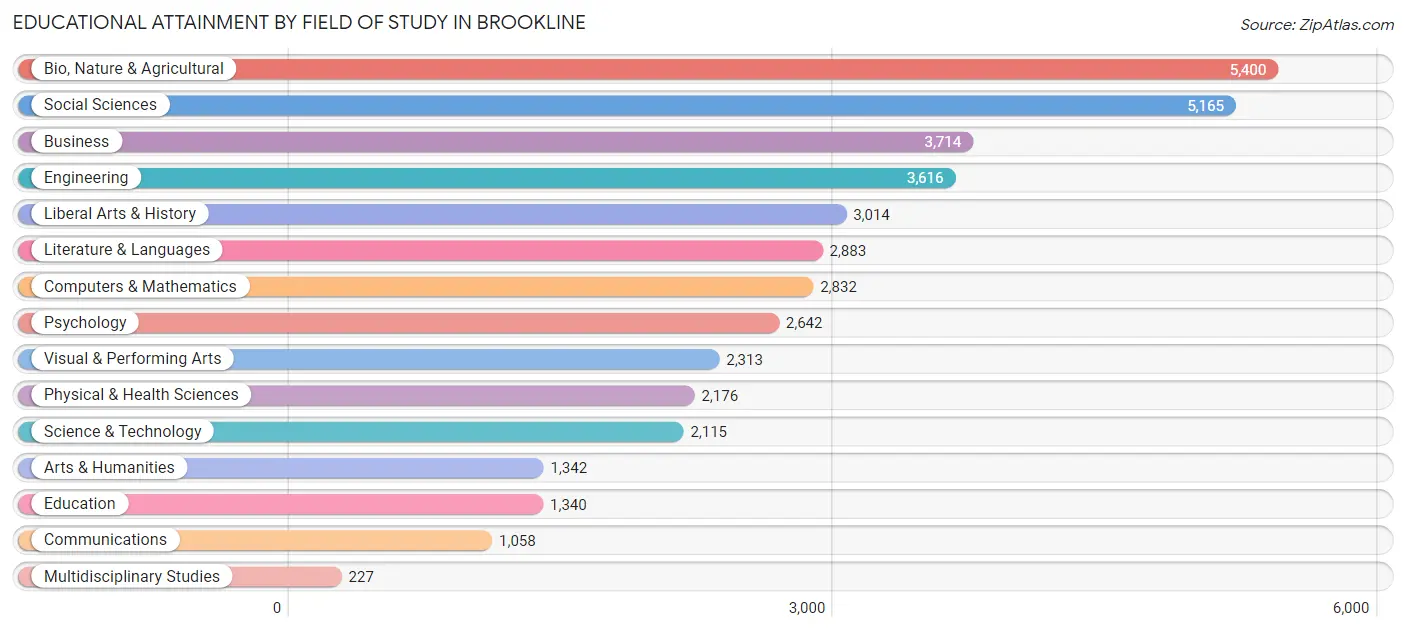
| Field of Study | # Graduates | % Graduates |
| Computers & Mathematics | 2,832 | 7.1% |
| Bio, Nature & Agricultural | 5,400 | 13.6% |
| Physical & Health Sciences | 2,176 | 5.5% |
| Psychology | 2,642 | 6.6% |
| Social Sciences | 5,165 | 13.0% |
| Engineering | 3,616 | 9.1% |
| Multidisciplinary Studies | 227 | 0.6% |
| Science & Technology | 2,115 | 5.3% |
| Business | 3,714 | 9.3% |
| Education | 1,340 | 3.4% |
| Literature & Languages | 2,883 | 7.2% |
| Liberal Arts & History | 3,014 | 7.6% |
| Visual & Performing Arts | 2,313 | 5.8% |
| Communications | 1,058 | 2.7% |
| Arts & Humanities | 1,342 | 3.4% |
| Total | 39,837 | 100.0% |
Transportation & Commute in Brookline
Vehicle Availability by Sex in Brookline
The most prevalent vehicle ownership categories in Brookline are males with 1 vehicle (7,345, accounting for 43.8%) and females with 1 vehicle (8,642, making up 40.0%).
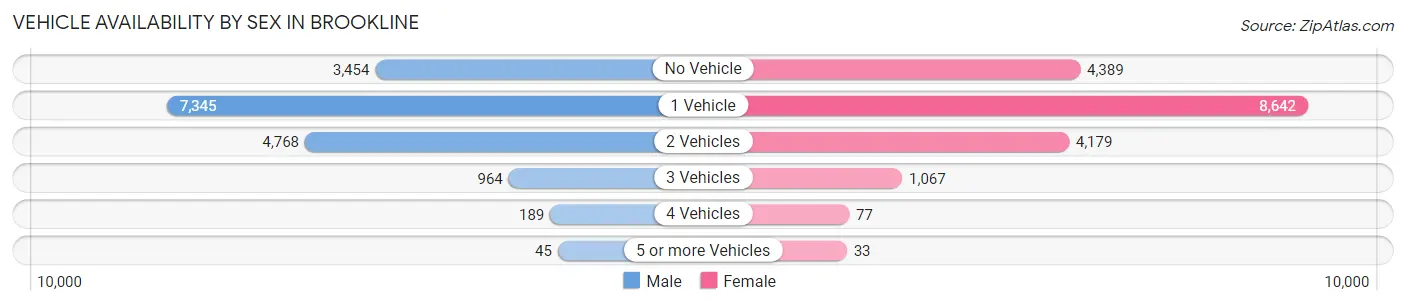
| Vehicles Available | Male | Female |
| No Vehicle | 3,454 (20.6%) | 4,389 (23.9%) |
| 1 Vehicle | 7,345 (43.8%) | 8,642 (47.0%) |
| 2 Vehicles | 4,768 (28.4%) | 4,179 (22.7%) |
| 3 Vehicles | 964 (5.8%) | 1,067 (5.8%) |
| 4 Vehicles | 189 (1.1%) | 77 (0.4%) |
| 5 or more Vehicles | 45 (0.3%) | 33 (0.2%) |
| Total | 16,765 (100.0%) | 18,387 (100.0%) |
Commute Time in Brookline
The most frequently occuring commute durations in Brookline are 30 to 34 minutes (5,200 commuters, 19.1%), 15 to 19 minutes (3,996 commuters, 14.7%), and 20 to 24 minutes (3,831 commuters, 14.1%).
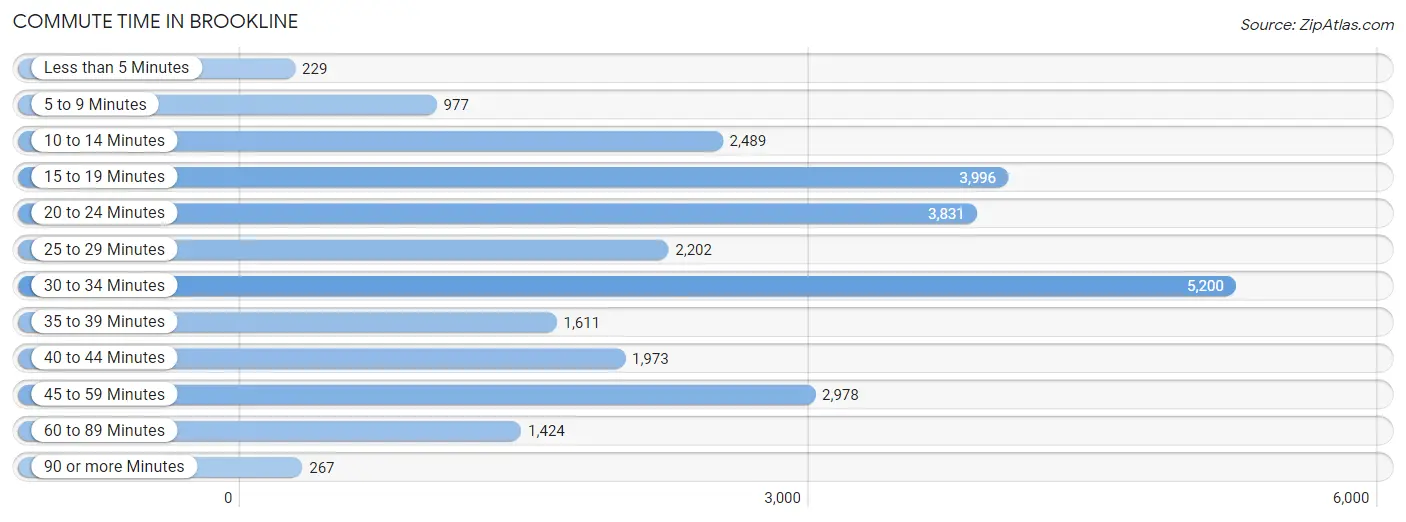
| Commute Time | # Commuters | % Commuters |
| Less than 5 Minutes | 229 | 0.8% |
| 5 to 9 Minutes | 977 | 3.6% |
| 10 to 14 Minutes | 2,489 | 9.2% |
| 15 to 19 Minutes | 3,996 | 14.7% |
| 20 to 24 Minutes | 3,831 | 14.1% |
| 25 to 29 Minutes | 2,202 | 8.1% |
| 30 to 34 Minutes | 5,200 | 19.1% |
| 35 to 39 Minutes | 1,611 | 5.9% |
| 40 to 44 Minutes | 1,973 | 7.3% |
| 45 to 59 Minutes | 2,978 | 11.0% |
| 60 to 89 Minutes | 1,424 | 5.2% |
| 90 or more Minutes | 267 | 1.0% |
Commute Time by Sex in Brookline
The most common commute times in Brookline are 30 to 34 minutes (2,959 commuters, 22.6%) for males and 15 to 19 minutes (2,304 commuters, 16.4%) for females.
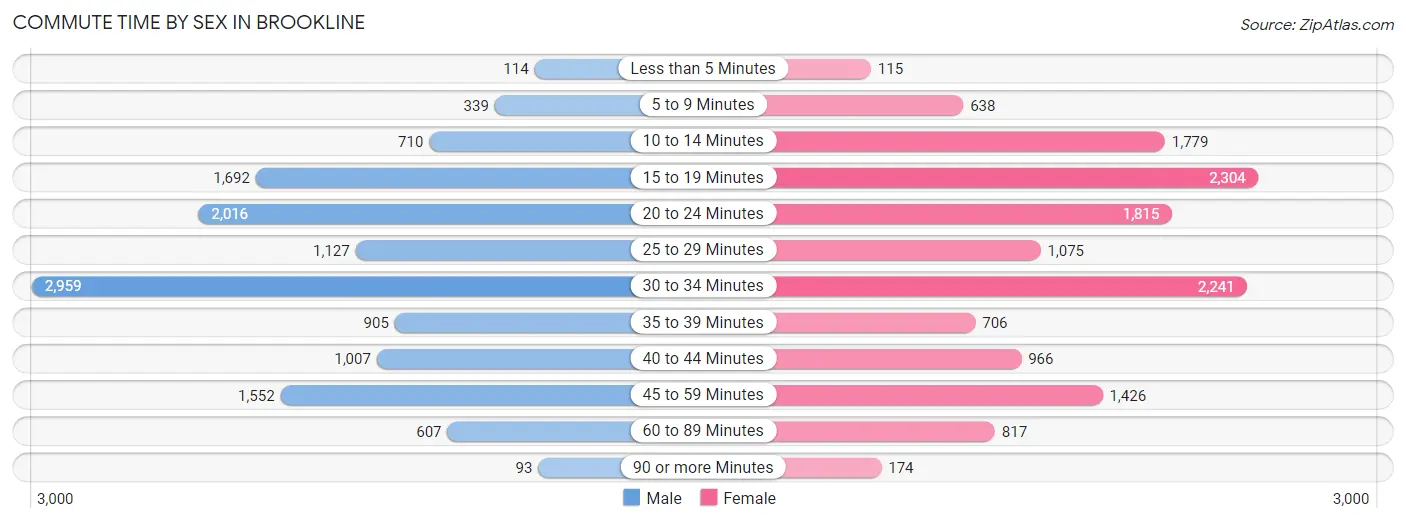
| Commute Time | Male | Female |
| Less than 5 Minutes | 114 (0.9%) | 115 (0.8%) |
| 5 to 9 Minutes | 339 (2.6%) | 638 (4.5%) |
| 10 to 14 Minutes | 710 (5.4%) | 1,779 (12.7%) |
| 15 to 19 Minutes | 1,692 (12.9%) | 2,304 (16.4%) |
| 20 to 24 Minutes | 2,016 (15.4%) | 1,815 (12.9%) |
| 25 to 29 Minutes | 1,127 (8.6%) | 1,075 (7.6%) |
| 30 to 34 Minutes | 2,959 (22.6%) | 2,241 (15.9%) |
| 35 to 39 Minutes | 905 (6.9%) | 706 (5.0%) |
| 40 to 44 Minutes | 1,007 (7.7%) | 966 (6.9%) |
| 45 to 59 Minutes | 1,552 (11.8%) | 1,426 (10.2%) |
| 60 to 89 Minutes | 607 (4.6%) | 817 (5.8%) |
| 90 or more Minutes | 93 (0.7%) | 174 (1.2%) |
Time of Departure to Work by Sex in Brookline
The most frequent times of departure to work in Brookline are 8:00 AM to 8:29 AM (3,109, 23.7%) for males and 8:00 AM to 8:29 AM (2,611, 18.6%) for females.
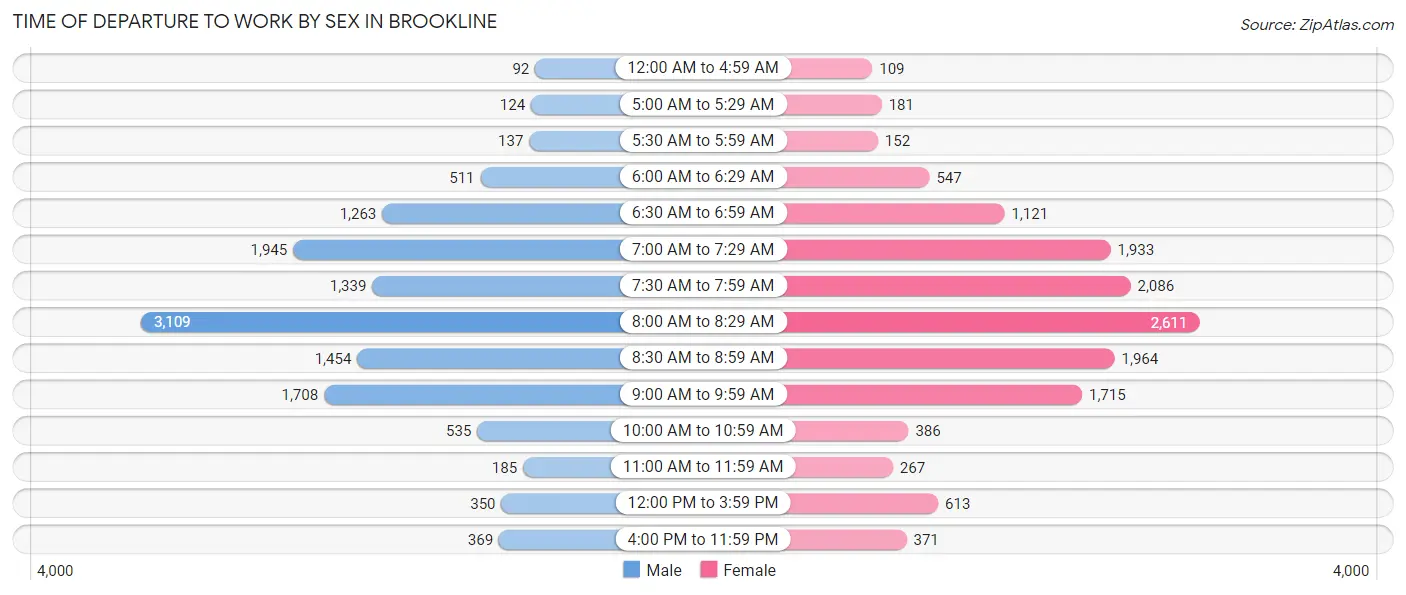
| Time of Departure | Male | Female |
| 12:00 AM to 4:59 AM | 92 (0.7%) | 109 (0.8%) |
| 5:00 AM to 5:29 AM | 124 (0.9%) | 181 (1.3%) |
| 5:30 AM to 5:59 AM | 137 (1.0%) | 152 (1.1%) |
| 6:00 AM to 6:29 AM | 511 (3.9%) | 547 (3.9%) |
| 6:30 AM to 6:59 AM | 1,263 (9.6%) | 1,121 (8.0%) |
| 7:00 AM to 7:29 AM | 1,945 (14.8%) | 1,933 (13.8%) |
| 7:30 AM to 7:59 AM | 1,339 (10.2%) | 2,086 (14.8%) |
| 8:00 AM to 8:29 AM | 3,109 (23.7%) | 2,611 (18.6%) |
| 8:30 AM to 8:59 AM | 1,454 (11.1%) | 1,964 (14.0%) |
| 9:00 AM to 9:59 AM | 1,708 (13.0%) | 1,715 (12.2%) |
| 10:00 AM to 10:59 AM | 535 (4.1%) | 386 (2.8%) |
| 11:00 AM to 11:59 AM | 185 (1.4%) | 267 (1.9%) |
| 12:00 PM to 3:59 PM | 350 (2.7%) | 613 (4.4%) |
| 4:00 PM to 11:59 PM | 369 (2.8%) | 371 (2.6%) |
| Total | 13,121 (100.0%) | 14,056 (100.0%) |
Housing Occupancy in Brookline
Occupancy by Ownership in Brookline
Of the total 26,919 dwellings in Brookline, owner-occupied units account for 12,480 (46.4%), while renter-occupied units make up 14,439 (53.6%).
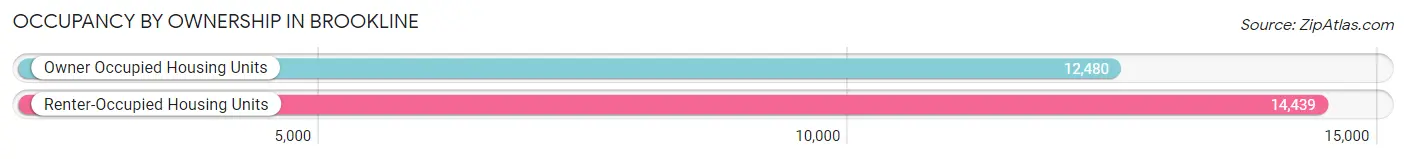
| Occupancy | # Housing Units | % Housing Units |
| Owner Occupied Housing Units | 12,480 | 46.4% |
| Renter-Occupied Housing Units | 14,439 | 53.6% |
| Total Occupied Housing Units | 26,919 | 100.0% |
Occupancy by Household Size in Brookline
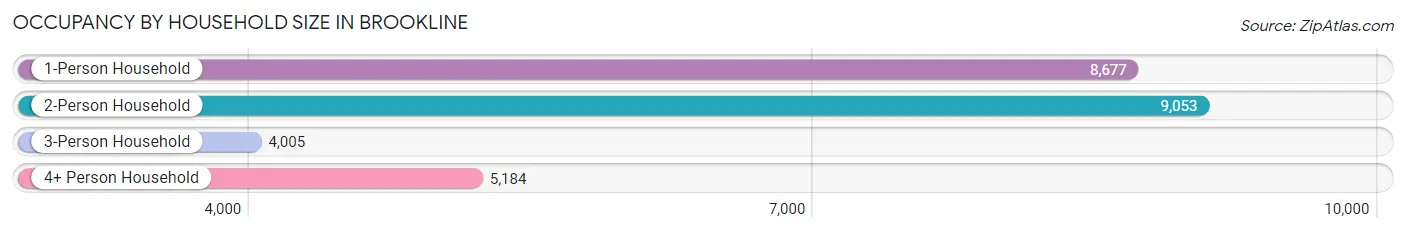
| Household Size | # Housing Units | % Housing Units |
| 1-Person Household | 8,677 | 32.2% |
| 2-Person Household | 9,053 | 33.6% |
| 3-Person Household | 4,005 | 14.9% |
| 4+ Person Household | 5,184 | 19.3% |
| Total Housing Units | 26,919 | 100.0% |
Occupancy by Ownership by Household Size in Brookline
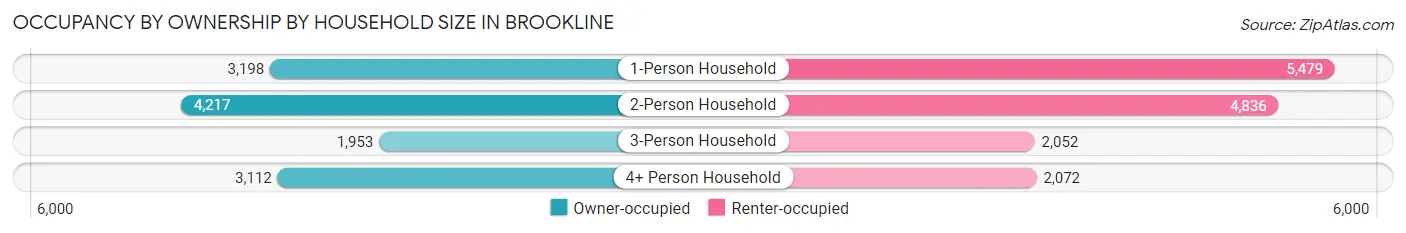
| Household Size | Owner-occupied | Renter-occupied |
| 1-Person Household | 3,198 (36.9%) | 5,479 (63.1%) |
| 2-Person Household | 4,217 (46.6%) | 4,836 (53.4%) |
| 3-Person Household | 1,953 (48.8%) | 2,052 (51.2%) |
| 4+ Person Household | 3,112 (60.0%) | 2,072 (40.0%) |
| Total Housing Units | 12,480 (46.4%) | 14,439 (53.6%) |
Occupancy by Educational Attainment in Brookline
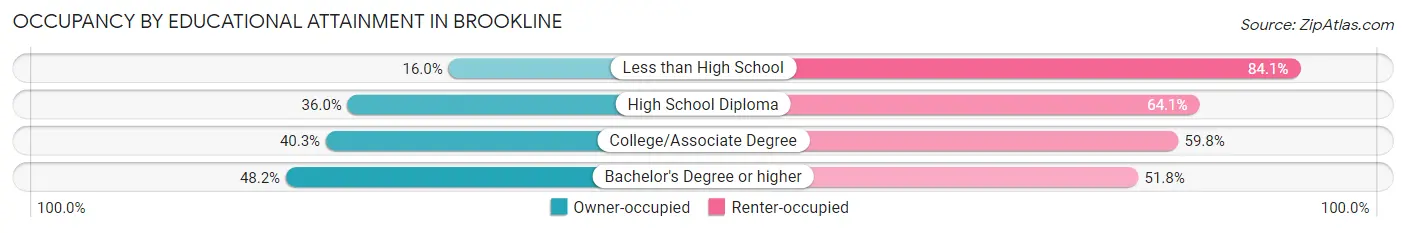
| Household Size | Owner-occupied | Renter-occupied |
| Less than High School | 78 (16.0%) | 411 (84.1%) |
| High School Diploma | 467 (35.9%) | 832 (64.0%) |
| College/Associate Degree | 881 (40.3%) | 1,308 (59.8%) |
| Bachelor's Degree or higher | 11,054 (48.2%) | 11,888 (51.8%) |
Occupancy by Age of Householder in Brookline
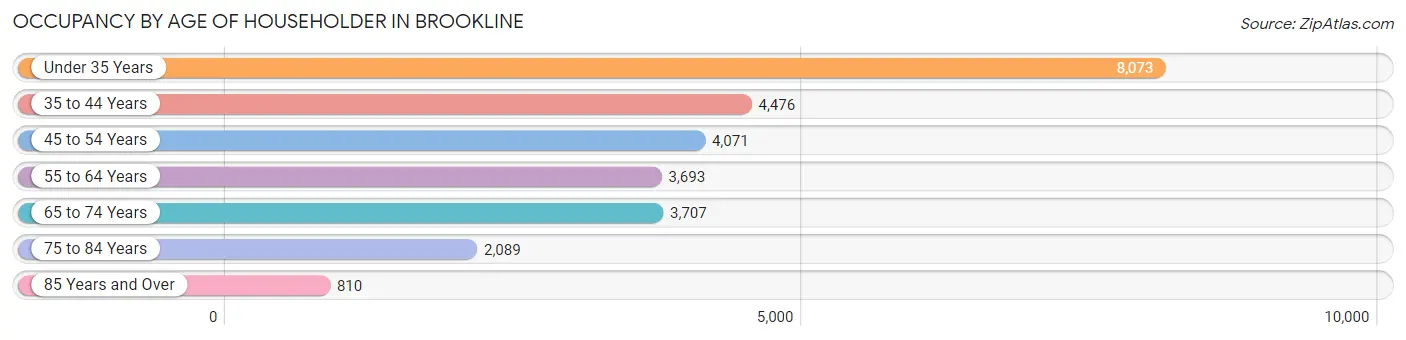
| Age Bracket | # Households | % Households |
| Under 35 Years | 8,073 | 30.0% |
| 35 to 44 Years | 4,476 | 16.6% |
| 45 to 54 Years | 4,071 | 15.1% |
| 55 to 64 Years | 3,693 | 13.7% |
| 65 to 74 Years | 3,707 | 13.8% |
| 75 to 84 Years | 2,089 | 7.8% |
| 85 Years and Over | 810 | 3.0% |
| Total | 26,919 | 100.0% |
Housing Finances in Brookline
Median Income by Occupancy in Brookline
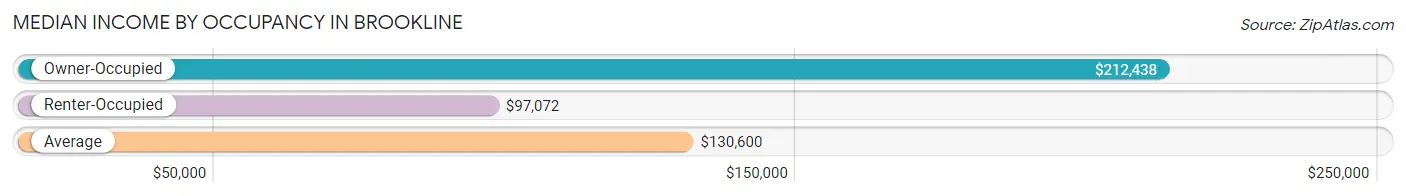
| Occupancy Type | # Households | Median Income |
| Owner-Occupied | 12,480 (46.4%) | $212,438 |
| Renter-Occupied | 14,439 (53.6%) | $97,072 |
| Average | 26,919 (100.0%) | $130,600 |
Occupancy by Householder Income Bracket in Brookline
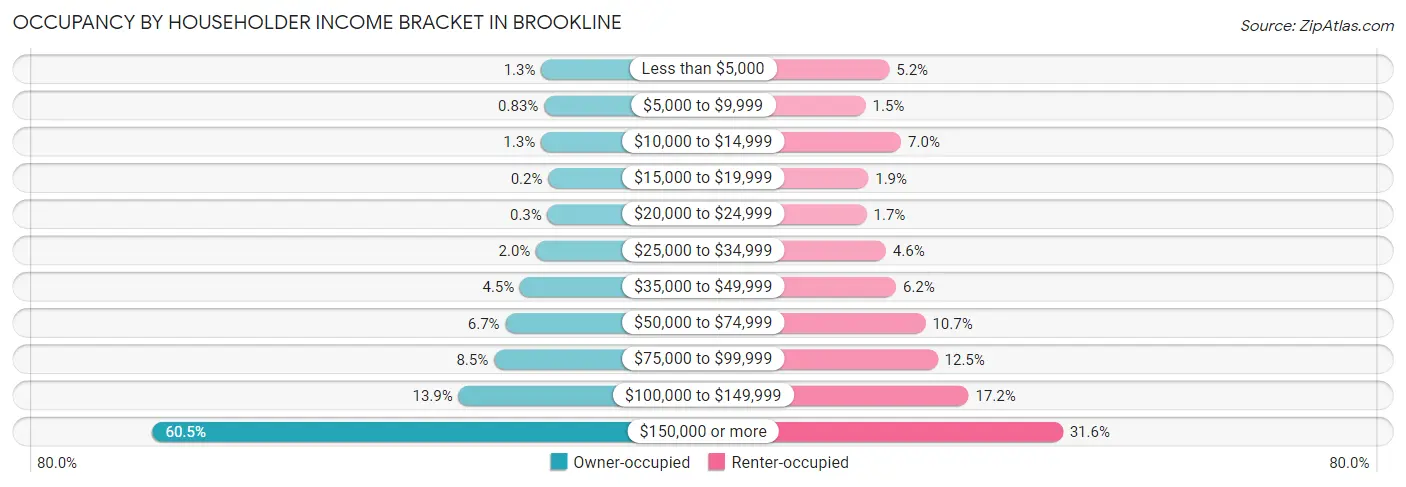
| Income Bracket | Owner-occupied | Renter-occupied |
| Less than $5,000 | 159 (1.3%) | 743 (5.1%) |
| $5,000 to $9,999 | 103 (0.8%) | 221 (1.5%) |
| $10,000 to $14,999 | 164 (1.3%) | 1,004 (7.0%) |
| $15,000 to $19,999 | 25 (0.2%) | 280 (1.9%) |
| $20,000 to $24,999 | 37 (0.3%) | 242 (1.7%) |
| $25,000 to $34,999 | 254 (2.0%) | 669 (4.6%) |
| $35,000 to $49,999 | 560 (4.5%) | 891 (6.2%) |
| $50,000 to $74,999 | 840 (6.7%) | 1,539 (10.7%) |
| $75,000 to $99,999 | 1,056 (8.5%) | 1,805 (12.5%) |
| $100,000 to $149,999 | 1,732 (13.9%) | 2,487 (17.2%) |
| $150,000 or more | 7,550 (60.5%) | 4,558 (31.6%) |
| Total | 12,480 (100.0%) | 14,439 (100.0%) |
Monthly Housing Cost Tiers in Brookline
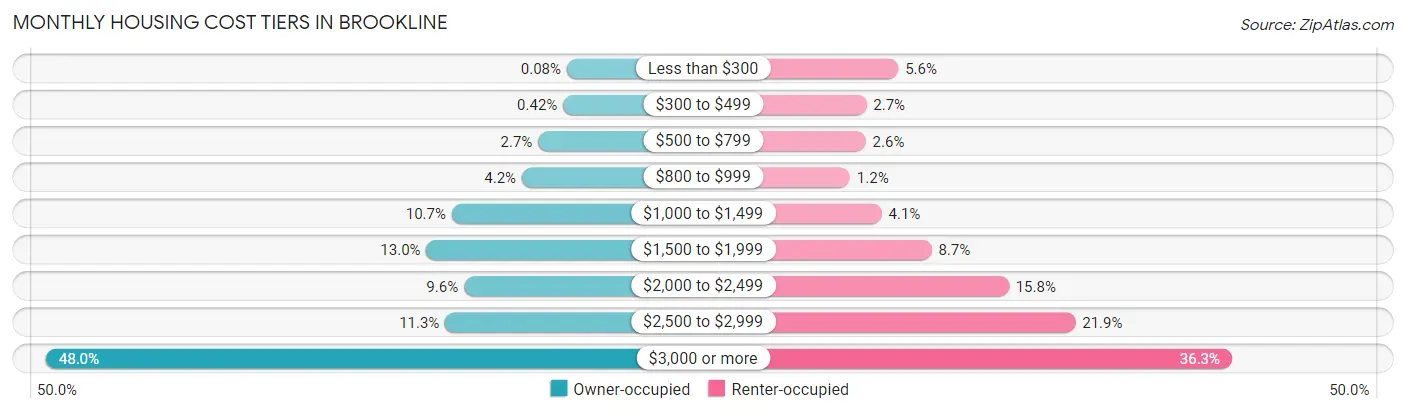
| Monthly Cost | Owner-occupied | Renter-occupied |
| Less than $300 | 10 (0.1%) | 809 (5.6%) |
| $300 to $499 | 53 (0.4%) | 384 (2.7%) |
| $500 to $799 | 339 (2.7%) | 375 (2.6%) |
| $800 to $999 | 527 (4.2%) | 166 (1.1%) |
| $1,000 to $1,499 | 1,332 (10.7%) | 587 (4.1%) |
| $1,500 to $1,999 | 1,624 (13.0%) | 1,251 (8.7%) |
| $2,000 to $2,499 | 1,192 (9.6%) | 2,277 (15.8%) |
| $2,500 to $2,999 | 1,408 (11.3%) | 3,162 (21.9%) |
| $3,000 or more | 5,995 (48.0%) | 5,243 (36.3%) |
| Total | 12,480 (100.0%) | 14,439 (100.0%) |
Physical Housing Characteristics in Brookline
Housing Structures in Brookline
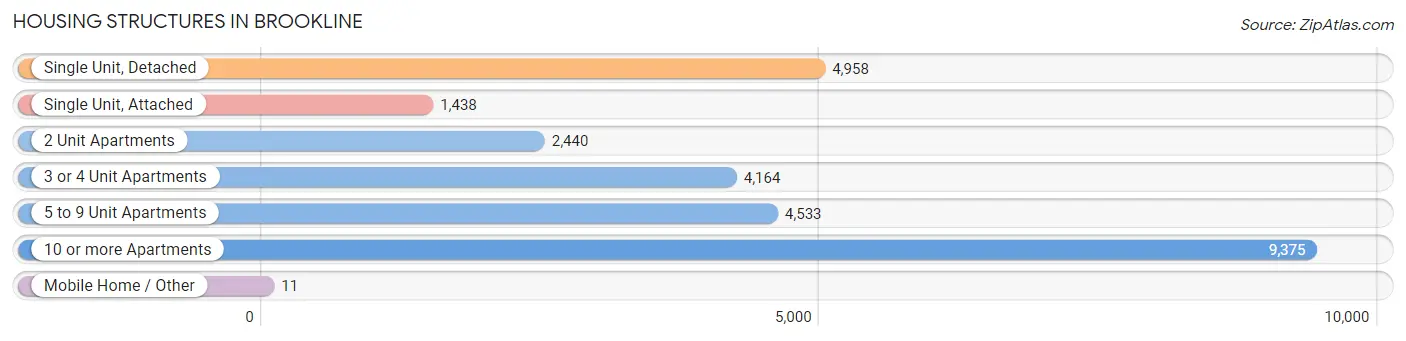
| Structure Type | # Housing Units | % Housing Units |
| Single Unit, Detached | 4,958 | 18.4% |
| Single Unit, Attached | 1,438 | 5.3% |
| 2 Unit Apartments | 2,440 | 9.1% |
| 3 or 4 Unit Apartments | 4,164 | 15.5% |
| 5 to 9 Unit Apartments | 4,533 | 16.8% |
| 10 or more Apartments | 9,375 | 34.8% |
| Mobile Home / Other | 11 | 0.0% |
| Total | 26,919 | 100.0% |
Housing Structures by Occupancy in Brookline
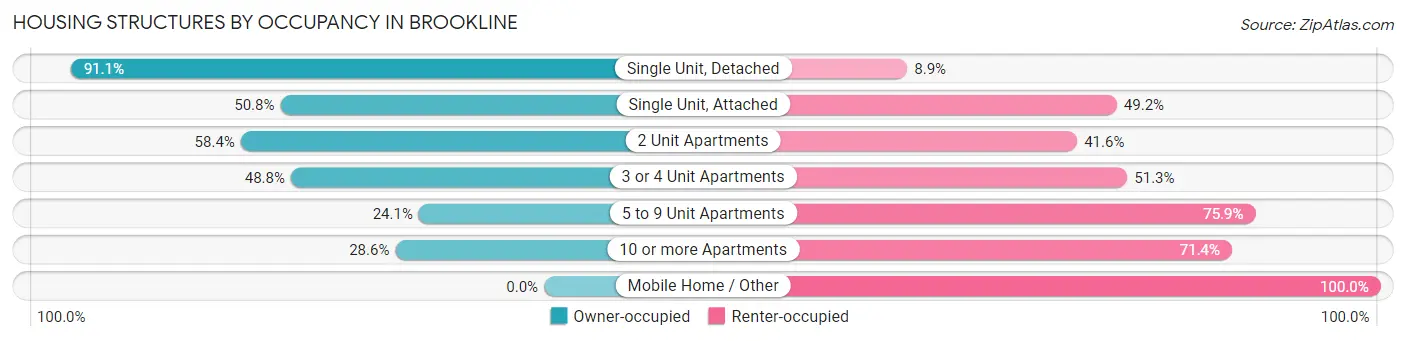
| Structure Type | Owner-occupied | Renter-occupied |
| Single Unit, Detached | 4,517 (91.1%) | 441 (8.9%) |
| Single Unit, Attached | 730 (50.8%) | 708 (49.2%) |
| 2 Unit Apartments | 1,425 (58.4%) | 1,015 (41.6%) |
| 3 or 4 Unit Apartments | 2,030 (48.7%) | 2,134 (51.2%) |
| 5 to 9 Unit Apartments | 1,093 (24.1%) | 3,440 (75.9%) |
| 10 or more Apartments | 2,685 (28.6%) | 6,690 (71.4%) |
| Mobile Home / Other | 0 (0.0%) | 11 (100.0%) |
| Total | 12,480 (46.4%) | 14,439 (53.6%) |
Housing Structures by Number of Rooms in Brookline
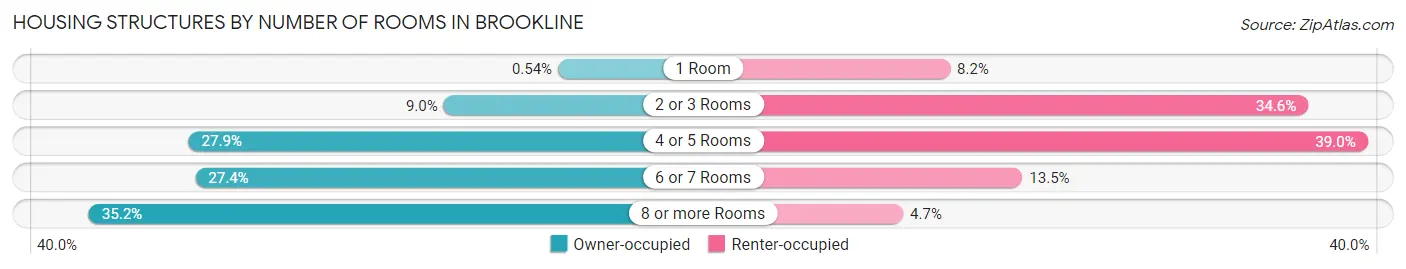
| Number of Rooms | Owner-occupied | Renter-occupied |
| 1 Room | 67 (0.5%) | 1,177 (8.2%) |
| 2 or 3 Rooms | 1,123 (9.0%) | 5,002 (34.6%) |
| 4 or 5 Rooms | 3,477 (27.9%) | 5,635 (39.0%) |
| 6 or 7 Rooms | 3,415 (27.4%) | 1,949 (13.5%) |
| 8 or more Rooms | 4,398 (35.2%) | 676 (4.7%) |
| Total | 12,480 (100.0%) | 14,439 (100.0%) |
Housing Structure by Heating Type in Brookline
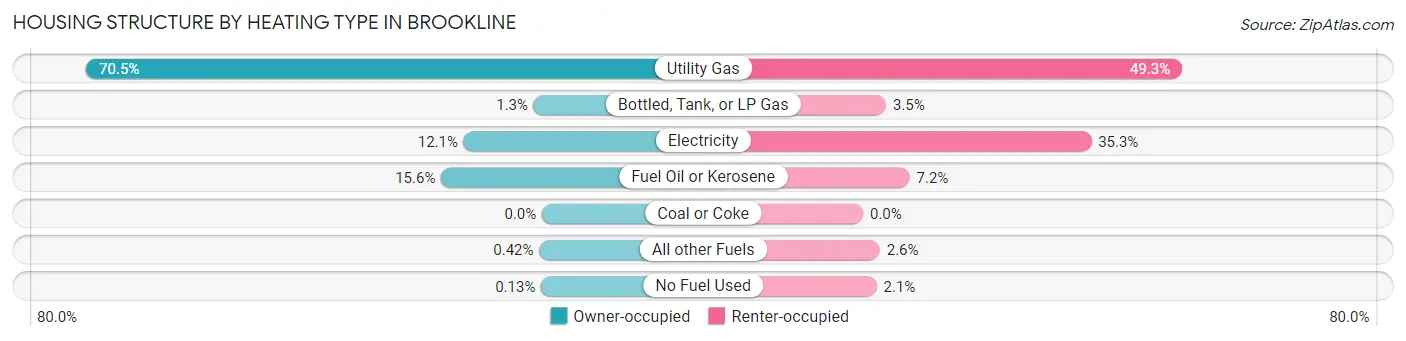
| Heating Type | Owner-occupied | Renter-occupied |
| Utility Gas | 8,796 (70.5%) | 7,118 (49.3%) |
| Bottled, Tank, or LP Gas | 158 (1.3%) | 511 (3.5%) |
| Electricity | 1,511 (12.1%) | 5,093 (35.3%) |
| Fuel Oil or Kerosene | 1,946 (15.6%) | 1,040 (7.2%) |
| Coal or Coke | 0 (0.0%) | 0 (0.0%) |
| All other Fuels | 53 (0.4%) | 374 (2.6%) |
| No Fuel Used | 16 (0.1%) | 303 (2.1%) |
| Total | 12,480 (100.0%) | 14,439 (100.0%) |
Household Vehicle Usage in Brookline
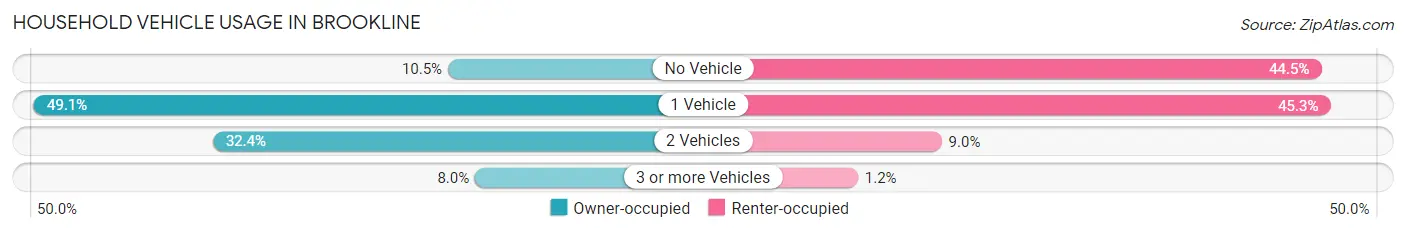
| Vehicles per Household | Owner-occupied | Renter-occupied |
| No Vehicle | 1,308 (10.5%) | 6,419 (44.5%) |
| 1 Vehicle | 6,131 (49.1%) | 6,541 (45.3%) |
| 2 Vehicles | 4,049 (32.4%) | 1,304 (9.0%) |
| 3 or more Vehicles | 992 (8.0%) | 175 (1.2%) |
| Total | 12,480 (100.0%) | 14,439 (100.0%) |
Real Estate & Mortgages in Brookline
Real Estate and Mortgage Overview in Brookline
| Characteristic | Without Mortgage | With Mortgage |
| Housing Units | 5,252 | 7,228 |
| Median Property Value | $1,139,300 | $1,220,400 |
| Median Household Income | $175,213 | $4,819 |
| Monthly Housing Costs | $1,501 | $5,332 |
| Real Estate Taxes | $9,982 | $76 |
Property Value by Mortgage Status in Brookline
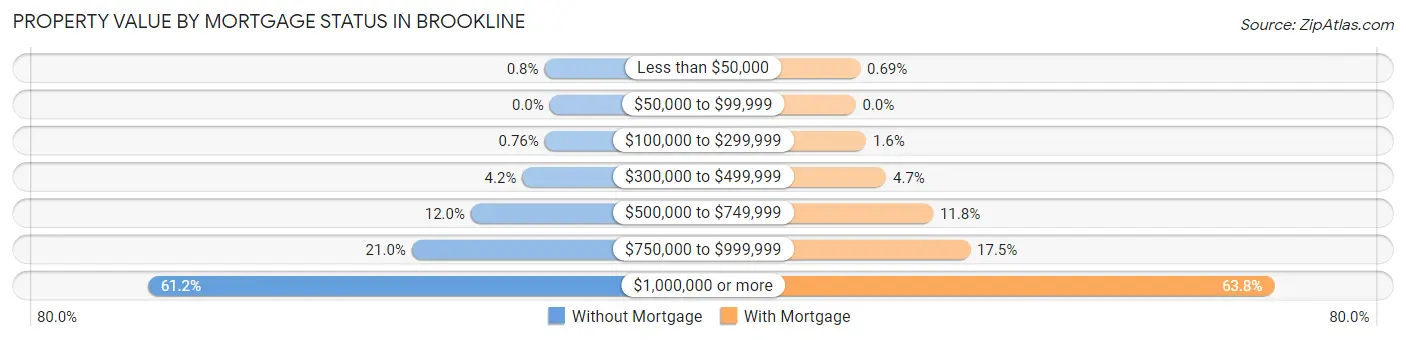
| Property Value | Without Mortgage | With Mortgage |
| Less than $50,000 | 42 (0.8%) | 50 (0.7%) |
| $50,000 to $99,999 | 0 (0.0%) | 0 (0.0%) |
| $100,000 to $299,999 | 40 (0.8%) | 116 (1.6%) |
| $300,000 to $499,999 | 219 (4.2%) | 336 (4.6%) |
| $500,000 to $749,999 | 631 (12.0%) | 853 (11.8%) |
| $750,000 to $999,999 | 1,104 (21.0%) | 1,262 (17.5%) |
| $1,000,000 or more | 3,216 (61.2%) | 4,611 (63.8%) |
| Total | 5,252 (100.0%) | 7,228 (100.0%) |
Household Income by Mortgage Status in Brookline
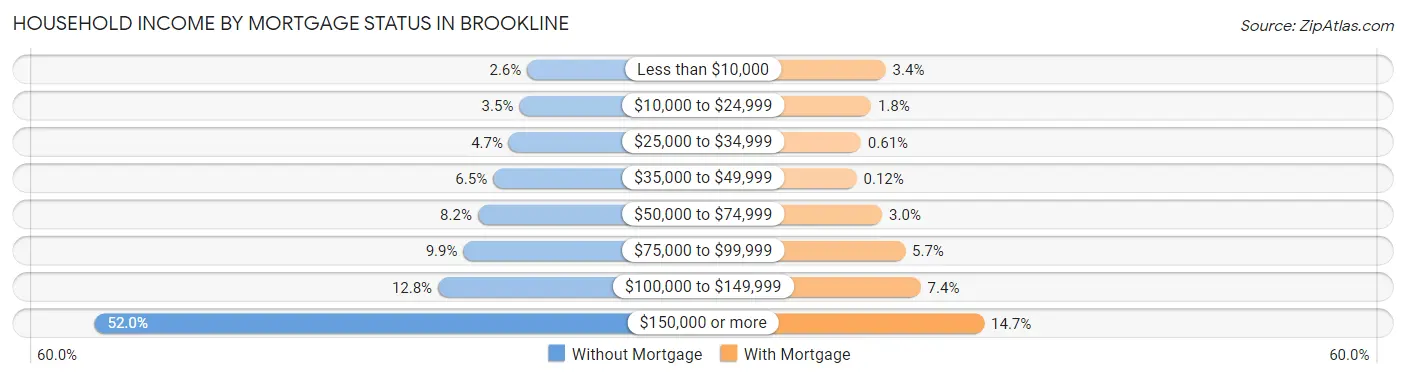
| Household Income | Without Mortgage | With Mortgage |
| Less than $10,000 | 135 (2.6%) | 249 (3.4%) |
| $10,000 to $24,999 | 182 (3.5%) | 127 (1.8%) |
| $25,000 to $34,999 | 245 (4.7%) | 44 (0.6%) |
| $35,000 to $49,999 | 340 (6.5%) | 9 (0.1%) |
| $50,000 to $74,999 | 431 (8.2%) | 220 (3.0%) |
| $75,000 to $99,999 | 518 (9.9%) | 409 (5.7%) |
| $100,000 to $149,999 | 670 (12.8%) | 538 (7.4%) |
| $150,000 or more | 2,731 (52.0%) | 1,062 (14.7%) |
| Total | 5,252 (100.0%) | 7,228 (100.0%) |
Property Value to Household Income Ratio in Brookline
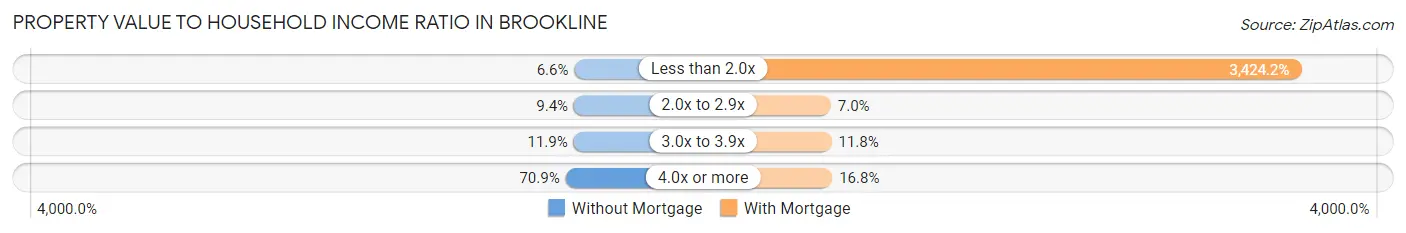
| Value-to-Income Ratio | Without Mortgage | With Mortgage |
| Less than 2.0x | 344 (6.6%) | 247,500 (3,424.2%) |
| 2.0x to 2.9x | 491 (9.3%) | 502 (7.0%) |
| 3.0x to 3.9x | 626 (11.9%) | 851 (11.8%) |
| 4.0x or more | 3,725 (70.9%) | 1,211 (16.8%) |
| Total | 5,252 (100.0%) | 7,228 (100.0%) |
Real Estate Taxes by Mortgage Status in Brookline
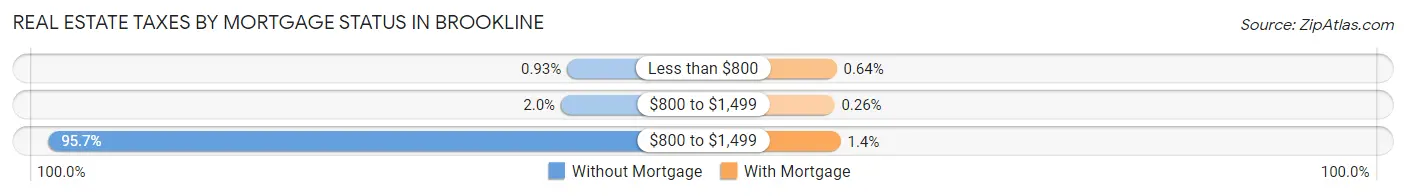
| Property Taxes | Without Mortgage | With Mortgage |
| Less than $800 | 49 (0.9%) | 46 (0.6%) |
| $800 to $1,499 | 107 (2.0%) | 19 (0.3%) |
| $800 to $1,499 | 5,025 (95.7%) | 99 (1.4%) |
| Total | 5,252 (100.0%) | 7,228 (100.0%) |
Health & Disability in Brookline
Health Insurance Coverage by Age in Brookline
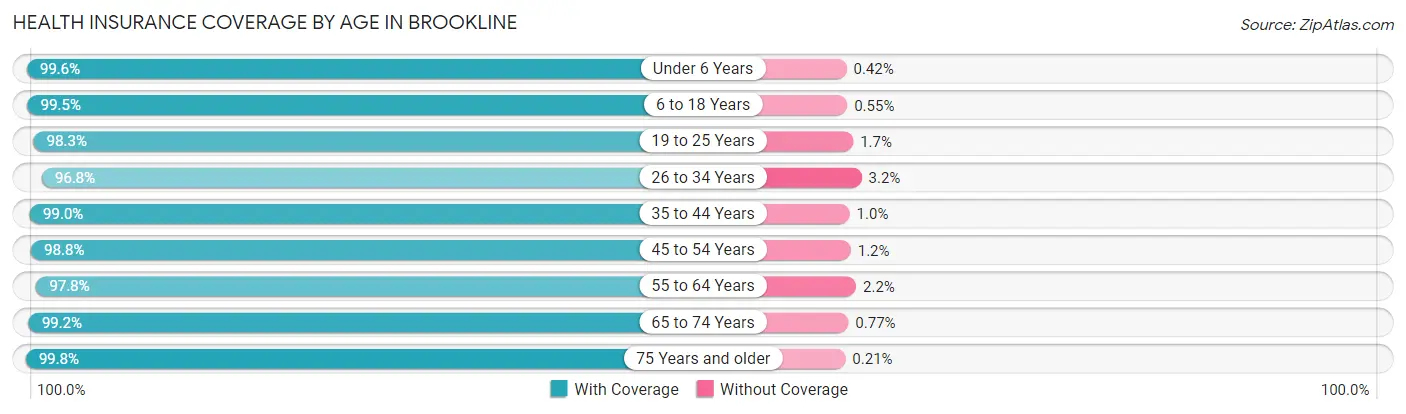
| Age Bracket | With Coverage | Without Coverage |
| Under 6 Years | 4,234 (99.6%) | 18 (0.4%) |
| 6 to 18 Years | 8,153 (99.5%) | 45 (0.5%) |
| 19 to 25 Years | 9,654 (98.3%) | 164 (1.7%) |
| 26 to 34 Years | 8,642 (96.8%) | 288 (3.2%) |
| 35 to 44 Years | 8,256 (99.0%) | 83 (1.0%) |
| 45 to 54 Years | 7,014 (98.8%) | 86 (1.2%) |
| 55 to 64 Years | 5,879 (97.8%) | 132 (2.2%) |
| 65 to 74 Years | 5,418 (99.2%) | 42 (0.8%) |
| 75 Years and older | 4,273 (99.8%) | 9 (0.2%) |
| Total | 61,523 (98.6%) | 867 (1.4%) |
Health Insurance Coverage by Citizenship Status in Brookline
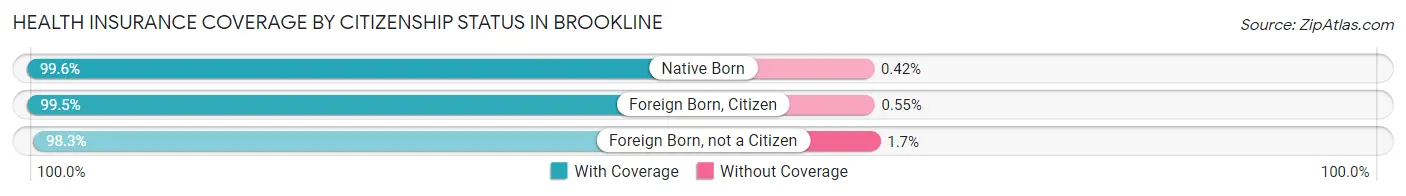
| Citizenship Status | With Coverage | Without Coverage |
| Native Born | 4,234 (99.6%) | 18 (0.4%) |
| Foreign Born, Citizen | 8,153 (99.5%) | 45 (0.5%) |
| Foreign Born, not a Citizen | 9,654 (98.3%) | 164 (1.7%) |
Health Insurance Coverage by Household Income in Brookline
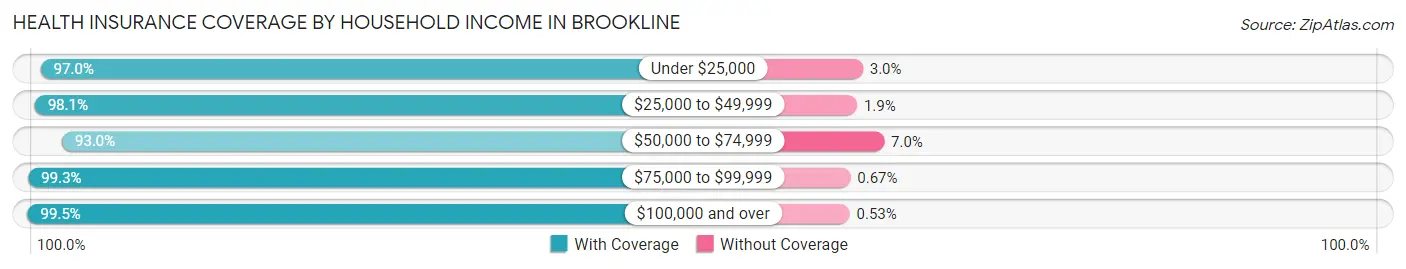
| Household Income | With Coverage | Without Coverage |
| Under $25,000 | 4,241 (97.0%) | 131 (3.0%) |
| $25,000 to $49,999 | 3,958 (98.1%) | 77 (1.9%) |
| $50,000 to $74,999 | 4,177 (93.0%) | 314 (7.0%) |
| $75,000 to $99,999 | 5,051 (99.3%) | 34 (0.7%) |
| $100,000 and over | 43,026 (99.5%) | 229 (0.5%) |
Public vs Private Health Insurance Coverage by Age in Brookline
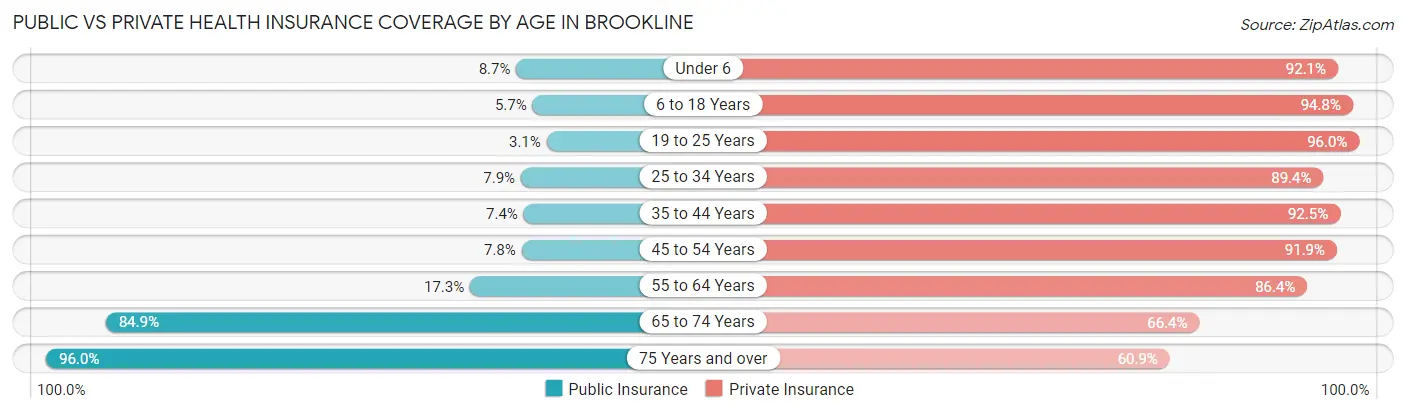
| Age Bracket | Public Insurance | Private Insurance |
| Under 6 | 371 (8.7%) | 3,915 (92.1%) |
| 6 to 18 Years | 468 (5.7%) | 7,774 (94.8%) |
| 19 to 25 Years | 304 (3.1%) | 9,428 (96.0%) |
| 25 to 34 Years | 703 (7.9%) | 7,980 (89.4%) |
| 35 to 44 Years | 615 (7.4%) | 7,711 (92.5%) |
| 45 to 54 Years | 550 (7.7%) | 6,524 (91.9%) |
| 55 to 64 Years | 1,041 (17.3%) | 5,193 (86.4%) |
| 65 to 74 Years | 4,637 (84.9%) | 3,623 (66.4%) |
| 75 Years and over | 4,111 (96.0%) | 2,606 (60.9%) |
| Total | 12,800 (20.5%) | 54,754 (87.8%) |
Disability Status by Sex by Age in Brookline
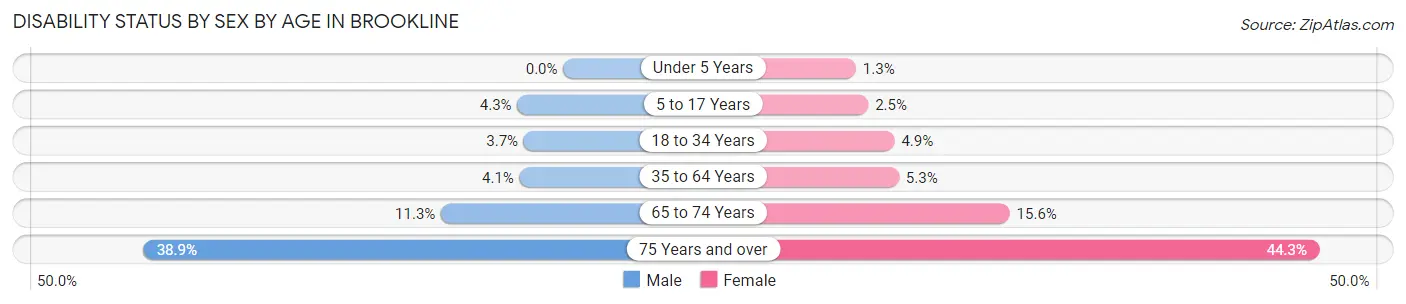
| Age Bracket | Male | Female |
| Under 5 Years | 0 (0.0%) | 25 (1.3%) |
| 5 to 17 Years | 189 (4.3%) | 96 (2.5%) |
| 18 to 34 Years | 309 (3.7%) | 527 (4.9%) |
| 35 to 64 Years | 408 (4.1%) | 603 (5.3%) |
| 65 to 74 Years | 256 (11.3%) | 499 (15.6%) |
| 75 Years and over | 655 (38.9%) | 1,151 (44.3%) |
Disability Class by Sex by Age in Brookline
Disability Class: Hearing Difficulty
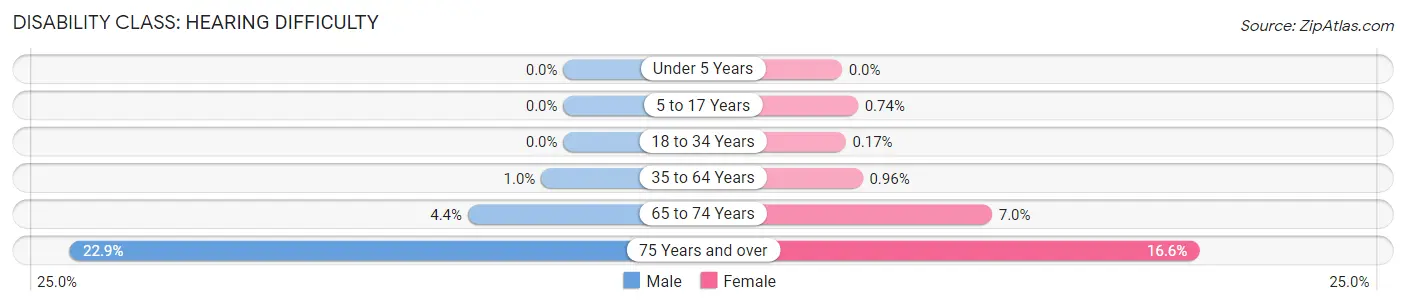
| Age Bracket | Male | Female |
| Under 5 Years | 0 (0.0%) | 0 (0.0%) |
| 5 to 17 Years | 0 (0.0%) | 29 (0.7%) |
| 18 to 34 Years | 0 (0.0%) | 18 (0.2%) |
| 35 to 64 Years | 104 (1.0%) | 109 (1.0%) |
| 65 to 74 Years | 100 (4.4%) | 223 (7.0%) |
| 75 Years and over | 385 (22.9%) | 431 (16.6%) |
Disability Class: Vision Difficulty
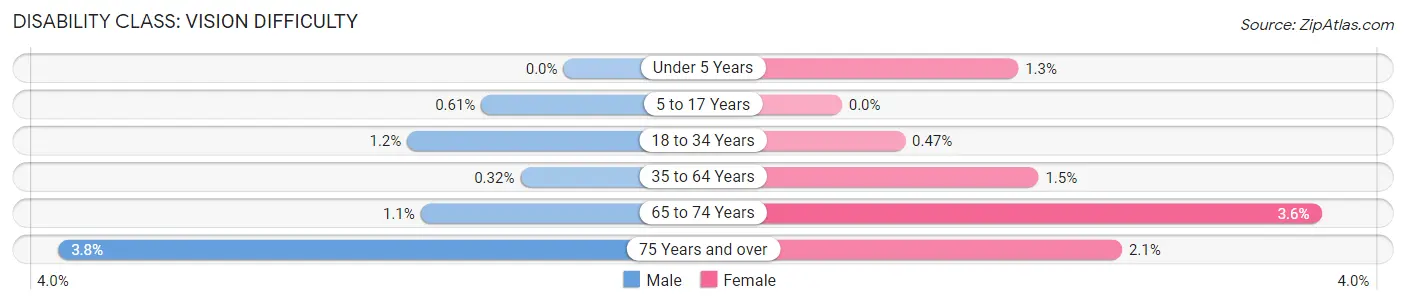
| Age Bracket | Male | Female |
| Under 5 Years | 0 (0.0%) | 25 (1.3%) |
| 5 to 17 Years | 27 (0.6%) | 0 (0.0%) |
| 18 to 34 Years | 98 (1.2%) | 51 (0.5%) |
| 35 to 64 Years | 32 (0.3%) | 166 (1.5%) |
| 65 to 74 Years | 24 (1.1%) | 114 (3.6%) |
| 75 Years and over | 63 (3.7%) | 54 (2.1%) |
Disability Class: Cognitive Difficulty
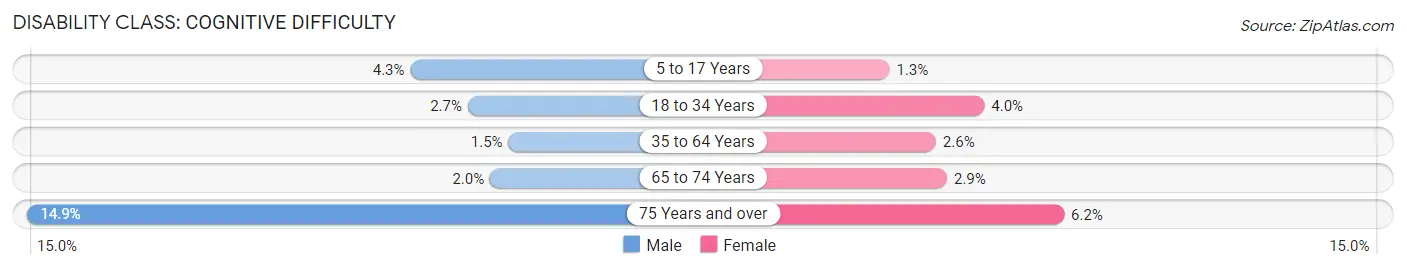
| Age Bracket | Male | Female |
| 5 to 17 Years | 189 (4.3%) | 52 (1.3%) |
| 18 to 34 Years | 225 (2.7%) | 428 (4.0%) |
| 35 to 64 Years | 154 (1.5%) | 298 (2.6%) |
| 65 to 74 Years | 46 (2.0%) | 94 (2.9%) |
| 75 Years and over | 251 (14.9%) | 161 (6.2%) |
Disability Class: Ambulatory Difficulty
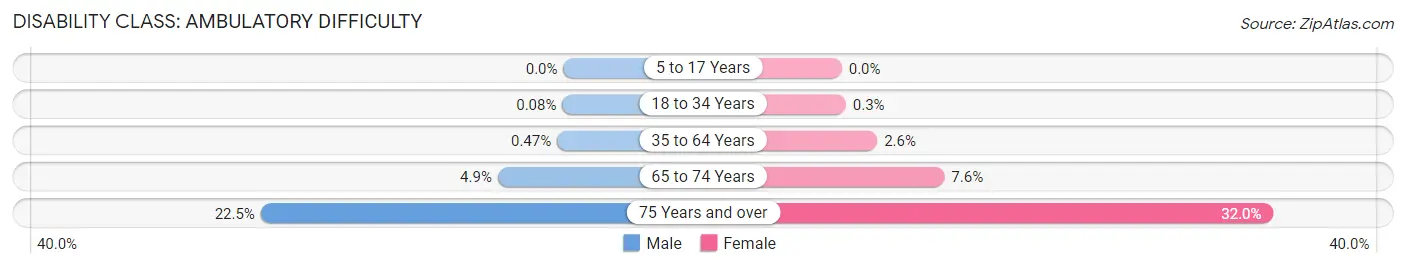
| Age Bracket | Male | Female |
| 5 to 17 Years | 0 (0.0%) | 0 (0.0%) |
| 18 to 34 Years | 7 (0.1%) | 32 (0.3%) |
| 35 to 64 Years | 47 (0.5%) | 299 (2.6%) |
| 65 to 74 Years | 110 (4.9%) | 244 (7.6%) |
| 75 Years and over | 378 (22.5%) | 833 (32.0%) |
Disability Class: Self-Care Difficulty
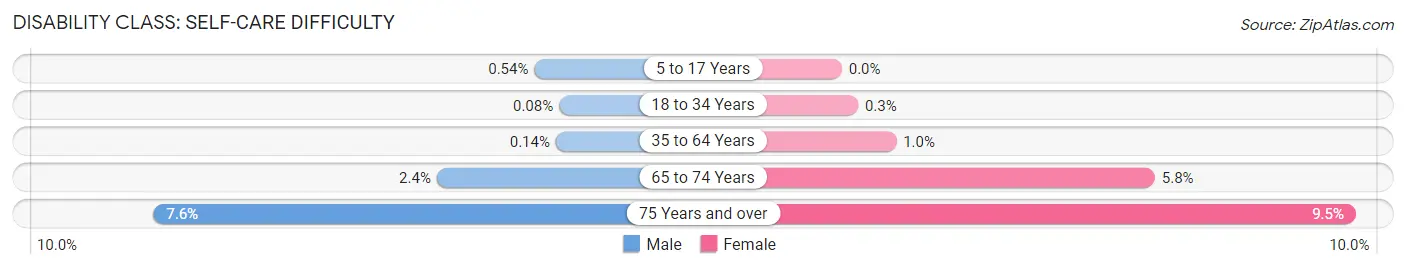
| Age Bracket | Male | Female |
| 5 to 17 Years | 24 (0.5%) | 0 (0.0%) |
| 18 to 34 Years | 7 (0.1%) | 32 (0.3%) |
| 35 to 64 Years | 14 (0.1%) | 115 (1.0%) |
| 65 to 74 Years | 53 (2.4%) | 186 (5.8%) |
| 75 Years and over | 128 (7.6%) | 248 (9.5%) |
Technology Access in Brookline
Computing Device Access in Brookline
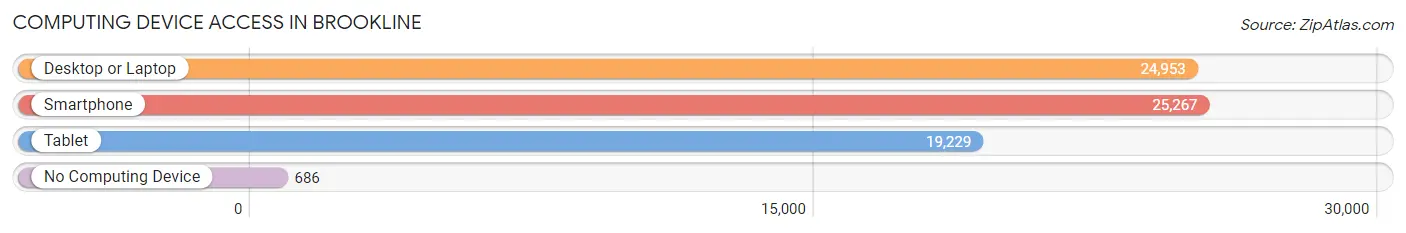
| Device Type | # Households | % Households |
| Desktop or Laptop | 24,953 | 92.7% |
| Smartphone | 25,267 | 93.9% |
| Tablet | 19,229 | 71.4% |
| No Computing Device | 686 | 2.5% |
| Total | 26,919 | 100.0% |
Internet Access in Brookline
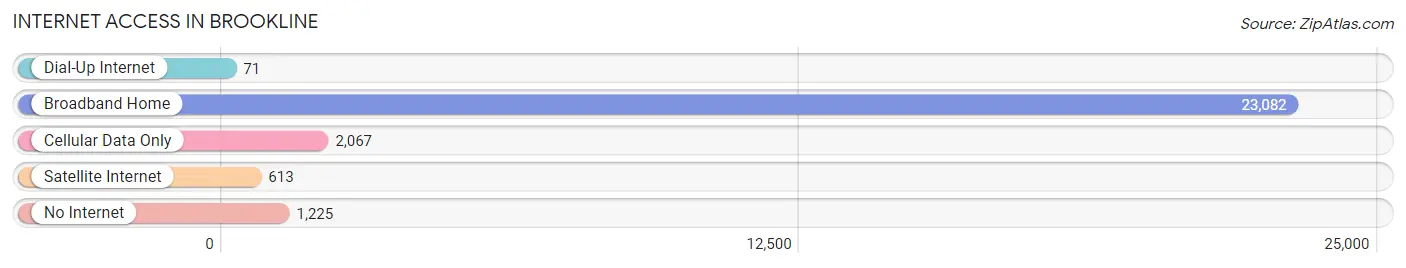
| Internet Type | # Households | % Households |
| Dial-Up Internet | 71 | 0.3% |
| Broadband Home | 23,082 | 85.8% |
| Cellular Data Only | 2,067 | 7.7% |
| Satellite Internet | 613 | 2.3% |
| No Internet | 1,225 | 4.5% |
| Total | 26,919 | 100.0% |
Brookline Summary
Brookline, MA is a town located in Norfolk County, Massachusetts, United States. It is a suburb of Boston and is bordered by the cities of Boston and Newton. As of the 2010 census, the population of Brookline was 58,732.
History
The area now known as Brookline was first settled in 1638 by a group of English Puritans. The area was originally part of the town of Cambridge, but was incorporated as the town of Brookline in 1705. The town was named after the brook that ran through the area.
In the 19th century, Brookline became a popular summer resort for wealthy Bostonians. The town was also home to several prominent figures, including John F. Kennedy, who was born in Brookline in 1917.
Geography
Brookline is located in eastern Massachusetts, about 6 miles west of downtown Boston. It is bordered by the cities of Boston and Newton to the north, west, and south, respectively. The town is situated on the Charles River, which forms its eastern border.
Brookline is hilly and densely populated, with a total area of 6.8 square miles. The highest point in the town is Fisher Hill, which rises to an elevation of 266 feet.
Economy
Brookline is a wealthy suburb of Boston, with a median household income of $90,890 in 2017. The town is home to several large employers, including Beth Israel Deaconess Medical Center, Brigham and Women’s Hospital, and Harvard University.
The town is also home to several retail and dining establishments, including the Coolidge Corner Theatre, the Brookline Booksmith, and the Brookline Village shopping district.
Demographics
As of the 2010 census, the population of Brookline was 58,732. The racial makeup of the town was 79.2% White, 8.3% Asian, 6.2% African American, 0.2% Native American, 0.1% Pacific Islander, and 5.9% from other races.
The median age in Brookline was 40.2 years, with 24.2% of the population under the age of 18 and 13.2% over the age of 65. The median household income was $90,890, and the median home value was $837,400.
Brookline is a diverse community, with a large Jewish population and a growing number of immigrants from Asia and Latin America. The town is also home to a large number of college students, due to its proximity to several universities in the Boston area.
Common Questions
What is Per Capita Income in Brookline?
Per Capita income in Brookline is $91,184.
What is the Median Family Income in Brookline?
Median Family Income in Brookline is $209,618.
What is the Median Household income in Brookline?
Median Household Income in Brookline is $130,600.
What is Income or Wage Gap in Brookline?
Income or Wage Gap in Brookline is 35.9%.
Women in Brookline earn 64.1 cents for every dollar earned by a man.
What is Family Income Deficit in Brookline?
Family Income Deficit in Brookline is $11,063.
Families that are below poverty line in Brookline earn $11,063 less on average than the poverty threshold level.
What is Inequality or Gini Index in Brookline?
Inequality or Gini Index in Brookline is 0.54.
What is the Total Population of Brookline?
Total Population of Brookline is 62,698.
What is the Total Male Population of Brookline?
Total Male Population of Brookline is 28,743.
What is the Total Female Population of Brookline?
Total Female Population of Brookline is 33,955.
What is the Ratio of Males per 100 Females in Brookline?
There are 84.65 Males per 100 Females in Brookline.
What is the Ratio of Females per 100 Males in Brookline?
There are 118.13 Females per 100 Males in Brookline.
What is the Median Population Age in Brookline?
Median Population Age in Brookline is 35.1 Years.
What is the Average Family Size in Brookline
Average Family Size in Brookline is 3.0 People.
What is the Average Household Size in Brookline
Average Household Size in Brookline is 2.3 People.
How Large is the Labor Force in Brookline?
There are 37,293 People in the Labor Forcein in Brookline.
What is the Percentage of People in the Labor Force in Brookline?
71.8% of People are in the Labor Force in Brookline.
What is the Unemployment Rate in Brookline?
Unemployment Rate in Brookline is 3.5%.