Orleans, MA Map & Demographics
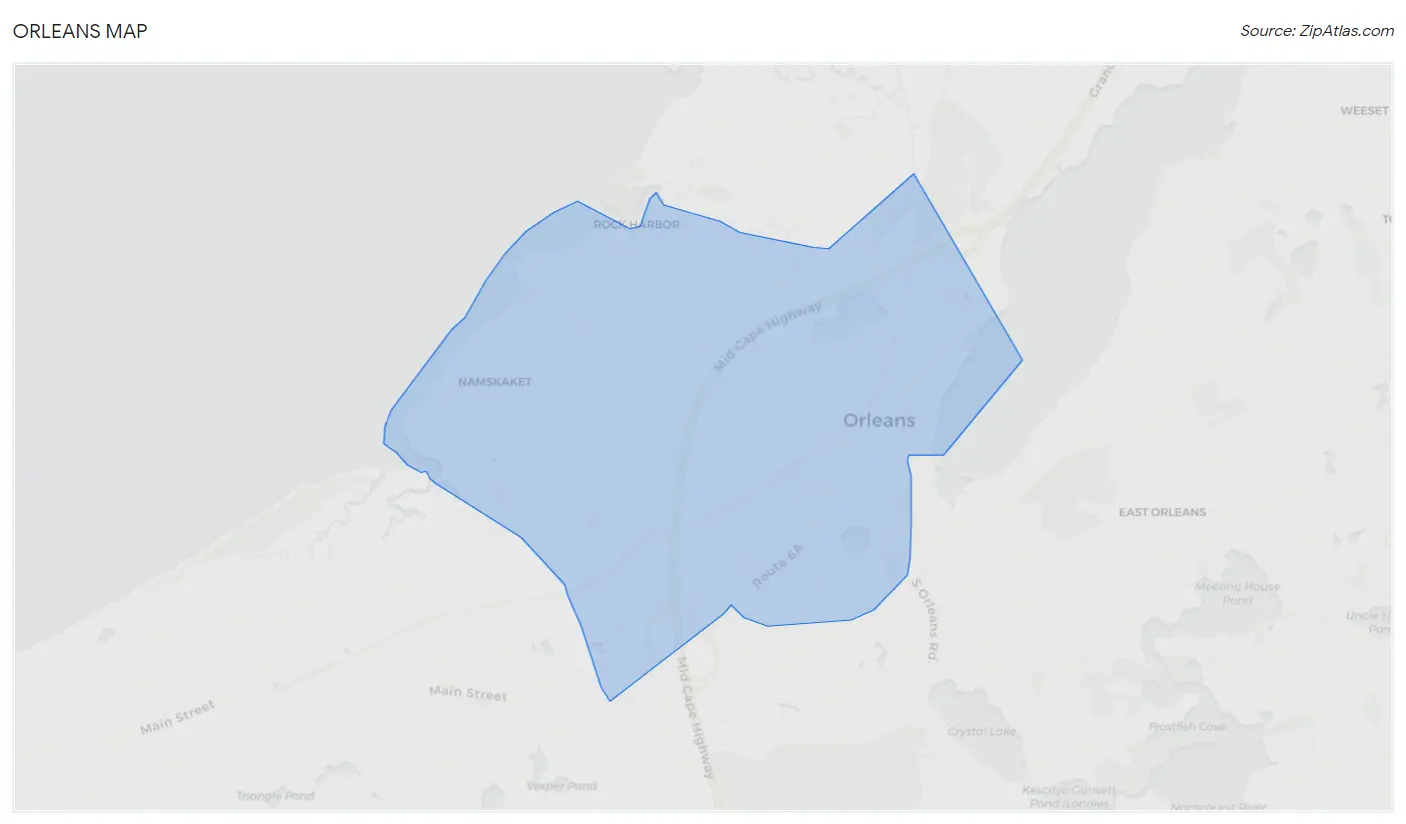
Orleans Map
Orleans Overview
$49,937
PER CAPITA INCOME
$102,188
AVG FAMILY INCOME
$72,422
AVG HOUSEHOLD INCOME
8.4%
WAGE / INCOME GAP [ % ]
91.6¢/ $1
WAGE / INCOME GAP [ $ ]
0.46
INEQUALITY / GINI INDEX
1,665
TOTAL POPULATION
594
MALE POPULATION
1,071
FEMALE POPULATION
55.46
MALES / 100 FEMALES
180.30
FEMALES / 100 MALES
64.3
MEDIAN AGE
2.7
AVG FAMILY SIZE
1.9
AVG HOUSEHOLD SIZE
767
LABOR FORCE [ PEOPLE ]
49.1%
PERCENT IN LABOR FORCE
Orleans Zip Codes
Income in Orleans
Income Overview in Orleans
Per Capita Income in Orleans is $49,937, while median incomes of families and households are $102,188 and $72,422 respectively.
| Characteristic | Number | Measure |
| Per Capita Income | 1,665 | $49,937 |
| Median Family Income | 395 | $102,188 |
| Mean Family Income | 395 | $132,475 |
| Median Household Income | 849 | $72,422 |
| Mean Household Income | 849 | $91,684 |
| Income Deficit | 395 | $0 |
| Wage / Income Gap (%) | 1,665 | 8.44% |
| Wage / Income Gap ($) | 1,665 | 91.56¢ per $1 |
| Gini / Inequality Index | 1,665 | 0.46 |
Earnings by Sex in Orleans
Average Earnings in Orleans are $45,130, $41,643 for men and $45,481 for women, a difference of 8.4%.
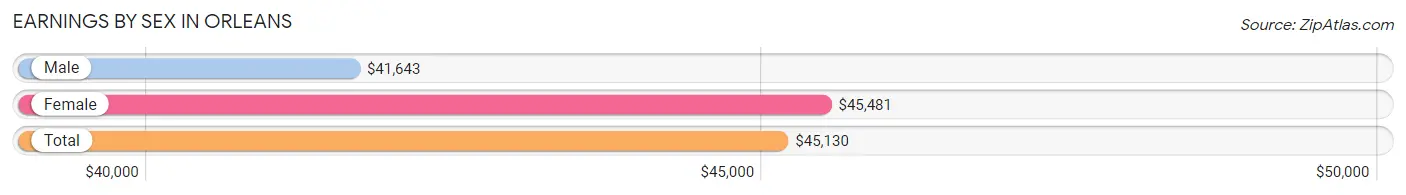
| Sex | Number | Average Earnings |
| Male | 324 (40.1%) | $41,643 |
| Female | 485 (60.0%) | $45,481 |
| Total | 809 (100.0%) | $45,130 |
Earnings by Sex by Income Bracket in Orleans
The most common earnings brackets in Orleans are $75,000 to $99,999 for men (60 | 18.5%) and $45,000 to $49,999 for women (136 | 28.0%).
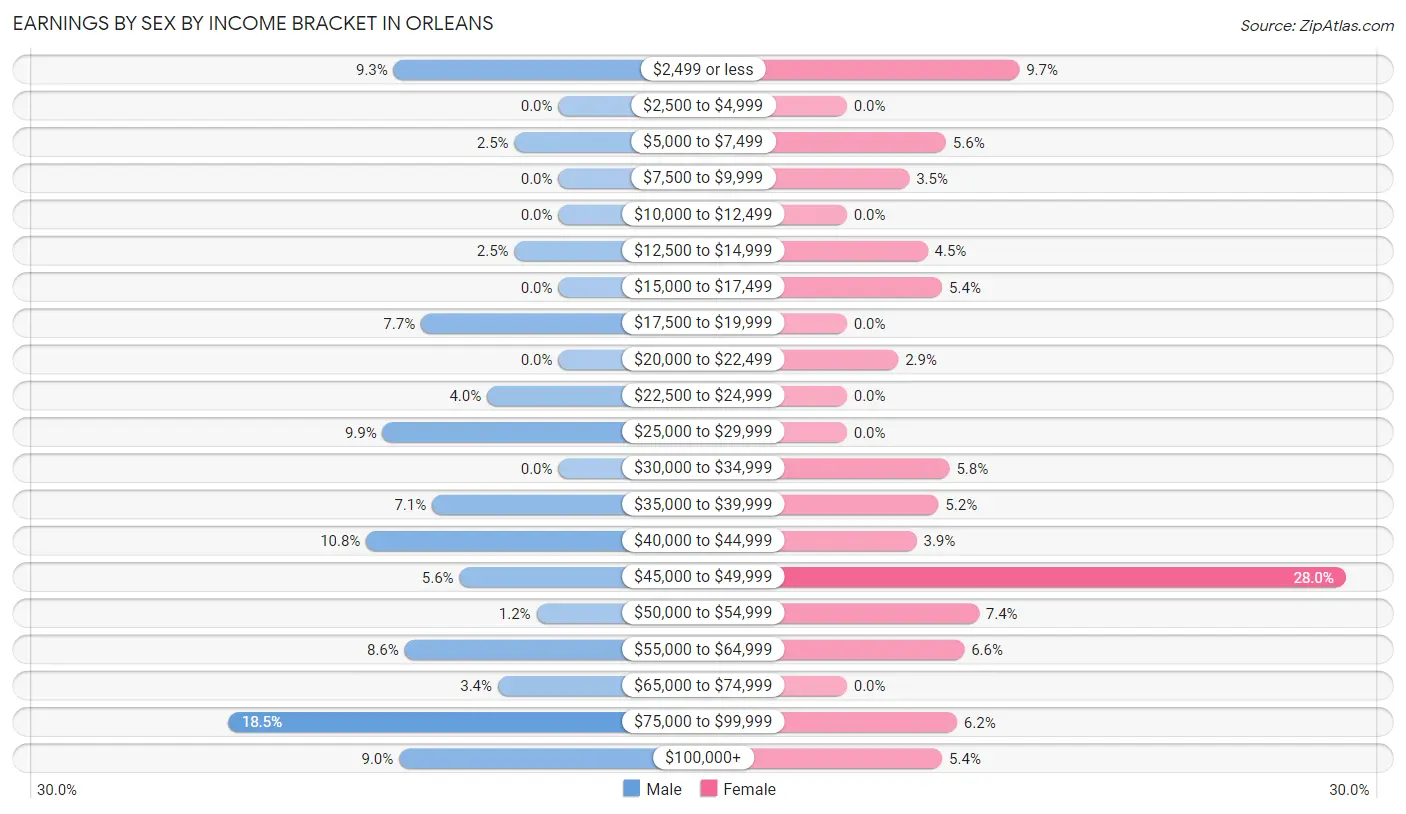
| Income | Male | Female |
| $2,499 or less | 30 (9.3%) | 47 (9.7%) |
| $2,500 to $4,999 | 0 (0.0%) | 0 (0.0%) |
| $5,000 to $7,499 | 8 (2.5%) | 27 (5.6%) |
| $7,500 to $9,999 | 0 (0.0%) | 17 (3.5%) |
| $10,000 to $12,499 | 0 (0.0%) | 0 (0.0%) |
| $12,500 to $14,999 | 8 (2.5%) | 22 (4.5%) |
| $15,000 to $17,499 | 0 (0.0%) | 26 (5.4%) |
| $17,500 to $19,999 | 25 (7.7%) | 0 (0.0%) |
| $20,000 to $22,499 | 0 (0.0%) | 14 (2.9%) |
| $22,500 to $24,999 | 13 (4.0%) | 0 (0.0%) |
| $25,000 to $29,999 | 32 (9.9%) | 0 (0.0%) |
| $30,000 to $34,999 | 0 (0.0%) | 28 (5.8%) |
| $35,000 to $39,999 | 23 (7.1%) | 25 (5.1%) |
| $40,000 to $44,999 | 35 (10.8%) | 19 (3.9%) |
| $45,000 to $49,999 | 18 (5.6%) | 136 (28.0%) |
| $50,000 to $54,999 | 4 (1.2%) | 36 (7.4%) |
| $55,000 to $64,999 | 28 (8.6%) | 32 (6.6%) |
| $65,000 to $74,999 | 11 (3.4%) | 0 (0.0%) |
| $75,000 to $99,999 | 60 (18.5%) | 30 (6.2%) |
| $100,000+ | 29 (8.9%) | 26 (5.4%) |
| Total | 324 (100.0%) | 485 (100.0%) |
Earnings by Sex by Educational Attainment in Orleans
Average earnings in Orleans are $52,188 for men and $45,810 for women, a difference of 12.2%. Men with an educational attainment of bachelor's degree enjoy the highest average annual earnings of $75,875, while those with graduate degree education earn the least with $40,729. Women with an educational attainment of bachelor's degree earn the most with the average annual earnings of $48,722, while those with high school diploma education have the smallest earnings of $33,672.
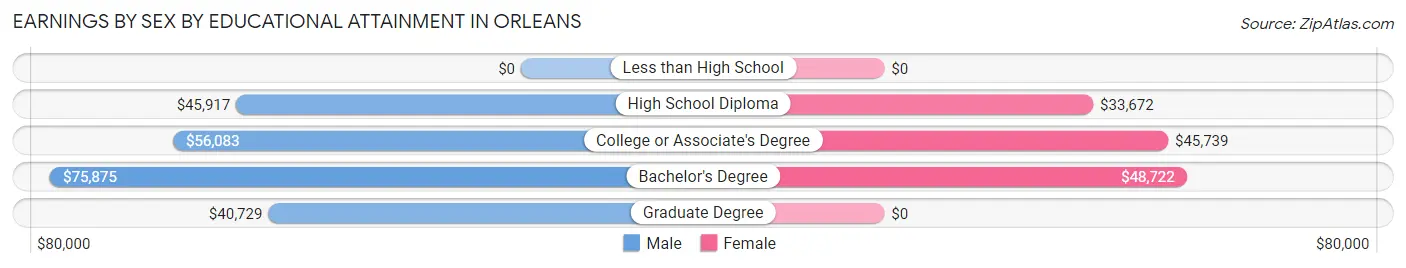
| Educational Attainment | Male Income | Female Income |
| Less than High School | - | - |
| High School Diploma | $45,917 | $33,672 |
| College or Associate's Degree | $56,083 | $45,739 |
| Bachelor's Degree | $75,875 | $48,722 |
| Graduate Degree | $40,729 | $0 |
| Total | $52,188 | $45,810 |
Family Income in Orleans
Family Income Brackets in Orleans
According to the Orleans family income data, there are 109 families falling into the $100,000 to $149,999 income range, which is the most common income bracket and makes up 27.6% of all families.
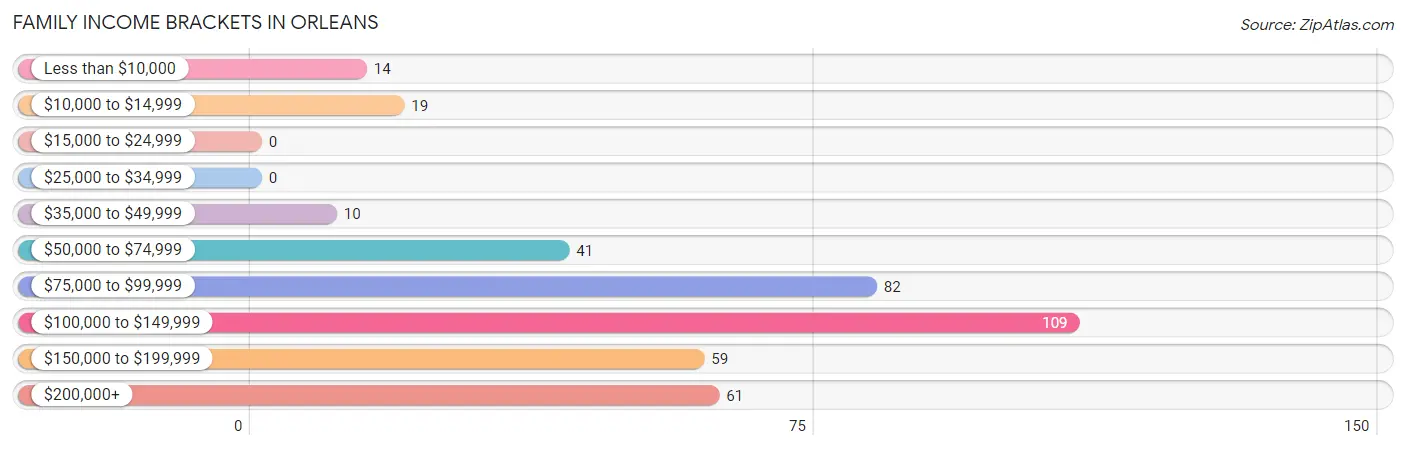
| Income Bracket | # Families | % Families |
| Less than $10,000 | 14 | 3.5% |
| $10,000 to $14,999 | 19 | 4.8% |
| $15,000 to $24,999 | 0 | 0.0% |
| $25,000 to $34,999 | 0 | 0.0% |
| $35,000 to $49,999 | 10 | 2.5% |
| $50,000 to $74,999 | 41 | 10.4% |
| $75,000 to $99,999 | 82 | 20.8% |
| $100,000 to $149,999 | 109 | 27.6% |
| $150,000 to $199,999 | 59 | 14.9% |
| $200,000+ | 61 | 15.4% |
Family Income by Famaliy Size in Orleans
3-person families (53 | 13.4%) account for the highest median family income in Orleans with $176,563 per family, while 3-person families (53 | 13.4%) have the highest median income of $58,854 per family member.
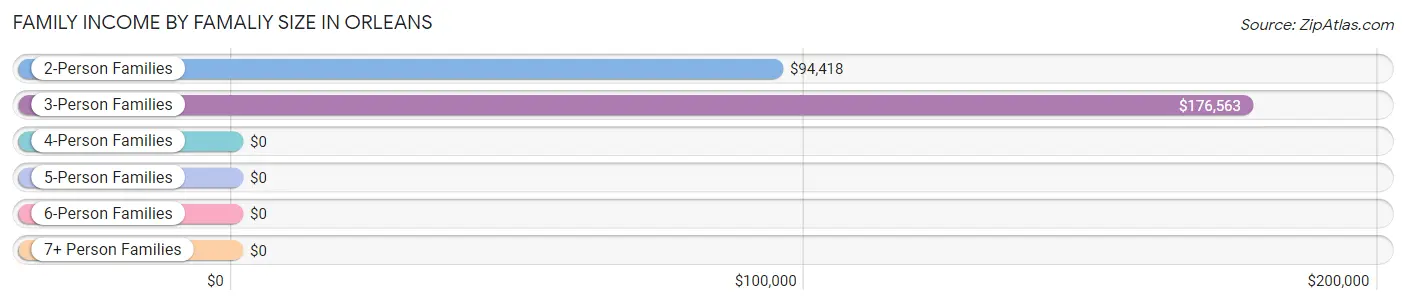
| Income Bracket | # Families | Median Income |
| 2-Person Families | 285 (72.2%) | $94,418 |
| 3-Person Families | 53 (13.4%) | $176,563 |
| 4-Person Families | 32 (8.1%) | $0 |
| 5-Person Families | 25 (6.3%) | $0 |
| 6-Person Families | 0 (0.0%) | $0 |
| 7+ Person Families | 0 (0.0%) | $0 |
| Total | 395 (100.0%) | $102,188 |
Family Income by Number of Earners in Orleans
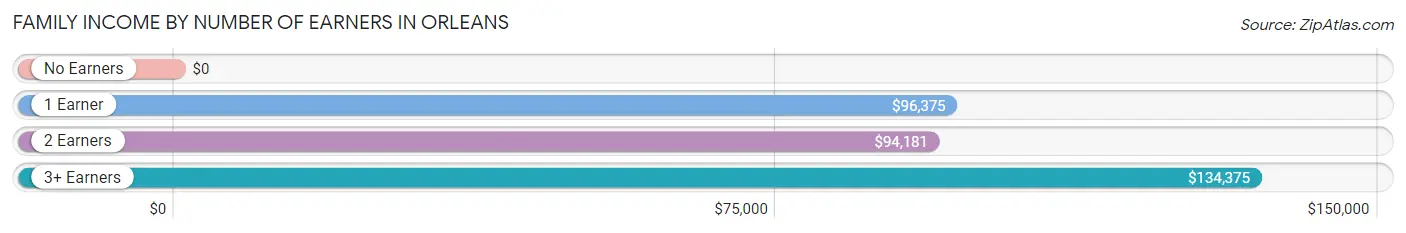
| Number of Earners | # Families | Median Income |
| No Earners | 140 (35.4%) | $0 |
| 1 Earner | 59 (14.9%) | $96,375 |
| 2 Earners | 130 (32.9%) | $94,181 |
| 3+ Earners | 66 (16.7%) | $134,375 |
| Total | 395 (100.0%) | $102,188 |
Household Income in Orleans
Household Income Brackets in Orleans
With 152 households falling in the category, the $50,000 to $74,999 income range is the most frequent in Orleans, accounting for 17.9% of all households. In contrast, only 31 households (3.6%) fall into the less than $10,000 income bracket, making it the least populous group.
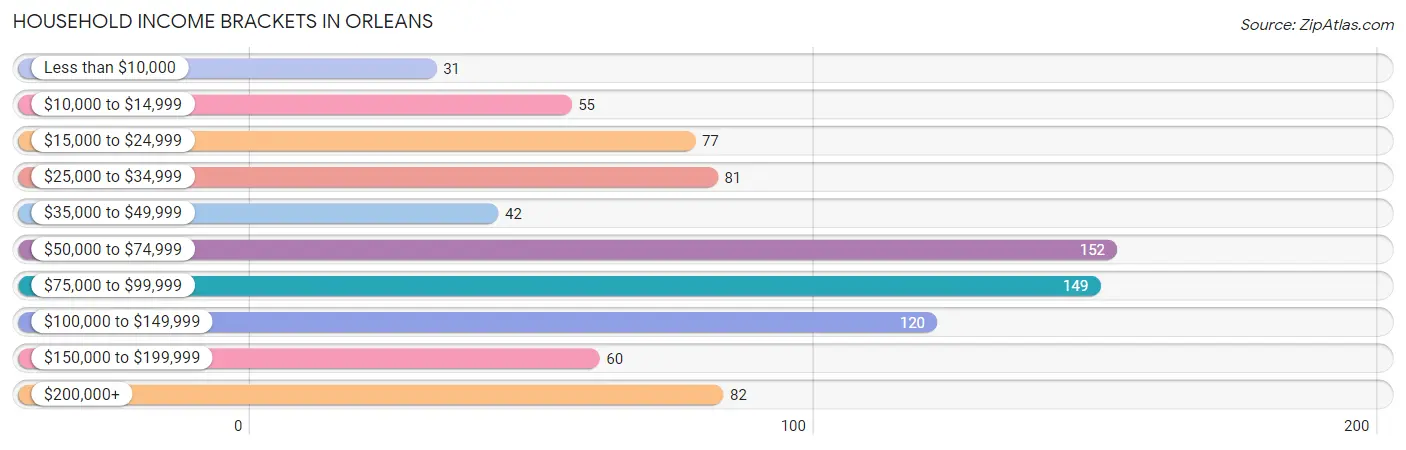
| Income Bracket | # Households | % Households |
| Less than $10,000 | 31 | 3.7% |
| $10,000 to $14,999 | 55 | 6.5% |
| $15,000 to $24,999 | 77 | 9.1% |
| $25,000 to $34,999 | 81 | 9.5% |
| $35,000 to $49,999 | 42 | 4.9% |
| $50,000 to $74,999 | 152 | 17.9% |
| $75,000 to $99,999 | 149 | 17.6% |
| $100,000 to $149,999 | 120 | 14.1% |
| $150,000 to $199,999 | 60 | 7.1% |
| $200,000+ | 82 | 9.7% |
Household Income by Householder Age in Orleans
The median household income in Orleans is $72,422, with the highest median household income of $93,139 found in the 25 to 44 years age bracket for the primary householder. A total of 105 households (12.4%) fall into this category. Meanwhile, the 15 to 24 years age bracket for the primary householder has the lowest median household income of $0, with 21 households (2.5%) in this group.
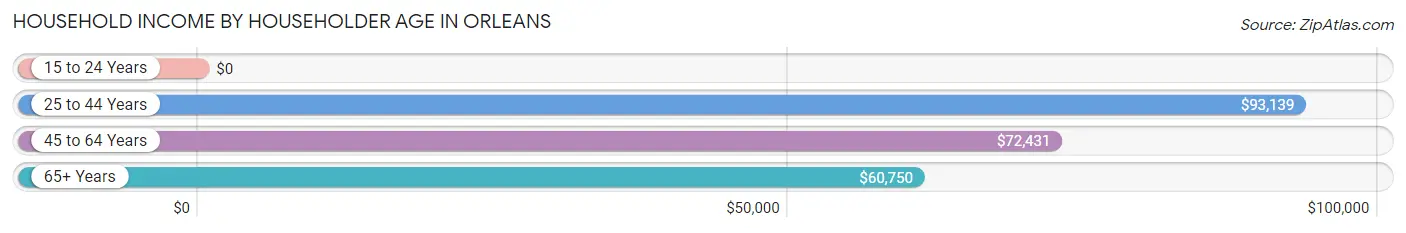
| Income Bracket | # Households | Median Income |
| 15 to 24 Years | 21 (2.5%) | $0 |
| 25 to 44 Years | 105 (12.4%) | $93,139 |
| 45 to 64 Years | 205 (24.1%) | $72,431 |
| 65+ Years | 518 (61.0%) | $60,750 |
| Total | 849 (100.0%) | $72,422 |
Poverty in Orleans
Income Below Poverty by Sex and Age in Orleans
With 7.1% poverty level for males and 18.2% for females among the residents of Orleans, under 5 year old males and 25 to 34 year old females are the most vulnerable to poverty, with 20 males (54.0%) and 40 females (61.5%) in their respective age groups living below the poverty level.
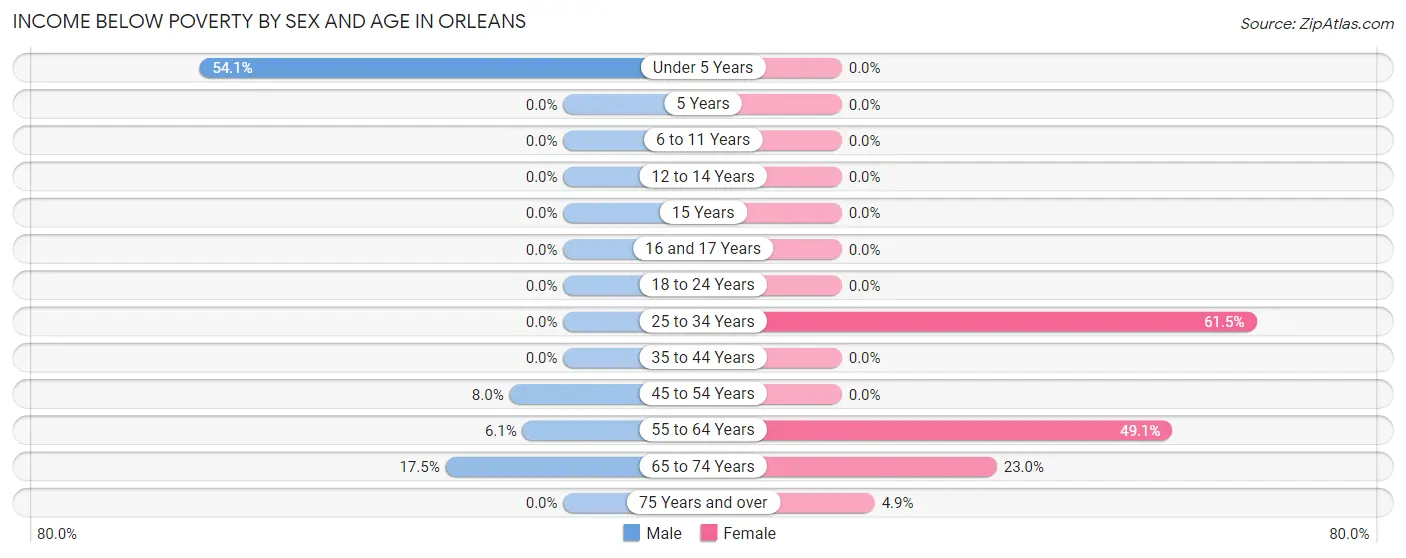
| Age Bracket | Male | Female |
| Under 5 Years | 20 (54.0%) | 0 (0.0%) |
| 5 Years | 0 (0.0%) | 0 (0.0%) |
| 6 to 11 Years | 0 (0.0%) | 0 (0.0%) |
| 12 to 14 Years | 0 (0.0%) | 0 (0.0%) |
| 15 Years | 0 (0.0%) | 0 (0.0%) |
| 16 and 17 Years | 0 (0.0%) | 0 (0.0%) |
| 18 to 24 Years | 0 (0.0%) | 0 (0.0%) |
| 25 to 34 Years | 0 (0.0%) | 40 (61.5%) |
| 35 to 44 Years | 0 (0.0%) | 0 (0.0%) |
| 45 to 54 Years | 4 (8.0%) | 0 (0.0%) |
| 55 to 64 Years | 4 (6.1%) | 80 (49.1%) |
| 65 to 74 Years | 14 (17.5%) | 64 (23.0%) |
| 75 Years and over | 0 (0.0%) | 11 (4.9%) |
| Total | 42 (7.1%) | 195 (18.2%) |
Income Above Poverty by Sex and Age in Orleans
According to the poverty statistics in Orleans, males aged 12 to 14 years and females aged 6 to 11 years are the age groups that are most secure financially, with 100.0% of males and 100.0% of females in these age groups living above the poverty line.
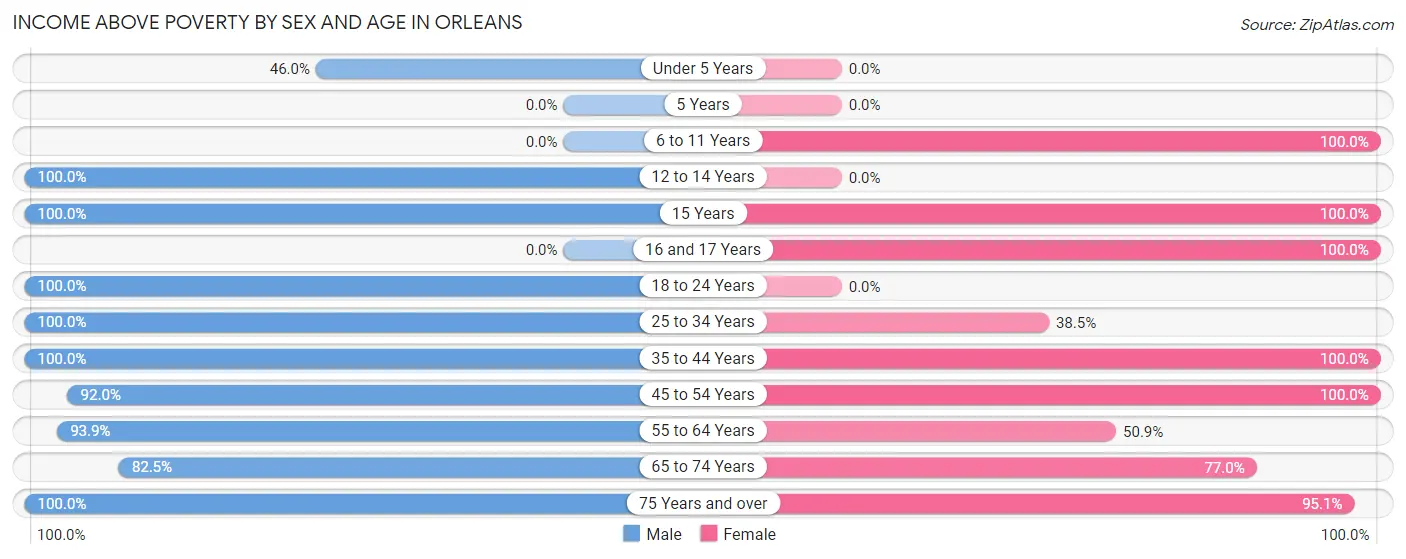
| Age Bracket | Male | Female |
| Under 5 Years | 17 (46.0%) | 0 (0.0%) |
| 5 Years | 0 (0.0%) | 0 (0.0%) |
| 6 to 11 Years | 0 (0.0%) | 15 (100.0%) |
| 12 to 14 Years | 11 (100.0%) | 0 (0.0%) |
| 15 Years | 32 (100.0%) | 7 (100.0%) |
| 16 and 17 Years | 0 (0.0%) | 34 (100.0%) |
| 18 to 24 Years | 67 (100.0%) | 0 (0.0%) |
| 25 to 34 Years | 39 (100.0%) | 25 (38.5%) |
| 35 to 44 Years | 47 (100.0%) | 156 (100.0%) |
| 45 to 54 Years | 46 (92.0%) | 128 (100.0%) |
| 55 to 64 Years | 62 (93.9%) | 83 (50.9%) |
| 65 to 74 Years | 66 (82.5%) | 214 (77.0%) |
| 75 Years and over | 165 (100.0%) | 214 (95.1%) |
| Total | 552 (92.9%) | 876 (81.8%) |
Income Below Poverty Among Married-Couple Families in Orleans
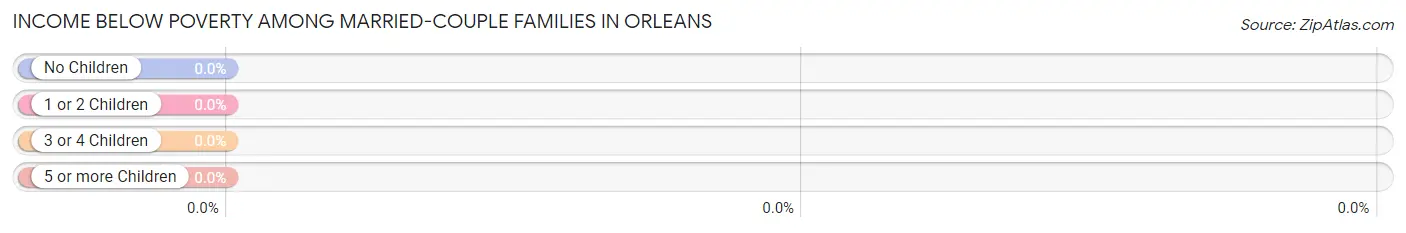
| Children | Above Poverty | Below Poverty |
| No Children | 227 (100.0%) | 0 (0.0%) |
| 1 or 2 Children | 55 (100.0%) | 0 (0.0%) |
| 3 or 4 Children | 0 (0.0%) | 0 (0.0%) |
| 5 or more Children | 0 (0.0%) | 0 (0.0%) |
| Total | 282 (100.0%) | 0 (0.0%) |
Income Below Poverty Among Single-Parent Households in Orleans
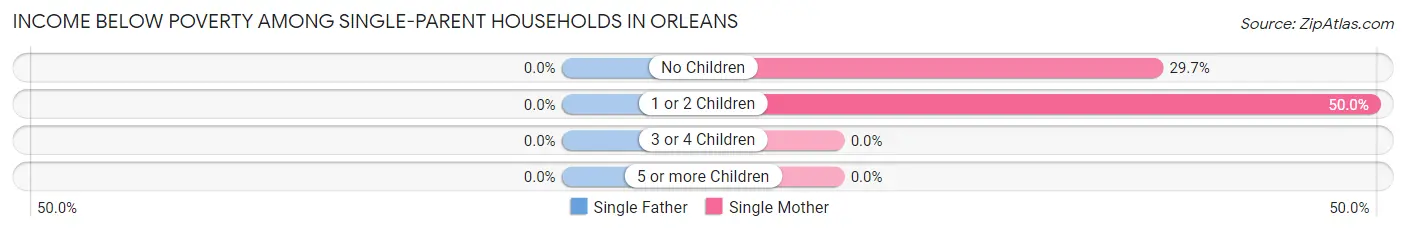
| Children | Single Father | Single Mother |
| No Children | 0 (0.0%) | 19 (29.7%) |
| 1 or 2 Children | 0 (0.0%) | 14 (50.0%) |
| 3 or 4 Children | 0 (0.0%) | 0 (0.0%) |
| 5 or more Children | 0 (0.0%) | 0 (0.0%) |
| Total | 0 (0.0%) | 33 (35.9%) |
Income Below Poverty Among Married-Couple vs Single-Parent Households in Orleans
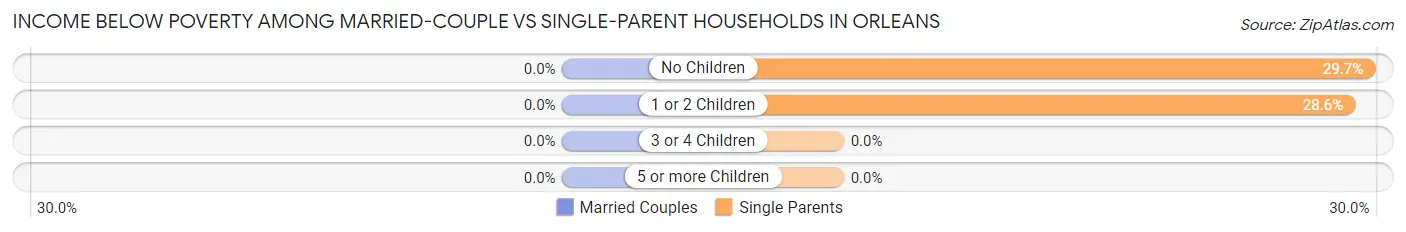
| Children | Married-Couple Families | Single-Parent Households |
| No Children | 0 (0.0%) | 19 (29.7%) |
| 1 or 2 Children | 0 (0.0%) | 14 (28.6%) |
| 3 or 4 Children | 0 (0.0%) | 0 (0.0%) |
| 5 or more Children | 0 (0.0%) | 0 (0.0%) |
| Total | 0 (0.0%) | 33 (29.2%) |
Race in Orleans
The most populous races in Orleans are White / Caucasian (1,594 | 95.7%), Hispanic or Latino (71 | 4.3%), and Two or more Races (61 | 3.7%).
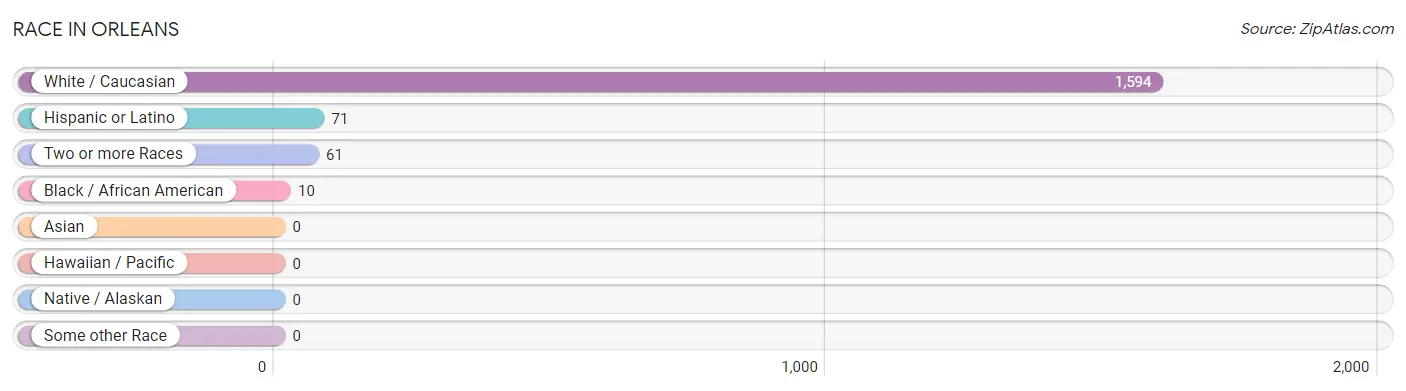
| Race | # Population | % Population |
| Asian | 0 | 0.0% |
| Black / African American | 10 | 0.6% |
| Hawaiian / Pacific | 0 | 0.0% |
| Hispanic or Latino | 71 | 4.3% |
| Native / Alaskan | 0 | 0.0% |
| White / Caucasian | 1,594 | 95.7% |
| Two or more Races | 61 | 3.7% |
| Some other Race | 0 | 0.0% |
| Total | 1,665 | 100.0% |
Ancestry in Orleans
The most populous ancestries reported in Orleans are Irish (652 | 39.2%), English (351 | 21.1%), German (295 | 17.7%), Italian (169 | 10.2%), and Polish (112 | 6.7%), together accounting for 94.8% of all Orleans residents.
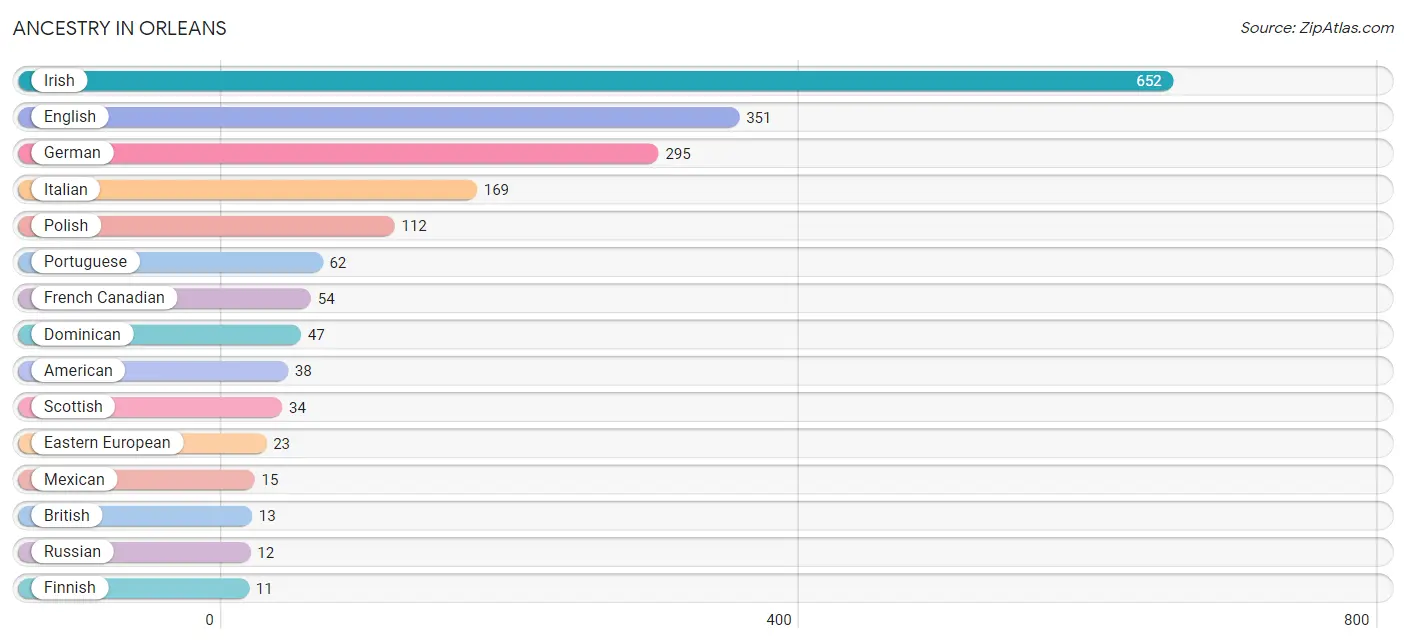
| Ancestry | # Population | % Population |
| Alsatian | 10 | 0.6% |
| American | 38 | 2.3% |
| British | 13 | 0.8% |
| Canadian | 4 | 0.2% |
| Central American | 9 | 0.5% |
| Czech | 10 | 0.6% |
| Dominican | 47 | 2.8% |
| Eastern European | 23 | 1.4% |
| English | 351 | 21.1% |
| Finnish | 11 | 0.7% |
| French | 9 | 0.5% |
| French Canadian | 54 | 3.2% |
| German | 295 | 17.7% |
| Greek | 10 | 0.6% |
| Guatemalan | 9 | 0.5% |
| Hungarian | 11 | 0.7% |
| Irish | 652 | 39.2% |
| Italian | 169 | 10.2% |
| Lithuanian | 11 | 0.7% |
| Mexican | 15 | 0.9% |
| Polish | 112 | 6.7% |
| Portuguese | 62 | 3.7% |
| Russian | 12 | 0.7% |
| Scandinavian | 4 | 0.2% |
| Scottish | 34 | 2.0% |
| Slovak | 11 | 0.7% |
| Swedish | 10 | 0.6% |
| Welsh | 11 | 0.7% | View All 28 Rows |
Immigrants in Orleans
The most numerous immigrant groups reported in Orleans came from Caribbean (27 | 1.6%), Dominican Republic (27 | 1.6%), Latin America (27 | 1.6%), Asia (13 | 0.8%), and China (13 | 0.8%), together accounting for 6.4% of all Orleans residents.
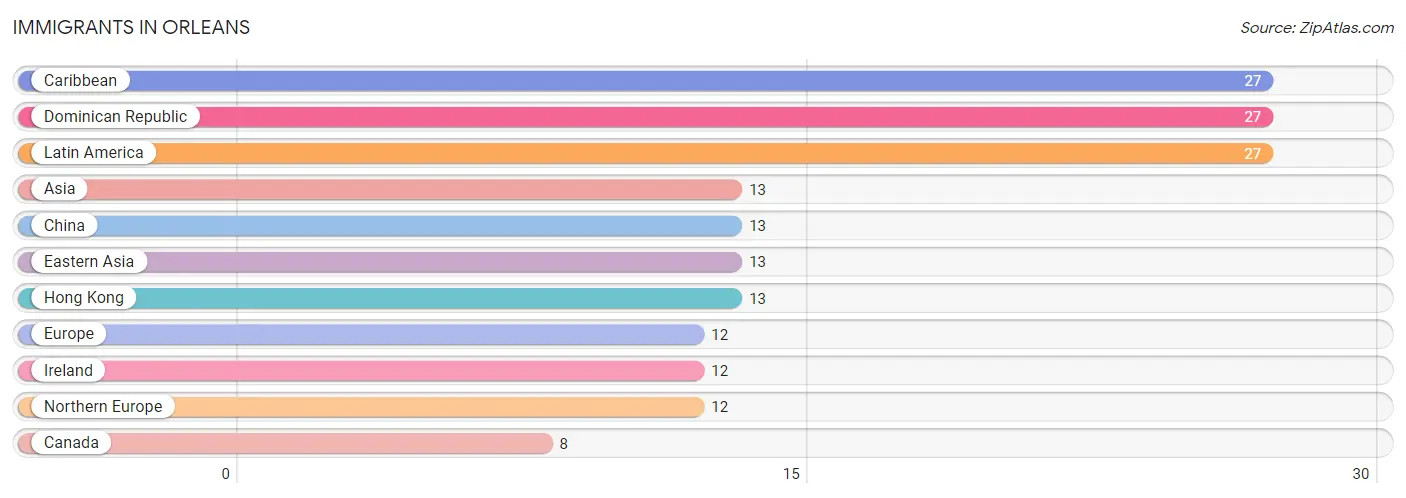
| Immigration Origin | # Population | % Population |
| Asia | 13 | 0.8% |
| Canada | 8 | 0.5% |
| Caribbean | 27 | 1.6% |
| China | 13 | 0.8% |
| Dominican Republic | 27 | 1.6% |
| Eastern Asia | 13 | 0.8% |
| Europe | 12 | 0.7% |
| Hong Kong | 13 | 0.8% |
| Ireland | 12 | 0.7% |
| Latin America | 27 | 1.6% |
| Northern Europe | 12 | 0.7% | View All 11 Rows |
Sex and Age in Orleans
Sex and Age in Orleans
The most populous age groups in Orleans are 75 to 79 Years (114 | 19.2%) for men and 70 to 74 Years (213 | 19.9%) for women.
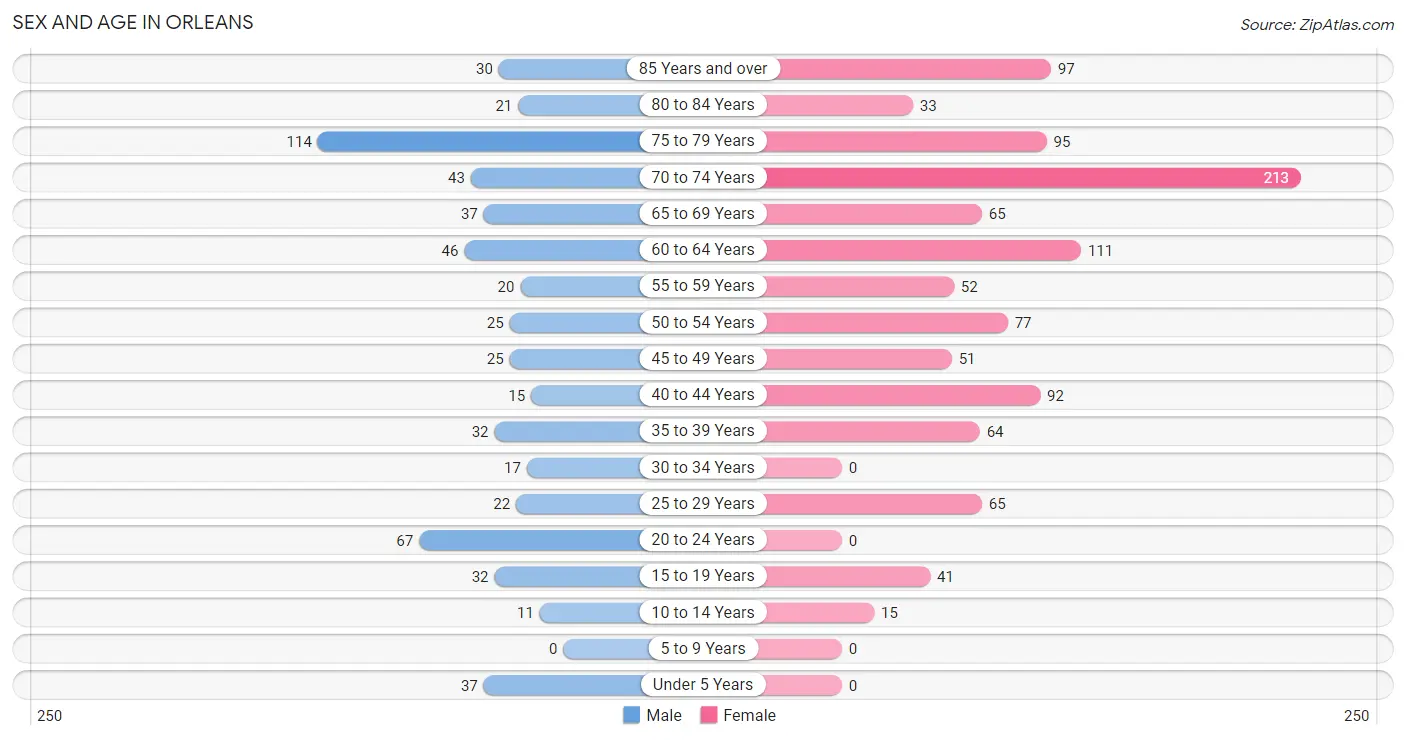
| Age Bracket | Male | Female |
| Under 5 Years | 37 (6.2%) | 0 (0.0%) |
| 5 to 9 Years | 0 (0.0%) | 0 (0.0%) |
| 10 to 14 Years | 11 (1.8%) | 15 (1.4%) |
| 15 to 19 Years | 32 (5.4%) | 41 (3.8%) |
| 20 to 24 Years | 67 (11.3%) | 0 (0.0%) |
| 25 to 29 Years | 22 (3.7%) | 65 (6.1%) |
| 30 to 34 Years | 17 (2.9%) | 0 (0.0%) |
| 35 to 39 Years | 32 (5.4%) | 64 (6.0%) |
| 40 to 44 Years | 15 (2.5%) | 92 (8.6%) |
| 45 to 49 Years | 25 (4.2%) | 51 (4.8%) |
| 50 to 54 Years | 25 (4.2%) | 77 (7.2%) |
| 55 to 59 Years | 20 (3.4%) | 52 (4.9%) |
| 60 to 64 Years | 46 (7.7%) | 111 (10.4%) |
| 65 to 69 Years | 37 (6.2%) | 65 (6.1%) |
| 70 to 74 Years | 43 (7.2%) | 213 (19.9%) |
| 75 to 79 Years | 114 (19.2%) | 95 (8.9%) |
| 80 to 84 Years | 21 (3.5%) | 33 (3.1%) |
| 85 Years and over | 30 (5.1%) | 97 (9.1%) |
| Total | 594 (100.0%) | 1,071 (100.0%) |
Families and Households in Orleans
Median Family Size in Orleans
The median family size in Orleans is 2.68 persons per family, with single male/father families (21 | 5.3%) accounting for the largest median family size of 3.76 persons per family. On the other hand, married-couple families (282 | 71.4%) represent the smallest median family size with 2.54 persons per family.
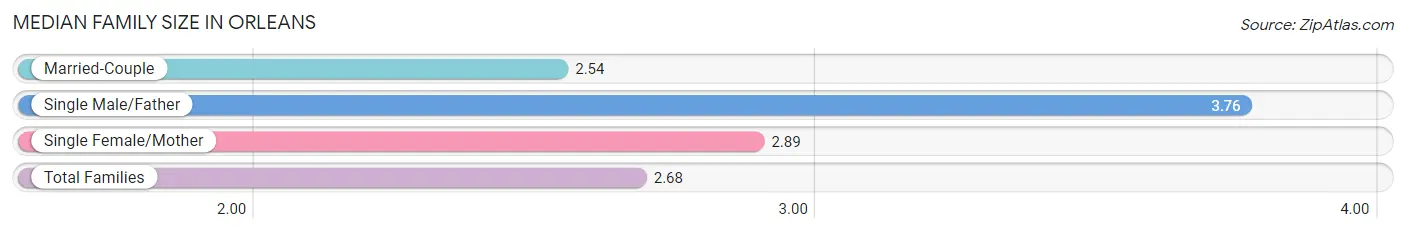
| Family Type | # Families | Family Size |
| Married-Couple | 282 (71.4%) | 2.54 |
| Single Male/Father | 21 (5.3%) | 3.76 |
| Single Female/Mother | 92 (23.3%) | 2.89 |
| Total Families | 395 (100.0%) | 2.68 |
Median Household Size in Orleans
The median household size in Orleans is 1.91 persons per household, with single male/father households (21 | 2.5%) accounting for the largest median household size of 3.76 persons per household. non-family households (454 | 53.5%) represent the smallest median household size with 1.13 persons per household.
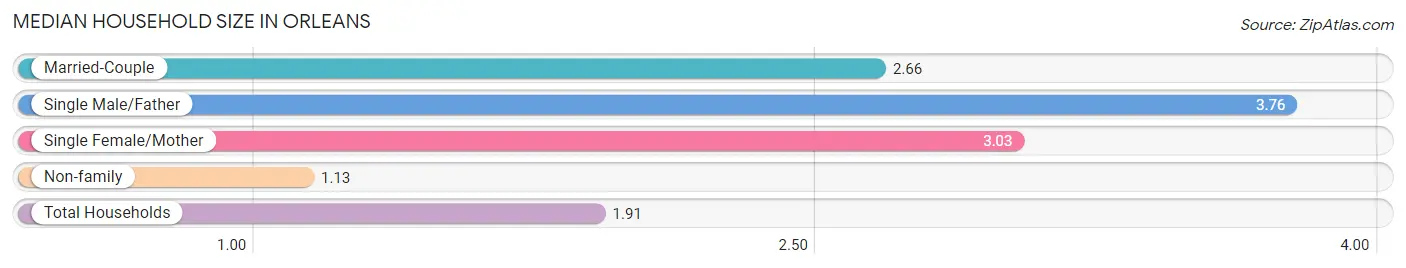
| Household Type | # Households | Household Size |
| Married-Couple | 282 (33.2%) | 2.66 |
| Single Male/Father | 21 (2.5%) | 3.76 |
| Single Female/Mother | 92 (10.8%) | 3.03 |
| Non-family | 454 (53.5%) | 1.13 |
| Total Households | 849 (100.0%) | 1.91 |
Household Size by Marriage Status in Orleans
Out of a total of 849 households in Orleans, 395 (46.5%) are family households, while 454 (53.5%) are nonfamily households. The most numerous type of family households are 2-person households, comprising 271, and the most common type of nonfamily households are 1-person households, comprising 397.
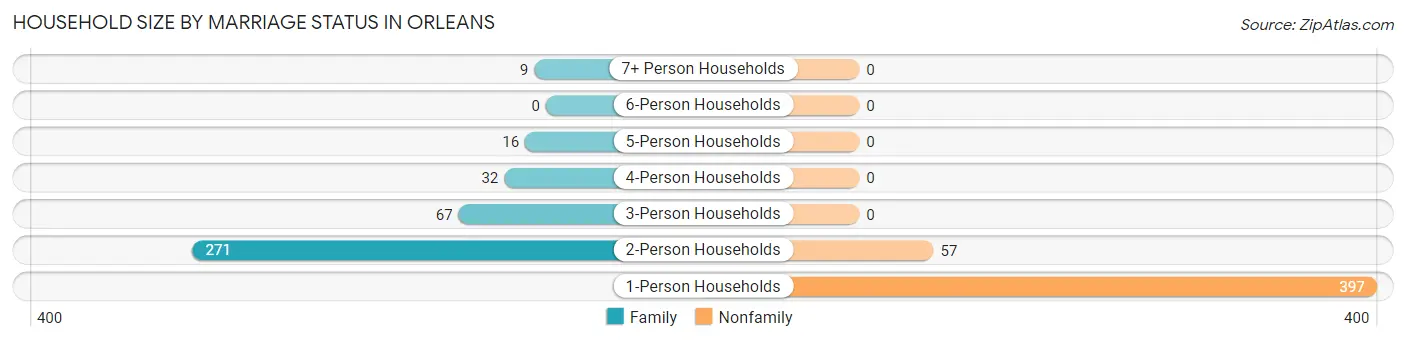
| Household Size | Family Households | Nonfamily Households |
| 1-Person Households | - | 397 (46.8%) |
| 2-Person Households | 271 (31.9%) | 57 (6.7%) |
| 3-Person Households | 67 (7.9%) | 0 (0.0%) |
| 4-Person Households | 32 (3.8%) | 0 (0.0%) |
| 5-Person Households | 16 (1.9%) | 0 (0.0%) |
| 6-Person Households | 0 (0.0%) | 0 (0.0%) |
| 7+ Person Households | 9 (1.1%) | 0 (0.0%) |
| Total | 395 (46.5%) | 454 (53.5%) |
Female Fertility in Orleans
Fertility by Age in Orleans
| Age Bracket | Women with Births | Births / 1,000 Women |
| 15 to 19 years | 0 (0.0%) | 0.0 |
| 20 to 34 years | 0 (0.0%) | 0.0 |
| 35 to 50 years | 0 (0.0%) | 0.0 |
| Total | 0 (0.0%) | 0.0 |
Fertility by Age by Marriage Status in Orleans
| Age Bracket | Married | Unmarried |
| 15 to 19 years | 0 (0.0%) | 0 (0.0%) |
| 20 to 34 years | 0 (0.0%) | 0 (0.0%) |
| 35 to 50 years | 0 (0.0%) | 0 (0.0%) |
| Total | 0 (0.0%) | 0 (0.0%) |
Fertility by Education in Orleans
| Educational Attainment | Women with Births | Births / 1,000 Women |
| Less than High School | 0 (0.0%) | 0.0 |
| High School Diploma | 0 (0.0%) | 0.0 |
| College or Associate's Degree | 0 (0.0%) | 0.0 |
| Bachelor's Degree | 0 (0.0%) | 0.0 |
| Graduate Degree | 0 (0.0%) | 0.0 |
| Total | 0 (0.0%) | 0.0 |
Fertility by Education by Marriage Status in Orleans
| Educational Attainment | Married | Unmarried |
| Less than High School | 0 (0.0%) | 0 (0.0%) |
| High School Diploma | 0 (0.0%) | 0 (0.0%) |
| College or Associate's Degree | 0 (0.0%) | 0 (0.0%) |
| Bachelor's Degree | 0 (0.0%) | 0 (0.0%) |
| Graduate Degree | 0 (0.0%) | 0 (0.0%) |
| Total | 0 (0.0%) | 0 (0.0%) |
Employment Characteristics in Orleans
Employment by Class of Employer in Orleans
Among the 743 employed individuals in Orleans, private company employees (409 | 55.0%), not-for-profit organizations (161 | 21.7%), and local government employees (70 | 9.4%) make up the most common classes of employment.
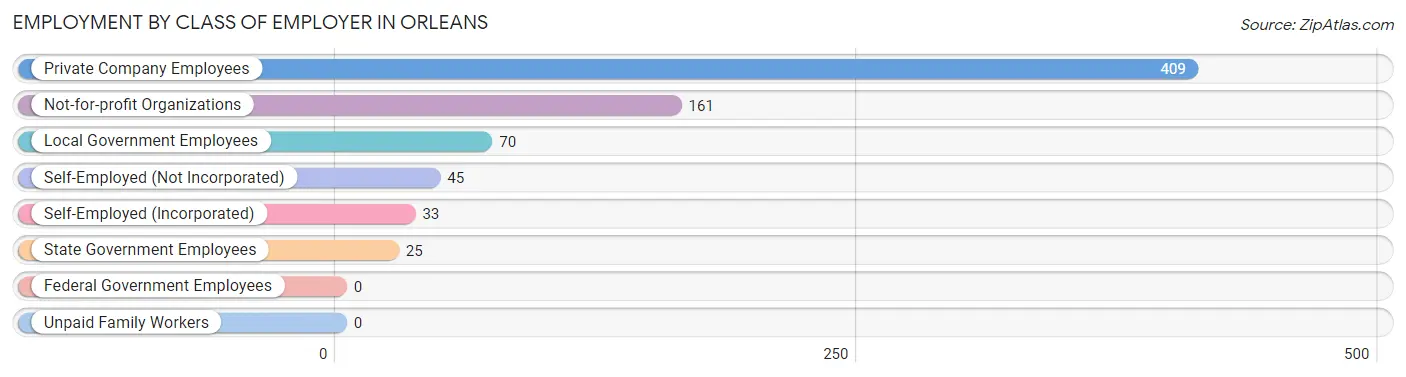
| Employer Class | # Employees | % Employees |
| Private Company Employees | 409 | 55.0% |
| Self-Employed (Incorporated) | 33 | 4.4% |
| Self-Employed (Not Incorporated) | 45 | 6.1% |
| Not-for-profit Organizations | 161 | 21.7% |
| Local Government Employees | 70 | 9.4% |
| State Government Employees | 25 | 3.4% |
| Federal Government Employees | 0 | 0.0% |
| Unpaid Family Workers | 0 | 0.0% |
| Total | 743 | 100.0% |
Employment Status by Age in Orleans
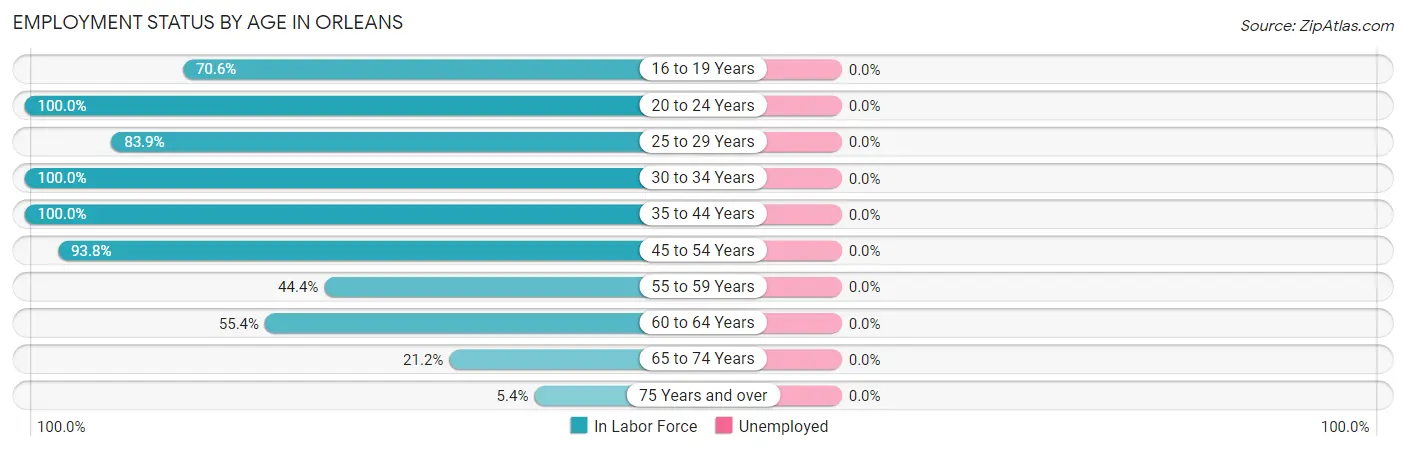
| Age Bracket | In Labor Force | Unemployed |
| 16 to 19 Years | 24 (70.6%) | 0 (0.0%) |
| 20 to 24 Years | 67 (100.0%) | 0 (0.0%) |
| 25 to 29 Years | 73 (83.9%) | 0 (0.0%) |
| 30 to 34 Years | 17 (100.0%) | 0 (0.0%) |
| 35 to 44 Years | 203 (100.0%) | 0 (0.0%) |
| 45 to 54 Years | 167 (93.8%) | 0 (0.0%) |
| 55 to 59 Years | 32 (44.4%) | 0 (0.0%) |
| 60 to 64 Years | 87 (55.4%) | 0 (0.0%) |
| 65 to 74 Years | 76 (21.2%) | 0 (0.0%) |
| 75 Years and over | 21 (5.4%) | 0 (0.0%) |
| Total | 767 (49.1%) | 0 (0.0%) |
Employment Status by Educational Attainment in Orleans
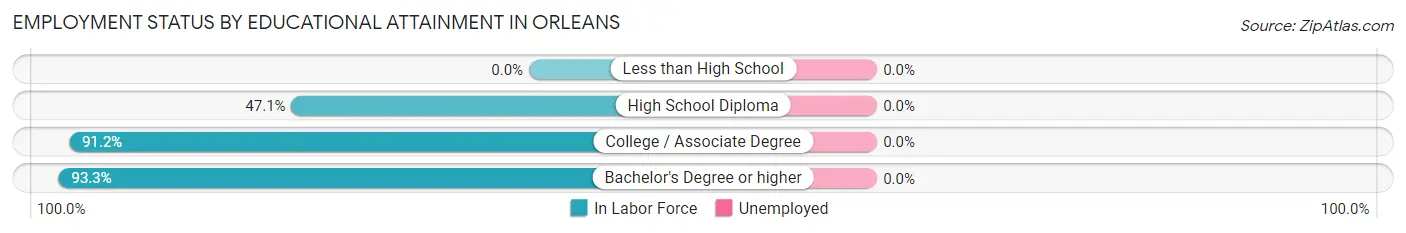
| Educational Attainment | In Labor Force | Unemployed |
| Less than High School | 0 (0.0%) | 0 (0.0%) |
| High School Diploma | 74 (47.1%) | 0 (0.0%) |
| College / Associate Degree | 187 (91.2%) | 0 (0.0%) |
| Bachelor's Degree or higher | 318 (93.3%) | 0 (0.0%) |
| Total | 579 (81.1%) | 0 (0.0%) |
Employment Occupations by Sex in Orleans
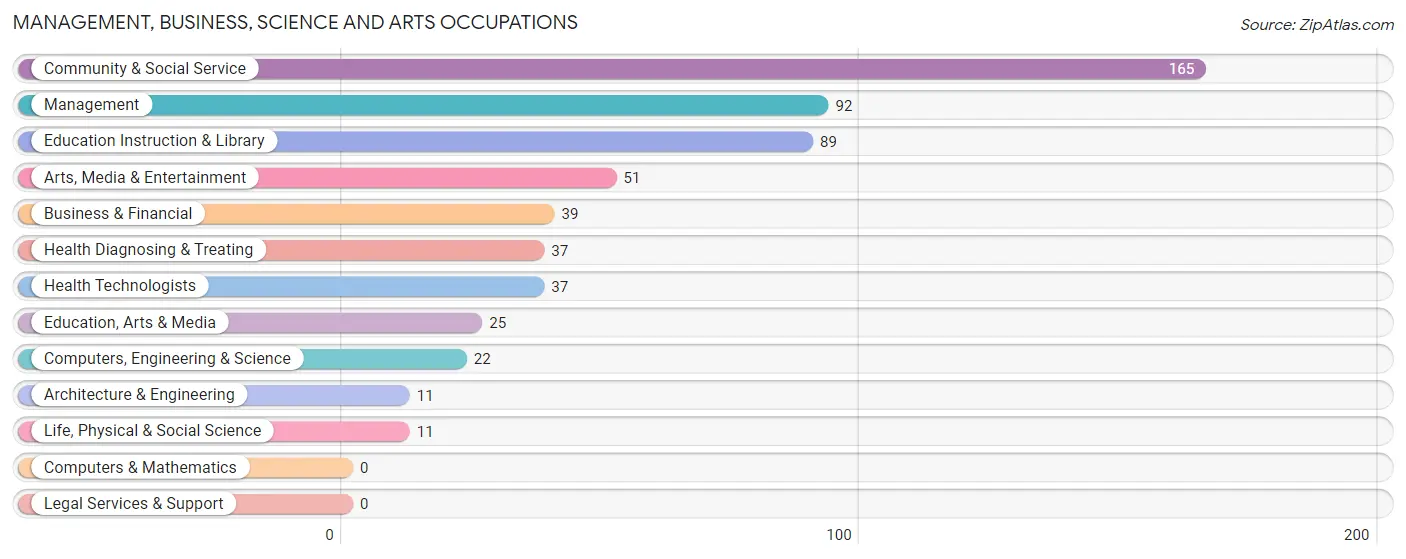
Management, Business, Science and Arts Occupations
The most common Management, Business, Science and Arts occupations in Orleans are Community & Social Service (165 | 21.5%), Management (92 | 12.0%), Education Instruction & Library (89 | 11.6%), Arts, Media & Entertainment (51 | 6.7%), and Business & Financial (39 | 5.1%).
Management, Business, Science and Arts Occupations by Sex
Within the Management, Business, Science and Arts occupations in Orleans, the most male-oriented occupations are Architecture & Engineering (100.0%), Computers, Engineering & Science (50.0%), and Health Diagnosing & Treating (48.6%), while the most female-oriented occupations are Business & Financial (100.0%), Life, Physical & Social Science (100.0%), and Education, Arts & Media (88.0%).
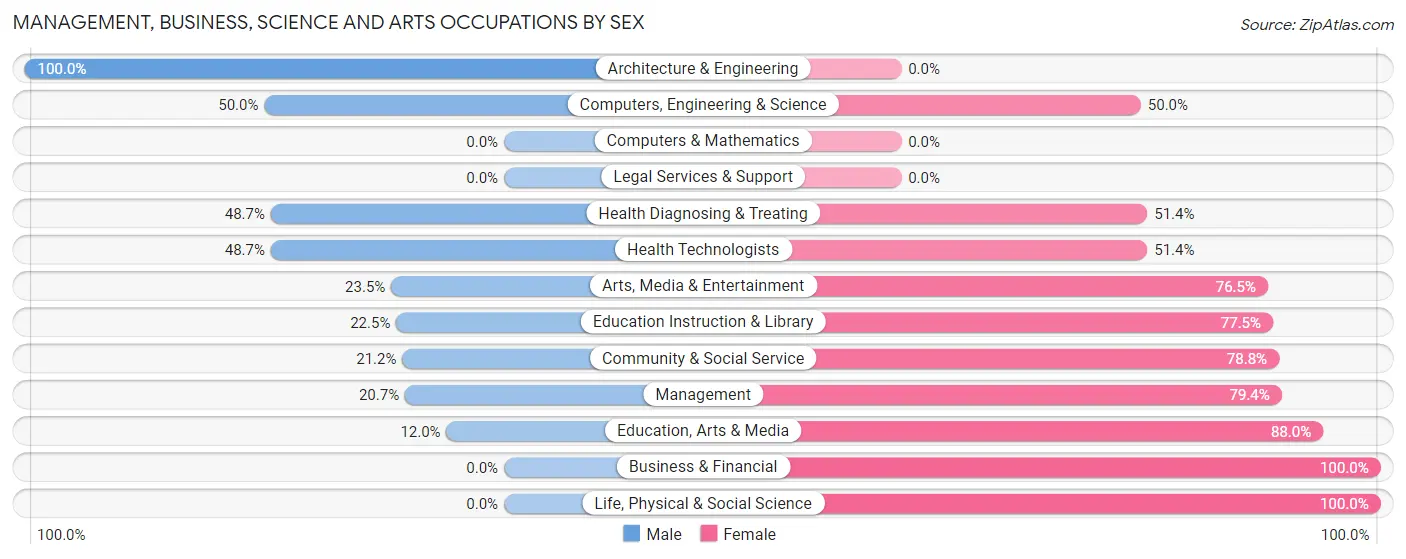
| Occupation | Male | Female |
| Management | 19 (20.6%) | 73 (79.3%) |
| Business & Financial | 0 (0.0%) | 39 (100.0%) |
| Computers, Engineering & Science | 11 (50.0%) | 11 (50.0%) |
| Computers & Mathematics | 0 (0.0%) | 0 (0.0%) |
| Architecture & Engineering | 11 (100.0%) | 0 (0.0%) |
| Life, Physical & Social Science | 0 (0.0%) | 11 (100.0%) |
| Community & Social Service | 35 (21.2%) | 130 (78.8%) |
| Education, Arts & Media | 3 (12.0%) | 22 (88.0%) |
| Legal Services & Support | 0 (0.0%) | 0 (0.0%) |
| Education Instruction & Library | 20 (22.5%) | 69 (77.5%) |
| Arts, Media & Entertainment | 12 (23.5%) | 39 (76.5%) |
| Health Diagnosing & Treating | 18 (48.6%) | 19 (51.3%) |
| Health Technologists | 18 (48.6%) | 19 (51.3%) |
| Total (Category) | 83 (23.4%) | 272 (76.6%) |
| Total (Overall) | 315 (41.1%) | 452 (58.9%) |
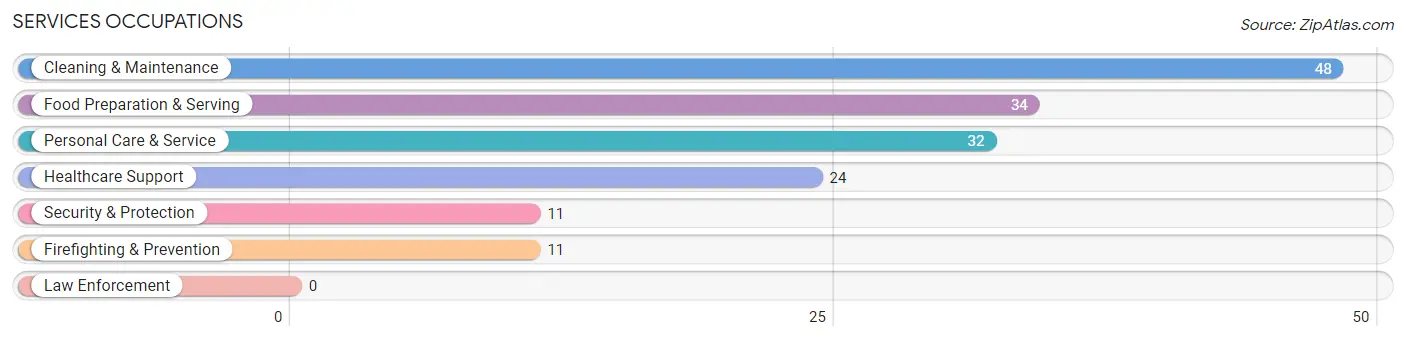
Services Occupations
The most common Services occupations in Orleans are Cleaning & Maintenance (48 | 6.3%), Food Preparation & Serving (34 | 4.4%), Personal Care & Service (32 | 4.2%), Healthcare Support (24 | 3.1%), and Security & Protection (11 | 1.4%).
Services Occupations by Sex
Within the Services occupations in Orleans, the most male-oriented occupations are Healthcare Support (100.0%), Security & Protection (100.0%), and Firefighting & Prevention (100.0%), while the most female-oriented occupations are Personal Care & Service (75.0%), and Food Preparation & Serving (20.6%).
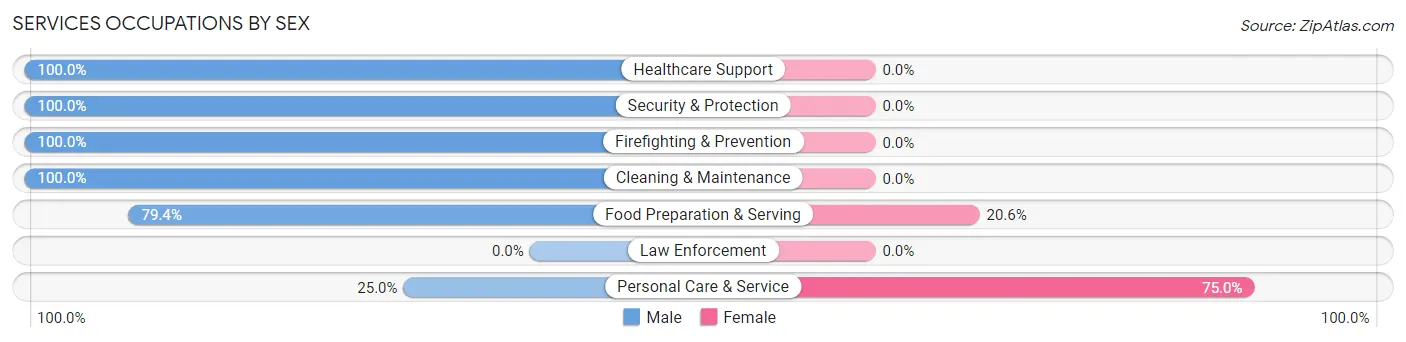
| Occupation | Male | Female |
| Healthcare Support | 24 (100.0%) | 0 (0.0%) |
| Security & Protection | 11 (100.0%) | 0 (0.0%) |
| Firefighting & Prevention | 11 (100.0%) | 0 (0.0%) |
| Law Enforcement | 0 (0.0%) | 0 (0.0%) |
| Food Preparation & Serving | 27 (79.4%) | 7 (20.6%) |
| Cleaning & Maintenance | 48 (100.0%) | 0 (0.0%) |
| Personal Care & Service | 8 (25.0%) | 24 (75.0%) |
| Total (Category) | 118 (79.2%) | 31 (20.8%) |
| Total (Overall) | 315 (41.1%) | 452 (58.9%) |
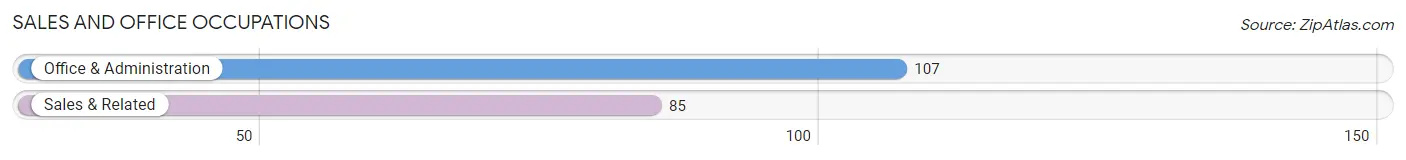
Sales and Office Occupations
The most common Sales and Office occupations in Orleans are Office & Administration (107 | 14.0%), and Sales & Related (85 | 11.1%).
Sales and Office Occupations by Sex
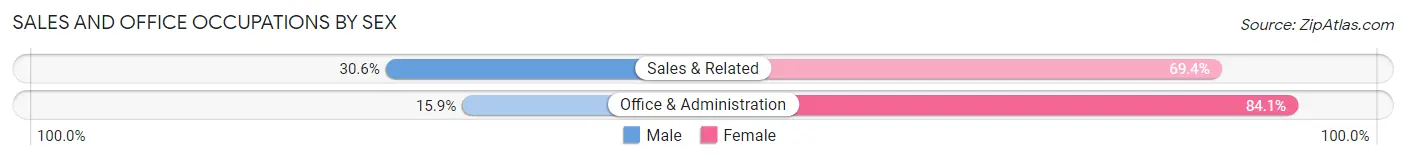
| Occupation | Male | Female |
| Sales & Related | 26 (30.6%) | 59 (69.4%) |
| Office & Administration | 17 (15.9%) | 90 (84.1%) |
| Total (Category) | 43 (22.4%) | 149 (77.6%) |
| Total (Overall) | 315 (41.1%) | 452 (58.9%) |
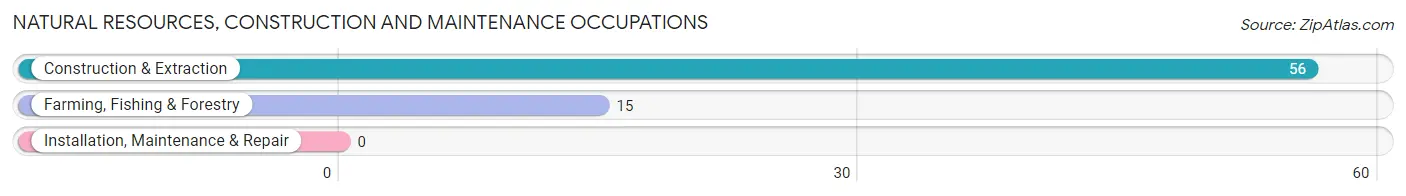
Natural Resources, Construction and Maintenance Occupations
The most common Natural Resources, Construction and Maintenance occupations in Orleans are Construction & Extraction (56 | 7.3%), and Farming, Fishing & Forestry (15 | 2.0%).
Natural Resources, Construction and Maintenance Occupations by Sex
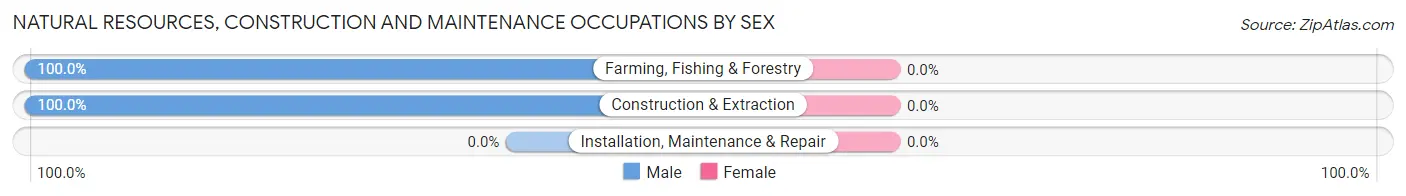
| Occupation | Male | Female |
| Farming, Fishing & Forestry | 15 (100.0%) | 0 (0.0%) |
| Construction & Extraction | 56 (100.0%) | 0 (0.0%) |
| Installation, Maintenance & Repair | 0 (0.0%) | 0 (0.0%) |
| Total (Category) | 71 (100.0%) | 0 (0.0%) |
| Total (Overall) | 315 (41.1%) | 452 (58.9%) |
Production, Transportation and Moving Occupations
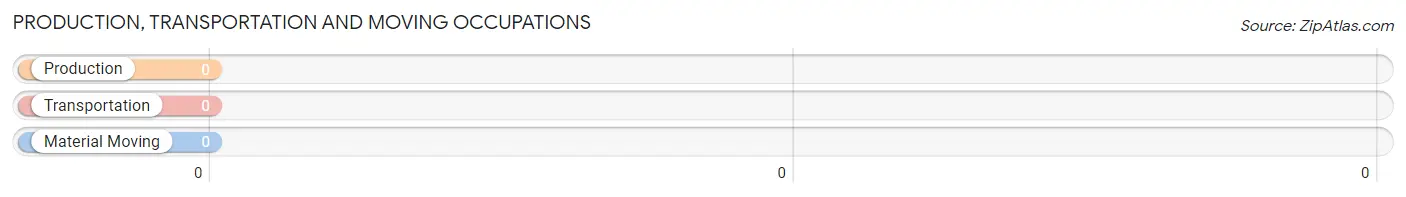
Production, Transportation and Moving Occupations by Sex
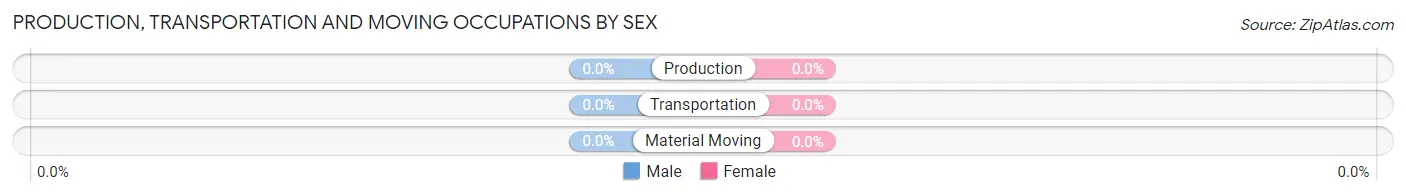
| Occupation | Male | Female |
| Production | 0 (0.0%) | 0 (0.0%) |
| Transportation | 0 (0.0%) | 0 (0.0%) |
| Material Moving | 0 (0.0%) | 0 (0.0%) |
| Total (Category) | 0 (0.0%) | 0 (0.0%) |
| Total (Overall) | 315 (41.1%) | 452 (58.9%) |
Employment Industries by Sex in Orleans
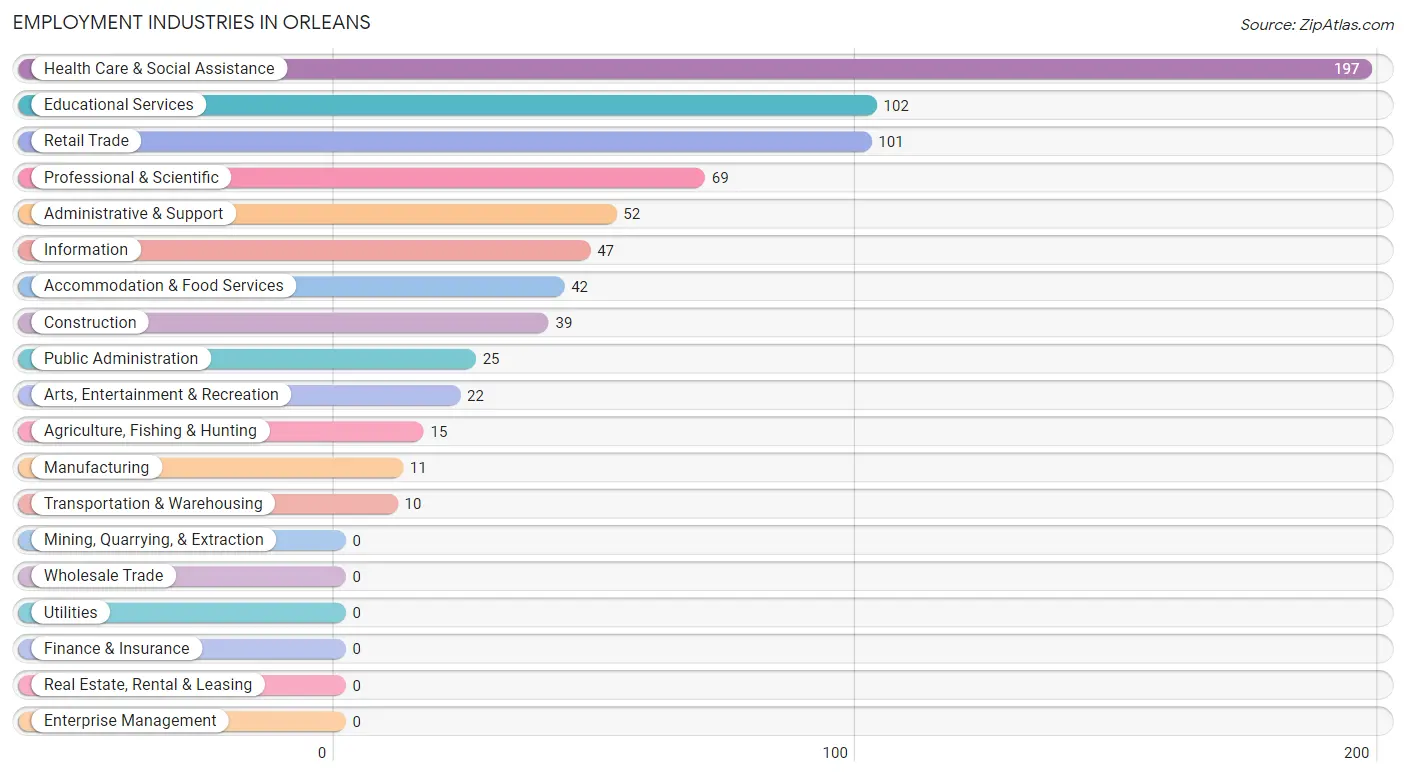
Employment Industries in Orleans
The major employment industries in Orleans include Health Care & Social Assistance (197 | 25.7%), Educational Services (102 | 13.3%), Retail Trade (101 | 13.2%), Professional & Scientific (69 | 9.0%), and Administrative & Support (52 | 6.8%).
Employment Industries by Sex in Orleans
The Orleans industries that see more men than women are Agriculture, Fishing & Hunting (100.0%), Construction (100.0%), and Manufacturing (100.0%), whereas the industries that tend to have a higher number of women are Transportation & Warehousing (100.0%), Health Care & Social Assistance (89.3%), and Educational Services (76.5%).
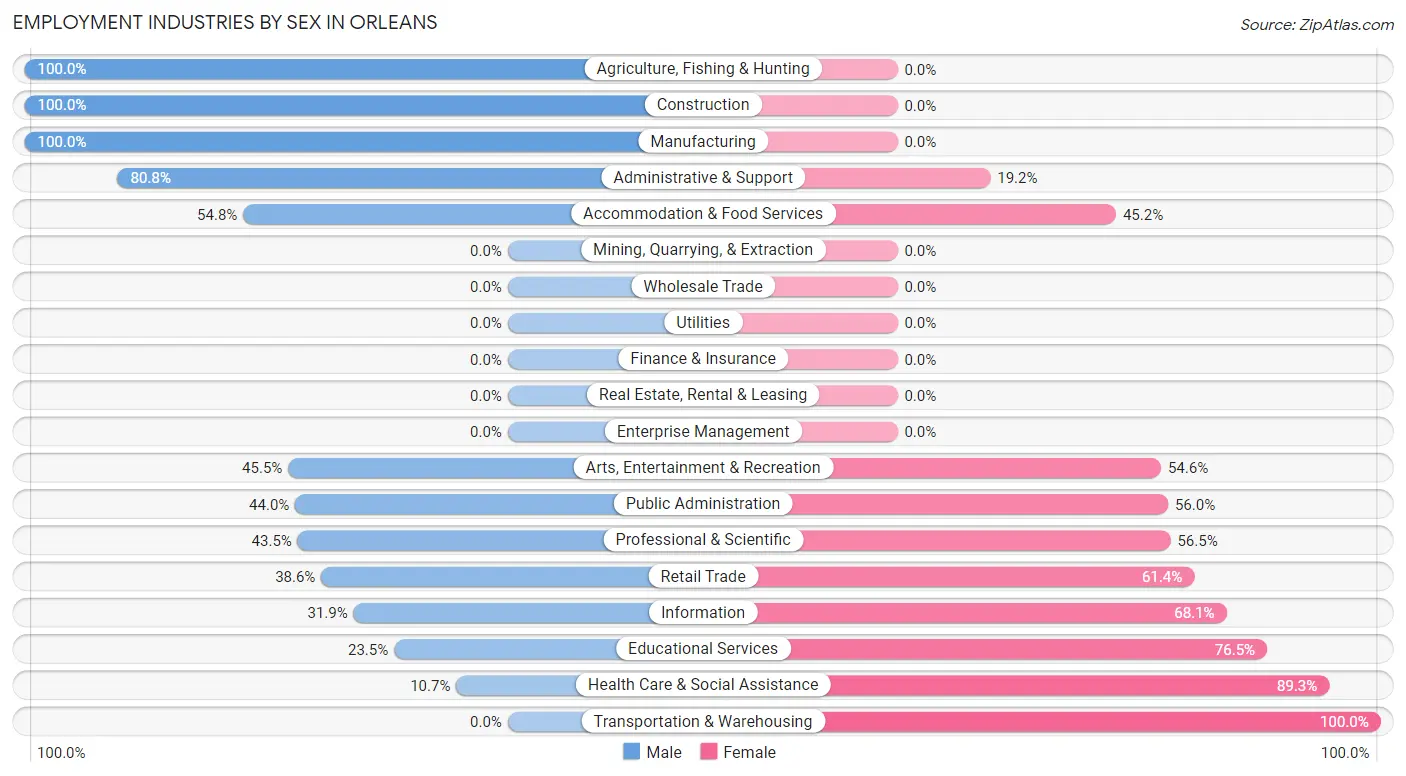
| Industry | Male | Female |
| Agriculture, Fishing & Hunting | 15 (100.0%) | 0 (0.0%) |
| Mining, Quarrying, & Extraction | 0 (0.0%) | 0 (0.0%) |
| Construction | 39 (100.0%) | 0 (0.0%) |
| Manufacturing | 11 (100.0%) | 0 (0.0%) |
| Wholesale Trade | 0 (0.0%) | 0 (0.0%) |
| Retail Trade | 39 (38.6%) | 62 (61.4%) |
| Transportation & Warehousing | 0 (0.0%) | 10 (100.0%) |
| Utilities | 0 (0.0%) | 0 (0.0%) |
| Information | 15 (31.9%) | 32 (68.1%) |
| Finance & Insurance | 0 (0.0%) | 0 (0.0%) |
| Real Estate, Rental & Leasing | 0 (0.0%) | 0 (0.0%) |
| Professional & Scientific | 30 (43.5%) | 39 (56.5%) |
| Enterprise Management | 0 (0.0%) | 0 (0.0%) |
| Administrative & Support | 42 (80.8%) | 10 (19.2%) |
| Educational Services | 24 (23.5%) | 78 (76.5%) |
| Health Care & Social Assistance | 21 (10.7%) | 176 (89.3%) |
| Arts, Entertainment & Recreation | 10 (45.5%) | 12 (54.5%) |
| Accommodation & Food Services | 23 (54.8%) | 19 (45.2%) |
| Public Administration | 11 (44.0%) | 14 (56.0%) |
| Total | 315 (41.1%) | 452 (58.9%) |
Education in Orleans
School Enrollment in Orleans
The most common levels of schooling among the 130 students in Orleans are high school (84 | 64.6%), nursery / preschool (17 | 13.1%), and middle school (15 | 11.5%).
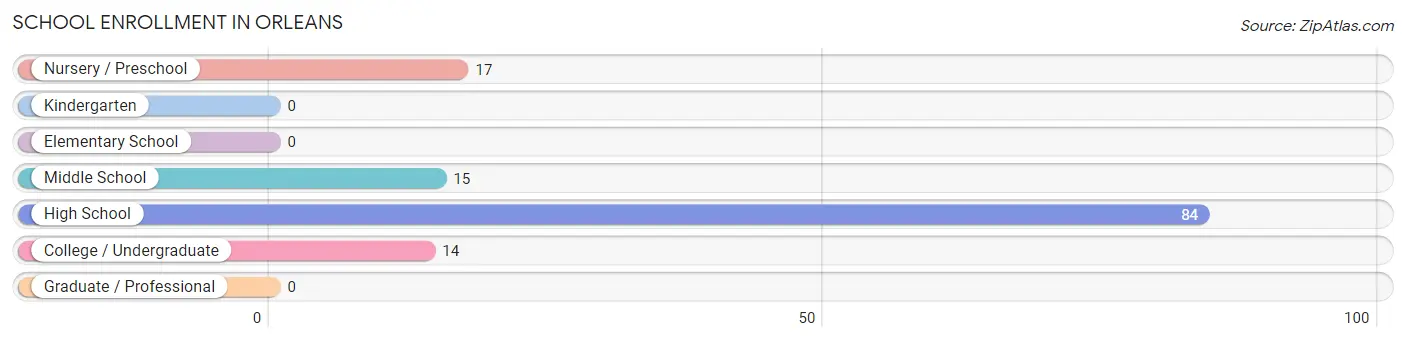
| School Level | # Students | % Students |
| Nursery / Preschool | 17 | 13.1% |
| Kindergarten | 0 | 0.0% |
| Elementary School | 0 | 0.0% |
| Middle School | 15 | 11.5% |
| High School | 84 | 64.6% |
| College / Undergraduate | 14 | 10.8% |
| Graduate / Professional | 0 | 0.0% |
| Total | 130 | 100.0% |
School Enrollment by Age by Funding Source in Orleans
Out of a total of 130 students who are enrolled in schools in Orleans, 39 (30.0%) attend a private institution, while the remaining 91 (70.0%) are enrolled in public schools. The age group of 15 to 17 year olds has the highest likelihood of being enrolled in private schools, with 39 (53.4% in the age bracket) enrolled. Conversely, the age group of 3 to 4 year olds has the lowest likelihood of being enrolled in a private school, with 17 (100.0% in the age bracket) attending a public institution.
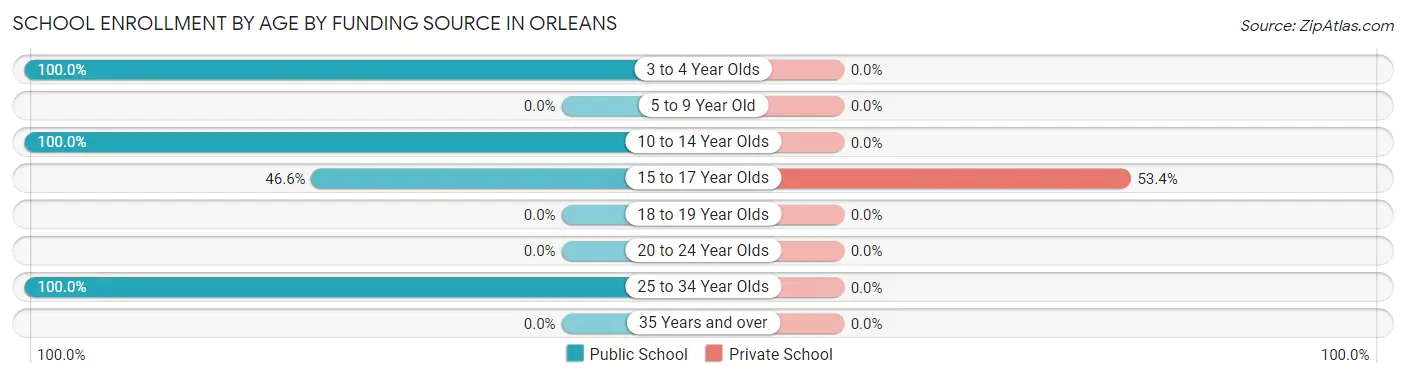
| Age Bracket | Public School | Private School |
| 3 to 4 Year Olds | 17 (100.0%) | 0 (0.0%) |
| 5 to 9 Year Old | 0 (0.0%) | 0 (0.0%) |
| 10 to 14 Year Olds | 26 (100.0%) | 0 (0.0%) |
| 15 to 17 Year Olds | 34 (46.6%) | 39 (53.4%) |
| 18 to 19 Year Olds | 0 (0.0%) | 0 (0.0%) |
| 20 to 24 Year Olds | 0 (0.0%) | 0 (0.0%) |
| 25 to 34 Year Olds | 14 (100.0%) | 0 (0.0%) |
| 35 Years and over | 0 (0.0%) | 0 (0.0%) |
| Total | 91 (70.0%) | 39 (30.0%) |
Educational Attainment by Field of Study in Orleans
Social sciences (132 | 17.9%), education (101 | 13.7%), psychology (75 | 10.2%), bio, nature & agricultural (65 | 8.8%), and business (63 | 8.5%) are the most common fields of study among 739 individuals in Orleans who have obtained a bachelor's degree or higher.
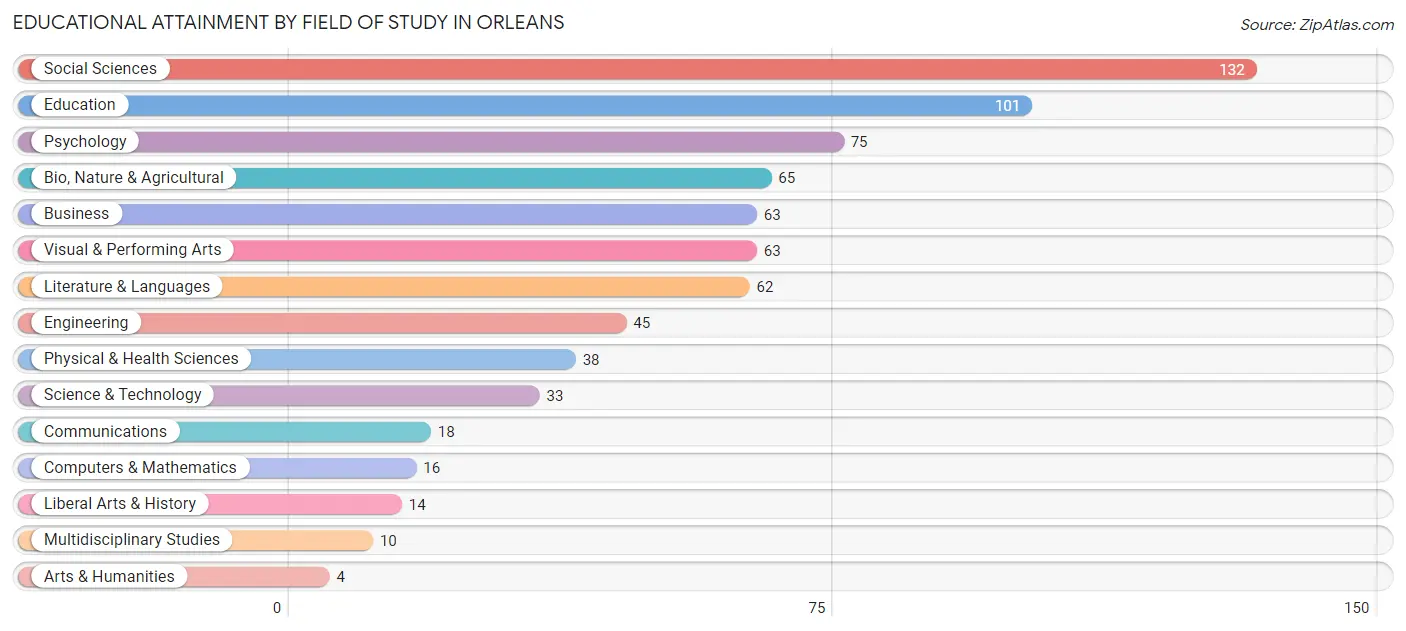
| Field of Study | # Graduates | % Graduates |
| Computers & Mathematics | 16 | 2.2% |
| Bio, Nature & Agricultural | 65 | 8.8% |
| Physical & Health Sciences | 38 | 5.1% |
| Psychology | 75 | 10.2% |
| Social Sciences | 132 | 17.9% |
| Engineering | 45 | 6.1% |
| Multidisciplinary Studies | 10 | 1.3% |
| Science & Technology | 33 | 4.5% |
| Business | 63 | 8.5% |
| Education | 101 | 13.7% |
| Literature & Languages | 62 | 8.4% |
| Liberal Arts & History | 14 | 1.9% |
| Visual & Performing Arts | 63 | 8.5% |
| Communications | 18 | 2.4% |
| Arts & Humanities | 4 | 0.5% |
| Total | 739 | 100.0% |
Transportation & Commute in Orleans
Vehicle Availability by Sex in Orleans
The most prevalent vehicle ownership categories in Orleans are males with 4 vehicles (100, accounting for 39.1%) and females with 4 vehicles (49, making up 22.7%).
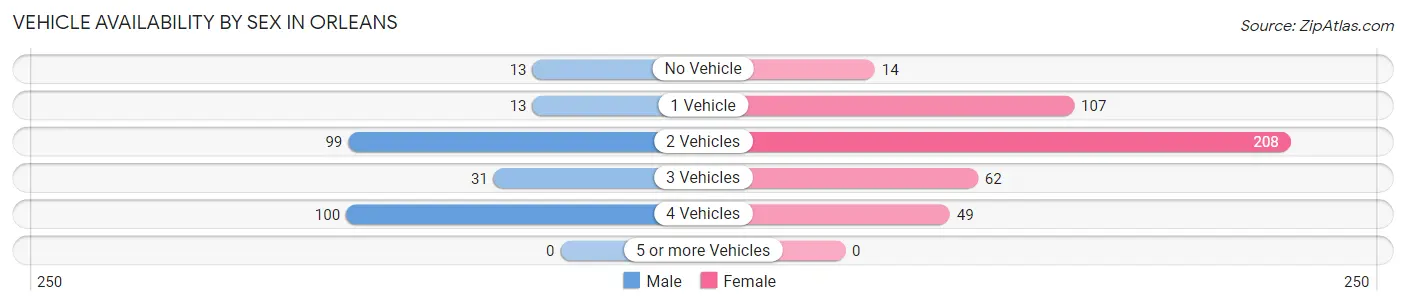
| Vehicles Available | Male | Female |
| No Vehicle | 13 (5.1%) | 14 (3.2%) |
| 1 Vehicle | 13 (5.1%) | 107 (24.3%) |
| 2 Vehicles | 99 (38.7%) | 208 (47.3%) |
| 3 Vehicles | 31 (12.1%) | 62 (14.1%) |
| 4 Vehicles | 100 (39.1%) | 49 (11.1%) |
| 5 or more Vehicles | 0 (0.0%) | 0 (0.0%) |
| Total | 256 (100.0%) | 440 (100.0%) |
Commute Time in Orleans
The most frequently occuring commute durations in Orleans are 30 to 34 minutes (109 commuters, 17.5%), 5 to 9 minutes (108 commuters, 17.3%), and 10 to 14 minutes (104 commuters, 16.7%).
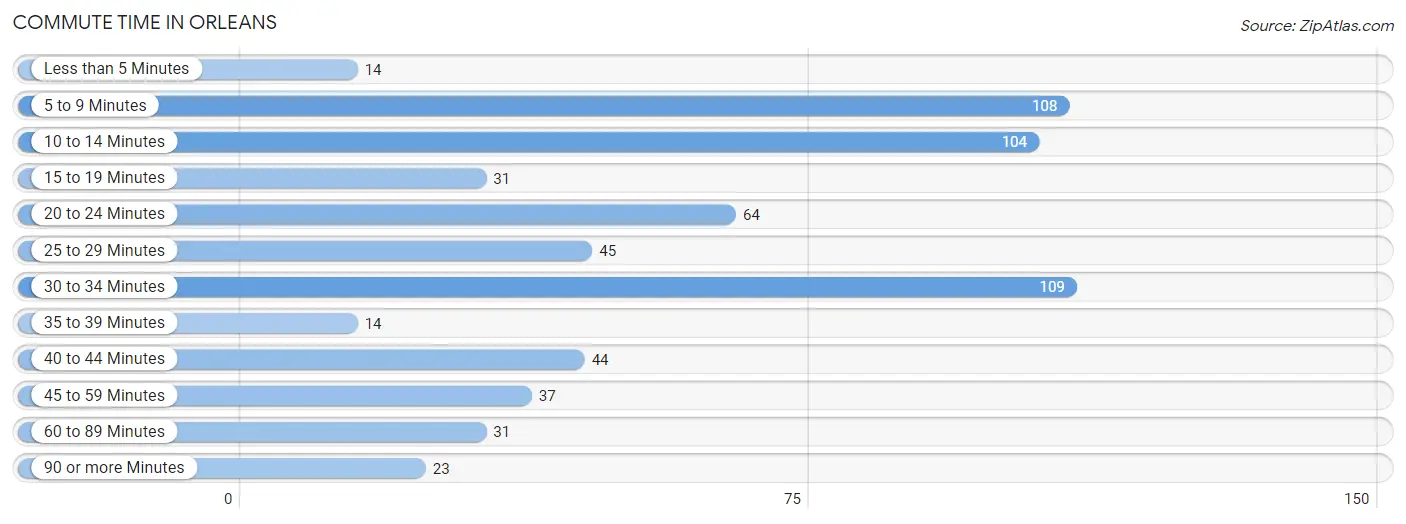
| Commute Time | # Commuters | % Commuters |
| Less than 5 Minutes | 14 | 2.2% |
| 5 to 9 Minutes | 108 | 17.3% |
| 10 to 14 Minutes | 104 | 16.7% |
| 15 to 19 Minutes | 31 | 5.0% |
| 20 to 24 Minutes | 64 | 10.3% |
| 25 to 29 Minutes | 45 | 7.2% |
| 30 to 34 Minutes | 109 | 17.5% |
| 35 to 39 Minutes | 14 | 2.2% |
| 40 to 44 Minutes | 44 | 7.0% |
| 45 to 59 Minutes | 37 | 5.9% |
| 60 to 89 Minutes | 31 | 5.0% |
| 90 or more Minutes | 23 | 3.7% |
Commute Time by Sex in Orleans
The most common commute times in Orleans are 30 to 34 minutes (73 commuters, 31.3%) for males and 5 to 9 minutes (76 commuters, 19.4%) for females.
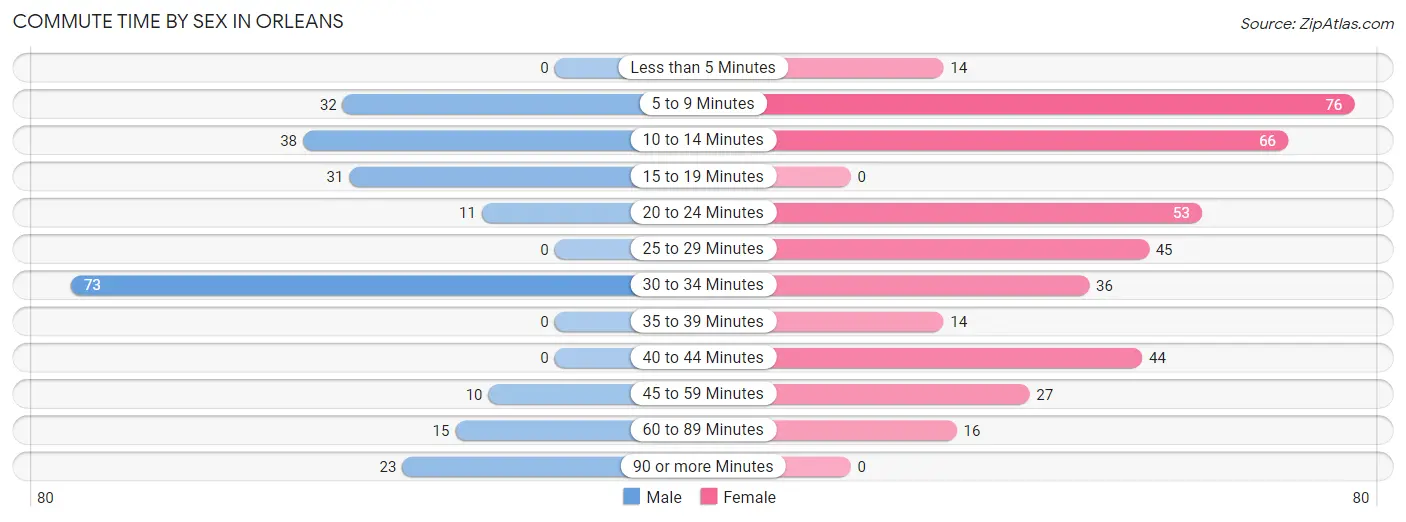
| Commute Time | Male | Female |
| Less than 5 Minutes | 0 (0.0%) | 14 (3.6%) |
| 5 to 9 Minutes | 32 (13.7%) | 76 (19.4%) |
| 10 to 14 Minutes | 38 (16.3%) | 66 (16.9%) |
| 15 to 19 Minutes | 31 (13.3%) | 0 (0.0%) |
| 20 to 24 Minutes | 11 (4.7%) | 53 (13.6%) |
| 25 to 29 Minutes | 0 (0.0%) | 45 (11.5%) |
| 30 to 34 Minutes | 73 (31.3%) | 36 (9.2%) |
| 35 to 39 Minutes | 0 (0.0%) | 14 (3.6%) |
| 40 to 44 Minutes | 0 (0.0%) | 44 (11.3%) |
| 45 to 59 Minutes | 10 (4.3%) | 27 (6.9%) |
| 60 to 89 Minutes | 15 (6.4%) | 16 (4.1%) |
| 90 or more Minutes | 23 (9.9%) | 0 (0.0%) |
Time of Departure to Work by Sex in Orleans
The most frequent times of departure to work in Orleans are 6:00 AM to 6:29 AM (55, 23.6%) for males and 7:30 AM to 7:59 AM (88, 22.5%) for females.
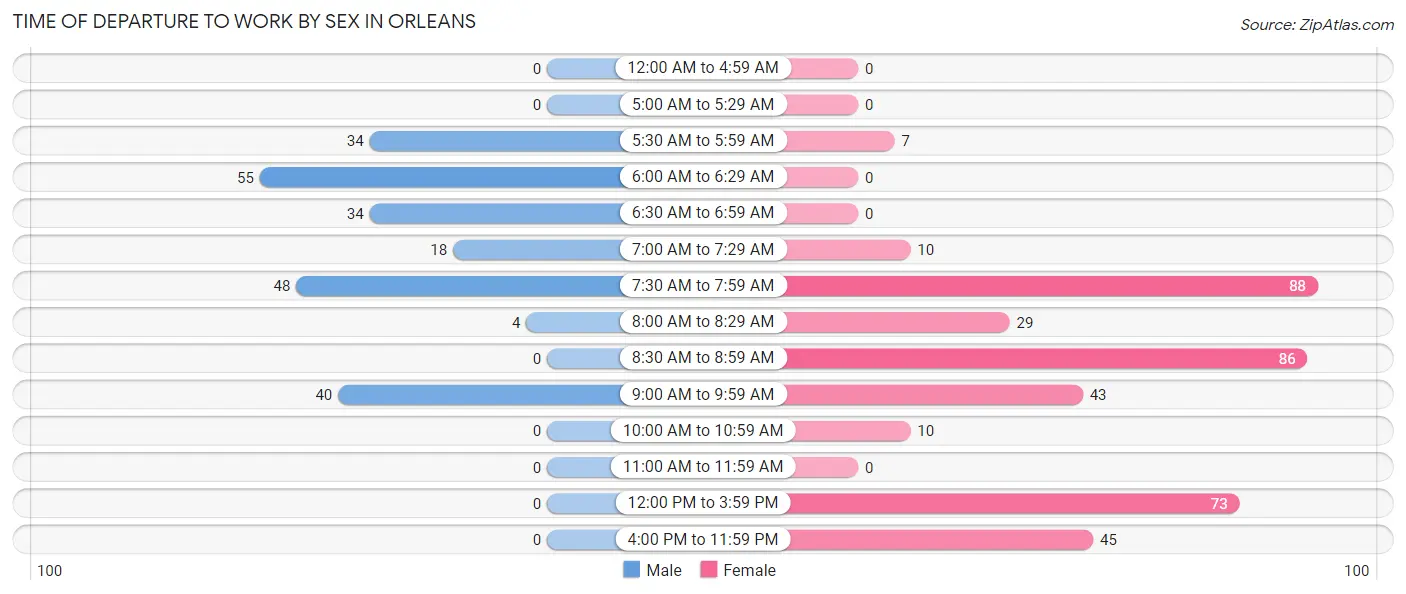
| Time of Departure | Male | Female |
| 12:00 AM to 4:59 AM | 0 (0.0%) | 0 (0.0%) |
| 5:00 AM to 5:29 AM | 0 (0.0%) | 0 (0.0%) |
| 5:30 AM to 5:59 AM | 34 (14.6%) | 7 (1.8%) |
| 6:00 AM to 6:29 AM | 55 (23.6%) | 0 (0.0%) |
| 6:30 AM to 6:59 AM | 34 (14.6%) | 0 (0.0%) |
| 7:00 AM to 7:29 AM | 18 (7.7%) | 10 (2.6%) |
| 7:30 AM to 7:59 AM | 48 (20.6%) | 88 (22.5%) |
| 8:00 AM to 8:29 AM | 4 (1.7%) | 29 (7.4%) |
| 8:30 AM to 8:59 AM | 0 (0.0%) | 86 (22.0%) |
| 9:00 AM to 9:59 AM | 40 (17.2%) | 43 (11.0%) |
| 10:00 AM to 10:59 AM | 0 (0.0%) | 10 (2.6%) |
| 11:00 AM to 11:59 AM | 0 (0.0%) | 0 (0.0%) |
| 12:00 PM to 3:59 PM | 0 (0.0%) | 73 (18.7%) |
| 4:00 PM to 11:59 PM | 0 (0.0%) | 45 (11.5%) |
| Total | 233 (100.0%) | 391 (100.0%) |
Housing Occupancy in Orleans
Occupancy by Ownership in Orleans
Of the total 849 dwellings in Orleans, owner-occupied units account for 588 (69.3%), while renter-occupied units make up 261 (30.7%).
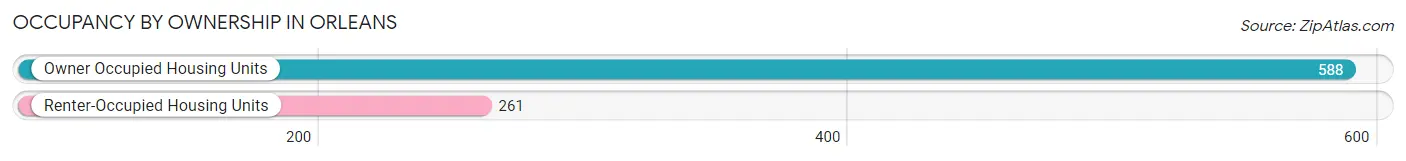
| Occupancy | # Housing Units | % Housing Units |
| Owner Occupied Housing Units | 588 | 69.3% |
| Renter-Occupied Housing Units | 261 | 30.7% |
| Total Occupied Housing Units | 849 | 100.0% |
Occupancy by Household Size in Orleans
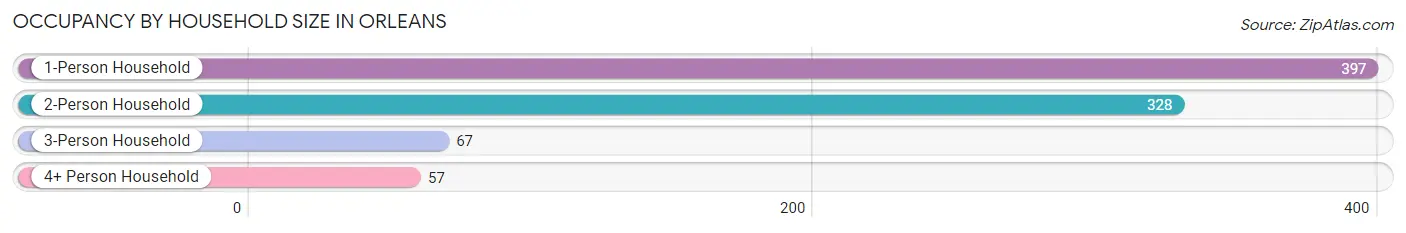
| Household Size | # Housing Units | % Housing Units |
| 1-Person Household | 397 | 46.8% |
| 2-Person Household | 328 | 38.6% |
| 3-Person Household | 67 | 7.9% |
| 4+ Person Household | 57 | 6.7% |
| Total Housing Units | 849 | 100.0% |
Occupancy by Ownership by Household Size in Orleans
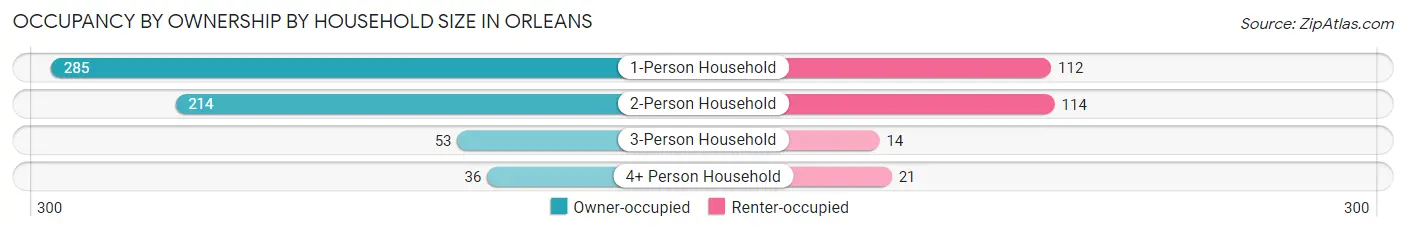
| Household Size | Owner-occupied | Renter-occupied |
| 1-Person Household | 285 (71.8%) | 112 (28.2%) |
| 2-Person Household | 214 (65.2%) | 114 (34.8%) |
| 3-Person Household | 53 (79.1%) | 14 (20.9%) |
| 4+ Person Household | 36 (63.2%) | 21 (36.8%) |
| Total Housing Units | 588 (69.3%) | 261 (30.7%) |
Occupancy by Educational Attainment in Orleans
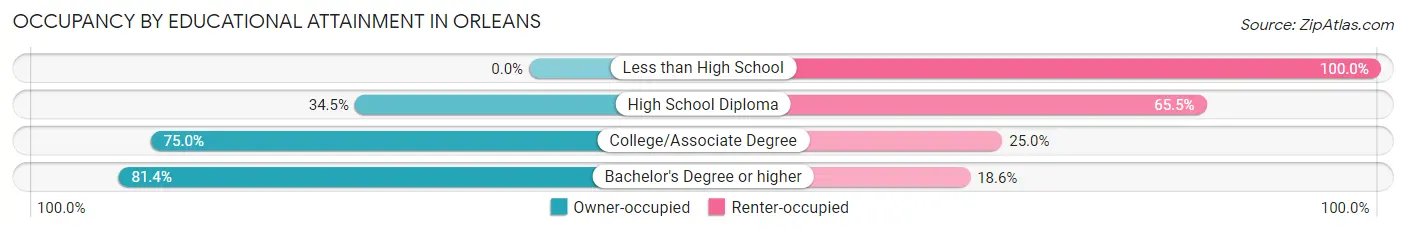
| Household Size | Owner-occupied | Renter-occupied |
| Less than High School | 0 (0.0%) | 30 (100.0%) |
| High School Diploma | 48 (34.5%) | 91 (65.5%) |
| College/Associate Degree | 156 (75.0%) | 52 (25.0%) |
| Bachelor's Degree or higher | 384 (81.4%) | 88 (18.6%) |
Occupancy by Age of Householder in Orleans
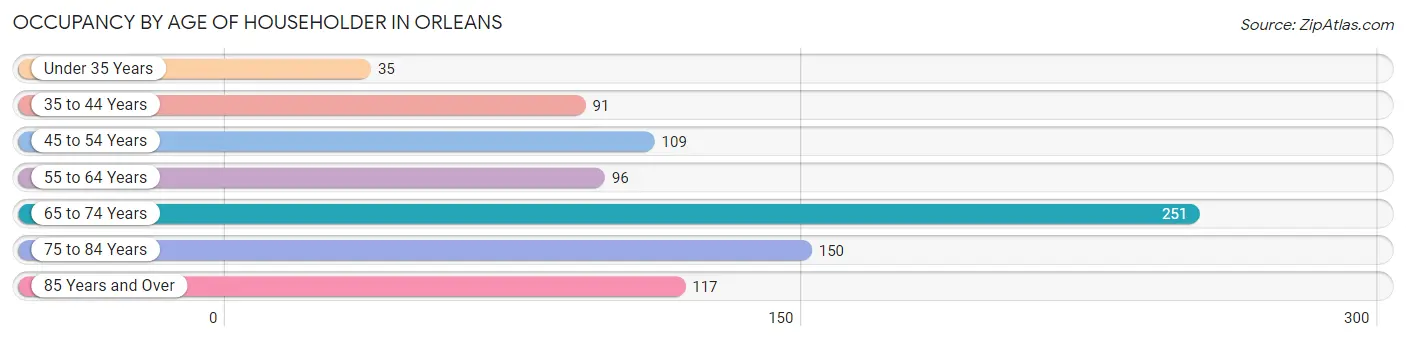
| Age Bracket | # Households | % Households |
| Under 35 Years | 35 | 4.1% |
| 35 to 44 Years | 91 | 10.7% |
| 45 to 54 Years | 109 | 12.8% |
| 55 to 64 Years | 96 | 11.3% |
| 65 to 74 Years | 251 | 29.6% |
| 75 to 84 Years | 150 | 17.7% |
| 85 Years and Over | 117 | 13.8% |
| Total | 849 | 100.0% |
Housing Finances in Orleans
Median Income by Occupancy in Orleans
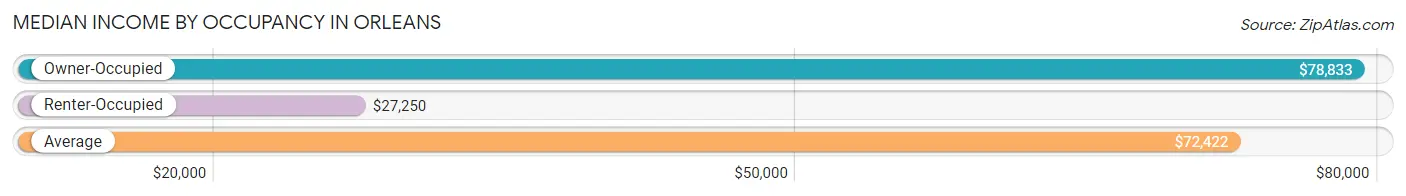
| Occupancy Type | # Households | Median Income |
| Owner-Occupied | 588 (69.3%) | $78,833 |
| Renter-Occupied | 261 (30.7%) | $27,250 |
| Average | 849 (100.0%) | $72,422 |
Occupancy by Householder Income Bracket in Orleans
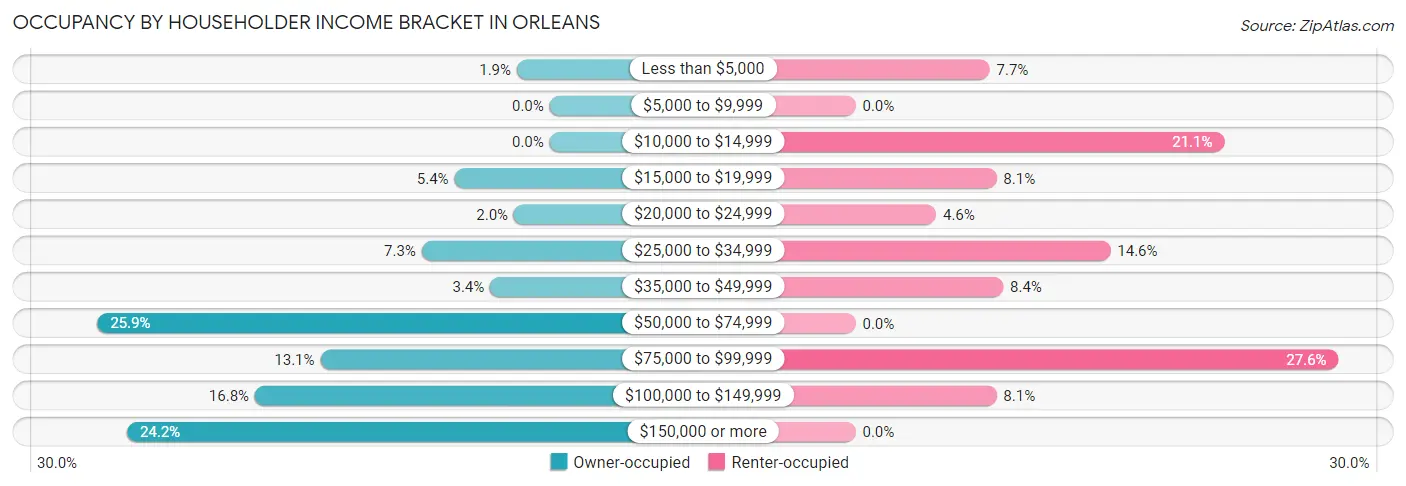
| Income Bracket | Owner-occupied | Renter-occupied |
| Less than $5,000 | 11 (1.9%) | 20 (7.7%) |
| $5,000 to $9,999 | 0 (0.0%) | 0 (0.0%) |
| $10,000 to $14,999 | 0 (0.0%) | 55 (21.1%) |
| $15,000 to $19,999 | 32 (5.4%) | 21 (8.1%) |
| $20,000 to $24,999 | 12 (2.0%) | 12 (4.6%) |
| $25,000 to $34,999 | 43 (7.3%) | 38 (14.6%) |
| $35,000 to $49,999 | 20 (3.4%) | 22 (8.4%) |
| $50,000 to $74,999 | 152 (25.9%) | 0 (0.0%) |
| $75,000 to $99,999 | 77 (13.1%) | 72 (27.6%) |
| $100,000 to $149,999 | 99 (16.8%) | 21 (8.1%) |
| $150,000 or more | 142 (24.1%) | 0 (0.0%) |
| Total | 588 (100.0%) | 261 (100.0%) |
Monthly Housing Cost Tiers in Orleans
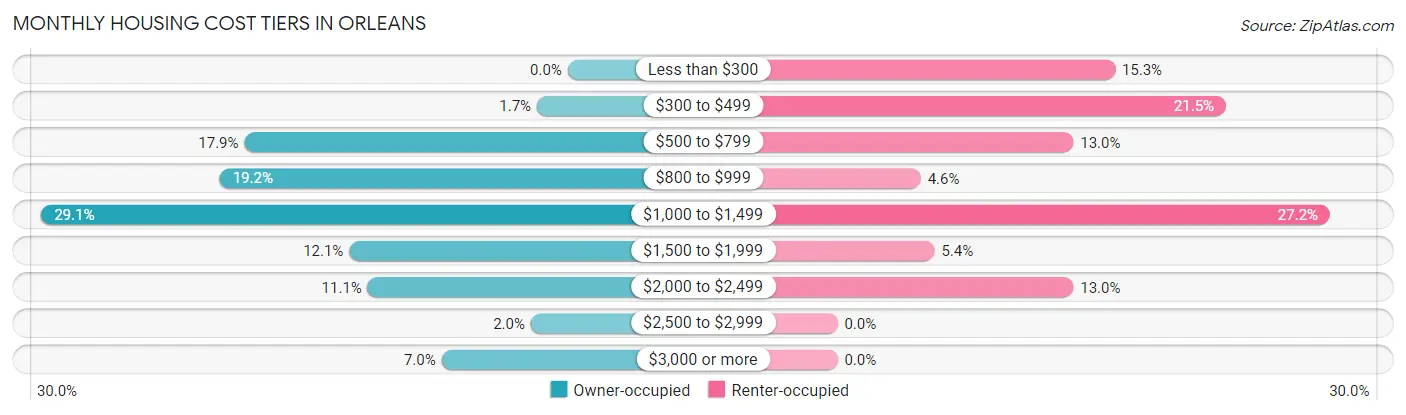
| Monthly Cost | Owner-occupied | Renter-occupied |
| Less than $300 | 0 (0.0%) | 40 (15.3%) |
| $300 to $499 | 10 (1.7%) | 56 (21.5%) |
| $500 to $799 | 105 (17.9%) | 34 (13.0%) |
| $800 to $999 | 113 (19.2%) | 12 (4.6%) |
| $1,000 to $1,499 | 171 (29.1%) | 71 (27.2%) |
| $1,500 to $1,999 | 71 (12.1%) | 14 (5.4%) |
| $2,000 to $2,499 | 65 (11.1%) | 34 (13.0%) |
| $2,500 to $2,999 | 12 (2.0%) | 0 (0.0%) |
| $3,000 or more | 41 (7.0%) | 0 (0.0%) |
| Total | 588 (100.0%) | 261 (100.0%) |
Physical Housing Characteristics in Orleans
Housing Structures in Orleans
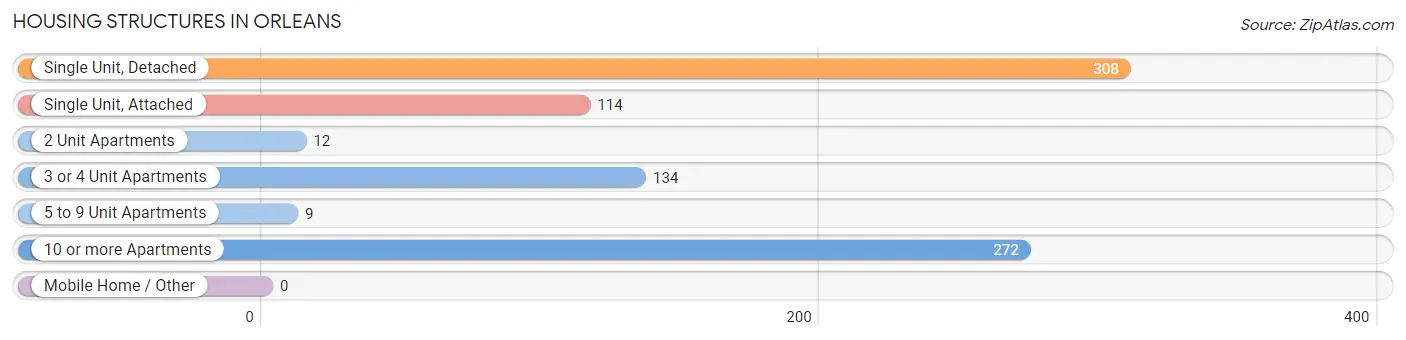
| Structure Type | # Housing Units | % Housing Units |
| Single Unit, Detached | 308 | 36.3% |
| Single Unit, Attached | 114 | 13.4% |
| 2 Unit Apartments | 12 | 1.4% |
| 3 or 4 Unit Apartments | 134 | 15.8% |
| 5 to 9 Unit Apartments | 9 | 1.1% |
| 10 or more Apartments | 272 | 32.0% |
| Mobile Home / Other | 0 | 0.0% |
| Total | 849 | 100.0% |
Housing Structures by Occupancy in Orleans
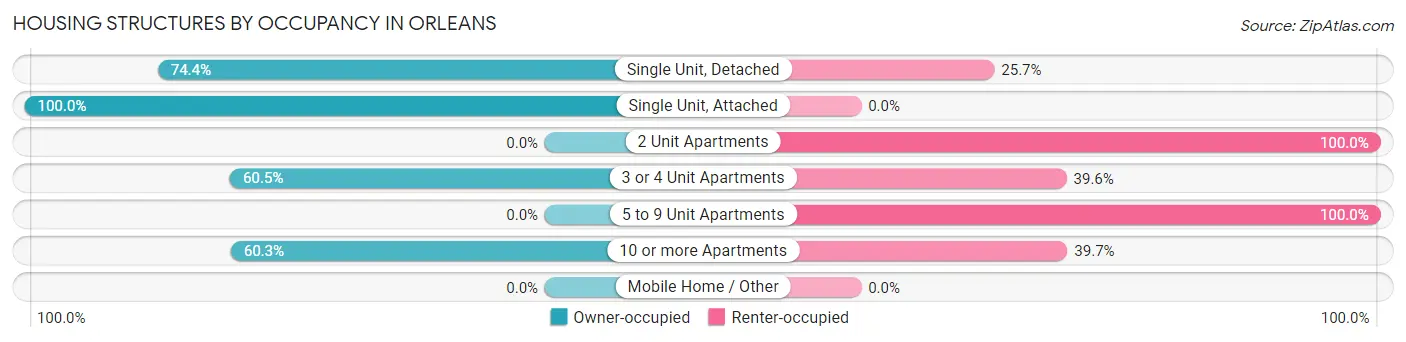
| Structure Type | Owner-occupied | Renter-occupied |
| Single Unit, Detached | 229 (74.4%) | 79 (25.7%) |
| Single Unit, Attached | 114 (100.0%) | 0 (0.0%) |
| 2 Unit Apartments | 0 (0.0%) | 12 (100.0%) |
| 3 or 4 Unit Apartments | 81 (60.5%) | 53 (39.6%) |
| 5 to 9 Unit Apartments | 0 (0.0%) | 9 (100.0%) |
| 10 or more Apartments | 164 (60.3%) | 108 (39.7%) |
| Mobile Home / Other | 0 (0.0%) | 0 (0.0%) |
| Total | 588 (69.3%) | 261 (30.7%) |
Housing Structures by Number of Rooms in Orleans
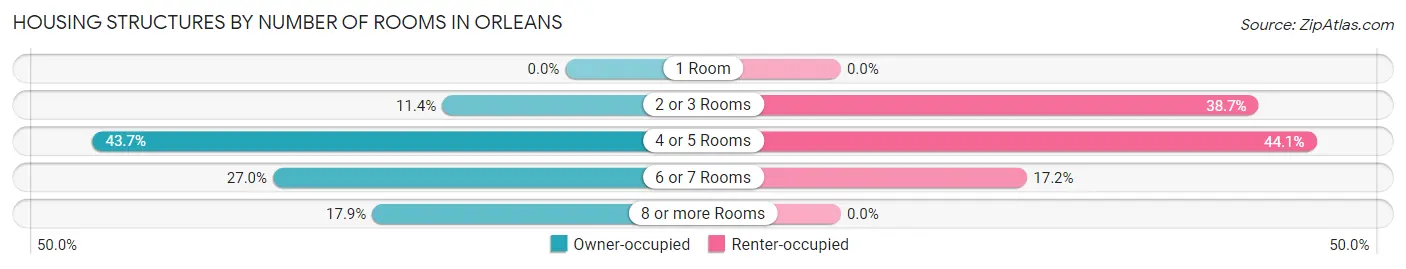
| Number of Rooms | Owner-occupied | Renter-occupied |
| 1 Room | 0 (0.0%) | 0 (0.0%) |
| 2 or 3 Rooms | 67 (11.4%) | 101 (38.7%) |
| 4 or 5 Rooms | 257 (43.7%) | 115 (44.1%) |
| 6 or 7 Rooms | 159 (27.0%) | 45 (17.2%) |
| 8 or more Rooms | 105 (17.9%) | 0 (0.0%) |
| Total | 588 (100.0%) | 261 (100.0%) |
Housing Structure by Heating Type in Orleans
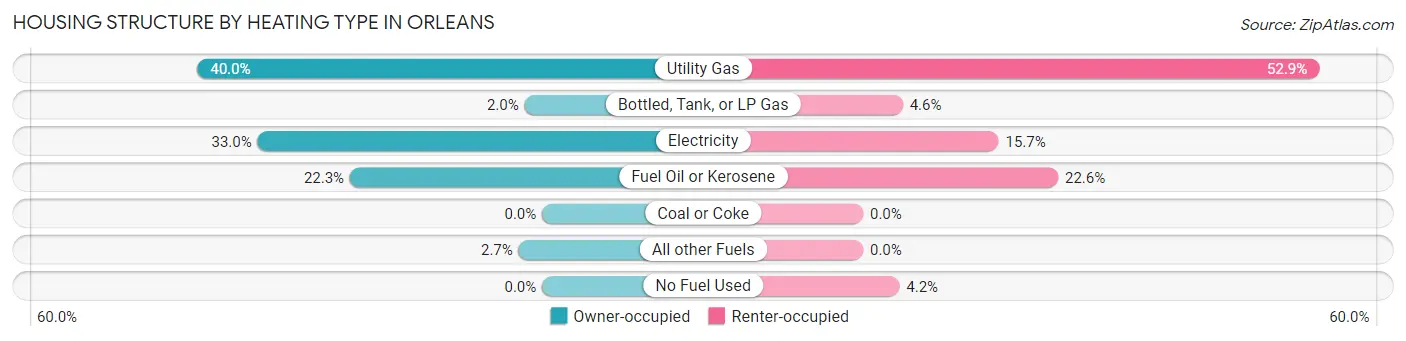
| Heating Type | Owner-occupied | Renter-occupied |
| Utility Gas | 235 (40.0%) | 138 (52.9%) |
| Bottled, Tank, or LP Gas | 12 (2.0%) | 12 (4.6%) |
| Electricity | 194 (33.0%) | 41 (15.7%) |
| Fuel Oil or Kerosene | 131 (22.3%) | 59 (22.6%) |
| Coal or Coke | 0 (0.0%) | 0 (0.0%) |
| All other Fuels | 16 (2.7%) | 0 (0.0%) |
| No Fuel Used | 0 (0.0%) | 11 (4.2%) |
| Total | 588 (100.0%) | 261 (100.0%) |
Household Vehicle Usage in Orleans
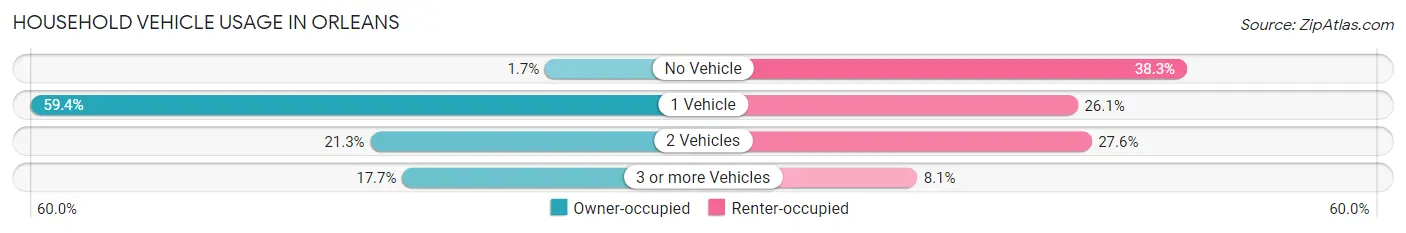
| Vehicles per Household | Owner-occupied | Renter-occupied |
| No Vehicle | 10 (1.7%) | 100 (38.3%) |
| 1 Vehicle | 349 (59.4%) | 68 (26.1%) |
| 2 Vehicles | 125 (21.3%) | 72 (27.6%) |
| 3 or more Vehicles | 104 (17.7%) | 21 (8.1%) |
| Total | 588 (100.0%) | 261 (100.0%) |
Real Estate & Mortgages in Orleans
Real Estate and Mortgage Overview in Orleans
| Characteristic | Without Mortgage | With Mortgage |
| Housing Units | 379 | 209 |
| Median Property Value | $445,400 | $525,300 |
| Median Household Income | $78,964 | $57 |
| Monthly Housing Costs | $929 | $41 |
| Real Estate Taxes | $2,621 | $0 |
Property Value by Mortgage Status in Orleans
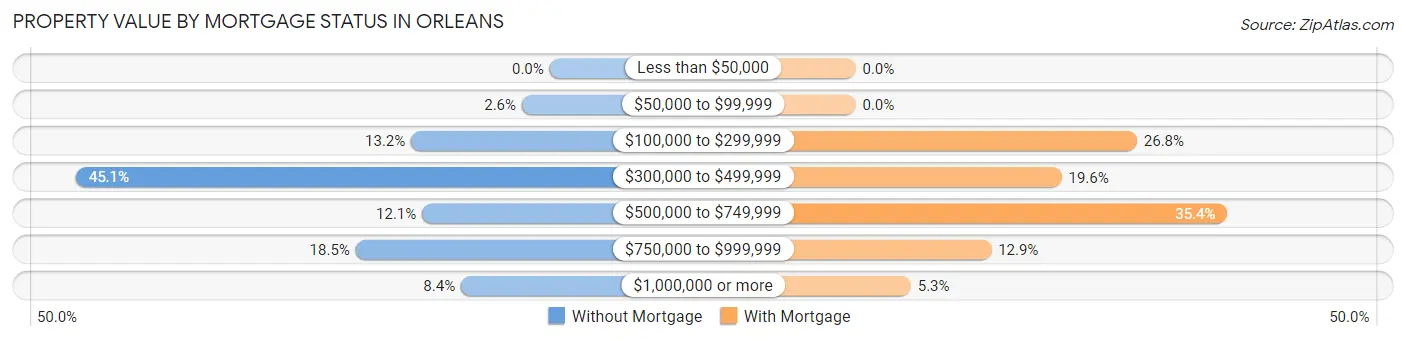
| Property Value | Without Mortgage | With Mortgage |
| Less than $50,000 | 0 (0.0%) | 0 (0.0%) |
| $50,000 to $99,999 | 10 (2.6%) | 0 (0.0%) |
| $100,000 to $299,999 | 50 (13.2%) | 56 (26.8%) |
| $300,000 to $499,999 | 171 (45.1%) | 41 (19.6%) |
| $500,000 to $749,999 | 46 (12.1%) | 74 (35.4%) |
| $750,000 to $999,999 | 70 (18.5%) | 27 (12.9%) |
| $1,000,000 or more | 32 (8.4%) | 11 (5.3%) |
| Total | 379 (100.0%) | 209 (100.0%) |
Household Income by Mortgage Status in Orleans
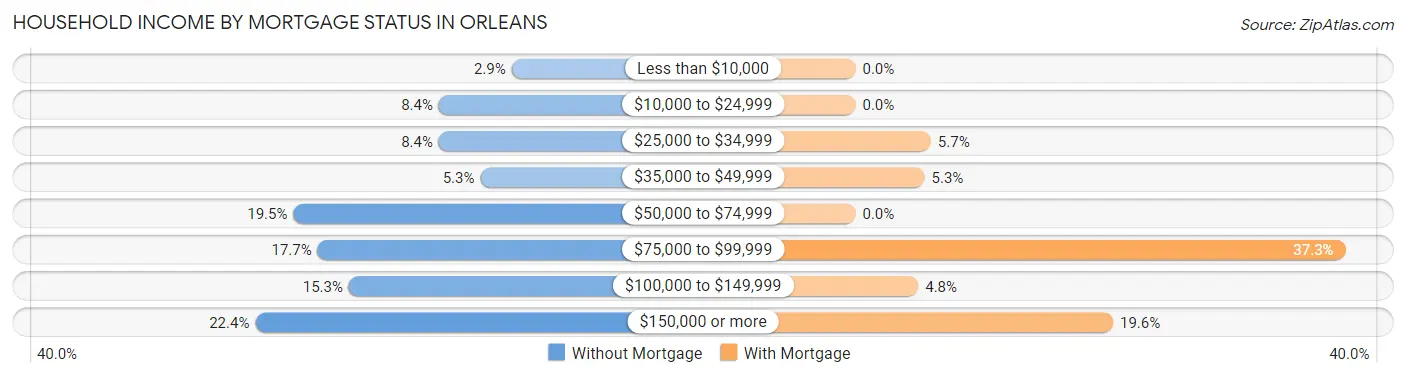
| Household Income | Without Mortgage | With Mortgage |
| Less than $10,000 | 11 (2.9%) | 0 (0.0%) |
| $10,000 to $24,999 | 32 (8.4%) | 0 (0.0%) |
| $25,000 to $34,999 | 32 (8.4%) | 12 (5.7%) |
| $35,000 to $49,999 | 20 (5.3%) | 11 (5.3%) |
| $50,000 to $74,999 | 74 (19.5%) | 0 (0.0%) |
| $75,000 to $99,999 | 67 (17.7%) | 78 (37.3%) |
| $100,000 to $149,999 | 58 (15.3%) | 10 (4.8%) |
| $150,000 or more | 85 (22.4%) | 41 (19.6%) |
| Total | 379 (100.0%) | 209 (100.0%) |
Property Value to Household Income Ratio in Orleans
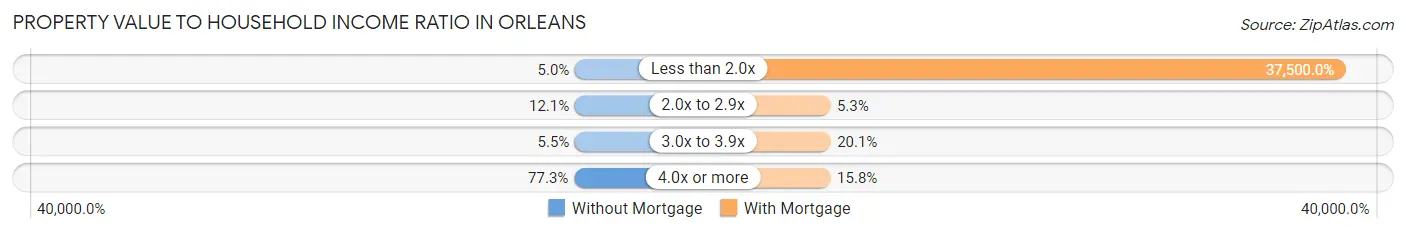
| Value-to-Income Ratio | Without Mortgage | With Mortgage |
| Less than 2.0x | 19 (5.0%) | 78,375 (37,500.0%) |
| 2.0x to 2.9x | 46 (12.1%) | 11 (5.3%) |
| 3.0x to 3.9x | 21 (5.5%) | 42 (20.1%) |
| 4.0x or more | 293 (77.3%) | 33 (15.8%) |
| Total | 379 (100.0%) | 209 (100.0%) |
Real Estate Taxes by Mortgage Status in Orleans
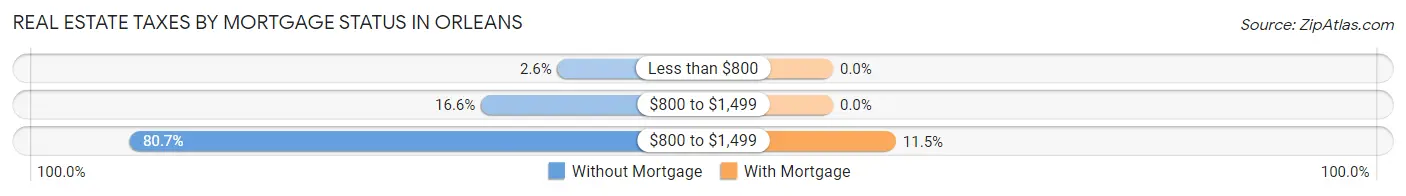
| Property Taxes | Without Mortgage | With Mortgage |
| Less than $800 | 10 (2.6%) | 0 (0.0%) |
| $800 to $1,499 | 63 (16.6%) | 0 (0.0%) |
| $800 to $1,499 | 306 (80.7%) | 24 (11.5%) |
| Total | 379 (100.0%) | 209 (100.0%) |
Health & Disability in Orleans
Health Insurance Coverage by Age in Orleans
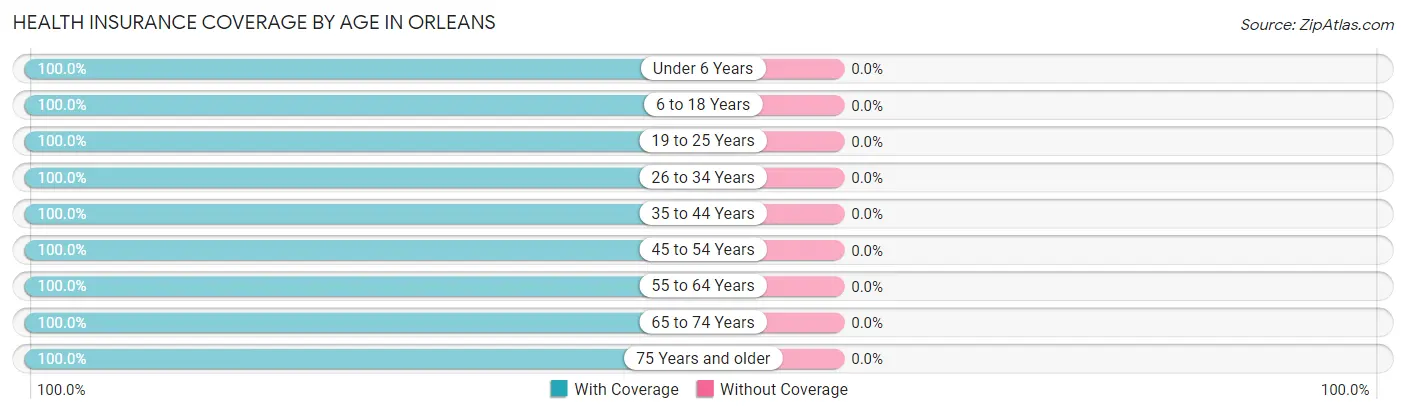
| Age Bracket | With Coverage | Without Coverage |
| Under 6 Years | 37 (100.0%) | 0 (0.0%) |
| 6 to 18 Years | 99 (100.0%) | 0 (0.0%) |
| 19 to 25 Years | 78 (100.0%) | 0 (0.0%) |
| 26 to 34 Years | 93 (100.0%) | 0 (0.0%) |
| 35 to 44 Years | 203 (100.0%) | 0 (0.0%) |
| 45 to 54 Years | 178 (100.0%) | 0 (0.0%) |
| 55 to 64 Years | 229 (100.0%) | 0 (0.0%) |
| 65 to 74 Years | 358 (100.0%) | 0 (0.0%) |
| 75 Years and older | 390 (100.0%) | 0 (0.0%) |
| Total | 1,665 (100.0%) | 0 (0.0%) |
Health Insurance Coverage by Citizenship Status in Orleans
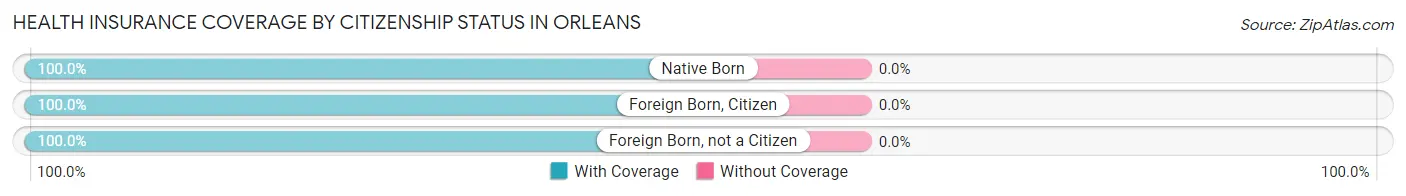
| Citizenship Status | With Coverage | Without Coverage |
| Native Born | 37 (100.0%) | 0 (0.0%) |
| Foreign Born, Citizen | 99 (100.0%) | 0 (0.0%) |
| Foreign Born, not a Citizen | 78 (100.0%) | 0 (0.0%) |
Health Insurance Coverage by Household Income in Orleans
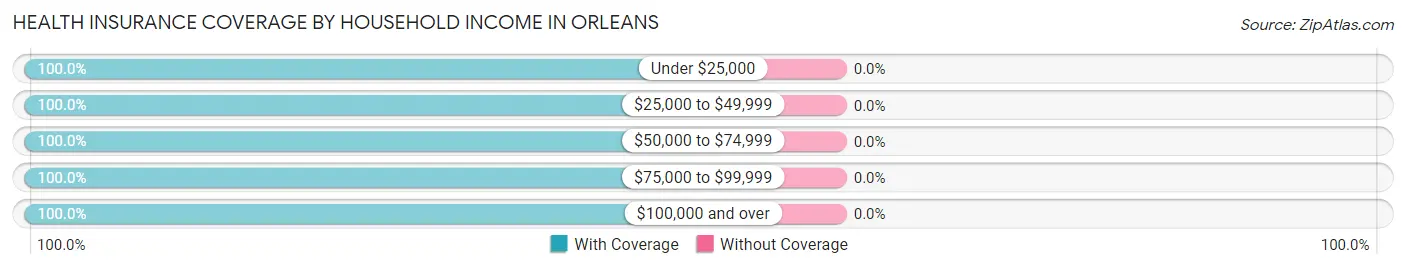
| Household Income | With Coverage | Without Coverage |
| Under $25,000 | 221 (100.0%) | 0 (0.0%) |
| $25,000 to $49,999 | 191 (100.0%) | 0 (0.0%) |
| $50,000 to $74,999 | 207 (100.0%) | 0 (0.0%) |
| $75,000 to $99,999 | 264 (100.0%) | 0 (0.0%) |
| $100,000 and over | 735 (100.0%) | 0 (0.0%) |
Public vs Private Health Insurance Coverage by Age in Orleans
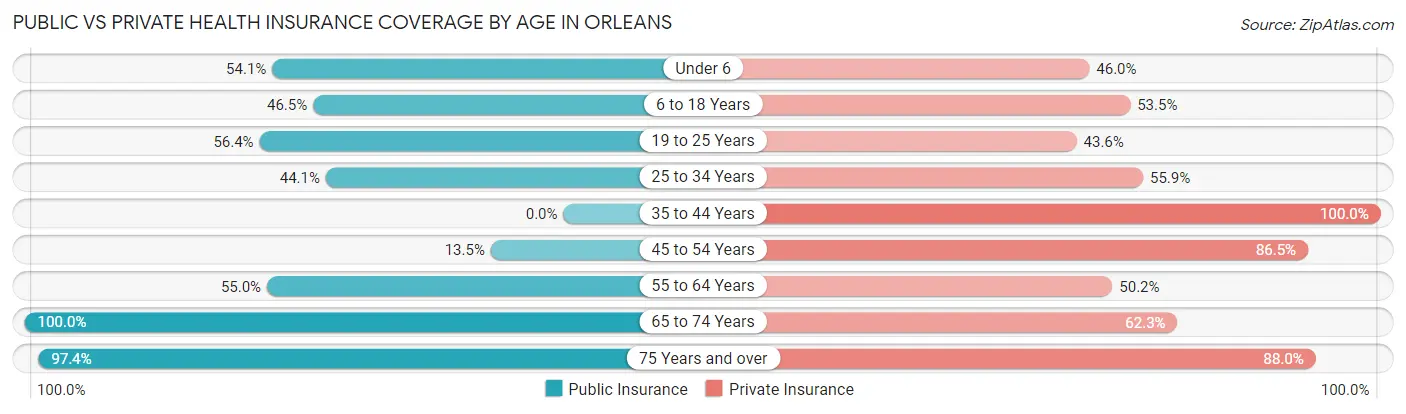
| Age Bracket | Public Insurance | Private Insurance |
| Under 6 | 20 (54.0%) | 17 (46.0%) |
| 6 to 18 Years | 46 (46.5%) | 53 (53.5%) |
| 19 to 25 Years | 44 (56.4%) | 34 (43.6%) |
| 25 to 34 Years | 41 (44.1%) | 52 (55.9%) |
| 35 to 44 Years | 0 (0.0%) | 203 (100.0%) |
| 45 to 54 Years | 24 (13.5%) | 154 (86.5%) |
| 55 to 64 Years | 126 (55.0%) | 115 (50.2%) |
| 65 to 74 Years | 358 (100.0%) | 223 (62.3%) |
| 75 Years and over | 380 (97.4%) | 343 (87.9%) |
| Total | 1,039 (62.4%) | 1,194 (71.7%) |
Disability Status by Sex by Age in Orleans
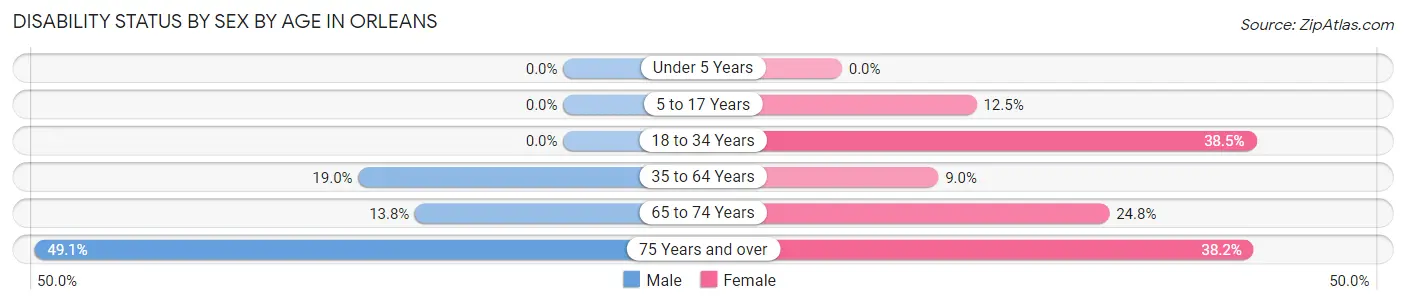
| Age Bracket | Male | Female |
| Under 5 Years | 0 (0.0%) | 0 (0.0%) |
| 5 to 17 Years | 0 (0.0%) | 7 (12.5%) |
| 18 to 34 Years | 0 (0.0%) | 25 (38.5%) |
| 35 to 64 Years | 31 (19.0%) | 40 (8.9%) |
| 65 to 74 Years | 11 (13.8%) | 69 (24.8%) |
| 75 Years and over | 81 (49.1%) | 86 (38.2%) |
Disability Class by Sex by Age in Orleans
Disability Class: Hearing Difficulty
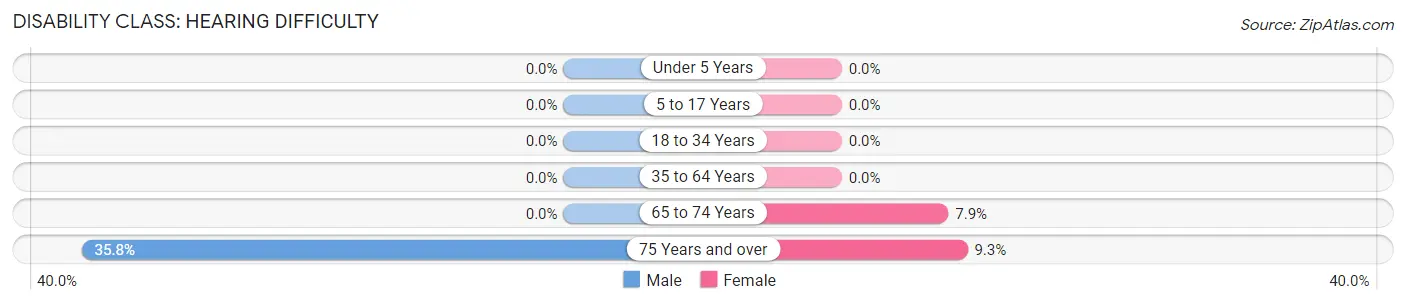
| Age Bracket | Male | Female |
| Under 5 Years | 0 (0.0%) | 0 (0.0%) |
| 5 to 17 Years | 0 (0.0%) | 0 (0.0%) |
| 18 to 34 Years | 0 (0.0%) | 0 (0.0%) |
| 35 to 64 Years | 0 (0.0%) | 0 (0.0%) |
| 65 to 74 Years | 0 (0.0%) | 22 (7.9%) |
| 75 Years and over | 59 (35.8%) | 21 (9.3%) |
Disability Class: Vision Difficulty
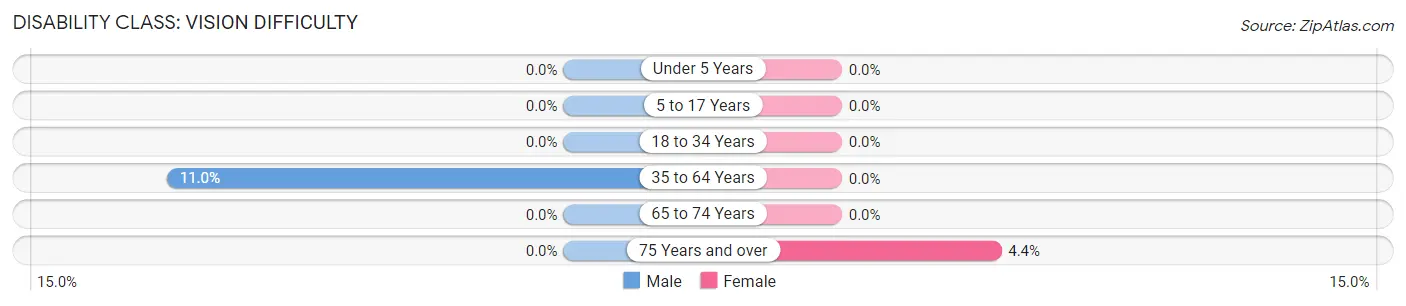
| Age Bracket | Male | Female |
| Under 5 Years | 0 (0.0%) | 0 (0.0%) |
| 5 to 17 Years | 0 (0.0%) | 0 (0.0%) |
| 18 to 34 Years | 0 (0.0%) | 0 (0.0%) |
| 35 to 64 Years | 18 (11.0%) | 0 (0.0%) |
| 65 to 74 Years | 0 (0.0%) | 0 (0.0%) |
| 75 Years and over | 0 (0.0%) | 10 (4.4%) |
Disability Class: Cognitive Difficulty
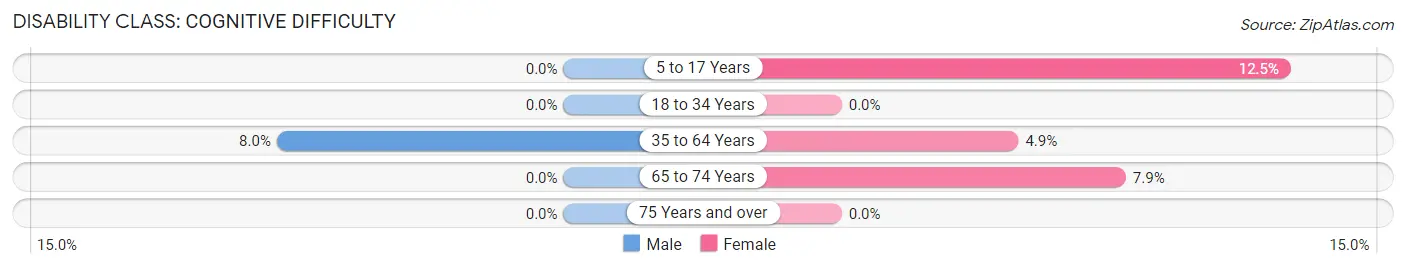
| Age Bracket | Male | Female |
| 5 to 17 Years | 0 (0.0%) | 7 (12.5%) |
| 18 to 34 Years | 0 (0.0%) | 0 (0.0%) |
| 35 to 64 Years | 13 (8.0%) | 22 (4.9%) |
| 65 to 74 Years | 0 (0.0%) | 22 (7.9%) |
| 75 Years and over | 0 (0.0%) | 0 (0.0%) |
Disability Class: Ambulatory Difficulty
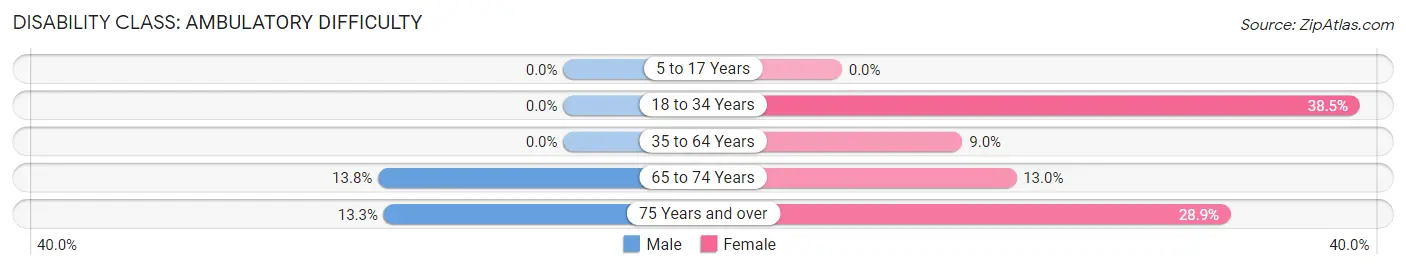
| Age Bracket | Male | Female |
| 5 to 17 Years | 0 (0.0%) | 0 (0.0%) |
| 18 to 34 Years | 0 (0.0%) | 25 (38.5%) |
| 35 to 64 Years | 0 (0.0%) | 40 (8.9%) |
| 65 to 74 Years | 11 (13.8%) | 36 (13.0%) |
| 75 Years and over | 22 (13.3%) | 65 (28.9%) |
Disability Class: Self-Care Difficulty
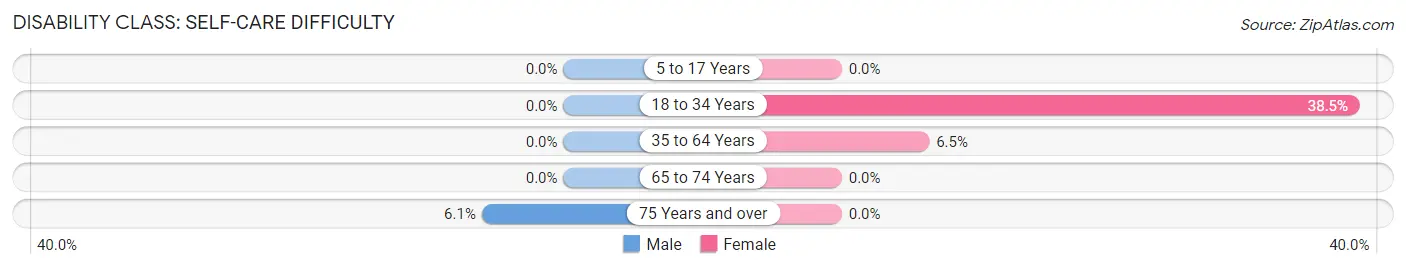
| Age Bracket | Male | Female |
| 5 to 17 Years | 0 (0.0%) | 0 (0.0%) |
| 18 to 34 Years | 0 (0.0%) | 25 (38.5%) |
| 35 to 64 Years | 0 (0.0%) | 29 (6.5%) |
| 65 to 74 Years | 0 (0.0%) | 0 (0.0%) |
| 75 Years and over | 10 (6.1%) | 0 (0.0%) |
Technology Access in Orleans
Computing Device Access in Orleans
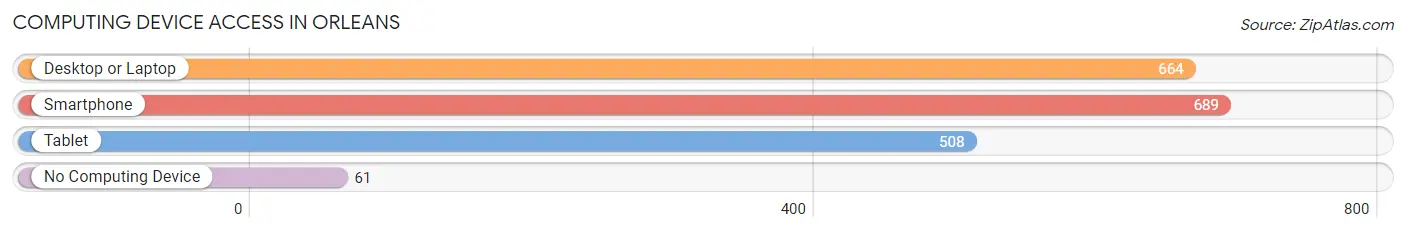
| Device Type | # Households | % Households |
| Desktop or Laptop | 664 | 78.2% |
| Smartphone | 689 | 81.1% |
| Tablet | 508 | 59.8% |
| No Computing Device | 61 | 7.2% |
| Total | 849 | 100.0% |
Internet Access in Orleans
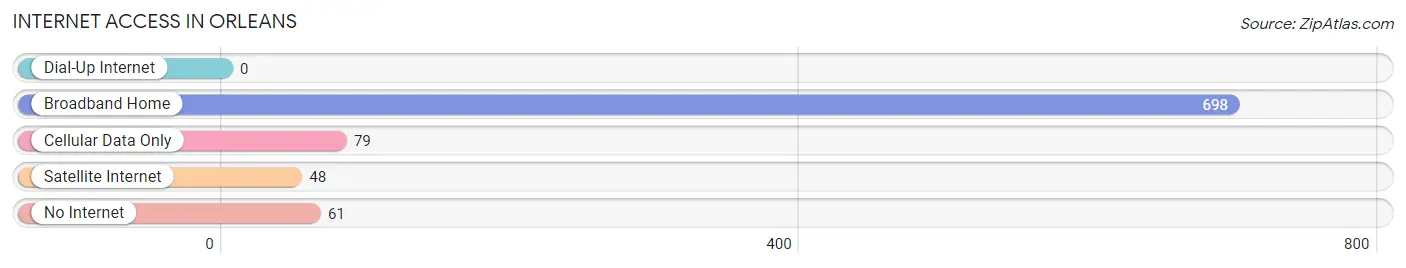
| Internet Type | # Households | % Households |
| Dial-Up Internet | 0 | 0.0% |
| Broadband Home | 698 | 82.2% |
| Cellular Data Only | 79 | 9.3% |
| Satellite Internet | 48 | 5.7% |
| No Internet | 61 | 7.2% |
| Total | 849 | 100.0% |
Orleans Summary
Orleans, Massachusetts is a town located in Barnstable County on the Cape Cod peninsula. It is bordered by Eastham to the north, Brewster to the east, Chatham to the south, and Wellfleet to the west. The town is known for its beautiful beaches, salt marshes, and cranberry bogs. Orleans is a popular tourist destination, and is home to a variety of restaurants, shops, and other attractions.
History
The area that is now Orleans was originally inhabited by the Nauset tribe, who were part of the Wampanoag Confederacy. The first European settlers arrived in the area in 1693, and the town was officially incorporated in 1797. The town was named after the Duke of Orleans, who was the regent of France at the time.
In the 19th century, Orleans was a major fishing port, and the town’s economy was largely based on the fishing industry. The town was also home to several shipbuilding yards, and the town’s population grew steadily throughout the 19th century.
In the 20th century, the town’s economy shifted away from fishing and shipbuilding, and towards tourism. The town’s population has grown steadily since the 1950s, and the town is now a popular tourist destination.
Geography
Orleans is located on the Cape Cod peninsula, and is bordered by Eastham to the north, Brewster to the east, Chatham to the south, and Wellfleet to the west. The town is located on the Atlantic Ocean, and is home to several beaches, salt marshes, and cranberry bogs. The town is also home to several ponds, including Town Cove, Little Pleasant Bay, and Nauset Marsh.
The town is located in the southeastern part of Massachusetts, and is approximately 50 miles south of Boston. The town is accessible by car via Route 6, and is also served by the Cape Cod Regional Transit Authority.
Economy
The town’s economy is largely based on tourism, and the town is home to a variety of restaurants, shops, and other attractions. The town is also home to several businesses, including a marina, a golf course, and a cranberry farm. The town is also home to several art galleries, and is a popular destination for art lovers.
Demographics
As of the 2010 census, the town had a population of 5,890. The median household income was $62,917, and the median family income was $76,917. The town’s population is largely white (93.3%), and the town is also home to a small Hispanic population (2.2%). The town’s population is also largely Christian (83.3%), and the town is home to a small Jewish population (1.2%).
Conclusion
Orleans, Massachusetts is a beautiful town located on the Cape Cod peninsula. The town is known for its beautiful beaches, salt marshes, and cranberry bogs, and is a popular tourist destination. The town’s economy is largely based on tourism, and the town is home to a variety of restaurants, shops, and other attractions. The town’s population is largely white, and the town is also home to a small Hispanic and Jewish population.
Common Questions
What is Per Capita Income in Orleans?
Per Capita income in Orleans is $49,937.
What is the Median Family Income in Orleans?
Median Family Income in Orleans is $102,188.
What is the Median Household income in Orleans?
Median Household Income in Orleans is $72,422.
What is Income or Wage Gap in Orleans?
Income or Wage Gap in Orleans is 8.4%.
Women in Orleans earn 91.6 cents for every dollar earned by a man.
What is Inequality or Gini Index in Orleans?
Inequality or Gini Index in Orleans is 0.46.
What is the Total Population of Orleans?
Total Population of Orleans is 1,665.
What is the Total Male Population of Orleans?
Total Male Population of Orleans is 594.
What is the Total Female Population of Orleans?
Total Female Population of Orleans is 1,071.
What is the Ratio of Males per 100 Females in Orleans?
There are 55.46 Males per 100 Females in Orleans.
What is the Ratio of Females per 100 Males in Orleans?
There are 180.30 Females per 100 Males in Orleans.
What is the Median Population Age in Orleans?
Median Population Age in Orleans is 64.3 Years.
What is the Average Family Size in Orleans
Average Family Size in Orleans is 2.7 People.
What is the Average Household Size in Orleans
Average Household Size in Orleans is 1.9 People.
How Large is the Labor Force in Orleans?
There are 767 People in the Labor Forcein in Orleans.
What is the Percentage of People in the Labor Force in Orleans?
49.1% of People are in the Labor Force in Orleans.