Reading, MA Map & Demographics
Reading Map
Reading Overview
$66,745
PER CAPITA INCOME
$187,682
AVG FAMILY INCOME
$154,662
AVG HOUSEHOLD INCOME
35.6%
WAGE / INCOME GAP [ % ]
64.4¢/ $1
WAGE / INCOME GAP [ $ ]
$3,890
FAMILY INCOME DEFICIT
0.42
INEQUALITY / GINI INDEX
25,415
TOTAL POPULATION
12,588
MALE POPULATION
12,827
FEMALE POPULATION
98.14
MALES / 100 FEMALES
101.90
FEMALES / 100 MALES
44.2
MEDIAN AGE
3.2
AVG FAMILY SIZE
2.7
AVG HOUSEHOLD SIZE
13,684
LABOR FORCE [ PEOPLE ]
68.2%
PERCENT IN LABOR FORCE
2.8%
UNEMPLOYMENT RATE
Reading Zip Codes
Reading Area Codes
Income in Reading
Income Overview in Reading
Per Capita Income in Reading is $66,745, while median incomes of families and households are $187,682 and $154,662 respectively.
| Characteristic | Number | Measure |
| Per Capita Income | 25,415 | $66,745 |
| Median Family Income | 6,927 | $187,682 |
| Mean Family Income | 6,927 | $209,915 |
| Median Household Income | 9,478 | $154,662 |
| Mean Household Income | 9,478 | $176,366 |
| Income Deficit | 6,927 | $3,890 |
| Wage / Income Gap (%) | 25,415 | 35.59% |
| Wage / Income Gap ($) | 25,415 | 64.41¢ per $1 |
| Gini / Inequality Index | 25,415 | 0.42 |
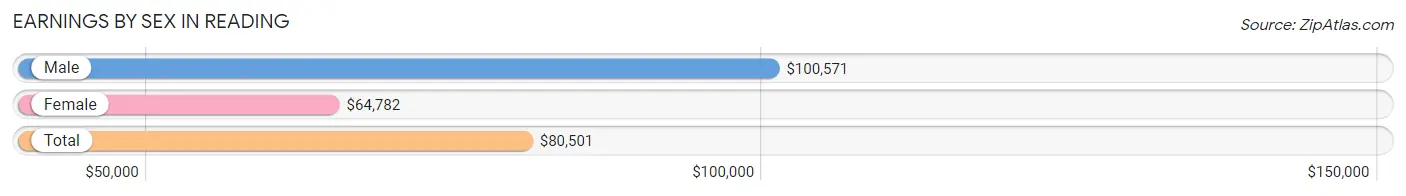
Earnings by Sex in Reading
Average Earnings in Reading are $80,501, $100,571 for men and $64,782 for women, a difference of 35.6%.
| Sex | Number | Average Earnings |
| Male | 7,328 (51.0%) | $100,571 |
| Female | 7,031 (49.0%) | $64,782 |
| Total | 14,359 (100.0%) | $80,501 |
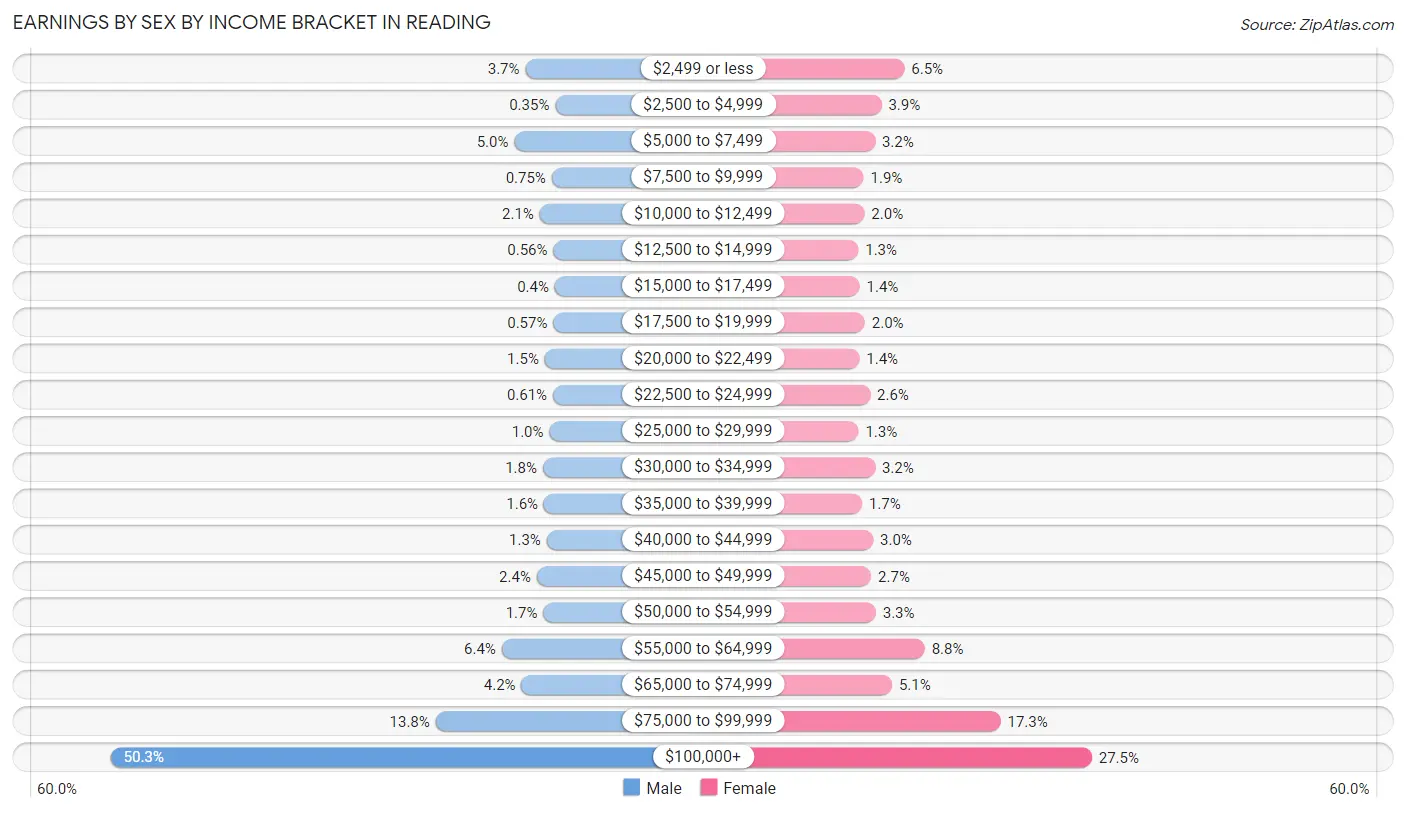
Earnings by Sex by Income Bracket in Reading
The most common earnings brackets in Reading are $100,000+ for men (3,688 | 50.3%) and $100,000+ for women (1,936 | 27.5%).
| Income | Male | Female |
| $2,499 or less | 272 (3.7%) | 455 (6.5%) |
| $2,500 to $4,999 | 26 (0.4%) | 274 (3.9%) |
| $5,000 to $7,499 | 363 (5.0%) | 223 (3.2%) |
| $7,500 to $9,999 | 55 (0.7%) | 133 (1.9%) |
| $10,000 to $12,499 | 154 (2.1%) | 139 (2.0%) |
| $12,500 to $14,999 | 41 (0.6%) | 91 (1.3%) |
| $15,000 to $17,499 | 29 (0.4%) | 101 (1.4%) |
| $17,500 to $19,999 | 42 (0.6%) | 143 (2.0%) |
| $20,000 to $22,499 | 112 (1.5%) | 99 (1.4%) |
| $22,500 to $24,999 | 45 (0.6%) | 184 (2.6%) |
| $25,000 to $29,999 | 74 (1.0%) | 92 (1.3%) |
| $30,000 to $34,999 | 128 (1.8%) | 223 (3.2%) |
| $35,000 to $39,999 | 119 (1.6%) | 120 (1.7%) |
| $40,000 to $44,999 | 96 (1.3%) | 208 (3.0%) |
| $45,000 to $49,999 | 178 (2.4%) | 193 (2.7%) |
| $50,000 to $54,999 | 124 (1.7%) | 229 (3.3%) |
| $55,000 to $64,999 | 467 (6.4%) | 616 (8.8%) |
| $65,000 to $74,999 | 304 (4.2%) | 357 (5.1%) |
| $75,000 to $99,999 | 1,011 (13.8%) | 1,215 (17.3%) |
| $100,000+ | 3,688 (50.3%) | 1,936 (27.5%) |
| Total | 7,328 (100.0%) | 7,031 (100.0%) |
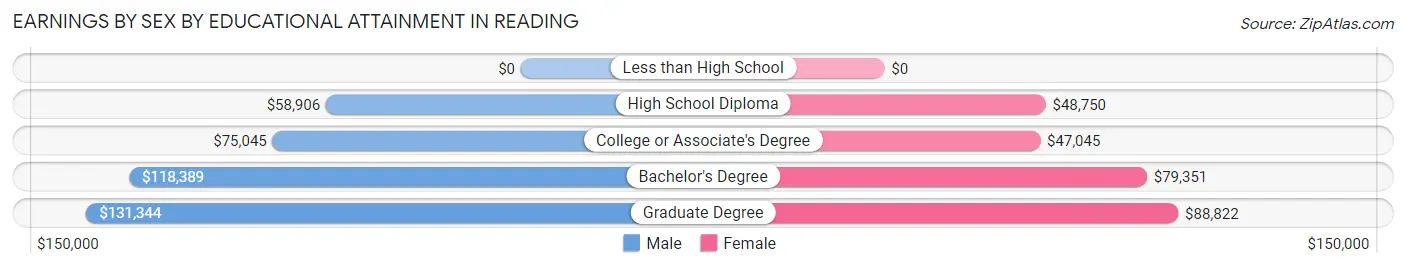
Earnings by Sex by Educational Attainment in Reading
Average earnings in Reading are $108,582 for men and $73,447 for women, a difference of 32.4%. Men with an educational attainment of graduate degree enjoy the highest average annual earnings of $131,344, while those with high school diploma education earn the least with $58,906. Women with an educational attainment of graduate degree earn the most with the average annual earnings of $88,822, while those with college or associate's degree education have the smallest earnings of $47,045.
| Educational Attainment | Male Income | Female Income |
| Less than High School | - | - |
| High School Diploma | $58,906 | $48,750 |
| College or Associate's Degree | $75,045 | $47,045 |
| Bachelor's Degree | $118,389 | $79,351 |
| Graduate Degree | $131,344 | $88,822 |
| Total | $108,582 | $73,447 |
Family Income in Reading
Family Income Brackets in Reading
According to the Reading family income data, there are 3,020 families falling into the $200,000+ income range, which is the most common income bracket and makes up 43.6% of all families. Conversely, the less than $10,000 income bracket is the least frequent group with only 21 families (0.3%) belonging to this category.
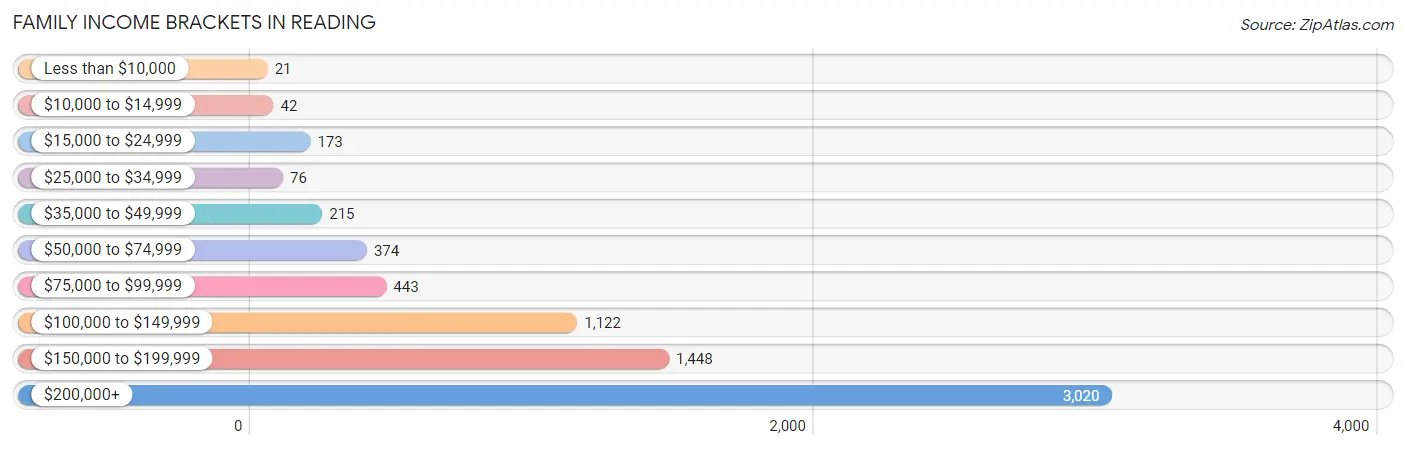
| Income Bracket | # Families | % Families |
| Less than $10,000 | 21 | 0.3% |
| $10,000 to $14,999 | 42 | 0.6% |
| $15,000 to $24,999 | 173 | 2.5% |
| $25,000 to $34,999 | 76 | 1.1% |
| $35,000 to $49,999 | 215 | 3.1% |
| $50,000 to $74,999 | 374 | 5.4% |
| $75,000 to $99,999 | 443 | 6.4% |
| $100,000 to $149,999 | 1,122 | 16.2% |
| $150,000 to $199,999 | 1,448 | 20.9% |
| $200,000+ | 3,020 | 43.6% |
Family Income by Famaliy Size in Reading
6-person families (189 | 2.7%) account for the highest median family income in Reading with $250,001 per family, while 2-person families (2,934 | 42.4%) have the highest median income of $70,270 per family member.
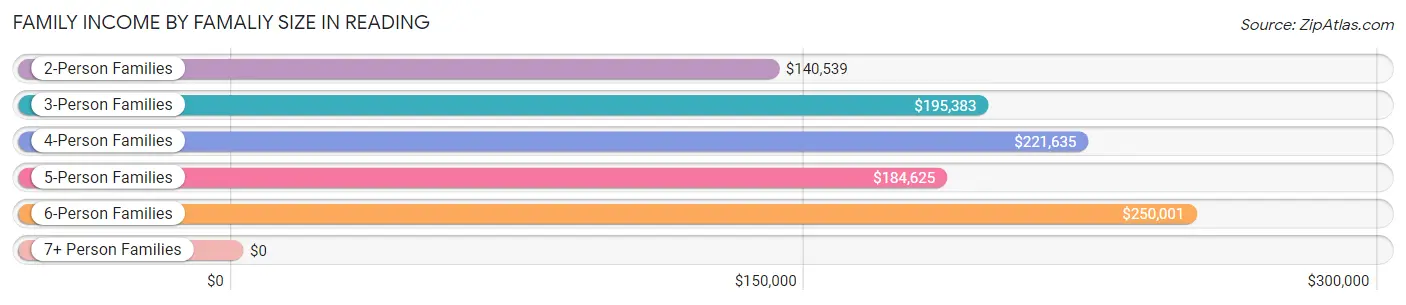
| Income Bracket | # Families | Median Income |
| 2-Person Families | 2,934 (42.4%) | $140,539 |
| 3-Person Families | 1,241 (17.9%) | $195,383 |
| 4-Person Families | 1,877 (27.1%) | $221,635 |
| 5-Person Families | 679 (9.8%) | $184,625 |
| 6-Person Families | 189 (2.7%) | $250,001 |
| 7+ Person Families | 7 (0.1%) | $0 |
| Total | 6,927 (100.0%) | $187,682 |
Family Income by Number of Earners in Reading
The median family income in Reading is $187,682, with families comprising 3+ earners (1,180) having the highest median family income of $248,286, while families with no earners (754) have the lowest median family income of $70,735, accounting for 17.0% and 10.9% of families, respectively.
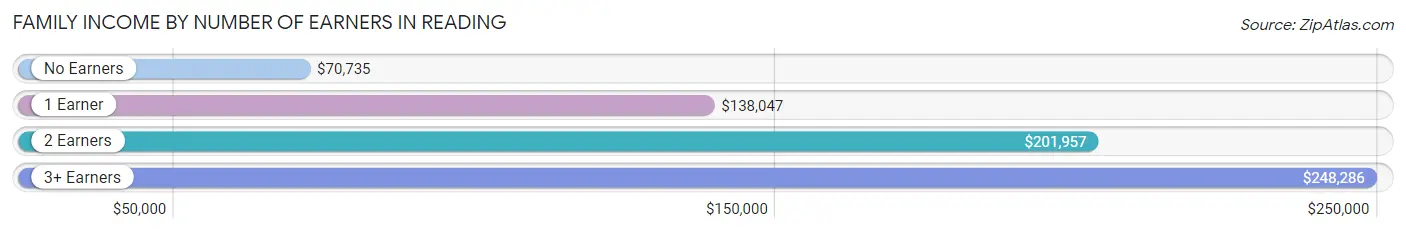
| Number of Earners | # Families | Median Income |
| No Earners | 754 (10.9%) | $70,735 |
| 1 Earner | 1,485 (21.4%) | $138,047 |
| 2 Earners | 3,508 (50.6%) | $201,957 |
| 3+ Earners | 1,180 (17.0%) | $248,286 |
| Total | 6,927 (100.0%) | $187,682 |
Household Income in Reading
Household Income Brackets in Reading
With 3,251 households falling in the category, the $200,000+ income range is the most frequent in Reading, accounting for 34.3% of all households. In contrast, only 95 households (1.0%) fall into the $10,000 to $14,999 income bracket, making it the least populous group.
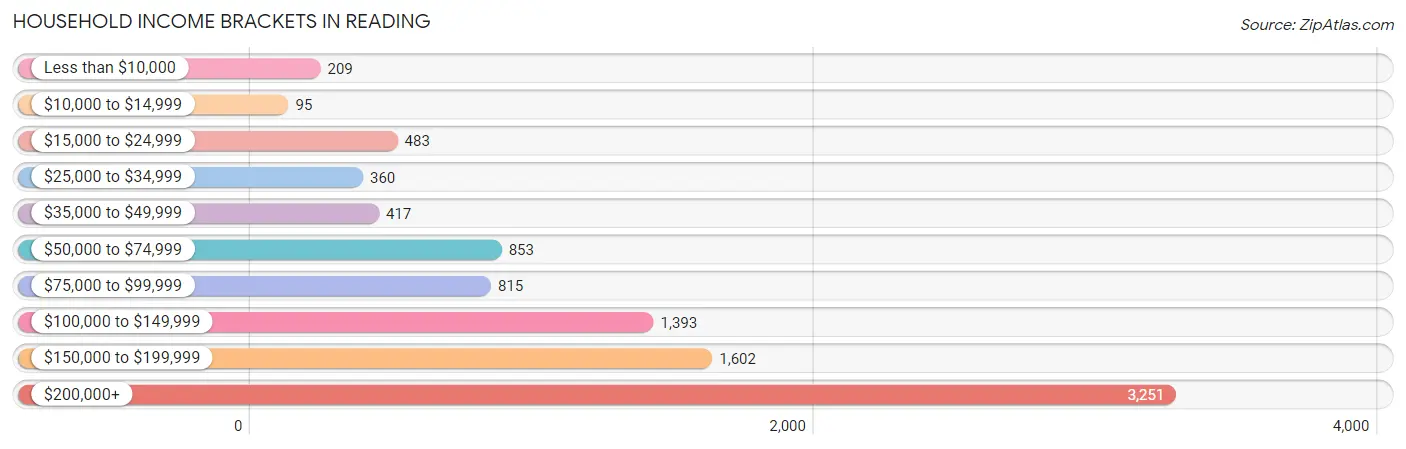
| Income Bracket | # Households | % Households |
| Less than $10,000 | 209 | 2.2% |
| $10,000 to $14,999 | 95 | 1.0% |
| $15,000 to $24,999 | 483 | 5.1% |
| $25,000 to $34,999 | 360 | 3.8% |
| $35,000 to $49,999 | 417 | 4.4% |
| $50,000 to $74,999 | 853 | 9.0% |
| $75,000 to $99,999 | 815 | 8.6% |
| $100,000 to $149,999 | 1,393 | 14.7% |
| $150,000 to $199,999 | 1,602 | 16.9% |
| $200,000+ | 3,251 | 34.3% |
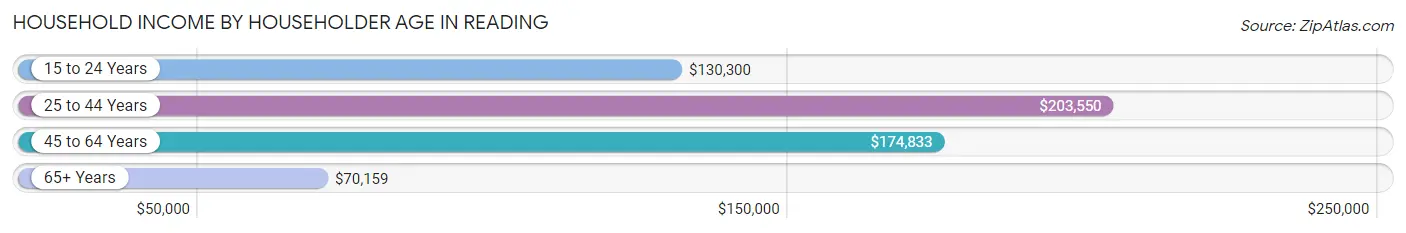
Household Income by Householder Age in Reading
The median household income in Reading is $154,662, with the highest median household income of $203,550 found in the 25 to 44 years age bracket for the primary householder. A total of 2,529 households (26.7%) fall into this category. Meanwhile, the 65+ years age bracket for the primary householder has the lowest median household income of $70,159, with 3,013 households (31.8%) in this group.
| Income Bracket | # Households | Median Income |
| 15 to 24 Years | 44 (0.5%) | $130,300 |
| 25 to 44 Years | 2,529 (26.7%) | $203,550 |
| 45 to 64 Years | 3,892 (41.1%) | $174,833 |
| 65+ Years | 3,013 (31.8%) | $70,159 |
| Total | 9,478 (100.0%) | $154,662 |
Poverty in Reading
Income Below Poverty by Sex and Age in Reading
With 2.2% poverty level for males and 4.8% for females among the residents of Reading, 16 and 17 year old males and 75 year old and over females are the most vulnerable to poverty, with 16 males (5.3%) and 141 females (11.5%) in their respective age groups living below the poverty level.
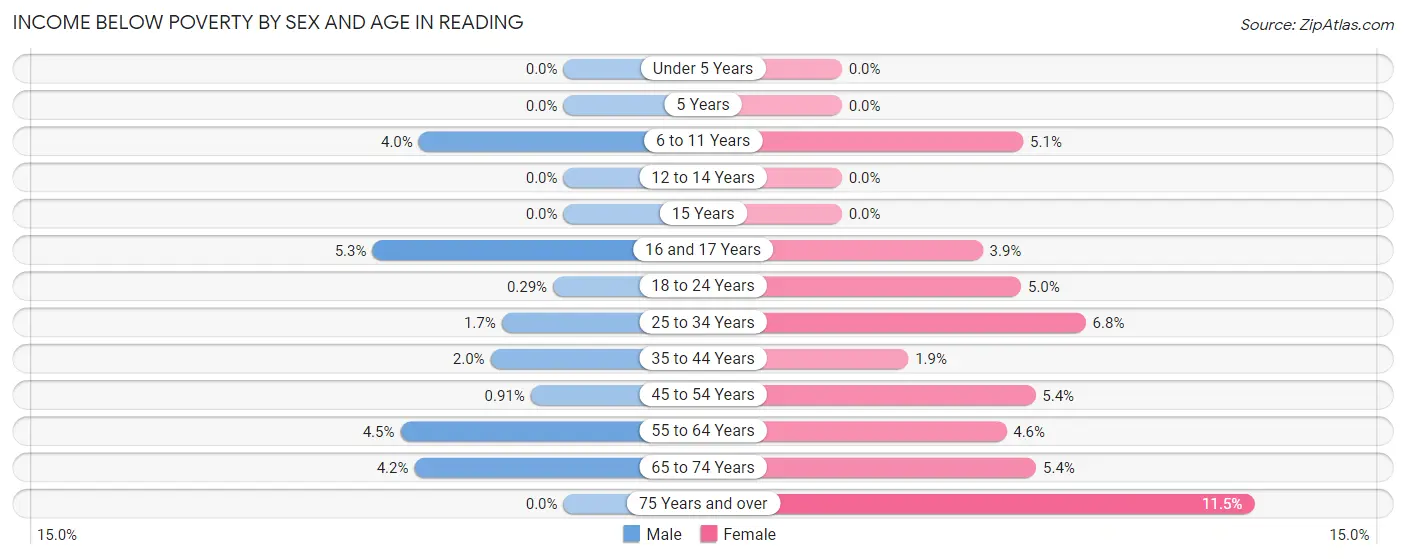
| Age Bracket | Male | Female |
| Under 5 Years | 0 (0.0%) | 0 (0.0%) |
| 5 Years | 0 (0.0%) | 0 (0.0%) |
| 6 to 11 Years | 57 (4.0%) | 43 (5.1%) |
| 12 to 14 Years | 0 (0.0%) | 0 (0.0%) |
| 15 Years | 0 (0.0%) | 0 (0.0%) |
| 16 and 17 Years | 16 (5.3%) | 16 (3.9%) |
| 18 to 24 Years | 2 (0.3%) | 36 (5.0%) |
| 25 to 34 Years | 20 (1.7%) | 76 (6.8%) |
| 35 to 44 Years | 32 (2.0%) | 32 (1.8%) |
| 45 to 54 Years | 17 (0.9%) | 95 (5.4%) |
| 55 to 64 Years | 83 (4.5%) | 81 (4.6%) |
| 65 to 74 Years | 54 (4.2%) | 92 (5.4%) |
| 75 Years and over | 0 (0.0%) | 141 (11.5%) |
| Total | 281 (2.2%) | 612 (4.8%) |
Income Above Poverty by Sex and Age in Reading
According to the poverty statistics in Reading, males aged under 5 years and females aged under 5 years are the age groups that are most secure financially, with 100.0% of males and 100.0% of females in these age groups living above the poverty line.
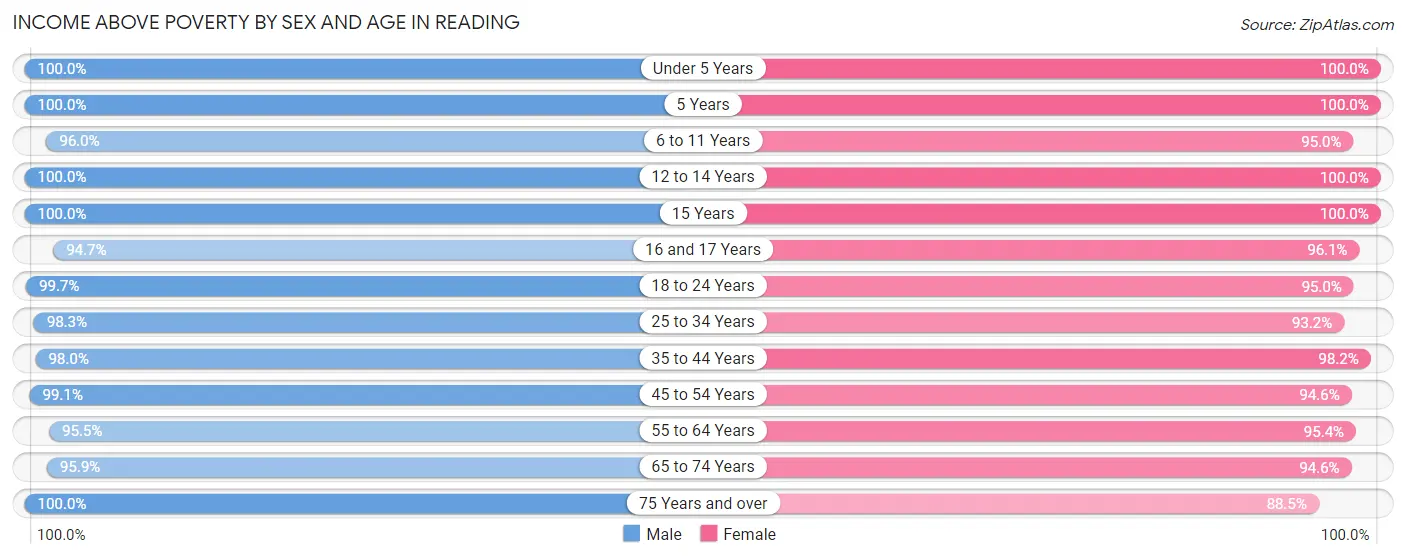
| Age Bracket | Male | Female |
| Under 5 Years | 748 (100.0%) | 591 (100.0%) |
| 5 Years | 147 (100.0%) | 108 (100.0%) |
| 6 to 11 Years | 1,356 (96.0%) | 808 (95.0%) |
| 12 to 14 Years | 480 (100.0%) | 565 (100.0%) |
| 15 Years | 238 (100.0%) | 172 (100.0%) |
| 16 and 17 Years | 285 (94.7%) | 392 (96.1%) |
| 18 to 24 Years | 695 (99.7%) | 685 (95.0%) |
| 25 to 34 Years | 1,145 (98.3%) | 1,044 (93.2%) |
| 35 to 44 Years | 1,543 (98.0%) | 1,697 (98.2%) |
| 45 to 54 Years | 1,857 (99.1%) | 1,668 (94.6%) |
| 55 to 64 Years | 1,746 (95.5%) | 1,686 (95.4%) |
| 65 to 74 Years | 1,246 (95.9%) | 1,609 (94.6%) |
| 75 Years and over | 764 (100.0%) | 1,087 (88.5%) |
| Total | 12,250 (97.8%) | 12,112 (95.2%) |
Income Below Poverty Among Married-Couple Families in Reading
The poverty statistics for married-couple families in Reading show that 0.9% or 54 of the total 6,094 families live below the poverty line. Families with no children have the highest poverty rate of 1.2%, comprising of 38 families. On the other hand, families with 3 or 4 children have the lowest poverty rate of 0.0%, which includes 0 families.
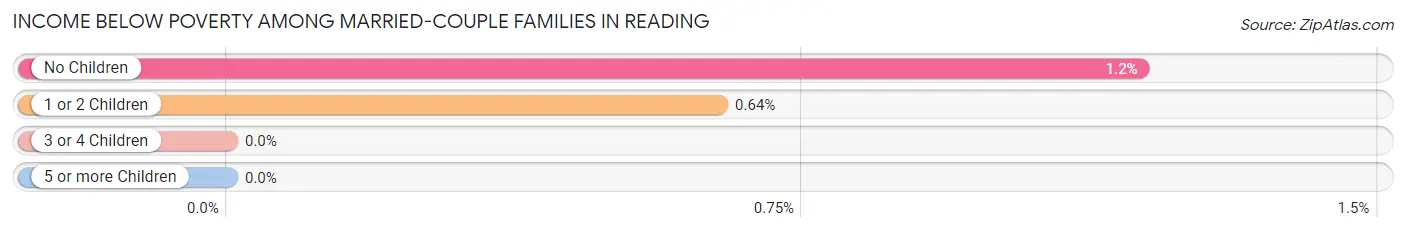
| Children | Above Poverty | Below Poverty |
| No Children | 3,157 (98.8%) | 38 (1.2%) |
| 1 or 2 Children | 2,491 (99.4%) | 16 (0.6%) |
| 3 or 4 Children | 392 (100.0%) | 0 (0.0%) |
| 5 or more Children | 0 (0.0%) | 0 (0.0%) |
| Total | 6,040 (99.1%) | 54 (0.9%) |
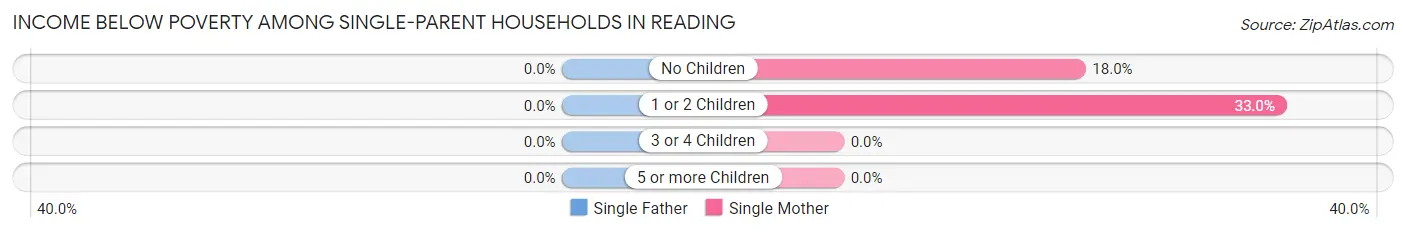
Income Below Poverty Among Single-Parent Households in Reading
| Children | Single Father | Single Mother |
| No Children | 0 (0.0%) | 67 (18.0%) |
| 1 or 2 Children | 0 (0.0%) | 69 (33.0%) |
| 3 or 4 Children | 0 (0.0%) | 0 (0.0%) |
| 5 or more Children | 0 (0.0%) | 0 (0.0%) |
| Total | 0 (0.0%) | 136 (22.5%) |
Income Below Poverty Among Married-Couple vs Single-Parent Households in Reading
The poverty data for Reading shows that 54 of the married-couple family households (0.9%) and 136 of the single-parent households (16.3%) are living below the poverty level. Within the married-couple family households, those with no children have the highest poverty rate, with 38 households (1.2%) falling below the poverty line. Among the single-parent households, those with 1 or 2 children have the highest poverty rate, with 69 household (21.1%) living below poverty.
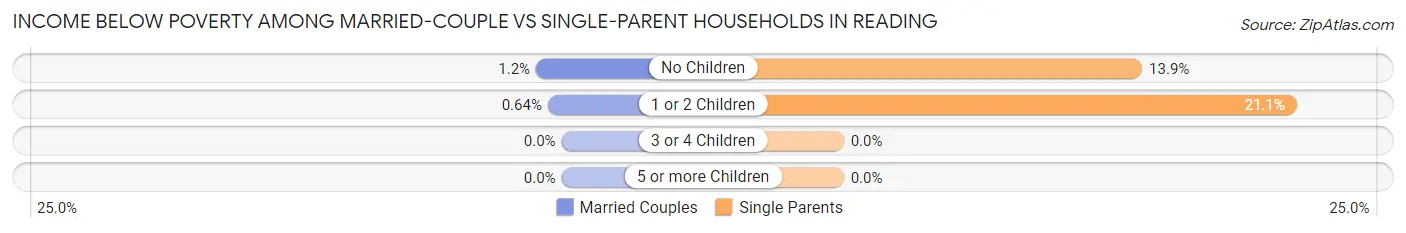
| Children | Married-Couple Families | Single-Parent Households |
| No Children | 38 (1.2%) | 67 (13.9%) |
| 1 or 2 Children | 16 (0.6%) | 69 (21.1%) |
| 3 or 4 Children | 0 (0.0%) | 0 (0.0%) |
| 5 or more Children | 0 (0.0%) | 0 (0.0%) |
| Total | 54 (0.9%) | 136 (16.3%) |
Race in Reading
The most populous races in Reading are White / Caucasian (22,157 | 87.2%), Asian (1,632 | 6.4%), and Two or more Races (1,321 | 5.2%).
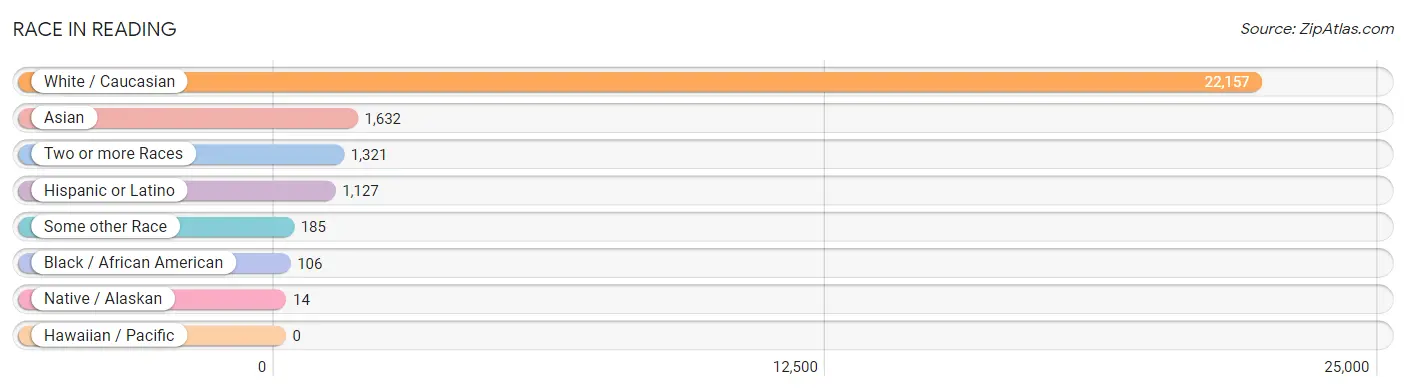
| Race | # Population | % Population |
| Asian | 1,632 | 6.4% |
| Black / African American | 106 | 0.4% |
| Hawaiian / Pacific | 0 | 0.0% |
| Hispanic or Latino | 1,127 | 4.4% |
| Native / Alaskan | 14 | 0.1% |
| White / Caucasian | 22,157 | 87.2% |
| Two or more Races | 1,321 | 5.2% |
| Some other Race | 185 | 0.7% |
| Total | 25,415 | 100.0% |
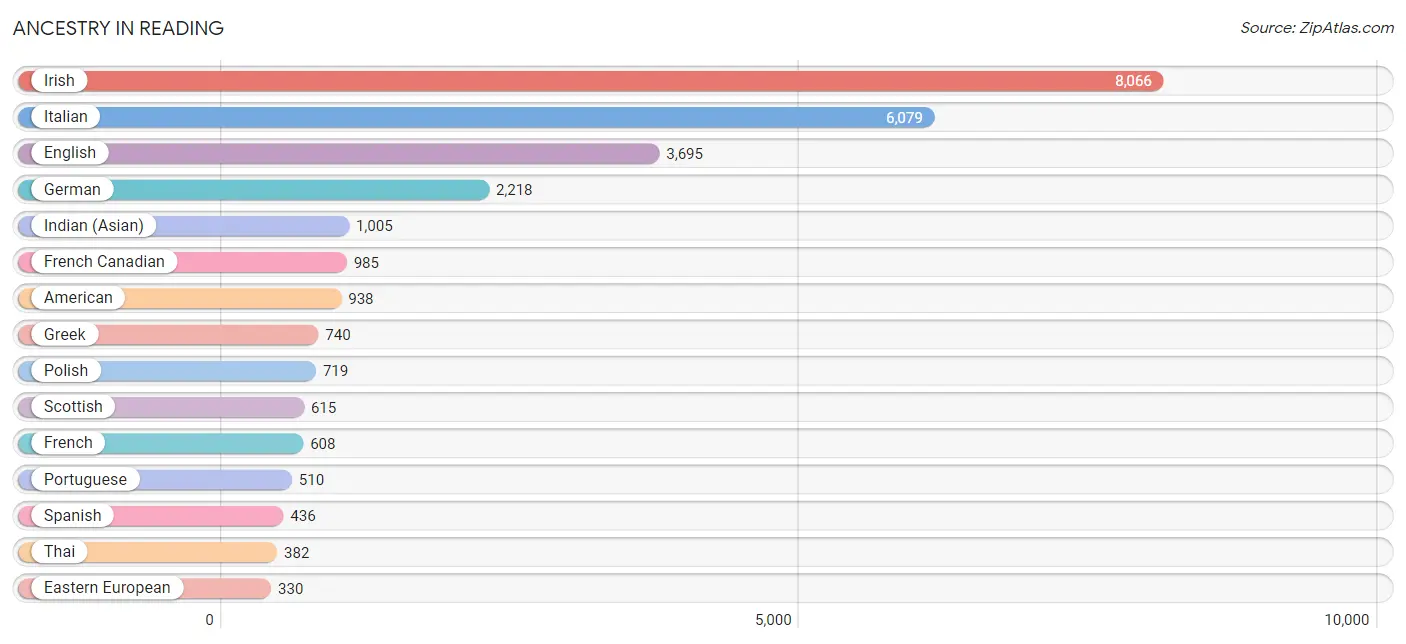
Ancestry in Reading
The most populous ancestries reported in Reading are Irish (8,066 | 31.7%), Italian (6,079 | 23.9%), English (3,695 | 14.5%), German (2,218 | 8.7%), and Indian (Asian) (1,005 | 4.0%), together accounting for 82.9% of all Reading residents.
| Ancestry | # Population | % Population |
| American | 938 | 3.7% |
| Arab | 122 | 0.5% |
| Argentinean | 14 | 0.1% |
| Armenian | 89 | 0.4% |
| Australian | 26 | 0.1% |
| Austrian | 64 | 0.3% |
| Belgian | 11 | 0.0% |
| Bhutanese | 15 | 0.1% |
| Brazilian | 167 | 0.7% |
| British | 109 | 0.4% |
| Bulgarian | 10 | 0.0% |
| Burmese | 141 | 0.5% |
| Canadian | 132 | 0.5% |
| Cape Verdean | 6 | 0.0% |
| Central American | 60 | 0.2% |
| Cherokee | 38 | 0.2% |
| Chippewa | 15 | 0.1% |
| Colombian | 76 | 0.3% |
| Croatian | 8 | 0.0% |
| Cuban | 16 | 0.1% |
| Czech | 43 | 0.2% |
| Czechoslovakian | 33 | 0.1% |
| Danish | 30 | 0.1% |
| Dominican | 15 | 0.1% |
| Dutch | 197 | 0.8% |
| Eastern European | 330 | 1.3% |
| Ecuadorian | 88 | 0.4% |
| Egyptian | 25 | 0.1% |
| English | 3,695 | 14.5% |
| European | 297 | 1.2% |
| Filipino | 27 | 0.1% |
| Finnish | 28 | 0.1% |
| French | 608 | 2.4% |
| French American Indian | 15 | 0.1% |
| French Canadian | 985 | 3.9% |
| German | 2,218 | 8.7% |
| Greek | 740 | 2.9% |
| Haitian | 1 | 0.0% |
| Hungarian | 53 | 0.2% |
| Indian (Asian) | 1,005 | 4.0% |
| Iranian | 7 | 0.0% |
| Irish | 8,066 | 31.7% |
| Italian | 6,079 | 23.9% |
| Jamaican | 63 | 0.3% |
| Korean | 157 | 0.6% |
| Lebanese | 18 | 0.1% |
| Liberian | 30 | 0.1% |
| Lithuanian | 143 | 0.6% |
| Mexican | 55 | 0.2% |
| Nicaraguan | 12 | 0.1% |
| Northern European | 14 | 0.1% |
| Norwegian | 196 | 0.8% |
| Panamanian | 48 | 0.2% |
| Polish | 719 | 2.8% |
| Portuguese | 510 | 2.0% |
| Puerto Rican | 179 | 0.7% |
| Romanian | 11 | 0.0% |
| Russian | 249 | 1.0% |
| Scandinavian | 62 | 0.2% |
| Scotch-Irish | 256 | 1.0% |
| Scottish | 615 | 2.4% |
| Serbian | 58 | 0.2% |
| Slavic | 55 | 0.2% |
| Slovak | 6 | 0.0% |
| South American | 178 | 0.7% |
| Spaniard | 52 | 0.2% |
| Spanish | 436 | 1.7% |
| Subsaharan African | 36 | 0.1% |
| Swedish | 254 | 1.0% |
| Swiss | 71 | 0.3% |
| Syrian | 79 | 0.3% |
| Thai | 382 | 1.5% |
| Welsh | 58 | 0.2% | View All 73 Rows |
Immigrants in Reading
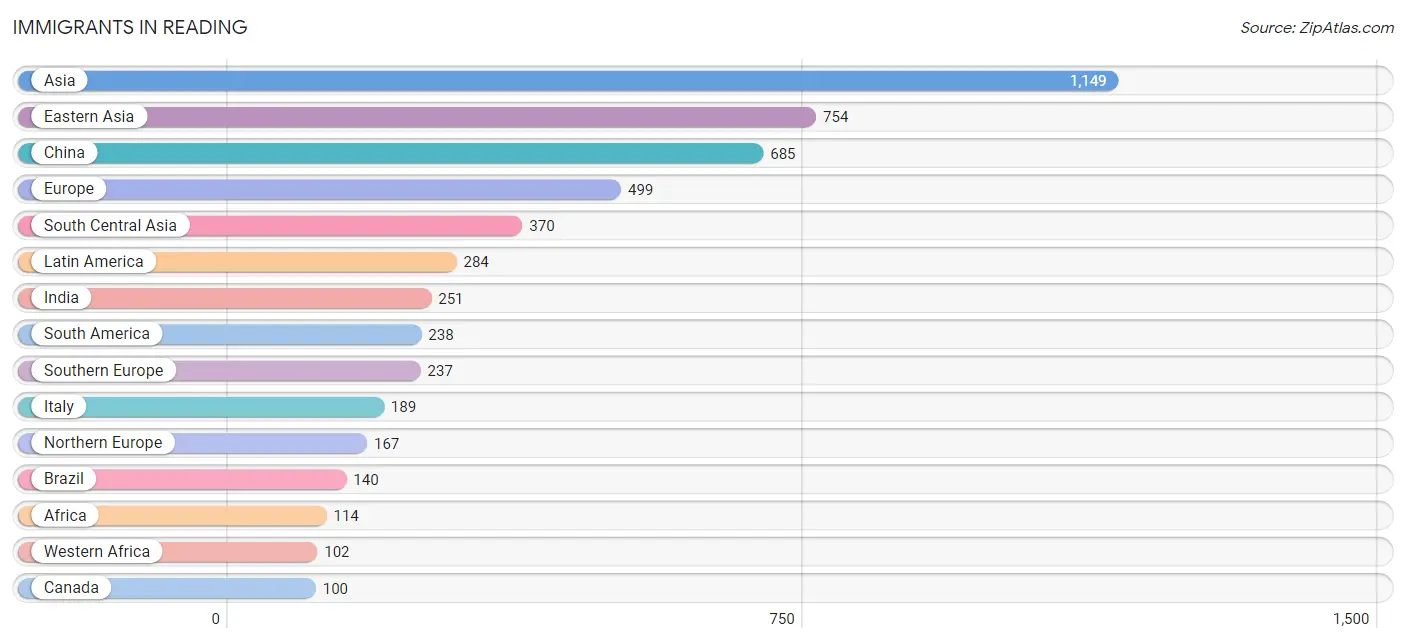
The most numerous immigrant groups reported in Reading came from Asia (1,149 | 4.5%), Eastern Asia (754 | 3.0%), China (685 | 2.7%), Europe (499 | 2.0%), and South Central Asia (370 | 1.5%), together accounting for 13.6% of all Reading residents.
| Immigration Origin | # Population | % Population |
| Africa | 114 | 0.4% |
| Argentina | 14 | 0.1% |
| Armenia | 8 | 0.0% |
| Asia | 1,149 | 4.5% |
| Azores | 18 | 0.1% |
| Brazil | 140 | 0.5% |
| Bulgaria | 10 | 0.0% |
| Canada | 100 | 0.4% |
| Caribbean | 46 | 0.2% |
| China | 685 | 2.7% |
| Colombia | 38 | 0.2% |
| Dominican Republic | 15 | 0.1% |
| Eastern Asia | 754 | 3.0% |
| Eastern Europe | 57 | 0.2% |
| Ecuador | 46 | 0.2% |
| England | 29 | 0.1% |
| Europe | 499 | 2.0% |
| France | 15 | 0.1% |
| Germany | 23 | 0.1% |
| Haiti | 1 | 0.0% |
| Hong Kong | 6 | 0.0% |
| India | 251 | 1.0% |
| Iran | 30 | 0.1% |
| Ireland | 76 | 0.3% |
| Israel | 9 | 0.0% |
| Italy | 189 | 0.7% |
| Jamaica | 30 | 0.1% |
| Korea | 69 | 0.3% |
| Latin America | 284 | 1.1% |
| Liberia | 19 | 0.1% |
| Moldova | 14 | 0.1% |
| Northern Africa | 12 | 0.1% |
| Northern Europe | 167 | 0.7% |
| Oceania | 19 | 0.1% |
| Pakistan | 44 | 0.2% |
| Philippines | 8 | 0.0% |
| Portugal | 48 | 0.2% |
| South America | 238 | 0.9% |
| South Central Asia | 370 | 1.5% |
| South Eastern Asia | 8 | 0.0% |
| Southern Europe | 237 | 0.9% |
| Sri Lanka | 45 | 0.2% |
| Taiwan | 27 | 0.1% |
| Ukraine | 33 | 0.1% |
| Western Africa | 102 | 0.4% |
| Western Asia | 17 | 0.1% |
| Western Europe | 38 | 0.2% | View All 47 Rows |
Sex and Age in Reading
Sex and Age in Reading
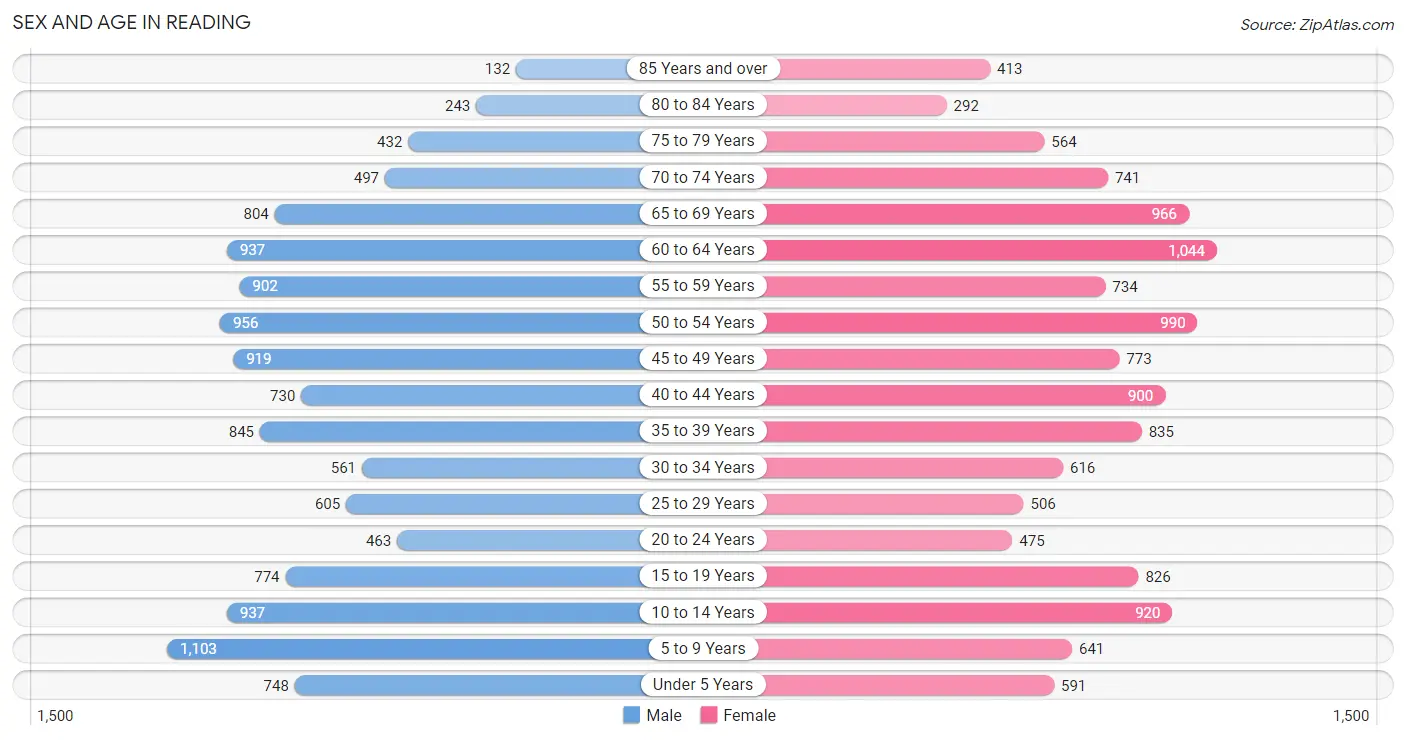
The most populous age groups in Reading are 5 to 9 Years (1,103 | 8.8%) for men and 60 to 64 Years (1,044 | 8.1%) for women.
| Age Bracket | Male | Female |
| Under 5 Years | 748 (5.9%) | 591 (4.6%) |
| 5 to 9 Years | 1,103 (8.8%) | 641 (5.0%) |
| 10 to 14 Years | 937 (7.4%) | 920 (7.2%) |
| 15 to 19 Years | 774 (6.1%) | 826 (6.4%) |
| 20 to 24 Years | 463 (3.7%) | 475 (3.7%) |
| 25 to 29 Years | 605 (4.8%) | 506 (3.9%) |
| 30 to 34 Years | 561 (4.5%) | 616 (4.8%) |
| 35 to 39 Years | 845 (6.7%) | 835 (6.5%) |
| 40 to 44 Years | 730 (5.8%) | 900 (7.0%) |
| 45 to 49 Years | 919 (7.3%) | 773 (6.0%) |
| 50 to 54 Years | 956 (7.6%) | 990 (7.7%) |
| 55 to 59 Years | 902 (7.2%) | 734 (5.7%) |
| 60 to 64 Years | 937 (7.4%) | 1,044 (8.1%) |
| 65 to 69 Years | 804 (6.4%) | 966 (7.5%) |
| 70 to 74 Years | 497 (4.0%) | 741 (5.8%) |
| 75 to 79 Years | 432 (3.4%) | 564 (4.4%) |
| 80 to 84 Years | 243 (1.9%) | 292 (2.3%) |
| 85 Years and over | 132 (1.1%) | 413 (3.2%) |
| Total | 12,588 (100.0%) | 12,827 (100.0%) |
Families and Households in Reading
Median Family Size in Reading
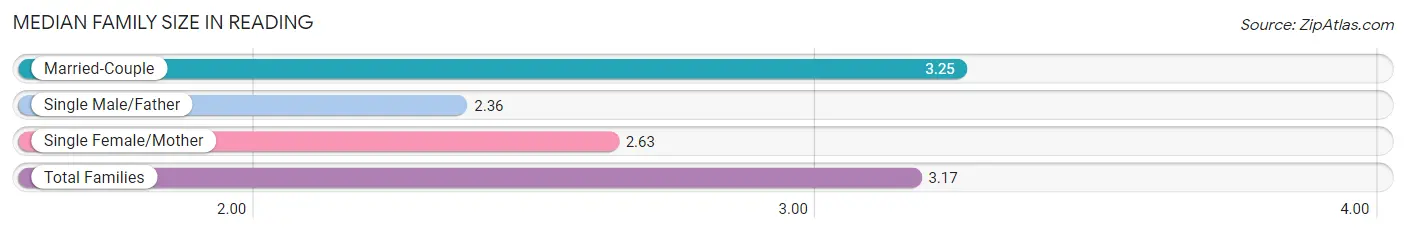
The median family size in Reading is 3.17 persons per family, with married-couple families (6,094 | 88.0%) accounting for the largest median family size of 3.25 persons per family. On the other hand, single male/father families (228 | 3.3%) represent the smallest median family size with 2.36 persons per family.
| Family Type | # Families | Family Size |
| Married-Couple | 6,094 (88.0%) | 3.25 |
| Single Male/Father | 228 (3.3%) | 2.36 |
| Single Female/Mother | 605 (8.7%) | 2.63 |
| Total Families | 6,927 (100.0%) | 3.17 |
Median Household Size in Reading
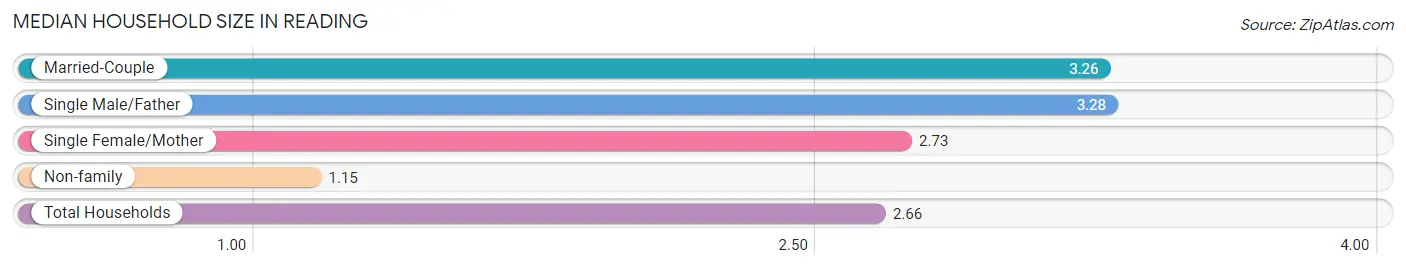
The median household size in Reading is 2.66 persons per household, with single male/father households (228 | 2.4%) accounting for the largest median household size of 3.28 persons per household. non-family households (2,551 | 26.9%) represent the smallest median household size with 1.15 persons per household.
| Household Type | # Households | Household Size |
| Married-Couple | 6,094 (64.3%) | 3.26 |
| Single Male/Father | 228 (2.4%) | 3.28 |
| Single Female/Mother | 605 (6.4%) | 2.73 |
| Non-family | 2,551 (26.9%) | 1.15 |
| Total Households | 9,478 (100.0%) | 2.66 |
Household Size by Marriage Status in Reading
Out of a total of 9,478 households in Reading, 6,927 (73.1%) are family households, while 2,551 (26.9%) are nonfamily households. The most numerous type of family households are 2-person households, comprising 2,845, and the most common type of nonfamily households are 1-person households, comprising 2,216.
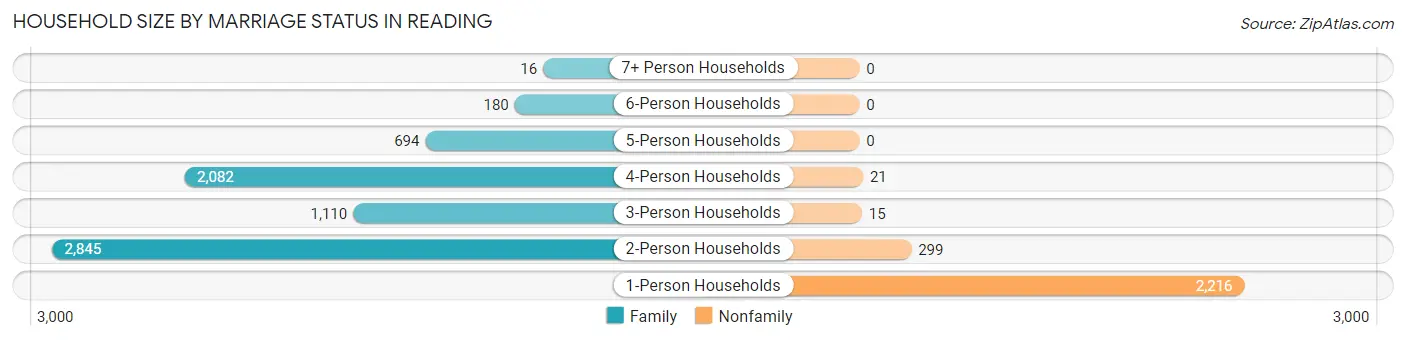
| Household Size | Family Households | Nonfamily Households |
| 1-Person Households | - | 2,216 (23.4%) |
| 2-Person Households | 2,845 (30.0%) | 299 (3.2%) |
| 3-Person Households | 1,110 (11.7%) | 15 (0.2%) |
| 4-Person Households | 2,082 (22.0%) | 21 (0.2%) |
| 5-Person Households | 694 (7.3%) | 0 (0.0%) |
| 6-Person Households | 180 (1.9%) | 0 (0.0%) |
| 7+ Person Households | 16 (0.2%) | 0 (0.0%) |
| Total | 6,927 (73.1%) | 2,551 (26.9%) |
Female Fertility in Reading
Fertility by Age in Reading
Average fertility rate in Reading is 71.0 births per 1,000 women. Women in the age bracket of 20 to 34 years have the highest fertility rate with 91.0 births per 1,000 women. Women in the age bracket of 35 to 50 years acount for 59.8% of all women with births.
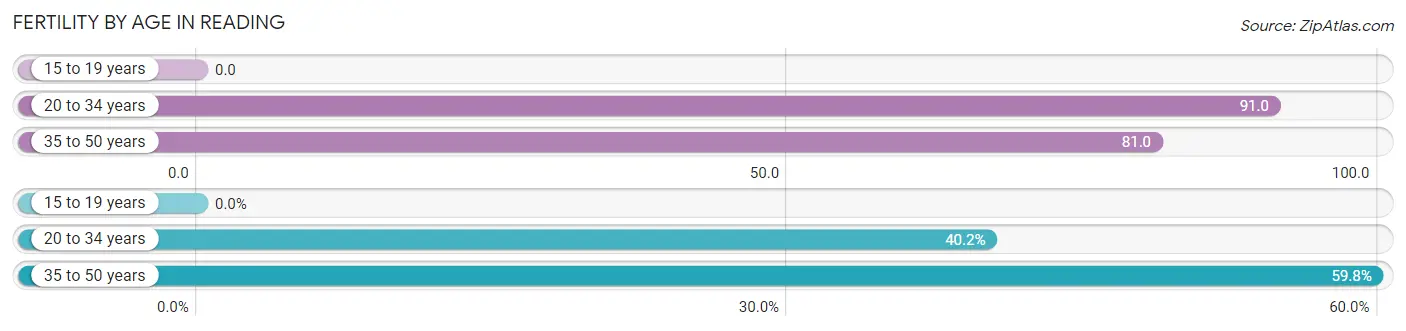
| Age Bracket | Women with Births | Births / 1,000 Women |
| 15 to 19 years | 0 (0.0%) | 0.0 |
| 20 to 34 years | 145 (40.2%) | 91.0 |
| 35 to 50 years | 216 (59.8%) | 81.0 |
| Total | 361 (100.0%) | 71.0 |
Fertility by Age by Marriage Status in Reading
93.4% of women with births (361) in Reading are married. The highest percentage of unmarried women with births falls into 35 to 50 years age bracket with 6.9% of them unmarried at the time of birth, while the lowest percentage of unmarried women with births belong to 20 to 34 years age bracket with 6.2% of them unmarried.
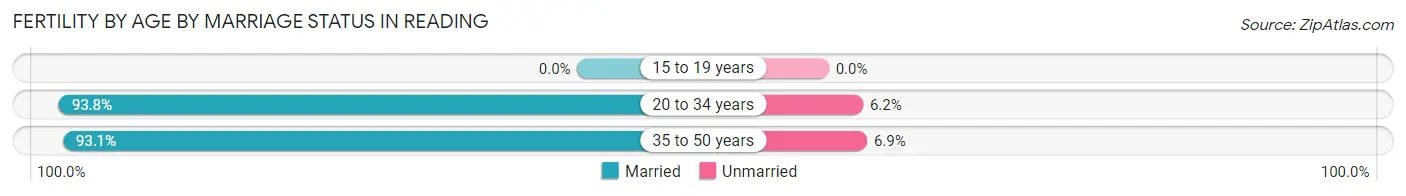
| Age Bracket | Married | Unmarried |
| 15 to 19 years | 0 (0.0%) | 0 (0.0%) |
| 20 to 34 years | 136 (93.8%) | 9 (6.2%) |
| 35 to 50 years | 201 (93.1%) | 15 (6.9%) |
| Total | 337 (93.3%) | 24 (6.7%) |
Fertility by Education in Reading
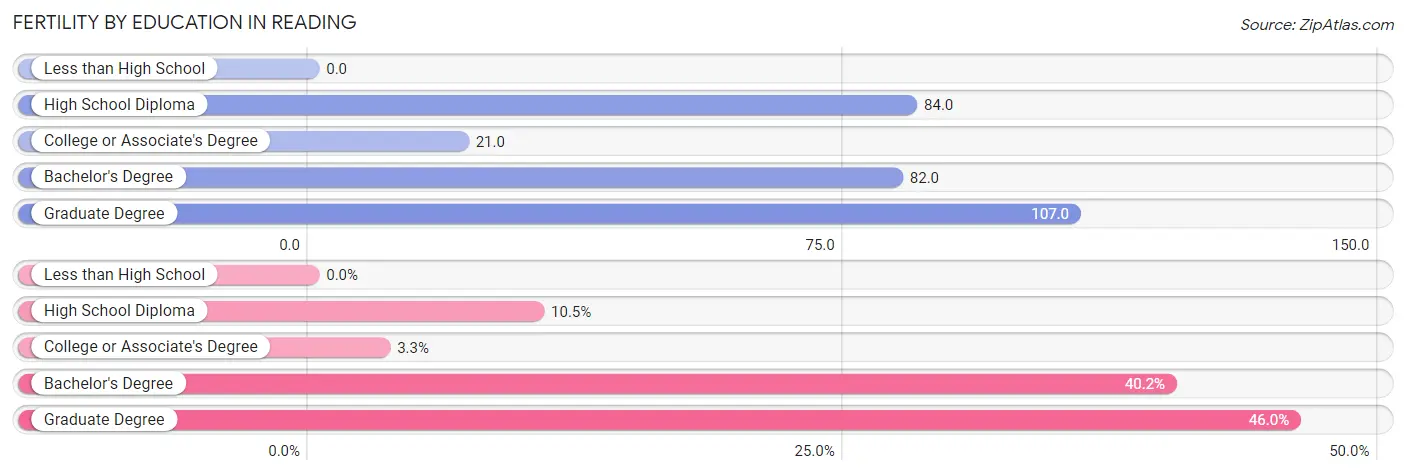
| Educational Attainment | Women with Births | Births / 1,000 Women |
| Less than High School | 0 (0.0%) | 0.0 |
| High School Diploma | 38 (10.5%) | 84.0 |
| College or Associate's Degree | 12 (3.3%) | 21.0 |
| Bachelor's Degree | 145 (40.2%) | 82.0 |
| Graduate Degree | 166 (46.0%) | 107.0 |
| Total | 361 (100.0%) | 71.0 |
Fertility by Education by Marriage Status in Reading
6.7% of women with births in Reading are unmarried. Women with the educational attainment of college or associate's degree are most likely to be married with 100.0% of them married at childbirth, while women with the educational attainment of high school diploma are least likely to be married with 63.2% of them unmarried at childbirth.
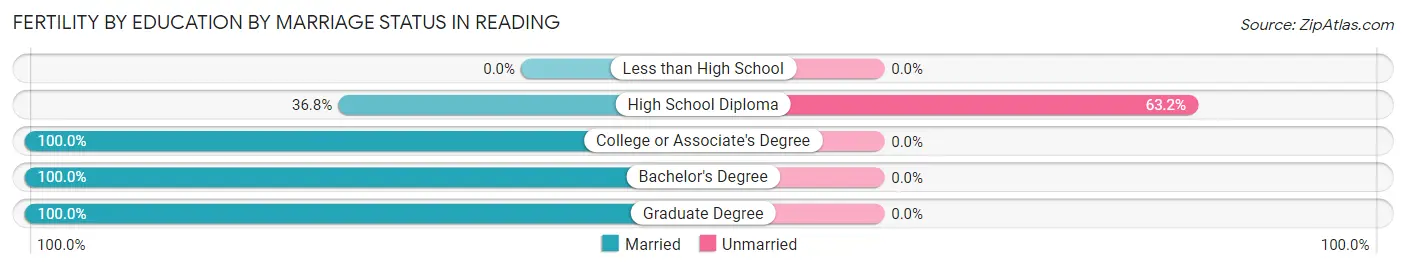
| Educational Attainment | Married | Unmarried |
| Less than High School | 0 (0.0%) | 0 (0.0%) |
| High School Diploma | 14 (36.8%) | 24 (63.2%) |
| College or Associate's Degree | 12 (100.0%) | 0 (0.0%) |
| Bachelor's Degree | 145 (100.0%) | 0 (0.0%) |
| Graduate Degree | 166 (100.0%) | 0 (0.0%) |
| Total | 337 (93.3%) | 24 (6.7%) |
Employment Characteristics in Reading
Employment by Class of Employer in Reading
Among the 13,248 employed individuals in Reading, private company employees (8,362 | 63.1%), not-for-profit organizations (1,856 | 14.0%), and local government employees (1,512 | 11.4%) make up the most common classes of employment.
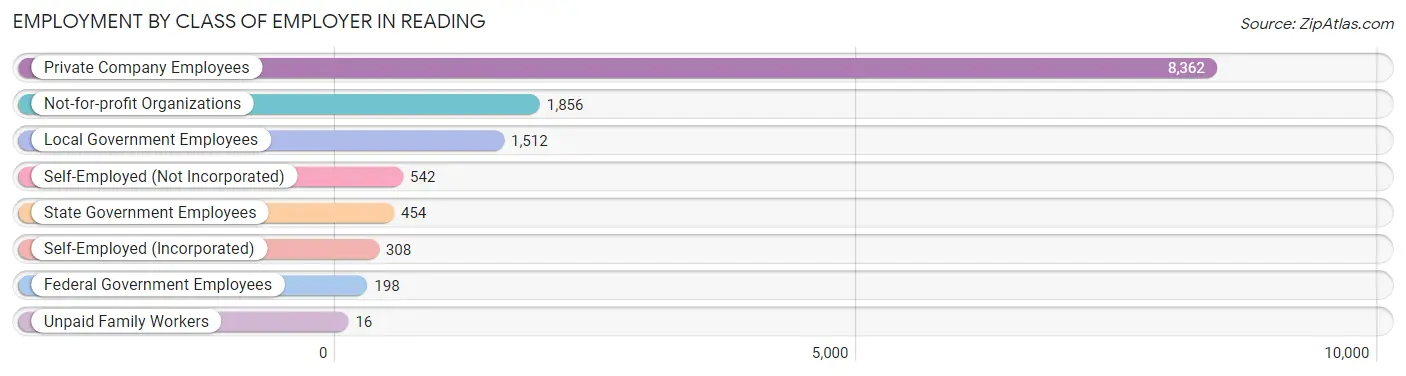
| Employer Class | # Employees | % Employees |
| Private Company Employees | 8,362 | 63.1% |
| Self-Employed (Incorporated) | 308 | 2.3% |
| Self-Employed (Not Incorporated) | 542 | 4.1% |
| Not-for-profit Organizations | 1,856 | 14.0% |
| Local Government Employees | 1,512 | 11.4% |
| State Government Employees | 454 | 3.4% |
| Federal Government Employees | 198 | 1.5% |
| Unpaid Family Workers | 16 | 0.1% |
| Total | 13,248 | 100.0% |
Employment Status by Age in Reading
According to the labor force statistics for Reading, out of the total population over 16 years of age (20,065), 68.2% or 13,684 individuals are in the labor force, with 2.8% or 383 of them unemployed. The age group with the highest labor force participation rate is 25 to 29 years, with 93.1% or 1,034 individuals in the labor force. Within the labor force, the 75 years and over age range has the highest percentage of unemployed individuals, with 12.5% or 13 of them being unemployed.
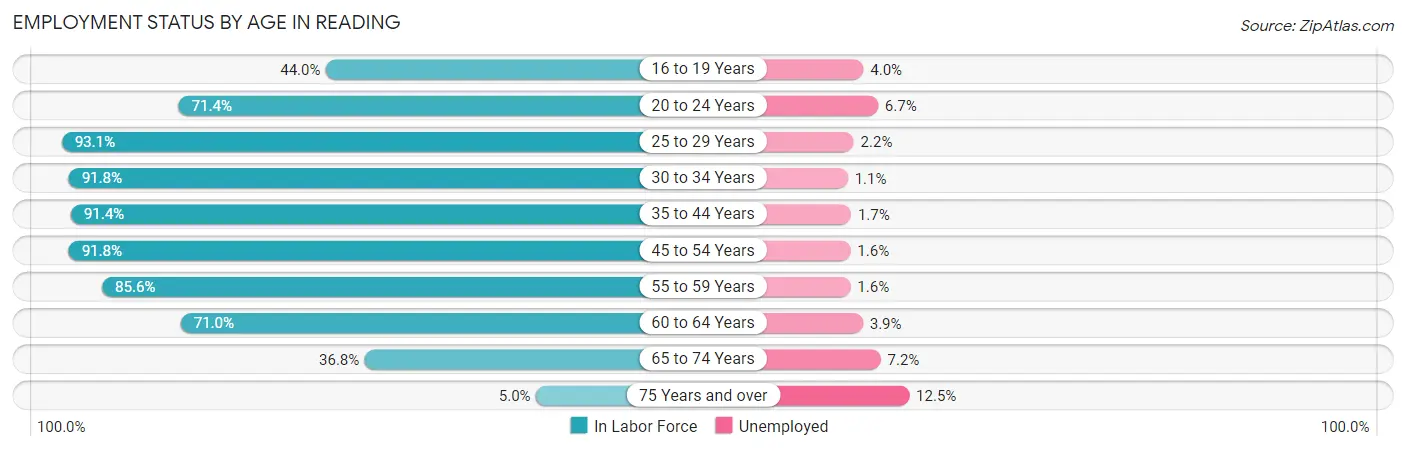
| Age Bracket | In Labor Force | Unemployed |
| 16 to 19 Years | 524 (44.0%) | 21 (4.0%) |
| 20 to 24 Years | 670 (71.4%) | 45 (6.7%) |
| 25 to 29 Years | 1,034 (93.1%) | 23 (2.2%) |
| 30 to 34 Years | 1,080 (91.8%) | 12 (1.1%) |
| 35 to 44 Years | 3,025 (91.4%) | 51 (1.7%) |
| 45 to 54 Years | 3,340 (91.8%) | 53 (1.6%) |
| 55 to 59 Years | 1,400 (85.6%) | 22 (1.6%) |
| 60 to 64 Years | 1,407 (71.0%) | 55 (3.9%) |
| 65 to 74 Years | 1,107 (36.8%) | 80 (7.2%) |
| 75 Years and over | 104 (5.0%) | 13 (12.5%) |
| Total | 13,684 (68.2%) | 383 (2.8%) |
Employment Status by Educational Attainment in Reading
According to labor force statistics for Reading, 87.8% of individuals (11,285) out of the total population between 25 and 64 years of age (12,853) are in the labor force, with 1.9% or 214 of them being unemployed. The group with the highest labor force participation rate are those with the educational attainment of bachelor's degree or higher, with 92.4% or 8,692 individuals in the labor force. Within the labor force, individuals with less than high school education have the highest percentage of unemployment, with 11.1% or 12 of them being unemployed.
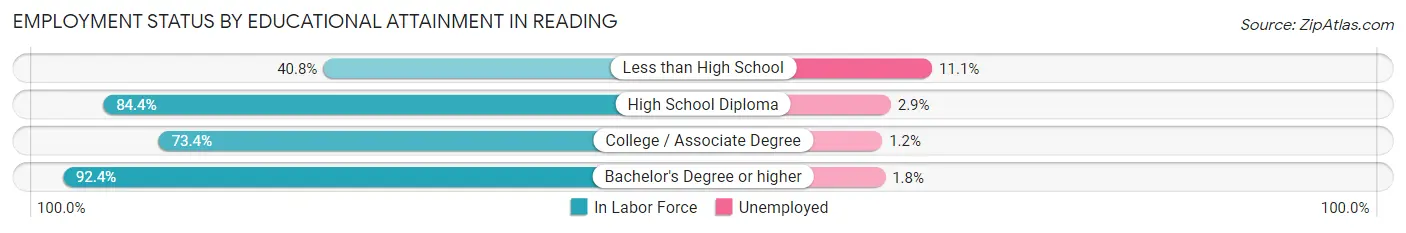
| Educational Attainment | In Labor Force | Unemployed |
| Less than High School | 108 (40.8%) | 29 (11.1%) |
| High School Diploma | 1,177 (84.4%) | 40 (2.9%) |
| College / Associate Degree | 1,312 (73.4%) | 21 (1.2%) |
| Bachelor's Degree or higher | 8,692 (92.4%) | 169 (1.8%) |
| Total | 11,285 (87.8%) | 244 (1.9%) |
Employment Occupations by Sex in Reading
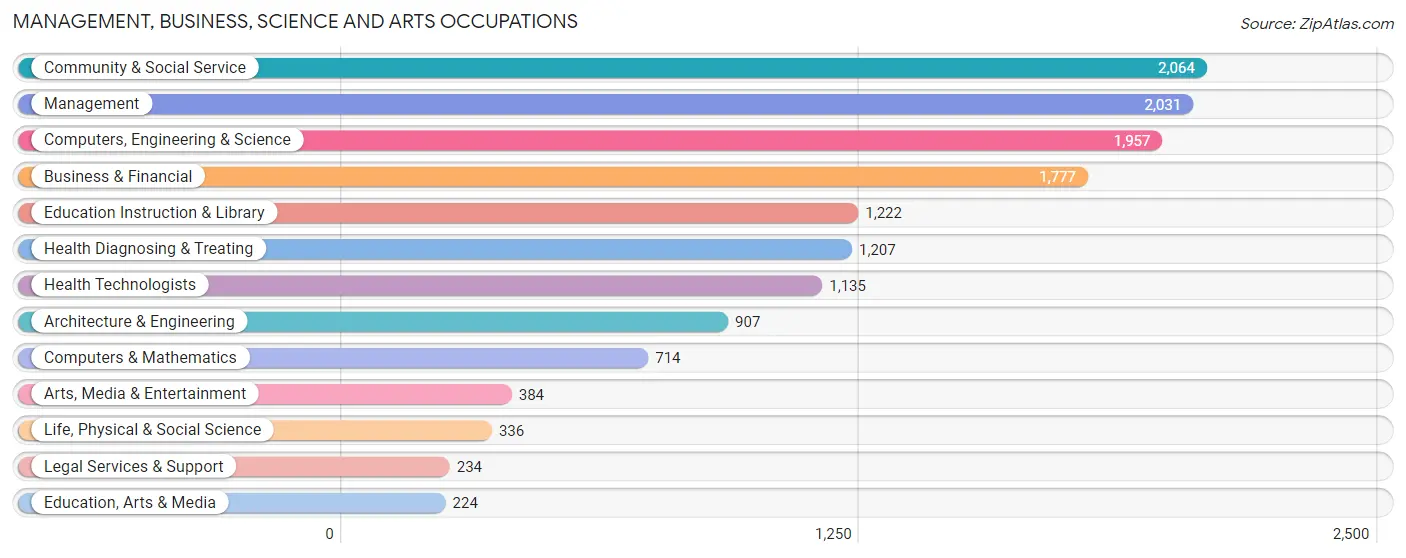
Management, Business, Science and Arts Occupations
The most common Management, Business, Science and Arts occupations in Reading are Community & Social Service (2,064 | 15.5%), Management (2,031 | 15.2%), Computers, Engineering & Science (1,957 | 14.7%), Business & Financial (1,777 | 13.4%), and Education Instruction & Library (1,222 | 9.2%).
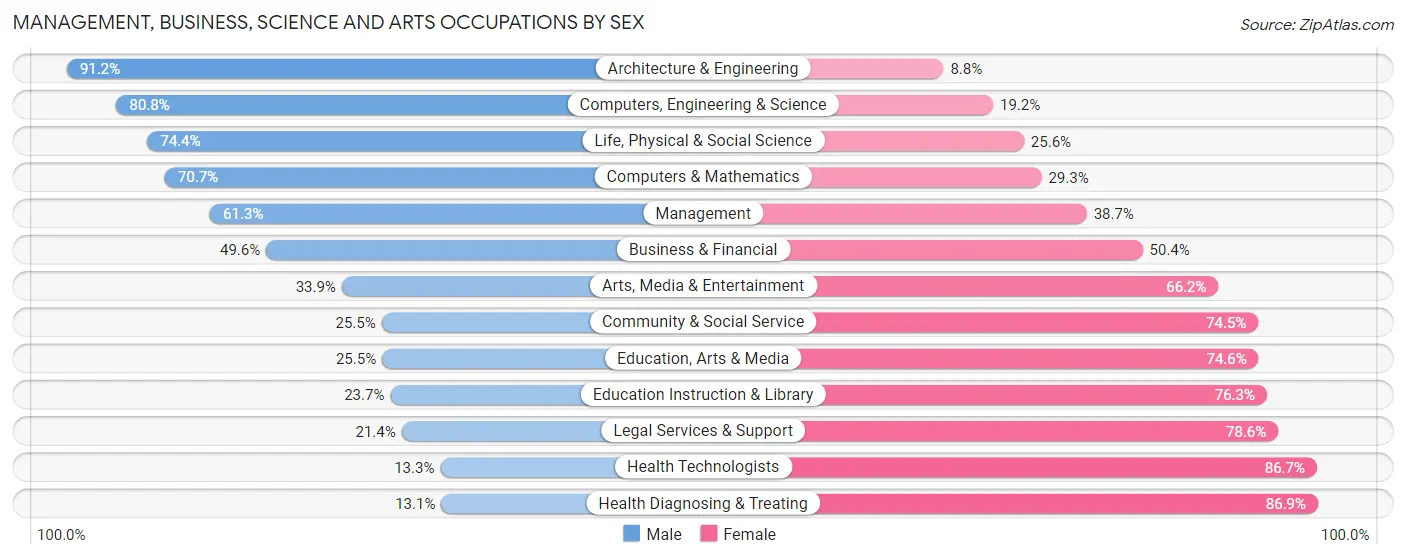
Management, Business, Science and Arts Occupations by Sex
Within the Management, Business, Science and Arts occupations in Reading, the most male-oriented occupations are Architecture & Engineering (91.2%), Computers, Engineering & Science (80.8%), and Life, Physical & Social Science (74.4%), while the most female-oriented occupations are Health Diagnosing & Treating (86.9%), Health Technologists (86.7%), and Legal Services & Support (78.6%).
| Occupation | Male | Female |
| Management | 1,245 (61.3%) | 786 (38.7%) |
| Business & Financial | 882 (49.6%) | 895 (50.4%) |
| Computers, Engineering & Science | 1,582 (80.8%) | 375 (19.2%) |
| Computers & Mathematics | 505 (70.7%) | 209 (29.3%) |
| Architecture & Engineering | 827 (91.2%) | 80 (8.8%) |
| Life, Physical & Social Science | 250 (74.4%) | 86 (25.6%) |
| Community & Social Service | 527 (25.5%) | 1,537 (74.5%) |
| Education, Arts & Media | 57 (25.5%) | 167 (74.6%) |
| Legal Services & Support | 50 (21.4%) | 184 (78.6%) |
| Education Instruction & Library | 290 (23.7%) | 932 (76.3%) |
| Arts, Media & Entertainment | 130 (33.9%) | 254 (66.1%) |
| Health Diagnosing & Treating | 158 (13.1%) | 1,049 (86.9%) |
| Health Technologists | 151 (13.3%) | 984 (86.7%) |
| Total (Category) | 4,394 (48.6%) | 4,642 (51.4%) |
| Total (Overall) | 6,738 (50.6%) | 6,577 (49.4%) |
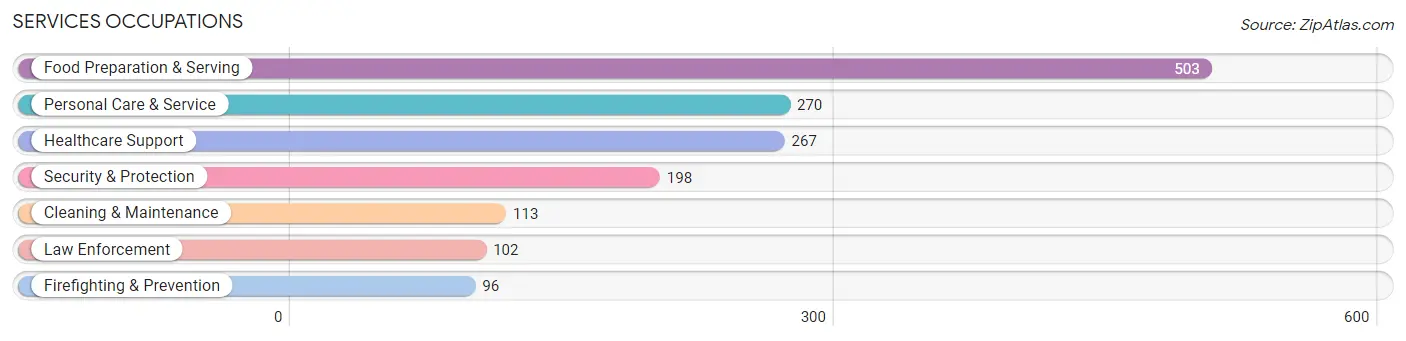
Services Occupations
The most common Services occupations in Reading are Food Preparation & Serving (503 | 3.8%), Personal Care & Service (270 | 2.0%), Healthcare Support (267 | 2.0%), Security & Protection (198 | 1.5%), and Cleaning & Maintenance (113 | 0.9%).
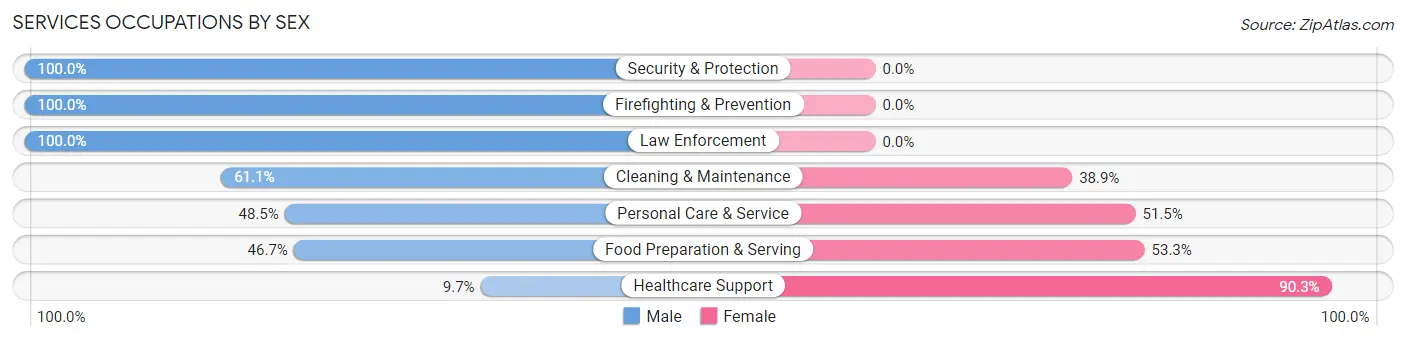
Services Occupations by Sex
Within the Services occupations in Reading, the most male-oriented occupations are Security & Protection (100.0%), Firefighting & Prevention (100.0%), and Law Enforcement (100.0%), while the most female-oriented occupations are Healthcare Support (90.3%), Food Preparation & Serving (53.3%), and Personal Care & Service (51.5%).
| Occupation | Male | Female |
| Healthcare Support | 26 (9.7%) | 241 (90.3%) |
| Security & Protection | 198 (100.0%) | 0 (0.0%) |
| Firefighting & Prevention | 96 (100.0%) | 0 (0.0%) |
| Law Enforcement | 102 (100.0%) | 0 (0.0%) |
| Food Preparation & Serving | 235 (46.7%) | 268 (53.3%) |
| Cleaning & Maintenance | 69 (61.1%) | 44 (38.9%) |
| Personal Care & Service | 131 (48.5%) | 139 (51.5%) |
| Total (Category) | 659 (48.8%) | 692 (51.2%) |
| Total (Overall) | 6,738 (50.6%) | 6,577 (49.4%) |
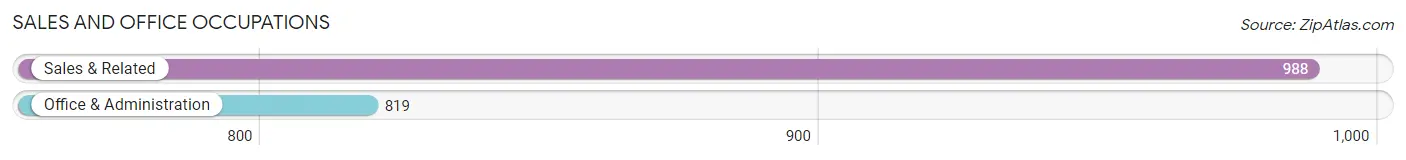
Sales and Office Occupations
The most common Sales and Office occupations in Reading are Sales & Related (988 | 7.4%), and Office & Administration (819 | 6.1%).
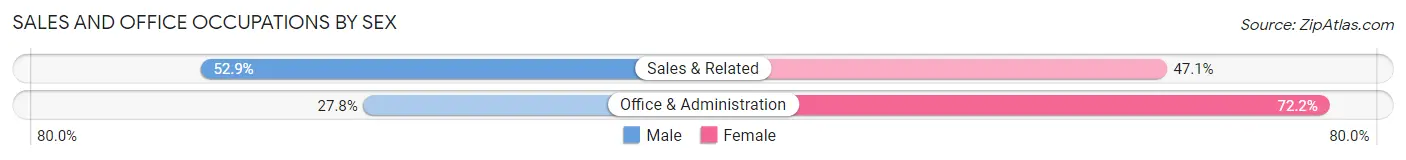
Sales and Office Occupations by Sex
| Occupation | Male | Female |
| Sales & Related | 523 (52.9%) | 465 (47.1%) |
| Office & Administration | 228 (27.8%) | 591 (72.2%) |
| Total (Category) | 751 (41.6%) | 1,056 (58.4%) |
| Total (Overall) | 6,738 (50.6%) | 6,577 (49.4%) |
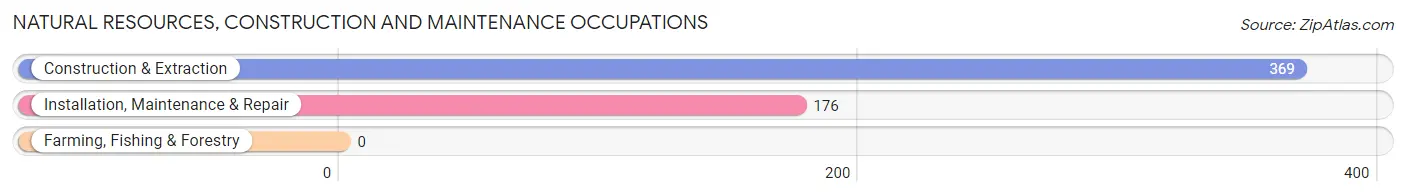
Natural Resources, Construction and Maintenance Occupations
The most common Natural Resources, Construction and Maintenance occupations in Reading are Construction & Extraction (369 | 2.8%), and Installation, Maintenance & Repair (176 | 1.3%).
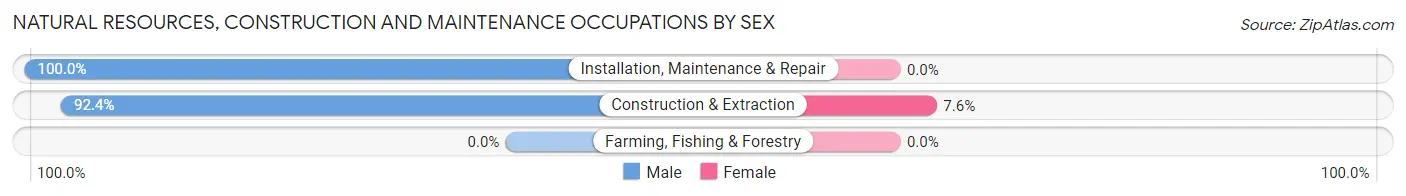
Natural Resources, Construction and Maintenance Occupations by Sex
| Occupation | Male | Female |
| Farming, Fishing & Forestry | 0 (0.0%) | 0 (0.0%) |
| Construction & Extraction | 341 (92.4%) | 28 (7.6%) |
| Installation, Maintenance & Repair | 176 (100.0%) | 0 (0.0%) |
| Total (Category) | 517 (94.9%) | 28 (5.1%) |
| Total (Overall) | 6,738 (50.6%) | 6,577 (49.4%) |
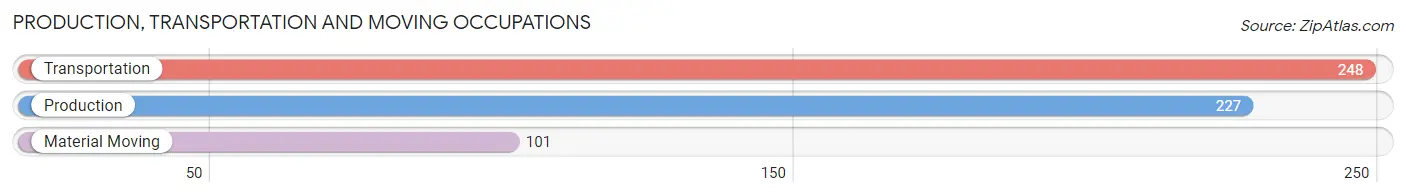
Production, Transportation and Moving Occupations
The most common Production, Transportation and Moving occupations in Reading are Transportation (248 | 1.9%), Production (227 | 1.7%), and Material Moving (101 | 0.8%).
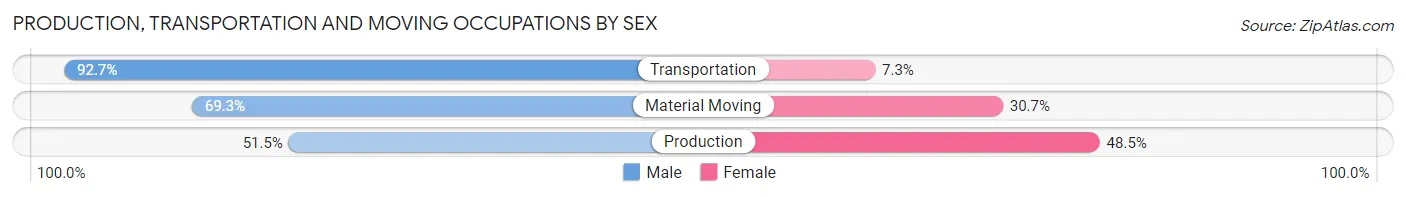
Production, Transportation and Moving Occupations by Sex
| Occupation | Male | Female |
| Production | 117 (51.5%) | 110 (48.5%) |
| Transportation | 230 (92.7%) | 18 (7.3%) |
| Material Moving | 70 (69.3%) | 31 (30.7%) |
| Total (Category) | 417 (72.4%) | 159 (27.6%) |
| Total (Overall) | 6,738 (50.6%) | 6,577 (49.4%) |
Employment Industries by Sex in Reading
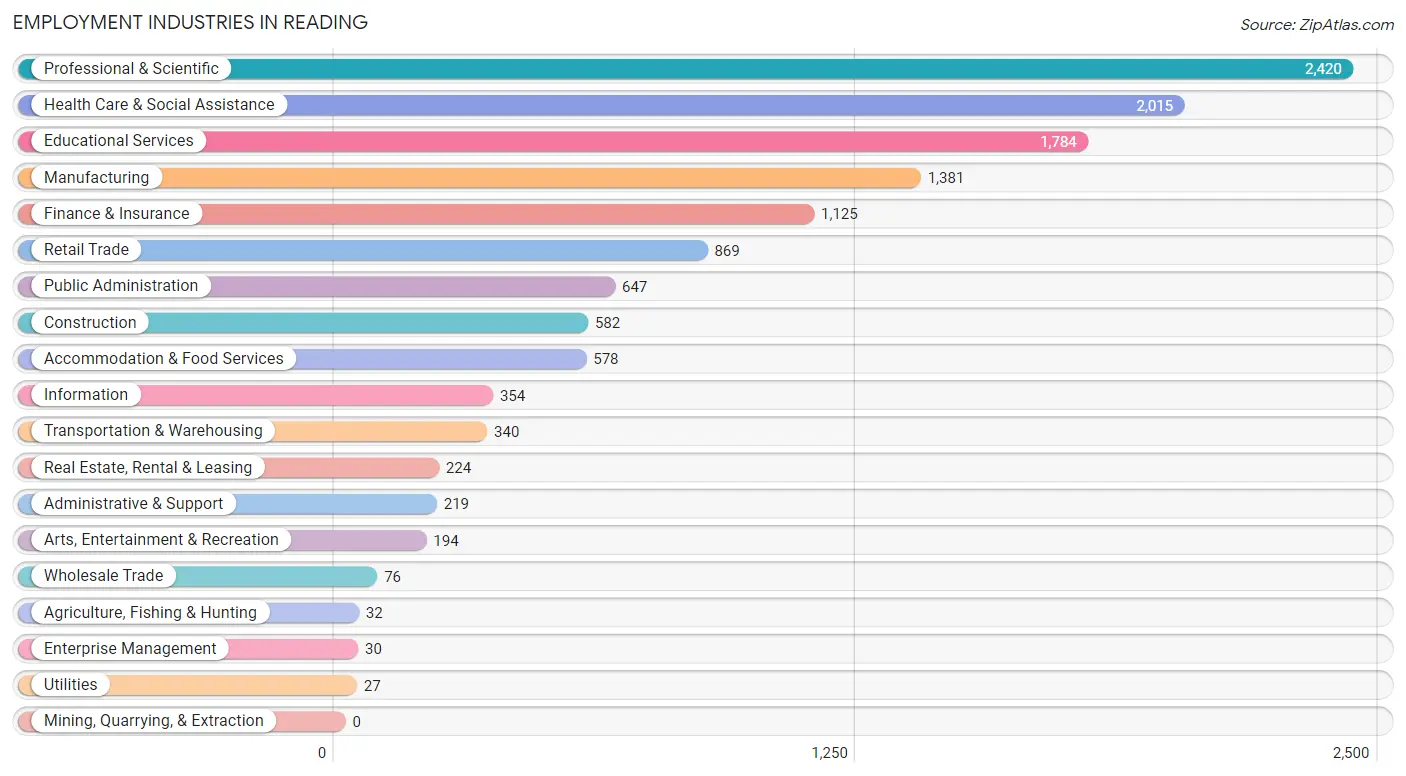
Employment Industries in Reading
The major employment industries in Reading include Professional & Scientific (2,420 | 18.2%), Health Care & Social Assistance (2,015 | 15.1%), Educational Services (1,784 | 13.4%), Manufacturing (1,381 | 10.4%), and Finance & Insurance (1,125 | 8.5%).
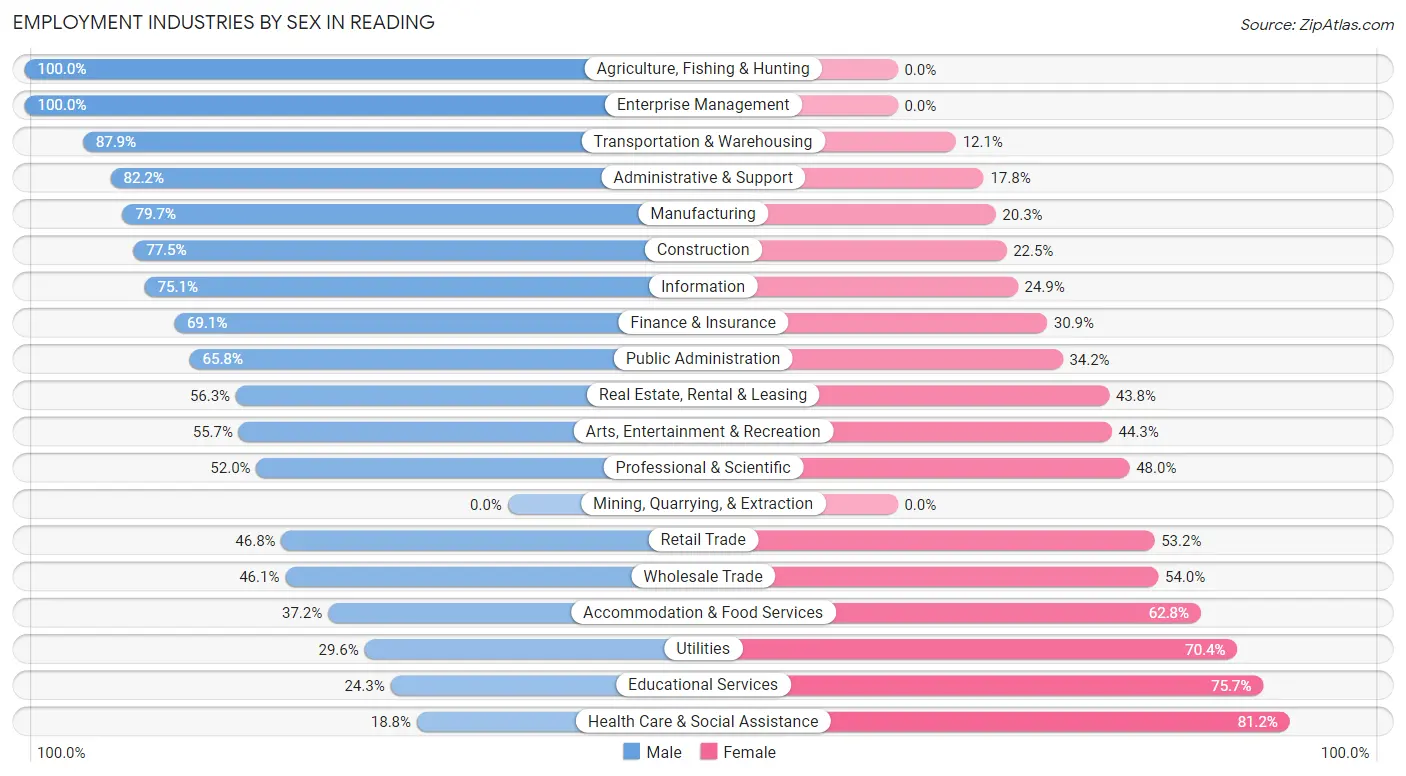
Employment Industries by Sex in Reading
The Reading industries that see more men than women are Agriculture, Fishing & Hunting (100.0%), Enterprise Management (100.0%), and Transportation & Warehousing (87.9%), whereas the industries that tend to have a higher number of women are Health Care & Social Assistance (81.2%), Educational Services (75.7%), and Utilities (70.4%).
| Industry | Male | Female |
| Agriculture, Fishing & Hunting | 32 (100.0%) | 0 (0.0%) |
| Mining, Quarrying, & Extraction | 0 (0.0%) | 0 (0.0%) |
| Construction | 451 (77.5%) | 131 (22.5%) |
| Manufacturing | 1,101 (79.7%) | 280 (20.3%) |
| Wholesale Trade | 35 (46.1%) | 41 (53.9%) |
| Retail Trade | 407 (46.8%) | 462 (53.2%) |
| Transportation & Warehousing | 299 (87.9%) | 41 (12.1%) |
| Utilities | 8 (29.6%) | 19 (70.4%) |
| Information | 266 (75.1%) | 88 (24.9%) |
| Finance & Insurance | 777 (69.1%) | 348 (30.9%) |
| Real Estate, Rental & Leasing | 126 (56.2%) | 98 (43.8%) |
| Professional & Scientific | 1,259 (52.0%) | 1,161 (48.0%) |
| Enterprise Management | 30 (100.0%) | 0 (0.0%) |
| Administrative & Support | 180 (82.2%) | 39 (17.8%) |
| Educational Services | 433 (24.3%) | 1,351 (75.7%) |
| Health Care & Social Assistance | 379 (18.8%) | 1,636 (81.2%) |
| Arts, Entertainment & Recreation | 108 (55.7%) | 86 (44.3%) |
| Accommodation & Food Services | 215 (37.2%) | 363 (62.8%) |
| Public Administration | 426 (65.8%) | 221 (34.2%) |
| Total | 6,738 (50.6%) | 6,577 (49.4%) |
Education in Reading
School Enrollment in Reading
The most common levels of schooling among the 6,071 students in Reading are high school (1,609 | 26.5%), middle school (1,522 | 25.1%), and elementary school (1,511 | 24.9%).
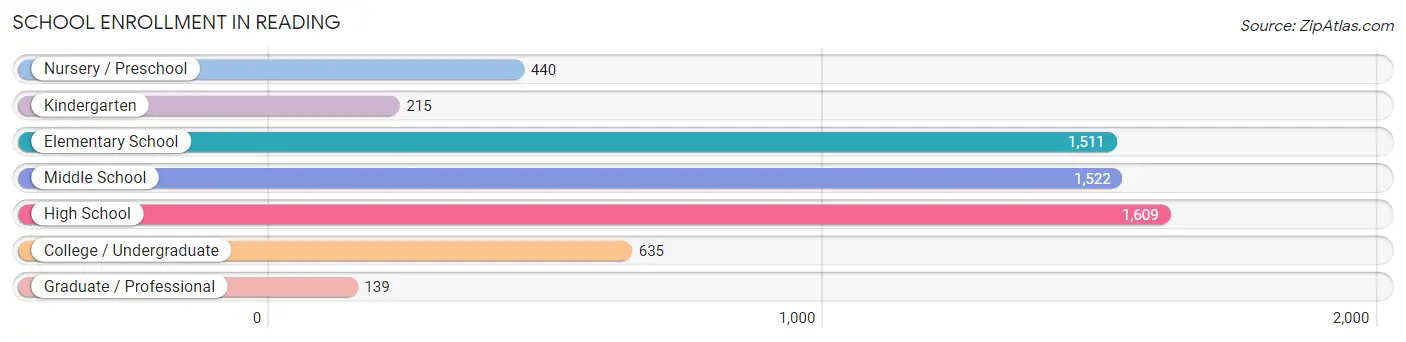
| School Level | # Students | % Students |
| Nursery / Preschool | 440 | 7.2% |
| Kindergarten | 215 | 3.5% |
| Elementary School | 1,511 | 24.9% |
| Middle School | 1,522 | 25.1% |
| High School | 1,609 | 26.5% |
| College / Undergraduate | 635 | 10.5% |
| Graduate / Professional | 139 | 2.3% |
| Total | 6,071 | 100.0% |
School Enrollment by Age by Funding Source in Reading
Out of a total of 6,071 students who are enrolled in schools in Reading, 880 (14.5%) attend a private institution, while the remaining 5,191 (85.5%) are enrolled in public schools. The age group of 25 to 34 year olds has the highest likelihood of being enrolled in private schools, with 80 (64.0% in the age bracket) enrolled. Conversely, the age group of 10 to 14 year olds has the lowest likelihood of being enrolled in a private school, with 1,771 (95.7% in the age bracket) attending a public institution.
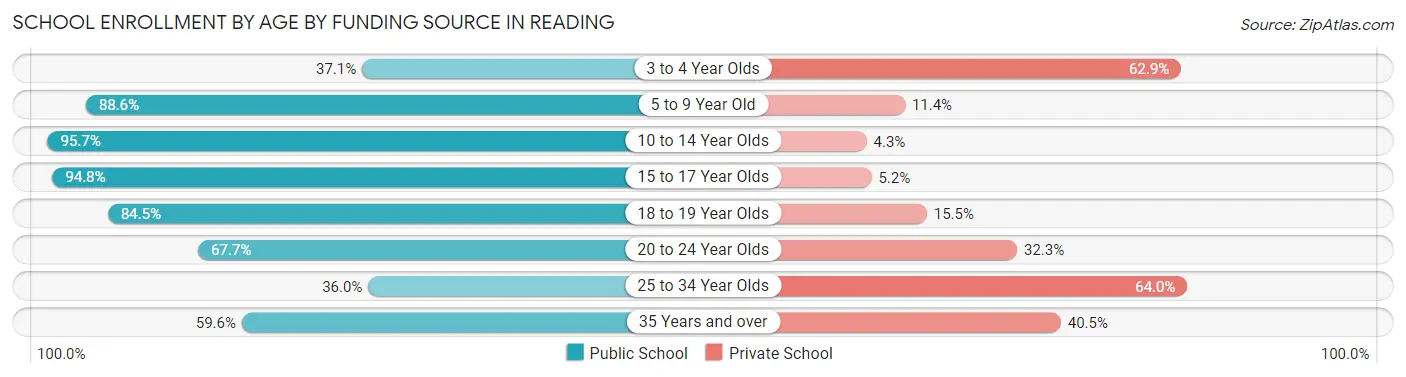
| Age Bracket | Public School | Private School |
| 3 to 4 Year Olds | 117 (37.1%) | 198 (62.9%) |
| 5 to 9 Year Old | 1,483 (88.6%) | 191 (11.4%) |
| 10 to 14 Year Olds | 1,771 (95.7%) | 79 (4.3%) |
| 15 to 17 Year Olds | 1,061 (94.8%) | 58 (5.2%) |
| 18 to 19 Year Olds | 322 (84.5%) | 59 (15.5%) |
| 20 to 24 Year Olds | 262 (67.7%) | 125 (32.3%) |
| 25 to 34 Year Olds | 45 (36.0%) | 80 (64.0%) |
| 35 Years and over | 131 (59.6%) | 89 (40.5%) |
| Total | 5,191 (85.5%) | 880 (14.5%) |
Educational Attainment by Field of Study in Reading
Business (2,502 | 20.1%), engineering (1,212 | 9.7%), science & technology (1,145 | 9.2%), education (1,134 | 9.1%), and social sciences (1,090 | 8.7%) are the most common fields of study among 12,451 individuals in Reading who have obtained a bachelor's degree or higher.
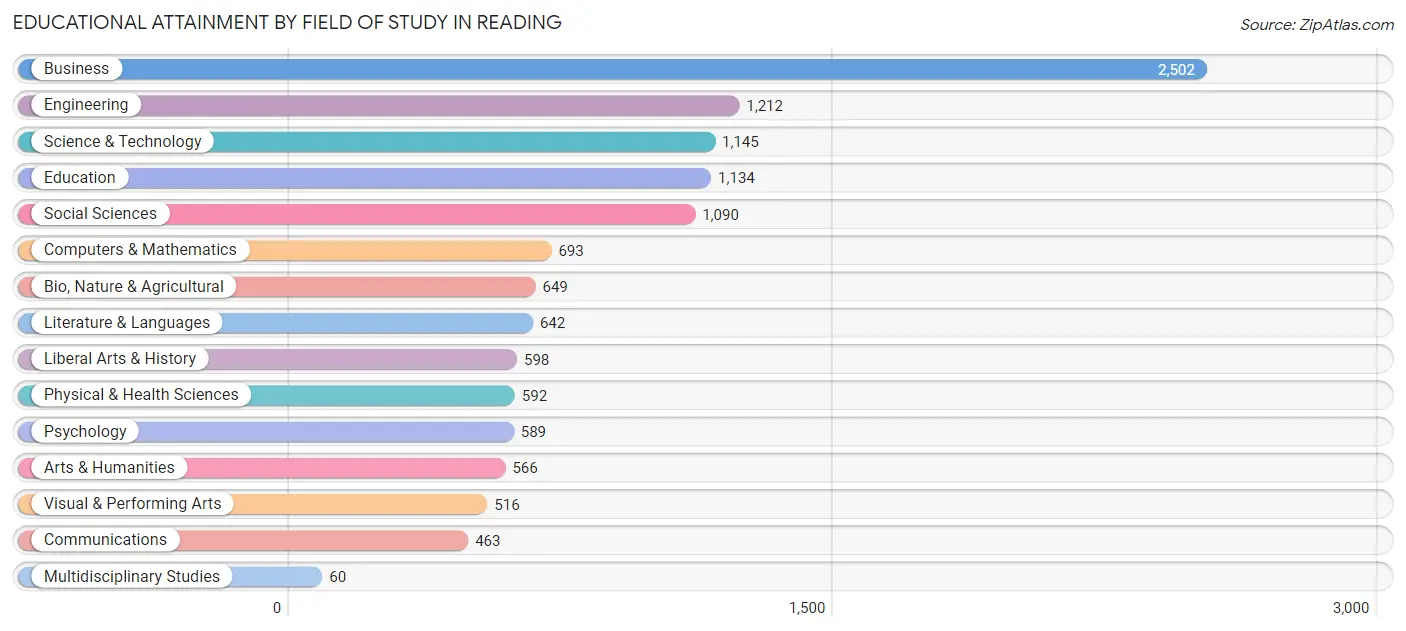
| Field of Study | # Graduates | % Graduates |
| Computers & Mathematics | 693 | 5.6% |
| Bio, Nature & Agricultural | 649 | 5.2% |
| Physical & Health Sciences | 592 | 4.8% |
| Psychology | 589 | 4.7% |
| Social Sciences | 1,090 | 8.7% |
| Engineering | 1,212 | 9.7% |
| Multidisciplinary Studies | 60 | 0.5% |
| Science & Technology | 1,145 | 9.2% |
| Business | 2,502 | 20.1% |
| Education | 1,134 | 9.1% |
| Literature & Languages | 642 | 5.2% |
| Liberal Arts & History | 598 | 4.8% |
| Visual & Performing Arts | 516 | 4.1% |
| Communications | 463 | 3.7% |
| Arts & Humanities | 566 | 4.5% |
| Total | 12,451 | 100.0% |
Transportation & Commute in Reading
Vehicle Availability by Sex in Reading
The most prevalent vehicle ownership categories in Reading are males with 2 vehicles (3,877, accounting for 57.7%) and females with 2 vehicles (3,400, making up 59.4%).
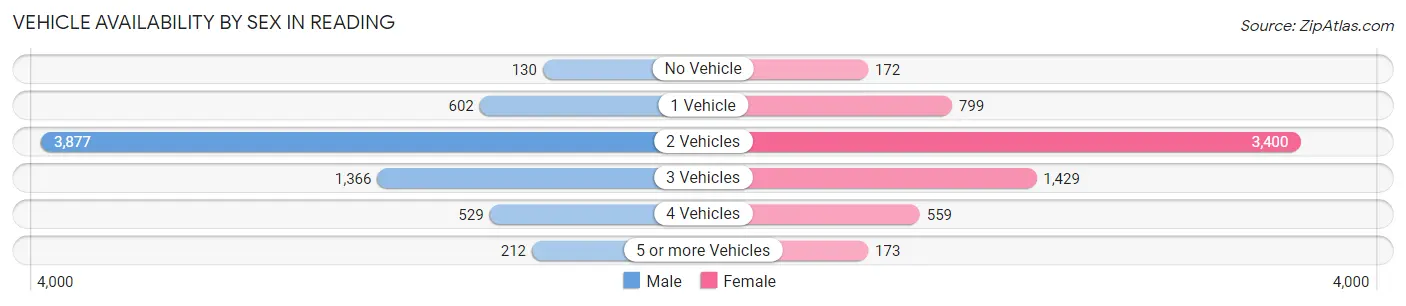
| Vehicles Available | Male | Female |
| No Vehicle | 130 (1.9%) | 172 (2.6%) |
| 1 Vehicle | 602 (9.0%) | 799 (12.2%) |
| 2 Vehicles | 3,877 (57.7%) | 3,400 (52.0%) |
| 3 Vehicles | 1,366 (20.3%) | 1,429 (21.9%) |
| 4 Vehicles | 529 (7.9%) | 559 (8.6%) |
| 5 or more Vehicles | 212 (3.2%) | 173 (2.6%) |
| Total | 6,716 (100.0%) | 6,532 (100.0%) |
Commute Time in Reading
The most frequently occuring commute durations in Reading are 60 to 89 minutes (1,456 commuters, 14.1%), 45 to 59 minutes (1,420 commuters, 13.8%), and 30 to 34 minutes (1,412 commuters, 13.7%).
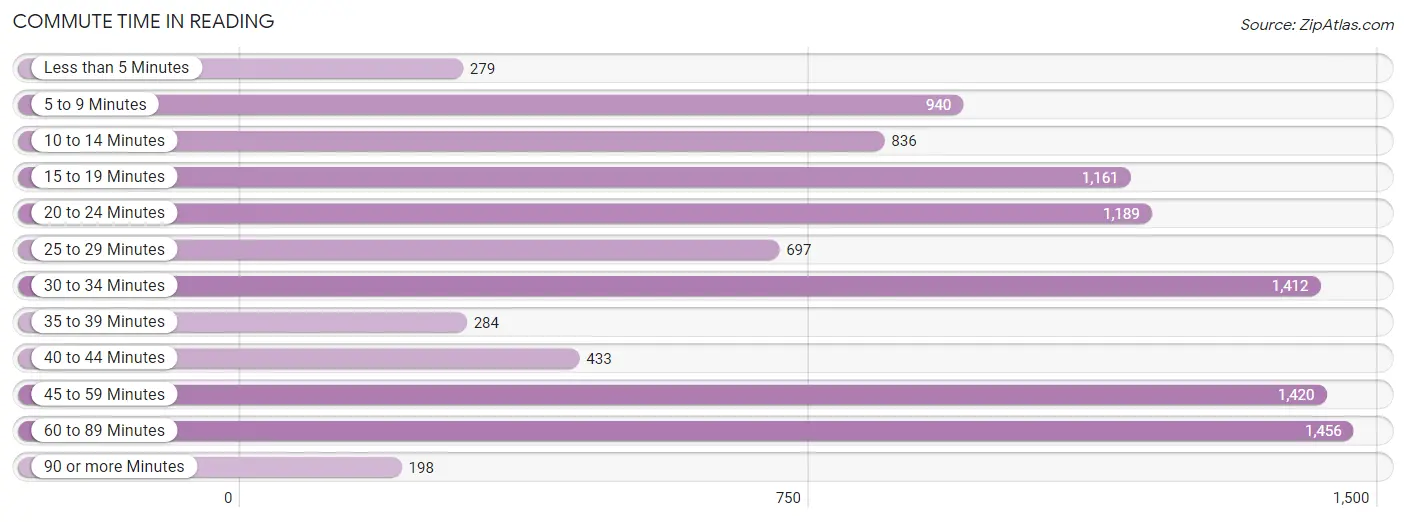
| Commute Time | # Commuters | % Commuters |
| Less than 5 Minutes | 279 | 2.7% |
| 5 to 9 Minutes | 940 | 9.1% |
| 10 to 14 Minutes | 836 | 8.1% |
| 15 to 19 Minutes | 1,161 | 11.3% |
| 20 to 24 Minutes | 1,189 | 11.5% |
| 25 to 29 Minutes | 697 | 6.8% |
| 30 to 34 Minutes | 1,412 | 13.7% |
| 35 to 39 Minutes | 284 | 2.8% |
| 40 to 44 Minutes | 433 | 4.2% |
| 45 to 59 Minutes | 1,420 | 13.8% |
| 60 to 89 Minutes | 1,456 | 14.1% |
| 90 or more Minutes | 198 | 1.9% |
Commute Time by Sex in Reading
The most common commute times in Reading are 30 to 34 minutes (873 commuters, 17.3%) for males and 60 to 89 minutes (826 commuters, 15.7%) for females.
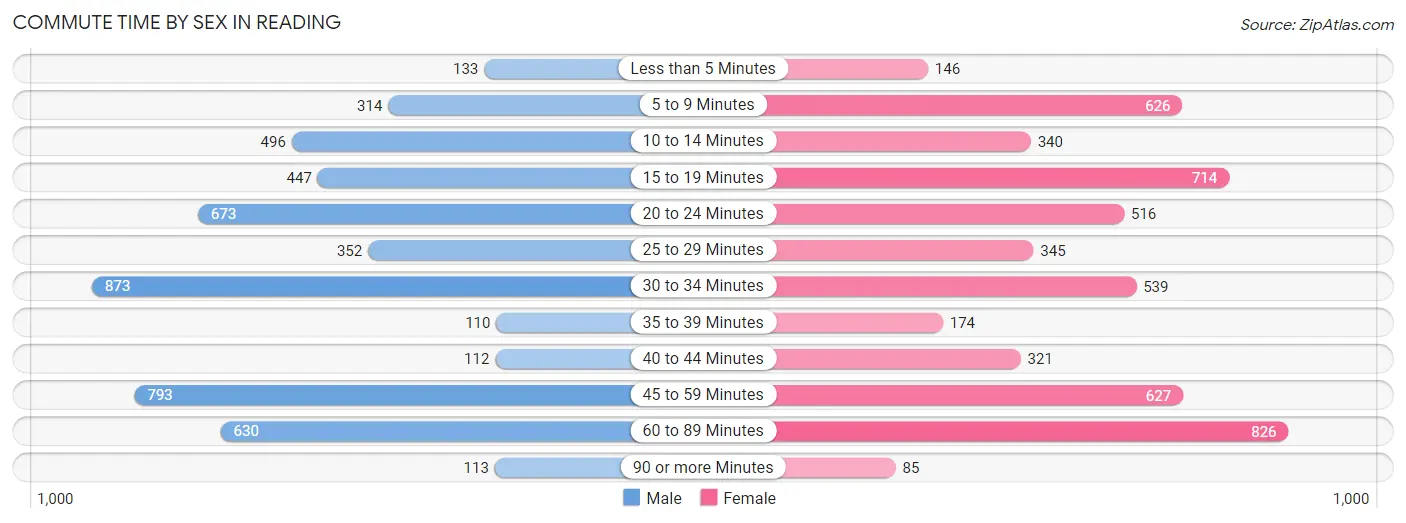
| Commute Time | Male | Female |
| Less than 5 Minutes | 133 (2.6%) | 146 (2.8%) |
| 5 to 9 Minutes | 314 (6.2%) | 626 (11.9%) |
| 10 to 14 Minutes | 496 (9.8%) | 340 (6.5%) |
| 15 to 19 Minutes | 447 (8.9%) | 714 (13.6%) |
| 20 to 24 Minutes | 673 (13.3%) | 516 (9.8%) |
| 25 to 29 Minutes | 352 (7.0%) | 345 (6.6%) |
| 30 to 34 Minutes | 873 (17.3%) | 539 (10.2%) |
| 35 to 39 Minutes | 110 (2.2%) | 174 (3.3%) |
| 40 to 44 Minutes | 112 (2.2%) | 321 (6.1%) |
| 45 to 59 Minutes | 793 (15.7%) | 627 (11.9%) |
| 60 to 89 Minutes | 630 (12.5%) | 826 (15.7%) |
| 90 or more Minutes | 113 (2.2%) | 85 (1.6%) |
Time of Departure to Work by Sex in Reading
The most frequent times of departure to work in Reading are 7:30 AM to 7:59 AM (922, 18.3%) for males and 7:30 AM to 7:59 AM (921, 17.5%) for females.
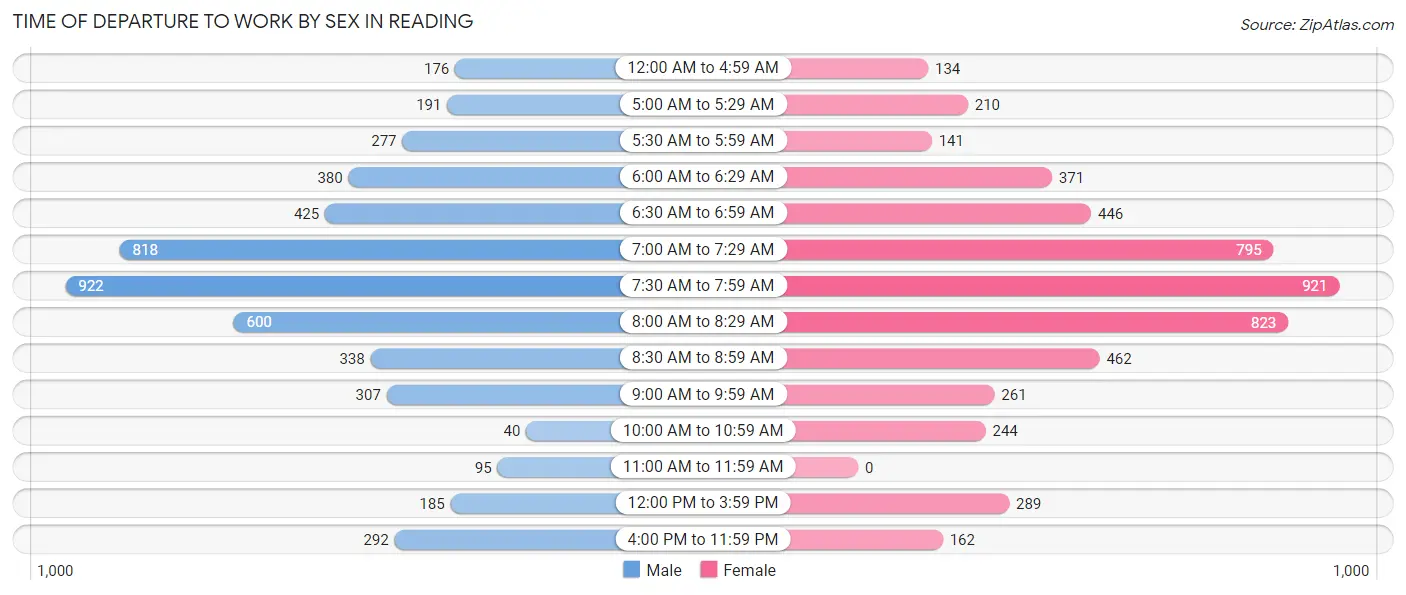
| Time of Departure | Male | Female |
| 12:00 AM to 4:59 AM | 176 (3.5%) | 134 (2.5%) |
| 5:00 AM to 5:29 AM | 191 (3.8%) | 210 (4.0%) |
| 5:30 AM to 5:59 AM | 277 (5.5%) | 141 (2.7%) |
| 6:00 AM to 6:29 AM | 380 (7.5%) | 371 (7.0%) |
| 6:30 AM to 6:59 AM | 425 (8.4%) | 446 (8.5%) |
| 7:00 AM to 7:29 AM | 818 (16.2%) | 795 (15.1%) |
| 7:30 AM to 7:59 AM | 922 (18.3%) | 921 (17.5%) |
| 8:00 AM to 8:29 AM | 600 (11.9%) | 823 (15.7%) |
| 8:30 AM to 8:59 AM | 338 (6.7%) | 462 (8.8%) |
| 9:00 AM to 9:59 AM | 307 (6.1%) | 261 (5.0%) |
| 10:00 AM to 10:59 AM | 40 (0.8%) | 244 (4.6%) |
| 11:00 AM to 11:59 AM | 95 (1.9%) | 0 (0.0%) |
| 12:00 PM to 3:59 PM | 185 (3.7%) | 289 (5.5%) |
| 4:00 PM to 11:59 PM | 292 (5.8%) | 162 (3.1%) |
| Total | 5,046 (100.0%) | 5,259 (100.0%) |
Housing Occupancy in Reading
Occupancy by Ownership in Reading
Of the total 9,478 dwellings in Reading, owner-occupied units account for 7,953 (83.9%), while renter-occupied units make up 1,525 (16.1%).
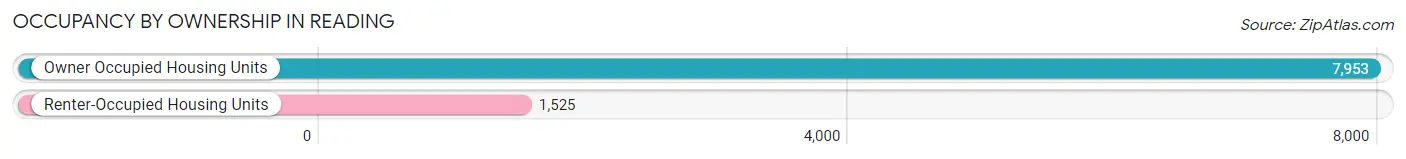
| Occupancy | # Housing Units | % Housing Units |
| Owner Occupied Housing Units | 7,953 | 83.9% |
| Renter-Occupied Housing Units | 1,525 | 16.1% |
| Total Occupied Housing Units | 9,478 | 100.0% |
Occupancy by Household Size in Reading
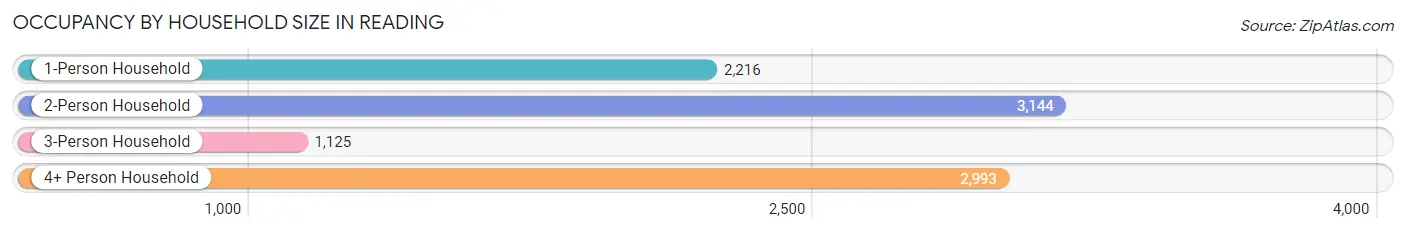
| Household Size | # Housing Units | % Housing Units |
| 1-Person Household | 2,216 | 23.4% |
| 2-Person Household | 3,144 | 33.2% |
| 3-Person Household | 1,125 | 11.9% |
| 4+ Person Household | 2,993 | 31.6% |
| Total Housing Units | 9,478 | 100.0% |
Occupancy by Ownership by Household Size in Reading
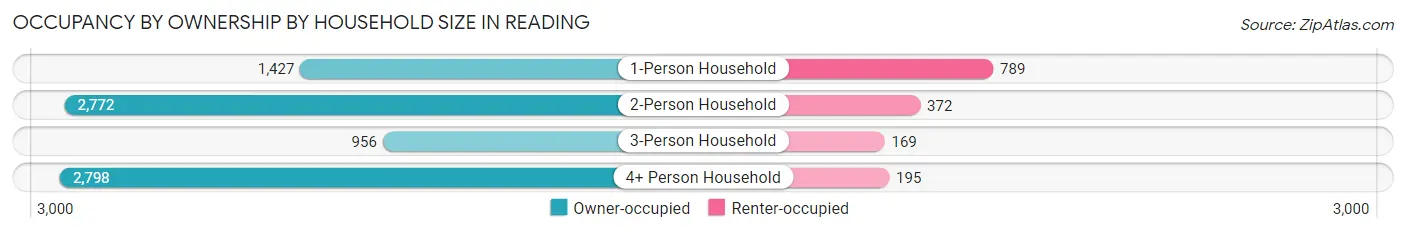
| Household Size | Owner-occupied | Renter-occupied |
| 1-Person Household | 1,427 (64.4%) | 789 (35.6%) |
| 2-Person Household | 2,772 (88.2%) | 372 (11.8%) |
| 3-Person Household | 956 (85.0%) | 169 (15.0%) |
| 4+ Person Household | 2,798 (93.5%) | 195 (6.5%) |
| Total Housing Units | 7,953 (83.9%) | 1,525 (16.1%) |
Occupancy by Educational Attainment in Reading
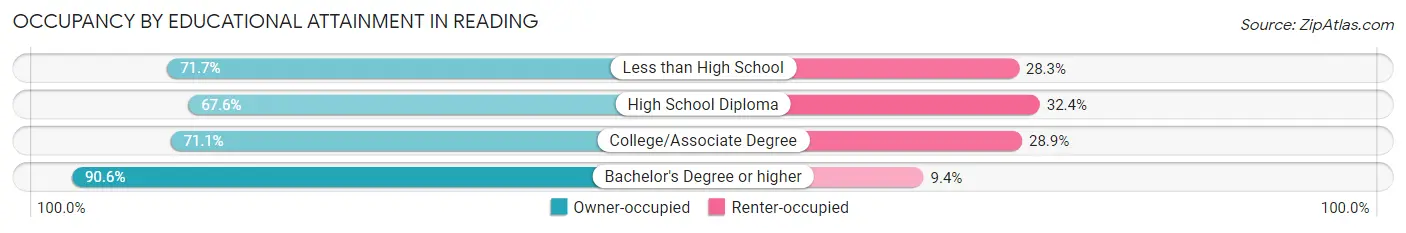
| Household Size | Owner-occupied | Renter-occupied |
| Less than High School | 142 (71.7%) | 56 (28.3%) |
| High School Diploma | 833 (67.6%) | 400 (32.4%) |
| College/Associate Degree | 1,138 (71.1%) | 463 (28.9%) |
| Bachelor's Degree or higher | 5,840 (90.6%) | 606 (9.4%) |
Occupancy by Age of Householder in Reading
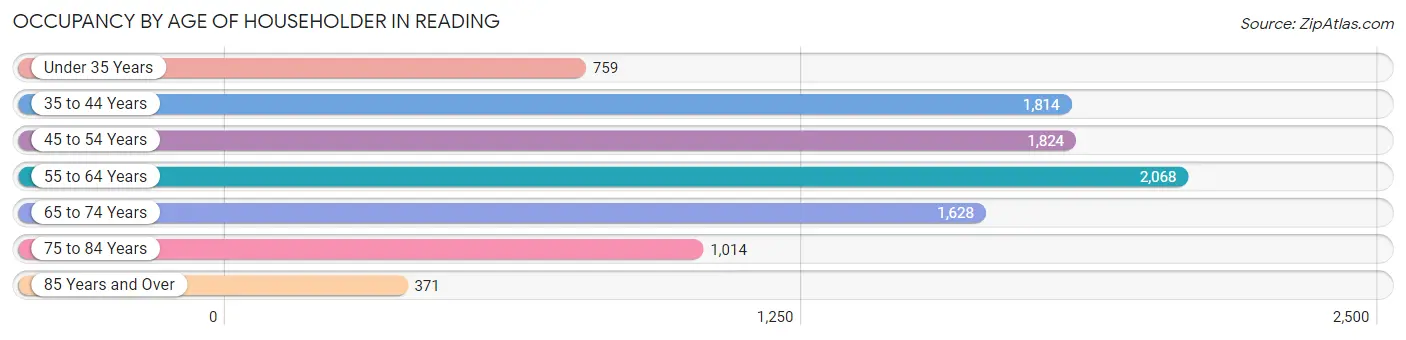
| Age Bracket | # Households | % Households |
| Under 35 Years | 759 | 8.0% |
| 35 to 44 Years | 1,814 | 19.1% |
| 45 to 54 Years | 1,824 | 19.2% |
| 55 to 64 Years | 2,068 | 21.8% |
| 65 to 74 Years | 1,628 | 17.2% |
| 75 to 84 Years | 1,014 | 10.7% |
| 85 Years and Over | 371 | 3.9% |
| Total | 9,478 | 100.0% |
Housing Finances in Reading
Median Income by Occupancy in Reading
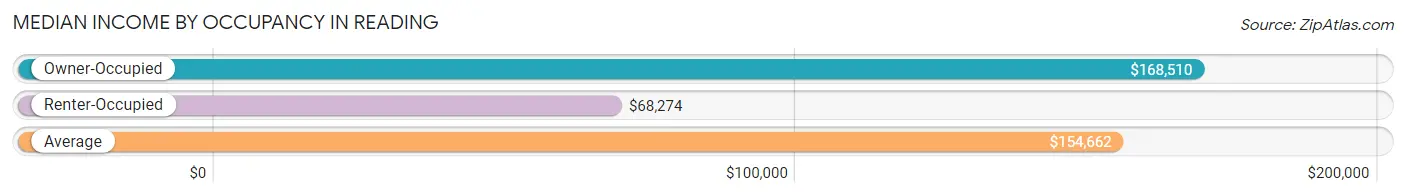
| Occupancy Type | # Households | Median Income |
| Owner-Occupied | 7,953 (83.9%) | $168,510 |
| Renter-Occupied | 1,525 (16.1%) | $68,274 |
| Average | 9,478 (100.0%) | $154,662 |
Occupancy by Householder Income Bracket in Reading
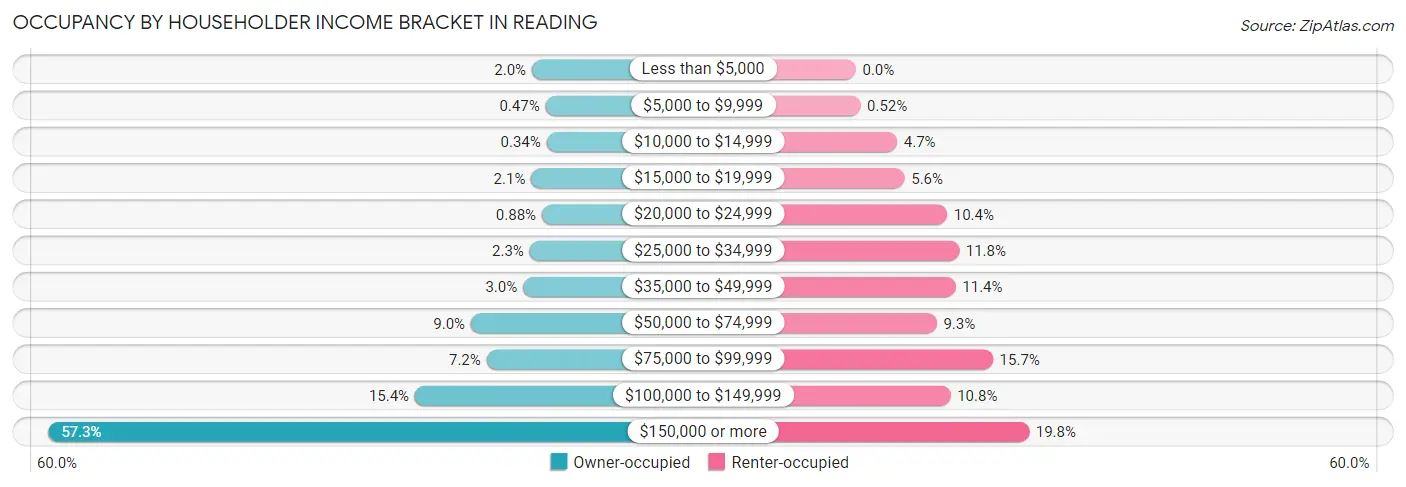
| Income Bracket | Owner-occupied | Renter-occupied |
| Less than $5,000 | 161 (2.0%) | 0 (0.0%) |
| $5,000 to $9,999 | 37 (0.5%) | 8 (0.5%) |
| $10,000 to $14,999 | 27 (0.3%) | 72 (4.7%) |
| $15,000 to $19,999 | 167 (2.1%) | 85 (5.6%) |
| $20,000 to $24,999 | 70 (0.9%) | 159 (10.4%) |
| $25,000 to $34,999 | 181 (2.3%) | 180 (11.8%) |
| $35,000 to $49,999 | 241 (3.0%) | 174 (11.4%) |
| $50,000 to $74,999 | 715 (9.0%) | 141 (9.2%) |
| $75,000 to $99,999 | 573 (7.2%) | 239 (15.7%) |
| $100,000 to $149,999 | 1,224 (15.4%) | 165 (10.8%) |
| $150,000 or more | 4,557 (57.3%) | 302 (19.8%) |
| Total | 7,953 (100.0%) | 1,525 (100.0%) |
Monthly Housing Cost Tiers in Reading
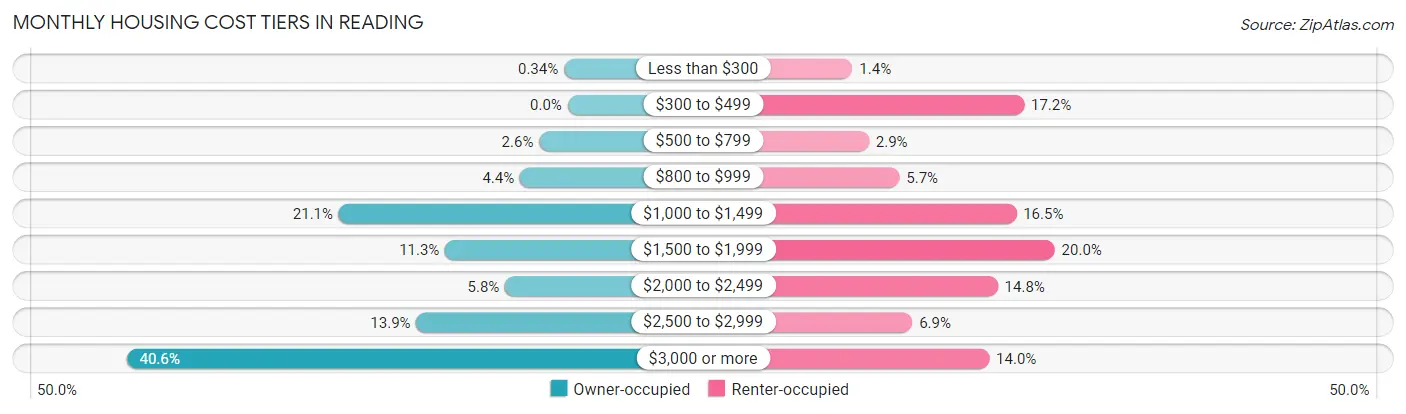
| Monthly Cost | Owner-occupied | Renter-occupied |
| Less than $300 | 27 (0.3%) | 21 (1.4%) |
| $300 to $499 | 0 (0.0%) | 262 (17.2%) |
| $500 to $799 | 208 (2.6%) | 44 (2.9%) |
| $800 to $999 | 349 (4.4%) | 87 (5.7%) |
| $1,000 to $1,499 | 1,676 (21.1%) | 251 (16.5%) |
| $1,500 to $1,999 | 897 (11.3%) | 305 (20.0%) |
| $2,000 to $2,499 | 458 (5.8%) | 225 (14.7%) |
| $2,500 to $2,999 | 1,108 (13.9%) | 105 (6.9%) |
| $3,000 or more | 3,230 (40.6%) | 213 (14.0%) |
| Total | 7,953 (100.0%) | 1,525 (100.0%) |
Physical Housing Characteristics in Reading
Housing Structures in Reading
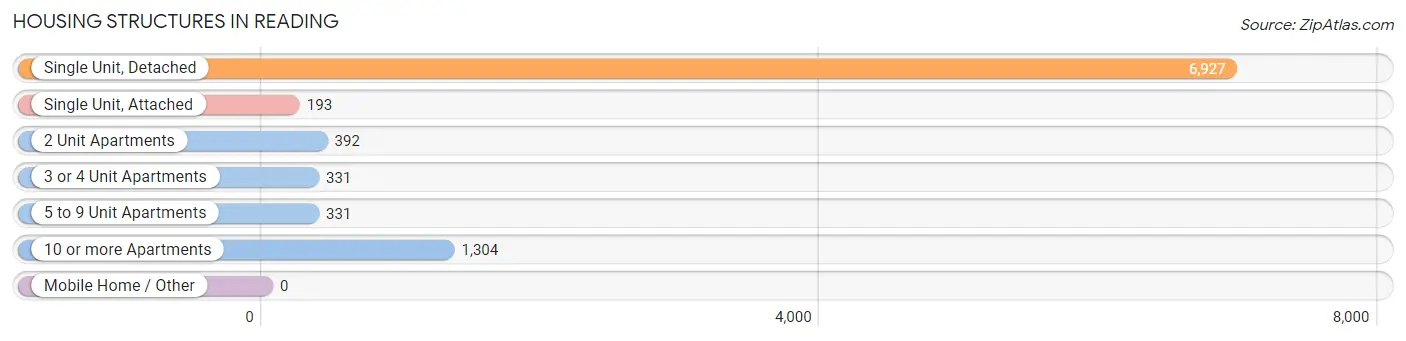
| Structure Type | # Housing Units | % Housing Units |
| Single Unit, Detached | 6,927 | 73.1% |
| Single Unit, Attached | 193 | 2.0% |
| 2 Unit Apartments | 392 | 4.1% |
| 3 or 4 Unit Apartments | 331 | 3.5% |
| 5 to 9 Unit Apartments | 331 | 3.5% |
| 10 or more Apartments | 1,304 | 13.8% |
| Mobile Home / Other | 0 | 0.0% |
| Total | 9,478 | 100.0% |
Housing Structures by Occupancy in Reading
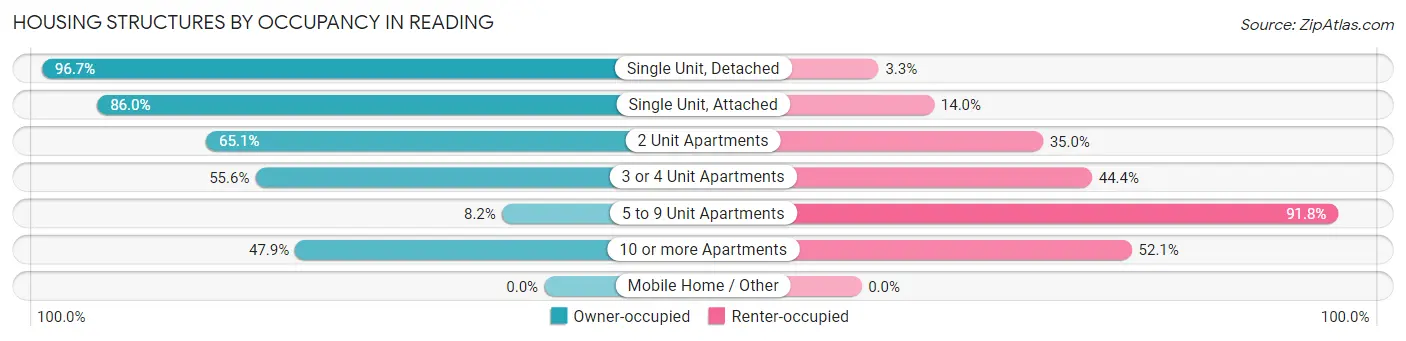
| Structure Type | Owner-occupied | Renter-occupied |
| Single Unit, Detached | 6,696 (96.7%) | 231 (3.3%) |
| Single Unit, Attached | 166 (86.0%) | 27 (14.0%) |
| 2 Unit Apartments | 255 (65.0%) | 137 (34.9%) |
| 3 or 4 Unit Apartments | 184 (55.6%) | 147 (44.4%) |
| 5 to 9 Unit Apartments | 27 (8.2%) | 304 (91.8%) |
| 10 or more Apartments | 625 (47.9%) | 679 (52.1%) |
| Mobile Home / Other | 0 (0.0%) | 0 (0.0%) |
| Total | 7,953 (83.9%) | 1,525 (16.1%) |
Housing Structures by Number of Rooms in Reading
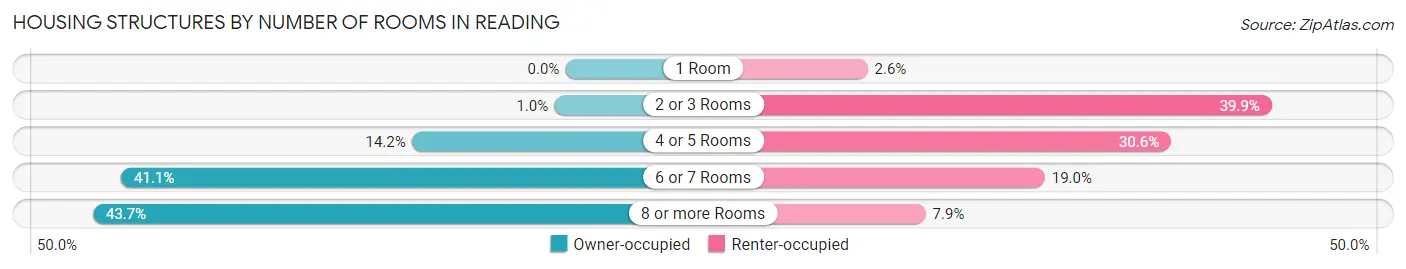
| Number of Rooms | Owner-occupied | Renter-occupied |
| 1 Room | 0 (0.0%) | 39 (2.6%) |
| 2 or 3 Rooms | 82 (1.0%) | 609 (39.9%) |
| 4 or 5 Rooms | 1,130 (14.2%) | 467 (30.6%) |
| 6 or 7 Rooms | 3,266 (41.1%) | 289 (19.0%) |
| 8 or more Rooms | 3,475 (43.7%) | 121 (7.9%) |
| Total | 7,953 (100.0%) | 1,525 (100.0%) |
Housing Structure by Heating Type in Reading
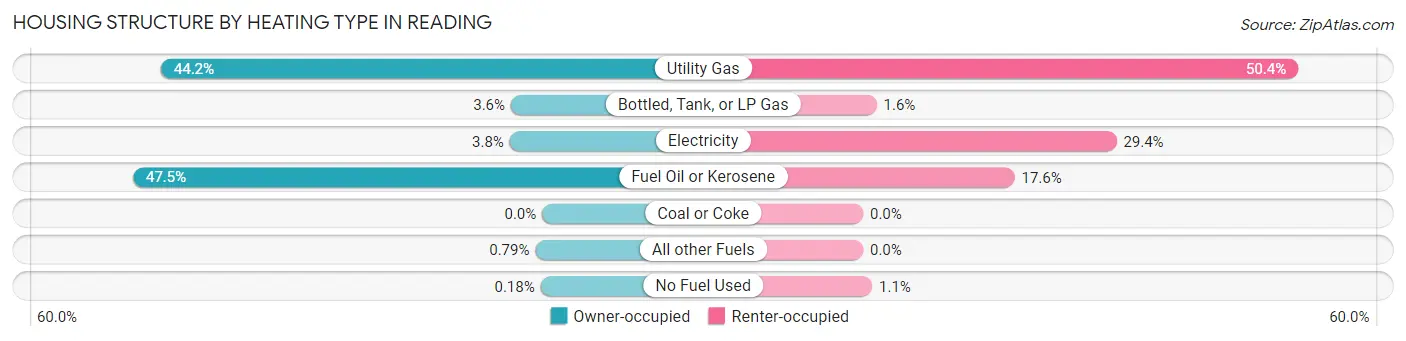
| Heating Type | Owner-occupied | Renter-occupied |
| Utility Gas | 3,515 (44.2%) | 769 (50.4%) |
| Bottled, Tank, or LP Gas | 288 (3.6%) | 24 (1.6%) |
| Electricity | 299 (3.8%) | 448 (29.4%) |
| Fuel Oil or Kerosene | 3,774 (47.4%) | 268 (17.6%) |
| Coal or Coke | 0 (0.0%) | 0 (0.0%) |
| All other Fuels | 63 (0.8%) | 0 (0.0%) |
| No Fuel Used | 14 (0.2%) | 16 (1.1%) |
| Total | 7,953 (100.0%) | 1,525 (100.0%) |
Household Vehicle Usage in Reading
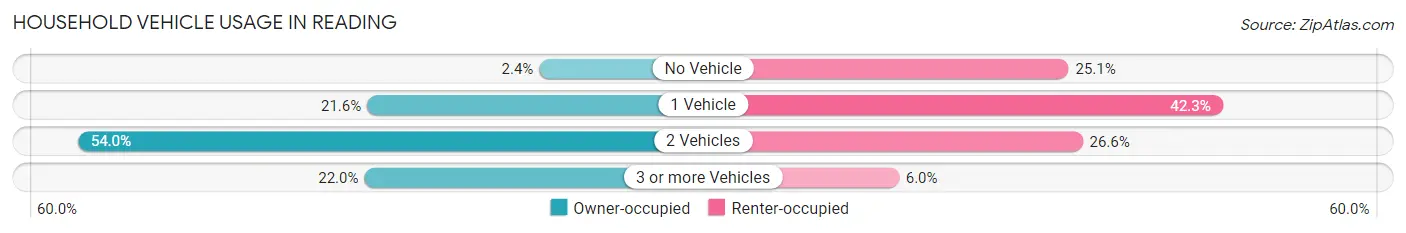
| Vehicles per Household | Owner-occupied | Renter-occupied |
| No Vehicle | 188 (2.4%) | 382 (25.1%) |
| 1 Vehicle | 1,721 (21.6%) | 645 (42.3%) |
| 2 Vehicles | 4,298 (54.0%) | 406 (26.6%) |
| 3 or more Vehicles | 1,746 (22.0%) | 92 (6.0%) |
| Total | 7,953 (100.0%) | 1,525 (100.0%) |
Real Estate & Mortgages in Reading
Real Estate and Mortgage Overview in Reading
| Characteristic | Without Mortgage | With Mortgage |
| Housing Units | 2,497 | 5,456 |
| Median Property Value | $667,800 | $736,600 |
| Median Household Income | $107,877 | $3,640 |
| Monthly Housing Costs | $1,269 | $3,230 |
| Real Estate Taxes | $8,680 | $59 |
Property Value by Mortgage Status in Reading
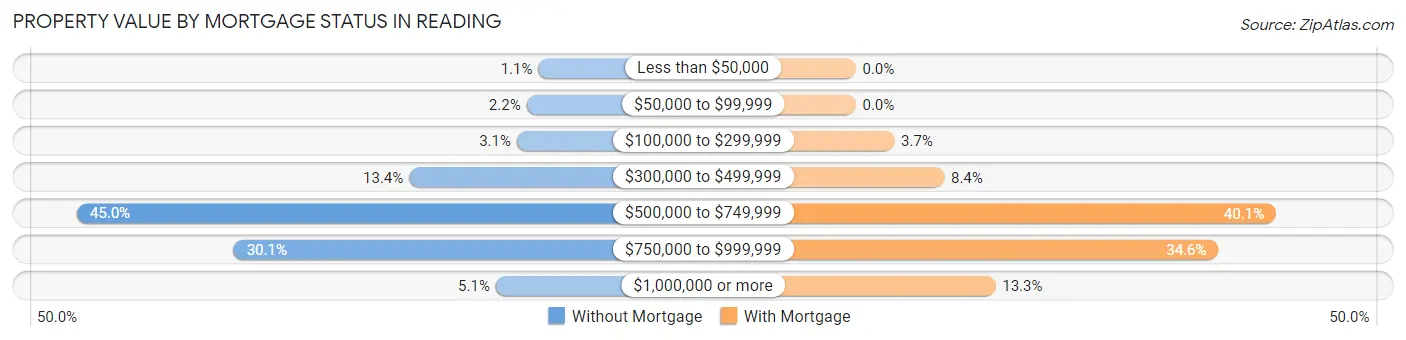
| Property Value | Without Mortgage | With Mortgage |
| Less than $50,000 | 27 (1.1%) | 0 (0.0%) |
| $50,000 to $99,999 | 55 (2.2%) | 0 (0.0%) |
| $100,000 to $299,999 | 78 (3.1%) | 200 (3.7%) |
| $300,000 to $499,999 | 334 (13.4%) | 460 (8.4%) |
| $500,000 to $749,999 | 1,124 (45.0%) | 2,185 (40.1%) |
| $750,000 to $999,999 | 751 (30.1%) | 1,885 (34.5%) |
| $1,000,000 or more | 128 (5.1%) | 726 (13.3%) |
| Total | 2,497 (100.0%) | 5,456 (100.0%) |
Household Income by Mortgage Status in Reading
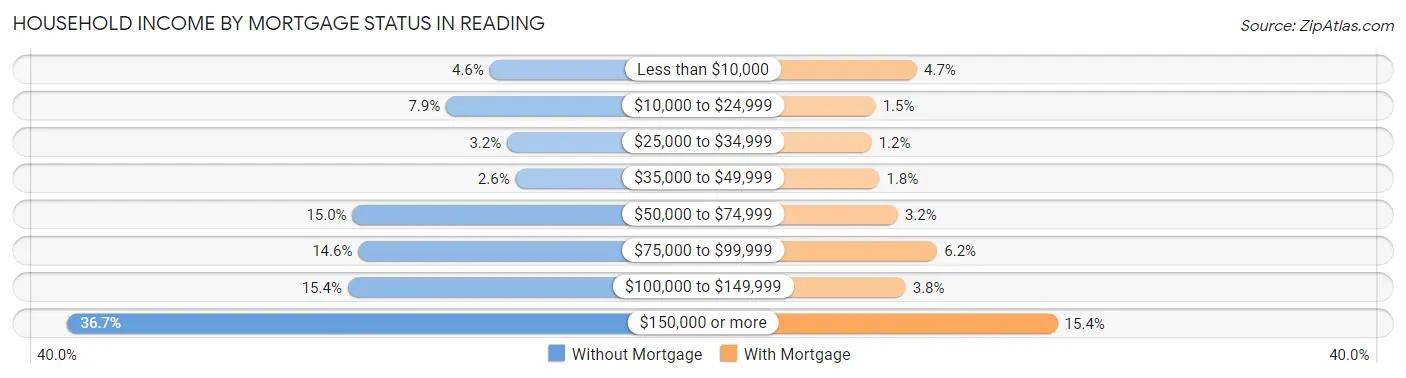
| Household Income | Without Mortgage | With Mortgage |
| Less than $10,000 | 114 (4.6%) | 256 (4.7%) |
| $10,000 to $24,999 | 197 (7.9%) | 84 (1.5%) |
| $25,000 to $34,999 | 81 (3.2%) | 67 (1.2%) |
| $35,000 to $49,999 | 65 (2.6%) | 100 (1.8%) |
| $50,000 to $74,999 | 375 (15.0%) | 176 (3.2%) |
| $75,000 to $99,999 | 364 (14.6%) | 340 (6.2%) |
| $100,000 to $149,999 | 384 (15.4%) | 209 (3.8%) |
| $150,000 or more | 917 (36.7%) | 840 (15.4%) |
| Total | 2,497 (100.0%) | 5,456 (100.0%) |
Property Value to Household Income Ratio in Reading
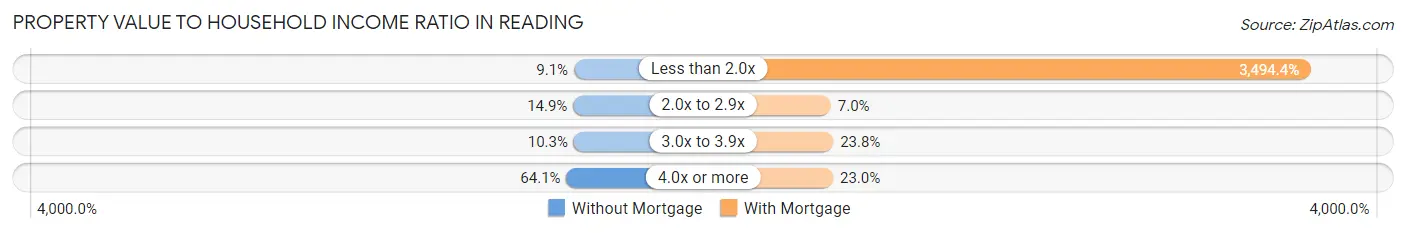
| Value-to-Income Ratio | Without Mortgage | With Mortgage |
| Less than 2.0x | 227 (9.1%) | 190,656 (3,494.4%) |
| 2.0x to 2.9x | 371 (14.9%) | 379 (7.0%) |
| 3.0x to 3.9x | 257 (10.3%) | 1,299 (23.8%) |
| 4.0x or more | 1,600 (64.1%) | 1,254 (23.0%) |
| Total | 2,497 (100.0%) | 5,456 (100.0%) |
Real Estate Taxes by Mortgage Status in Reading
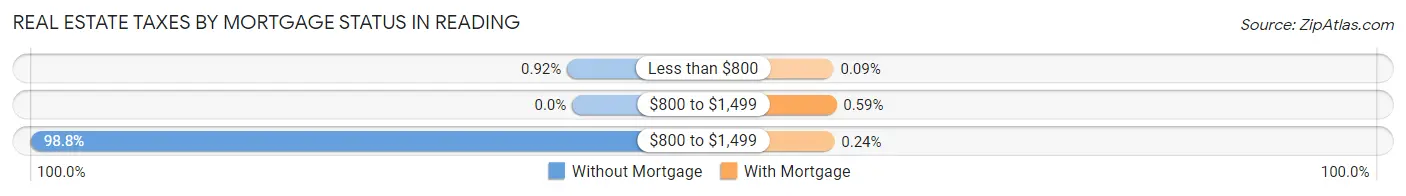
| Property Taxes | Without Mortgage | With Mortgage |
| Less than $800 | 23 (0.9%) | 5 (0.1%) |
| $800 to $1,499 | 0 (0.0%) | 32 (0.6%) |
| $800 to $1,499 | 2,468 (98.8%) | 13 (0.2%) |
| Total | 2,497 (100.0%) | 5,456 (100.0%) |
Health & Disability in Reading
Health Insurance Coverage by Age in Reading
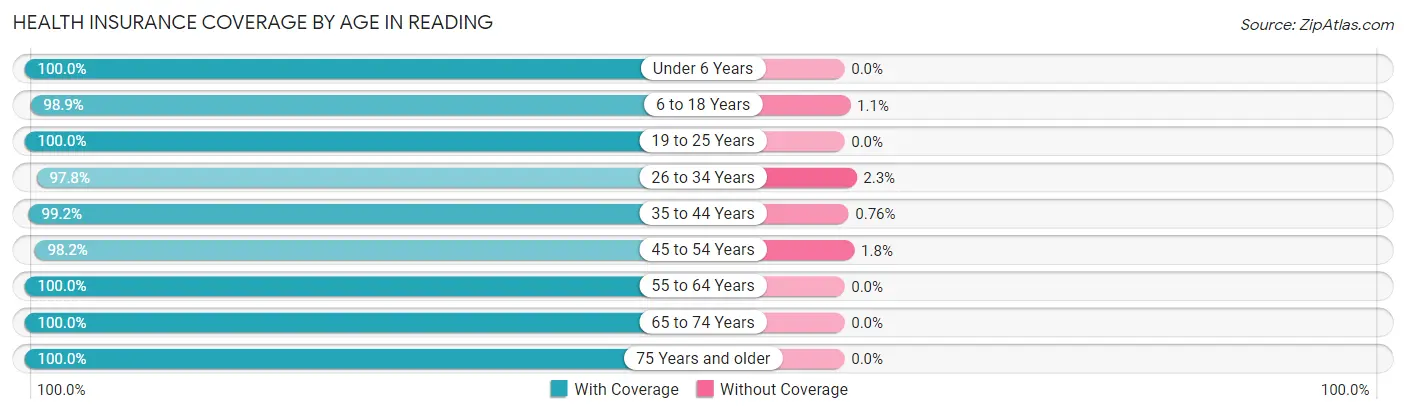
| Age Bracket | With Coverage | Without Coverage |
| Under 6 Years | 1,594 (100.0%) | 0 (0.0%) |
| 6 to 18 Years | 4,828 (98.9%) | 53 (1.1%) |
| 19 to 25 Years | 1,157 (100.0%) | 0 (0.0%) |
| 26 to 34 Years | 2,082 (97.8%) | 48 (2.2%) |
| 35 to 44 Years | 3,279 (99.2%) | 25 (0.8%) |
| 45 to 54 Years | 3,570 (98.2%) | 67 (1.8%) |
| 55 to 64 Years | 3,596 (100.0%) | 0 (0.0%) |
| 65 to 74 Years | 3,001 (100.0%) | 0 (0.0%) |
| 75 Years and older | 1,992 (100.0%) | 0 (0.0%) |
| Total | 25,099 (99.2%) | 193 (0.8%) |
Health Insurance Coverage by Citizenship Status in Reading
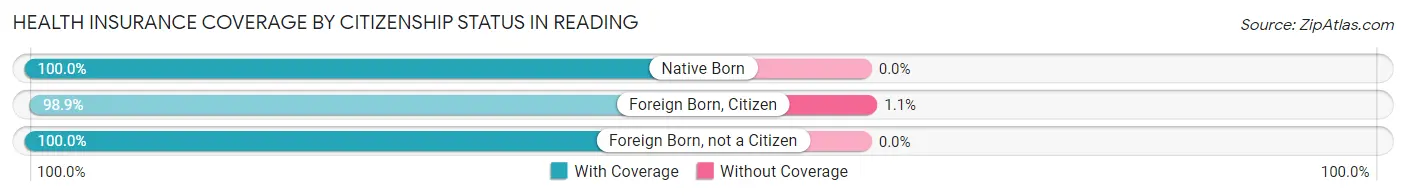
| Citizenship Status | With Coverage | Without Coverage |
| Native Born | 1,594 (100.0%) | 0 (0.0%) |
| Foreign Born, Citizen | 4,828 (98.9%) | 53 (1.1%) |
| Foreign Born, not a Citizen | 1,157 (100.0%) | 0 (0.0%) |
Health Insurance Coverage by Household Income in Reading
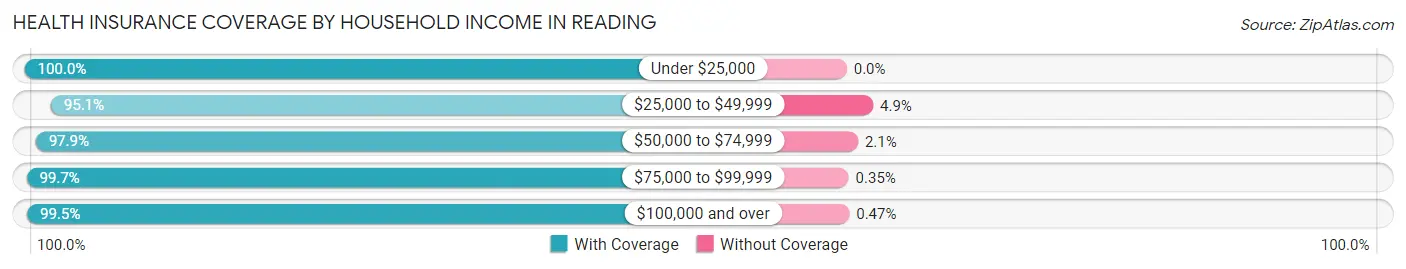
| Household Income | With Coverage | Without Coverage |
| Under $25,000 | 1,034 (100.0%) | 0 (0.0%) |
| $25,000 to $49,999 | 1,214 (95.1%) | 63 (4.9%) |
| $50,000 to $74,999 | 1,454 (97.9%) | 31 (2.1%) |
| $75,000 to $99,999 | 1,694 (99.7%) | 6 (0.4%) |
| $100,000 and over | 19,630 (99.5%) | 93 (0.5%) |
Public vs Private Health Insurance Coverage by Age in Reading
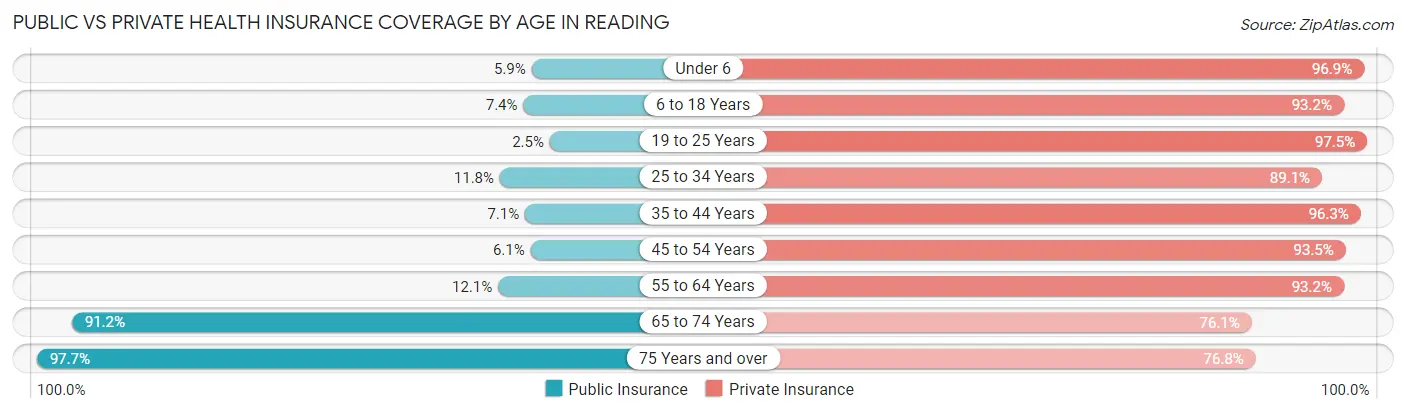
| Age Bracket | Public Insurance | Private Insurance |
| Under 6 | 94 (5.9%) | 1,545 (96.9%) |
| 6 to 18 Years | 362 (7.4%) | 4,547 (93.2%) |
| 19 to 25 Years | 29 (2.5%) | 1,128 (97.5%) |
| 25 to 34 Years | 251 (11.8%) | 1,898 (89.1%) |
| 35 to 44 Years | 235 (7.1%) | 3,182 (96.3%) |
| 45 to 54 Years | 221 (6.1%) | 3,401 (93.5%) |
| 55 to 64 Years | 436 (12.1%) | 3,350 (93.2%) |
| 65 to 74 Years | 2,738 (91.2%) | 2,283 (76.1%) |
| 75 Years and over | 1,947 (97.7%) | 1,530 (76.8%) |
| Total | 6,313 (25.0%) | 22,864 (90.4%) |
Disability Status by Sex by Age in Reading
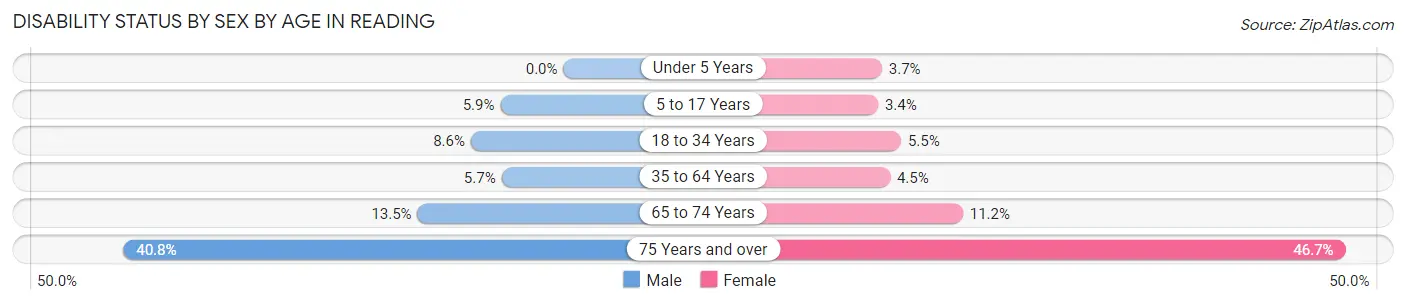
| Age Bracket | Male | Female |
| Under 5 Years | 0 (0.0%) | 22 (3.7%) |
| 5 to 17 Years | 151 (5.9%) | 72 (3.4%) |
| 18 to 34 Years | 160 (8.6%) | 101 (5.5%) |
| 35 to 64 Years | 303 (5.7%) | 235 (4.5%) |
| 65 to 74 Years | 176 (13.5%) | 191 (11.2%) |
| 75 Years and over | 312 (40.8%) | 574 (46.7%) |
Disability Class by Sex by Age in Reading
Disability Class: Hearing Difficulty
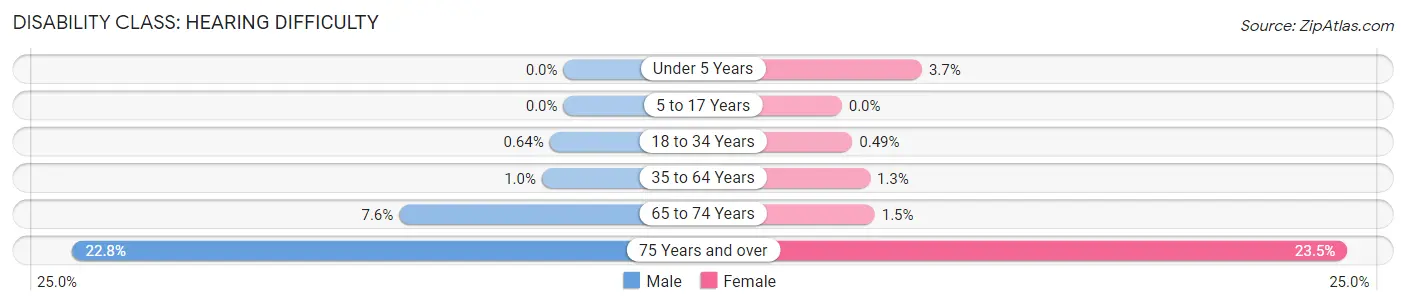
| Age Bracket | Male | Female |
| Under 5 Years | 0 (0.0%) | 22 (3.7%) |
| 5 to 17 Years | 0 (0.0%) | 0 (0.0%) |
| 18 to 34 Years | 12 (0.6%) | 9 (0.5%) |
| 35 to 64 Years | 53 (1.0%) | 69 (1.3%) |
| 65 to 74 Years | 99 (7.6%) | 26 (1.5%) |
| 75 Years and over | 174 (22.8%) | 288 (23.4%) |
Disability Class: Vision Difficulty
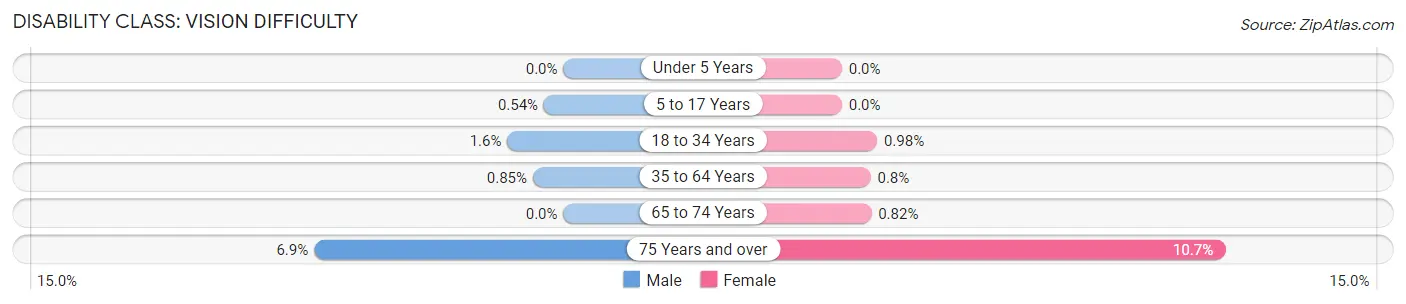
| Age Bracket | Male | Female |
| Under 5 Years | 0 (0.0%) | 0 (0.0%) |
| 5 to 17 Years | 14 (0.5%) | 0 (0.0%) |
| 18 to 34 Years | 29 (1.6%) | 18 (1.0%) |
| 35 to 64 Years | 45 (0.9%) | 42 (0.8%) |
| 65 to 74 Years | 0 (0.0%) | 14 (0.8%) |
| 75 Years and over | 53 (6.9%) | 131 (10.7%) |
Disability Class: Cognitive Difficulty
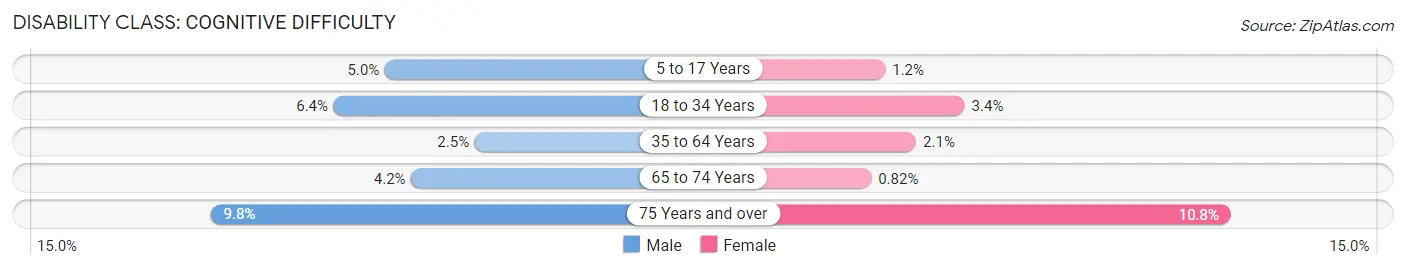
| Age Bracket | Male | Female |
| 5 to 17 Years | 128 (5.0%) | 26 (1.2%) |
| 18 to 34 Years | 119 (6.4%) | 63 (3.4%) |
| 35 to 64 Years | 130 (2.5%) | 109 (2.1%) |
| 65 to 74 Years | 55 (4.2%) | 14 (0.8%) |
| 75 Years and over | 75 (9.8%) | 133 (10.8%) |
Disability Class: Ambulatory Difficulty
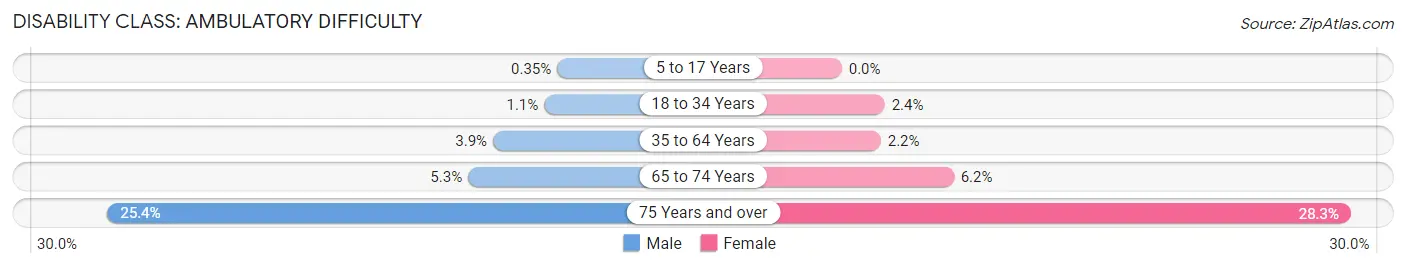
| Age Bracket | Male | Female |
| 5 to 17 Years | 9 (0.4%) | 0 (0.0%) |
| 18 to 34 Years | 20 (1.1%) | 44 (2.4%) |
| 35 to 64 Years | 207 (3.9%) | 114 (2.2%) |
| 65 to 74 Years | 69 (5.3%) | 106 (6.2%) |
| 75 Years and over | 194 (25.4%) | 348 (28.3%) |
Disability Class: Self-Care Difficulty
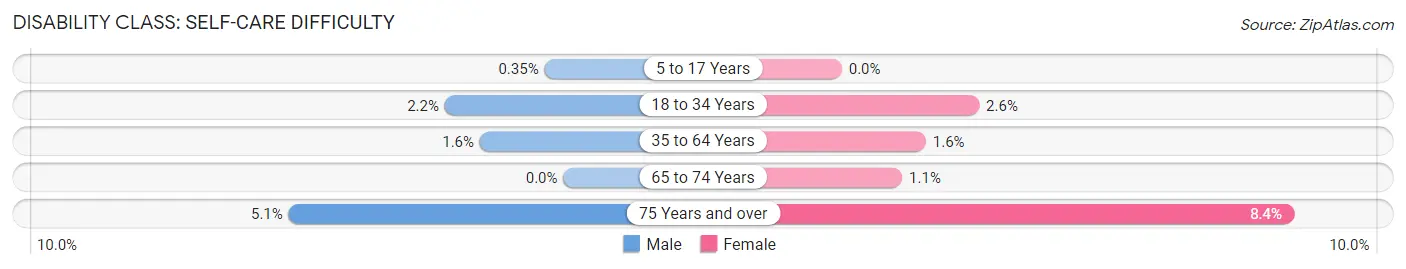
| Age Bracket | Male | Female |
| 5 to 17 Years | 9 (0.4%) | 0 (0.0%) |
| 18 to 34 Years | 41 (2.2%) | 47 (2.5%) |
| 35 to 64 Years | 82 (1.5%) | 82 (1.6%) |
| 65 to 74 Years | 0 (0.0%) | 19 (1.1%) |
| 75 Years and over | 39 (5.1%) | 103 (8.4%) |
Technology Access in Reading
Computing Device Access in Reading
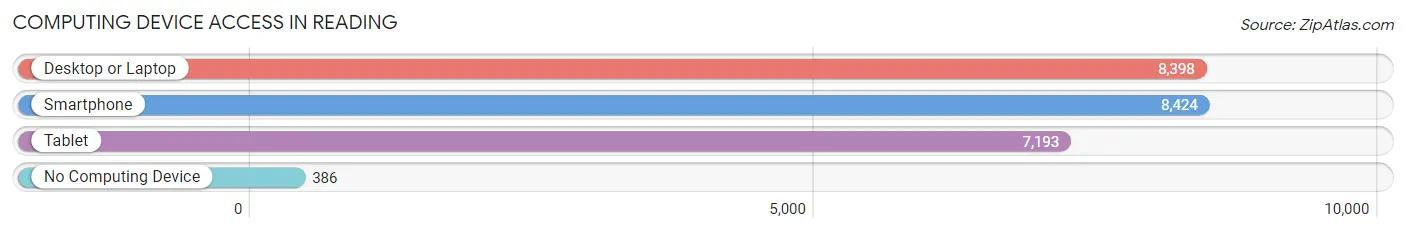
| Device Type | # Households | % Households |
| Desktop or Laptop | 8,398 | 88.6% |
| Smartphone | 8,424 | 88.9% |
| Tablet | 7,193 | 75.9% |
| No Computing Device | 386 | 4.1% |
| Total | 9,478 | 100.0% |
Internet Access in Reading
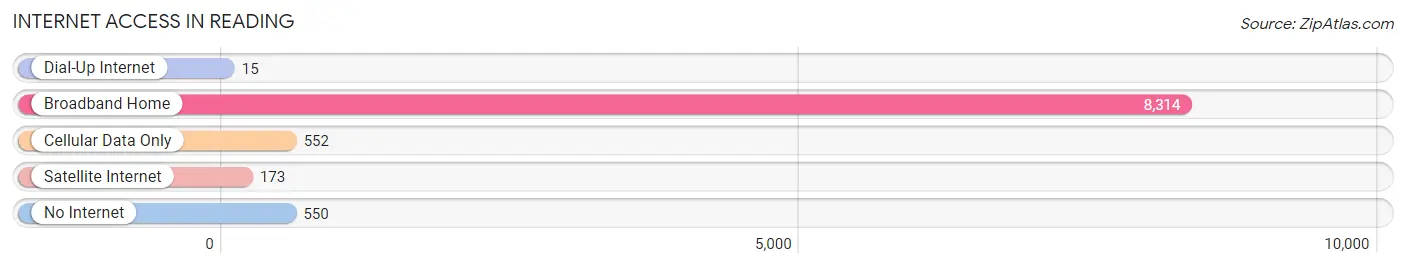
| Internet Type | # Households | % Households |
| Dial-Up Internet | 15 | 0.2% |
| Broadband Home | 8,314 | 87.7% |
| Cellular Data Only | 552 | 5.8% |
| Satellite Internet | 173 | 1.8% |
| No Internet | 550 | 5.8% |
| Total | 9,478 | 100.0% |
Reading Summary
Reading, Massachusetts is a city located in Middlesex County, Massachusetts, United States. It is situated on the banks of the Merrimack River, approximately 25 miles northwest of Boston. The city has a population of approximately 33,000 people, making it the sixth largest city in the state.
History
The area that is now Reading was first settled in 1639 by Puritan settlers from England. The town was officially incorporated in 1644 and was named after the town of Reading in Berkshire, England. The town was primarily an agricultural community, with the main crops being corn, wheat, and hay. In the late 1700s, the town began to industrialize, with the first cotton mill being built in 1790. The town also had a number of tanneries, shoe factories, and other small industries.
In the mid-1800s, Reading began to experience a population boom, as immigrants from Ireland, Italy, and other parts of Europe began to settle in the area. This influx of immigrants helped to fuel the town’s industrial growth, and by the late 1800s, Reading had become a major manufacturing center. The town also had a thriving retail sector, with a number of stores and shops located in the downtown area.
Geography
Reading is located in Middlesex County, Massachusetts, approximately 25 miles northwest of Boston. The city is situated on the banks of the Merrimack River, and is bordered by the towns of Wakefield, North Reading, Lynnfield, and Wilmington. The city has a total area of 8.3 square miles, of which 8.2 square miles is land and 0.1 square miles is water.
Economy
Reading’s economy is largely based on manufacturing and retail. The city is home to a number of manufacturing companies, including a number of electronics and medical device companies. The city also has a number of retail stores, including a number of national chain stores. The city also has a number of restaurants, bars, and other businesses.
Demographics
As of the 2010 census, Reading had a population of 33,000 people. The racial makeup of the city was 87.3% White, 4.2% African American, 0.4% Native American, 3.2% Asian, 0.1% Pacific Islander, and 4.8% from other races. The median household income was $63,000, and the median family income was $76,000. The city’s population is largely made up of young professionals and families. The city also has a large Hispanic population, with approximately 20% of the population being of Hispanic or Latino origin.
Common Questions
What is Per Capita Income in Reading?
Per Capita income in Reading is $66,745.
What is the Median Family Income in Reading?
Median Family Income in Reading is $187,682.
What is the Median Household income in Reading?
Median Household Income in Reading is $154,662.
What is Income or Wage Gap in Reading?
Income or Wage Gap in Reading is 35.6%.
Women in Reading earn 64.4 cents for every dollar earned by a man.
What is Family Income Deficit in Reading?
Family Income Deficit in Reading is $3,890.
Families that are below poverty line in Reading earn $3,890 less on average than the poverty threshold level.
What is Inequality or Gini Index in Reading?
Inequality or Gini Index in Reading is 0.42.
What is the Total Population of Reading?
Total Population of Reading is 25,415.
What is the Total Male Population of Reading?
Total Male Population of Reading is 12,588.
What is the Total Female Population of Reading?
Total Female Population of Reading is 12,827.
What is the Ratio of Males per 100 Females in Reading?
There are 98.14 Males per 100 Females in Reading.
What is the Ratio of Females per 100 Males in Reading?
There are 101.90 Females per 100 Males in Reading.
What is the Median Population Age in Reading?
Median Population Age in Reading is 44.2 Years.
What is the Average Family Size in Reading
Average Family Size in Reading is 3.2 People.
What is the Average Household Size in Reading
Average Household Size in Reading is 2.7 People.
How Large is the Labor Force in Reading?
There are 13,684 People in the Labor Forcein in Reading.
What is the Percentage of People in the Labor Force in Reading?
68.2% of People are in the Labor Force in Reading.
What is the Unemployment Rate in Reading?
Unemployment Rate in Reading is 2.8%.