Wellesley, MA Map & Demographics
Wellesley Map
Wellesley Overview
$111,690
PER CAPITA INCOME
$250,001
AVG FAMILY INCOME
$250,001
AVG HOUSEHOLD INCOME
81.7%
WAGE / INCOME GAP [ % ]
18.3¢/ $1
WAGE / INCOME GAP [ $ ]
0.49
INEQUALITY / GINI INDEX
29,862
TOTAL POPULATION
13,343
MALE POPULATION
16,519
FEMALE POPULATION
80.77
MALES / 100 FEMALES
123.80
FEMALES / 100 MALES
37.6
MEDIAN AGE
3.3
AVG FAMILY SIZE
2.8
AVG HOUSEHOLD SIZE
13,359
LABOR FORCE [ PEOPLE ]
57.0%
PERCENT IN LABOR FORCE
4.0%
UNEMPLOYMENT RATE
Wellesley Zip Codes
Income in Wellesley
Income Overview in Wellesley
Per Capita Income in Wellesley is $111,690, while median incomes of families and households are $250,001 and $250,001 respectively.
| Characteristic | Number | Measure |
| Per Capita Income | 29,862 | $111,690 |
| Median Family Income | 7,019 | $250,001 |
| Mean Family Income | 7,019 | $425,556 |
| Median Household Income | 8,956 | $250,001 |
| Mean Household Income | 8,956 | $367,801 |
| Income Deficit | 7,019 | $0 |
| Wage / Income Gap (%) | 29,862 | 81.69% |
| Wage / Income Gap ($) | 29,862 | 18.31¢ per $1 |
| Gini / Inequality Index | 29,862 | 0.49 |
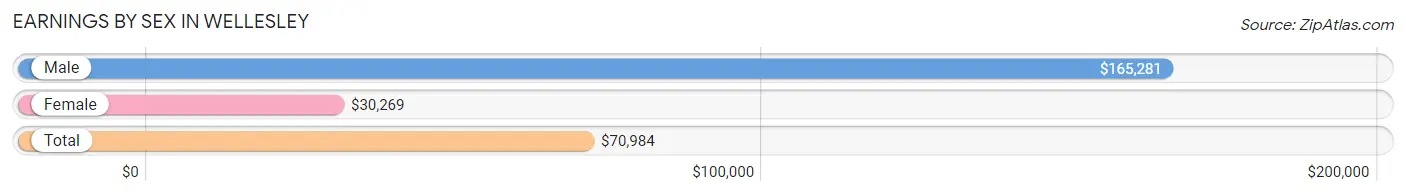
Earnings by Sex in Wellesley
Average Earnings in Wellesley are $70,984, $165,281 for men and $30,269 for women, a difference of 81.7%.
| Sex | Number | Average Earnings |
| Male | 7,483 (47.7%) | $165,281 |
| Female | 8,218 (52.3%) | $30,269 |
| Total | 15,701 (100.0%) | $70,984 |
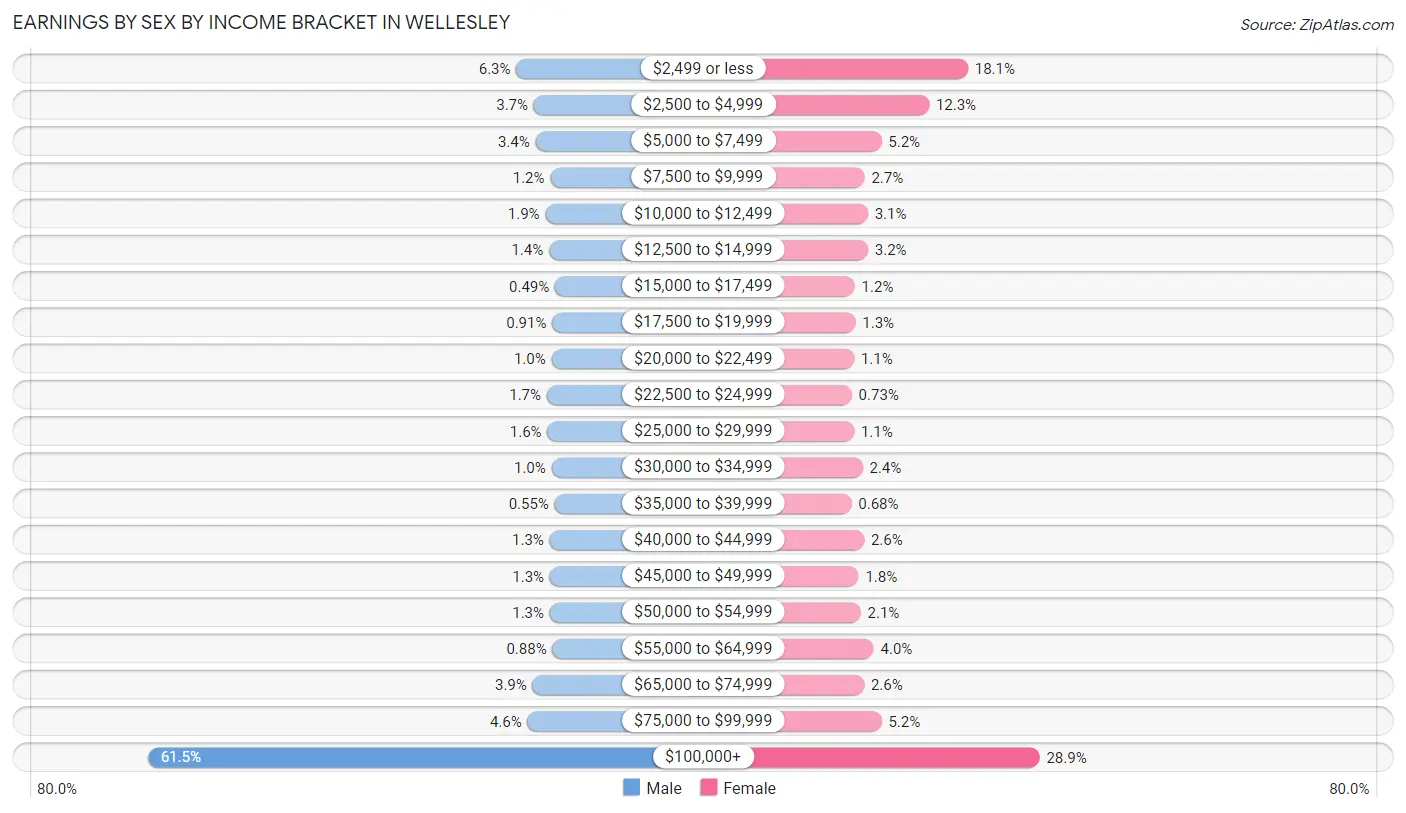
Earnings by Sex by Income Bracket in Wellesley
The most common earnings brackets in Wellesley are $100,000+ for men (4,605 | 61.5%) and $100,000+ for women (2,373 | 28.9%).
| Income | Male | Female |
| $2,499 or less | 471 (6.3%) | 1,490 (18.1%) |
| $2,500 to $4,999 | 275 (3.7%) | 1,012 (12.3%) |
| $5,000 to $7,499 | 256 (3.4%) | 426 (5.2%) |
| $7,500 to $9,999 | 90 (1.2%) | 218 (2.6%) |
| $10,000 to $12,499 | 145 (1.9%) | 257 (3.1%) |
| $12,500 to $14,999 | 104 (1.4%) | 260 (3.2%) |
| $15,000 to $17,499 | 37 (0.5%) | 97 (1.2%) |
| $17,500 to $19,999 | 68 (0.9%) | 105 (1.3%) |
| $20,000 to $22,499 | 76 (1.0%) | 88 (1.1%) |
| $22,500 to $24,999 | 129 (1.7%) | 60 (0.7%) |
| $25,000 to $29,999 | 123 (1.6%) | 89 (1.1%) |
| $30,000 to $34,999 | 76 (1.0%) | 194 (2.4%) |
| $35,000 to $39,999 | 41 (0.5%) | 56 (0.7%) |
| $40,000 to $44,999 | 97 (1.3%) | 211 (2.6%) |
| $45,000 to $49,999 | 94 (1.3%) | 144 (1.8%) |
| $50,000 to $54,999 | 95 (1.3%) | 170 (2.1%) |
| $55,000 to $64,999 | 66 (0.9%) | 330 (4.0%) |
| $65,000 to $74,999 | 289 (3.9%) | 211 (2.6%) |
| $75,000 to $99,999 | 346 (4.6%) | 427 (5.2%) |
| $100,000+ | 4,605 (61.5%) | 2,373 (28.9%) |
| Total | 7,483 (100.0%) | 8,218 (100.0%) |
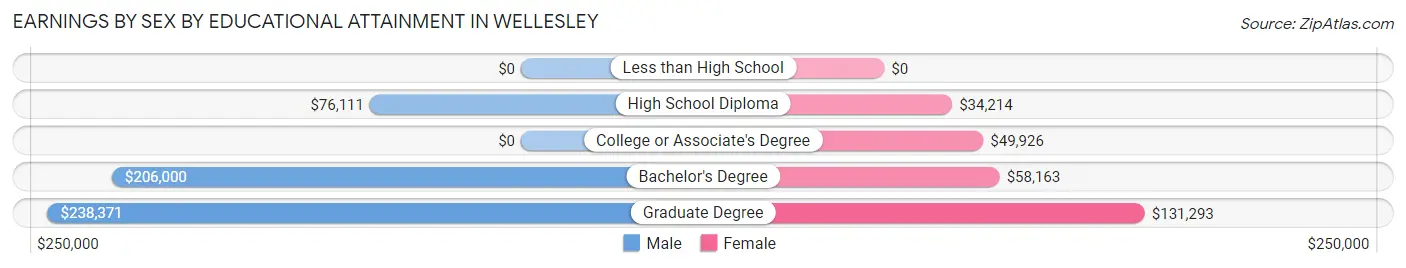
Earnings by Sex by Educational Attainment in Wellesley
Average earnings in Wellesley are $225,509 for men and $95,492 for women, a difference of 57.7%. Men with an educational attainment of graduate degree enjoy the highest average annual earnings of $238,371, while those with high school diploma education earn the least with $76,111. Women with an educational attainment of graduate degree earn the most with the average annual earnings of $131,293, while those with high school diploma education have the smallest earnings of $34,214.
| Educational Attainment | Male Income | Female Income |
| Less than High School | - | - |
| High School Diploma | $76,111 | $34,214 |
| College or Associate's Degree | - | - |
| Bachelor's Degree | $206,000 | $58,163 |
| Graduate Degree | $238,371 | $131,293 |
| Total | $225,509 | $95,492 |
Family Income in Wellesley
Family Income Brackets in Wellesley
According to the Wellesley family income data, there are 4,976 families falling into the $200,000+ income range, which is the most common income bracket and makes up 70.9% of all families. Conversely, the $10,000 to $14,999 income bracket is the least frequent group with only 21 families (0.3%) belonging to this category.
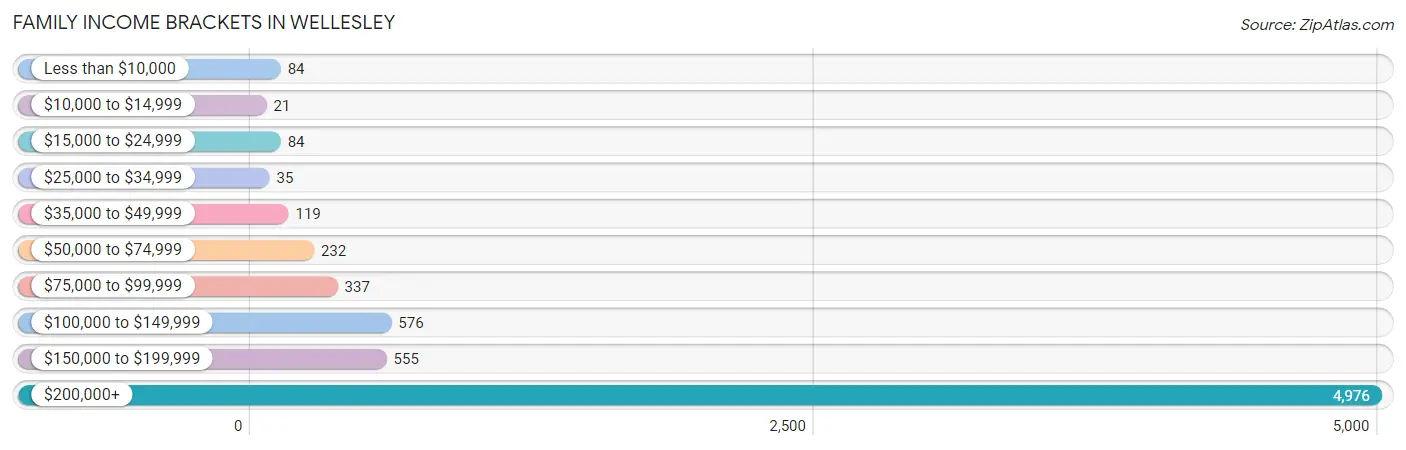
| Income Bracket | # Families | % Families |
| Less than $10,000 | 84 | 1.2% |
| $10,000 to $14,999 | 21 | 0.3% |
| $15,000 to $24,999 | 84 | 1.2% |
| $25,000 to $34,999 | 35 | 0.5% |
| $35,000 to $49,999 | 119 | 1.7% |
| $50,000 to $74,999 | 232 | 3.3% |
| $75,000 to $99,999 | 337 | 4.8% |
| $100,000 to $149,999 | 576 | 8.2% |
| $150,000 to $199,999 | 555 | 7.9% |
| $200,000+ | 4,976 | 70.9% |
Family Income by Famaliy Size in Wellesley
3-person families (1,375 | 19.6%) account for the highest median family income in Wellesley with $250,001 per family, while 2-person families (2,712 | 38.6%) have the highest median income of $111,698 per family member.
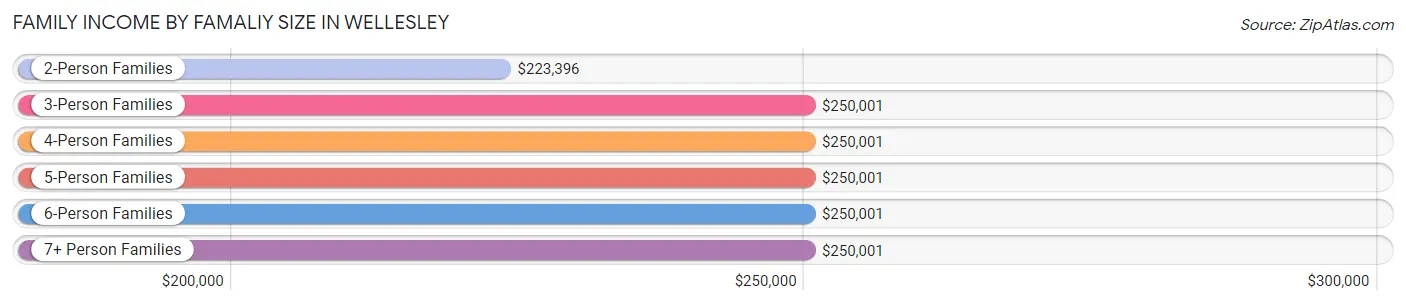
| Income Bracket | # Families | Median Income |
| 2-Person Families | 2,712 (38.6%) | $223,396 |
| 3-Person Families | 1,375 (19.6%) | $250,001 |
| 4-Person Families | 1,652 (23.5%) | $250,001 |
| 5-Person Families | 930 (13.3%) | $250,001 |
| 6-Person Families | 321 (4.6%) | $250,001 |
| 7+ Person Families | 29 (0.4%) | $250,001 |
| Total | 7,019 (100.0%) | $250,001 |
Family Income by Number of Earners in Wellesley
The median family income in Wellesley is $250,001, with families comprising 2 earners (3,296) having the highest median family income of $250,001, while families with no earners (717) have the lowest median family income of $129,779, accounting for 47.0% and 10.2% of families, respectively.
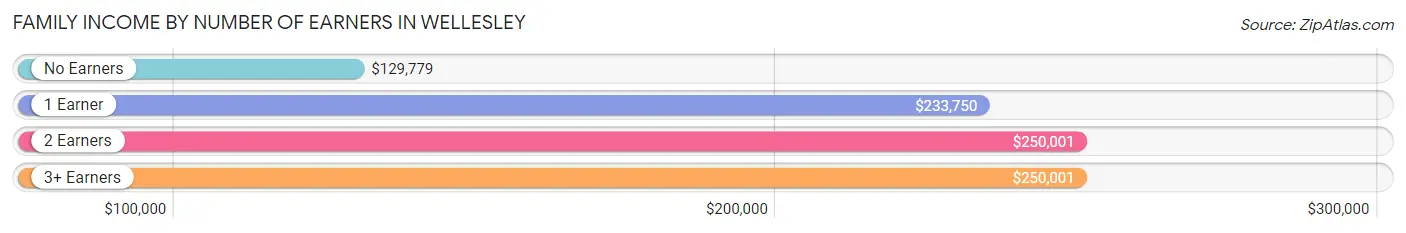
| Number of Earners | # Families | Median Income |
| No Earners | 717 (10.2%) | $129,779 |
| 1 Earner | 2,266 (32.3%) | $233,750 |
| 2 Earners | 3,296 (47.0%) | $250,001 |
| 3+ Earners | 740 (10.5%) | $250,001 |
| Total | 7,019 (100.0%) | $250,001 |
Household Income in Wellesley
Household Income Brackets in Wellesley
With 5,436 households falling in the category, the $200,000+ income range is the most frequent in Wellesley, accounting for 60.7% of all households. In contrast, only 116 households (1.3%) fall into the $10,000 to $14,999 income bracket, making it the least populous group.
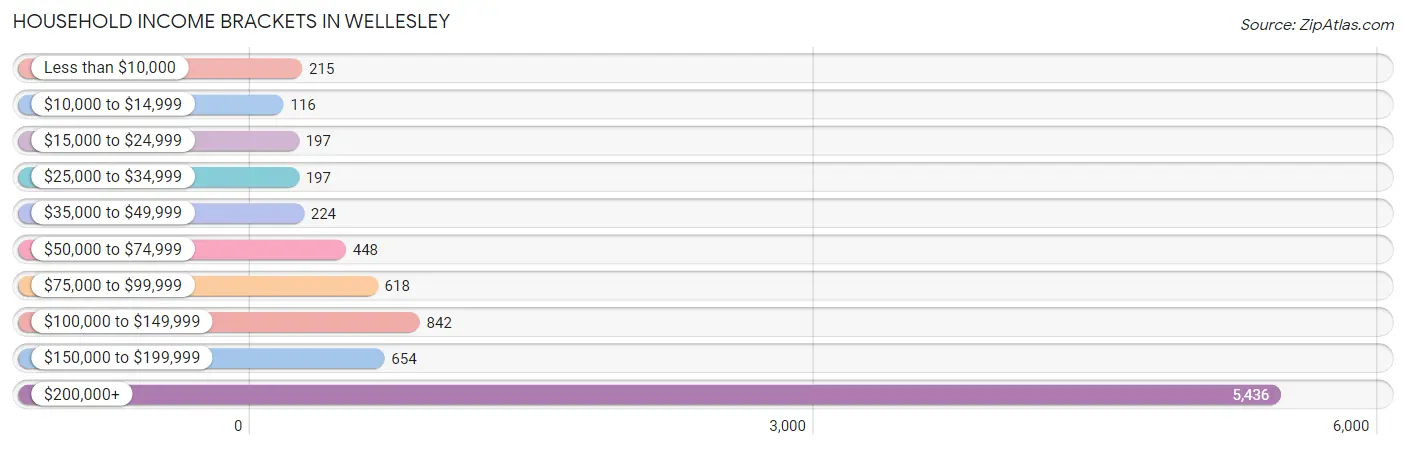
| Income Bracket | # Households | % Households |
| Less than $10,000 | 215 | 2.4% |
| $10,000 to $14,999 | 116 | 1.3% |
| $15,000 to $24,999 | 197 | 2.2% |
| $25,000 to $34,999 | 197 | 2.2% |
| $35,000 to $49,999 | 224 | 2.5% |
| $50,000 to $74,999 | 448 | 5.0% |
| $75,000 to $99,999 | 618 | 6.9% |
| $100,000 to $149,999 | 842 | 9.4% |
| $150,000 to $199,999 | 654 | 7.3% |
| $200,000+ | 5,436 | 60.7% |
Household Income by Householder Age in Wellesley
The median household income in Wellesley is $250,001, with the highest median household income of $250,001 found in the 25 to 44 years age bracket for the primary householder. A total of 1,807 households (20.2%) fall into this category. Meanwhile, the 15 to 24 years age bracket for the primary householder has the lowest median household income of $0, with 30 households (0.3%) in this group.
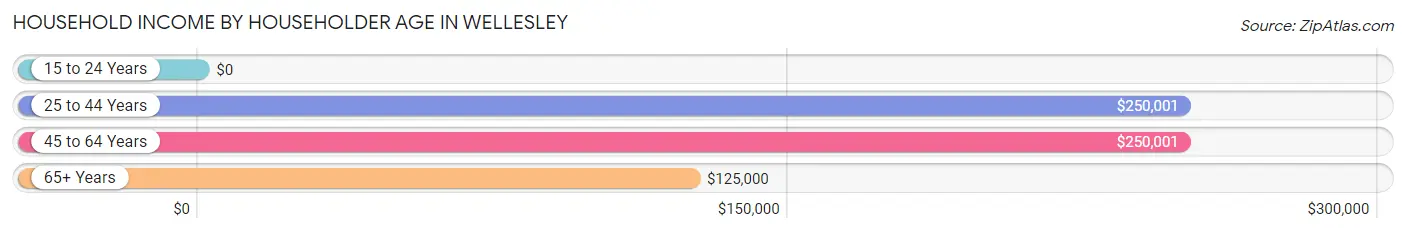
| Income Bracket | # Households | Median Income |
| 15 to 24 Years | 30 (0.3%) | $0 |
| 25 to 44 Years | 1,807 (20.2%) | $250,001 |
| 45 to 64 Years | 4,425 (49.4%) | $250,001 |
| 65+ Years | 2,694 (30.1%) | $125,000 |
| Total | 8,956 (100.0%) | $250,001 |
Poverty in Wellesley
Income Below Poverty by Sex and Age in Wellesley
With 4.0% poverty level for males and 4.2% for females among the residents of Wellesley, 18 to 24 year old males and 75 year old and over females are the most vulnerable to poverty, with 107 males (16.3%) and 96 females (7.4%) in their respective age groups living below the poverty level.
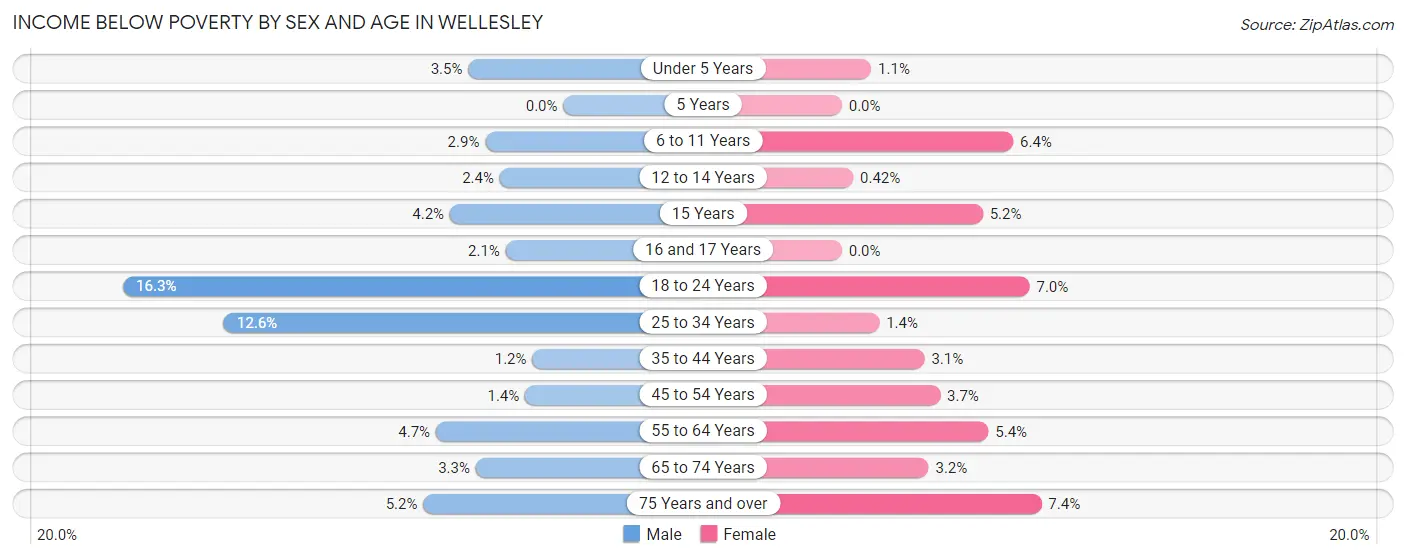
| Age Bracket | Male | Female |
| Under 5 Years | 28 (3.5%) | 8 (1.1%) |
| 5 Years | 0 (0.0%) | 0 (0.0%) |
| 6 to 11 Years | 37 (2.9%) | 88 (6.4%) |
| 12 to 14 Years | 20 (2.4%) | 3 (0.4%) |
| 15 Years | 11 (4.2%) | 9 (5.2%) |
| 16 and 17 Years | 15 (2.1%) | 0 (0.0%) |
| 18 to 24 Years | 107 (16.3%) | 66 (7.0%) |
| 25 to 34 Years | 63 (12.6%) | 9 (1.4%) |
| 35 to 44 Years | 15 (1.1%) | 45 (3.1%) |
| 45 to 54 Years | 28 (1.4%) | 81 (3.6%) |
| 55 to 64 Years | 93 (4.7%) | 107 (5.4%) |
| 65 to 74 Years | 35 (3.3%) | 40 (3.2%) |
| 75 Years and over | 41 (5.2%) | 96 (7.4%) |
| Total | 493 (4.0%) | 552 (4.2%) |
Income Above Poverty by Sex and Age in Wellesley
According to the poverty statistics in Wellesley, males aged 5 years and females aged 5 years are the age groups that are most secure financially, with 100.0% of males and 100.0% of females in these age groups living above the poverty line.
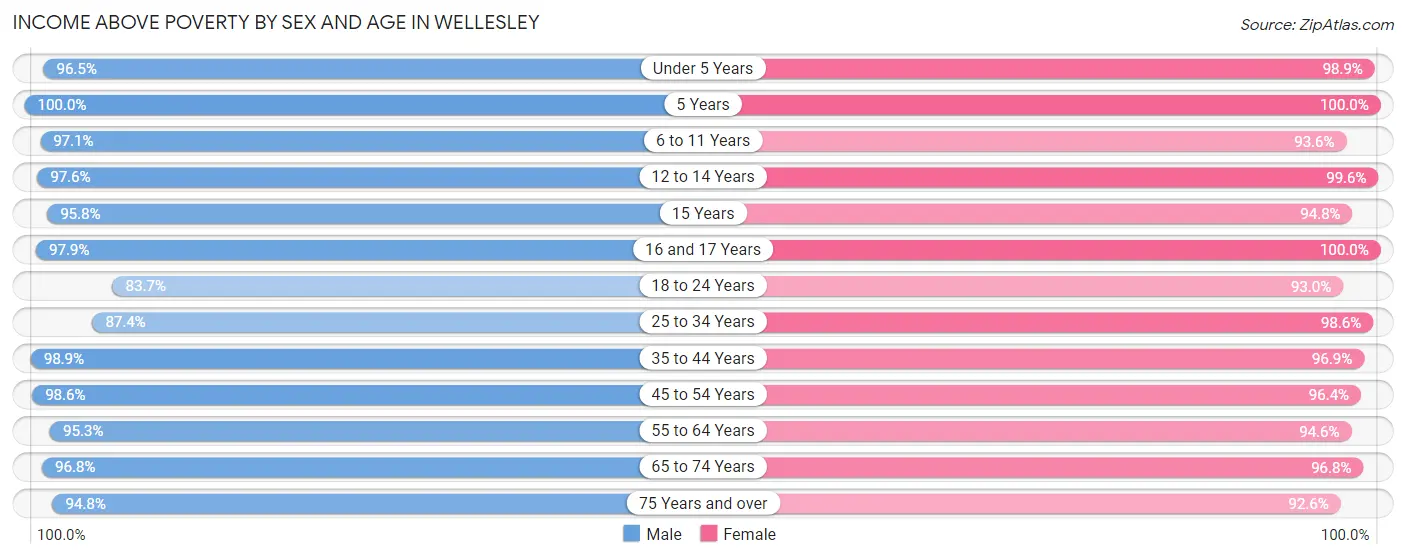
| Age Bracket | Male | Female |
| Under 5 Years | 766 (96.5%) | 728 (98.9%) |
| 5 Years | 140 (100.0%) | 61 (100.0%) |
| 6 to 11 Years | 1,239 (97.1%) | 1,295 (93.6%) |
| 12 to 14 Years | 826 (97.6%) | 716 (99.6%) |
| 15 Years | 250 (95.8%) | 163 (94.8%) |
| 16 and 17 Years | 687 (97.9%) | 330 (100.0%) |
| 18 to 24 Years | 548 (83.7%) | 881 (93.0%) |
| 25 to 34 Years | 437 (87.4%) | 639 (98.6%) |
| 35 to 44 Years | 1,295 (98.9%) | 1,421 (96.9%) |
| 45 to 54 Years | 1,945 (98.6%) | 2,136 (96.4%) |
| 55 to 64 Years | 1,872 (95.3%) | 1,859 (94.6%) |
| 65 to 74 Years | 1,041 (96.8%) | 1,202 (96.8%) |
| 75 Years and over | 748 (94.8%) | 1,200 (92.6%) |
| Total | 11,794 (96.0%) | 12,631 (95.8%) |
Income Below Poverty Among Married-Couple Families in Wellesley
The poverty statistics for married-couple families in Wellesley show that 1.8% or 112 of the total 6,263 families live below the poverty line. Families with 3 or 4 children have the highest poverty rate of 3.9%, comprising of 39 families. On the other hand, families with 5 or more children have the lowest poverty rate of 0.0%, which includes 0 families.
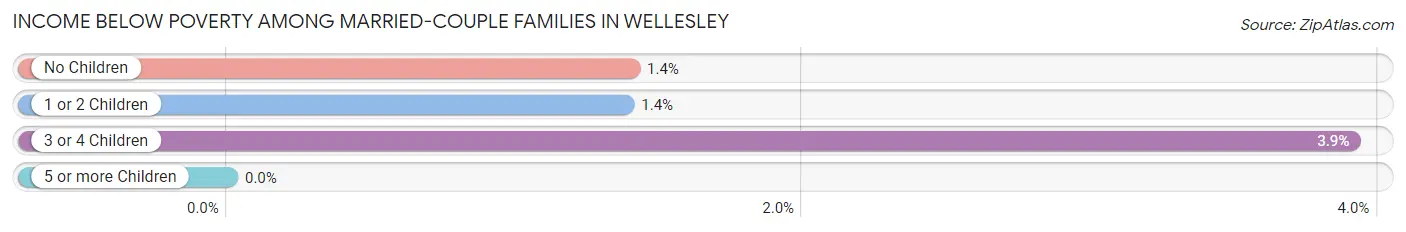
| Children | Above Poverty | Below Poverty |
| No Children | 2,897 (98.6%) | 41 (1.4%) |
| 1 or 2 Children | 2,290 (98.6%) | 32 (1.4%) |
| 3 or 4 Children | 959 (96.1%) | 39 (3.9%) |
| 5 or more Children | 5 (100.0%) | 0 (0.0%) |
| Total | 6,151 (98.2%) | 112 (1.8%) |
Income Below Poverty Among Single-Parent Households in Wellesley
According to the poverty data in Wellesley, 7.6% or 16 single-father households and 5.1% or 28 single-mother households are living below the poverty line. Among single-father households, those with 1 or 2 children have the highest poverty rate, with 16 households (9.9%) experiencing poverty. Likewise, among single-mother households, those with 1 or 2 children have the highest poverty rate, with 28 households (8.3%) falling below the poverty line.
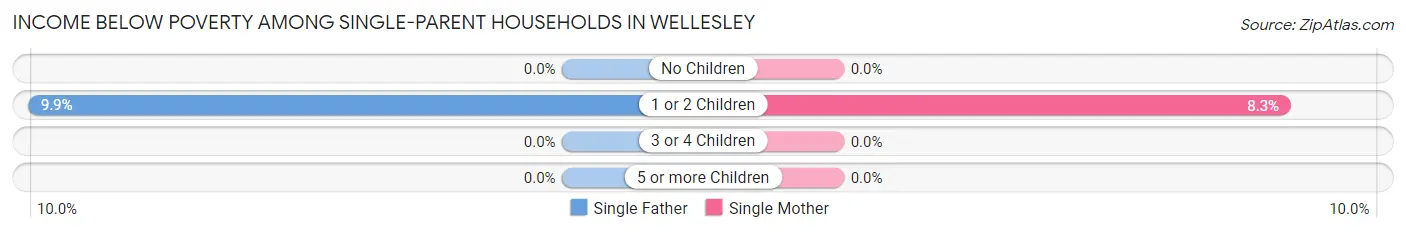
| Children | Single Father | Single Mother |
| No Children | 0 (0.0%) | 0 (0.0%) |
| 1 or 2 Children | 16 (9.9%) | 28 (8.3%) |
| 3 or 4 Children | 0 (0.0%) | 0 (0.0%) |
| 5 or more Children | 0 (0.0%) | 0 (0.0%) |
| Total | 16 (7.6%) | 28 (5.1%) |
Income Below Poverty Among Married-Couple vs Single-Parent Households in Wellesley
The poverty data for Wellesley shows that 112 of the married-couple family households (1.8%) and 44 of the single-parent households (5.8%) are living below the poverty level. Within the married-couple family households, those with 3 or 4 children have the highest poverty rate, with 39 households (3.9%) falling below the poverty line. Among the single-parent households, those with 1 or 2 children have the highest poverty rate, with 44 household (8.8%) living below poverty.
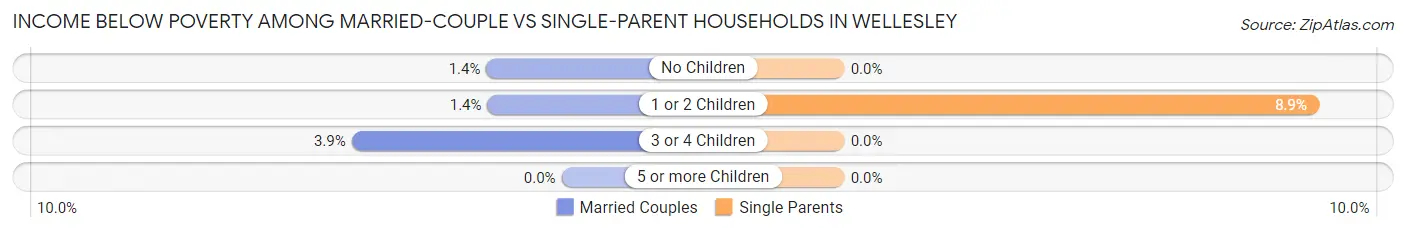
| Children | Married-Couple Families | Single-Parent Households |
| No Children | 41 (1.4%) | 0 (0.0%) |
| 1 or 2 Children | 32 (1.4%) | 44 (8.8%) |
| 3 or 4 Children | 39 (3.9%) | 0 (0.0%) |
| 5 or more Children | 0 (0.0%) | 0 (0.0%) |
| Total | 112 (1.8%) | 44 (5.8%) |
Race in Wellesley
The most populous races in Wellesley are White / Caucasian (22,634 | 75.8%), Asian (3,965 | 13.3%), and Two or more Races (2,270 | 7.6%).
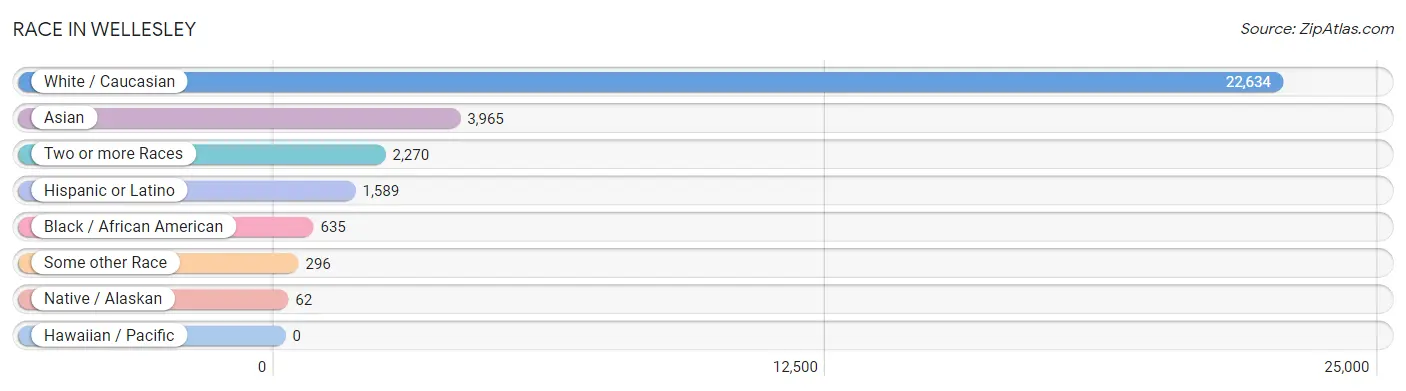
| Race | # Population | % Population |
| Asian | 3,965 | 13.3% |
| Black / African American | 635 | 2.1% |
| Hawaiian / Pacific | 0 | 0.0% |
| Hispanic or Latino | 1,589 | 5.3% |
| Native / Alaskan | 62 | 0.2% |
| White / Caucasian | 22,634 | 75.8% |
| Two or more Races | 2,270 | 7.6% |
| Some other Race | 296 | 1.0% |
| Total | 29,862 | 100.0% |
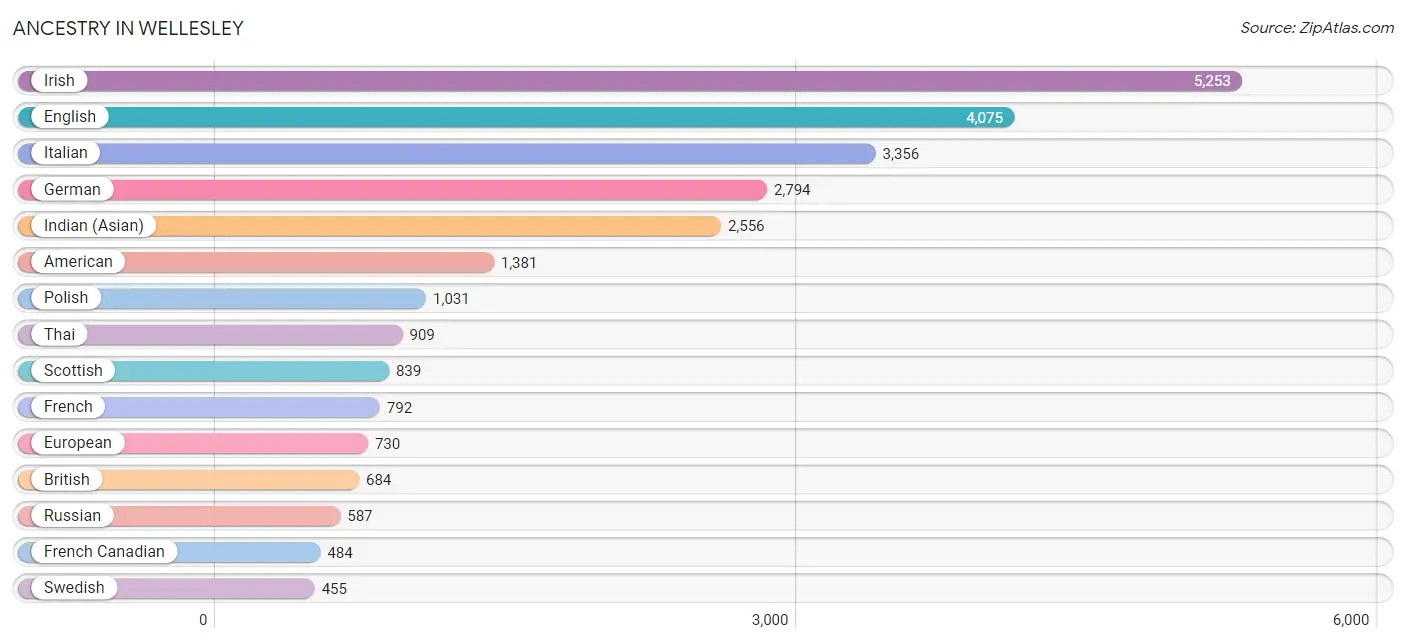
Ancestry in Wellesley
The most populous ancestries reported in Wellesley are Irish (5,253 | 17.6%), English (4,075 | 13.7%), Italian (3,356 | 11.2%), German (2,794 | 9.4%), and Indian (Asian) (2,556 | 8.6%), together accounting for 60.4% of all Wellesley residents.
| Ancestry | # Population | % Population |
| Afghan | 8 | 0.0% |
| African | 72 | 0.2% |
| Albanian | 39 | 0.1% |
| American | 1,381 | 4.6% |
| Arab | 278 | 0.9% |
| Argentinean | 142 | 0.5% |
| Armenian | 419 | 1.4% |
| Assyrian / Chaldean / Syriac | 8 | 0.0% |
| Australian | 1 | 0.0% |
| Austrian | 389 | 1.3% |
| Bahamian | 44 | 0.2% |
| Barbadian | 3 | 0.0% |
| Belgian | 48 | 0.2% |
| Belizean | 7 | 0.0% |
| Bhutanese | 173 | 0.6% |
| Bolivian | 2 | 0.0% |
| Brazilian | 24 | 0.1% |
| British | 684 | 2.3% |
| Bulgarian | 27 | 0.1% |
| Burmese | 413 | 1.4% |
| Canadian | 185 | 0.6% |
| Cape Verdean | 14 | 0.1% |
| Central American | 112 | 0.4% |
| Central American Indian | 7 | 0.0% |
| Cherokee | 7 | 0.0% |
| Colombian | 113 | 0.4% |
| Costa Rican | 6 | 0.0% |
| Croatian | 29 | 0.1% |
| Cuban | 58 | 0.2% |
| Czech | 72 | 0.2% |
| Danish | 244 | 0.8% |
| Dominican | 31 | 0.1% |
| Dutch | 245 | 0.8% |
| Eastern European | 369 | 1.2% |
| Ecuadorian | 17 | 0.1% |
| Egyptian | 8 | 0.0% |
| English | 4,075 | 13.7% |
| European | 730 | 2.4% |
| Filipino | 162 | 0.5% |
| Finnish | 94 | 0.3% |
| French | 792 | 2.6% |
| French Canadian | 484 | 1.6% |
| German | 2,794 | 9.4% |
| Ghanaian | 19 | 0.1% |
| Greek | 303 | 1.0% |
| Guatemalan | 47 | 0.2% |
| Guyanese | 22 | 0.1% |
| Haitian | 113 | 0.4% |
| Honduran | 17 | 0.1% |
| Hungarian | 83 | 0.3% |
| Indian (Asian) | 2,556 | 8.6% |
| Iranian | 188 | 0.6% |
| Irish | 5,253 | 17.6% |
| Israeli | 20 | 0.1% |
| Italian | 3,356 | 11.2% |
| Jamaican | 46 | 0.2% |
| Japanese | 33 | 0.1% |
| Jordanian | 9 | 0.0% |
| Kenyan | 20 | 0.1% |
| Korean | 184 | 0.6% |
| Laotian | 43 | 0.1% |
| Latvian | 42 | 0.1% |
| Lebanese | 163 | 0.5% |
| Lithuanian | 144 | 0.5% |
| Maltese | 10 | 0.0% |
| Mexican | 239 | 0.8% |
| Mexican American Indian | 8 | 0.0% |
| Mongolian | 1 | 0.0% |
| Moroccan | 53 | 0.2% |
| Native Hawaiian | 19 | 0.1% |
| New Zealander | 8 | 0.0% |
| Nigerian | 10 | 0.0% |
| Northern European | 92 | 0.3% |
| Norwegian | 389 | 1.3% |
| Okinawan | 1 | 0.0% |
| Pakistani | 16 | 0.1% |
| Palestinian | 19 | 0.1% |
| Panamanian | 32 | 0.1% |
| Peruvian | 29 | 0.1% |
| Polish | 1,031 | 3.5% |
| Portuguese | 212 | 0.7% |
| Pueblo | 5 | 0.0% |
| Puerto Rican | 188 | 0.6% |
| Romanian | 141 | 0.5% |
| Russian | 587 | 2.0% |
| Salvadoran | 10 | 0.0% |
| Scandinavian | 25 | 0.1% |
| Scotch-Irish | 235 | 0.8% |
| Scottish | 839 | 2.8% |
| Seminole | 33 | 0.1% |
| Serbian | 69 | 0.2% |
| Sierra Leonean | 7 | 0.0% |
| Slavic | 10 | 0.0% |
| Slovak | 77 | 0.3% |
| Somali | 25 | 0.1% |
| South African | 56 | 0.2% |
| South American | 351 | 1.2% |
| Spaniard | 331 | 1.1% |
| Spanish | 132 | 0.4% |
| Sri Lankan | 73 | 0.2% |
| Subsaharan African | 249 | 0.8% |
| Swedish | 455 | 1.5% |
| Swiss | 82 | 0.3% |
| Syrian | 10 | 0.0% |
| Thai | 909 | 3.0% |
| Trinidadian and Tobagonian | 37 | 0.1% |
| Turkish | 25 | 0.1% |
| Ukrainian | 255 | 0.9% |
| Venezuelan | 40 | 0.1% |
| Vietnamese | 5 | 0.0% |
| Welsh | 83 | 0.3% |
| West Indian | 11 | 0.0% |
| Zimbabwean | 2 | 0.0% | View All 113 Rows |
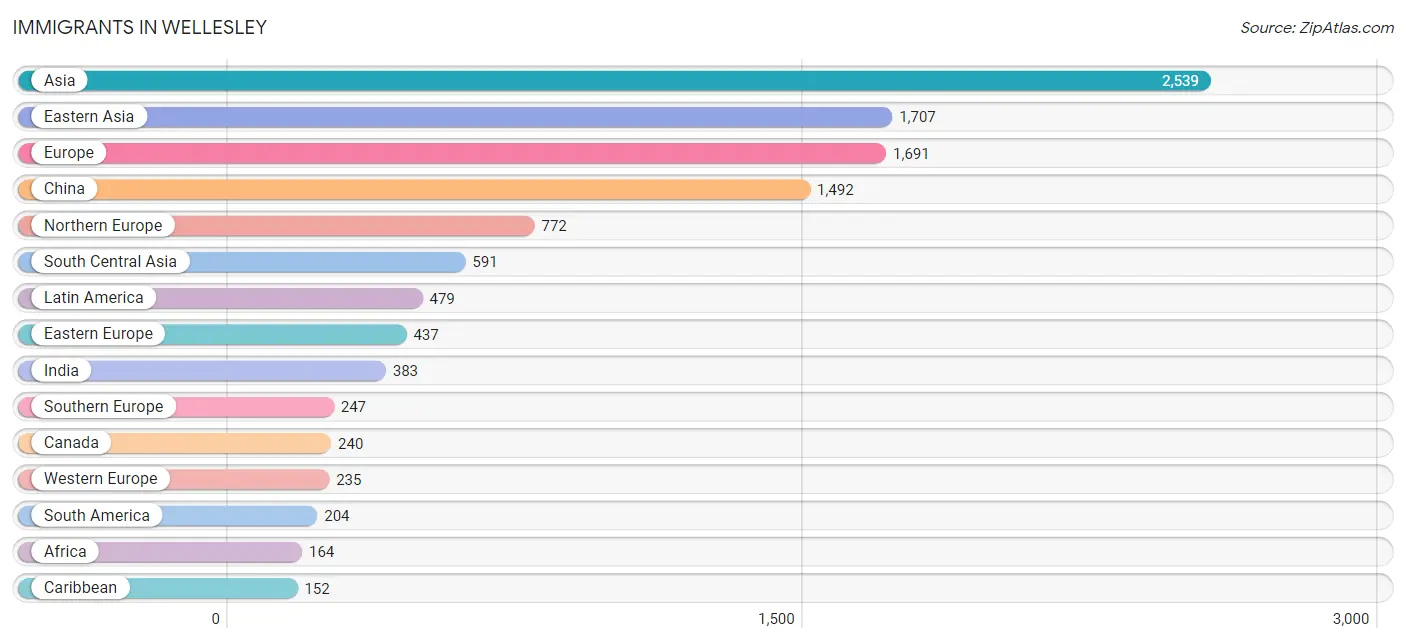
Immigrants in Wellesley
The most numerous immigrant groups reported in Wellesley came from Asia (2,539 | 8.5%), Eastern Asia (1,707 | 5.7%), Europe (1,691 | 5.7%), China (1,492 | 5.0%), and Northern Europe (772 | 2.6%), together accounting for 27.5% of all Wellesley residents.
| Immigration Origin | # Population | % Population |
| Africa | 164 | 0.5% |
| Albania | 20 | 0.1% |
| Argentina | 116 | 0.4% |
| Asia | 2,539 | 8.5% |
| Australia | 60 | 0.2% |
| Austria | 9 | 0.0% |
| Belarus | 10 | 0.0% |
| Belgium | 11 | 0.0% |
| Brazil | 32 | 0.1% |
| Bulgaria | 10 | 0.0% |
| Cambodia | 33 | 0.1% |
| Canada | 240 | 0.8% |
| Caribbean | 152 | 0.5% |
| Central America | 123 | 0.4% |
| China | 1,492 | 5.0% |
| Colombia | 16 | 0.1% |
| Cuba | 19 | 0.1% |
| Czechoslovakia | 21 | 0.1% |
| Denmark | 53 | 0.2% |
| Eastern Africa | 22 | 0.1% |
| Eastern Asia | 1,707 | 5.7% |
| Eastern Europe | 437 | 1.5% |
| Ecuador | 24 | 0.1% |
| Egypt | 8 | 0.0% |
| El Salvador | 65 | 0.2% |
| England | 81 | 0.3% |
| Europe | 1,691 | 5.7% |
| France | 41 | 0.1% |
| Germany | 124 | 0.4% |
| Ghana | 31 | 0.1% |
| Greece | 54 | 0.2% |
| Guatemala | 38 | 0.1% |
| Haiti | 122 | 0.4% |
| Honduras | 9 | 0.0% |
| Hong Kong | 132 | 0.4% |
| India | 383 | 1.3% |
| Indonesia | 6 | 0.0% |
| Iran | 70 | 0.2% |
| Ireland | 111 | 0.4% |
| Israel | 20 | 0.1% |
| Italy | 30 | 0.1% |
| Japan | 67 | 0.2% |
| Jordan | 9 | 0.0% |
| Kenya | 20 | 0.1% |
| Korea | 148 | 0.5% |
| Kuwait | 7 | 0.0% |
| Latin America | 479 | 1.6% |
| Lebanon | 29 | 0.1% |
| Lithuania | 10 | 0.0% |
| Malaysia | 31 | 0.1% |
| Mexico | 11 | 0.0% |
| Moldova | 57 | 0.2% |
| Morocco | 53 | 0.2% |
| Nepal | 5 | 0.0% |
| Netherlands | 8 | 0.0% |
| Northern Africa | 61 | 0.2% |
| Northern Europe | 772 | 2.6% |
| Oceania | 85 | 0.3% |
| Pakistan | 85 | 0.3% |
| Peru | 6 | 0.0% |
| Philippines | 38 | 0.1% |
| Poland | 95 | 0.3% |
| Portugal | 43 | 0.1% |
| Romania | 56 | 0.2% |
| Russia | 120 | 0.4% |
| Scotland | 7 | 0.0% |
| Singapore | 7 | 0.0% |
| South Africa | 50 | 0.2% |
| South America | 204 | 0.7% |
| South Central Asia | 591 | 2.0% |
| South Eastern Asia | 147 | 0.5% |
| Southern Europe | 247 | 0.8% |
| Spain | 120 | 0.4% |
| Sri Lanka | 48 | 0.2% |
| Sweden | 21 | 0.1% |
| Switzerland | 42 | 0.1% |
| Taiwan | 27 | 0.1% |
| Trinidad and Tobago | 11 | 0.0% |
| Turkey | 13 | 0.0% |
| Ukraine | 21 | 0.1% |
| Venezuela | 10 | 0.0% |
| Vietnam | 32 | 0.1% |
| Western Africa | 31 | 0.1% |
| Western Asia | 78 | 0.3% |
| Western Europe | 235 | 0.8% |
| Zimbabwe | 2 | 0.0% | View All 86 Rows |
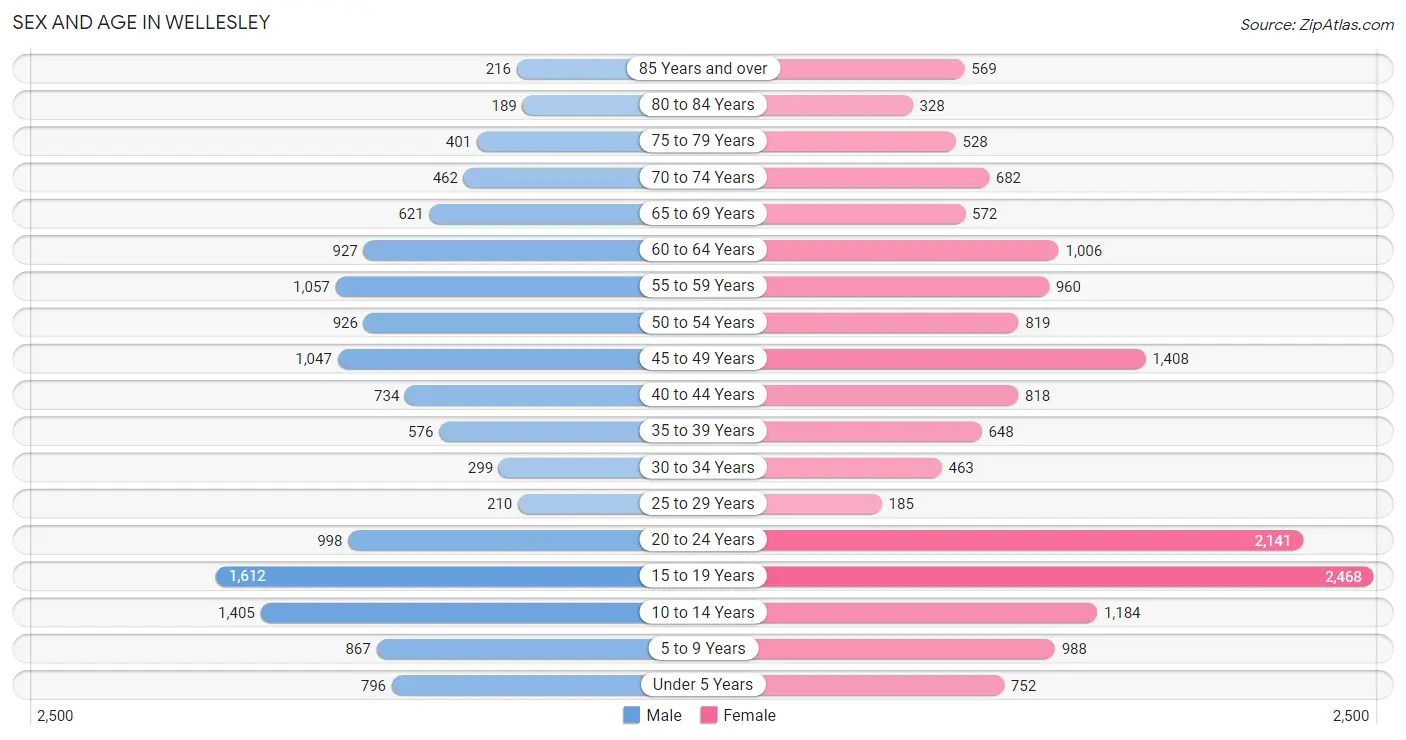
Sex and Age in Wellesley
Sex and Age in Wellesley
The most populous age groups in Wellesley are 15 to 19 Years (1,612 | 12.1%) for men and 15 to 19 Years (2,468 | 14.9%) for women.
| Age Bracket | Male | Female |
| Under 5 Years | 796 (6.0%) | 752 (4.5%) |
| 5 to 9 Years | 867 (6.5%) | 988 (6.0%) |
| 10 to 14 Years | 1,405 (10.5%) | 1,184 (7.2%) |
| 15 to 19 Years | 1,612 (12.1%) | 2,468 (14.9%) |
| 20 to 24 Years | 998 (7.5%) | 2,141 (13.0%) |
| 25 to 29 Years | 210 (1.6%) | 185 (1.1%) |
| 30 to 34 Years | 299 (2.2%) | 463 (2.8%) |
| 35 to 39 Years | 576 (4.3%) | 648 (3.9%) |
| 40 to 44 Years | 734 (5.5%) | 818 (5.0%) |
| 45 to 49 Years | 1,047 (7.9%) | 1,408 (8.5%) |
| 50 to 54 Years | 926 (6.9%) | 819 (5.0%) |
| 55 to 59 Years | 1,057 (7.9%) | 960 (5.8%) |
| 60 to 64 Years | 927 (7.0%) | 1,006 (6.1%) |
| 65 to 69 Years | 621 (4.6%) | 572 (3.5%) |
| 70 to 74 Years | 462 (3.5%) | 682 (4.1%) |
| 75 to 79 Years | 401 (3.0%) | 528 (3.2%) |
| 80 to 84 Years | 189 (1.4%) | 328 (2.0%) |
| 85 Years and over | 216 (1.6%) | 569 (3.4%) |
| Total | 13,343 (100.0%) | 16,519 (100.0%) |
Families and Households in Wellesley
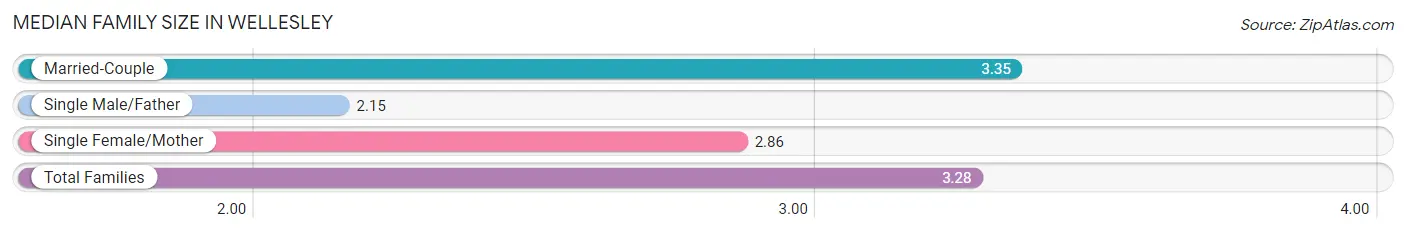
Median Family Size in Wellesley
The median family size in Wellesley is 3.28 persons per family, with married-couple families (6,263 | 89.2%) accounting for the largest median family size of 3.35 persons per family. On the other hand, single male/father families (210 | 3.0%) represent the smallest median family size with 2.15 persons per family.
| Family Type | # Families | Family Size |
| Married-Couple | 6,263 (89.2%) | 3.35 |
| Single Male/Father | 210 (3.0%) | 2.15 |
| Single Female/Mother | 546 (7.8%) | 2.86 |
| Total Families | 7,019 (100.0%) | 3.28 |
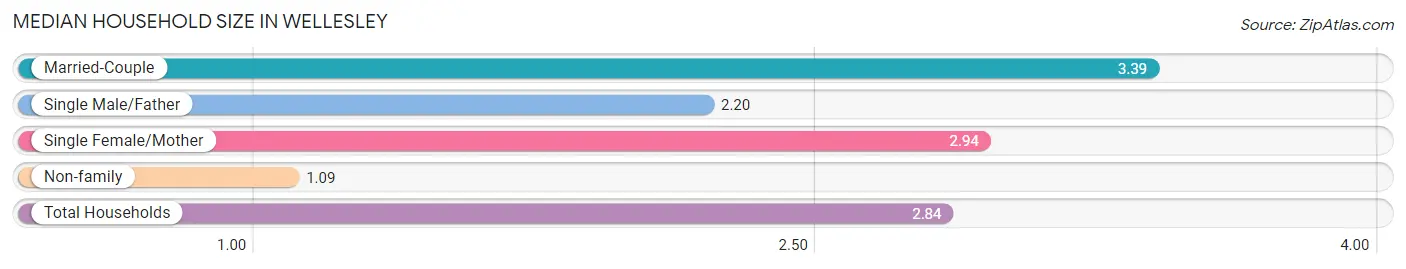
Median Household Size in Wellesley
The median household size in Wellesley is 2.84 persons per household, with married-couple households (6,263 | 69.9%) accounting for the largest median household size of 3.39 persons per household. non-family households (1,937 | 21.6%) represent the smallest median household size with 1.09 persons per household.
| Household Type | # Households | Household Size |
| Married-Couple | 6,263 (69.9%) | 3.39 |
| Single Male/Father | 210 (2.3%) | 2.20 |
| Single Female/Mother | 546 (6.1%) | 2.94 |
| Non-family | 1,937 (21.6%) | 1.09 |
| Total Households | 8,956 (100.0%) | 2.84 |
Household Size by Marriage Status in Wellesley
Out of a total of 8,956 households in Wellesley, 7,019 (78.4%) are family households, while 1,937 (21.6%) are nonfamily households. The most numerous type of family households are 2-person households, comprising 2,635, and the most common type of nonfamily households are 1-person households, comprising 1,777.
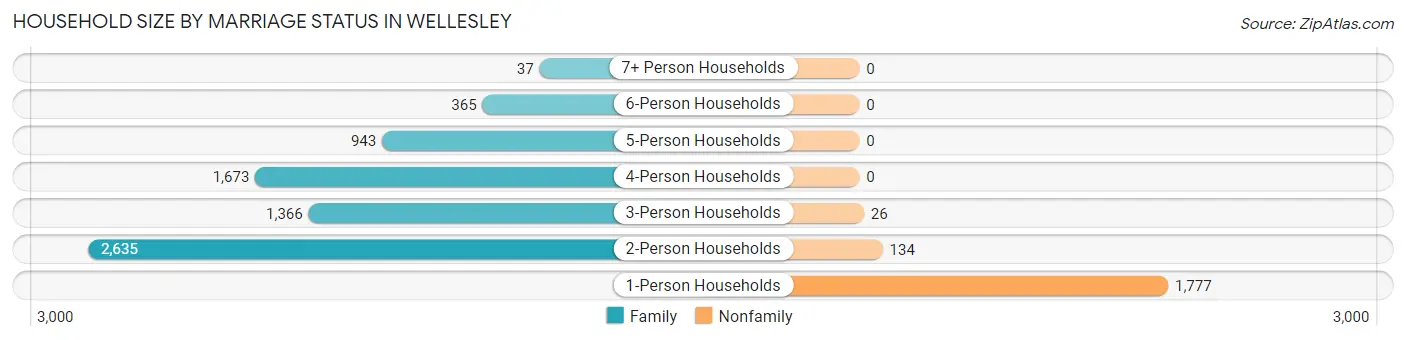
| Household Size | Family Households | Nonfamily Households |
| 1-Person Households | - | 1,777 (19.8%) |
| 2-Person Households | 2,635 (29.4%) | 134 (1.5%) |
| 3-Person Households | 1,366 (15.2%) | 26 (0.3%) |
| 4-Person Households | 1,673 (18.7%) | 0 (0.0%) |
| 5-Person Households | 943 (10.5%) | 0 (0.0%) |
| 6-Person Households | 365 (4.1%) | 0 (0.0%) |
| 7+ Person Households | 37 (0.4%) | 0 (0.0%) |
| Total | 7,019 (78.4%) | 1,937 (21.6%) |
Female Fertility in Wellesley
Fertility by Age in Wellesley
Average fertility rate in Wellesley is 41.0 births per 1,000 women. Women in the age bracket of 35 to 50 years have the highest fertility rate with 79.0 births per 1,000 women. Women in the age bracket of 35 to 50 years acount for 70.6% of all women with births.
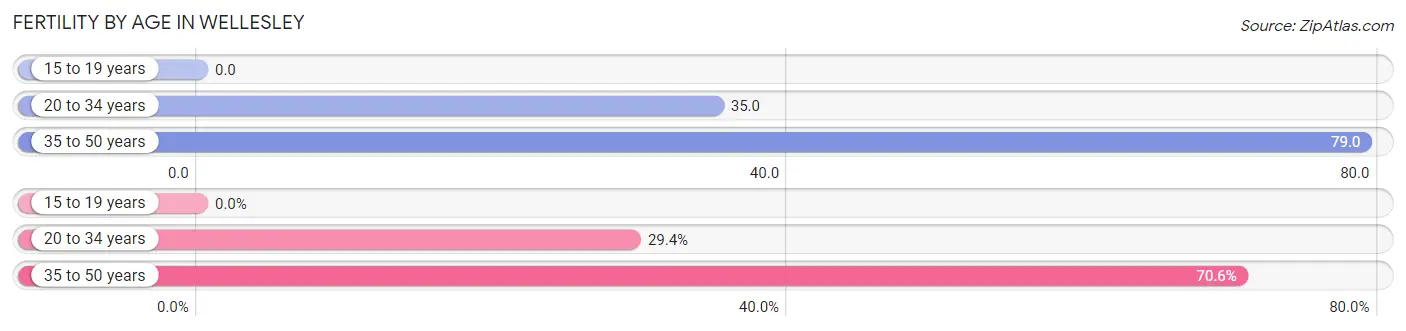
| Age Bracket | Women with Births | Births / 1,000 Women |
| 15 to 19 years | 0 (0.0%) | 0.0 |
| 20 to 34 years | 99 (29.4%) | 35.0 |
| 35 to 50 years | 238 (70.6%) | 79.0 |
| Total | 337 (100.0%) | 41.0 |
Fertility by Age by Marriage Status in Wellesley
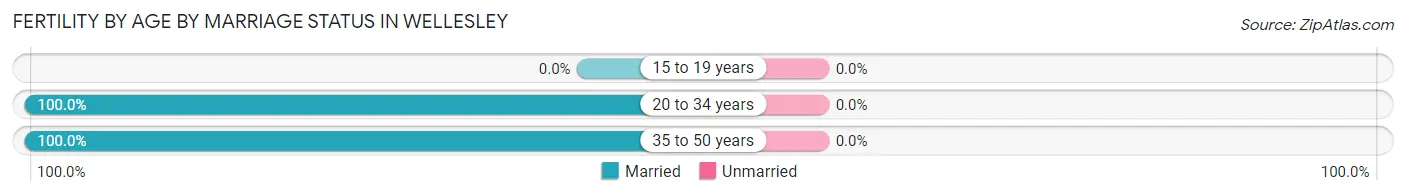
| Age Bracket | Married | Unmarried |
| 15 to 19 years | 0 (0.0%) | 0 (0.0%) |
| 20 to 34 years | 99 (100.0%) | 0 (0.0%) |
| 35 to 50 years | 238 (100.0%) | 0 (0.0%) |
| Total | 337 (100.0%) | 0 (0.0%) |
Fertility by Education in Wellesley
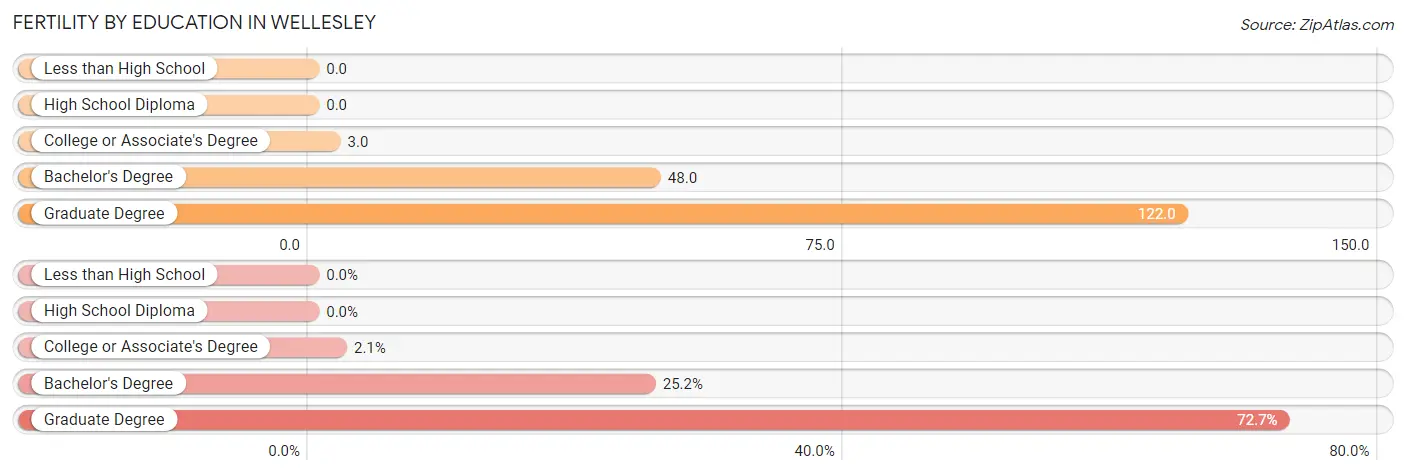
| Educational Attainment | Women with Births | Births / 1,000 Women |
| Less than High School | 0 (0.0%) | 0.0 |
| High School Diploma | 0 (0.0%) | 0.0 |
| College or Associate's Degree | 7 (2.1%) | 3.0 |
| Bachelor's Degree | 85 (25.2%) | 48.0 |
| Graduate Degree | 245 (72.7%) | 122.0 |
| Total | 337 (100.0%) | 41.0 |
Fertility by Education by Marriage Status in Wellesley
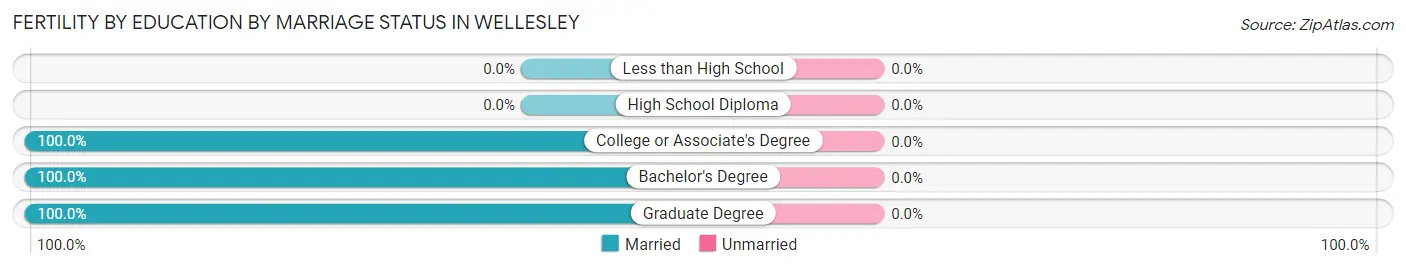
| Educational Attainment | Married | Unmarried |
| Less than High School | 0 (0.0%) | 0 (0.0%) |
| High School Diploma | 0 (0.0%) | 0 (0.0%) |
| College or Associate's Degree | 7 (100.0%) | 0 (0.0%) |
| Bachelor's Degree | 85 (100.0%) | 0 (0.0%) |
| Graduate Degree | 245 (100.0%) | 0 (0.0%) |
| Total | 337 (100.0%) | 0 (0.0%) |
Employment Characteristics in Wellesley
Employment by Class of Employer in Wellesley
Among the 12,650 employed individuals in Wellesley, private company employees (8,166 | 64.5%), not-for-profit organizations (2,319 | 18.3%), and self-employed (not incorporated) (725 | 5.7%) make up the most common classes of employment.
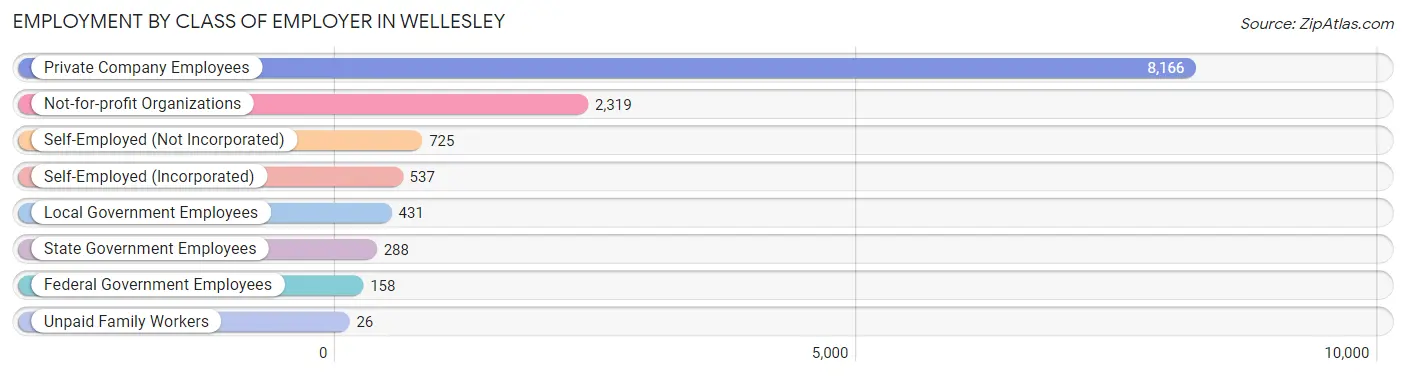
| Employer Class | # Employees | % Employees |
| Private Company Employees | 8,166 | 64.5% |
| Self-Employed (Incorporated) | 537 | 4.3% |
| Self-Employed (Not Incorporated) | 725 | 5.7% |
| Not-for-profit Organizations | 2,319 | 18.3% |
| Local Government Employees | 431 | 3.4% |
| State Government Employees | 288 | 2.3% |
| Federal Government Employees | 158 | 1.3% |
| Unpaid Family Workers | 26 | 0.2% |
| Total | 12,650 | 100.0% |
Employment Status by Age in Wellesley
According to the labor force statistics for Wellesley, out of the total population over 16 years of age (23,437), 57.0% or 13,359 individuals are in the labor force, with 4.0% or 534 of them unemployed. The age group with the highest labor force participation rate is 30 to 34 years, with 90.3% or 688 individuals in the labor force. Within the labor force, the 65 to 74 years age range has the highest percentage of unemployed individuals, with 9.8% or 96 of them being unemployed.
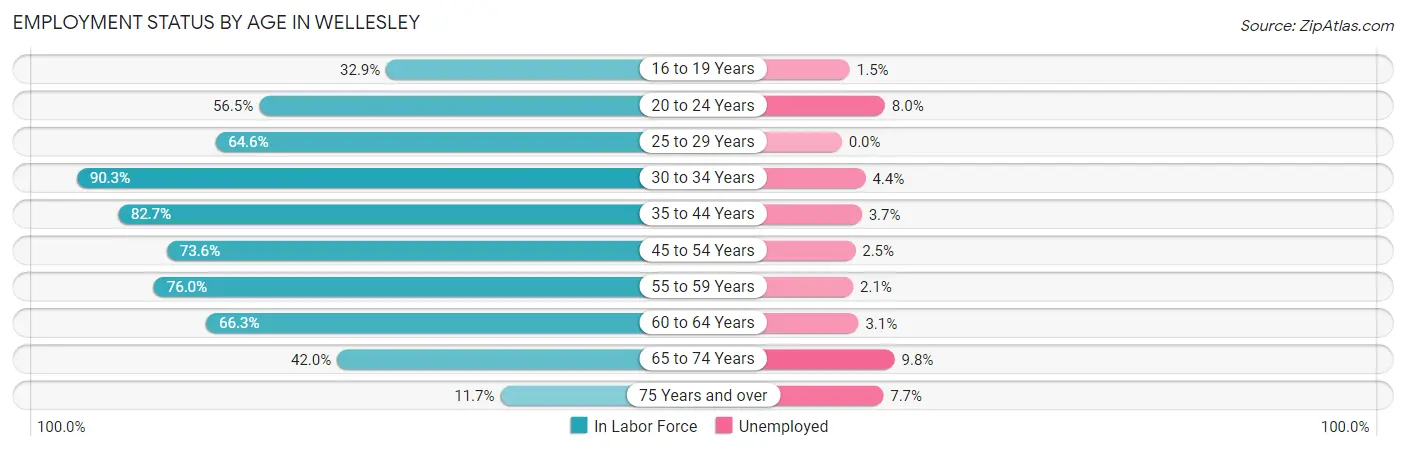
| Age Bracket | In Labor Force | Unemployed |
| 16 to 19 Years | 1,200 (32.9%) | 18 (1.5%) |
| 20 to 24 Years | 1,774 (56.5%) | 142 (8.0%) |
| 25 to 29 Years | 255 (64.6%) | 0 (0.0%) |
| 30 to 34 Years | 688 (90.3%) | 30 (4.4%) |
| 35 to 44 Years | 2,296 (82.7%) | 85 (3.7%) |
| 45 to 54 Years | 3,091 (73.6%) | 77 (2.5%) |
| 55 to 59 Years | 1,533 (76.0%) | 32 (2.1%) |
| 60 to 64 Years | 1,282 (66.3%) | 40 (3.1%) |
| 65 to 74 Years | 982 (42.0%) | 96 (9.8%) |
| 75 Years and over | 261 (11.7%) | 20 (7.7%) |
| Total | 13,359 (57.0%) | 534 (4.0%) |
Employment Status by Educational Attainment in Wellesley
According to labor force statistics for Wellesley, 75.7% of individuals (9,147) out of the total population between 25 and 64 years of age (12,083) are in the labor force, with 2.9% or 265 of them being unemployed. The group with the highest labor force participation rate are those with the educational attainment of bachelor's degree or higher, with 79.3% or 8,640 individuals in the labor force. Within the labor force, individuals with less than high school education have the highest percentage of unemployment, with 16.4% or 9 of them being unemployed.
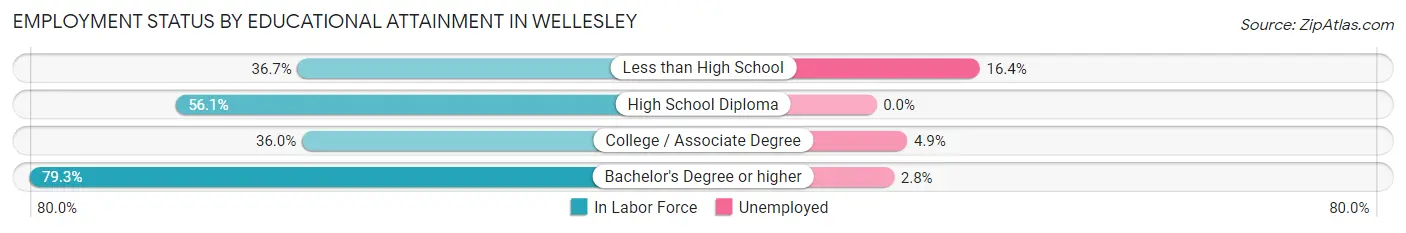
| Educational Attainment | In Labor Force | Unemployed |
| Less than High School | 55 (36.7%) | 25 (16.4%) |
| High School Diploma | 199 (56.1%) | 0 (0.0%) |
| College / Associate Degree | 246 (36.0%) | 33 (4.9%) |
| Bachelor's Degree or higher | 8,640 (79.3%) | 305 (2.8%) |
| Total | 9,147 (75.7%) | 350 (2.9%) |
Employment Occupations by Sex in Wellesley
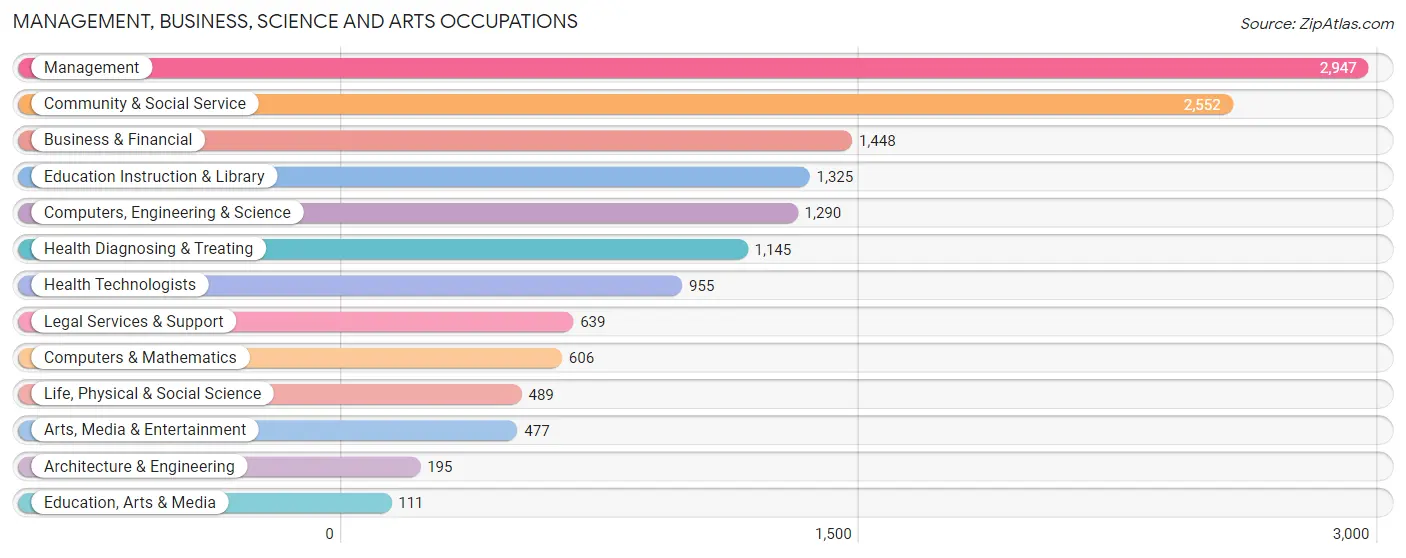
Management, Business, Science and Arts Occupations
The most common Management, Business, Science and Arts occupations in Wellesley are Management (2,947 | 23.0%), Community & Social Service (2,552 | 19.9%), Business & Financial (1,448 | 11.3%), Education Instruction & Library (1,325 | 10.3%), and Computers, Engineering & Science (1,290 | 10.1%).
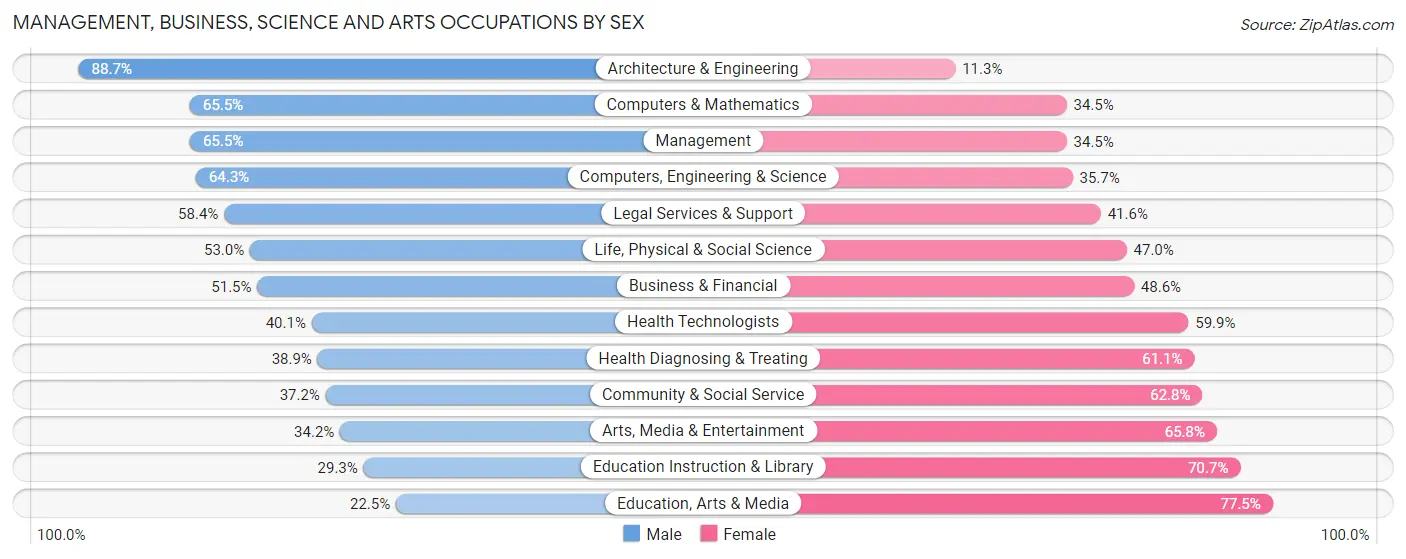
Management, Business, Science and Arts Occupations by Sex
Within the Management, Business, Science and Arts occupations in Wellesley, the most male-oriented occupations are Architecture & Engineering (88.7%), Computers & Mathematics (65.5%), and Management (65.5%), while the most female-oriented occupations are Education, Arts & Media (77.5%), Education Instruction & Library (70.7%), and Arts, Media & Entertainment (65.8%).
| Occupation | Male | Female |
| Management | 1,930 (65.5%) | 1,017 (34.5%) |
| Business & Financial | 745 (51.4%) | 703 (48.5%) |
| Computers, Engineering & Science | 829 (64.3%) | 461 (35.7%) |
| Computers & Mathematics | 397 (65.5%) | 209 (34.5%) |
| Architecture & Engineering | 173 (88.7%) | 22 (11.3%) |
| Life, Physical & Social Science | 259 (53.0%) | 230 (47.0%) |
| Community & Social Service | 949 (37.2%) | 1,603 (62.8%) |
| Education, Arts & Media | 25 (22.5%) | 86 (77.5%) |
| Legal Services & Support | 373 (58.4%) | 266 (41.6%) |
| Education Instruction & Library | 388 (29.3%) | 937 (70.7%) |
| Arts, Media & Entertainment | 163 (34.2%) | 314 (65.8%) |
| Health Diagnosing & Treating | 445 (38.9%) | 700 (61.1%) |
| Health Technologists | 383 (40.1%) | 572 (59.9%) |
| Total (Category) | 4,898 (52.2%) | 4,484 (47.8%) |
| Total (Overall) | 6,500 (50.7%) | 6,321 (49.3%) |
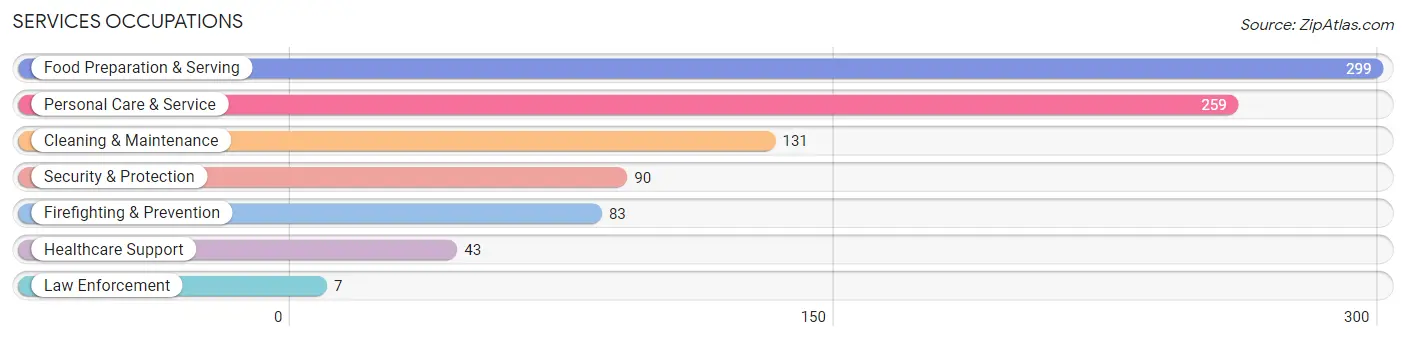
Services Occupations
The most common Services occupations in Wellesley are Food Preparation & Serving (299 | 2.3%), Personal Care & Service (259 | 2.0%), Cleaning & Maintenance (131 | 1.0%), Security & Protection (90 | 0.7%), and Firefighting & Prevention (83 | 0.6%).
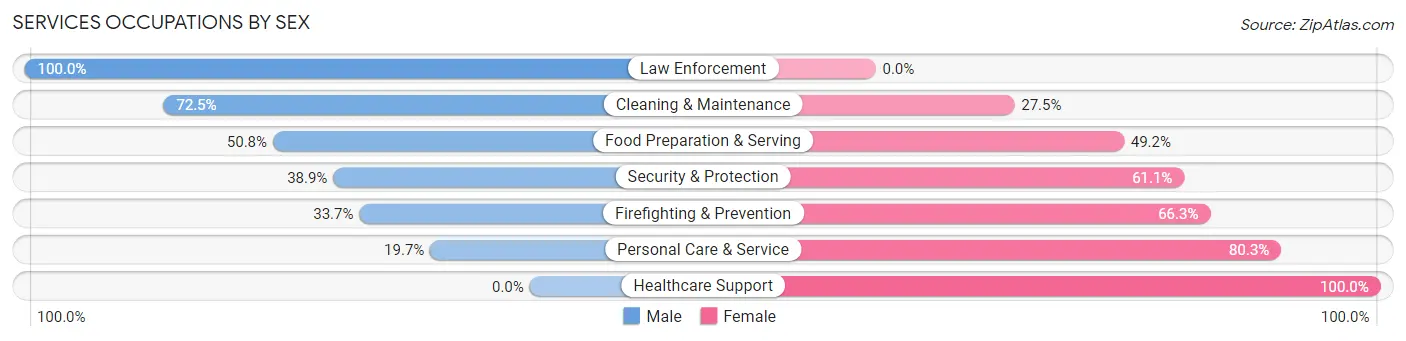
Services Occupations by Sex
Within the Services occupations in Wellesley, the most male-oriented occupations are Law Enforcement (100.0%), Cleaning & Maintenance (72.5%), and Food Preparation & Serving (50.8%), while the most female-oriented occupations are Healthcare Support (100.0%), Personal Care & Service (80.3%), and Firefighting & Prevention (66.3%).
| Occupation | Male | Female |
| Healthcare Support | 0 (0.0%) | 43 (100.0%) |
| Security & Protection | 35 (38.9%) | 55 (61.1%) |
| Firefighting & Prevention | 28 (33.7%) | 55 (66.3%) |
| Law Enforcement | 7 (100.0%) | 0 (0.0%) |
| Food Preparation & Serving | 152 (50.8%) | 147 (49.2%) |
| Cleaning & Maintenance | 95 (72.5%) | 36 (27.5%) |
| Personal Care & Service | 51 (19.7%) | 208 (80.3%) |
| Total (Category) | 333 (40.5%) | 489 (59.5%) |
| Total (Overall) | 6,500 (50.7%) | 6,321 (49.3%) |
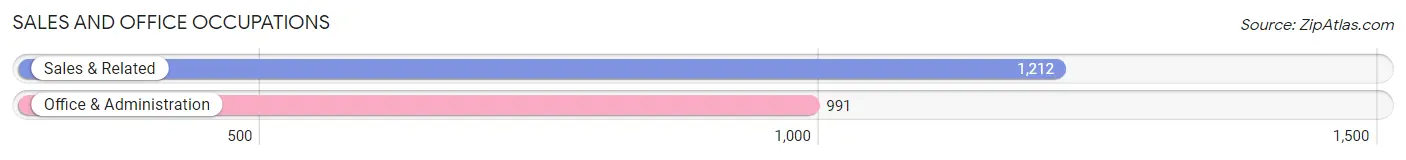
Sales and Office Occupations
The most common Sales and Office occupations in Wellesley are Sales & Related (1,212 | 9.5%), and Office & Administration (991 | 7.7%).
Sales and Office Occupations by Sex
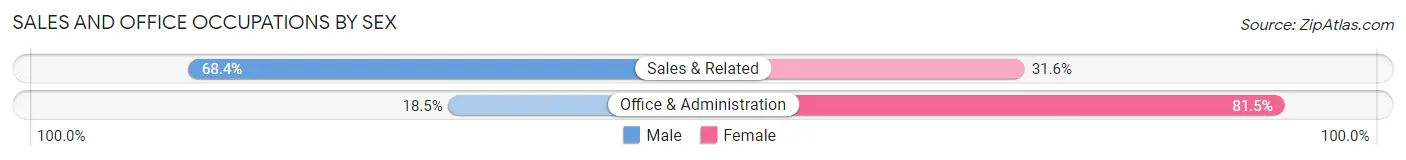
| Occupation | Male | Female |
| Sales & Related | 829 (68.4%) | 383 (31.6%) |
| Office & Administration | 183 (18.5%) | 808 (81.5%) |
| Total (Category) | 1,012 (45.9%) | 1,191 (54.1%) |
| Total (Overall) | 6,500 (50.7%) | 6,321 (49.3%) |
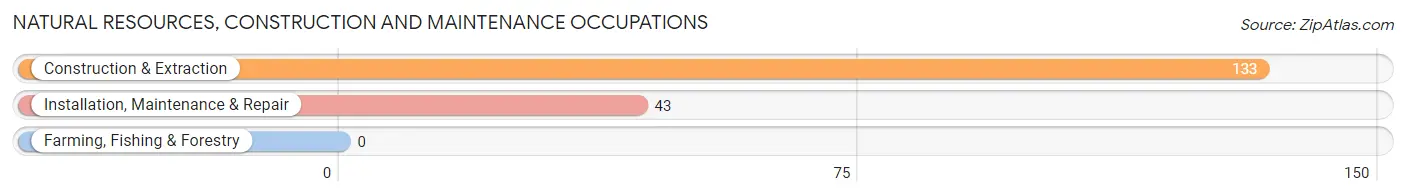
Natural Resources, Construction and Maintenance Occupations
The most common Natural Resources, Construction and Maintenance occupations in Wellesley are Construction & Extraction (133 | 1.0%), and Installation, Maintenance & Repair (43 | 0.3%).
Natural Resources, Construction and Maintenance Occupations by Sex
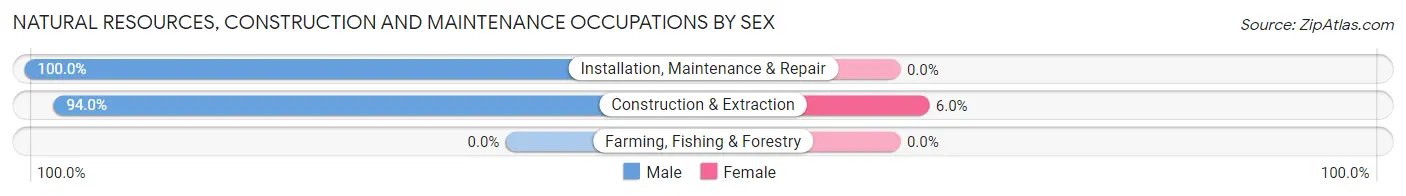
| Occupation | Male | Female |
| Farming, Fishing & Forestry | 0 (0.0%) | 0 (0.0%) |
| Construction & Extraction | 125 (94.0%) | 8 (6.0%) |
| Installation, Maintenance & Repair | 43 (100.0%) | 0 (0.0%) |
| Total (Category) | 168 (95.5%) | 8 (4.5%) |
| Total (Overall) | 6,500 (50.7%) | 6,321 (49.3%) |
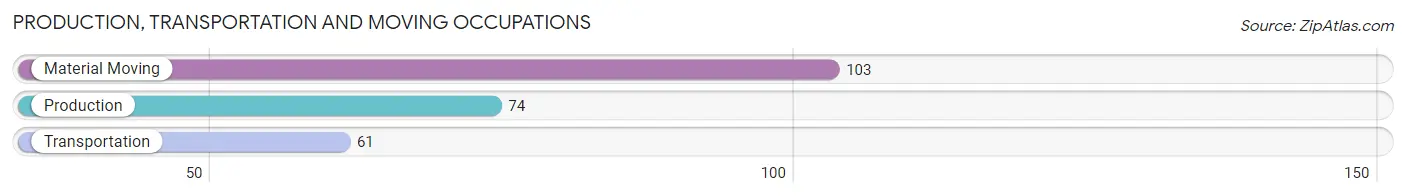
Production, Transportation and Moving Occupations
The most common Production, Transportation and Moving occupations in Wellesley are Material Moving (103 | 0.8%), Production (74 | 0.6%), and Transportation (61 | 0.5%).
Production, Transportation and Moving Occupations by Sex
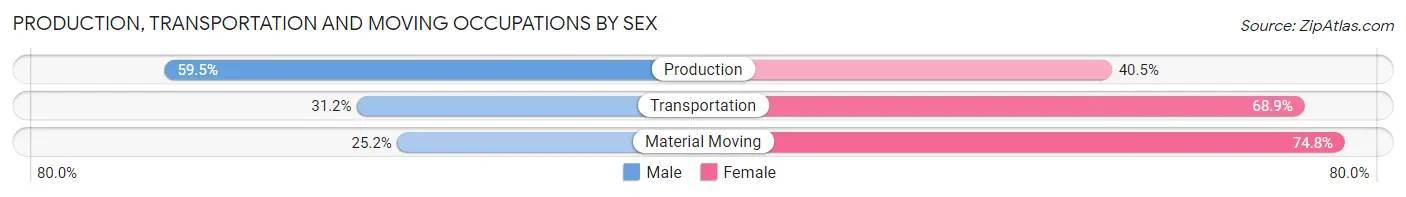
| Occupation | Male | Female |
| Production | 44 (59.5%) | 30 (40.5%) |
| Transportation | 19 (31.1%) | 42 (68.9%) |
| Material Moving | 26 (25.2%) | 77 (74.8%) |
| Total (Category) | 89 (37.4%) | 149 (62.6%) |
| Total (Overall) | 6,500 (50.7%) | 6,321 (49.3%) |
Employment Industries by Sex in Wellesley
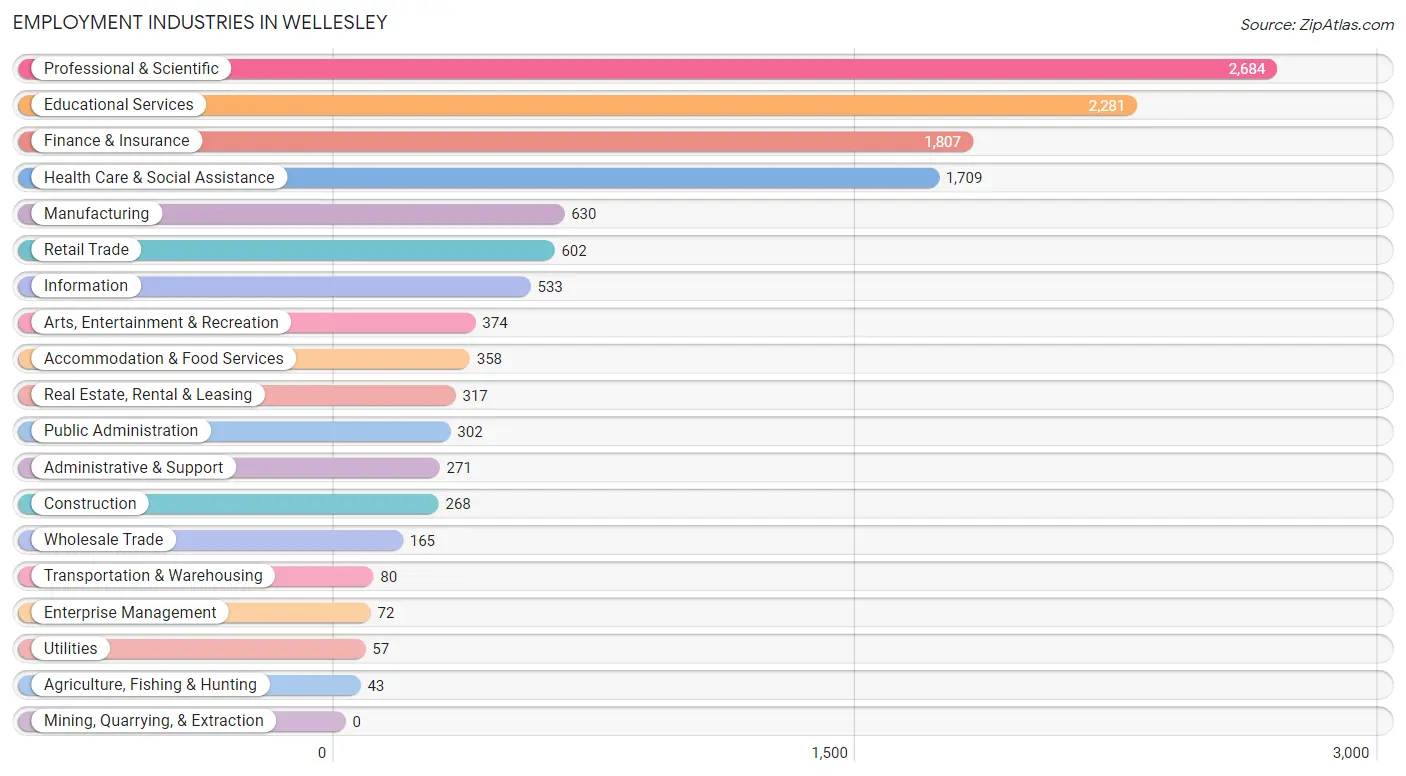
Employment Industries in Wellesley
The major employment industries in Wellesley include Professional & Scientific (2,684 | 20.9%), Educational Services (2,281 | 17.8%), Finance & Insurance (1,807 | 14.1%), Health Care & Social Assistance (1,709 | 13.3%), and Manufacturing (630 | 4.9%).
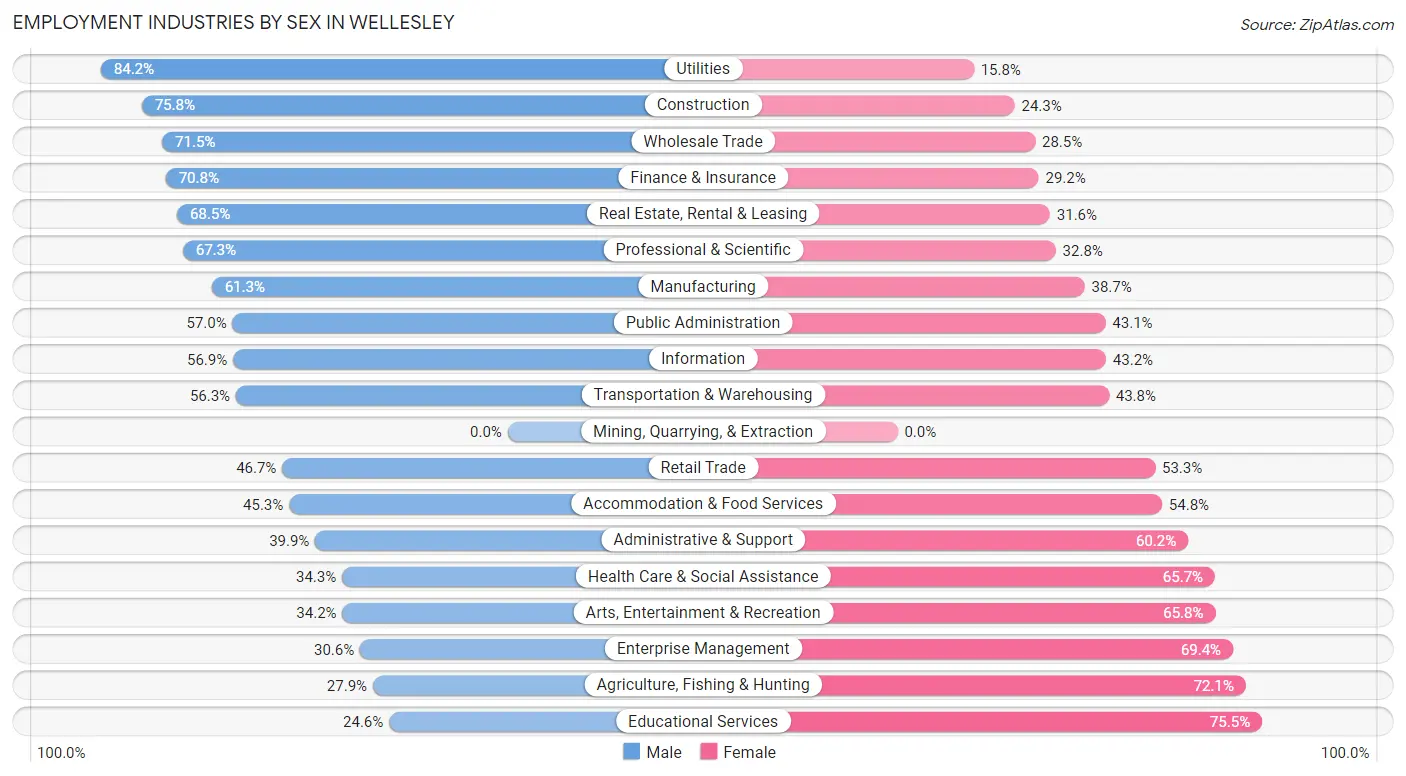
Employment Industries by Sex in Wellesley
The Wellesley industries that see more men than women are Utilities (84.2%), Construction (75.7%), and Wholesale Trade (71.5%), whereas the industries that tend to have a higher number of women are Educational Services (75.4%), Agriculture, Fishing & Hunting (72.1%), and Enterprise Management (69.4%).
| Industry | Male | Female |
| Agriculture, Fishing & Hunting | 12 (27.9%) | 31 (72.1%) |
| Mining, Quarrying, & Extraction | 0 (0.0%) | 0 (0.0%) |
| Construction | 203 (75.7%) | 65 (24.2%) |
| Manufacturing | 386 (61.3%) | 244 (38.7%) |
| Wholesale Trade | 118 (71.5%) | 47 (28.5%) |
| Retail Trade | 281 (46.7%) | 321 (53.3%) |
| Transportation & Warehousing | 45 (56.2%) | 35 (43.8%) |
| Utilities | 48 (84.2%) | 9 (15.8%) |
| Information | 303 (56.9%) | 230 (43.1%) |
| Finance & Insurance | 1,279 (70.8%) | 528 (29.2%) |
| Real Estate, Rental & Leasing | 217 (68.4%) | 100 (31.6%) |
| Professional & Scientific | 1,805 (67.2%) | 879 (32.8%) |
| Enterprise Management | 22 (30.6%) | 50 (69.4%) |
| Administrative & Support | 108 (39.9%) | 163 (60.2%) |
| Educational Services | 560 (24.5%) | 1,721 (75.4%) |
| Health Care & Social Assistance | 586 (34.3%) | 1,123 (65.7%) |
| Arts, Entertainment & Recreation | 128 (34.2%) | 246 (65.8%) |
| Accommodation & Food Services | 162 (45.3%) | 196 (54.7%) |
| Public Administration | 172 (57.0%) | 130 (43.0%) |
| Total | 6,500 (50.7%) | 6,321 (49.3%) |
Education in Wellesley
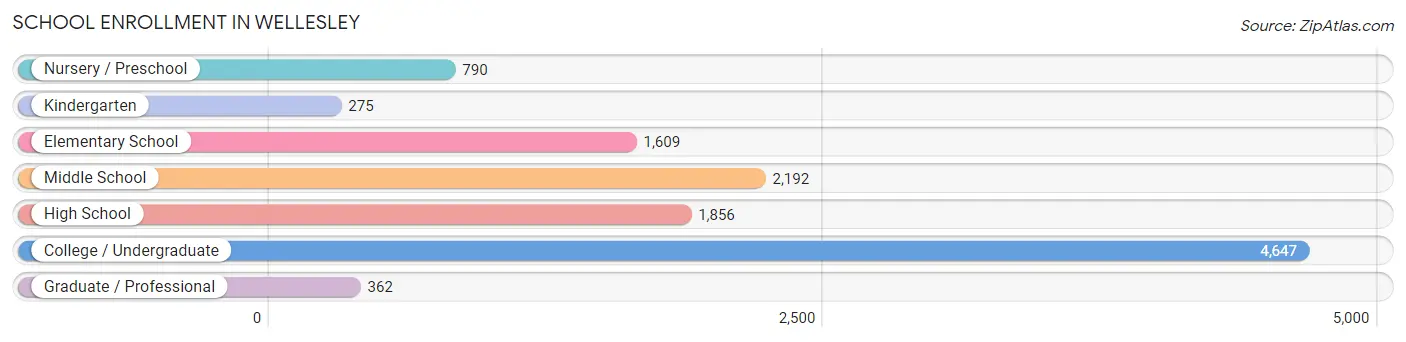
School Enrollment in Wellesley
The most common levels of schooling among the 11,731 students in Wellesley are college / undergraduate (4,647 | 39.6%), middle school (2,192 | 18.7%), and high school (1,856 | 15.8%).
| School Level | # Students | % Students |
| Nursery / Preschool | 790 | 6.7% |
| Kindergarten | 275 | 2.3% |
| Elementary School | 1,609 | 13.7% |
| Middle School | 2,192 | 18.7% |
| High School | 1,856 | 15.8% |
| College / Undergraduate | 4,647 | 39.6% |
| Graduate / Professional | 362 | 3.1% |
| Total | 11,731 | 100.0% |
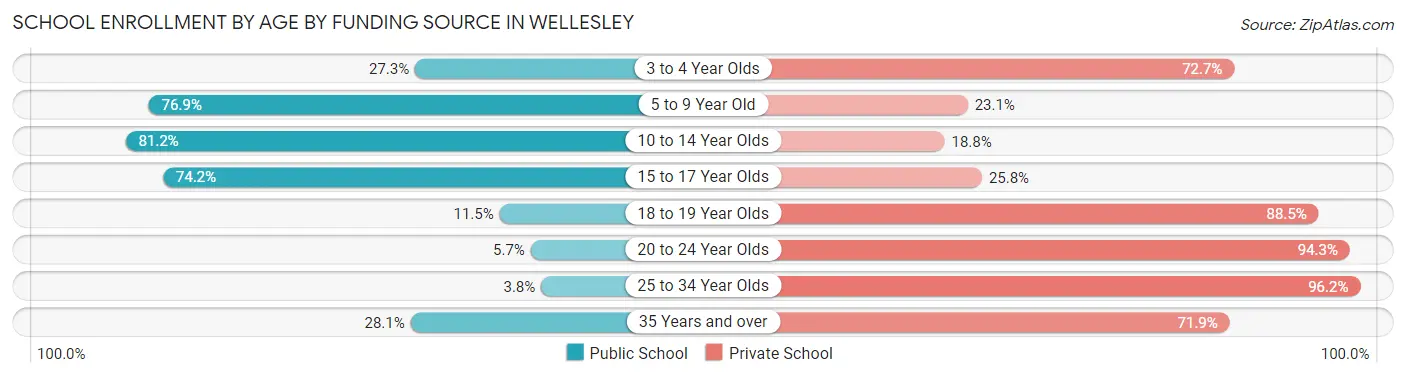
School Enrollment by Age by Funding Source in Wellesley
Out of a total of 11,731 students who are enrolled in schools in Wellesley, 6,522 (55.6%) attend a private institution, while the remaining 5,209 (44.4%) are enrolled in public schools. The age group of 25 to 34 year olds has the highest likelihood of being enrolled in private schools, with 127 (96.2% in the age bracket) enrolled. Conversely, the age group of 10 to 14 year olds has the lowest likelihood of being enrolled in a private school, with 2,018 (81.2% in the age bracket) attending a public institution.
| Age Bracket | Public School | Private School |
| 3 to 4 Year Olds | 186 (27.3%) | 496 (72.7%) |
| 5 to 9 Year Old | 1,385 (76.9%) | 416 (23.1%) |
| 10 to 14 Year Olds | 2,018 (81.2%) | 467 (18.8%) |
| 15 to 17 Year Olds | 1,124 (74.2%) | 390 (25.8%) |
| 18 to 19 Year Olds | 281 (11.5%) | 2,156 (88.5%) |
| 20 to 24 Year Olds | 141 (5.7%) | 2,315 (94.3%) |
| 25 to 34 Year Olds | 5 (3.8%) | 127 (96.2%) |
| 35 Years and over | 63 (28.1%) | 161 (71.9%) |
| Total | 5,209 (44.4%) | 6,522 (55.6%) |
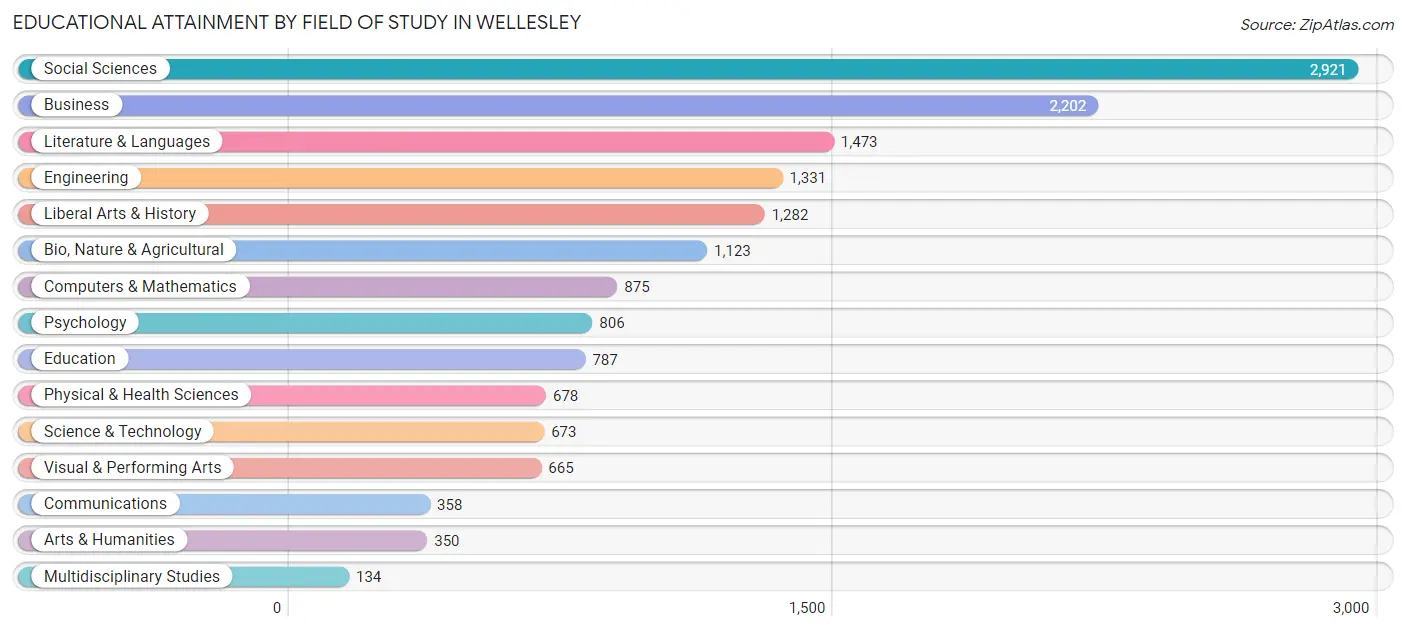
Educational Attainment by Field of Study in Wellesley
Social sciences (2,921 | 18.7%), business (2,202 | 14.1%), literature & languages (1,473 | 9.4%), engineering (1,331 | 8.5%), and liberal arts & history (1,282 | 8.2%) are the most common fields of study among 15,658 individuals in Wellesley who have obtained a bachelor's degree or higher.
| Field of Study | # Graduates | % Graduates |
| Computers & Mathematics | 875 | 5.6% |
| Bio, Nature & Agricultural | 1,123 | 7.2% |
| Physical & Health Sciences | 678 | 4.3% |
| Psychology | 806 | 5.1% |
| Social Sciences | 2,921 | 18.7% |
| Engineering | 1,331 | 8.5% |
| Multidisciplinary Studies | 134 | 0.9% |
| Science & Technology | 673 | 4.3% |
| Business | 2,202 | 14.1% |
| Education | 787 | 5.0% |
| Literature & Languages | 1,473 | 9.4% |
| Liberal Arts & History | 1,282 | 8.2% |
| Visual & Performing Arts | 665 | 4.3% |
| Communications | 358 | 2.3% |
| Arts & Humanities | 350 | 2.2% |
| Total | 15,658 | 100.0% |
Transportation & Commute in Wellesley
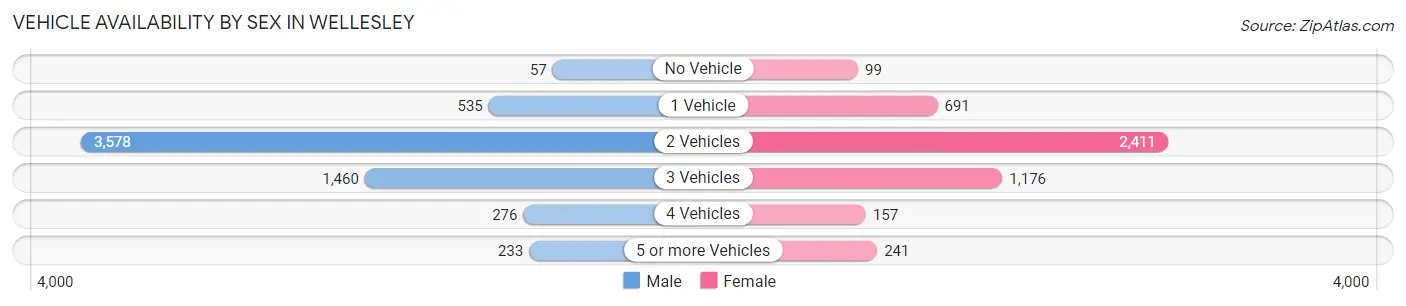
Vehicle Availability by Sex in Wellesley
The most prevalent vehicle ownership categories in Wellesley are males with 2 vehicles (3,578, accounting for 58.3%) and females with 2 vehicles (2,411, making up 74.9%).
| Vehicles Available | Male | Female |
| No Vehicle | 57 (0.9%) | 99 (2.1%) |
| 1 Vehicle | 535 (8.7%) | 691 (14.5%) |
| 2 Vehicles | 3,578 (58.3%) | 2,411 (50.5%) |
| 3 Vehicles | 1,460 (23.8%) | 1,176 (24.6%) |
| 4 Vehicles | 276 (4.5%) | 157 (3.3%) |
| 5 or more Vehicles | 233 (3.8%) | 241 (5.1%) |
| Total | 6,139 (100.0%) | 4,775 (100.0%) |
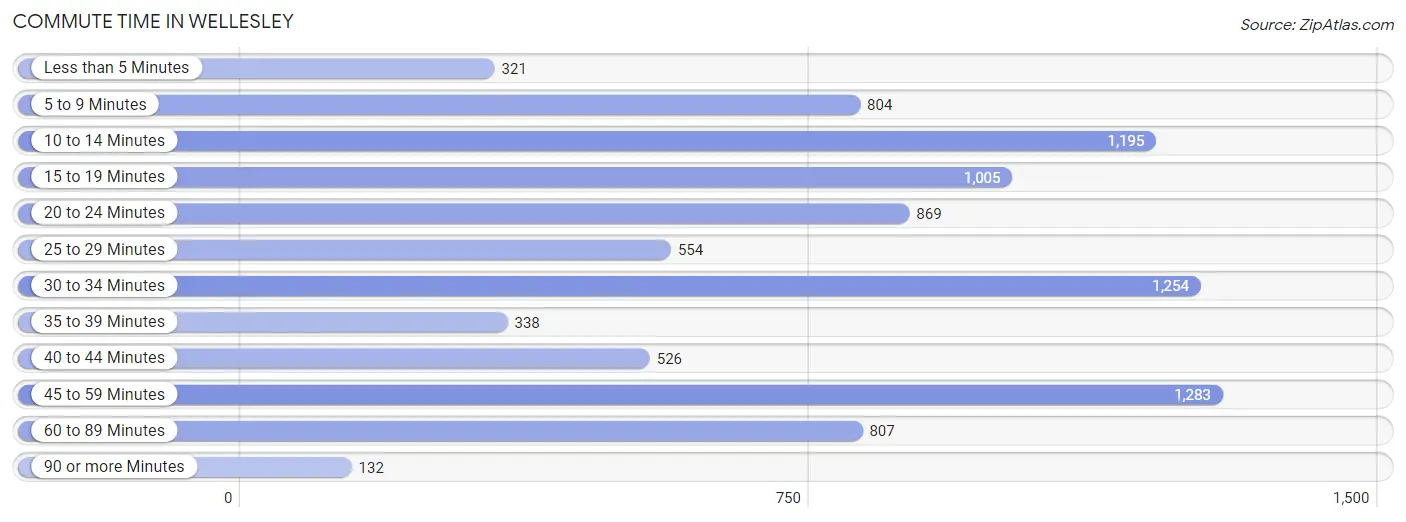
Commute Time in Wellesley
The most frequently occuring commute durations in Wellesley are 45 to 59 minutes (1,283 commuters, 14.1%), 30 to 34 minutes (1,254 commuters, 13.8%), and 10 to 14 minutes (1,195 commuters, 13.2%).
| Commute Time | # Commuters | % Commuters |
| Less than 5 Minutes | 321 | 3.5% |
| 5 to 9 Minutes | 804 | 8.8% |
| 10 to 14 Minutes | 1,195 | 13.2% |
| 15 to 19 Minutes | 1,005 | 11.1% |
| 20 to 24 Minutes | 869 | 9.6% |
| 25 to 29 Minutes | 554 | 6.1% |
| 30 to 34 Minutes | 1,254 | 13.8% |
| 35 to 39 Minutes | 338 | 3.7% |
| 40 to 44 Minutes | 526 | 5.8% |
| 45 to 59 Minutes | 1,283 | 14.1% |
| 60 to 89 Minutes | 807 | 8.9% |
| 90 or more Minutes | 132 | 1.5% |
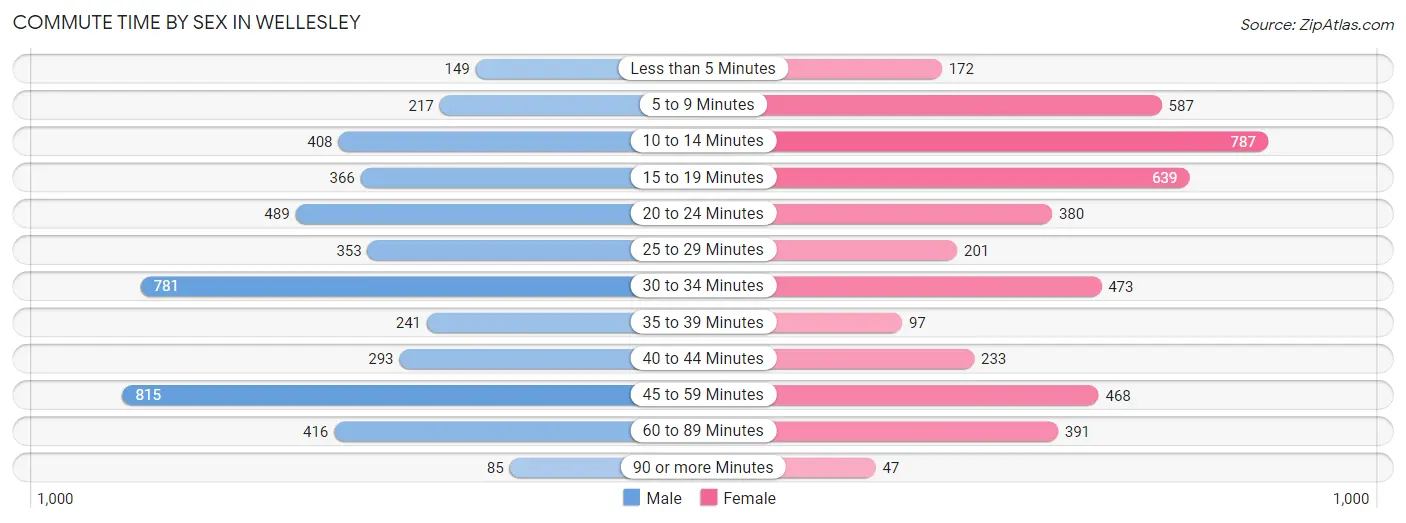
Commute Time by Sex in Wellesley
The most common commute times in Wellesley are 45 to 59 minutes (815 commuters, 17.7%) for males and 10 to 14 minutes (787 commuters, 17.6%) for females.
| Commute Time | Male | Female |
| Less than 5 Minutes | 149 (3.2%) | 172 (3.8%) |
| 5 to 9 Minutes | 217 (4.7%) | 587 (13.1%) |
| 10 to 14 Minutes | 408 (8.8%) | 787 (17.6%) |
| 15 to 19 Minutes | 366 (7.9%) | 639 (14.3%) |
| 20 to 24 Minutes | 489 (10.6%) | 380 (8.5%) |
| 25 to 29 Minutes | 353 (7.6%) | 201 (4.5%) |
| 30 to 34 Minutes | 781 (16.9%) | 473 (10.6%) |
| 35 to 39 Minutes | 241 (5.2%) | 97 (2.2%) |
| 40 to 44 Minutes | 293 (6.4%) | 233 (5.2%) |
| 45 to 59 Minutes | 815 (17.7%) | 468 (10.5%) |
| 60 to 89 Minutes | 416 (9.0%) | 391 (8.7%) |
| 90 or more Minutes | 85 (1.8%) | 47 (1.1%) |
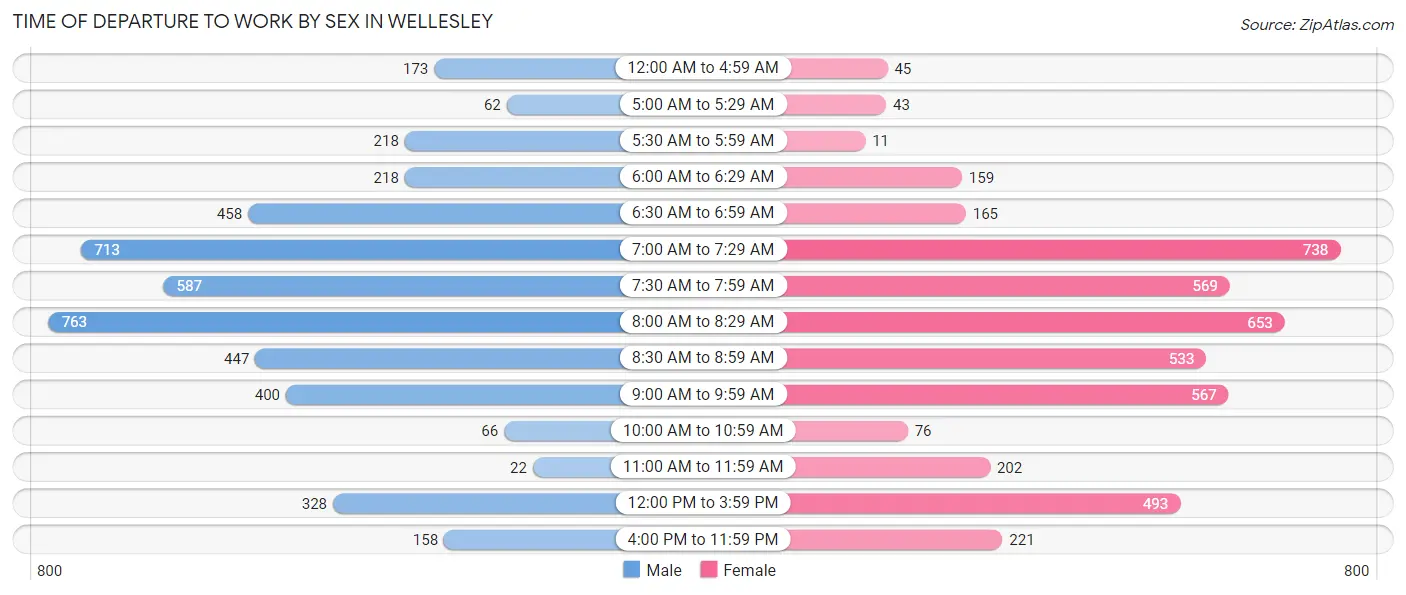
Time of Departure to Work by Sex in Wellesley
The most frequent times of departure to work in Wellesley are 8:00 AM to 8:29 AM (763, 16.5%) for males and 7:00 AM to 7:29 AM (738, 16.5%) for females.
| Time of Departure | Male | Female |
| 12:00 AM to 4:59 AM | 173 (3.7%) | 45 (1.0%) |
| 5:00 AM to 5:29 AM | 62 (1.3%) | 43 (1.0%) |
| 5:30 AM to 5:59 AM | 218 (4.7%) | 11 (0.3%) |
| 6:00 AM to 6:29 AM | 218 (4.7%) | 159 (3.5%) |
| 6:30 AM to 6:59 AM | 458 (9.9%) | 165 (3.7%) |
| 7:00 AM to 7:29 AM | 713 (15.5%) | 738 (16.5%) |
| 7:30 AM to 7:59 AM | 587 (12.7%) | 569 (12.7%) |
| 8:00 AM to 8:29 AM | 763 (16.5%) | 653 (14.6%) |
| 8:30 AM to 8:59 AM | 447 (9.7%) | 533 (11.9%) |
| 9:00 AM to 9:59 AM | 400 (8.7%) | 567 (12.7%) |
| 10:00 AM to 10:59 AM | 66 (1.4%) | 76 (1.7%) |
| 11:00 AM to 11:59 AM | 22 (0.5%) | 202 (4.5%) |
| 12:00 PM to 3:59 PM | 328 (7.1%) | 493 (11.0%) |
| 4:00 PM to 11:59 PM | 158 (3.4%) | 221 (4.9%) |
| Total | 4,613 (100.0%) | 4,475 (100.0%) |
Housing Occupancy in Wellesley
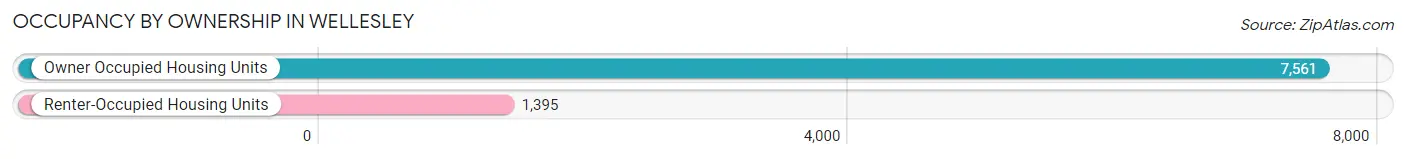
Occupancy by Ownership in Wellesley
Of the total 8,956 dwellings in Wellesley, owner-occupied units account for 7,561 (84.4%), while renter-occupied units make up 1,395 (15.6%).
| Occupancy | # Housing Units | % Housing Units |
| Owner Occupied Housing Units | 7,561 | 84.4% |
| Renter-Occupied Housing Units | 1,395 | 15.6% |
| Total Occupied Housing Units | 8,956 | 100.0% |
Occupancy by Household Size in Wellesley
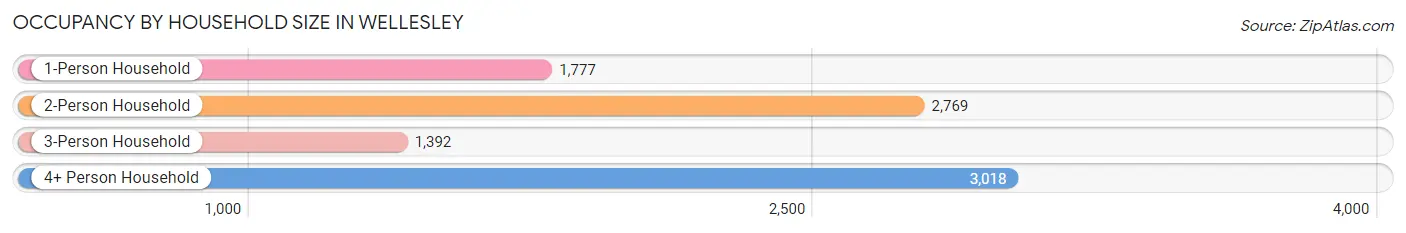
| Household Size | # Housing Units | % Housing Units |
| 1-Person Household | 1,777 | 19.8% |
| 2-Person Household | 2,769 | 30.9% |
| 3-Person Household | 1,392 | 15.5% |
| 4+ Person Household | 3,018 | 33.7% |
| Total Housing Units | 8,956 | 100.0% |
Occupancy by Ownership by Household Size in Wellesley
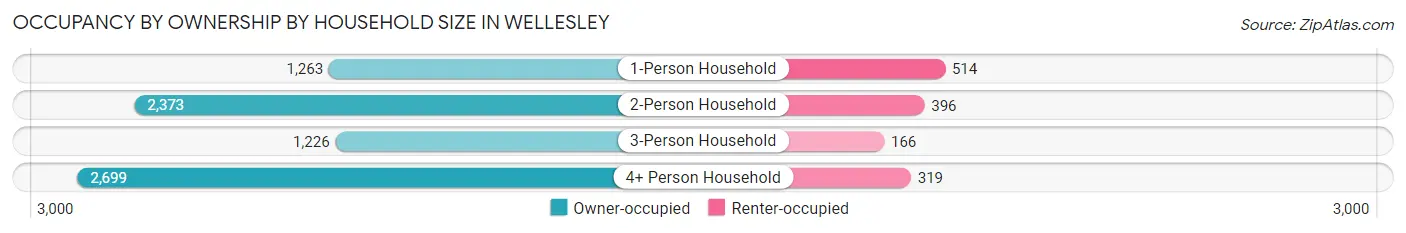
| Household Size | Owner-occupied | Renter-occupied |
| 1-Person Household | 1,263 (71.1%) | 514 (28.9%) |
| 2-Person Household | 2,373 (85.7%) | 396 (14.3%) |
| 3-Person Household | 1,226 (88.1%) | 166 (11.9%) |
| 4+ Person Household | 2,699 (89.4%) | 319 (10.6%) |
| Total Housing Units | 7,561 (84.4%) | 1,395 (15.6%) |
Occupancy by Educational Attainment in Wellesley
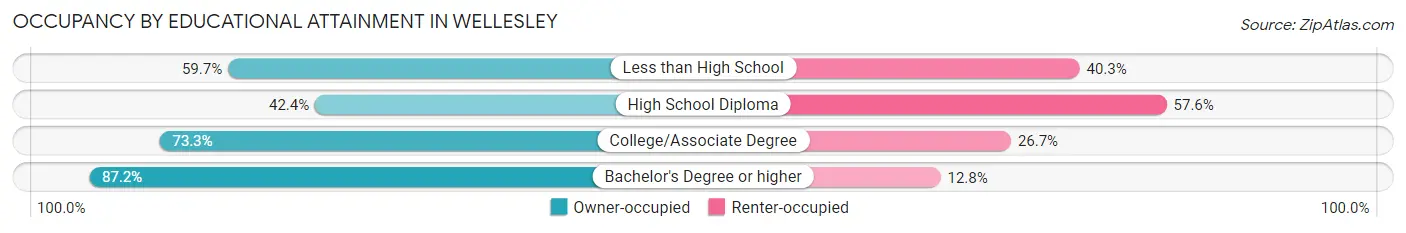
| Household Size | Owner-occupied | Renter-occupied |
| Less than High School | 37 (59.7%) | 25 (40.3%) |
| High School Diploma | 140 (42.4%) | 190 (57.6%) |
| College/Associate Degree | 458 (73.3%) | 167 (26.7%) |
| Bachelor's Degree or higher | 6,926 (87.2%) | 1,013 (12.8%) |
Occupancy by Age of Householder in Wellesley
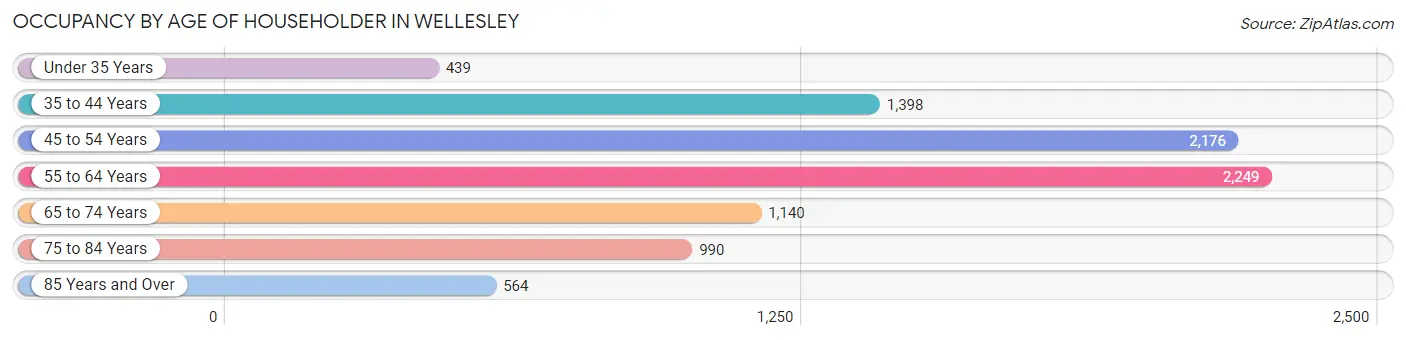
| Age Bracket | # Households | % Households |
| Under 35 Years | 439 | 4.9% |
| 35 to 44 Years | 1,398 | 15.6% |
| 45 to 54 Years | 2,176 | 24.3% |
| 55 to 64 Years | 2,249 | 25.1% |
| 65 to 74 Years | 1,140 | 12.7% |
| 75 to 84 Years | 990 | 11.1% |
| 85 Years and Over | 564 | 6.3% |
| Total | 8,956 | 100.0% |
Housing Finances in Wellesley
Median Income by Occupancy in Wellesley
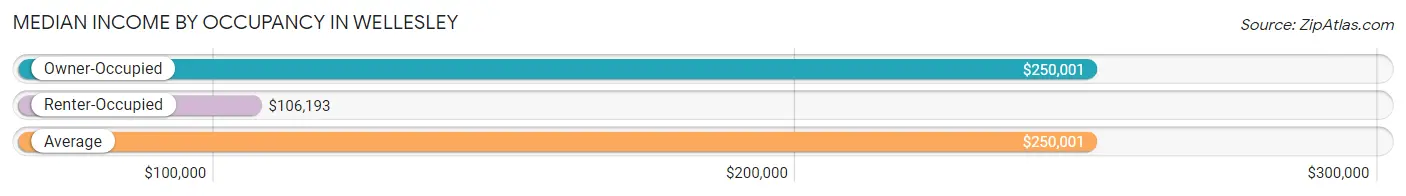
| Occupancy Type | # Households | Median Income |
| Owner-Occupied | 7,561 (84.4%) | $250,001 |
| Renter-Occupied | 1,395 (15.6%) | $106,193 |
| Average | 8,956 (100.0%) | $250,001 |
Occupancy by Householder Income Bracket in Wellesley
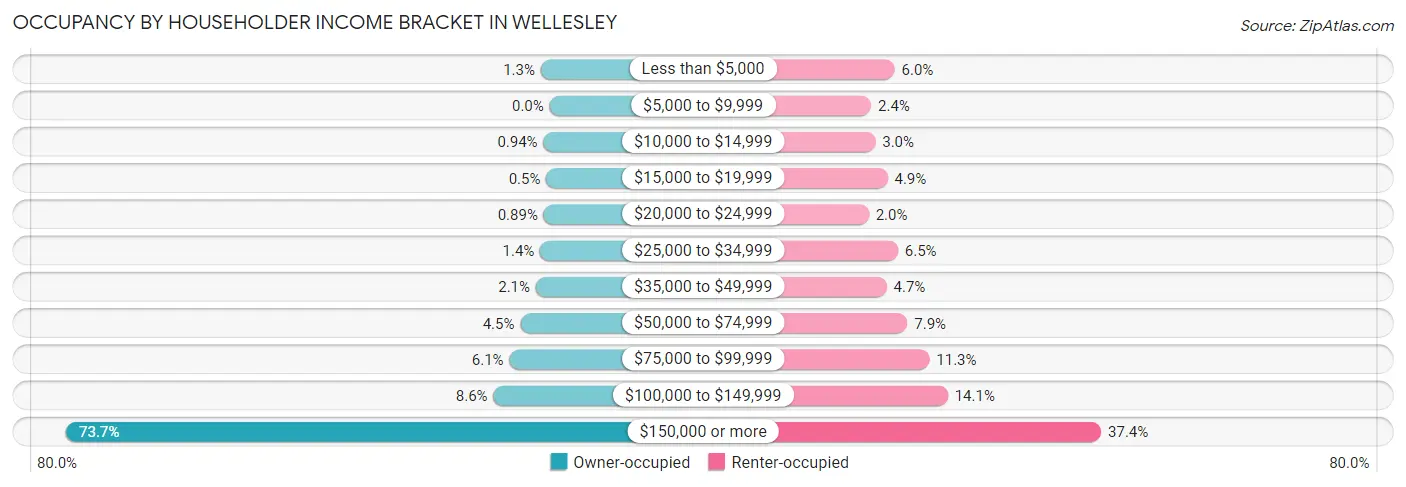
| Income Bracket | Owner-occupied | Renter-occupied |
| Less than $5,000 | 101 (1.3%) | 83 (5.9%) |
| $5,000 to $9,999 | 0 (0.0%) | 33 (2.4%) |
| $10,000 to $14,999 | 71 (0.9%) | 42 (3.0%) |
| $15,000 to $19,999 | 38 (0.5%) | 68 (4.9%) |
| $20,000 to $24,999 | 67 (0.9%) | 28 (2.0%) |
| $25,000 to $34,999 | 109 (1.4%) | 90 (6.5%) |
| $35,000 to $49,999 | 158 (2.1%) | 66 (4.7%) |
| $50,000 to $74,999 | 337 (4.5%) | 110 (7.9%) |
| $75,000 to $99,999 | 463 (6.1%) | 157 (11.3%) |
| $100,000 to $149,999 | 647 (8.6%) | 196 (14.1%) |
| $150,000 or more | 5,570 (73.7%) | 522 (37.4%) |
| Total | 7,561 (100.0%) | 1,395 (100.0%) |
Monthly Housing Cost Tiers in Wellesley
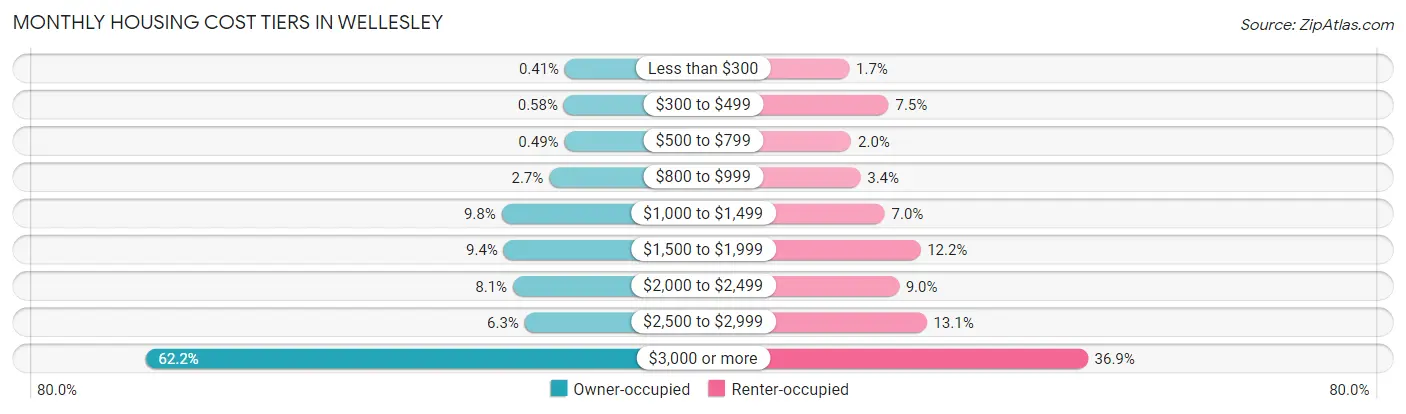
| Monthly Cost | Owner-occupied | Renter-occupied |
| Less than $300 | 31 (0.4%) | 24 (1.7%) |
| $300 to $499 | 44 (0.6%) | 105 (7.5%) |
| $500 to $799 | 37 (0.5%) | 28 (2.0%) |
| $800 to $999 | 207 (2.7%) | 47 (3.4%) |
| $1,000 to $1,499 | 737 (9.8%) | 97 (7.0%) |
| $1,500 to $1,999 | 713 (9.4%) | 170 (12.2%) |
| $2,000 to $2,499 | 610 (8.1%) | 126 (9.0%) |
| $2,500 to $2,999 | 479 (6.3%) | 183 (13.1%) |
| $3,000 or more | 4,703 (62.2%) | 514 (36.8%) |
| Total | 7,561 (100.0%) | 1,395 (100.0%) |
Physical Housing Characteristics in Wellesley
Housing Structures in Wellesley
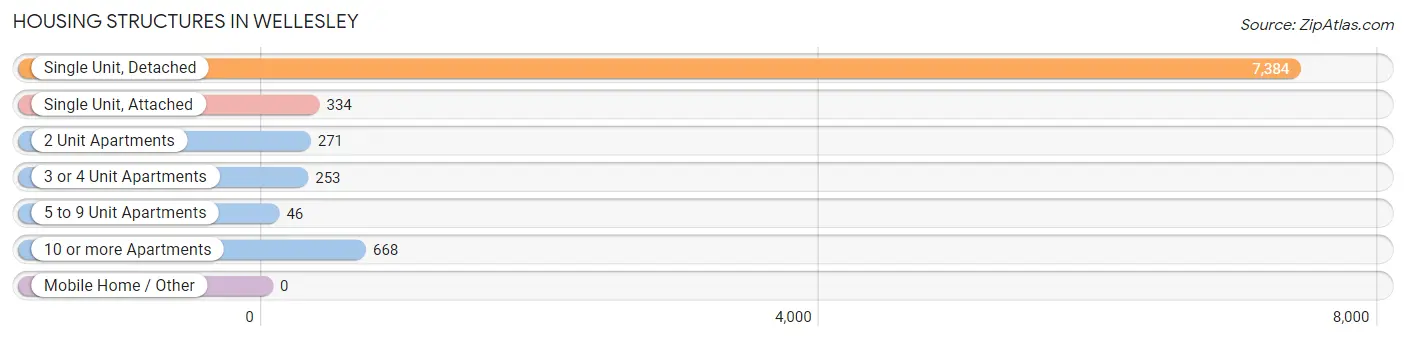
| Structure Type | # Housing Units | % Housing Units |
| Single Unit, Detached | 7,384 | 82.5% |
| Single Unit, Attached | 334 | 3.7% |
| 2 Unit Apartments | 271 | 3.0% |
| 3 or 4 Unit Apartments | 253 | 2.8% |
| 5 to 9 Unit Apartments | 46 | 0.5% |
| 10 or more Apartments | 668 | 7.5% |
| Mobile Home / Other | 0 | 0.0% |
| Total | 8,956 | 100.0% |
Housing Structures by Occupancy in Wellesley
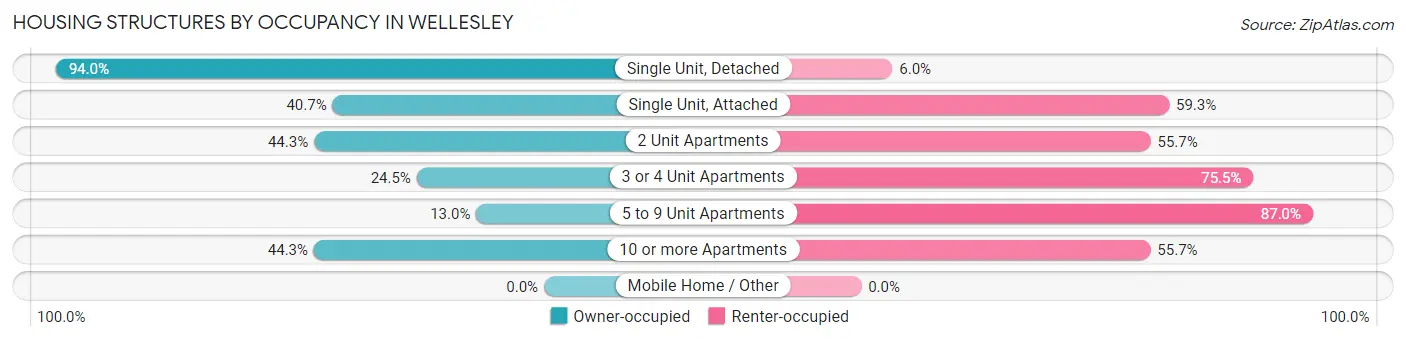
| Structure Type | Owner-occupied | Renter-occupied |
| Single Unit, Detached | 6,941 (94.0%) | 443 (6.0%) |
| Single Unit, Attached | 136 (40.7%) | 198 (59.3%) |
| 2 Unit Apartments | 120 (44.3%) | 151 (55.7%) |
| 3 or 4 Unit Apartments | 62 (24.5%) | 191 (75.5%) |
| 5 to 9 Unit Apartments | 6 (13.0%) | 40 (87.0%) |
| 10 or more Apartments | 296 (44.3%) | 372 (55.7%) |
| Mobile Home / Other | 0 (0.0%) | 0 (0.0%) |
| Total | 7,561 (84.4%) | 1,395 (15.6%) |
Housing Structures by Number of Rooms in Wellesley
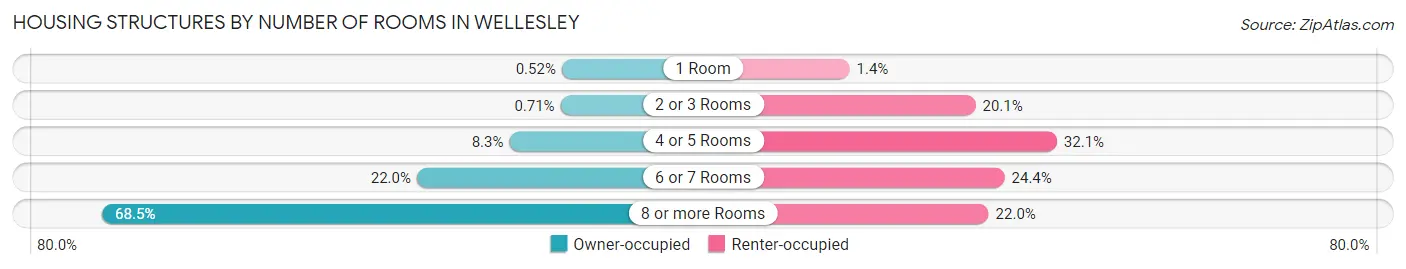
| Number of Rooms | Owner-occupied | Renter-occupied |
| 1 Room | 39 (0.5%) | 20 (1.4%) |
| 2 or 3 Rooms | 54 (0.7%) | 280 (20.1%) |
| 4 or 5 Rooms | 626 (8.3%) | 448 (32.1%) |
| 6 or 7 Rooms | 1,661 (22.0%) | 340 (24.4%) |
| 8 or more Rooms | 5,181 (68.5%) | 307 (22.0%) |
| Total | 7,561 (100.0%) | 1,395 (100.0%) |
Housing Structure by Heating Type in Wellesley
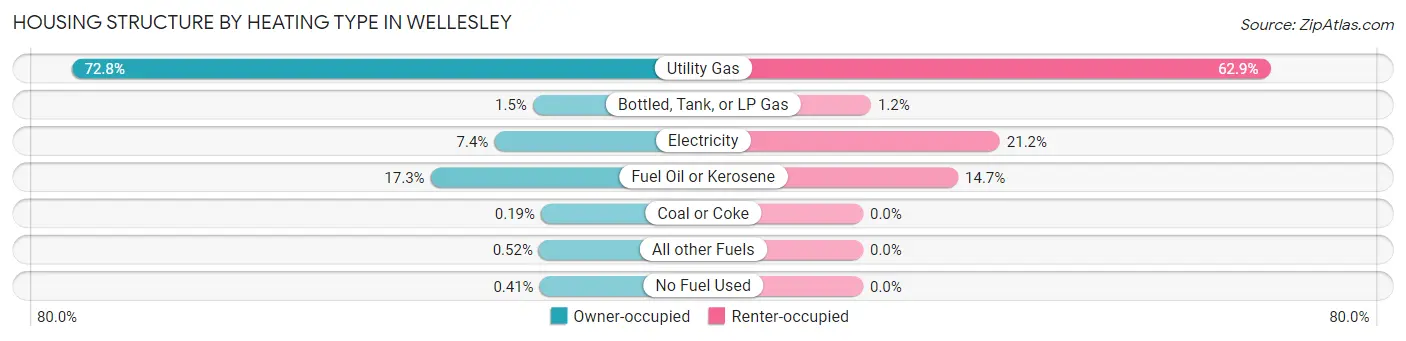
| Heating Type | Owner-occupied | Renter-occupied |
| Utility Gas | 5,501 (72.8%) | 878 (62.9%) |
| Bottled, Tank, or LP Gas | 110 (1.5%) | 17 (1.2%) |
| Electricity | 560 (7.4%) | 295 (21.1%) |
| Fuel Oil or Kerosene | 1,306 (17.3%) | 205 (14.7%) |
| Coal or Coke | 14 (0.2%) | 0 (0.0%) |
| All other Fuels | 39 (0.5%) | 0 (0.0%) |
| No Fuel Used | 31 (0.4%) | 0 (0.0%) |
| Total | 7,561 (100.0%) | 1,395 (100.0%) |
Household Vehicle Usage in Wellesley
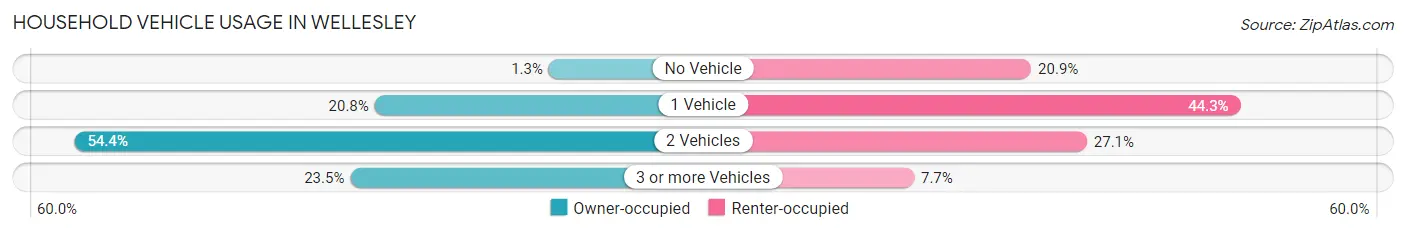
| Vehicles per Household | Owner-occupied | Renter-occupied |
| No Vehicle | 97 (1.3%) | 291 (20.9%) |
| 1 Vehicle | 1,572 (20.8%) | 618 (44.3%) |
| 2 Vehicles | 4,114 (54.4%) | 378 (27.1%) |
| 3 or more Vehicles | 1,778 (23.5%) | 108 (7.7%) |
| Total | 7,561 (100.0%) | 1,395 (100.0%) |
Real Estate & Mortgages in Wellesley
Real Estate and Mortgage Overview in Wellesley
| Characteristic | Without Mortgage | With Mortgage |
| Housing Units | 2,708 | 4,853 |
| Median Property Value | $1,238,000 | $1,512,400 |
| Median Household Income | $192,222 | $4,048 |
| Monthly Housing Costs | $1,501 | $4,277 |
| Real Estate Taxes | $10,001 | $15 |
Property Value by Mortgage Status in Wellesley
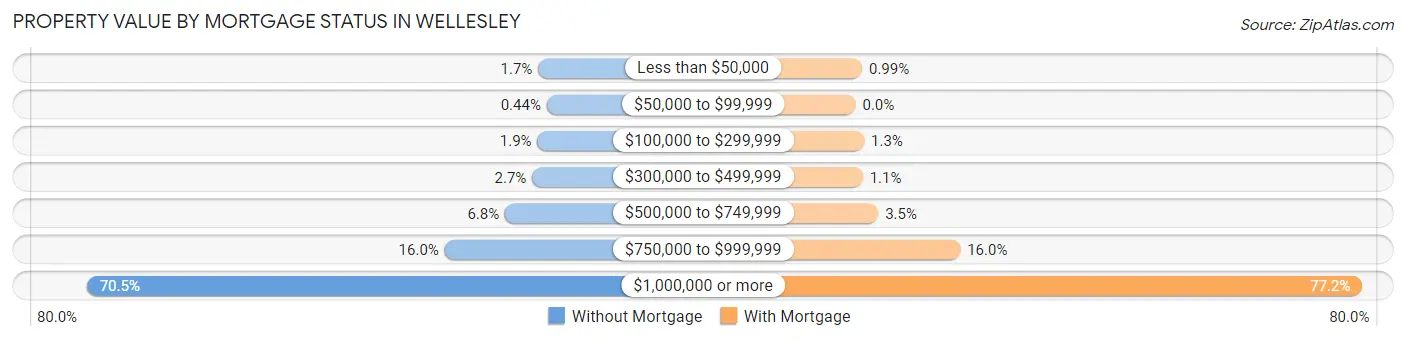
| Property Value | Without Mortgage | With Mortgage |
| Less than $50,000 | 47 (1.7%) | 48 (1.0%) |
| $50,000 to $99,999 | 12 (0.4%) | 0 (0.0%) |
| $100,000 to $299,999 | 50 (1.8%) | 63 (1.3%) |
| $300,000 to $499,999 | 72 (2.7%) | 53 (1.1%) |
| $500,000 to $749,999 | 184 (6.8%) | 168 (3.5%) |
| $750,000 to $999,999 | 433 (16.0%) | 774 (16.0%) |
| $1,000,000 or more | 1,910 (70.5%) | 3,747 (77.2%) |
| Total | 2,708 (100.0%) | 4,853 (100.0%) |
Household Income by Mortgage Status in Wellesley
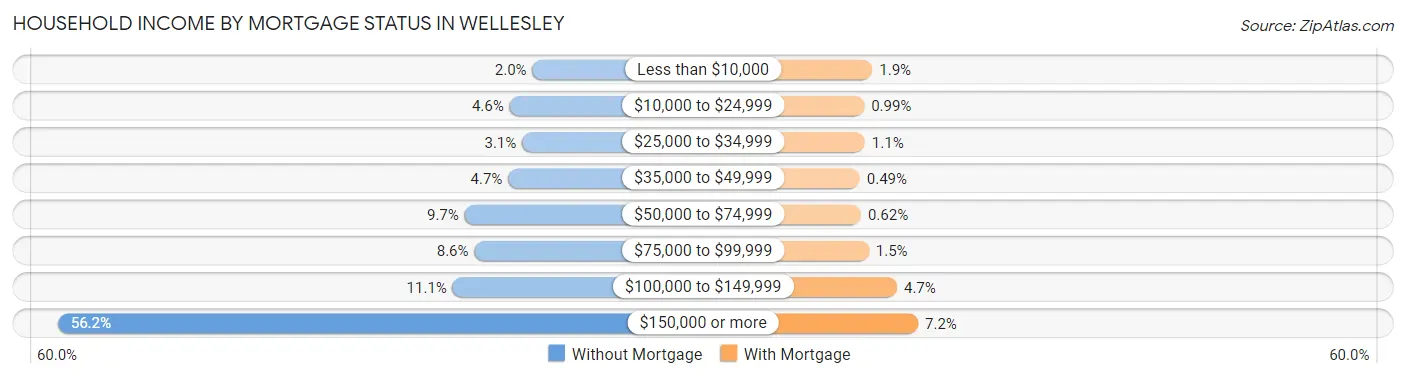
| Household Income | Without Mortgage | With Mortgage |
| Less than $10,000 | 53 (2.0%) | 93 (1.9%) |
| $10,000 to $24,999 | 124 (4.6%) | 48 (1.0%) |
| $25,000 to $34,999 | 85 (3.1%) | 52 (1.1%) |
| $35,000 to $49,999 | 128 (4.7%) | 24 (0.5%) |
| $50,000 to $74,999 | 263 (9.7%) | 30 (0.6%) |
| $75,000 to $99,999 | 233 (8.6%) | 74 (1.5%) |
| $100,000 to $149,999 | 300 (11.1%) | 230 (4.7%) |
| $150,000 or more | 1,522 (56.2%) | 347 (7.1%) |
| Total | 2,708 (100.0%) | 4,853 (100.0%) |
Property Value to Household Income Ratio in Wellesley
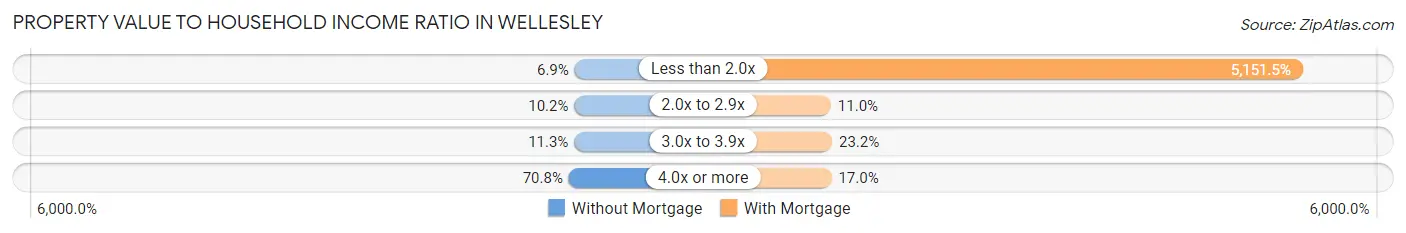
| Value-to-Income Ratio | Without Mortgage | With Mortgage |
| Less than 2.0x | 186 (6.9%) | 250,001 (5,151.5%) |
| 2.0x to 2.9x | 276 (10.2%) | 533 (11.0%) |
| 3.0x to 3.9x | 307 (11.3%) | 1,127 (23.2%) |
| 4.0x or more | 1,918 (70.8%) | 823 (17.0%) |
| Total | 2,708 (100.0%) | 4,853 (100.0%) |
Real Estate Taxes by Mortgage Status in Wellesley
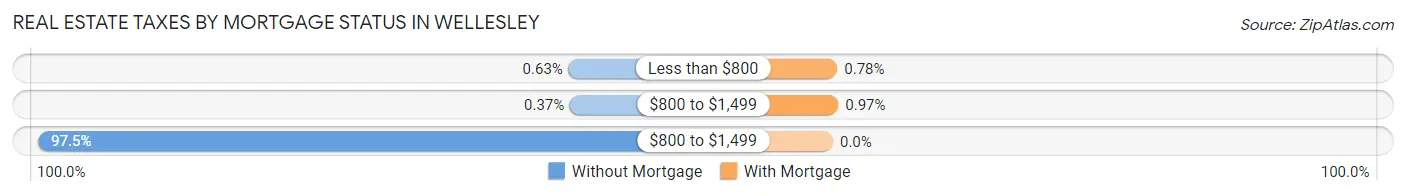
| Property Taxes | Without Mortgage | With Mortgage |
| Less than $800 | 17 (0.6%) | 38 (0.8%) |
| $800 to $1,499 | 10 (0.4%) | 47 (1.0%) |
| $800 to $1,499 | 2,641 (97.5%) | 0 (0.0%) |
| Total | 2,708 (100.0%) | 4,853 (100.0%) |
Health & Disability in Wellesley
Health Insurance Coverage by Age in Wellesley
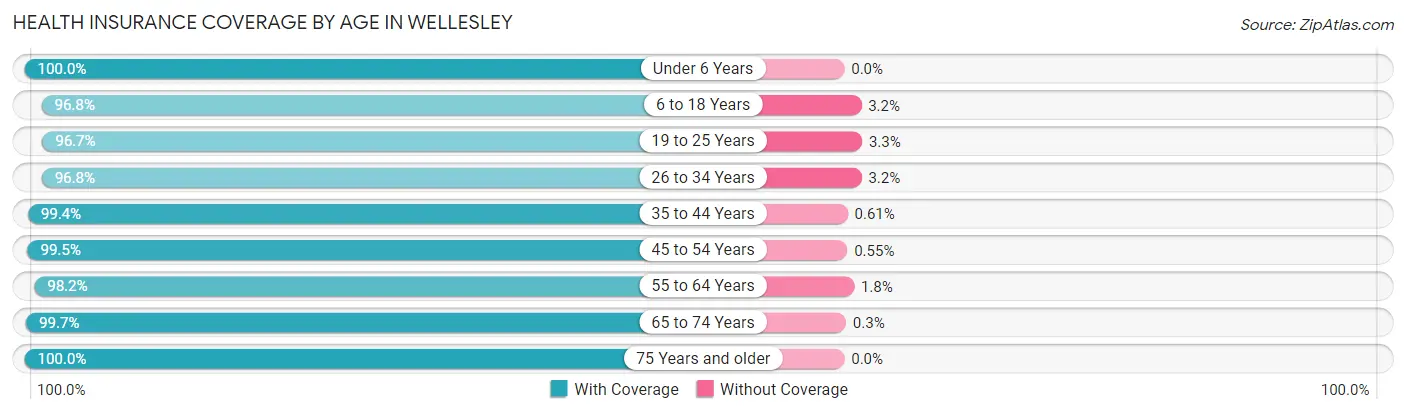
| Age Bracket | With Coverage | Without Coverage |
| Under 6 Years | 1,749 (100.0%) | 0 (0.0%) |
| 6 to 18 Years | 6,626 (96.8%) | 216 (3.2%) |
| 19 to 25 Years | 4,509 (96.7%) | 154 (3.3%) |
| 26 to 34 Years | 1,059 (96.8%) | 35 (3.2%) |
| 35 to 44 Years | 2,759 (99.4%) | 17 (0.6%) |
| 45 to 54 Years | 4,167 (99.5%) | 23 (0.5%) |
| 55 to 64 Years | 3,860 (98.2%) | 71 (1.8%) |
| 65 to 74 Years | 2,311 (99.7%) | 7 (0.3%) |
| 75 Years and older | 2,085 (100.0%) | 0 (0.0%) |
| Total | 29,125 (98.2%) | 523 (1.8%) |
Health Insurance Coverage by Citizenship Status in Wellesley
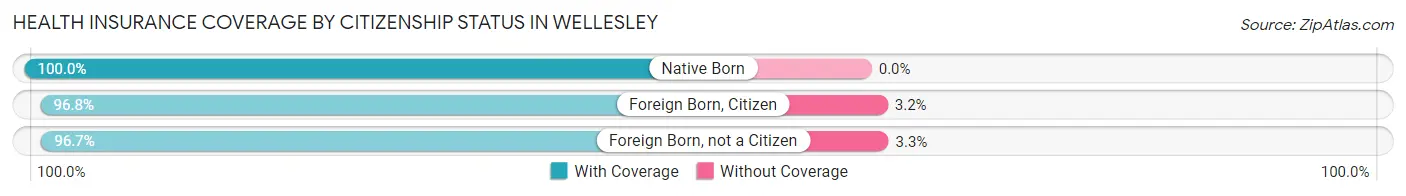
| Citizenship Status | With Coverage | Without Coverage |
| Native Born | 1,749 (100.0%) | 0 (0.0%) |
| Foreign Born, Citizen | 6,626 (96.8%) | 216 (3.2%) |
| Foreign Born, not a Citizen | 4,509 (96.7%) | 154 (3.3%) |
Health Insurance Coverage by Household Income in Wellesley
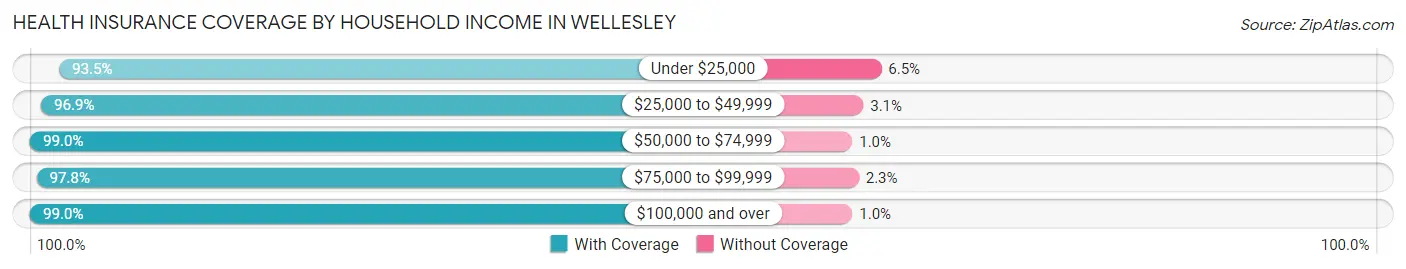
| Household Income | With Coverage | Without Coverage |
| Under $25,000 | 909 (93.5%) | 63 (6.5%) |
| $25,000 to $49,999 | 658 (96.9%) | 21 (3.1%) |
| $50,000 to $74,999 | 675 (99.0%) | 7 (1.0%) |
| $75,000 to $99,999 | 1,478 (97.8%) | 34 (2.2%) |
| $100,000 and over | 21,330 (99.0%) | 225 (1.0%) |
Public vs Private Health Insurance Coverage by Age in Wellesley
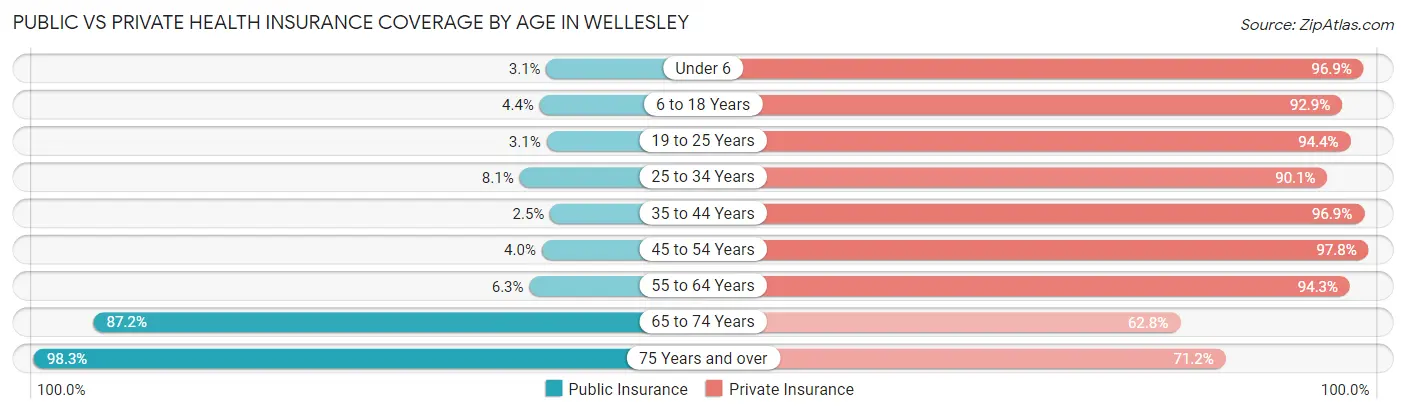
| Age Bracket | Public Insurance | Private Insurance |
| Under 6 | 55 (3.1%) | 1,694 (96.9%) |
| 6 to 18 Years | 301 (4.4%) | 6,353 (92.8%) |
| 19 to 25 Years | 146 (3.1%) | 4,402 (94.4%) |
| 25 to 34 Years | 89 (8.1%) | 986 (90.1%) |
| 35 to 44 Years | 68 (2.5%) | 2,691 (96.9%) |
| 45 to 54 Years | 168 (4.0%) | 4,096 (97.8%) |
| 55 to 64 Years | 248 (6.3%) | 3,707 (94.3%) |
| 65 to 74 Years | 2,021 (87.2%) | 1,455 (62.8%) |
| 75 Years and over | 2,049 (98.3%) | 1,485 (71.2%) |
| Total | 5,145 (17.3%) | 26,869 (90.6%) |
Disability Status by Sex by Age in Wellesley
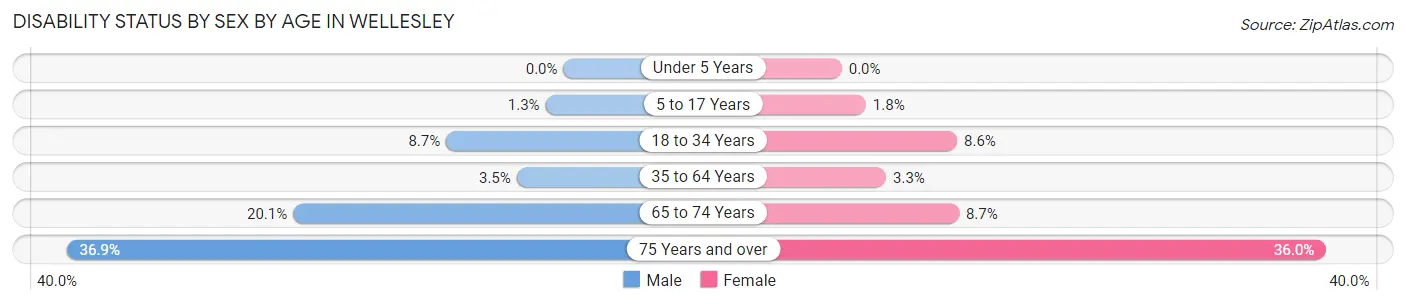
| Age Bracket | Male | Female |
| Under 5 Years | 0 (0.0%) | 0 (0.0%) |
| 5 to 17 Years | 43 (1.3%) | 49 (1.8%) |
| 18 to 34 Years | 186 (8.7%) | 402 (8.6%) |
| 35 to 64 Years | 182 (3.5%) | 186 (3.3%) |
| 65 to 74 Years | 216 (20.1%) | 108 (8.7%) |
| 75 Years and over | 291 (36.9%) | 466 (36.0%) |
Disability Class by Sex by Age in Wellesley
Disability Class: Hearing Difficulty
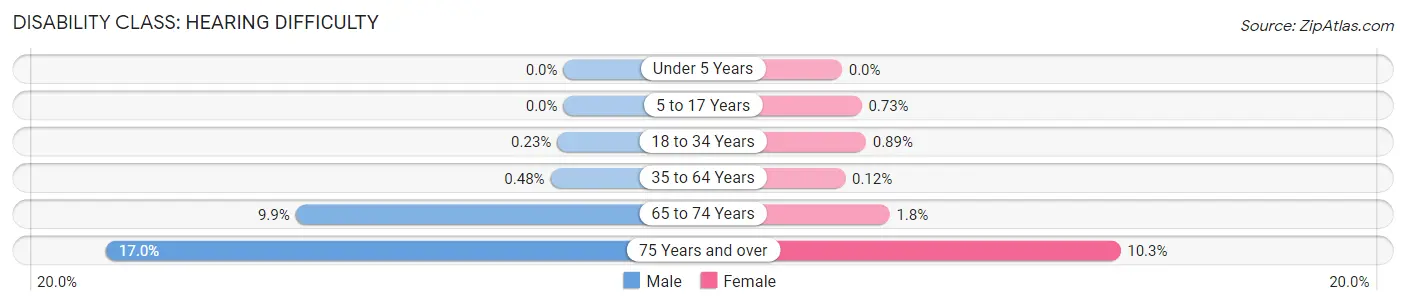
| Age Bracket | Male | Female |
| Under 5 Years | 0 (0.0%) | 0 (0.0%) |
| 5 to 17 Years | 0 (0.0%) | 20 (0.7%) |
| 18 to 34 Years | 5 (0.2%) | 42 (0.9%) |
| 35 to 64 Years | 25 (0.5%) | 7 (0.1%) |
| 65 to 74 Years | 107 (9.9%) | 22 (1.8%) |
| 75 Years and over | 134 (17.0%) | 134 (10.3%) |
Disability Class: Vision Difficulty
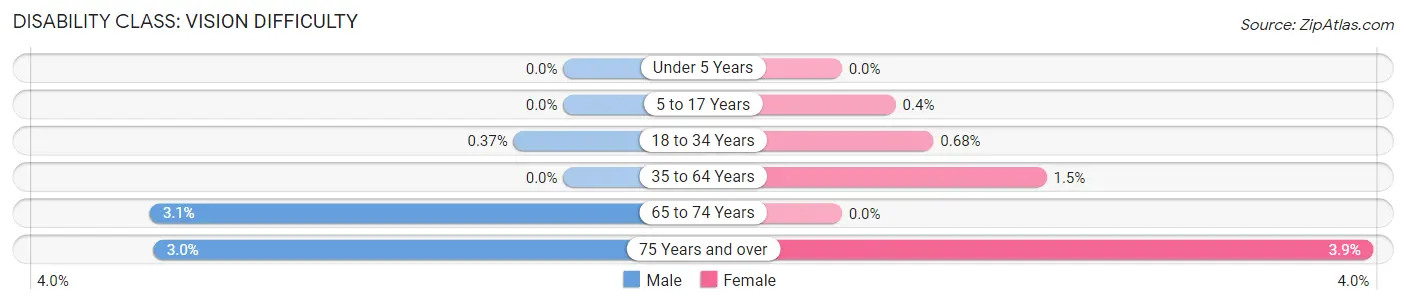
| Age Bracket | Male | Female |
| Under 5 Years | 0 (0.0%) | 0 (0.0%) |
| 5 to 17 Years | 0 (0.0%) | 11 (0.4%) |
| 18 to 34 Years | 8 (0.4%) | 32 (0.7%) |
| 35 to 64 Years | 0 (0.0%) | 86 (1.5%) |
| 65 to 74 Years | 33 (3.1%) | 0 (0.0%) |
| 75 Years and over | 24 (3.0%) | 51 (3.9%) |
Disability Class: Cognitive Difficulty
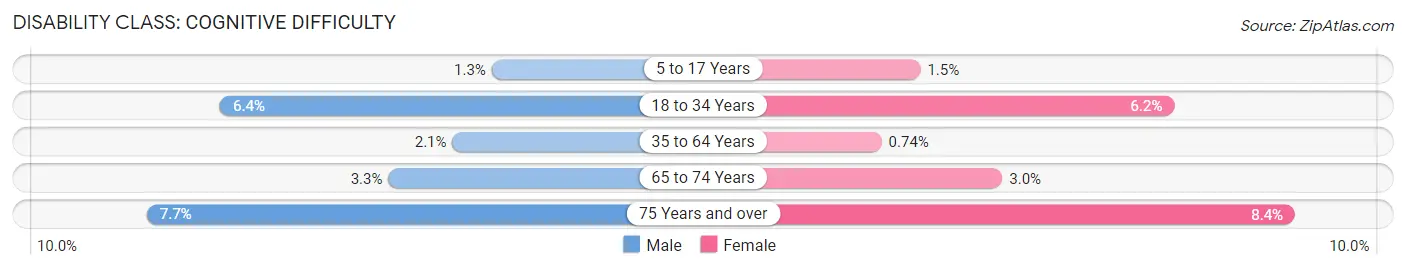
| Age Bracket | Male | Female |
| 5 to 17 Years | 43 (1.3%) | 40 (1.5%) |
| 18 to 34 Years | 136 (6.4%) | 290 (6.2%) |
| 35 to 64 Years | 108 (2.1%) | 42 (0.7%) |
| 65 to 74 Years | 35 (3.3%) | 37 (3.0%) |
| 75 Years and over | 61 (7.7%) | 109 (8.4%) |
Disability Class: Ambulatory Difficulty
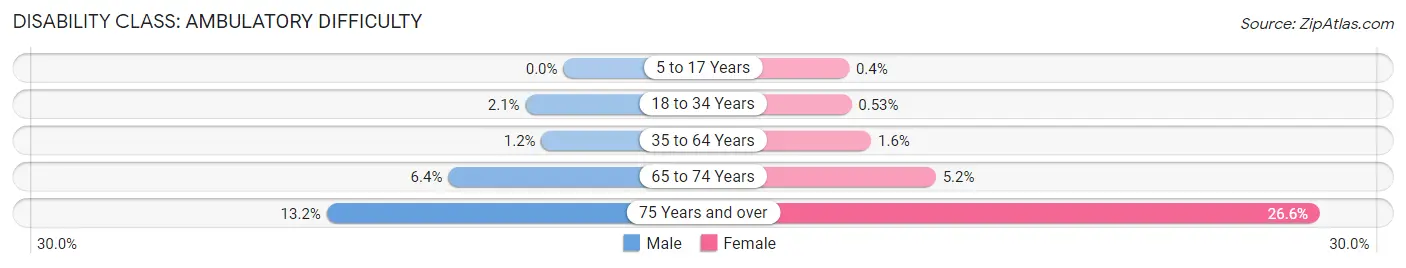
| Age Bracket | Male | Female |
| 5 to 17 Years | 0 (0.0%) | 11 (0.4%) |
| 18 to 34 Years | 45 (2.1%) | 25 (0.5%) |
| 35 to 64 Years | 64 (1.2%) | 92 (1.6%) |
| 65 to 74 Years | 69 (6.4%) | 65 (5.2%) |
| 75 Years and over | 104 (13.2%) | 345 (26.6%) |
Disability Class: Self-Care Difficulty
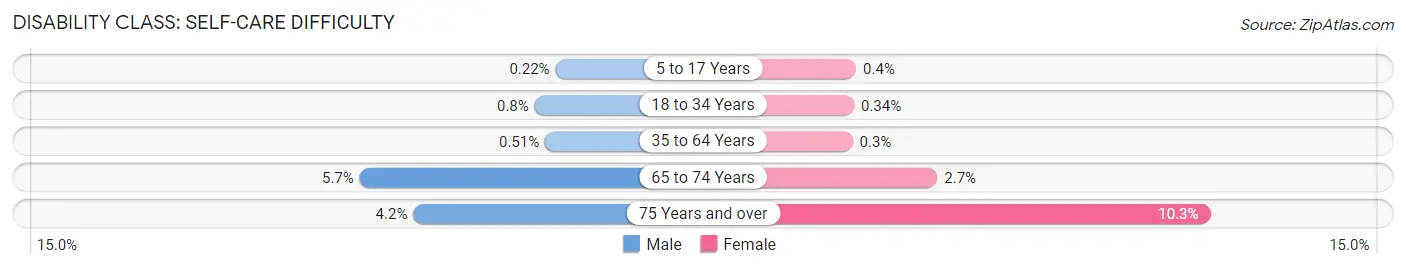
| Age Bracket | Male | Female |
| 5 to 17 Years | 7 (0.2%) | 11 (0.4%) |
| 18 to 34 Years | 17 (0.8%) | 16 (0.3%) |
| 35 to 64 Years | 27 (0.5%) | 17 (0.3%) |
| 65 to 74 Years | 61 (5.7%) | 33 (2.7%) |
| 75 Years and over | 33 (4.2%) | 133 (10.3%) |
Technology Access in Wellesley
Computing Device Access in Wellesley
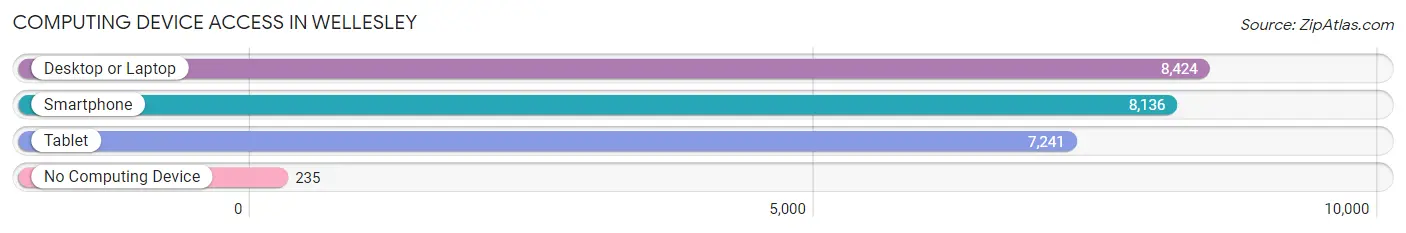
| Device Type | # Households | % Households |
| Desktop or Laptop | 8,424 | 94.1% |
| Smartphone | 8,136 | 90.8% |
| Tablet | 7,241 | 80.8% |
| No Computing Device | 235 | 2.6% |
| Total | 8,956 | 100.0% |
Internet Access in Wellesley
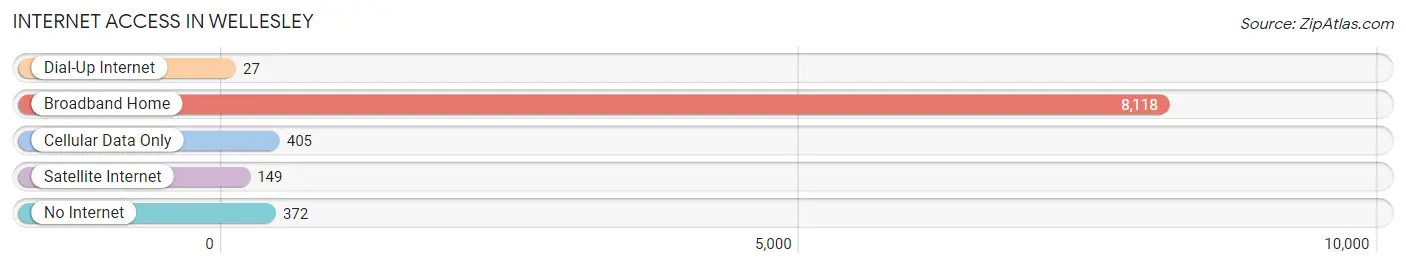
| Internet Type | # Households | % Households |
| Dial-Up Internet | 27 | 0.3% |
| Broadband Home | 8,118 | 90.6% |
| Cellular Data Only | 405 | 4.5% |
| Satellite Internet | 149 | 1.7% |
| No Internet | 372 | 4.2% |
| Total | 8,956 | 100.0% |
Wellesley Summary
Wellesley, MA is a town located in Norfolk County, Massachusetts, United States. It is part of the Greater Boston area and is located approximately 20 miles west of downtown Boston. As of the 2010 census, the population of Wellesley was 27,982.
History
Wellesley was first settled in 1630 and was officially incorporated in 1881. The town was named after the Wellesley family, who were prominent landowners in the area. The town was originally part of Dedham, Massachusetts, but was separated in 1779.
In the 19th century, Wellesley was a popular summer resort for wealthy Bostonians. The town was home to several large estates, including the estate of Horatio Hollis Hunnewell, which is now the site of the Wellesley College campus.
Geography
Wellesley is located in eastern Massachusetts, approximately 20 miles west of downtown Boston. It is bordered by the towns of Weston, Needham, Natick, and Newton. The town is situated on the Charles River, which forms its eastern border.
The town has a total area of 10.49 square miles, of which 10.18 square miles is land and 0.31 square miles is water. The town is mostly flat, with some hills in the northern and western parts of town.
Economy
Wellesley is a wealthy suburb of Boston and is home to many affluent residents. The town has a strong economy, with many residents employed in professional and managerial positions. The town is home to several large employers, including Wellesley College, Babson College, and the Massachusetts Institute of Technology.
The town also has a vibrant retail sector, with many shops and restaurants located in the town center. The town is also home to several corporate headquarters, including TJX Companies, Inc., and Staples, Inc.
Demographics
As of the 2010 census, the population of Wellesley was 27,982. The racial makeup of the town was 87.2% White, 4.2% Asian, 3.2% African American, 0.2% Native American, 0.1% Pacific Islander, and 4.1% from other races. Hispanic or Latino of any race were 5.2% of the population.
The median household income in Wellesley was $179,817 in 2018, and the median family income was $202,917. The per capita income for the town was $90,945. About 3.2% of families and 4.7% of the population were below the poverty line.
Common Questions
What is Per Capita Income in Wellesley?
Per Capita income in Wellesley is $111,690.
What is the Median Family Income in Wellesley?
Median Family Income in Wellesley is $250,001.
What is the Median Household income in Wellesley?
Median Household Income in Wellesley is $250,001.
What is Income or Wage Gap in Wellesley?
Income or Wage Gap in Wellesley is 81.7%.
Women in Wellesley earn 18.3 cents for every dollar earned by a man.
What is Inequality or Gini Index in Wellesley?
Inequality or Gini Index in Wellesley is 0.49.
What is the Total Population of Wellesley?
Total Population of Wellesley is 29,862.
What is the Total Male Population of Wellesley?
Total Male Population of Wellesley is 13,343.
What is the Total Female Population of Wellesley?
Total Female Population of Wellesley is 16,519.
What is the Ratio of Males per 100 Females in Wellesley?
There are 80.77 Males per 100 Females in Wellesley.
What is the Ratio of Females per 100 Males in Wellesley?
There are 123.80 Females per 100 Males in Wellesley.
What is the Median Population Age in Wellesley?
Median Population Age in Wellesley is 37.6 Years.
What is the Average Family Size in Wellesley
Average Family Size in Wellesley is 3.3 People.
What is the Average Household Size in Wellesley
Average Household Size in Wellesley is 2.8 People.
How Large is the Labor Force in Wellesley?
There are 13,359 People in the Labor Forcein in Wellesley.
What is the Percentage of People in the Labor Force in Wellesley?
57.0% of People are in the Labor Force in Wellesley.
What is the Unemployment Rate in Wellesley?
Unemployment Rate in Wellesley is 4.0%.