Sharon, MA Map & Demographics
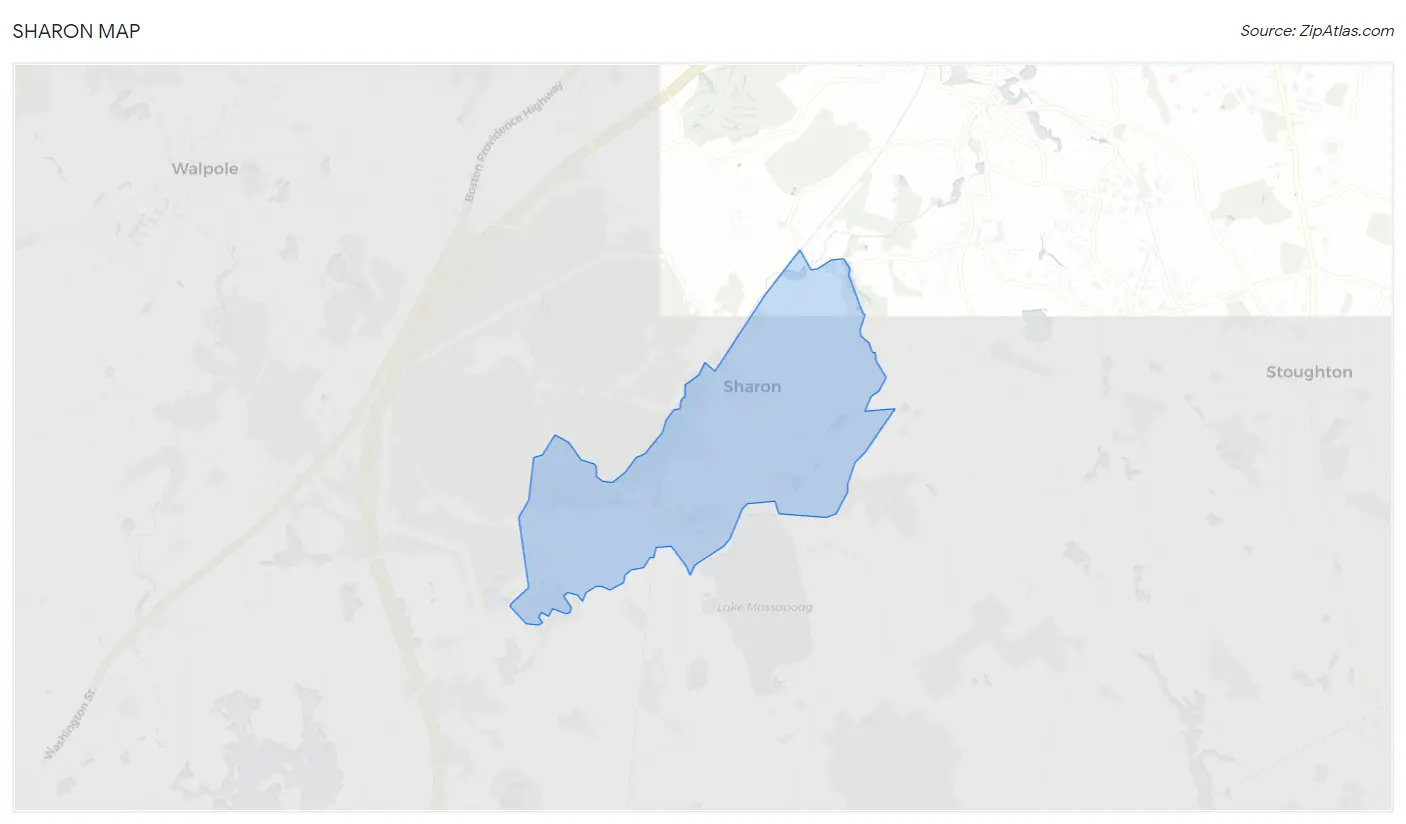
Sharon Map
Sharon Overview
$71,548
PER CAPITA INCOME
$178,929
AVG FAMILY INCOME
$173,938
AVG HOUSEHOLD INCOME
46.6%
WAGE / INCOME GAP [ % ]
53.4¢/ $1
WAGE / INCOME GAP [ $ ]
0.38
INEQUALITY / GINI INDEX
5,983
TOTAL POPULATION
2,976
MALE POPULATION
3,007
FEMALE POPULATION
98.97
MALES / 100 FEMALES
101.04
FEMALES / 100 MALES
38.8
MEDIAN AGE
3.2
AVG FAMILY SIZE
3.0
AVG HOUSEHOLD SIZE
3,131
LABOR FORCE [ PEOPLE ]
71.0%
PERCENT IN LABOR FORCE
3.1%
UNEMPLOYMENT RATE
Sharon Zip Codes
Income in Sharon
Income Overview in Sharon
Per Capita Income in Sharon is $71,548, while median incomes of families and households are $178,929 and $173,938 respectively.
| Characteristic | Number | Measure |
| Per Capita Income | 5,983 | $71,548 |
| Median Family Income | 1,688 | $178,929 |
| Mean Family Income | 1,688 | $230,245 |
| Median Household Income | 1,993 | $173,938 |
| Mean Household Income | 1,993 | $213,367 |
| Income Deficit | 1,688 | $0 |
| Wage / Income Gap (%) | 5,983 | 46.64% |
| Wage / Income Gap ($) | 5,983 | 53.36¢ per $1 |
| Gini / Inequality Index | 5,983 | 0.38 |
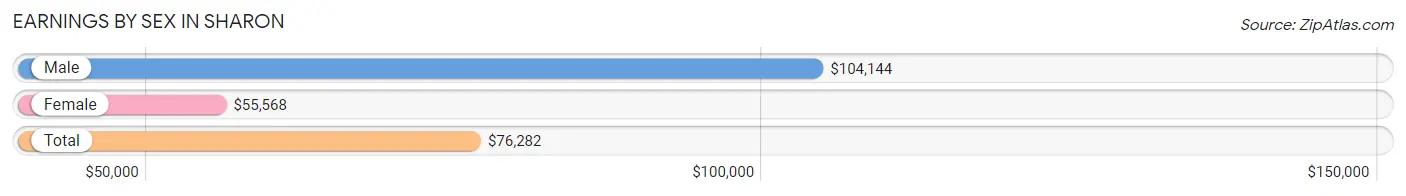
Earnings by Sex in Sharon
Average Earnings in Sharon are $76,282, $104,144 for men and $55,568 for women, a difference of 46.6%.
| Sex | Number | Average Earnings |
| Male | 1,827 (53.3%) | $104,144 |
| Female | 1,603 (46.7%) | $55,568 |
| Total | 3,430 (100.0%) | $76,282 |
Earnings by Sex by Income Bracket in Sharon
The most common earnings brackets in Sharon are $100,000+ for men (958 | 52.4%) and $100,000+ for women (416 | 26.0%).
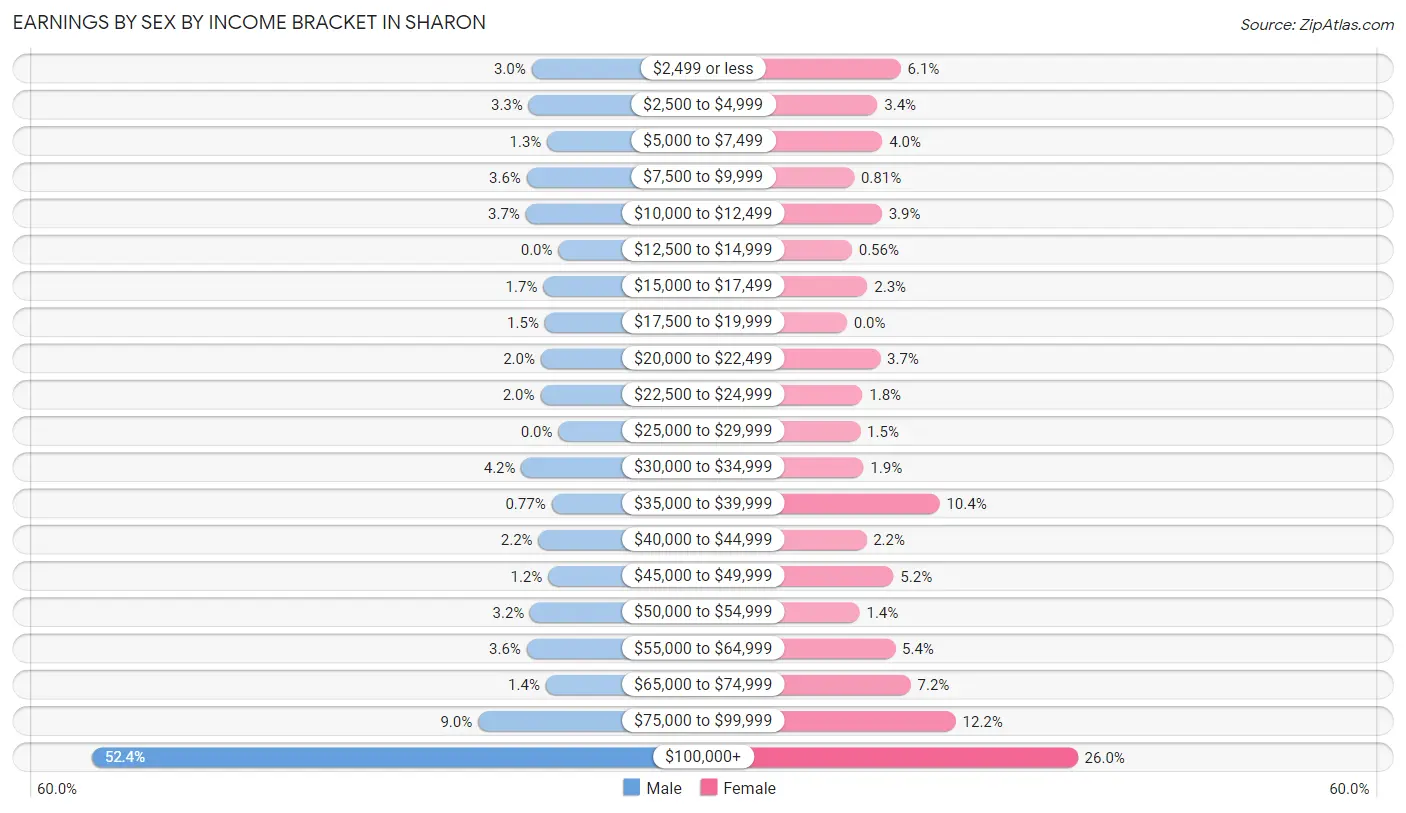
| Income | Male | Female |
| $2,499 or less | 55 (3.0%) | 97 (6.0%) |
| $2,500 to $4,999 | 61 (3.3%) | 55 (3.4%) |
| $5,000 to $7,499 | 23 (1.3%) | 64 (4.0%) |
| $7,500 to $9,999 | 65 (3.6%) | 13 (0.8%) |
| $10,000 to $12,499 | 67 (3.7%) | 63 (3.9%) |
| $12,500 to $14,999 | 0 (0.0%) | 9 (0.6%) |
| $15,000 to $17,499 | 31 (1.7%) | 37 (2.3%) |
| $17,500 to $19,999 | 28 (1.5%) | 0 (0.0%) |
| $20,000 to $22,499 | 36 (2.0%) | 60 (3.7%) |
| $22,500 to $24,999 | 37 (2.0%) | 28 (1.8%) |
| $25,000 to $29,999 | 0 (0.0%) | 24 (1.5%) |
| $30,000 to $34,999 | 76 (4.2%) | 30 (1.9%) |
| $35,000 to $39,999 | 14 (0.8%) | 167 (10.4%) |
| $40,000 to $44,999 | 41 (2.2%) | 35 (2.2%) |
| $45,000 to $49,999 | 21 (1.1%) | 84 (5.2%) |
| $50,000 to $54,999 | 58 (3.2%) | 23 (1.4%) |
| $55,000 to $64,999 | 65 (3.6%) | 87 (5.4%) |
| $65,000 to $74,999 | 26 (1.4%) | 115 (7.2%) |
| $75,000 to $99,999 | 165 (9.0%) | 196 (12.2%) |
| $100,000+ | 958 (52.4%) | 416 (26.0%) |
| Total | 1,827 (100.0%) | 1,603 (100.0%) |
Earnings by Sex by Educational Attainment in Sharon
Average earnings in Sharon are $115,175 for men and $62,663 for women, a difference of 45.6%. Men with an educational attainment of graduate degree enjoy the highest average annual earnings of $144,219, while those with bachelor's degree education earn the least with $98,000. Women with an educational attainment of graduate degree earn the most with the average annual earnings of $73,885, while those with college or associate's degree education have the smallest earnings of $35,556.
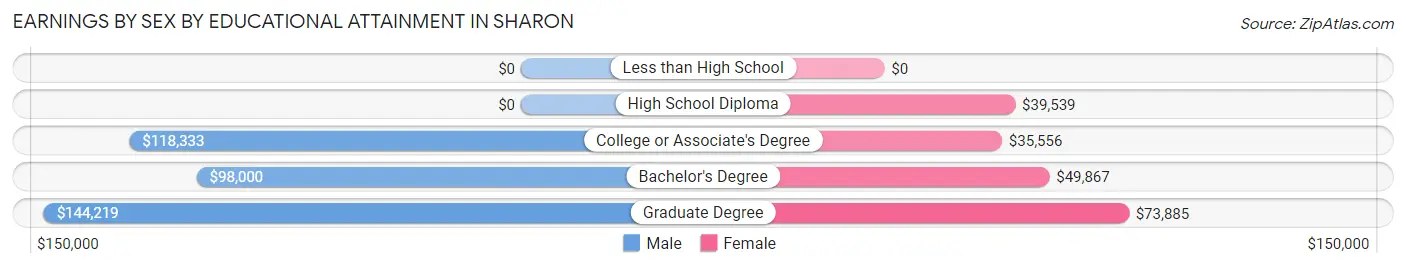
| Educational Attainment | Male Income | Female Income |
| Less than High School | - | - |
| High School Diploma | - | - |
| College or Associate's Degree | $118,333 | $35,556 |
| Bachelor's Degree | $98,000 | $49,867 |
| Graduate Degree | $144,219 | $73,885 |
| Total | $115,175 | $62,663 |
Family Income in Sharon
Family Income Brackets in Sharon
According to the Sharon family income data, there are 699 families falling into the $200,000+ income range, which is the most common income bracket and makes up 41.4% of all families.
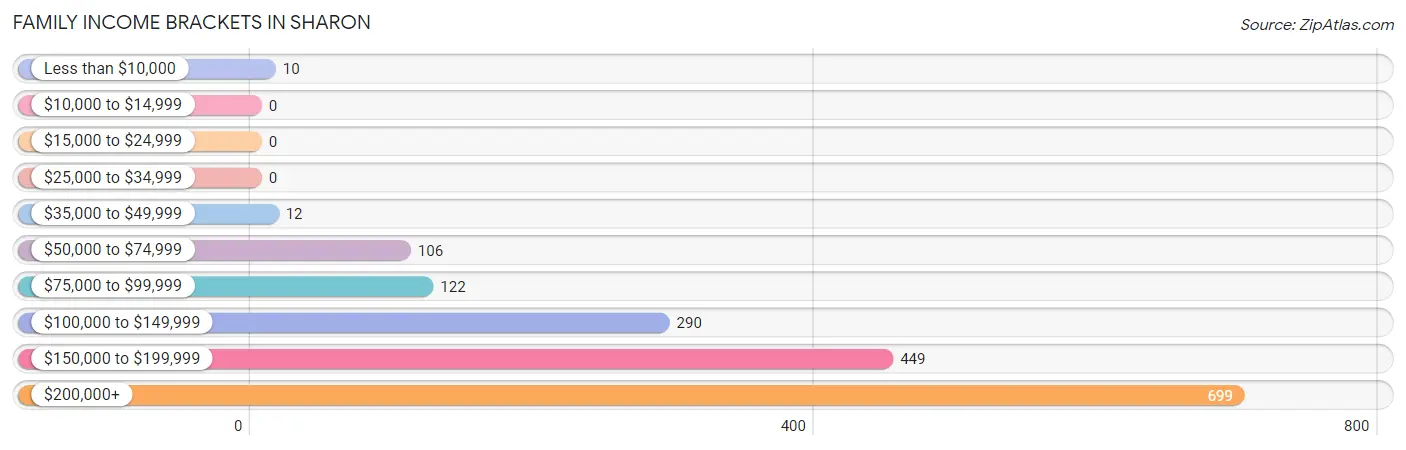
| Income Bracket | # Families | % Families |
| Less than $10,000 | 10 | 0.6% |
| $10,000 to $14,999 | 0 | 0.0% |
| $15,000 to $24,999 | 0 | 0.0% |
| $25,000 to $34,999 | 0 | 0.0% |
| $35,000 to $49,999 | 12 | 0.7% |
| $50,000 to $74,999 | 106 | 6.3% |
| $75,000 to $99,999 | 122 | 7.2% |
| $100,000 to $149,999 | 290 | 17.2% |
| $150,000 to $199,999 | 449 | 26.6% |
| $200,000+ | 699 | 41.4% |
Family Income by Famaliy Size in Sharon
3-person families (417 | 24.7%) account for the highest median family income in Sharon with $193,125 per family, while 2-person families (591 | 35.0%) have the highest median income of $85,379 per family member.
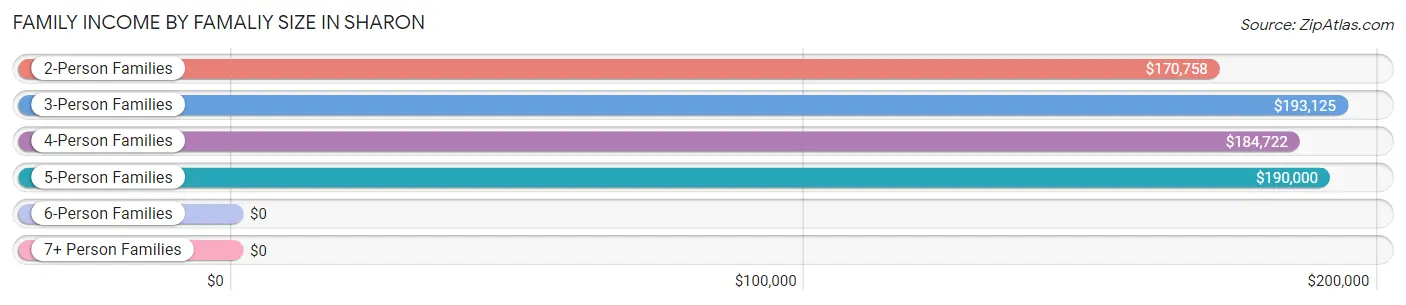
| Income Bracket | # Families | Median Income |
| 2-Person Families | 591 (35.0%) | $170,758 |
| 3-Person Families | 417 (24.7%) | $193,125 |
| 4-Person Families | 460 (27.3%) | $184,722 |
| 5-Person Families | 172 (10.2%) | $190,000 |
| 6-Person Families | 15 (0.9%) | $0 |
| 7+ Person Families | 33 (1.9%) | $0 |
| Total | 1,688 (100.0%) | $178,929 |
Family Income by Number of Earners in Sharon
The median family income in Sharon is $178,929, with families comprising 2 earners (913) having the highest median family income of $208,477, while families with no earners (57) have the lowest median family income of $79,196, accounting for 54.1% and 3.4% of families, respectively.
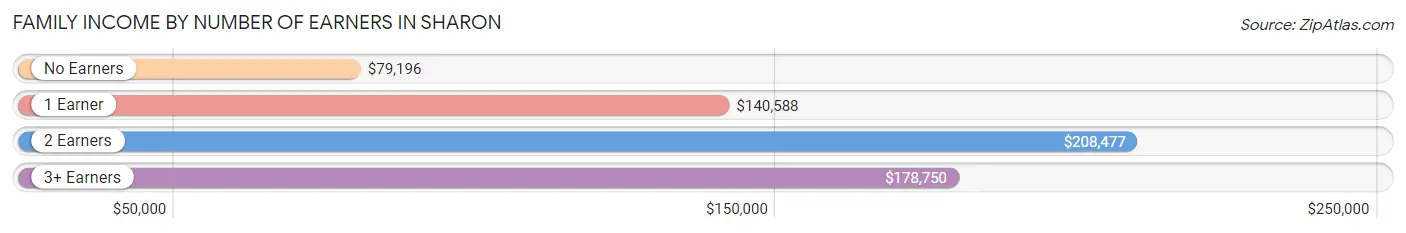
| Number of Earners | # Families | Median Income |
| No Earners | 57 (3.4%) | $79,196 |
| 1 Earner | 490 (29.0%) | $140,588 |
| 2 Earners | 913 (54.1%) | $208,477 |
| 3+ Earners | 228 (13.5%) | $178,750 |
| Total | 1,688 (100.0%) | $178,929 |
Household Income in Sharon
Household Income Brackets in Sharon
With 761 households falling in the category, the $200,000+ income range is the most frequent in Sharon, accounting for 38.2% of all households.
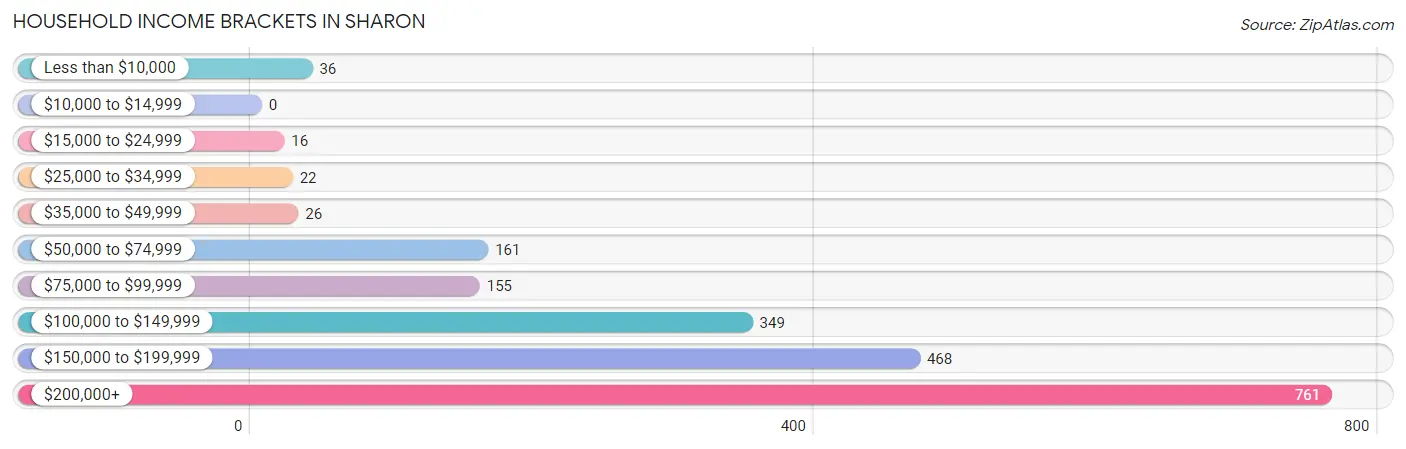
| Income Bracket | # Households | % Households |
| Less than $10,000 | 36 | 1.8% |
| $10,000 to $14,999 | 0 | 0.0% |
| $15,000 to $24,999 | 16 | 0.8% |
| $25,000 to $34,999 | 22 | 1.1% |
| $35,000 to $49,999 | 26 | 1.3% |
| $50,000 to $74,999 | 161 | 8.1% |
| $75,000 to $99,999 | 155 | 7.8% |
| $100,000 to $149,999 | 349 | 17.5% |
| $150,000 to $199,999 | 468 | 23.5% |
| $200,000+ | 761 | 38.2% |
Household Income by Householder Age in Sharon
The median household income in Sharon is $173,938, with the highest median household income of $199,881 found in the 25 to 44 years age bracket for the primary householder. A total of 568 households (28.5%) fall into this category. Meanwhile, the 15 to 24 years age bracket for the primary householder has the lowest median household income of $0, with 12 households (0.6%) in this group.
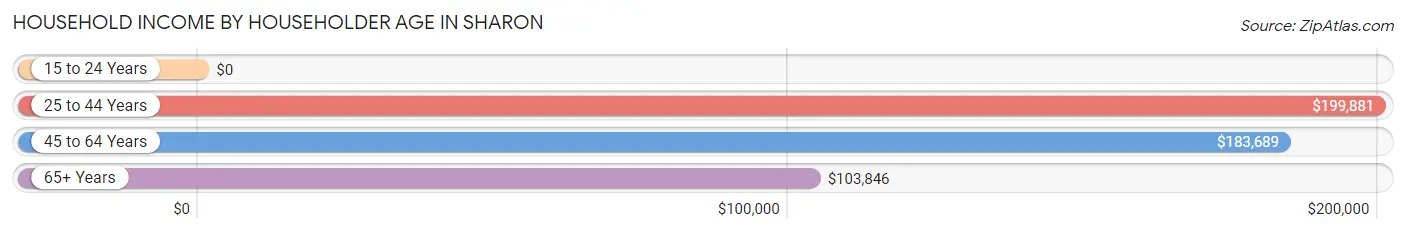
| Income Bracket | # Households | Median Income |
| 15 to 24 Years | 12 (0.6%) | $0 |
| 25 to 44 Years | 568 (28.5%) | $199,881 |
| 45 to 64 Years | 859 (43.1%) | $183,689 |
| 65+ Years | 554 (27.8%) | $103,846 |
| Total | 1,993 (100.0%) | $173,938 |
Poverty in Sharon
Income Below Poverty by Sex and Age in Sharon
With 1.3% poverty level for males and 2.7% for females among the residents of Sharon, 15 year old males and 18 to 24 year old females are the most vulnerable to poverty, with 26 males (38.2%) and 28 females (20.1%) in their respective age groups living below the poverty level.
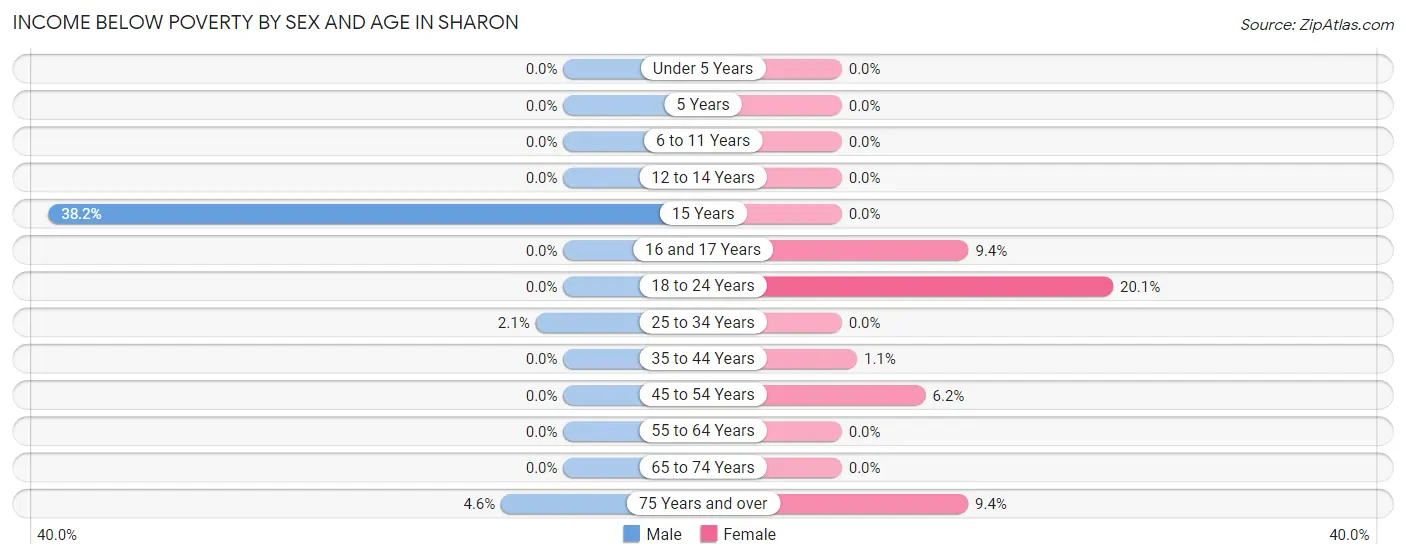
| Age Bracket | Male | Female |
| Under 5 Years | 0 (0.0%) | 0 (0.0%) |
| 5 Years | 0 (0.0%) | 0 (0.0%) |
| 6 to 11 Years | 0 (0.0%) | 0 (0.0%) |
| 12 to 14 Years | 0 (0.0%) | 0 (0.0%) |
| 15 Years | 26 (38.2%) | 0 (0.0%) |
| 16 and 17 Years | 0 (0.0%) | 8 (9.4%) |
| 18 to 24 Years | 0 (0.0%) | 28 (20.1%) |
| 25 to 34 Years | 5 (2.1%) | 0 (0.0%) |
| 35 to 44 Years | 0 (0.0%) | 5 (1.1%) |
| 45 to 54 Years | 0 (0.0%) | 30 (6.2%) |
| 55 to 64 Years | 0 (0.0%) | 0 (0.0%) |
| 65 to 74 Years | 0 (0.0%) | 0 (0.0%) |
| 75 Years and over | 8 (4.6%) | 9 (9.4%) |
| Total | 39 (1.3%) | 80 (2.7%) |
Income Above Poverty by Sex and Age in Sharon
According to the poverty statistics in Sharon, males aged under 5 years and females aged under 5 years are the age groups that are most secure financially, with 100.0% of males and 100.0% of females in these age groups living above the poverty line.
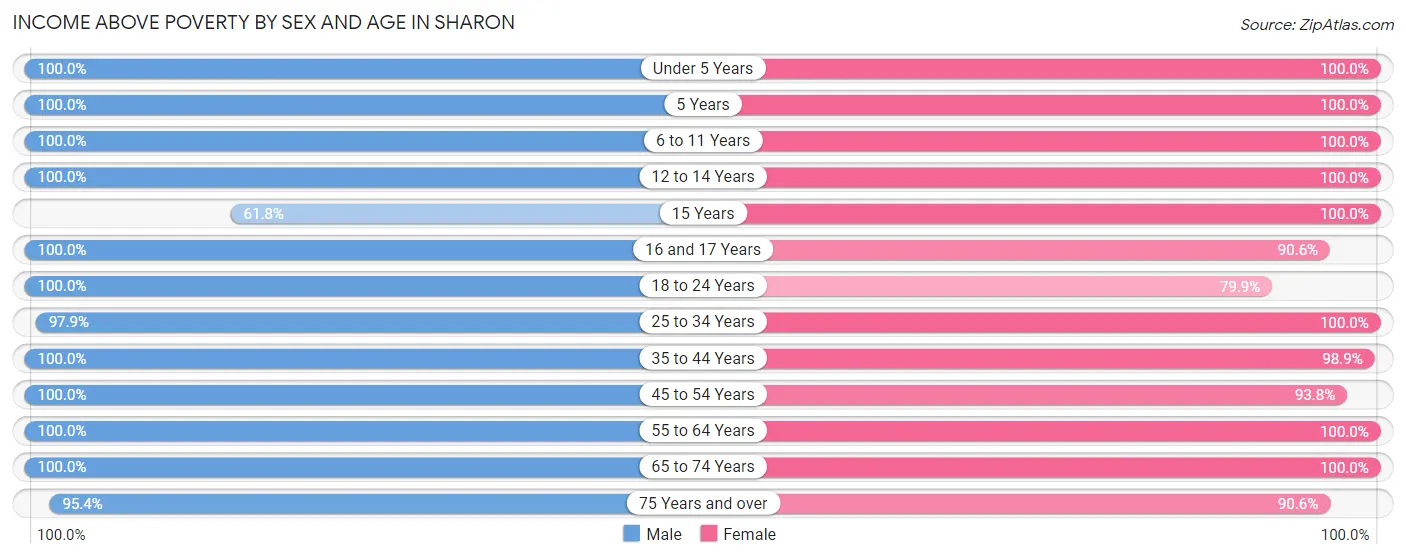
| Age Bracket | Male | Female |
| Under 5 Years | 193 (100.0%) | 237 (100.0%) |
| 5 Years | 75 (100.0%) | 38 (100.0%) |
| 6 to 11 Years | 310 (100.0%) | 327 (100.0%) |
| 12 to 14 Years | 146 (100.0%) | 137 (100.0%) |
| 15 Years | 42 (61.8%) | 36 (100.0%) |
| 16 and 17 Years | 117 (100.0%) | 77 (90.6%) |
| 18 to 24 Years | 164 (100.0%) | 111 (79.9%) |
| 25 to 34 Years | 237 (97.9%) | 291 (100.0%) |
| 35 to 44 Years | 355 (100.0%) | 436 (98.9%) |
| 45 to 54 Years | 469 (100.0%) | 452 (93.8%) |
| 55 to 64 Years | 339 (100.0%) | 325 (100.0%) |
| 65 to 74 Years | 325 (100.0%) | 367 (100.0%) |
| 75 Years and over | 165 (95.4%) | 87 (90.6%) |
| Total | 2,937 (98.7%) | 2,921 (97.3%) |
Income Below Poverty Among Married-Couple Families in Sharon
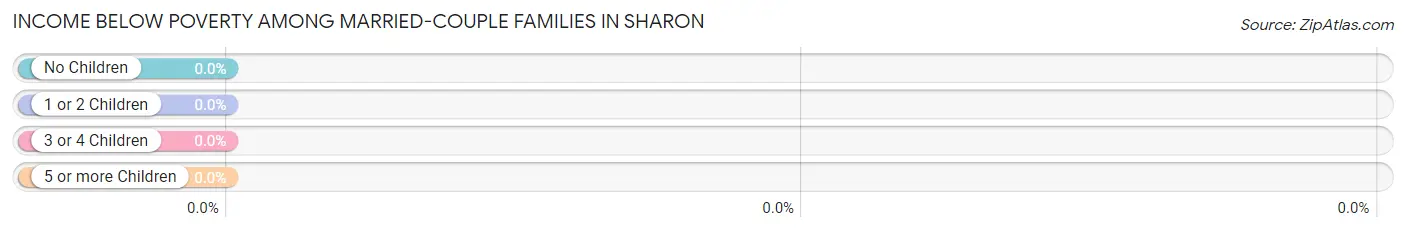
| Children | Above Poverty | Below Poverty |
| No Children | 730 (100.0%) | 0 (0.0%) |
| 1 or 2 Children | 640 (100.0%) | 0 (0.0%) |
| 3 or 4 Children | 123 (100.0%) | 0 (0.0%) |
| 5 or more Children | 33 (100.0%) | 0 (0.0%) |
| Total | 1,526 (100.0%) | 0 (0.0%) |
Income Below Poverty Among Single-Parent Households in Sharon
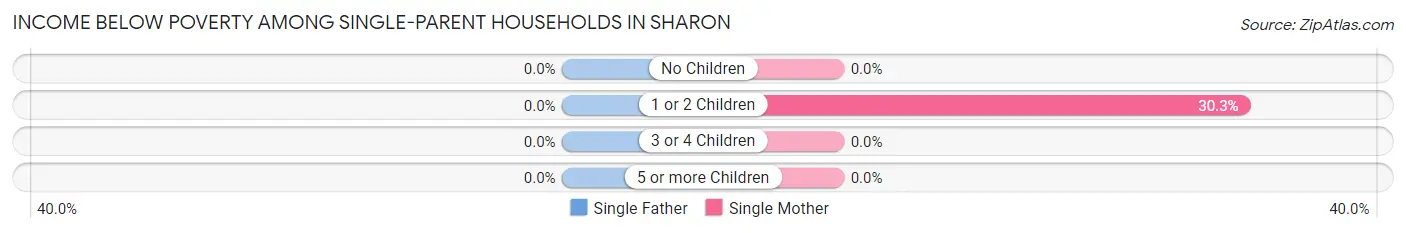
| Children | Single Father | Single Mother |
| No Children | 0 (0.0%) | 0 (0.0%) |
| 1 or 2 Children | 0 (0.0%) | 10 (30.3%) |
| 3 or 4 Children | 0 (0.0%) | 0 (0.0%) |
| 5 or more Children | 0 (0.0%) | 0 (0.0%) |
| Total | 0 (0.0%) | 10 (14.1%) |
Income Below Poverty Among Married-Couple vs Single-Parent Households in Sharon
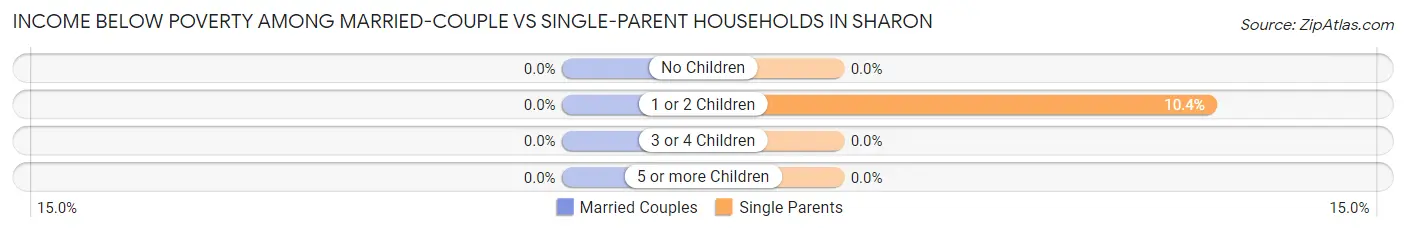
| Children | Married-Couple Families | Single-Parent Households |
| No Children | 0 (0.0%) | 0 (0.0%) |
| 1 or 2 Children | 0 (0.0%) | 10 (10.4%) |
| 3 or 4 Children | 0 (0.0%) | 0 (0.0%) |
| 5 or more Children | 0 (0.0%) | 0 (0.0%) |
| Total | 0 (0.0%) | 10 (6.2%) |
Race in Sharon
The most populous races in Sharon are White / Caucasian (4,707 | 78.7%), Asian (722 | 12.1%), and Two or more Races (328 | 5.5%).
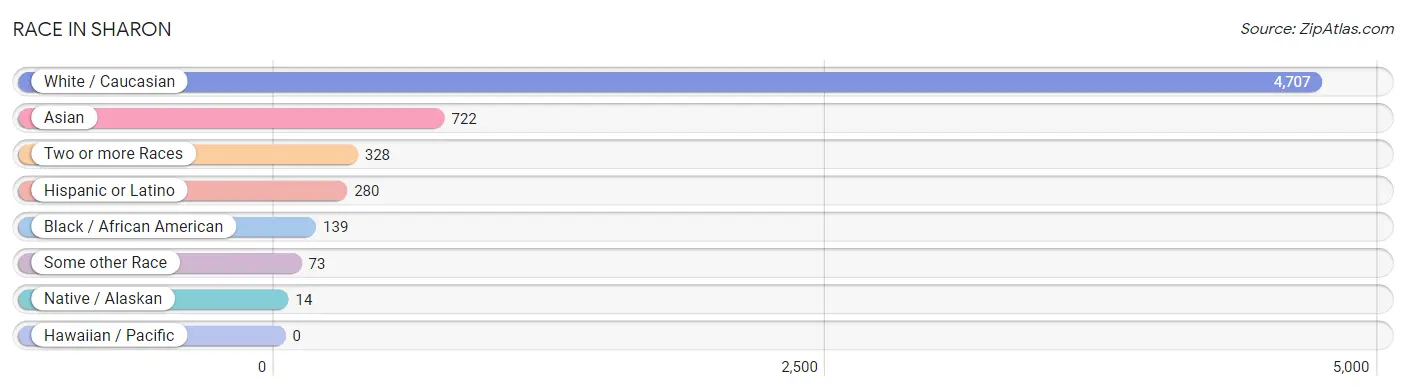
| Race | # Population | % Population |
| Asian | 722 | 12.1% |
| Black / African American | 139 | 2.3% |
| Hawaiian / Pacific | 0 | 0.0% |
| Hispanic or Latino | 280 | 4.7% |
| Native / Alaskan | 14 | 0.2% |
| White / Caucasian | 4,707 | 78.7% |
| Two or more Races | 328 | 5.5% |
| Some other Race | 73 | 1.2% |
| Total | 5,983 | 100.0% |
Ancestry in Sharon
The most populous ancestries reported in Sharon are Irish (800 | 13.4%), English (645 | 10.8%), Italian (591 | 9.9%), German (543 | 9.1%), and Russian (490 | 8.2%), together accounting for 51.3% of all Sharon residents.
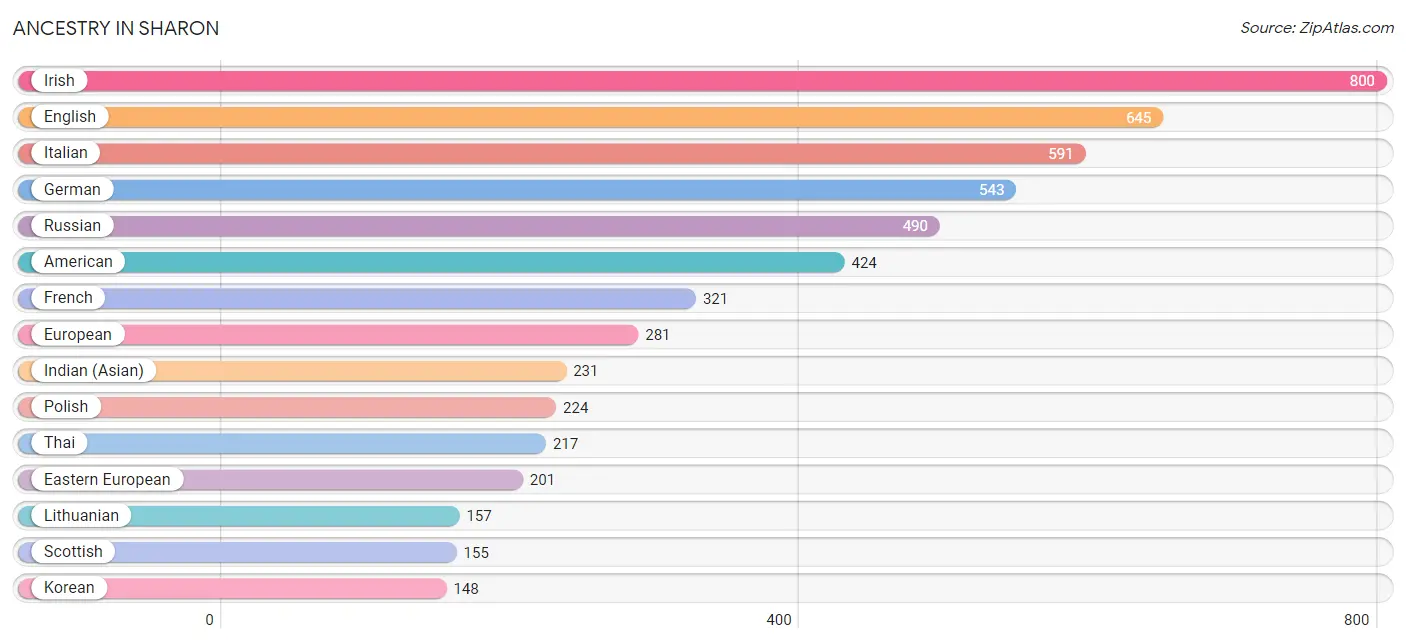
| Ancestry | # Population | % Population |
| Afghan | 26 | 0.4% |
| American | 424 | 7.1% |
| Arab | 130 | 2.2% |
| Armenian | 9 | 0.2% |
| Austrian | 13 | 0.2% |
| Bhutanese | 88 | 1.5% |
| Blackfeet | 55 | 0.9% |
| Brazilian | 20 | 0.3% |
| British | 15 | 0.3% |
| Burmese | 96 | 1.6% |
| Canadian | 41 | 0.7% |
| Cherokee | 68 | 1.1% |
| Croatian | 35 | 0.6% |
| Cuban | 102 | 1.7% |
| Czechoslovakian | 8 | 0.1% |
| Dominican | 40 | 0.7% |
| Dutch | 33 | 0.5% |
| Eastern European | 201 | 3.4% |
| Egyptian | 62 | 1.0% |
| English | 645 | 10.8% |
| Estonian | 10 | 0.2% |
| European | 281 | 4.7% |
| Finnish | 31 | 0.5% |
| French | 321 | 5.4% |
| French Canadian | 93 | 1.5% |
| German | 543 | 9.1% |
| Greek | 35 | 0.6% |
| Hungarian | 13 | 0.2% |
| Indian (Asian) | 231 | 3.9% |
| Iranian | 9 | 0.2% |
| Irish | 800 | 13.4% |
| Israeli | 29 | 0.5% |
| Italian | 591 | 9.9% |
| Japanese | 20 | 0.3% |
| Kenyan | 139 | 2.3% |
| Korean | 148 | 2.5% |
| Lebanese | 47 | 0.8% |
| Lithuanian | 157 | 2.6% |
| Norwegian | 85 | 1.4% |
| Polish | 224 | 3.7% |
| Portuguese | 91 | 1.5% |
| Puerto Rican | 118 | 2.0% |
| Romanian | 94 | 1.6% |
| Russian | 490 | 8.2% |
| Scandinavian | 10 | 0.2% |
| Scotch-Irish | 17 | 0.3% |
| Scottish | 155 | 2.6% |
| Serbian | 14 | 0.2% |
| Slavic | 18 | 0.3% |
| South American | 20 | 0.3% |
| Sri Lankan | 56 | 0.9% |
| Subsaharan African | 139 | 2.3% |
| Swedish | 44 | 0.7% |
| Swiss | 35 | 0.6% |
| Thai | 217 | 3.6% |
| Ukrainian | 55 | 0.9% |
| Uruguayan | 11 | 0.2% |
| Venezuelan | 9 | 0.2% |
| Welsh | 33 | 0.5% | View All 59 Rows |
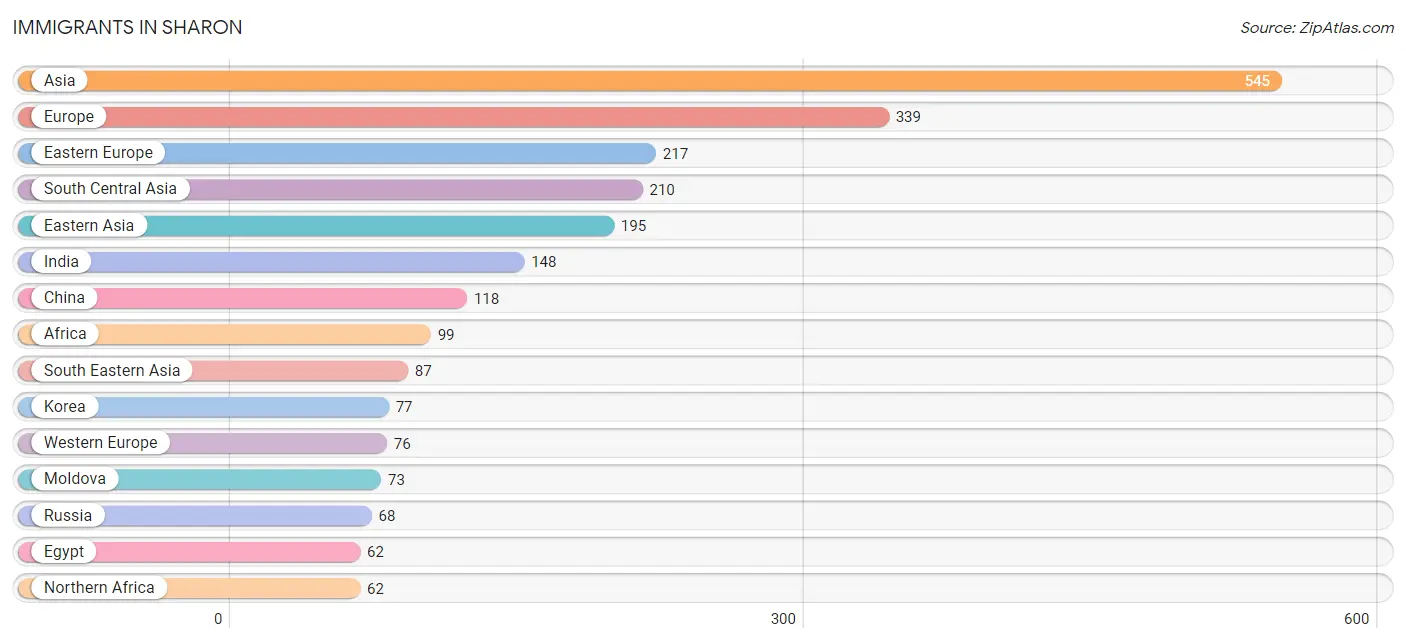
Immigrants in Sharon
The most numerous immigrant groups reported in Sharon came from Asia (545 | 9.1%), Europe (339 | 5.7%), Eastern Europe (217 | 3.6%), South Central Asia (210 | 3.5%), and Eastern Asia (195 | 3.3%), together accounting for 25.2% of all Sharon residents.
| Immigration Origin | # Population | % Population |
| Afghanistan | 26 | 0.4% |
| Africa | 99 | 1.7% |
| Argentina | 15 | 0.3% |
| Asia | 545 | 9.1% |
| Austria | 9 | 0.2% |
| Bangladesh | 17 | 0.3% |
| Belarus | 12 | 0.2% |
| Bosnia and Herzegovina | 15 | 0.3% |
| Brazil | 20 | 0.3% |
| Cambodia | 6 | 0.1% |
| Canada | 16 | 0.3% |
| China | 118 | 2.0% |
| Eastern Africa | 37 | 0.6% |
| Eastern Asia | 195 | 3.3% |
| Eastern Europe | 217 | 3.6% |
| Egypt | 62 | 1.0% |
| England | 26 | 0.4% |
| Europe | 339 | 5.7% |
| France | 25 | 0.4% |
| Germany | 35 | 0.6% |
| Hong Kong | 9 | 0.2% |
| India | 148 | 2.5% |
| Israel | 43 | 0.7% |
| Italy | 20 | 0.3% |
| Kazakhstan | 19 | 0.3% |
| Kenya | 37 | 0.6% |
| Korea | 77 | 1.3% |
| Latin America | 55 | 0.9% |
| Lebanon | 10 | 0.2% |
| Moldova | 73 | 1.2% |
| Netherlands | 7 | 0.1% |
| Northern Africa | 62 | 1.0% |
| Northern Europe | 26 | 0.4% |
| Philippines | 49 | 0.8% |
| Romania | 9 | 0.2% |
| Russia | 68 | 1.1% |
| South America | 55 | 0.9% |
| South Central Asia | 210 | 3.5% |
| South Eastern Asia | 87 | 1.5% |
| Southern Europe | 20 | 0.3% |
| Ukraine | 5 | 0.1% |
| Uruguay | 11 | 0.2% |
| Venezuela | 9 | 0.2% |
| Vietnam | 32 | 0.5% |
| Western Asia | 53 | 0.9% |
| Western Europe | 76 | 1.3% | View All 46 Rows |
Sex and Age in Sharon
Sex and Age in Sharon
The most populous age groups in Sharon are 5 to 9 Years (281 | 9.4%) for men and 35 to 39 Years (315 | 10.5%) for women.
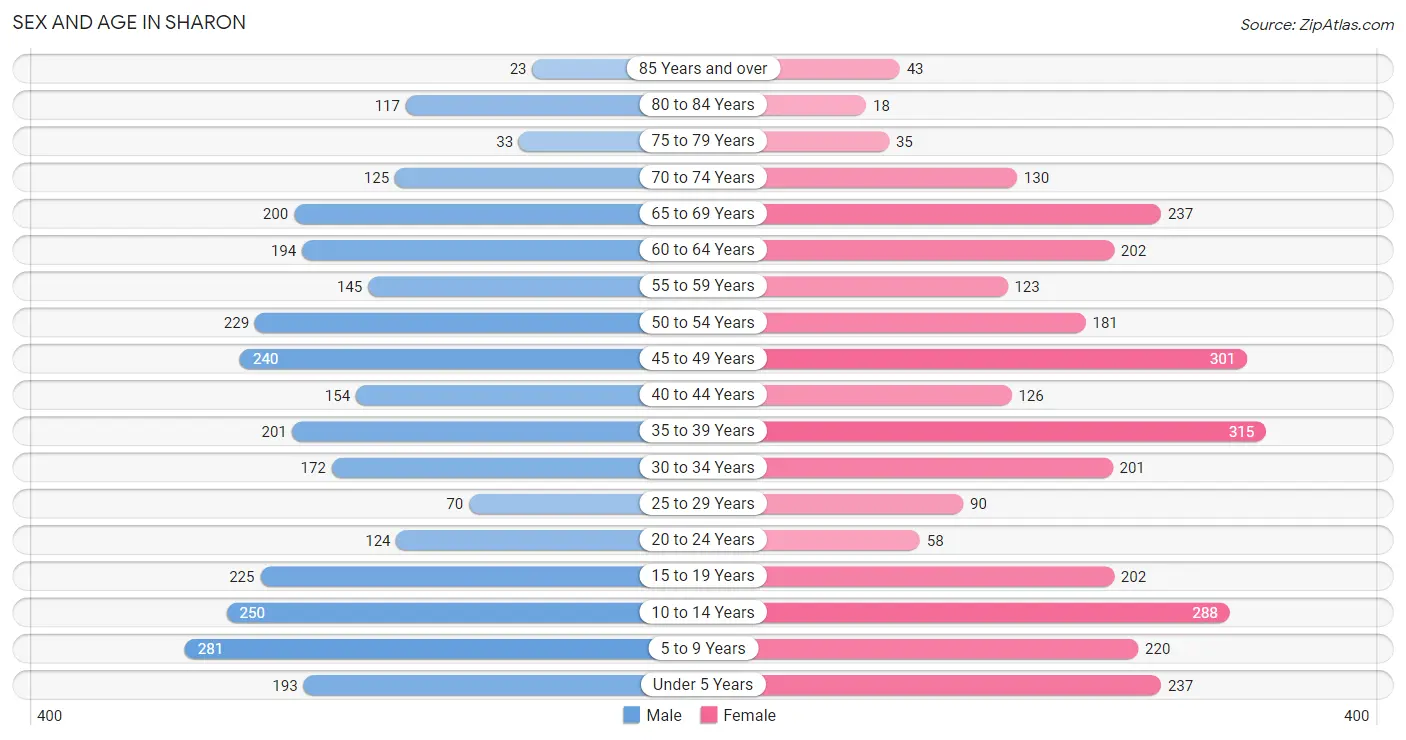
| Age Bracket | Male | Female |
| Under 5 Years | 193 (6.5%) | 237 (7.9%) |
| 5 to 9 Years | 281 (9.4%) | 220 (7.3%) |
| 10 to 14 Years | 250 (8.4%) | 288 (9.6%) |
| 15 to 19 Years | 225 (7.6%) | 202 (6.7%) |
| 20 to 24 Years | 124 (4.2%) | 58 (1.9%) |
| 25 to 29 Years | 70 (2.4%) | 90 (3.0%) |
| 30 to 34 Years | 172 (5.8%) | 201 (6.7%) |
| 35 to 39 Years | 201 (6.8%) | 315 (10.5%) |
| 40 to 44 Years | 154 (5.2%) | 126 (4.2%) |
| 45 to 49 Years | 240 (8.1%) | 301 (10.0%) |
| 50 to 54 Years | 229 (7.7%) | 181 (6.0%) |
| 55 to 59 Years | 145 (4.9%) | 123 (4.1%) |
| 60 to 64 Years | 194 (6.5%) | 202 (6.7%) |
| 65 to 69 Years | 200 (6.7%) | 237 (7.9%) |
| 70 to 74 Years | 125 (4.2%) | 130 (4.3%) |
| 75 to 79 Years | 33 (1.1%) | 35 (1.2%) |
| 80 to 84 Years | 117 (3.9%) | 18 (0.6%) |
| 85 Years and over | 23 (0.8%) | 43 (1.4%) |
| Total | 2,976 (100.0%) | 3,007 (100.0%) |
Families and Households in Sharon
Median Family Size in Sharon
The median family size in Sharon is 3.20 persons per family, with single female/mother families (71 | 4.2%) accounting for the largest median family size of 3.58 persons per family. On the other hand, single male/father families (91 | 5.4%) represent the smallest median family size with 2.44 persons per family.
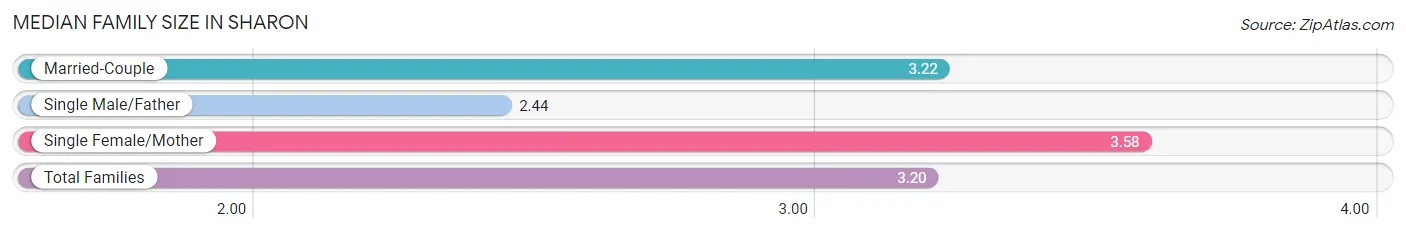
| Family Type | # Families | Family Size |
| Married-Couple | 1,526 (90.4%) | 3.22 |
| Single Male/Father | 91 (5.4%) | 2.44 |
| Single Female/Mother | 71 (4.2%) | 3.58 |
| Total Families | 1,688 (100.0%) | 3.20 |
Median Household Size in Sharon
The median household size in Sharon is 3.00 persons per household, with single female/mother households (71 | 3.6%) accounting for the largest median household size of 3.93 persons per household. non-family households (305 | 15.3%) represent the smallest median household size with 1.38 persons per household.
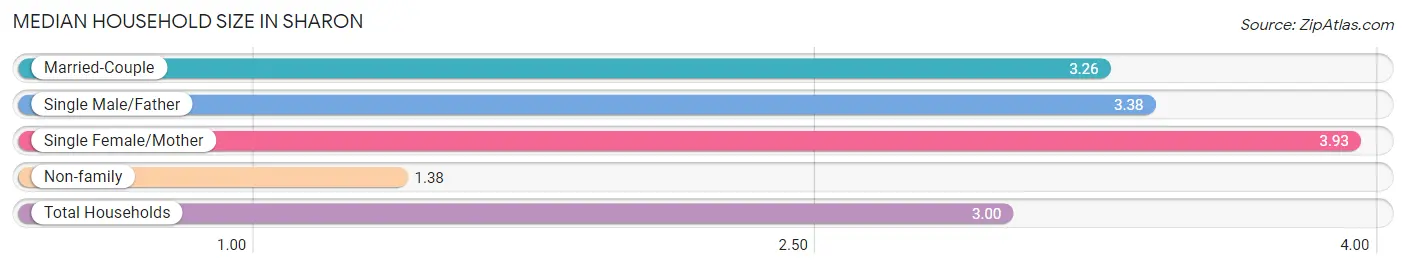
| Household Type | # Households | Household Size |
| Married-Couple | 1,526 (76.6%) | 3.26 |
| Single Male/Father | 91 (4.6%) | 3.38 |
| Single Female/Mother | 71 (3.6%) | 3.93 |
| Non-family | 305 (15.3%) | 1.38 |
| Total Households | 1,993 (100.0%) | 3.00 |
Household Size by Marriage Status in Sharon
Out of a total of 1,993 households in Sharon, 1,688 (84.7%) are family households, while 305 (15.3%) are nonfamily households. The most numerous type of family households are 2-person households, comprising 555, and the most common type of nonfamily households are 1-person households, comprising 219.
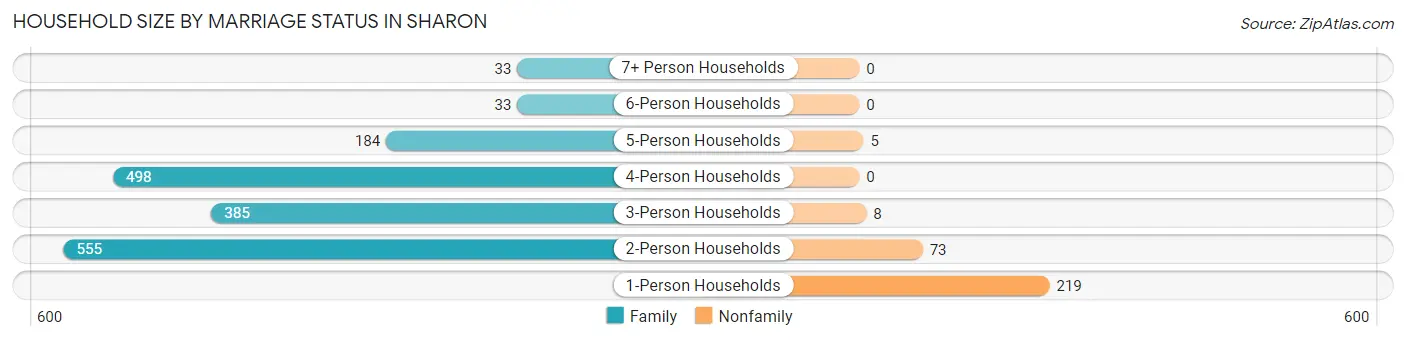
| Household Size | Family Households | Nonfamily Households |
| 1-Person Households | - | 219 (11.0%) |
| 2-Person Households | 555 (27.9%) | 73 (3.7%) |
| 3-Person Households | 385 (19.3%) | 8 (0.4%) |
| 4-Person Households | 498 (25.0%) | 0 (0.0%) |
| 5-Person Households | 184 (9.2%) | 5 (0.3%) |
| 6-Person Households | 33 (1.7%) | 0 (0.0%) |
| 7+ Person Households | 33 (1.7%) | 0 (0.0%) |
| Total | 1,688 (84.7%) | 305 (15.3%) |
Female Fertility in Sharon
Fertility by Age in Sharon
Average fertility rate in Sharon is 33.0 births per 1,000 women. Women in the age bracket of 20 to 34 years have the highest fertility rate with 97.0 births per 1,000 women. Women in the age bracket of 20 to 34 years acount for 77.3% of all women with births.
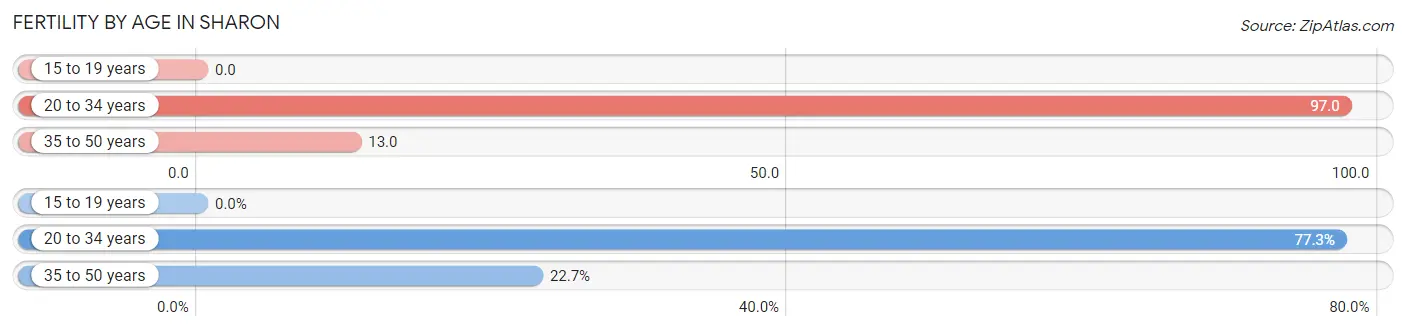
| Age Bracket | Women with Births | Births / 1,000 Women |
| 15 to 19 years | 0 (0.0%) | 0.0 |
| 20 to 34 years | 34 (77.3%) | 97.0 |
| 35 to 50 years | 10 (22.7%) | 13.0 |
| Total | 44 (100.0%) | 33.0 |
Fertility by Age by Marriage Status in Sharon
72.7% of women with births (44) in Sharon are married. The highest percentage of unmarried women with births falls into 20 to 34 years age bracket with 35.3% of them unmarried at the time of birth, while the lowest percentage of unmarried women with births belong to 35 to 50 years age bracket with 0.0% of them unmarried.

| Age Bracket | Married | Unmarried |
| 15 to 19 years | 0 (0.0%) | 0 (0.0%) |
| 20 to 34 years | 22 (64.7%) | 12 (35.3%) |
| 35 to 50 years | 10 (100.0%) | 0 (0.0%) |
| Total | 32 (72.7%) | 12 (27.3%) |
Fertility by Education in Sharon
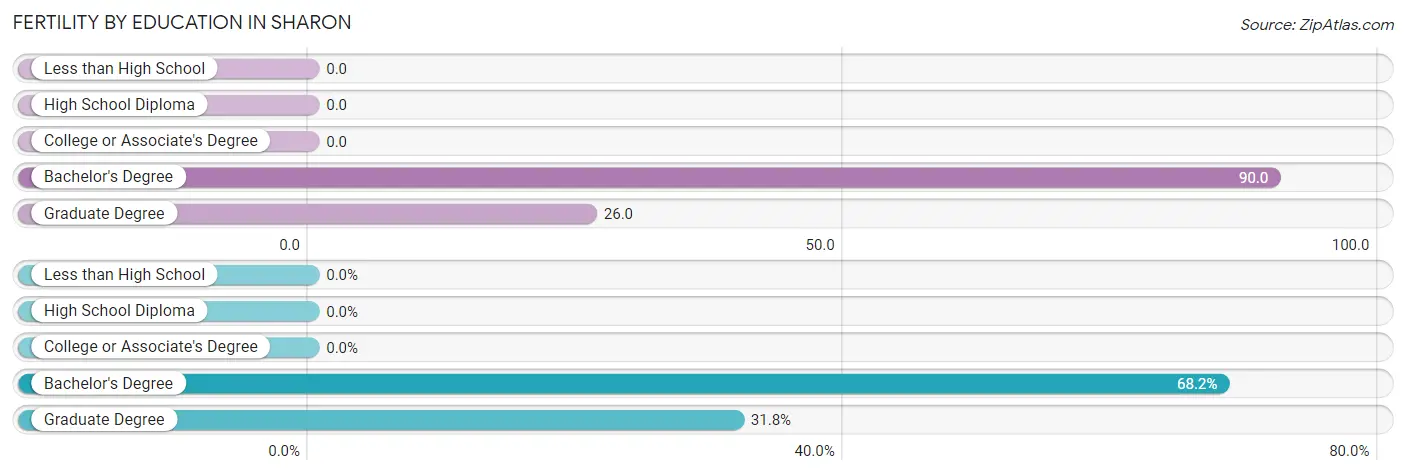
| Educational Attainment | Women with Births | Births / 1,000 Women |
| Less than High School | 0 (0.0%) | 0.0 |
| High School Diploma | 0 (0.0%) | 0.0 |
| College or Associate's Degree | 0 (0.0%) | 0.0 |
| Bachelor's Degree | 30 (68.2%) | 90.0 |
| Graduate Degree | 14 (31.8%) | 26.0 |
| Total | 44 (100.0%) | 33.0 |
Fertility by Education by Marriage Status in Sharon
27.3% of women with births in Sharon are unmarried. Women with the educational attainment of graduate degree are most likely to be married with 100.0% of them married at childbirth, while women with the educational attainment of bachelor's degree are least likely to be married with 40.0% of them unmarried at childbirth.
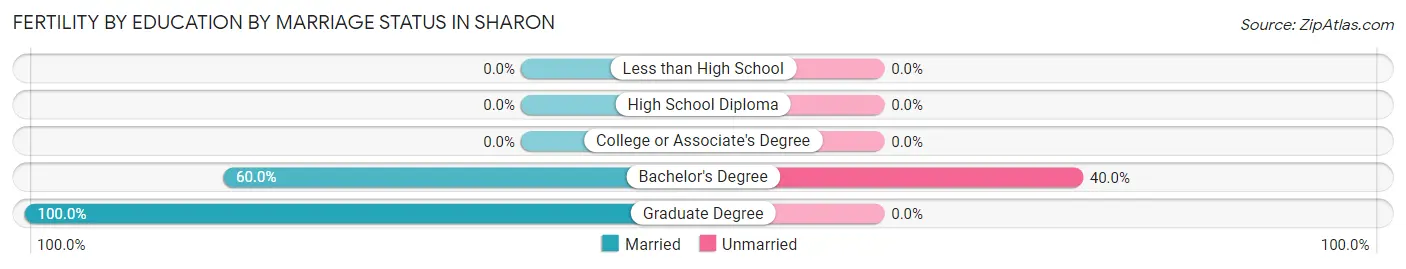
| Educational Attainment | Married | Unmarried |
| Less than High School | 0 (0.0%) | 0 (0.0%) |
| High School Diploma | 0 (0.0%) | 0 (0.0%) |
| College or Associate's Degree | 0 (0.0%) | 0 (0.0%) |
| Bachelor's Degree | 18 (60.0%) | 12 (40.0%) |
| Graduate Degree | 14 (100.0%) | 0 (0.0%) |
| Total | 32 (72.7%) | 12 (27.3%) |
Employment Characteristics in Sharon
Employment by Class of Employer in Sharon
Among the 3,002 employed individuals in Sharon, private company employees (1,855 | 61.8%), not-for-profit organizations (563 | 18.8%), and local government employees (147 | 4.9%) make up the most common classes of employment.
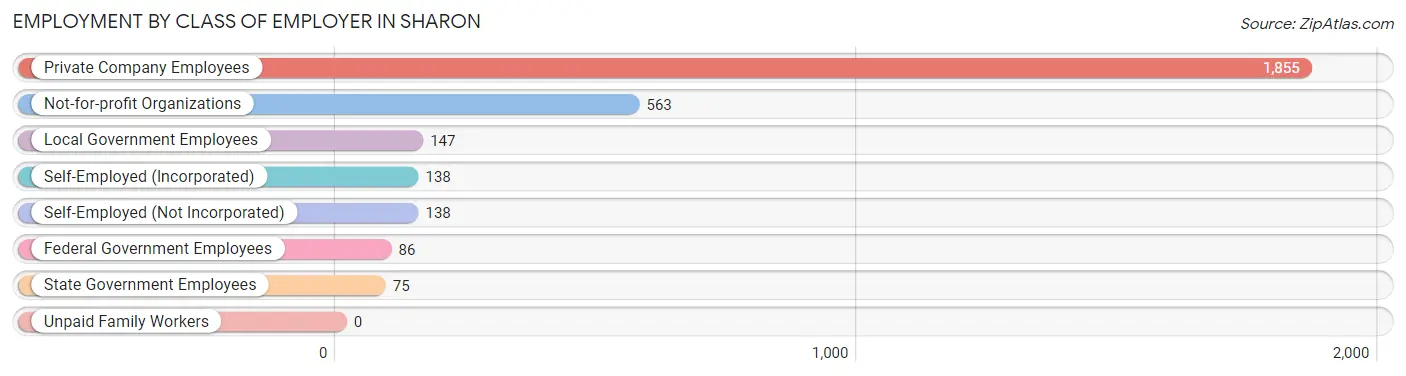
| Employer Class | # Employees | % Employees |
| Private Company Employees | 1,855 | 61.8% |
| Self-Employed (Incorporated) | 138 | 4.6% |
| Self-Employed (Not Incorporated) | 138 | 4.6% |
| Not-for-profit Organizations | 563 | 18.8% |
| Local Government Employees | 147 | 4.9% |
| State Government Employees | 75 | 2.5% |
| Federal Government Employees | 86 | 2.9% |
| Unpaid Family Workers | 0 | 0.0% |
| Total | 3,002 | 100.0% |
Employment Status by Age in Sharon
According to the labor force statistics for Sharon, out of the total population over 16 years of age (4,410), 71.0% or 3,131 individuals are in the labor force, with 3.1% or 97 of them unemployed. The age group with the highest labor force participation rate is 55 to 59 years, with 95.5% or 256 individuals in the labor force. Within the labor force, the 20 to 24 years age range has the highest percentage of unemployed individuals, with 23.3% or 40 of them being unemployed.
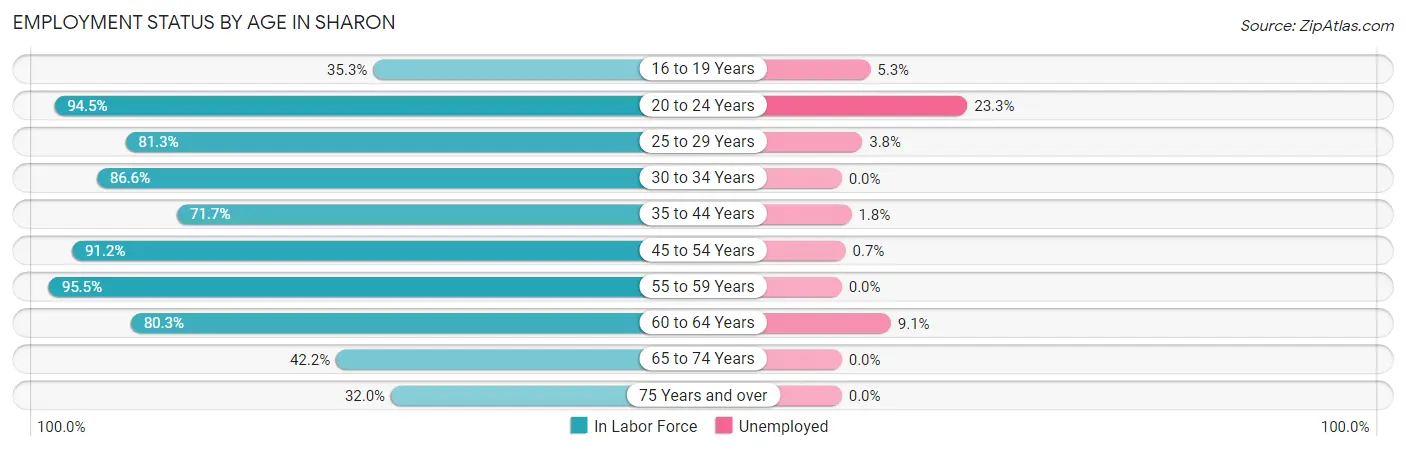
| Age Bracket | In Labor Force | Unemployed |
| 16 to 19 Years | 114 (35.3%) | 6 (5.3%) |
| 20 to 24 Years | 172 (94.5%) | 40 (23.3%) |
| 25 to 29 Years | 130 (81.3%) | 5 (3.8%) |
| 30 to 34 Years | 323 (86.6%) | 0 (0.0%) |
| 35 to 44 Years | 571 (71.7%) | 10 (1.8%) |
| 45 to 54 Years | 867 (91.2%) | 6 (0.7%) |
| 55 to 59 Years | 256 (95.5%) | 0 (0.0%) |
| 60 to 64 Years | 318 (80.3%) | 29 (9.1%) |
| 65 to 74 Years | 292 (42.2%) | 0 (0.0%) |
| 75 Years and over | 86 (32.0%) | 0 (0.0%) |
| Total | 3,131 (71.0%) | 97 (3.1%) |
Employment Status by Educational Attainment in Sharon
According to labor force statistics for Sharon, 83.7% of individuals (2,464) out of the total population between 25 and 64 years of age (2,944) are in the labor force, with 2.1% or 52 of them being unemployed. The group with the highest labor force participation rate are those with the educational attainment of less than high school, with 88.9% or 40 individuals in the labor force. Within the labor force, individuals with college / associate degree education have the highest percentage of unemployment, with 11.6% or 34 of them being unemployed.
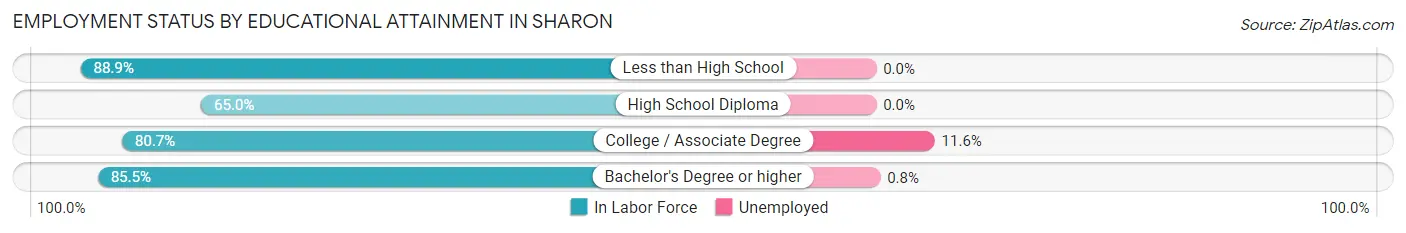
| Educational Attainment | In Labor Force | Unemployed |
| Less than High School | 40 (88.9%) | 0 (0.0%) |
| High School Diploma | 115 (65.0%) | 0 (0.0%) |
| College / Associate Degree | 292 (80.7%) | 42 (11.6%) |
| Bachelor's Degree or higher | 2,018 (85.5%) | 19 (0.8%) |
| Total | 2,464 (83.7%) | 62 (2.1%) |
Employment Occupations by Sex in Sharon
Management, Business, Science and Arts Occupations
The most common Management, Business, Science and Arts occupations in Sharon are Management (581 | 19.4%), Community & Social Service (504 | 16.9%), Computers, Engineering & Science (501 | 16.8%), Business & Financial (292 | 9.8%), and Education Instruction & Library (258 | 8.6%).
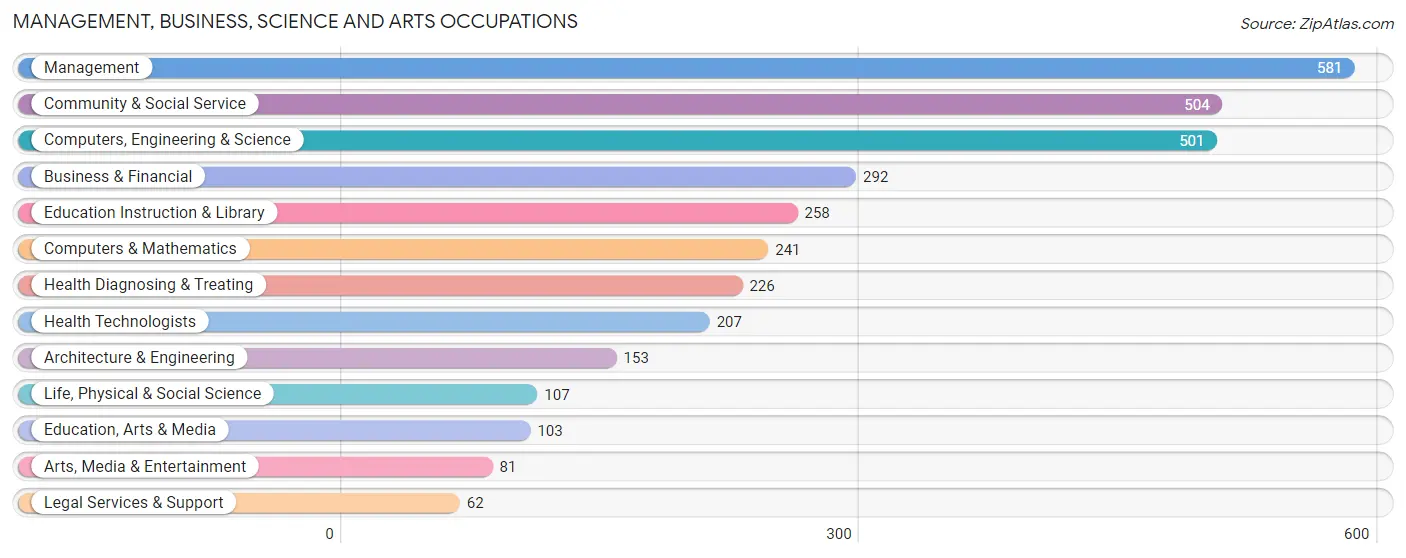
Management, Business, Science and Arts Occupations by Sex
Within the Management, Business, Science and Arts occupations in Sharon, the most male-oriented occupations are Architecture & Engineering (100.0%), Computers, Engineering & Science (80.4%), and Life, Physical & Social Science (80.4%), while the most female-oriented occupations are Education Instruction & Library (82.6%), Business & Financial (70.6%), and Community & Social Service (66.1%).
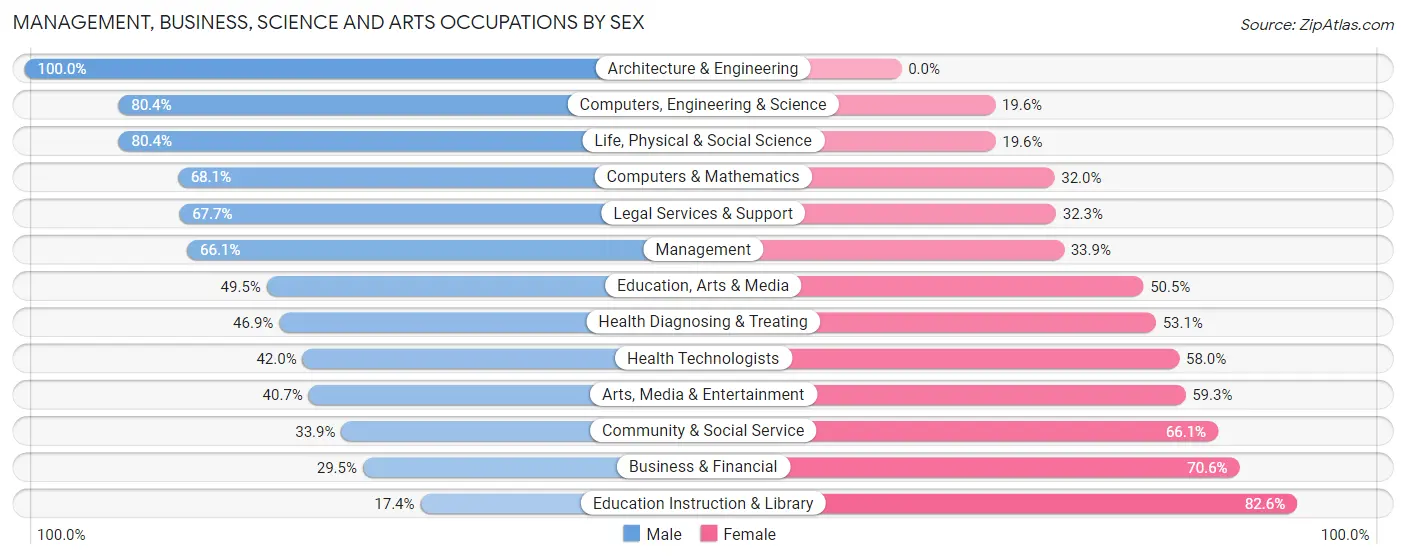
| Occupation | Male | Female |
| Management | 384 (66.1%) | 197 (33.9%) |
| Business & Financial | 86 (29.4%) | 206 (70.6%) |
| Computers, Engineering & Science | 403 (80.4%) | 98 (19.6%) |
| Computers & Mathematics | 164 (68.0%) | 77 (32.0%) |
| Architecture & Engineering | 153 (100.0%) | 0 (0.0%) |
| Life, Physical & Social Science | 86 (80.4%) | 21 (19.6%) |
| Community & Social Service | 171 (33.9%) | 333 (66.1%) |
| Education, Arts & Media | 51 (49.5%) | 52 (50.5%) |
| Legal Services & Support | 42 (67.7%) | 20 (32.3%) |
| Education Instruction & Library | 45 (17.4%) | 213 (82.6%) |
| Arts, Media & Entertainment | 33 (40.7%) | 48 (59.3%) |
| Health Diagnosing & Treating | 106 (46.9%) | 120 (53.1%) |
| Health Technologists | 87 (42.0%) | 120 (58.0%) |
| Total (Category) | 1,150 (54.7%) | 954 (45.3%) |
| Total (Overall) | 1,658 (55.4%) | 1,333 (44.6%) |
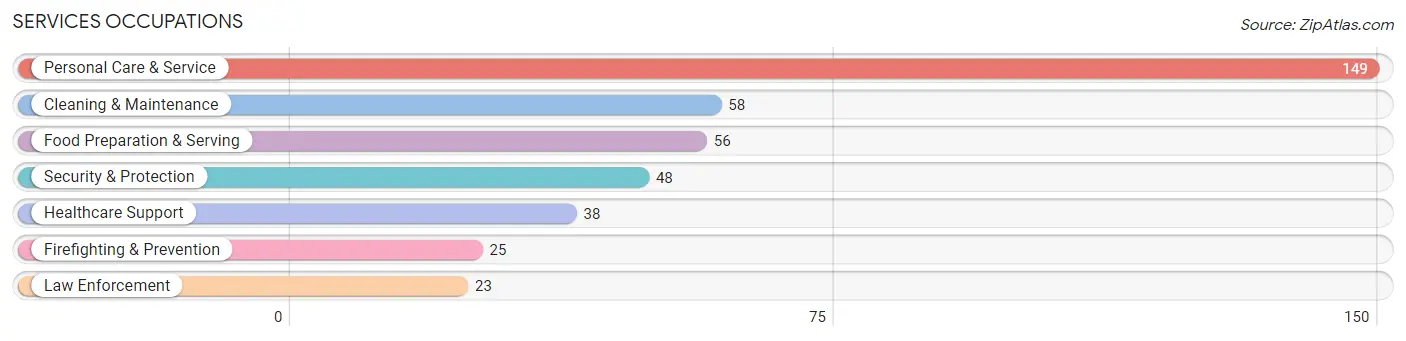
Services Occupations
The most common Services occupations in Sharon are Personal Care & Service (149 | 5.0%), Cleaning & Maintenance (58 | 1.9%), Food Preparation & Serving (56 | 1.9%), Security & Protection (48 | 1.6%), and Healthcare Support (38 | 1.3%).
Services Occupations by Sex
Within the Services occupations in Sharon, the most male-oriented occupations are Firefighting & Prevention (100.0%), Cleaning & Maintenance (100.0%), and Healthcare Support (65.8%), while the most female-oriented occupations are Law Enforcement (100.0%), Food Preparation & Serving (66.1%), and Personal Care & Service (65.1%).
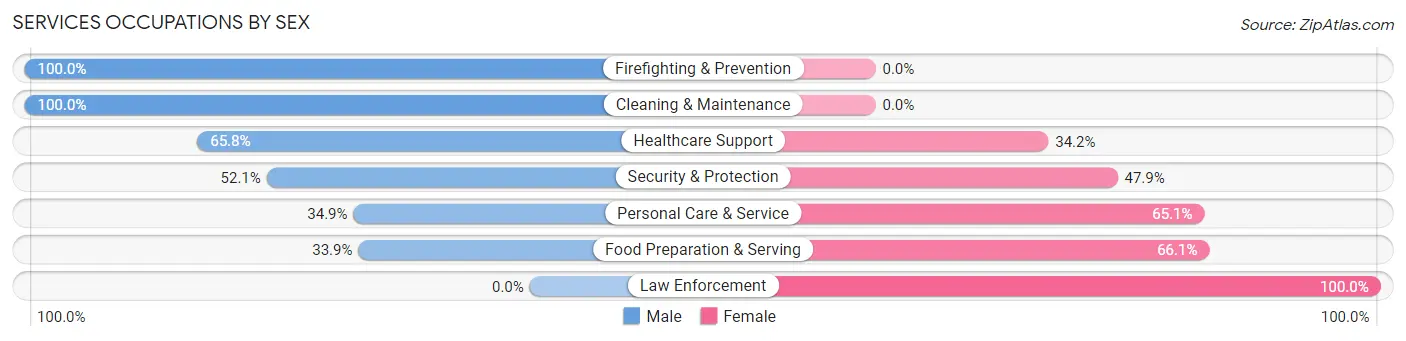
| Occupation | Male | Female |
| Healthcare Support | 25 (65.8%) | 13 (34.2%) |
| Security & Protection | 25 (52.1%) | 23 (47.9%) |
| Firefighting & Prevention | 25 (100.0%) | 0 (0.0%) |
| Law Enforcement | 0 (0.0%) | 23 (100.0%) |
| Food Preparation & Serving | 19 (33.9%) | 37 (66.1%) |
| Cleaning & Maintenance | 58 (100.0%) | 0 (0.0%) |
| Personal Care & Service | 52 (34.9%) | 97 (65.1%) |
| Total (Category) | 179 (51.3%) | 170 (48.7%) |
| Total (Overall) | 1,658 (55.4%) | 1,333 (44.6%) |
Sales and Office Occupations
The most common Sales and Office occupations in Sharon are Sales & Related (301 | 10.1%), and Office & Administration (116 | 3.9%).

Sales and Office Occupations by Sex
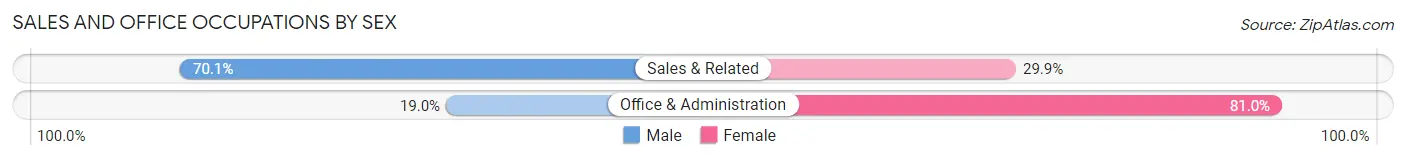
| Occupation | Male | Female |
| Sales & Related | 211 (70.1%) | 90 (29.9%) |
| Office & Administration | 22 (19.0%) | 94 (81.0%) |
| Total (Category) | 233 (55.9%) | 184 (44.1%) |
| Total (Overall) | 1,658 (55.4%) | 1,333 (44.6%) |
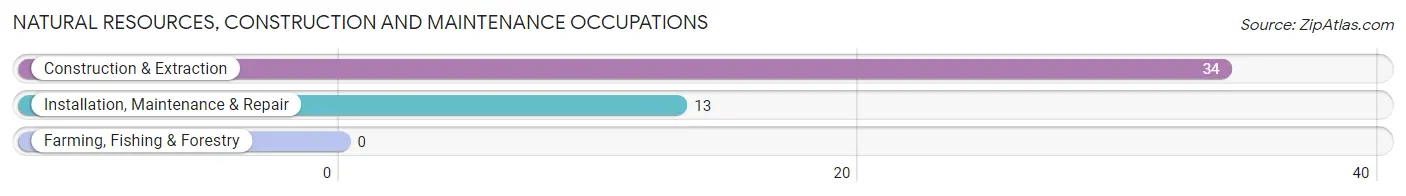
Natural Resources, Construction and Maintenance Occupations
The most common Natural Resources, Construction and Maintenance occupations in Sharon are Construction & Extraction (34 | 1.1%), and Installation, Maintenance & Repair (13 | 0.4%).
Natural Resources, Construction and Maintenance Occupations by Sex
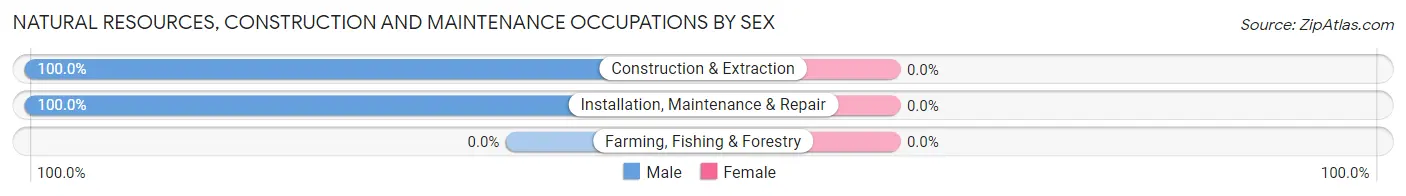
| Occupation | Male | Female |
| Farming, Fishing & Forestry | 0 (0.0%) | 0 (0.0%) |
| Construction & Extraction | 34 (100.0%) | 0 (0.0%) |
| Installation, Maintenance & Repair | 13 (100.0%) | 0 (0.0%) |
| Total (Category) | 47 (100.0%) | 0 (0.0%) |
| Total (Overall) | 1,658 (55.4%) | 1,333 (44.6%) |
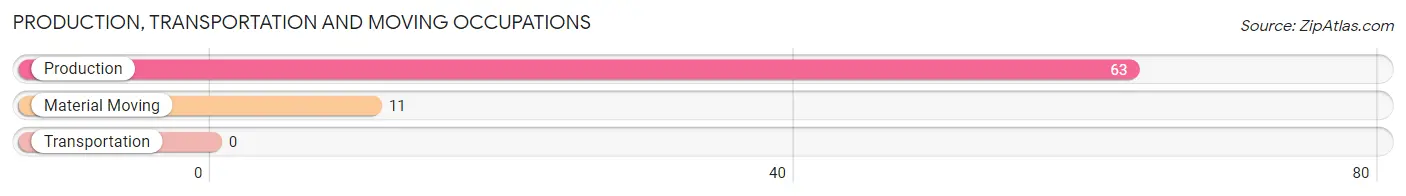
Production, Transportation and Moving Occupations
The most common Production, Transportation and Moving occupations in Sharon are Production (63 | 2.1%), and Material Moving (11 | 0.4%).
Production, Transportation and Moving Occupations by Sex
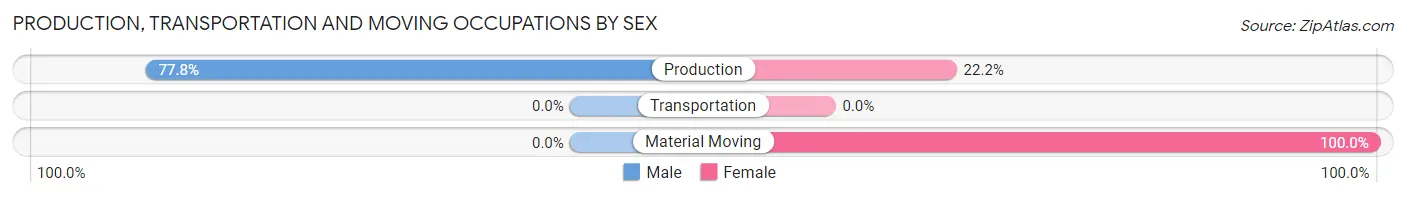
| Occupation | Male | Female |
| Production | 49 (77.8%) | 14 (22.2%) |
| Transportation | 0 (0.0%) | 0 (0.0%) |
| Material Moving | 0 (0.0%) | 11 (100.0%) |
| Total (Category) | 49 (66.2%) | 25 (33.8%) |
| Total (Overall) | 1,658 (55.4%) | 1,333 (44.6%) |
Employment Industries by Sex in Sharon
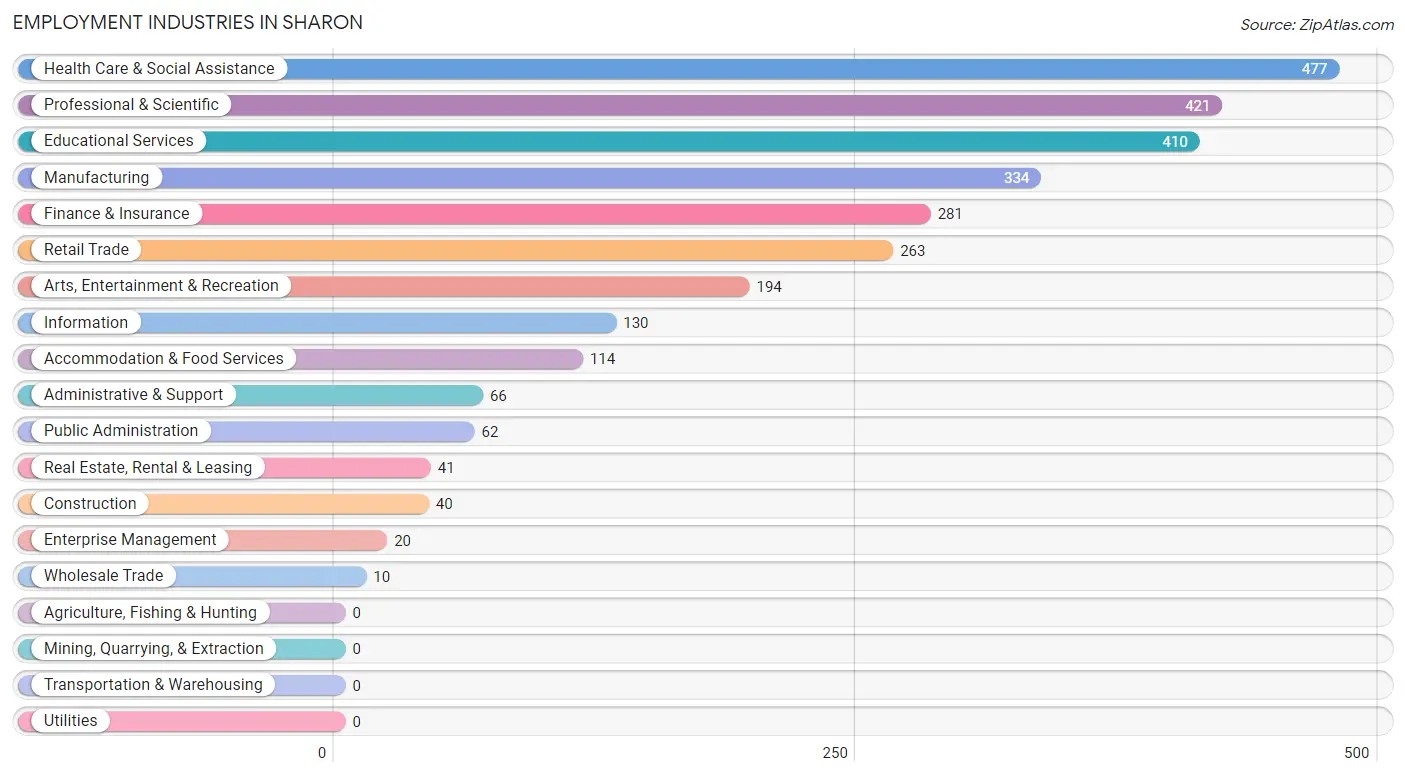
Employment Industries in Sharon
The major employment industries in Sharon include Health Care & Social Assistance (477 | 16.0%), Professional & Scientific (421 | 14.1%), Educational Services (410 | 13.7%), Manufacturing (334 | 11.2%), and Finance & Insurance (281 | 9.4%).
Employment Industries by Sex in Sharon
The Sharon industries that see more men than women are Construction (100.0%), Wholesale Trade (100.0%), and Manufacturing (82.0%), whereas the industries that tend to have a higher number of women are Enterprise Management (100.0%), Administrative & Support (90.9%), and Educational Services (71.7%).
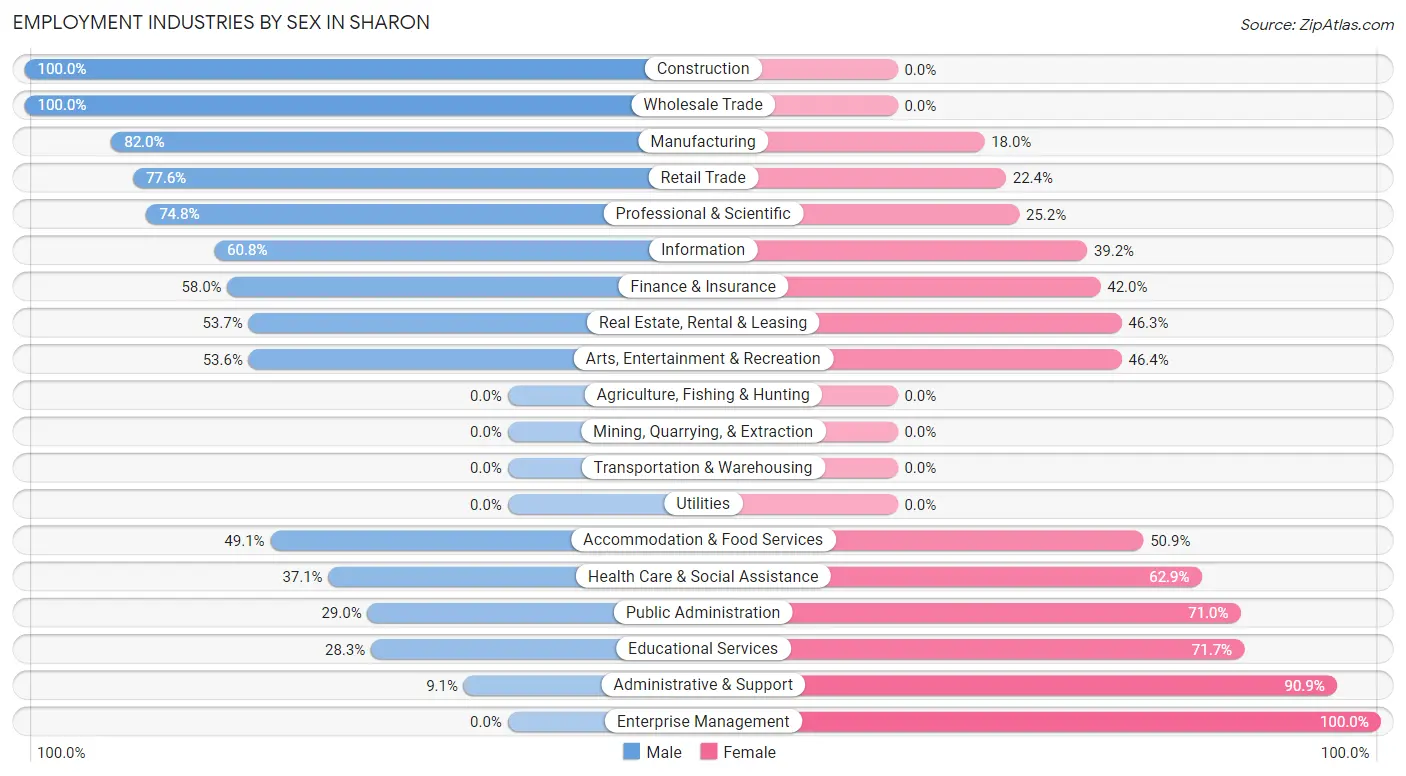
| Industry | Male | Female |
| Agriculture, Fishing & Hunting | 0 (0.0%) | 0 (0.0%) |
| Mining, Quarrying, & Extraction | 0 (0.0%) | 0 (0.0%) |
| Construction | 40 (100.0%) | 0 (0.0%) |
| Manufacturing | 274 (82.0%) | 60 (18.0%) |
| Wholesale Trade | 10 (100.0%) | 0 (0.0%) |
| Retail Trade | 204 (77.6%) | 59 (22.4%) |
| Transportation & Warehousing | 0 (0.0%) | 0 (0.0%) |
| Utilities | 0 (0.0%) | 0 (0.0%) |
| Information | 79 (60.8%) | 51 (39.2%) |
| Finance & Insurance | 163 (58.0%) | 118 (42.0%) |
| Real Estate, Rental & Leasing | 22 (53.7%) | 19 (46.3%) |
| Professional & Scientific | 315 (74.8%) | 106 (25.2%) |
| Enterprise Management | 0 (0.0%) | 20 (100.0%) |
| Administrative & Support | 6 (9.1%) | 60 (90.9%) |
| Educational Services | 116 (28.3%) | 294 (71.7%) |
| Health Care & Social Assistance | 177 (37.1%) | 300 (62.9%) |
| Arts, Entertainment & Recreation | 104 (53.6%) | 90 (46.4%) |
| Accommodation & Food Services | 56 (49.1%) | 58 (50.9%) |
| Public Administration | 18 (29.0%) | 44 (71.0%) |
| Total | 1,658 (55.4%) | 1,333 (44.6%) |
Education in Sharon
School Enrollment in Sharon
The most common levels of schooling among the 1,687 students in Sharon are elementary school (413 | 24.5%), middle school (410 | 24.3%), and high school (392 | 23.2%).
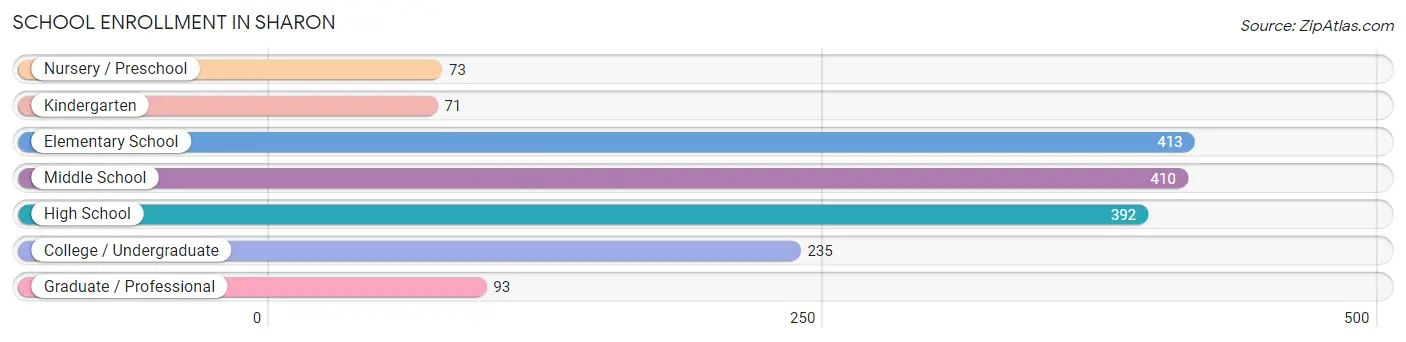
| School Level | # Students | % Students |
| Nursery / Preschool | 73 | 4.3% |
| Kindergarten | 71 | 4.2% |
| Elementary School | 413 | 24.5% |
| Middle School | 410 | 24.3% |
| High School | 392 | 23.2% |
| College / Undergraduate | 235 | 13.9% |
| Graduate / Professional | 93 | 5.5% |
| Total | 1,687 | 100.0% |
School Enrollment by Age by Funding Source in Sharon
Out of a total of 1,687 students who are enrolled in schools in Sharon, 388 (23.0%) attend a private institution, while the remaining 1,299 (77.0%) are enrolled in public schools. The age group of 3 to 4 year olds has the highest likelihood of being enrolled in private schools, with 19 (100.0% in the age bracket) enrolled. Conversely, the age group of 10 to 14 year olds has the lowest likelihood of being enrolled in a private school, with 490 (91.1% in the age bracket) attending a public institution.
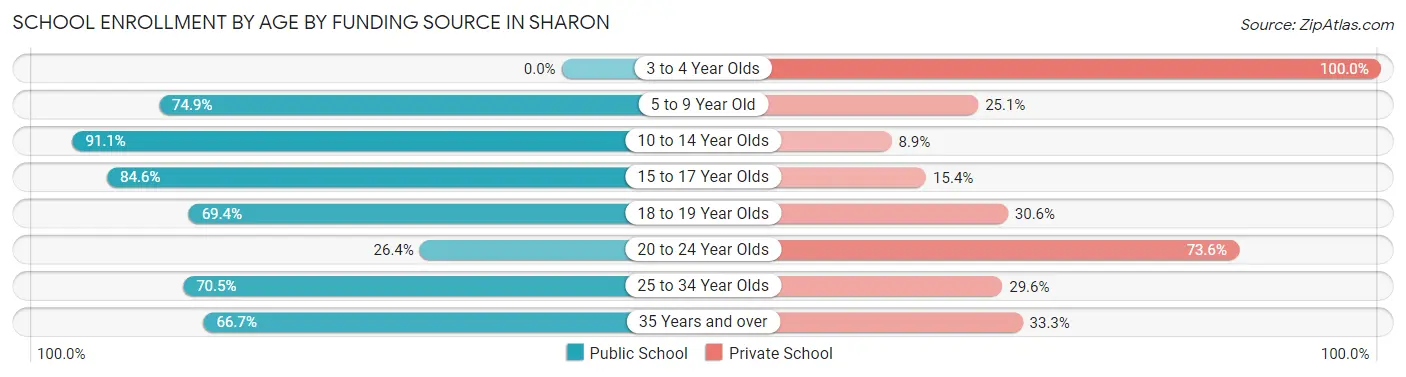
| Age Bracket | Public School | Private School |
| 3 to 4 Year Olds | 0 (0.0%) | 19 (100.0%) |
| 5 to 9 Year Old | 332 (74.9%) | 111 (25.1%) |
| 10 to 14 Year Olds | 490 (91.1%) | 48 (8.9%) |
| 15 to 17 Year Olds | 259 (84.6%) | 47 (15.4%) |
| 18 to 19 Year Olds | 84 (69.4%) | 37 (30.6%) |
| 20 to 24 Year Olds | 28 (26.4%) | 78 (73.6%) |
| 25 to 34 Year Olds | 62 (70.5%) | 26 (29.5%) |
| 35 Years and over | 44 (66.7%) | 22 (33.3%) |
| Total | 1,299 (77.0%) | 388 (23.0%) |
Educational Attainment by Field of Study in Sharon
Business (521 | 15.5%), visual & performing arts (392 | 11.6%), social sciences (328 | 9.7%), bio, nature & agricultural (325 | 9.6%), and literature & languages (258 | 7.6%) are the most common fields of study among 3,371 individuals in Sharon who have obtained a bachelor's degree or higher.
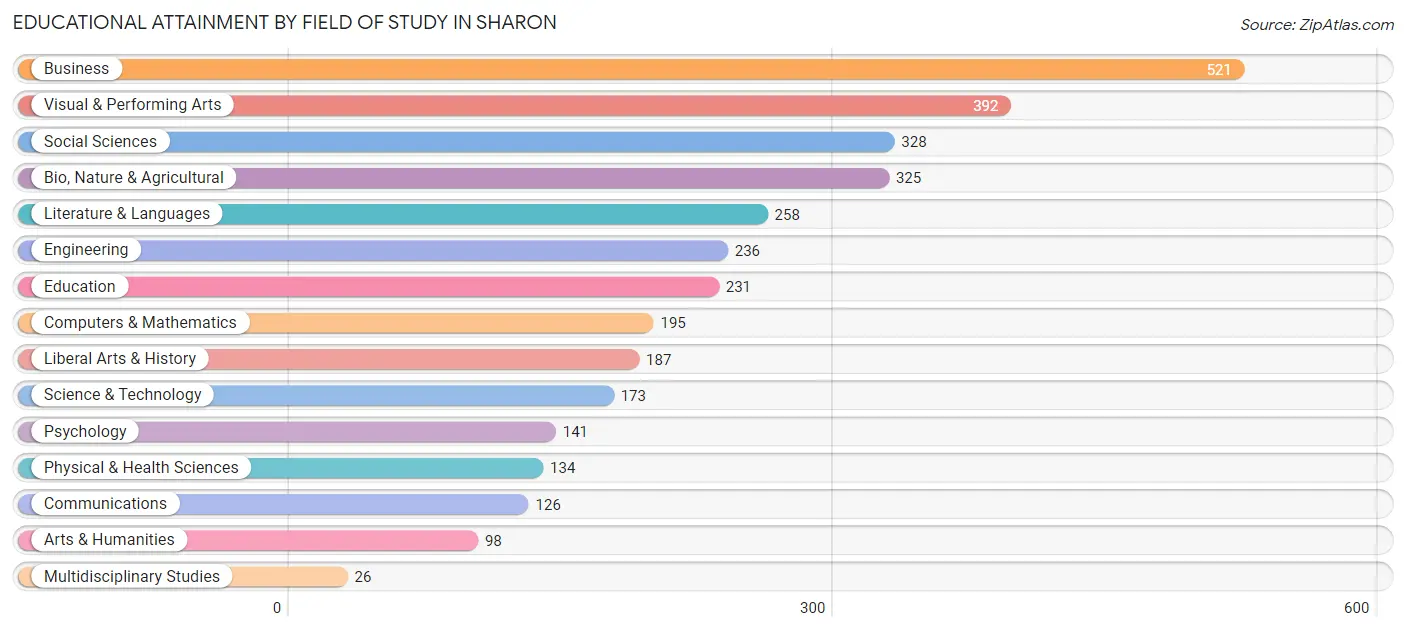
| Field of Study | # Graduates | % Graduates |
| Computers & Mathematics | 195 | 5.8% |
| Bio, Nature & Agricultural | 325 | 9.6% |
| Physical & Health Sciences | 134 | 4.0% |
| Psychology | 141 | 4.2% |
| Social Sciences | 328 | 9.7% |
| Engineering | 236 | 7.0% |
| Multidisciplinary Studies | 26 | 0.8% |
| Science & Technology | 173 | 5.1% |
| Business | 521 | 15.5% |
| Education | 231 | 6.9% |
| Literature & Languages | 258 | 7.6% |
| Liberal Arts & History | 187 | 5.6% |
| Visual & Performing Arts | 392 | 11.6% |
| Communications | 126 | 3.7% |
| Arts & Humanities | 98 | 2.9% |
| Total | 3,371 | 100.0% |
Transportation & Commute in Sharon
Vehicle Availability by Sex in Sharon
The most prevalent vehicle ownership categories in Sharon are males with 2 vehicles (879, accounting for 53.2%) and females with 2 vehicles (866, making up 65.1%).
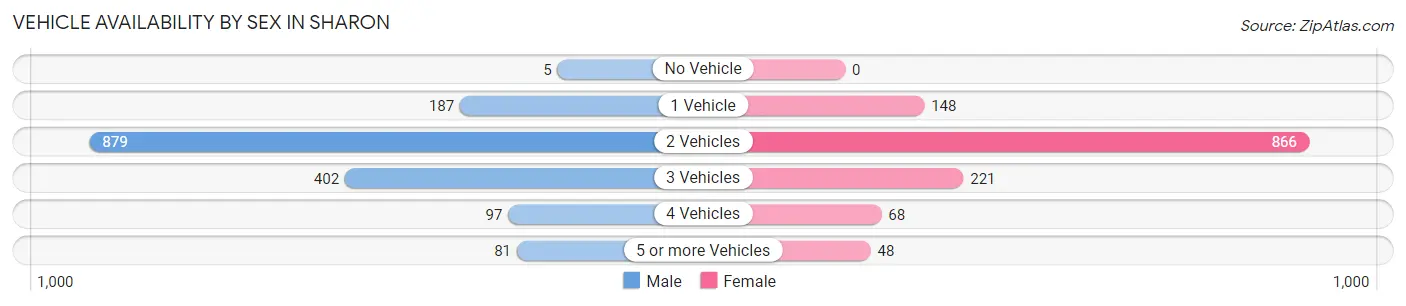
| Vehicles Available | Male | Female |
| No Vehicle | 5 (0.3%) | 0 (0.0%) |
| 1 Vehicle | 187 (11.3%) | 148 (11.0%) |
| 2 Vehicles | 879 (53.2%) | 866 (64.1%) |
| 3 Vehicles | 402 (24.3%) | 221 (16.4%) |
| 4 Vehicles | 97 (5.9%) | 68 (5.0%) |
| 5 or more Vehicles | 81 (4.9%) | 48 (3.5%) |
| Total | 1,651 (100.0%) | 1,351 (100.0%) |
Commute Time in Sharon
The most frequently occuring commute durations in Sharon are 60 to 89 minutes (411 commuters, 18.3%), 45 to 59 minutes (298 commuters, 13.3%), and 20 to 24 minutes (290 commuters, 12.9%).
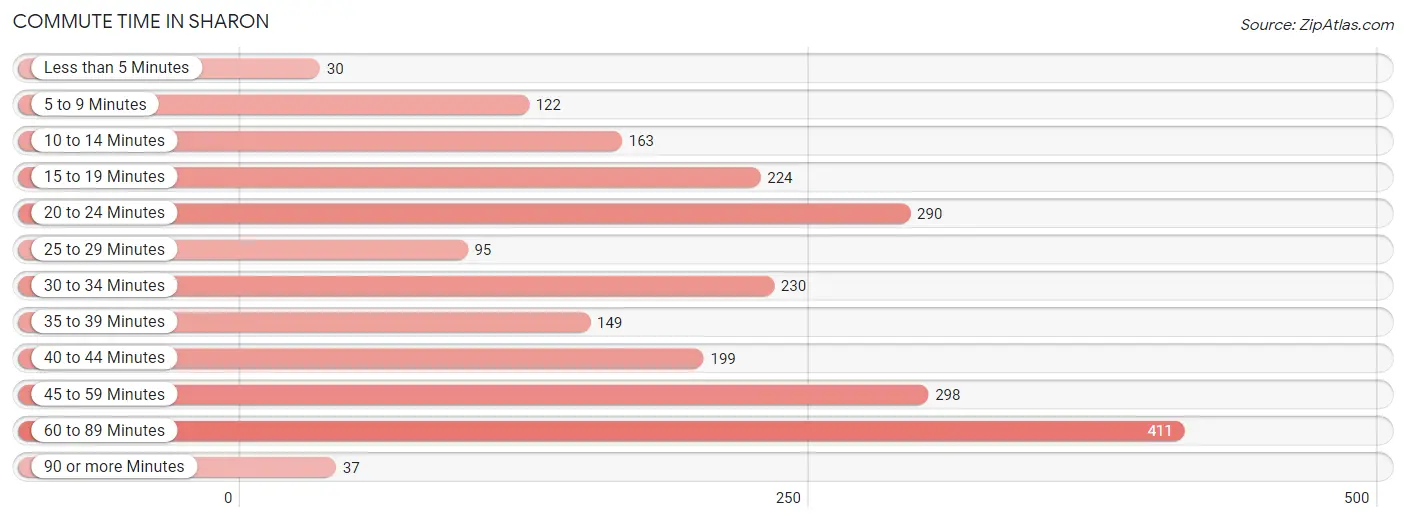
| Commute Time | # Commuters | % Commuters |
| Less than 5 Minutes | 30 | 1.3% |
| 5 to 9 Minutes | 122 | 5.4% |
| 10 to 14 Minutes | 163 | 7.2% |
| 15 to 19 Minutes | 224 | 10.0% |
| 20 to 24 Minutes | 290 | 12.9% |
| 25 to 29 Minutes | 95 | 4.2% |
| 30 to 34 Minutes | 230 | 10.2% |
| 35 to 39 Minutes | 149 | 6.6% |
| 40 to 44 Minutes | 199 | 8.8% |
| 45 to 59 Minutes | 298 | 13.3% |
| 60 to 89 Minutes | 411 | 18.3% |
| 90 or more Minutes | 37 | 1.7% |
Commute Time by Sex in Sharon
The most common commute times in Sharon are 20 to 24 minutes (223 commuters, 16.8%) for males and 60 to 89 minutes (189 commuters, 20.4%) for females.
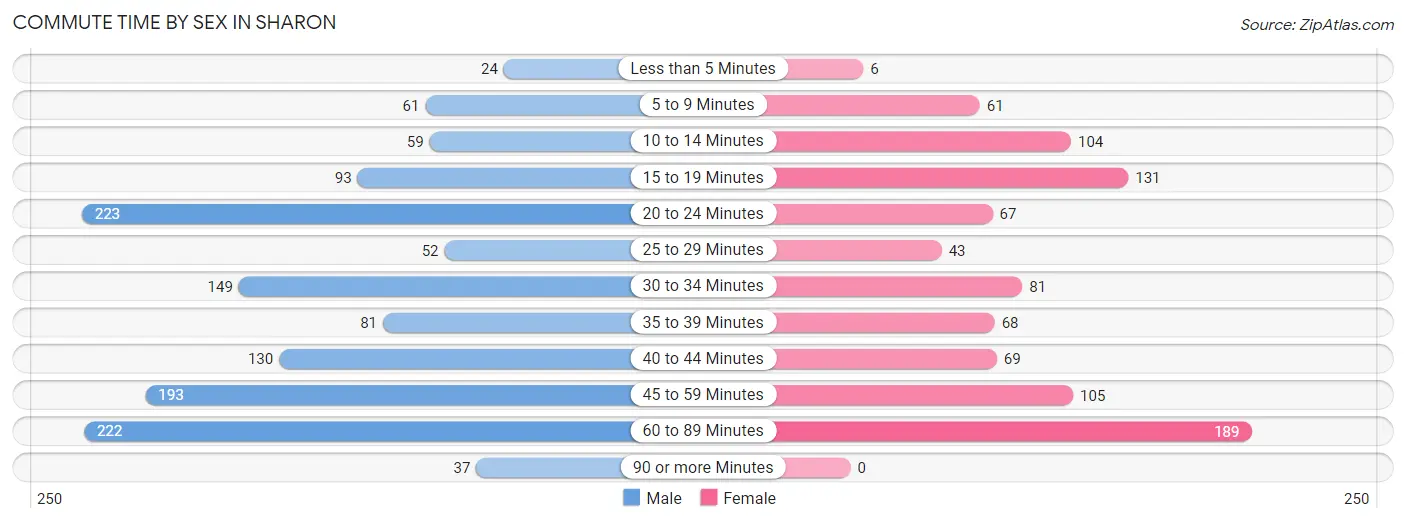
| Commute Time | Male | Female |
| Less than 5 Minutes | 24 (1.8%) | 6 (0.6%) |
| 5 to 9 Minutes | 61 (4.6%) | 61 (6.6%) |
| 10 to 14 Minutes | 59 (4.5%) | 104 (11.3%) |
| 15 to 19 Minutes | 93 (7.0%) | 131 (14.2%) |
| 20 to 24 Minutes | 223 (16.8%) | 67 (7.2%) |
| 25 to 29 Minutes | 52 (3.9%) | 43 (4.6%) |
| 30 to 34 Minutes | 149 (11.3%) | 81 (8.8%) |
| 35 to 39 Minutes | 81 (6.1%) | 68 (7.4%) |
| 40 to 44 Minutes | 130 (9.8%) | 69 (7.5%) |
| 45 to 59 Minutes | 193 (14.6%) | 105 (11.4%) |
| 60 to 89 Minutes | 222 (16.8%) | 189 (20.4%) |
| 90 or more Minutes | 37 (2.8%) | 0 (0.0%) |
Time of Departure to Work by Sex in Sharon
The most frequent times of departure to work in Sharon are 7:30 AM to 7:59 AM (278, 21.0%) for males and 7:30 AM to 7:59 AM (179, 19.4%) for females.
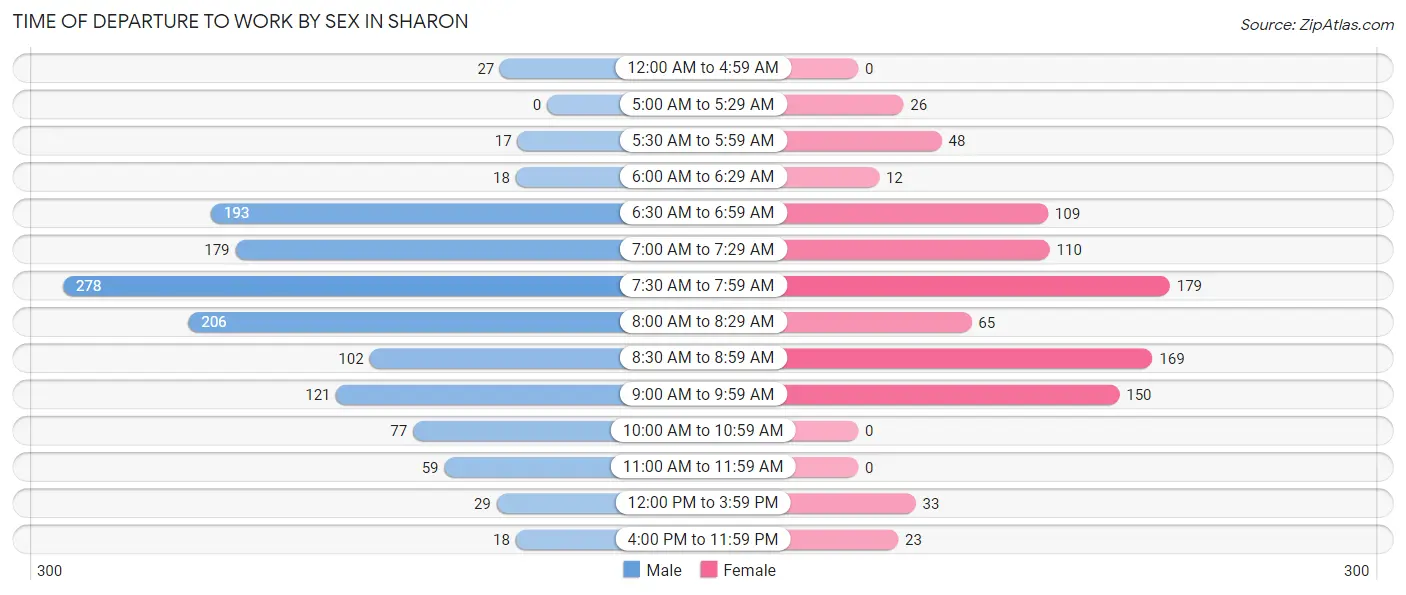
| Time of Departure | Male | Female |
| 12:00 AM to 4:59 AM | 27 (2.0%) | 0 (0.0%) |
| 5:00 AM to 5:29 AM | 0 (0.0%) | 26 (2.8%) |
| 5:30 AM to 5:59 AM | 17 (1.3%) | 48 (5.2%) |
| 6:00 AM to 6:29 AM | 18 (1.4%) | 12 (1.3%) |
| 6:30 AM to 6:59 AM | 193 (14.6%) | 109 (11.8%) |
| 7:00 AM to 7:29 AM | 179 (13.5%) | 110 (11.9%) |
| 7:30 AM to 7:59 AM | 278 (21.0%) | 179 (19.4%) |
| 8:00 AM to 8:29 AM | 206 (15.6%) | 65 (7.0%) |
| 8:30 AM to 8:59 AM | 102 (7.7%) | 169 (18.3%) |
| 9:00 AM to 9:59 AM | 121 (9.1%) | 150 (16.2%) |
| 10:00 AM to 10:59 AM | 77 (5.8%) | 0 (0.0%) |
| 11:00 AM to 11:59 AM | 59 (4.5%) | 0 (0.0%) |
| 12:00 PM to 3:59 PM | 29 (2.2%) | 33 (3.6%) |
| 4:00 PM to 11:59 PM | 18 (1.4%) | 23 (2.5%) |
| Total | 1,324 (100.0%) | 924 (100.0%) |
Housing Occupancy in Sharon
Occupancy by Ownership in Sharon
Of the total 1,993 dwellings in Sharon, owner-occupied units account for 1,810 (90.8%), while renter-occupied units make up 183 (9.2%).
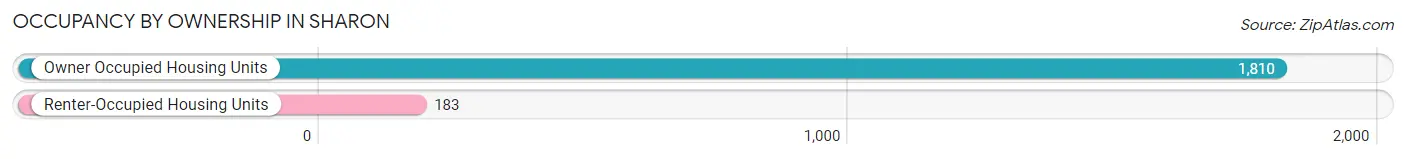
| Occupancy | # Housing Units | % Housing Units |
| Owner Occupied Housing Units | 1,810 | 90.8% |
| Renter-Occupied Housing Units | 183 | 9.2% |
| Total Occupied Housing Units | 1,993 | 100.0% |
Occupancy by Household Size in Sharon
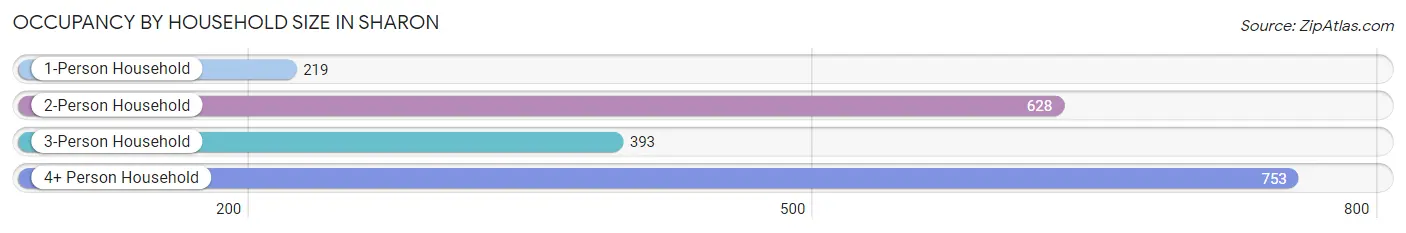
| Household Size | # Housing Units | % Housing Units |
| 1-Person Household | 219 | 11.0% |
| 2-Person Household | 628 | 31.5% |
| 3-Person Household | 393 | 19.7% |
| 4+ Person Household | 753 | 37.8% |
| Total Housing Units | 1,993 | 100.0% |
Occupancy by Ownership by Household Size in Sharon
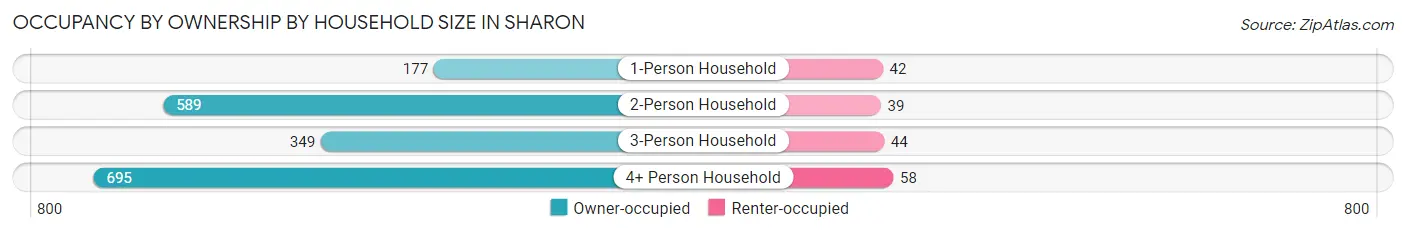
| Household Size | Owner-occupied | Renter-occupied |
| 1-Person Household | 177 (80.8%) | 42 (19.2%) |
| 2-Person Household | 589 (93.8%) | 39 (6.2%) |
| 3-Person Household | 349 (88.8%) | 44 (11.2%) |
| 4+ Person Household | 695 (92.3%) | 58 (7.7%) |
| Total Housing Units | 1,810 (90.8%) | 183 (9.2%) |
Occupancy by Educational Attainment in Sharon
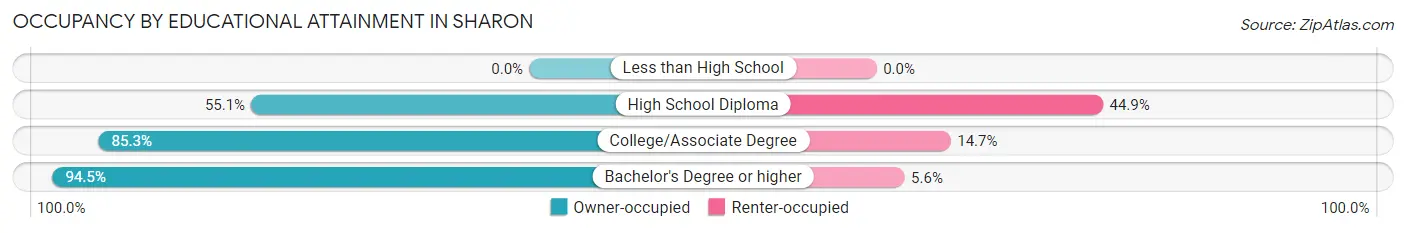
| Household Size | Owner-occupied | Renter-occupied |
| Less than High School | 0 (0.0%) | 0 (0.0%) |
| High School Diploma | 70 (55.1%) | 57 (44.9%) |
| College/Associate Degree | 209 (85.3%) | 36 (14.7%) |
| Bachelor's Degree or higher | 1,531 (94.5%) | 90 (5.6%) |
Occupancy by Age of Householder in Sharon
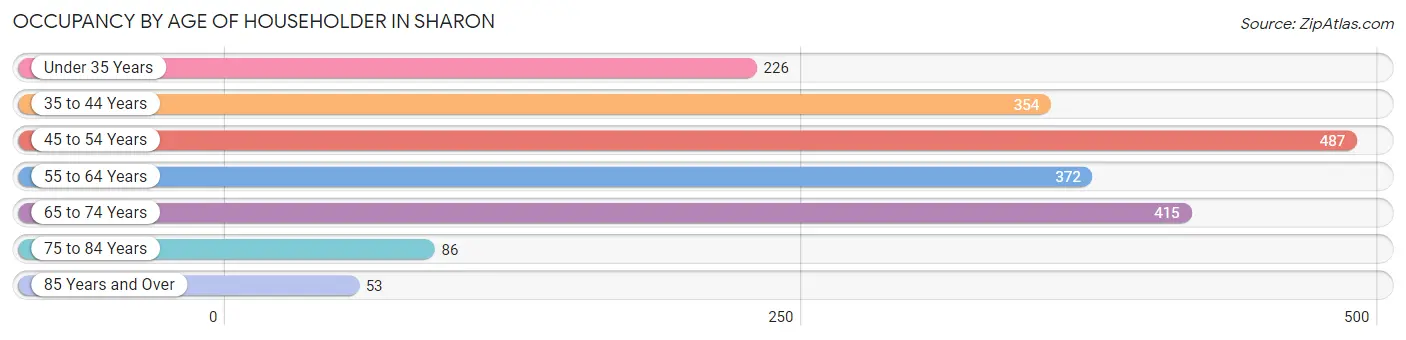
| Age Bracket | # Households | % Households |
| Under 35 Years | 226 | 11.3% |
| 35 to 44 Years | 354 | 17.8% |
| 45 to 54 Years | 487 | 24.4% |
| 55 to 64 Years | 372 | 18.7% |
| 65 to 74 Years | 415 | 20.8% |
| 75 to 84 Years | 86 | 4.3% |
| 85 Years and Over | 53 | 2.7% |
| Total | 1,993 | 100.0% |
Housing Finances in Sharon
Median Income by Occupancy in Sharon
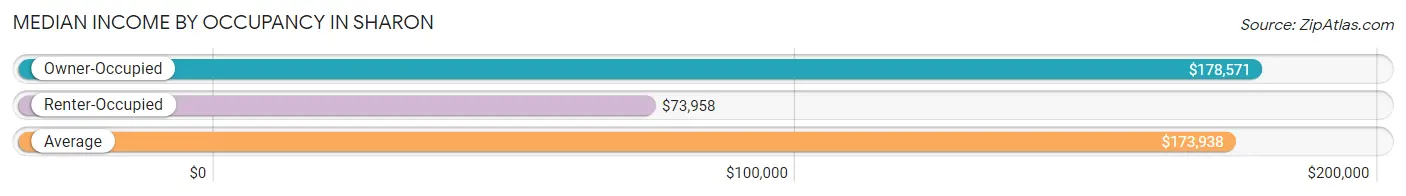
| Occupancy Type | # Households | Median Income |
| Owner-Occupied | 1,810 (90.8%) | $178,571 |
| Renter-Occupied | 183 (9.2%) | $73,958 |
| Average | 1,993 (100.0%) | $173,938 |
Occupancy by Householder Income Bracket in Sharon
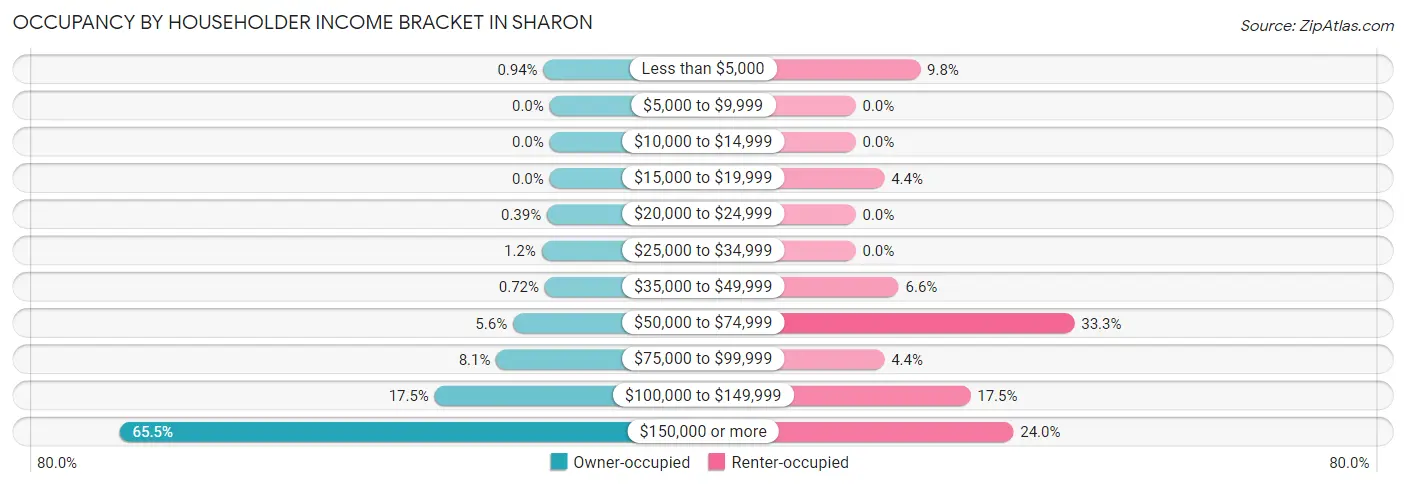
| Income Bracket | Owner-occupied | Renter-occupied |
| Less than $5,000 | 17 (0.9%) | 18 (9.8%) |
| $5,000 to $9,999 | 0 (0.0%) | 0 (0.0%) |
| $10,000 to $14,999 | 0 (0.0%) | 0 (0.0%) |
| $15,000 to $19,999 | 0 (0.0%) | 8 (4.4%) |
| $20,000 to $24,999 | 7 (0.4%) | 0 (0.0%) |
| $25,000 to $34,999 | 22 (1.2%) | 0 (0.0%) |
| $35,000 to $49,999 | 13 (0.7%) | 12 (6.6%) |
| $50,000 to $74,999 | 101 (5.6%) | 61 (33.3%) |
| $75,000 to $99,999 | 147 (8.1%) | 8 (4.4%) |
| $100,000 to $149,999 | 317 (17.5%) | 32 (17.5%) |
| $150,000 or more | 1,186 (65.5%) | 44 (24.0%) |
| Total | 1,810 (100.0%) | 183 (100.0%) |
Monthly Housing Cost Tiers in Sharon
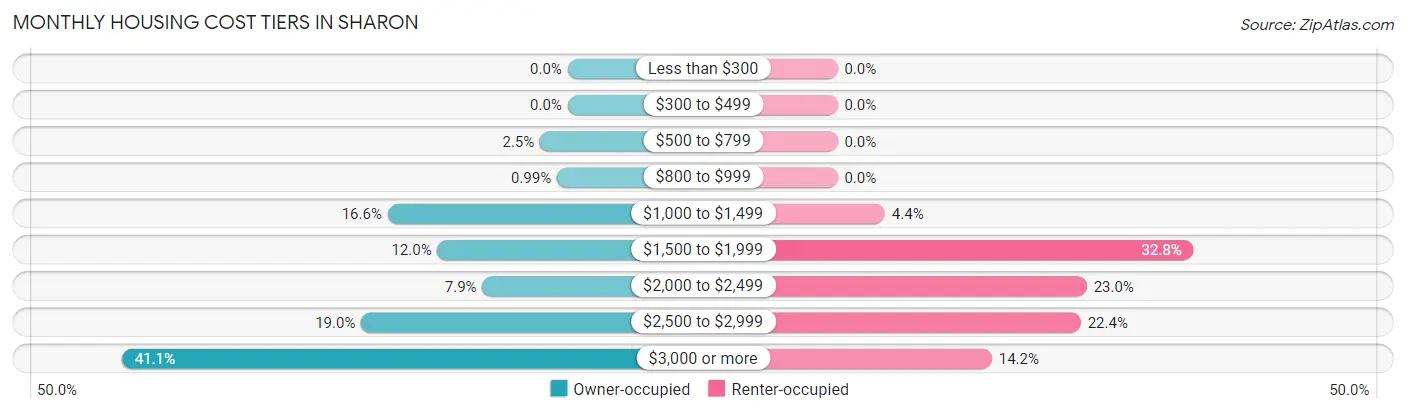
| Monthly Cost | Owner-occupied | Renter-occupied |
| Less than $300 | 0 (0.0%) | 0 (0.0%) |
| $300 to $499 | 0 (0.0%) | 0 (0.0%) |
| $500 to $799 | 46 (2.5%) | 0 (0.0%) |
| $800 to $999 | 18 (1.0%) | 0 (0.0%) |
| $1,000 to $1,499 | 300 (16.6%) | 8 (4.4%) |
| $1,500 to $1,999 | 217 (12.0%) | 60 (32.8%) |
| $2,000 to $2,499 | 142 (7.9%) | 42 (23.0%) |
| $2,500 to $2,999 | 344 (19.0%) | 41 (22.4%) |
| $3,000 or more | 743 (41.0%) | 26 (14.2%) |
| Total | 1,810 (100.0%) | 183 (100.0%) |
Physical Housing Characteristics in Sharon
Housing Structures in Sharon
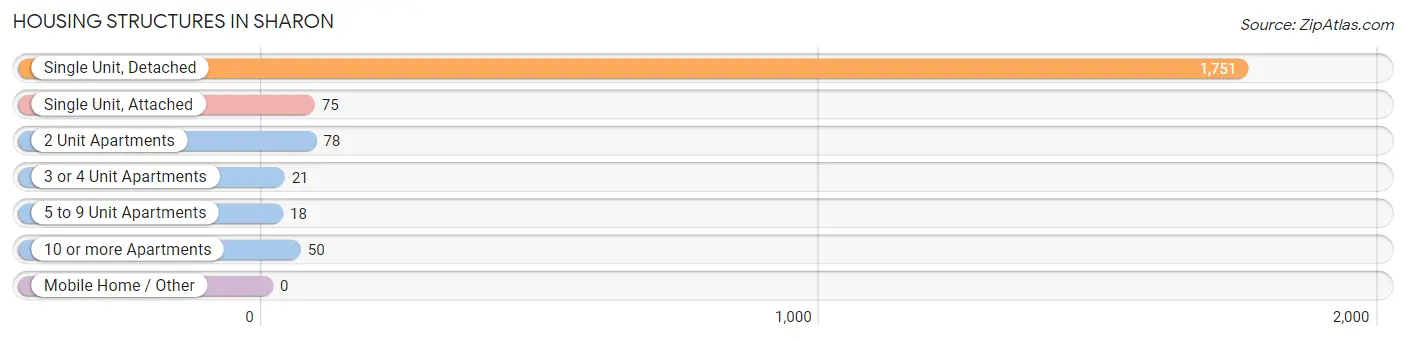
| Structure Type | # Housing Units | % Housing Units |
| Single Unit, Detached | 1,751 | 87.9% |
| Single Unit, Attached | 75 | 3.8% |
| 2 Unit Apartments | 78 | 3.9% |
| 3 or 4 Unit Apartments | 21 | 1.1% |
| 5 to 9 Unit Apartments | 18 | 0.9% |
| 10 or more Apartments | 50 | 2.5% |
| Mobile Home / Other | 0 | 0.0% |
| Total | 1,993 | 100.0% |
Housing Structures by Occupancy in Sharon
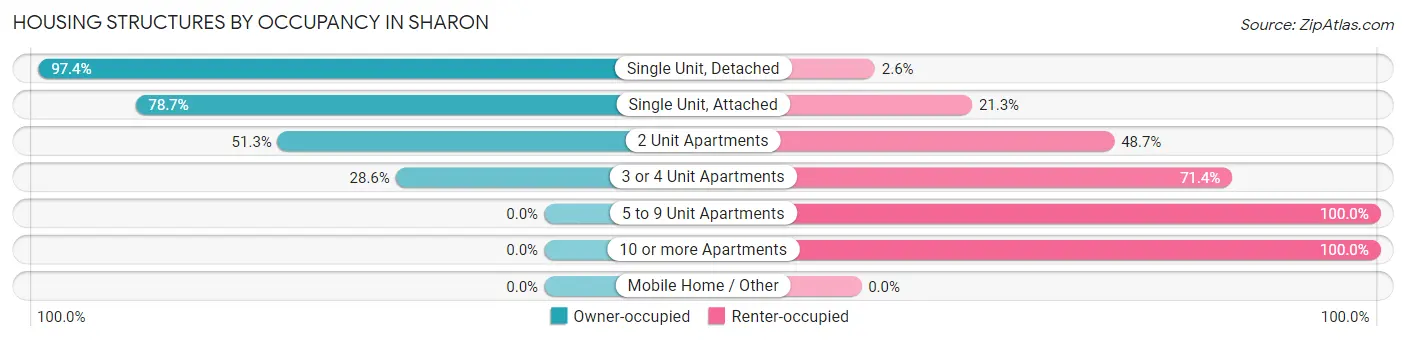
| Structure Type | Owner-occupied | Renter-occupied |
| Single Unit, Detached | 1,705 (97.4%) | 46 (2.6%) |
| Single Unit, Attached | 59 (78.7%) | 16 (21.3%) |
| 2 Unit Apartments | 40 (51.3%) | 38 (48.7%) |
| 3 or 4 Unit Apartments | 6 (28.6%) | 15 (71.4%) |
| 5 to 9 Unit Apartments | 0 (0.0%) | 18 (100.0%) |
| 10 or more Apartments | 0 (0.0%) | 50 (100.0%) |
| Mobile Home / Other | 0 (0.0%) | 0 (0.0%) |
| Total | 1,810 (90.8%) | 183 (9.2%) |
Housing Structures by Number of Rooms in Sharon
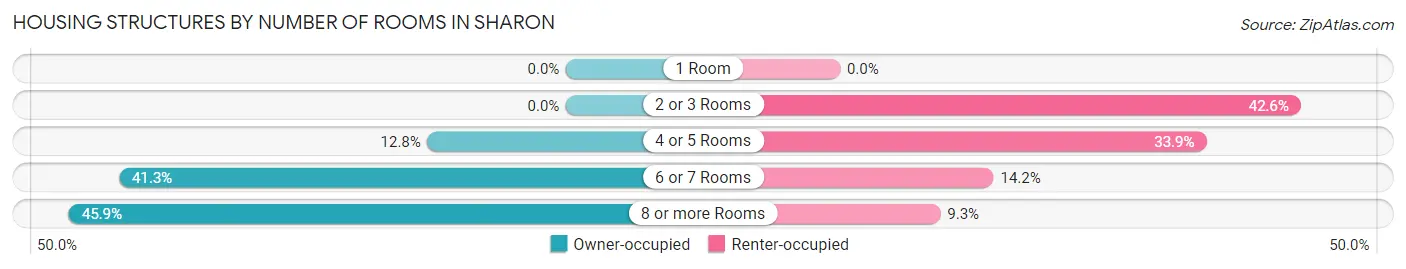
| Number of Rooms | Owner-occupied | Renter-occupied |
| 1 Room | 0 (0.0%) | 0 (0.0%) |
| 2 or 3 Rooms | 0 (0.0%) | 78 (42.6%) |
| 4 or 5 Rooms | 232 (12.8%) | 62 (33.9%) |
| 6 or 7 Rooms | 747 (41.3%) | 26 (14.2%) |
| 8 or more Rooms | 831 (45.9%) | 17 (9.3%) |
| Total | 1,810 (100.0%) | 183 (100.0%) |
Housing Structure by Heating Type in Sharon
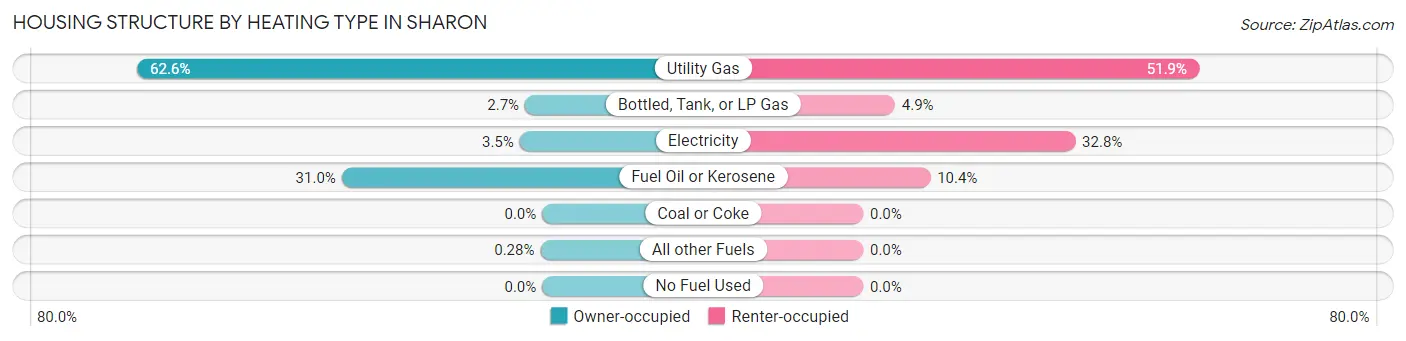
| Heating Type | Owner-occupied | Renter-occupied |
| Utility Gas | 1,133 (62.6%) | 95 (51.9%) |
| Bottled, Tank, or LP Gas | 48 (2.6%) | 9 (4.9%) |
| Electricity | 63 (3.5%) | 60 (32.8%) |
| Fuel Oil or Kerosene | 561 (31.0%) | 19 (10.4%) |
| Coal or Coke | 0 (0.0%) | 0 (0.0%) |
| All other Fuels | 5 (0.3%) | 0 (0.0%) |
| No Fuel Used | 0 (0.0%) | 0 (0.0%) |
| Total | 1,810 (100.0%) | 183 (100.0%) |
Household Vehicle Usage in Sharon
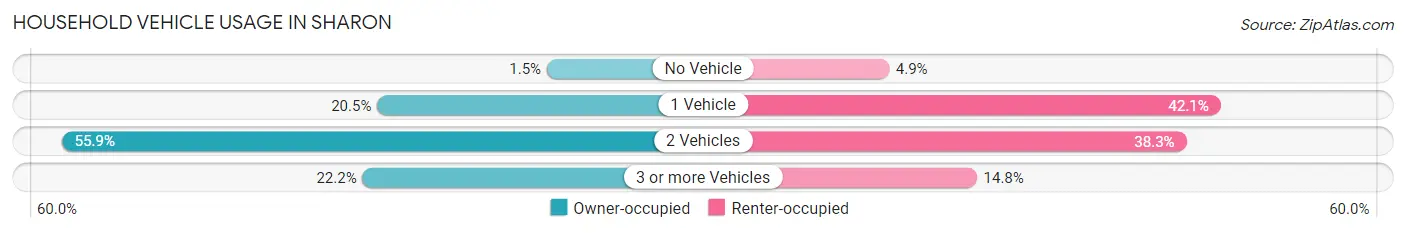
| Vehicles per Household | Owner-occupied | Renter-occupied |
| No Vehicle | 27 (1.5%) | 9 (4.9%) |
| 1 Vehicle | 371 (20.5%) | 77 (42.1%) |
| 2 Vehicles | 1,011 (55.9%) | 70 (38.3%) |
| 3 or more Vehicles | 401 (22.2%) | 27 (14.7%) |
| Total | 1,810 (100.0%) | 183 (100.0%) |
Real Estate & Mortgages in Sharon
Real Estate and Mortgage Overview in Sharon
| Characteristic | Without Mortgage | With Mortgage |
| Housing Units | 524 | 1,286 |
| Median Property Value | $508,900 | $609,200 |
| Median Household Income | $115,417 | $934 |
| Monthly Housing Costs | $1,342 | $743 |
| Real Estate Taxes | $9,788 | $0 |
Property Value by Mortgage Status in Sharon
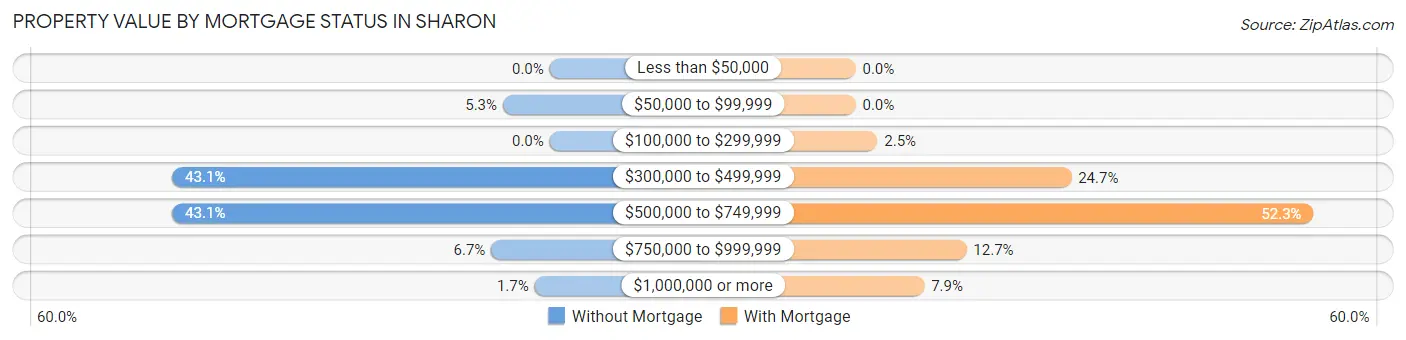
| Property Value | Without Mortgage | With Mortgage |
| Less than $50,000 | 0 (0.0%) | 0 (0.0%) |
| $50,000 to $99,999 | 28 (5.3%) | 0 (0.0%) |
| $100,000 to $299,999 | 0 (0.0%) | 32 (2.5%) |
| $300,000 to $499,999 | 226 (43.1%) | 317 (24.6%) |
| $500,000 to $749,999 | 226 (43.1%) | 673 (52.3%) |
| $750,000 to $999,999 | 35 (6.7%) | 163 (12.7%) |
| $1,000,000 or more | 9 (1.7%) | 101 (7.9%) |
| Total | 524 (100.0%) | 1,286 (100.0%) |
Household Income by Mortgage Status in Sharon
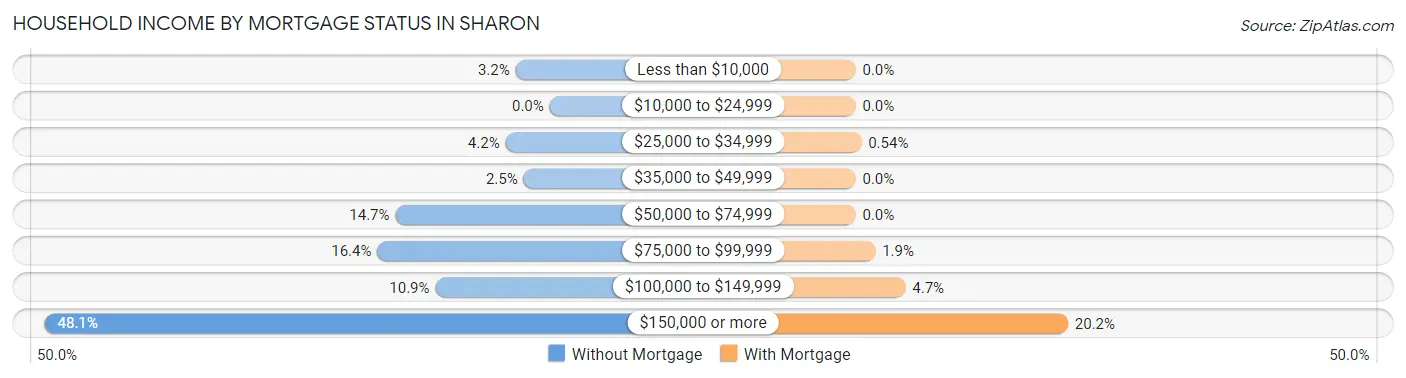
| Household Income | Without Mortgage | With Mortgage |
| Less than $10,000 | 17 (3.2%) | 0 (0.0%) |
| $10,000 to $24,999 | 0 (0.0%) | 0 (0.0%) |
| $25,000 to $34,999 | 22 (4.2%) | 7 (0.5%) |
| $35,000 to $49,999 | 13 (2.5%) | 0 (0.0%) |
| $50,000 to $74,999 | 77 (14.7%) | 0 (0.0%) |
| $75,000 to $99,999 | 86 (16.4%) | 24 (1.9%) |
| $100,000 to $149,999 | 57 (10.9%) | 61 (4.7%) |
| $150,000 or more | 252 (48.1%) | 260 (20.2%) |
| Total | 524 (100.0%) | 1,286 (100.0%) |
Property Value to Household Income Ratio in Sharon
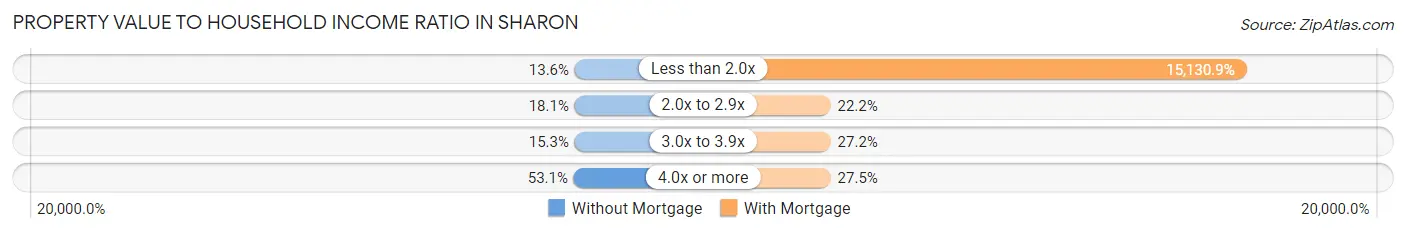
| Value-to-Income Ratio | Without Mortgage | With Mortgage |
| Less than 2.0x | 71 (13.6%) | 194,583 (15,130.9%) |
| 2.0x to 2.9x | 95 (18.1%) | 285 (22.2%) |
| 3.0x to 3.9x | 80 (15.3%) | 350 (27.2%) |
| 4.0x or more | 278 (53.0%) | 354 (27.5%) |
| Total | 524 (100.0%) | 1,286 (100.0%) |
Real Estate Taxes by Mortgage Status in Sharon

| Property Taxes | Without Mortgage | With Mortgage |
| Less than $800 | 23 (4.4%) | 0 (0.0%) |
| $800 to $1,499 | 0 (0.0%) | 0 (0.0%) |
| $800 to $1,499 | 501 (95.6%) | 59 (4.6%) |
| Total | 524 (100.0%) | 1,286 (100.0%) |
Health & Disability in Sharon
Health Insurance Coverage by Age in Sharon
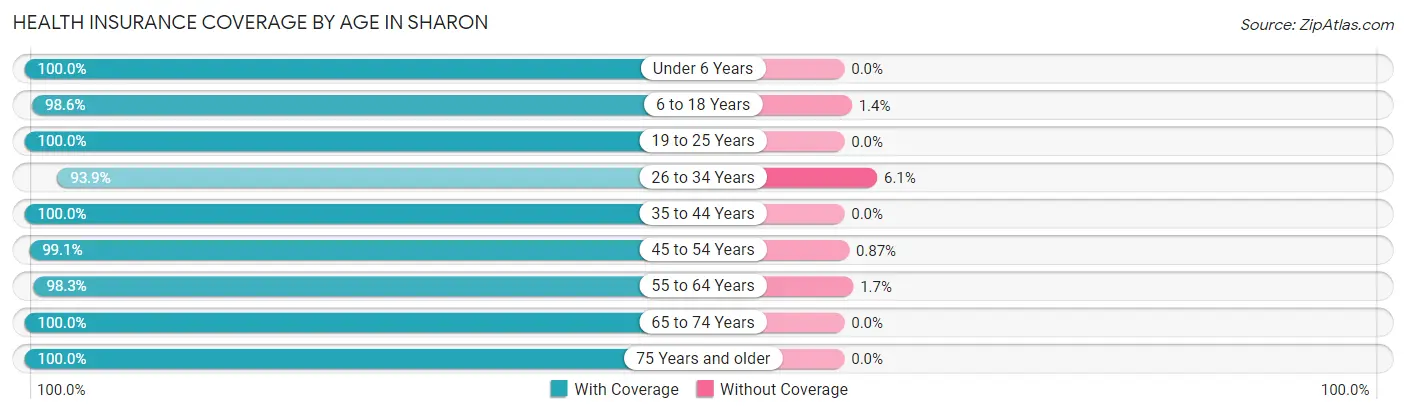
| Age Bracket | With Coverage | Without Coverage |
| Under 6 Years | 543 (100.0%) | 0 (0.0%) |
| 6 to 18 Years | 1,280 (98.6%) | 18 (1.4%) |
| 19 to 25 Years | 264 (100.0%) | 0 (0.0%) |
| 26 to 34 Years | 461 (93.9%) | 30 (6.1%) |
| 35 to 44 Years | 796 (100.0%) | 0 (0.0%) |
| 45 to 54 Years | 916 (99.1%) | 8 (0.9%) |
| 55 to 64 Years | 653 (98.3%) | 11 (1.7%) |
| 65 to 74 Years | 692 (100.0%) | 0 (0.0%) |
| 75 Years and older | 269 (100.0%) | 0 (0.0%) |
| Total | 5,874 (98.9%) | 67 (1.1%) |
Health Insurance Coverage by Citizenship Status in Sharon
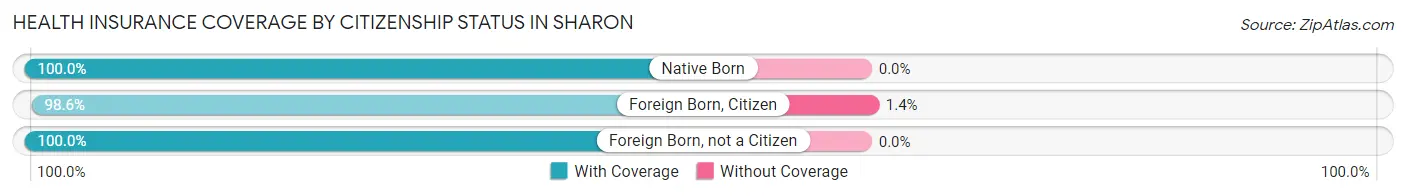
| Citizenship Status | With Coverage | Without Coverage |
| Native Born | 543 (100.0%) | 0 (0.0%) |
| Foreign Born, Citizen | 1,280 (98.6%) | 18 (1.4%) |
| Foreign Born, not a Citizen | 264 (100.0%) | 0 (0.0%) |
Health Insurance Coverage by Household Income in Sharon
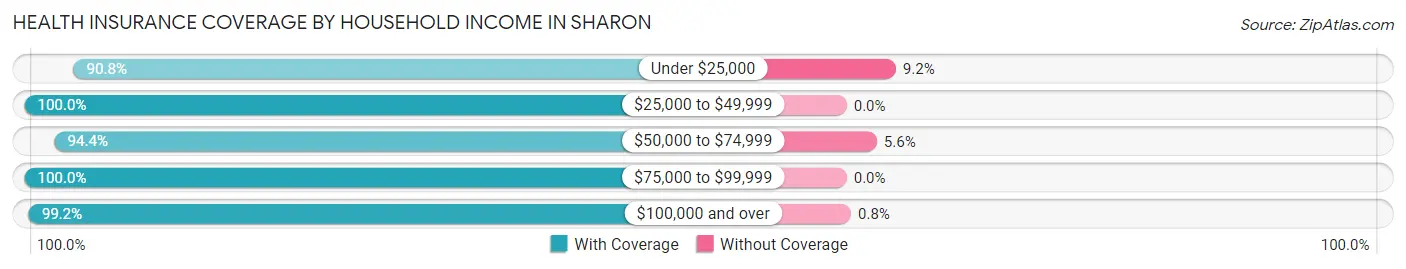
| Household Income | With Coverage | Without Coverage |
| Under $25,000 | 79 (90.8%) | 8 (9.2%) |
| $25,000 to $49,999 | 61 (100.0%) | 0 (0.0%) |
| $50,000 to $74,999 | 301 (94.4%) | 18 (5.6%) |
| $75,000 to $99,999 | 340 (100.0%) | 0 (0.0%) |
| $100,000 and over | 5,088 (99.2%) | 41 (0.8%) |
Public vs Private Health Insurance Coverage by Age in Sharon
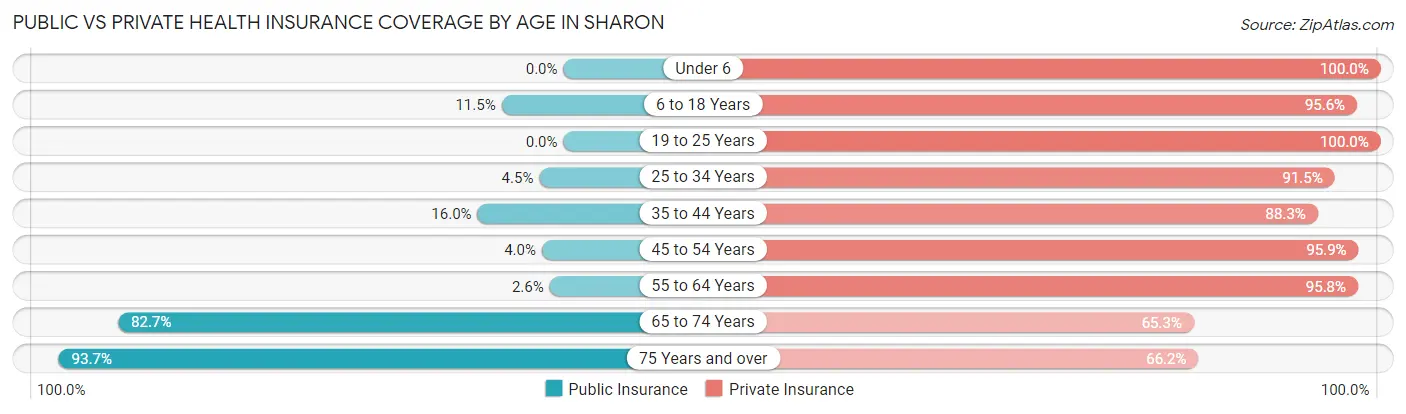
| Age Bracket | Public Insurance | Private Insurance |
| Under 6 | 0 (0.0%) | 543 (100.0%) |
| 6 to 18 Years | 149 (11.5%) | 1,241 (95.6%) |
| 19 to 25 Years | 0 (0.0%) | 264 (100.0%) |
| 25 to 34 Years | 22 (4.5%) | 449 (91.4%) |
| 35 to 44 Years | 127 (16.0%) | 703 (88.3%) |
| 45 to 54 Years | 37 (4.0%) | 886 (95.9%) |
| 55 to 64 Years | 17 (2.6%) | 636 (95.8%) |
| 65 to 74 Years | 572 (82.7%) | 452 (65.3%) |
| 75 Years and over | 252 (93.7%) | 178 (66.2%) |
| Total | 1,176 (19.8%) | 5,352 (90.1%) |
Disability Status by Sex by Age in Sharon
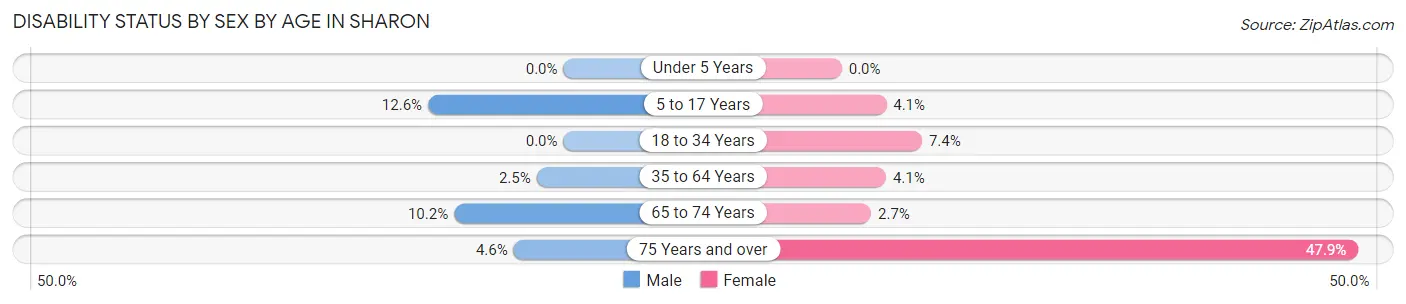
| Age Bracket | Male | Female |
| Under 5 Years | 0 (0.0%) | 0 (0.0%) |
| 5 to 17 Years | 90 (12.6%) | 26 (4.1%) |
| 18 to 34 Years | 0 (0.0%) | 32 (7.4%) |
| 35 to 64 Years | 29 (2.5%) | 50 (4.1%) |
| 65 to 74 Years | 33 (10.2%) | 10 (2.7%) |
| 75 Years and over | 8 (4.6%) | 46 (47.9%) |
Disability Class by Sex by Age in Sharon
Disability Class: Hearing Difficulty
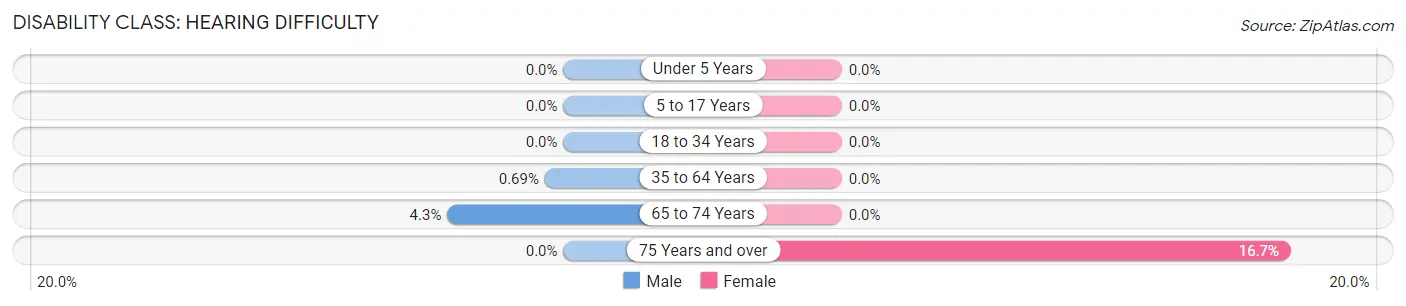
| Age Bracket | Male | Female |
| Under 5 Years | 0 (0.0%) | 0 (0.0%) |
| 5 to 17 Years | 0 (0.0%) | 0 (0.0%) |
| 18 to 34 Years | 0 (0.0%) | 0 (0.0%) |
| 35 to 64 Years | 8 (0.7%) | 0 (0.0%) |
| 65 to 74 Years | 14 (4.3%) | 0 (0.0%) |
| 75 Years and over | 0 (0.0%) | 16 (16.7%) |
Disability Class: Vision Difficulty
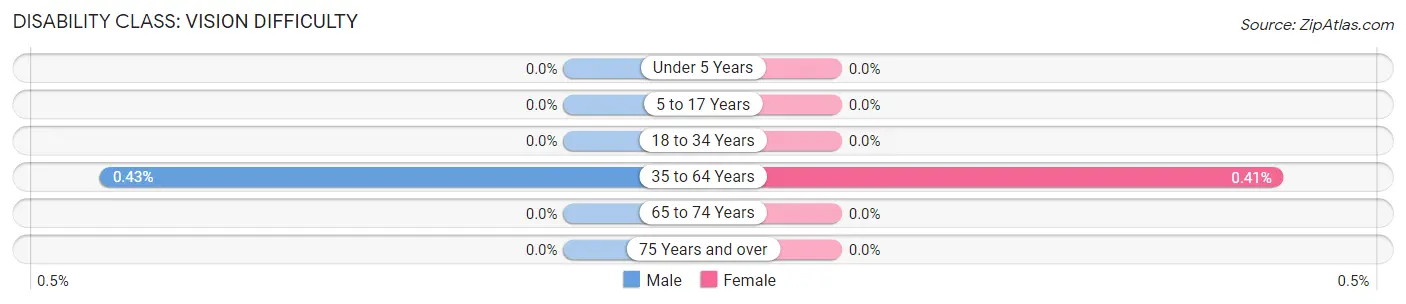
| Age Bracket | Male | Female |
| Under 5 Years | 0 (0.0%) | 0 (0.0%) |
| 5 to 17 Years | 0 (0.0%) | 0 (0.0%) |
| 18 to 34 Years | 0 (0.0%) | 0 (0.0%) |
| 35 to 64 Years | 5 (0.4%) | 5 (0.4%) |
| 65 to 74 Years | 0 (0.0%) | 0 (0.0%) |
| 75 Years and over | 0 (0.0%) | 0 (0.0%) |
Disability Class: Cognitive Difficulty
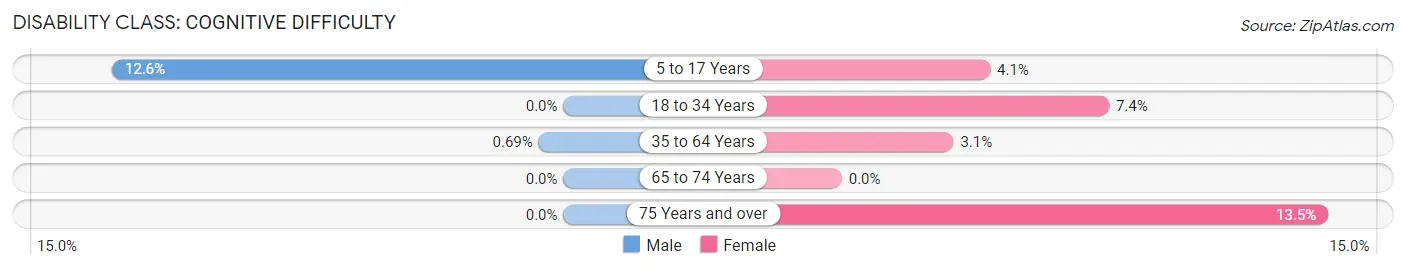
| Age Bracket | Male | Female |
| 5 to 17 Years | 90 (12.6%) | 26 (4.1%) |
| 18 to 34 Years | 0 (0.0%) | 32 (7.4%) |
| 35 to 64 Years | 8 (0.7%) | 38 (3.1%) |
| 65 to 74 Years | 0 (0.0%) | 0 (0.0%) |
| 75 Years and over | 0 (0.0%) | 13 (13.5%) |
Disability Class: Ambulatory Difficulty
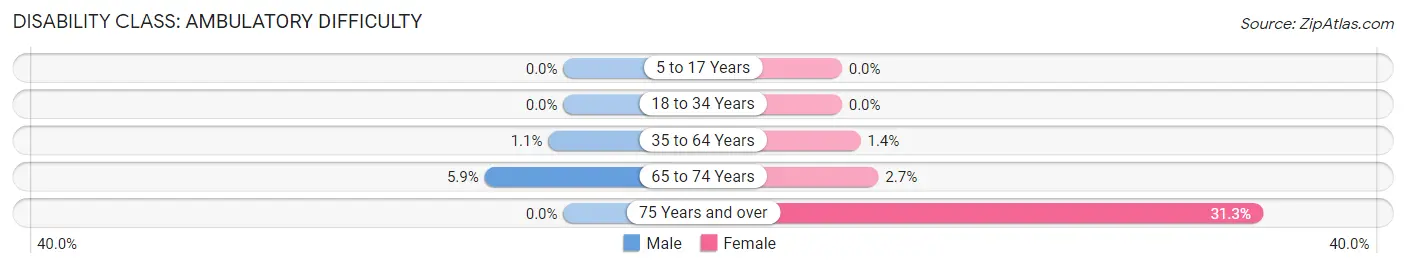
| Age Bracket | Male | Female |
| 5 to 17 Years | 0 (0.0%) | 0 (0.0%) |
| 18 to 34 Years | 0 (0.0%) | 0 (0.0%) |
| 35 to 64 Years | 13 (1.1%) | 17 (1.4%) |
| 65 to 74 Years | 19 (5.9%) | 10 (2.7%) |
| 75 Years and over | 0 (0.0%) | 30 (31.2%) |
Disability Class: Self-Care Difficulty
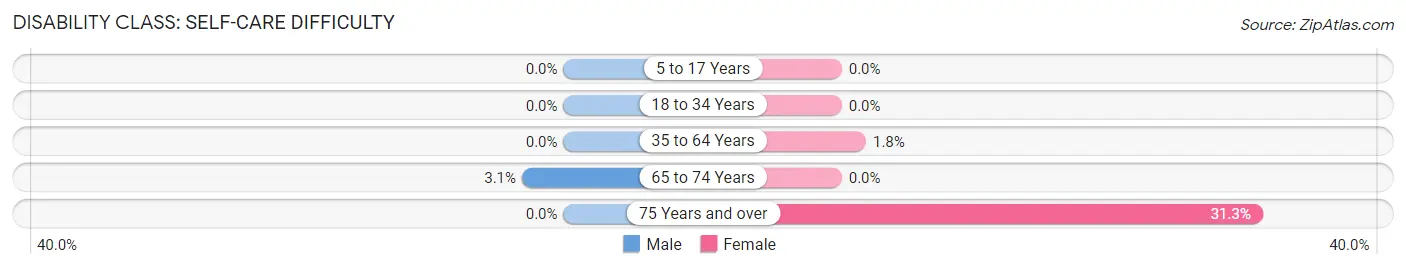
| Age Bracket | Male | Female |
| 5 to 17 Years | 0 (0.0%) | 0 (0.0%) |
| 18 to 34 Years | 0 (0.0%) | 0 (0.0%) |
| 35 to 64 Years | 0 (0.0%) | 22 (1.8%) |
| 65 to 74 Years | 10 (3.1%) | 0 (0.0%) |
| 75 Years and over | 0 (0.0%) | 30 (31.2%) |
Technology Access in Sharon
Computing Device Access in Sharon
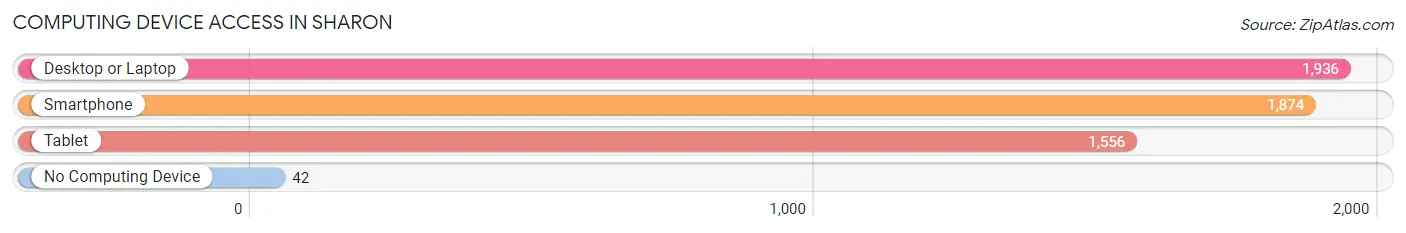
| Device Type | # Households | % Households |
| Desktop or Laptop | 1,936 | 97.1% |
| Smartphone | 1,874 | 94.0% |
| Tablet | 1,556 | 78.1% |
| No Computing Device | 42 | 2.1% |
| Total | 1,993 | 100.0% |
Internet Access in Sharon
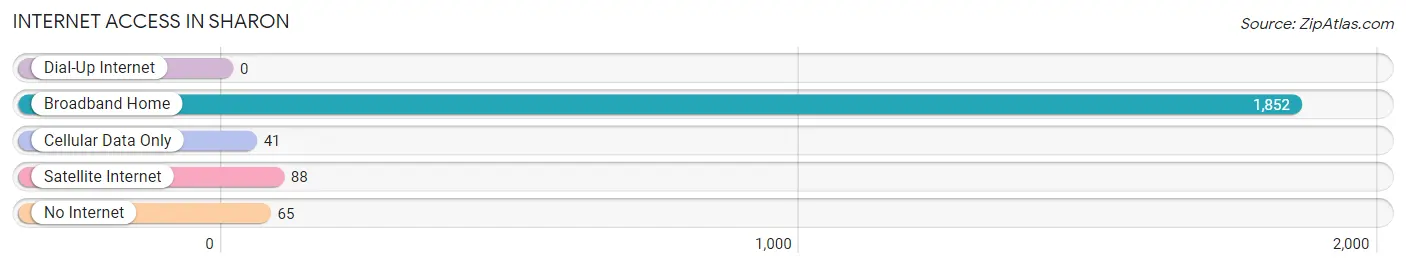
| Internet Type | # Households | % Households |
| Dial-Up Internet | 0 | 0.0% |
| Broadband Home | 1,852 | 92.9% |
| Cellular Data Only | 41 | 2.1% |
| Satellite Internet | 88 | 4.4% |
| No Internet | 65 | 3.3% |
| Total | 1,993 | 100.0% |
Sharon Summary
Sharon, Massachusetts is a town located in Norfolk County, approximately 20 miles southwest of Boston. It is bordered by the towns of Easton, Stoughton, Canton, Foxborough, and Walpole. The town has a population of 17,612, according to the 2010 census.
History
The area that is now Sharon was originally inhabited by the Wampanoag tribe. The first European settlers arrived in 1637, and the town was officially incorporated in 1775. The town was named after the Biblical figure, Sharon, and was originally part of Stoughton.
In the late 1700s, Sharon was a farming community, with a few small mills and a tannery. In the early 1800s, the town began to industrialize, with the construction of a cotton mill and a paper mill. The town also became a popular summer resort destination, with many wealthy Bostonians building summer homes in the area.
In the late 1800s, the town began to shift away from its industrial roots, and became a residential community. The town was also home to a number of summer camps, which attracted many visitors from around the country.
Geography
Sharon is located in eastern Massachusetts, in Norfolk County. It is bordered by the towns of Easton, Stoughton, Canton, Foxborough, and Walpole. The town is located on the banks of the Taunton River, and is approximately 20 miles southwest of Boston.
The town has a total area of 16.7 square miles, of which 16.3 square miles is land and 0.4 square miles is water. The town is mostly flat, with some rolling hills in the northern part of town.
Economy
Sharon is a primarily residential community, with a few small businesses located in the town. The largest employers in the town are the Sharon Public Schools, the Sharon Hospital, and the Sharon Credit Union.
The town also has a number of small businesses, including restaurants, retail stores, and professional services. The town is also home to a number of summer camps, which attract visitors from around the country.
Demographics
According to the 2010 census, Sharon has a population of 17,612. The racial makeup of the town is 87.3% White, 5.2% African American, 0.3% Native American, 3.2% Asian, 0.1% Pacific Islander, 1.7% from other races, and 2.4% from two or more races.
The median household income in Sharon is $90,945, and the median family income is $103,945. The per capita income in the town is $41,945. The town has a poverty rate of 4.3%.
The town is served by the Sharon Public Schools, which includes four elementary schools, one middle school, and one high school. The town is also home to a number of private schools, including the Sharon Academy and the Sharon Country Day School.
Common Questions
What is Per Capita Income in Sharon?
Per Capita income in Sharon is $71,548.
What is the Median Family Income in Sharon?
Median Family Income in Sharon is $178,929.
What is the Median Household income in Sharon?
Median Household Income in Sharon is $173,938.
What is Income or Wage Gap in Sharon?
Income or Wage Gap in Sharon is 46.6%.
Women in Sharon earn 53.4 cents for every dollar earned by a man.
What is Inequality or Gini Index in Sharon?
Inequality or Gini Index in Sharon is 0.38.
What is the Total Population of Sharon?
Total Population of Sharon is 5,983.
What is the Total Male Population of Sharon?
Total Male Population of Sharon is 2,976.
What is the Total Female Population of Sharon?
Total Female Population of Sharon is 3,007.
What is the Ratio of Males per 100 Females in Sharon?
There are 98.97 Males per 100 Females in Sharon.
What is the Ratio of Females per 100 Males in Sharon?
There are 101.04 Females per 100 Males in Sharon.
What is the Median Population Age in Sharon?
Median Population Age in Sharon is 38.8 Years.
What is the Average Family Size in Sharon
Average Family Size in Sharon is 3.2 People.
What is the Average Household Size in Sharon
Average Household Size in Sharon is 3.0 People.
How Large is the Labor Force in Sharon?
There are 3,131 People in the Labor Forcein in Sharon.
What is the Percentage of People in the Labor Force in Sharon?
71.0% of People are in the Labor Force in Sharon.
What is the Unemployment Rate in Sharon?
Unemployment Rate in Sharon is 3.1%.