Salem, MA Map & Demographics
Salem Map
Salem Overview
$46,919
PER CAPITA INCOME
$105,422
AVG FAMILY INCOME
$79,196
AVG HOUSEHOLD INCOME
10.8%
WAGE / INCOME GAP [ % ]
89.2¢/ $1
WAGE / INCOME GAP [ $ ]
$5,944
FAMILY INCOME DEFICIT
0.45
INEQUALITY / GINI INDEX
44,541
TOTAL POPULATION
20,222
MALE POPULATION
24,319
FEMALE POPULATION
83.15
MALES / 100 FEMALES
120.26
FEMALES / 100 MALES
38.0
MEDIAN AGE
2.9
AVG FAMILY SIZE
2.2
AVG HOUSEHOLD SIZE
26,951
LABOR FORCE [ PEOPLE ]
70.4%
PERCENT IN LABOR FORCE
5.0%
UNEMPLOYMENT RATE
Salem Zip Codes
Income in Salem
Income Overview in Salem
Per Capita Income in Salem is $46,919, while median incomes of families and households are $105,422 and $79,196 respectively.
| Characteristic | Number | Measure |
| Per Capita Income | 44,541 | $46,919 |
| Median Family Income | 10,407 | $105,422 |
| Mean Family Income | 10,407 | $123,840 |
| Median Household Income | 19,887 | $79,196 |
| Mean Household Income | 19,887 | $102,850 |
| Income Deficit | 10,407 | $5,944 |
| Wage / Income Gap (%) | 44,541 | 10.79% |
| Wage / Income Gap ($) | 44,541 | 89.21¢ per $1 |
| Gini / Inequality Index | 44,541 | 0.45 |
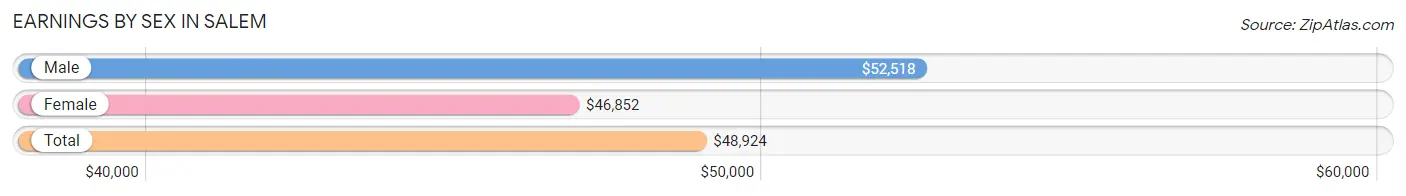
Earnings by Sex in Salem
Average Earnings in Salem are $48,924, $52,518 for men and $46,852 for women, a difference of 10.8%.
| Sex | Number | Average Earnings |
| Male | 13,239 (46.9%) | $52,518 |
| Female | 14,967 (53.1%) | $46,852 |
| Total | 28,206 (100.0%) | $48,924 |
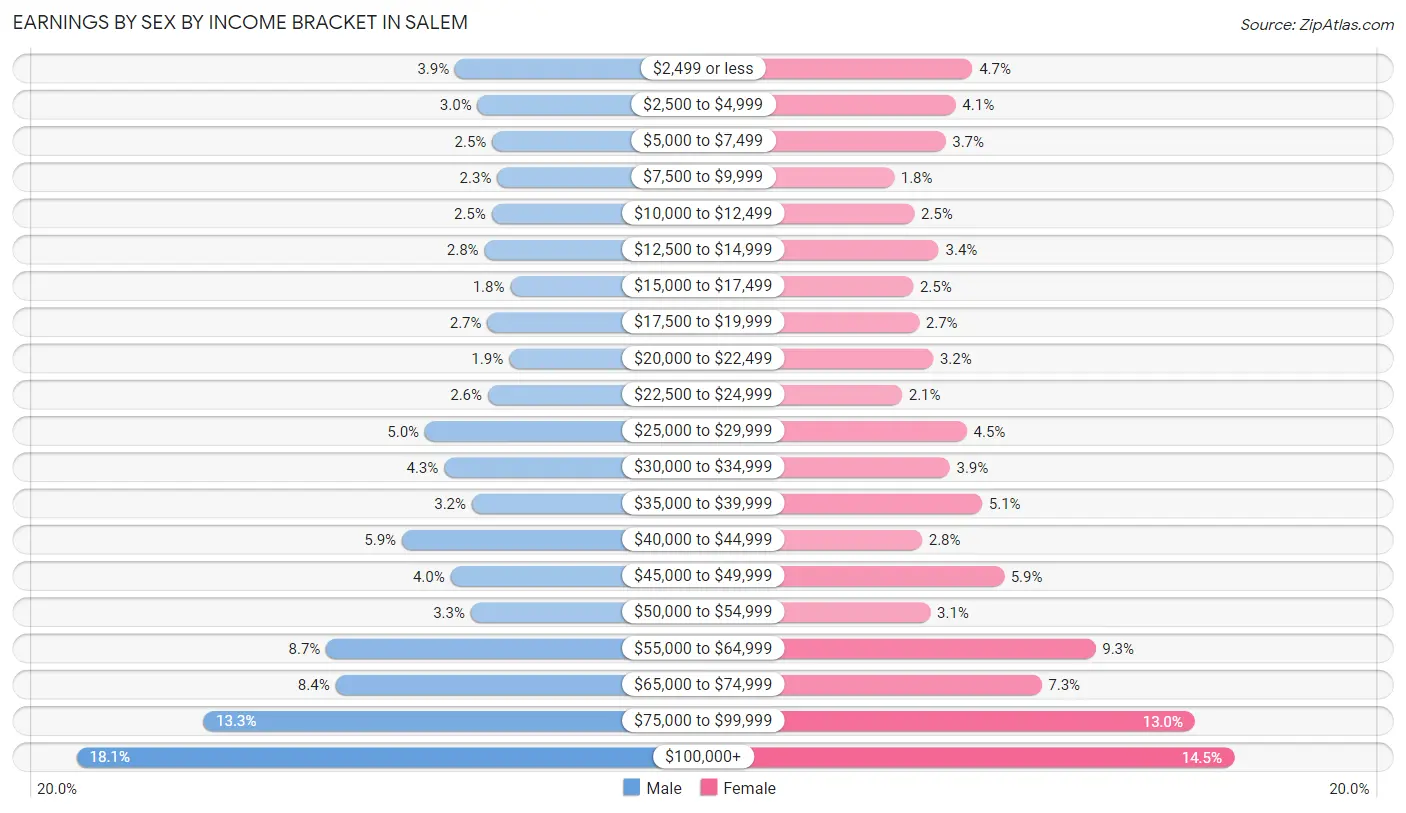
Earnings by Sex by Income Bracket in Salem
The most common earnings brackets in Salem are $100,000+ for men (2,390 | 18.0%) and $100,000+ for women (2,170 | 14.5%).
| Income | Male | Female |
| $2,499 or less | 512 (3.9%) | 703 (4.7%) |
| $2,500 to $4,999 | 401 (3.0%) | 609 (4.1%) |
| $5,000 to $7,499 | 328 (2.5%) | 553 (3.7%) |
| $7,500 to $9,999 | 303 (2.3%) | 264 (1.8%) |
| $10,000 to $12,499 | 331 (2.5%) | 377 (2.5%) |
| $12,500 to $14,999 | 367 (2.8%) | 515 (3.4%) |
| $15,000 to $17,499 | 238 (1.8%) | 371 (2.5%) |
| $17,500 to $19,999 | 352 (2.7%) | 404 (2.7%) |
| $20,000 to $22,499 | 245 (1.8%) | 483 (3.2%) |
| $22,500 to $24,999 | 350 (2.6%) | 309 (2.1%) |
| $25,000 to $29,999 | 662 (5.0%) | 672 (4.5%) |
| $30,000 to $34,999 | 566 (4.3%) | 576 (3.8%) |
| $35,000 to $39,999 | 429 (3.2%) | 757 (5.1%) |
| $40,000 to $44,999 | 776 (5.9%) | 420 (2.8%) |
| $45,000 to $49,999 | 535 (4.0%) | 880 (5.9%) |
| $50,000 to $54,999 | 434 (3.3%) | 467 (3.1%) |
| $55,000 to $64,999 | 1,152 (8.7%) | 1,394 (9.3%) |
| $65,000 to $74,999 | 1,106 (8.4%) | 1,091 (7.3%) |
| $75,000 to $99,999 | 1,762 (13.3%) | 1,952 (13.0%) |
| $100,000+ | 2,390 (18.0%) | 2,170 (14.5%) |
| Total | 13,239 (100.0%) | 14,967 (100.0%) |
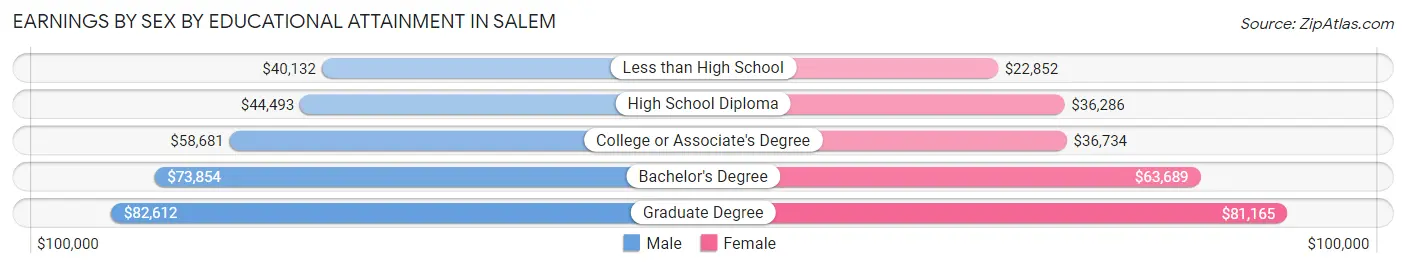
Earnings by Sex by Educational Attainment in Salem
Average earnings in Salem are $61,266 for men and $56,385 for women, a difference of 8.0%. Men with an educational attainment of graduate degree enjoy the highest average annual earnings of $82,612, while those with less than high school education earn the least with $40,132. Women with an educational attainment of graduate degree earn the most with the average annual earnings of $81,165, while those with less than high school education have the smallest earnings of $22,852.
| Educational Attainment | Male Income | Female Income |
| Less than High School | $40,132 | $22,852 |
| High School Diploma | $44,493 | $36,286 |
| College or Associate's Degree | $58,681 | $36,734 |
| Bachelor's Degree | $73,854 | $63,689 |
| Graduate Degree | $82,612 | $81,165 |
| Total | $61,266 | $56,385 |
Family Income in Salem
Family Income Brackets in Salem
According to the Salem family income data, there are 1,967 families falling into the $100,000 to $149,999 income range, which is the most common income bracket and makes up 18.9% of all families. Conversely, the $10,000 to $14,999 income bracket is the least frequent group with only 156 families (1.5%) belonging to this category.
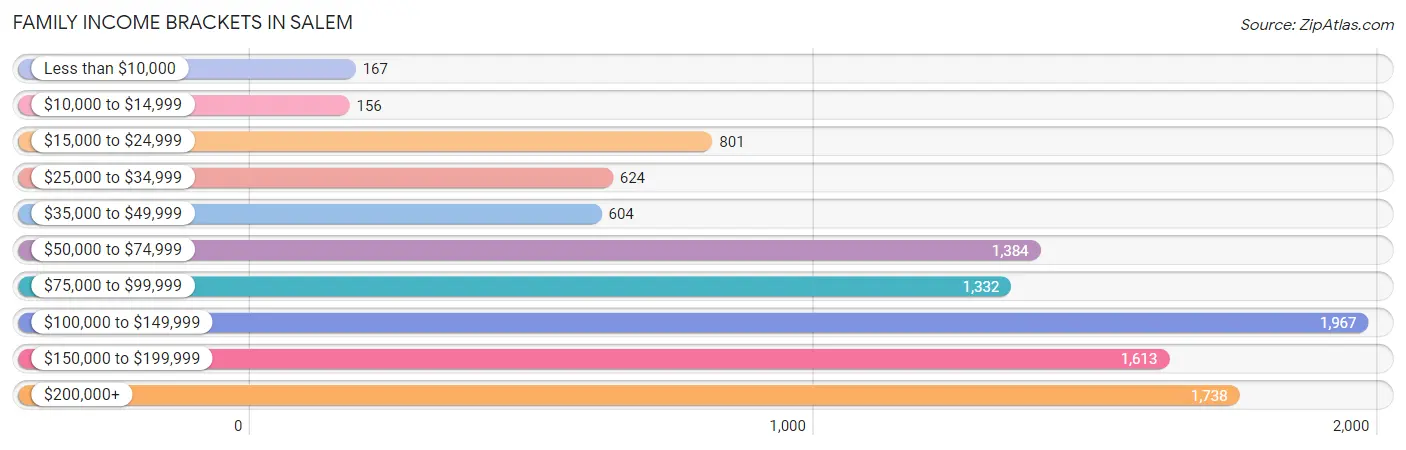
| Income Bracket | # Families | % Families |
| Less than $10,000 | 167 | 1.6% |
| $10,000 to $14,999 | 156 | 1.5% |
| $15,000 to $24,999 | 801 | 7.7% |
| $25,000 to $34,999 | 624 | 6.0% |
| $35,000 to $49,999 | 604 | 5.8% |
| $50,000 to $74,999 | 1,384 | 13.3% |
| $75,000 to $99,999 | 1,332 | 12.8% |
| $100,000 to $149,999 | 1,967 | 18.9% |
| $150,000 to $199,999 | 1,613 | 15.5% |
| $200,000+ | 1,738 | 16.7% |
Family Income by Famaliy Size in Salem
5-person families (432 | 4.2%) account for the highest median family income in Salem with $199,211 per family, while 2-person families (5,484 | 52.7%) have the highest median income of $49,194 per family member.
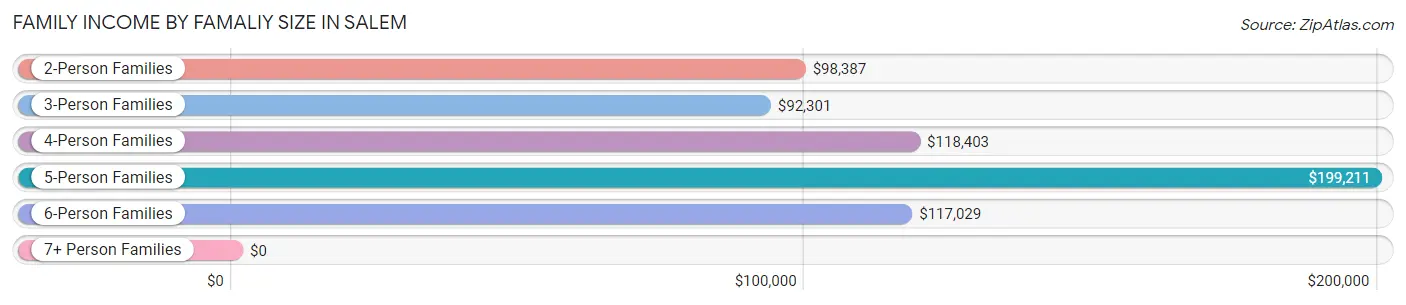
| Income Bracket | # Families | Median Income |
| 2-Person Families | 5,484 (52.7%) | $98,387 |
| 3-Person Families | 2,325 (22.3%) | $92,301 |
| 4-Person Families | 1,845 (17.7%) | $118,403 |
| 5-Person Families | 432 (4.2%) | $199,211 |
| 6-Person Families | 230 (2.2%) | $117,029 |
| 7+ Person Families | 91 (0.9%) | $0 |
| Total | 10,407 (100.0%) | $105,422 |
Family Income by Number of Earners in Salem
The median family income in Salem is $105,422, with families comprising 3+ earners (1,471) having the highest median family income of $152,269, while families with 1 earner (2,899) have the lowest median family income of $52,185, accounting for 14.1% and 27.9% of families, respectively.
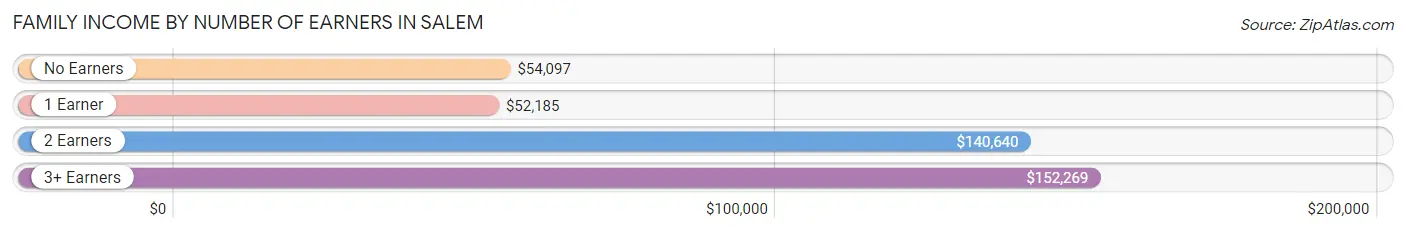
| Number of Earners | # Families | Median Income |
| No Earners | 1,089 (10.5%) | $54,097 |
| 1 Earner | 2,899 (27.9%) | $52,185 |
| 2 Earners | 4,948 (47.5%) | $140,640 |
| 3+ Earners | 1,471 (14.1%) | $152,269 |
| Total | 10,407 (100.0%) | $105,422 |
Household Income in Salem
Household Income Brackets in Salem
With 3,540 households falling in the category, the $100,000 to $149,999 income range is the most frequent in Salem, accounting for 17.8% of all households. In contrast, only 855 households (4.3%) fall into the less than $10,000 income bracket, making it the least populous group.
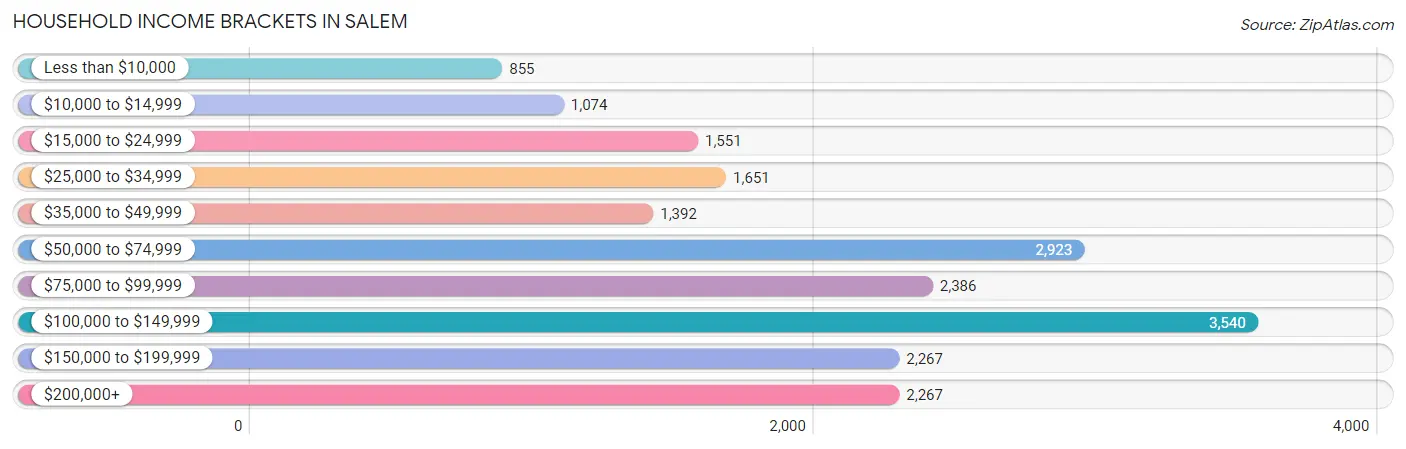
| Income Bracket | # Households | % Households |
| Less than $10,000 | 855 | 4.3% |
| $10,000 to $14,999 | 1,074 | 5.4% |
| $15,000 to $24,999 | 1,551 | 7.8% |
| $25,000 to $34,999 | 1,651 | 8.3% |
| $35,000 to $49,999 | 1,392 | 7.0% |
| $50,000 to $74,999 | 2,923 | 14.7% |
| $75,000 to $99,999 | 2,386 | 12.0% |
| $100,000 to $149,999 | 3,540 | 17.8% |
| $150,000 to $199,999 | 2,267 | 11.4% |
| $200,000+ | 2,267 | 11.4% |
Household Income by Householder Age in Salem
The median household income in Salem is $79,196, with the highest median household income of $93,094 found in the 25 to 44 years age bracket for the primary householder. A total of 7,082 households (35.6%) fall into this category. Meanwhile, the 65+ years age bracket for the primary householder has the lowest median household income of $48,566, with 5,216 households (26.2%) in this group.
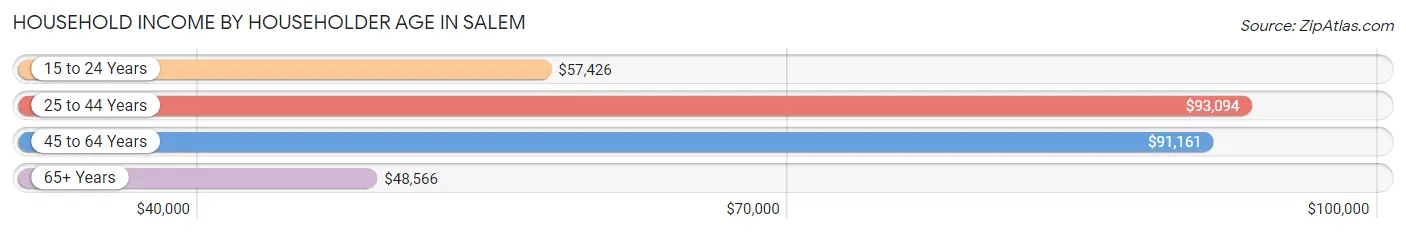
| Income Bracket | # Households | Median Income |
| 15 to 24 Years | 746 (3.7%) | $57,426 |
| 25 to 44 Years | 7,082 (35.6%) | $93,094 |
| 45 to 64 Years | 6,843 (34.4%) | $91,161 |
| 65+ Years | 5,216 (26.2%) | $48,566 |
| Total | 19,887 (100.0%) | $79,196 |
Poverty in Salem
Income Below Poverty by Sex and Age in Salem
With 11.0% poverty level for males and 16.0% for females among the residents of Salem, 16 and 17 year old males and 5 year old females are the most vulnerable to poverty, with 144 males (37.9%) and 92 females (41.8%) in their respective age groups living below the poverty level.
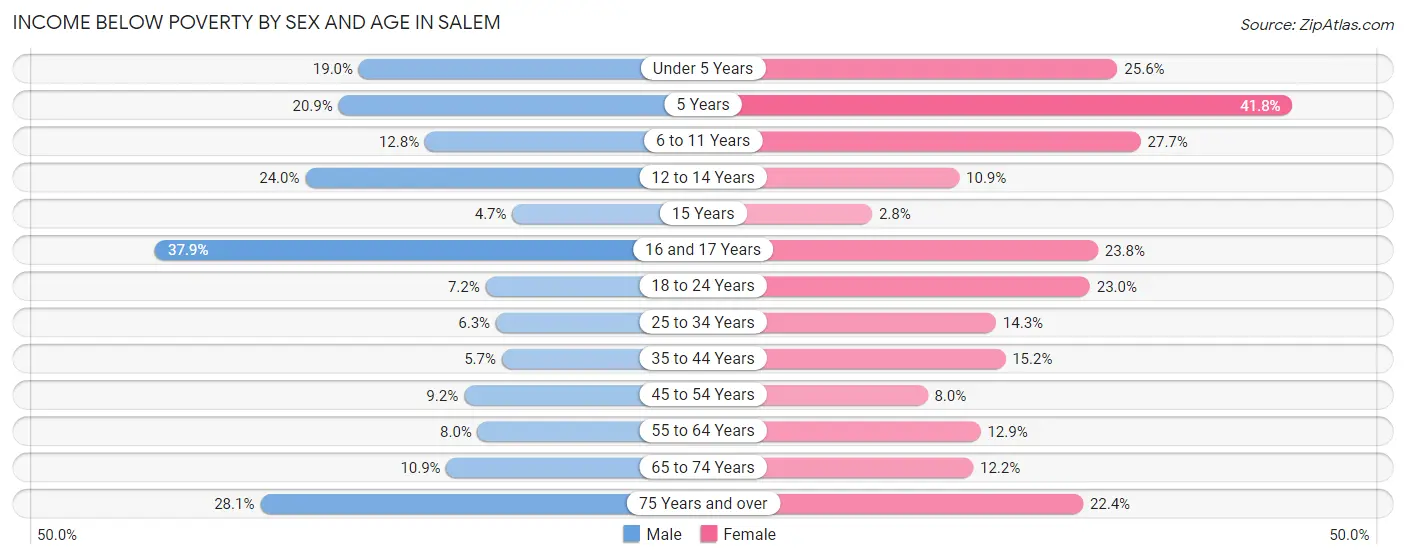
| Age Bracket | Male | Female |
| Under 5 Years | 235 (19.0%) | 252 (25.6%) |
| 5 Years | 34 (20.9%) | 92 (41.8%) |
| 6 to 11 Years | 124 (12.8%) | 340 (27.7%) |
| 12 to 14 Years | 159 (23.9%) | 50 (10.9%) |
| 15 Years | 7 (4.7%) | 4 (2.8%) |
| 16 and 17 Years | 144 (37.9%) | 72 (23.8%) |
| 18 to 24 Years | 140 (7.2%) | 531 (23.0%) |
| 25 to 34 Years | 229 (6.3%) | 612 (14.3%) |
| 35 to 44 Years | 159 (5.7%) | 469 (15.2%) |
| 45 to 54 Years | 213 (9.2%) | 226 (8.0%) |
| 55 to 64 Years | 211 (8.0%) | 407 (12.9%) |
| 65 to 74 Years | 183 (10.8%) | 341 (12.2%) |
| 75 Years and over | 326 (28.1%) | 368 (22.4%) |
| Total | 2,164 (11.0%) | 3,764 (16.0%) |
Income Above Poverty by Sex and Age in Salem
According to the poverty statistics in Salem, males aged 15 years and females aged 15 years are the age groups that are most secure financially, with 95.3% of males and 97.2% of females in these age groups living above the poverty line.
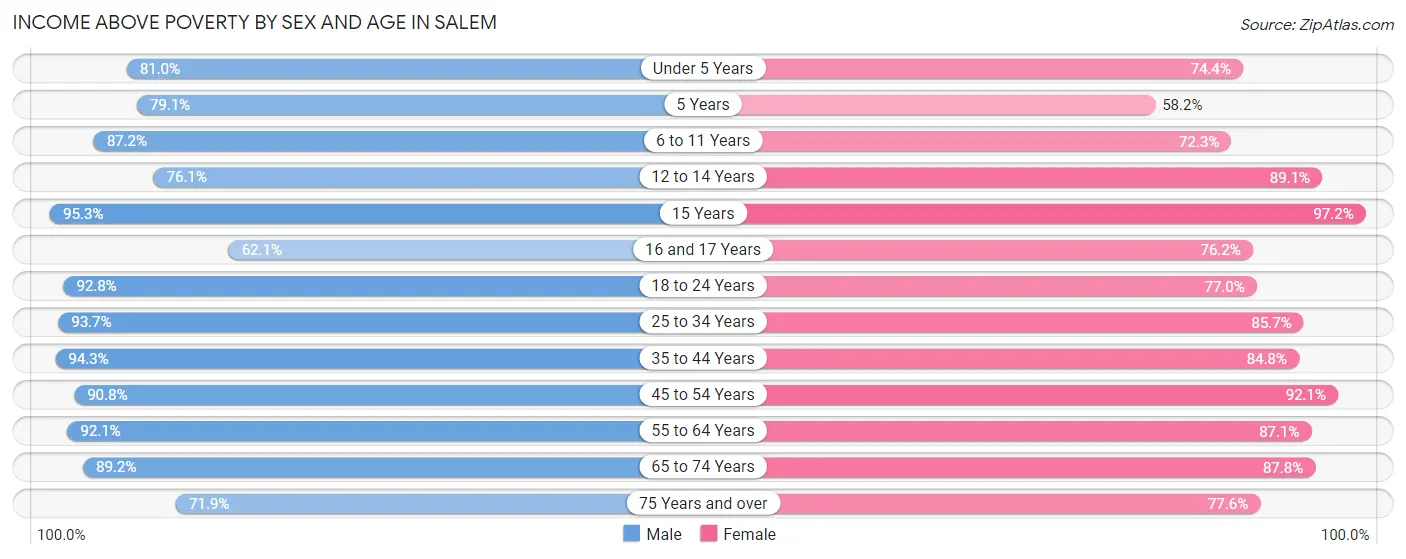
| Age Bracket | Male | Female |
| Under 5 Years | 1,003 (81.0%) | 733 (74.4%) |
| 5 Years | 129 (79.1%) | 128 (58.2%) |
| 6 to 11 Years | 842 (87.2%) | 886 (72.3%) |
| 12 to 14 Years | 505 (76.0%) | 409 (89.1%) |
| 15 Years | 141 (95.3%) | 139 (97.2%) |
| 16 and 17 Years | 236 (62.1%) | 231 (76.2%) |
| 18 to 24 Years | 1,798 (92.8%) | 1,776 (77.0%) |
| 25 to 34 Years | 3,428 (93.7%) | 3,668 (85.7%) |
| 35 to 44 Years | 2,628 (94.3%) | 2,623 (84.8%) |
| 45 to 54 Years | 2,097 (90.8%) | 2,615 (92.0%) |
| 55 to 64 Years | 2,443 (92.0%) | 2,755 (87.1%) |
| 65 to 74 Years | 1,503 (89.1%) | 2,459 (87.8%) |
| 75 Years and over | 833 (71.9%) | 1,276 (77.6%) |
| Total | 17,586 (89.0%) | 19,698 (84.0%) |
Income Below Poverty Among Married-Couple Families in Salem
The poverty statistics for married-couple families in Salem show that 3.4% or 235 of the total 7,003 families live below the poverty line. Families with 1 or 2 children have the highest poverty rate of 7.3%, comprising of 145 families. On the other hand, families with 3 or 4 children have the lowest poverty rate of 0.0%, which includes 0 families.
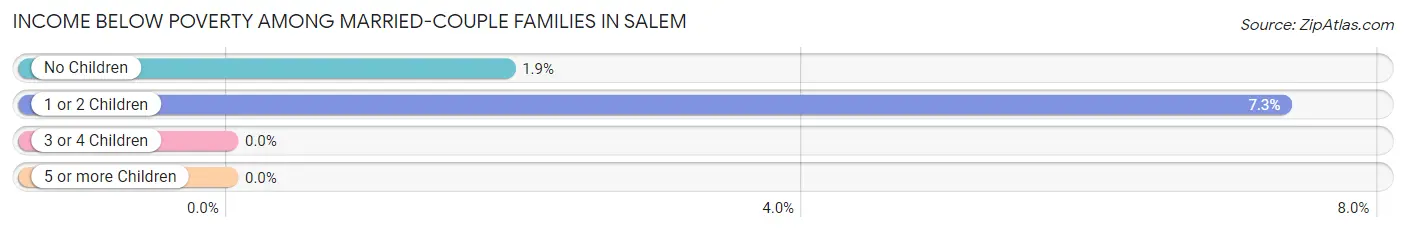
| Children | Above Poverty | Below Poverty |
| No Children | 4,569 (98.1%) | 90 (1.9%) |
| 1 or 2 Children | 1,830 (92.7%) | 145 (7.3%) |
| 3 or 4 Children | 369 (100.0%) | 0 (0.0%) |
| 5 or more Children | 0 (0.0%) | 0 (0.0%) |
| Total | 6,768 (96.6%) | 235 (3.4%) |
Income Below Poverty Among Single-Parent Households in Salem
According to the poverty data in Salem, 11.9% or 71 single-father households and 30.3% or 850 single-mother households are living below the poverty line. Among single-father households, those with 3 or 4 children have the highest poverty rate, with 61 households (91.0%) experiencing poverty. Likewise, among single-mother households, those with 5 or more children have the highest poverty rate, with 48 households (100.0%) falling below the poverty line.
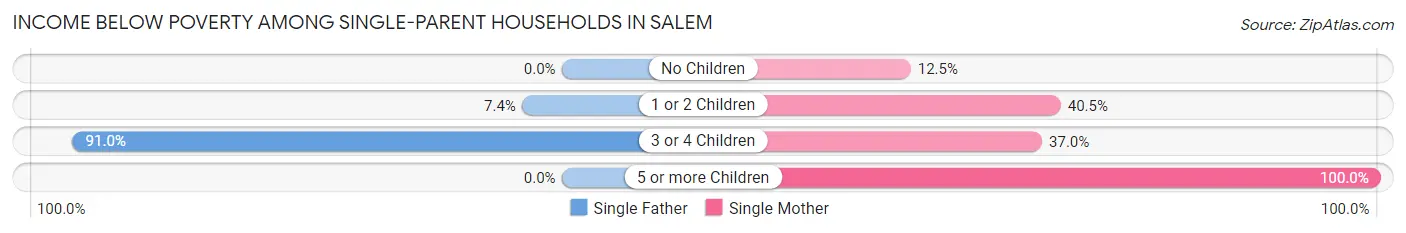
| Children | Single Father | Single Mother |
| No Children | 0 (0.0%) | 139 (12.5%) |
| 1 or 2 Children | 10 (7.4%) | 629 (40.5%) |
| 3 or 4 Children | 61 (91.0%) | 34 (37.0%) |
| 5 or more Children | 0 (0.0%) | 48 (100.0%) |
| Total | 71 (11.9%) | 850 (30.3%) |
Income Below Poverty Among Married-Couple vs Single-Parent Households in Salem
The poverty data for Salem shows that 235 of the married-couple family households (3.4%) and 921 of the single-parent households (27.1%) are living below the poverty level. Within the married-couple family households, those with 1 or 2 children have the highest poverty rate, with 145 households (7.3%) falling below the poverty line. Among the single-parent households, those with 5 or more children have the highest poverty rate, with 48 household (100.0%) living below poverty.
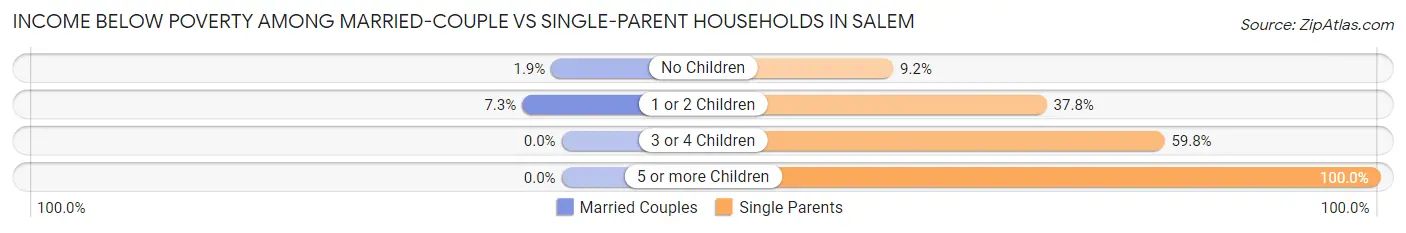
| Children | Married-Couple Families | Single-Parent Households |
| No Children | 90 (1.9%) | 139 (9.2%) |
| 1 or 2 Children | 145 (7.3%) | 639 (37.8%) |
| 3 or 4 Children | 0 (0.0%) | 95 (59.8%) |
| 5 or more Children | 0 (0.0%) | 48 (100.0%) |
| Total | 235 (3.4%) | 921 (27.1%) |
Race in Salem
The most populous races in Salem are White / Caucasian (34,039 | 76.4%), Hispanic or Latino (8,473 | 19.0%), and Two or more Races (3,555 | 8.0%).
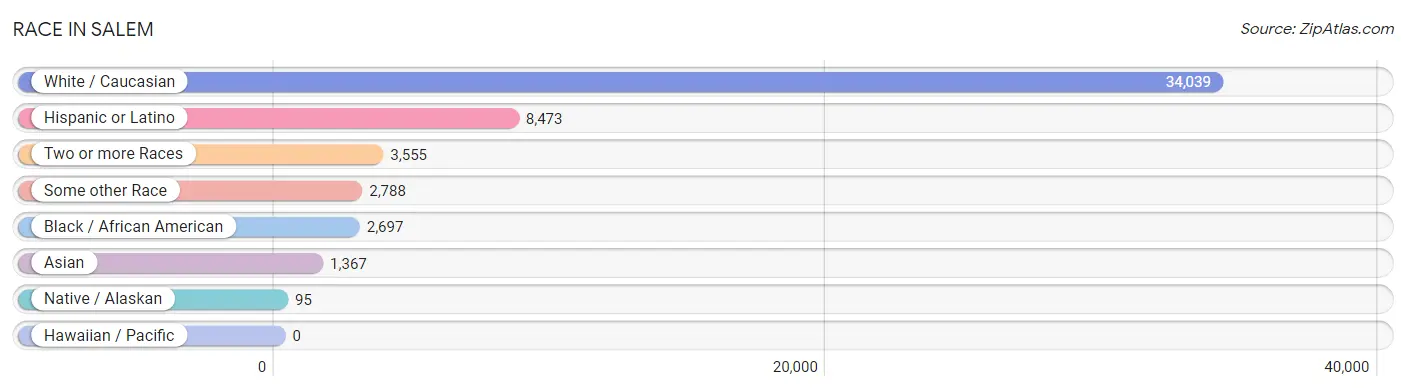
| Race | # Population | % Population |
| Asian | 1,367 | 3.1% |
| Black / African American | 2,697 | 6.1% |
| Hawaiian / Pacific | 0 | 0.0% |
| Hispanic or Latino | 8,473 | 19.0% |
| Native / Alaskan | 95 | 0.2% |
| White / Caucasian | 34,039 | 76.4% |
| Two or more Races | 3,555 | 8.0% |
| Some other Race | 2,788 | 6.3% |
| Total | 44,541 | 100.0% |
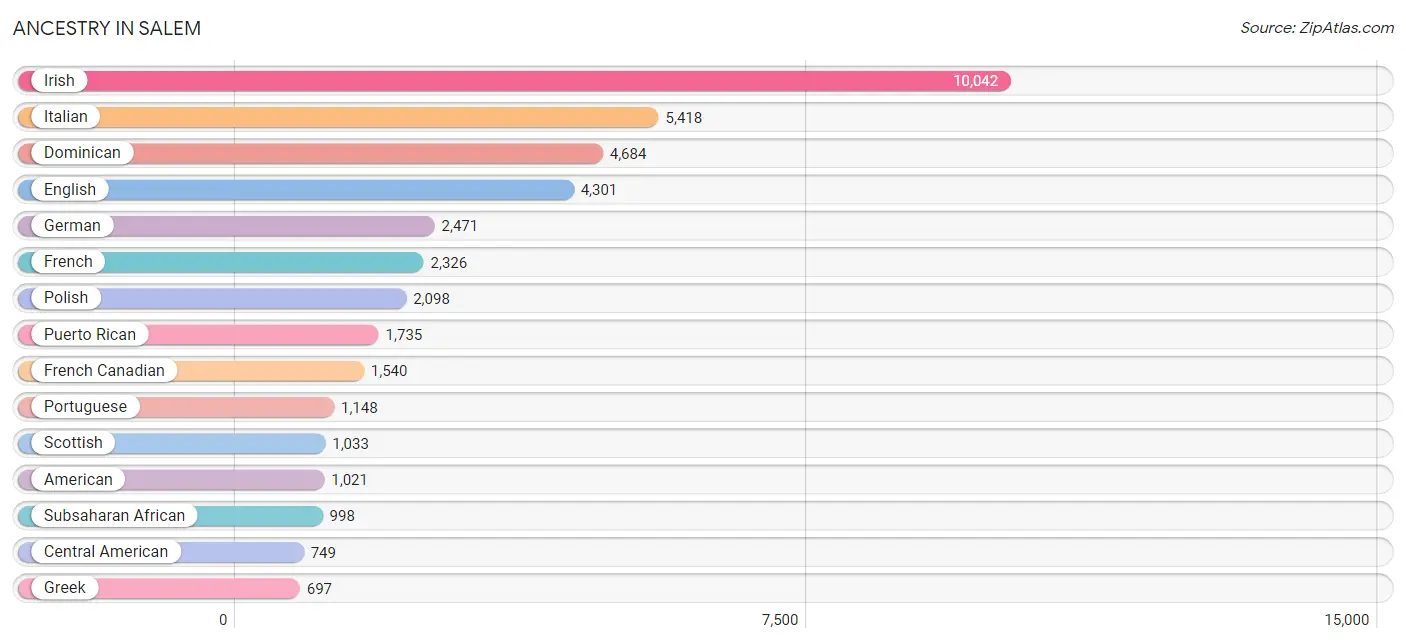
Ancestry in Salem
The most populous ancestries reported in Salem are Irish (10,042 | 22.6%), Italian (5,418 | 12.2%), Dominican (4,684 | 10.5%), English (4,301 | 9.7%), and German (2,471 | 5.6%), together accounting for 60.4% of all Salem residents.
| Ancestry | # Population | % Population |
| African | 477 | 1.1% |
| Albanian | 138 | 0.3% |
| American | 1,021 | 2.3% |
| Arab | 428 | 1.0% |
| Argentinean | 21 | 0.1% |
| Armenian | 57 | 0.1% |
| Australian | 7 | 0.0% |
| Austrian | 62 | 0.1% |
| Barbadian | 13 | 0.0% |
| Belgian | 13 | 0.0% |
| Bhutanese | 129 | 0.3% |
| Blackfeet | 28 | 0.1% |
| Brazilian | 308 | 0.7% |
| British | 137 | 0.3% |
| British West Indian | 11 | 0.0% |
| Burmese | 228 | 0.5% |
| Canadian | 258 | 0.6% |
| Cape Verdean | 274 | 0.6% |
| Central American | 749 | 1.7% |
| Central American Indian | 61 | 0.1% |
| Cherokee | 13 | 0.0% |
| Chilean | 10 | 0.0% |
| Chippewa | 5 | 0.0% |
| Colombian | 87 | 0.2% |
| Costa Rican | 40 | 0.1% |
| Cree | 24 | 0.1% |
| Croatian | 13 | 0.0% |
| Cuban | 36 | 0.1% |
| Cypriot | 16 | 0.0% |
| Czech | 96 | 0.2% |
| Czechoslovakian | 34 | 0.1% |
| Danish | 172 | 0.4% |
| Dominican | 4,684 | 10.5% |
| Dutch | 293 | 0.7% |
| Eastern European | 235 | 0.5% |
| Ecuadorian | 34 | 0.1% |
| English | 4,301 | 9.7% |
| Estonian | 20 | 0.0% |
| European | 434 | 1.0% |
| Finnish | 128 | 0.3% |
| French | 2,326 | 5.2% |
| French American Indian | 17 | 0.0% |
| French Canadian | 1,540 | 3.5% |
| German | 2,471 | 5.6% |
| Greek | 697 | 1.6% |
| Guatemalan | 12 | 0.0% |
| Guyanese | 2 | 0.0% |
| Haitian | 296 | 0.7% |
| Honduran | 218 | 0.5% |
| Hungarian | 63 | 0.1% |
| Indian (Asian) | 602 | 1.3% |
| Iranian | 64 | 0.1% |
| Iraqi | 118 | 0.3% |
| Irish | 10,042 | 22.6% |
| Italian | 5,418 | 12.2% |
| Jamaican | 178 | 0.4% |
| Japanese | 128 | 0.3% |
| Jordanian | 13 | 0.0% |
| Korean | 243 | 0.5% |
| Laotian | 20 | 0.0% |
| Lebanese | 64 | 0.1% |
| Lithuanian | 216 | 0.5% |
| Mexican | 520 | 1.2% |
| Moroccan | 49 | 0.1% |
| Native Hawaiian | 16 | 0.0% |
| Nicaraguan | 38 | 0.1% |
| Nigerian | 50 | 0.1% |
| Northern European | 118 | 0.3% |
| Norwegian | 352 | 0.8% |
| Pakistani | 114 | 0.3% |
| Paraguayan | 45 | 0.1% |
| Peruvian | 178 | 0.4% |
| Polish | 2,098 | 4.7% |
| Portuguese | 1,148 | 2.6% |
| Puerto Rican | 1,735 | 3.9% |
| Romanian | 78 | 0.2% |
| Russian | 601 | 1.3% |
| Salvadoran | 417 | 0.9% |
| Scandinavian | 103 | 0.2% |
| Scotch-Irish | 380 | 0.9% |
| Scottish | 1,033 | 2.3% |
| Slovak | 31 | 0.1% |
| Slovene | 9 | 0.0% |
| South African | 42 | 0.1% |
| South American | 395 | 0.9% |
| Spaniard | 22 | 0.1% |
| Spanish | 171 | 0.4% |
| Sri Lankan | 117 | 0.3% |
| Subsaharan African | 998 | 2.2% |
| Swedish | 451 | 1.0% |
| Swiss | 98 | 0.2% |
| Syrian | 160 | 0.4% |
| Thai | 61 | 0.1% |
| Trinidadian and Tobagonian | 17 | 0.0% |
| Turkish | 37 | 0.1% |
| Ukrainian | 172 | 0.4% |
| Venezuelan | 20 | 0.0% |
| Vietnamese | 282 | 0.6% |
| Welsh | 148 | 0.3% |
| Yugoslavian | 45 | 0.1% | View All 100 Rows |
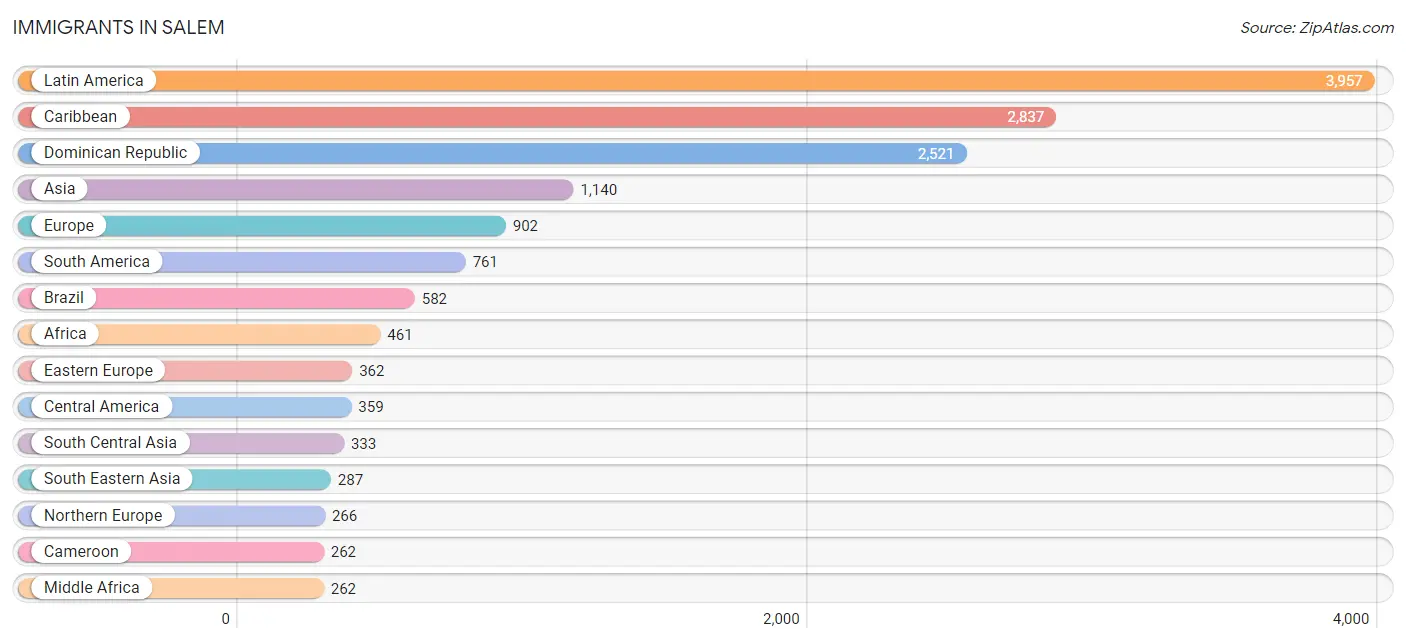
Immigrants in Salem
The most numerous immigrant groups reported in Salem came from Latin America (3,957 | 8.9%), Caribbean (2,837 | 6.4%), Dominican Republic (2,521 | 5.7%), Asia (1,140 | 2.6%), and Europe (902 | 2.0%), together accounting for 25.5% of all Salem residents.
| Immigration Origin | # Population | % Population |
| Africa | 461 | 1.0% |
| Albania | 4 | 0.0% |
| Argentina | 31 | 0.1% |
| Asia | 1,140 | 2.6% |
| Australia | 12 | 0.0% |
| Bangladesh | 200 | 0.4% |
| Bosnia and Herzegovina | 45 | 0.1% |
| Brazil | 582 | 1.3% |
| Cabo Verde | 26 | 0.1% |
| Cambodia | 9 | 0.0% |
| Cameroon | 262 | 0.6% |
| Canada | 84 | 0.2% |
| Caribbean | 2,837 | 6.4% |
| Central America | 359 | 0.8% |
| Chile | 10 | 0.0% |
| China | 188 | 0.4% |
| Colombia | 108 | 0.2% |
| Costa Rica | 10 | 0.0% |
| Cuba | 31 | 0.1% |
| Dominican Republic | 2,521 | 5.7% |
| Eastern Africa | 3 | 0.0% |
| Eastern Asia | 259 | 0.6% |
| Eastern Europe | 362 | 0.8% |
| El Salvador | 151 | 0.3% |
| England | 96 | 0.2% |
| Europe | 902 | 2.0% |
| France | 17 | 0.0% |
| Germany | 24 | 0.1% |
| Ghana | 32 | 0.1% |
| Greece | 120 | 0.3% |
| Guyana | 2 | 0.0% |
| Haiti | 121 | 0.3% |
| Honduras | 32 | 0.1% |
| Hong Kong | 11 | 0.0% |
| Hungary | 37 | 0.1% |
| India | 50 | 0.1% |
| Indonesia | 20 | 0.0% |
| Iran | 21 | 0.1% |
| Iraq | 118 | 0.3% |
| Ireland | 54 | 0.1% |
| Israel | 13 | 0.0% |
| Italy | 26 | 0.1% |
| Jamaica | 141 | 0.3% |
| Japan | 51 | 0.1% |
| Jordan | 13 | 0.0% |
| Korea | 20 | 0.0% |
| Kuwait | 20 | 0.0% |
| Latin America | 3,957 | 8.9% |
| Latvia | 10 | 0.0% |
| Malaysia | 12 | 0.0% |
| Mexico | 154 | 0.4% |
| Middle Africa | 262 | 0.6% |
| Moldova | 48 | 0.1% |
| Morocco | 30 | 0.1% |
| Nicaragua | 12 | 0.0% |
| Nigeria | 108 | 0.2% |
| Northern Africa | 30 | 0.1% |
| Northern Europe | 266 | 0.6% |
| Oceania | 12 | 0.0% |
| Pakistan | 21 | 0.1% |
| Peru | 28 | 0.1% |
| Philippines | 133 | 0.3% |
| Poland | 25 | 0.1% |
| Portugal | 87 | 0.2% |
| Russia | 51 | 0.1% |
| Scotland | 14 | 0.0% |
| South America | 761 | 1.7% |
| South Central Asia | 333 | 0.7% |
| South Eastern Asia | 287 | 0.6% |
| Southern Europe | 233 | 0.5% |
| Sri Lanka | 26 | 0.1% |
| Sweden | 14 | 0.0% |
| Syria | 65 | 0.2% |
| Trinidad and Tobago | 12 | 0.0% |
| Turkey | 9 | 0.0% |
| Ukraine | 84 | 0.2% |
| Uzbekistan | 15 | 0.0% |
| Vietnam | 113 | 0.3% |
| Western Africa | 166 | 0.4% |
| Western Asia | 261 | 0.6% |
| Western Europe | 41 | 0.1% | View All 81 Rows |
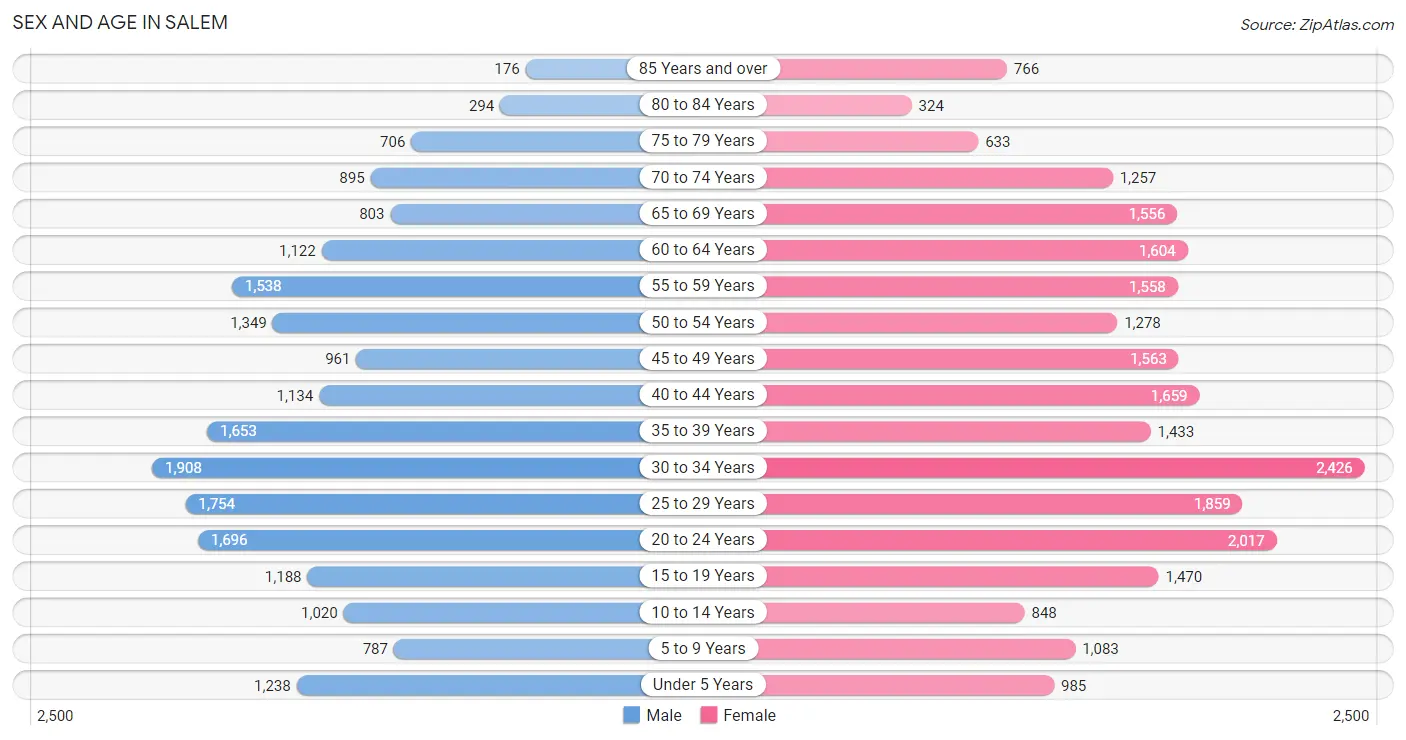
Sex and Age in Salem
Sex and Age in Salem
The most populous age groups in Salem are 30 to 34 Years (1,908 | 9.4%) for men and 30 to 34 Years (2,426 | 10.0%) for women.
| Age Bracket | Male | Female |
| Under 5 Years | 1,238 (6.1%) | 985 (4.1%) |
| 5 to 9 Years | 787 (3.9%) | 1,083 (4.4%) |
| 10 to 14 Years | 1,020 (5.0%) | 848 (3.5%) |
| 15 to 19 Years | 1,188 (5.9%) | 1,470 (6.0%) |
| 20 to 24 Years | 1,696 (8.4%) | 2,017 (8.3%) |
| 25 to 29 Years | 1,754 (8.7%) | 1,859 (7.6%) |
| 30 to 34 Years | 1,908 (9.4%) | 2,426 (10.0%) |
| 35 to 39 Years | 1,653 (8.2%) | 1,433 (5.9%) |
| 40 to 44 Years | 1,134 (5.6%) | 1,659 (6.8%) |
| 45 to 49 Years | 961 (4.8%) | 1,563 (6.4%) |
| 50 to 54 Years | 1,349 (6.7%) | 1,278 (5.3%) |
| 55 to 59 Years | 1,538 (7.6%) | 1,558 (6.4%) |
| 60 to 64 Years | 1,122 (5.6%) | 1,604 (6.6%) |
| 65 to 69 Years | 803 (4.0%) | 1,556 (6.4%) |
| 70 to 74 Years | 895 (4.4%) | 1,257 (5.2%) |
| 75 to 79 Years | 706 (3.5%) | 633 (2.6%) |
| 80 to 84 Years | 294 (1.5%) | 324 (1.3%) |
| 85 Years and over | 176 (0.9%) | 766 (3.2%) |
| Total | 20,222 (100.0%) | 24,319 (100.0%) |
Families and Households in Salem
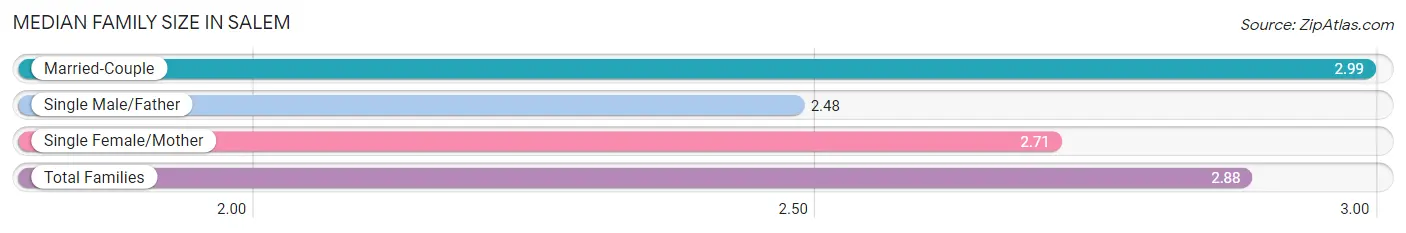
Median Family Size in Salem
The median family size in Salem is 2.88 persons per family, with married-couple families (7,003 | 67.3%) accounting for the largest median family size of 2.99 persons per family. On the other hand, single male/father families (598 | 5.8%) represent the smallest median family size with 2.48 persons per family.
| Family Type | # Families | Family Size |
| Married-Couple | 7,003 (67.3%) | 2.99 |
| Single Male/Father | 598 (5.8%) | 2.48 |
| Single Female/Mother | 2,806 (27.0%) | 2.71 |
| Total Families | 10,407 (100.0%) | 2.88 |
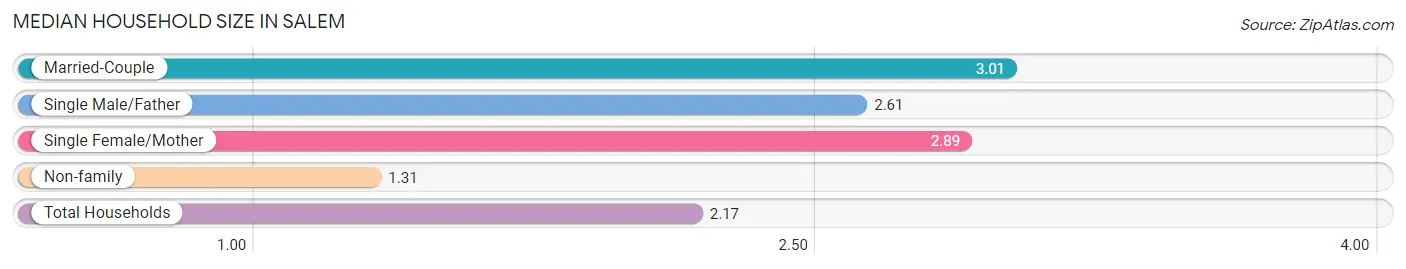
Median Household Size in Salem
The median household size in Salem is 2.17 persons per household, with married-couple households (7,003 | 35.2%) accounting for the largest median household size of 3.01 persons per household. non-family households (9,480 | 47.7%) represent the smallest median household size with 1.31 persons per household.
| Household Type | # Households | Household Size |
| Married-Couple | 7,003 (35.2%) | 3.01 |
| Single Male/Father | 598 (3.0%) | 2.61 |
| Single Female/Mother | 2,806 (14.1%) | 2.89 |
| Non-family | 9,480 (47.7%) | 1.31 |
| Total Households | 19,887 (100.0%) | 2.17 |
Household Size by Marriage Status in Salem
Out of a total of 19,887 households in Salem, 10,407 (52.3%) are family households, while 9,480 (47.7%) are nonfamily households. The most numerous type of family households are 2-person households, comprising 5,170, and the most common type of nonfamily households are 1-person households, comprising 7,147.
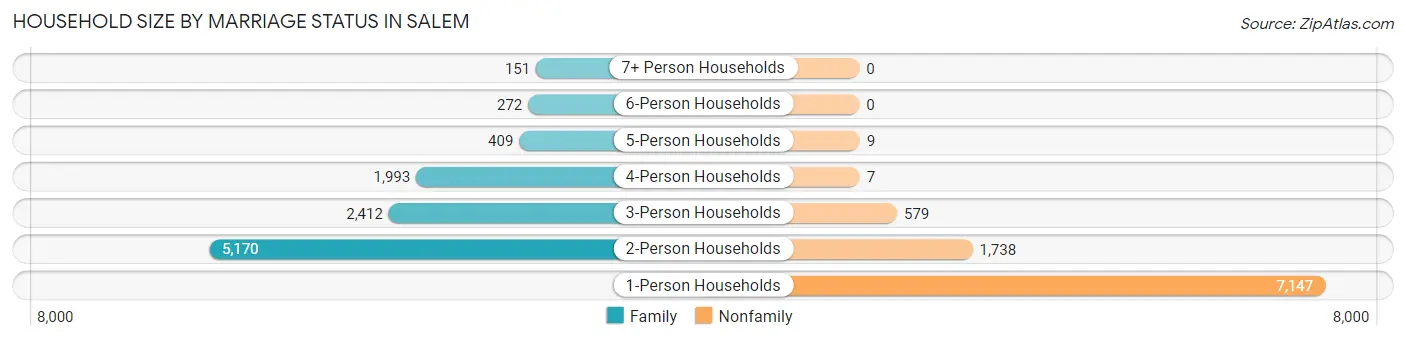
| Household Size | Family Households | Nonfamily Households |
| 1-Person Households | - | 7,147 (35.9%) |
| 2-Person Households | 5,170 (26.0%) | 1,738 (8.7%) |
| 3-Person Households | 2,412 (12.1%) | 579 (2.9%) |
| 4-Person Households | 1,993 (10.0%) | 7 (0.0%) |
| 5-Person Households | 409 (2.1%) | 9 (0.1%) |
| 6-Person Households | 272 (1.4%) | 0 (0.0%) |
| 7+ Person Households | 151 (0.8%) | 0 (0.0%) |
| Total | 10,407 (52.3%) | 9,480 (47.7%) |
Female Fertility in Salem
Fertility by Age in Salem
Average fertility rate in Salem is 48.0 births per 1,000 women. Women in the age bracket of 20 to 34 years have the highest fertility rate with 90.0 births per 1,000 women. Women in the age bracket of 20 to 34 years acount for 94.2% of all women with births.
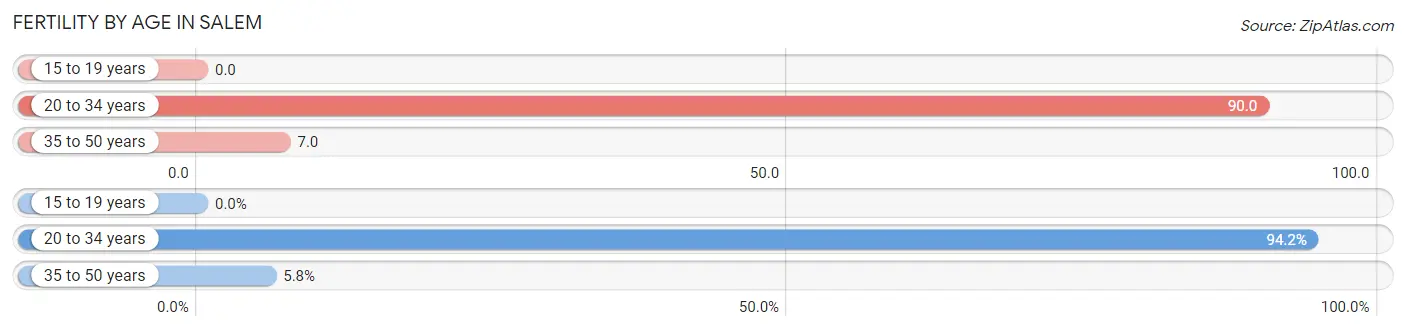
| Age Bracket | Women with Births | Births / 1,000 Women |
| 15 to 19 years | 0 (0.0%) | 0.0 |
| 20 to 34 years | 570 (94.2%) | 90.0 |
| 35 to 50 years | 35 (5.8%) | 7.0 |
| Total | 605 (100.0%) | 48.0 |
Fertility by Age by Marriage Status in Salem
58.5% of women with births (605) in Salem are married. The highest percentage of unmarried women with births falls into 20 to 34 years age bracket with 42.6% of them unmarried at the time of birth, while the lowest percentage of unmarried women with births belong to 35 to 50 years age bracket with 22.9% of them unmarried.
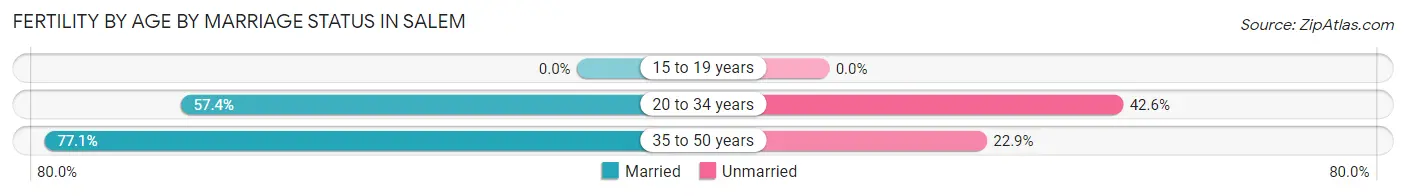
| Age Bracket | Married | Unmarried |
| 15 to 19 years | 0 (0.0%) | 0 (0.0%) |
| 20 to 34 years | 327 (57.4%) | 243 (42.6%) |
| 35 to 50 years | 27 (77.1%) | 8 (22.9%) |
| Total | 354 (58.5%) | 251 (41.5%) |
Fertility by Education in Salem
Average fertility rate in Salem is 48.0 births per 1,000 women. Women with the education attainment of college or associate's degree have the highest fertility rate of 69.0 births per 1,000 women, while women with the education attainment of bachelor's degree have the lowest fertility at 29.0 births per 1,000 women. Women with the education attainment of college or associate's degree represent 43.6% of all women with births.
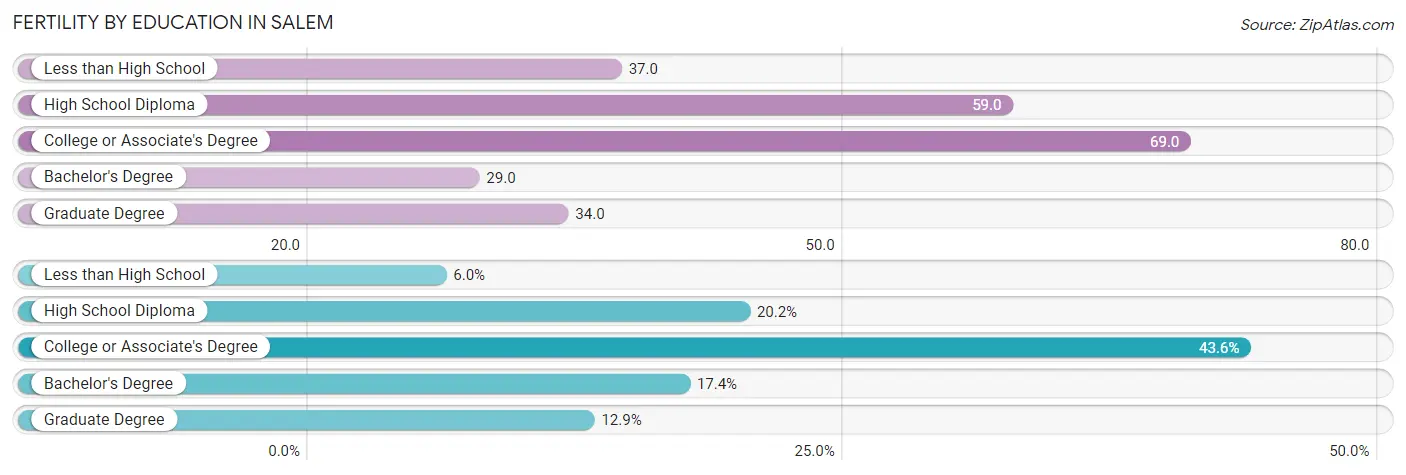
| Educational Attainment | Women with Births | Births / 1,000 Women |
| Less than High School | 36 (5.9%) | 37.0 |
| High School Diploma | 122 (20.2%) | 59.0 |
| College or Associate's Degree | 264 (43.6%) | 69.0 |
| Bachelor's Degree | 105 (17.4%) | 29.0 |
| Graduate Degree | 78 (12.9%) | 34.0 |
| Total | 605 (100.0%) | 48.0 |
Fertility by Education by Marriage Status in Salem
41.5% of women with births in Salem are unmarried. Women with the educational attainment of less than high school are most likely to be married with 100.0% of them married at childbirth, while women with the educational attainment of college or associate's degree are least likely to be married with 76.9% of them unmarried at childbirth.
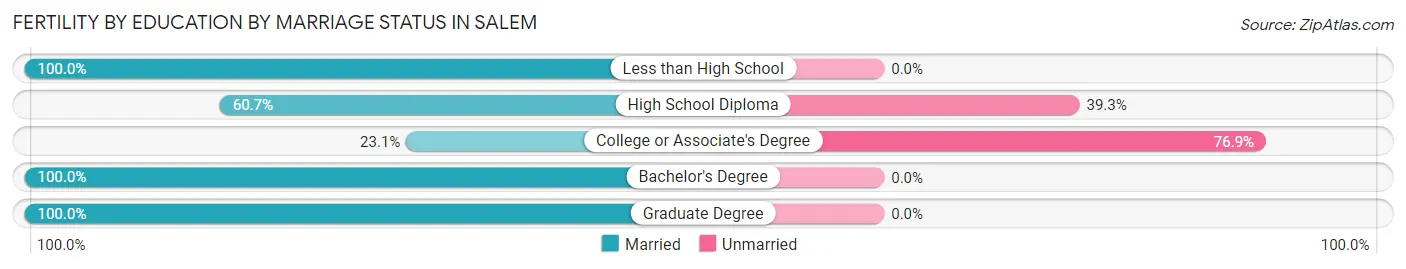
| Educational Attainment | Married | Unmarried |
| Less than High School | 36 (100.0%) | 0 (0.0%) |
| High School Diploma | 74 (60.7%) | 48 (39.3%) |
| College or Associate's Degree | 61 (23.1%) | 203 (76.9%) |
| Bachelor's Degree | 105 (100.0%) | 0 (0.0%) |
| Graduate Degree | 78 (100.0%) | 0 (0.0%) |
| Total | 354 (58.5%) | 251 (41.5%) |
Employment Characteristics in Salem
Employment by Class of Employer in Salem
Among the 25,116 employed individuals in Salem, private company employees (16,518 | 65.8%), not-for-profit organizations (3,006 | 12.0%), and local government employees (2,100 | 8.4%) make up the most common classes of employment.
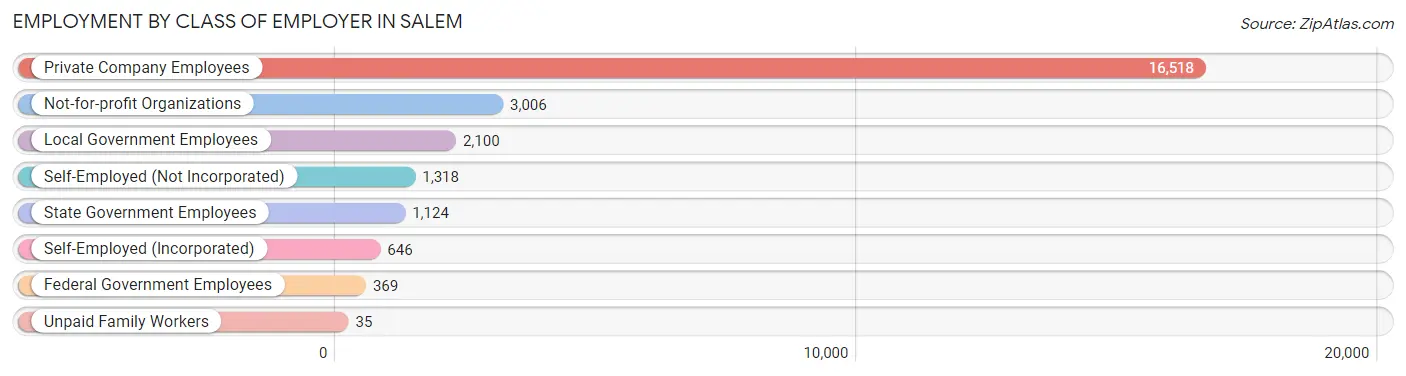
| Employer Class | # Employees | % Employees |
| Private Company Employees | 16,518 | 65.8% |
| Self-Employed (Incorporated) | 646 | 2.6% |
| Self-Employed (Not Incorporated) | 1,318 | 5.2% |
| Not-for-profit Organizations | 3,006 | 12.0% |
| Local Government Employees | 2,100 | 8.4% |
| State Government Employees | 1,124 | 4.5% |
| Federal Government Employees | 369 | 1.5% |
| Unpaid Family Workers | 35 | 0.1% |
| Total | 25,116 | 100.0% |
Employment Status by Age in Salem
According to the labor force statistics for Salem, out of the total population over 16 years of age (38,283), 70.4% or 26,951 individuals are in the labor force, with 5.0% or 1,348 of them unemployed. The age group with the highest labor force participation rate is 25 to 29 years, with 92.3% or 3,335 individuals in the labor force. Within the labor force, the 16 to 19 years age range has the highest percentage of unemployed individuals, with 14.1% or 140 of them being unemployed.
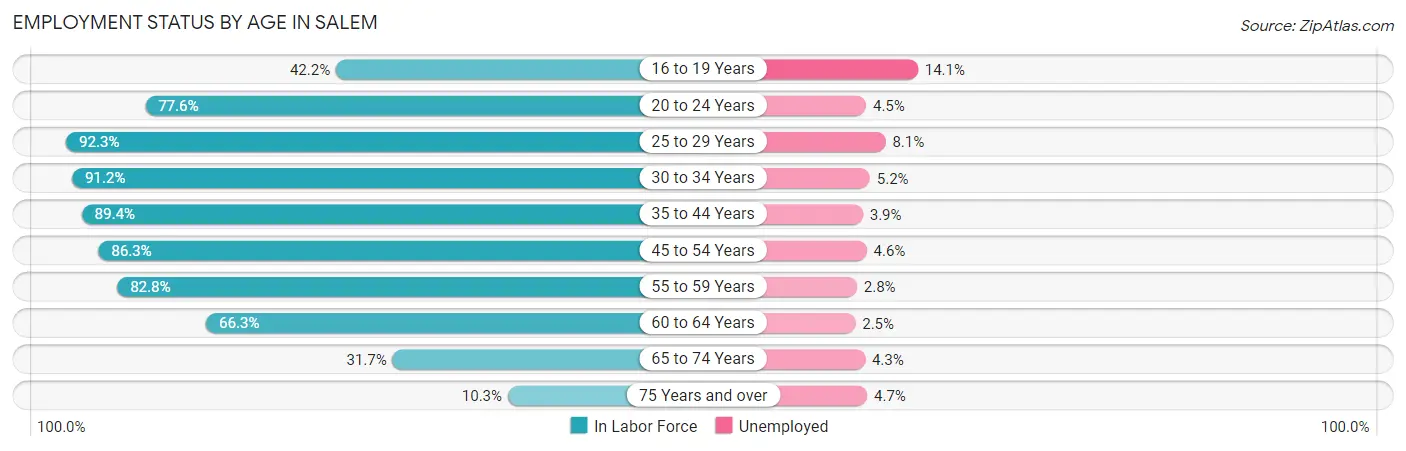
| Age Bracket | In Labor Force | Unemployed |
| 16 to 19 Years | 996 (42.2%) | 140 (14.1%) |
| 20 to 24 Years | 2,881 (77.6%) | 130 (4.5%) |
| 25 to 29 Years | 3,335 (92.3%) | 270 (8.1%) |
| 30 to 34 Years | 3,953 (91.2%) | 206 (5.2%) |
| 35 to 44 Years | 5,256 (89.4%) | 205 (3.9%) |
| 45 to 54 Years | 4,445 (86.3%) | 204 (4.6%) |
| 55 to 59 Years | 2,563 (82.8%) | 72 (2.8%) |
| 60 to 64 Years | 1,807 (66.3%) | 45 (2.5%) |
| 65 to 74 Years | 1,430 (31.7%) | 61 (4.3%) |
| 75 Years and over | 299 (10.3%) | 14 (4.7%) |
| Total | 26,951 (70.4%) | 1,348 (5.0%) |
Employment Status by Educational Attainment in Salem
According to labor force statistics for Salem, 86.1% of individuals (21,352) out of the total population between 25 and 64 years of age (24,799) are in the labor force, with 4.7% or 1,004 of them being unemployed. The group with the highest labor force participation rate are those with the educational attainment of bachelor's degree or higher, with 93.6% or 11,691 individuals in the labor force. Within the labor force, individuals with less than high school education have the highest percentage of unemployment, with 14.2% or 121 of them being unemployed.
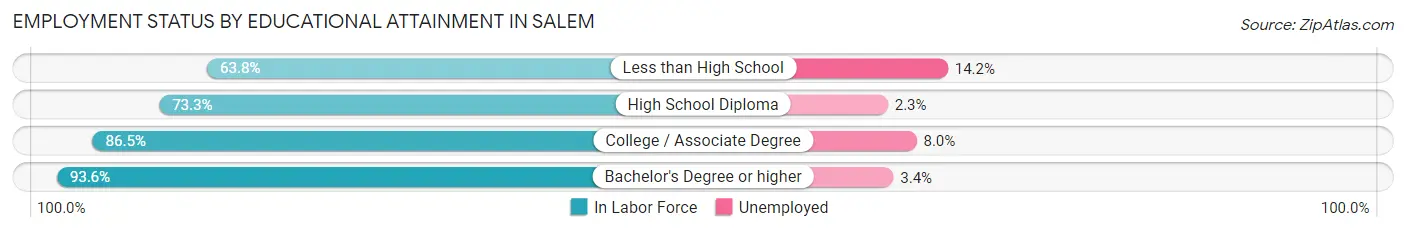
| Educational Attainment | In Labor Force | Unemployed |
| Less than High School | 854 (63.8%) | 190 (14.2%) |
| High School Diploma | 3,763 (73.3%) | 118 (2.3%) |
| College / Associate Degree | 5,049 (86.5%) | 467 (8.0%) |
| Bachelor's Degree or higher | 11,691 (93.6%) | 425 (3.4%) |
| Total | 21,352 (86.1%) | 1,166 (4.7%) |
Employment Occupations by Sex in Salem
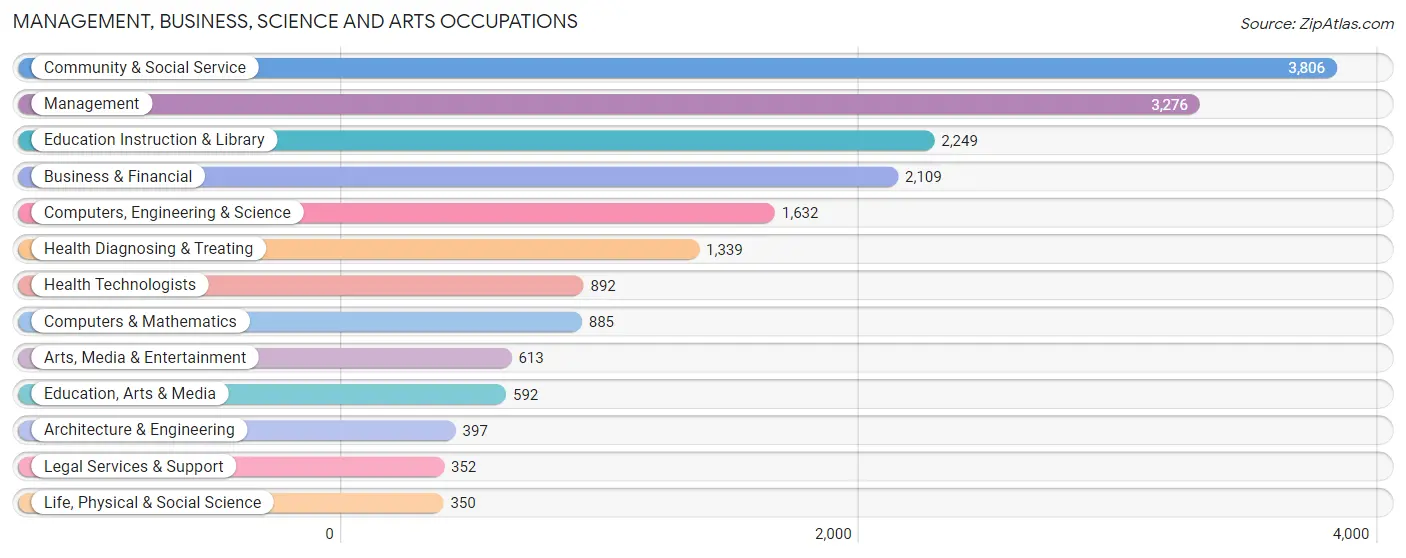
Management, Business, Science and Arts Occupations
The most common Management, Business, Science and Arts occupations in Salem are Community & Social Service (3,806 | 14.9%), Management (3,276 | 12.8%), Education Instruction & Library (2,249 | 8.8%), Business & Financial (2,109 | 8.2%), and Computers, Engineering & Science (1,632 | 6.4%).
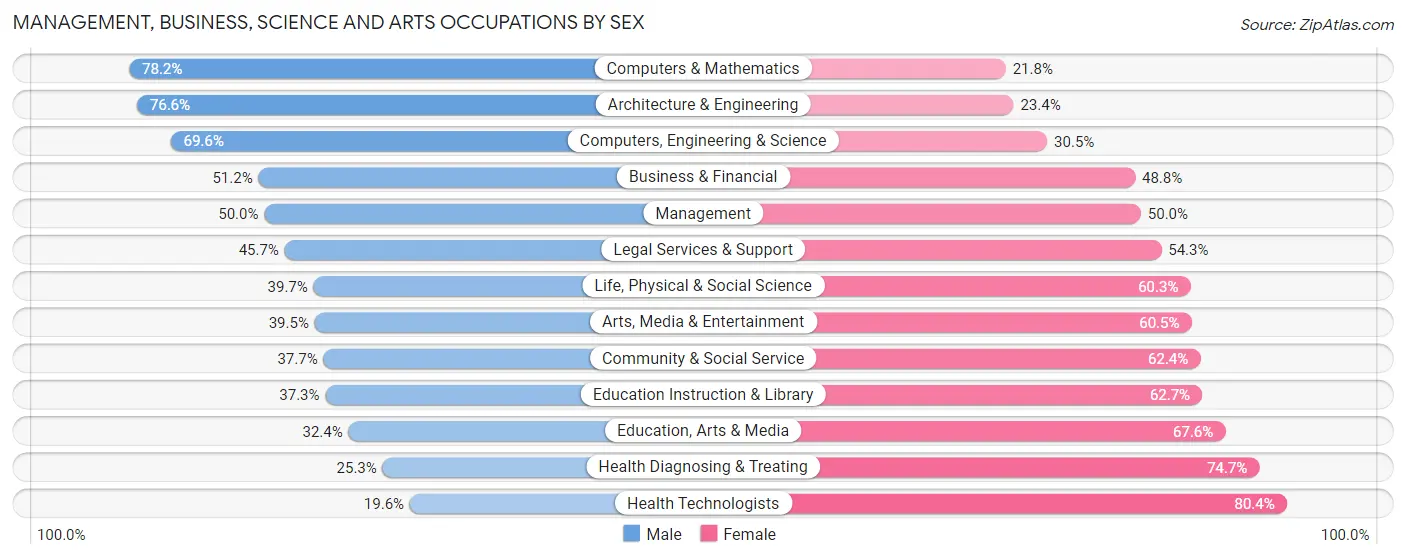
Management, Business, Science and Arts Occupations by Sex
Within the Management, Business, Science and Arts occupations in Salem, the most male-oriented occupations are Computers & Mathematics (78.2%), Architecture & Engineering (76.6%), and Computers, Engineering & Science (69.6%), while the most female-oriented occupations are Health Technologists (80.4%), Health Diagnosing & Treating (74.7%), and Education, Arts & Media (67.6%).
| Occupation | Male | Female |
| Management | 1,638 (50.0%) | 1,638 (50.0%) |
| Business & Financial | 1,080 (51.2%) | 1,029 (48.8%) |
| Computers, Engineering & Science | 1,135 (69.6%) | 497 (30.4%) |
| Computers & Mathematics | 692 (78.2%) | 193 (21.8%) |
| Architecture & Engineering | 304 (76.6%) | 93 (23.4%) |
| Life, Physical & Social Science | 139 (39.7%) | 211 (60.3%) |
| Community & Social Service | 1,433 (37.7%) | 2,373 (62.4%) |
| Education, Arts & Media | 192 (32.4%) | 400 (67.6%) |
| Legal Services & Support | 161 (45.7%) | 191 (54.3%) |
| Education Instruction & Library | 838 (37.3%) | 1,411 (62.7%) |
| Arts, Media & Entertainment | 242 (39.5%) | 371 (60.5%) |
| Health Diagnosing & Treating | 339 (25.3%) | 1,000 (74.7%) |
| Health Technologists | 175 (19.6%) | 717 (80.4%) |
| Total (Category) | 5,625 (46.3%) | 6,537 (53.7%) |
| Total (Overall) | 12,020 (47.0%) | 13,575 (53.0%) |
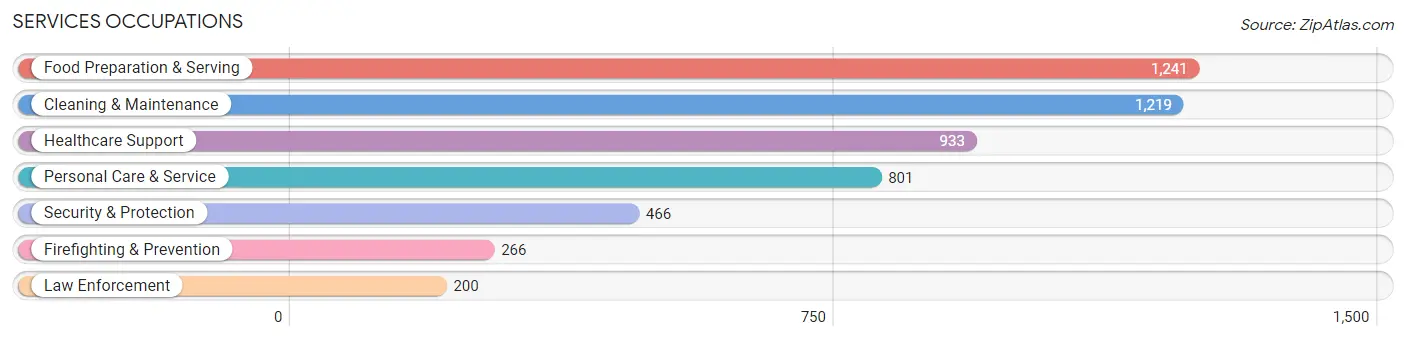
Services Occupations
The most common Services occupations in Salem are Food Preparation & Serving (1,241 | 4.9%), Cleaning & Maintenance (1,219 | 4.8%), Healthcare Support (933 | 3.6%), Personal Care & Service (801 | 3.1%), and Security & Protection (466 | 1.8%).
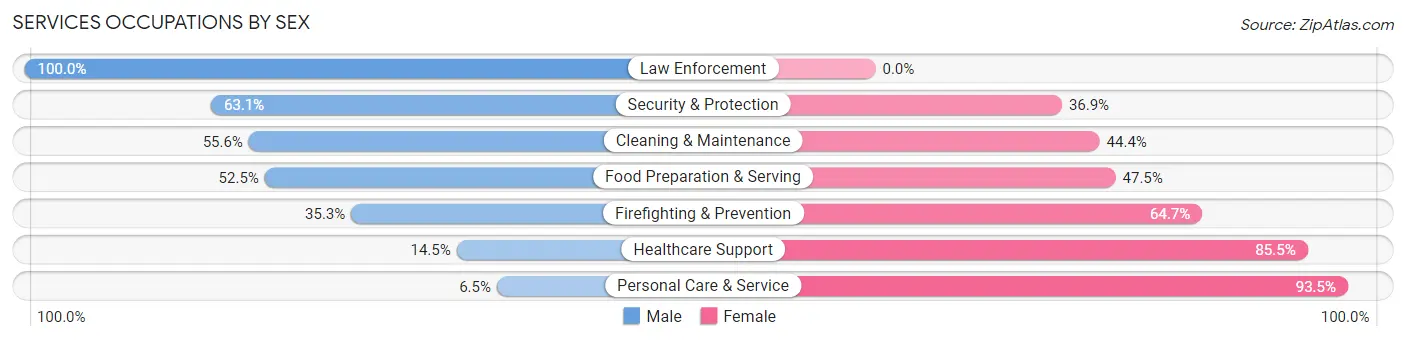
Services Occupations by Sex
Within the Services occupations in Salem, the most male-oriented occupations are Law Enforcement (100.0%), Security & Protection (63.1%), and Cleaning & Maintenance (55.6%), while the most female-oriented occupations are Personal Care & Service (93.5%), Healthcare Support (85.5%), and Firefighting & Prevention (64.7%).
| Occupation | Male | Female |
| Healthcare Support | 135 (14.5%) | 798 (85.5%) |
| Security & Protection | 294 (63.1%) | 172 (36.9%) |
| Firefighting & Prevention | 94 (35.3%) | 172 (64.7%) |
| Law Enforcement | 200 (100.0%) | 0 (0.0%) |
| Food Preparation & Serving | 651 (52.5%) | 590 (47.5%) |
| Cleaning & Maintenance | 678 (55.6%) | 541 (44.4%) |
| Personal Care & Service | 52 (6.5%) | 749 (93.5%) |
| Total (Category) | 1,810 (38.8%) | 2,850 (61.2%) |
| Total (Overall) | 12,020 (47.0%) | 13,575 (53.0%) |
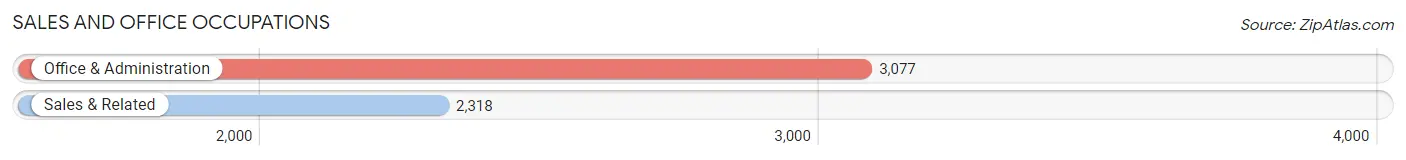
Sales and Office Occupations
The most common Sales and Office occupations in Salem are Office & Administration (3,077 | 12.0%), and Sales & Related (2,318 | 9.1%).
Sales and Office Occupations by Sex
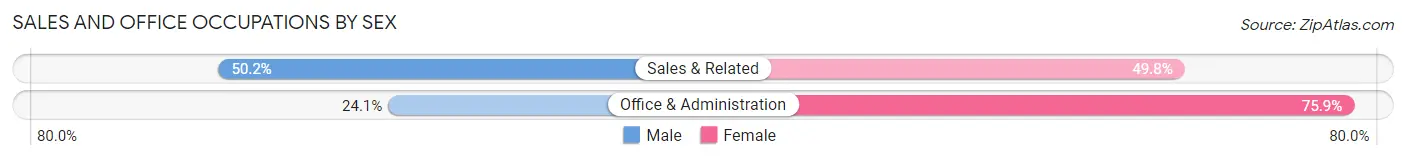
| Occupation | Male | Female |
| Sales & Related | 1,163 (50.2%) | 1,155 (49.8%) |
| Office & Administration | 741 (24.1%) | 2,336 (75.9%) |
| Total (Category) | 1,904 (35.3%) | 3,491 (64.7%) |
| Total (Overall) | 12,020 (47.0%) | 13,575 (53.0%) |
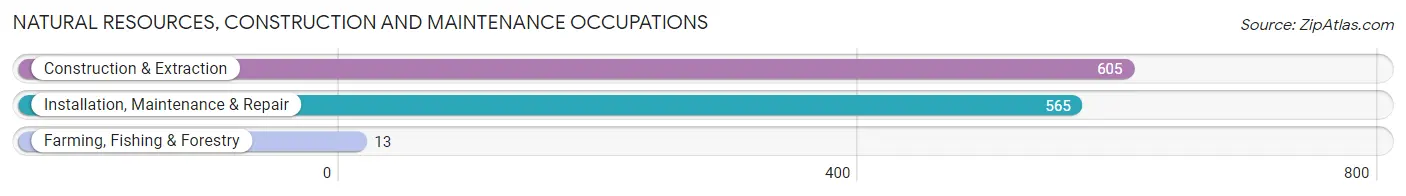
Natural Resources, Construction and Maintenance Occupations
The most common Natural Resources, Construction and Maintenance occupations in Salem are Construction & Extraction (605 | 2.4%), Installation, Maintenance & Repair (565 | 2.2%), and Farming, Fishing & Forestry (13 | 0.1%).
Natural Resources, Construction and Maintenance Occupations by Sex
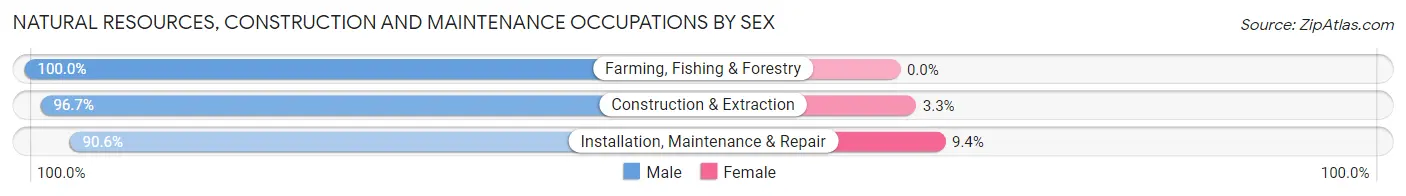
| Occupation | Male | Female |
| Farming, Fishing & Forestry | 13 (100.0%) | 0 (0.0%) |
| Construction & Extraction | 585 (96.7%) | 20 (3.3%) |
| Installation, Maintenance & Repair | 512 (90.6%) | 53 (9.4%) |
| Total (Category) | 1,110 (93.8%) | 73 (6.2%) |
| Total (Overall) | 12,020 (47.0%) | 13,575 (53.0%) |
Production, Transportation and Moving Occupations
The most common Production, Transportation and Moving occupations in Salem are Transportation (811 | 3.2%), Production (791 | 3.1%), and Material Moving (593 | 2.3%).
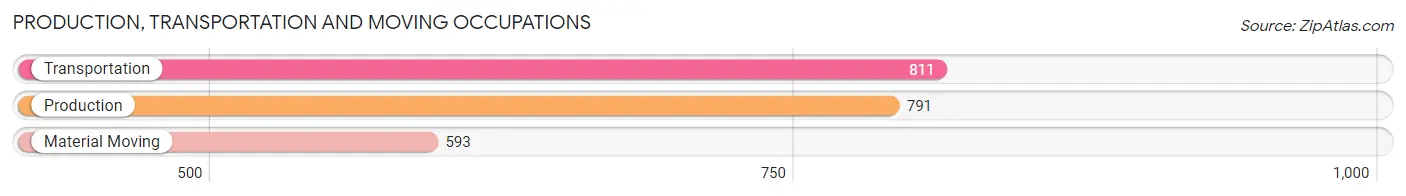
Production, Transportation and Moving Occupations by Sex
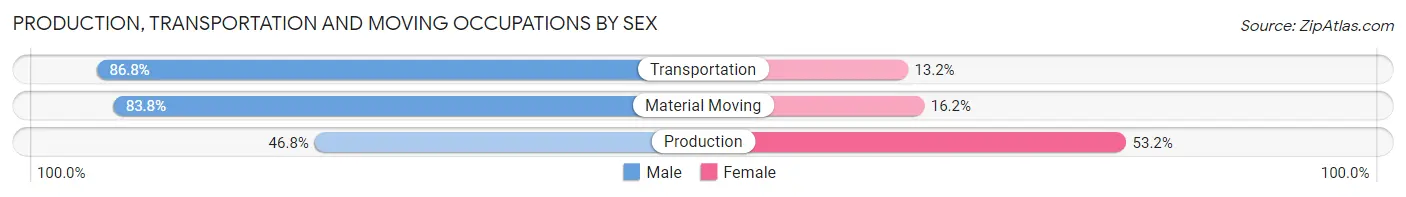
| Occupation | Male | Female |
| Production | 370 (46.8%) | 421 (53.2%) |
| Transportation | 704 (86.8%) | 107 (13.2%) |
| Material Moving | 497 (83.8%) | 96 (16.2%) |
| Total (Category) | 1,571 (71.6%) | 624 (28.4%) |
| Total (Overall) | 12,020 (47.0%) | 13,575 (53.0%) |
Employment Industries by Sex in Salem
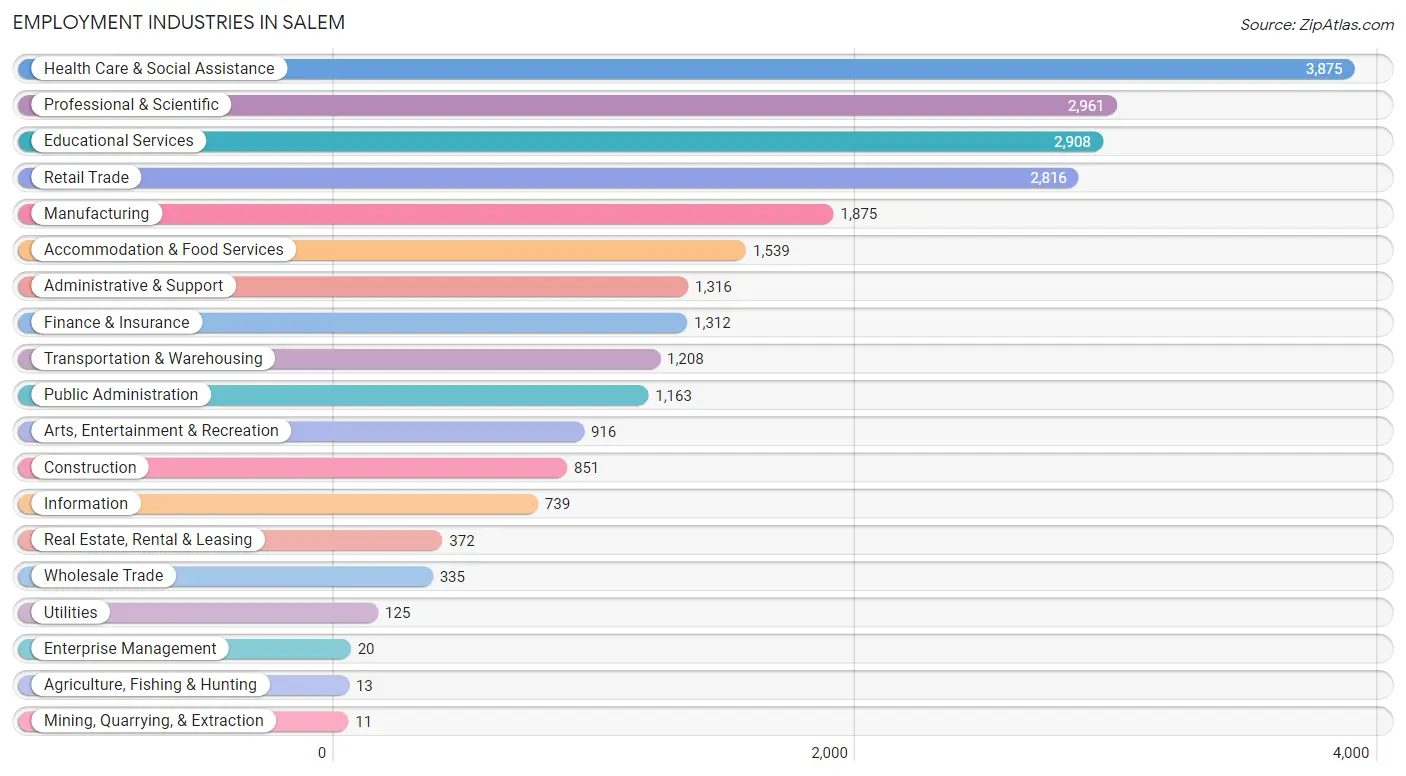
Employment Industries in Salem
The major employment industries in Salem include Health Care & Social Assistance (3,875 | 15.1%), Professional & Scientific (2,961 | 11.6%), Educational Services (2,908 | 11.4%), Retail Trade (2,816 | 11.0%), and Manufacturing (1,875 | 7.3%).
Employment Industries by Sex in Salem
The Salem industries that see more men than women are Agriculture, Fishing & Hunting (100.0%), Mining, Quarrying, & Extraction (100.0%), and Enterprise Management (100.0%), whereas the industries that tend to have a higher number of women are Health Care & Social Assistance (77.2%), Educational Services (64.2%), and Arts, Entertainment & Recreation (59.4%).
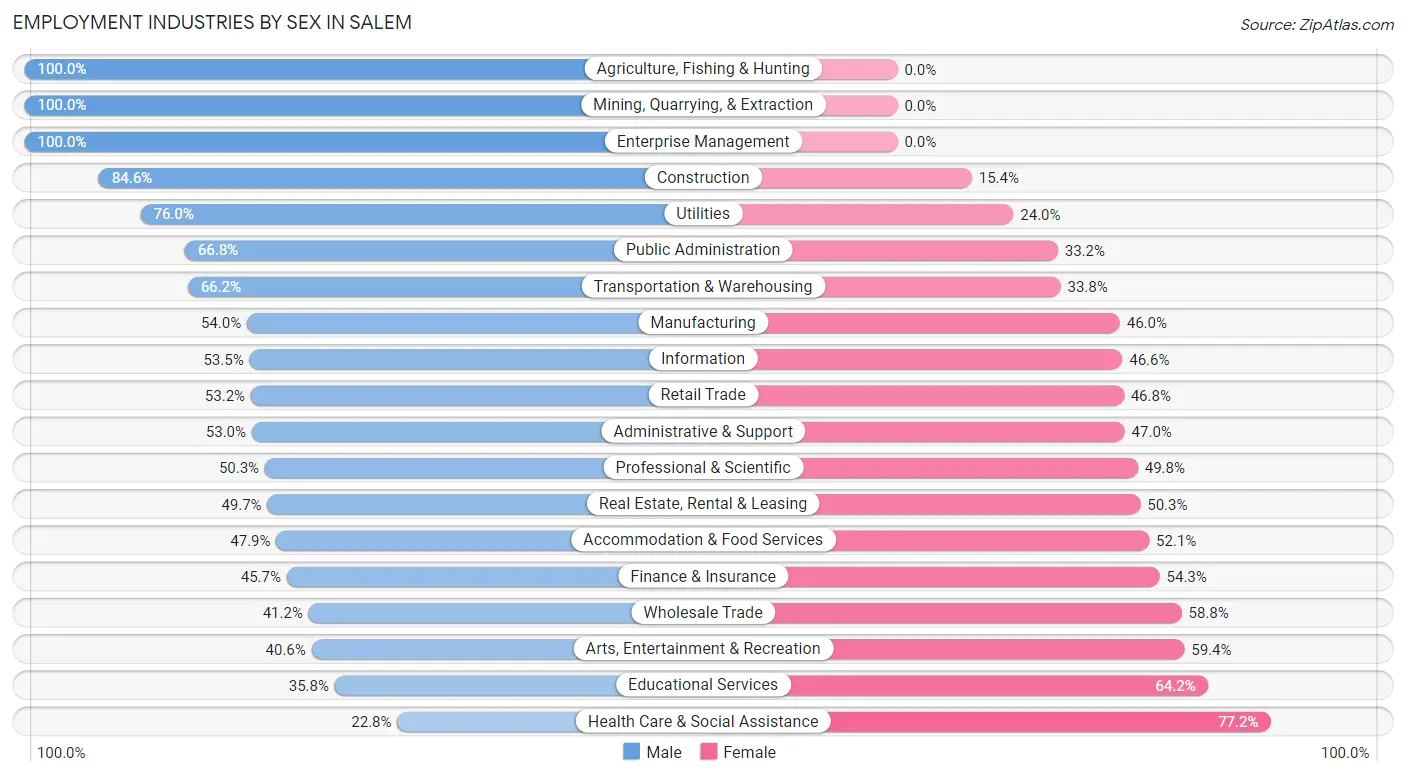
| Industry | Male | Female |
| Agriculture, Fishing & Hunting | 13 (100.0%) | 0 (0.0%) |
| Mining, Quarrying, & Extraction | 11 (100.0%) | 0 (0.0%) |
| Construction | 720 (84.6%) | 131 (15.4%) |
| Manufacturing | 1,012 (54.0%) | 863 (46.0%) |
| Wholesale Trade | 138 (41.2%) | 197 (58.8%) |
| Retail Trade | 1,497 (53.2%) | 1,319 (46.8%) |
| Transportation & Warehousing | 800 (66.2%) | 408 (33.8%) |
| Utilities | 95 (76.0%) | 30 (24.0%) |
| Information | 395 (53.4%) | 344 (46.6%) |
| Finance & Insurance | 600 (45.7%) | 712 (54.3%) |
| Real Estate, Rental & Leasing | 185 (49.7%) | 187 (50.3%) |
| Professional & Scientific | 1,488 (50.2%) | 1,473 (49.7%) |
| Enterprise Management | 20 (100.0%) | 0 (0.0%) |
| Administrative & Support | 697 (53.0%) | 619 (47.0%) |
| Educational Services | 1,041 (35.8%) | 1,867 (64.2%) |
| Health Care & Social Assistance | 885 (22.8%) | 2,990 (77.2%) |
| Arts, Entertainment & Recreation | 372 (40.6%) | 544 (59.4%) |
| Accommodation & Food Services | 737 (47.9%) | 802 (52.1%) |
| Public Administration | 777 (66.8%) | 386 (33.2%) |
| Total | 12,020 (47.0%) | 13,575 (53.0%) |
Education in Salem
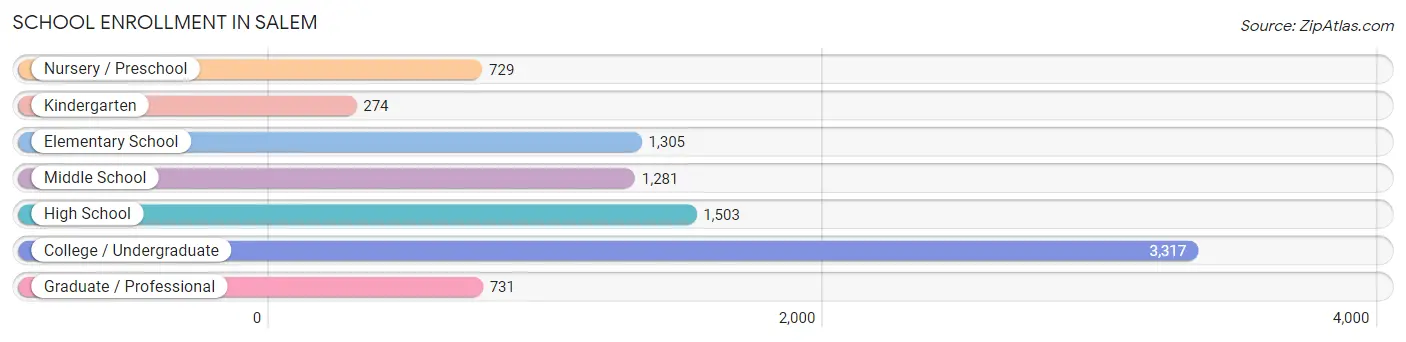
School Enrollment in Salem
The most common levels of schooling among the 9,140 students in Salem are college / undergraduate (3,317 | 36.3%), high school (1,503 | 16.4%), and elementary school (1,305 | 14.3%).
| School Level | # Students | % Students |
| Nursery / Preschool | 729 | 8.0% |
| Kindergarten | 274 | 3.0% |
| Elementary School | 1,305 | 14.3% |
| Middle School | 1,281 | 14.0% |
| High School | 1,503 | 16.4% |
| College / Undergraduate | 3,317 | 36.3% |
| Graduate / Professional | 731 | 8.0% |
| Total | 9,140 | 100.0% |
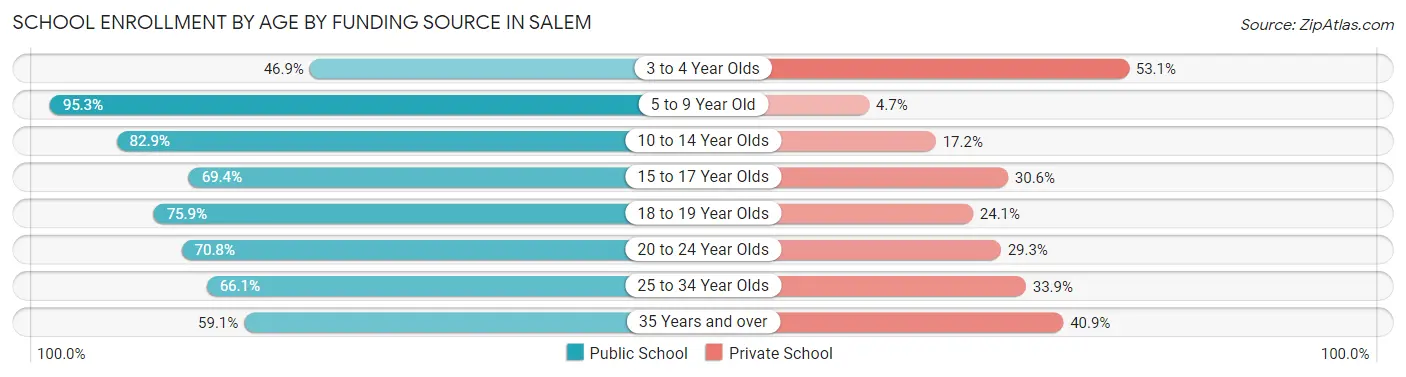
School Enrollment by Age by Funding Source in Salem
Out of a total of 9,140 students who are enrolled in schools in Salem, 2,248 (24.6%) attend a private institution, while the remaining 6,892 (75.4%) are enrolled in public schools. The age group of 3 to 4 year olds has the highest likelihood of being enrolled in private schools, with 317 (53.1% in the age bracket) enrolled. Conversely, the age group of 5 to 9 year old has the lowest likelihood of being enrolled in a private school, with 1,440 (95.3% in the age bracket) attending a public institution.
| Age Bracket | Public School | Private School |
| 3 to 4 Year Olds | 280 (46.9%) | 317 (53.1%) |
| 5 to 9 Year Old | 1,440 (95.3%) | 71 (4.7%) |
| 10 to 14 Year Olds | 1,473 (82.9%) | 305 (17.2%) |
| 15 to 17 Year Olds | 622 (69.4%) | 274 (30.6%) |
| 18 to 19 Year Olds | 1,007 (75.9%) | 319 (24.1%) |
| 20 to 24 Year Olds | 1,345 (70.8%) | 556 (29.2%) |
| 25 to 34 Year Olds | 555 (66.1%) | 285 (33.9%) |
| 35 Years and over | 172 (59.1%) | 119 (40.9%) |
| Total | 6,892 (75.4%) | 2,248 (24.6%) |
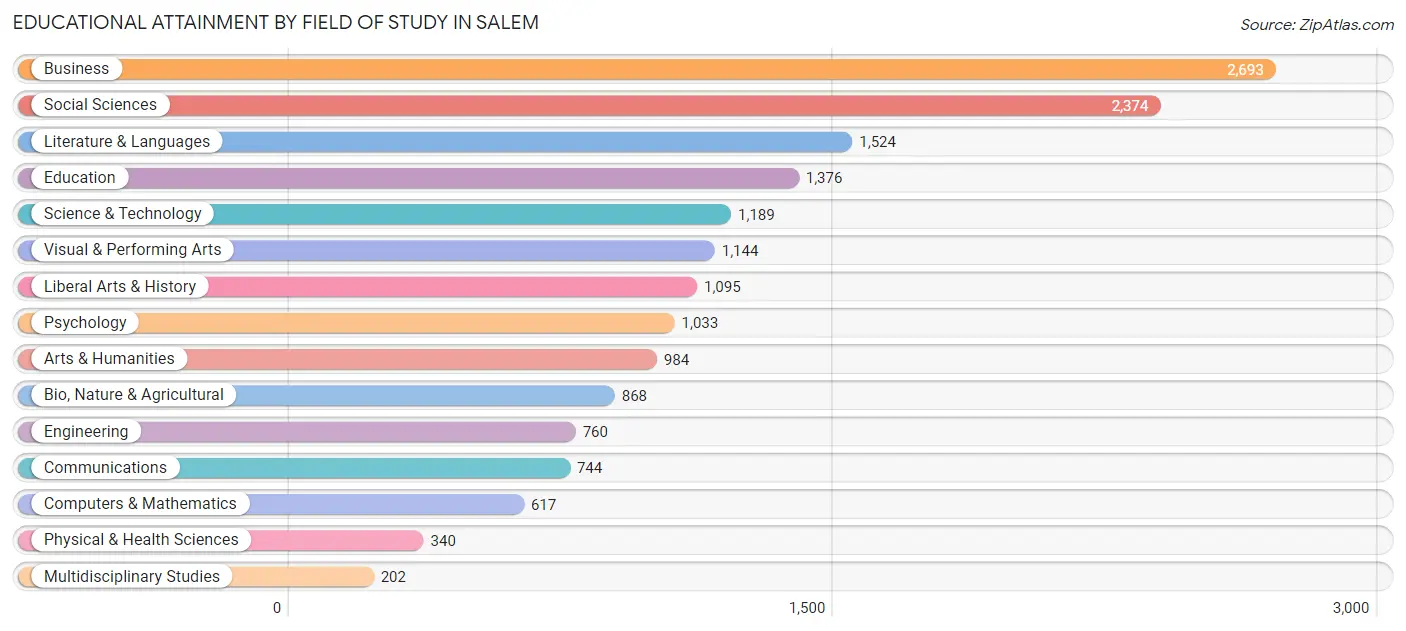
Educational Attainment by Field of Study in Salem
Business (2,693 | 15.9%), social sciences (2,374 | 14.0%), literature & languages (1,524 | 9.0%), education (1,376 | 8.1%), and science & technology (1,189 | 7.0%) are the most common fields of study among 16,943 individuals in Salem who have obtained a bachelor's degree or higher.
| Field of Study | # Graduates | % Graduates |
| Computers & Mathematics | 617 | 3.6% |
| Bio, Nature & Agricultural | 868 | 5.1% |
| Physical & Health Sciences | 340 | 2.0% |
| Psychology | 1,033 | 6.1% |
| Social Sciences | 2,374 | 14.0% |
| Engineering | 760 | 4.5% |
| Multidisciplinary Studies | 202 | 1.2% |
| Science & Technology | 1,189 | 7.0% |
| Business | 2,693 | 15.9% |
| Education | 1,376 | 8.1% |
| Literature & Languages | 1,524 | 9.0% |
| Liberal Arts & History | 1,095 | 6.5% |
| Visual & Performing Arts | 1,144 | 6.8% |
| Communications | 744 | 4.4% |
| Arts & Humanities | 984 | 5.8% |
| Total | 16,943 | 100.0% |
Transportation & Commute in Salem
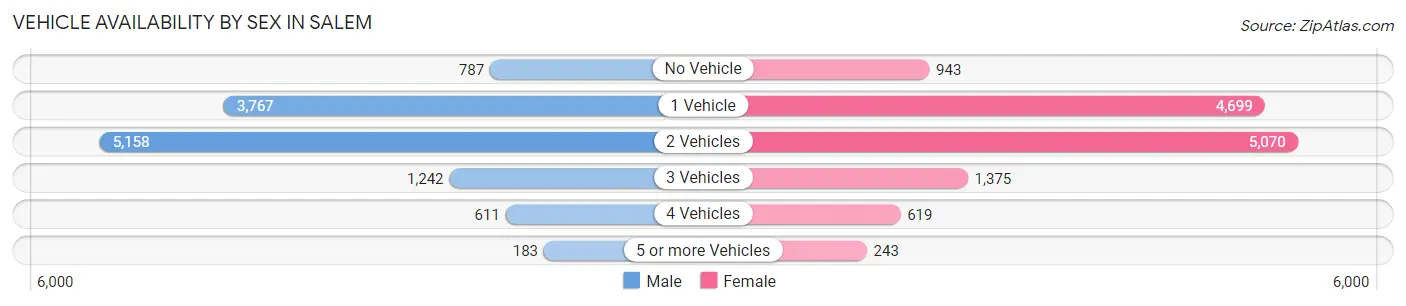
Vehicle Availability by Sex in Salem
The most prevalent vehicle ownership categories in Salem are males with 2 vehicles (5,158, accounting for 43.9%) and females with 2 vehicles (5,070, making up 39.8%).
| Vehicles Available | Male | Female |
| No Vehicle | 787 (6.7%) | 943 (7.3%) |
| 1 Vehicle | 3,767 (32.1%) | 4,699 (36.3%) |
| 2 Vehicles | 5,158 (43.9%) | 5,070 (39.2%) |
| 3 Vehicles | 1,242 (10.6%) | 1,375 (10.6%) |
| 4 Vehicles | 611 (5.2%) | 619 (4.8%) |
| 5 or more Vehicles | 183 (1.6%) | 243 (1.9%) |
| Total | 11,748 (100.0%) | 12,949 (100.0%) |
Commute Time in Salem
The most frequently occuring commute durations in Salem are 15 to 19 minutes (3,512 commuters, 16.6%), 60 to 89 minutes (3,007 commuters, 14.2%), and 10 to 14 minutes (2,842 commuters, 13.4%).
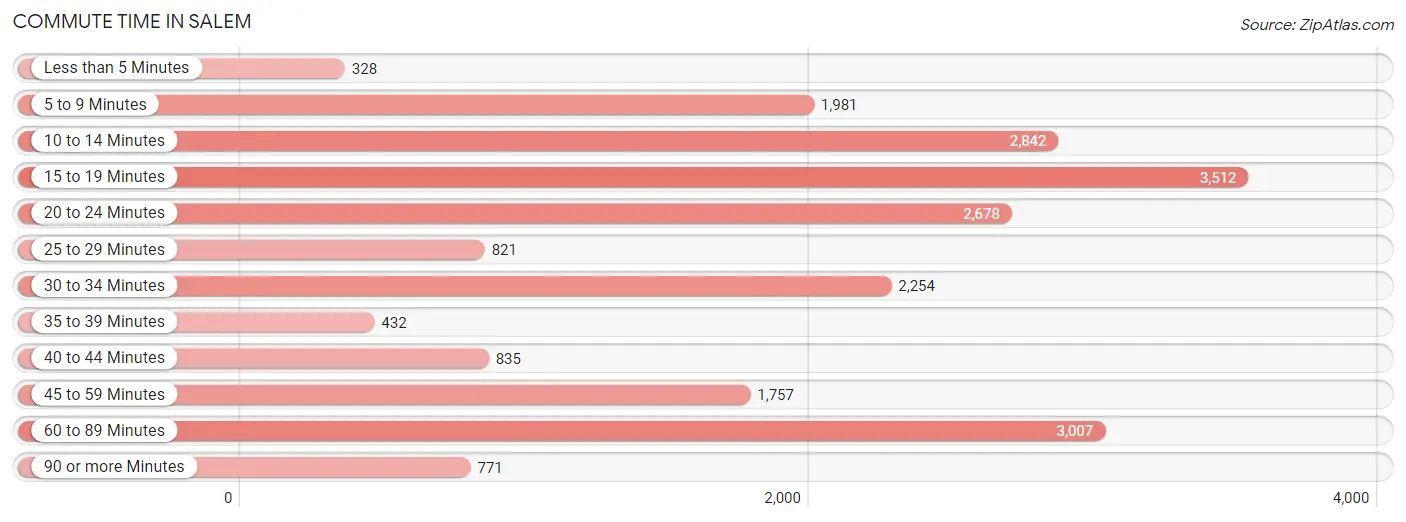
| Commute Time | # Commuters | % Commuters |
| Less than 5 Minutes | 328 | 1.5% |
| 5 to 9 Minutes | 1,981 | 9.3% |
| 10 to 14 Minutes | 2,842 | 13.4% |
| 15 to 19 Minutes | 3,512 | 16.6% |
| 20 to 24 Minutes | 2,678 | 12.6% |
| 25 to 29 Minutes | 821 | 3.9% |
| 30 to 34 Minutes | 2,254 | 10.6% |
| 35 to 39 Minutes | 432 | 2.0% |
| 40 to 44 Minutes | 835 | 3.9% |
| 45 to 59 Minutes | 1,757 | 8.3% |
| 60 to 89 Minutes | 3,007 | 14.2% |
| 90 or more Minutes | 771 | 3.6% |
Commute Time by Sex in Salem
The most common commute times in Salem are 15 to 19 minutes (1,674 commuters, 16.6%) for males and 20 to 24 minutes (1,892 commuters, 17.0%) for females.
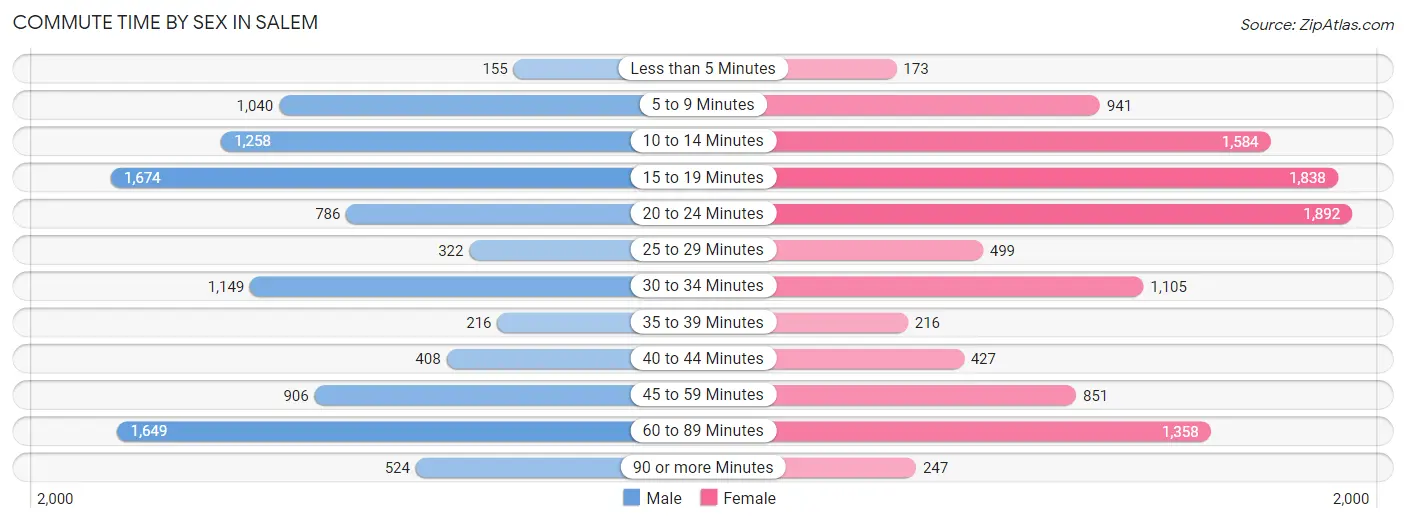
| Commute Time | Male | Female |
| Less than 5 Minutes | 155 (1.5%) | 173 (1.5%) |
| 5 to 9 Minutes | 1,040 (10.3%) | 941 (8.5%) |
| 10 to 14 Minutes | 1,258 (12.5%) | 1,584 (14.2%) |
| 15 to 19 Minutes | 1,674 (16.6%) | 1,838 (16.5%) |
| 20 to 24 Minutes | 786 (7.8%) | 1,892 (17.0%) |
| 25 to 29 Minutes | 322 (3.2%) | 499 (4.5%) |
| 30 to 34 Minutes | 1,149 (11.4%) | 1,105 (9.9%) |
| 35 to 39 Minutes | 216 (2.1%) | 216 (1.9%) |
| 40 to 44 Minutes | 408 (4.0%) | 427 (3.8%) |
| 45 to 59 Minutes | 906 (9.0%) | 851 (7.6%) |
| 60 to 89 Minutes | 1,649 (16.4%) | 1,358 (12.2%) |
| 90 or more Minutes | 524 (5.2%) | 247 (2.2%) |
Time of Departure to Work by Sex in Salem
The most frequent times of departure to work in Salem are 7:00 AM to 7:29 AM (1,425, 14.1%) for males and 7:00 AM to 7:29 AM (2,054, 18.4%) for females.
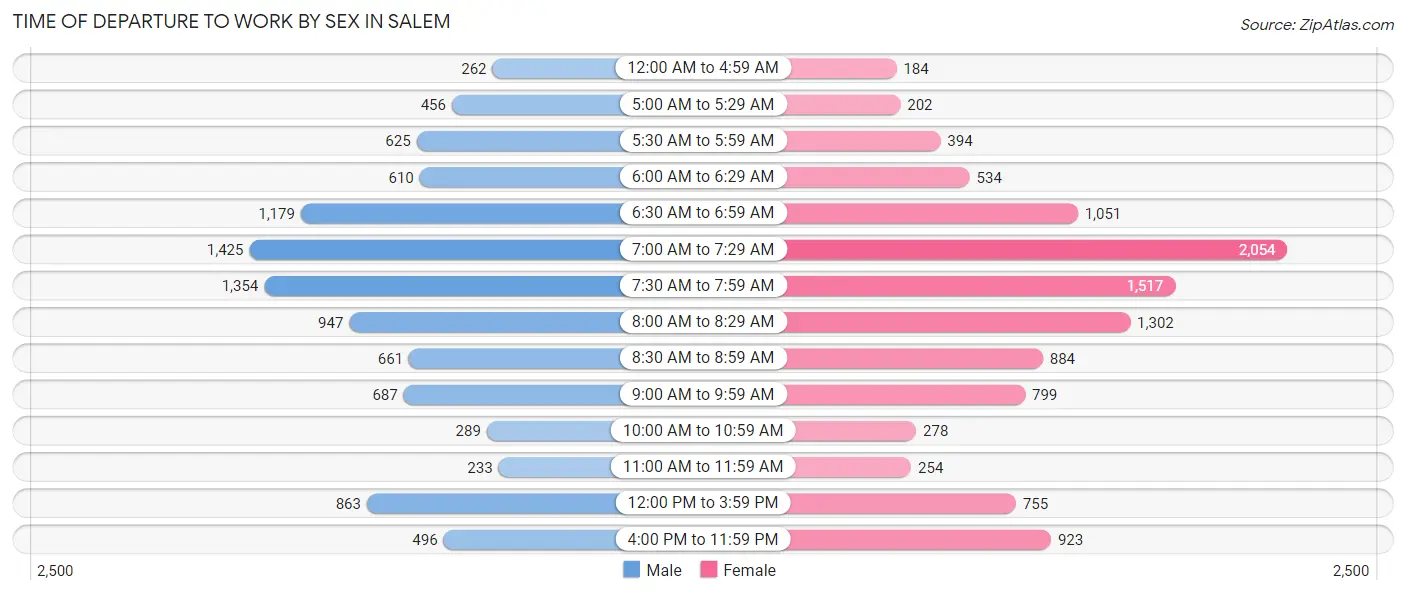
| Time of Departure | Male | Female |
| 12:00 AM to 4:59 AM | 262 (2.6%) | 184 (1.7%) |
| 5:00 AM to 5:29 AM | 456 (4.5%) | 202 (1.8%) |
| 5:30 AM to 5:59 AM | 625 (6.2%) | 394 (3.5%) |
| 6:00 AM to 6:29 AM | 610 (6.0%) | 534 (4.8%) |
| 6:30 AM to 6:59 AM | 1,179 (11.7%) | 1,051 (9.4%) |
| 7:00 AM to 7:29 AM | 1,425 (14.1%) | 2,054 (18.4%) |
| 7:30 AM to 7:59 AM | 1,354 (13.4%) | 1,517 (13.6%) |
| 8:00 AM to 8:29 AM | 947 (9.4%) | 1,302 (11.7%) |
| 8:30 AM to 8:59 AM | 661 (6.6%) | 884 (7.9%) |
| 9:00 AM to 9:59 AM | 687 (6.8%) | 799 (7.2%) |
| 10:00 AM to 10:59 AM | 289 (2.9%) | 278 (2.5%) |
| 11:00 AM to 11:59 AM | 233 (2.3%) | 254 (2.3%) |
| 12:00 PM to 3:59 PM | 863 (8.6%) | 755 (6.8%) |
| 4:00 PM to 11:59 PM | 496 (4.9%) | 923 (8.3%) |
| Total | 10,087 (100.0%) | 11,131 (100.0%) |
Housing Occupancy in Salem
Occupancy by Ownership in Salem
Of the total 19,887 dwellings in Salem, owner-occupied units account for 10,077 (50.7%), while renter-occupied units make up 9,810 (49.3%).
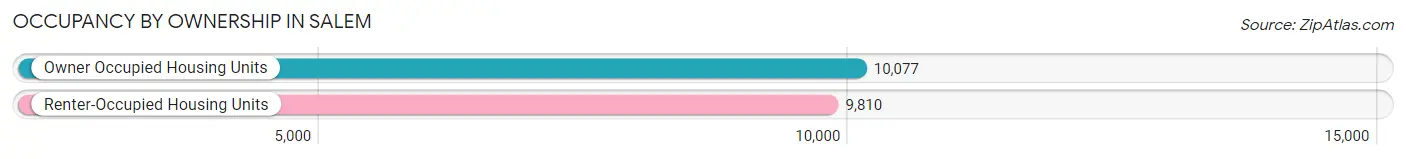
| Occupancy | # Housing Units | % Housing Units |
| Owner Occupied Housing Units | 10,077 | 50.7% |
| Renter-Occupied Housing Units | 9,810 | 49.3% |
| Total Occupied Housing Units | 19,887 | 100.0% |
Occupancy by Household Size in Salem
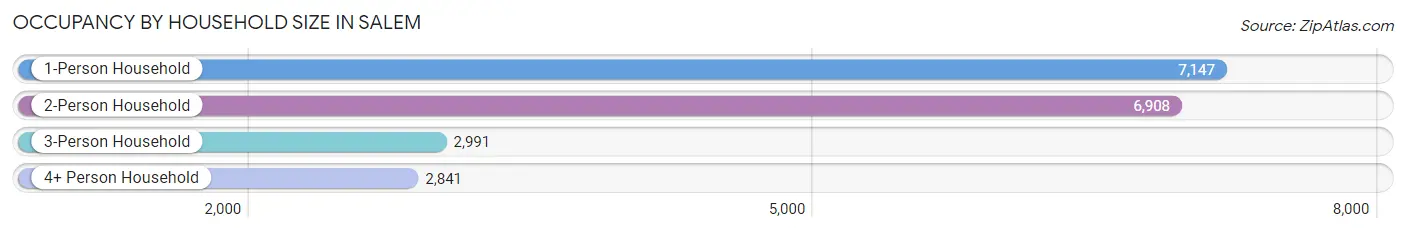
| Household Size | # Housing Units | % Housing Units |
| 1-Person Household | 7,147 | 35.9% |
| 2-Person Household | 6,908 | 34.7% |
| 3-Person Household | 2,991 | 15.0% |
| 4+ Person Household | 2,841 | 14.3% |
| Total Housing Units | 19,887 | 100.0% |
Occupancy by Ownership by Household Size in Salem
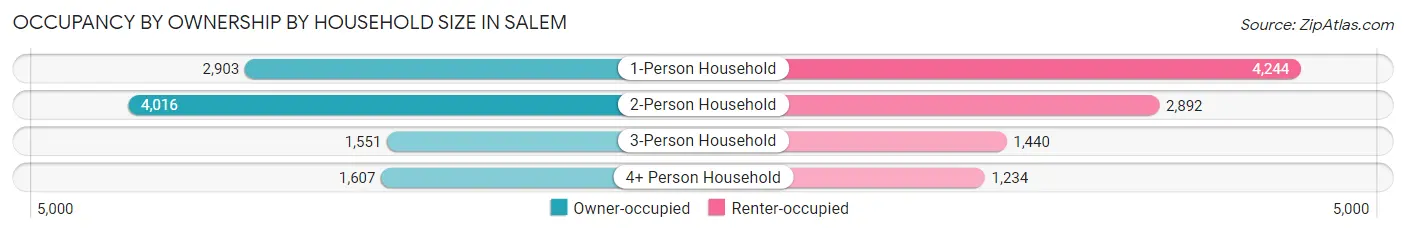
| Household Size | Owner-occupied | Renter-occupied |
| 1-Person Household | 2,903 (40.6%) | 4,244 (59.4%) |
| 2-Person Household | 4,016 (58.1%) | 2,892 (41.9%) |
| 3-Person Household | 1,551 (51.9%) | 1,440 (48.1%) |
| 4+ Person Household | 1,607 (56.6%) | 1,234 (43.4%) |
| Total Housing Units | 10,077 (50.7%) | 9,810 (49.3%) |
Occupancy by Educational Attainment in Salem
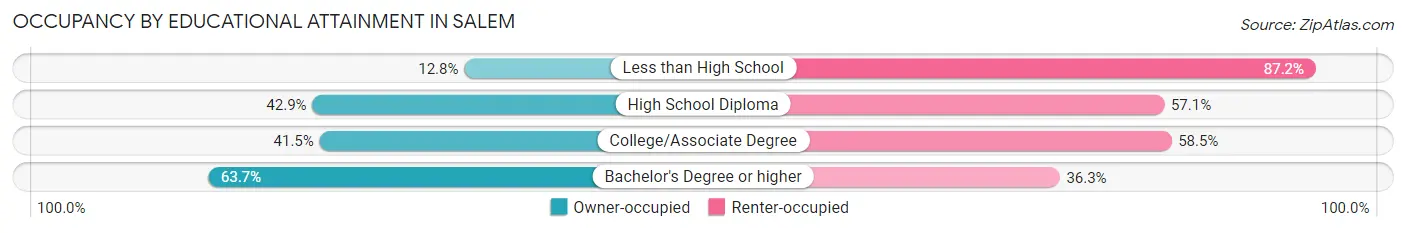
| Household Size | Owner-occupied | Renter-occupied |
| Less than High School | 210 (12.8%) | 1,427 (87.2%) |
| High School Diploma | 1,599 (42.9%) | 2,125 (57.1%) |
| College/Associate Degree | 1,835 (41.5%) | 2,586 (58.5%) |
| Bachelor's Degree or higher | 6,433 (63.7%) | 3,672 (36.3%) |
Occupancy by Age of Householder in Salem
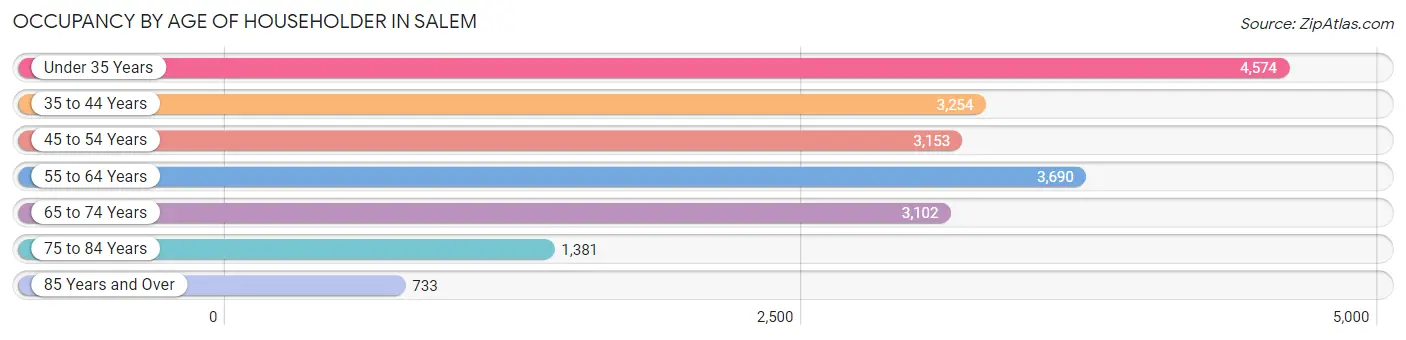
| Age Bracket | # Households | % Households |
| Under 35 Years | 4,574 | 23.0% |
| 35 to 44 Years | 3,254 | 16.4% |
| 45 to 54 Years | 3,153 | 15.9% |
| 55 to 64 Years | 3,690 | 18.5% |
| 65 to 74 Years | 3,102 | 15.6% |
| 75 to 84 Years | 1,381 | 6.9% |
| 85 Years and Over | 733 | 3.7% |
| Total | 19,887 | 100.0% |
Housing Finances in Salem
Median Income by Occupancy in Salem
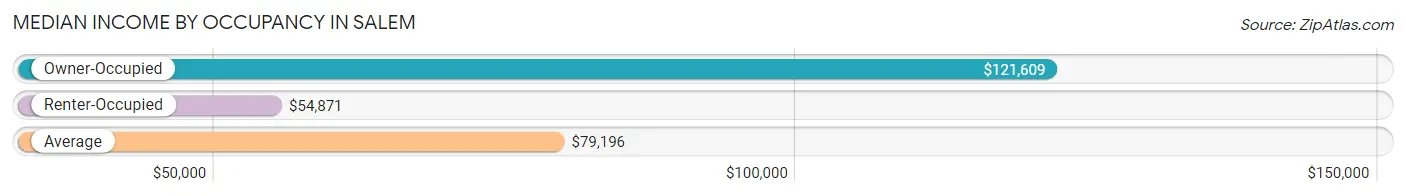
| Occupancy Type | # Households | Median Income |
| Owner-Occupied | 10,077 (50.7%) | $121,609 |
| Renter-Occupied | 9,810 (49.3%) | $54,871 |
| Average | 19,887 (100.0%) | $79,196 |
Occupancy by Householder Income Bracket in Salem
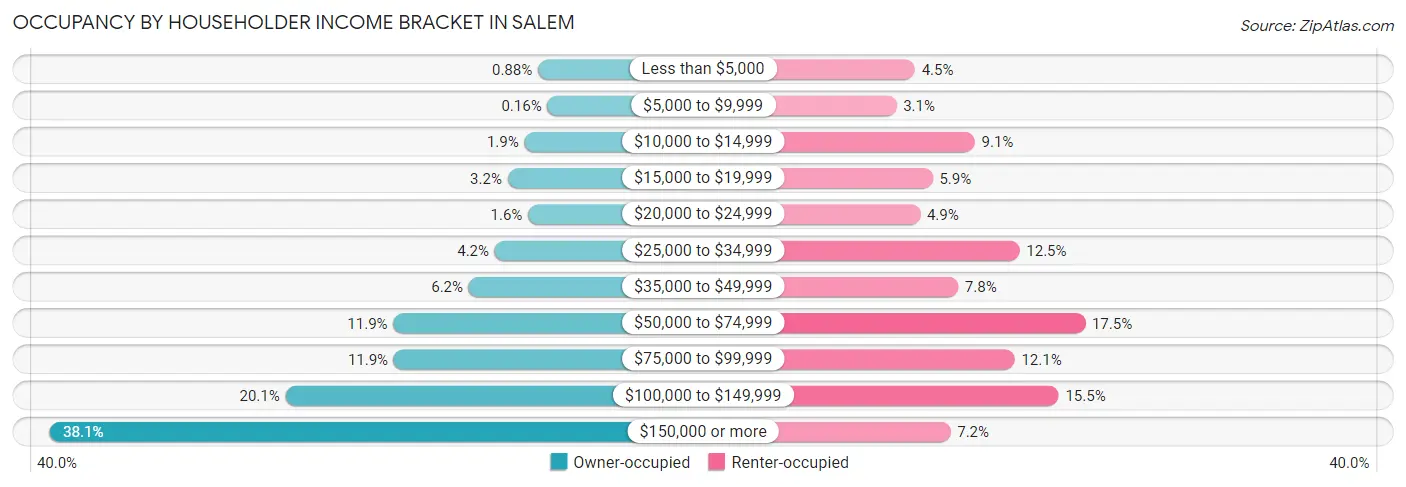
| Income Bracket | Owner-occupied | Renter-occupied |
| Less than $5,000 | 89 (0.9%) | 442 (4.5%) |
| $5,000 to $9,999 | 16 (0.2%) | 304 (3.1%) |
| $10,000 to $14,999 | 192 (1.9%) | 890 (9.1%) |
| $15,000 to $19,999 | 321 (3.2%) | 575 (5.9%) |
| $20,000 to $24,999 | 164 (1.6%) | 482 (4.9%) |
| $25,000 to $34,999 | 420 (4.2%) | 1,224 (12.5%) |
| $35,000 to $49,999 | 620 (6.1%) | 765 (7.8%) |
| $50,000 to $74,999 | 1,199 (11.9%) | 1,715 (17.5%) |
| $75,000 to $99,999 | 1,195 (11.9%) | 1,188 (12.1%) |
| $100,000 to $149,999 | 2,027 (20.1%) | 1,517 (15.5%) |
| $150,000 or more | 3,834 (38.1%) | 708 (7.2%) |
| Total | 10,077 (100.0%) | 9,810 (100.0%) |
Monthly Housing Cost Tiers in Salem
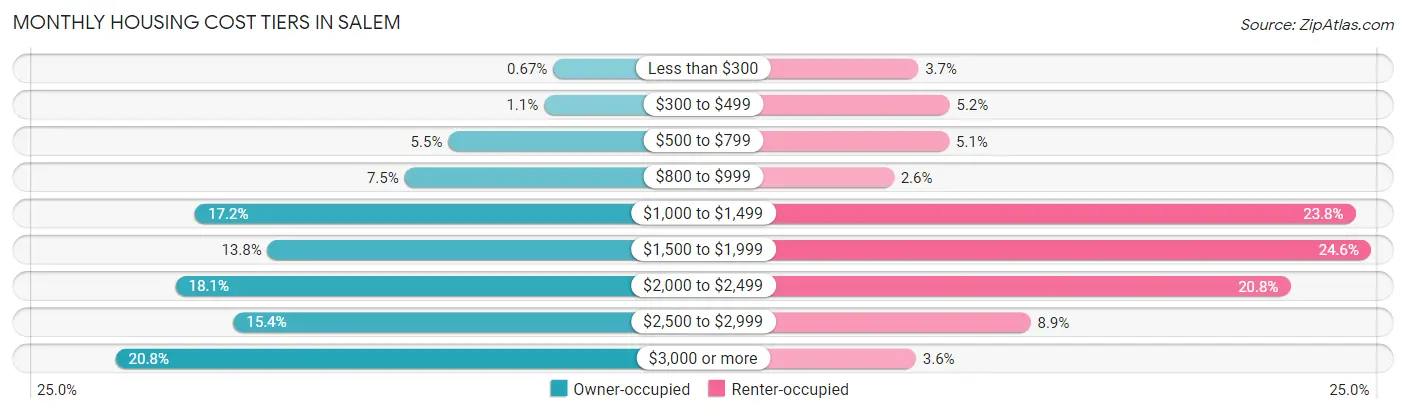
| Monthly Cost | Owner-occupied | Renter-occupied |
| Less than $300 | 68 (0.7%) | 365 (3.7%) |
| $300 to $499 | 110 (1.1%) | 506 (5.2%) |
| $500 to $799 | 554 (5.5%) | 504 (5.1%) |
| $800 to $999 | 757 (7.5%) | 254 (2.6%) |
| $1,000 to $1,499 | 1,728 (17.2%) | 2,339 (23.8%) |
| $1,500 to $1,999 | 1,393 (13.8%) | 2,408 (24.5%) |
| $2,000 to $2,499 | 1,819 (18.0%) | 2,044 (20.8%) |
| $2,500 to $2,999 | 1,551 (15.4%) | 872 (8.9%) |
| $3,000 or more | 2,097 (20.8%) | 354 (3.6%) |
| Total | 10,077 (100.0%) | 9,810 (100.0%) |
Physical Housing Characteristics in Salem
Housing Structures in Salem
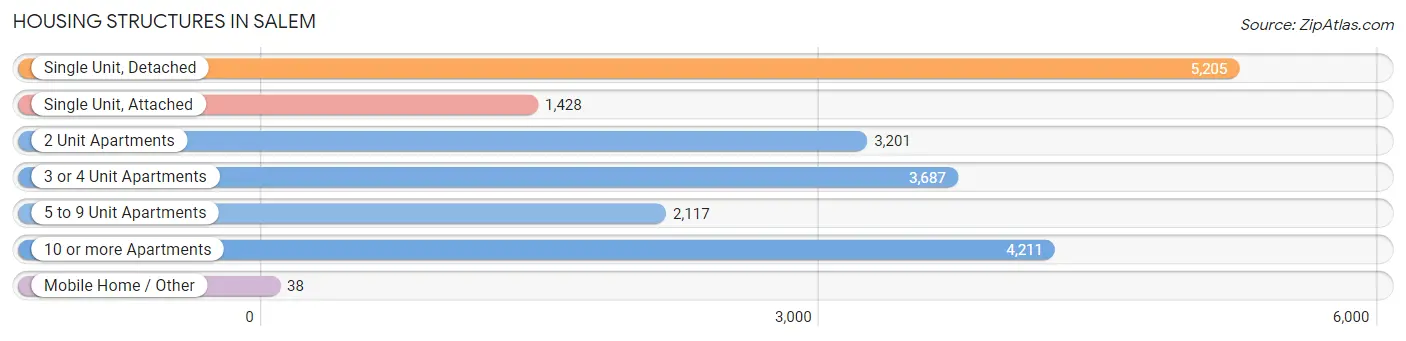
| Structure Type | # Housing Units | % Housing Units |
| Single Unit, Detached | 5,205 | 26.2% |
| Single Unit, Attached | 1,428 | 7.2% |
| 2 Unit Apartments | 3,201 | 16.1% |
| 3 or 4 Unit Apartments | 3,687 | 18.5% |
| 5 to 9 Unit Apartments | 2,117 | 10.6% |
| 10 or more Apartments | 4,211 | 21.2% |
| Mobile Home / Other | 38 | 0.2% |
| Total | 19,887 | 100.0% |
Housing Structures by Occupancy in Salem
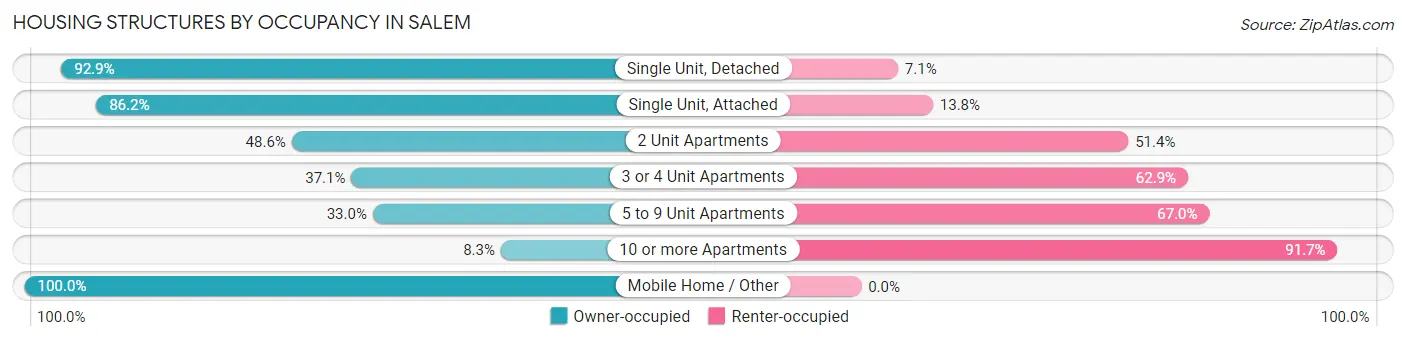
| Structure Type | Owner-occupied | Renter-occupied |
| Single Unit, Detached | 4,837 (92.9%) | 368 (7.1%) |
| Single Unit, Attached | 1,231 (86.2%) | 197 (13.8%) |
| 2 Unit Apartments | 1,555 (48.6%) | 1,646 (51.4%) |
| 3 or 4 Unit Apartments | 1,368 (37.1%) | 2,319 (62.9%) |
| 5 to 9 Unit Apartments | 698 (33.0%) | 1,419 (67.0%) |
| 10 or more Apartments | 350 (8.3%) | 3,861 (91.7%) |
| Mobile Home / Other | 38 (100.0%) | 0 (0.0%) |
| Total | 10,077 (50.7%) | 9,810 (49.3%) |
Housing Structures by Number of Rooms in Salem
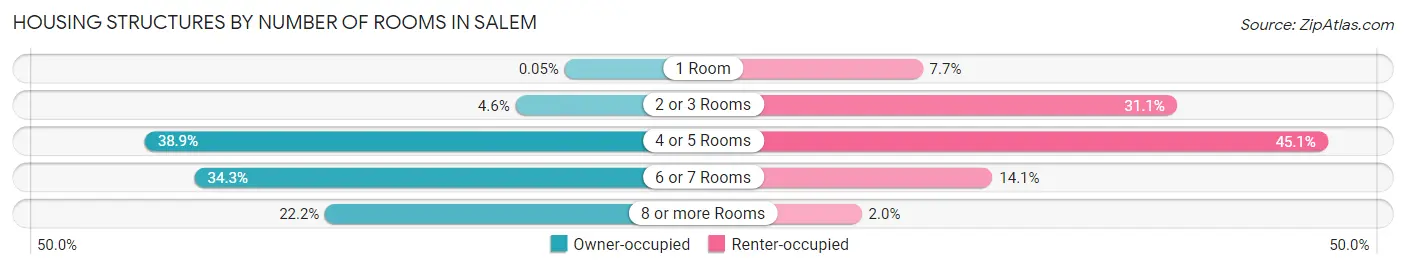
| Number of Rooms | Owner-occupied | Renter-occupied |
| 1 Room | 5 (0.1%) | 750 (7.6%) |
| 2 or 3 Rooms | 464 (4.6%) | 3,055 (31.1%) |
| 4 or 5 Rooms | 3,918 (38.9%) | 4,425 (45.1%) |
| 6 or 7 Rooms | 3,453 (34.3%) | 1,383 (14.1%) |
| 8 or more Rooms | 2,237 (22.2%) | 197 (2.0%) |
| Total | 10,077 (100.0%) | 9,810 (100.0%) |
Housing Structure by Heating Type in Salem
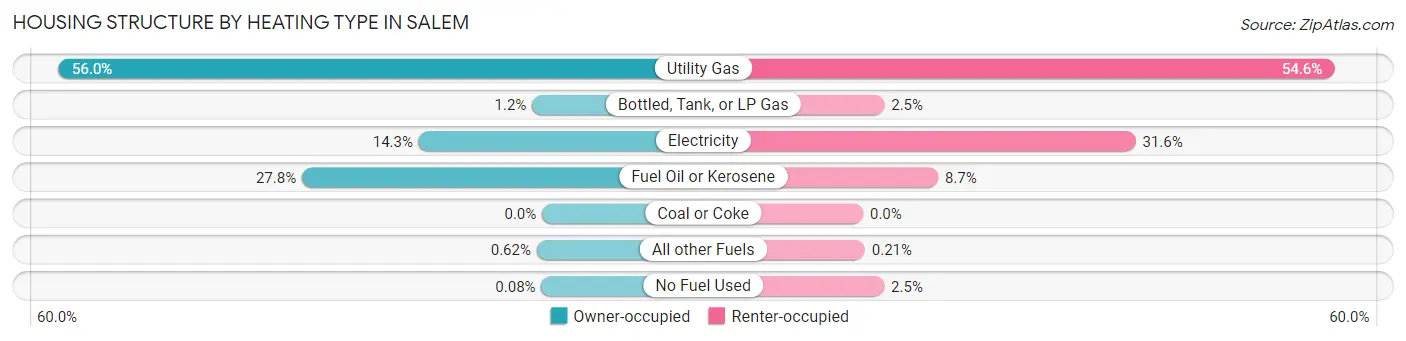
| Heating Type | Owner-occupied | Renter-occupied |
| Utility Gas | 5,645 (56.0%) | 5,357 (54.6%) |
| Bottled, Tank, or LP Gas | 116 (1.1%) | 241 (2.5%) |
| Electricity | 1,441 (14.3%) | 3,099 (31.6%) |
| Fuel Oil or Kerosene | 2,805 (27.8%) | 852 (8.7%) |
| Coal or Coke | 0 (0.0%) | 0 (0.0%) |
| All other Fuels | 62 (0.6%) | 21 (0.2%) |
| No Fuel Used | 8 (0.1%) | 240 (2.5%) |
| Total | 10,077 (100.0%) | 9,810 (100.0%) |
Household Vehicle Usage in Salem
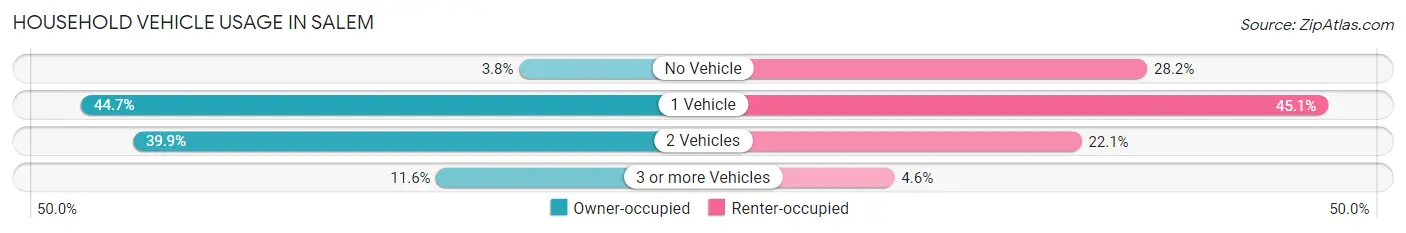
| Vehicles per Household | Owner-occupied | Renter-occupied |
| No Vehicle | 385 (3.8%) | 2,767 (28.2%) |
| 1 Vehicle | 4,507 (44.7%) | 4,424 (45.1%) |
| 2 Vehicles | 4,020 (39.9%) | 2,166 (22.1%) |
| 3 or more Vehicles | 1,165 (11.6%) | 453 (4.6%) |
| Total | 10,077 (100.0%) | 9,810 (100.0%) |
Real Estate & Mortgages in Salem
Real Estate and Mortgage Overview in Salem
| Characteristic | Without Mortgage | With Mortgage |
| Housing Units | 2,659 | 7,418 |
| Median Property Value | $457,700 | $465,500 |
| Median Household Income | $76,319 | $3,219 |
| Monthly Housing Costs | $1,017 | $2,097 |
| Real Estate Taxes | $5,873 | $117 |
Property Value by Mortgage Status in Salem
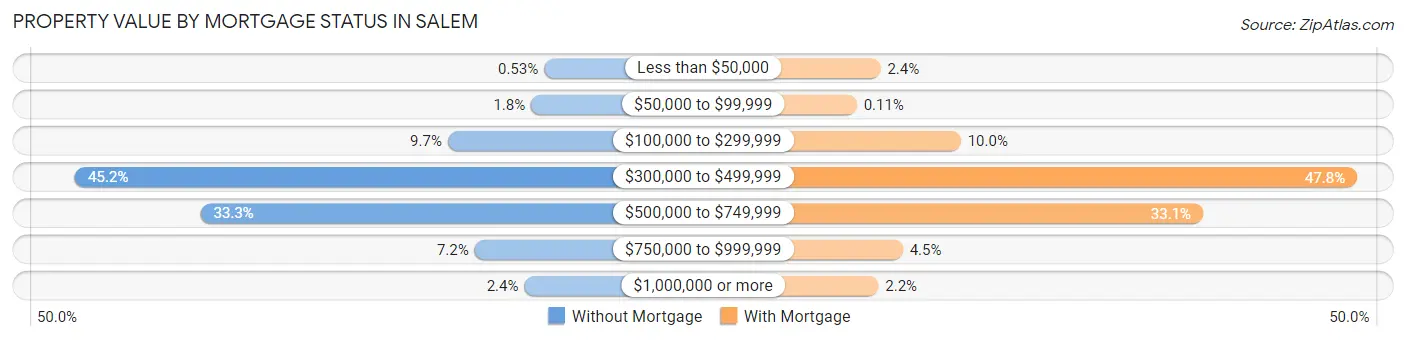
| Property Value | Without Mortgage | With Mortgage |
| Less than $50,000 | 14 (0.5%) | 176 (2.4%) |
| $50,000 to $99,999 | 47 (1.8%) | 8 (0.1%) |
| $100,000 to $299,999 | 258 (9.7%) | 743 (10.0%) |
| $300,000 to $499,999 | 1,202 (45.2%) | 3,543 (47.8%) |
| $500,000 to $749,999 | 884 (33.3%) | 2,454 (33.1%) |
| $750,000 to $999,999 | 190 (7.1%) | 333 (4.5%) |
| $1,000,000 or more | 64 (2.4%) | 161 (2.2%) |
| Total | 2,659 (100.0%) | 7,418 (100.0%) |
Household Income by Mortgage Status in Salem
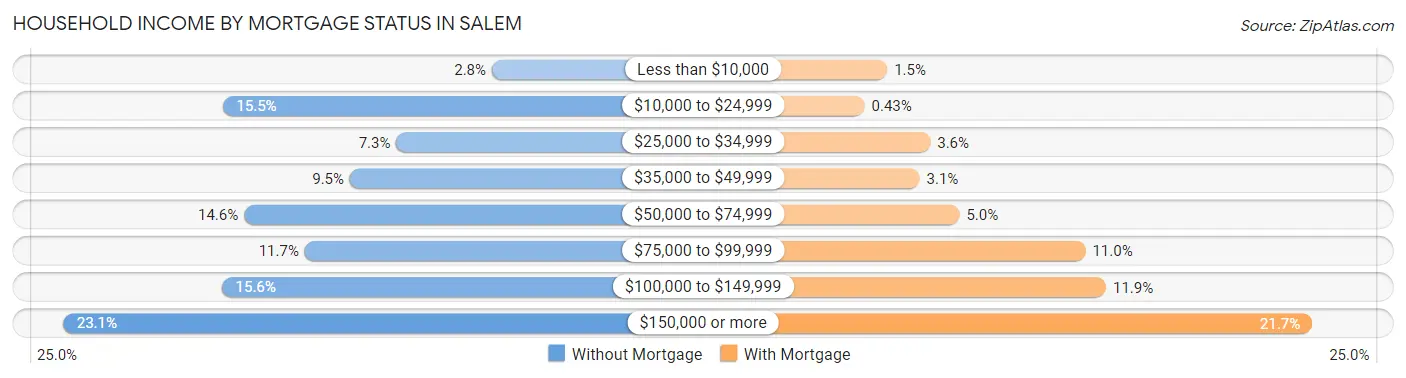
| Household Income | Without Mortgage | With Mortgage |
| Less than $10,000 | 73 (2.8%) | 112 (1.5%) |
| $10,000 to $24,999 | 413 (15.5%) | 32 (0.4%) |
| $25,000 to $34,999 | 194 (7.3%) | 264 (3.6%) |
| $35,000 to $49,999 | 253 (9.5%) | 226 (3.0%) |
| $50,000 to $74,999 | 387 (14.5%) | 367 (5.0%) |
| $75,000 to $99,999 | 310 (11.7%) | 812 (11.0%) |
| $100,000 to $149,999 | 414 (15.6%) | 885 (11.9%) |
| $150,000 or more | 615 (23.1%) | 1,613 (21.7%) |
| Total | 2,659 (100.0%) | 7,418 (100.0%) |
Property Value to Household Income Ratio in Salem
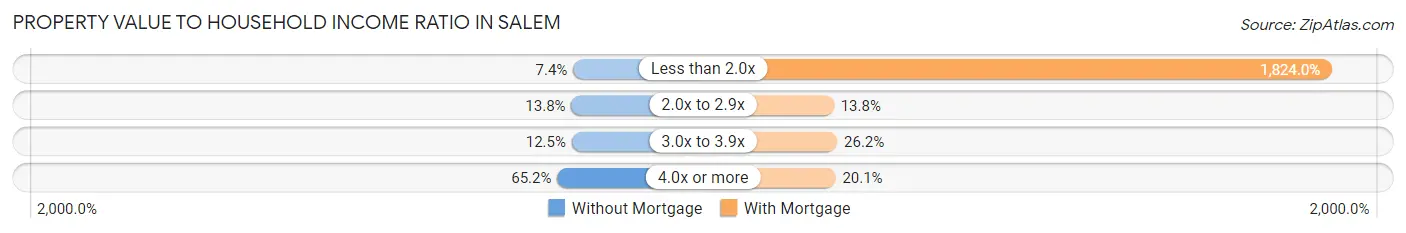
| Value-to-Income Ratio | Without Mortgage | With Mortgage |
| Less than 2.0x | 196 (7.4%) | 135,305 (1,824.0%) |
| 2.0x to 2.9x | 367 (13.8%) | 1,026 (13.8%) |
| 3.0x to 3.9x | 331 (12.4%) | 1,940 (26.2%) |
| 4.0x or more | 1,734 (65.2%) | 1,494 (20.1%) |
| Total | 2,659 (100.0%) | 7,418 (100.0%) |
Real Estate Taxes by Mortgage Status in Salem
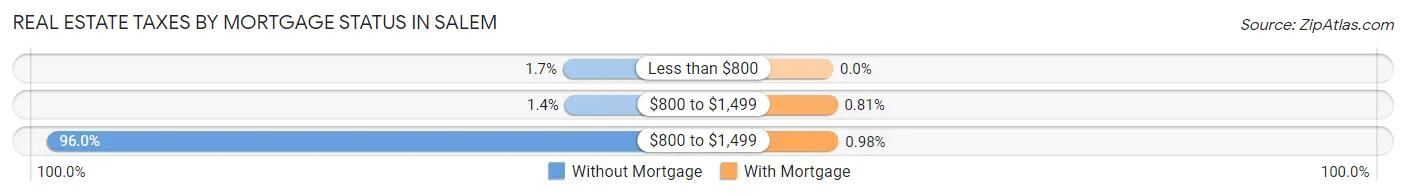
| Property Taxes | Without Mortgage | With Mortgage |
| Less than $800 | 45 (1.7%) | 0 (0.0%) |
| $800 to $1,499 | 36 (1.3%) | 60 (0.8%) |
| $800 to $1,499 | 2,552 (96.0%) | 73 (1.0%) |
| Total | 2,659 (100.0%) | 7,418 (100.0%) |
Health & Disability in Salem
Health Insurance Coverage by Age in Salem
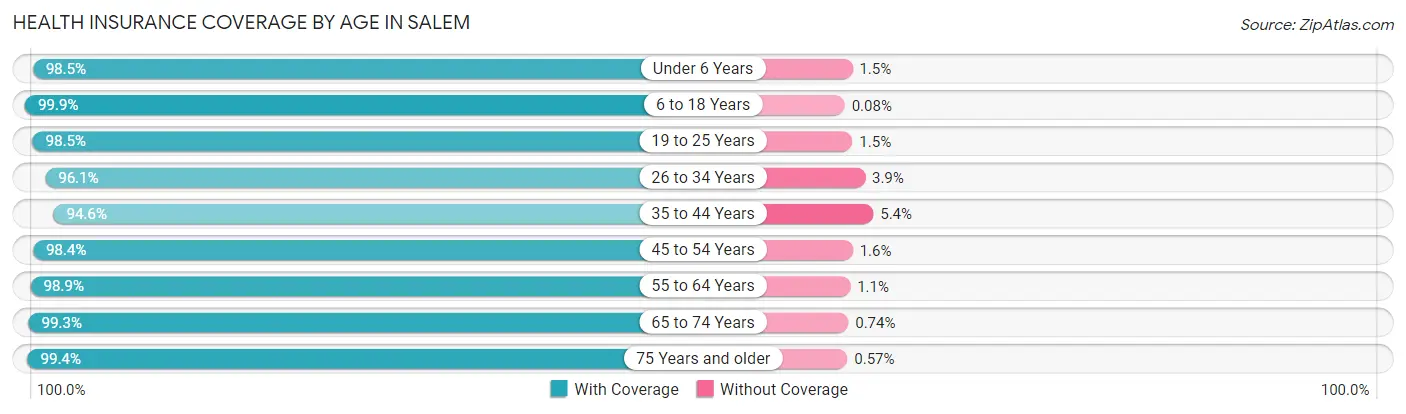
| Age Bracket | With Coverage | Without Coverage |
| Under 6 Years | 2,592 (98.5%) | 40 (1.5%) |
| 6 to 18 Years | 5,259 (99.9%) | 4 (0.1%) |
| 19 to 25 Years | 5,169 (98.5%) | 79 (1.5%) |
| 26 to 34 Years | 6,833 (96.1%) | 275 (3.9%) |
| 35 to 44 Years | 5,561 (94.6%) | 318 (5.4%) |
| 45 to 54 Years | 5,070 (98.4%) | 81 (1.6%) |
| 55 to 64 Years | 5,752 (98.9%) | 64 (1.1%) |
| 65 to 74 Years | 4,453 (99.3%) | 33 (0.7%) |
| 75 Years and older | 2,787 (99.4%) | 16 (0.6%) |
| Total | 43,476 (98.0%) | 910 (2.1%) |
Health Insurance Coverage by Citizenship Status in Salem
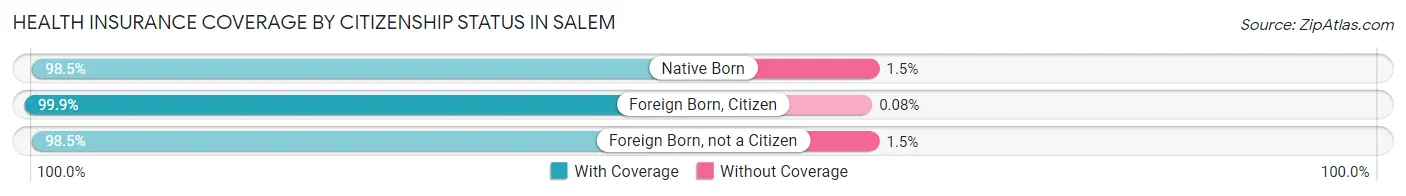
| Citizenship Status | With Coverage | Without Coverage |
| Native Born | 2,592 (98.5%) | 40 (1.5%) |
| Foreign Born, Citizen | 5,259 (99.9%) | 4 (0.1%) |
| Foreign Born, not a Citizen | 5,169 (98.5%) | 79 (1.5%) |
Health Insurance Coverage by Household Income in Salem
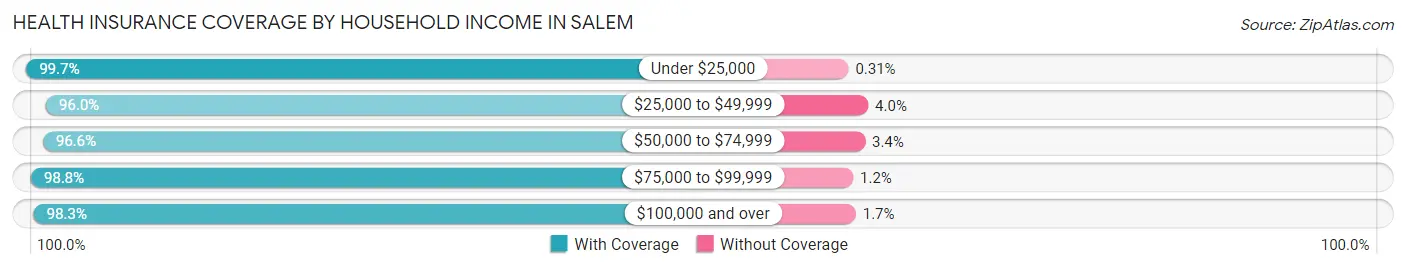
| Household Income | With Coverage | Without Coverage |
| Under $25,000 | 5,181 (99.7%) | 16 (0.3%) |
| $25,000 to $49,999 | 5,469 (96.0%) | 228 (4.0%) |
| $50,000 to $74,999 | 5,221 (96.6%) | 185 (3.4%) |
| $75,000 to $99,999 | 5,273 (98.8%) | 63 (1.2%) |
| $100,000 and over | 21,118 (98.3%) | 361 (1.7%) |
Public vs Private Health Insurance Coverage by Age in Salem
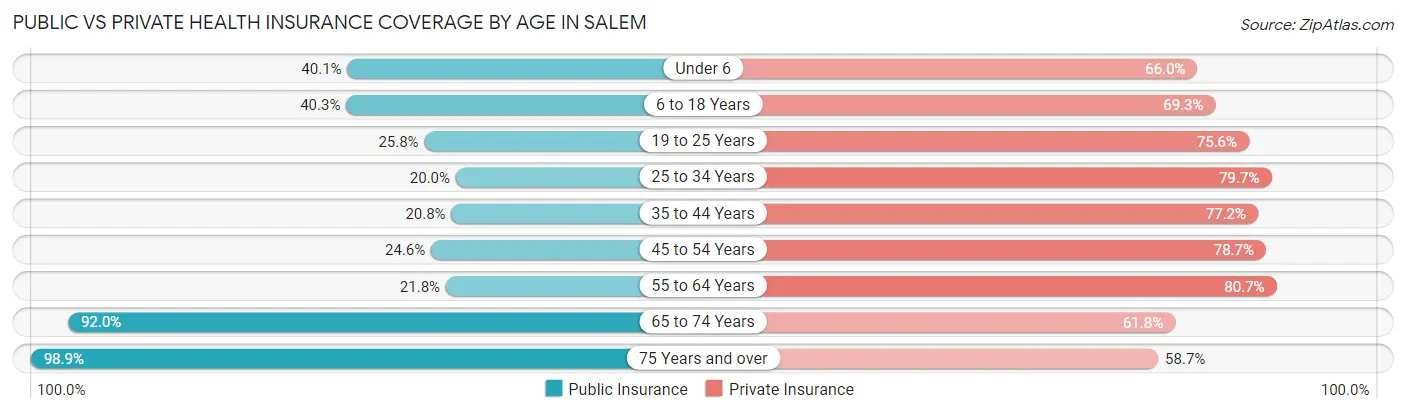
| Age Bracket | Public Insurance | Private Insurance |
| Under 6 | 1,055 (40.1%) | 1,737 (66.0%) |
| 6 to 18 Years | 2,121 (40.3%) | 3,649 (69.3%) |
| 19 to 25 Years | 1,353 (25.8%) | 3,965 (75.5%) |
| 25 to 34 Years | 1,418 (20.0%) | 5,665 (79.7%) |
| 35 to 44 Years | 1,221 (20.8%) | 4,540 (77.2%) |
| 45 to 54 Years | 1,265 (24.6%) | 4,054 (78.7%) |
| 55 to 64 Years | 1,268 (21.8%) | 4,691 (80.7%) |
| 65 to 74 Years | 4,125 (91.9%) | 2,774 (61.8%) |
| 75 Years and over | 2,771 (98.9%) | 1,646 (58.7%) |
| Total | 16,597 (37.4%) | 32,721 (73.7%) |
Disability Status by Sex by Age in Salem
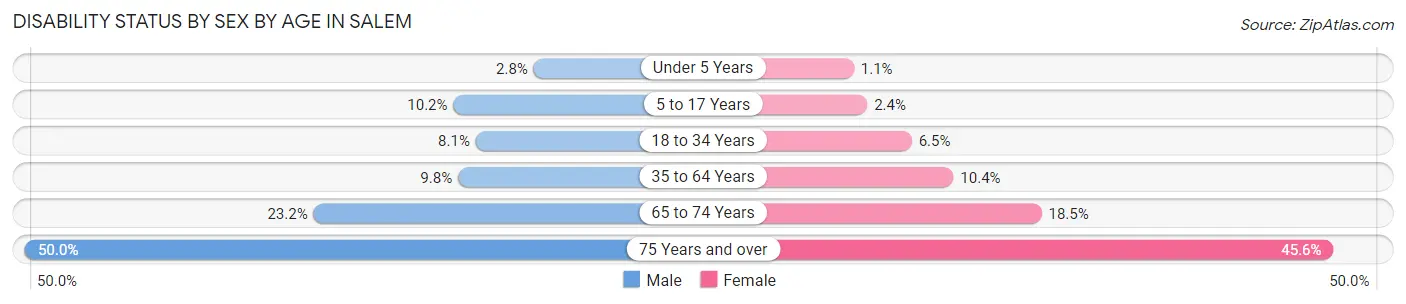
| Age Bracket | Male | Female |
| Under 5 Years | 34 (2.8%) | 11 (1.1%) |
| 5 to 17 Years | 238 (10.2%) | 56 (2.4%) |
| 18 to 34 Years | 488 (8.1%) | 475 (6.5%) |
| 35 to 64 Years | 758 (9.8%) | 942 (10.4%) |
| 65 to 74 Years | 391 (23.2%) | 519 (18.5%) |
| 75 Years and over | 579 (50.0%) | 750 (45.6%) |
Disability Class by Sex by Age in Salem
Disability Class: Hearing Difficulty
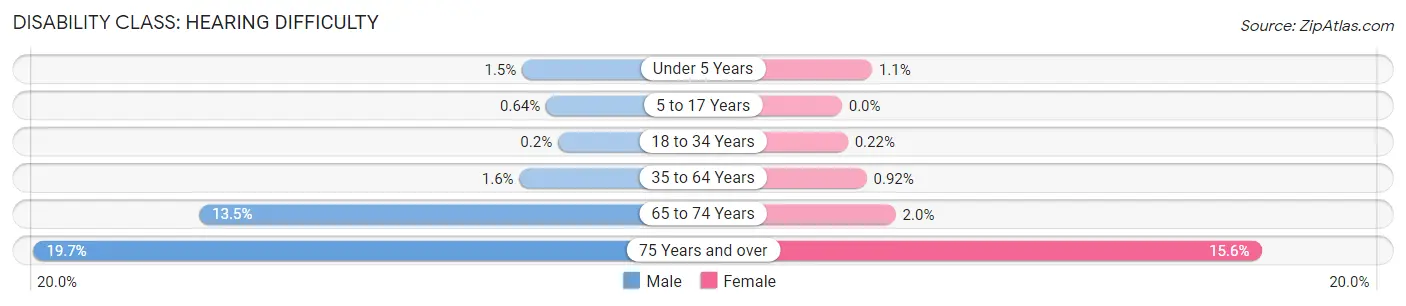
| Age Bracket | Male | Female |
| Under 5 Years | 19 (1.5%) | 11 (1.1%) |
| 5 to 17 Years | 15 (0.6%) | 0 (0.0%) |
| 18 to 34 Years | 12 (0.2%) | 16 (0.2%) |
| 35 to 64 Years | 126 (1.6%) | 84 (0.9%) |
| 65 to 74 Years | 228 (13.5%) | 56 (2.0%) |
| 75 Years and over | 228 (19.7%) | 256 (15.6%) |
Disability Class: Vision Difficulty
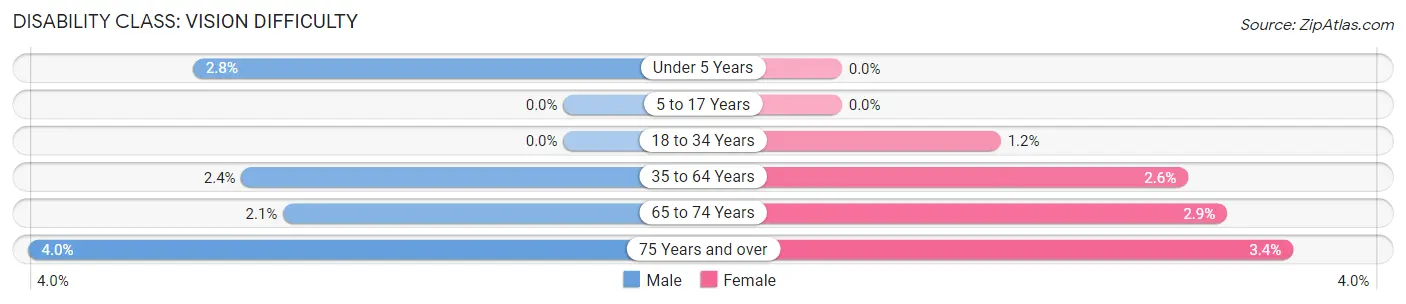
| Age Bracket | Male | Female |
| Under 5 Years | 34 (2.8%) | 0 (0.0%) |
| 5 to 17 Years | 0 (0.0%) | 0 (0.0%) |
| 18 to 34 Years | 0 (0.0%) | 86 (1.2%) |
| 35 to 64 Years | 185 (2.4%) | 234 (2.6%) |
| 65 to 74 Years | 35 (2.1%) | 80 (2.9%) |
| 75 Years and over | 46 (4.0%) | 55 (3.4%) |
Disability Class: Cognitive Difficulty
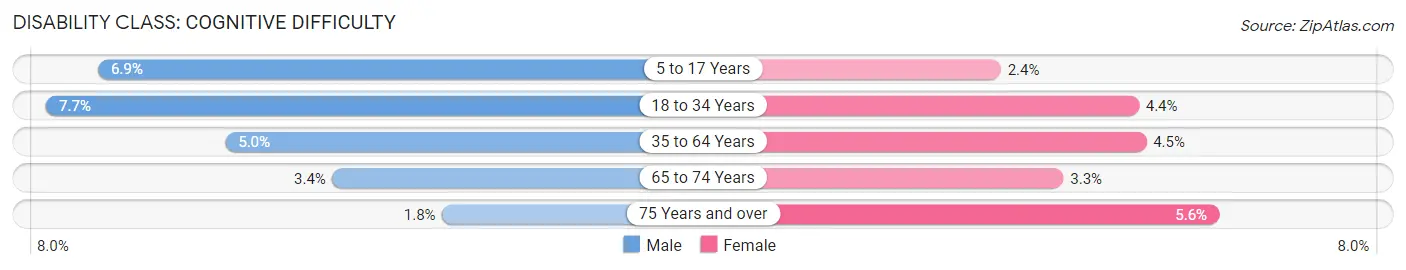
| Age Bracket | Male | Female |
| 5 to 17 Years | 161 (6.9%) | 56 (2.4%) |
| 18 to 34 Years | 461 (7.7%) | 323 (4.4%) |
| 35 to 64 Years | 389 (5.0%) | 411 (4.5%) |
| 65 to 74 Years | 58 (3.4%) | 92 (3.3%) |
| 75 Years and over | 21 (1.8%) | 92 (5.6%) |
Disability Class: Ambulatory Difficulty
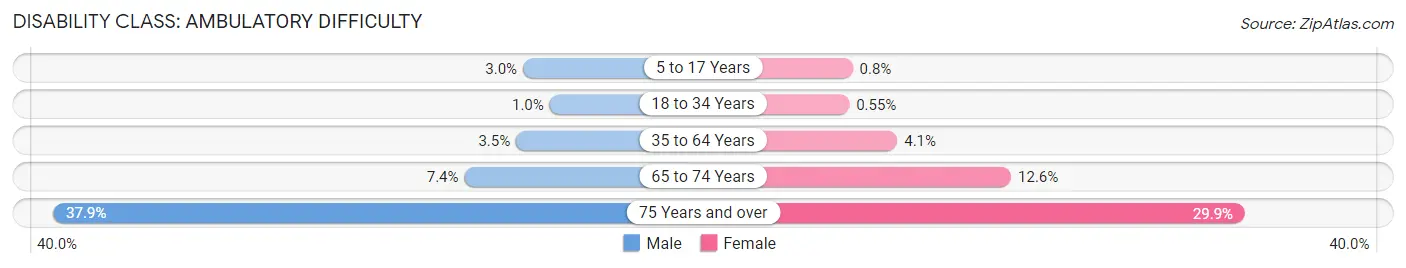
| Age Bracket | Male | Female |
| 5 to 17 Years | 70 (3.0%) | 19 (0.8%) |
| 18 to 34 Years | 61 (1.0%) | 40 (0.5%) |
| 35 to 64 Years | 272 (3.5%) | 375 (4.1%) |
| 65 to 74 Years | 124 (7.3%) | 352 (12.6%) |
| 75 Years and over | 439 (37.9%) | 492 (29.9%) |
Disability Class: Self-Care Difficulty
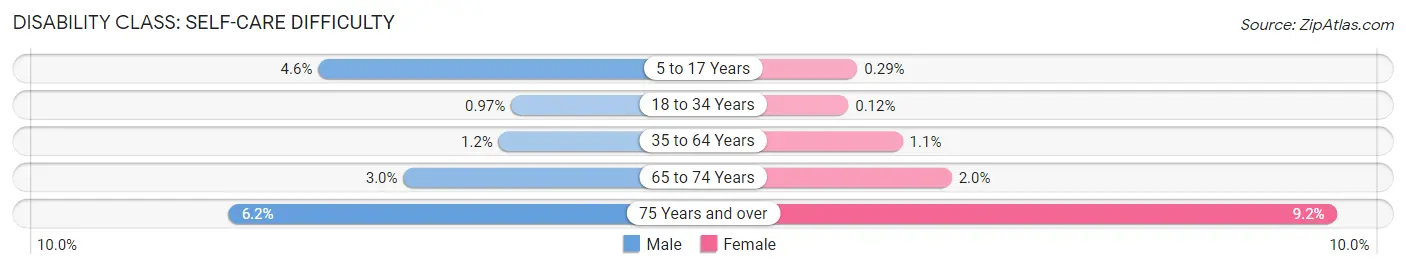
| Age Bracket | Male | Female |
| 5 to 17 Years | 106 (4.5%) | 7 (0.3%) |
| 18 to 34 Years | 58 (1.0%) | 9 (0.1%) |
| 35 to 64 Years | 93 (1.2%) | 103 (1.1%) |
| 65 to 74 Years | 50 (3.0%) | 57 (2.0%) |
| 75 Years and over | 72 (6.2%) | 151 (9.2%) |
Technology Access in Salem
Computing Device Access in Salem
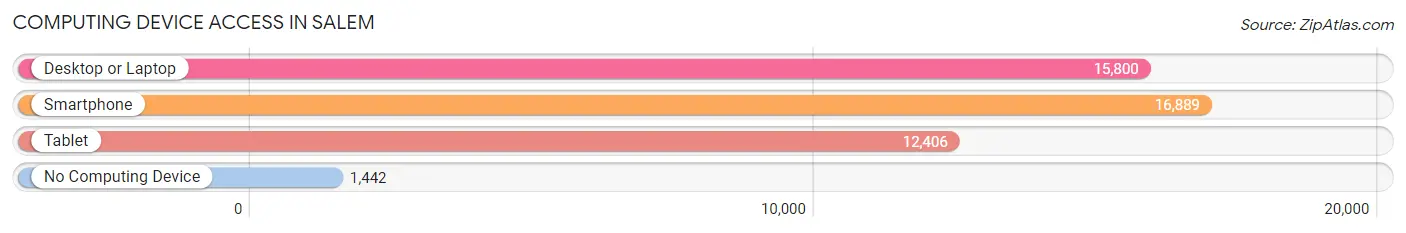
| Device Type | # Households | % Households |
| Desktop or Laptop | 15,800 | 79.4% |
| Smartphone | 16,889 | 84.9% |
| Tablet | 12,406 | 62.4% |
| No Computing Device | 1,442 | 7.2% |
| Total | 19,887 | 100.0% |
Internet Access in Salem
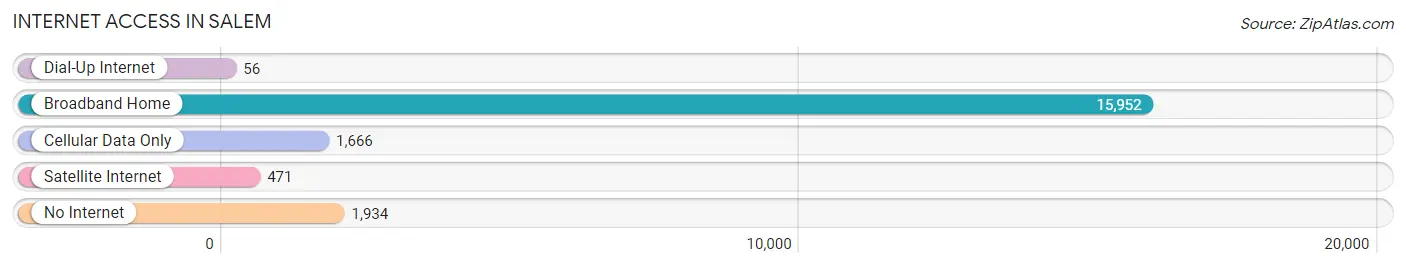
| Internet Type | # Households | % Households |
| Dial-Up Internet | 56 | 0.3% |
| Broadband Home | 15,952 | 80.2% |
| Cellular Data Only | 1,666 | 8.4% |
| Satellite Internet | 471 | 2.4% |
| No Internet | 1,934 | 9.7% |
| Total | 19,887 | 100.0% |
Salem Summary
Salem, Massachusetts is a city located in Essex County, Massachusetts, United States. It is situated on the North Shore of Massachusetts Bay, about 10 miles northeast of Boston. The city has a population of approximately 41,340 people, making it the ninth-largest city in the state.
History
Salem was first settled in 1626 by a group of Puritans from England. The city was named after the Hebrew word for peace, shalom. The settlers established a fishing village and trading post, and the area quickly grew into a prosperous port. Salem was incorporated as a town in 1629 and as a city in 1836.
During the late 17th century, Salem became a major center of the Atlantic slave trade. The city was also home to the Salem witch trials of 1692, which resulted in the execution of 20 people accused of witchcraft.
In the 19th century, Salem became a major center of the maritime industry. The city was home to the East India Marine Society, which was founded in 1799 and was the first American organization devoted to the study of the world’s oceans.
Geography
Salem is located at the mouth of the Naumkeag River, which empties into Massachusetts Bay. The city is situated on the North Shore of Massachusetts Bay, about 10 miles northeast of Boston. The city has a total area of 8.3 square miles, of which 7.9 square miles is land and 0.4 square miles is water.
The city is bordered by the towns of Marblehead to the northeast, Swampscott to the east, Beverly to the south, and Peabody to the west. The city is also home to several islands, including Winter Island, the House Island, and the Niles Island.
Economy
Salem’s economy is largely based on tourism, with the city’s historic sites and attractions drawing visitors from around the world. The city is also home to a number of technology and biotechnology companies, as well as a number of manufacturing and service-based businesses.
The city’s largest employers include the Salem Hospital, the Salem Public Schools, the Salem State University, and the North Shore Community College. Other major employers include the Peabody Essex Museum, the Salem Maritime National Historic Site, and the Salem Willows Amusement Park.
Demographics
As of the 2010 census, Salem had a population of 41,340 people. The racial makeup of the city was 79.2% White, 8.3% African American, 0.3% Native American, 5.2% Asian, 0.1% Pacific Islander, 3.3% from other races, and 3.6% from two or more races. Hispanic or Latino of any race were 8.3% of the population.
The median income for a household in the city was $50,817, and the median income for a family was $62,817. The per capita income for the city was $27,817. About 11.2% of families and 14.3% of the population were below the poverty line, including 19.2% of those under age 18 and 8.2% of those age 65 or over.
Common Questions
What is Per Capita Income in Salem?
Per Capita income in Salem is $46,919.
What is the Median Family Income in Salem?
Median Family Income in Salem is $105,422.
What is the Median Household income in Salem?
Median Household Income in Salem is $79,196.
What is Income or Wage Gap in Salem?
Income or Wage Gap in Salem is 10.8%.
Women in Salem earn 89.2 cents for every dollar earned by a man.
What is Family Income Deficit in Salem?
Family Income Deficit in Salem is $5,944.
Families that are below poverty line in Salem earn $5,944 less on average than the poverty threshold level.
What is Inequality or Gini Index in Salem?
Inequality or Gini Index in Salem is 0.45.
What is the Total Population of Salem?
Total Population of Salem is 44,541.
What is the Total Male Population of Salem?
Total Male Population of Salem is 20,222.
What is the Total Female Population of Salem?
Total Female Population of Salem is 24,319.
What is the Ratio of Males per 100 Females in Salem?
There are 83.15 Males per 100 Females in Salem.
What is the Ratio of Females per 100 Males in Salem?
There are 120.26 Females per 100 Males in Salem.
What is the Median Population Age in Salem?
Median Population Age in Salem is 38.0 Years.
What is the Average Family Size in Salem
Average Family Size in Salem is 2.9 People.
What is the Average Household Size in Salem
Average Household Size in Salem is 2.2 People.
How Large is the Labor Force in Salem?
There are 26,951 People in the Labor Forcein in Salem.
What is the Percentage of People in the Labor Force in Salem?
70.4% of People are in the Labor Force in Salem.
What is the Unemployment Rate in Salem?
Unemployment Rate in Salem is 5.0%.