Provincetown, MA Map & Demographics
Provincetown Map
Provincetown Overview
$89,577
PER CAPITA INCOME
$136,667
AVG FAMILY INCOME
$91,711
AVG HOUSEHOLD INCOME
29.7%
WAGE / INCOME GAP [ % ]
70.3¢/ $1
WAGE / INCOME GAP [ $ ]
0.53
INEQUALITY / GINI INDEX
3,433
TOTAL POPULATION
2,138
MALE POPULATION
1,295
FEMALE POPULATION
165.10
MALES / 100 FEMALES
60.57
FEMALES / 100 MALES
56.1
MEDIAN AGE
2.5
AVG FAMILY SIZE
1.8
AVG HOUSEHOLD SIZE
2,144
LABOR FORCE [ PEOPLE ]
67.8%
PERCENT IN LABOR FORCE
8.3%
UNEMPLOYMENT RATE
Provincetown Zip Codes
Income in Provincetown
Income Overview in Provincetown
Per Capita Income in Provincetown is $89,577, while median incomes of families and households are $136,667 and $91,711 respectively.
| Characteristic | Number | Measure |
| Per Capita Income | 3,433 | $89,577 |
| Median Family Income | 652 | $136,667 |
| Mean Family Income | 652 | $184,541 |
| Median Household Income | 1,890 | $91,711 |
| Mean Household Income | 1,890 | $158,278 |
| Income Deficit | 652 | $0 |
| Wage / Income Gap (%) | 3,433 | 29.67% |
| Wage / Income Gap ($) | 3,433 | 70.33¢ per $1 |
| Gini / Inequality Index | 3,433 | 0.53 |
Earnings by Sex in Provincetown
Average Earnings in Provincetown are $52,424, $70,260 for men and $49,417 for women, a difference of 29.7%.
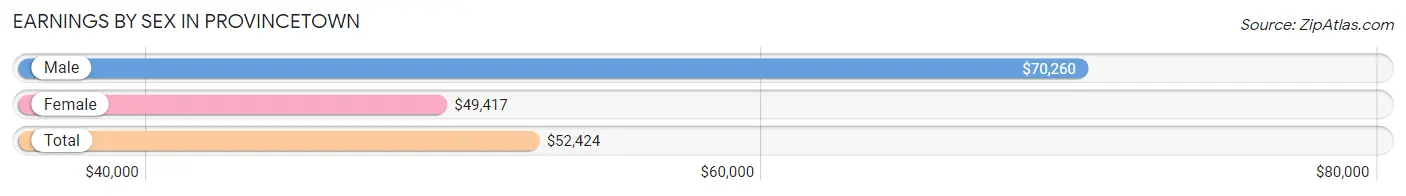
| Sex | Number | Average Earnings |
| Male | 1,479 (66.1%) | $70,260 |
| Female | 757 (33.9%) | $49,417 |
| Total | 2,236 (100.0%) | $52,424 |
Earnings by Sex by Income Bracket in Provincetown
The most common earnings brackets in Provincetown are $100,000+ for men (528 | 35.7%) and $100,000+ for women (210 | 27.7%).
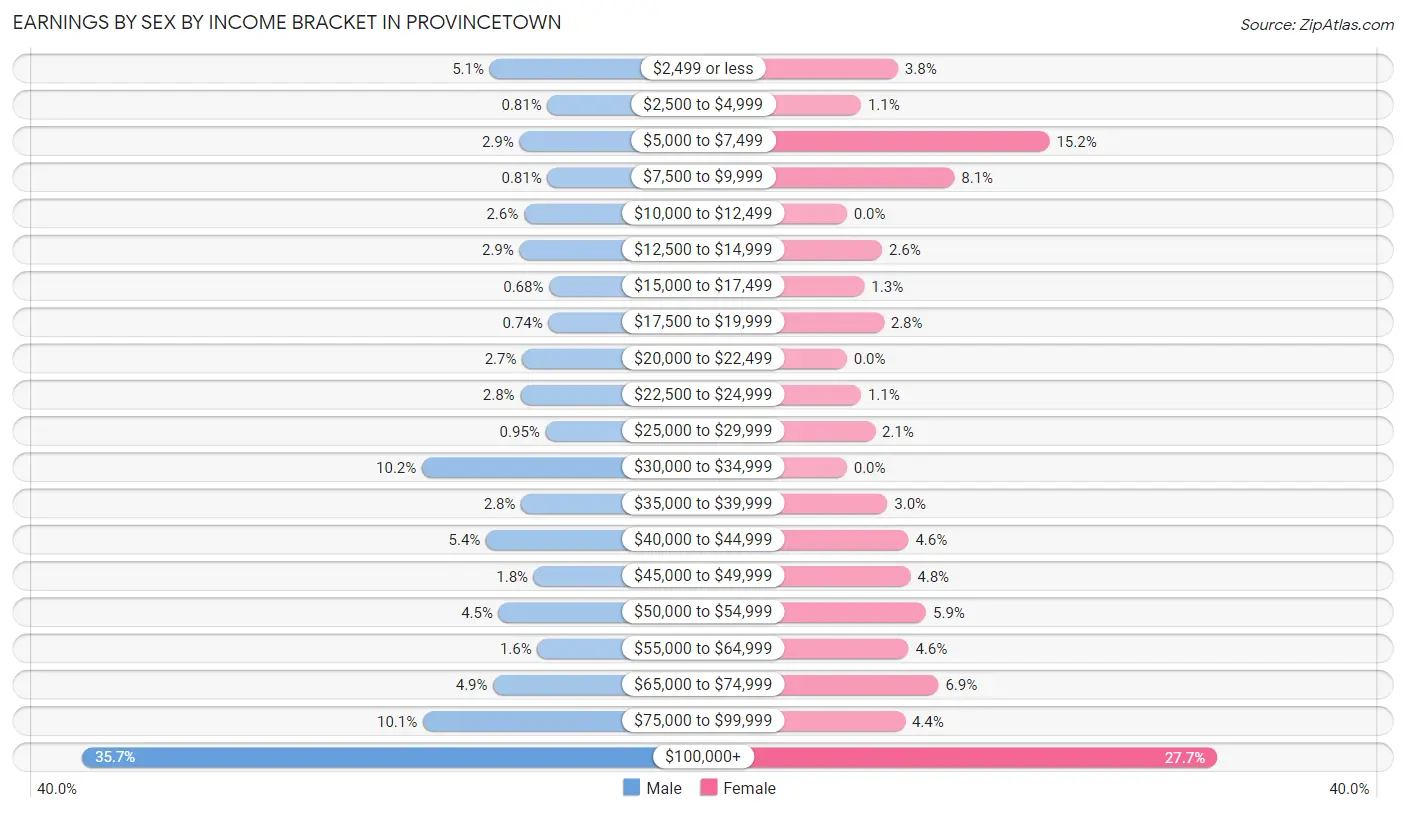
| Income | Male | Female |
| $2,499 or less | 76 (5.1%) | 29 (3.8%) |
| $2,500 to $4,999 | 12 (0.8%) | 8 (1.1%) |
| $5,000 to $7,499 | 43 (2.9%) | 115 (15.2%) |
| $7,500 to $9,999 | 12 (0.8%) | 61 (8.1%) |
| $10,000 to $12,499 | 38 (2.6%) | 0 (0.0%) |
| $12,500 to $14,999 | 43 (2.9%) | 20 (2.6%) |
| $15,000 to $17,499 | 10 (0.7%) | 10 (1.3%) |
| $17,500 to $19,999 | 11 (0.7%) | 21 (2.8%) |
| $20,000 to $22,499 | 40 (2.7%) | 0 (0.0%) |
| $22,500 to $24,999 | 42 (2.8%) | 8 (1.1%) |
| $25,000 to $29,999 | 14 (0.9%) | 16 (2.1%) |
| $30,000 to $34,999 | 151 (10.2%) | 0 (0.0%) |
| $35,000 to $39,999 | 41 (2.8%) | 23 (3.0%) |
| $40,000 to $44,999 | 80 (5.4%) | 35 (4.6%) |
| $45,000 to $49,999 | 27 (1.8%) | 36 (4.8%) |
| $50,000 to $54,999 | 66 (4.5%) | 45 (5.9%) |
| $55,000 to $64,999 | 23 (1.6%) | 35 (4.6%) |
| $65,000 to $74,999 | 72 (4.9%) | 52 (6.9%) |
| $75,000 to $99,999 | 150 (10.1%) | 33 (4.4%) |
| $100,000+ | 528 (35.7%) | 210 (27.7%) |
| Total | 1,479 (100.0%) | 757 (100.0%) |
Earnings by Sex by Educational Attainment in Provincetown
Average earnings in Provincetown are $73,125 for men and $50,722 for women, a difference of 30.6%. Men with an educational attainment of bachelor's degree enjoy the highest average annual earnings of $110,417, while those with college or associate's degree education earn the least with $32,188. Women with an educational attainment of graduate degree earn the most with the average annual earnings of $93,611, while those with college or associate's degree education have the smallest earnings of $36,630.
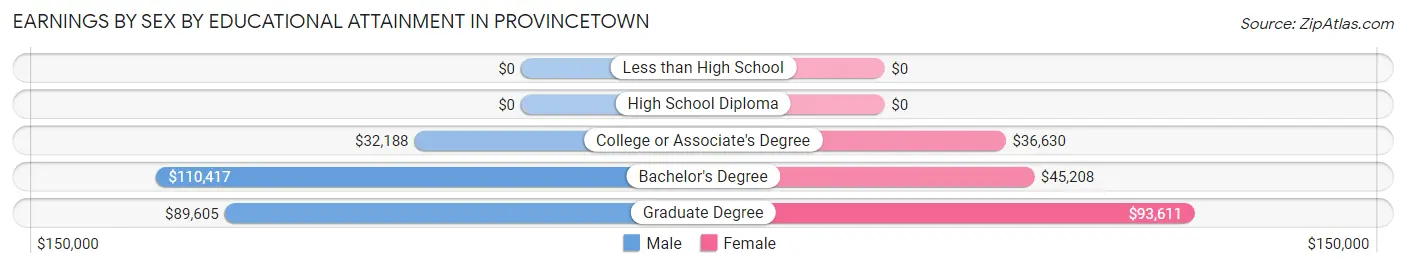
| Educational Attainment | Male Income | Female Income |
| Less than High School | - | - |
| High School Diploma | - | - |
| College or Associate's Degree | $32,188 | $36,630 |
| Bachelor's Degree | $110,417 | $45,208 |
| Graduate Degree | $89,605 | $93,611 |
| Total | $73,125 | $50,722 |
Family Income in Provincetown
Family Income Brackets in Provincetown
According to the Provincetown family income data, there are 199 families falling into the $200,000+ income range, which is the most common income bracket and makes up 30.5% of all families.
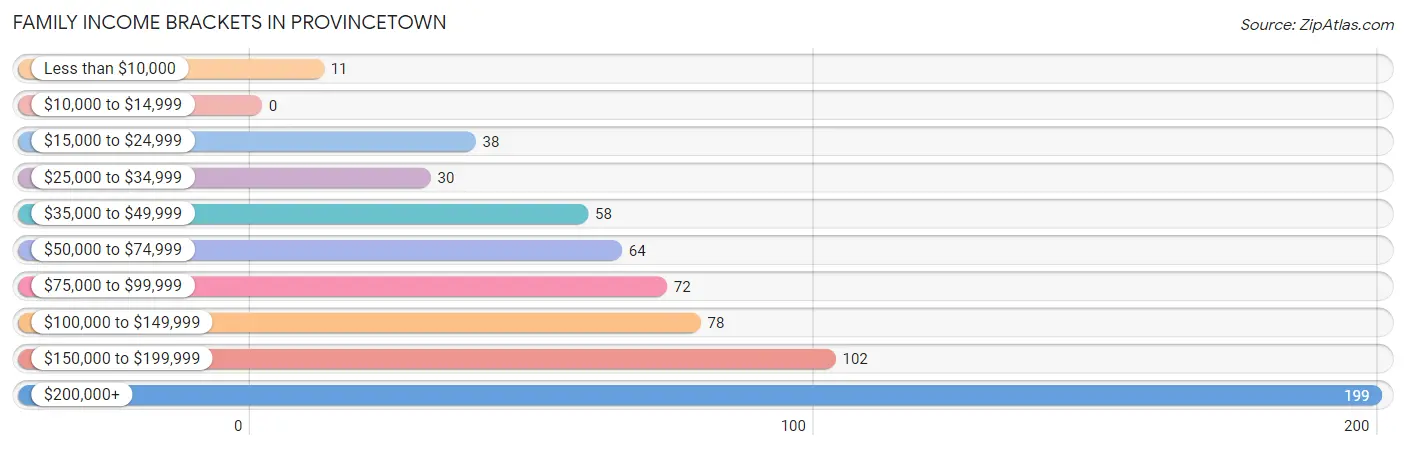
| Income Bracket | # Families | % Families |
| Less than $10,000 | 11 | 1.7% |
| $10,000 to $14,999 | 0 | 0.0% |
| $15,000 to $24,999 | 38 | 5.8% |
| $25,000 to $34,999 | 30 | 4.6% |
| $35,000 to $49,999 | 58 | 8.9% |
| $50,000 to $74,999 | 64 | 9.8% |
| $75,000 to $99,999 | 72 | 11.0% |
| $100,000 to $149,999 | 78 | 12.0% |
| $150,000 to $199,999 | 102 | 15.6% |
| $200,000+ | 199 | 30.5% |
Family Income by Famaliy Size in Provincetown
2-person families (549 | 84.2%) account for the highest median family income in Provincetown with $155,972 per family, while 2-person families (549 | 84.2%) have the highest median income of $77,986 per family member.
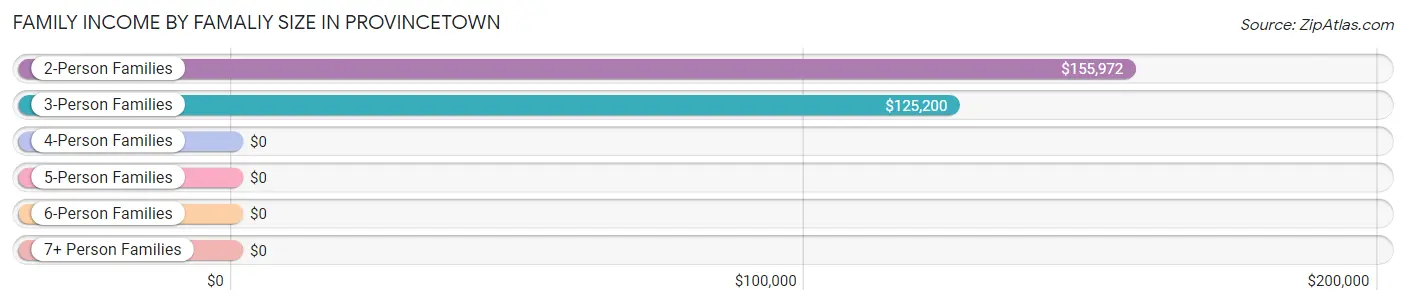
| Income Bracket | # Families | Median Income |
| 2-Person Families | 549 (84.2%) | $155,972 |
| 3-Person Families | 46 (7.1%) | $125,200 |
| 4-Person Families | 40 (6.1%) | $0 |
| 5-Person Families | 0 (0.0%) | $0 |
| 6-Person Families | 0 (0.0%) | $0 |
| 7+ Person Families | 17 (2.6%) | $0 |
| Total | 652 (100.0%) | $136,667 |
Family Income by Number of Earners in Provincetown
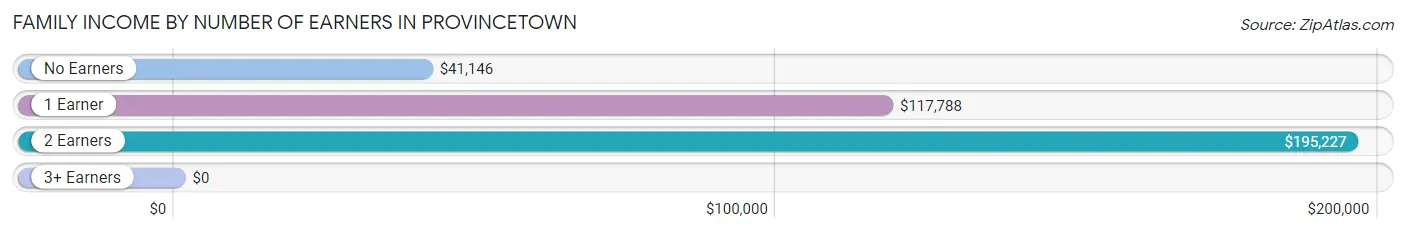
| Number of Earners | # Families | Median Income |
| No Earners | 81 (12.4%) | $41,146 |
| 1 Earner | 205 (31.4%) | $117,788 |
| 2 Earners | 330 (50.6%) | $195,227 |
| 3+ Earners | 36 (5.5%) | $0 |
| Total | 652 (100.0%) | $136,667 |
Household Income in Provincetown
Household Income Brackets in Provincetown
With 525 households falling in the category, the $200,000+ income range is the most frequent in Provincetown, accounting for 27.8% of all households. In contrast, only 51 households (2.7%) fall into the less than $10,000 income bracket, making it the least populous group.
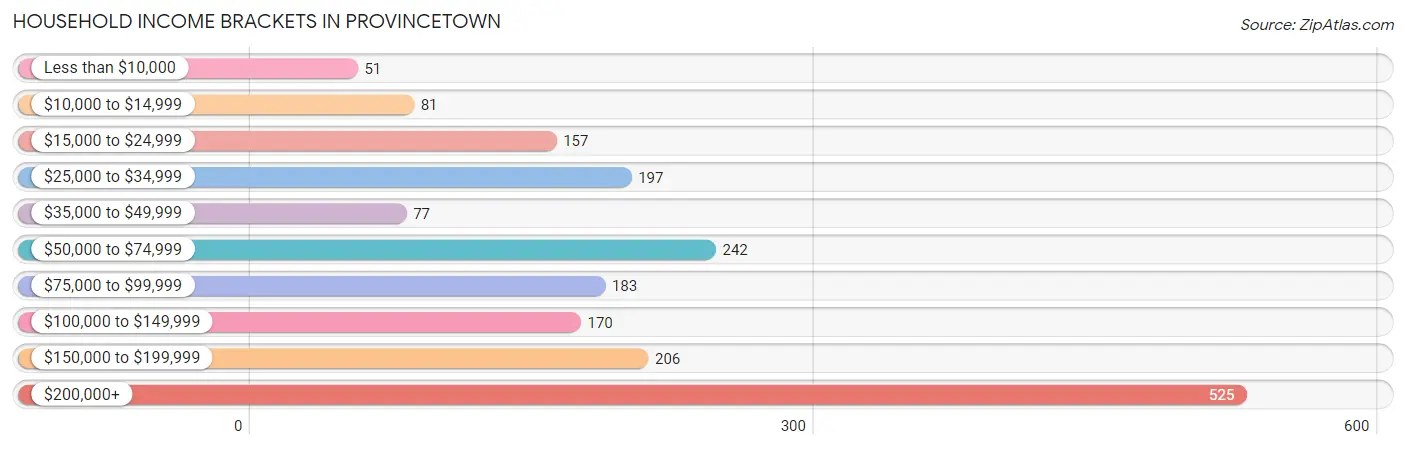
| Income Bracket | # Households | % Households |
| Less than $10,000 | 51 | 2.7% |
| $10,000 to $14,999 | 81 | 4.3% |
| $15,000 to $24,999 | 157 | 8.3% |
| $25,000 to $34,999 | 197 | 10.4% |
| $35,000 to $49,999 | 77 | 4.1% |
| $50,000 to $74,999 | 242 | 12.8% |
| $75,000 to $99,999 | 183 | 9.7% |
| $100,000 to $149,999 | 170 | 9.0% |
| $150,000 to $199,999 | 206 | 10.9% |
| $200,000+ | 525 | 27.8% |
Household Income by Householder Age in Provincetown
The median household income in Provincetown is $91,711, with the highest median household income of $248,750 found in the 25 to 44 years age bracket for the primary householder. A total of 274 households (14.5%) fall into this category.
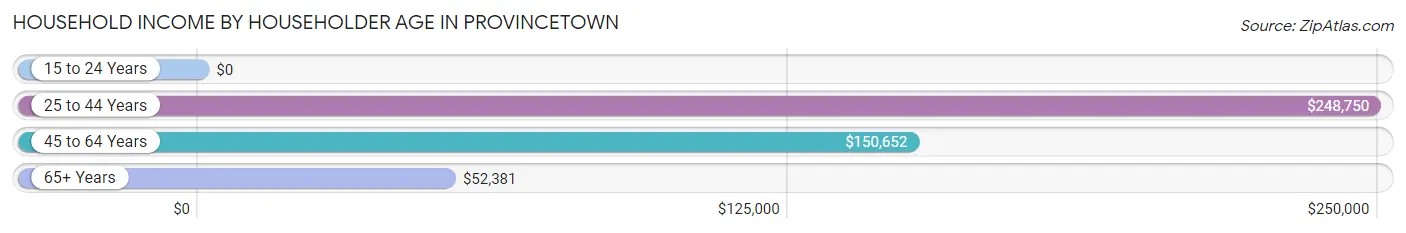
| Income Bracket | # Households | Median Income |
| 15 to 24 Years | 0 (0.0%) | $0 |
| 25 to 44 Years | 274 (14.5%) | $248,750 |
| 45 to 64 Years | 916 (48.5%) | $150,652 |
| 65+ Years | 700 (37.0%) | $52,381 |
| Total | 1,890 (100.0%) | $91,711 |
Poverty in Provincetown
Income Below Poverty by Sex and Age in Provincetown
With 17.0% poverty level for males and 3.9% for females among the residents of Provincetown, under 5 year old males and 25 to 34 year old females are the most vulnerable to poverty, with 87 males (90.6%) and 48 females (57.8%) in their respective age groups living below the poverty level.
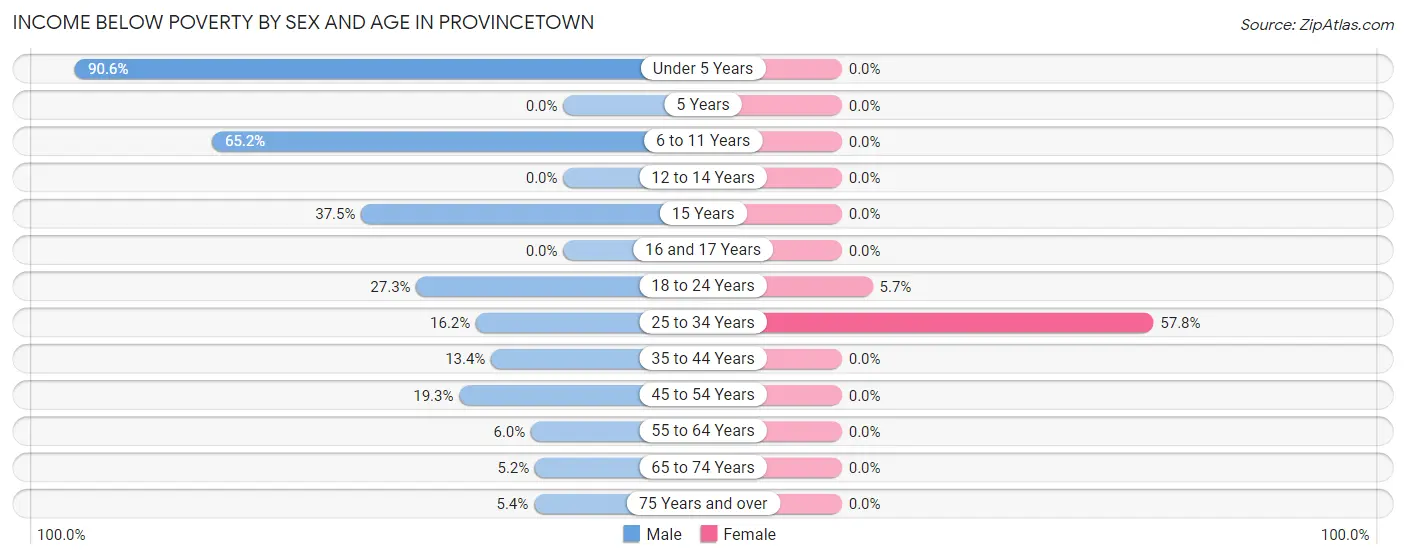
| Age Bracket | Male | Female |
| Under 5 Years | 87 (90.6%) | 0 (0.0%) |
| 5 Years | 0 (0.0%) | 0 (0.0%) |
| 6 to 11 Years | 45 (65.2%) | 0 (0.0%) |
| 12 to 14 Years | 0 (0.0%) | 0 (0.0%) |
| 15 Years | 12 (37.5%) | 0 (0.0%) |
| 16 and 17 Years | 0 (0.0%) | 0 (0.0%) |
| 18 to 24 Years | 15 (27.3%) | 2 (5.7%) |
| 25 to 34 Years | 40 (16.2%) | 48 (57.8%) |
| 35 to 44 Years | 30 (13.4%) | 0 (0.0%) |
| 45 to 54 Years | 73 (19.3%) | 0 (0.0%) |
| 55 to 64 Years | 35 (6.0%) | 0 (0.0%) |
| 65 to 74 Years | 11 (5.2%) | 0 (0.0%) |
| 75 Years and over | 10 (5.4%) | 0 (0.0%) |
| Total | 358 (17.0%) | 50 (3.9%) |
Income Above Poverty by Sex and Age in Provincetown
According to the poverty statistics in Provincetown, males aged 5 years and females aged 6 to 11 years are the age groups that are most secure financially, with 100.0% of males and 100.0% of females in these age groups living above the poverty line.
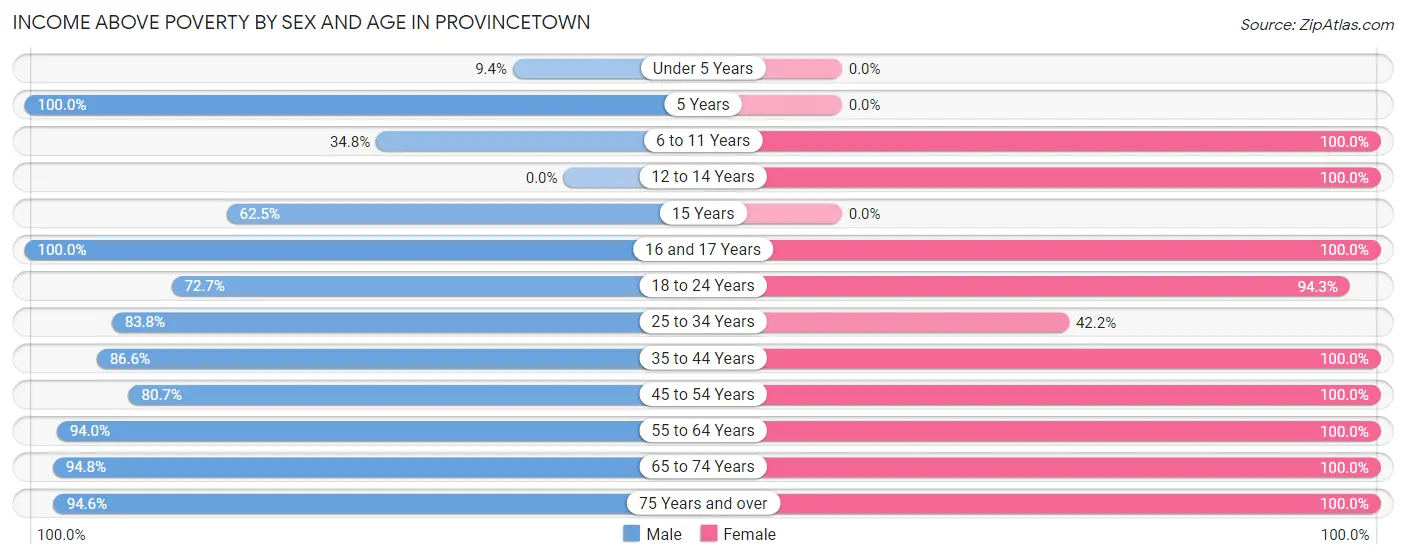
| Age Bracket | Male | Female |
| Under 5 Years | 9 (9.4%) | 0 (0.0%) |
| 5 Years | 16 (100.0%) | 0 (0.0%) |
| 6 to 11 Years | 24 (34.8%) | 19 (100.0%) |
| 12 to 14 Years | 0 (0.0%) | 8 (100.0%) |
| 15 Years | 20 (62.5%) | 0 (0.0%) |
| 16 and 17 Years | 11 (100.0%) | 18 (100.0%) |
| 18 to 24 Years | 40 (72.7%) | 33 (94.3%) |
| 25 to 34 Years | 207 (83.8%) | 35 (42.2%) |
| 35 to 44 Years | 194 (86.6%) | 131 (100.0%) |
| 45 to 54 Years | 305 (80.7%) | 157 (100.0%) |
| 55 to 64 Years | 550 (94.0%) | 293 (100.0%) |
| 65 to 74 Years | 199 (94.8%) | 358 (100.0%) |
| 75 Years and over | 174 (94.6%) | 185 (100.0%) |
| Total | 1,749 (83.0%) | 1,237 (96.1%) |
Income Below Poverty Among Married-Couple Families in Provincetown
The poverty statistics for married-couple families in Provincetown show that 5.7% or 29 of the total 509 families live below the poverty line. Families with 1 or 2 children have the highest poverty rate of 58.0%, comprising of 29 families. On the other hand, families with no children have the lowest poverty rate of 0.0%, which includes 0 families.
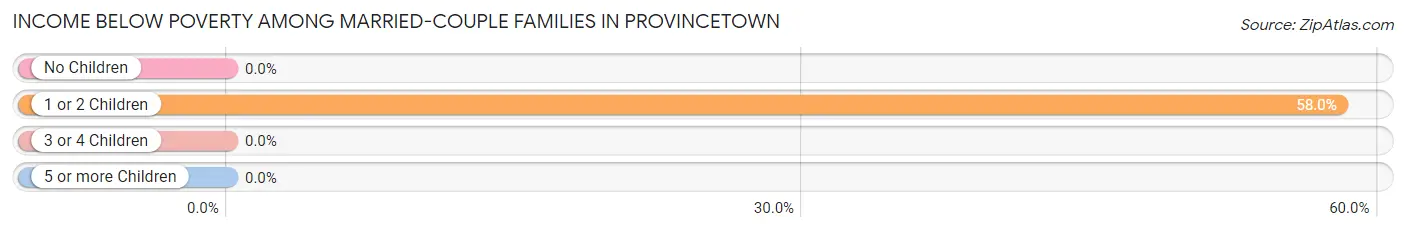
| Children | Above Poverty | Below Poverty |
| No Children | 459 (100.0%) | 0 (0.0%) |
| 1 or 2 Children | 21 (42.0%) | 29 (58.0%) |
| 3 or 4 Children | 0 (0.0%) | 0 (0.0%) |
| 5 or more Children | 0 (0.0%) | 0 (0.0%) |
| Total | 480 (94.3%) | 29 (5.7%) |
Income Below Poverty Among Single-Parent Households in Provincetown
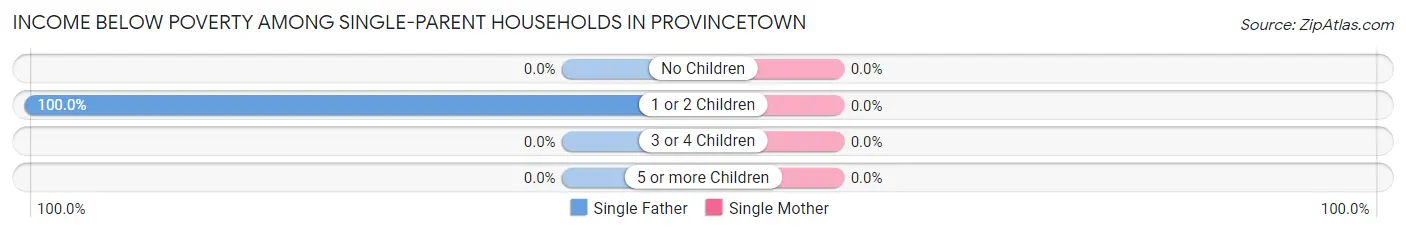
| Children | Single Father | Single Mother |
| No Children | 0 (0.0%) | 0 (0.0%) |
| 1 or 2 Children | 11 (100.0%) | 0 (0.0%) |
| 3 or 4 Children | 0 (0.0%) | 0 (0.0%) |
| 5 or more Children | 0 (0.0%) | 0 (0.0%) |
| Total | 11 (100.0%) | 0 (0.0%) |
Income Below Poverty Among Married-Couple vs Single-Parent Households in Provincetown
The poverty data for Provincetown shows that 29 of the married-couple family households (5.7%) and 11 of the single-parent households (7.7%) are living below the poverty level. Within the married-couple family households, those with 1 or 2 children have the highest poverty rate, with 29 households (58.0%) falling below the poverty line. Among the single-parent households, those with 1 or 2 children have the highest poverty rate, with 11 household (100.0%) living below poverty.
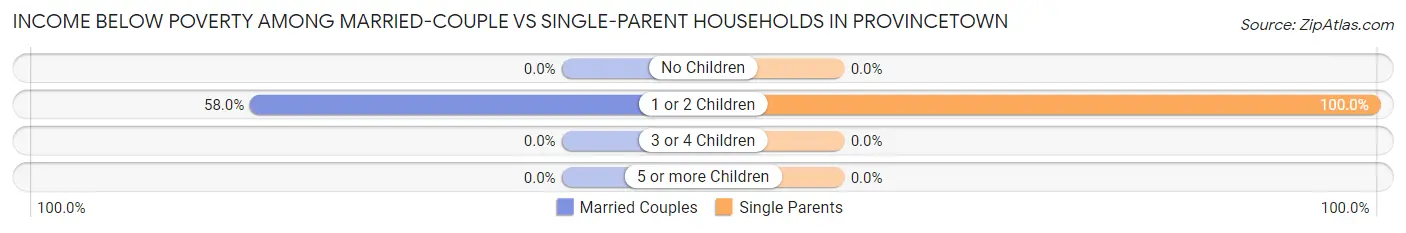
| Children | Married-Couple Families | Single-Parent Households |
| No Children | 0 (0.0%) | 0 (0.0%) |
| 1 or 2 Children | 29 (58.0%) | 11 (100.0%) |
| 3 or 4 Children | 0 (0.0%) | 0 (0.0%) |
| 5 or more Children | 0 (0.0%) | 0 (0.0%) |
| Total | 29 (5.7%) | 11 (7.7%) |
Race in Provincetown
The most populous races in Provincetown are White / Caucasian (2,818 | 82.1%), Hispanic or Latino (419 | 12.2%), and Two or more Races (303 | 8.8%).
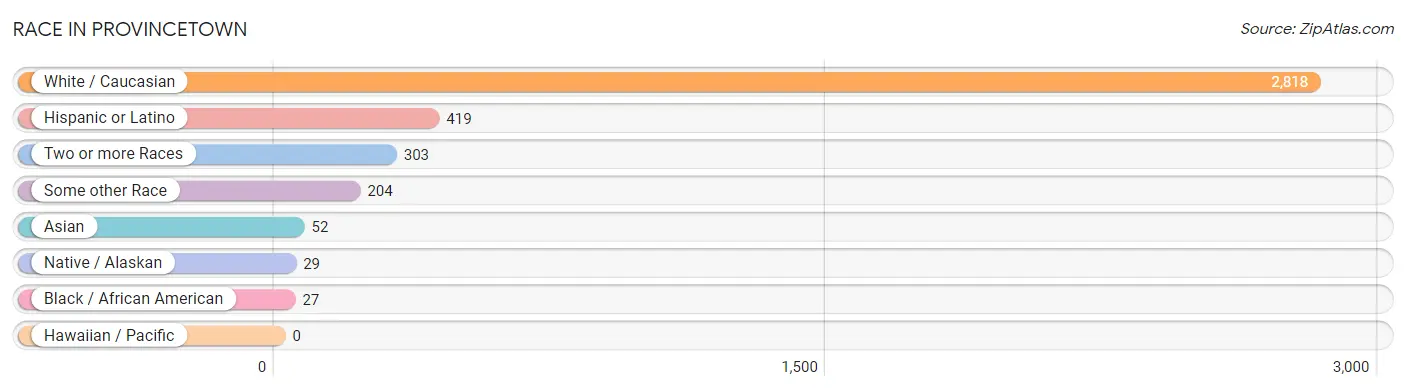
| Race | # Population | % Population |
| Asian | 52 | 1.5% |
| Black / African American | 27 | 0.8% |
| Hawaiian / Pacific | 0 | 0.0% |
| Hispanic or Latino | 419 | 12.2% |
| Native / Alaskan | 29 | 0.8% |
| White / Caucasian | 2,818 | 82.1% |
| Two or more Races | 303 | 8.8% |
| Some other Race | 204 | 5.9% |
| Total | 3,433 | 100.0% |
Ancestry in Provincetown
The most populous ancestries reported in Provincetown are Irish (798 | 23.2%), English (507 | 14.8%), Italian (360 | 10.5%), Portuguese (197 | 5.7%), and Central American (181 | 5.3%), together accounting for 59.5% of all Provincetown residents.
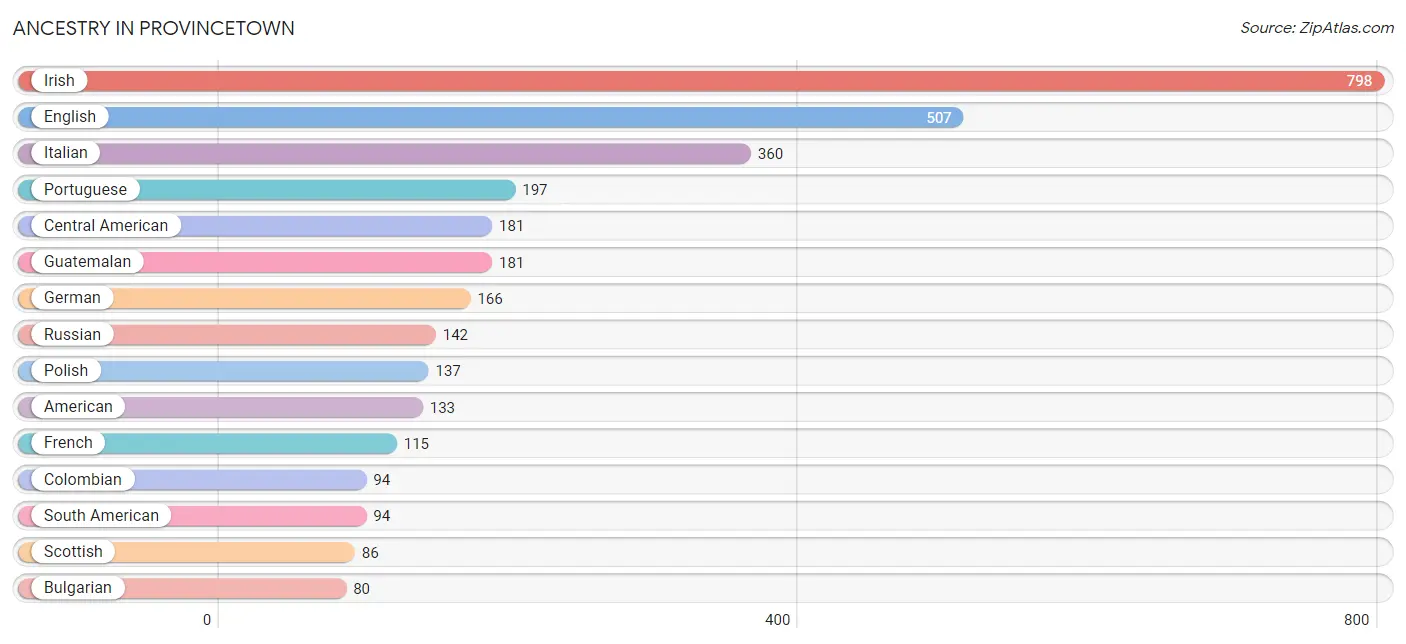
| Ancestry | # Population | % Population |
| American | 133 | 3.9% |
| Arab | 78 | 2.3% |
| Armenian | 13 | 0.4% |
| Austrian | 25 | 0.7% |
| British | 49 | 1.4% |
| Bulgarian | 80 | 2.3% |
| Canadian | 8 | 0.2% |
| Cape Verdean | 2 | 0.1% |
| Central American | 181 | 5.3% |
| Colombian | 94 | 2.7% |
| Croatian | 6 | 0.2% |
| Cuban | 52 | 1.5% |
| Czech | 37 | 1.1% |
| Dutch | 43 | 1.3% |
| Eastern European | 19 | 0.5% |
| Egyptian | 47 | 1.4% |
| English | 507 | 14.8% |
| European | 38 | 1.1% |
| Finnish | 8 | 0.2% |
| French | 115 | 3.4% |
| French American Indian | 40 | 1.2% |
| French Canadian | 80 | 2.3% |
| German | 166 | 4.8% |
| Greek | 60 | 1.8% |
| Guatemalan | 181 | 5.3% |
| Hungarian | 9 | 0.3% |
| Indian (Asian) | 42 | 1.2% |
| Irish | 798 | 23.2% |
| Israeli | 10 | 0.3% |
| Italian | 360 | 10.5% |
| Jamaican | 11 | 0.3% |
| Korean | 10 | 0.3% |
| Lebanese | 19 | 0.5% |
| Lithuanian | 22 | 0.6% |
| Mexican | 77 | 2.2% |
| Native Hawaiian | 11 | 0.3% |
| Northern European | 25 | 0.7% |
| Norwegian | 16 | 0.5% |
| Pakistani | 22 | 0.6% |
| Polish | 137 | 4.0% |
| Portuguese | 197 | 5.7% |
| Puerto Rican | 5 | 0.2% |
| Romanian | 9 | 0.3% |
| Russian | 142 | 4.1% |
| Scandinavian | 12 | 0.4% |
| Scotch-Irish | 59 | 1.7% |
| Scottish | 86 | 2.5% |
| South American | 94 | 2.7% |
| Spaniard | 10 | 0.3% |
| Sri Lankan | 17 | 0.5% |
| Subsaharan African | 2 | 0.1% |
| Swedish | 57 | 1.7% |
| Syrian | 9 | 0.3% |
| Ukrainian | 25 | 0.7% |
| Welsh | 32 | 0.9% | View All 55 Rows |
Immigrants in Provincetown
The most numerous immigrant groups reported in Provincetown came from Latin America (142 | 4.1%), Europe (116 | 3.4%), Eastern Europe (91 | 2.6%), Bulgaria (80 | 2.3%), and Central America (69 | 2.0%), together accounting for 14.5% of all Provincetown residents.
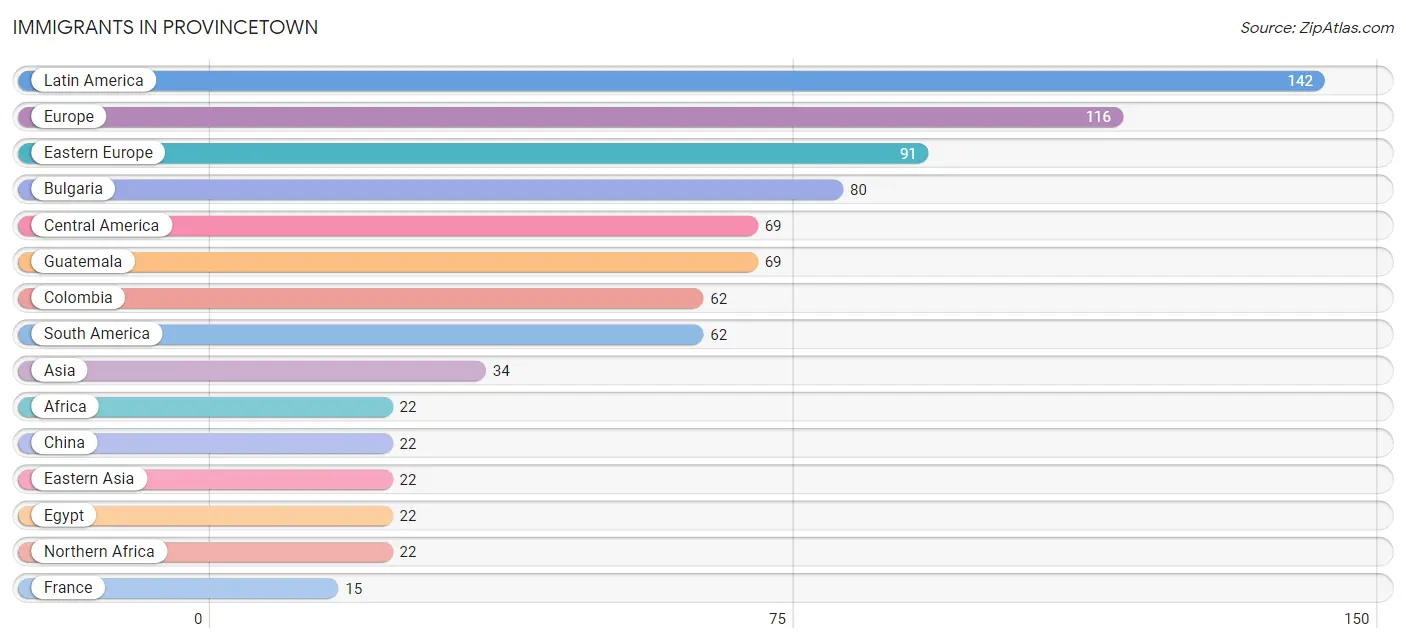
| Immigration Origin | # Population | % Population |
| Africa | 22 | 0.6% |
| Asia | 34 | 1.0% |
| Bulgaria | 80 | 2.3% |
| Canada | 11 | 0.3% |
| Caribbean | 11 | 0.3% |
| Central America | 69 | 2.0% |
| China | 22 | 0.6% |
| Colombia | 62 | 1.8% |
| Eastern Asia | 22 | 0.6% |
| Eastern Europe | 91 | 2.6% |
| Egypt | 22 | 0.6% |
| England | 10 | 0.3% |
| Europe | 116 | 3.4% |
| France | 15 | 0.4% |
| Guatemala | 69 | 2.0% |
| Iraq | 12 | 0.4% |
| Jamaica | 11 | 0.3% |
| Latin America | 142 | 4.1% |
| Northern Africa | 22 | 0.6% |
| Northern Europe | 10 | 0.3% |
| South America | 62 | 1.8% |
| Western Asia | 12 | 0.4% |
| Western Europe | 15 | 0.4% | View All 23 Rows |
Sex and Age in Provincetown
Sex and Age in Provincetown
The most populous age groups in Provincetown are 55 to 59 Years (373 | 17.4%) for men and 70 to 74 Years (198 | 15.3%) for women.
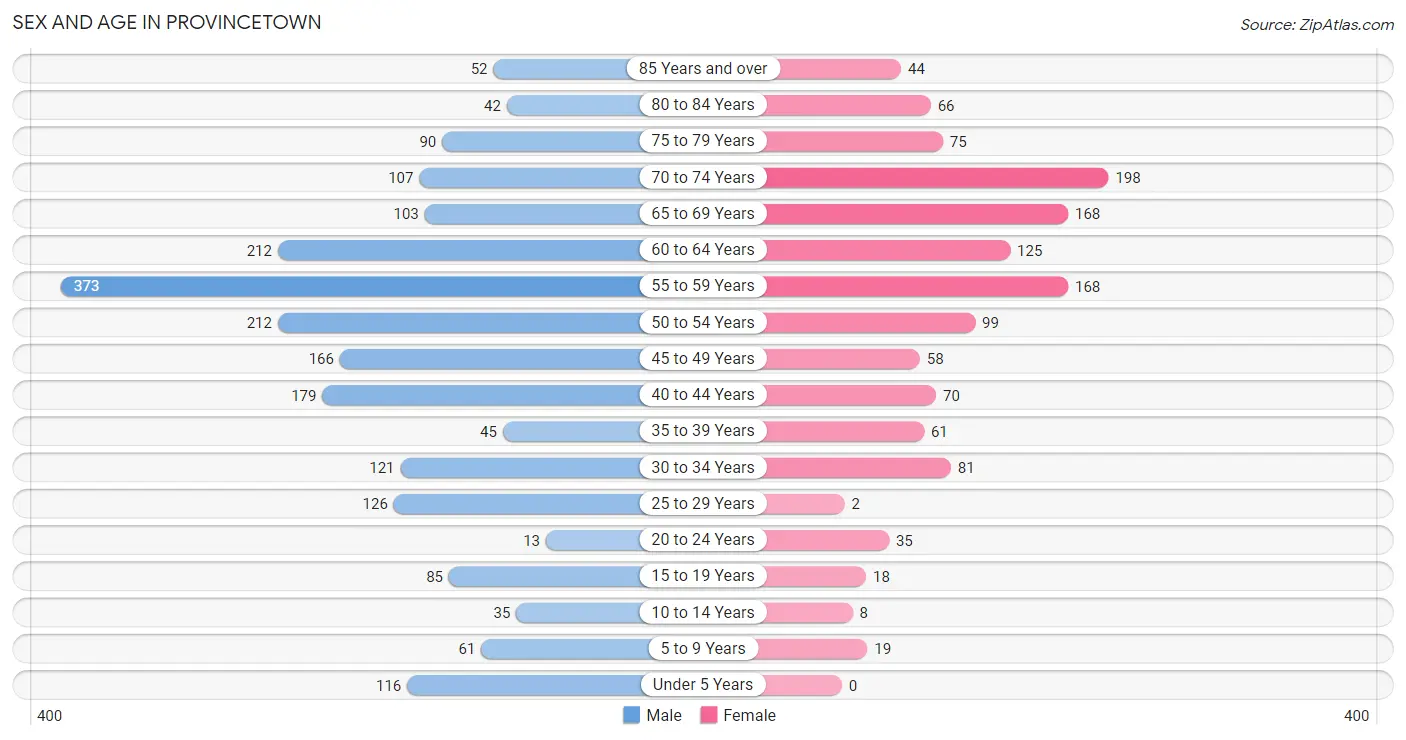
| Age Bracket | Male | Female |
| Under 5 Years | 116 (5.4%) | 0 (0.0%) |
| 5 to 9 Years | 61 (2.9%) | 19 (1.5%) |
| 10 to 14 Years | 35 (1.6%) | 8 (0.6%) |
| 15 to 19 Years | 85 (4.0%) | 18 (1.4%) |
| 20 to 24 Years | 13 (0.6%) | 35 (2.7%) |
| 25 to 29 Years | 126 (5.9%) | 2 (0.2%) |
| 30 to 34 Years | 121 (5.7%) | 81 (6.2%) |
| 35 to 39 Years | 45 (2.1%) | 61 (4.7%) |
| 40 to 44 Years | 179 (8.4%) | 70 (5.4%) |
| 45 to 49 Years | 166 (7.8%) | 58 (4.5%) |
| 50 to 54 Years | 212 (9.9%) | 99 (7.6%) |
| 55 to 59 Years | 373 (17.4%) | 168 (13.0%) |
| 60 to 64 Years | 212 (9.9%) | 125 (9.7%) |
| 65 to 69 Years | 103 (4.8%) | 168 (13.0%) |
| 70 to 74 Years | 107 (5.0%) | 198 (15.3%) |
| 75 to 79 Years | 90 (4.2%) | 75 (5.8%) |
| 80 to 84 Years | 42 (2.0%) | 66 (5.1%) |
| 85 Years and over | 52 (2.4%) | 44 (3.4%) |
| Total | 2,138 (100.0%) | 1,295 (100.0%) |
Families and Households in Provincetown
Median Family Size in Provincetown
The median family size in Provincetown is 2.54 persons per family, with single female/mother families (132 | 20.3%) accounting for the largest median family size of 3.29 persons per family. On the other hand, married-couple families (509 | 78.1%) represent the smallest median family size with 2.34 persons per family.
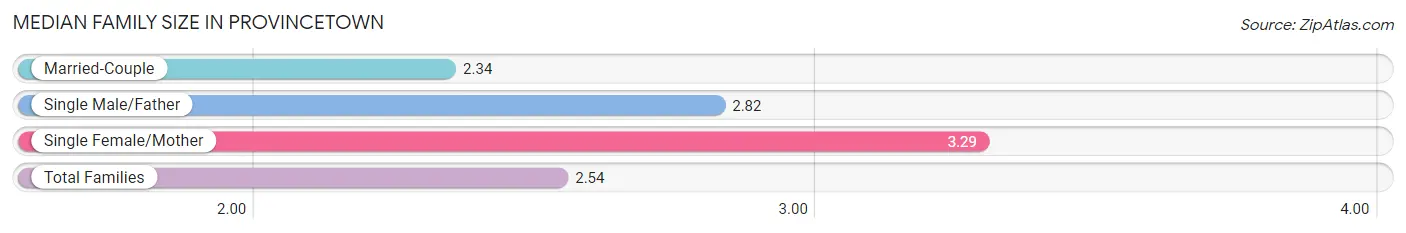
| Family Type | # Families | Family Size |
| Married-Couple | 509 (78.1%) | 2.34 |
| Single Male/Father | 11 (1.7%) | 2.82 |
| Single Female/Mother | 132 (20.3%) | 3.29 |
| Total Families | 652 (100.0%) | 2.54 |
Median Household Size in Provincetown
The median household size in Provincetown is 1.81 persons per household, with single male/father households (11 | 0.6%) accounting for the largest median household size of 3.82 persons per household. non-family households (1,238 | 65.5%) represent the smallest median household size with 1.34 persons per household.
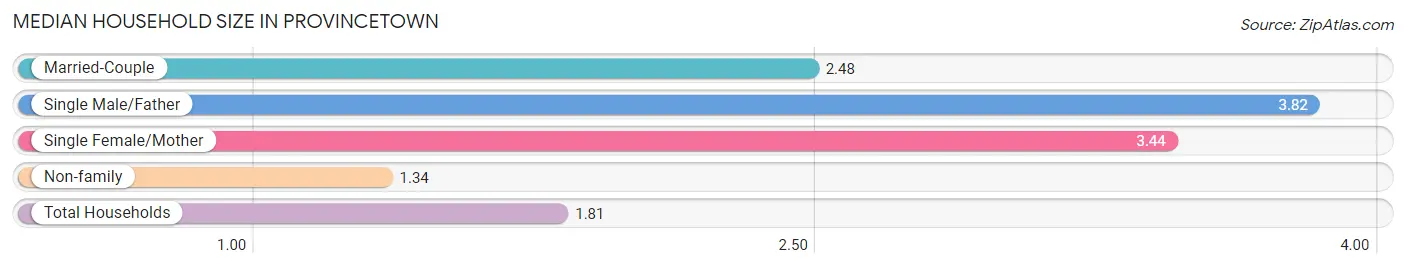
| Household Type | # Households | Household Size |
| Married-Couple | 509 (26.9%) | 2.48 |
| Single Male/Father | 11 (0.6%) | 3.82 |
| Single Female/Mother | 132 (7.0%) | 3.44 |
| Non-family | 1,238 (65.5%) | 1.34 |
| Total Households | 1,890 (100.0%) | 1.81 |
Household Size by Marriage Status in Provincetown
Out of a total of 1,890 households in Provincetown, 652 (34.5%) are family households, while 1,238 (65.5%) are nonfamily households. The most numerous type of family households are 2-person households, comprising 511, and the most common type of nonfamily households are 1-person households, comprising 884.
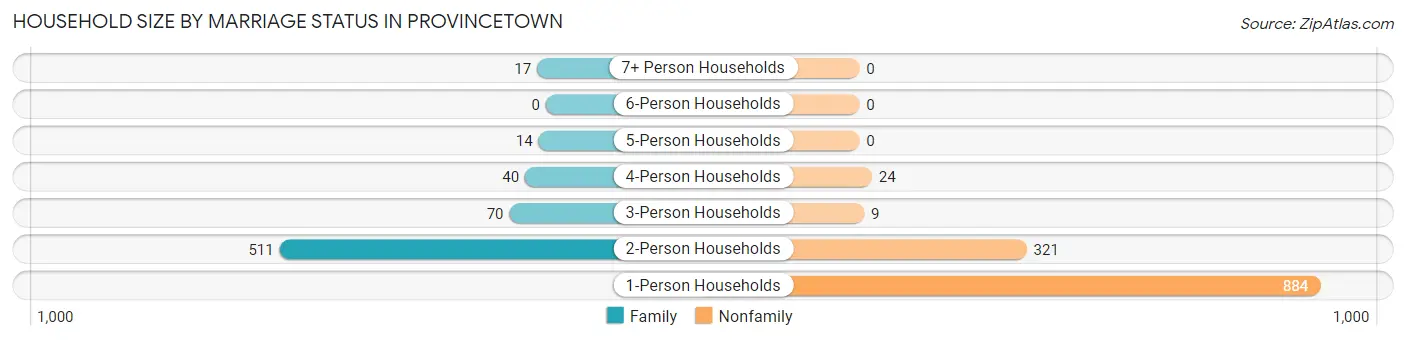
| Household Size | Family Households | Nonfamily Households |
| 1-Person Households | - | 884 (46.8%) |
| 2-Person Households | 511 (27.0%) | 321 (17.0%) |
| 3-Person Households | 70 (3.7%) | 9 (0.5%) |
| 4-Person Households | 40 (2.1%) | 24 (1.3%) |
| 5-Person Households | 14 (0.7%) | 0 (0.0%) |
| 6-Person Households | 0 (0.0%) | 0 (0.0%) |
| 7+ Person Households | 17 (0.9%) | 0 (0.0%) |
| Total | 652 (34.5%) | 1,238 (65.5%) |
Female Fertility in Provincetown
Fertility by Age in Provincetown
Average fertility rate in Provincetown is 40.0 births per 1,000 women. Women in the age bracket of 35 to 50 years have the highest fertility rate with 58.0 births per 1,000 women. Women in the age bracket of 35 to 50 years acount for 84.6% of all women with births.
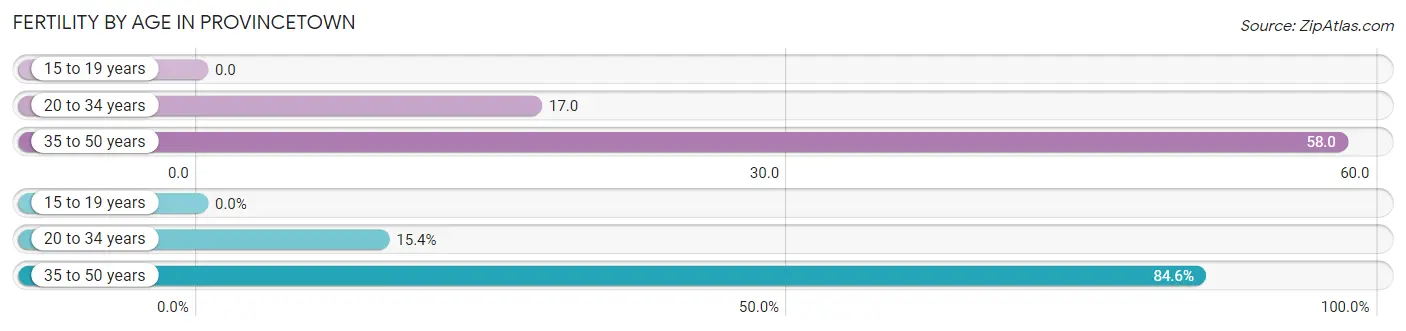
| Age Bracket | Women with Births | Births / 1,000 Women |
| 15 to 19 years | 0 (0.0%) | 0.0 |
| 20 to 34 years | 2 (15.4%) | 17.0 |
| 35 to 50 years | 11 (84.6%) | 58.0 |
| Total | 13 (100.0%) | 40.0 |
Fertility by Age by Marriage Status in Provincetown
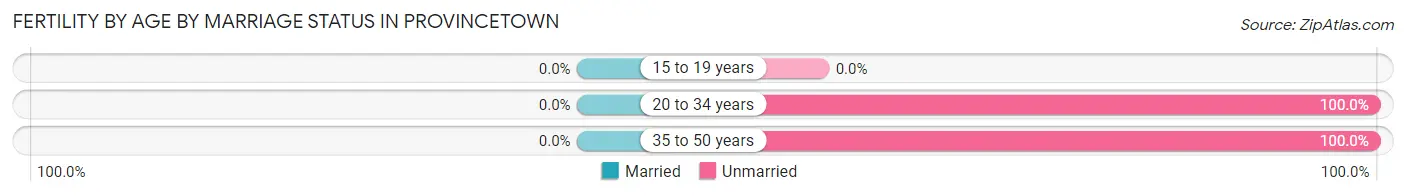
| Age Bracket | Married | Unmarried |
| 15 to 19 years | 0 (0.0%) | 0 (0.0%) |
| 20 to 34 years | 0 (0.0%) | 2 (100.0%) |
| 35 to 50 years | 0 (0.0%) | 11 (100.0%) |
| Total | 0 (0.0%) | 13 (100.0%) |
Fertility by Education in Provincetown
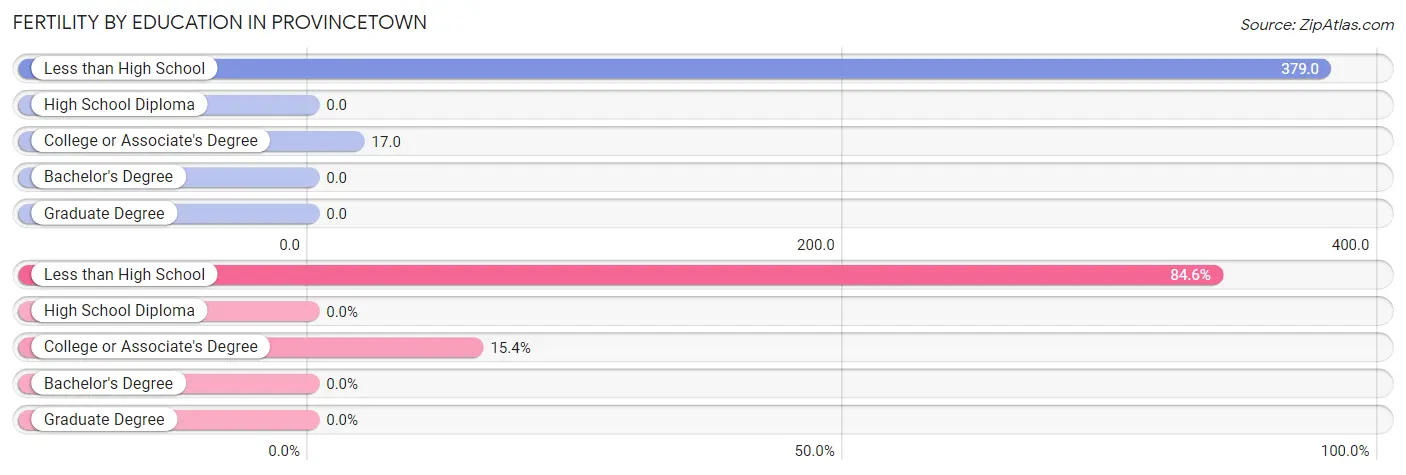
| Educational Attainment | Women with Births | Births / 1,000 Women |
| Less than High School | 11 (84.6%) | 379.0 |
| High School Diploma | 0 (0.0%) | 0.0 |
| College or Associate's Degree | 2 (15.4%) | 17.0 |
| Bachelor's Degree | 0 (0.0%) | 0.0 |
| Graduate Degree | 0 (0.0%) | 0.0 |
| Total | 13 (100.0%) | 40.0 |
Fertility by Education by Marriage Status in Provincetown
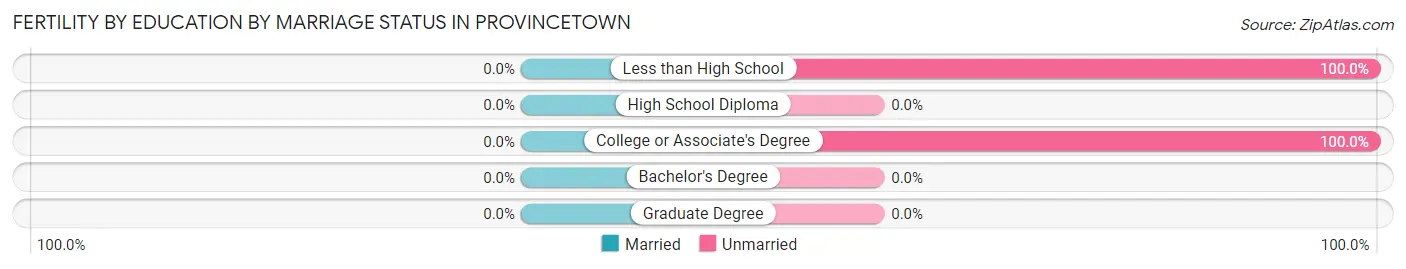
| Educational Attainment | Married | Unmarried |
| Less than High School | 0 (0.0%) | 11 (100.0%) |
| High School Diploma | 0 (0.0%) | 0 (0.0%) |
| College or Associate's Degree | 0 (0.0%) | 2 (100.0%) |
| Bachelor's Degree | 0 (0.0%) | 0 (0.0%) |
| Graduate Degree | 0 (0.0%) | 0 (0.0%) |
| Total | 0 (0.0%) | 13 (100.0%) |
Employment Characteristics in Provincetown
Employment by Class of Employer in Provincetown
Among the 1,926 employed individuals in Provincetown, private company employees (1,085 | 56.3%), self-employed (incorporated) (277 | 14.4%), and self-employed (not incorporated) (189 | 9.8%) make up the most common classes of employment.
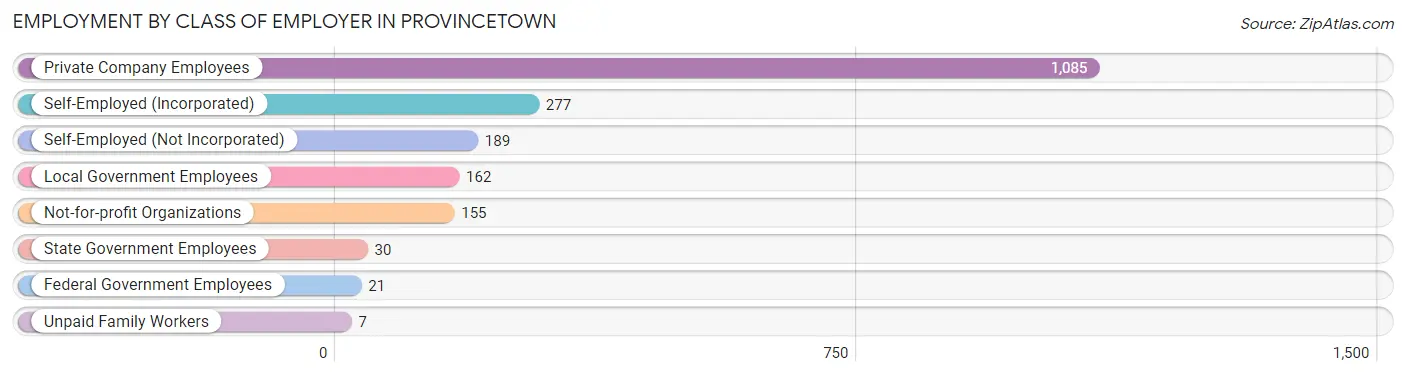
| Employer Class | # Employees | % Employees |
| Private Company Employees | 1,085 | 56.3% |
| Self-Employed (Incorporated) | 277 | 14.4% |
| Self-Employed (Not Incorporated) | 189 | 9.8% |
| Not-for-profit Organizations | 155 | 8.1% |
| Local Government Employees | 162 | 8.4% |
| State Government Employees | 30 | 1.6% |
| Federal Government Employees | 21 | 1.1% |
| Unpaid Family Workers | 7 | 0.4% |
| Total | 1,926 | 100.0% |
Employment Status by Age in Provincetown
According to the labor force statistics for Provincetown, out of the total population over 16 years of age (3,162), 67.8% or 2,144 individuals are in the labor force, with 8.3% or 178 of them unemployed. The age group with the highest labor force participation rate is 20 to 24 years, with 100.0% or 48 individuals in the labor force. Within the labor force, the 65 to 74 years age range has the highest percentage of unemployed individuals, with 25.2% or 63 of them being unemployed.
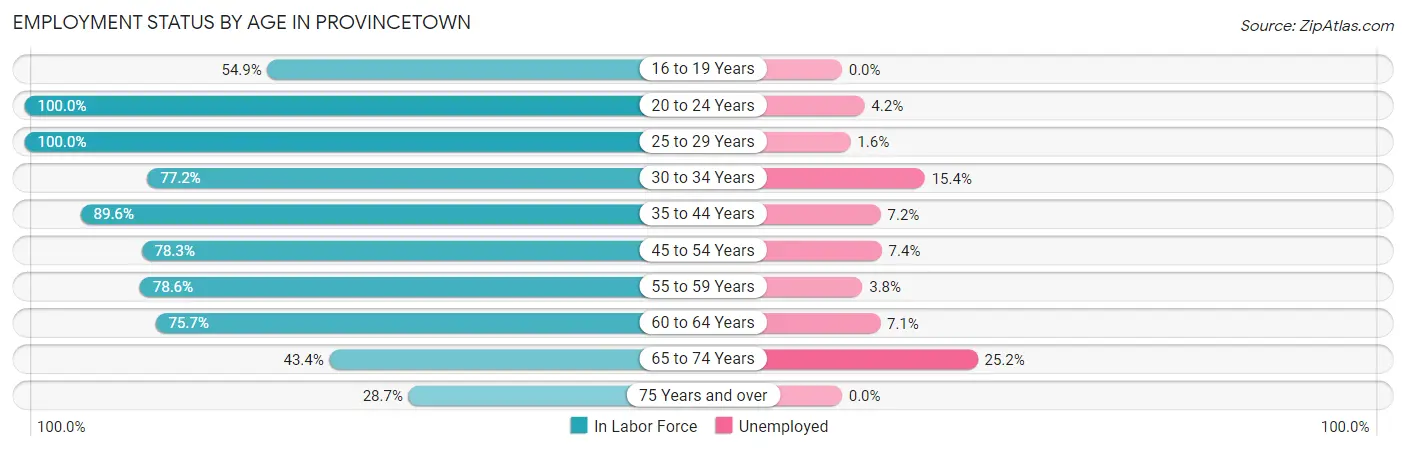
| Age Bracket | In Labor Force | Unemployed |
| 16 to 19 Years | 39 (54.9%) | 0 (0.0%) |
| 20 to 24 Years | 48 (100.0%) | 2 (4.2%) |
| 25 to 29 Years | 128 (100.0%) | 2 (1.6%) |
| 30 to 34 Years | 156 (77.2%) | 24 (15.4%) |
| 35 to 44 Years | 318 (89.6%) | 23 (7.2%) |
| 45 to 54 Years | 419 (78.3%) | 31 (7.4%) |
| 55 to 59 Years | 425 (78.6%) | 16 (3.8%) |
| 60 to 64 Years | 255 (75.7%) | 18 (7.1%) |
| 65 to 74 Years | 250 (43.4%) | 63 (25.2%) |
| 75 Years and over | 106 (28.7%) | 0 (0.0%) |
| Total | 2,144 (67.8%) | 178 (8.3%) |
Employment Status by Educational Attainment in Provincetown
According to labor force statistics for Provincetown, 81.1% of individuals (1,701) out of the total population between 25 and 64 years of age (2,098) are in the labor force, with 6.7% or 114 of them being unemployed. The group with the highest labor force participation rate are those with the educational attainment of less than high school, with 100.0% or 60 individuals in the labor force. Within the labor force, individuals with less than high school education have the highest percentage of unemployment, with 33.3% or 20 of them being unemployed.
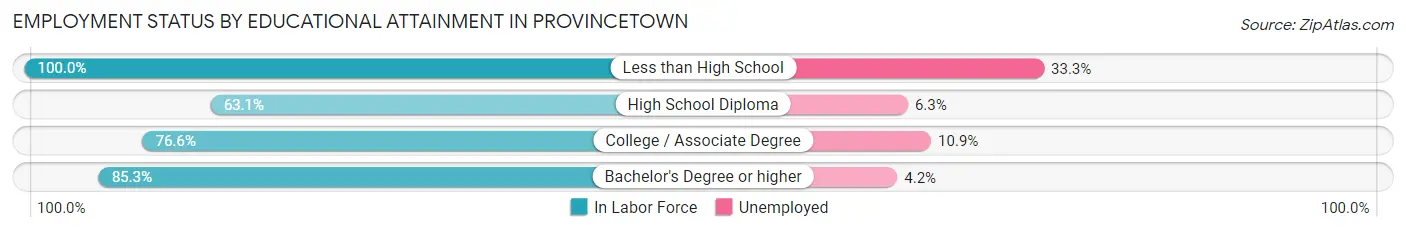
| Educational Attainment | In Labor Force | Unemployed |
| Less than High School | 60 (100.0%) | 20 (33.3%) |
| High School Diploma | 176 (63.1%) | 18 (6.3%) |
| College / Associate Degree | 311 (76.6%) | 44 (10.9%) |
| Bachelor's Degree or higher | 1,154 (85.3%) | 57 (4.2%) |
| Total | 1,701 (81.1%) | 141 (6.7%) |
Employment Occupations by Sex in Provincetown
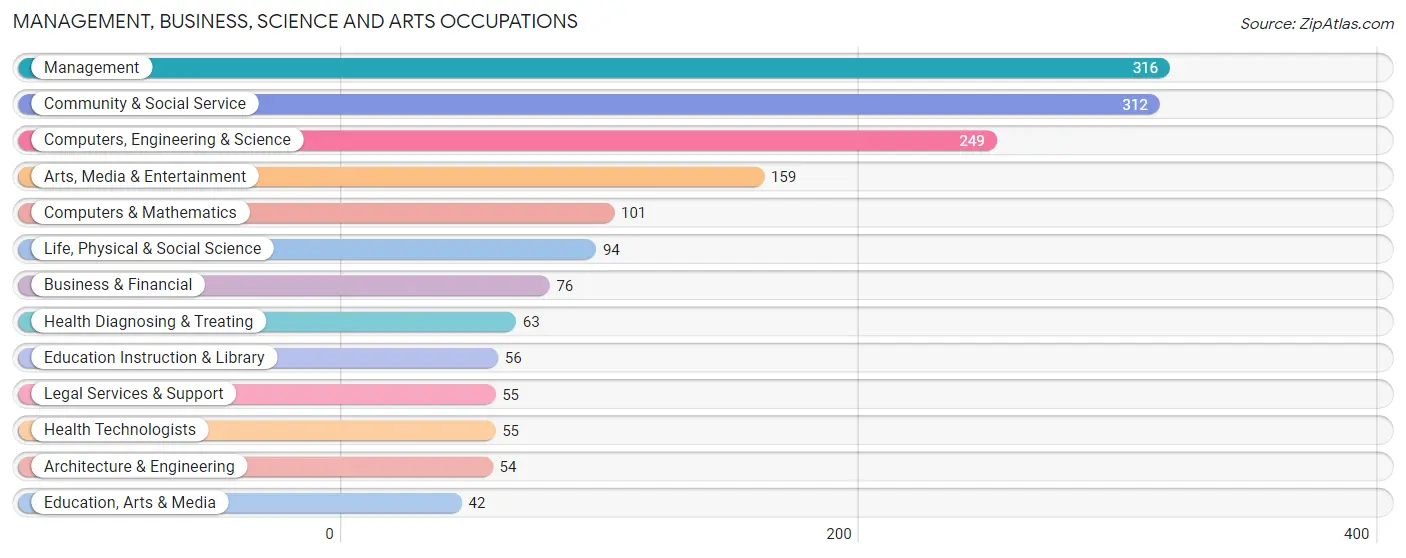
Management, Business, Science and Arts Occupations
The most common Management, Business, Science and Arts occupations in Provincetown are Management (316 | 16.1%), Community & Social Service (312 | 15.9%), Computers, Engineering & Science (249 | 12.7%), Arts, Media & Entertainment (159 | 8.1%), and Computers & Mathematics (101 | 5.1%).
Management, Business, Science and Arts Occupations by Sex
Within the Management, Business, Science and Arts occupations in Provincetown, the most male-oriented occupations are Architecture & Engineering (100.0%), Legal Services & Support (100.0%), and Computers, Engineering & Science (84.7%), while the most female-oriented occupations are Business & Financial (85.5%), Education, Arts & Media (76.2%), and Education Instruction & Library (66.1%).
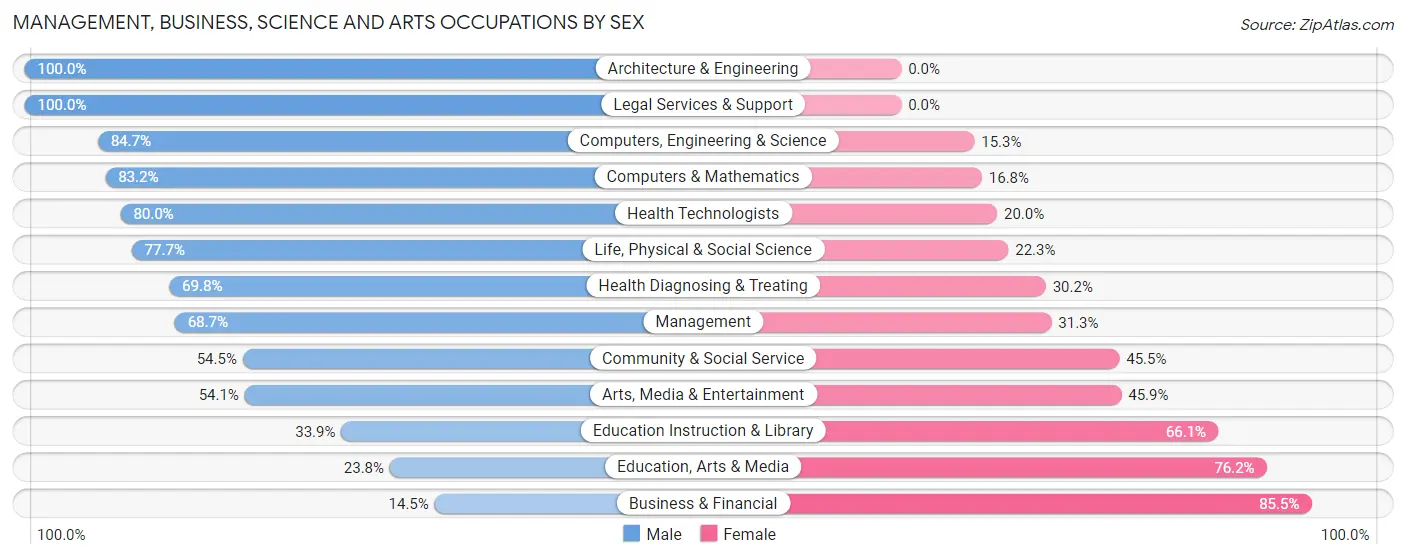
| Occupation | Male | Female |
| Management | 217 (68.7%) | 99 (31.3%) |
| Business & Financial | 11 (14.5%) | 65 (85.5%) |
| Computers, Engineering & Science | 211 (84.7%) | 38 (15.3%) |
| Computers & Mathematics | 84 (83.2%) | 17 (16.8%) |
| Architecture & Engineering | 54 (100.0%) | 0 (0.0%) |
| Life, Physical & Social Science | 73 (77.7%) | 21 (22.3%) |
| Community & Social Service | 170 (54.5%) | 142 (45.5%) |
| Education, Arts & Media | 10 (23.8%) | 32 (76.2%) |
| Legal Services & Support | 55 (100.0%) | 0 (0.0%) |
| Education Instruction & Library | 19 (33.9%) | 37 (66.1%) |
| Arts, Media & Entertainment | 86 (54.1%) | 73 (45.9%) |
| Health Diagnosing & Treating | 44 (69.8%) | 19 (30.2%) |
| Health Technologists | 44 (80.0%) | 11 (20.0%) |
| Total (Category) | 653 (64.3%) | 363 (35.7%) |
| Total (Overall) | 1,323 (67.3%) | 642 (32.7%) |
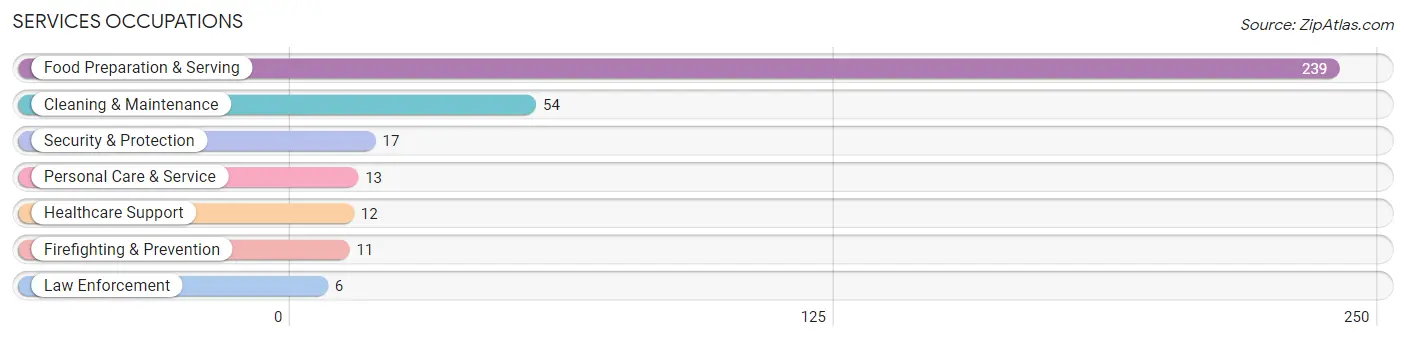
Services Occupations
The most common Services occupations in Provincetown are Food Preparation & Serving (239 | 12.2%), Cleaning & Maintenance (54 | 2.8%), Security & Protection (17 | 0.9%), Personal Care & Service (13 | 0.7%), and Healthcare Support (12 | 0.6%).
Services Occupations by Sex
Within the Services occupations in Provincetown, the most male-oriented occupations are Law Enforcement (100.0%), Personal Care & Service (100.0%), and Food Preparation & Serving (79.9%), while the most female-oriented occupations are Healthcare Support (100.0%), Firefighting & Prevention (100.0%), and Security & Protection (64.7%).
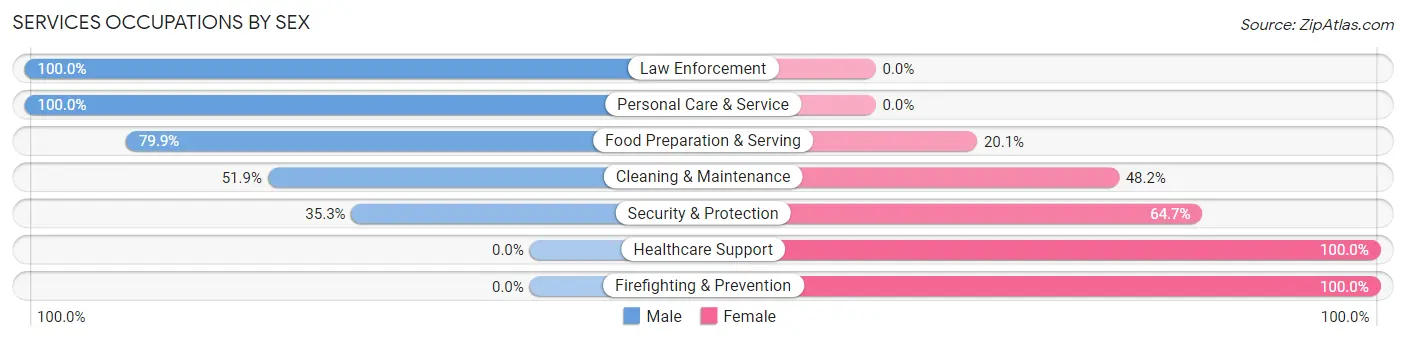
| Occupation | Male | Female |
| Healthcare Support | 0 (0.0%) | 12 (100.0%) |
| Security & Protection | 6 (35.3%) | 11 (64.7%) |
| Firefighting & Prevention | 0 (0.0%) | 11 (100.0%) |
| Law Enforcement | 6 (100.0%) | 0 (0.0%) |
| Food Preparation & Serving | 191 (79.9%) | 48 (20.1%) |
| Cleaning & Maintenance | 28 (51.8%) | 26 (48.1%) |
| Personal Care & Service | 13 (100.0%) | 0 (0.0%) |
| Total (Category) | 238 (71.0%) | 97 (29.0%) |
| Total (Overall) | 1,323 (67.3%) | 642 (32.7%) |
Sales and Office Occupations
The most common Sales and Office occupations in Provincetown are Office & Administration (165 | 8.4%), and Sales & Related (155 | 7.9%).

Sales and Office Occupations by Sex

| Occupation | Male | Female |
| Sales & Related | 97 (62.6%) | 58 (37.4%) |
| Office & Administration | 96 (58.2%) | 69 (41.8%) |
| Total (Category) | 193 (60.3%) | 127 (39.7%) |
| Total (Overall) | 1,323 (67.3%) | 642 (32.7%) |
Natural Resources, Construction and Maintenance Occupations
The most common Natural Resources, Construction and Maintenance occupations in Provincetown are Construction & Extraction (88 | 4.5%), and Installation, Maintenance & Repair (65 | 3.3%).

Natural Resources, Construction and Maintenance Occupations by Sex

| Occupation | Male | Female |
| Farming, Fishing & Forestry | 0 (0.0%) | 0 (0.0%) |
| Construction & Extraction | 88 (100.0%) | 0 (0.0%) |
| Installation, Maintenance & Repair | 65 (100.0%) | 0 (0.0%) |
| Total (Category) | 153 (100.0%) | 0 (0.0%) |
| Total (Overall) | 1,323 (67.3%) | 642 (32.7%) |
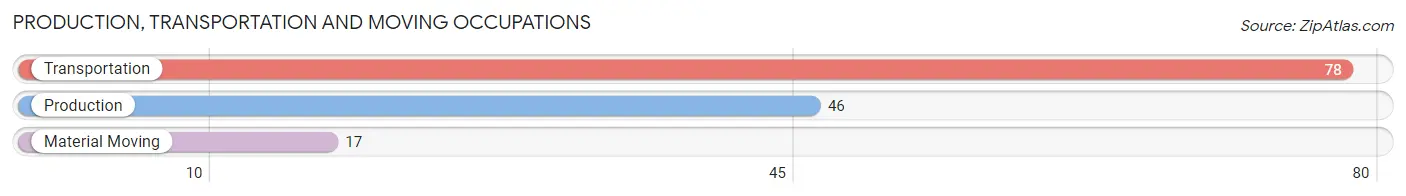
Production, Transportation and Moving Occupations
The most common Production, Transportation and Moving occupations in Provincetown are Transportation (78 | 4.0%), Production (46 | 2.3%), and Material Moving (17 | 0.9%).
Production, Transportation and Moving Occupations by Sex

| Occupation | Male | Female |
| Production | 15 (32.6%) | 31 (67.4%) |
| Transportation | 54 (69.2%) | 24 (30.8%) |
| Material Moving | 17 (100.0%) | 0 (0.0%) |
| Total (Category) | 86 (61.0%) | 55 (39.0%) |
| Total (Overall) | 1,323 (67.3%) | 642 (32.7%) |
Employment Industries by Sex in Provincetown
Employment Industries in Provincetown
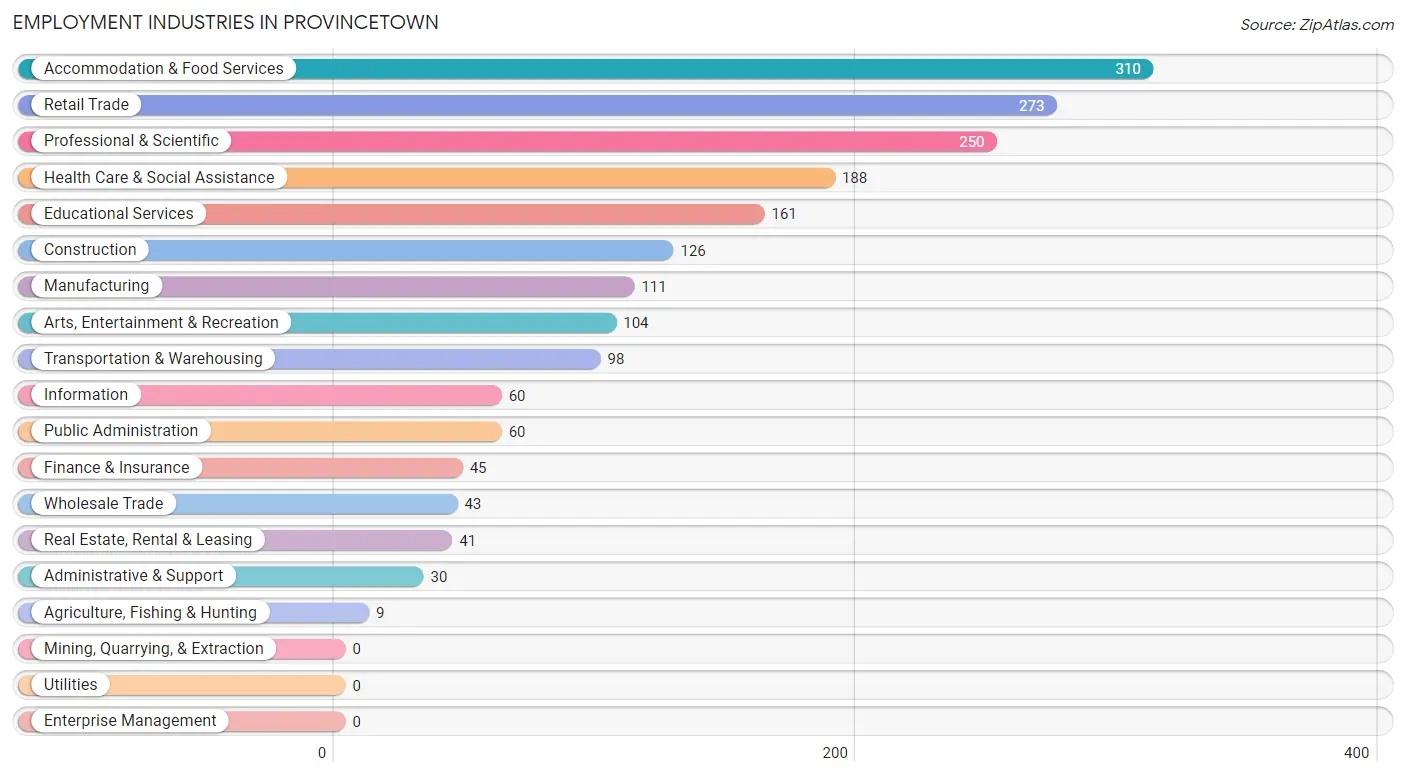
The major employment industries in Provincetown include Accommodation & Food Services (310 | 15.8%), Retail Trade (273 | 13.9%), Professional & Scientific (250 | 12.7%), Health Care & Social Assistance (188 | 9.6%), and Educational Services (161 | 8.2%).
Employment Industries by Sex in Provincetown
The Provincetown industries that see more men than women are Agriculture, Fishing & Hunting (100.0%), Construction (100.0%), and Information (90.0%), whereas the industries that tend to have a higher number of women are Finance & Insurance (48.9%), Wholesale Trade (48.8%), and Retail Trade (47.6%).
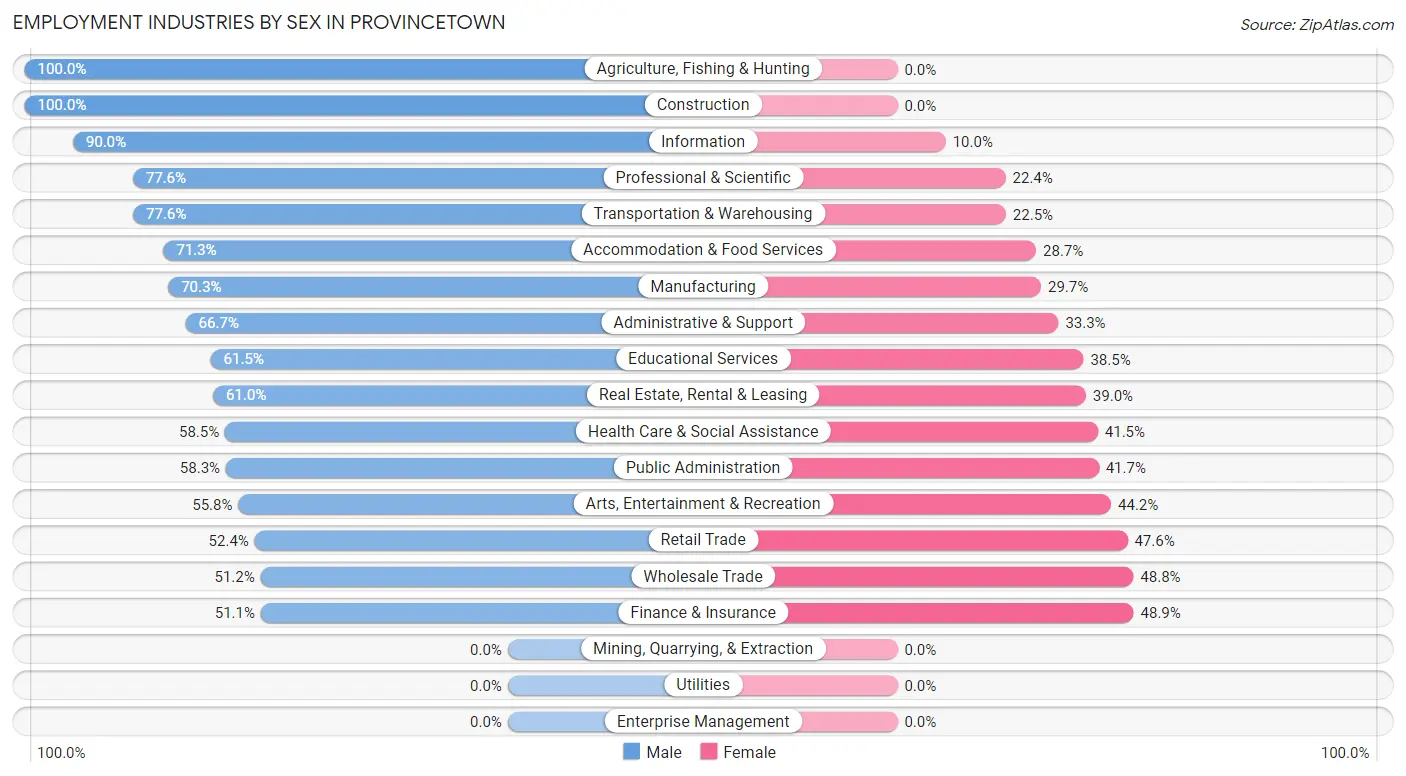
| Industry | Male | Female |
| Agriculture, Fishing & Hunting | 9 (100.0%) | 0 (0.0%) |
| Mining, Quarrying, & Extraction | 0 (0.0%) | 0 (0.0%) |
| Construction | 126 (100.0%) | 0 (0.0%) |
| Manufacturing | 78 (70.3%) | 33 (29.7%) |
| Wholesale Trade | 22 (51.2%) | 21 (48.8%) |
| Retail Trade | 143 (52.4%) | 130 (47.6%) |
| Transportation & Warehousing | 76 (77.5%) | 22 (22.5%) |
| Utilities | 0 (0.0%) | 0 (0.0%) |
| Information | 54 (90.0%) | 6 (10.0%) |
| Finance & Insurance | 23 (51.1%) | 22 (48.9%) |
| Real Estate, Rental & Leasing | 25 (61.0%) | 16 (39.0%) |
| Professional & Scientific | 194 (77.6%) | 56 (22.4%) |
| Enterprise Management | 0 (0.0%) | 0 (0.0%) |
| Administrative & Support | 20 (66.7%) | 10 (33.3%) |
| Educational Services | 99 (61.5%) | 62 (38.5%) |
| Health Care & Social Assistance | 110 (58.5%) | 78 (41.5%) |
| Arts, Entertainment & Recreation | 58 (55.8%) | 46 (44.2%) |
| Accommodation & Food Services | 221 (71.3%) | 89 (28.7%) |
| Public Administration | 35 (58.3%) | 25 (41.7%) |
| Total | 1,323 (67.3%) | 642 (32.7%) |
Education in Provincetown
School Enrollment in Provincetown
The most common levels of schooling among the 345 students in Provincetown are high school (80 | 23.2%), middle school (63 | 18.3%), and graduate / professional (61 | 17.7%).
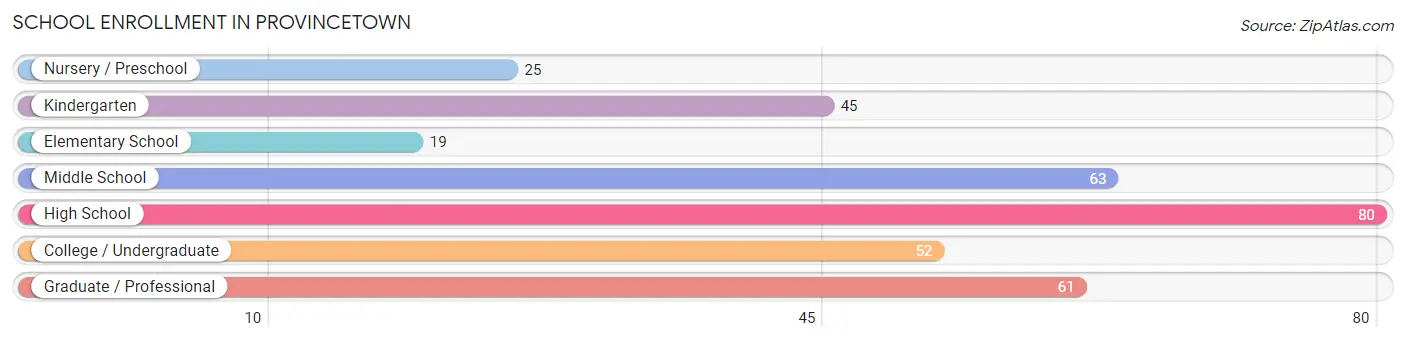
| School Level | # Students | % Students |
| Nursery / Preschool | 25 | 7.2% |
| Kindergarten | 45 | 13.0% |
| Elementary School | 19 | 5.5% |
| Middle School | 63 | 18.3% |
| High School | 80 | 23.2% |
| College / Undergraduate | 52 | 15.1% |
| Graduate / Professional | 61 | 17.7% |
| Total | 345 | 100.0% |
School Enrollment by Age by Funding Source in Provincetown
Out of a total of 345 students who are enrolled in schools in Provincetown, 84 (24.3%) attend a private institution, while the remaining 261 (75.7%) are enrolled in public schools. The age group of 3 to 4 year olds has the highest likelihood of being enrolled in private schools, with 9 (100.0% in the age bracket) enrolled. Conversely, the age group of 5 to 9 year old has the lowest likelihood of being enrolled in a private school, with 80 (100.0% in the age bracket) attending a public institution.
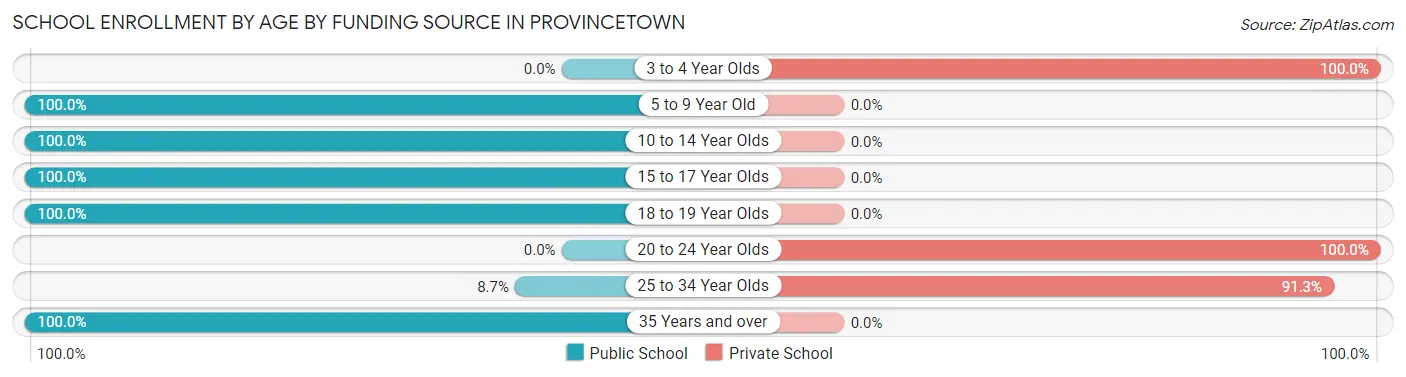
| Age Bracket | Public School | Private School |
| 3 to 4 Year Olds | 0 (0.0%) | 9 (100.0%) |
| 5 to 9 Year Old | 80 (100.0%) | 0 (0.0%) |
| 10 to 14 Year Olds | 43 (100.0%) | 0 (0.0%) |
| 15 to 17 Year Olds | 61 (100.0%) | 0 (0.0%) |
| 18 to 19 Year Olds | 42 (100.0%) | 0 (0.0%) |
| 20 to 24 Year Olds | 0 (0.0%) | 33 (100.0%) |
| 25 to 34 Year Olds | 4 (8.7%) | 42 (91.3%) |
| 35 Years and over | 31 (100.0%) | 0 (0.0%) |
| Total | 261 (75.7%) | 84 (24.3%) |
Educational Attainment by Field of Study in Provincetown
Visual & performing arts (418 | 19.8%), business (351 | 16.6%), literature & languages (235 | 11.1%), social sciences (200 | 9.5%), and science & technology (143 | 6.8%) are the most common fields of study among 2,115 individuals in Provincetown who have obtained a bachelor's degree or higher.
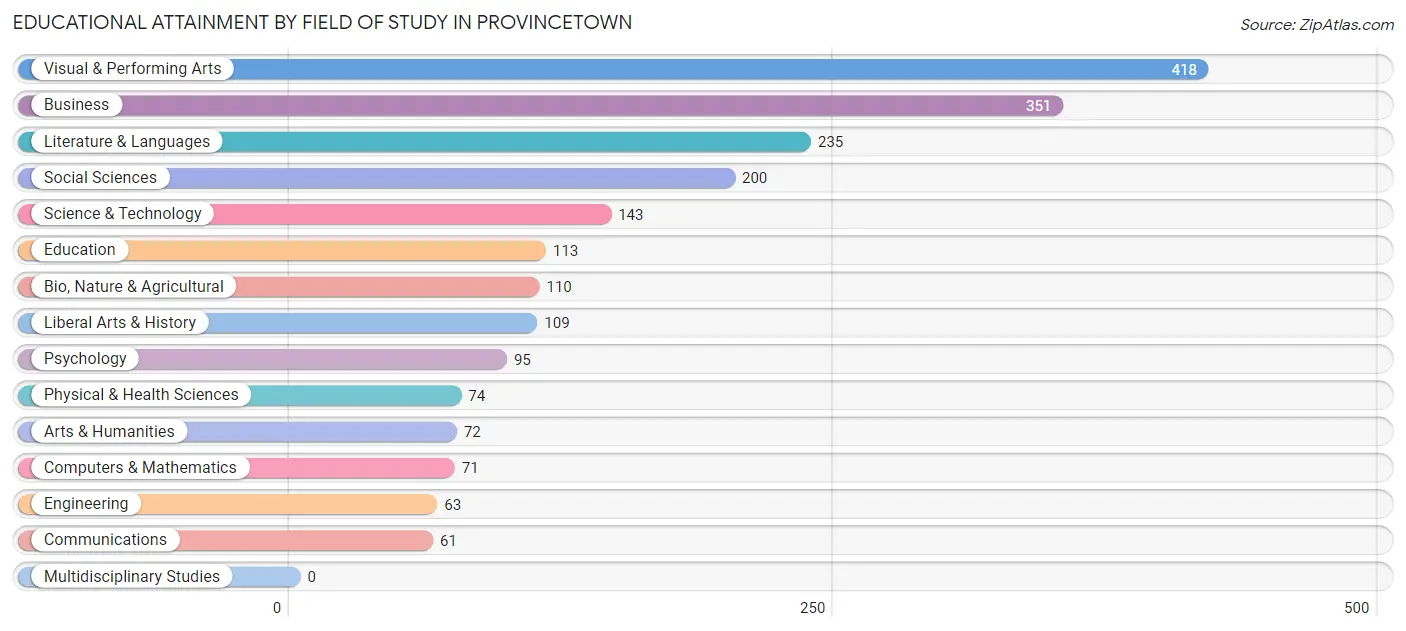
| Field of Study | # Graduates | % Graduates |
| Computers & Mathematics | 71 | 3.4% |
| Bio, Nature & Agricultural | 110 | 5.2% |
| Physical & Health Sciences | 74 | 3.5% |
| Psychology | 95 | 4.5% |
| Social Sciences | 200 | 9.5% |
| Engineering | 63 | 3.0% |
| Multidisciplinary Studies | 0 | 0.0% |
| Science & Technology | 143 | 6.8% |
| Business | 351 | 16.6% |
| Education | 113 | 5.3% |
| Literature & Languages | 235 | 11.1% |
| Liberal Arts & History | 109 | 5.1% |
| Visual & Performing Arts | 418 | 19.8% |
| Communications | 61 | 2.9% |
| Arts & Humanities | 72 | 3.4% |
| Total | 2,115 | 100.0% |
Transportation & Commute in Provincetown
Vehicle Availability by Sex in Provincetown
The most prevalent vehicle ownership categories in Provincetown are males with 1 vehicle (726, accounting for 55.5%) and females with 1 vehicle (244, making up 118.6%).
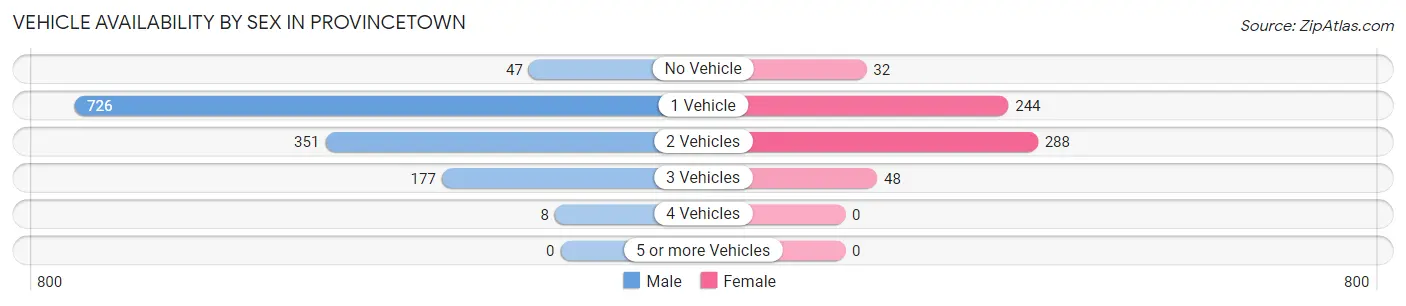
| Vehicles Available | Male | Female |
| No Vehicle | 47 (3.6%) | 32 (5.2%) |
| 1 Vehicle | 726 (55.5%) | 244 (39.9%) |
| 2 Vehicles | 351 (26.8%) | 288 (47.1%) |
| 3 Vehicles | 177 (13.5%) | 48 (7.8%) |
| 4 Vehicles | 8 (0.6%) | 0 (0.0%) |
| 5 or more Vehicles | 0 (0.0%) | 0 (0.0%) |
| Total | 1,309 (100.0%) | 612 (100.0%) |
Commute Time in Provincetown
The most frequently occuring commute durations in Provincetown are 5 to 9 minutes (503 commuters, 41.7%), 10 to 14 minutes (224 commuters, 18.6%), and less than 5 minutes (179 commuters, 14.8%).
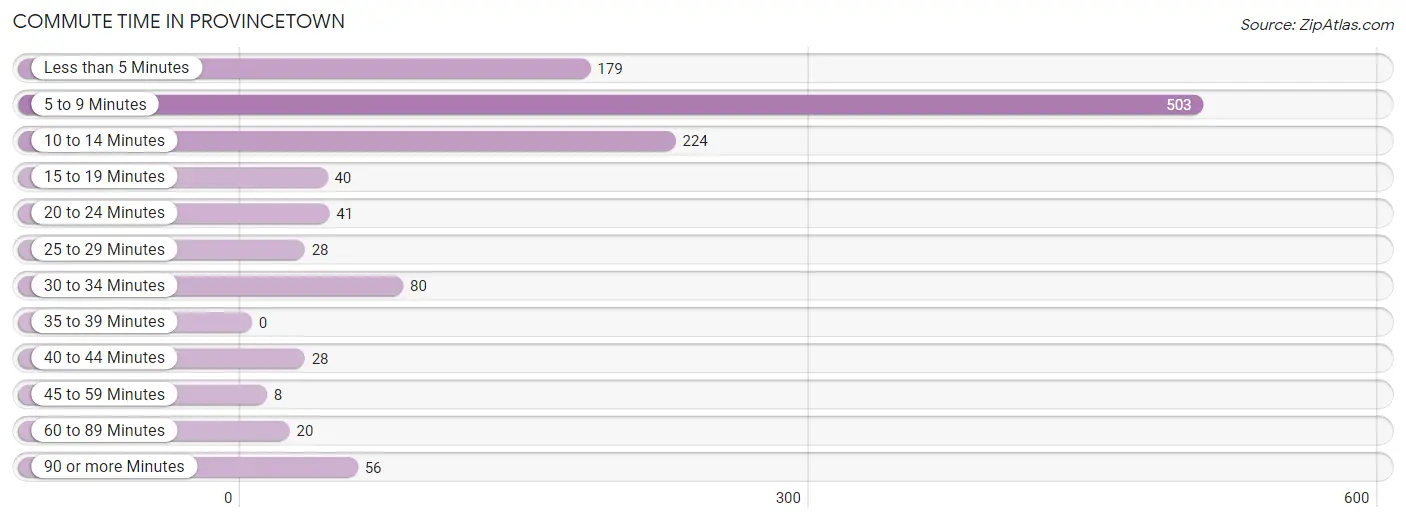
| Commute Time | # Commuters | % Commuters |
| Less than 5 Minutes | 179 | 14.8% |
| 5 to 9 Minutes | 503 | 41.7% |
| 10 to 14 Minutes | 224 | 18.6% |
| 15 to 19 Minutes | 40 | 3.3% |
| 20 to 24 Minutes | 41 | 3.4% |
| 25 to 29 Minutes | 28 | 2.3% |
| 30 to 34 Minutes | 80 | 6.6% |
| 35 to 39 Minutes | 0 | 0.0% |
| 40 to 44 Minutes | 28 | 2.3% |
| 45 to 59 Minutes | 8 | 0.7% |
| 60 to 89 Minutes | 20 | 1.7% |
| 90 or more Minutes | 56 | 4.6% |
Commute Time by Sex in Provincetown
The most common commute times in Provincetown are 5 to 9 minutes (301 commuters, 38.7%) for males and 5 to 9 minutes (202 commuters, 47.0%) for females.
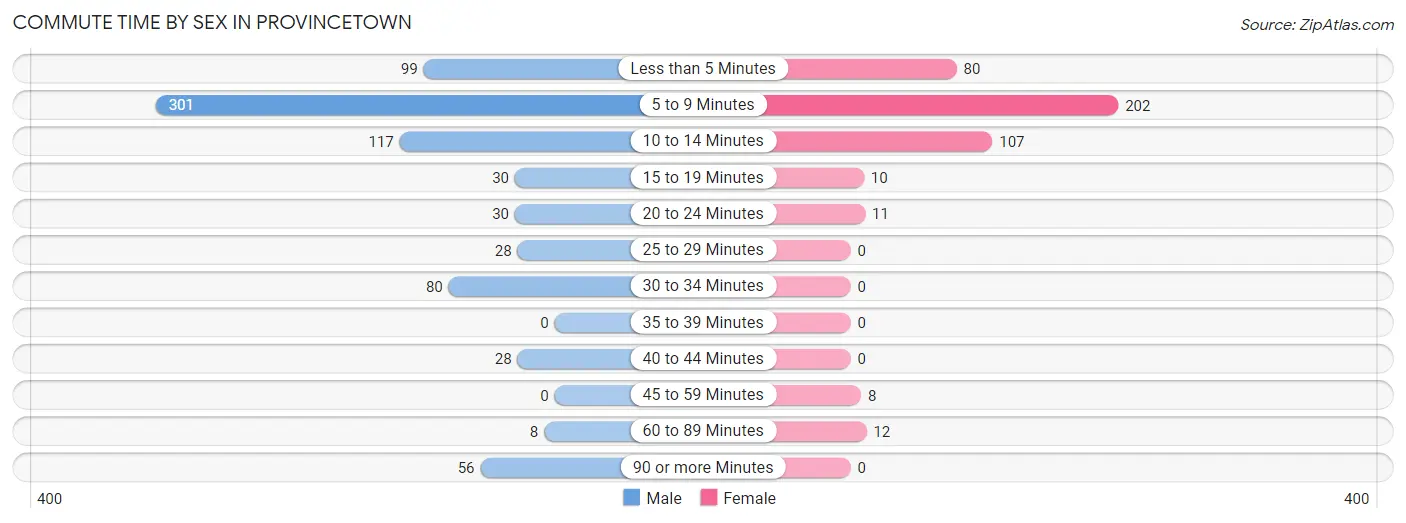
| Commute Time | Male | Female |
| Less than 5 Minutes | 99 (12.7%) | 80 (18.6%) |
| 5 to 9 Minutes | 301 (38.7%) | 202 (47.0%) |
| 10 to 14 Minutes | 117 (15.1%) | 107 (24.9%) |
| 15 to 19 Minutes | 30 (3.9%) | 10 (2.3%) |
| 20 to 24 Minutes | 30 (3.9%) | 11 (2.6%) |
| 25 to 29 Minutes | 28 (3.6%) | 0 (0.0%) |
| 30 to 34 Minutes | 80 (10.3%) | 0 (0.0%) |
| 35 to 39 Minutes | 0 (0.0%) | 0 (0.0%) |
| 40 to 44 Minutes | 28 (3.6%) | 0 (0.0%) |
| 45 to 59 Minutes | 0 (0.0%) | 8 (1.9%) |
| 60 to 89 Minutes | 8 (1.0%) | 12 (2.8%) |
| 90 or more Minutes | 56 (7.2%) | 0 (0.0%) |
Time of Departure to Work by Sex in Provincetown
The most frequent times of departure to work in Provincetown are 8:00 AM to 8:29 AM (165, 21.2%) for males and 7:30 AM to 7:59 AM (115, 26.7%) for females.
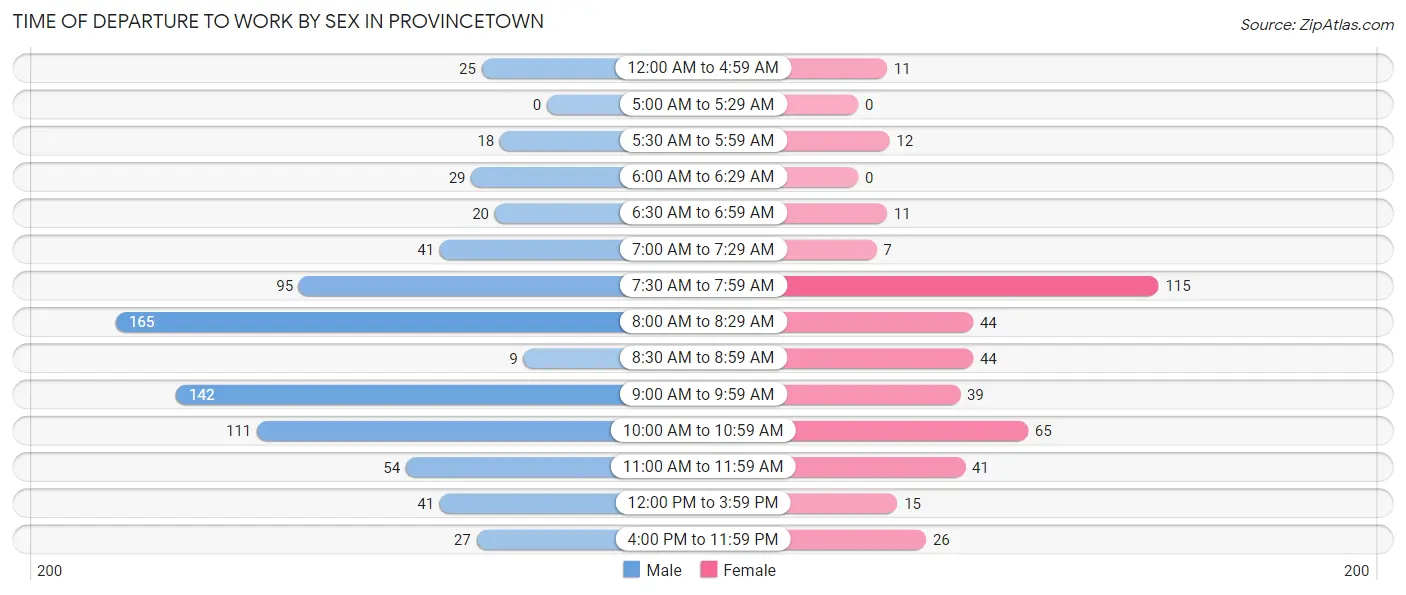
| Time of Departure | Male | Female |
| 12:00 AM to 4:59 AM | 25 (3.2%) | 11 (2.6%) |
| 5:00 AM to 5:29 AM | 0 (0.0%) | 0 (0.0%) |
| 5:30 AM to 5:59 AM | 18 (2.3%) | 12 (2.8%) |
| 6:00 AM to 6:29 AM | 29 (3.7%) | 0 (0.0%) |
| 6:30 AM to 6:59 AM | 20 (2.6%) | 11 (2.6%) |
| 7:00 AM to 7:29 AM | 41 (5.3%) | 7 (1.6%) |
| 7:30 AM to 7:59 AM | 95 (12.2%) | 115 (26.7%) |
| 8:00 AM to 8:29 AM | 165 (21.2%) | 44 (10.2%) |
| 8:30 AM to 8:59 AM | 9 (1.2%) | 44 (10.2%) |
| 9:00 AM to 9:59 AM | 142 (18.3%) | 39 (9.1%) |
| 10:00 AM to 10:59 AM | 111 (14.3%) | 65 (15.1%) |
| 11:00 AM to 11:59 AM | 54 (7.0%) | 41 (9.5%) |
| 12:00 PM to 3:59 PM | 41 (5.3%) | 15 (3.5%) |
| 4:00 PM to 11:59 PM | 27 (3.5%) | 26 (6.0%) |
| Total | 777 (100.0%) | 430 (100.0%) |
Housing Occupancy in Provincetown
Occupancy by Ownership in Provincetown
Of the total 1,890 dwellings in Provincetown, owner-occupied units account for 1,419 (75.1%), while renter-occupied units make up 471 (24.9%).
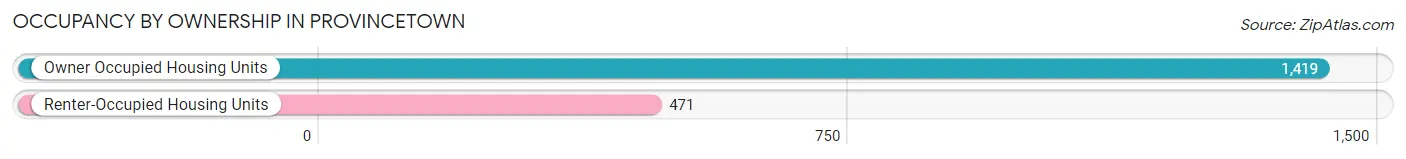
| Occupancy | # Housing Units | % Housing Units |
| Owner Occupied Housing Units | 1,419 | 75.1% |
| Renter-Occupied Housing Units | 471 | 24.9% |
| Total Occupied Housing Units | 1,890 | 100.0% |
Occupancy by Household Size in Provincetown
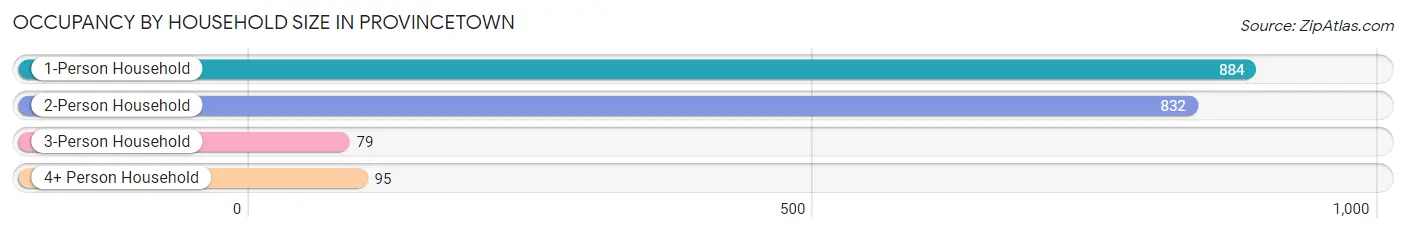
| Household Size | # Housing Units | % Housing Units |
| 1-Person Household | 884 | 46.8% |
| 2-Person Household | 832 | 44.0% |
| 3-Person Household | 79 | 4.2% |
| 4+ Person Household | 95 | 5.0% |
| Total Housing Units | 1,890 | 100.0% |
Occupancy by Ownership by Household Size in Provincetown
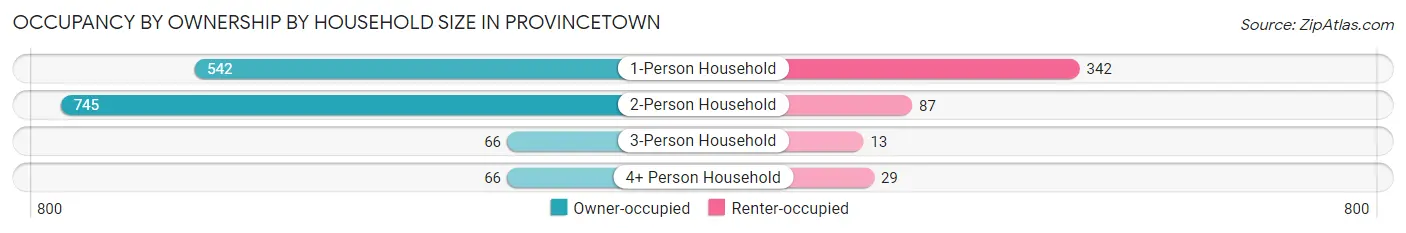
| Household Size | Owner-occupied | Renter-occupied |
| 1-Person Household | 542 (61.3%) | 342 (38.7%) |
| 2-Person Household | 745 (89.5%) | 87 (10.5%) |
| 3-Person Household | 66 (83.5%) | 13 (16.5%) |
| 4+ Person Household | 66 (69.5%) | 29 (30.5%) |
| Total Housing Units | 1,419 (75.1%) | 471 (24.9%) |
Occupancy by Educational Attainment in Provincetown
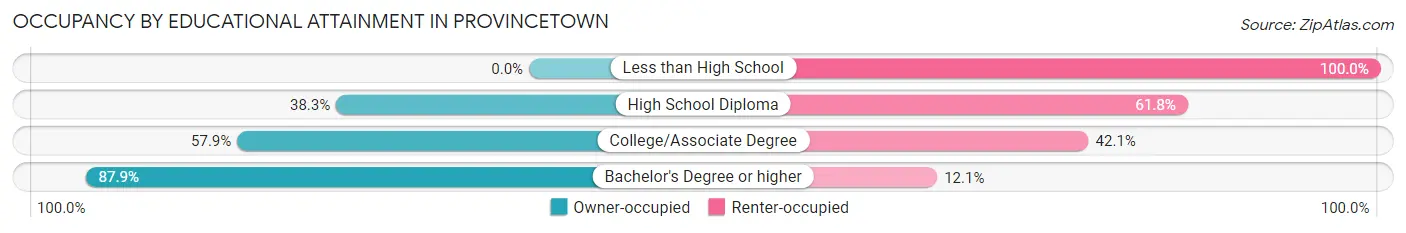
| Household Size | Owner-occupied | Renter-occupied |
| Less than High School | 0 (0.0%) | 44 (100.0%) |
| High School Diploma | 70 (38.3%) | 113 (61.8%) |
| College/Associate Degree | 217 (57.9%) | 158 (42.1%) |
| Bachelor's Degree or higher | 1,132 (87.9%) | 156 (12.1%) |
Occupancy by Age of Householder in Provincetown
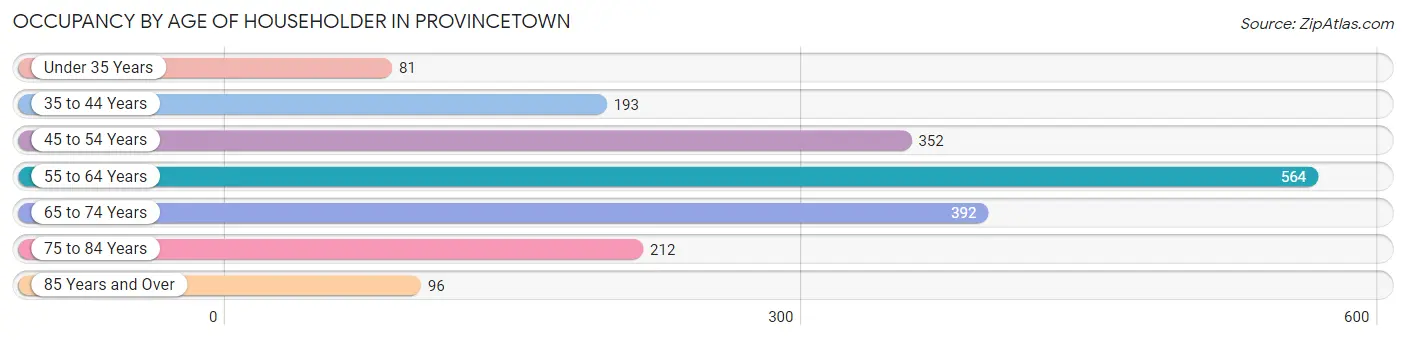
| Age Bracket | # Households | % Households |
| Under 35 Years | 81 | 4.3% |
| 35 to 44 Years | 193 | 10.2% |
| 45 to 54 Years | 352 | 18.6% |
| 55 to 64 Years | 564 | 29.8% |
| 65 to 74 Years | 392 | 20.7% |
| 75 to 84 Years | 212 | 11.2% |
| 85 Years and Over | 96 | 5.1% |
| Total | 1,890 | 100.0% |
Housing Finances in Provincetown
Median Income by Occupancy in Provincetown
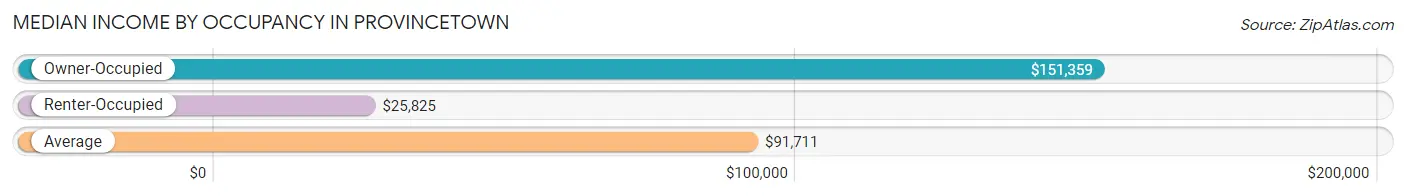
| Occupancy Type | # Households | Median Income |
| Owner-Occupied | 1,419 (75.1%) | $151,359 |
| Renter-Occupied | 471 (24.9%) | $25,825 |
| Average | 1,890 (100.0%) | $91,711 |
Occupancy by Householder Income Bracket in Provincetown
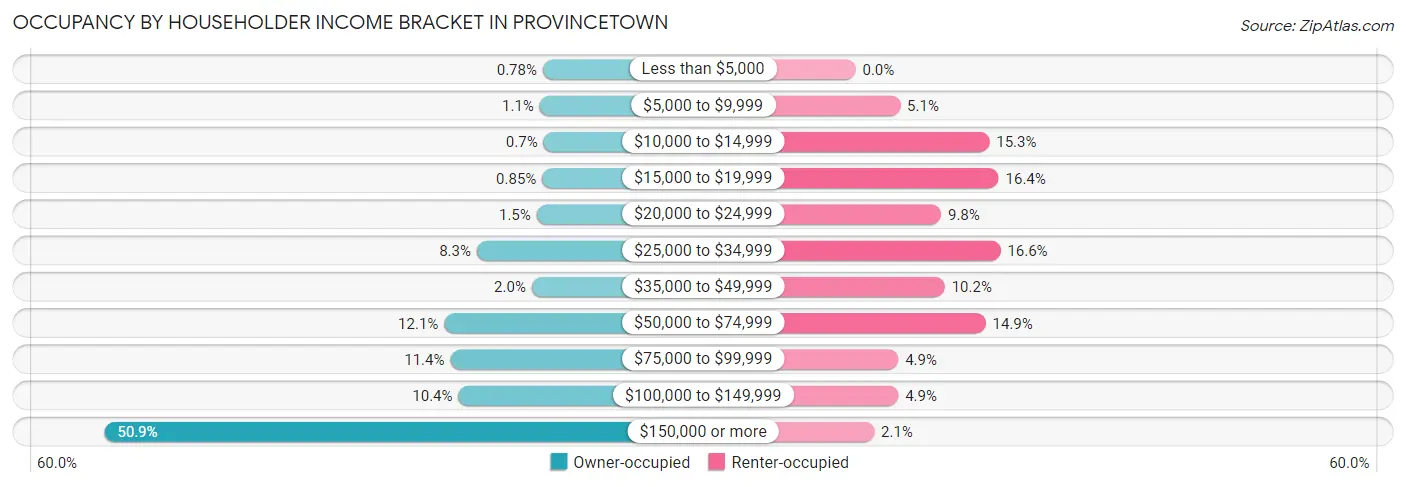
| Income Bracket | Owner-occupied | Renter-occupied |
| Less than $5,000 | 11 (0.8%) | 0 (0.0%) |
| $5,000 to $9,999 | 16 (1.1%) | 24 (5.1%) |
| $10,000 to $14,999 | 10 (0.7%) | 72 (15.3%) |
| $15,000 to $19,999 | 12 (0.9%) | 77 (16.4%) |
| $20,000 to $24,999 | 21 (1.5%) | 46 (9.8%) |
| $25,000 to $34,999 | 118 (8.3%) | 78 (16.6%) |
| $35,000 to $49,999 | 29 (2.0%) | 48 (10.2%) |
| $50,000 to $74,999 | 171 (12.0%) | 70 (14.9%) |
| $75,000 to $99,999 | 161 (11.4%) | 23 (4.9%) |
| $100,000 to $149,999 | 148 (10.4%) | 23 (4.9%) |
| $150,000 or more | 722 (50.9%) | 10 (2.1%) |
| Total | 1,419 (100.0%) | 471 (100.0%) |
Monthly Housing Cost Tiers in Provincetown
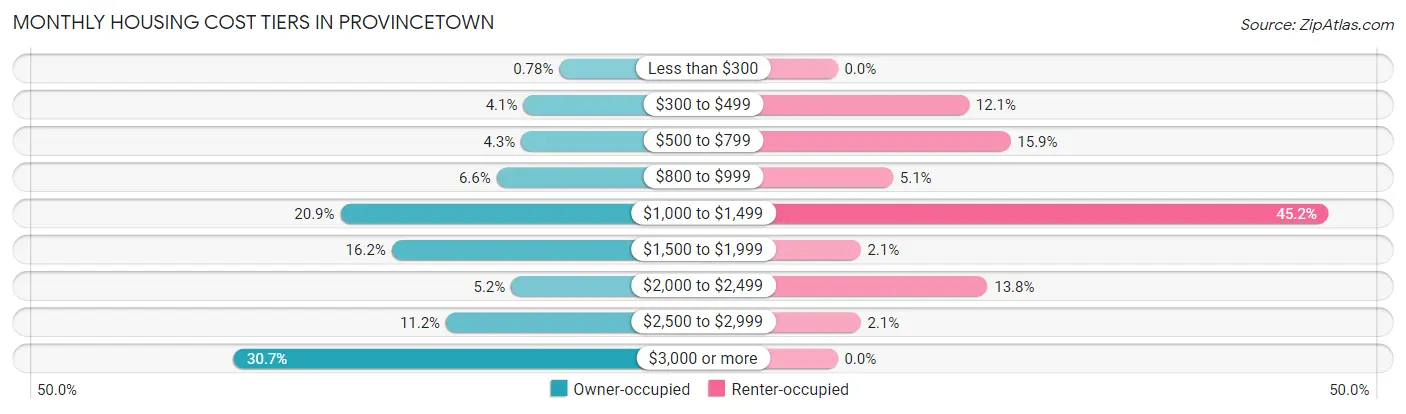
| Monthly Cost | Owner-occupied | Renter-occupied |
| Less than $300 | 11 (0.8%) | 0 (0.0%) |
| $300 to $499 | 58 (4.1%) | 57 (12.1%) |
| $500 to $799 | 61 (4.3%) | 75 (15.9%) |
| $800 to $999 | 93 (6.6%) | 24 (5.1%) |
| $1,000 to $1,499 | 297 (20.9%) | 213 (45.2%) |
| $1,500 to $1,999 | 230 (16.2%) | 10 (2.1%) |
| $2,000 to $2,499 | 74 (5.2%) | 65 (13.8%) |
| $2,500 to $2,999 | 159 (11.2%) | 10 (2.1%) |
| $3,000 or more | 436 (30.7%) | 0 (0.0%) |
| Total | 1,419 (100.0%) | 471 (100.0%) |
Physical Housing Characteristics in Provincetown
Housing Structures in Provincetown
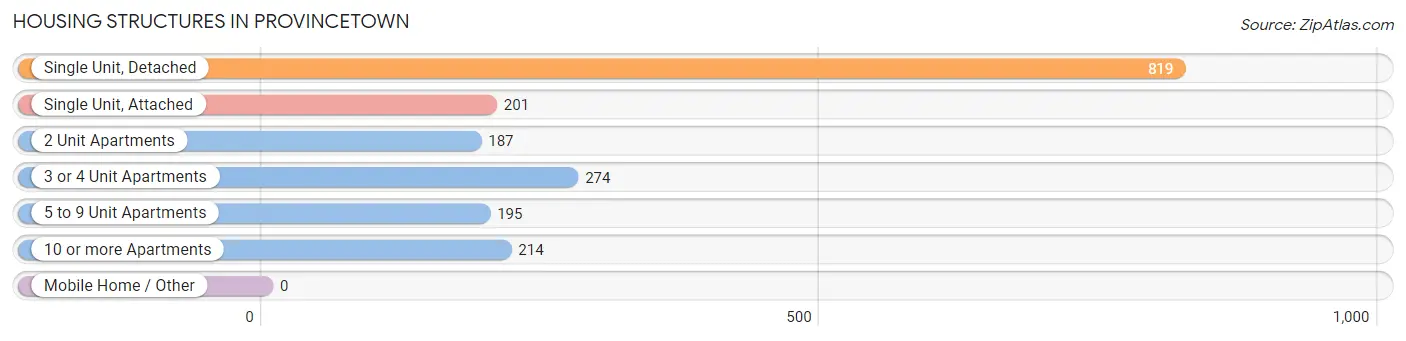
| Structure Type | # Housing Units | % Housing Units |
| Single Unit, Detached | 819 | 43.3% |
| Single Unit, Attached | 201 | 10.6% |
| 2 Unit Apartments | 187 | 9.9% |
| 3 or 4 Unit Apartments | 274 | 14.5% |
| 5 to 9 Unit Apartments | 195 | 10.3% |
| 10 or more Apartments | 214 | 11.3% |
| Mobile Home / Other | 0 | 0.0% |
| Total | 1,890 | 100.0% |
Housing Structures by Occupancy in Provincetown
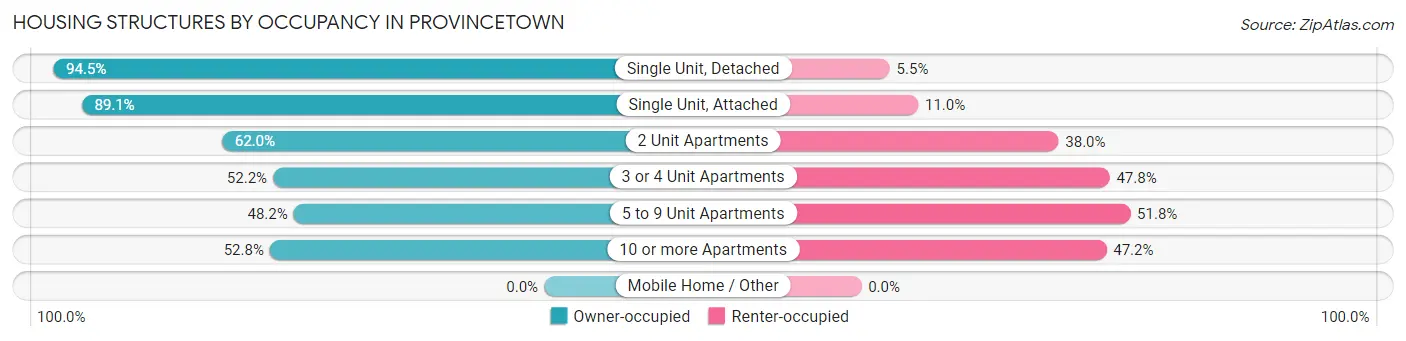
| Structure Type | Owner-occupied | Renter-occupied |
| Single Unit, Detached | 774 (94.5%) | 45 (5.5%) |
| Single Unit, Attached | 179 (89.0%) | 22 (11.0%) |
| 2 Unit Apartments | 116 (62.0%) | 71 (38.0%) |
| 3 or 4 Unit Apartments | 143 (52.2%) | 131 (47.8%) |
| 5 to 9 Unit Apartments | 94 (48.2%) | 101 (51.8%) |
| 10 or more Apartments | 113 (52.8%) | 101 (47.2%) |
| Mobile Home / Other | 0 (0.0%) | 0 (0.0%) |
| Total | 1,419 (75.1%) | 471 (24.9%) |
Housing Structures by Number of Rooms in Provincetown
| Number of Rooms | Owner-occupied | Renter-occupied |
| 1 Room | 35 (2.5%) | 20 (4.3%) |
| 2 or 3 Rooms | 221 (15.6%) | 288 (61.2%) |
| 4 or 5 Rooms | 446 (31.4%) | 121 (25.7%) |
| 6 or 7 Rooms | 320 (22.6%) | 29 (6.2%) |
| 8 or more Rooms | 397 (28.0%) | 13 (2.8%) |
| Total | 1,419 (100.0%) | 471 (100.0%) |
Housing Structure by Heating Type in Provincetown
| Heating Type | Owner-occupied | Renter-occupied |
| Utility Gas | 281 (19.8%) | 127 (27.0%) |
| Bottled, Tank, or LP Gas | 339 (23.9%) | 136 (28.9%) |
| Electricity | 327 (23.0%) | 144 (30.6%) |
| Fuel Oil or Kerosene | 358 (25.2%) | 45 (9.6%) |
| Coal or Coke | 0 (0.0%) | 0 (0.0%) |
| All other Fuels | 114 (8.0%) | 10 (2.1%) |
| No Fuel Used | 0 (0.0%) | 9 (1.9%) |
| Total | 1,419 (100.0%) | 471 (100.0%) |
Household Vehicle Usage in Provincetown
| Vehicles per Household | Owner-occupied | Renter-occupied |
| No Vehicle | 94 (6.6%) | 151 (32.1%) |
| 1 Vehicle | 763 (53.8%) | 270 (57.3%) |
| 2 Vehicles | 416 (29.3%) | 50 (10.6%) |
| 3 or more Vehicles | 146 (10.3%) | 0 (0.0%) |
| Total | 1,419 (100.0%) | 471 (100.0%) |
Real Estate & Mortgages in Provincetown
Real Estate and Mortgage Overview in Provincetown
| Characteristic | Without Mortgage | With Mortgage |
| Housing Units | 436 | 983 |
| Median Property Value | $860,400 | $745,300 |
| Median Household Income | $96,471 | $564 |
| Monthly Housing Costs | $1,063 | $407 |
| Real Estate Taxes | $5,740 | $0 |
Property Value by Mortgage Status in Provincetown
| Property Value | Without Mortgage | With Mortgage |
| Less than $50,000 | 23 (5.3%) | 0 (0.0%) |
| $50,000 to $99,999 | 0 (0.0%) | 25 (2.5%) |
| $100,000 to $299,999 | 18 (4.1%) | 49 (5.0%) |
| $300,000 to $499,999 | 56 (12.8%) | 130 (13.2%) |
| $500,000 to $749,999 | 72 (16.5%) | 293 (29.8%) |
| $750,000 to $999,999 | 111 (25.5%) | 141 (14.3%) |
| $1,000,000 or more | 156 (35.8%) | 345 (35.1%) |
| Total | 436 (100.0%) | 983 (100.0%) |
Household Income by Mortgage Status in Provincetown
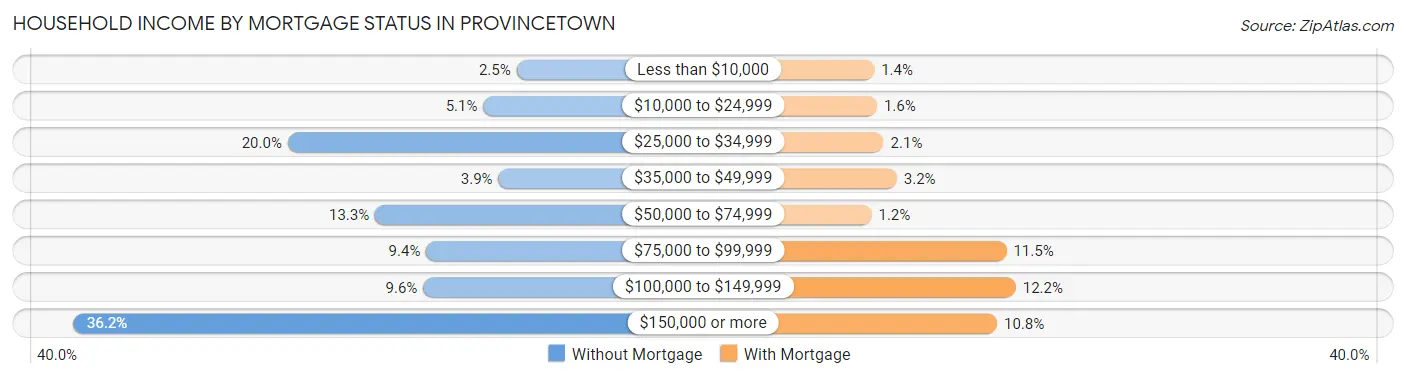
| Household Income | Without Mortgage | With Mortgage |
| Less than $10,000 | 11 (2.5%) | 14 (1.4%) |
| $10,000 to $24,999 | 22 (5.1%) | 16 (1.6%) |
| $25,000 to $34,999 | 87 (20.0%) | 21 (2.1%) |
| $35,000 to $49,999 | 17 (3.9%) | 31 (3.2%) |
| $50,000 to $74,999 | 58 (13.3%) | 12 (1.2%) |
| $75,000 to $99,999 | 41 (9.4%) | 113 (11.5%) |
| $100,000 to $149,999 | 42 (9.6%) | 120 (12.2%) |
| $150,000 or more | 158 (36.2%) | 106 (10.8%) |
| Total | 436 (100.0%) | 983 (100.0%) |
Property Value to Household Income Ratio in Provincetown
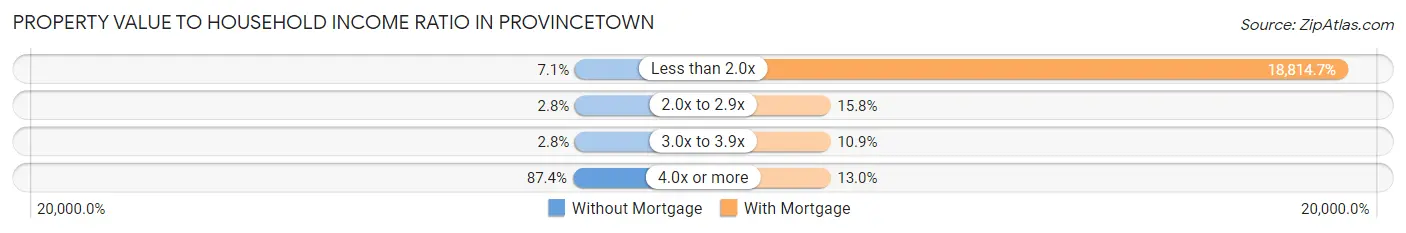
| Value-to-Income Ratio | Without Mortgage | With Mortgage |
| Less than 2.0x | 31 (7.1%) | 184,948 (18,814.7%) |
| 2.0x to 2.9x | 12 (2.8%) | 155 (15.8%) |
| 3.0x to 3.9x | 12 (2.8%) | 107 (10.9%) |
| 4.0x or more | 381 (87.4%) | 128 (13.0%) |
| Total | 436 (100.0%) | 983 (100.0%) |
Real Estate Taxes by Mortgage Status in Provincetown

| Property Taxes | Without Mortgage | With Mortgage |
| Less than $800 | 33 (7.6%) | 0 (0.0%) |
| $800 to $1,499 | 0 (0.0%) | 25 (2.5%) |
| $800 to $1,499 | 369 (84.6%) | 19 (1.9%) |
| Total | 436 (100.0%) | 983 (100.0%) |
Health & Disability in Provincetown
Health Insurance Coverage by Age in Provincetown
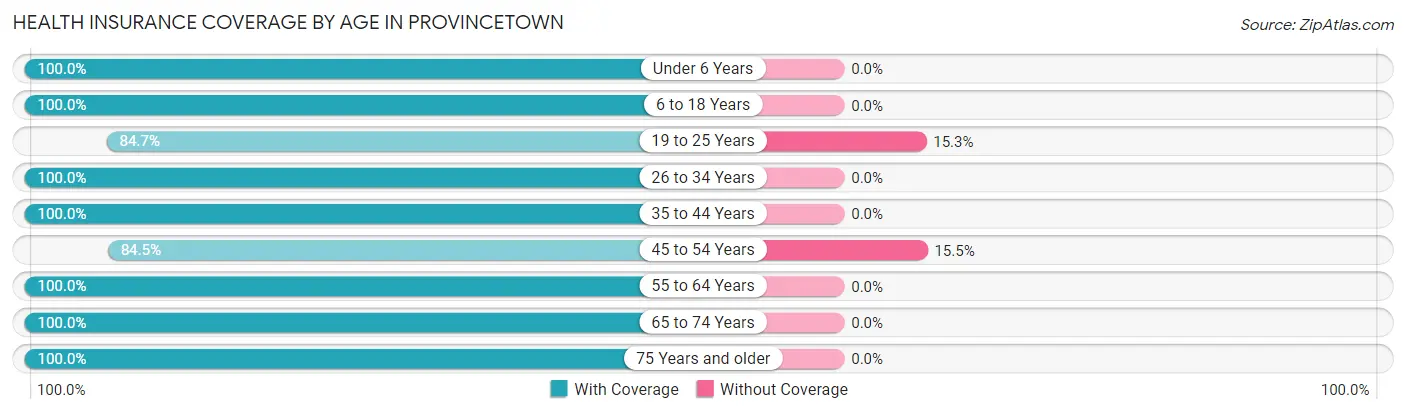
| Age Bracket | With Coverage | Without Coverage |
| Under 6 Years | 132 (100.0%) | 0 (0.0%) |
| 6 to 18 Years | 207 (100.0%) | 0 (0.0%) |
| 19 to 25 Years | 72 (84.7%) | 13 (15.3%) |
| 26 to 34 Years | 296 (100.0%) | 0 (0.0%) |
| 35 to 44 Years | 355 (100.0%) | 0 (0.0%) |
| 45 to 54 Years | 452 (84.5%) | 83 (15.5%) |
| 55 to 64 Years | 878 (100.0%) | 0 (0.0%) |
| 65 to 74 Years | 568 (100.0%) | 0 (0.0%) |
| 75 Years and older | 369 (100.0%) | 0 (0.0%) |
| Total | 3,329 (97.2%) | 96 (2.8%) |
Health Insurance Coverage by Citizenship Status in Provincetown

| Citizenship Status | With Coverage | Without Coverage |
| Native Born | 132 (100.0%) | 0 (0.0%) |
| Foreign Born, Citizen | 207 (100.0%) | 0 (0.0%) |
| Foreign Born, not a Citizen | 72 (84.7%) | 13 (15.3%) |
Health Insurance Coverage by Household Income in Provincetown

| Household Income | With Coverage | Without Coverage |
| Under $25,000 | 450 (100.0%) | 0 (0.0%) |
| $25,000 to $49,999 | 387 (100.0%) | 0 (0.0%) |
| $50,000 to $74,999 | 491 (93.3%) | 35 (6.7%) |
| $75,000 to $99,999 | 274 (100.0%) | 0 (0.0%) |
| $100,000 and over | 1,715 (96.6%) | 61 (3.4%) |
Public vs Private Health Insurance Coverage by Age in Provincetown
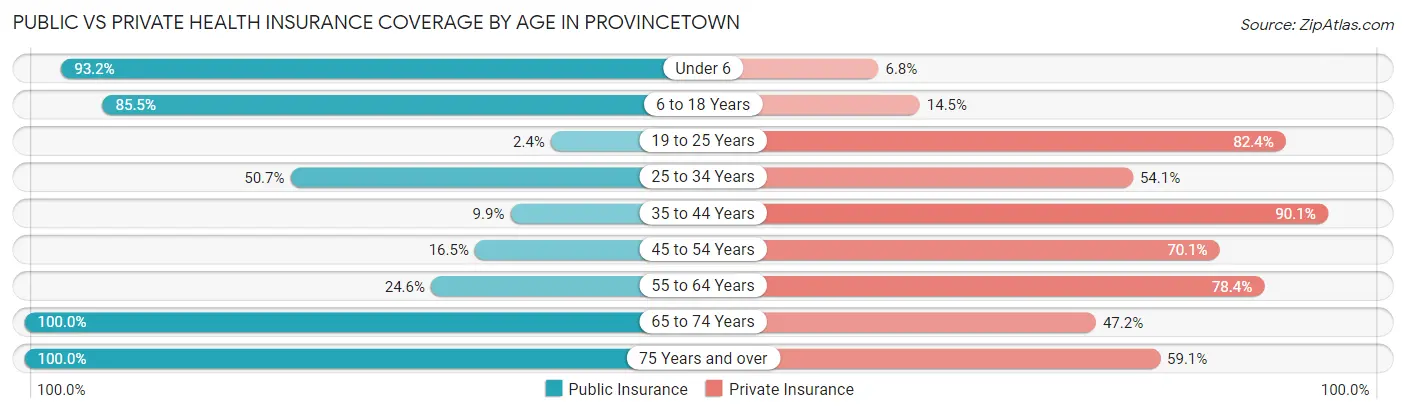
| Age Bracket | Public Insurance | Private Insurance |
| Under 6 | 123 (93.2%) | 9 (6.8%) |
| 6 to 18 Years | 177 (85.5%) | 30 (14.5%) |
| 19 to 25 Years | 2 (2.4%) | 70 (82.4%) |
| 25 to 34 Years | 150 (50.7%) | 160 (54.0%) |
| 35 to 44 Years | 35 (9.9%) | 320 (90.1%) |
| 45 to 54 Years | 88 (16.5%) | 375 (70.1%) |
| 55 to 64 Years | 216 (24.6%) | 688 (78.4%) |
| 65 to 74 Years | 568 (100.0%) | 268 (47.2%) |
| 75 Years and over | 369 (100.0%) | 218 (59.1%) |
| Total | 1,728 (50.4%) | 2,138 (62.4%) |
Disability Status by Sex by Age in Provincetown
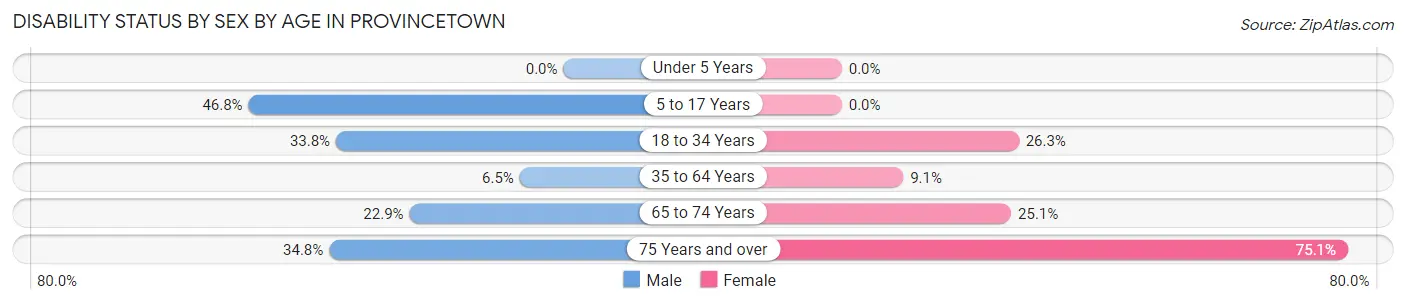
| Age Bracket | Male | Female |
| Under 5 Years | 0 (0.0%) | 0 (0.0%) |
| 5 to 17 Years | 65 (46.8%) | 0 (0.0%) |
| 18 to 34 Years | 102 (33.8%) | 31 (26.3%) |
| 35 to 64 Years | 77 (6.5%) | 53 (9.1%) |
| 65 to 74 Years | 48 (22.9%) | 90 (25.1%) |
| 75 Years and over | 64 (34.8%) | 139 (75.1%) |
Disability Class by Sex by Age in Provincetown
Disability Class: Hearing Difficulty
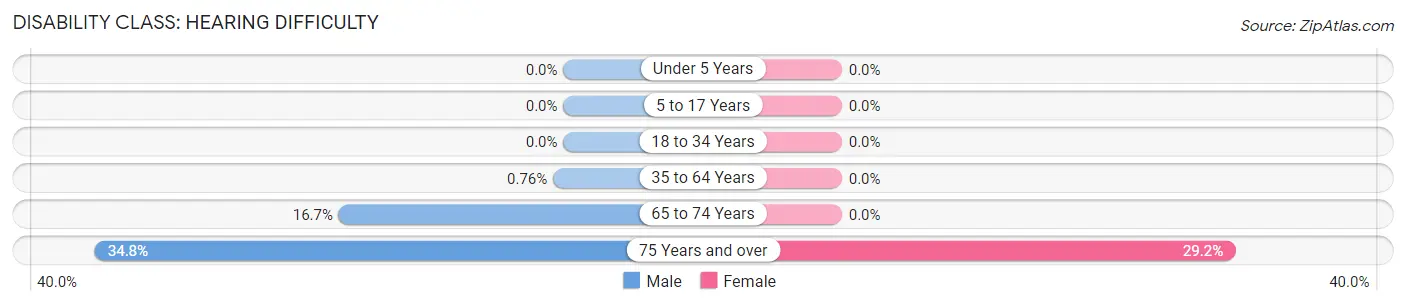
| Age Bracket | Male | Female |
| Under 5 Years | 0 (0.0%) | 0 (0.0%) |
| 5 to 17 Years | 0 (0.0%) | 0 (0.0%) |
| 18 to 34 Years | 0 (0.0%) | 0 (0.0%) |
| 35 to 64 Years | 9 (0.8%) | 0 (0.0%) |
| 65 to 74 Years | 35 (16.7%) | 0 (0.0%) |
| 75 Years and over | 64 (34.8%) | 54 (29.2%) |
Disability Class: Vision Difficulty
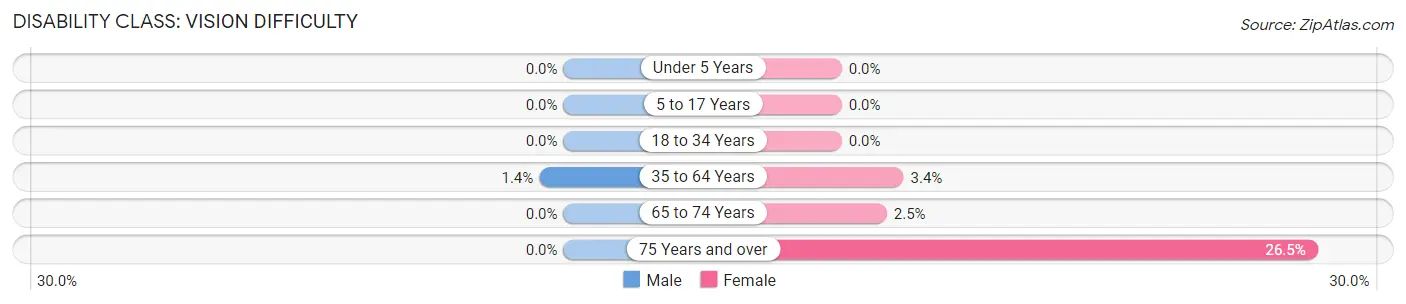
| Age Bracket | Male | Female |
| Under 5 Years | 0 (0.0%) | 0 (0.0%) |
| 5 to 17 Years | 0 (0.0%) | 0 (0.0%) |
| 18 to 34 Years | 0 (0.0%) | 0 (0.0%) |
| 35 to 64 Years | 16 (1.3%) | 20 (3.4%) |
| 65 to 74 Years | 0 (0.0%) | 9 (2.5%) |
| 75 Years and over | 0 (0.0%) | 49 (26.5%) |
Disability Class: Cognitive Difficulty
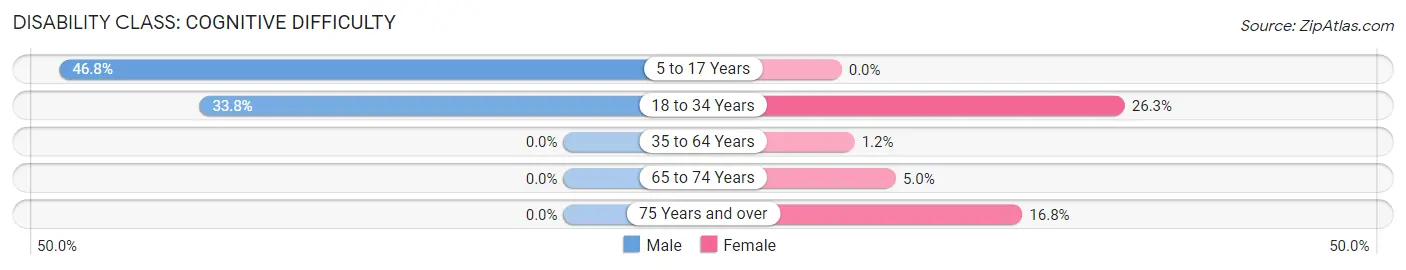
| Age Bracket | Male | Female |
| 5 to 17 Years | 65 (46.8%) | 0 (0.0%) |
| 18 to 34 Years | 102 (33.8%) | 31 (26.3%) |
| 35 to 64 Years | 0 (0.0%) | 7 (1.2%) |
| 65 to 74 Years | 0 (0.0%) | 18 (5.0%) |
| 75 Years and over | 0 (0.0%) | 31 (16.8%) |
Disability Class: Ambulatory Difficulty
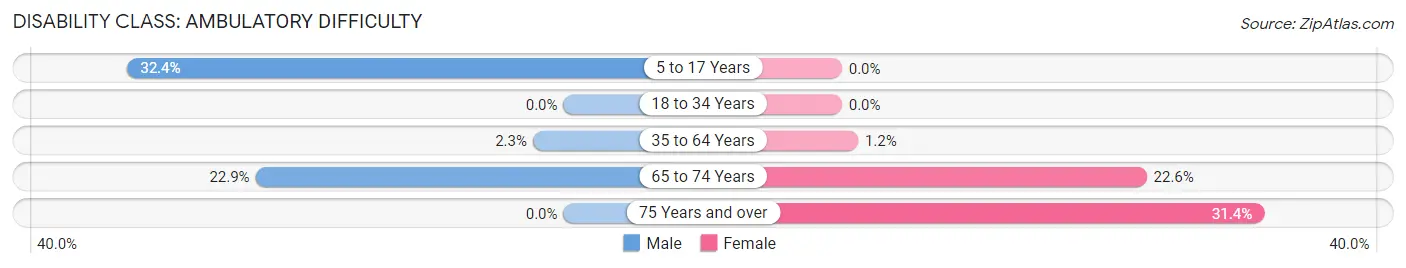
| Age Bracket | Male | Female |
| 5 to 17 Years | 45 (32.4%) | 0 (0.0%) |
| 18 to 34 Years | 0 (0.0%) | 0 (0.0%) |
| 35 to 64 Years | 27 (2.3%) | 7 (1.2%) |
| 65 to 74 Years | 48 (22.9%) | 81 (22.6%) |
| 75 Years and over | 0 (0.0%) | 58 (31.4%) |
Disability Class: Self-Care Difficulty
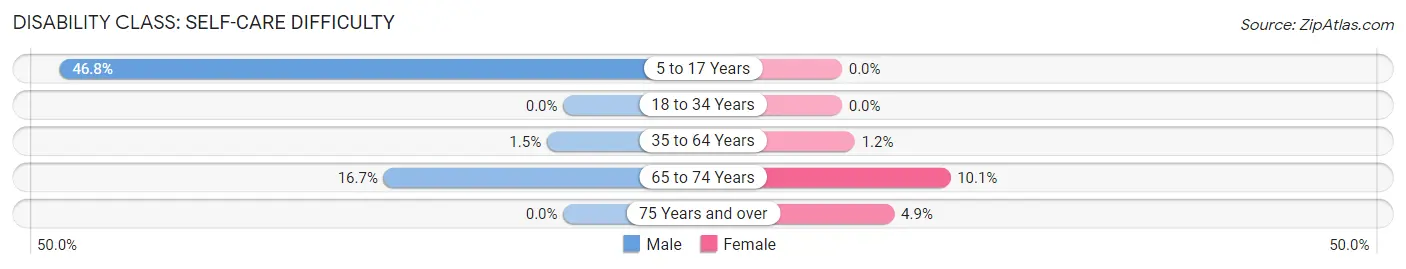
| Age Bracket | Male | Female |
| 5 to 17 Years | 65 (46.8%) | 0 (0.0%) |
| 18 to 34 Years | 0 (0.0%) | 0 (0.0%) |
| 35 to 64 Years | 18 (1.5%) | 7 (1.2%) |
| 65 to 74 Years | 35 (16.7%) | 36 (10.1%) |
| 75 Years and over | 0 (0.0%) | 9 (4.9%) |
Technology Access in Provincetown
Computing Device Access in Provincetown
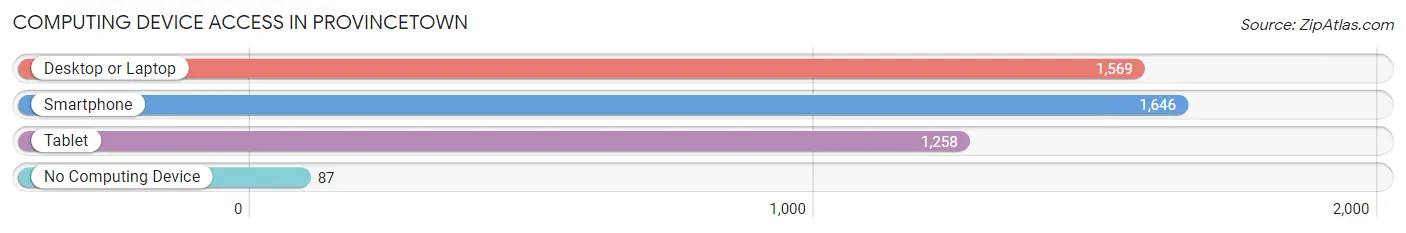
| Device Type | # Households | % Households |
| Desktop or Laptop | 1,569 | 83.0% |
| Smartphone | 1,646 | 87.1% |
| Tablet | 1,258 | 66.6% |
| No Computing Device | 87 | 4.6% |
| Total | 1,890 | 100.0% |
Internet Access in Provincetown
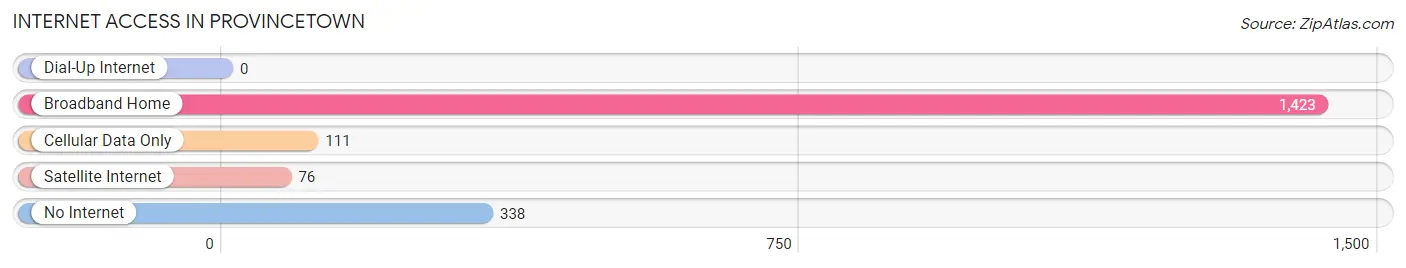
| Internet Type | # Households | % Households |
| Dial-Up Internet | 0 | 0.0% |
| Broadband Home | 1,423 | 75.3% |
| Cellular Data Only | 111 | 5.9% |
| Satellite Internet | 76 | 4.0% |
| No Internet | 338 | 17.9% |
| Total | 1,890 | 100.0% |
Provincetown Summary
Provincetown, Massachusetts is a small town located at the tip of Cape Cod. It is a popular tourist destination, known for its beaches, art galleries, and vibrant nightlife. The town has a rich history, diverse geography, and a unique economy and demographics.
History
Provincetown has a long and storied history. It was first settled in 1620 by the Pilgrims, who named it “Province Towne” after the nearby Province Lands. The town was officially incorporated in 1727, and quickly became a major fishing port. In the 19th century, it was a major whaling port, and the town’s economy was largely based on the whaling industry. In the late 19th century, the town began to attract artists and writers, and it became a popular summer destination. In the early 20th century, the town became a center for the arts, and it remains a popular destination for artists and writers today.
Geography
Provincetown is located at the tip of Cape Cod, at the northern end of the Cape Cod National Seashore. The town is bordered by the Atlantic Ocean to the east, and the Cape Cod Bay to the west. The town is divided into two sections: the East End and the West End. The East End is the more developed part of town, with a variety of shops, restaurants, and galleries. The West End is more rural, with a number of beaches and nature trails. The town is also home to a number of lighthouses, including the iconic Long Point Light.
Economy
The economy of Provincetown is largely based on tourism. The town is a popular summer destination, and it attracts visitors from all over the world. The town is also home to a number of art galleries, restaurants, and shops. The town’s fishing industry is still active, and the town is home to a number of commercial fishing boats. The town is also home to a number of small businesses, including boat builders, carpenters, and other tradespeople.
Demographics
As of the 2010 census, the population of Provincetown was 2,922. The town has a diverse population, with a large number of immigrants from Portugal, Brazil, and other countries. The town is also home to a large LGBT population, and it is a popular destination for LGBT tourists. The median household income in the town is $50,945, and the median home value is $541,000.
Provincetown is a unique and vibrant town with a rich history, diverse geography, and a unique economy and demographics. The town is a popular tourist destination, and it is home to a diverse population of artists, writers, fishermen, and other tradespeople. The town is a popular summer destination, and it attracts visitors from all over the world.
Common Questions
What is Per Capita Income in Provincetown?
Per Capita income in Provincetown is $89,577.
What is the Median Family Income in Provincetown?
Median Family Income in Provincetown is $136,667.
What is the Median Household income in Provincetown?
Median Household Income in Provincetown is $91,711.
What is Income or Wage Gap in Provincetown?
Income or Wage Gap in Provincetown is 29.7%.
Women in Provincetown earn 70.3 cents for every dollar earned by a man.
What is Inequality or Gini Index in Provincetown?
Inequality or Gini Index in Provincetown is 0.53.
What is the Total Population of Provincetown?
Total Population of Provincetown is 3,433.
What is the Total Male Population of Provincetown?
Total Male Population of Provincetown is 2,138.
What is the Total Female Population of Provincetown?
Total Female Population of Provincetown is 1,295.
What is the Ratio of Males per 100 Females in Provincetown?
There are 165.10 Males per 100 Females in Provincetown.
What is the Ratio of Females per 100 Males in Provincetown?
There are 60.57 Females per 100 Males in Provincetown.
What is the Median Population Age in Provincetown?
Median Population Age in Provincetown is 56.1 Years.
What is the Average Family Size in Provincetown
Average Family Size in Provincetown is 2.5 People.
What is the Average Household Size in Provincetown
Average Household Size in Provincetown is 1.8 People.
How Large is the Labor Force in Provincetown?
There are 2,144 People in the Labor Forcein in Provincetown.
What is the Percentage of People in the Labor Force in Provincetown?
67.8% of People are in the Labor Force in Provincetown.
What is the Unemployment Rate in Provincetown?
Unemployment Rate in Provincetown is 8.3%.