New Seabury, MA Map & Demographics
New Seabury Map
New Seabury Overview
$119,584
PER CAPITA INCOME
$233,333
AVG FAMILY INCOME
$167,222
AVG HOUSEHOLD INCOME
0.45
INEQUALITY / GINI INDEX
738
TOTAL POPULATION
377
MALE POPULATION
361
FEMALE POPULATION
104.43
MALES / 100 FEMALES
95.76
FEMALES / 100 MALES
66.1
MEDIAN AGE
2.4
AVG FAMILY SIZE
1.9
AVG HOUSEHOLD SIZE
258
LABOR FORCE [ PEOPLE ]
36.3%
PERCENT IN LABOR FORCE
4.5%
UNEMPLOYMENT RATE
Income in New Seabury
Income Overview in New Seabury
Per Capita Income in New Seabury is $119,584, while median incomes of families and households are $233,333 and $167,222 respectively.
| Characteristic | Number | Measure |
| Per Capita Income | 738 | $119,584 |
| Median Family Income | 258 | $233,333 |
| Mean Family Income | 258 | $251,410 |
| Median Household Income | 384 | $167,222 |
| Mean Household Income | 384 | $227,845 |
| Income Deficit | 258 | $0 |
| Wage / Income Gap (%) | 738 | 0.00% |
| Wage / Income Gap ($) | 738 | 100.00¢ per $1 |
| Gini / Inequality Index | 738 | 0.45 |
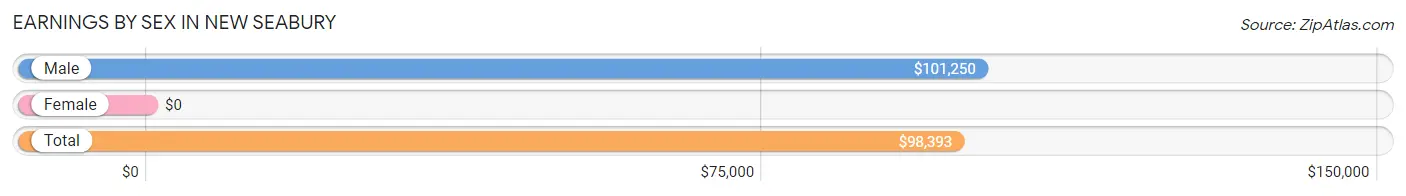
Earnings by Sex in New Seabury
| Sex | Number | Average Earnings |
| Male | 176 (58.3%) | $101,250 |
| Female | 126 (41.7%) | $0 |
| Total | 302 (100.0%) | $98,393 |
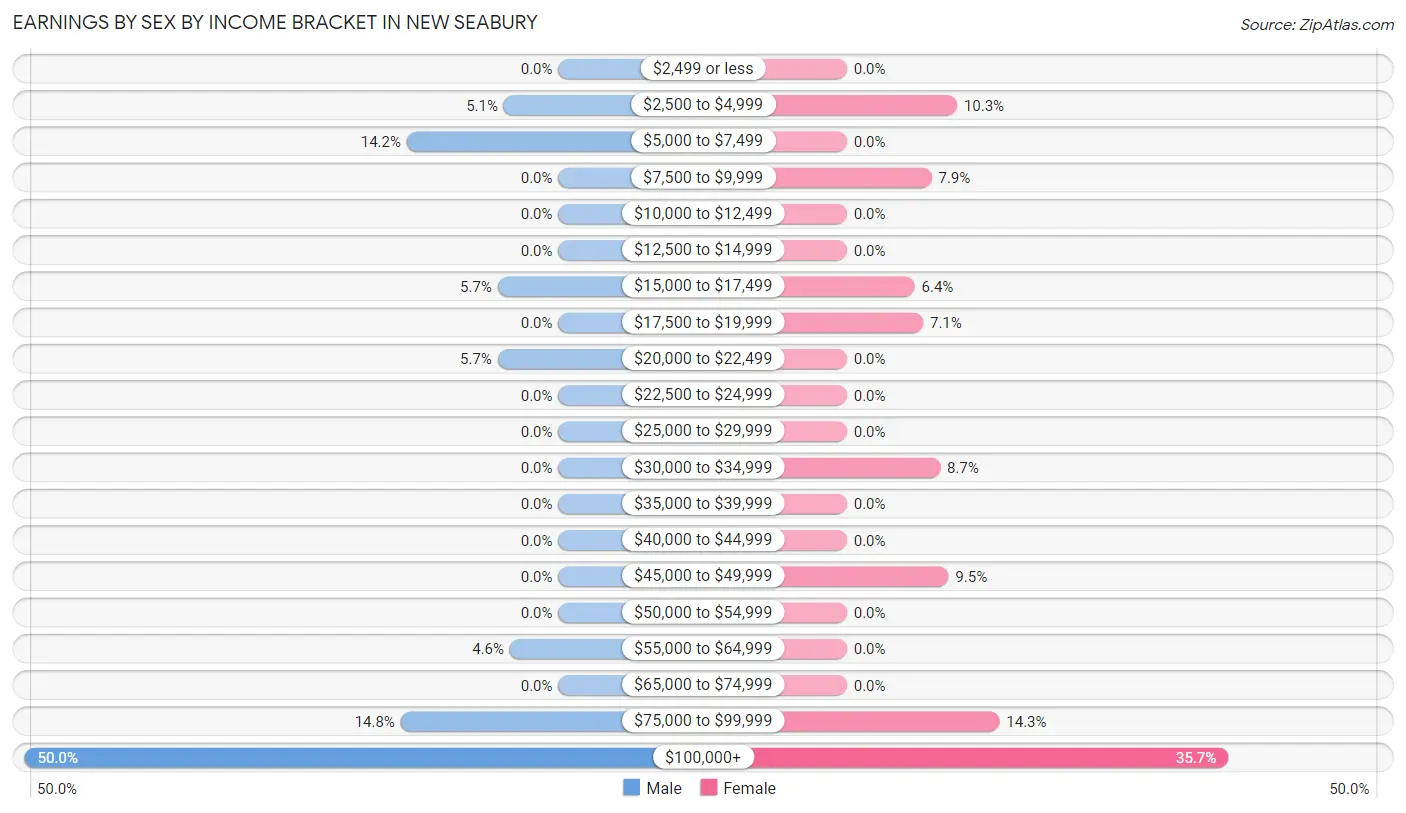
Earnings by Sex by Income Bracket in New Seabury
The most common earnings brackets in New Seabury are $100,000+ for men (88 | 50.0%) and $100,000+ for women (45 | 35.7%).
| Income | Male | Female |
| $2,499 or less | 0 (0.0%) | 0 (0.0%) |
| $2,500 to $4,999 | 9 (5.1%) | 13 (10.3%) |
| $5,000 to $7,499 | 25 (14.2%) | 0 (0.0%) |
| $7,500 to $9,999 | 0 (0.0%) | 10 (7.9%) |
| $10,000 to $12,499 | 0 (0.0%) | 0 (0.0%) |
| $12,500 to $14,999 | 0 (0.0%) | 0 (0.0%) |
| $15,000 to $17,499 | 10 (5.7%) | 8 (6.4%) |
| $17,500 to $19,999 | 0 (0.0%) | 9 (7.1%) |
| $20,000 to $22,499 | 10 (5.7%) | 0 (0.0%) |
| $22,500 to $24,999 | 0 (0.0%) | 0 (0.0%) |
| $25,000 to $29,999 | 0 (0.0%) | 0 (0.0%) |
| $30,000 to $34,999 | 0 (0.0%) | 11 (8.7%) |
| $35,000 to $39,999 | 0 (0.0%) | 0 (0.0%) |
| $40,000 to $44,999 | 0 (0.0%) | 0 (0.0%) |
| $45,000 to $49,999 | 0 (0.0%) | 12 (9.5%) |
| $50,000 to $54,999 | 0 (0.0%) | 0 (0.0%) |
| $55,000 to $64,999 | 8 (4.5%) | 0 (0.0%) |
| $65,000 to $74,999 | 0 (0.0%) | 0 (0.0%) |
| $75,000 to $99,999 | 26 (14.8%) | 18 (14.3%) |
| $100,000+ | 88 (50.0%) | 45 (35.7%) |
| Total | 176 (100.0%) | 126 (100.0%) |
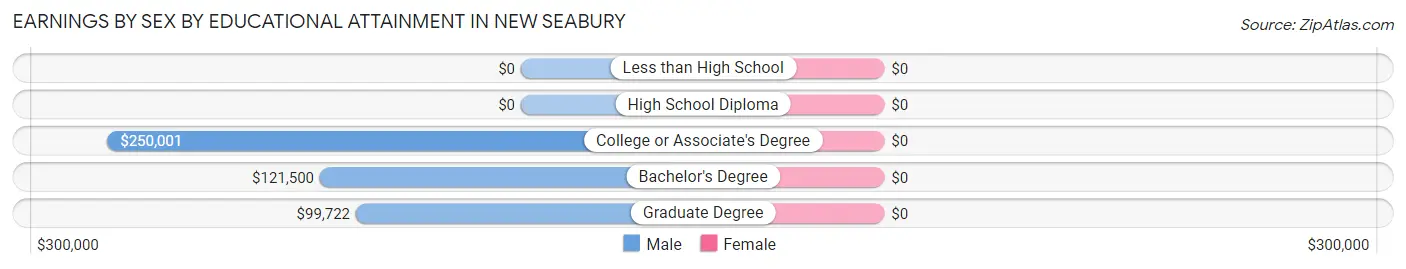
Earnings by Sex by Educational Attainment in New Seabury
| Educational Attainment | Male Income | Female Income |
| Less than High School | - | - |
| High School Diploma | - | - |
| College or Associate's Degree | $250,001 | $0 |
| Bachelor's Degree | $121,500 | $0 |
| Graduate Degree | $99,722 | $0 |
| Total | $101,250 | $92,031 |
Family Income in New Seabury
Family Income Brackets in New Seabury
According to the New Seabury family income data, there are 145 families falling into the $200,000+ income range, which is the most common income bracket and makes up 56.2% of all families.
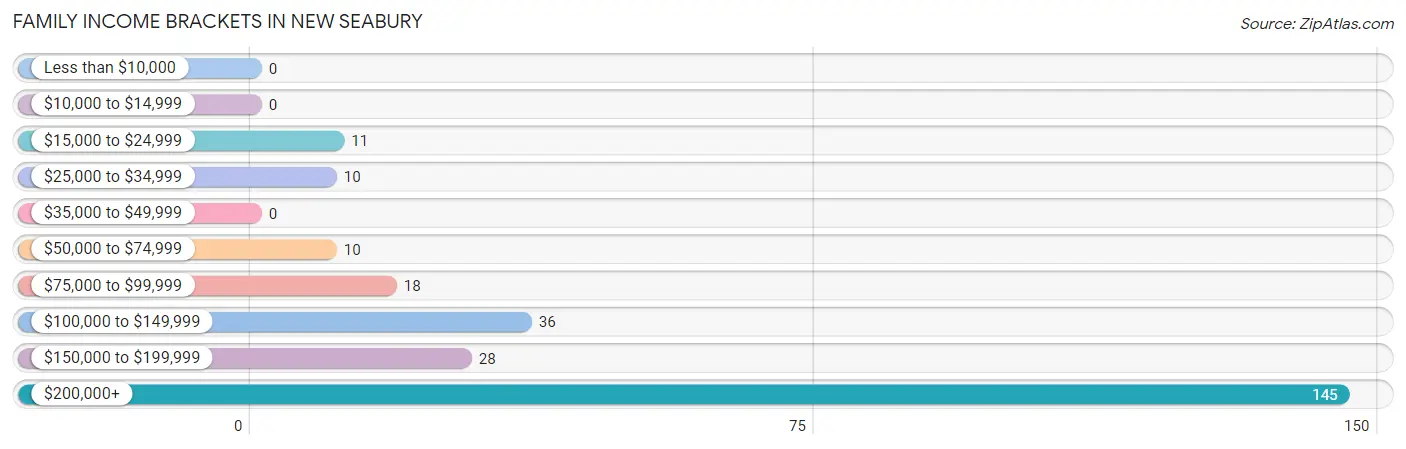
| Income Bracket | # Families | % Families |
| Less than $10,000 | 0 | 0.0% |
| $10,000 to $14,999 | 0 | 0.0% |
| $15,000 to $24,999 | 11 | 4.3% |
| $25,000 to $34,999 | 10 | 3.9% |
| $35,000 to $49,999 | 0 | 0.0% |
| $50,000 to $74,999 | 10 | 3.9% |
| $75,000 to $99,999 | 18 | 7.0% |
| $100,000 to $149,999 | 36 | 14.0% |
| $150,000 to $199,999 | 28 | 10.9% |
| $200,000+ | 145 | 56.2% |
Family Income by Famaliy Size in New Seabury
2-person families (223 | 86.4%) account for the highest median family income in New Seabury with $245,375 per family, while 2-person families (223 | 86.4%) have the highest median income of $122,688 per family member.
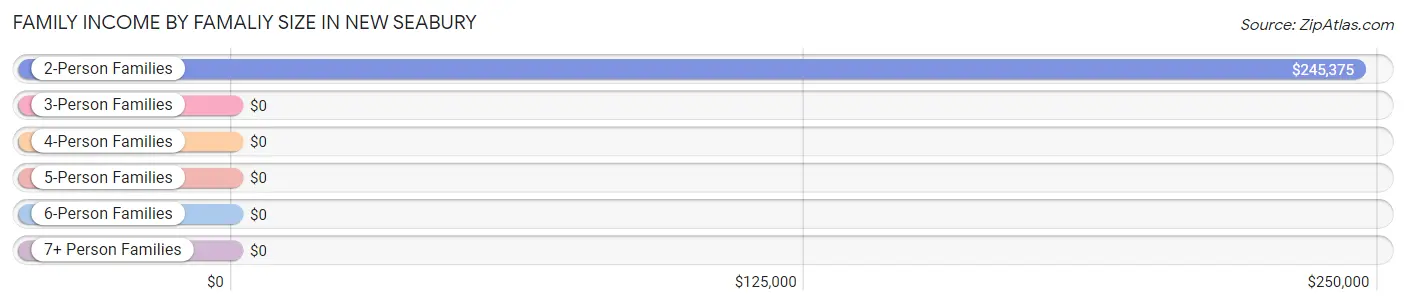
| Income Bracket | # Families | Median Income |
| 2-Person Families | 223 (86.4%) | $245,375 |
| 3-Person Families | 17 (6.6%) | $0 |
| 4-Person Families | 8 (3.1%) | $0 |
| 5-Person Families | 0 (0.0%) | $0 |
| 6-Person Families | 10 (3.9%) | $0 |
| 7+ Person Families | 0 (0.0%) | $0 |
| Total | 258 (100.0%) | $233,333 |
Family Income by Number of Earners in New Seabury
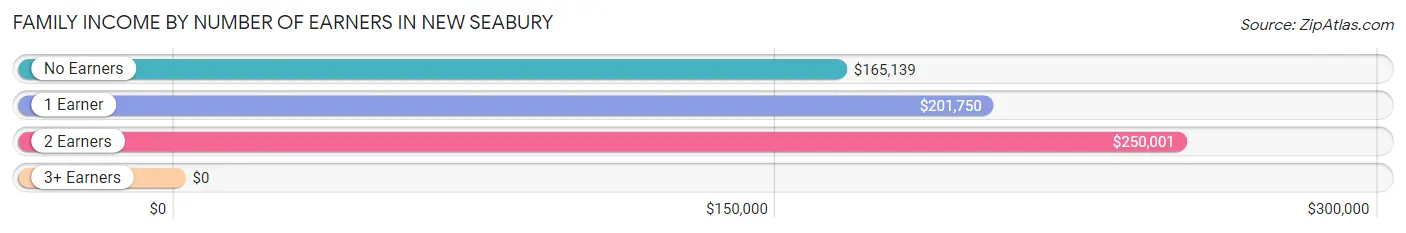
| Number of Earners | # Families | Median Income |
| No Earners | 93 (36.0%) | $165,139 |
| 1 Earner | 90 (34.9%) | $201,750 |
| 2 Earners | 67 (26.0%) | $250,001 |
| 3+ Earners | 8 (3.1%) | $0 |
| Total | 258 (100.0%) | $233,333 |
Household Income in New Seabury
Household Income Brackets in New Seabury
With 168 households falling in the category, the $200,000+ income range is the most frequent in New Seabury, accounting for 43.8% of all households.
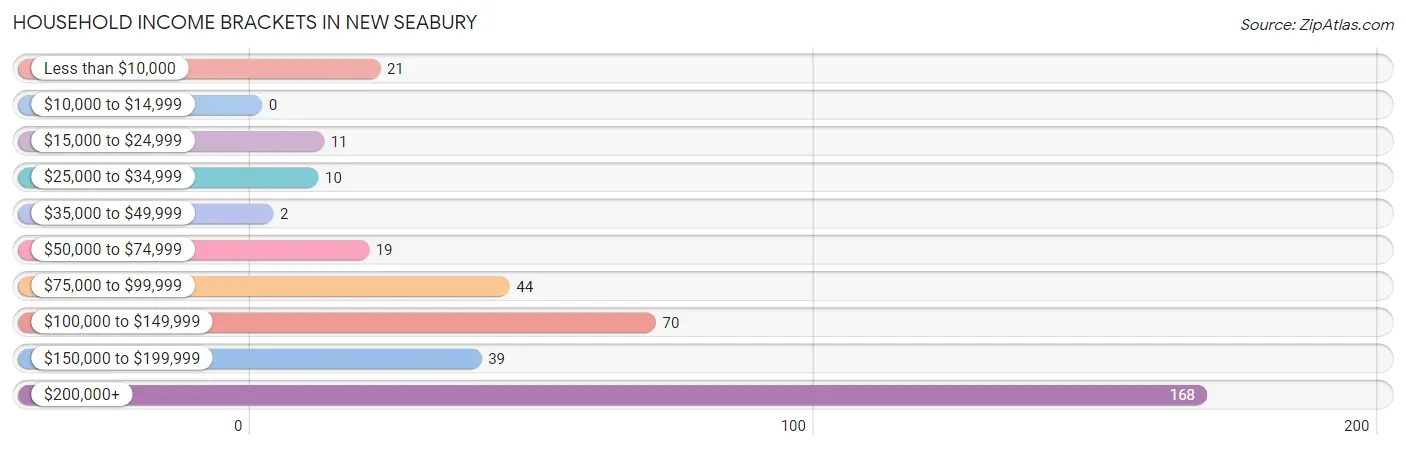
| Income Bracket | # Households | % Households |
| Less than $10,000 | 21 | 5.5% |
| $10,000 to $14,999 | 0 | 0.0% |
| $15,000 to $24,999 | 11 | 2.9% |
| $25,000 to $34,999 | 10 | 2.6% |
| $35,000 to $49,999 | 2 | 0.5% |
| $50,000 to $74,999 | 19 | 4.9% |
| $75,000 to $99,999 | 44 | 11.5% |
| $100,000 to $149,999 | 70 | 18.2% |
| $150,000 to $199,999 | 39 | 10.2% |
| $200,000+ | 168 | 43.8% |
Household Income by Householder Age in New Seabury
The median household income in New Seabury is $167,222, with the highest median household income of $181,023 found in the 65+ years age bracket for the primary householder. A total of 247 households (64.3%) fall into this category.
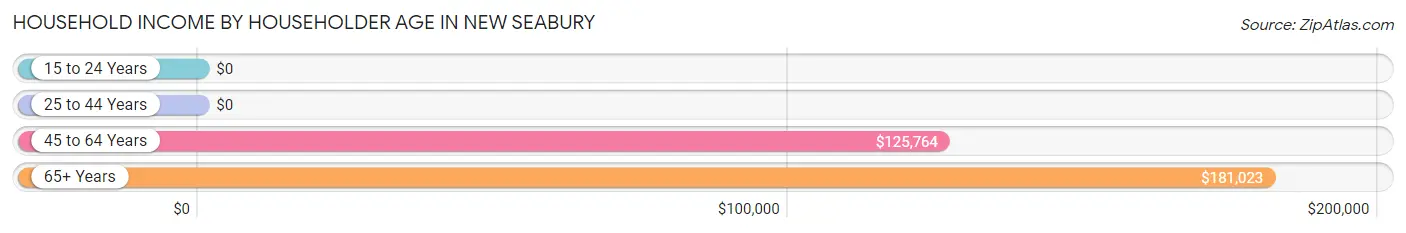
| Income Bracket | # Households | Median Income |
| 15 to 24 Years | 0 (0.0%) | $0 |
| 25 to 44 Years | 16 (4.2%) | $0 |
| 45 to 64 Years | 121 (31.5%) | $125,764 |
| 65+ Years | 247 (64.3%) | $181,023 |
| Total | 384 (100.0%) | $167,222 |
Poverty in New Seabury
Income Below Poverty by Sex and Age in New Seabury
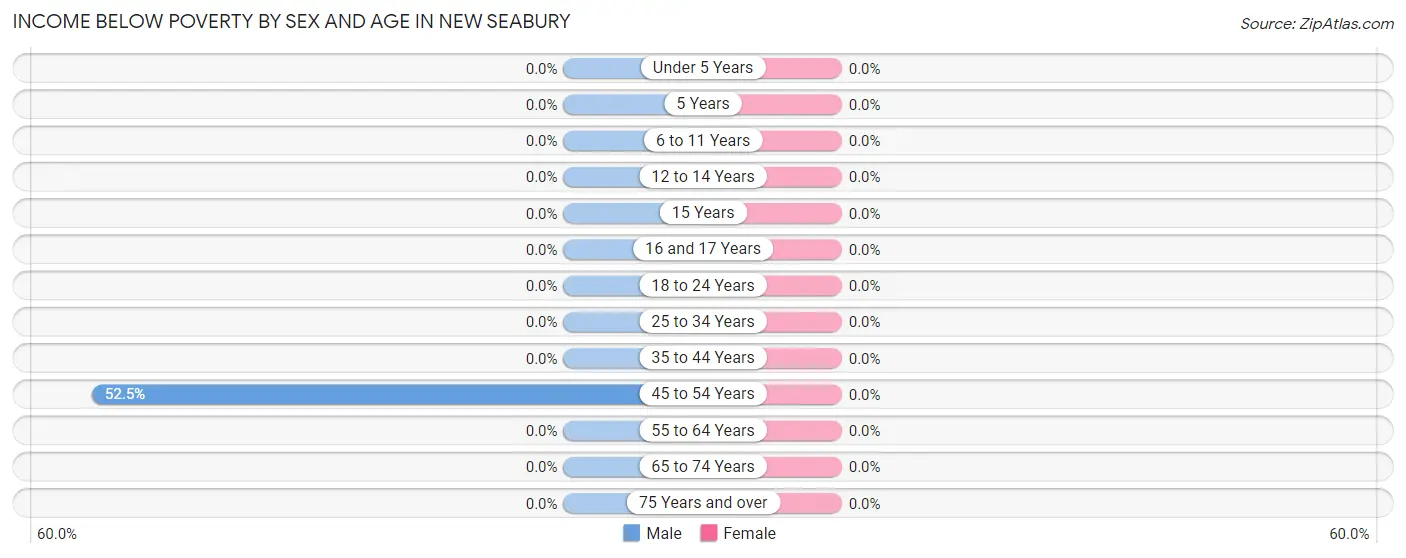
| Age Bracket | Male | Female |
| Under 5 Years | 0 (0.0%) | 0 (0.0%) |
| 5 Years | 0 (0.0%) | 0 (0.0%) |
| 6 to 11 Years | 0 (0.0%) | 0 (0.0%) |
| 12 to 14 Years | 0 (0.0%) | 0 (0.0%) |
| 15 Years | 0 (0.0%) | 0 (0.0%) |
| 16 and 17 Years | 0 (0.0%) | 0 (0.0%) |
| 18 to 24 Years | 0 (0.0%) | 0 (0.0%) |
| 25 to 34 Years | 0 (0.0%) | 0 (0.0%) |
| 35 to 44 Years | 0 (0.0%) | 0 (0.0%) |
| 45 to 54 Years | 21 (52.5%) | 0 (0.0%) |
| 55 to 64 Years | 0 (0.0%) | 0 (0.0%) |
| 65 to 74 Years | 0 (0.0%) | 0 (0.0%) |
| 75 Years and over | 0 (0.0%) | 0 (0.0%) |
| Total | 21 (5.6%) | 0 (0.0%) |
Income Above Poverty by Sex and Age in New Seabury
According to the poverty statistics in New Seabury, males aged 6 to 11 years and females aged 16 and 17 years are the age groups that are most secure financially, with 100.0% of males and 100.0% of females in these age groups living above the poverty line.
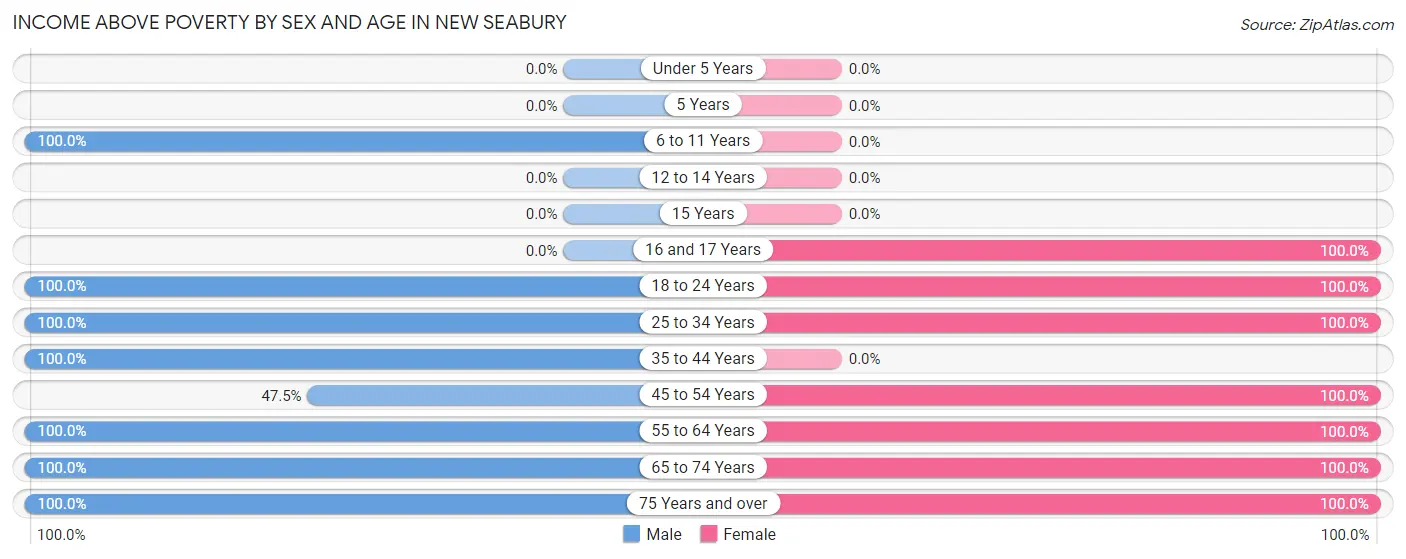
| Age Bracket | Male | Female |
| Under 5 Years | 0 (0.0%) | 0 (0.0%) |
| 5 Years | 0 (0.0%) | 0 (0.0%) |
| 6 to 11 Years | 27 (100.0%) | 0 (0.0%) |
| 12 to 14 Years | 0 (0.0%) | 0 (0.0%) |
| 15 Years | 0 (0.0%) | 0 (0.0%) |
| 16 and 17 Years | 0 (0.0%) | 7 (100.0%) |
| 18 to 24 Years | 12 (100.0%) | 23 (100.0%) |
| 25 to 34 Years | 12 (100.0%) | 2 (100.0%) |
| 35 to 44 Years | 14 (100.0%) | 0 (0.0%) |
| 45 to 54 Years | 19 (47.5%) | 26 (100.0%) |
| 55 to 64 Years | 79 (100.0%) | 119 (100.0%) |
| 65 to 74 Years | 88 (100.0%) | 120 (100.0%) |
| 75 Years and over | 105 (100.0%) | 64 (100.0%) |
| Total | 356 (94.4%) | 361 (100.0%) |
Income Below Poverty Among Married-Couple Families in New Seabury
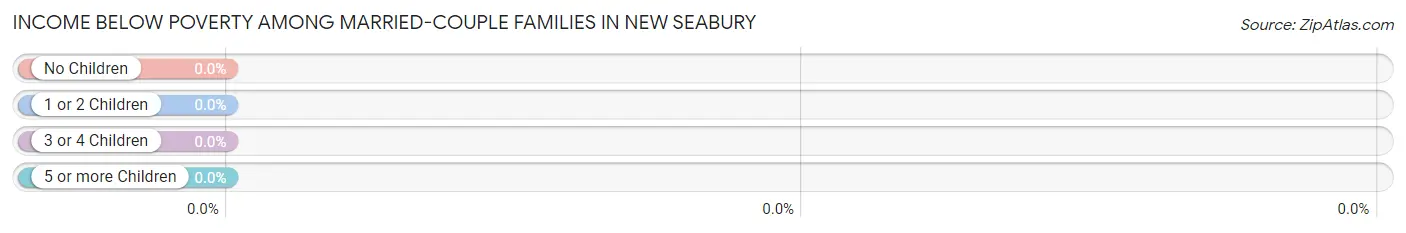
| Children | Above Poverty | Below Poverty |
| No Children | 241 (100.0%) | 0 (0.0%) |
| 1 or 2 Children | 10 (100.0%) | 0 (0.0%) |
| 3 or 4 Children | 0 (0.0%) | 0 (0.0%) |
| 5 or more Children | 0 (0.0%) | 0 (0.0%) |
| Total | 251 (100.0%) | 0 (0.0%) |
Income Below Poverty Among Single-Parent Households in New Seabury
| Children | Single Father | Single Mother |
| No Children | 0 (0.0%) | 0 (0.0%) |
| 1 or 2 Children | 0 (0.0%) | 0 (0.0%) |
| 3 or 4 Children | 0 (0.0%) | 0 (0.0%) |
| 5 or more Children | 0 (0.0%) | 0 (0.0%) |
| Total | 0 (0.0%) | 0 (0.0%) |
Income Below Poverty Among Married-Couple vs Single-Parent Households in New Seabury
| Children | Married-Couple Families | Single-Parent Households |
| No Children | 0 (0.0%) | 0 (0.0%) |
| 1 or 2 Children | 0 (0.0%) | 0 (0.0%) |
| 3 or 4 Children | 0 (0.0%) | 0 (0.0%) |
| 5 or more Children | 0 (0.0%) | 0 (0.0%) |
| Total | 0 (0.0%) | 0 (0.0%) |
Race in New Seabury
The most populous races in New Seabury are White / Caucasian (711 | 96.3%), Hispanic or Latino (27 | 3.7%), and Two or more Races (27 | 3.7%).
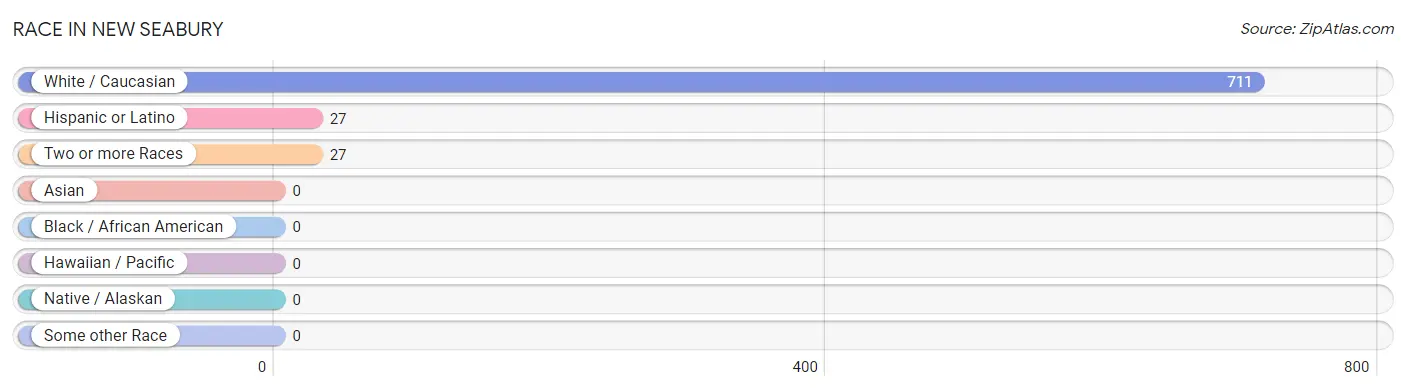
| Race | # Population | % Population |
| Asian | 0 | 0.0% |
| Black / African American | 0 | 0.0% |
| Hawaiian / Pacific | 0 | 0.0% |
| Hispanic or Latino | 27 | 3.7% |
| Native / Alaskan | 0 | 0.0% |
| White / Caucasian | 711 | 96.3% |
| Two or more Races | 27 | 3.7% |
| Some other Race | 0 | 0.0% |
| Total | 738 | 100.0% |
Ancestry in New Seabury
The most populous ancestries reported in New Seabury are Irish (161 | 21.8%), English (111 | 15.0%), German (67 | 9.1%), Polish (60 | 8.1%), and Russian (51 | 6.9%), together accounting for 61.0% of all New Seabury residents.
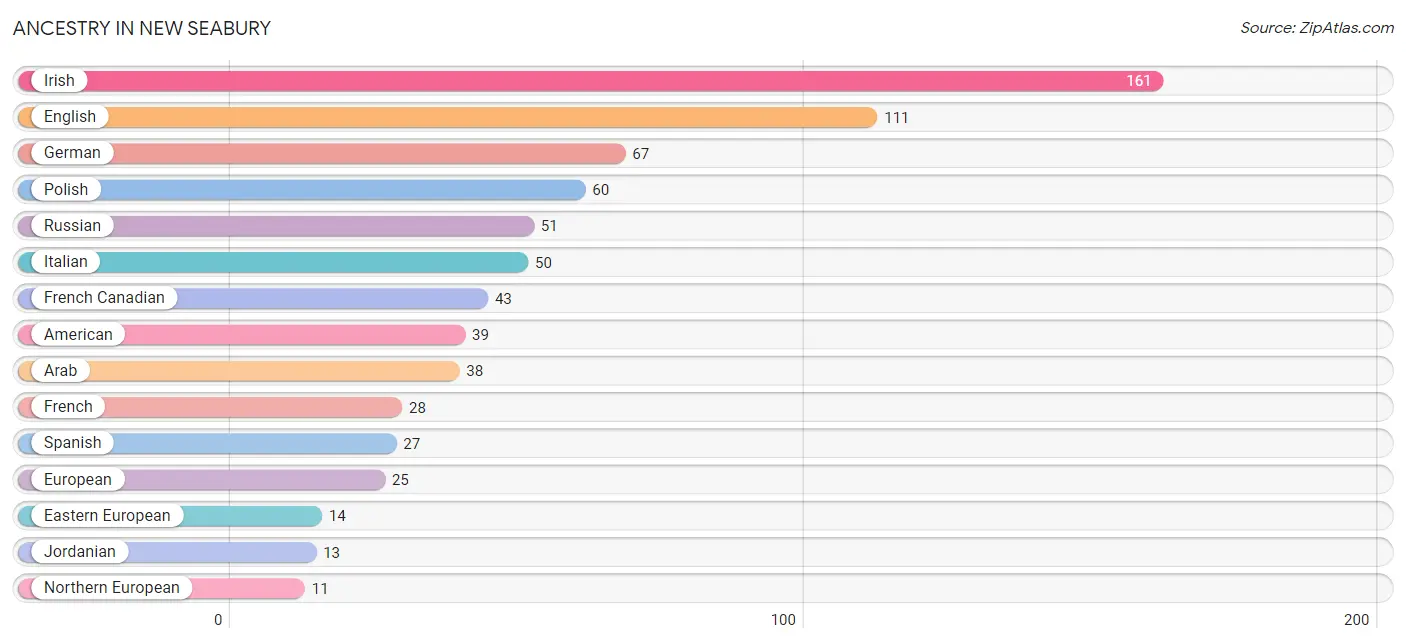
| Ancestry | # Population | % Population |
| American | 39 | 5.3% |
| Arab | 38 | 5.1% |
| Austrian | 3 | 0.4% |
| Eastern European | 14 | 1.9% |
| English | 111 | 15.0% |
| European | 25 | 3.4% |
| French | 28 | 3.8% |
| French Canadian | 43 | 5.8% |
| German | 67 | 9.1% |
| Irish | 161 | 21.8% |
| Italian | 50 | 6.8% |
| Jordanian | 13 | 1.8% |
| Lithuanian | 9 | 1.2% |
| Northern European | 11 | 1.5% |
| Polish | 60 | 8.1% |
| Romanian | 9 | 1.2% |
| Russian | 51 | 6.9% |
| Slovak | 10 | 1.4% |
| Spanish | 27 | 3.7% |
| Swedish | 9 | 1.2% | View All 20 Rows |
Immigrants in New Seabury
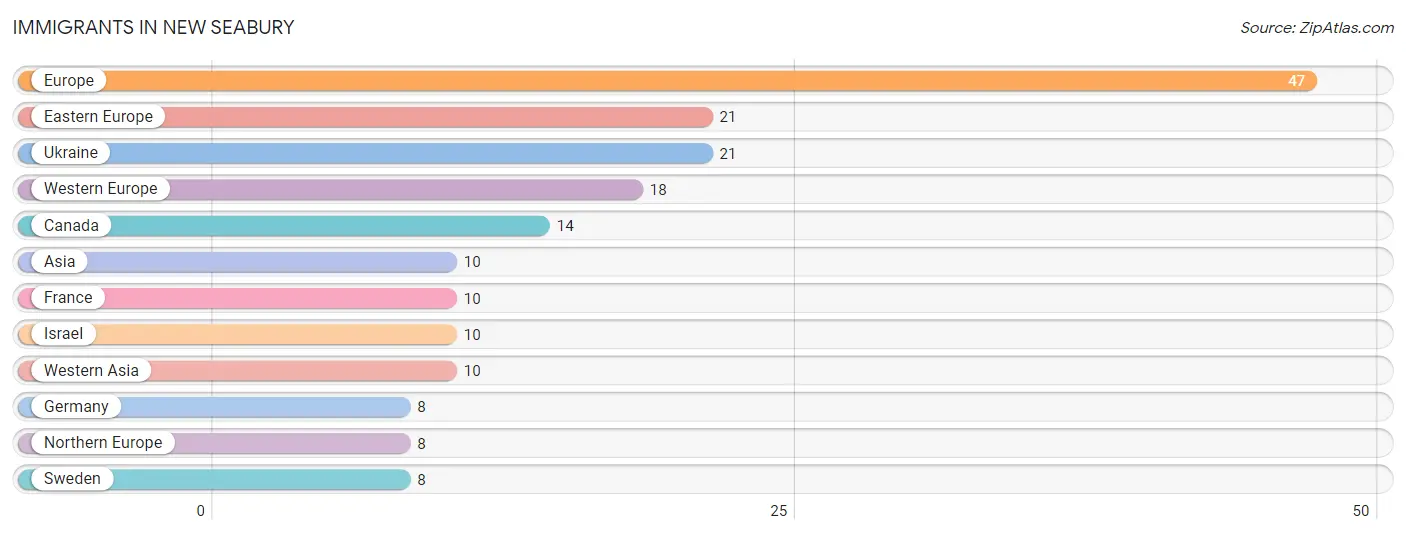
The most numerous immigrant groups reported in New Seabury came from Europe (47 | 6.4%), Eastern Europe (21 | 2.9%), Ukraine (21 | 2.9%), Western Europe (18 | 2.4%), and Canada (14 | 1.9%), together accounting for 16.4% of all New Seabury residents.
| Immigration Origin | # Population | % Population |
| Asia | 10 | 1.4% |
| Canada | 14 | 1.9% |
| Eastern Europe | 21 | 2.9% |
| Europe | 47 | 6.4% |
| France | 10 | 1.4% |
| Germany | 8 | 1.1% |
| Israel | 10 | 1.4% |
| Northern Europe | 8 | 1.1% |
| Sweden | 8 | 1.1% |
| Ukraine | 21 | 2.9% |
| Western Asia | 10 | 1.4% |
| Western Europe | 18 | 2.4% | View All 12 Rows |
Sex and Age in New Seabury
Sex and Age in New Seabury
The most populous age groups in New Seabury are 65 to 69 Years (66 | 17.5%) for men and 60 to 64 Years (91 | 25.2%) for women.
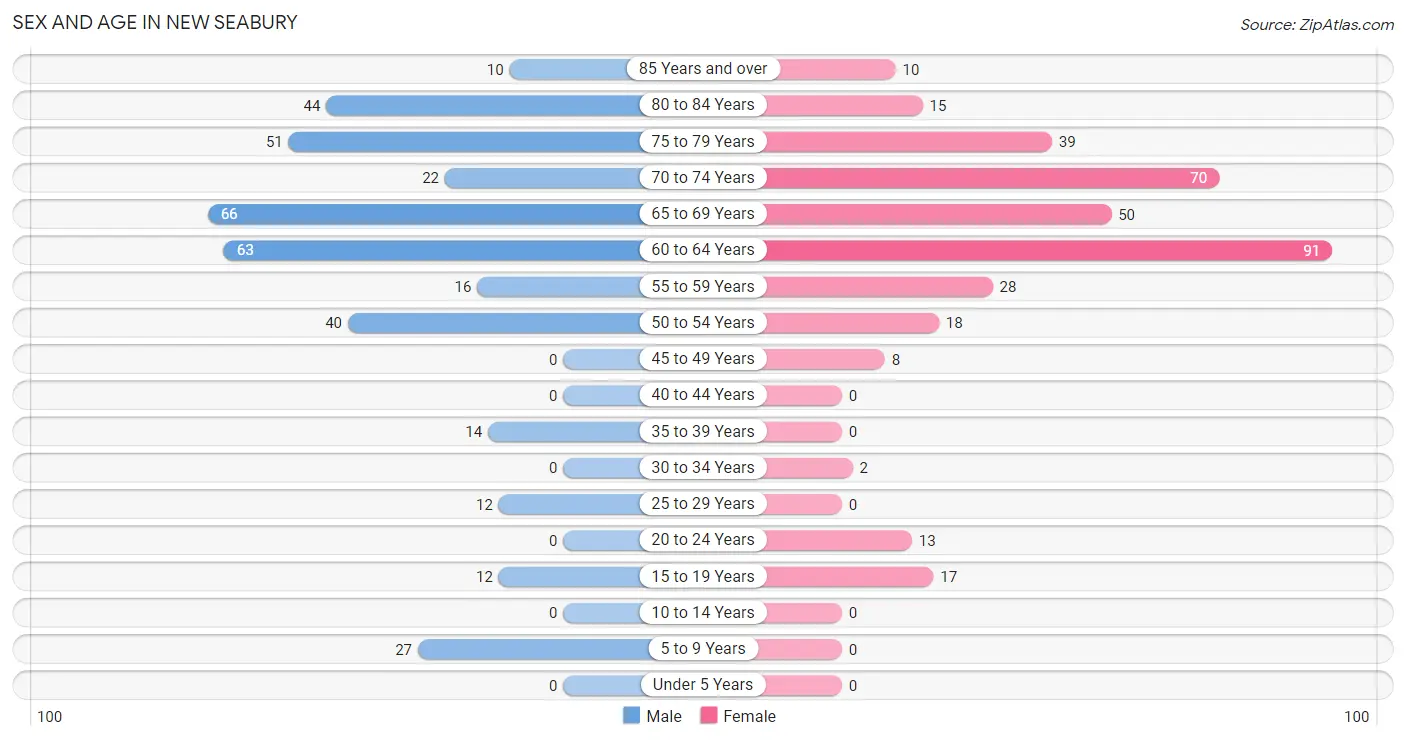
| Age Bracket | Male | Female |
| Under 5 Years | 0 (0.0%) | 0 (0.0%) |
| 5 to 9 Years | 27 (7.2%) | 0 (0.0%) |
| 10 to 14 Years | 0 (0.0%) | 0 (0.0%) |
| 15 to 19 Years | 12 (3.2%) | 17 (4.7%) |
| 20 to 24 Years | 0 (0.0%) | 13 (3.6%) |
| 25 to 29 Years | 12 (3.2%) | 0 (0.0%) |
| 30 to 34 Years | 0 (0.0%) | 2 (0.5%) |
| 35 to 39 Years | 14 (3.7%) | 0 (0.0%) |
| 40 to 44 Years | 0 (0.0%) | 0 (0.0%) |
| 45 to 49 Years | 0 (0.0%) | 8 (2.2%) |
| 50 to 54 Years | 40 (10.6%) | 18 (5.0%) |
| 55 to 59 Years | 16 (4.2%) | 28 (7.8%) |
| 60 to 64 Years | 63 (16.7%) | 91 (25.2%) |
| 65 to 69 Years | 66 (17.5%) | 50 (13.9%) |
| 70 to 74 Years | 22 (5.8%) | 70 (19.4%) |
| 75 to 79 Years | 51 (13.5%) | 39 (10.8%) |
| 80 to 84 Years | 44 (11.7%) | 15 (4.2%) |
| 85 Years and over | 10 (2.6%) | 10 (2.8%) |
| Total | 377 (100.0%) | 361 (100.0%) |
Families and Households in New Seabury
Median Family Size in New Seabury
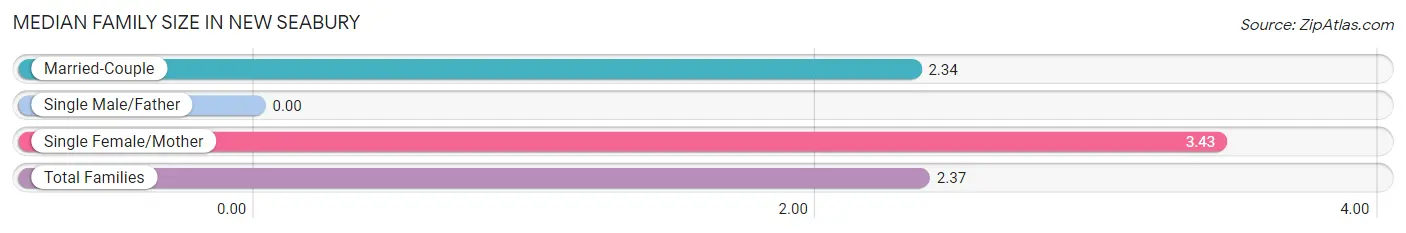
| Family Type | # Families | Family Size |
| Married-Couple | 251 (97.3%) | 2.34 |
| Single Male/Father | 0 (0.0%) | - |
| Single Female/Mother | 7 (2.7%) | 3.43 |
| Total Families | 258 (100.0%) | 2.37 |
Median Household Size in New Seabury
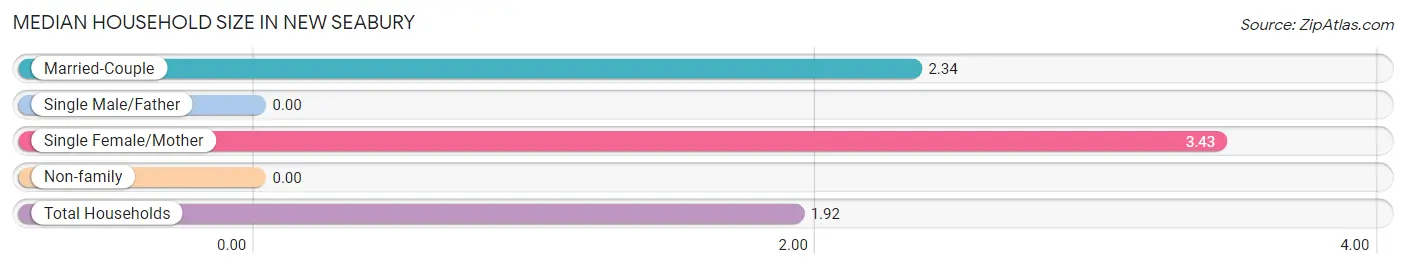
| Household Type | # Households | Household Size |
| Married-Couple | 251 (65.4%) | 2.34 |
| Single Male/Father | 0 (0.0%) | - |
| Single Female/Mother | 7 (1.8%) | 3.43 |
| Non-family | 126 (32.8%) | - |
| Total Households | 384 (100.0%) | 1.92 |
Household Size by Marriage Status in New Seabury
Out of a total of 384 households in New Seabury, 258 (67.2%) are family households, while 126 (32.8%) are nonfamily households. The most numerous type of family households are 2-person households, comprising 223, and the most common type of nonfamily households are 1-person households, comprising 126.
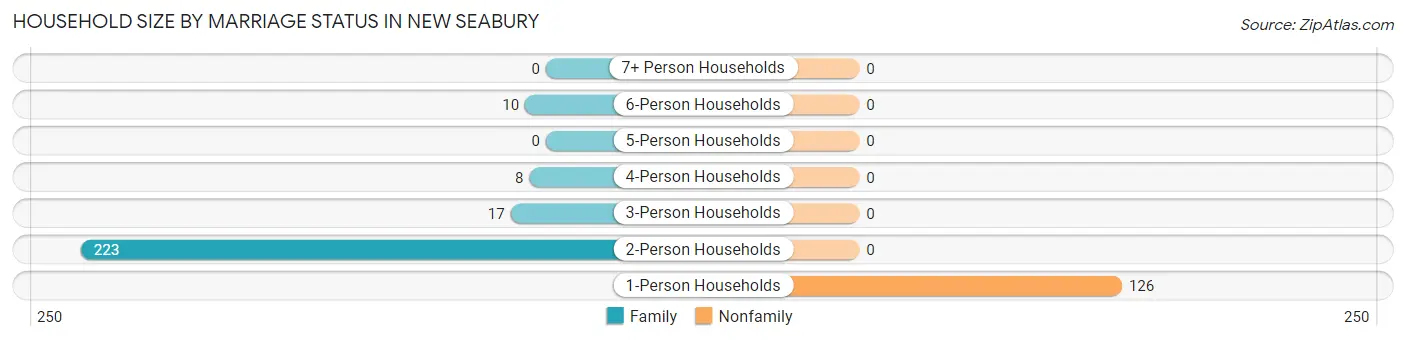
| Household Size | Family Households | Nonfamily Households |
| 1-Person Households | - | 126 (32.8%) |
| 2-Person Households | 223 (58.1%) | 0 (0.0%) |
| 3-Person Households | 17 (4.4%) | 0 (0.0%) |
| 4-Person Households | 8 (2.1%) | 0 (0.0%) |
| 5-Person Households | 0 (0.0%) | 0 (0.0%) |
| 6-Person Households | 10 (2.6%) | 0 (0.0%) |
| 7+ Person Households | 0 (0.0%) | 0 (0.0%) |
| Total | 258 (67.2%) | 126 (32.8%) |
Female Fertility in New Seabury
Fertility by Age in New Seabury
| Age Bracket | Women with Births | Births / 1,000 Women |
| 15 to 19 years | 0 (0.0%) | 0.0 |
| 20 to 34 years | 0 (0.0%) | 0.0 |
| 35 to 50 years | 0 (0.0%) | 0.0 |
| Total | 0 (0.0%) | 0.0 |
Fertility by Age by Marriage Status in New Seabury
| Age Bracket | Married | Unmarried |
| 15 to 19 years | 0 (0.0%) | 0 (0.0%) |
| 20 to 34 years | 0 (0.0%) | 0 (0.0%) |
| 35 to 50 years | 0 (0.0%) | 0 (0.0%) |
| Total | 0 (0.0%) | 0 (0.0%) |
Fertility by Education in New Seabury
| Educational Attainment | Women with Births | Births / 1,000 Women |
| Less than High School | 0 (0.0%) | 0.0 |
| High School Diploma | 0 (0.0%) | 0.0 |
| College or Associate's Degree | 0 (0.0%) | 0.0 |
| Bachelor's Degree | 0 (0.0%) | 0.0 |
| Graduate Degree | 0 (0.0%) | 0.0 |
| Total | 0 (0.0%) | 0.0 |
Fertility by Education by Marriage Status in New Seabury
| Educational Attainment | Married | Unmarried |
| Less than High School | 0 (0.0%) | 0 (0.0%) |
| High School Diploma | 0 (0.0%) | 0 (0.0%) |
| College or Associate's Degree | 0 (0.0%) | 0 (0.0%) |
| Bachelor's Degree | 0 (0.0%) | 0 (0.0%) |
| Graduate Degree | 0 (0.0%) | 0 (0.0%) |
| Total | 0 (0.0%) | 0 (0.0%) |
Employment Characteristics in New Seabury
Employment by Class of Employer in New Seabury
Among the 247 employed individuals in New Seabury, private company employees (139 | 56.3%), not-for-profit organizations (33 | 13.4%), and federal government employees (26 | 10.5%) make up the most common classes of employment.
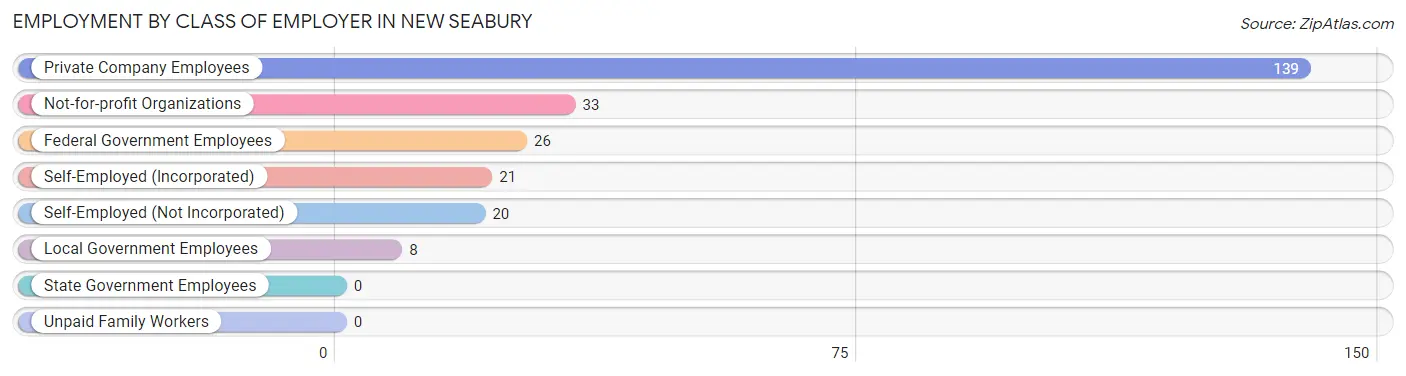
| Employer Class | # Employees | % Employees |
| Private Company Employees | 139 | 56.3% |
| Self-Employed (Incorporated) | 21 | 8.5% |
| Self-Employed (Not Incorporated) | 20 | 8.1% |
| Not-for-profit Organizations | 33 | 13.4% |
| Local Government Employees | 8 | 3.2% |
| State Government Employees | 0 | 0.0% |
| Federal Government Employees | 26 | 10.5% |
| Unpaid Family Workers | 0 | 0.0% |
| Total | 247 | 100.0% |
Employment Status by Age in New Seabury
According to the labor force statistics for New Seabury, out of the total population over 16 years of age (711), 36.3% or 258 individuals are in the labor force, with 4.5% or 12 of them unemployed. The age group with the highest labor force participation rate is 25 to 29 years, with 100.0% or 12 individuals in the labor force. Within the labor force, the 45 to 54 years age range has the highest percentage of unemployed individuals, with 16.7% or 11 of them being unemployed.
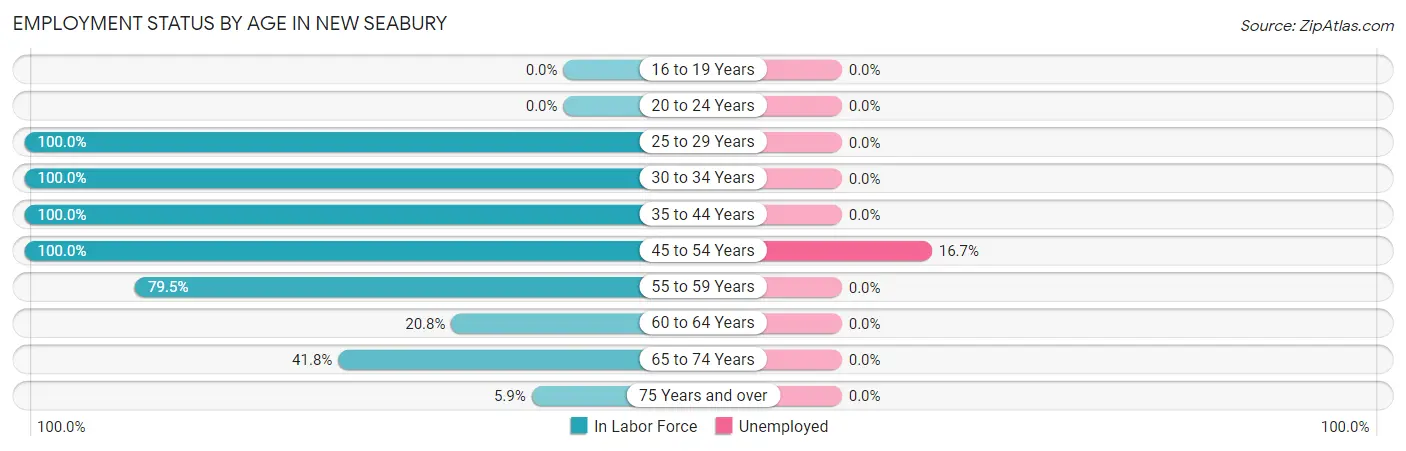
| Age Bracket | In Labor Force | Unemployed |
| 16 to 19 Years | 0 (0.0%) | 0 (0.0%) |
| 20 to 24 Years | 0 (0.0%) | 0 (0.0%) |
| 25 to 29 Years | 12 (100.0%) | 0 (0.0%) |
| 30 to 34 Years | 2 (100.0%) | 0 (0.0%) |
| 35 to 44 Years | 14 (100.0%) | 0 (0.0%) |
| 45 to 54 Years | 66 (100.0%) | 11 (16.7%) |
| 55 to 59 Years | 35 (79.5%) | 0 (0.0%) |
| 60 to 64 Years | 32 (20.8%) | 0 (0.0%) |
| 65 to 74 Years | 87 (41.8%) | 0 (0.0%) |
| 75 Years and over | 10 (5.9%) | 0 (0.0%) |
| Total | 258 (36.3%) | 12 (4.5%) |
Employment Status by Educational Attainment in New Seabury
According to labor force statistics for New Seabury, 55.1% of individuals (161) out of the total population between 25 and 64 years of age (292) are in the labor force, with 7.5% or 12 of them being unemployed. The group with the highest labor force participation rate are those with the educational attainment of college / associate degree, with 59.7% or 37 individuals in the labor force. Within the labor force, individuals with bachelor's degree or higher education have the highest percentage of unemployment, with 10.0% or 12 of them being unemployed.
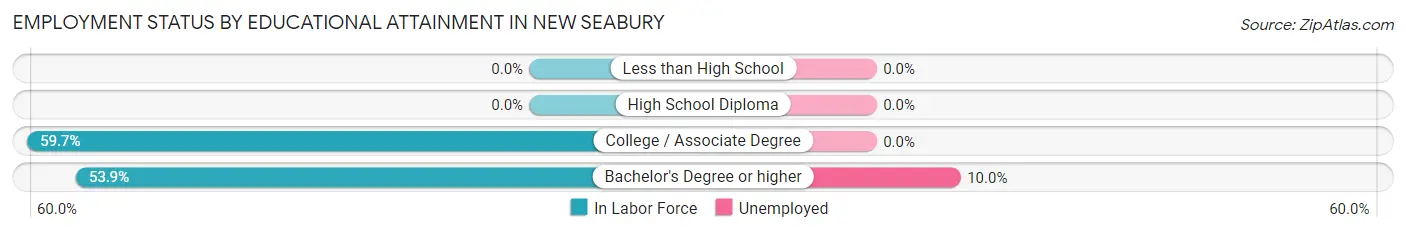
| Educational Attainment | In Labor Force | Unemployed |
| Less than High School | 0 (0.0%) | 0 (0.0%) |
| High School Diploma | 0 (0.0%) | 0 (0.0%) |
| College / Associate Degree | 37 (59.7%) | 0 (0.0%) |
| Bachelor's Degree or higher | 124 (53.9%) | 23 (10.0%) |
| Total | 161 (55.1%) | 22 (7.5%) |
Employment Occupations by Sex in New Seabury
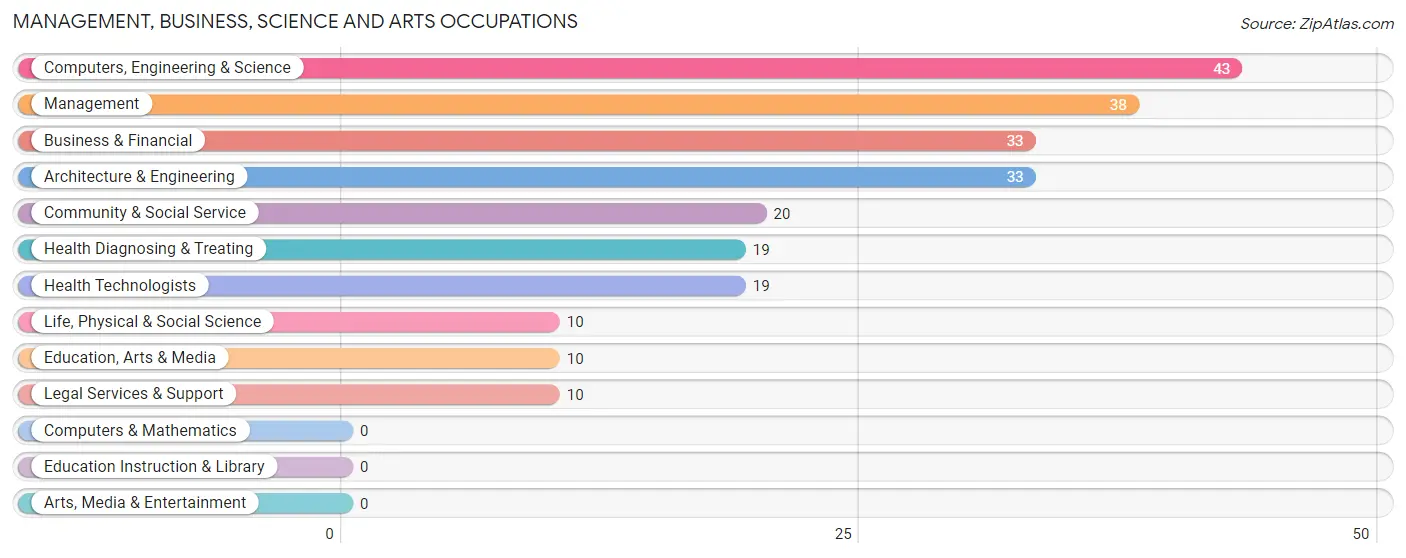
Management, Business, Science and Arts Occupations
The most common Management, Business, Science and Arts occupations in New Seabury are Computers, Engineering & Science (43 | 18.4%), Management (38 | 16.3%), Business & Financial (33 | 14.2%), Architecture & Engineering (33 | 14.2%), and Community & Social Service (20 | 8.6%).
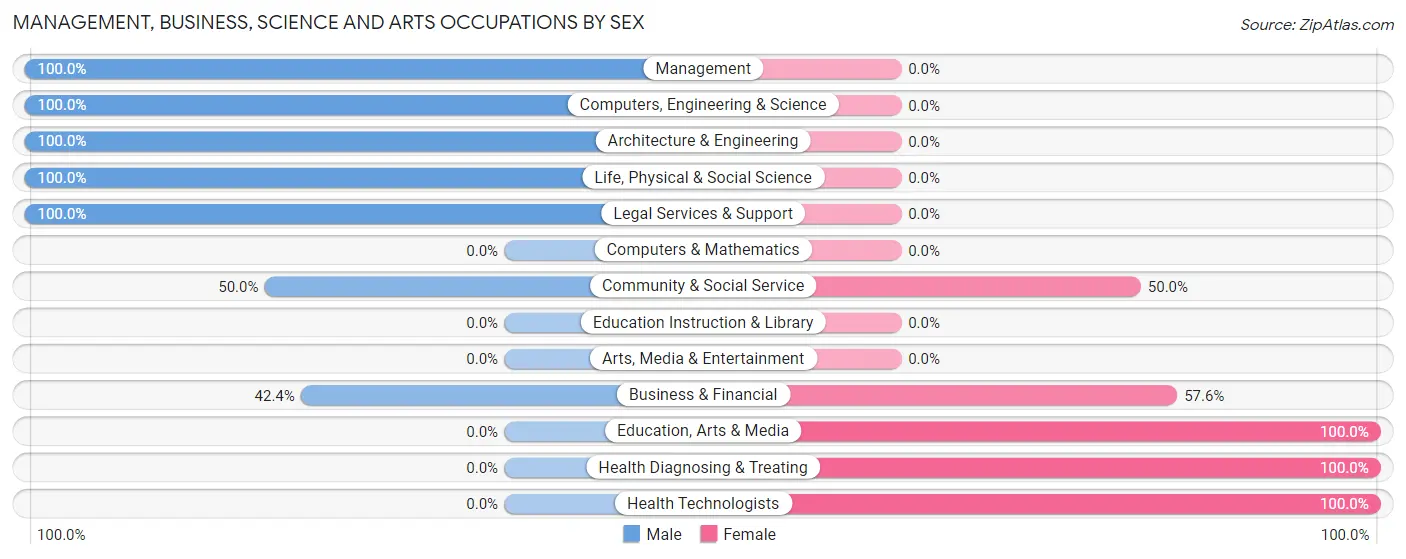
Management, Business, Science and Arts Occupations by Sex
Within the Management, Business, Science and Arts occupations in New Seabury, the most male-oriented occupations are Management (100.0%), Computers, Engineering & Science (100.0%), and Architecture & Engineering (100.0%), while the most female-oriented occupations are Education, Arts & Media (100.0%), Health Diagnosing & Treating (100.0%), and Health Technologists (100.0%).
| Occupation | Male | Female |
| Management | 38 (100.0%) | 0 (0.0%) |
| Business & Financial | 14 (42.4%) | 19 (57.6%) |
| Computers, Engineering & Science | 43 (100.0%) | 0 (0.0%) |
| Computers & Mathematics | 0 (0.0%) | 0 (0.0%) |
| Architecture & Engineering | 33 (100.0%) | 0 (0.0%) |
| Life, Physical & Social Science | 10 (100.0%) | 0 (0.0%) |
| Community & Social Service | 10 (50.0%) | 10 (50.0%) |
| Education, Arts & Media | 0 (0.0%) | 10 (100.0%) |
| Legal Services & Support | 10 (100.0%) | 0 (0.0%) |
| Education Instruction & Library | 0 (0.0%) | 0 (0.0%) |
| Arts, Media & Entertainment | 0 (0.0%) | 0 (0.0%) |
| Health Diagnosing & Treating | 0 (0.0%) | 19 (100.0%) |
| Health Technologists | 0 (0.0%) | 19 (100.0%) |
| Total (Category) | 105 (68.6%) | 48 (31.4%) |
| Total (Overall) | 129 (55.4%) | 104 (44.6%) |
Services Occupations
Services Occupations by Sex
| Occupation | Male | Female |
| Healthcare Support | 0 (0.0%) | 0 (0.0%) |
| Security & Protection | 0 (0.0%) | 0 (0.0%) |
| Firefighting & Prevention | 0 (0.0%) | 0 (0.0%) |
| Law Enforcement | 0 (0.0%) | 0 (0.0%) |
| Food Preparation & Serving | 0 (0.0%) | 0 (0.0%) |
| Cleaning & Maintenance | 0 (0.0%) | 0 (0.0%) |
| Personal Care & Service | 0 (0.0%) | 0 (0.0%) |
| Total (Category) | 0 (0.0%) | 0 (0.0%) |
| Total (Overall) | 129 (55.4%) | 104 (44.6%) |
Sales and Office Occupations
The most common Sales and Office occupations in New Seabury are Sales & Related (38 | 16.3%), and Office & Administration (18 | 7.7%).
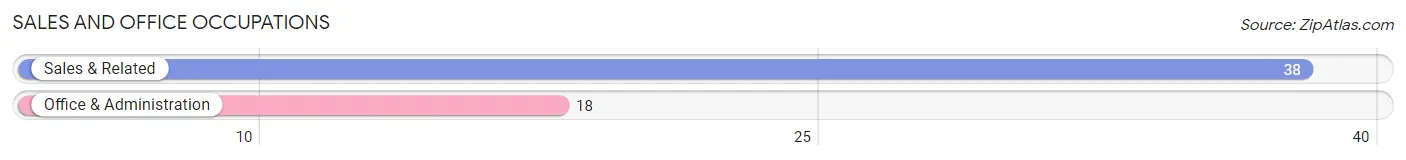
Sales and Office Occupations by Sex
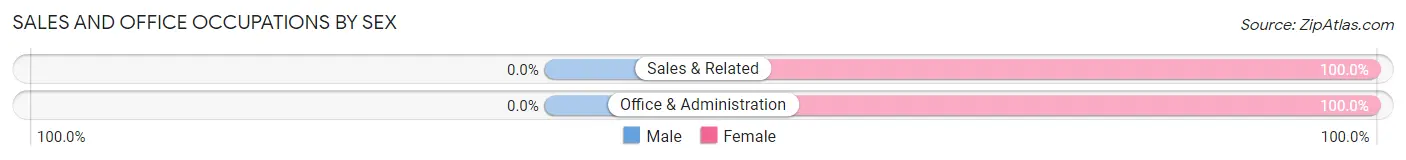
| Occupation | Male | Female |
| Sales & Related | 0 (0.0%) | 38 (100.0%) |
| Office & Administration | 0 (0.0%) | 18 (100.0%) |
| Total (Category) | 0 (0.0%) | 56 (100.0%) |
| Total (Overall) | 129 (55.4%) | 104 (44.6%) |
Natural Resources, Construction and Maintenance Occupations
The most common Natural Resources, Construction and Maintenance occupations in New Seabury are Construction & Extraction (10 | 4.3%), and Installation, Maintenance & Repair (6 | 2.6%).
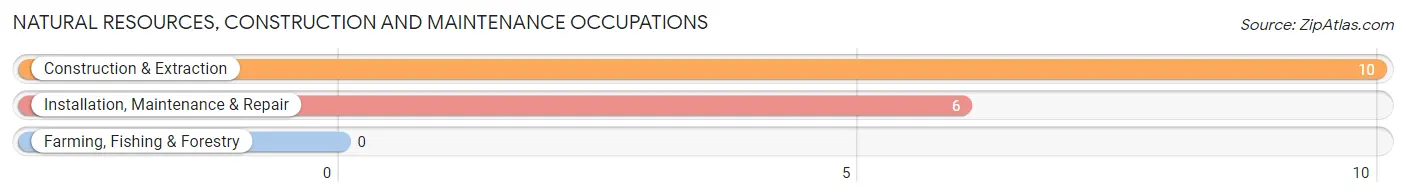
Natural Resources, Construction and Maintenance Occupations by Sex
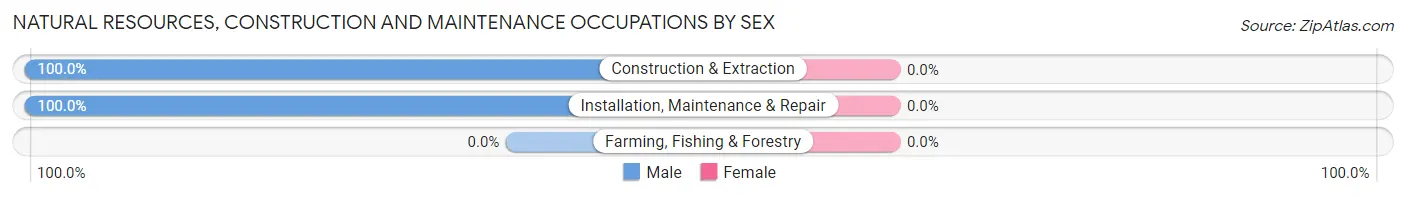
| Occupation | Male | Female |
| Farming, Fishing & Forestry | 0 (0.0%) | 0 (0.0%) |
| Construction & Extraction | 10 (100.0%) | 0 (0.0%) |
| Installation, Maintenance & Repair | 6 (100.0%) | 0 (0.0%) |
| Total (Category) | 16 (100.0%) | 0 (0.0%) |
| Total (Overall) | 129 (55.4%) | 104 (44.6%) |
Production, Transportation and Moving Occupations
The most common Production, Transportation and Moving occupations in New Seabury are , and Transportation (8 | 3.4%).
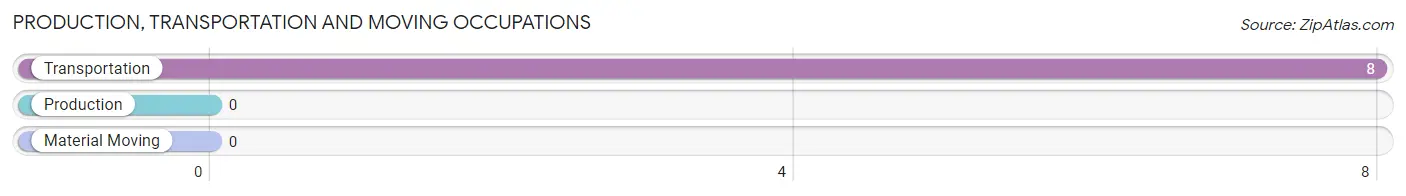
Production, Transportation and Moving Occupations by Sex
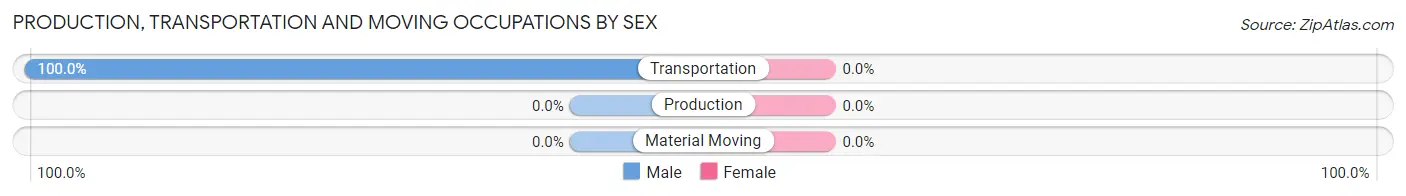
| Occupation | Male | Female |
| Production | 0 (0.0%) | 0 (0.0%) |
| Transportation | 8 (100.0%) | 0 (0.0%) |
| Material Moving | 0 (0.0%) | 0 (0.0%) |
| Total (Category) | 8 (100.0%) | 0 (0.0%) |
| Total (Overall) | 129 (55.4%) | 104 (44.6%) |
Employment Industries by Sex in New Seabury
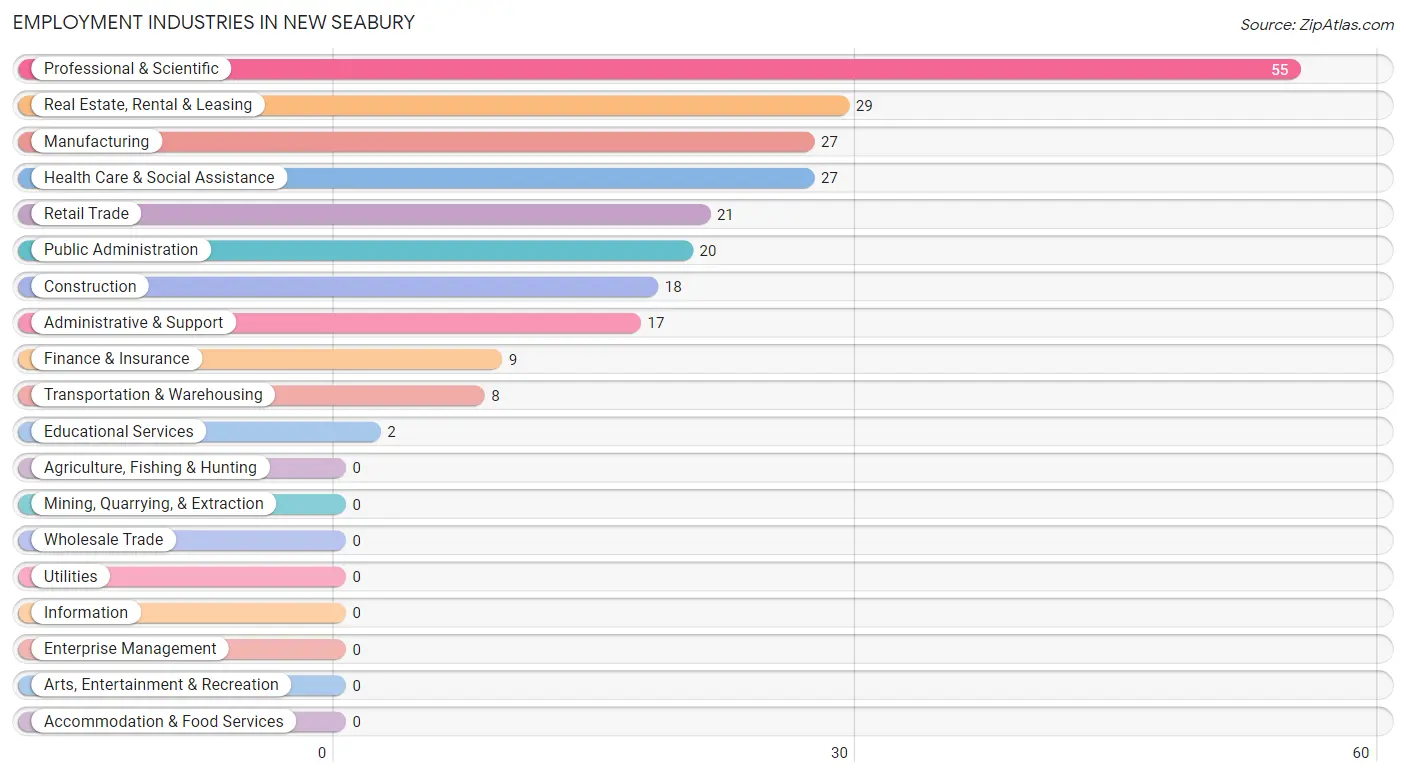
Employment Industries in New Seabury
The major employment industries in New Seabury include Professional & Scientific (55 | 23.6%), Real Estate, Rental & Leasing (29 | 12.4%), Manufacturing (27 | 11.6%), Health Care & Social Assistance (27 | 11.6%), and Retail Trade (21 | 9.0%).
Employment Industries by Sex in New Seabury
The New Seabury industries that see more men than women are Construction (100.0%), Transportation & Warehousing (100.0%), and Professional & Scientific (100.0%), whereas the industries that tend to have a higher number of women are Finance & Insurance (100.0%), Real Estate, Rental & Leasing (100.0%), and Educational Services (100.0%).
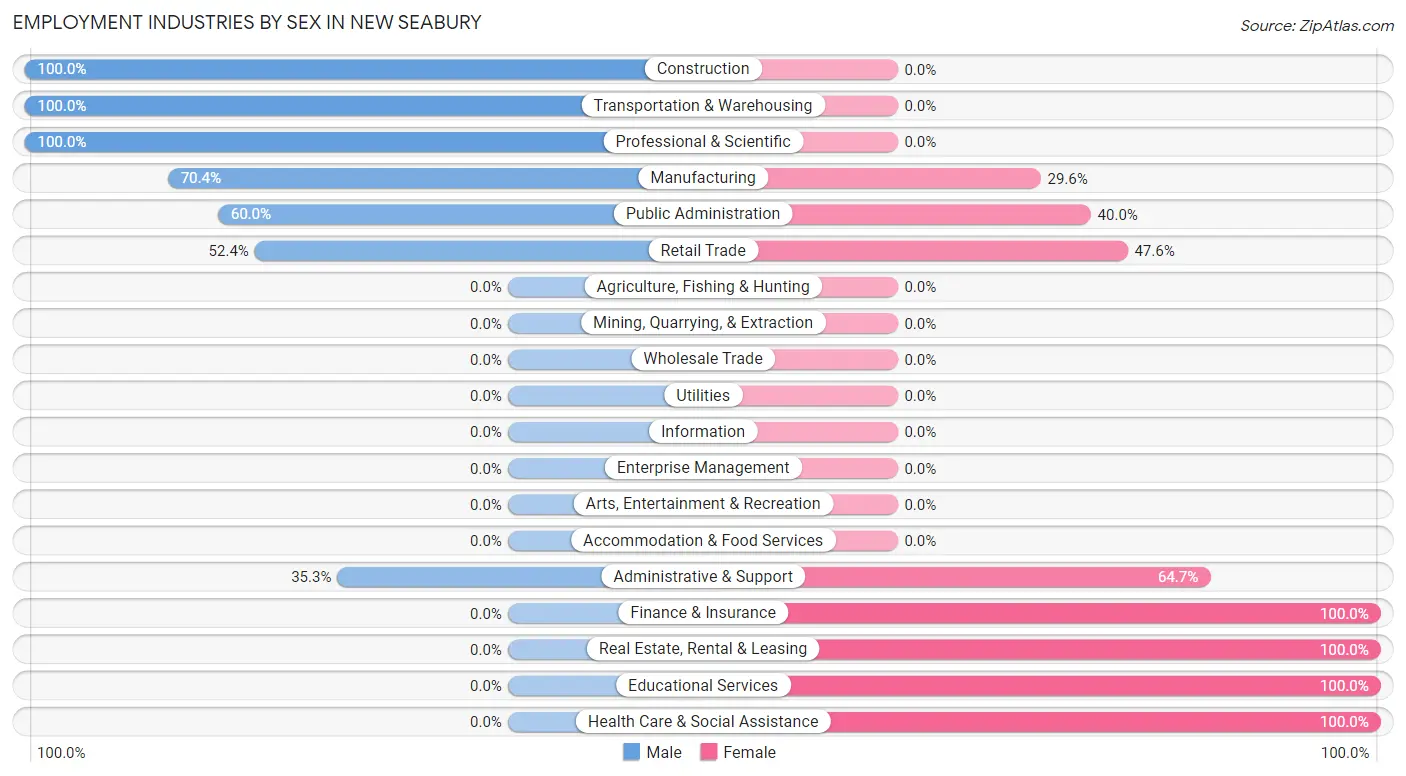
| Industry | Male | Female |
| Agriculture, Fishing & Hunting | 0 (0.0%) | 0 (0.0%) |
| Mining, Quarrying, & Extraction | 0 (0.0%) | 0 (0.0%) |
| Construction | 18 (100.0%) | 0 (0.0%) |
| Manufacturing | 19 (70.4%) | 8 (29.6%) |
| Wholesale Trade | 0 (0.0%) | 0 (0.0%) |
| Retail Trade | 11 (52.4%) | 10 (47.6%) |
| Transportation & Warehousing | 8 (100.0%) | 0 (0.0%) |
| Utilities | 0 (0.0%) | 0 (0.0%) |
| Information | 0 (0.0%) | 0 (0.0%) |
| Finance & Insurance | 0 (0.0%) | 9 (100.0%) |
| Real Estate, Rental & Leasing | 0 (0.0%) | 29 (100.0%) |
| Professional & Scientific | 55 (100.0%) | 0 (0.0%) |
| Enterprise Management | 0 (0.0%) | 0 (0.0%) |
| Administrative & Support | 6 (35.3%) | 11 (64.7%) |
| Educational Services | 0 (0.0%) | 2 (100.0%) |
| Health Care & Social Assistance | 0 (0.0%) | 27 (100.0%) |
| Arts, Entertainment & Recreation | 0 (0.0%) | 0 (0.0%) |
| Accommodation & Food Services | 0 (0.0%) | 0 (0.0%) |
| Public Administration | 12 (60.0%) | 8 (40.0%) |
| Total | 129 (55.4%) | 104 (44.6%) |
Education in New Seabury
School Enrollment in New Seabury
The most common levels of schooling among the 69 students in New Seabury are college / undergraduate (25 | 36.2%), high school (17 | 24.6%), and kindergarten (14 | 20.3%).
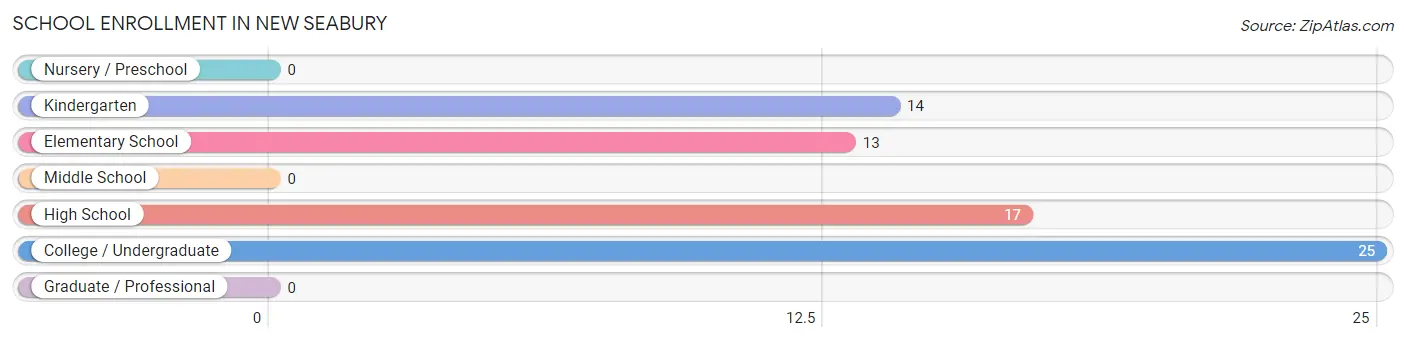
| School Level | # Students | % Students |
| Nursery / Preschool | 0 | 0.0% |
| Kindergarten | 14 | 20.3% |
| Elementary School | 13 | 18.8% |
| Middle School | 0 | 0.0% |
| High School | 17 | 24.6% |
| College / Undergraduate | 25 | 36.2% |
| Graduate / Professional | 0 | 0.0% |
| Total | 69 | 100.0% |
School Enrollment by Age by Funding Source in New Seabury
Out of a total of 69 students who are enrolled in schools in New Seabury, 35 (50.7%) attend a private institution, while the remaining 34 (49.3%) are enrolled in public schools. The age group of 18 to 19 year olds has the highest likelihood of being enrolled in private schools, with 22 (100.0% in the age bracket) enrolled. Conversely, the age group of 5 to 9 year old has the lowest likelihood of being enrolled in a private school, with 27 (100.0% in the age bracket) attending a public institution.
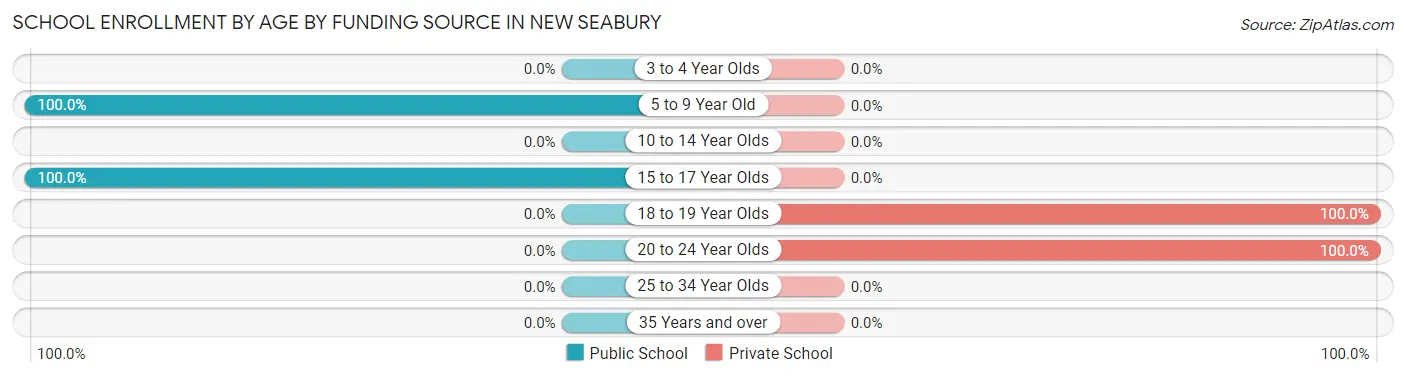
| Age Bracket | Public School | Private School |
| 3 to 4 Year Olds | 0 (0.0%) | 0 (0.0%) |
| 5 to 9 Year Old | 27 (100.0%) | 0 (0.0%) |
| 10 to 14 Year Olds | 0 (0.0%) | 0 (0.0%) |
| 15 to 17 Year Olds | 7 (100.0%) | 0 (0.0%) |
| 18 to 19 Year Olds | 0 (0.0%) | 22 (100.0%) |
| 20 to 24 Year Olds | 0 (0.0%) | 13 (100.0%) |
| 25 to 34 Year Olds | 0 (0.0%) | 0 (0.0%) |
| 35 Years and over | 0 (0.0%) | 0 (0.0%) |
| Total | 34 (49.3%) | 35 (50.7%) |
Educational Attainment by Field of Study in New Seabury
Education (104 | 20.2%), business (98 | 19.0%), social sciences (65 | 12.6%), engineering (55 | 10.7%), and psychology (37 | 7.2%) are the most common fields of study among 516 individuals in New Seabury who have obtained a bachelor's degree or higher.
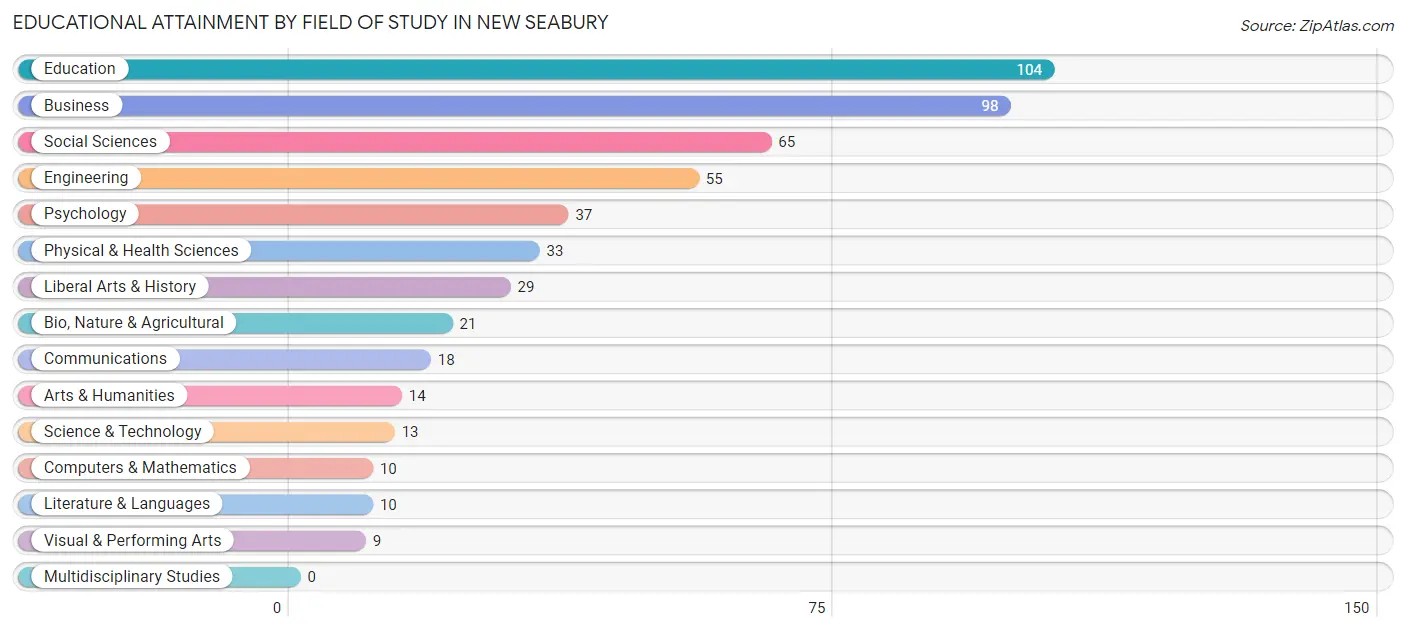
| Field of Study | # Graduates | % Graduates |
| Computers & Mathematics | 10 | 1.9% |
| Bio, Nature & Agricultural | 21 | 4.1% |
| Physical & Health Sciences | 33 | 6.4% |
| Psychology | 37 | 7.2% |
| Social Sciences | 65 | 12.6% |
| Engineering | 55 | 10.7% |
| Multidisciplinary Studies | 0 | 0.0% |
| Science & Technology | 13 | 2.5% |
| Business | 98 | 19.0% |
| Education | 104 | 20.2% |
| Literature & Languages | 10 | 1.9% |
| Liberal Arts & History | 29 | 5.6% |
| Visual & Performing Arts | 9 | 1.7% |
| Communications | 18 | 3.5% |
| Arts & Humanities | 14 | 2.7% |
| Total | 516 | 100.0% |
Transportation & Commute in New Seabury
Vehicle Availability by Sex in New Seabury
The most prevalent vehicle ownership categories in New Seabury are males with 1 vehicle (47, accounting for 32.9%) and females with 1 vehicle (9, making up 45.2%).
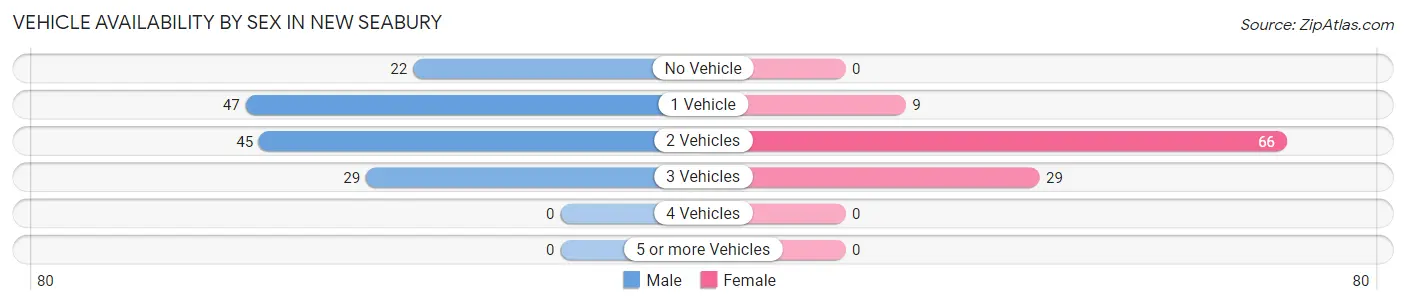
| Vehicles Available | Male | Female |
| No Vehicle | 22 (15.4%) | 0 (0.0%) |
| 1 Vehicle | 47 (32.9%) | 9 (8.6%) |
| 2 Vehicles | 45 (31.5%) | 66 (63.5%) |
| 3 Vehicles | 29 (20.3%) | 29 (27.9%) |
| 4 Vehicles | 0 (0.0%) | 0 (0.0%) |
| 5 or more Vehicles | 0 (0.0%) | 0 (0.0%) |
| Total | 143 (100.0%) | 104 (100.0%) |
Commute Time in New Seabury
The most frequently occuring commute durations in New Seabury are 90 or more minutes (49 commuters, 28.8%), 60 to 89 minutes (45 commuters, 26.5%), and 15 to 19 minutes (20 commuters, 11.8%).
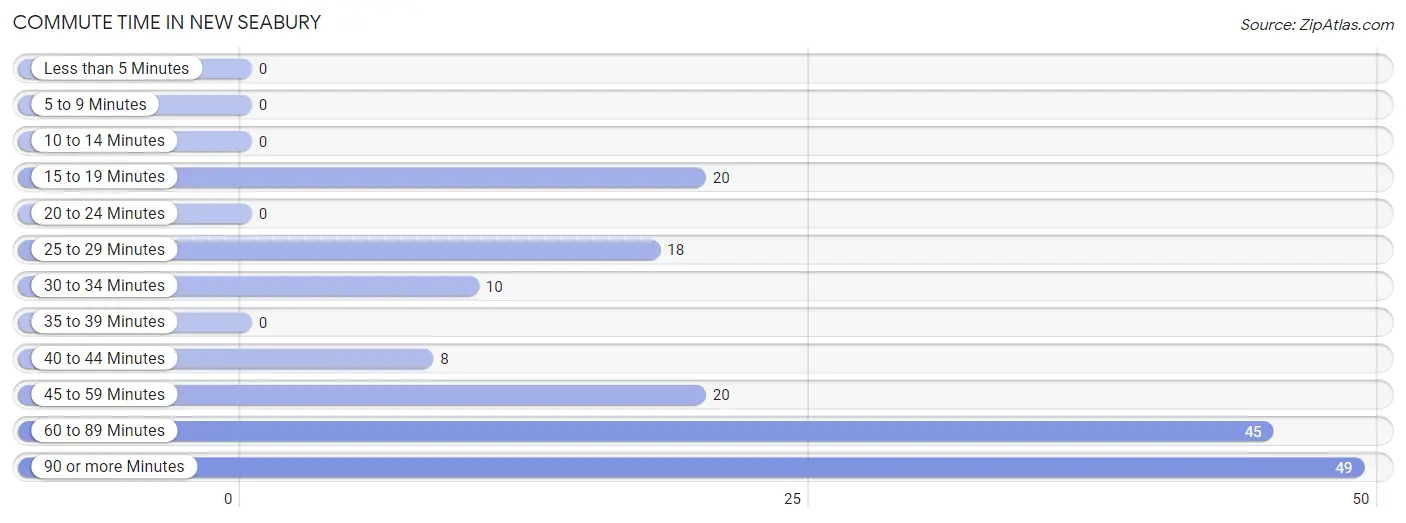
| Commute Time | # Commuters | % Commuters |
| Less than 5 Minutes | 0 | 0.0% |
| 5 to 9 Minutes | 0 | 0.0% |
| 10 to 14 Minutes | 0 | 0.0% |
| 15 to 19 Minutes | 20 | 11.8% |
| 20 to 24 Minutes | 0 | 0.0% |
| 25 to 29 Minutes | 18 | 10.6% |
| 30 to 34 Minutes | 10 | 5.9% |
| 35 to 39 Minutes | 0 | 0.0% |
| 40 to 44 Minutes | 8 | 4.7% |
| 45 to 59 Minutes | 20 | 11.8% |
| 60 to 89 Minutes | 45 | 26.5% |
| 90 or more Minutes | 49 | 28.8% |
Commute Time by Sex in New Seabury
The most common commute times in New Seabury are 90 or more minutes (49 commuters, 51.6%) for males and 60 to 89 minutes (27 commuters, 36.0%) for females.
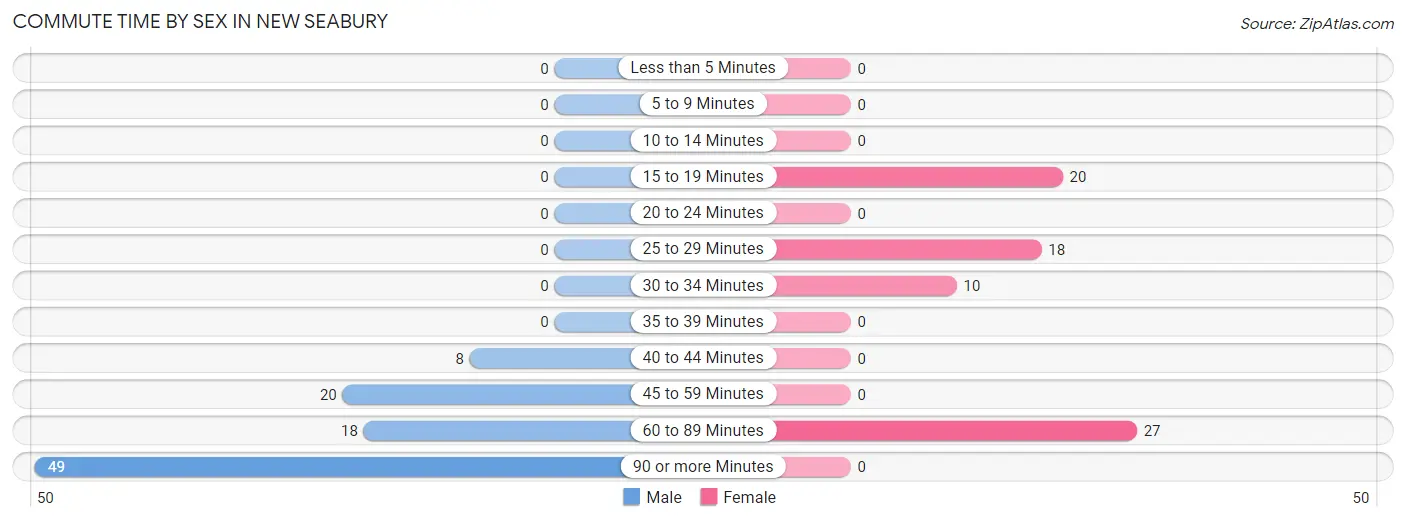
| Commute Time | Male | Female |
| Less than 5 Minutes | 0 (0.0%) | 0 (0.0%) |
| 5 to 9 Minutes | 0 (0.0%) | 0 (0.0%) |
| 10 to 14 Minutes | 0 (0.0%) | 0 (0.0%) |
| 15 to 19 Minutes | 0 (0.0%) | 20 (26.7%) |
| 20 to 24 Minutes | 0 (0.0%) | 0 (0.0%) |
| 25 to 29 Minutes | 0 (0.0%) | 18 (24.0%) |
| 30 to 34 Minutes | 0 (0.0%) | 10 (13.3%) |
| 35 to 39 Minutes | 0 (0.0%) | 0 (0.0%) |
| 40 to 44 Minutes | 8 (8.4%) | 0 (0.0%) |
| 45 to 59 Minutes | 20 (21.0%) | 0 (0.0%) |
| 60 to 89 Minutes | 18 (19.0%) | 27 (36.0%) |
| 90 or more Minutes | 49 (51.6%) | 0 (0.0%) |
Time of Departure to Work by Sex in New Seabury
The most frequent times of departure to work in New Seabury are 6:30 AM to 6:59 AM (29, 30.5%) for males and 8:00 AM to 8:29 AM (20, 26.7%) for females.
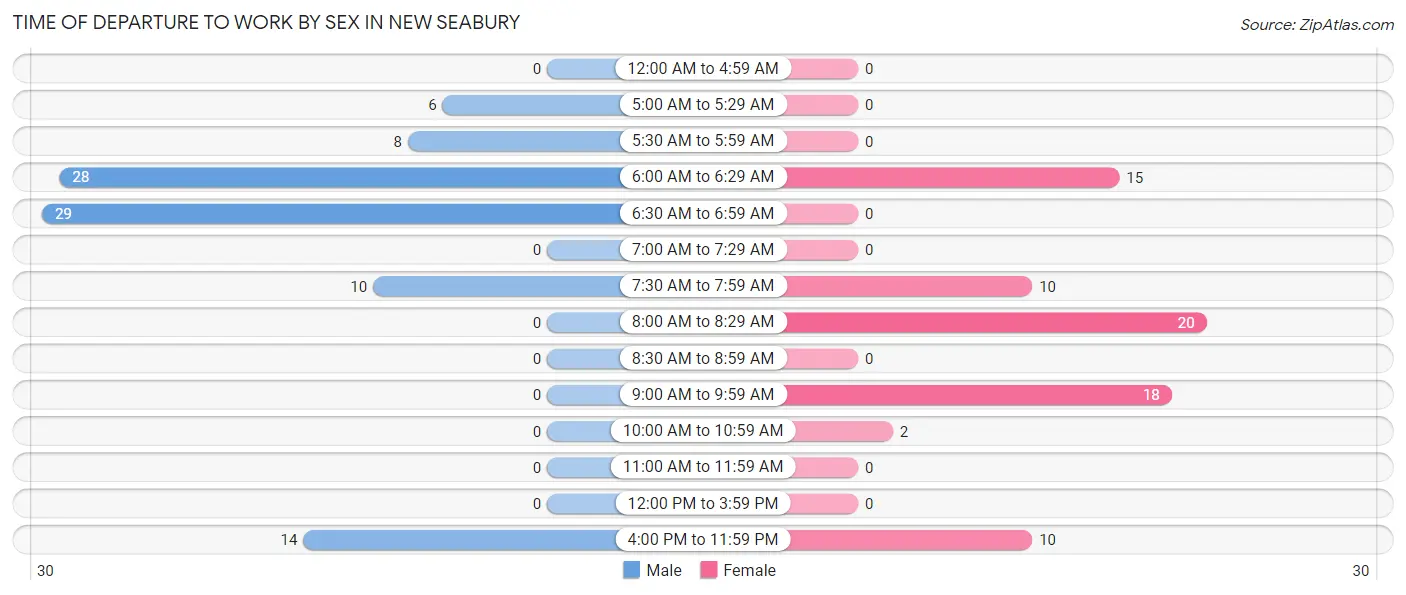
| Time of Departure | Male | Female |
| 12:00 AM to 4:59 AM | 0 (0.0%) | 0 (0.0%) |
| 5:00 AM to 5:29 AM | 6 (6.3%) | 0 (0.0%) |
| 5:30 AM to 5:59 AM | 8 (8.4%) | 0 (0.0%) |
| 6:00 AM to 6:29 AM | 28 (29.5%) | 15 (20.0%) |
| 6:30 AM to 6:59 AM | 29 (30.5%) | 0 (0.0%) |
| 7:00 AM to 7:29 AM | 0 (0.0%) | 0 (0.0%) |
| 7:30 AM to 7:59 AM | 10 (10.5%) | 10 (13.3%) |
| 8:00 AM to 8:29 AM | 0 (0.0%) | 20 (26.7%) |
| 8:30 AM to 8:59 AM | 0 (0.0%) | 0 (0.0%) |
| 9:00 AM to 9:59 AM | 0 (0.0%) | 18 (24.0%) |
| 10:00 AM to 10:59 AM | 0 (0.0%) | 2 (2.7%) |
| 11:00 AM to 11:59 AM | 0 (0.0%) | 0 (0.0%) |
| 12:00 PM to 3:59 PM | 0 (0.0%) | 0 (0.0%) |
| 4:00 PM to 11:59 PM | 14 (14.7%) | 10 (13.3%) |
| Total | 95 (100.0%) | 75 (100.0%) |
Housing Occupancy in New Seabury
Occupancy by Ownership in New Seabury
Of the total 384 dwellings in New Seabury, owner-occupied units account for 358 (93.2%), while renter-occupied units make up 26 (6.8%).
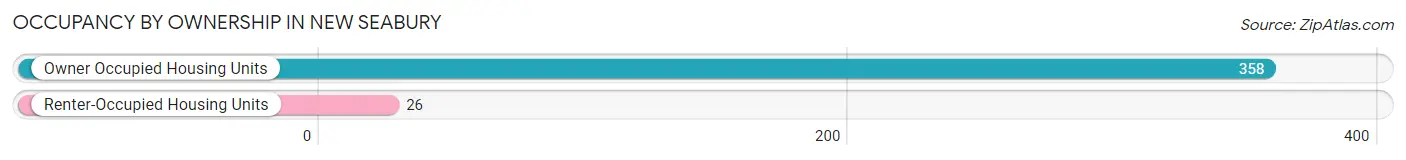
| Occupancy | # Housing Units | % Housing Units |
| Owner Occupied Housing Units | 358 | 93.2% |
| Renter-Occupied Housing Units | 26 | 6.8% |
| Total Occupied Housing Units | 384 | 100.0% |
Occupancy by Household Size in New Seabury
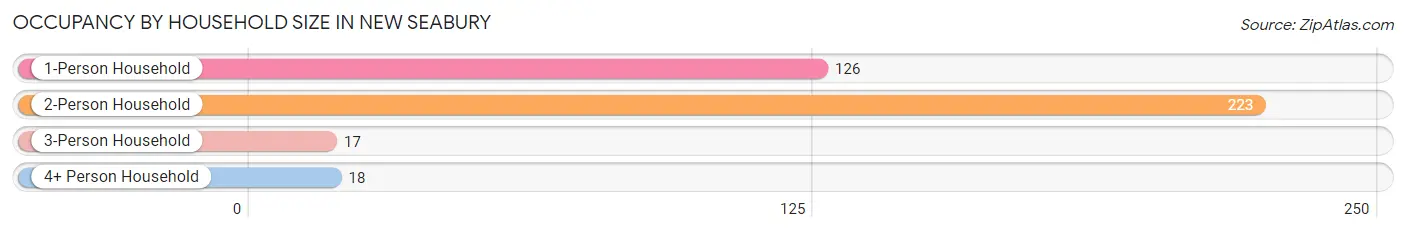
| Household Size | # Housing Units | % Housing Units |
| 1-Person Household | 126 | 32.8% |
| 2-Person Household | 223 | 58.1% |
| 3-Person Household | 17 | 4.4% |
| 4+ Person Household | 18 | 4.7% |
| Total Housing Units | 384 | 100.0% |
Occupancy by Ownership by Household Size in New Seabury
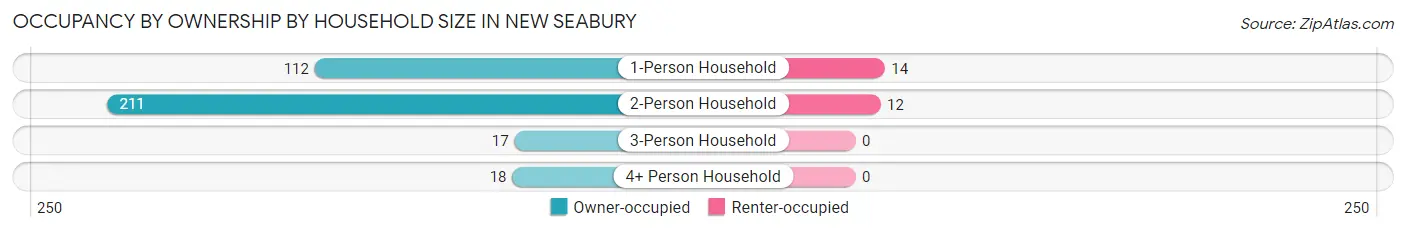
| Household Size | Owner-occupied | Renter-occupied |
| 1-Person Household | 112 (88.9%) | 14 (11.1%) |
| 2-Person Household | 211 (94.6%) | 12 (5.4%) |
| 3-Person Household | 17 (100.0%) | 0 (0.0%) |
| 4+ Person Household | 18 (100.0%) | 0 (0.0%) |
| Total Housing Units | 358 (93.2%) | 26 (6.8%) |
Occupancy by Educational Attainment in New Seabury
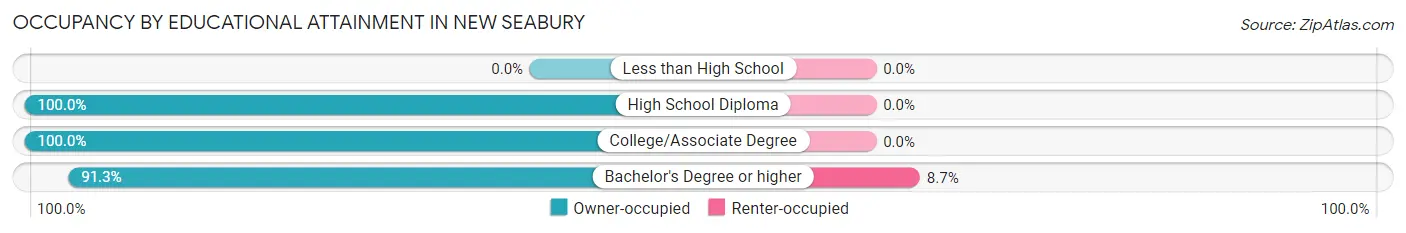
| Household Size | Owner-occupied | Renter-occupied |
| Less than High School | 0 (0.0%) | 0 (0.0%) |
| High School Diploma | 20 (100.0%) | 0 (0.0%) |
| College/Associate Degree | 64 (100.0%) | 0 (0.0%) |
| Bachelor's Degree or higher | 274 (91.3%) | 26 (8.7%) |
Occupancy by Age of Householder in New Seabury
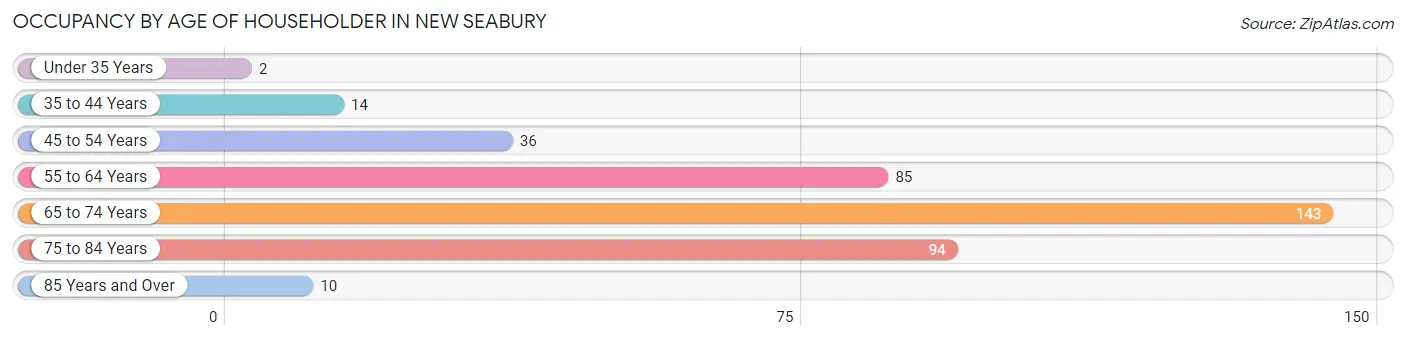
| Age Bracket | # Households | % Households |
| Under 35 Years | 2 | 0.5% |
| 35 to 44 Years | 14 | 3.6% |
| 45 to 54 Years | 36 | 9.4% |
| 55 to 64 Years | 85 | 22.1% |
| 65 to 74 Years | 143 | 37.2% |
| 75 to 84 Years | 94 | 24.5% |
| 85 Years and Over | 10 | 2.6% |
| Total | 384 | 100.0% |
Housing Finances in New Seabury
Median Income by Occupancy in New Seabury
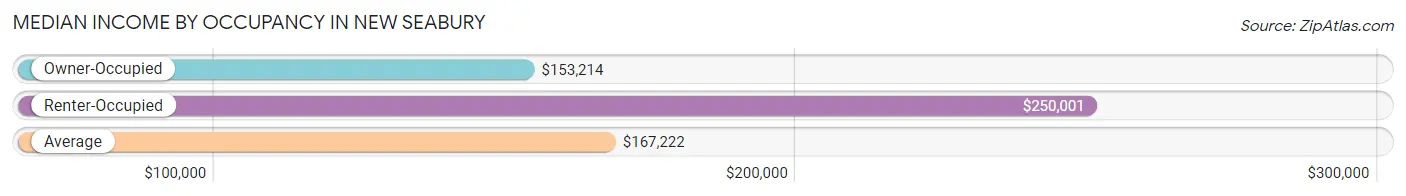
| Occupancy Type | # Households | Median Income |
| Owner-Occupied | 358 (93.2%) | $153,214 |
| Renter-Occupied | 26 (6.8%) | $250,001 |
| Average | 384 (100.0%) | $167,222 |
Occupancy by Householder Income Bracket in New Seabury
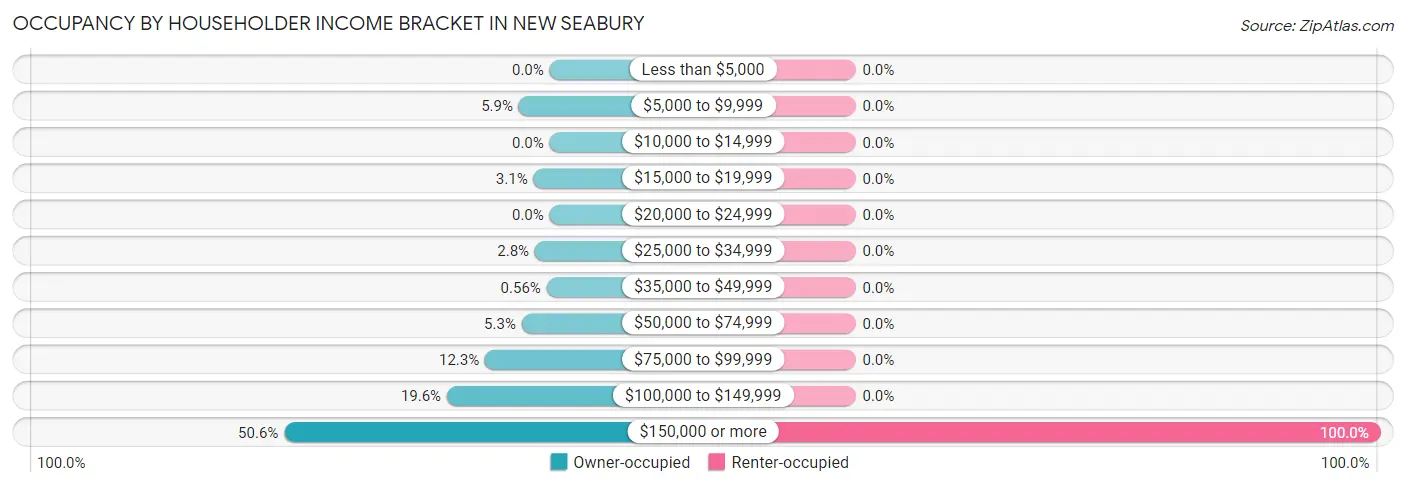
| Income Bracket | Owner-occupied | Renter-occupied |
| Less than $5,000 | 0 (0.0%) | 0 (0.0%) |
| $5,000 to $9,999 | 21 (5.9%) | 0 (0.0%) |
| $10,000 to $14,999 | 0 (0.0%) | 0 (0.0%) |
| $15,000 to $19,999 | 11 (3.1%) | 0 (0.0%) |
| $20,000 to $24,999 | 0 (0.0%) | 0 (0.0%) |
| $25,000 to $34,999 | 10 (2.8%) | 0 (0.0%) |
| $35,000 to $49,999 | 2 (0.6%) | 0 (0.0%) |
| $50,000 to $74,999 | 19 (5.3%) | 0 (0.0%) |
| $75,000 to $99,999 | 44 (12.3%) | 0 (0.0%) |
| $100,000 to $149,999 | 70 (19.6%) | 0 (0.0%) |
| $150,000 or more | 181 (50.6%) | 26 (100.0%) |
| Total | 358 (100.0%) | 26 (100.0%) |
Monthly Housing Cost Tiers in New Seabury
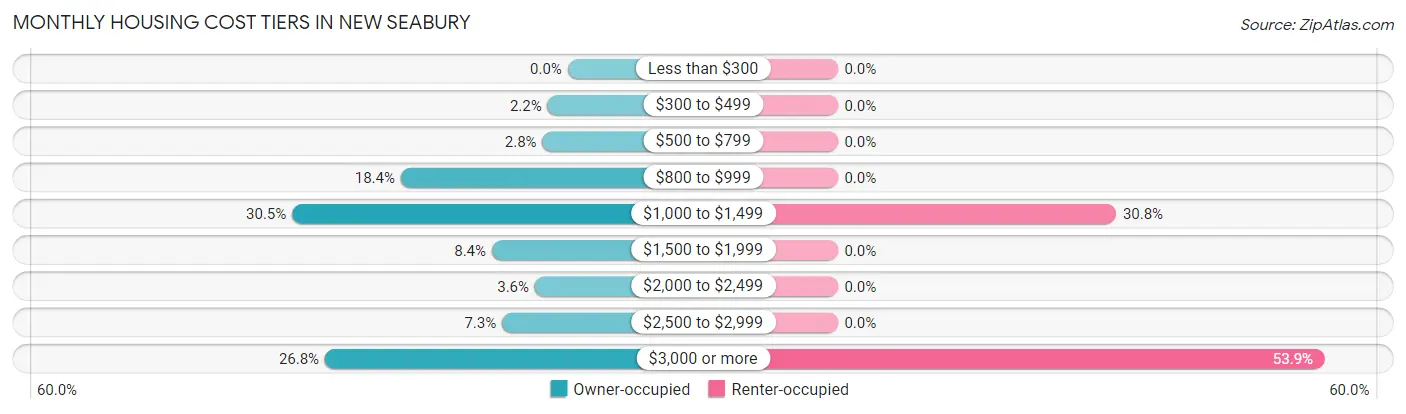
| Monthly Cost | Owner-occupied | Renter-occupied |
| Less than $300 | 0 (0.0%) | 0 (0.0%) |
| $300 to $499 | 8 (2.2%) | 0 (0.0%) |
| $500 to $799 | 10 (2.8%) | 0 (0.0%) |
| $800 to $999 | 66 (18.4%) | 0 (0.0%) |
| $1,000 to $1,499 | 109 (30.4%) | 8 (30.8%) |
| $1,500 to $1,999 | 30 (8.4%) | 0 (0.0%) |
| $2,000 to $2,499 | 13 (3.6%) | 0 (0.0%) |
| $2,500 to $2,999 | 26 (7.3%) | 0 (0.0%) |
| $3,000 or more | 96 (26.8%) | 14 (53.8%) |
| Total | 358 (100.0%) | 26 (100.0%) |
Physical Housing Characteristics in New Seabury
Housing Structures in New Seabury
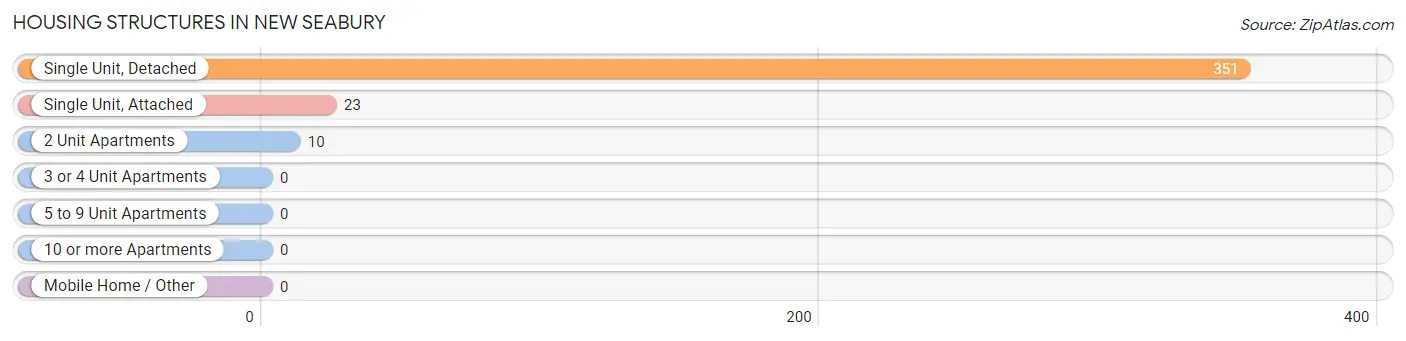
| Structure Type | # Housing Units | % Housing Units |
| Single Unit, Detached | 351 | 91.4% |
| Single Unit, Attached | 23 | 6.0% |
| 2 Unit Apartments | 10 | 2.6% |
| 3 or 4 Unit Apartments | 0 | 0.0% |
| 5 to 9 Unit Apartments | 0 | 0.0% |
| 10 or more Apartments | 0 | 0.0% |
| Mobile Home / Other | 0 | 0.0% |
| Total | 384 | 100.0% |
Housing Structures by Occupancy in New Seabury
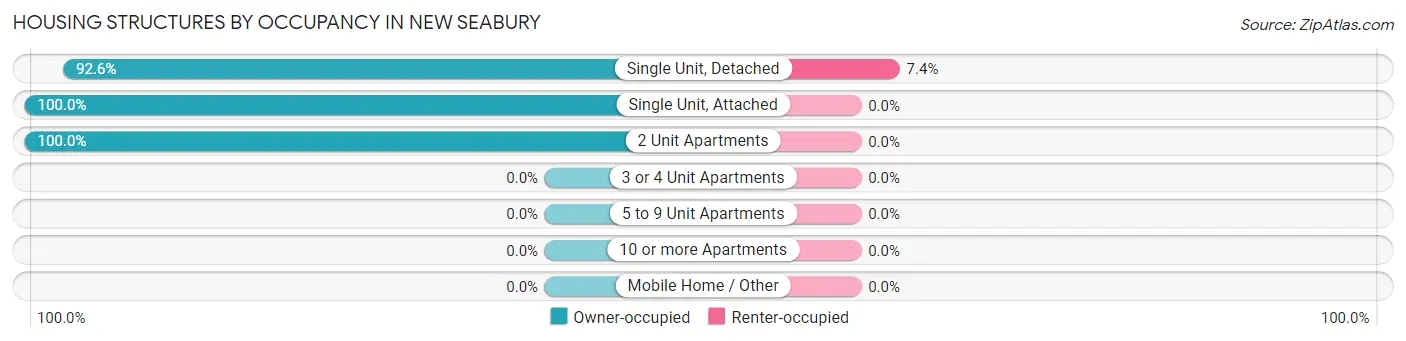
| Structure Type | Owner-occupied | Renter-occupied |
| Single Unit, Detached | 325 (92.6%) | 26 (7.4%) |
| Single Unit, Attached | 23 (100.0%) | 0 (0.0%) |
| 2 Unit Apartments | 10 (100.0%) | 0 (0.0%) |
| 3 or 4 Unit Apartments | 0 (0.0%) | 0 (0.0%) |
| 5 to 9 Unit Apartments | 0 (0.0%) | 0 (0.0%) |
| 10 or more Apartments | 0 (0.0%) | 0 (0.0%) |
| Mobile Home / Other | 0 (0.0%) | 0 (0.0%) |
| Total | 358 (93.2%) | 26 (6.8%) |
Housing Structures by Number of Rooms in New Seabury
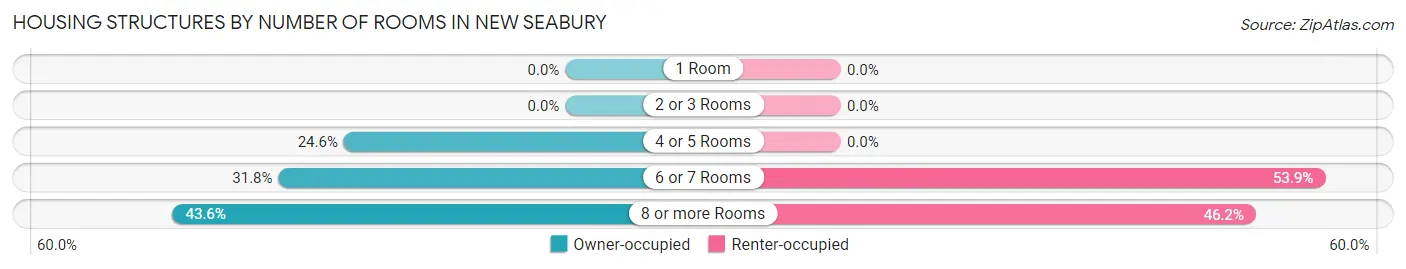
| Number of Rooms | Owner-occupied | Renter-occupied |
| 1 Room | 0 (0.0%) | 0 (0.0%) |
| 2 or 3 Rooms | 0 (0.0%) | 0 (0.0%) |
| 4 or 5 Rooms | 88 (24.6%) | 0 (0.0%) |
| 6 or 7 Rooms | 114 (31.8%) | 14 (53.8%) |
| 8 or more Rooms | 156 (43.6%) | 12 (46.2%) |
| Total | 358 (100.0%) | 26 (100.0%) |
Housing Structure by Heating Type in New Seabury
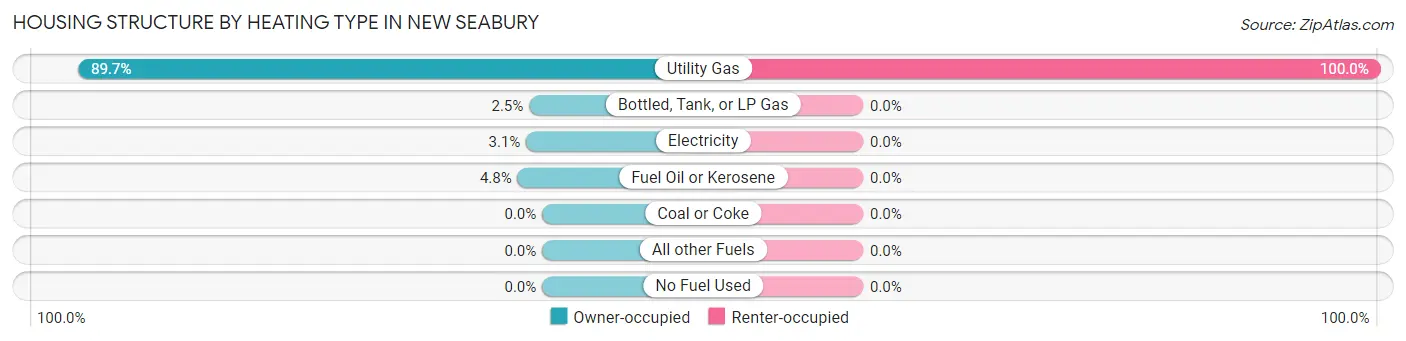
| Heating Type | Owner-occupied | Renter-occupied |
| Utility Gas | 321 (89.7%) | 26 (100.0%) |
| Bottled, Tank, or LP Gas | 9 (2.5%) | 0 (0.0%) |
| Electricity | 11 (3.1%) | 0 (0.0%) |
| Fuel Oil or Kerosene | 17 (4.8%) | 0 (0.0%) |
| Coal or Coke | 0 (0.0%) | 0 (0.0%) |
| All other Fuels | 0 (0.0%) | 0 (0.0%) |
| No Fuel Used | 0 (0.0%) | 0 (0.0%) |
| Total | 358 (100.0%) | 26 (100.0%) |
Household Vehicle Usage in New Seabury
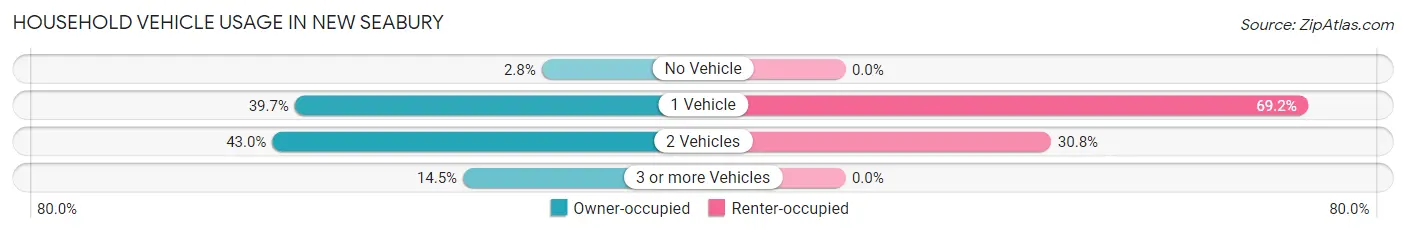
| Vehicles per Household | Owner-occupied | Renter-occupied |
| No Vehicle | 10 (2.8%) | 0 (0.0%) |
| 1 Vehicle | 142 (39.7%) | 18 (69.2%) |
| 2 Vehicles | 154 (43.0%) | 8 (30.8%) |
| 3 or more Vehicles | 52 (14.5%) | 0 (0.0%) |
| Total | 358 (100.0%) | 26 (100.0%) |
Real Estate & Mortgages in New Seabury
Real Estate and Mortgage Overview in New Seabury
| Characteristic | Without Mortgage | With Mortgage |
| Housing Units | 194 | 164 |
| Median Property Value | $743,400 | $745,200 |
| Median Household Income | $109,773 | $117 |
| Monthly Housing Costs | $1,086 | $87 |
| Real Estate Taxes | $5,588 | $8 |
Property Value by Mortgage Status in New Seabury
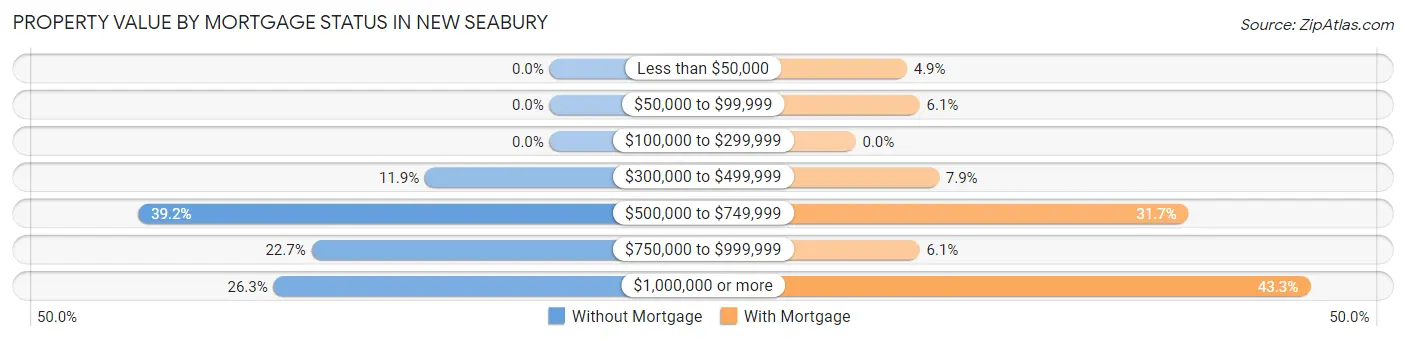
| Property Value | Without Mortgage | With Mortgage |
| Less than $50,000 | 0 (0.0%) | 8 (4.9%) |
| $50,000 to $99,999 | 0 (0.0%) | 10 (6.1%) |
| $100,000 to $299,999 | 0 (0.0%) | 0 (0.0%) |
| $300,000 to $499,999 | 23 (11.9%) | 13 (7.9%) |
| $500,000 to $749,999 | 76 (39.2%) | 52 (31.7%) |
| $750,000 to $999,999 | 44 (22.7%) | 10 (6.1%) |
| $1,000,000 or more | 51 (26.3%) | 71 (43.3%) |
| Total | 194 (100.0%) | 164 (100.0%) |
Household Income by Mortgage Status in New Seabury
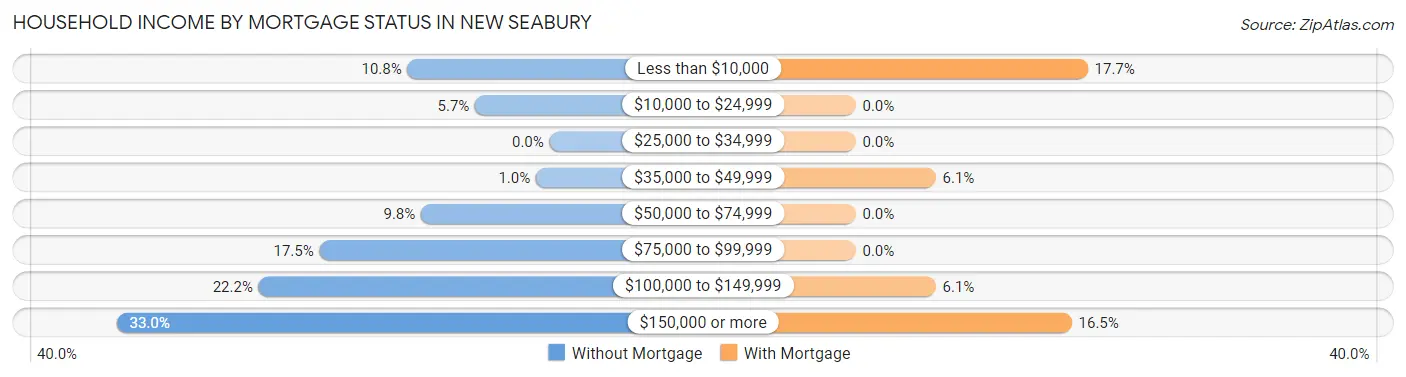
| Household Income | Without Mortgage | With Mortgage |
| Less than $10,000 | 21 (10.8%) | 29 (17.7%) |
| $10,000 to $24,999 | 11 (5.7%) | 0 (0.0%) |
| $25,000 to $34,999 | 0 (0.0%) | 0 (0.0%) |
| $35,000 to $49,999 | 2 (1.0%) | 10 (6.1%) |
| $50,000 to $74,999 | 19 (9.8%) | 0 (0.0%) |
| $75,000 to $99,999 | 34 (17.5%) | 0 (0.0%) |
| $100,000 to $149,999 | 43 (22.2%) | 10 (6.1%) |
| $150,000 or more | 64 (33.0%) | 27 (16.5%) |
| Total | 194 (100.0%) | 164 (100.0%) |
Property Value to Household Income Ratio in New Seabury
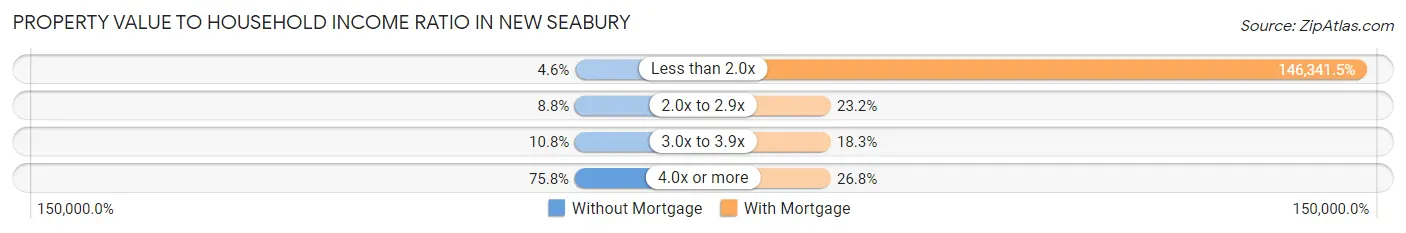
| Value-to-Income Ratio | Without Mortgage | With Mortgage |
| Less than 2.0x | 9 (4.6%) | 240,000 (146,341.5%) |
| 2.0x to 2.9x | 17 (8.8%) | 38 (23.2%) |
| 3.0x to 3.9x | 21 (10.8%) | 30 (18.3%) |
| 4.0x or more | 147 (75.8%) | 44 (26.8%) |
| Total | 194 (100.0%) | 164 (100.0%) |
Real Estate Taxes by Mortgage Status in New Seabury
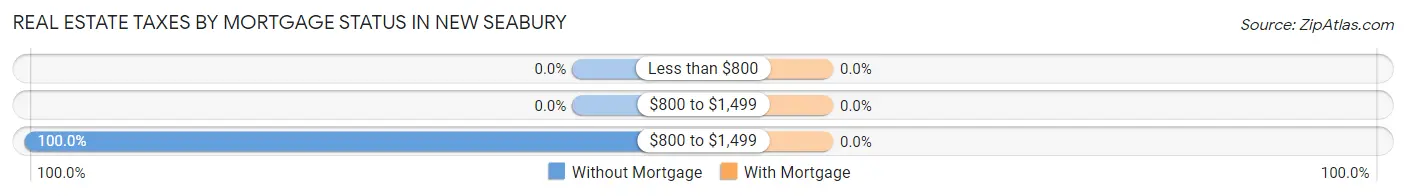
| Property Taxes | Without Mortgage | With Mortgage |
| Less than $800 | 0 (0.0%) | 0 (0.0%) |
| $800 to $1,499 | 0 (0.0%) | 0 (0.0%) |
| $800 to $1,499 | 194 (100.0%) | 0 (0.0%) |
| Total | 194 (100.0%) | 164 (100.0%) |
Health & Disability in New Seabury
Health Insurance Coverage by Age in New Seabury
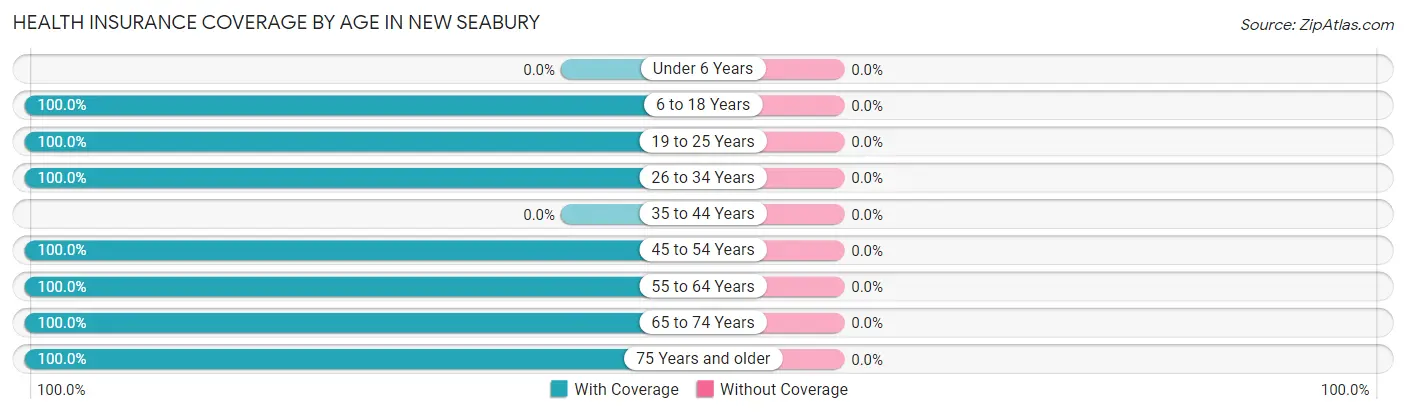
| Age Bracket | With Coverage | Without Coverage |
| Under 6 Years | 0 (0.0%) | 0 (0.0%) |
| 6 to 18 Years | 44 (100.0%) | 0 (0.0%) |
| 19 to 25 Years | 25 (100.0%) | 0 (0.0%) |
| 26 to 34 Years | 14 (100.0%) | 0 (0.0%) |
| 35 to 44 Years | 0 (0.0%) | 0 (0.0%) |
| 45 to 54 Years | 66 (100.0%) | 0 (0.0%) |
| 55 to 64 Years | 198 (100.0%) | 0 (0.0%) |
| 65 to 74 Years | 208 (100.0%) | 0 (0.0%) |
| 75 Years and older | 169 (100.0%) | 0 (0.0%) |
| Total | 724 (100.0%) | 0 (0.0%) |
Health Insurance Coverage by Citizenship Status in New Seabury
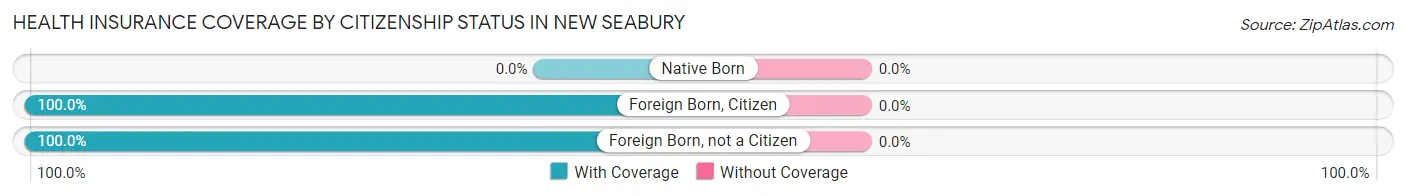
| Citizenship Status | With Coverage | Without Coverage |
| Native Born | 0 (0.0%) | 0 (0.0%) |
| Foreign Born, Citizen | 44 (100.0%) | 0 (0.0%) |
| Foreign Born, not a Citizen | 25 (100.0%) | 0 (0.0%) |
Health Insurance Coverage by Household Income in New Seabury
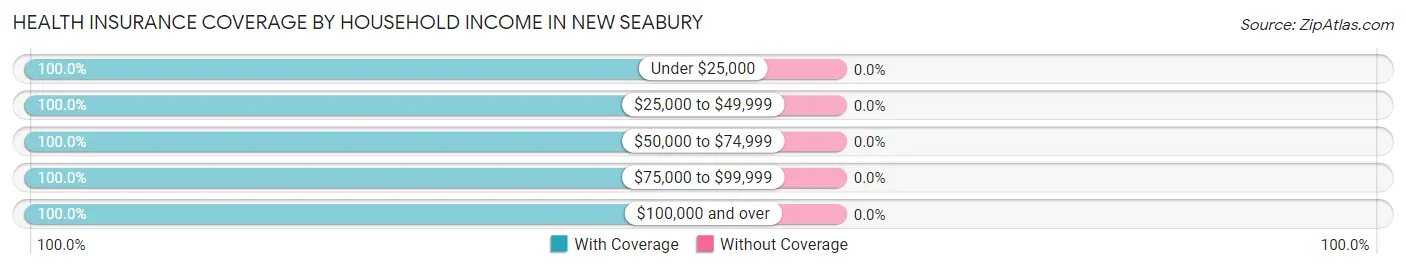
| Household Income | With Coverage | Without Coverage |
| Under $25,000 | 41 (100.0%) | 0 (0.0%) |
| $25,000 to $49,999 | 22 (100.0%) | 0 (0.0%) |
| $50,000 to $74,999 | 29 (100.0%) | 0 (0.0%) |
| $75,000 to $99,999 | 62 (100.0%) | 0 (0.0%) |
| $100,000 and over | 570 (100.0%) | 0 (0.0%) |
Public vs Private Health Insurance Coverage by Age in New Seabury
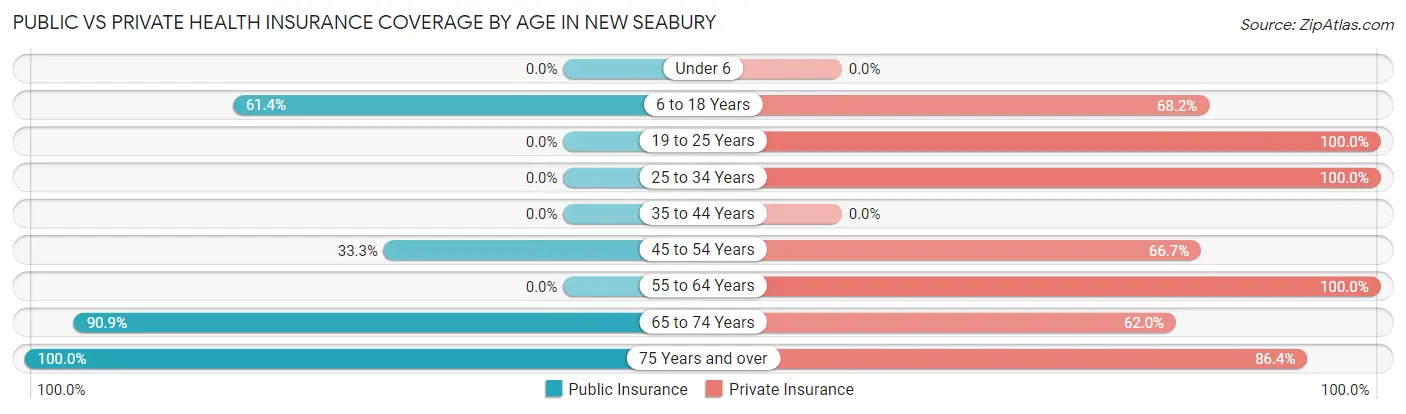
| Age Bracket | Public Insurance | Private Insurance |
| Under 6 | 0 (0.0%) | 0 (0.0%) |
| 6 to 18 Years | 27 (61.4%) | 30 (68.2%) |
| 19 to 25 Years | 0 (0.0%) | 25 (100.0%) |
| 25 to 34 Years | 0 (0.0%) | 14 (100.0%) |
| 35 to 44 Years | 0 (0.0%) | 0 (0.0%) |
| 45 to 54 Years | 22 (33.3%) | 44 (66.7%) |
| 55 to 64 Years | 0 (0.0%) | 198 (100.0%) |
| 65 to 74 Years | 189 (90.9%) | 129 (62.0%) |
| 75 Years and over | 169 (100.0%) | 146 (86.4%) |
| Total | 407 (56.2%) | 586 (80.9%) |
Disability Status by Sex by Age in New Seabury
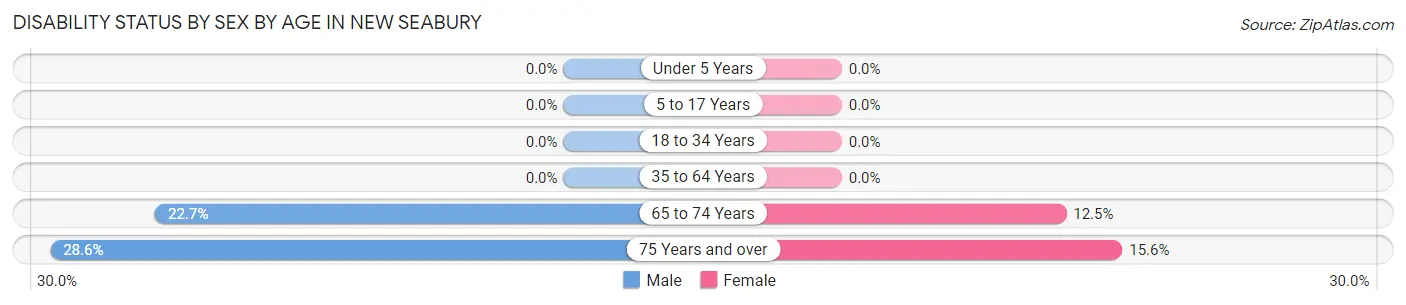
| Age Bracket | Male | Female |
| Under 5 Years | 0 (0.0%) | 0 (0.0%) |
| 5 to 17 Years | 0 (0.0%) | 0 (0.0%) |
| 18 to 34 Years | 0 (0.0%) | 0 (0.0%) |
| 35 to 64 Years | 0 (0.0%) | 0 (0.0%) |
| 65 to 74 Years | 20 (22.7%) | 15 (12.5%) |
| 75 Years and over | 30 (28.6%) | 10 (15.6%) |
Disability Class by Sex by Age in New Seabury
Disability Class: Hearing Difficulty
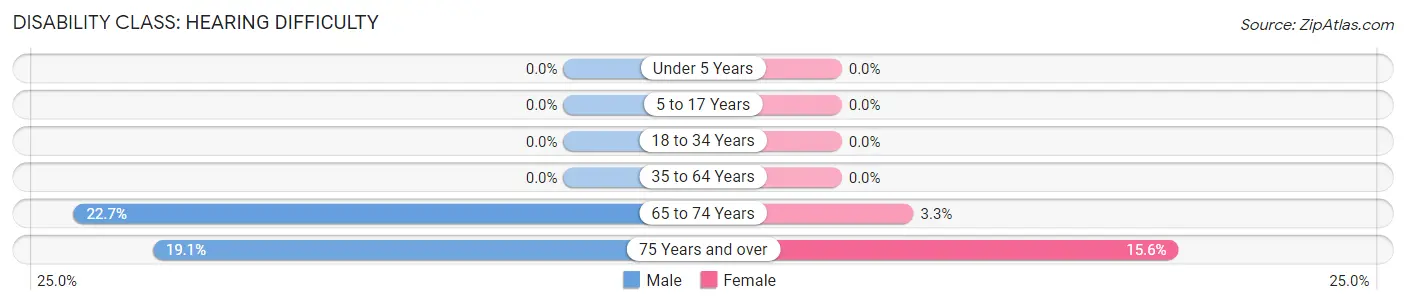
| Age Bracket | Male | Female |
| Under 5 Years | 0 (0.0%) | 0 (0.0%) |
| 5 to 17 Years | 0 (0.0%) | 0 (0.0%) |
| 18 to 34 Years | 0 (0.0%) | 0 (0.0%) |
| 35 to 64 Years | 0 (0.0%) | 0 (0.0%) |
| 65 to 74 Years | 20 (22.7%) | 4 (3.3%) |
| 75 Years and over | 20 (19.1%) | 10 (15.6%) |
Disability Class: Vision Difficulty
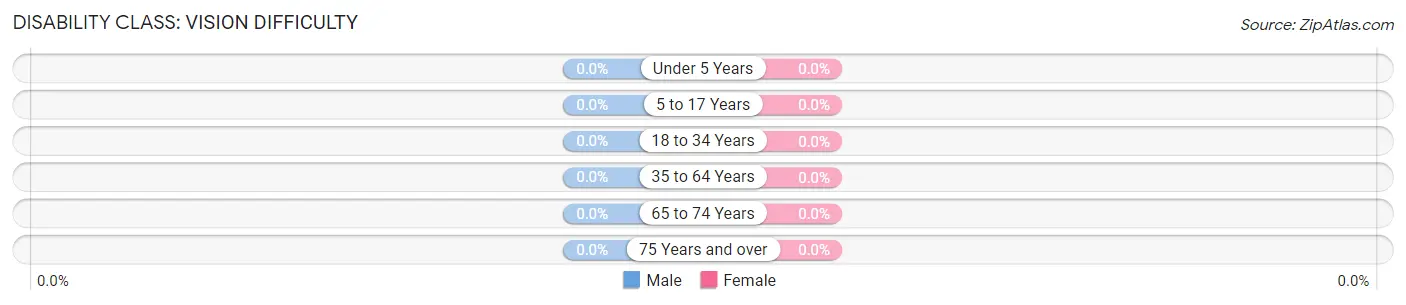
| Age Bracket | Male | Female |
| Under 5 Years | 0 (0.0%) | 0 (0.0%) |
| 5 to 17 Years | 0 (0.0%) | 0 (0.0%) |
| 18 to 34 Years | 0 (0.0%) | 0 (0.0%) |
| 35 to 64 Years | 0 (0.0%) | 0 (0.0%) |
| 65 to 74 Years | 0 (0.0%) | 0 (0.0%) |
| 75 Years and over | 0 (0.0%) | 0 (0.0%) |
Disability Class: Cognitive Difficulty
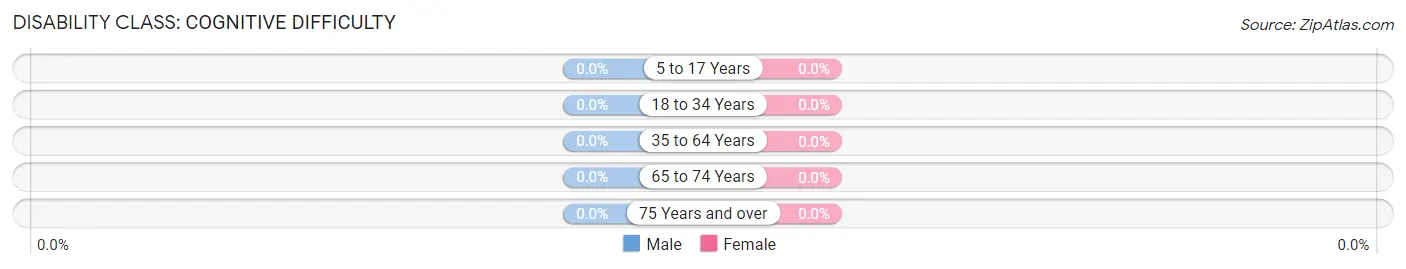
| Age Bracket | Male | Female |
| 5 to 17 Years | 0 (0.0%) | 0 (0.0%) |
| 18 to 34 Years | 0 (0.0%) | 0 (0.0%) |
| 35 to 64 Years | 0 (0.0%) | 0 (0.0%) |
| 65 to 74 Years | 0 (0.0%) | 0 (0.0%) |
| 75 Years and over | 0 (0.0%) | 0 (0.0%) |
Disability Class: Ambulatory Difficulty
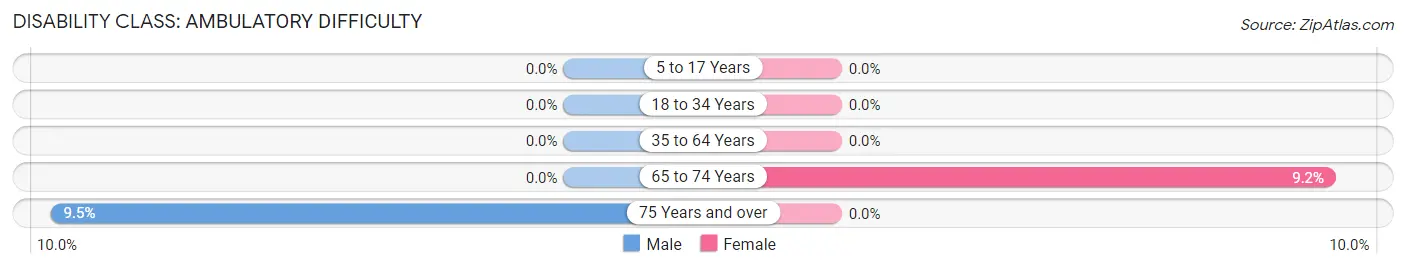
| Age Bracket | Male | Female |
| 5 to 17 Years | 0 (0.0%) | 0 (0.0%) |
| 18 to 34 Years | 0 (0.0%) | 0 (0.0%) |
| 35 to 64 Years | 0 (0.0%) | 0 (0.0%) |
| 65 to 74 Years | 0 (0.0%) | 11 (9.2%) |
| 75 Years and over | 10 (9.5%) | 0 (0.0%) |
Disability Class: Self-Care Difficulty
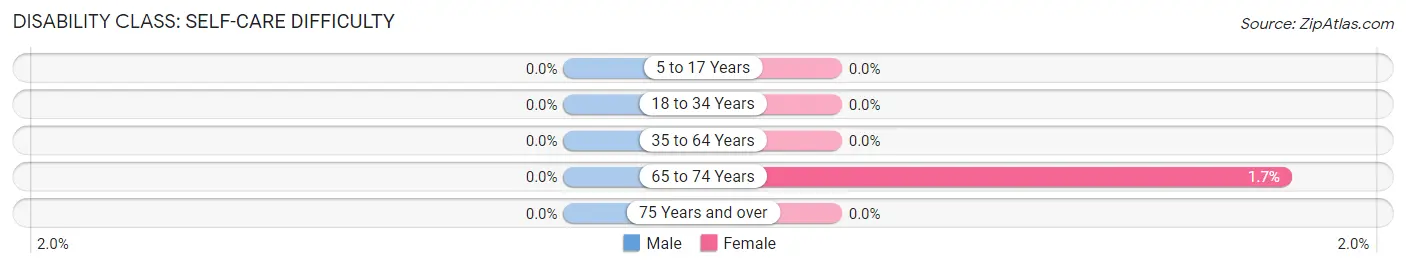
| Age Bracket | Male | Female |
| 5 to 17 Years | 0 (0.0%) | 0 (0.0%) |
| 18 to 34 Years | 0 (0.0%) | 0 (0.0%) |
| 35 to 64 Years | 0 (0.0%) | 0 (0.0%) |
| 65 to 74 Years | 0 (0.0%) | 2 (1.7%) |
| 75 Years and over | 0 (0.0%) | 0 (0.0%) |
Technology Access in New Seabury
Computing Device Access in New Seabury
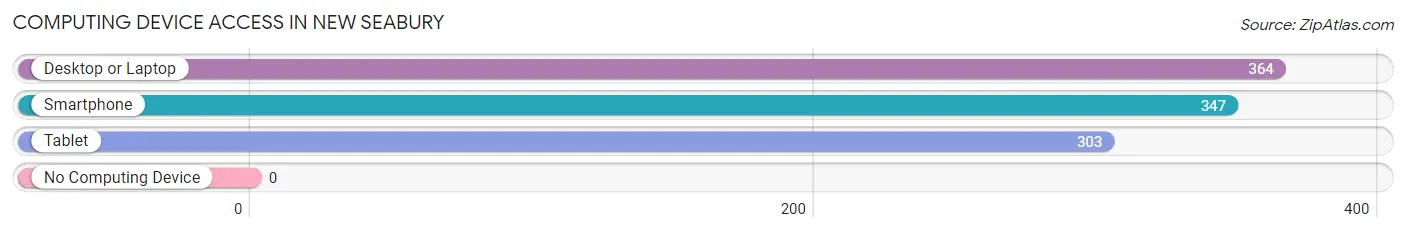
| Device Type | # Households | % Households |
| Desktop or Laptop | 364 | 94.8% |
| Smartphone | 347 | 90.4% |
| Tablet | 303 | 78.9% |
| No Computing Device | 0 | 0.0% |
| Total | 384 | 100.0% |
Internet Access in New Seabury
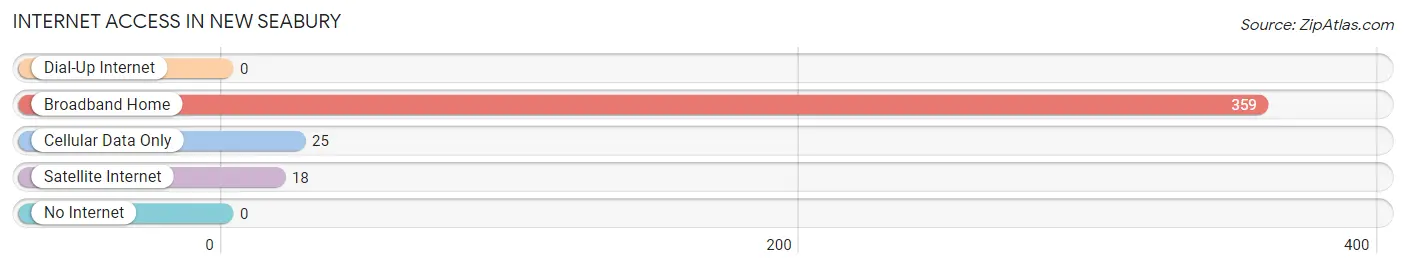
| Internet Type | # Households | % Households |
| Dial-Up Internet | 0 | 0.0% |
| Broadband Home | 359 | 93.5% |
| Cellular Data Only | 25 | 6.5% |
| Satellite Internet | 18 | 4.7% |
| No Internet | 0 | 0.0% |
| Total | 384 | 100.0% |
New Seabury Summary
Seabury is a small town located in the southeastern corner of Massachusetts, in the county of Barnstable. It is situated on the shores of Cape Cod Bay, and is bordered by the towns of Sandwich, Mashpee, and Bourne. The town has a population of approximately 2,000 people, and is a popular tourist destination due to its proximity to the ocean and its many beaches.
History
The area that is now Seabury was originally inhabited by the Wampanoag people, who were part of the Algonquian language family. The first European settlers arrived in the area in 1639, and the town was officially incorporated in 1644. The town was named after the Seabury family, who were among the first settlers.
In the late 19th century, Seabury became a popular summer destination for wealthy families from Boston and New York. The town was home to several large estates, and many of the town’s original buildings still stand today.
Geography
Seabury is located in the southeastern corner of Massachusetts, in the county of Barnstable. It is situated on the shores of Cape Cod Bay, and is bordered by the towns of Sandwich, Mashpee, and Bourne. The town has a total area of 8.2 square miles, of which 7.9 square miles is land and 0.3 square miles is water.
The town is home to several beaches, including Seabury Beach, which is a popular spot for swimming and sunbathing. The town also has several parks, including Seabury Park, which is a popular spot for picnics and outdoor activities.
Economy
The economy of Seabury is largely based on tourism, as the town is a popular destination for beachgoers and outdoor enthusiasts. The town is also home to several small businesses, including restaurants, shops, and galleries.
The town is also home to several large employers, including the Seabury Resort and Spa, which is a popular destination for weddings and other events. The town is also home to several marinas, which provide services to boaters and fishermen.
Demographics
As of the 2010 census, the population of Seabury was 2,000 people. The racial makeup of the town was 97.2% White, 0.7% African American, 0.3% Native American, 0.3% Asian, 0.1% Pacific Islander, 0.3% from other races, and 1.3% from two or more races. Hispanic or Latino of any race were 1.3% of the population.
The median household income in Seabury was $62,500, and the median family income was $68,750. The per capita income for the town was $30,000. About 5.3% of families and 7.2% of the population were below the poverty line, including 8.3% of those under age 18 and 4.2% of those age 65 or over.
Seabury is a small town with a rich history and a vibrant economy. The town is home to several beaches, parks, and businesses, and is a popular destination for tourists and outdoor enthusiasts. The town has a diverse population, and is a great place to live and work.
Common Questions
What is Per Capita Income in New Seabury?
Per Capita income in New Seabury is $119,584.
What is the Median Family Income in New Seabury?
Median Family Income in New Seabury is $233,333.
What is the Median Household income in New Seabury?
Median Household Income in New Seabury is $167,222.
What is Inequality or Gini Index in New Seabury?
Inequality or Gini Index in New Seabury is 0.45.
What is the Total Population of New Seabury?
Total Population of New Seabury is 738.
What is the Total Male Population of New Seabury?
Total Male Population of New Seabury is 377.
What is the Total Female Population of New Seabury?
Total Female Population of New Seabury is 361.
What is the Ratio of Males per 100 Females in New Seabury?
There are 104.43 Males per 100 Females in New Seabury.
What is the Ratio of Females per 100 Males in New Seabury?
There are 95.76 Females per 100 Males in New Seabury.
What is the Median Population Age in New Seabury?
Median Population Age in New Seabury is 66.1 Years.
What is the Average Family Size in New Seabury
Average Family Size in New Seabury is 2.4 People.
What is the Average Household Size in New Seabury
Average Household Size in New Seabury is 1.9 People.
How Large is the Labor Force in New Seabury?
There are 258 People in the Labor Forcein in New Seabury.
What is the Percentage of People in the Labor Force in New Seabury?
36.3% of People are in the Labor Force in New Seabury.
What is the Unemployment Rate in New Seabury?
Unemployment Rate in New Seabury is 4.5%.