Vineyard Haven, MA Map & Demographics
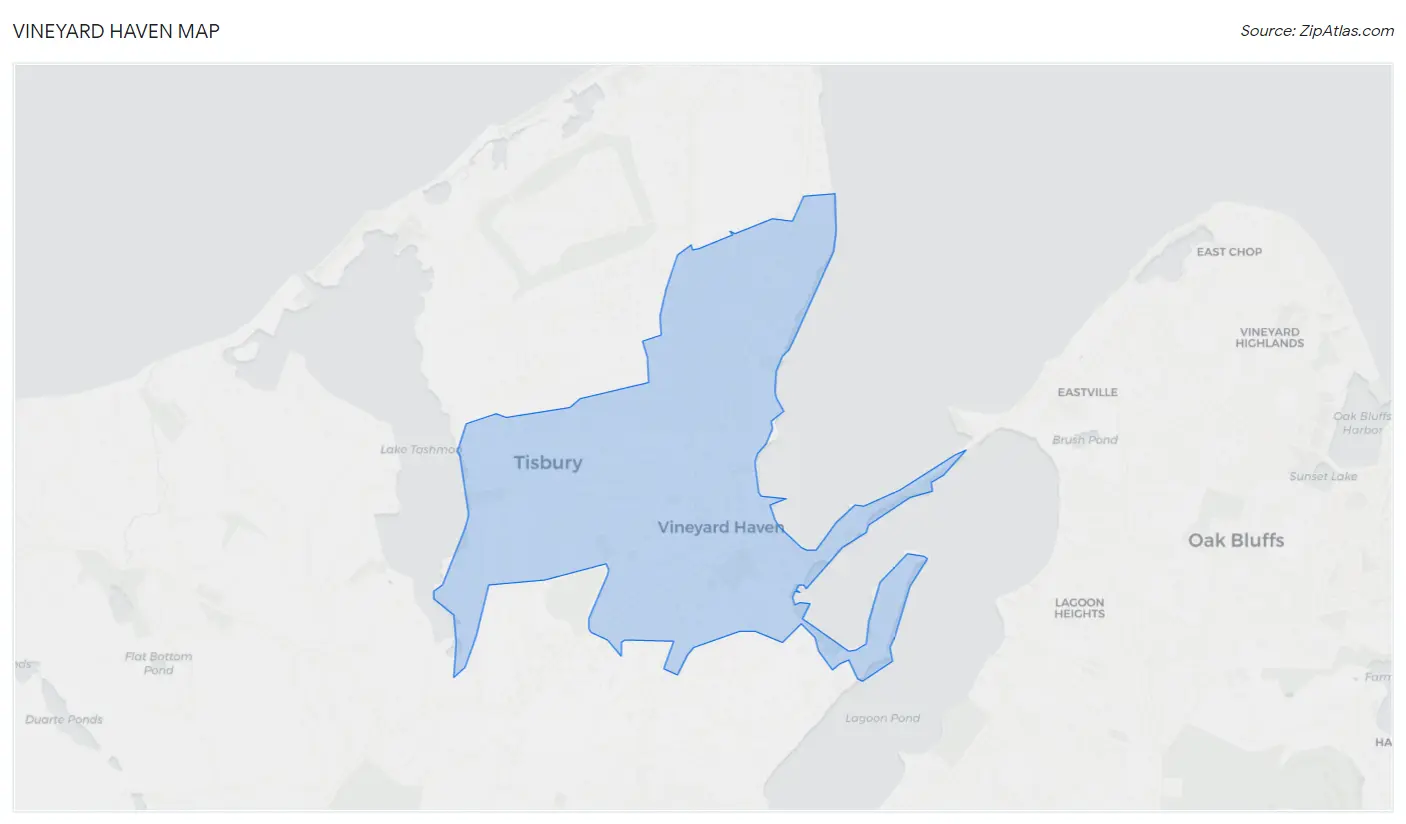
Vineyard Haven Map
Vineyard Haven Overview
$39,285
PER CAPITA INCOME
$92,426
AVG FAMILY INCOME
$65,313
AVG HOUSEHOLD INCOME
0.36
INEQUALITY / GINI INDEX
2,367
TOTAL POPULATION
1,257
MALE POPULATION
1,110
FEMALE POPULATION
113.24
MALES / 100 FEMALES
88.31
FEMALES / 100 MALES
50.3
MEDIAN AGE
4.9
AVG FAMILY SIZE
2.9
AVG HOUSEHOLD SIZE
1,336
LABOR FORCE [ PEOPLE ]
69.7%
PERCENT IN LABOR FORCE
3.7%
UNEMPLOYMENT RATE
Vineyard Haven Zip Codes
Income in Vineyard Haven
Income Overview in Vineyard Haven
Per Capita Income in Vineyard Haven is $39,285, while median incomes of families and households are $92,426 and $65,313 respectively.
| Characteristic | Number | Measure |
| Per Capita Income | 2,367 | $39,285 |
| Median Family Income | 328 | $92,426 |
| Mean Family Income | 328 | $125,589 |
| Median Household Income | 816 | $65,313 |
| Mean Household Income | 816 | $90,519 |
| Income Deficit | 328 | $0 |
| Wage / Income Gap (%) | 2,367 | 0.00% |
| Wage / Income Gap ($) | 2,367 | 100.00¢ per $1 |
| Gini / Inequality Index | 2,367 | 0.36 |
Earnings by Sex in Vineyard Haven
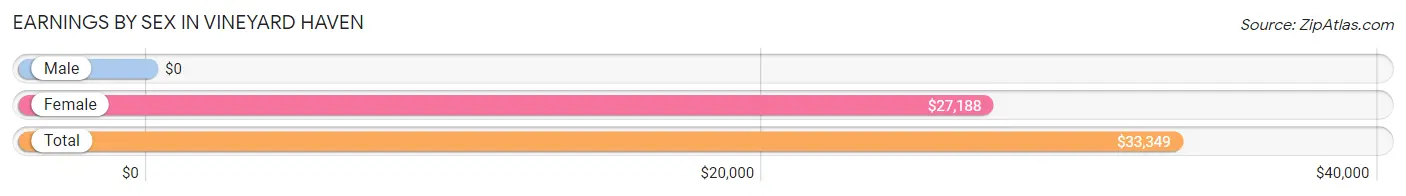
| Sex | Number | Average Earnings |
| Male | 920 (63.8%) | $0 |
| Female | 522 (36.2%) | $27,188 |
| Total | 1,442 (100.0%) | $33,349 |
Earnings by Sex by Income Bracket in Vineyard Haven
The most common earnings brackets in Vineyard Haven are $5,000 to $7,499 for men (209 | 22.7%) and $35,000 to $39,999 for women (76 | 14.6%).
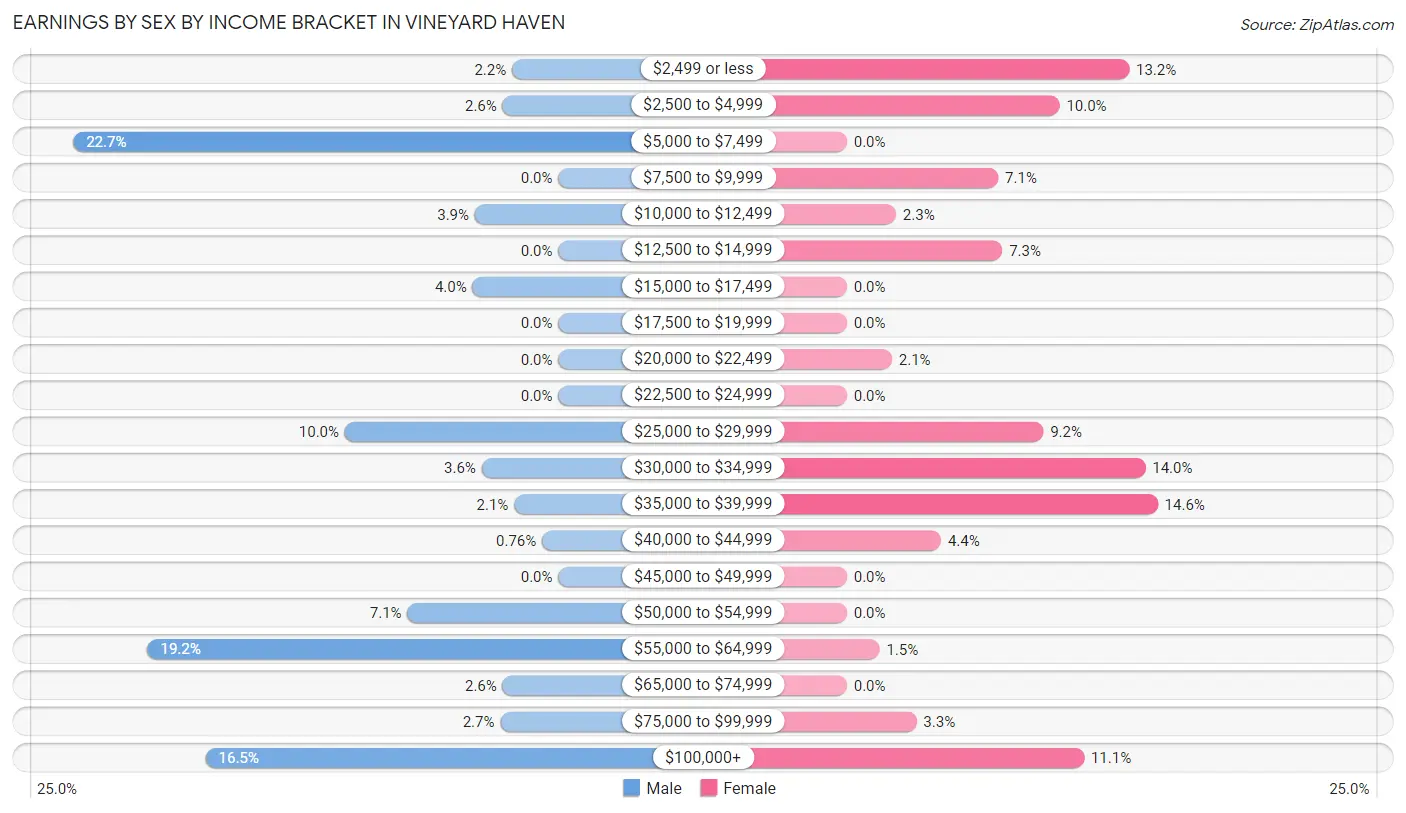
| Income | Male | Female |
| $2,499 or less | 20 (2.2%) | 69 (13.2%) |
| $2,500 to $4,999 | 24 (2.6%) | 52 (10.0%) |
| $5,000 to $7,499 | 209 (22.7%) | 0 (0.0%) |
| $7,500 to $9,999 | 0 (0.0%) | 37 (7.1%) |
| $10,000 to $12,499 | 36 (3.9%) | 12 (2.3%) |
| $12,500 to $14,999 | 0 (0.0%) | 38 (7.3%) |
| $15,000 to $17,499 | 37 (4.0%) | 0 (0.0%) |
| $17,500 to $19,999 | 0 (0.0%) | 0 (0.0%) |
| $20,000 to $22,499 | 0 (0.0%) | 11 (2.1%) |
| $22,500 to $24,999 | 0 (0.0%) | 0 (0.0%) |
| $25,000 to $29,999 | 92 (10.0%) | 48 (9.2%) |
| $30,000 to $34,999 | 33 (3.6%) | 73 (14.0%) |
| $35,000 to $39,999 | 19 (2.1%) | 76 (14.6%) |
| $40,000 to $44,999 | 7 (0.8%) | 23 (4.4%) |
| $45,000 to $49,999 | 0 (0.0%) | 0 (0.0%) |
| $50,000 to $54,999 | 65 (7.1%) | 0 (0.0%) |
| $55,000 to $64,999 | 177 (19.2%) | 8 (1.5%) |
| $65,000 to $74,999 | 24 (2.6%) | 0 (0.0%) |
| $75,000 to $99,999 | 25 (2.7%) | 17 (3.3%) |
| $100,000+ | 152 (16.5%) | 58 (11.1%) |
| Total | 920 (100.0%) | 522 (100.0%) |
Earnings by Sex by Educational Attainment in Vineyard Haven
Average earnings in Vineyard Haven are $51,311 for men and $32,928 for women, a difference of 35.8%. Men with an educational attainment of bachelor's degree enjoy the highest average annual earnings of $120,848, while those with bachelor's degree education earn the least with $120,848. Women with an educational attainment of high school diploma earn the most with the average annual earnings of $35,139, while those with college or associate's degree education have the smallest earnings of $2,499.
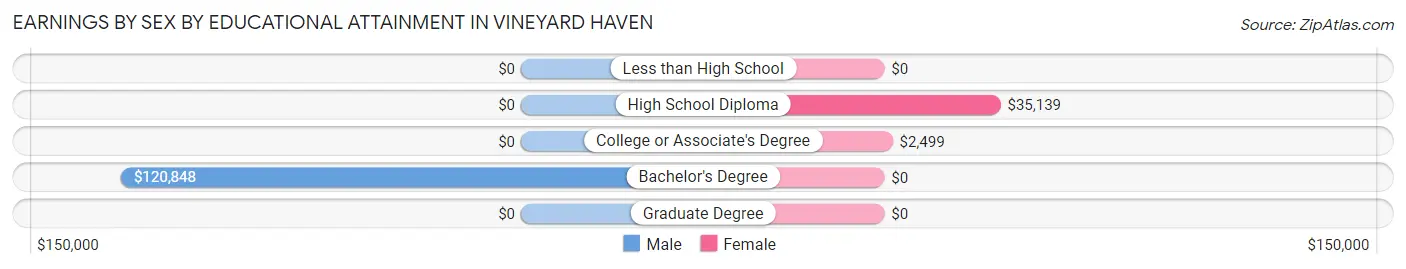
| Educational Attainment | Male Income | Female Income |
| Less than High School | - | - |
| High School Diploma | - | - |
| College or Associate's Degree | - | - |
| Bachelor's Degree | $120,848 | $0 |
| Graduate Degree | - | - |
| Total | $51,311 | $32,928 |
Family Income in Vineyard Haven
Family Income Brackets in Vineyard Haven
According to the Vineyard Haven family income data, there are 120 families falling into the $50,000 to $74,999 income range, which is the most common income bracket and makes up 36.6% of all families.
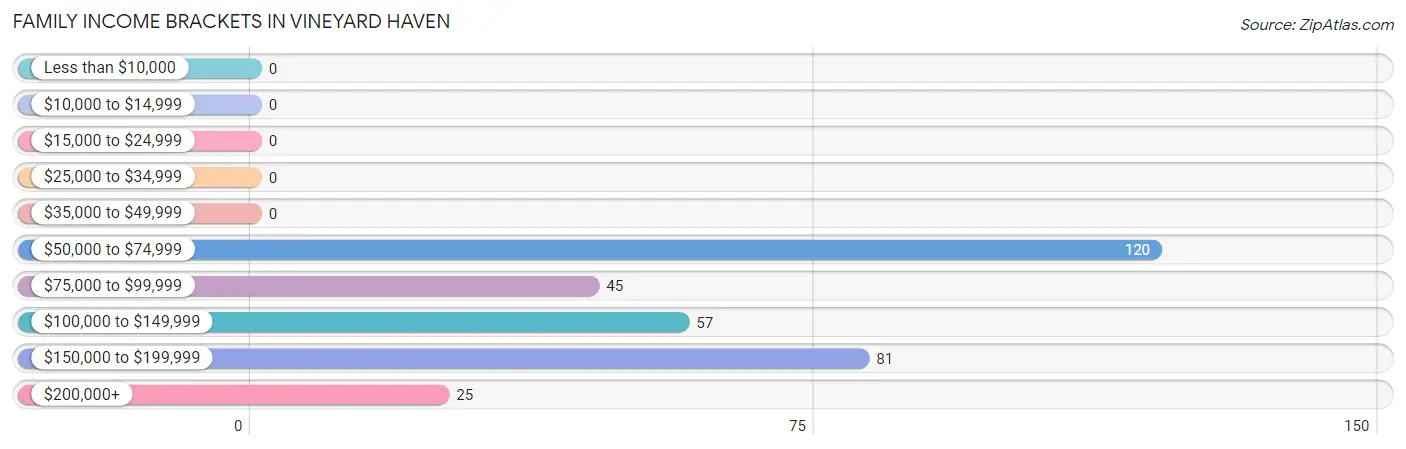
| Income Bracket | # Families | % Families |
| Less than $10,000 | 0 | 0.0% |
| $10,000 to $14,999 | 0 | 0.0% |
| $15,000 to $24,999 | 0 | 0.0% |
| $25,000 to $34,999 | 0 | 0.0% |
| $35,000 to $49,999 | 0 | 0.0% |
| $50,000 to $74,999 | 120 | 36.6% |
| $75,000 to $99,999 | 45 | 13.7% |
| $100,000 to $149,999 | 57 | 17.4% |
| $150,000 to $199,999 | 81 | 24.7% |
| $200,000+ | 25 | 7.6% |
Family Income by Famaliy Size in Vineyard Haven
2-person families (159 | 48.5%) account for the highest median family income in Vineyard Haven with $91,066 per family, while 2-person families (159 | 48.5%) have the highest median income of $45,533 per family member.
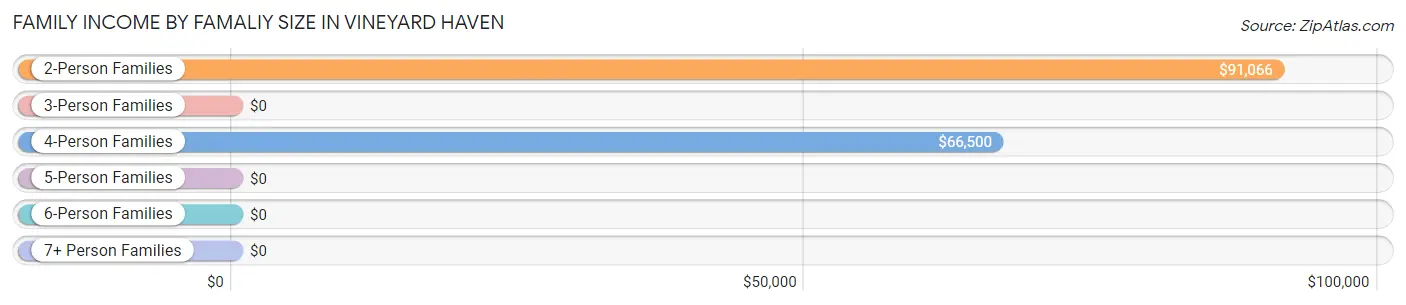
| Income Bracket | # Families | Median Income |
| 2-Person Families | 159 (48.5%) | $91,066 |
| 3-Person Families | 84 (25.6%) | $0 |
| 4-Person Families | 44 (13.4%) | $66,500 |
| 5-Person Families | 41 (12.5%) | $0 |
| 6-Person Families | 0 (0.0%) | $0 |
| 7+ Person Families | 0 (0.0%) | $0 |
| Total | 328 (100.0%) | $92,426 |
Family Income by Number of Earners in Vineyard Haven
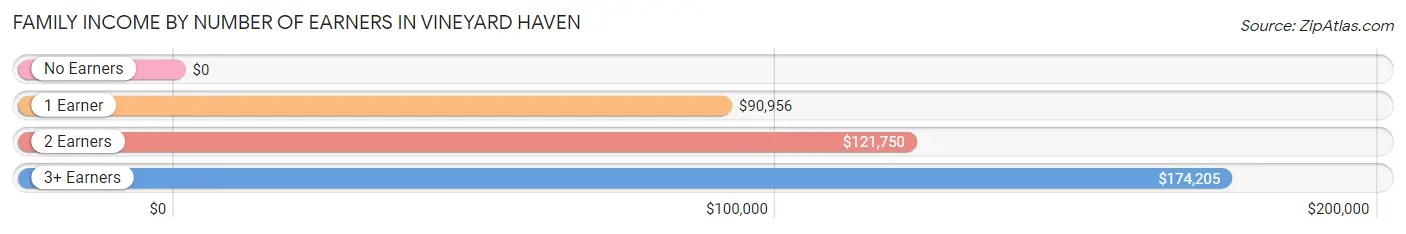
| Number of Earners | # Families | Median Income |
| No Earners | 54 (16.5%) | $0 |
| 1 Earner | 68 (20.7%) | $90,956 |
| 2 Earners | 176 (53.7%) | $121,750 |
| 3+ Earners | 30 (9.1%) | $174,205 |
| Total | 328 (100.0%) | $92,426 |
Household Income in Vineyard Haven
Household Income Brackets in Vineyard Haven
With 299 households falling in the category, the $50,000 to $74,999 income range is the most frequent in Vineyard Haven, accounting for 36.6% of all households.
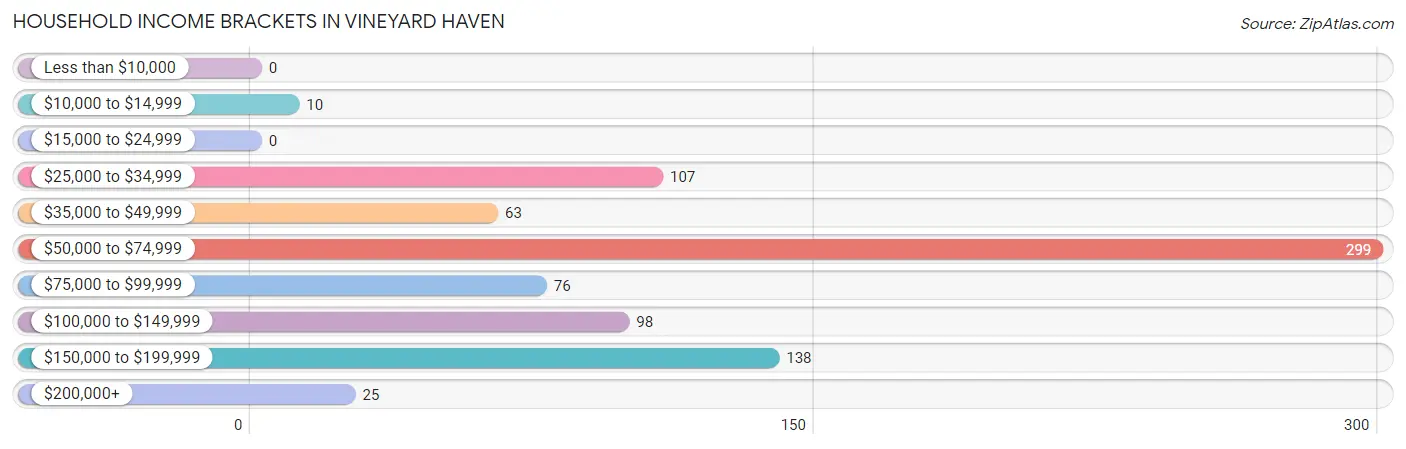
| Income Bracket | # Households | % Households |
| Less than $10,000 | 0 | 0.0% |
| $10,000 to $14,999 | 10 | 1.2% |
| $15,000 to $24,999 | 0 | 0.0% |
| $25,000 to $34,999 | 107 | 13.1% |
| $35,000 to $49,999 | 63 | 7.7% |
| $50,000 to $74,999 | 299 | 36.6% |
| $75,000 to $99,999 | 76 | 9.3% |
| $100,000 to $149,999 | 98 | 12.0% |
| $150,000 to $199,999 | 138 | 16.9% |
| $200,000+ | 25 | 3.1% |
Household Income by Householder Age in Vineyard Haven
The median household income in Vineyard Haven is $65,313, with the highest median household income of $120,281 found in the 45 to 64 years age bracket for the primary householder. A total of 203 households (24.9%) fall into this category.
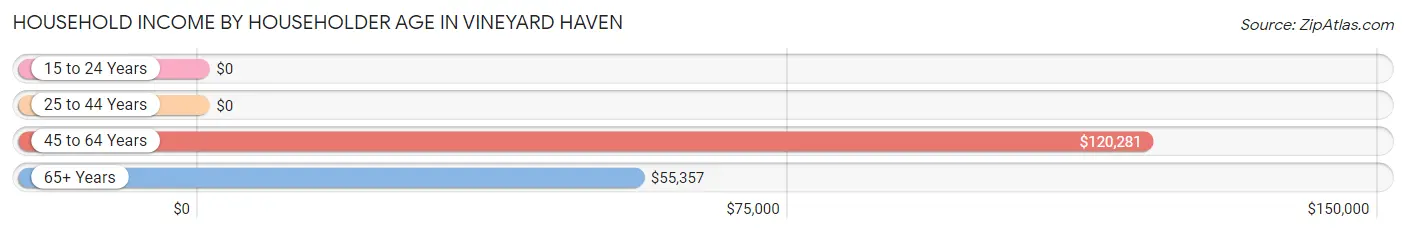
| Income Bracket | # Households | Median Income |
| 15 to 24 Years | 0 (0.0%) | $0 |
| 25 to 44 Years | 197 (24.1%) | $0 |
| 45 to 64 Years | 203 (24.9%) | $120,281 |
| 65+ Years | 416 (51.0%) | $55,357 |
| Total | 816 (100.0%) | $65,313 |
Poverty in Vineyard Haven
Income Below Poverty by Sex and Age in Vineyard Haven
With 3.7% poverty level for males and 6.1% for females among the residents of Vineyard Haven, 18 to 24 year old males and 35 to 44 year old females are the most vulnerable to poverty, with 36 males (34.9%) and 38 females (41.3%) in their respective age groups living below the poverty level.
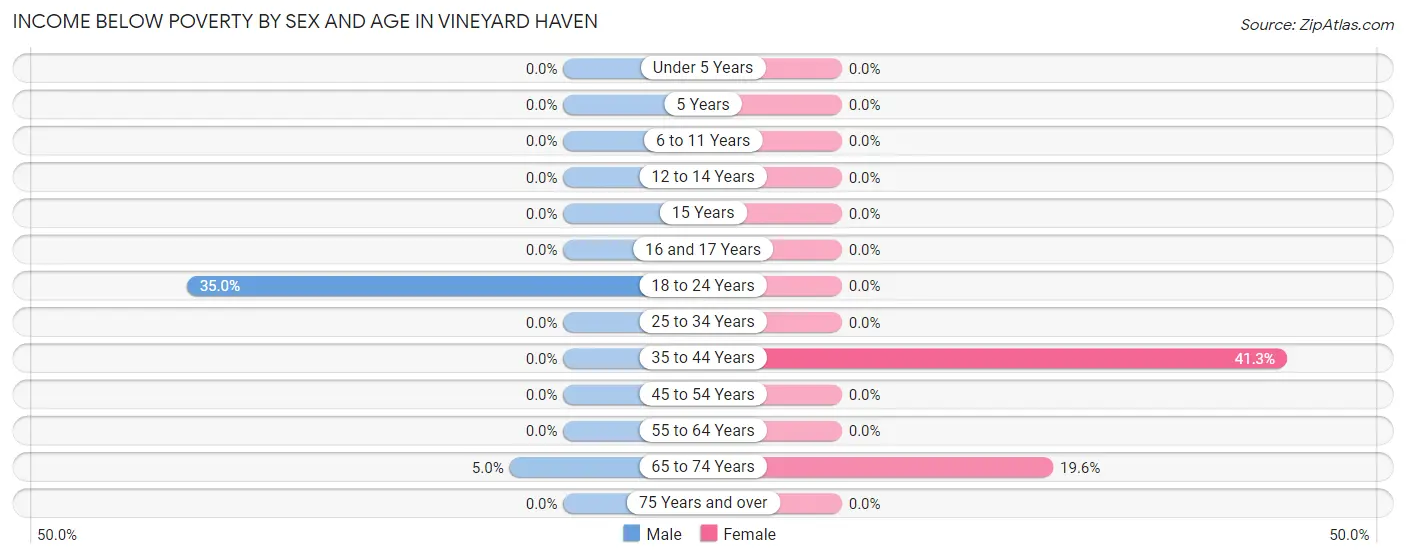
| Age Bracket | Male | Female |
| Under 5 Years | 0 (0.0%) | 0 (0.0%) |
| 5 Years | 0 (0.0%) | 0 (0.0%) |
| 6 to 11 Years | 0 (0.0%) | 0 (0.0%) |
| 12 to 14 Years | 0 (0.0%) | 0 (0.0%) |
| 15 Years | 0 (0.0%) | 0 (0.0%) |
| 16 and 17 Years | 0 (0.0%) | 0 (0.0%) |
| 18 to 24 Years | 36 (34.9%) | 0 (0.0%) |
| 25 to 34 Years | 0 (0.0%) | 0 (0.0%) |
| 35 to 44 Years | 0 (0.0%) | 38 (41.3%) |
| 45 to 54 Years | 0 (0.0%) | 0 (0.0%) |
| 55 to 64 Years | 0 (0.0%) | 0 (0.0%) |
| 65 to 74 Years | 10 (5.0%) | 30 (19.6%) |
| 75 Years and over | 0 (0.0%) | 0 (0.0%) |
| Total | 46 (3.7%) | 68 (6.1%) |
Income Above Poverty by Sex and Age in Vineyard Haven
According to the poverty statistics in Vineyard Haven, males aged 6 to 11 years and females aged under 5 years are the age groups that are most secure financially, with 100.0% of males and 100.0% of females in these age groups living above the poverty line.
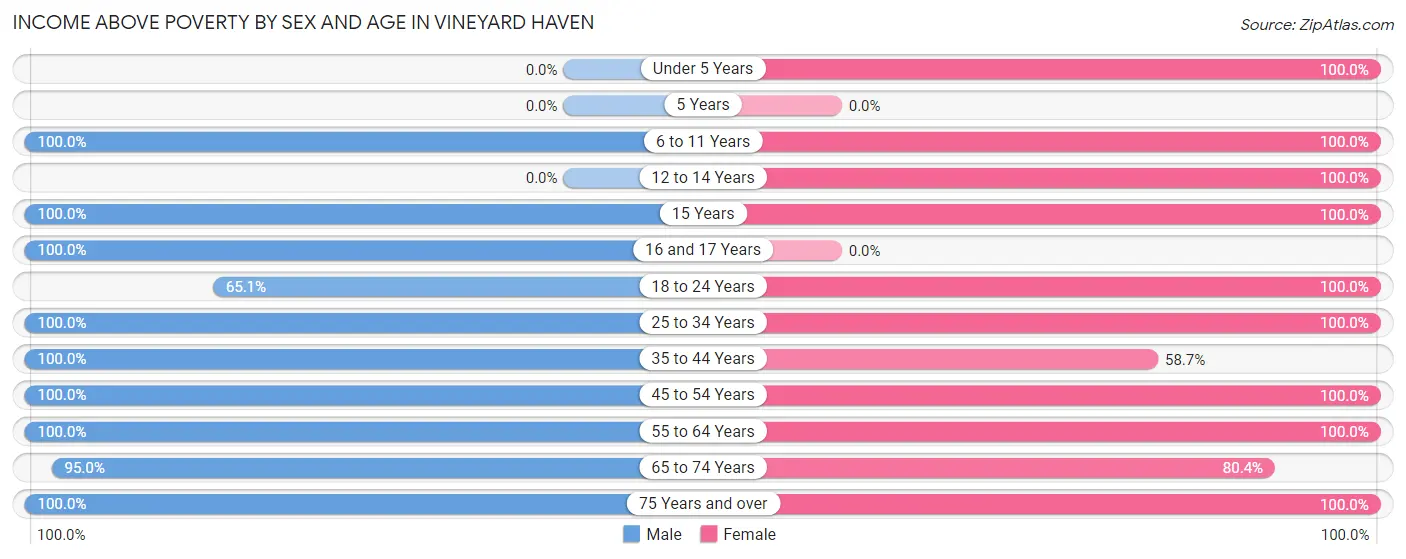
| Age Bracket | Male | Female |
| Under 5 Years | 0 (0.0%) | 116 (100.0%) |
| 5 Years | 0 (0.0%) | 0 (0.0%) |
| 6 to 11 Years | 81 (100.0%) | 93 (100.0%) |
| 12 to 14 Years | 0 (0.0%) | 37 (100.0%) |
| 15 Years | 36 (100.0%) | 76 (100.0%) |
| 16 and 17 Years | 10 (100.0%) | 0 (0.0%) |
| 18 to 24 Years | 67 (65.0%) | 37 (100.0%) |
| 25 to 34 Years | 207 (100.0%) | 78 (100.0%) |
| 35 to 44 Years | 124 (100.0%) | 54 (58.7%) |
| 45 to 54 Years | 160 (100.0%) | 8 (100.0%) |
| 55 to 64 Years | 250 (100.0%) | 204 (100.0%) |
| 65 to 74 Years | 190 (95.0%) | 123 (80.4%) |
| 75 Years and over | 72 (100.0%) | 211 (100.0%) |
| Total | 1,197 (96.3%) | 1,037 (93.9%) |
Income Below Poverty Among Married-Couple Families in Vineyard Haven
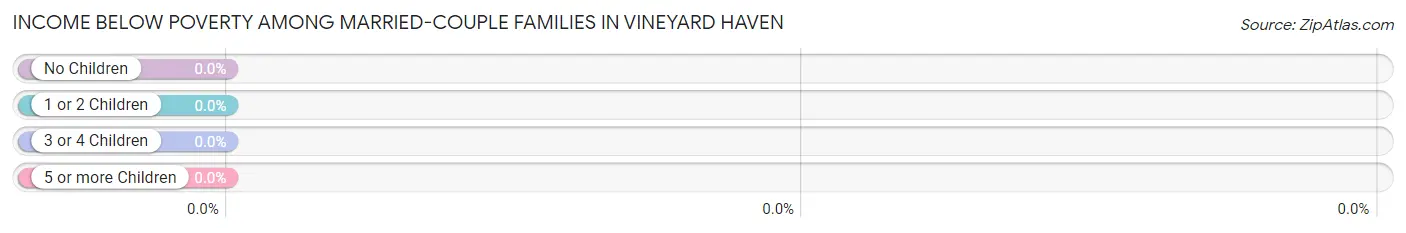
| Children | Above Poverty | Below Poverty |
| No Children | 135 (100.0%) | 0 (0.0%) |
| 1 or 2 Children | 102 (100.0%) | 0 (0.0%) |
| 3 or 4 Children | 0 (0.0%) | 0 (0.0%) |
| 5 or more Children | 0 (0.0%) | 0 (0.0%) |
| Total | 237 (100.0%) | 0 (0.0%) |
Income Below Poverty Among Single-Parent Households in Vineyard Haven
| Children | Single Father | Single Mother |
| No Children | 0 (0.0%) | 0 (0.0%) |
| 1 or 2 Children | 0 (0.0%) | 0 (0.0%) |
| 3 or 4 Children | 0 (0.0%) | 0 (0.0%) |
| 5 or more Children | 0 (0.0%) | 0 (0.0%) |
| Total | 0 (0.0%) | 0 (0.0%) |
Income Below Poverty Among Married-Couple vs Single-Parent Households in Vineyard Haven
| Children | Married-Couple Families | Single-Parent Households |
| No Children | 0 (0.0%) | 0 (0.0%) |
| 1 or 2 Children | 0 (0.0%) | 0 (0.0%) |
| 3 or 4 Children | 0 (0.0%) | 0 (0.0%) |
| 5 or more Children | 0 (0.0%) | 0 (0.0%) |
| Total | 0 (0.0%) | 0 (0.0%) |
Race in Vineyard Haven
The most populous races in Vineyard Haven are White / Caucasian (1,834 | 77.5%), Two or more Races (211 | 8.9%), and Asian (193 | 8.2%).
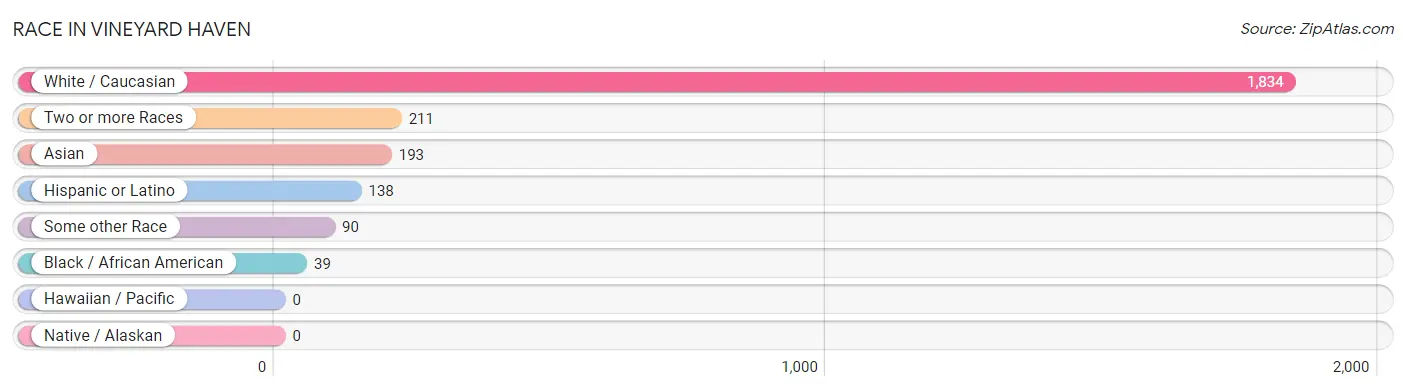
| Race | # Population | % Population |
| Asian | 193 | 8.2% |
| Black / African American | 39 | 1.7% |
| Hawaiian / Pacific | 0 | 0.0% |
| Hispanic or Latino | 138 | 5.8% |
| Native / Alaskan | 0 | 0.0% |
| White / Caucasian | 1,834 | 77.5% |
| Two or more Races | 211 | 8.9% |
| Some other Race | 90 | 3.8% |
| Total | 2,367 | 100.0% |
Ancestry in Vineyard Haven
The most populous ancestries reported in Vineyard Haven are English (491 | 20.7%), Brazilian (461 | 19.5%), Scottish (314 | 13.3%), German (258 | 10.9%), and Irish (216 | 9.1%), together accounting for 73.5% of all Vineyard Haven residents.
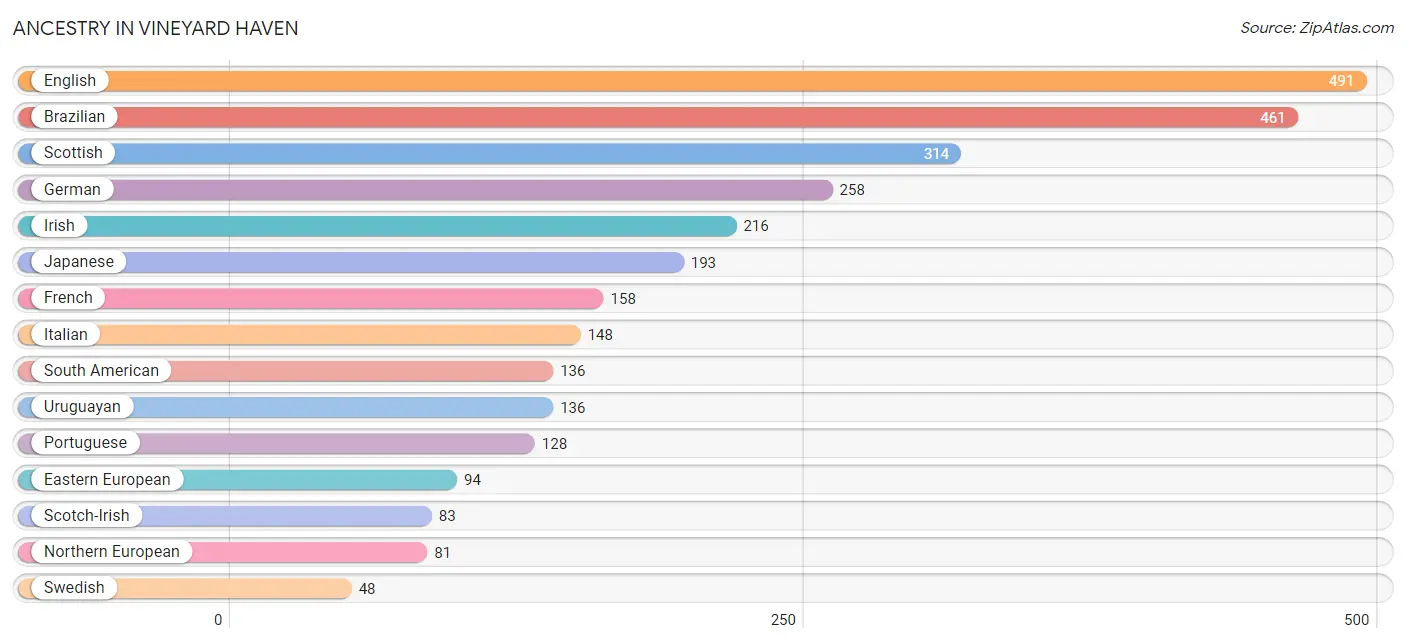
| Ancestry | # Population | % Population |
| American | 24 | 1.0% |
| Brazilian | 461 | 19.5% |
| Cambodian | 47 | 2.0% |
| Canadian | 20 | 0.8% |
| Eastern European | 94 | 4.0% |
| English | 491 | 20.7% |
| Ethiopian | 2 | 0.1% |
| European | 13 | 0.5% |
| French | 158 | 6.7% |
| German | 258 | 10.9% |
| Greek | 13 | 0.5% |
| Haitian | 2 | 0.1% |
| Irish | 216 | 9.1% |
| Italian | 148 | 6.2% |
| Japanese | 193 | 8.2% |
| Northern European | 81 | 3.4% |
| Norwegian | 23 | 1.0% |
| Polish | 13 | 0.5% |
| Portuguese | 128 | 5.4% |
| Scandinavian | 12 | 0.5% |
| Scotch-Irish | 83 | 3.5% |
| Scottish | 314 | 13.3% |
| South American | 136 | 5.8% |
| Subsaharan African | 14 | 0.6% |
| Swedish | 48 | 2.0% |
| Uruguayan | 136 | 5.8% |
| Welsh | 31 | 1.3% | View All 27 Rows |
Immigrants in Vineyard Haven
The most numerous immigrant groups reported in Vineyard Haven came from Latin America (516 | 21.8%), South America (514 | 21.7%), Brazil (378 | 16.0%), Uruguay (44 | 1.9%), and Asia (41 | 1.7%), together accounting for 63.1% of all Vineyard Haven residents.
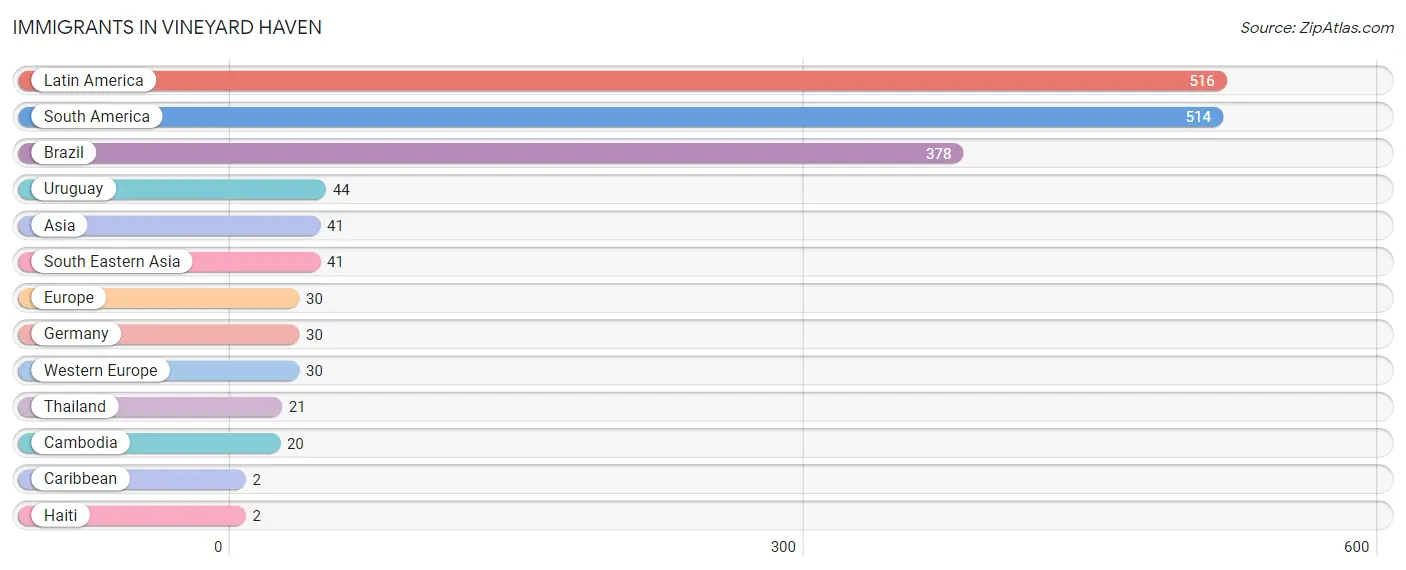
| Immigration Origin | # Population | % Population |
| Asia | 41 | 1.7% |
| Brazil | 378 | 16.0% |
| Cambodia | 20 | 0.8% |
| Caribbean | 2 | 0.1% |
| Europe | 30 | 1.3% |
| Germany | 30 | 1.3% |
| Haiti | 2 | 0.1% |
| Latin America | 516 | 21.8% |
| South America | 514 | 21.7% |
| South Eastern Asia | 41 | 1.7% |
| Thailand | 21 | 0.9% |
| Uruguay | 44 | 1.9% |
| Western Europe | 30 | 1.3% | View All 13 Rows |
Sex and Age in Vineyard Haven
Sex and Age in Vineyard Haven
The most populous age groups in Vineyard Haven are 25 to 29 Years (195 | 15.5%) for men and 60 to 64 Years (140 | 12.6%) for women.
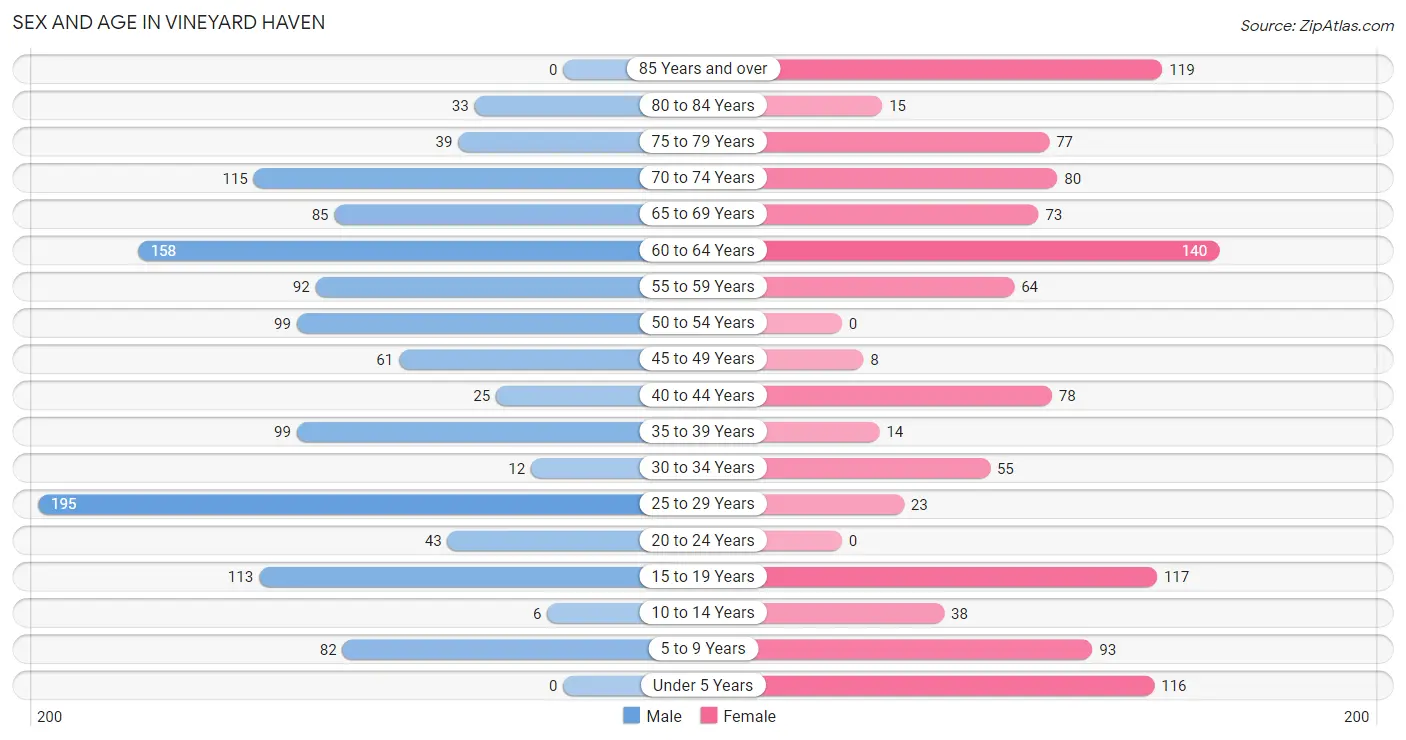
| Age Bracket | Male | Female |
| Under 5 Years | 0 (0.0%) | 116 (10.4%) |
| 5 to 9 Years | 82 (6.5%) | 93 (8.4%) |
| 10 to 14 Years | 6 (0.5%) | 38 (3.4%) |
| 15 to 19 Years | 113 (9.0%) | 117 (10.5%) |
| 20 to 24 Years | 43 (3.4%) | 0 (0.0%) |
| 25 to 29 Years | 195 (15.5%) | 23 (2.1%) |
| 30 to 34 Years | 12 (0.9%) | 55 (5.0%) |
| 35 to 39 Years | 99 (7.9%) | 14 (1.3%) |
| 40 to 44 Years | 25 (2.0%) | 78 (7.0%) |
| 45 to 49 Years | 61 (4.9%) | 8 (0.7%) |
| 50 to 54 Years | 99 (7.9%) | 0 (0.0%) |
| 55 to 59 Years | 92 (7.3%) | 64 (5.8%) |
| 60 to 64 Years | 158 (12.6%) | 140 (12.6%) |
| 65 to 69 Years | 85 (6.8%) | 73 (6.6%) |
| 70 to 74 Years | 115 (9.1%) | 80 (7.2%) |
| 75 to 79 Years | 39 (3.1%) | 77 (6.9%) |
| 80 to 84 Years | 33 (2.6%) | 15 (1.3%) |
| 85 Years and over | 0 (0.0%) | 119 (10.7%) |
| Total | 1,257 (100.0%) | 1,110 (100.0%) |
Families and Households in Vineyard Haven
Median Family Size in Vineyard Haven
The median family size in Vineyard Haven is 4.89 persons per family, with married-couple families (237 | 72.3%) accounting for the largest median family size of 5 persons per family. On the other hand, single male/father families (35 | 10.7%) represent the smallest median family size with 3.94 persons per family.
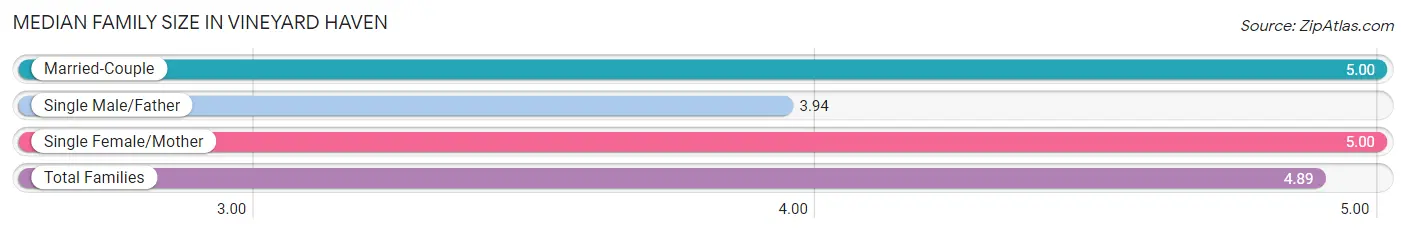
| Family Type | # Families | Family Size |
| Married-Couple | 237 (72.3%) | 5.00 |
| Single Male/Father | 35 (10.7%) | 3.94 |
| Single Female/Mother | 56 (17.1%) | 5.00 |
| Total Families | 328 (100.0%) | 4.89 |
Median Household Size in Vineyard Haven
The median household size in Vineyard Haven is 2.88 persons per household, with single female/mother households (56 | 6.9%) accounting for the largest median household size of 6.32 persons per household. non-family households (488 | 59.8%) represent the smallest median household size with 1.37 persons per household.
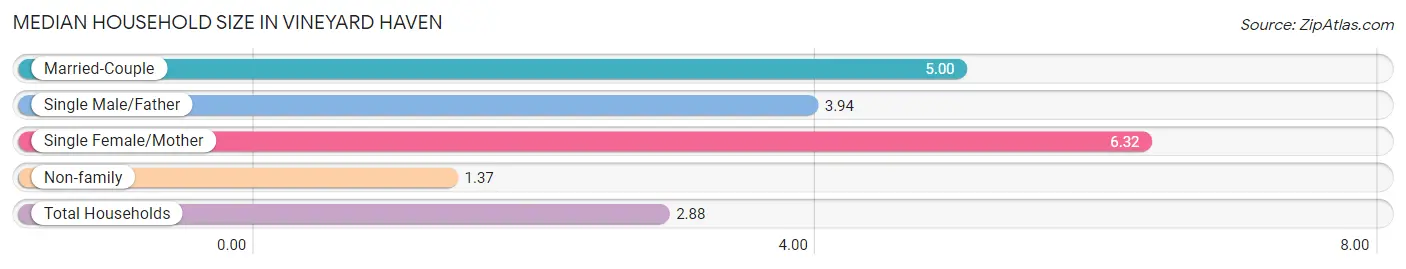
| Household Type | # Households | Household Size |
| Married-Couple | 237 (29.0%) | 5.00 |
| Single Male/Father | 35 (4.3%) | 3.94 |
| Single Female/Mother | 56 (6.9%) | 6.32 |
| Non-family | 488 (59.8%) | 1.37 |
| Total Households | 816 (100.0%) | 2.88 |
Household Size by Marriage Status in Vineyard Haven
Out of a total of 816 households in Vineyard Haven, 328 (40.2%) are family households, while 488 (59.8%) are nonfamily households. The most numerous type of family households are 2-person households, comprising 146, and the most common type of nonfamily households are 1-person households, comprising 395.
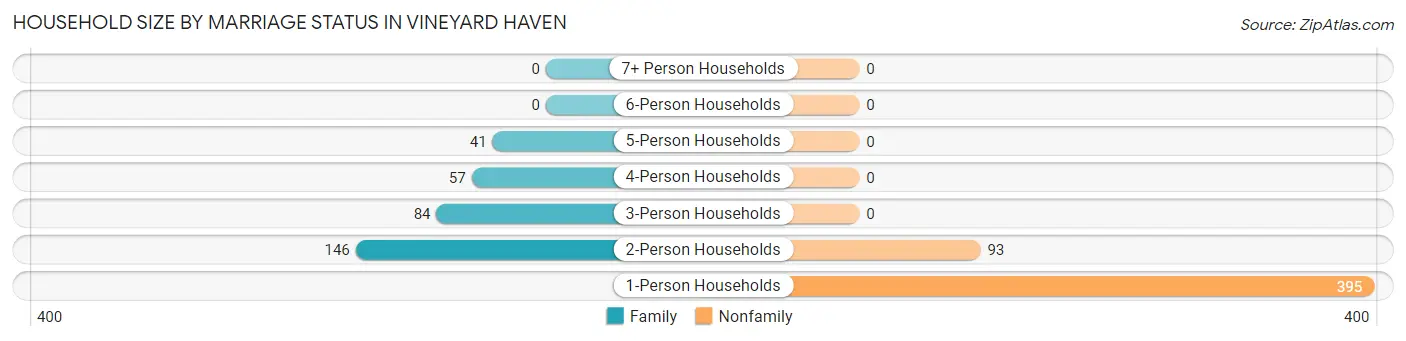
| Household Size | Family Households | Nonfamily Households |
| 1-Person Households | - | 395 (48.4%) |
| 2-Person Households | 146 (17.9%) | 93 (11.4%) |
| 3-Person Households | 84 (10.3%) | 0 (0.0%) |
| 4-Person Households | 57 (7.0%) | 0 (0.0%) |
| 5-Person Households | 41 (5.0%) | 0 (0.0%) |
| 6-Person Households | 0 (0.0%) | 0 (0.0%) |
| 7+ Person Households | 0 (0.0%) | 0 (0.0%) |
| Total | 328 (40.2%) | 488 (59.8%) |
Female Fertility in Vineyard Haven
Fertility by Age in Vineyard Haven
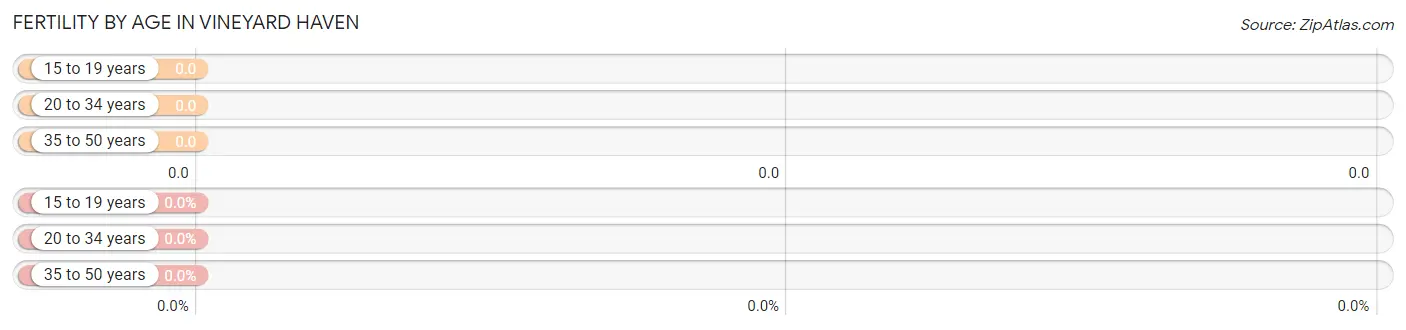
| Age Bracket | Women with Births | Births / 1,000 Women |
| 15 to 19 years | 0 (0.0%) | 0.0 |
| 20 to 34 years | 0 (0.0%) | 0.0 |
| 35 to 50 years | 0 (0.0%) | 0.0 |
| Total | 0 (0.0%) | 0.0 |
Fertility by Age by Marriage Status in Vineyard Haven
| Age Bracket | Married | Unmarried |
| 15 to 19 years | 0 (0.0%) | 0 (0.0%) |
| 20 to 34 years | 0 (0.0%) | 0 (0.0%) |
| 35 to 50 years | 0 (0.0%) | 0 (0.0%) |
| Total | 0 (0.0%) | 0 (0.0%) |
Fertility by Education in Vineyard Haven
| Educational Attainment | Women with Births | Births / 1,000 Women |
| Less than High School | 0 (0.0%) | 0.0 |
| High School Diploma | 0 (0.0%) | 0.0 |
| College or Associate's Degree | 0 (0.0%) | 0.0 |
| Bachelor's Degree | 0 (0.0%) | 0.0 |
| Graduate Degree | 0 (0.0%) | 0.0 |
| Total | 0 (0.0%) | 0.0 |
Fertility by Education by Marriage Status in Vineyard Haven
| Educational Attainment | Married | Unmarried |
| Less than High School | 0 (0.0%) | 0 (0.0%) |
| High School Diploma | 0 (0.0%) | 0 (0.0%) |
| College or Associate's Degree | 0 (0.0%) | 0 (0.0%) |
| Bachelor's Degree | 0 (0.0%) | 0 (0.0%) |
| Graduate Degree | 0 (0.0%) | 0 (0.0%) |
| Total | 0 (0.0%) | 0 (0.0%) |
Employment Characteristics in Vineyard Haven
Employment by Class of Employer in Vineyard Haven
Among the 1,242 employed individuals in Vineyard Haven, private company employees (748 | 60.2%), not-for-profit organizations (185 | 14.9%), and self-employed (not incorporated) (112 | 9.0%) make up the most common classes of employment.
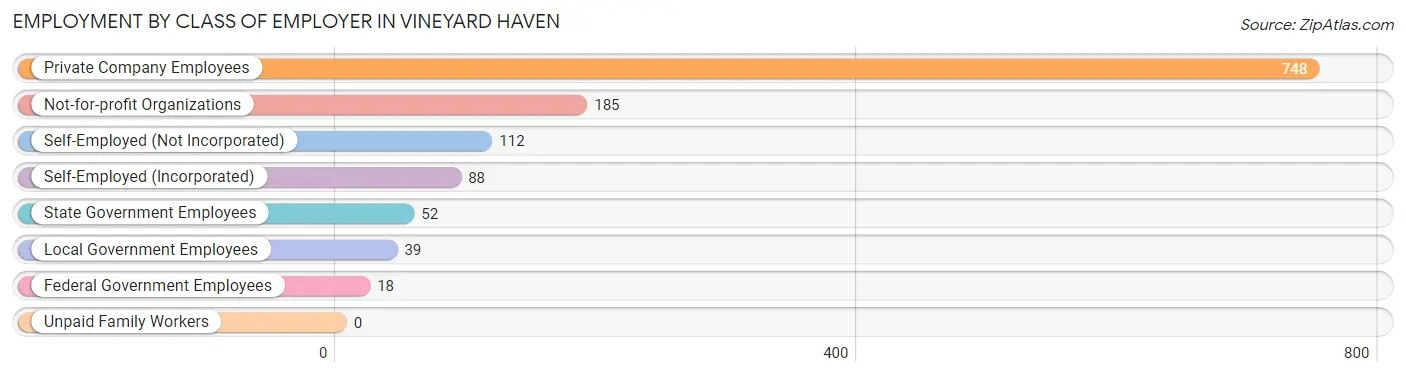
| Employer Class | # Employees | % Employees |
| Private Company Employees | 748 | 60.2% |
| Self-Employed (Incorporated) | 88 | 7.1% |
| Self-Employed (Not Incorporated) | 112 | 9.0% |
| Not-for-profit Organizations | 185 | 14.9% |
| Local Government Employees | 39 | 3.1% |
| State Government Employees | 52 | 4.2% |
| Federal Government Employees | 18 | 1.5% |
| Unpaid Family Workers | 0 | 0.0% |
| Total | 1,242 | 100.0% |
Employment Status by Age in Vineyard Haven
According to the labor force statistics for Vineyard Haven, out of the total population over 16 years of age (1,917), 69.7% or 1,336 individuals are in the labor force, with 3.7% or 49 of them unemployed. The age group with the highest labor force participation rate is 20 to 24 years, with 100.0% or 43 individuals in the labor force. Within the labor force, the 25 to 29 years age range has the highest percentage of unemployed individuals, with 20.3% or 37 of them being unemployed.
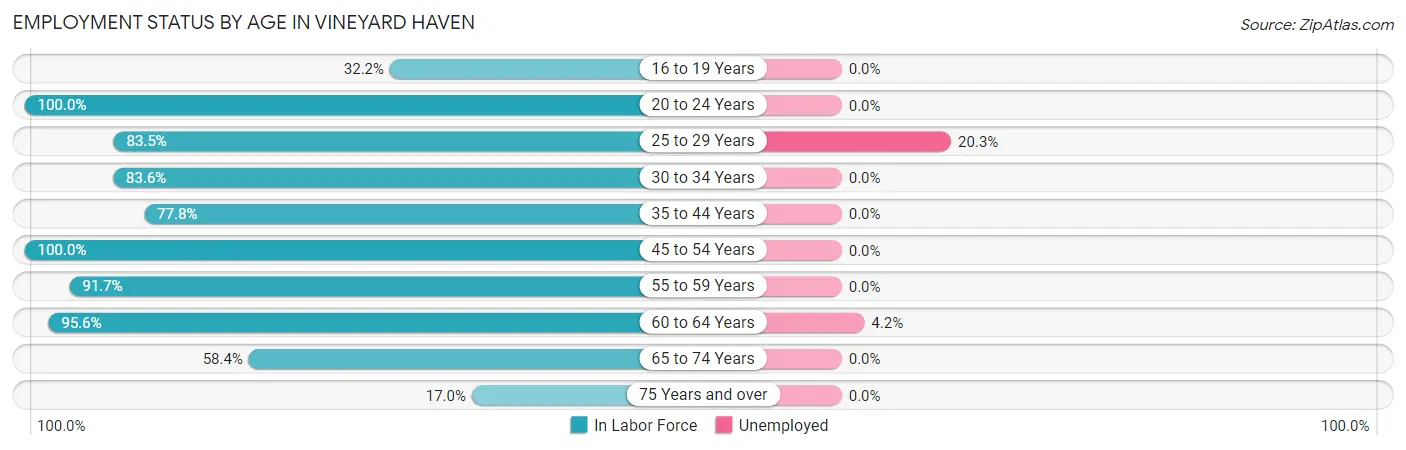
| Age Bracket | In Labor Force | Unemployed |
| 16 to 19 Years | 37 (32.2%) | 0 (0.0%) |
| 20 to 24 Years | 43 (100.0%) | 0 (0.0%) |
| 25 to 29 Years | 182 (83.5%) | 37 (20.3%) |
| 30 to 34 Years | 56 (83.6%) | 0 (0.0%) |
| 35 to 44 Years | 168 (77.8%) | 0 (0.0%) |
| 45 to 54 Years | 168 (100.0%) | 0 (0.0%) |
| 55 to 59 Years | 143 (91.7%) | 0 (0.0%) |
| 60 to 64 Years | 285 (95.6%) | 12 (4.2%) |
| 65 to 74 Years | 206 (58.4%) | 0 (0.0%) |
| 75 Years and over | 48 (17.0%) | 0 (0.0%) |
| Total | 1,336 (69.7%) | 49 (3.7%) |
Employment Status by Educational Attainment in Vineyard Haven
According to labor force statistics for Vineyard Haven, 89.2% of individuals (1,002) out of the total population between 25 and 64 years of age (1,123) are in the labor force, with 4.9% or 49 of them being unemployed. The group with the highest labor force participation rate are those with the educational attainment of college / associate degree, with 100.0% or 124 individuals in the labor force. Within the labor force, individuals with college / associate degree education have the highest percentage of unemployment, with 9.7% or 12 of them being unemployed.
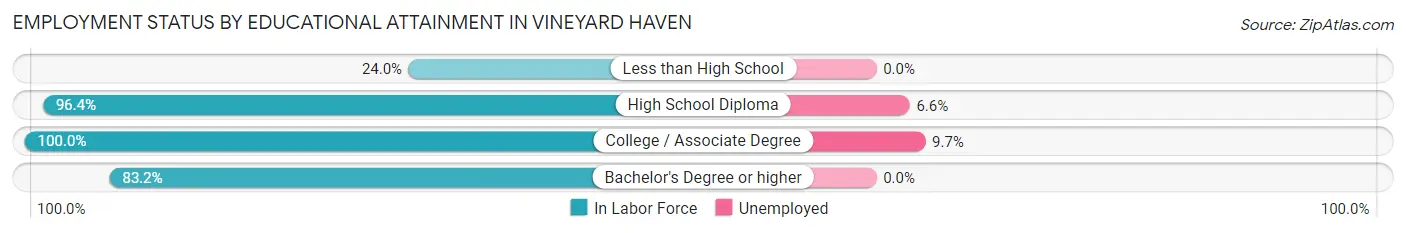
| Educational Attainment | In Labor Force | Unemployed |
| Less than High School | 12 (24.0%) | 0 (0.0%) |
| High School Diploma | 558 (96.4%) | 38 (6.6%) |
| College / Associate Degree | 124 (100.0%) | 12 (9.7%) |
| Bachelor's Degree or higher | 308 (83.2%) | 0 (0.0%) |
| Total | 1,002 (89.2%) | 55 (4.9%) |
Employment Occupations by Sex in Vineyard Haven
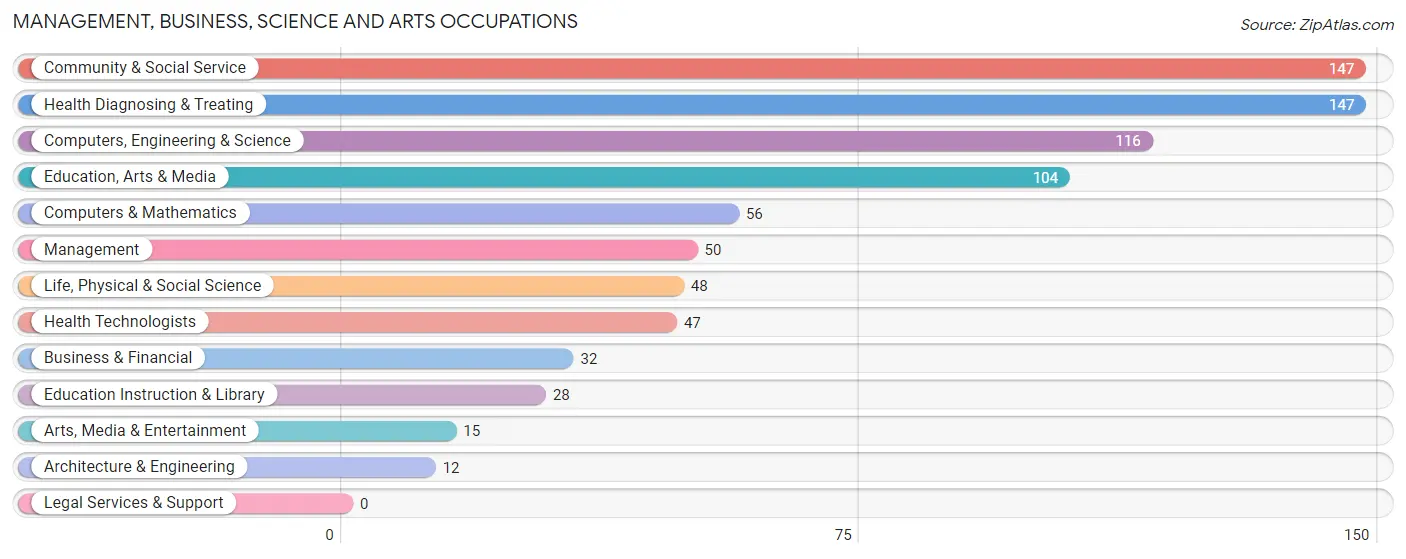
Management, Business, Science and Arts Occupations
The most common Management, Business, Science and Arts occupations in Vineyard Haven are Community & Social Service (147 | 11.4%), Health Diagnosing & Treating (147 | 11.4%), Computers, Engineering & Science (116 | 9.0%), Education, Arts & Media (104 | 8.1%), and Computers & Mathematics (56 | 4.3%).
Management, Business, Science and Arts Occupations by Sex
Within the Management, Business, Science and Arts occupations in Vineyard Haven, the most male-oriented occupations are Business & Financial (100.0%), Computers & Mathematics (100.0%), and Management (92.0%), while the most female-oriented occupations are Life, Physical & Social Science (100.0%), Education Instruction & Library (100.0%), and Health Diagnosing & Treating (70.8%).
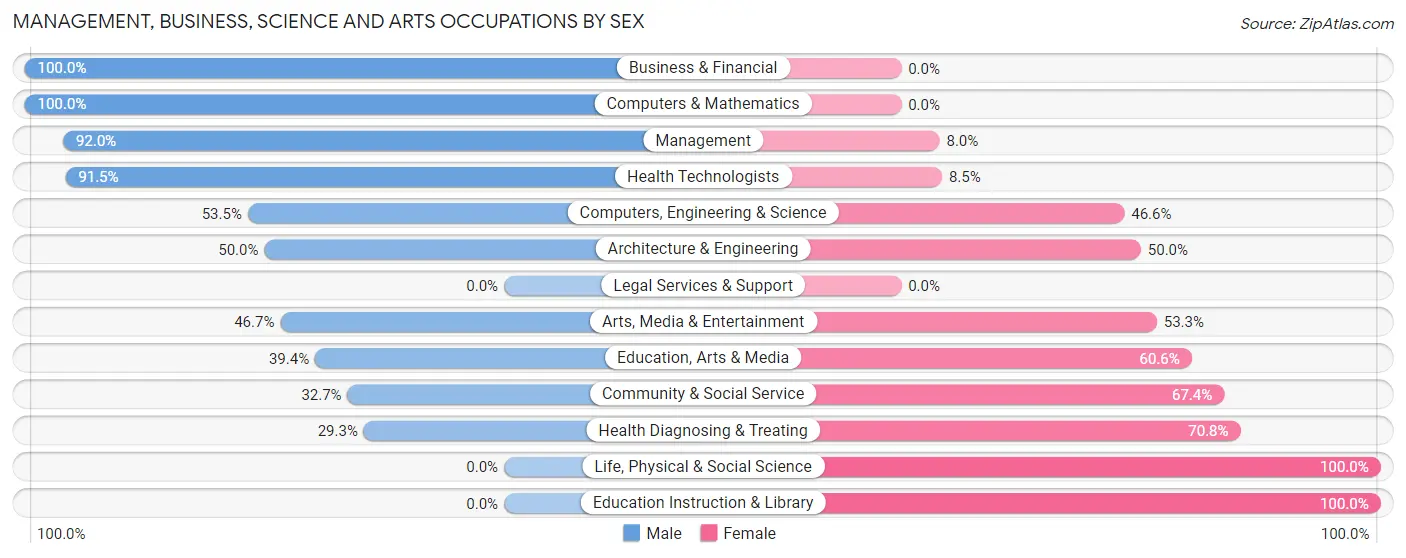
| Occupation | Male | Female |
| Management | 46 (92.0%) | 4 (8.0%) |
| Business & Financial | 32 (100.0%) | 0 (0.0%) |
| Computers, Engineering & Science | 62 (53.4%) | 54 (46.6%) |
| Computers & Mathematics | 56 (100.0%) | 0 (0.0%) |
| Architecture & Engineering | 6 (50.0%) | 6 (50.0%) |
| Life, Physical & Social Science | 0 (0.0%) | 48 (100.0%) |
| Community & Social Service | 48 (32.7%) | 99 (67.3%) |
| Education, Arts & Media | 41 (39.4%) | 63 (60.6%) |
| Legal Services & Support | 0 (0.0%) | 0 (0.0%) |
| Education Instruction & Library | 0 (0.0%) | 28 (100.0%) |
| Arts, Media & Entertainment | 7 (46.7%) | 8 (53.3%) |
| Health Diagnosing & Treating | 43 (29.2%) | 104 (70.8%) |
| Health Technologists | 43 (91.5%) | 4 (8.5%) |
| Total (Category) | 231 (46.9%) | 261 (53.0%) |
| Total (Overall) | 826 (64.2%) | 461 (35.8%) |
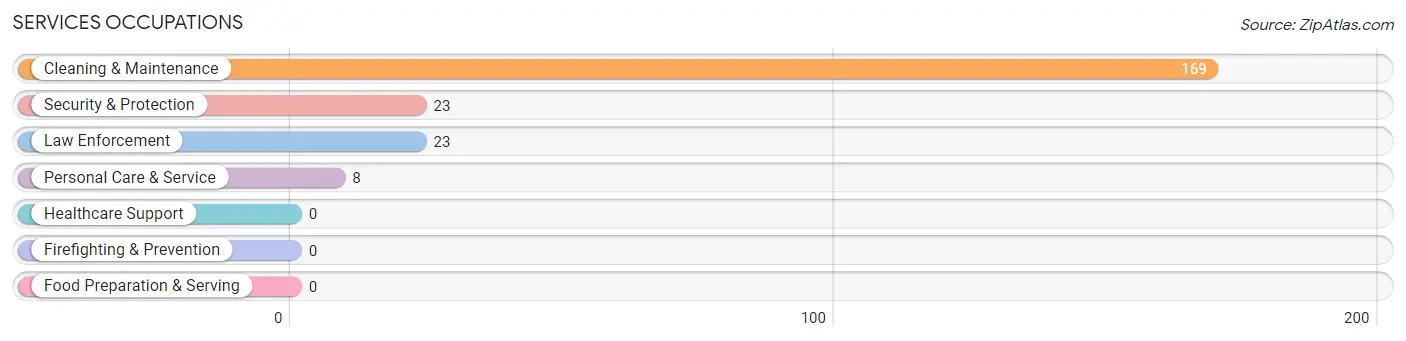
Services Occupations
The most common Services occupations in Vineyard Haven are Cleaning & Maintenance (169 | 13.1%), Security & Protection (23 | 1.8%), Law Enforcement (23 | 1.8%), and Personal Care & Service (8 | 0.6%).
Services Occupations by Sex
Within the Services occupations in Vineyard Haven, the most male-oriented occupations are Security & Protection (100.0%), Law Enforcement (100.0%), and Cleaning & Maintenance (74.0%), while the most female-oriented occupations are Personal Care & Service (100.0%), and Cleaning & Maintenance (26.0%).
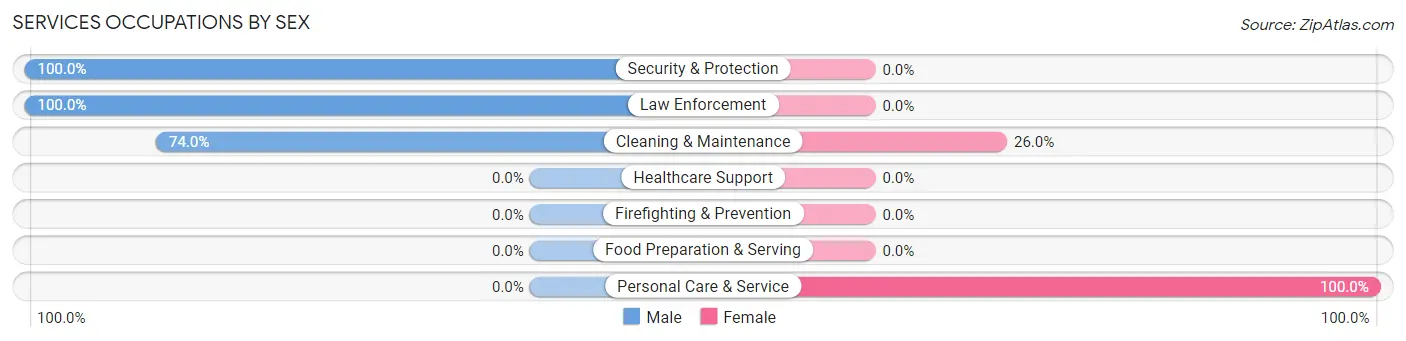
| Occupation | Male | Female |
| Healthcare Support | 0 (0.0%) | 0 (0.0%) |
| Security & Protection | 23 (100.0%) | 0 (0.0%) |
| Firefighting & Prevention | 0 (0.0%) | 0 (0.0%) |
| Law Enforcement | 23 (100.0%) | 0 (0.0%) |
| Food Preparation & Serving | 0 (0.0%) | 0 (0.0%) |
| Cleaning & Maintenance | 125 (74.0%) | 44 (26.0%) |
| Personal Care & Service | 0 (0.0%) | 8 (100.0%) |
| Total (Category) | 148 (74.0%) | 52 (26.0%) |
| Total (Overall) | 826 (64.2%) | 461 (35.8%) |
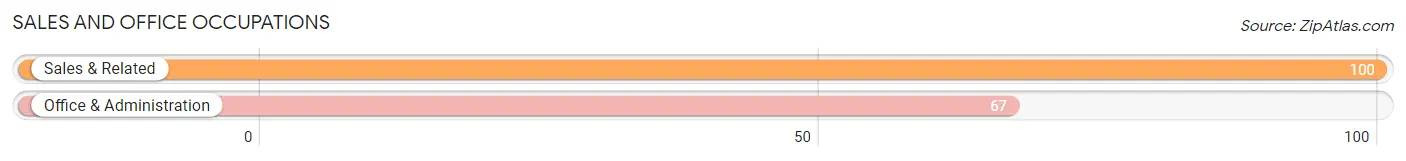
Sales and Office Occupations
The most common Sales and Office occupations in Vineyard Haven are Sales & Related (100 | 7.8%), and Office & Administration (67 | 5.2%).
Sales and Office Occupations by Sex
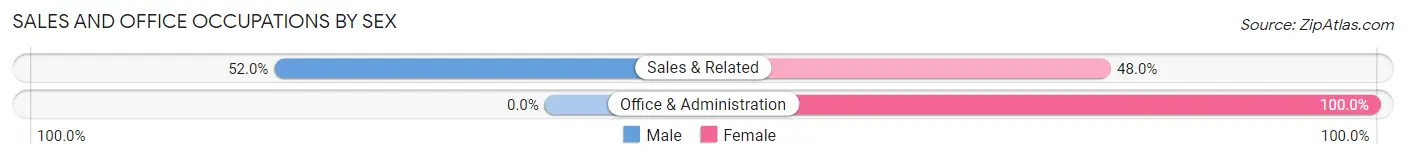
| Occupation | Male | Female |
| Sales & Related | 52 (52.0%) | 48 (48.0%) |
| Office & Administration | 0 (0.0%) | 67 (100.0%) |
| Total (Category) | 52 (31.1%) | 115 (68.9%) |
| Total (Overall) | 826 (64.2%) | 461 (35.8%) |
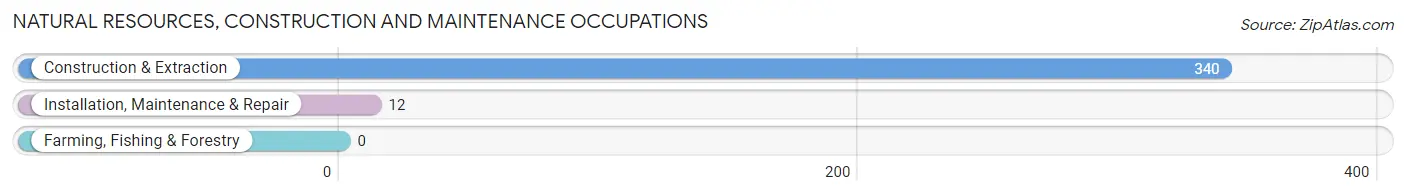
Natural Resources, Construction and Maintenance Occupations
The most common Natural Resources, Construction and Maintenance occupations in Vineyard Haven are Construction & Extraction (340 | 26.4%), and Installation, Maintenance & Repair (12 | 0.9%).
Natural Resources, Construction and Maintenance Occupations by Sex
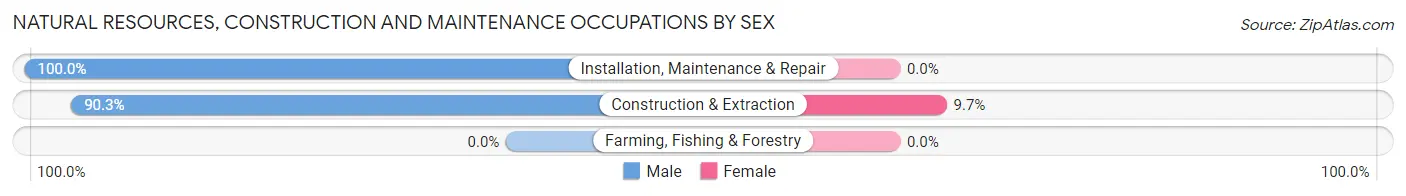
| Occupation | Male | Female |
| Farming, Fishing & Forestry | 0 (0.0%) | 0 (0.0%) |
| Construction & Extraction | 307 (90.3%) | 33 (9.7%) |
| Installation, Maintenance & Repair | 12 (100.0%) | 0 (0.0%) |
| Total (Category) | 319 (90.6%) | 33 (9.4%) |
| Total (Overall) | 826 (64.2%) | 461 (35.8%) |
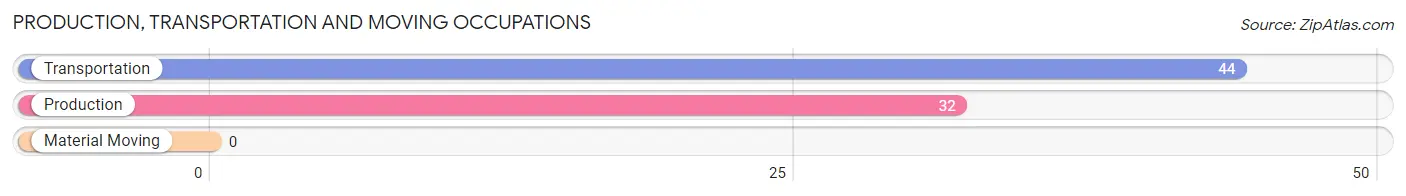
Production, Transportation and Moving Occupations
The most common Production, Transportation and Moving occupations in Vineyard Haven are Transportation (44 | 3.4%), and Production (32 | 2.5%).
Production, Transportation and Moving Occupations by Sex
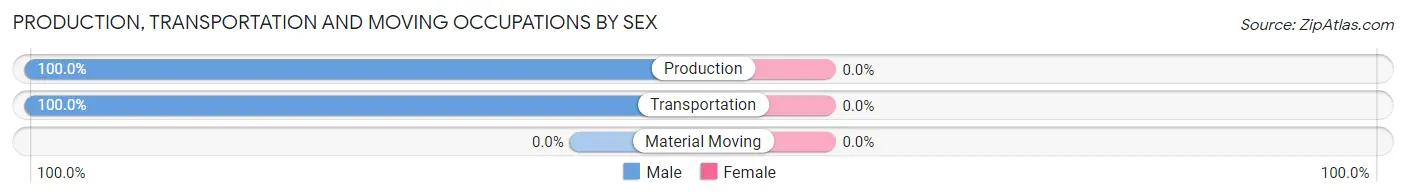
| Occupation | Male | Female |
| Production | 32 (100.0%) | 0 (0.0%) |
| Transportation | 44 (100.0%) | 0 (0.0%) |
| Material Moving | 0 (0.0%) | 0 (0.0%) |
| Total (Category) | 76 (100.0%) | 0 (0.0%) |
| Total (Overall) | 826 (64.2%) | 461 (35.8%) |
Employment Industries by Sex in Vineyard Haven
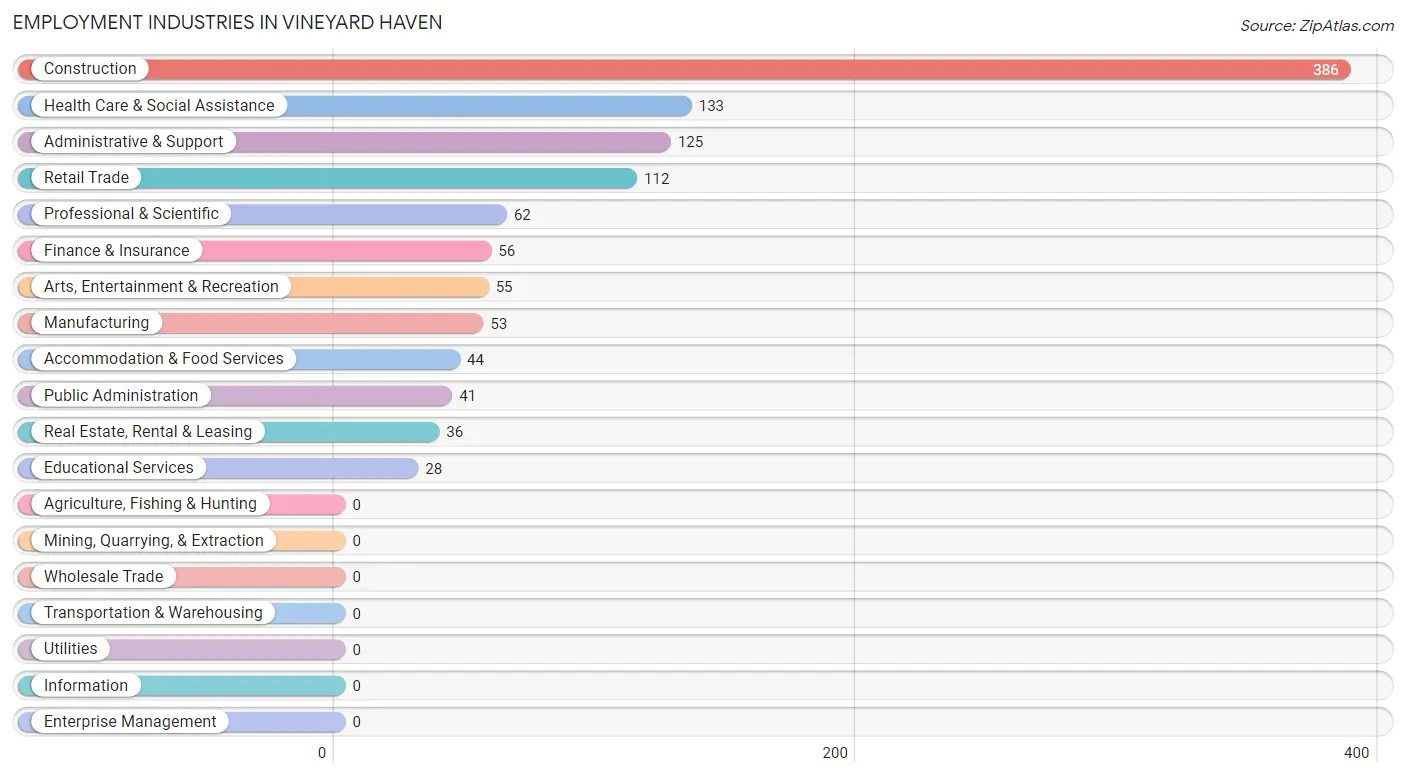
Employment Industries in Vineyard Haven
The major employment industries in Vineyard Haven include Construction (386 | 30.0%), Health Care & Social Assistance (133 | 10.3%), Administrative & Support (125 | 9.7%), Retail Trade (112 | 8.7%), and Professional & Scientific (62 | 4.8%).
Employment Industries by Sex in Vineyard Haven
The Vineyard Haven industries that see more men than women are Finance & Insurance (100.0%), Real Estate, Rental & Leasing (100.0%), and Administrative & Support (100.0%), whereas the industries that tend to have a higher number of women are Educational Services (100.0%), Health Care & Social Assistance (97.0%), and Retail Trade (85.7%).
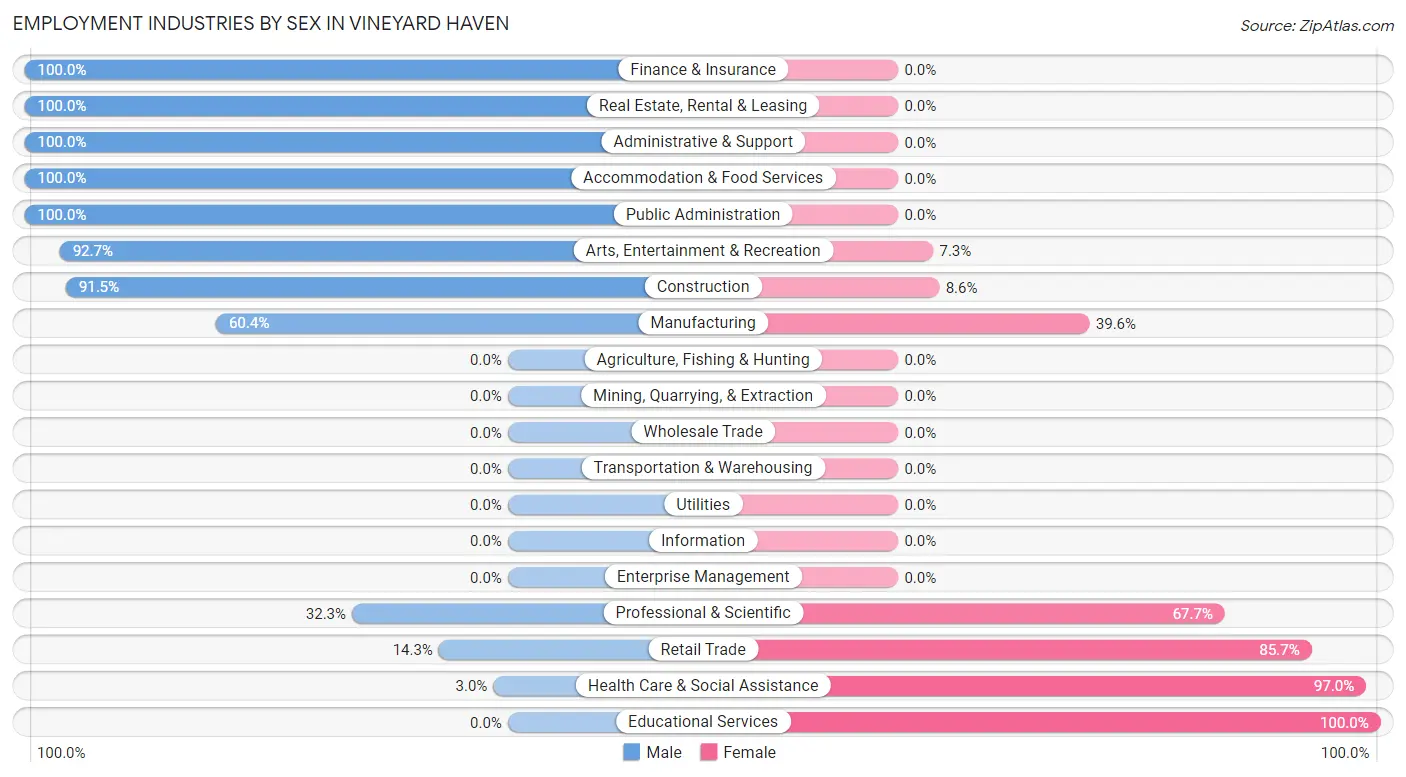
| Industry | Male | Female |
| Agriculture, Fishing & Hunting | 0 (0.0%) | 0 (0.0%) |
| Mining, Quarrying, & Extraction | 0 (0.0%) | 0 (0.0%) |
| Construction | 353 (91.4%) | 33 (8.6%) |
| Manufacturing | 32 (60.4%) | 21 (39.6%) |
| Wholesale Trade | 0 (0.0%) | 0 (0.0%) |
| Retail Trade | 16 (14.3%) | 96 (85.7%) |
| Transportation & Warehousing | 0 (0.0%) | 0 (0.0%) |
| Utilities | 0 (0.0%) | 0 (0.0%) |
| Information | 0 (0.0%) | 0 (0.0%) |
| Finance & Insurance | 56 (100.0%) | 0 (0.0%) |
| Real Estate, Rental & Leasing | 36 (100.0%) | 0 (0.0%) |
| Professional & Scientific | 20 (32.3%) | 42 (67.7%) |
| Enterprise Management | 0 (0.0%) | 0 (0.0%) |
| Administrative & Support | 125 (100.0%) | 0 (0.0%) |
| Educational Services | 0 (0.0%) | 28 (100.0%) |
| Health Care & Social Assistance | 4 (3.0%) | 129 (97.0%) |
| Arts, Entertainment & Recreation | 51 (92.7%) | 4 (7.3%) |
| Accommodation & Food Services | 44 (100.0%) | 0 (0.0%) |
| Public Administration | 41 (100.0%) | 0 (0.0%) |
| Total | 826 (64.2%) | 461 (35.8%) |
Education in Vineyard Haven
School Enrollment in Vineyard Haven
The most common levels of schooling among the 525 students in Vineyard Haven are elementary school (175 | 33.3%), high school (174 | 33.1%), and college / undergraduate (104 | 19.8%).
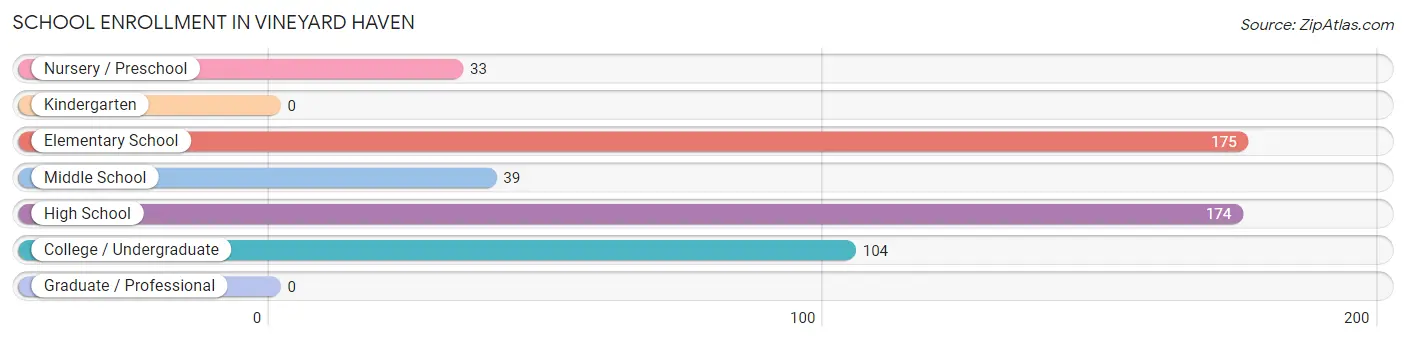
| School Level | # Students | % Students |
| Nursery / Preschool | 33 | 6.3% |
| Kindergarten | 0 | 0.0% |
| Elementary School | 175 | 33.3% |
| Middle School | 39 | 7.4% |
| High School | 174 | 33.1% |
| College / Undergraduate | 104 | 19.8% |
| Graduate / Professional | 0 | 0.0% |
| Total | 525 | 100.0% |
School Enrollment by Age by Funding Source in Vineyard Haven
Out of a total of 525 students who are enrolled in schools in Vineyard Haven, 102 (19.4%) attend a private institution, while the remaining 423 (80.6%) are enrolled in public schools. The age group of 20 to 24 year olds has the highest likelihood of being enrolled in private schools, with 43 (100.0% in the age bracket) enrolled. Conversely, the age group of 3 to 4 year olds has the lowest likelihood of being enrolled in a private school, with 33 (100.0% in the age bracket) attending a public institution.
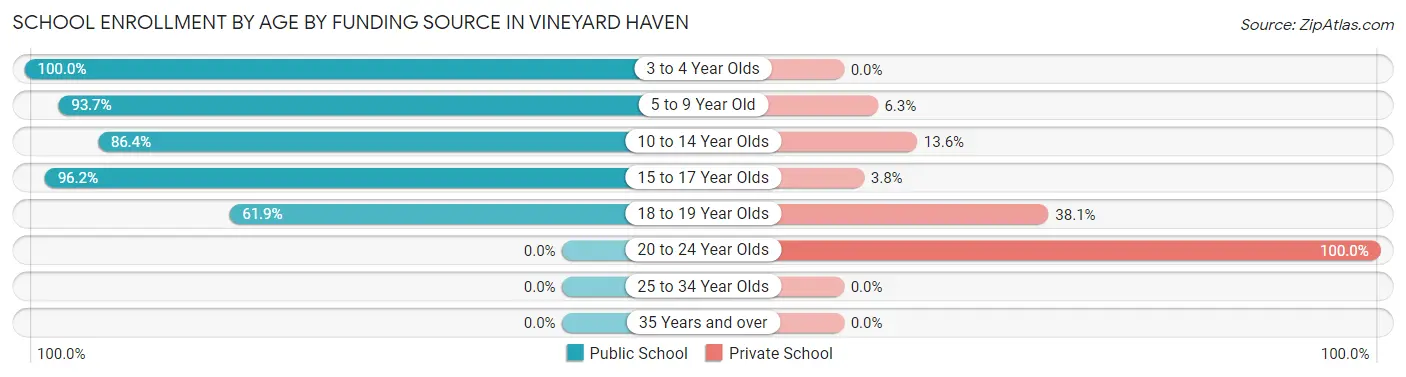
| Age Bracket | Public School | Private School |
| 3 to 4 Year Olds | 33 (100.0%) | 0 (0.0%) |
| 5 to 9 Year Old | 164 (93.7%) | 11 (6.3%) |
| 10 to 14 Year Olds | 38 (86.4%) | 6 (13.6%) |
| 15 to 17 Year Olds | 128 (96.2%) | 5 (3.8%) |
| 18 to 19 Year Olds | 60 (61.9%) | 37 (38.1%) |
| 20 to 24 Year Olds | 0 (0.0%) | 43 (100.0%) |
| 25 to 34 Year Olds | 0 (0.0%) | 0 (0.0%) |
| 35 Years and over | 0 (0.0%) | 0 (0.0%) |
| Total | 423 (80.6%) | 102 (19.4%) |
Educational Attainment by Field of Study in Vineyard Haven
Education (227 | 28.0%), psychology (98 | 12.1%), science & technology (96 | 11.8%), literature & languages (69 | 8.5%), and liberal arts & history (63 | 7.8%) are the most common fields of study among 811 individuals in Vineyard Haven who have obtained a bachelor's degree or higher.
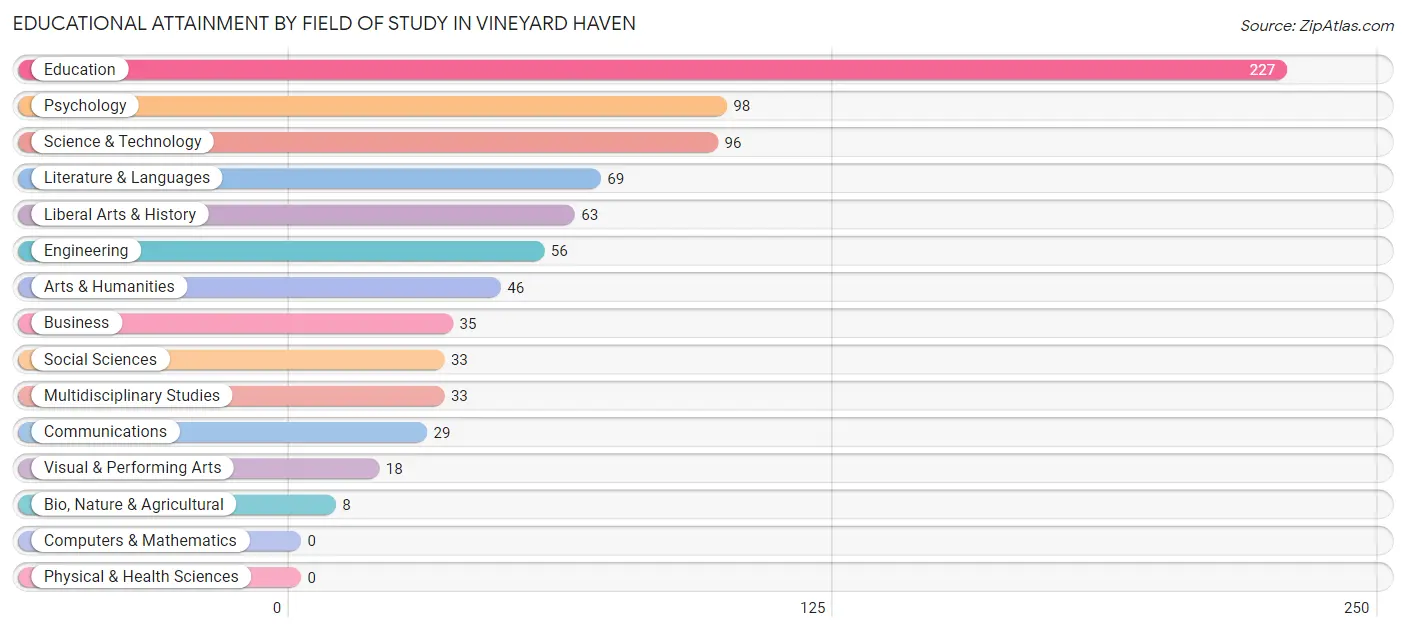
| Field of Study | # Graduates | % Graduates |
| Computers & Mathematics | 0 | 0.0% |
| Bio, Nature & Agricultural | 8 | 1.0% |
| Physical & Health Sciences | 0 | 0.0% |
| Psychology | 98 | 12.1% |
| Social Sciences | 33 | 4.1% |
| Engineering | 56 | 6.9% |
| Multidisciplinary Studies | 33 | 4.1% |
| Science & Technology | 96 | 11.8% |
| Business | 35 | 4.3% |
| Education | 227 | 28.0% |
| Literature & Languages | 69 | 8.5% |
| Liberal Arts & History | 63 | 7.8% |
| Visual & Performing Arts | 18 | 2.2% |
| Communications | 29 | 3.6% |
| Arts & Humanities | 46 | 5.7% |
| Total | 811 | 100.0% |
Transportation & Commute in Vineyard Haven
Vehicle Availability by Sex in Vineyard Haven
The most prevalent vehicle ownership categories in Vineyard Haven are males with 3 vehicles (409, accounting for 51.6%) and females with 3 vehicles (142, making up 91.1%).
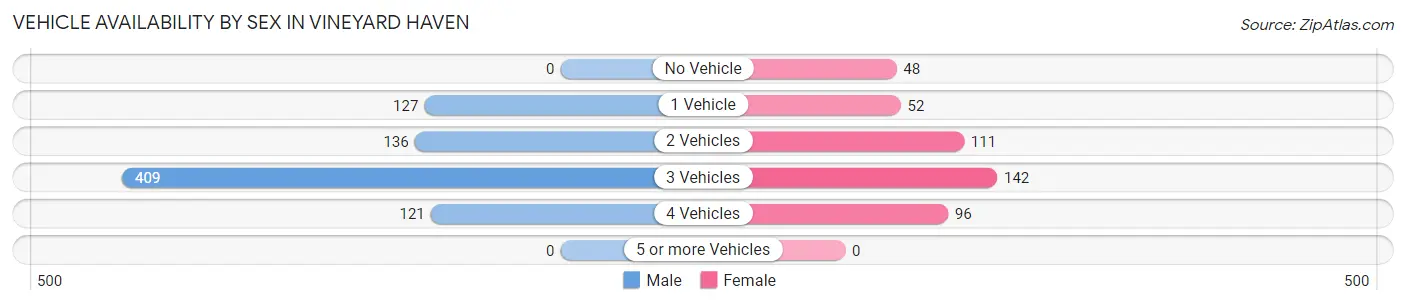
| Vehicles Available | Male | Female |
| No Vehicle | 0 (0.0%) | 48 (10.7%) |
| 1 Vehicle | 127 (16.0%) | 52 (11.6%) |
| 2 Vehicles | 136 (17.2%) | 111 (24.7%) |
| 3 Vehicles | 409 (51.6%) | 142 (31.6%) |
| 4 Vehicles | 121 (15.3%) | 96 (21.4%) |
| 5 or more Vehicles | 0 (0.0%) | 0 (0.0%) |
| Total | 793 (100.0%) | 449 (100.0%) |
Commute Time in Vineyard Haven
The most frequently occuring commute durations in Vineyard Haven are 15 to 19 minutes (351 commuters, 30.9%), 20 to 24 minutes (262 commuters, 23.1%), and 30 to 34 minutes (181 commuters, 15.9%).
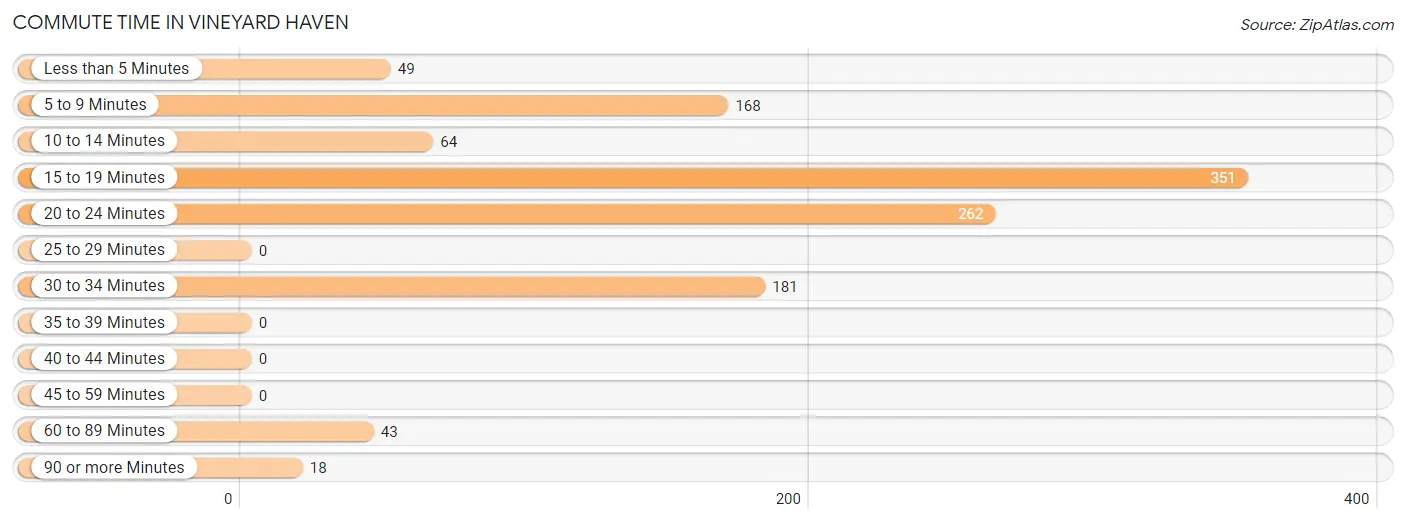
| Commute Time | # Commuters | % Commuters |
| Less than 5 Minutes | 49 | 4.3% |
| 5 to 9 Minutes | 168 | 14.8% |
| 10 to 14 Minutes | 64 | 5.6% |
| 15 to 19 Minutes | 351 | 30.9% |
| 20 to 24 Minutes | 262 | 23.1% |
| 25 to 29 Minutes | 0 | 0.0% |
| 30 to 34 Minutes | 181 | 15.9% |
| 35 to 39 Minutes | 0 | 0.0% |
| 40 to 44 Minutes | 0 | 0.0% |
| 45 to 59 Minutes | 0 | 0.0% |
| 60 to 89 Minutes | 43 | 3.8% |
| 90 or more Minutes | 18 | 1.6% |
Commute Time by Sex in Vineyard Haven
The most common commute times in Vineyard Haven are 15 to 19 minutes (193 commuters, 26.0%) for males and 15 to 19 minutes (158 commuters, 40.2%) for females.
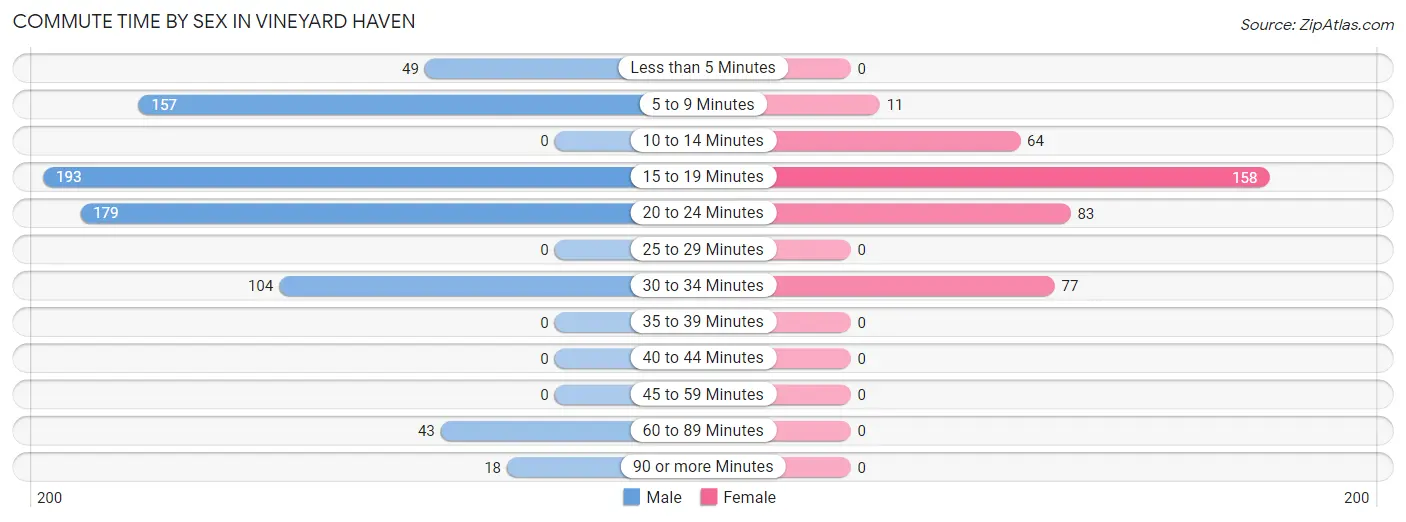
| Commute Time | Male | Female |
| Less than 5 Minutes | 49 (6.6%) | 0 (0.0%) |
| 5 to 9 Minutes | 157 (21.1%) | 11 (2.8%) |
| 10 to 14 Minutes | 0 (0.0%) | 64 (16.3%) |
| 15 to 19 Minutes | 193 (26.0%) | 158 (40.2%) |
| 20 to 24 Minutes | 179 (24.1%) | 83 (21.1%) |
| 25 to 29 Minutes | 0 (0.0%) | 0 (0.0%) |
| 30 to 34 Minutes | 104 (14.0%) | 77 (19.6%) |
| 35 to 39 Minutes | 0 (0.0%) | 0 (0.0%) |
| 40 to 44 Minutes | 0 (0.0%) | 0 (0.0%) |
| 45 to 59 Minutes | 0 (0.0%) | 0 (0.0%) |
| 60 to 89 Minutes | 43 (5.8%) | 0 (0.0%) |
| 90 or more Minutes | 18 (2.4%) | 0 (0.0%) |
Time of Departure to Work by Sex in Vineyard Haven
The most frequent times of departure to work in Vineyard Haven are 8:00 AM to 8:29 AM (441, 59.4%) for males and 8:00 AM to 8:29 AM (152, 38.7%) for females.
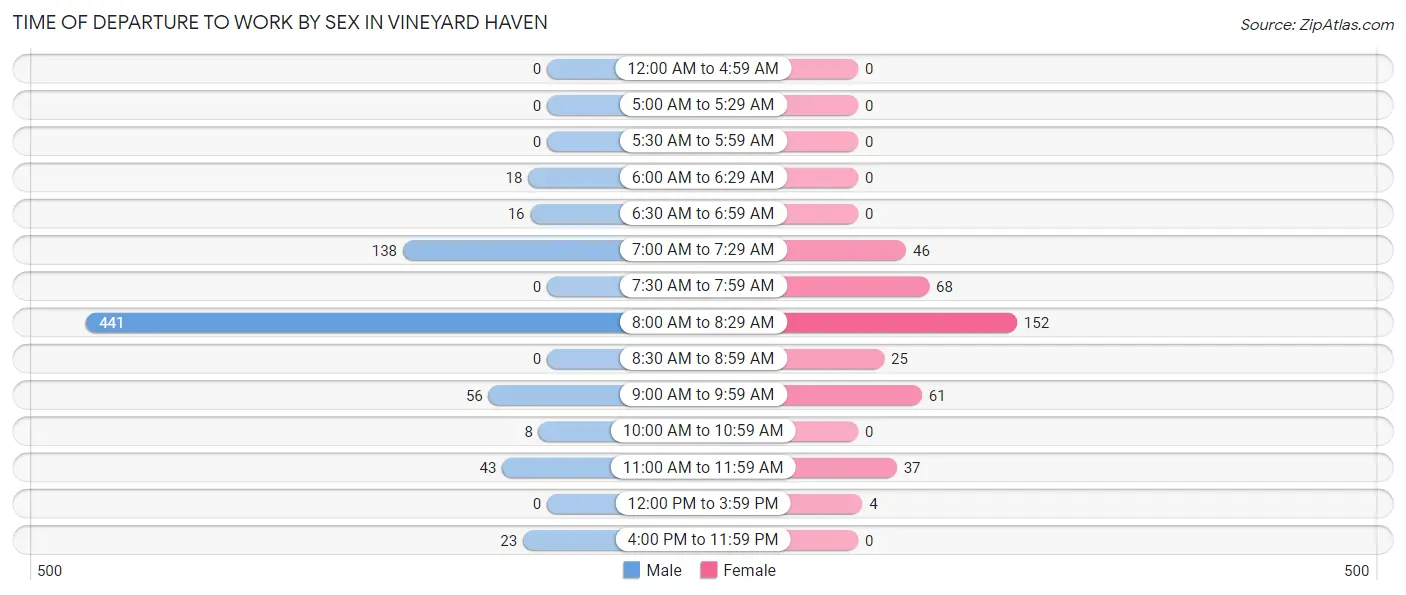
| Time of Departure | Male | Female |
| 12:00 AM to 4:59 AM | 0 (0.0%) | 0 (0.0%) |
| 5:00 AM to 5:29 AM | 0 (0.0%) | 0 (0.0%) |
| 5:30 AM to 5:59 AM | 0 (0.0%) | 0 (0.0%) |
| 6:00 AM to 6:29 AM | 18 (2.4%) | 0 (0.0%) |
| 6:30 AM to 6:59 AM | 16 (2.1%) | 0 (0.0%) |
| 7:00 AM to 7:29 AM | 138 (18.6%) | 46 (11.7%) |
| 7:30 AM to 7:59 AM | 0 (0.0%) | 68 (17.3%) |
| 8:00 AM to 8:29 AM | 441 (59.4%) | 152 (38.7%) |
| 8:30 AM to 8:59 AM | 0 (0.0%) | 25 (6.4%) |
| 9:00 AM to 9:59 AM | 56 (7.5%) | 61 (15.5%) |
| 10:00 AM to 10:59 AM | 8 (1.1%) | 0 (0.0%) |
| 11:00 AM to 11:59 AM | 43 (5.8%) | 37 (9.4%) |
| 12:00 PM to 3:59 PM | 0 (0.0%) | 4 (1.0%) |
| 4:00 PM to 11:59 PM | 23 (3.1%) | 0 (0.0%) |
| Total | 743 (100.0%) | 393 (100.0%) |
Housing Occupancy in Vineyard Haven
Occupancy by Ownership in Vineyard Haven
Of the total 816 dwellings in Vineyard Haven, owner-occupied units account for 504 (61.8%), while renter-occupied units make up 312 (38.2%).
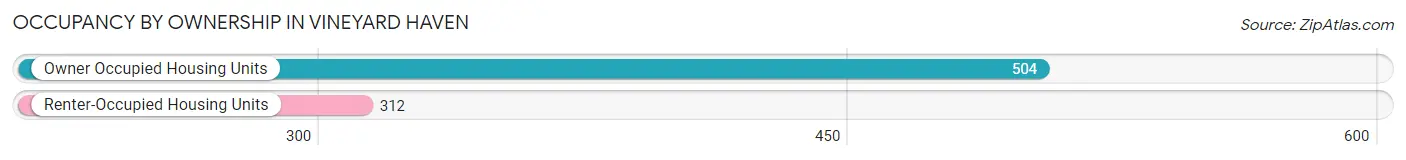
| Occupancy | # Housing Units | % Housing Units |
| Owner Occupied Housing Units | 504 | 61.8% |
| Renter-Occupied Housing Units | 312 | 38.2% |
| Total Occupied Housing Units | 816 | 100.0% |
Occupancy by Household Size in Vineyard Haven
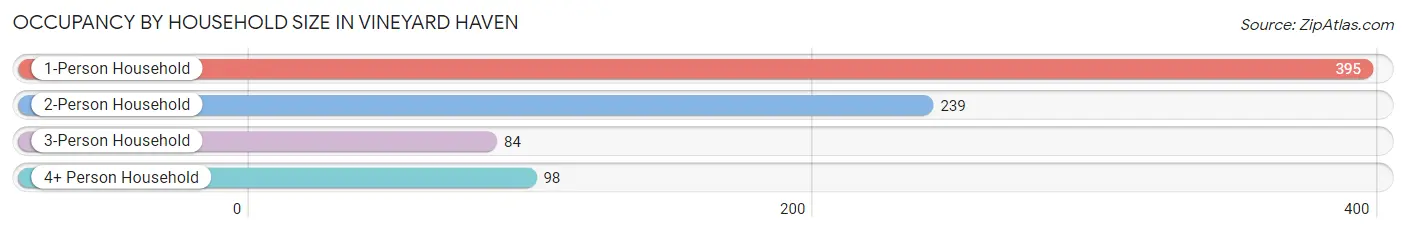
| Household Size | # Housing Units | % Housing Units |
| 1-Person Household | 395 | 48.4% |
| 2-Person Household | 239 | 29.3% |
| 3-Person Household | 84 | 10.3% |
| 4+ Person Household | 98 | 12.0% |
| Total Housing Units | 816 | 100.0% |
Occupancy by Ownership by Household Size in Vineyard Haven
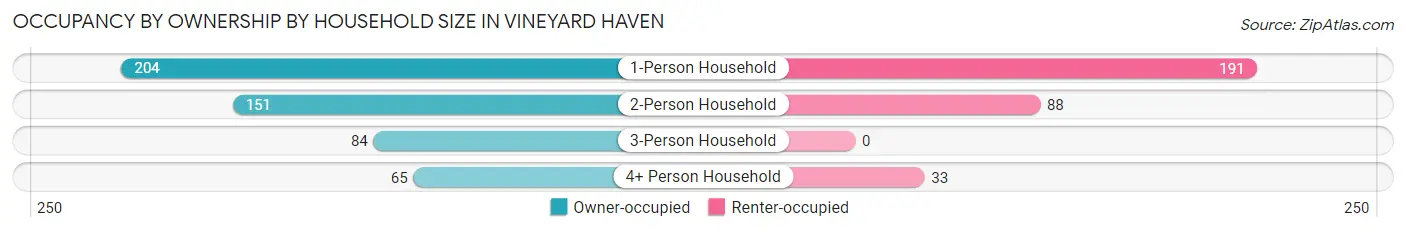
| Household Size | Owner-occupied | Renter-occupied |
| 1-Person Household | 204 (51.6%) | 191 (48.3%) |
| 2-Person Household | 151 (63.2%) | 88 (36.8%) |
| 3-Person Household | 84 (100.0%) | 0 (0.0%) |
| 4+ Person Household | 65 (66.3%) | 33 (33.7%) |
| Total Housing Units | 504 (61.8%) | 312 (38.2%) |
Occupancy by Educational Attainment in Vineyard Haven
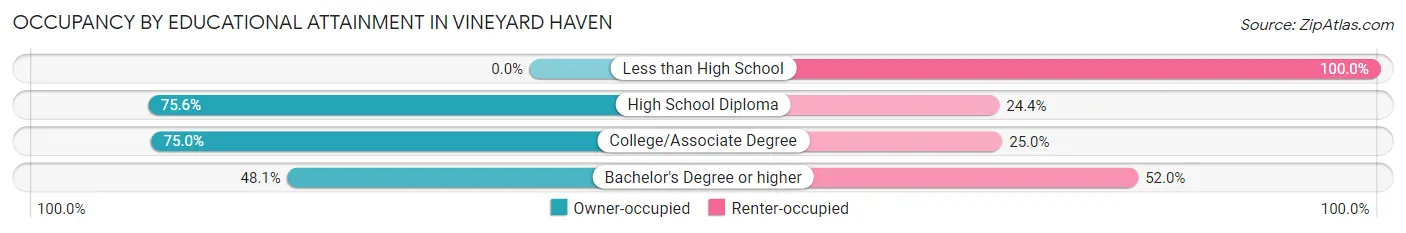
| Household Size | Owner-occupied | Renter-occupied |
| Less than High School | 0 (0.0%) | 26 (100.0%) |
| High School Diploma | 167 (75.6%) | 54 (24.4%) |
| College/Associate Degree | 177 (75.0%) | 59 (25.0%) |
| Bachelor's Degree or higher | 160 (48.0%) | 173 (51.9%) |
Occupancy by Age of Householder in Vineyard Haven
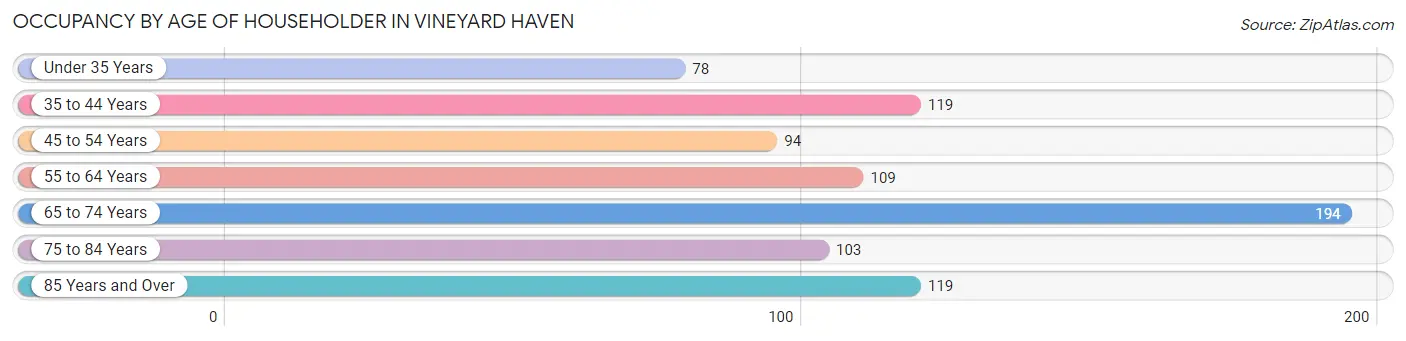
| Age Bracket | # Households | % Households |
| Under 35 Years | 78 | 9.6% |
| 35 to 44 Years | 119 | 14.6% |
| 45 to 54 Years | 94 | 11.5% |
| 55 to 64 Years | 109 | 13.4% |
| 65 to 74 Years | 194 | 23.8% |
| 75 to 84 Years | 103 | 12.6% |
| 85 Years and Over | 119 | 14.6% |
| Total | 816 | 100.0% |
Housing Finances in Vineyard Haven
Median Income by Occupancy in Vineyard Haven
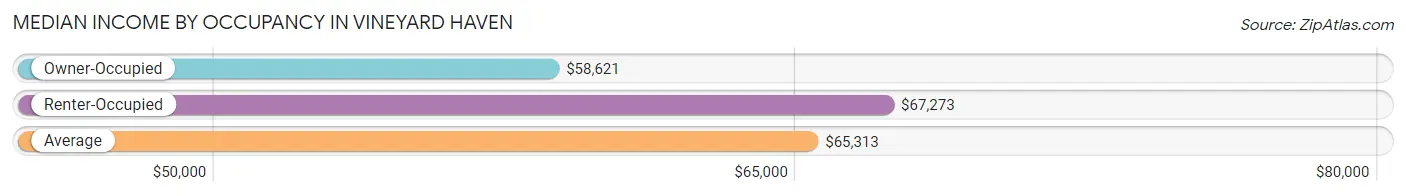
| Occupancy Type | # Households | Median Income |
| Owner-Occupied | 504 (61.8%) | $58,621 |
| Renter-Occupied | 312 (38.2%) | $67,273 |
| Average | 816 (100.0%) | $65,313 |
Occupancy by Householder Income Bracket in Vineyard Haven
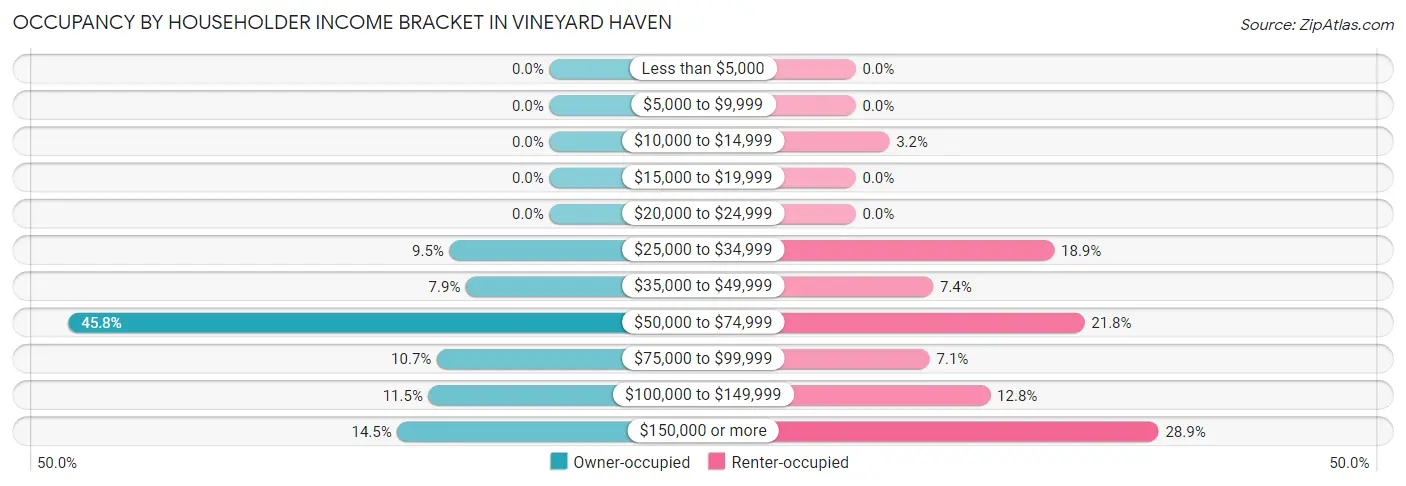
| Income Bracket | Owner-occupied | Renter-occupied |
| Less than $5,000 | 0 (0.0%) | 0 (0.0%) |
| $5,000 to $9,999 | 0 (0.0%) | 0 (0.0%) |
| $10,000 to $14,999 | 0 (0.0%) | 10 (3.2%) |
| $15,000 to $19,999 | 0 (0.0%) | 0 (0.0%) |
| $20,000 to $24,999 | 0 (0.0%) | 0 (0.0%) |
| $25,000 to $34,999 | 48 (9.5%) | 59 (18.9%) |
| $35,000 to $49,999 | 40 (7.9%) | 23 (7.4%) |
| $50,000 to $74,999 | 231 (45.8%) | 68 (21.8%) |
| $75,000 to $99,999 | 54 (10.7%) | 22 (7.0%) |
| $100,000 to $149,999 | 58 (11.5%) | 40 (12.8%) |
| $150,000 or more | 73 (14.5%) | 90 (28.8%) |
| Total | 504 (100.0%) | 312 (100.0%) |
Monthly Housing Cost Tiers in Vineyard Haven
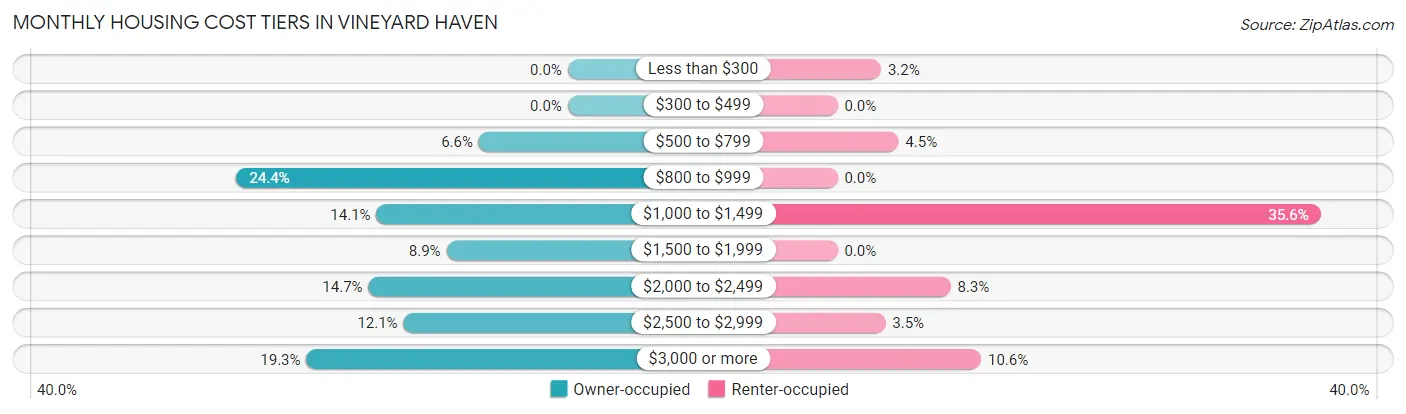
| Monthly Cost | Owner-occupied | Renter-occupied |
| Less than $300 | 0 (0.0%) | 10 (3.2%) |
| $300 to $499 | 0 (0.0%) | 0 (0.0%) |
| $500 to $799 | 33 (6.6%) | 14 (4.5%) |
| $800 to $999 | 123 (24.4%) | 0 (0.0%) |
| $1,000 to $1,499 | 71 (14.1%) | 111 (35.6%) |
| $1,500 to $1,999 | 45 (8.9%) | 0 (0.0%) |
| $2,000 to $2,499 | 74 (14.7%) | 26 (8.3%) |
| $2,500 to $2,999 | 61 (12.1%) | 11 (3.5%) |
| $3,000 or more | 97 (19.3%) | 33 (10.6%) |
| Total | 504 (100.0%) | 312 (100.0%) |
Physical Housing Characteristics in Vineyard Haven
Housing Structures in Vineyard Haven
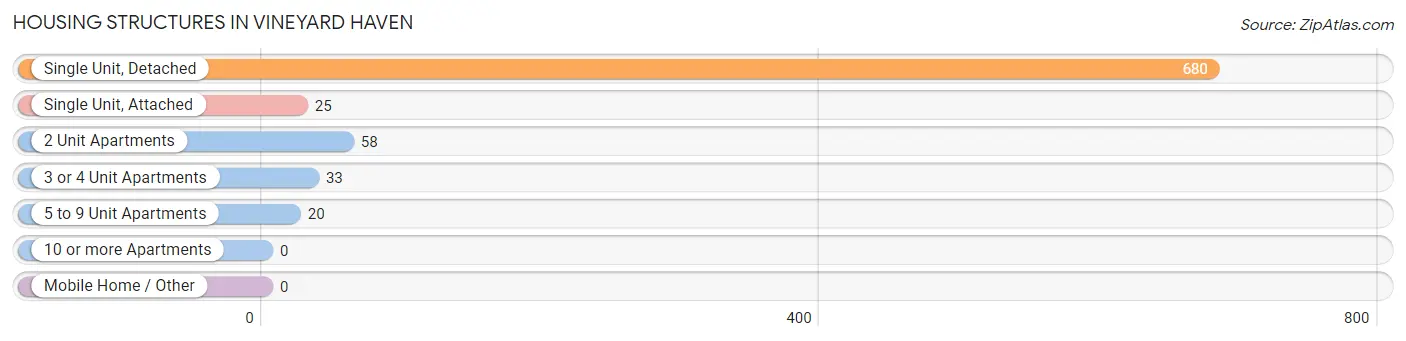
| Structure Type | # Housing Units | % Housing Units |
| Single Unit, Detached | 680 | 83.3% |
| Single Unit, Attached | 25 | 3.1% |
| 2 Unit Apartments | 58 | 7.1% |
| 3 or 4 Unit Apartments | 33 | 4.0% |
| 5 to 9 Unit Apartments | 20 | 2.5% |
| 10 or more Apartments | 0 | 0.0% |
| Mobile Home / Other | 0 | 0.0% |
| Total | 816 | 100.0% |
Housing Structures by Occupancy in Vineyard Haven
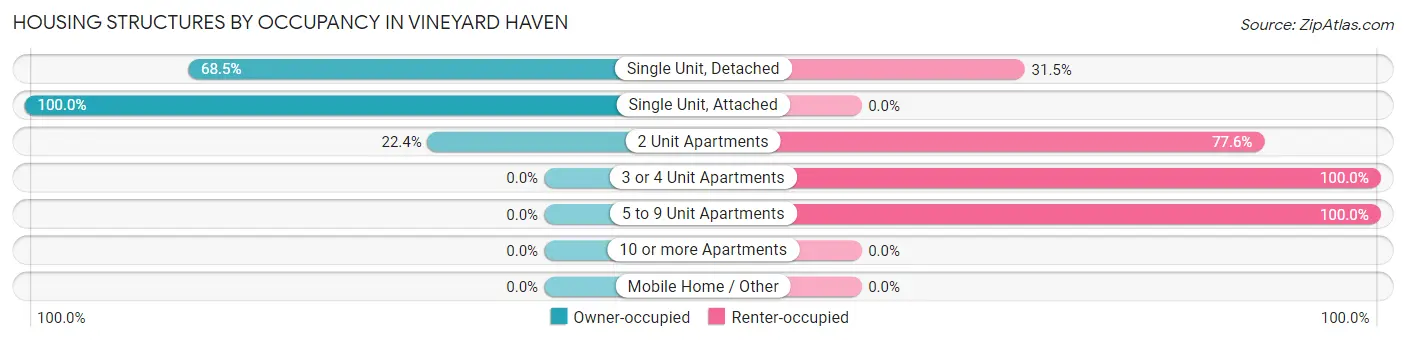
| Structure Type | Owner-occupied | Renter-occupied |
| Single Unit, Detached | 466 (68.5%) | 214 (31.5%) |
| Single Unit, Attached | 25 (100.0%) | 0 (0.0%) |
| 2 Unit Apartments | 13 (22.4%) | 45 (77.6%) |
| 3 or 4 Unit Apartments | 0 (0.0%) | 33 (100.0%) |
| 5 to 9 Unit Apartments | 0 (0.0%) | 20 (100.0%) |
| 10 or more Apartments | 0 (0.0%) | 0 (0.0%) |
| Mobile Home / Other | 0 (0.0%) | 0 (0.0%) |
| Total | 504 (61.8%) | 312 (38.2%) |
Housing Structures by Number of Rooms in Vineyard Haven
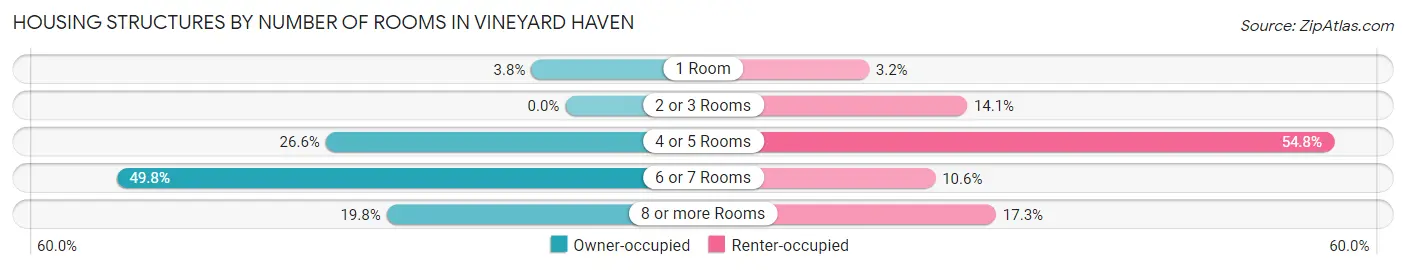
| Number of Rooms | Owner-occupied | Renter-occupied |
| 1 Room | 19 (3.8%) | 10 (3.2%) |
| 2 or 3 Rooms | 0 (0.0%) | 44 (14.1%) |
| 4 or 5 Rooms | 134 (26.6%) | 171 (54.8%) |
| 6 or 7 Rooms | 251 (49.8%) | 33 (10.6%) |
| 8 or more Rooms | 100 (19.8%) | 54 (17.3%) |
| Total | 504 (100.0%) | 312 (100.0%) |
Housing Structure by Heating Type in Vineyard Haven
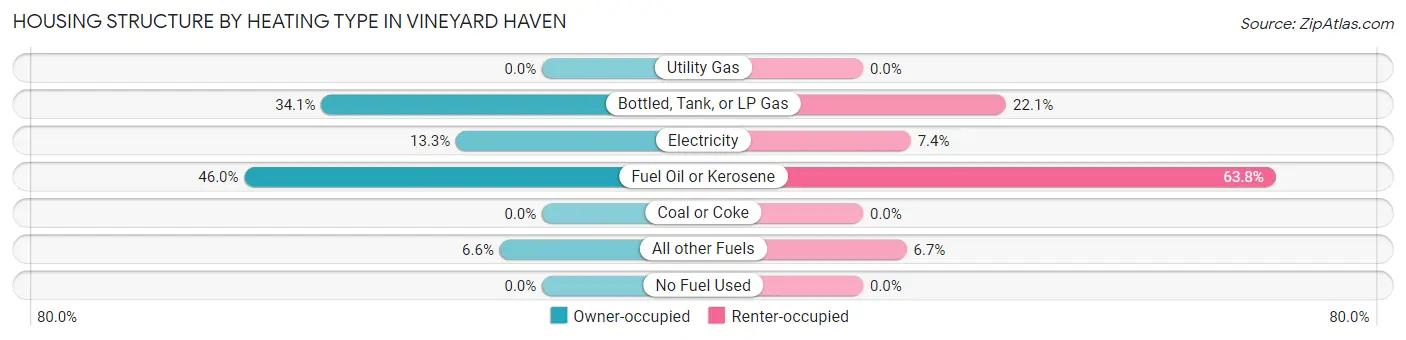
| Heating Type | Owner-occupied | Renter-occupied |
| Utility Gas | 0 (0.0%) | 0 (0.0%) |
| Bottled, Tank, or LP Gas | 172 (34.1%) | 69 (22.1%) |
| Electricity | 67 (13.3%) | 23 (7.4%) |
| Fuel Oil or Kerosene | 232 (46.0%) | 199 (63.8%) |
| Coal or Coke | 0 (0.0%) | 0 (0.0%) |
| All other Fuels | 33 (6.6%) | 21 (6.7%) |
| No Fuel Used | 0 (0.0%) | 0 (0.0%) |
| Total | 504 (100.0%) | 312 (100.0%) |
Household Vehicle Usage in Vineyard Haven
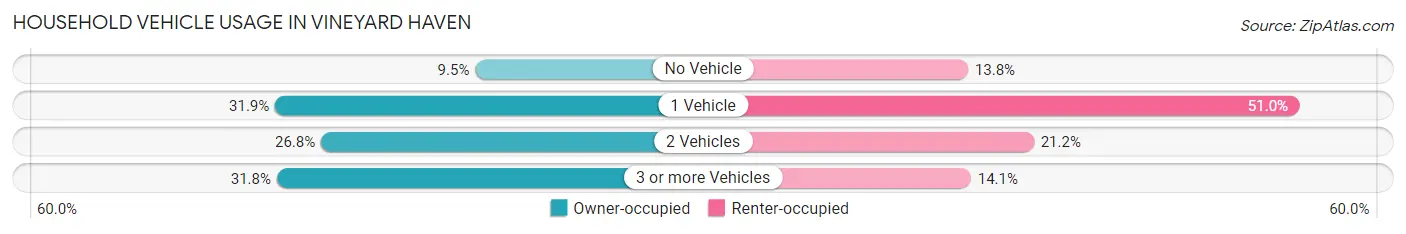
| Vehicles per Household | Owner-occupied | Renter-occupied |
| No Vehicle | 48 (9.5%) | 43 (13.8%) |
| 1 Vehicle | 161 (31.9%) | 159 (51.0%) |
| 2 Vehicles | 135 (26.8%) | 66 (21.1%) |
| 3 or more Vehicles | 160 (31.8%) | 44 (14.1%) |
| Total | 504 (100.0%) | 312 (100.0%) |
Real Estate & Mortgages in Vineyard Haven
Real Estate and Mortgage Overview in Vineyard Haven
| Characteristic | Without Mortgage | With Mortgage |
| Housing Units | 286 | 218 |
| Median Property Value | $695,500 | $787,700 |
| Median Household Income | $53,819 | $35 |
| Monthly Housing Costs | $983 | $97 |
| Real Estate Taxes | $4,417 | $0 |
Property Value by Mortgage Status in Vineyard Haven
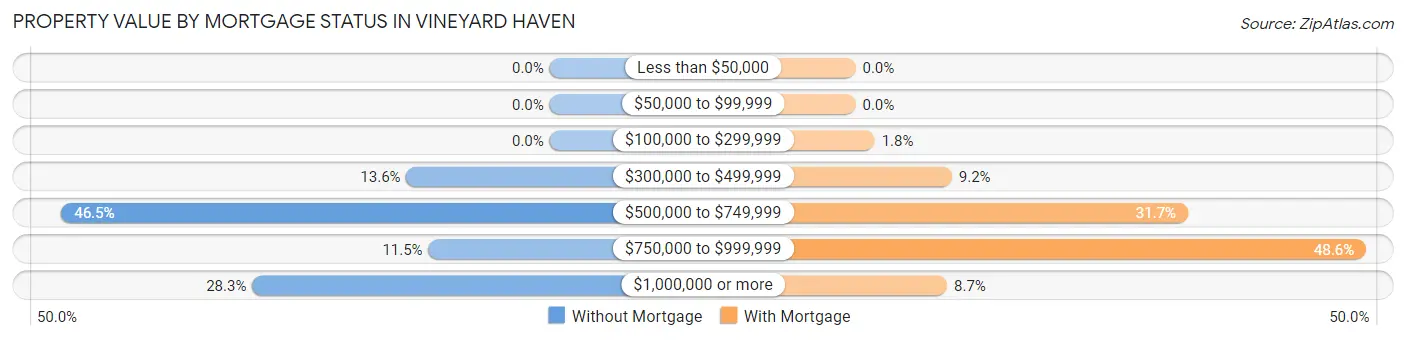
| Property Value | Without Mortgage | With Mortgage |
| Less than $50,000 | 0 (0.0%) | 0 (0.0%) |
| $50,000 to $99,999 | 0 (0.0%) | 0 (0.0%) |
| $100,000 to $299,999 | 0 (0.0%) | 4 (1.8%) |
| $300,000 to $499,999 | 39 (13.6%) | 20 (9.2%) |
| $500,000 to $749,999 | 133 (46.5%) | 69 (31.7%) |
| $750,000 to $999,999 | 33 (11.5%) | 106 (48.6%) |
| $1,000,000 or more | 81 (28.3%) | 19 (8.7%) |
| Total | 286 (100.0%) | 218 (100.0%) |
Household Income by Mortgage Status in Vineyard Haven
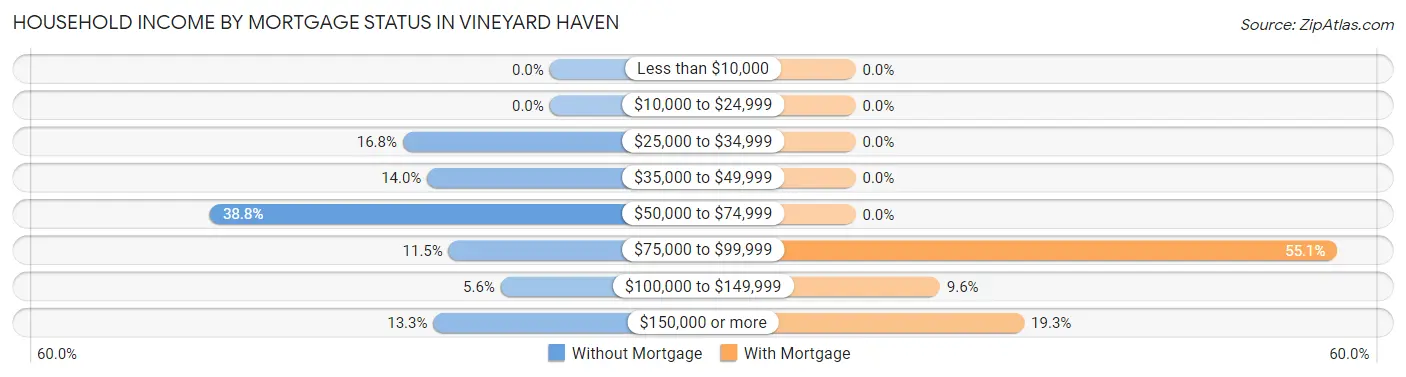
| Household Income | Without Mortgage | With Mortgage |
| Less than $10,000 | 0 (0.0%) | 0 (0.0%) |
| $10,000 to $24,999 | 0 (0.0%) | 0 (0.0%) |
| $25,000 to $34,999 | 48 (16.8%) | 0 (0.0%) |
| $35,000 to $49,999 | 40 (14.0%) | 0 (0.0%) |
| $50,000 to $74,999 | 111 (38.8%) | 0 (0.0%) |
| $75,000 to $99,999 | 33 (11.5%) | 120 (55.0%) |
| $100,000 to $149,999 | 16 (5.6%) | 21 (9.6%) |
| $150,000 or more | 38 (13.3%) | 42 (19.3%) |
| Total | 286 (100.0%) | 218 (100.0%) |
Property Value to Household Income Ratio in Vineyard Haven
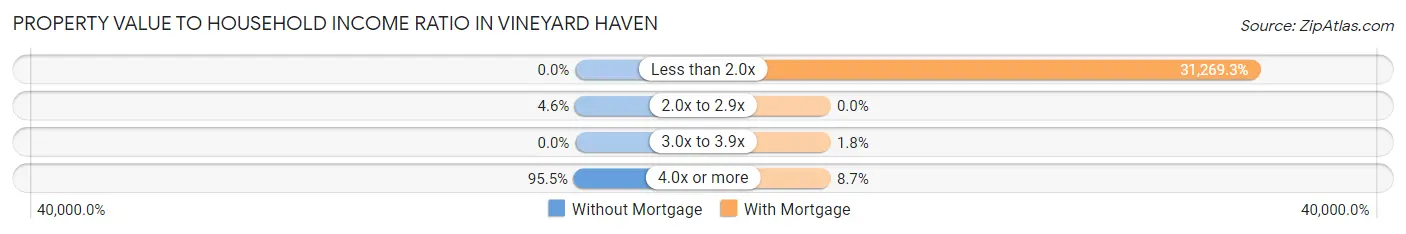
| Value-to-Income Ratio | Without Mortgage | With Mortgage |
| Less than 2.0x | 0 (0.0%) | 68,167 (31,269.3%) |
| 2.0x to 2.9x | 13 (4.5%) | 0 (0.0%) |
| 3.0x to 3.9x | 0 (0.0%) | 4 (1.8%) |
| 4.0x or more | 273 (95.5%) | 19 (8.7%) |
| Total | 286 (100.0%) | 218 (100.0%) |
Real Estate Taxes by Mortgage Status in Vineyard Haven
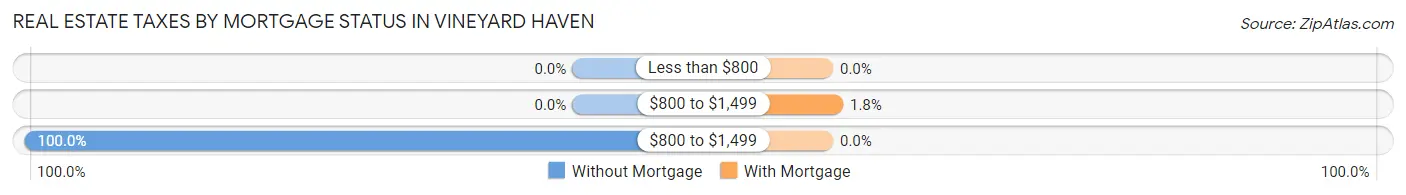
| Property Taxes | Without Mortgage | With Mortgage |
| Less than $800 | 0 (0.0%) | 0 (0.0%) |
| $800 to $1,499 | 0 (0.0%) | 4 (1.8%) |
| $800 to $1,499 | 286 (100.0%) | 0 (0.0%) |
| Total | 286 (100.0%) | 218 (100.0%) |
Health & Disability in Vineyard Haven
Health Insurance Coverage by Age in Vineyard Haven
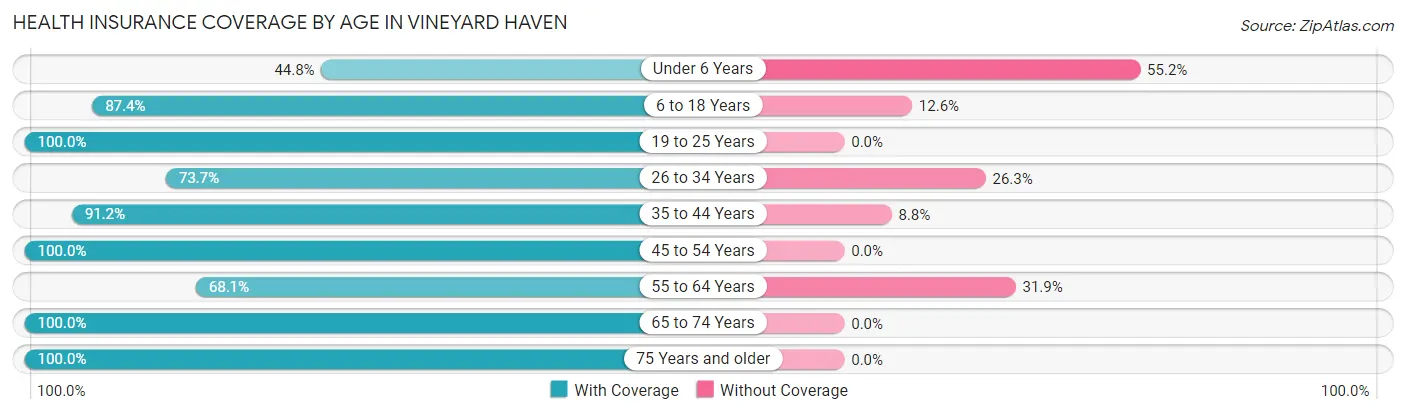
| Age Bracket | With Coverage | Without Coverage |
| Under 6 Years | 52 (44.8%) | 64 (55.2%) |
| 6 to 18 Years | 312 (87.4%) | 45 (12.6%) |
| 19 to 25 Years | 139 (100.0%) | 0 (0.0%) |
| 26 to 34 Years | 193 (73.7%) | 69 (26.3%) |
| 35 to 44 Years | 197 (91.2%) | 19 (8.8%) |
| 45 to 54 Years | 168 (100.0%) | 0 (0.0%) |
| 55 to 64 Years | 309 (68.1%) | 145 (31.9%) |
| 65 to 74 Years | 353 (100.0%) | 0 (0.0%) |
| 75 Years and older | 283 (100.0%) | 0 (0.0%) |
| Total | 2,006 (85.4%) | 342 (14.6%) |
Health Insurance Coverage by Citizenship Status in Vineyard Haven
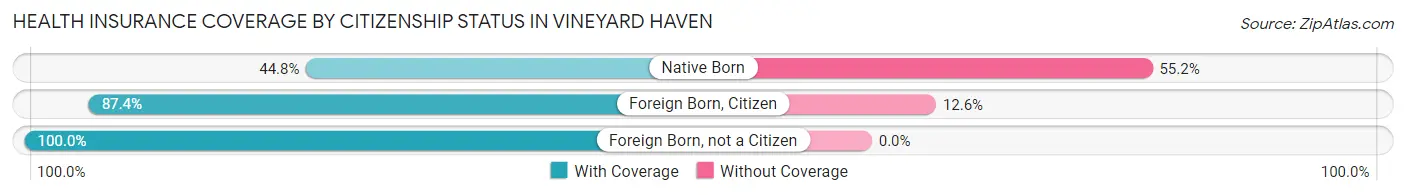
| Citizenship Status | With Coverage | Without Coverage |
| Native Born | 52 (44.8%) | 64 (55.2%) |
| Foreign Born, Citizen | 312 (87.4%) | 45 (12.6%) |
| Foreign Born, not a Citizen | 139 (100.0%) | 0 (0.0%) |
Health Insurance Coverage by Household Income in Vineyard Haven
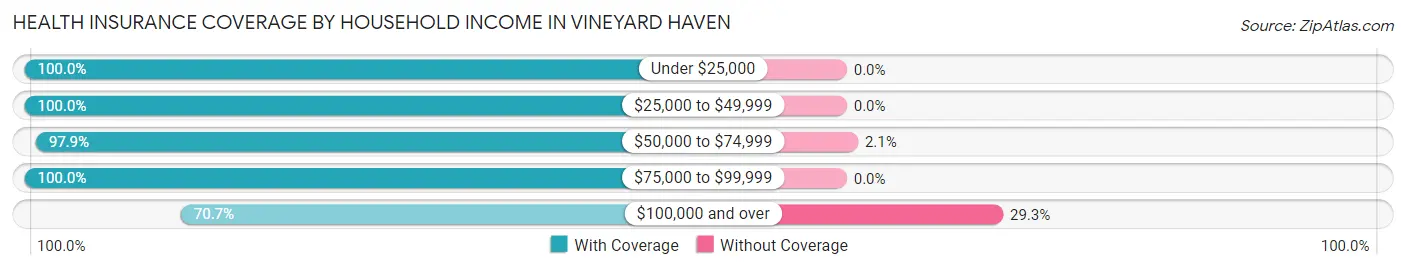
| Household Income | With Coverage | Without Coverage |
| Under $25,000 | 10 (100.0%) | 0 (0.0%) |
| $25,000 to $49,999 | 200 (100.0%) | 0 (0.0%) |
| $50,000 to $74,999 | 887 (97.9%) | 19 (2.1%) |
| $75,000 to $99,999 | 129 (100.0%) | 0 (0.0%) |
| $100,000 and over | 780 (70.7%) | 323 (29.3%) |
Public vs Private Health Insurance Coverage by Age in Vineyard Haven
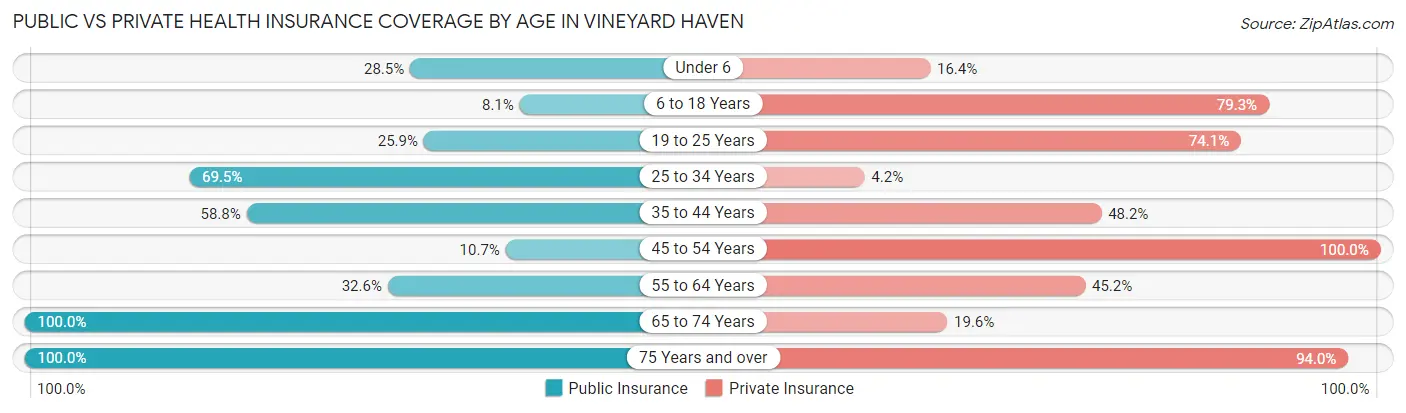
| Age Bracket | Public Insurance | Private Insurance |
| Under 6 | 33 (28.4%) | 19 (16.4%) |
| 6 to 18 Years | 29 (8.1%) | 283 (79.3%) |
| 19 to 25 Years | 36 (25.9%) | 103 (74.1%) |
| 25 to 34 Years | 182 (69.5%) | 11 (4.2%) |
| 35 to 44 Years | 127 (58.8%) | 104 (48.1%) |
| 45 to 54 Years | 18 (10.7%) | 168 (100.0%) |
| 55 to 64 Years | 148 (32.6%) | 205 (45.2%) |
| 65 to 74 Years | 353 (100.0%) | 69 (19.6%) |
| 75 Years and over | 283 (100.0%) | 266 (94.0%) |
| Total | 1,209 (51.5%) | 1,228 (52.3%) |
Disability Status by Sex by Age in Vineyard Haven
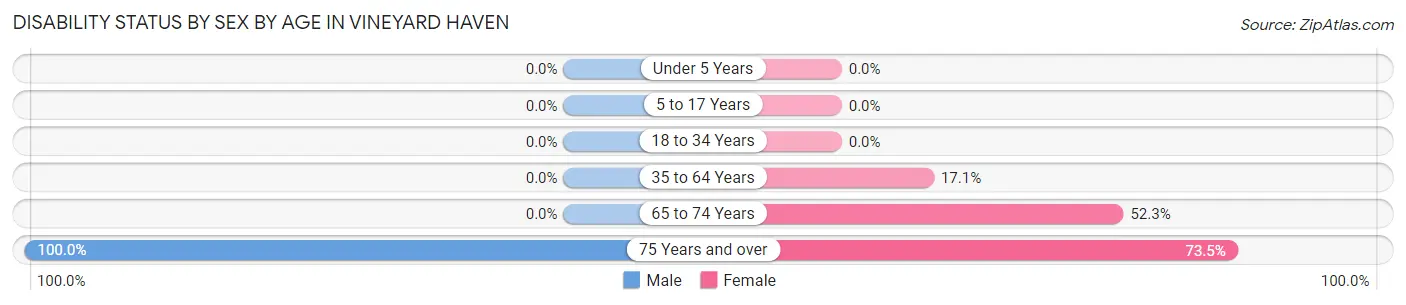
| Age Bracket | Male | Female |
| Under 5 Years | 0 (0.0%) | 0 (0.0%) |
| 5 to 17 Years | 0 (0.0%) | 0 (0.0%) |
| 18 to 34 Years | 0 (0.0%) | 0 (0.0%) |
| 35 to 64 Years | 0 (0.0%) | 52 (17.1%) |
| 65 to 74 Years | 0 (0.0%) | 80 (52.3%) |
| 75 Years and over | 72 (100.0%) | 155 (73.5%) |
Disability Class by Sex by Age in Vineyard Haven
Disability Class: Hearing Difficulty
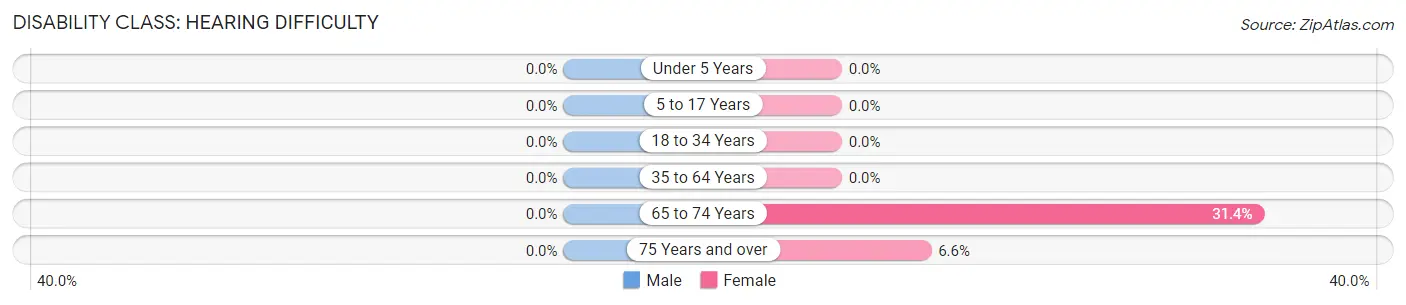
| Age Bracket | Male | Female |
| Under 5 Years | 0 (0.0%) | 0 (0.0%) |
| 5 to 17 Years | 0 (0.0%) | 0 (0.0%) |
| 18 to 34 Years | 0 (0.0%) | 0 (0.0%) |
| 35 to 64 Years | 0 (0.0%) | 0 (0.0%) |
| 65 to 74 Years | 0 (0.0%) | 48 (31.4%) |
| 75 Years and over | 0 (0.0%) | 14 (6.6%) |
Disability Class: Vision Difficulty
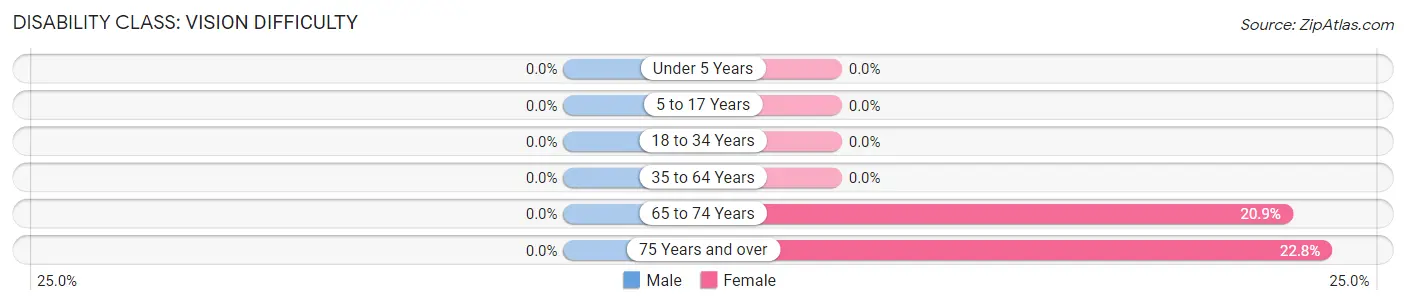
| Age Bracket | Male | Female |
| Under 5 Years | 0 (0.0%) | 0 (0.0%) |
| 5 to 17 Years | 0 (0.0%) | 0 (0.0%) |
| 18 to 34 Years | 0 (0.0%) | 0 (0.0%) |
| 35 to 64 Years | 0 (0.0%) | 0 (0.0%) |
| 65 to 74 Years | 0 (0.0%) | 32 (20.9%) |
| 75 Years and over | 0 (0.0%) | 48 (22.8%) |
Disability Class: Cognitive Difficulty
| Age Bracket | Male | Female |
| 5 to 17 Years | 0 (0.0%) | 0 (0.0%) |
| 18 to 34 Years | 0 (0.0%) | 0 (0.0%) |
| 35 to 64 Years | 0 (0.0%) | 0 (0.0%) |
| 65 to 74 Years | 0 (0.0%) | 0 (0.0%) |
| 75 Years and over | 0 (0.0%) | 0 (0.0%) |
Disability Class: Ambulatory Difficulty
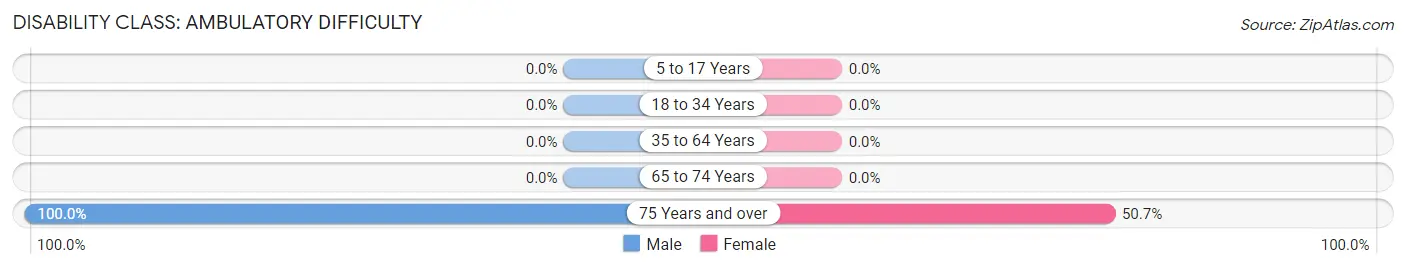
| Age Bracket | Male | Female |
| 5 to 17 Years | 0 (0.0%) | 0 (0.0%) |
| 18 to 34 Years | 0 (0.0%) | 0 (0.0%) |
| 35 to 64 Years | 0 (0.0%) | 0 (0.0%) |
| 65 to 74 Years | 0 (0.0%) | 0 (0.0%) |
| 75 Years and over | 72 (100.0%) | 107 (50.7%) |
Disability Class: Self-Care Difficulty
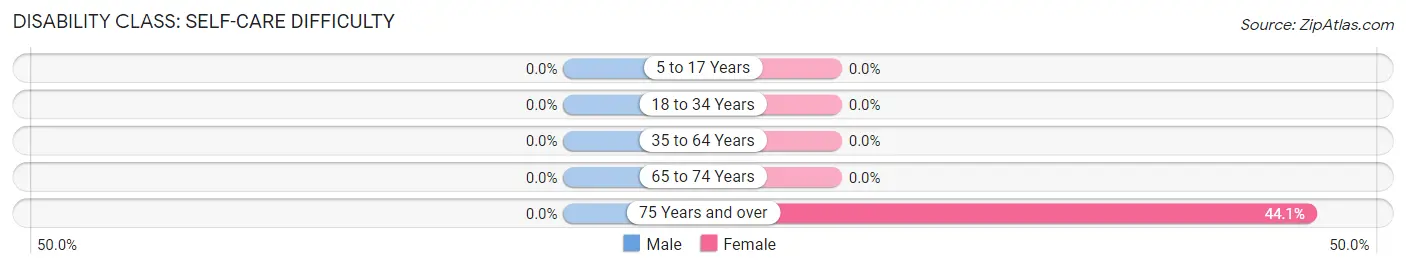
| Age Bracket | Male | Female |
| 5 to 17 Years | 0 (0.0%) | 0 (0.0%) |
| 18 to 34 Years | 0 (0.0%) | 0 (0.0%) |
| 35 to 64 Years | 0 (0.0%) | 0 (0.0%) |
| 65 to 74 Years | 0 (0.0%) | 0 (0.0%) |
| 75 Years and over | 0 (0.0%) | 93 (44.1%) |
Technology Access in Vineyard Haven
Computing Device Access in Vineyard Haven
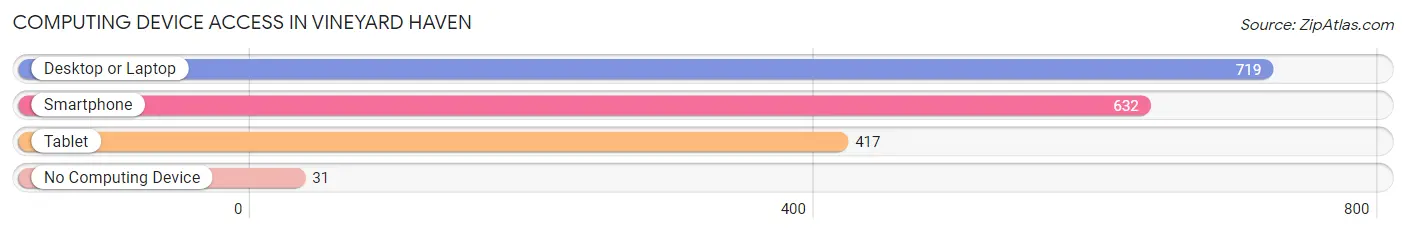
| Device Type | # Households | % Households |
| Desktop or Laptop | 719 | 88.1% |
| Smartphone | 632 | 77.4% |
| Tablet | 417 | 51.1% |
| No Computing Device | 31 | 3.8% |
| Total | 816 | 100.0% |
Internet Access in Vineyard Haven
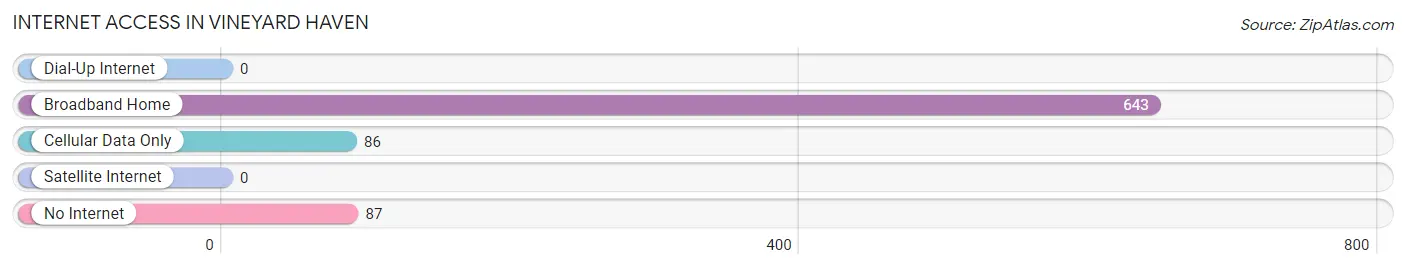
| Internet Type | # Households | % Households |
| Dial-Up Internet | 0 | 0.0% |
| Broadband Home | 643 | 78.8% |
| Cellular Data Only | 86 | 10.5% |
| Satellite Internet | 0 | 0.0% |
| No Internet | 87 | 10.7% |
| Total | 816 | 100.0% |
Vineyard Haven Summary
Vineyard Haven is a town located on the island of Martha’s Vineyard in Dukes County, Massachusetts. It is the principal town of the island and the county seat. The town is located on the western side of the island, and is bordered by the towns of West Tisbury, Oak Bluffs, and Edgartown. Vineyard Haven is a popular tourist destination, and is known for its picturesque harbor, beaches, and historic downtown.
History
The area that is now Vineyard Haven was originally inhabited by the Wampanoag people. The first European settlers arrived in the area in 1642, and the town was officially incorporated in 1771. The town was originally known as Holmes Hole, and was renamed Vineyard Haven in 1871.
The town was an important port for the whaling industry in the 19th century, and was home to several whaling ships. The town was also a major center for the fishing industry, and was home to several fish processing plants.
In the late 19th century, the town began to attract tourists, and the downtown area was developed to accommodate them. The town was also home to several summer resorts, and the population grew significantly during the summer months.
Geography
Vineyard Haven is located on the western side of Martha’s Vineyard, and is bordered by the towns of West Tisbury, Oak Bluffs, and Edgartown. The town is located on a peninsula, and is surrounded by Vineyard Sound to the north, Nantucket Sound to the south, and the Atlantic Ocean to the east.
The town is home to several beaches, including State Beach, Eastville Beach, and Owen Park Beach. The town also has several parks, including Owen Park, Eastville Park, and the Vineyard Haven Town Park.
Economy
The economy of Vineyard Haven is largely based on tourism. The town is home to several hotels, restaurants, and shops, and is a popular destination for visitors from around the world. The town is also home to several marinas, and is a popular destination for boaters.
The town is also home to several businesses, including a brewery, a winery, and a distillery. The town is also home to several art galleries, and is a popular destination for art lovers.
Demographics
As of the 2010 census, the population of Vineyard Haven was 2,114. The median age of the population was 48.7 years, and the median household income was $63,917. The town is predominantly white, with 92.3% of the population identifying as white. The town is also home to a small African American population, with 2.3% of the population identifying as African American.
Conclusion
Vineyard Haven is a town located on the island of Martha’s Vineyard in Dukes County, Massachusetts. It is the principal town of the island and the county seat. The town is known for its picturesque harbor, beaches, and historic downtown, and is a popular tourist destination. The economy of the town is largely based on tourism, and the town is home to several businesses, including a brewery, a winery, and a distillery. As of the 2010 census, the population of Vineyard Haven was 2,114, and the median age of the population was 48.7 years.
Common Questions
What is Per Capita Income in Vineyard Haven?
Per Capita income in Vineyard Haven is $39,285.
What is the Median Family Income in Vineyard Haven?
Median Family Income in Vineyard Haven is $92,426.
What is the Median Household income in Vineyard Haven?
Median Household Income in Vineyard Haven is $65,313.
What is Inequality or Gini Index in Vineyard Haven?
Inequality or Gini Index in Vineyard Haven is 0.36.
What is the Total Population of Vineyard Haven?
Total Population of Vineyard Haven is 2,367.
What is the Total Male Population of Vineyard Haven?
Total Male Population of Vineyard Haven is 1,257.
What is the Total Female Population of Vineyard Haven?
Total Female Population of Vineyard Haven is 1,110.
What is the Ratio of Males per 100 Females in Vineyard Haven?
There are 113.24 Males per 100 Females in Vineyard Haven.
What is the Ratio of Females per 100 Males in Vineyard Haven?
There are 88.31 Females per 100 Males in Vineyard Haven.
What is the Median Population Age in Vineyard Haven?
Median Population Age in Vineyard Haven is 50.3 Years.
What is the Average Family Size in Vineyard Haven
Average Family Size in Vineyard Haven is 4.9 People.
What is the Average Household Size in Vineyard Haven
Average Household Size in Vineyard Haven is 2.9 People.
How Large is the Labor Force in Vineyard Haven?
There are 1,336 People in the Labor Forcein in Vineyard Haven.
What is the Percentage of People in the Labor Force in Vineyard Haven?
69.7% of People are in the Labor Force in Vineyard Haven.
What is the Unemployment Rate in Vineyard Haven?
Unemployment Rate in Vineyard Haven is 3.7%.