Zip Codes with the Highest Percentage of Population Employed in Life, Physical & Social Science in Chicopee, MA
RELATED REPORTS & OPTIONS
Life, Physical & Social Science
Chicopee
Compare Zip Codes
Map of Zip Codes with the Highest Percentage of Population Employed in Life, Physical & Social Science in Chicopee
0.43%
1.1%
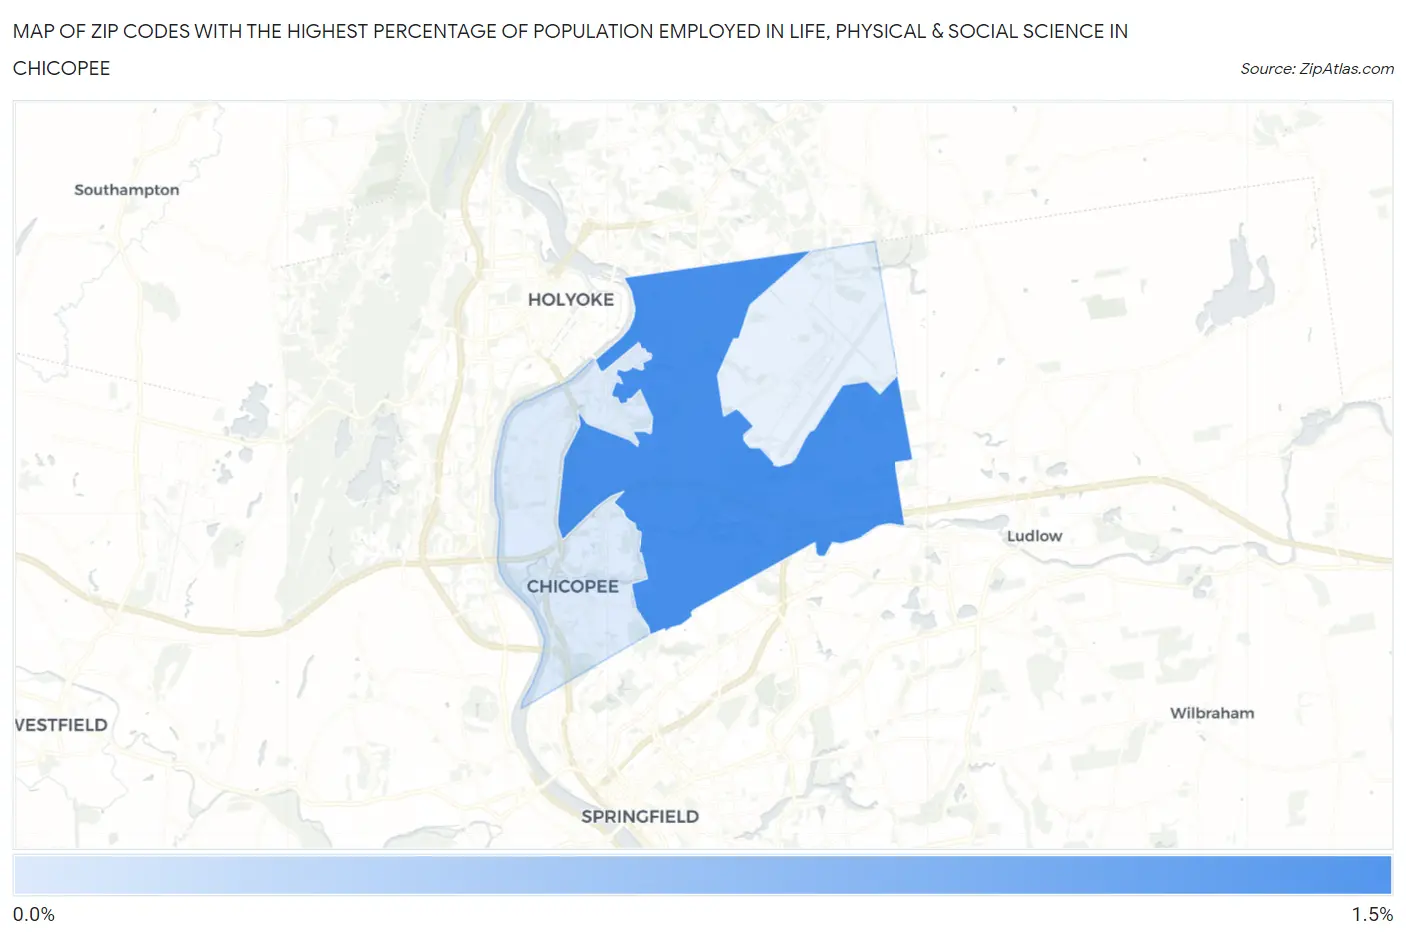
Zip Codes with the Highest Percentage of Population Employed in Life, Physical & Social Science in Chicopee, MA
| Zip Code | % Employed | vs State | vs National | |
| 1. | 01020 | 1.1% | 2.4%(-1.24)#281 | 1.1%(+0.033)#8,041 |
| 2. | 01013 | 0.43% | 2.4%(-1.93)#398 | 1.1%(-0.659)#15,352 |
1
Common Questions
What are the Top Zip Codes with the Highest Percentage of Population Employed in Life, Physical & Social Science in Chicopee, MA?
Top Zip Codes with the Highest Percentage of Population Employed in Life, Physical & Social Science in Chicopee, MA are:
What zip code has the Highest Percentage of Population Employed in Life, Physical & Social Science in Chicopee, MA?
01020 has the Highest Percentage of Population Employed in Life, Physical & Social Science in Chicopee, MA with 1.1%.
What is the Percentage of Population Employed in Life, Physical & Social Science in Chicopee, MA?
Percentage of Population Employed in Life, Physical & Social Science in Chicopee is 0.80%.
What is the Percentage of Population Employed in Life, Physical & Social Science in Massachusetts?
Percentage of Population Employed in Life, Physical & Social Science in Massachusetts is 2.4%.
What is the Percentage of Population Employed in Life, Physical & Social Science in the United States?
Percentage of Population Employed in Life, Physical & Social Science in the United States is 1.1%.