Zip Codes with the Highest Percentage of Population Employed in Life, Physical & Social Science in Massachusetts
RELATED REPORTS & OPTIONS
Life, Physical & Social Science
Massachusetts
Compare Zip Codes
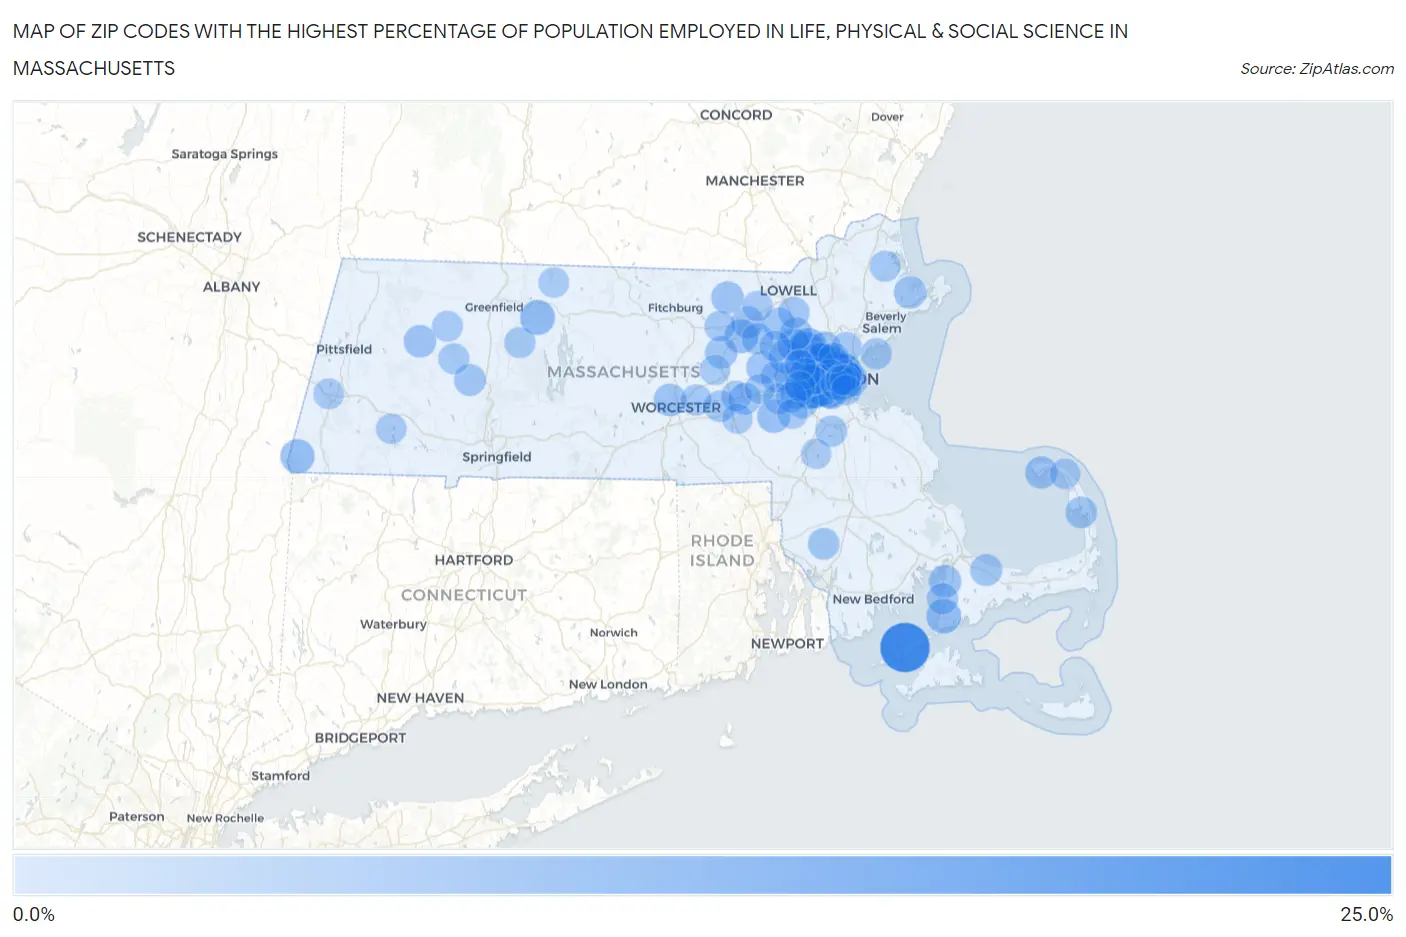
Map of Zip Codes with the Highest Percentage of Population Employed in Life, Physical & Social Science in Massachusetts
0.0%
25.0%
Zip Codes with the Highest Percentage of Population Employed in Life, Physical & Social Science in Massachusetts
| Zip Code | % Employed | vs State | vs National | |
| 1. | 02543 | 22.3% | 2.4%(+19.9)#1 | 1.1%(+21.2)#50 |
| 2. | 02142 | 20.2% | 2.4%(+17.8)#2 | 1.1%(+19.1)#61 |
| 3. | 02139 | 12.8% | 2.4%(+10.4)#3 | 1.1%(+11.7)#134 |
| 4. | 02141 | 10.9% | 2.4%(+8.50)#4 | 1.1%(+9.77)#175 |
| 5. | 02421 | 10.5% | 2.4%(+8.15)#5 | 1.1%(+9.42)#193 |
| 6. | 02445 | 10.4% | 2.4%(+8.00)#6 | 1.1%(+9.27)#199 |
| 7. | 02140 | 10.3% | 2.4%(+7.98)#7 | 1.1%(+9.26)#200 |
| 8. | 02446 | 9.7% | 2.4%(+7.30)#8 | 1.1%(+8.58)#221 |
| 9. | 02144 | 9.2% | 2.4%(+6.83)#9 | 1.1%(+8.10)#245 |
| 10. | 02138 | 9.1% | 2.4%(+6.78)#10 | 1.1%(+8.05)#250 |
| 11. | 02478 | 9.0% | 2.4%(+6.59)#11 | 1.1%(+7.86)#259 |
| 12. | 02420 | 8.8% | 2.4%(+6.40)#12 | 1.1%(+7.68)#269 |
| 13. | 02114 | 8.6% | 2.4%(+6.23)#13 | 1.1%(+7.50)#278 |
| 14. | 02476 | 8.6% | 2.4%(+6.21)#14 | 1.1%(+7.49)#279 |
| 15. | 02461 | 8.5% | 2.4%(+6.17)#15 | 1.1%(+7.44)#282 |
| 16. | 02134 | 8.5% | 2.4%(+6.13)#16 | 1.1%(+7.41)#284 |
| 17. | 02215 | 8.4% | 2.4%(+6.07)#17 | 1.1%(+7.34)#293 |
| 18. | 02466 | 8.3% | 2.4%(+5.91)#18 | 1.1%(+7.19)#305 |
| 19. | 01379 | 7.7% | 2.4%(+5.37)#19 | 1.1%(+6.64)#347 |
| 20. | 02143 | 7.5% | 2.4%(+5.16)#20 | 1.1%(+6.43)#360 |
| 21. | 02540 | 7.4% | 2.4%(+5.07)#21 | 1.1%(+6.34)#369 |
| 22. | 01773 | 7.4% | 2.4%(+5.06)#22 | 1.1%(+6.34)#371 |
| 23. | 02464 | 7.4% | 2.4%(+4.99)#23 | 1.1%(+6.26)#377 |
| 24. | 02459 | 7.0% | 2.4%(+4.62)#24 | 1.1%(+5.89)#409 |
| 25. | 01258 | 6.9% | 2.4%(+4.57)#25 | 1.1%(+5.84)#418 |
| 26. | 02135 | 6.9% | 2.4%(+4.49)#26 | 1.1%(+5.76)#424 |
| 27. | 02468 | 6.6% | 2.4%(+4.26)#27 | 1.1%(+5.53)#454 |
| 28. | 01719 | 6.6% | 2.4%(+4.19)#28 | 1.1%(+5.47)#461 |
| 29. | 02474 | 6.3% | 2.4%(+3.96)#29 | 1.1%(+5.24)#497 |
| 30. | 01770 | 6.2% | 2.4%(+3.80)#30 | 1.1%(+5.08)#523 |
| 31. | 02130 | 6.1% | 2.4%(+3.72)#31 | 1.1%(+4.99)#537 |
| 32. | 02493 | 6.1% | 2.4%(+3.72)#32 | 1.1%(+4.99)#538 |
| 33. | 02465 | 6.1% | 2.4%(+3.71)#33 | 1.1%(+4.99)#539 |
| 34. | 02210 | 6.1% | 2.4%(+3.69)#34 | 1.1%(+4.97)#542 |
| 35. | 02472 | 6.0% | 2.4%(+3.67)#35 | 1.1%(+4.94)#544 |
| 36. | 01731 | 6.0% | 2.4%(+3.60)#36 | 1.1%(+4.87)#552 |
| 37. | 02467 | 5.8% | 2.4%(+3.39)#37 | 1.1%(+4.67)#581 |
| 38. | 01929 | 5.5% | 2.4%(+3.18)#38 | 1.1%(+4.45)#619 |
| 39. | 01460 | 5.5% | 2.4%(+3.12)#39 | 1.1%(+4.39)#631 |
| 40. | 01609 | 5.4% | 2.4%(+3.06)#40 | 1.1%(+4.34)#647 |
| 41. | 01450 | 5.4% | 2.4%(+3.00)#41 | 1.1%(+4.27)#659 |
| 42. | 01026 | 5.3% | 2.4%(+2.97)#42 | 1.1%(+4.24)#673 |
| 43. | 02657 | 5.3% | 2.4%(+2.96)#43 | 1.1%(+4.24)#677 |
| 44. | 02559 | 5.3% | 2.4%(+2.96)#44 | 1.1%(+4.23)#679 |
| 45. | 01776 | 5.2% | 2.4%(+2.86)#45 | 1.1%(+4.13)#705 |
| 46. | 01730 | 5.2% | 2.4%(+2.84)#46 | 1.1%(+4.11)#711 |
| 47. | 02145 | 5.1% | 2.4%(+2.77)#47 | 1.1%(+4.04)#724 |
| 48. | 01740 | 5.1% | 2.4%(+2.72)#48 | 1.1%(+3.99)#742 |
| 49. | 01741 | 5.0% | 2.4%(+2.63)#49 | 1.1%(+3.90)#763 |
| 50. | 02115 | 4.9% | 2.4%(+2.57)#50 | 1.1%(+3.85)#778 |
| 51. | 02537 | 4.8% | 2.4%(+2.47)#51 | 1.1%(+3.74)#813 |
| 52. | 01053 | 4.8% | 2.4%(+2.43)#52 | 1.1%(+3.70)#821 |
| 53. | 01890 | 4.8% | 2.4%(+2.40)#53 | 1.1%(+3.67)#828 |
| 54. | 01720 | 4.7% | 2.4%(+2.36)#54 | 1.1%(+3.63)#844 |
| 55. | 01745 | 4.7% | 2.4%(+2.30)#55 | 1.1%(+3.57)#860 |
| 56. | 02113 | 4.6% | 2.4%(+2.25)#56 | 1.1%(+3.52)#878 |
| 57. | 02667 | 4.6% | 2.4%(+2.24)#57 | 1.1%(+3.52)#881 |
| 58. | 02715 | 4.6% | 2.4%(+2.19)#58 | 1.1%(+3.47)#901 |
| 59. | 01581 | 4.5% | 2.4%(+2.18)#59 | 1.1%(+3.45)#915 |
| 60. | 02492 | 4.5% | 2.4%(+2.16)#60 | 1.1%(+3.44)#919 |
| 61. | 02163 | 4.5% | 2.4%(+2.16)#61 | 1.1%(+3.43)#920 |
| 62. | 01862 | 4.4% | 2.4%(+2.04)#62 | 1.1%(+3.32)#961 |
| 63. | 02458 | 4.3% | 2.4%(+1.97)#63 | 1.1%(+3.25)#986 |
| 64. | 02021 | 4.3% | 2.4%(+1.92)#64 | 1.1%(+3.20)#1,012 |
| 65. | 02460 | 4.3% | 2.4%(+1.91)#65 | 1.1%(+3.19)#1,016 |
| 66. | 02109 | 4.2% | 2.4%(+1.86)#66 | 1.1%(+3.13)#1,039 |
| 67. | 01778 | 4.2% | 2.4%(+1.83)#67 | 1.1%(+3.10)#1,050 |
| 68. | 02556 | 4.2% | 2.4%(+1.82)#68 | 1.1%(+3.09)#1,058 |
| 69. | 01908 | 4.1% | 2.4%(+1.77)#69 | 1.1%(+3.04)#1,083 |
| 70. | 02199 | 4.1% | 2.4%(+1.74)#70 | 1.1%(+3.02)#1,096 |
| 71. | 01742 | 4.0% | 2.4%(+1.68)#71 | 1.1%(+2.95)#1,131 |
| 72. | 02453 | 4.0% | 2.4%(+1.67)#72 | 1.1%(+2.94)#1,132 |
| 73. | 01054 | 4.0% | 2.4%(+1.67)#73 | 1.1%(+2.94)#1,133 |
| 74. | 02481 | 4.0% | 2.4%(+1.67)#74 | 1.1%(+2.94)#1,135 |
| 75. | 02120 | 4.0% | 2.4%(+1.62)#75 | 1.1%(+2.89)#1,162 |
| 76. | 02451 | 4.0% | 2.4%(+1.60)#76 | 1.1%(+2.87)#1,175 |
| 77. | 01545 | 4.0% | 2.4%(+1.59)#77 | 1.1%(+2.86)#1,181 |
| 78. | 01434 | 3.9% | 2.4%(+1.56)#78 | 1.1%(+2.83)#1,200 |
| 79. | 01096 | 3.9% | 2.4%(+1.52)#79 | 1.1%(+2.80)#1,225 |
| 80. | 01760 | 3.9% | 2.4%(+1.50)#80 | 1.1%(+2.77)#1,229 |
| 81. | 01969 | 3.8% | 2.4%(+1.46)#81 | 1.1%(+2.73)#1,253 |
| 82. | 02176 | 3.8% | 2.4%(+1.45)#82 | 1.1%(+2.72)#1,259 |
| 83. | 01330 | 3.8% | 2.4%(+1.42)#83 | 1.1%(+2.70)#1,271 |
| 84. | 01772 | 3.7% | 2.4%(+1.35)#84 | 1.1%(+2.62)#1,306 |
| 85. | 01262 | 3.6% | 2.4%(+1.28)#85 | 1.1%(+2.55)#1,348 |
| 86. | 02116 | 3.6% | 2.4%(+1.27)#86 | 1.1%(+2.54)#1,354 |
| 87. | 02482 | 3.6% | 2.4%(+1.25)#87 | 1.1%(+2.52)#1,363 |
| 88. | 02652 | 3.6% | 2.4%(+1.24)#88 | 1.1%(+2.52)#1,365 |
| 89. | 02111 | 3.6% | 2.4%(+1.19)#89 | 1.1%(+2.46)#1,389 |
| 90. | 01029 | 3.5% | 2.4%(+1.18)#90 | 1.1%(+2.46)#1,392 |
| 91. | 01886 | 3.5% | 2.4%(+1.14)#91 | 1.1%(+2.41)#1,425 |
| 92. | 01378 | 3.5% | 2.4%(+1.09)#92 | 1.1%(+2.37)#1,454 |
| 93. | 01503 | 3.4% | 2.4%(+0.996)#93 | 1.1%(+2.27)#1,529 |
| 94. | 02030 | 3.3% | 2.4%(+0.976)#94 | 1.1%(+2.25)#1,540 |
| 95. | 02462 | 3.3% | 2.4%(+0.975)#95 | 1.1%(+2.25)#1,542 |
| 96. | 02067 | 3.3% | 2.4%(+0.960)#96 | 1.1%(+2.23)#1,555 |
| 97. | 02125 | 3.2% | 2.4%(+0.873)#97 | 1.1%(+2.15)#1,636 |
| 98. | 01748 | 3.2% | 2.4%(+0.870)#98 | 1.1%(+2.14)#1,640 |
| 99. | 02155 | 3.2% | 2.4%(+0.864)#99 | 1.1%(+2.14)#1,645 |
| 100. | 01701 | 3.2% | 2.4%(+0.860)#100 | 1.1%(+2.13)#1,652 |
Common Questions
What are the Top 10 Zip Codes with the Highest Percentage of Population Employed in Life, Physical & Social Science in Massachusetts?
Top 10 Zip Codes with the Highest Percentage of Population Employed in Life, Physical & Social Science in Massachusetts are:
What zip code has the Highest Percentage of Population Employed in Life, Physical & Social Science in Massachusetts?
02543 has the Highest Percentage of Population Employed in Life, Physical & Social Science in Massachusetts with 22.3%.
What is the Percentage of Population Employed in Life, Physical & Social Science in the State of Massachusetts?
Percentage of Population Employed in Life, Physical & Social Science in Massachusetts is 2.4%.
What is the Percentage of Population Employed in Life, Physical & Social Science in the United States?
Percentage of Population Employed in Life, Physical & Social Science in the United States is 1.1%.