Foxborough, MA Map & Demographics
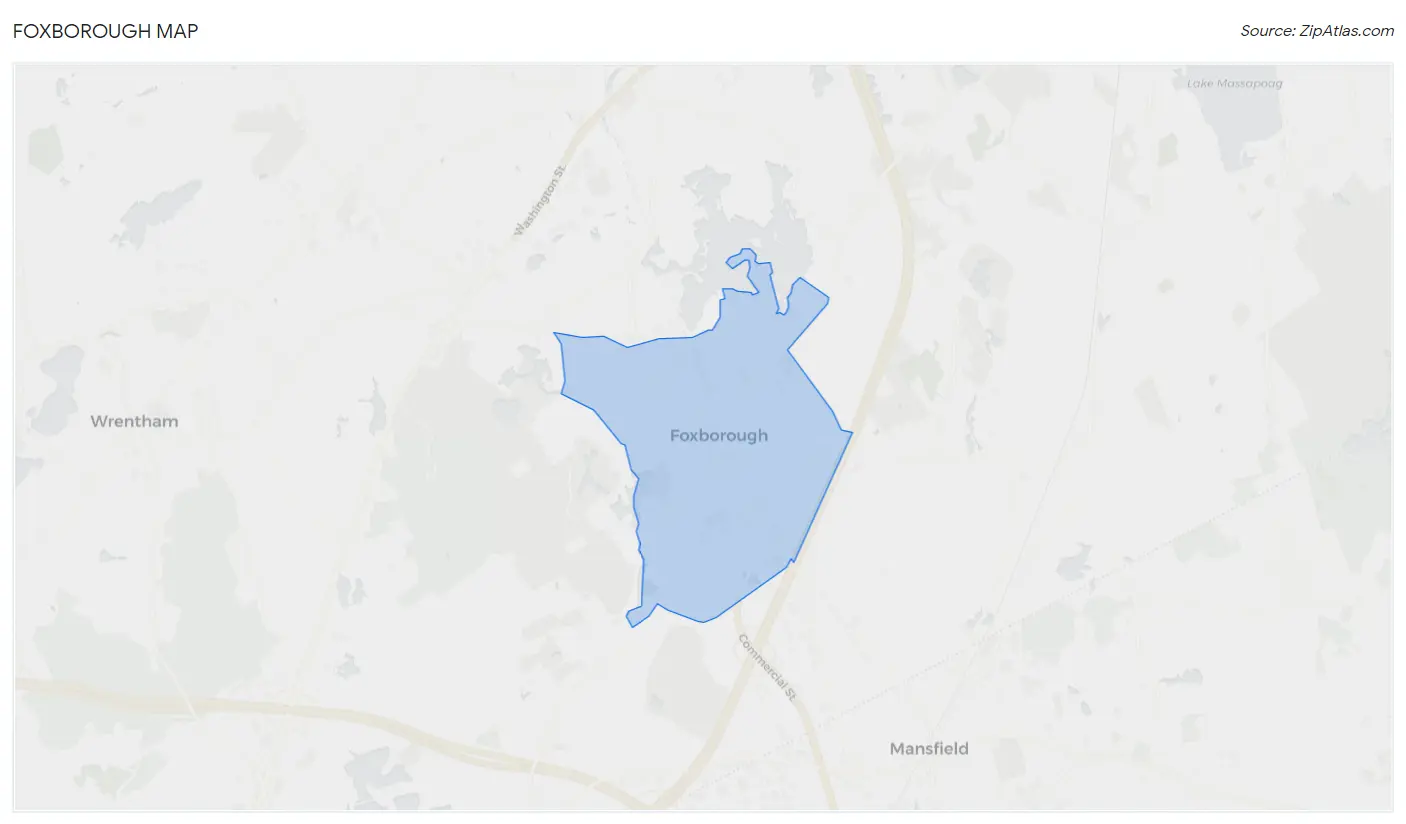
Foxborough Map
Foxborough Overview
$56,635
PER CAPITA INCOME
$100,089
AVG FAMILY INCOME
$71,340
AVG HOUSEHOLD INCOME
47.0%
WAGE / INCOME GAP [ % ]
53.0¢/ $1
WAGE / INCOME GAP [ $ ]
0.60
INEQUALITY / GINI INDEX
6,312
TOTAL POPULATION
2,847
MALE POPULATION
3,465
FEMALE POPULATION
82.16
MALES / 100 FEMALES
121.71
FEMALES / 100 MALES
42.7
MEDIAN AGE
3.2
AVG FAMILY SIZE
2.2
AVG HOUSEHOLD SIZE
3,326
LABOR FORCE [ PEOPLE ]
65.7%
PERCENT IN LABOR FORCE
3.4%
UNEMPLOYMENT RATE
Income in Foxborough
Income Overview in Foxborough
Per Capita Income in Foxborough is $56,635, while median incomes of families and households are $100,089 and $71,340 respectively.
| Characteristic | Number | Measure |
| Per Capita Income | 6,312 | $56,635 |
| Median Family Income | 1,377 | $100,089 |
| Mean Family Income | 1,377 | $193,960 |
| Median Household Income | 2,883 | $71,340 |
| Mean Household Income | 2,883 | $122,429 |
| Income Deficit | 1,377 | $0 |
| Wage / Income Gap (%) | 6,312 | 47.02% |
| Wage / Income Gap ($) | 6,312 | 52.98¢ per $1 |
| Gini / Inequality Index | 6,312 | 0.60 |
Earnings by Sex in Foxborough
Average Earnings in Foxborough are $46,194, $59,448 for men and $31,498 for women, a difference of 47.0%.
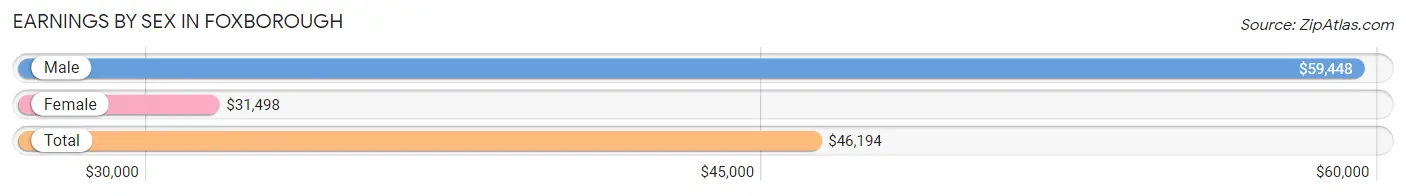
| Sex | Number | Average Earnings |
| Male | 1,629 (45.9%) | $59,448 |
| Female | 1,919 (54.1%) | $31,498 |
| Total | 3,548 (100.0%) | $46,194 |
Earnings by Sex by Income Bracket in Foxborough
The most common earnings brackets in Foxborough are $100,000+ for men (437 | 26.8%) and $100,000+ for women (308 | 16.1%).
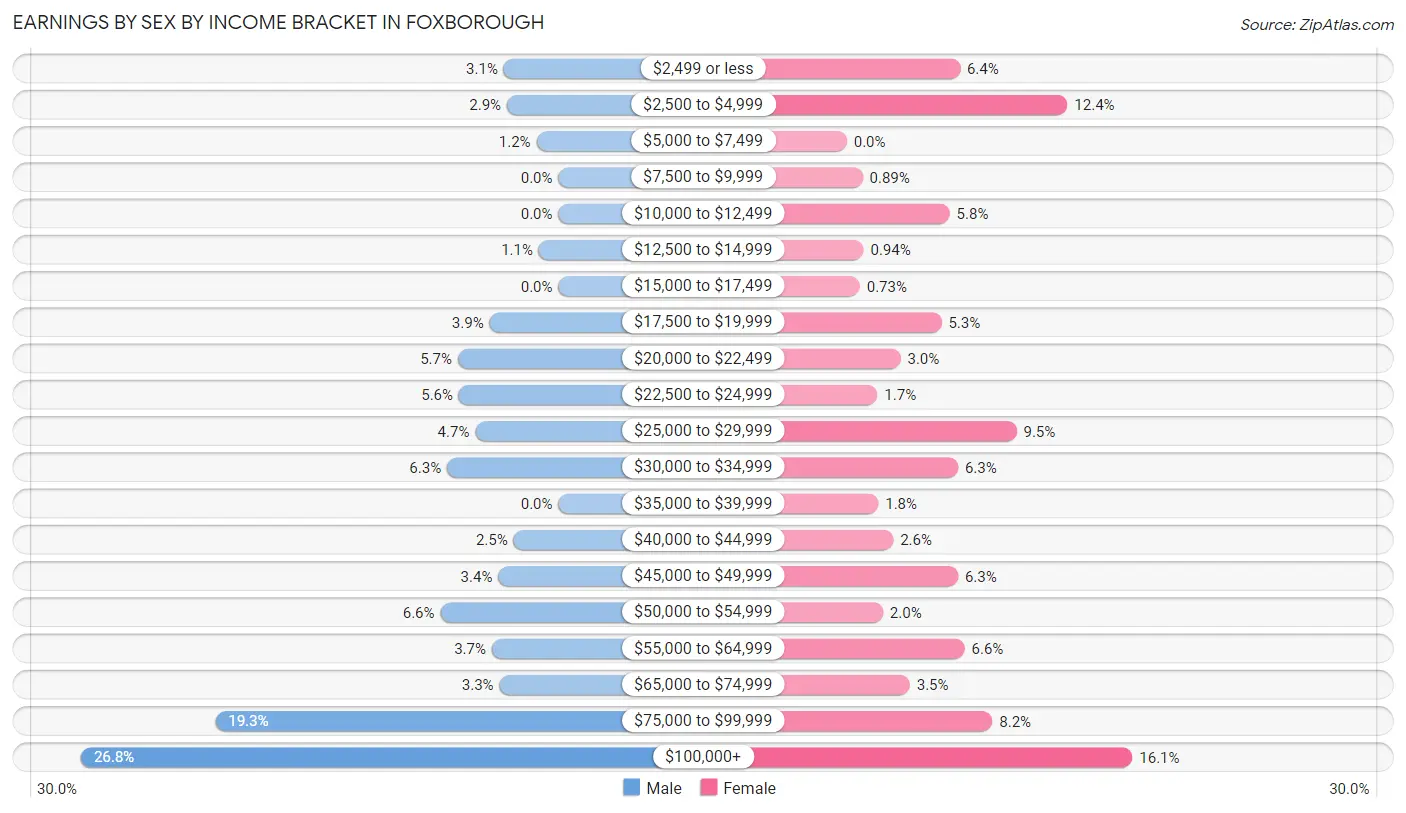
| Income | Male | Female |
| $2,499 or less | 50 (3.1%) | 122 (6.4%) |
| $2,500 to $4,999 | 47 (2.9%) | 238 (12.4%) |
| $5,000 to $7,499 | 20 (1.2%) | 0 (0.0%) |
| $7,500 to $9,999 | 0 (0.0%) | 17 (0.9%) |
| $10,000 to $12,499 | 0 (0.0%) | 111 (5.8%) |
| $12,500 to $14,999 | 18 (1.1%) | 18 (0.9%) |
| $15,000 to $17,499 | 0 (0.0%) | 14 (0.7%) |
| $17,500 to $19,999 | 63 (3.9%) | 102 (5.3%) |
| $20,000 to $22,499 | 92 (5.7%) | 58 (3.0%) |
| $22,500 to $24,999 | 91 (5.6%) | 33 (1.7%) |
| $25,000 to $29,999 | 76 (4.7%) | 183 (9.5%) |
| $30,000 to $34,999 | 102 (6.3%) | 120 (6.2%) |
| $35,000 to $39,999 | 0 (0.0%) | 34 (1.8%) |
| $40,000 to $44,999 | 41 (2.5%) | 50 (2.6%) |
| $45,000 to $49,999 | 55 (3.4%) | 120 (6.2%) |
| $50,000 to $54,999 | 108 (6.6%) | 39 (2.0%) |
| $55,000 to $64,999 | 61 (3.7%) | 127 (6.6%) |
| $65,000 to $74,999 | 54 (3.3%) | 68 (3.5%) |
| $75,000 to $99,999 | 314 (19.3%) | 157 (8.2%) |
| $100,000+ | 437 (26.8%) | 308 (16.1%) |
| Total | 1,629 (100.0%) | 1,919 (100.0%) |
Earnings by Sex by Educational Attainment in Foxborough
Average earnings in Foxborough are $66,131 for men and $41,036 for women, a difference of 38.0%. Men with an educational attainment of graduate degree enjoy the highest average annual earnings of $111,563, while those with high school diploma education earn the least with $28,015. Women with an educational attainment of college or associate's degree earn the most with the average annual earnings of $46,315, while those with bachelor's degree education have the smallest earnings of $42,361.
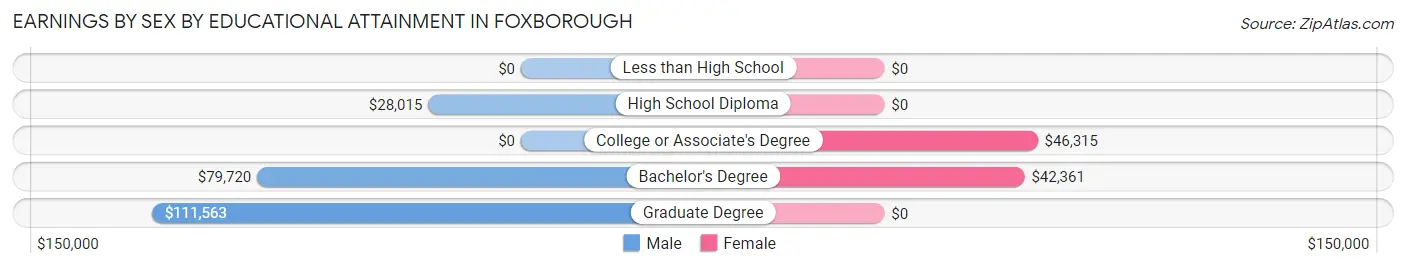
| Educational Attainment | Male Income | Female Income |
| Less than High School | - | - |
| High School Diploma | $28,015 | $0 |
| College or Associate's Degree | - | - |
| Bachelor's Degree | $79,720 | $42,361 |
| Graduate Degree | $111,563 | $0 |
| Total | $66,131 | $41,036 |
Family Income in Foxborough
Family Income Brackets in Foxborough
According to the Foxborough family income data, there are 297 families falling into the $200,000+ income range, which is the most common income bracket and makes up 21.6% of all families.
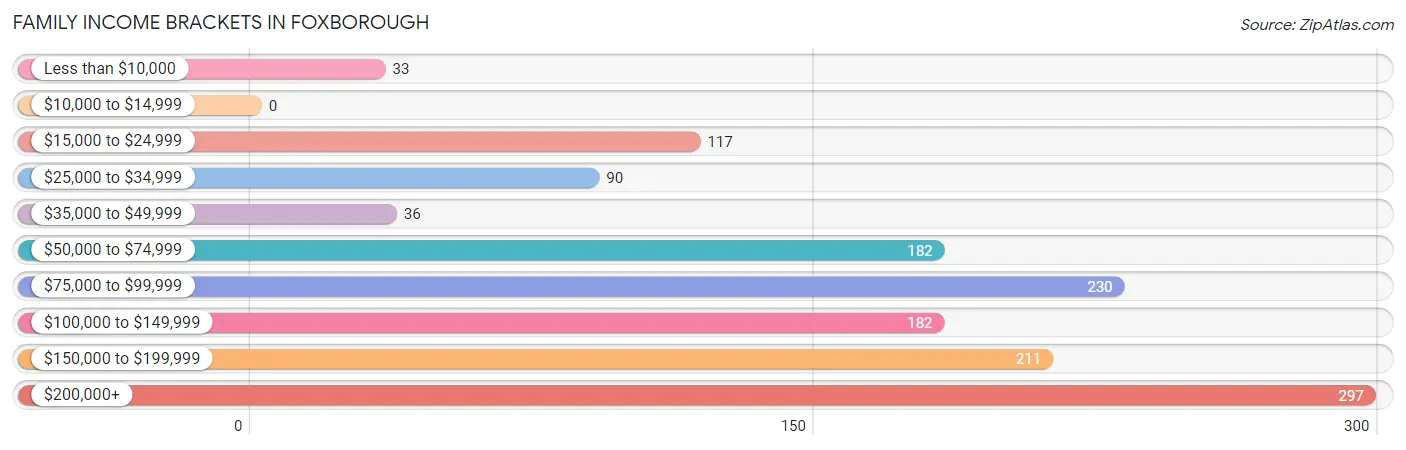
| Income Bracket | # Families | % Families |
| Less than $10,000 | 33 | 2.4% |
| $10,000 to $14,999 | 0 | 0.0% |
| $15,000 to $24,999 | 117 | 8.5% |
| $25,000 to $34,999 | 90 | 6.5% |
| $35,000 to $49,999 | 36 | 2.6% |
| $50,000 to $74,999 | 182 | 13.2% |
| $75,000 to $99,999 | 230 | 16.7% |
| $100,000 to $149,999 | 182 | 13.2% |
| $150,000 to $199,999 | 211 | 15.3% |
| $200,000+ | 297 | 21.6% |
Family Income by Famaliy Size in Foxborough
5-person families (147 | 10.7%) account for the highest median family income in Foxborough with $250,001 per family, while 5-person families (147 | 10.7%) have the highest median income of $50,000 per family member.
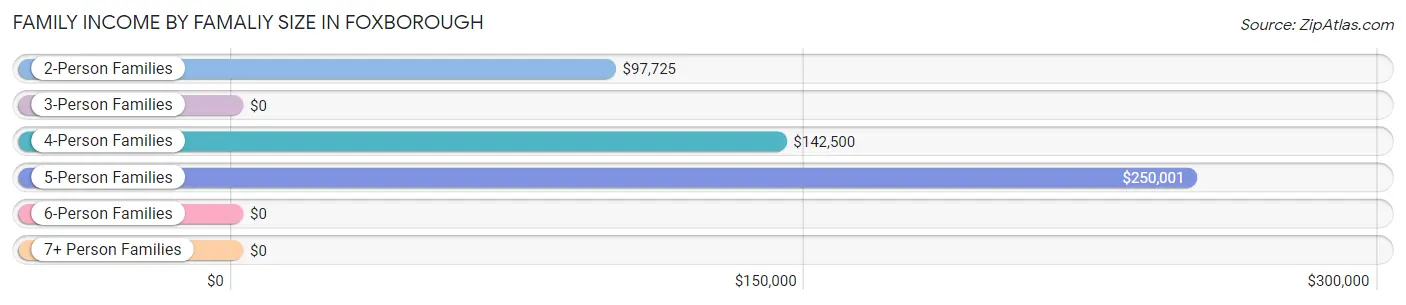
| Income Bracket | # Families | Median Income |
| 2-Person Families | 555 (40.3%) | $97,725 |
| 3-Person Families | 335 (24.3%) | $0 |
| 4-Person Families | 340 (24.7%) | $142,500 |
| 5-Person Families | 147 (10.7%) | $250,001 |
| 6-Person Families | 0 (0.0%) | $0 |
| 7+ Person Families | 0 (0.0%) | $0 |
| Total | 1,377 (100.0%) | $100,089 |
Family Income by Number of Earners in Foxborough
The median family income in Foxborough is $100,089, with families comprising 2 earners (667) having the highest median family income of $142,303, while families with no earners (136) have the lowest median family income of $65,985, accounting for 48.4% and 9.9% of families, respectively.
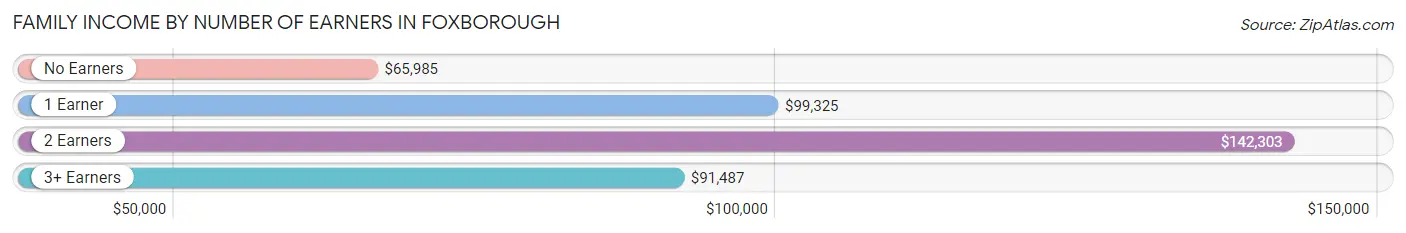
| Number of Earners | # Families | Median Income |
| No Earners | 136 (9.9%) | $65,985 |
| 1 Earner | 341 (24.8%) | $99,325 |
| 2 Earners | 667 (48.4%) | $142,303 |
| 3+ Earners | 233 (16.9%) | $91,487 |
| Total | 1,377 (100.0%) | $100,089 |
Household Income in Foxborough
Household Income Brackets in Foxborough
With 461 households falling in the category, the $75,000 to $99,999 income range is the most frequent in Foxborough, accounting for 16.0% of all households. In contrast, only 164 households (5.7%) fall into the $35,000 to $49,999 income bracket, making it the least populous group.
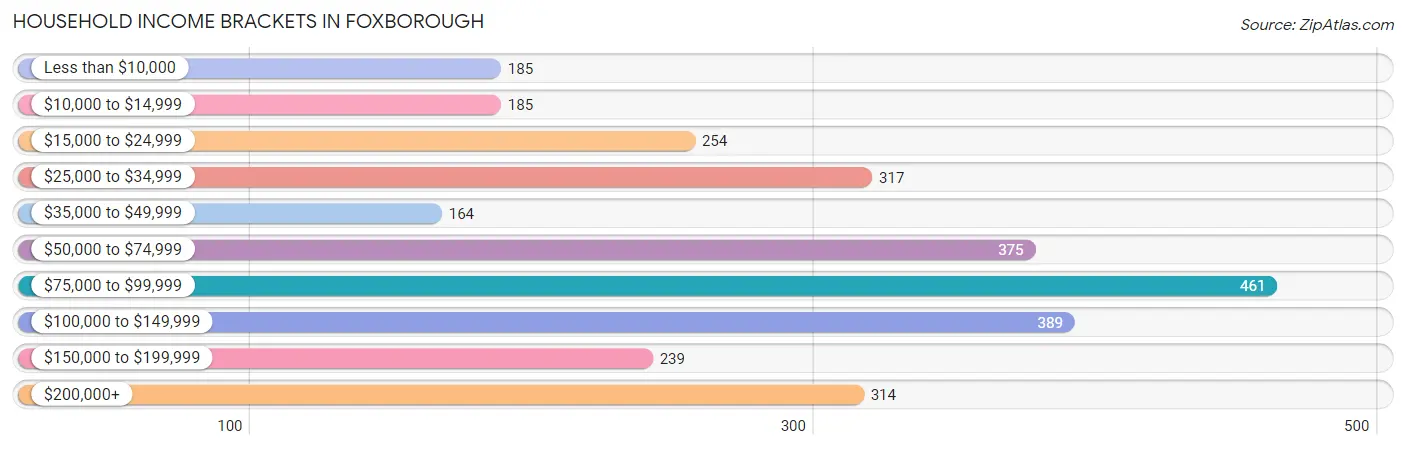
| Income Bracket | # Households | % Households |
| Less than $10,000 | 185 | 6.4% |
| $10,000 to $14,999 | 185 | 6.4% |
| $15,000 to $24,999 | 254 | 8.8% |
| $25,000 to $34,999 | 317 | 11.0% |
| $35,000 to $49,999 | 164 | 5.7% |
| $50,000 to $74,999 | 375 | 13.0% |
| $75,000 to $99,999 | 461 | 16.0% |
| $100,000 to $149,999 | 389 | 13.5% |
| $150,000 to $199,999 | 239 | 8.3% |
| $200,000+ | 314 | 10.9% |
Household Income by Householder Age in Foxborough
The median household income in Foxborough is $71,340, with the highest median household income of $117,821 found in the 25 to 44 years age bracket for the primary householder. A total of 713 households (24.7%) fall into this category. Meanwhile, the 15 to 24 years age bracket for the primary householder has the lowest median household income of $0, with 81 households (2.8%) in this group.
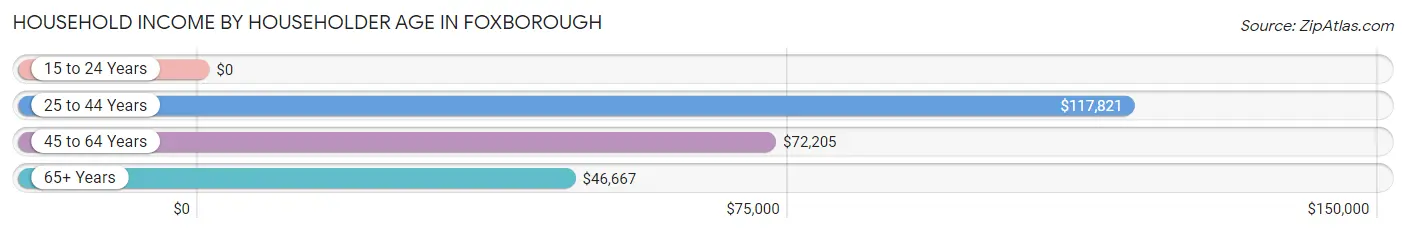
| Income Bracket | # Households | Median Income |
| 15 to 24 Years | 81 (2.8%) | $0 |
| 25 to 44 Years | 713 (24.7%) | $117,821 |
| 45 to 64 Years | 1,123 (39.0%) | $72,205 |
| 65+ Years | 966 (33.5%) | $46,667 |
| Total | 2,883 (100.0%) | $71,340 |
Poverty in Foxborough
Income Below Poverty by Sex and Age in Foxborough
With 6.8% poverty level for males and 11.6% for females among the residents of Foxborough, 75 year old and over males and 65 to 74 year old females are the most vulnerable to poverty, with 33 males (15.6%) and 107 females (26.9%) in their respective age groups living below the poverty level.
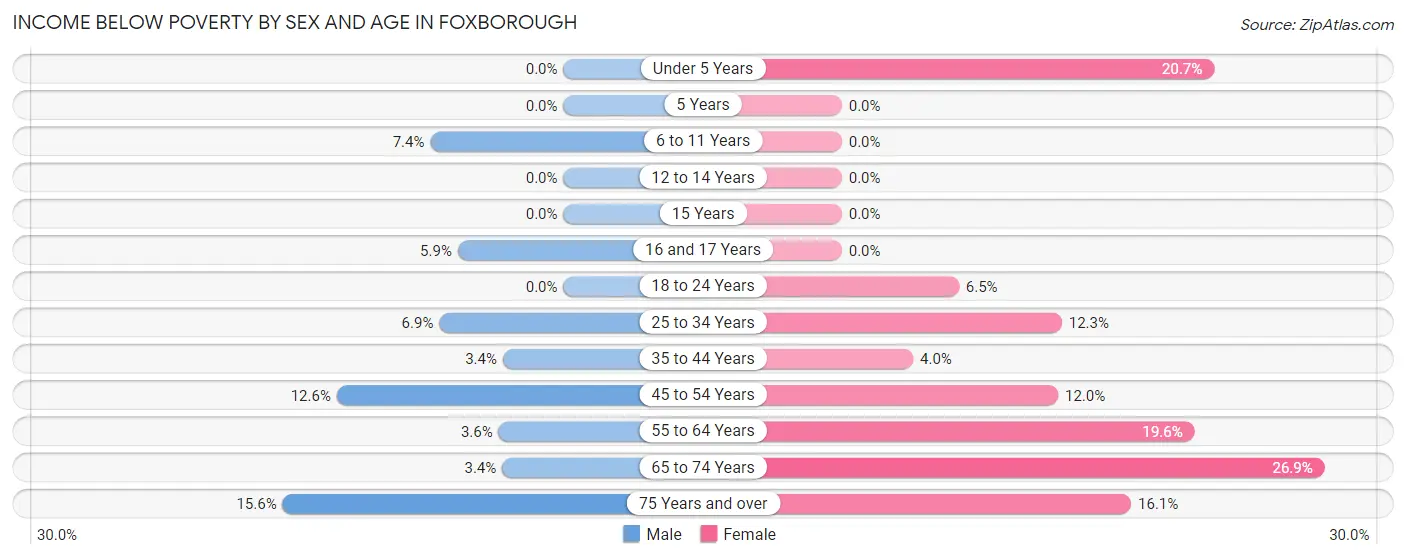
| Age Bracket | Male | Female |
| Under 5 Years | 0 (0.0%) | 40 (20.7%) |
| 5 Years | 0 (0.0%) | 0 (0.0%) |
| 6 to 11 Years | 20 (7.4%) | 0 (0.0%) |
| 12 to 14 Years | 0 (0.0%) | 0 (0.0%) |
| 15 Years | 0 (0.0%) | 0 (0.0%) |
| 16 and 17 Years | 1 (5.9%) | 0 (0.0%) |
| 18 to 24 Years | 0 (0.0%) | 24 (6.5%) |
| 25 to 34 Years | 21 (6.9%) | 55 (12.2%) |
| 35 to 44 Years | 10 (3.4%) | 16 (4.0%) |
| 45 to 54 Years | 80 (12.6%) | 43 (12.0%) |
| 55 to 64 Years | 13 (3.6%) | 87 (19.6%) |
| 65 to 74 Years | 14 (3.4%) | 107 (26.9%) |
| 75 Years and over | 33 (15.6%) | 29 (16.1%) |
| Total | 192 (6.8%) | 401 (11.6%) |
Income Above Poverty by Sex and Age in Foxborough
According to the poverty statistics in Foxborough, males aged under 5 years and females aged 5 years are the age groups that are most secure financially, with 100.0% of males and 100.0% of females in these age groups living above the poverty line.
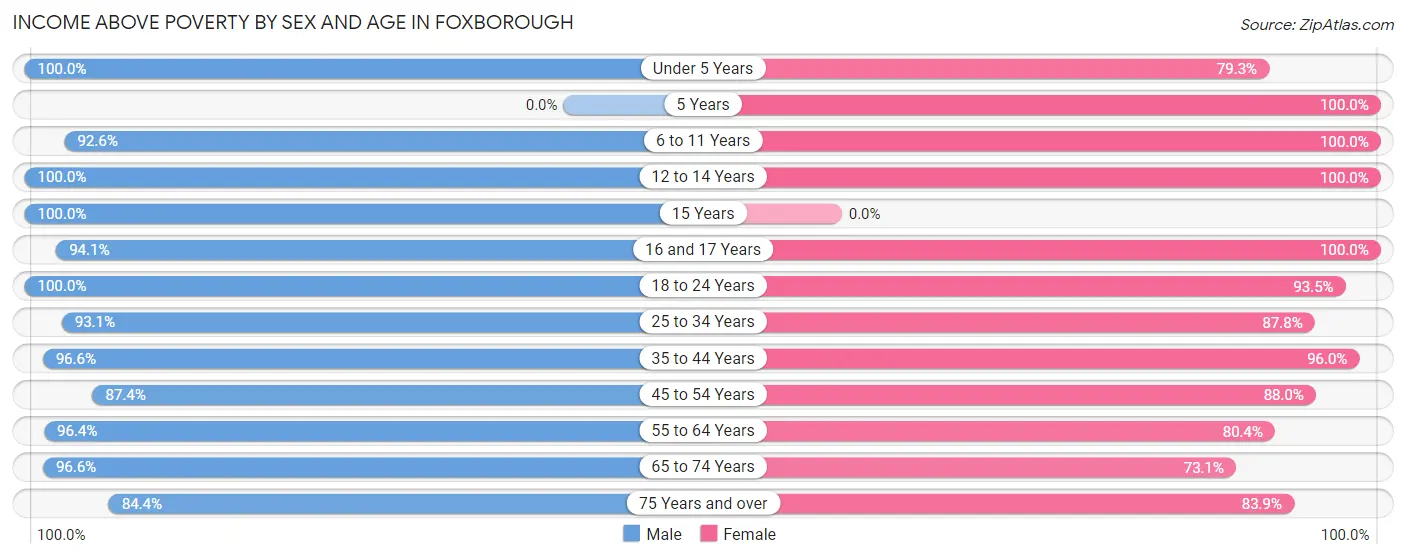
| Age Bracket | Male | Female |
| Under 5 Years | 83 (100.0%) | 153 (79.3%) |
| 5 Years | 0 (0.0%) | 124 (100.0%) |
| 6 to 11 Years | 250 (92.6%) | 321 (100.0%) |
| 12 to 14 Years | 120 (100.0%) | 108 (100.0%) |
| 15 Years | 12 (100.0%) | 0 (0.0%) |
| 16 and 17 Years | 16 (94.1%) | 108 (100.0%) |
| 18 to 24 Years | 103 (100.0%) | 344 (93.5%) |
| 25 to 34 Years | 283 (93.1%) | 394 (87.7%) |
| 35 to 44 Years | 287 (96.6%) | 387 (96.0%) |
| 45 to 54 Years | 554 (87.4%) | 314 (88.0%) |
| 55 to 64 Years | 347 (96.4%) | 356 (80.4%) |
| 65 to 74 Years | 397 (96.6%) | 291 (73.1%) |
| 75 Years and over | 178 (84.4%) | 151 (83.9%) |
| Total | 2,630 (93.2%) | 3,051 (88.4%) |
Income Below Poverty Among Married-Couple Families in Foxborough
The poverty statistics for married-couple families in Foxborough show that 1.9% or 20 of the total 1,029 families live below the poverty line. Families with 3 or 4 children have the highest poverty rate of 15.4%, comprising of 20 families. On the other hand, families with no children have the lowest poverty rate of 0.0%, which includes 0 families.
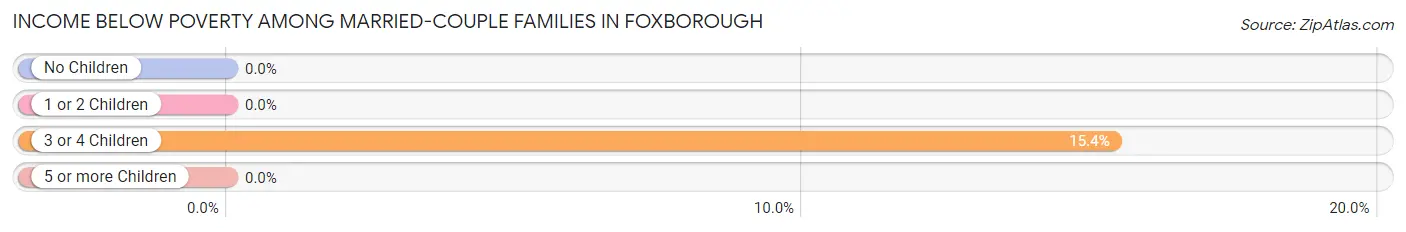
| Children | Above Poverty | Below Poverty |
| No Children | 509 (100.0%) | 0 (0.0%) |
| 1 or 2 Children | 390 (100.0%) | 0 (0.0%) |
| 3 or 4 Children | 110 (84.6%) | 20 (15.4%) |
| 5 or more Children | 0 (0.0%) | 0 (0.0%) |
| Total | 1,009 (98.1%) | 20 (1.9%) |
Income Below Poverty Among Single-Parent Households in Foxborough
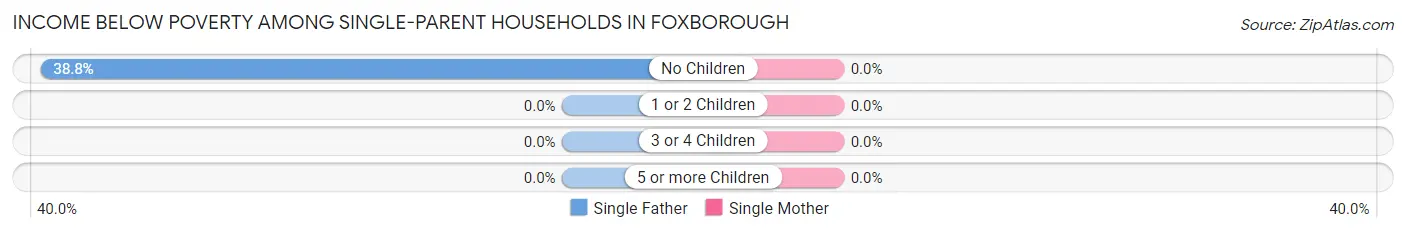
| Children | Single Father | Single Mother |
| No Children | 33 (38.8%) | 0 (0.0%) |
| 1 or 2 Children | 0 (0.0%) | 0 (0.0%) |
| 3 or 4 Children | 0 (0.0%) | 0 (0.0%) |
| 5 or more Children | 0 (0.0%) | 0 (0.0%) |
| Total | 33 (38.8%) | 0 (0.0%) |
Income Below Poverty Among Married-Couple vs Single-Parent Households in Foxborough
The poverty data for Foxborough shows that 20 of the married-couple family households (1.9%) and 33 of the single-parent households (9.5%) are living below the poverty level. Within the married-couple family households, those with 3 or 4 children have the highest poverty rate, with 20 households (15.4%) falling below the poverty line. Among the single-parent households, those with no children have the highest poverty rate, with 33 household (19.8%) living below poverty.
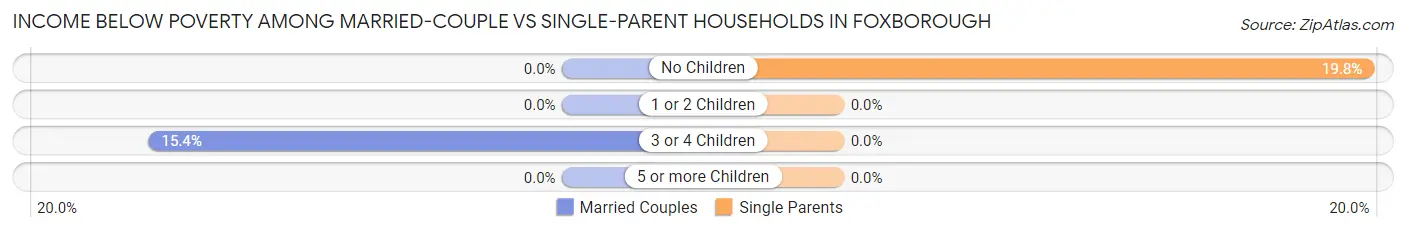
| Children | Married-Couple Families | Single-Parent Households |
| No Children | 0 (0.0%) | 33 (19.8%) |
| 1 or 2 Children | 0 (0.0%) | 0 (0.0%) |
| 3 or 4 Children | 20 (15.4%) | 0 (0.0%) |
| 5 or more Children | 0 (0.0%) | 0 (0.0%) |
| Total | 20 (1.9%) | 33 (9.5%) |
Race in Foxborough
The most populous races in Foxborough are White / Caucasian (4,432 | 70.2%), Two or more Races (660 | 10.5%), and Asian (628 | 10.0%).
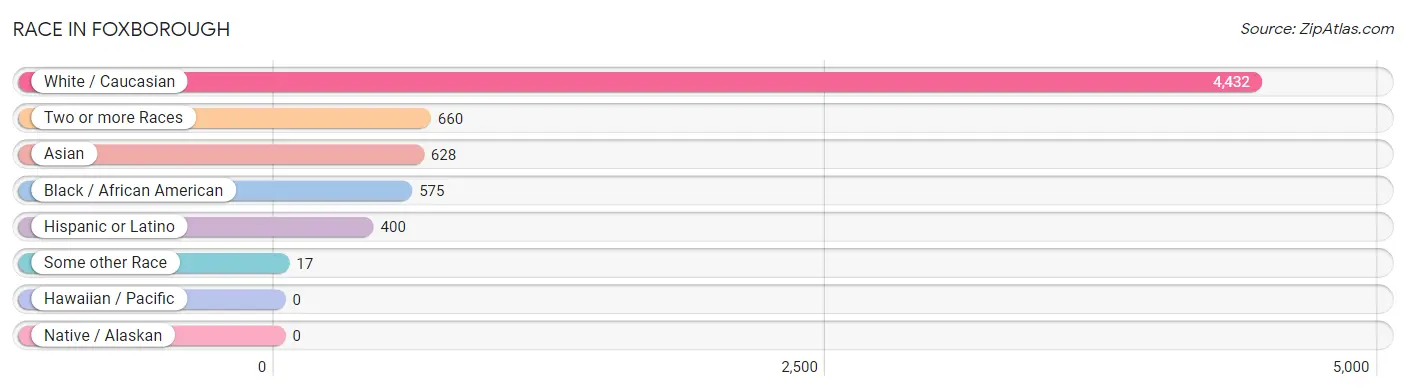
| Race | # Population | % Population |
| Asian | 628 | 10.0% |
| Black / African American | 575 | 9.1% |
| Hawaiian / Pacific | 0 | 0.0% |
| Hispanic or Latino | 400 | 6.3% |
| Native / Alaskan | 0 | 0.0% |
| White / Caucasian | 4,432 | 70.2% |
| Two or more Races | 660 | 10.5% |
| Some other Race | 17 | 0.3% |
| Total | 6,312 | 100.0% |
Ancestry in Foxborough
The most populous ancestries reported in Foxborough are Irish (1,849 | 29.3%), Italian (603 | 9.6%), Subsaharan African (494 | 7.8%), German (466 | 7.4%), and English (444 | 7.0%), together accounting for 61.1% of all Foxborough residents.
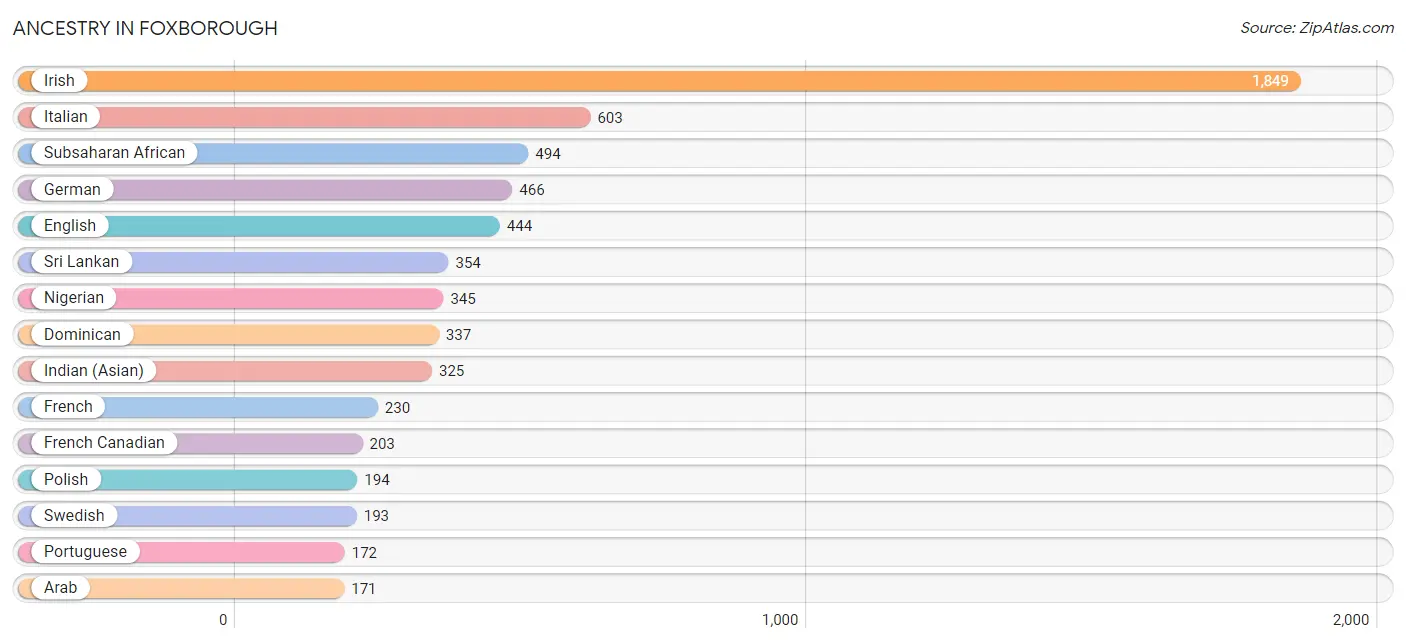
| Ancestry | # Population | % Population |
| American | 150 | 2.4% |
| Arab | 171 | 2.7% |
| Austrian | 24 | 0.4% |
| British | 6 | 0.1% |
| Canadian | 54 | 0.9% |
| Cuban | 17 | 0.3% |
| Danish | 101 | 1.6% |
| Dominican | 337 | 5.3% |
| Eastern European | 18 | 0.3% |
| Egyptian | 41 | 0.6% |
| English | 444 | 7.0% |
| French | 230 | 3.6% |
| French Canadian | 203 | 3.2% |
| German | 466 | 7.4% |
| Greek | 17 | 0.3% |
| Haitian | 99 | 1.6% |
| Hungarian | 18 | 0.3% |
| Indian (Asian) | 325 | 5.1% |
| Irish | 1,849 | 29.3% |
| Italian | 603 | 9.6% |
| Kenyan | 45 | 0.7% |
| Korean | 14 | 0.2% |
| Latvian | 16 | 0.3% |
| Lebanese | 108 | 1.7% |
| Lithuanian | 60 | 0.9% |
| Nigerian | 345 | 5.5% |
| Norwegian | 36 | 0.6% |
| Polish | 194 | 3.1% |
| Portuguese | 172 | 2.7% |
| Russian | 162 | 2.6% |
| Scandinavian | 16 | 0.3% |
| Scotch-Irish | 105 | 1.7% |
| Scottish | 72 | 1.1% |
| Slovak | 52 | 0.8% |
| Spaniard | 46 | 0.7% |
| Sri Lankan | 354 | 5.6% |
| Subsaharan African | 494 | 7.8% |
| Swedish | 193 | 3.1% |
| Syrian | 22 | 0.4% |
| Thai | 168 | 2.7% |
| Ukrainian | 21 | 0.3% |
| Welsh | 15 | 0.2% | View All 42 Rows |
Immigrants in Foxborough
The most numerous immigrant groups reported in Foxborough came from Asia (493 | 7.8%), South Eastern Asia (230 | 3.6%), Vietnam (230 | 3.6%), South Central Asia (183 | 2.9%), and India (168 | 2.7%), together accounting for 20.7% of all Foxborough residents.
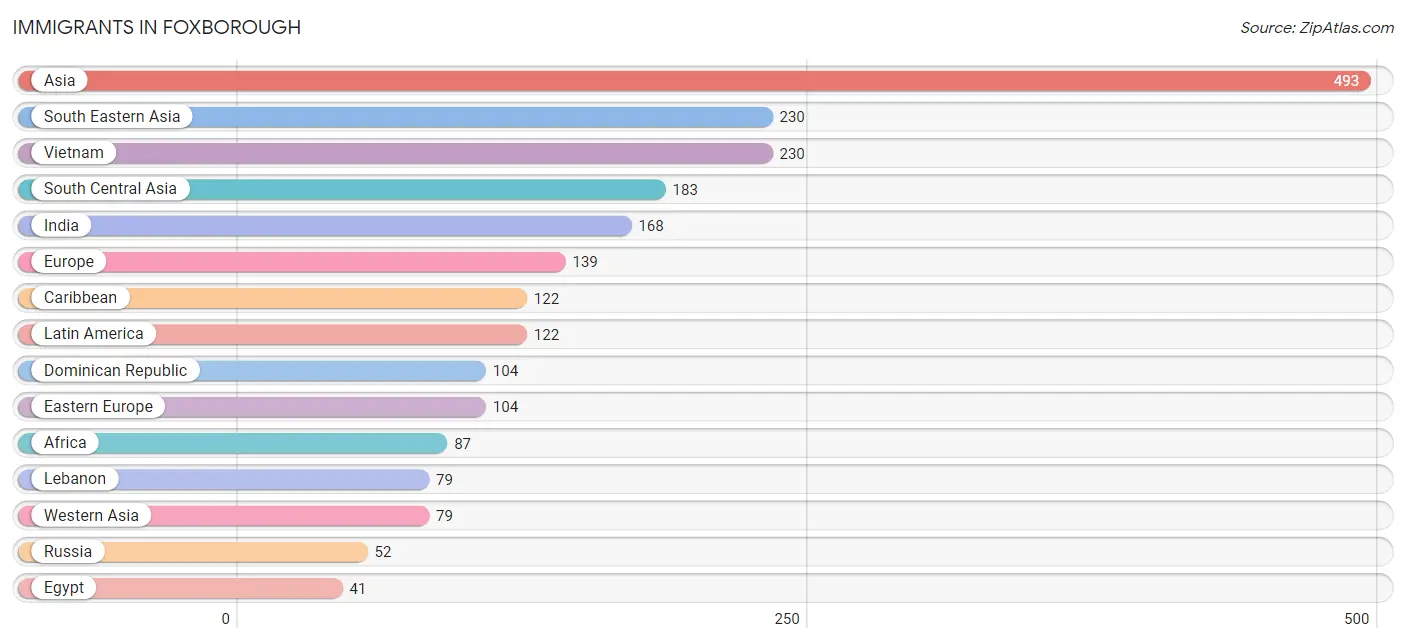
| Immigration Origin | # Population | % Population |
| Africa | 87 | 1.4% |
| Asia | 493 | 7.8% |
| Canada | 13 | 0.2% |
| Caribbean | 122 | 1.9% |
| China | 1 | 0.0% |
| Dominican Republic | 104 | 1.7% |
| Eastern Africa | 36 | 0.6% |
| Eastern Asia | 1 | 0.0% |
| Eastern Europe | 104 | 1.7% |
| Egypt | 41 | 0.6% |
| Europe | 139 | 2.2% |
| Haiti | 18 | 0.3% |
| Hungary | 18 | 0.3% |
| India | 168 | 2.7% |
| Kazakhstan | 15 | 0.2% |
| Kenya | 36 | 0.6% |
| Latin America | 122 | 1.9% |
| Lebanon | 79 | 1.3% |
| Nigeria | 10 | 0.2% |
| Northern Africa | 41 | 0.6% |
| Portugal | 35 | 0.5% |
| Russia | 52 | 0.8% |
| South Central Asia | 183 | 2.9% |
| South Eastern Asia | 230 | 3.6% |
| Southern Europe | 35 | 0.5% |
| Ukraine | 34 | 0.5% |
| Vietnam | 230 | 3.6% |
| Western Africa | 10 | 0.2% |
| Western Asia | 79 | 1.3% | View All 29 Rows |
Sex and Age in Foxborough
Sex and Age in Foxborough
The most populous age groups in Foxborough are 45 to 49 Years (373 | 13.1%) for men and 30 to 34 Years (356 | 10.3%) for women.
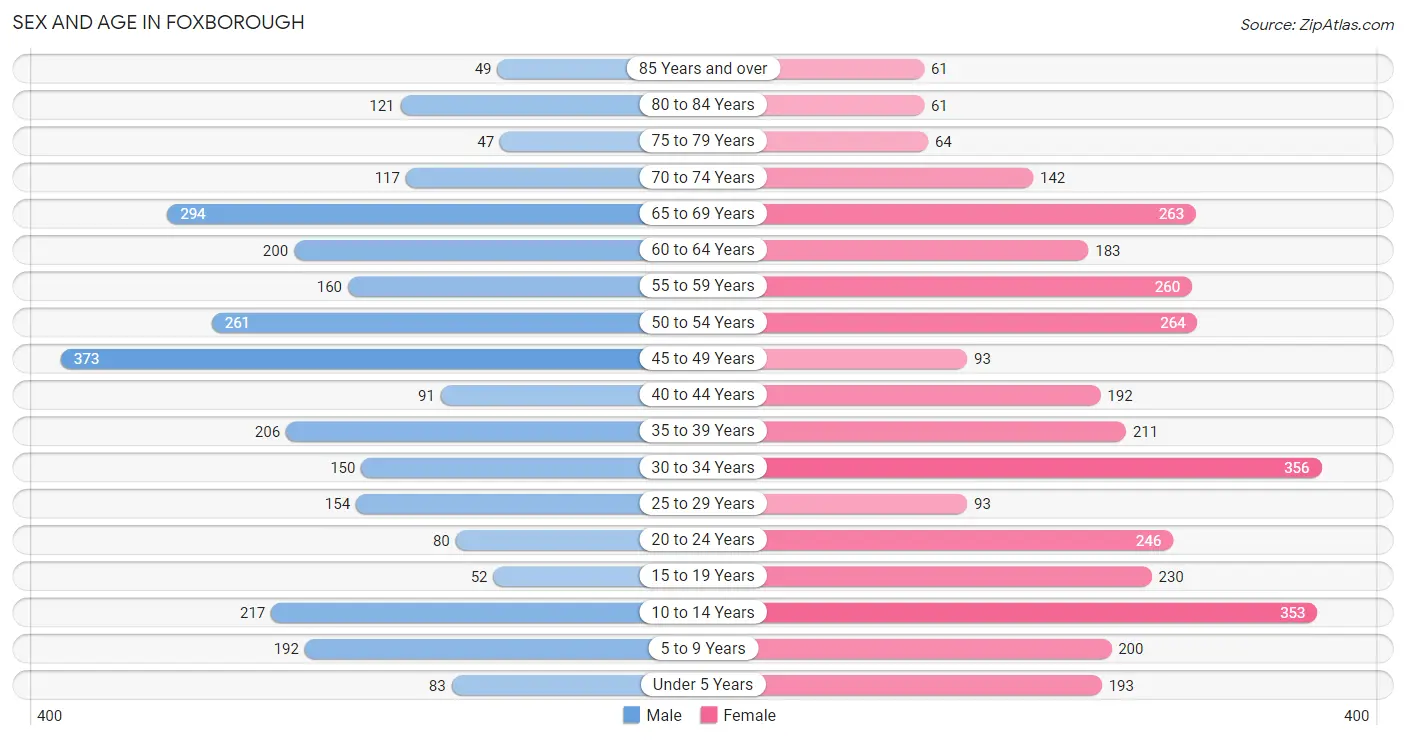
| Age Bracket | Male | Female |
| Under 5 Years | 83 (2.9%) | 193 (5.6%) |
| 5 to 9 Years | 192 (6.7%) | 200 (5.8%) |
| 10 to 14 Years | 217 (7.6%) | 353 (10.2%) |
| 15 to 19 Years | 52 (1.8%) | 230 (6.6%) |
| 20 to 24 Years | 80 (2.8%) | 246 (7.1%) |
| 25 to 29 Years | 154 (5.4%) | 93 (2.7%) |
| 30 to 34 Years | 150 (5.3%) | 356 (10.3%) |
| 35 to 39 Years | 206 (7.2%) | 211 (6.1%) |
| 40 to 44 Years | 91 (3.2%) | 192 (5.5%) |
| 45 to 49 Years | 373 (13.1%) | 93 (2.7%) |
| 50 to 54 Years | 261 (9.2%) | 264 (7.6%) |
| 55 to 59 Years | 160 (5.6%) | 260 (7.5%) |
| 60 to 64 Years | 200 (7.0%) | 183 (5.3%) |
| 65 to 69 Years | 294 (10.3%) | 263 (7.6%) |
| 70 to 74 Years | 117 (4.1%) | 142 (4.1%) |
| 75 to 79 Years | 47 (1.7%) | 64 (1.8%) |
| 80 to 84 Years | 121 (4.3%) | 61 (1.8%) |
| 85 Years and over | 49 (1.7%) | 61 (1.8%) |
| Total | 2,847 (100.0%) | 3,465 (100.0%) |
Families and Households in Foxborough
Median Family Size in Foxborough
The median family size in Foxborough is 3.25 persons per family, with single female/mother families (263 | 19.1%) accounting for the largest median family size of 3.49 persons per family. On the other hand, single male/father families (85 | 6.2%) represent the smallest median family size with 1.87 persons per family.
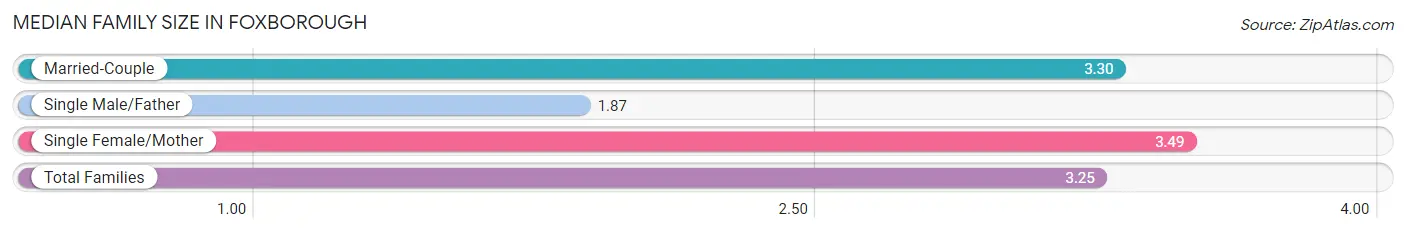
| Family Type | # Families | Family Size |
| Married-Couple | 1,029 (74.7%) | 3.30 |
| Single Male/Father | 85 (6.2%) | 1.87 |
| Single Female/Mother | 263 (19.1%) | 3.49 |
| Total Families | 1,377 (100.0%) | 3.25 |
Median Household Size in Foxborough
The median household size in Foxborough is 2.18 persons per household, with single female/mother households (263 | 9.1%) accounting for the largest median household size of 3.77 persons per household. non-family households (1,506 | 52.2%) represent the smallest median household size with 1.11 persons per household.
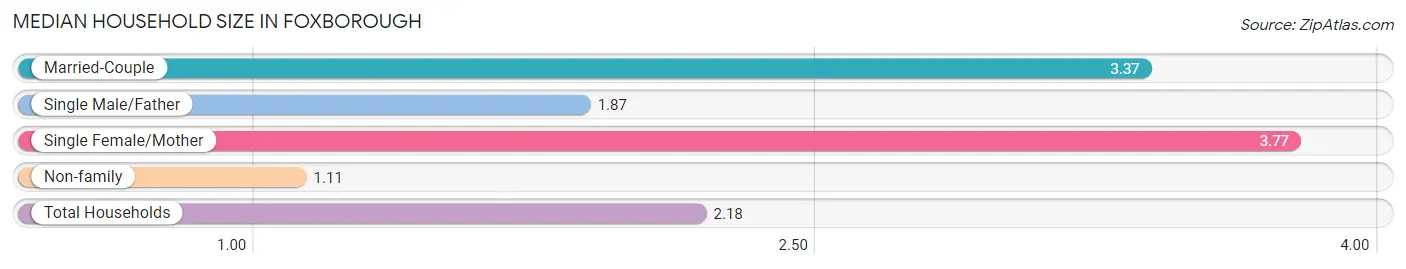
| Household Type | # Households | Household Size |
| Married-Couple | 1,029 (35.7%) | 3.37 |
| Single Male/Father | 85 (2.9%) | 1.87 |
| Single Female/Mother | 263 (9.1%) | 3.77 |
| Non-family | 1,506 (52.2%) | 1.11 |
| Total Households | 2,883 (100.0%) | 2.18 |
Household Size by Marriage Status in Foxborough
Out of a total of 2,883 households in Foxborough, 1,377 (47.8%) are family households, while 1,506 (52.2%) are nonfamily households. The most numerous type of family households are 2-person households, comprising 522, and the most common type of nonfamily households are 1-person households, comprising 1,342.
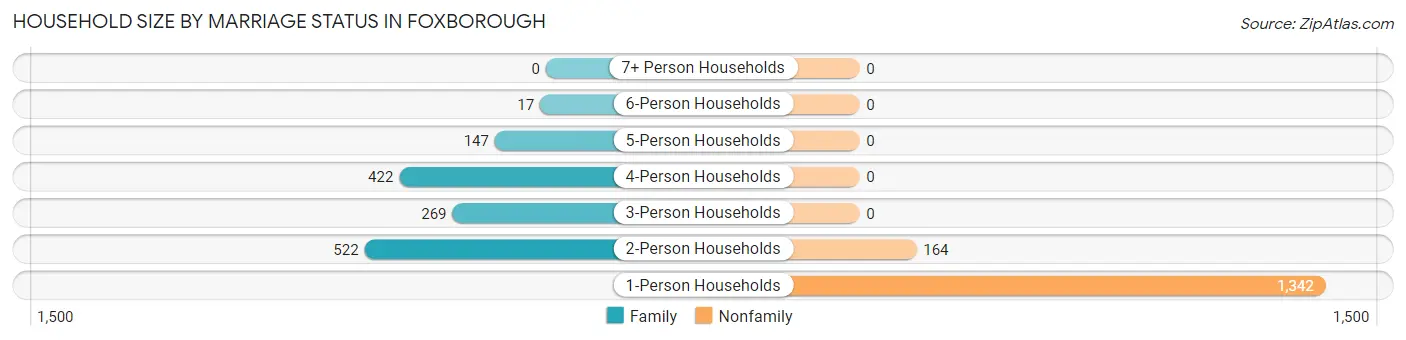
| Household Size | Family Households | Nonfamily Households |
| 1-Person Households | - | 1,342 (46.6%) |
| 2-Person Households | 522 (18.1%) | 164 (5.7%) |
| 3-Person Households | 269 (9.3%) | 0 (0.0%) |
| 4-Person Households | 422 (14.6%) | 0 (0.0%) |
| 5-Person Households | 147 (5.1%) | 0 (0.0%) |
| 6-Person Households | 17 (0.6%) | 0 (0.0%) |
| 7+ Person Households | 0 (0.0%) | 0 (0.0%) |
| Total | 1,377 (47.8%) | 1,506 (52.2%) |
Female Fertility in Foxborough
Fertility by Age in Foxborough
Average fertility rate in Foxborough is 50.0 births per 1,000 women. Women in the age bracket of 20 to 34 years have the highest fertility rate with 82.0 births per 1,000 women. Women in the age bracket of 20 to 34 years acount for 79.2% of all women with births.
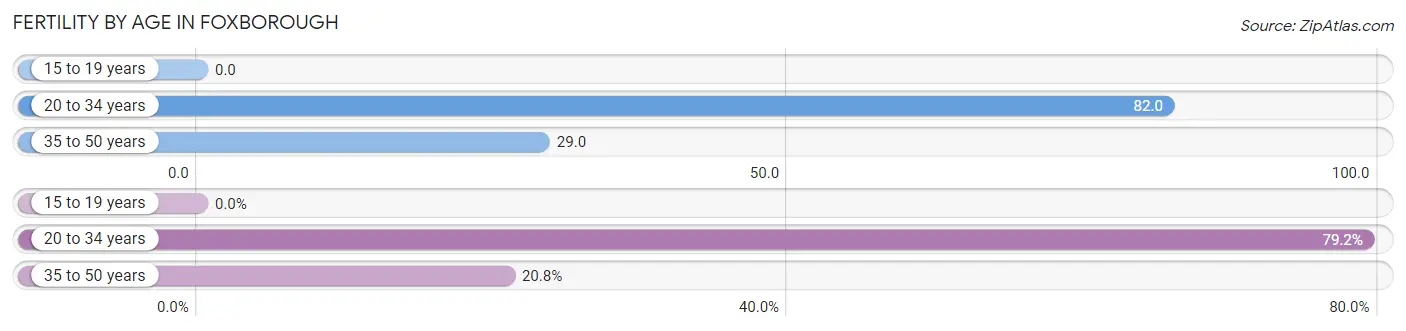
| Age Bracket | Women with Births | Births / 1,000 Women |
| 15 to 19 years | 0 (0.0%) | 0.0 |
| 20 to 34 years | 57 (79.2%) | 82.0 |
| 35 to 50 years | 15 (20.8%) | 29.0 |
| Total | 72 (100.0%) | 50.0 |
Fertility by Age by Marriage Status in Foxborough
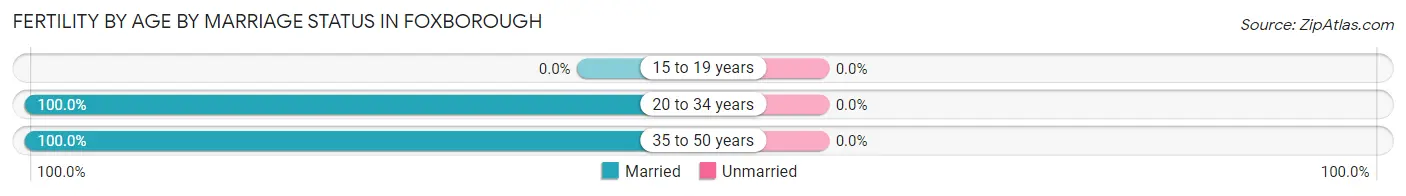
| Age Bracket | Married | Unmarried |
| 15 to 19 years | 0 (0.0%) | 0 (0.0%) |
| 20 to 34 years | 57 (100.0%) | 0 (0.0%) |
| 35 to 50 years | 15 (100.0%) | 0 (0.0%) |
| Total | 72 (100.0%) | 0 (0.0%) |
Fertility by Education in Foxborough
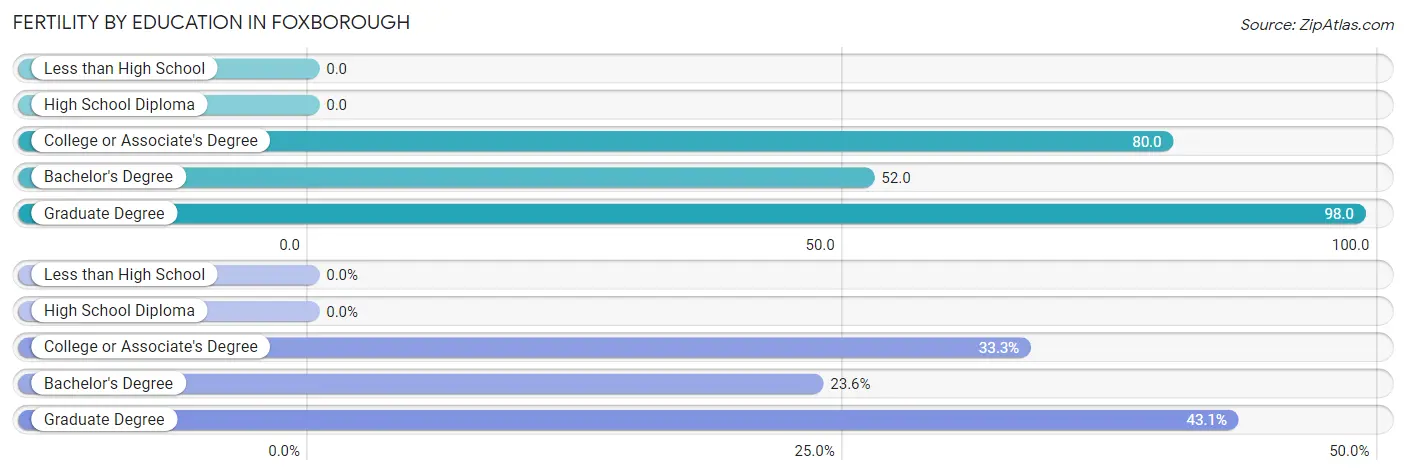
| Educational Attainment | Women with Births | Births / 1,000 Women |
| Less than High School | 0 (0.0%) | 0.0 |
| High School Diploma | 0 (0.0%) | 0.0 |
| College or Associate's Degree | 24 (33.3%) | 80.0 |
| Bachelor's Degree | 17 (23.6%) | 52.0 |
| Graduate Degree | 31 (43.1%) | 98.0 |
| Total | 72 (100.0%) | 50.0 |
Fertility by Education by Marriage Status in Foxborough
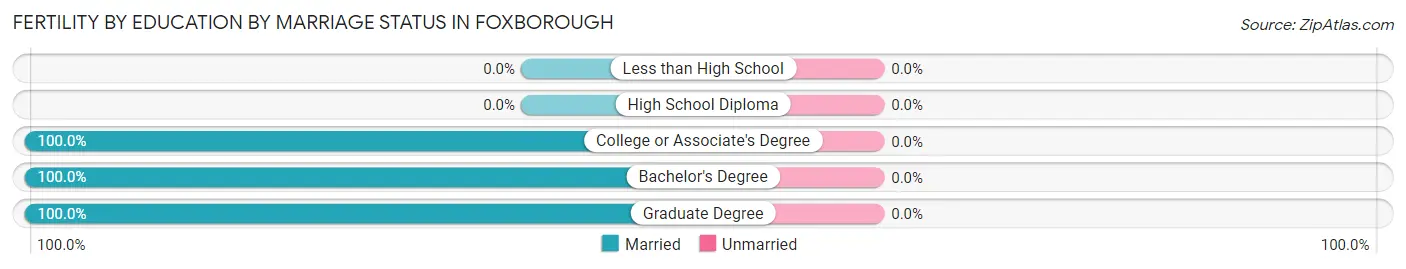
| Educational Attainment | Married | Unmarried |
| Less than High School | 0 (0.0%) | 0 (0.0%) |
| High School Diploma | 0 (0.0%) | 0 (0.0%) |
| College or Associate's Degree | 24 (100.0%) | 0 (0.0%) |
| Bachelor's Degree | 17 (100.0%) | 0 (0.0%) |
| Graduate Degree | 31 (100.0%) | 0 (0.0%) |
| Total | 72 (100.0%) | 0 (0.0%) |
Employment Characteristics in Foxborough
Employment by Class of Employer in Foxborough
Among the 2,942 employed individuals in Foxborough, private company employees (1,811 | 61.6%), not-for-profit organizations (520 | 17.7%), and local government employees (192 | 6.5%) make up the most common classes of employment.
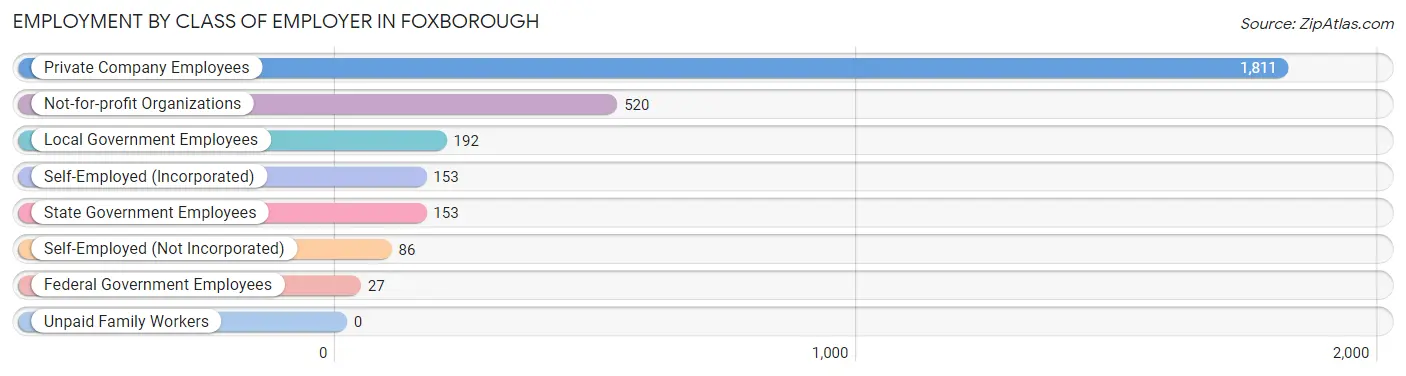
| Employer Class | # Employees | % Employees |
| Private Company Employees | 1,811 | 61.6% |
| Self-Employed (Incorporated) | 153 | 5.2% |
| Self-Employed (Not Incorporated) | 86 | 2.9% |
| Not-for-profit Organizations | 520 | 17.7% |
| Local Government Employees | 192 | 6.5% |
| State Government Employees | 153 | 5.2% |
| Federal Government Employees | 27 | 0.9% |
| Unpaid Family Workers | 0 | 0.0% |
| Total | 2,942 | 100.0% |
Employment Status by Age in Foxborough
According to the labor force statistics for Foxborough, out of the total population over 16 years of age (5,062), 65.7% or 3,326 individuals are in the labor force, with 3.4% or 113 of them unemployed. The age group with the highest labor force participation rate is 35 to 44 years, with 95.0% or 665 individuals in the labor force. Within the labor force, the 20 to 24 years age range has the highest percentage of unemployed individuals, with 11.0% or 28 of them being unemployed.
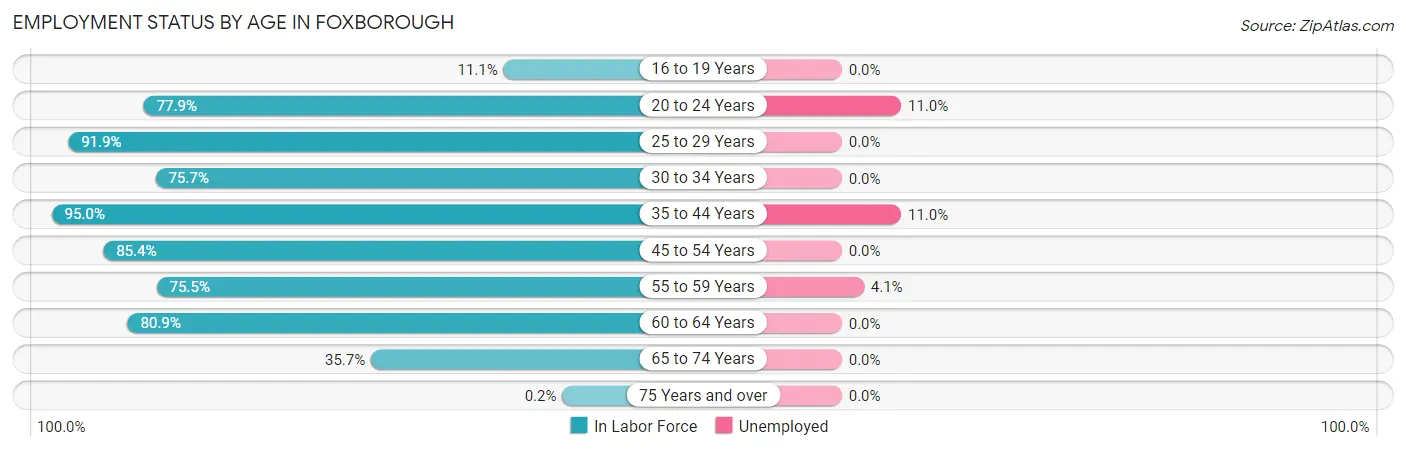
| Age Bracket | In Labor Force | Unemployed |
| 16 to 19 Years | 30 (11.1%) | 0 (0.0%) |
| 20 to 24 Years | 254 (77.9%) | 28 (11.0%) |
| 25 to 29 Years | 227 (91.9%) | 0 (0.0%) |
| 30 to 34 Years | 383 (75.7%) | 0 (0.0%) |
| 35 to 44 Years | 665 (95.0%) | 73 (11.0%) |
| 45 to 54 Years | 846 (85.4%) | 0 (0.0%) |
| 55 to 59 Years | 317 (75.5%) | 13 (4.1%) |
| 60 to 64 Years | 310 (80.9%) | 0 (0.0%) |
| 65 to 74 Years | 291 (35.7%) | 0 (0.0%) |
| 75 Years and over | 1 (0.2%) | 0 (0.0%) |
| Total | 3,326 (65.7%) | 113 (3.4%) |
Employment Status by Educational Attainment in Foxborough
According to labor force statistics for Foxborough, 84.6% of individuals (2,747) out of the total population between 25 and 64 years of age (3,247) are in the labor force, with 3.1% or 85 of them being unemployed. The group with the highest labor force participation rate are those with the educational attainment of college / associate degree, with 91.0% or 654 individuals in the labor force. Within the labor force, individuals with college / associate degree education have the highest percentage of unemployment, with 9.6% or 63 of them being unemployed.
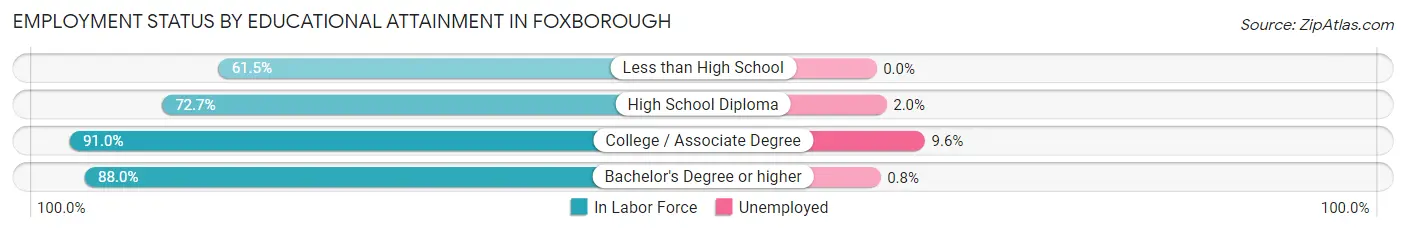
| Educational Attainment | In Labor Force | Unemployed |
| Less than High School | 59 (61.5%) | 0 (0.0%) |
| High School Diploma | 500 (72.7%) | 14 (2.0%) |
| College / Associate Degree | 654 (91.0%) | 69 (9.6%) |
| Bachelor's Degree or higher | 1,535 (88.0%) | 14 (0.8%) |
| Total | 2,747 (84.6%) | 101 (3.1%) |
Employment Occupations by Sex in Foxborough
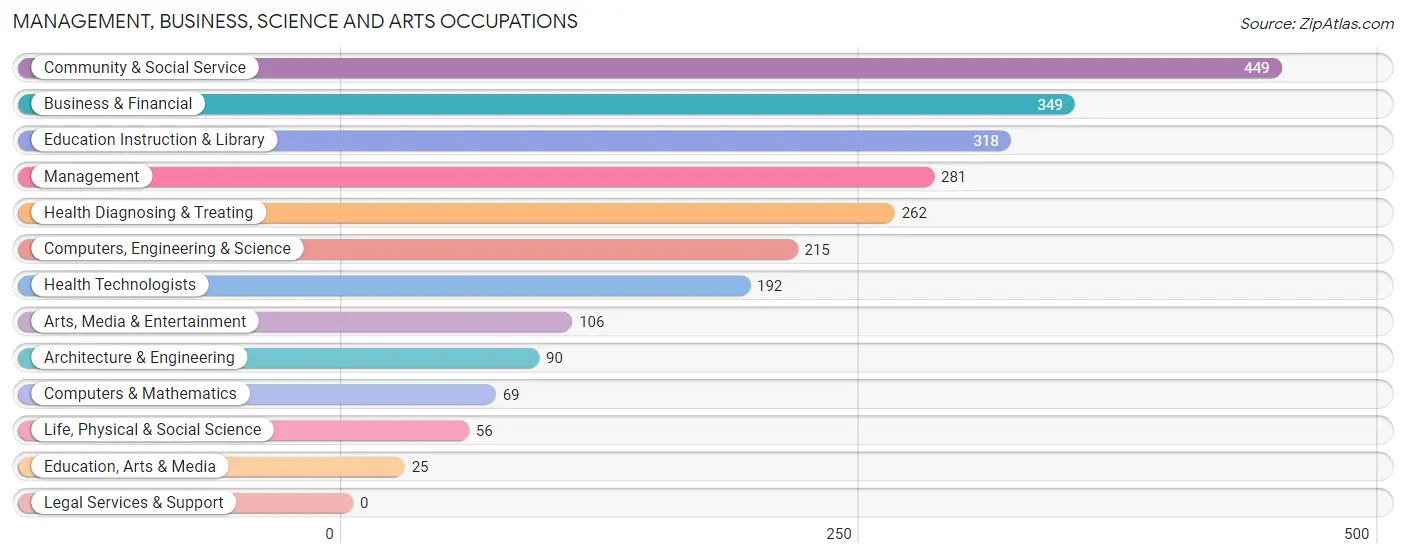
Management, Business, Science and Arts Occupations
The most common Management, Business, Science and Arts occupations in Foxborough are Community & Social Service (449 | 14.0%), Business & Financial (349 | 10.9%), Education Instruction & Library (318 | 9.9%), Management (281 | 8.7%), and Health Diagnosing & Treating (262 | 8.2%).
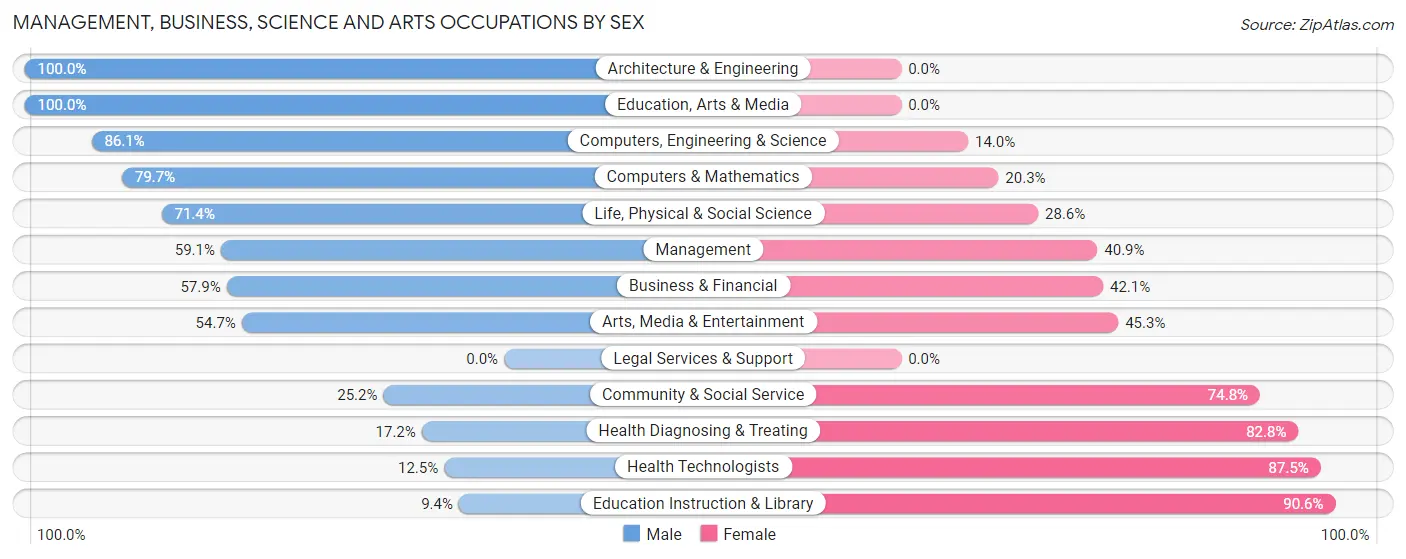
Management, Business, Science and Arts Occupations by Sex
Within the Management, Business, Science and Arts occupations in Foxborough, the most male-oriented occupations are Architecture & Engineering (100.0%), Education, Arts & Media (100.0%), and Computers, Engineering & Science (86.1%), while the most female-oriented occupations are Education Instruction & Library (90.6%), Health Technologists (87.5%), and Health Diagnosing & Treating (82.8%).
| Occupation | Male | Female |
| Management | 166 (59.1%) | 115 (40.9%) |
| Business & Financial | 202 (57.9%) | 147 (42.1%) |
| Computers, Engineering & Science | 185 (86.1%) | 30 (14.0%) |
| Computers & Mathematics | 55 (79.7%) | 14 (20.3%) |
| Architecture & Engineering | 90 (100.0%) | 0 (0.0%) |
| Life, Physical & Social Science | 40 (71.4%) | 16 (28.6%) |
| Community & Social Service | 113 (25.2%) | 336 (74.8%) |
| Education, Arts & Media | 25 (100.0%) | 0 (0.0%) |
| Legal Services & Support | 0 (0.0%) | 0 (0.0%) |
| Education Instruction & Library | 30 (9.4%) | 288 (90.6%) |
| Arts, Media & Entertainment | 58 (54.7%) | 48 (45.3%) |
| Health Diagnosing & Treating | 45 (17.2%) | 217 (82.8%) |
| Health Technologists | 24 (12.5%) | 168 (87.5%) |
| Total (Category) | 711 (45.7%) | 845 (54.3%) |
| Total (Overall) | 1,558 (48.5%) | 1,652 (51.5%) |
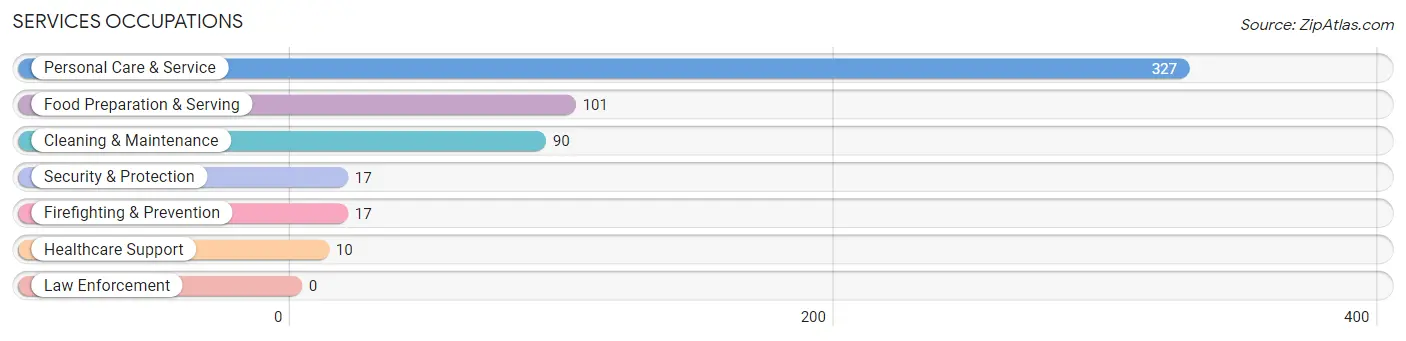
Services Occupations
The most common Services occupations in Foxborough are Personal Care & Service (327 | 10.2%), Food Preparation & Serving (101 | 3.2%), Cleaning & Maintenance (90 | 2.8%), Security & Protection (17 | 0.5%), and Firefighting & Prevention (17 | 0.5%).
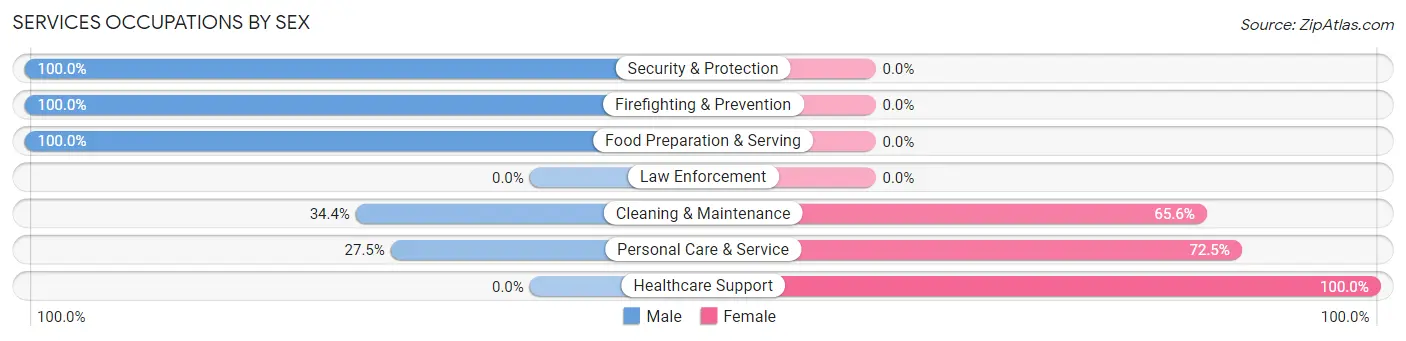
Services Occupations by Sex
Within the Services occupations in Foxborough, the most male-oriented occupations are Security & Protection (100.0%), Firefighting & Prevention (100.0%), and Food Preparation & Serving (100.0%), while the most female-oriented occupations are Healthcare Support (100.0%), Personal Care & Service (72.5%), and Cleaning & Maintenance (65.6%).
| Occupation | Male | Female |
| Healthcare Support | 0 (0.0%) | 10 (100.0%) |
| Security & Protection | 17 (100.0%) | 0 (0.0%) |
| Firefighting & Prevention | 17 (100.0%) | 0 (0.0%) |
| Law Enforcement | 0 (0.0%) | 0 (0.0%) |
| Food Preparation & Serving | 101 (100.0%) | 0 (0.0%) |
| Cleaning & Maintenance | 31 (34.4%) | 59 (65.6%) |
| Personal Care & Service | 90 (27.5%) | 237 (72.5%) |
| Total (Category) | 239 (43.9%) | 306 (56.1%) |
| Total (Overall) | 1,558 (48.5%) | 1,652 (51.5%) |
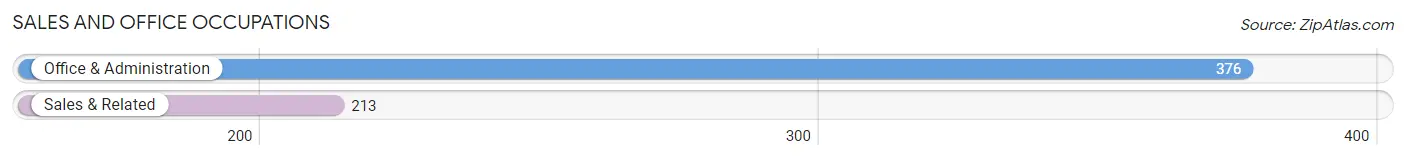
Sales and Office Occupations
The most common Sales and Office occupations in Foxborough are Office & Administration (376 | 11.7%), and Sales & Related (213 | 6.6%).
Sales and Office Occupations by Sex
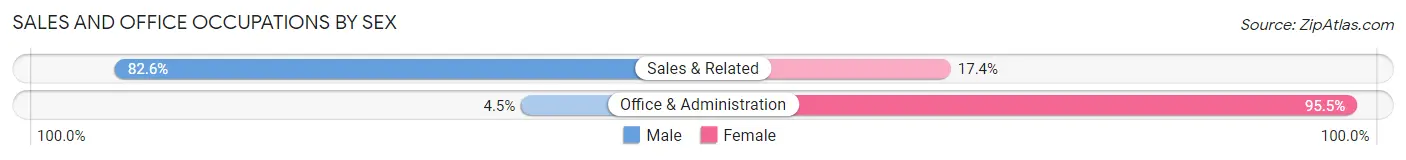
| Occupation | Male | Female |
| Sales & Related | 176 (82.6%) | 37 (17.4%) |
| Office & Administration | 17 (4.5%) | 359 (95.5%) |
| Total (Category) | 193 (32.8%) | 396 (67.2%) |
| Total (Overall) | 1,558 (48.5%) | 1,652 (51.5%) |
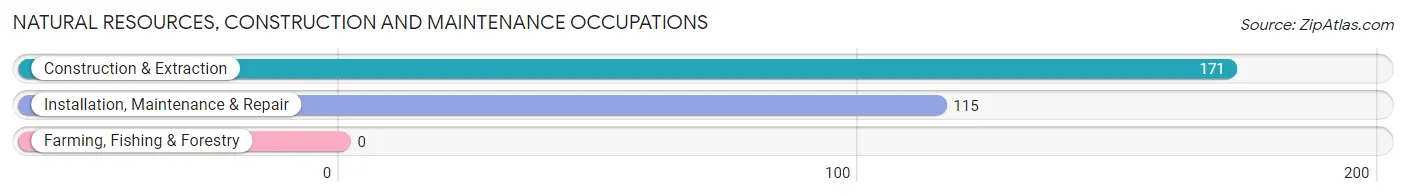
Natural Resources, Construction and Maintenance Occupations
The most common Natural Resources, Construction and Maintenance occupations in Foxborough are Construction & Extraction (171 | 5.3%), and Installation, Maintenance & Repair (115 | 3.6%).
Natural Resources, Construction and Maintenance Occupations by Sex
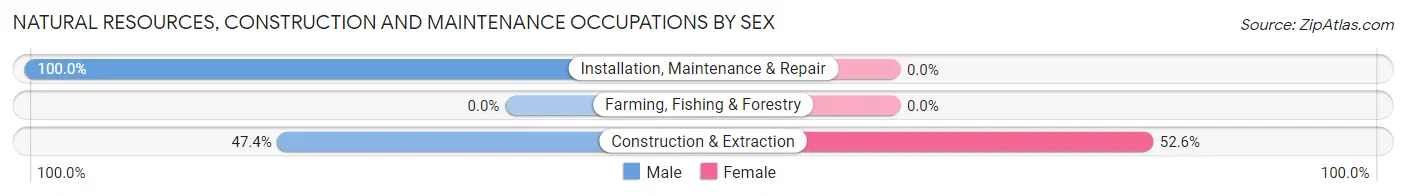
| Occupation | Male | Female |
| Farming, Fishing & Forestry | 0 (0.0%) | 0 (0.0%) |
| Construction & Extraction | 81 (47.4%) | 90 (52.6%) |
| Installation, Maintenance & Repair | 115 (100.0%) | 0 (0.0%) |
| Total (Category) | 196 (68.5%) | 90 (31.5%) |
| Total (Overall) | 1,558 (48.5%) | 1,652 (51.5%) |
Production, Transportation and Moving Occupations
The most common Production, Transportation and Moving occupations in Foxborough are Transportation (121 | 3.8%), Production (65 | 2.0%), and Material Moving (48 | 1.5%).
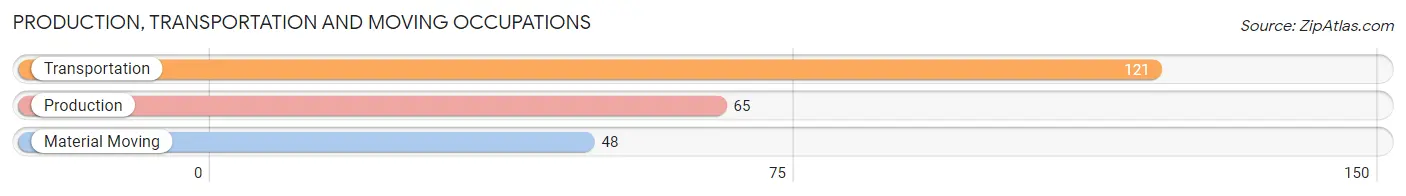
Production, Transportation and Moving Occupations by Sex
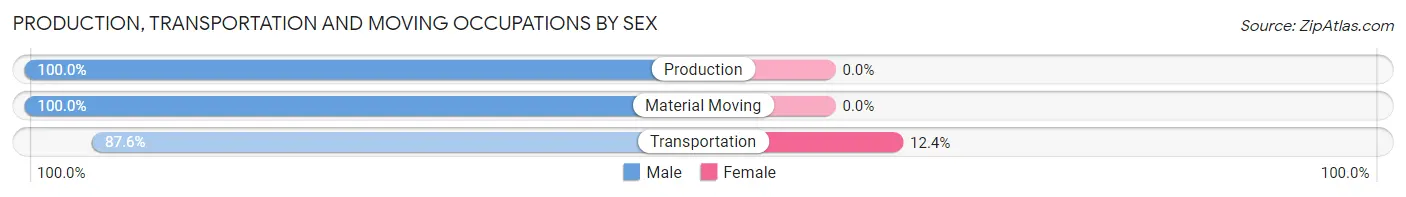
| Occupation | Male | Female |
| Production | 65 (100.0%) | 0 (0.0%) |
| Transportation | 106 (87.6%) | 15 (12.4%) |
| Material Moving | 48 (100.0%) | 0 (0.0%) |
| Total (Category) | 219 (93.6%) | 15 (6.4%) |
| Total (Overall) | 1,558 (48.5%) | 1,652 (51.5%) |
Employment Industries by Sex in Foxborough
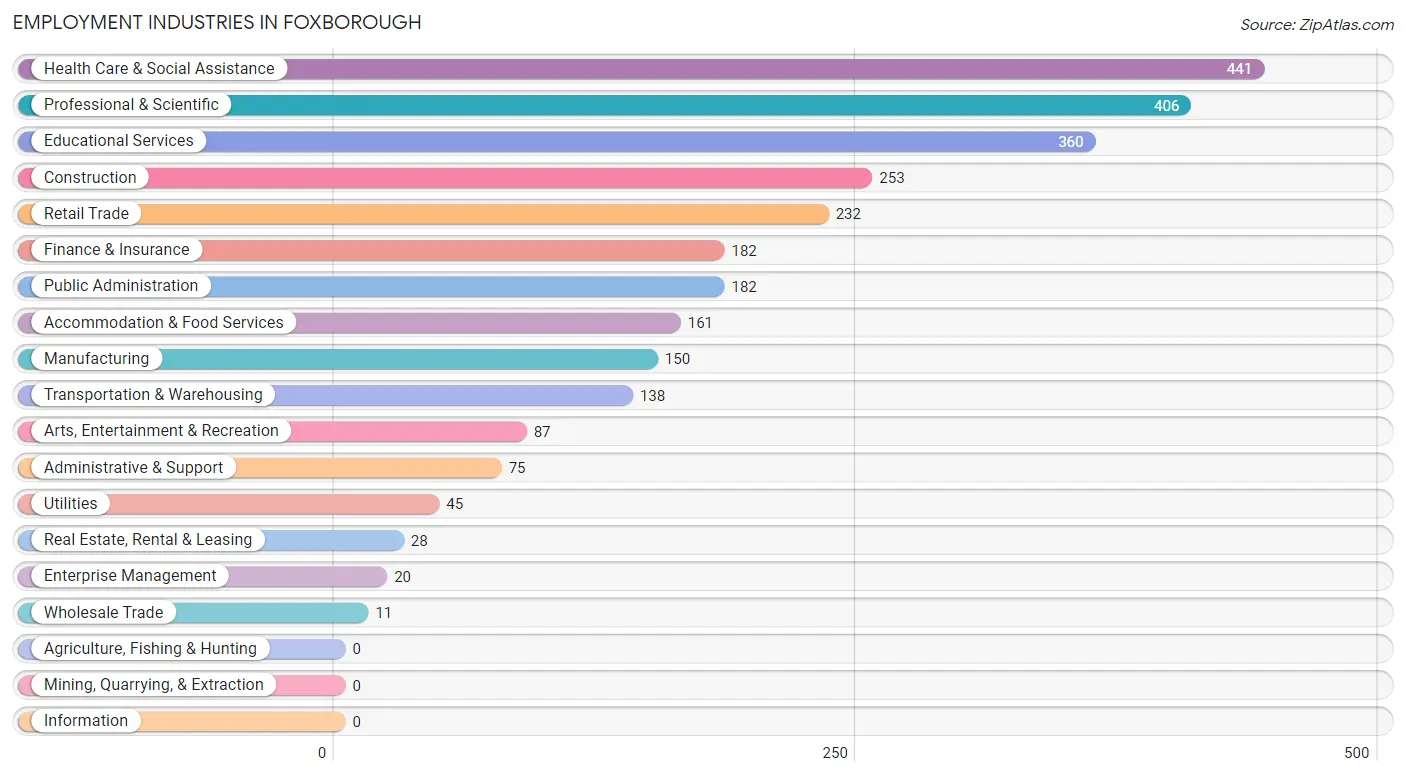
Employment Industries in Foxborough
The major employment industries in Foxborough include Health Care & Social Assistance (441 | 13.7%), Professional & Scientific (406 | 12.7%), Educational Services (360 | 11.2%), Construction (253 | 7.9%), and Retail Trade (232 | 7.2%).
Employment Industries by Sex in Foxborough
The Foxborough industries that see more men than women are Accommodation & Food Services (100.0%), Transportation & Warehousing (89.1%), and Manufacturing (76.7%), whereas the industries that tend to have a higher number of women are Wholesale Trade (100.0%), Enterprise Management (100.0%), and Administrative & Support (100.0%).
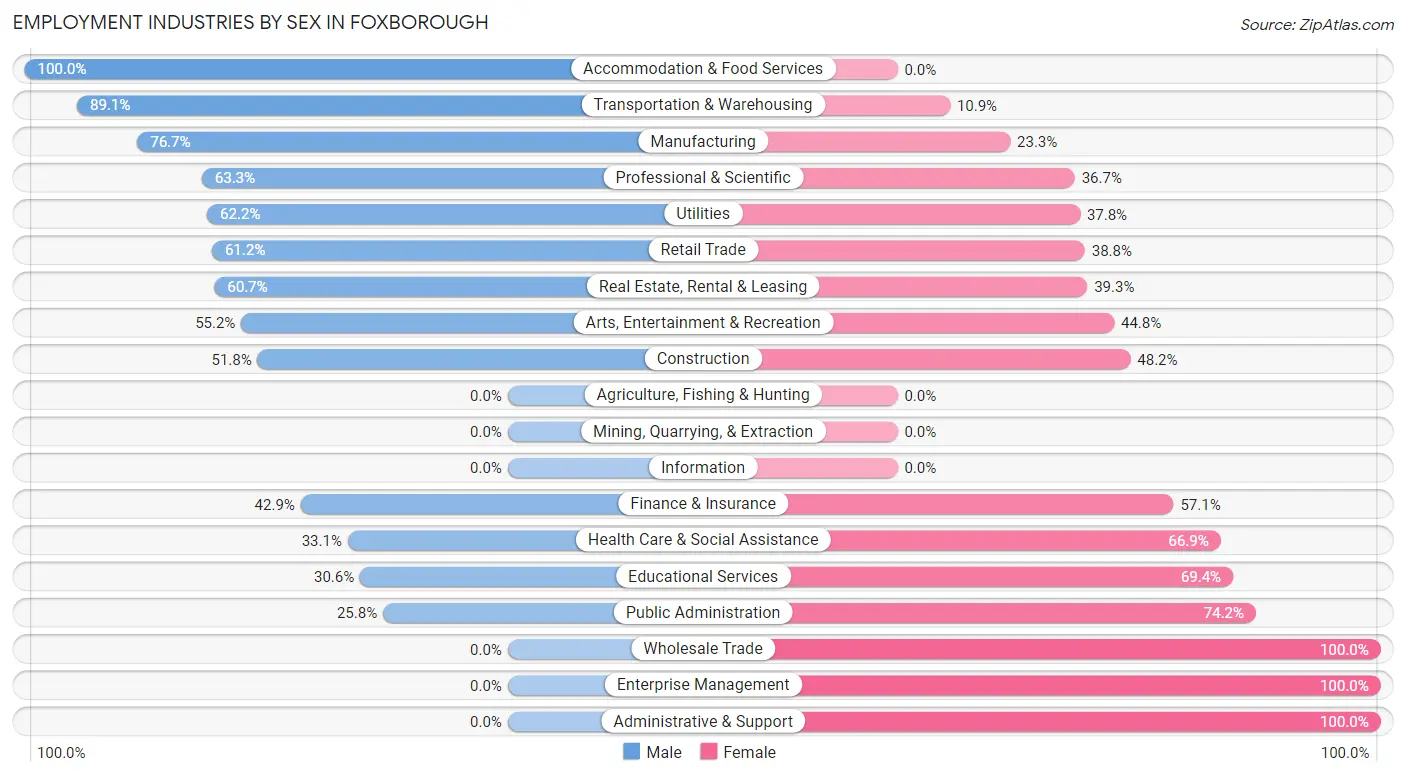
| Industry | Male | Female |
| Agriculture, Fishing & Hunting | 0 (0.0%) | 0 (0.0%) |
| Mining, Quarrying, & Extraction | 0 (0.0%) | 0 (0.0%) |
| Construction | 131 (51.8%) | 122 (48.2%) |
| Manufacturing | 115 (76.7%) | 35 (23.3%) |
| Wholesale Trade | 0 (0.0%) | 11 (100.0%) |
| Retail Trade | 142 (61.2%) | 90 (38.8%) |
| Transportation & Warehousing | 123 (89.1%) | 15 (10.9%) |
| Utilities | 28 (62.2%) | 17 (37.8%) |
| Information | 0 (0.0%) | 0 (0.0%) |
| Finance & Insurance | 78 (42.9%) | 104 (57.1%) |
| Real Estate, Rental & Leasing | 17 (60.7%) | 11 (39.3%) |
| Professional & Scientific | 257 (63.3%) | 149 (36.7%) |
| Enterprise Management | 0 (0.0%) | 20 (100.0%) |
| Administrative & Support | 0 (0.0%) | 75 (100.0%) |
| Educational Services | 110 (30.6%) | 250 (69.4%) |
| Health Care & Social Assistance | 146 (33.1%) | 295 (66.9%) |
| Arts, Entertainment & Recreation | 48 (55.2%) | 39 (44.8%) |
| Accommodation & Food Services | 161 (100.0%) | 0 (0.0%) |
| Public Administration | 47 (25.8%) | 135 (74.2%) |
| Total | 1,558 (48.5%) | 1,652 (51.5%) |
Education in Foxborough
School Enrollment in Foxborough
The most common levels of schooling among the 1,537 students in Foxborough are elementary school (340 | 22.1%), middle school (292 | 19.0%), and high school (260 | 16.9%).
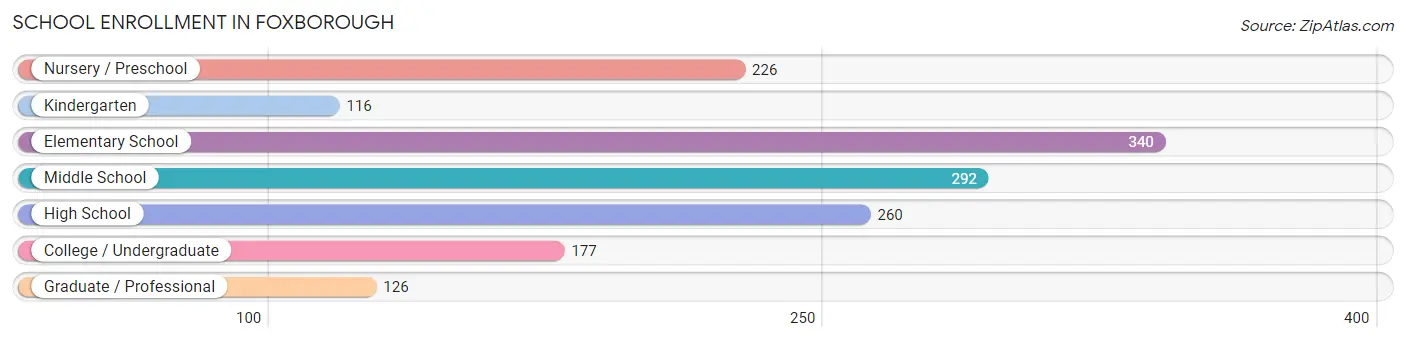
| School Level | # Students | % Students |
| Nursery / Preschool | 226 | 14.7% |
| Kindergarten | 116 | 7.5% |
| Elementary School | 340 | 22.1% |
| Middle School | 292 | 19.0% |
| High School | 260 | 16.9% |
| College / Undergraduate | 177 | 11.5% |
| Graduate / Professional | 126 | 8.2% |
| Total | 1,537 | 100.0% |
School Enrollment by Age by Funding Source in Foxborough
Out of a total of 1,537 students who are enrolled in schools in Foxborough, 306 (19.9%) attend a private institution, while the remaining 1,231 (80.1%) are enrolled in public schools. The age group of 35 years and over has the highest likelihood of being enrolled in private schools, with 82 (85.4% in the age bracket) enrolled. Conversely, the age group of 5 to 9 year old has the lowest likelihood of being enrolled in a private school, with 392 (100.0% in the age bracket) attending a public institution.
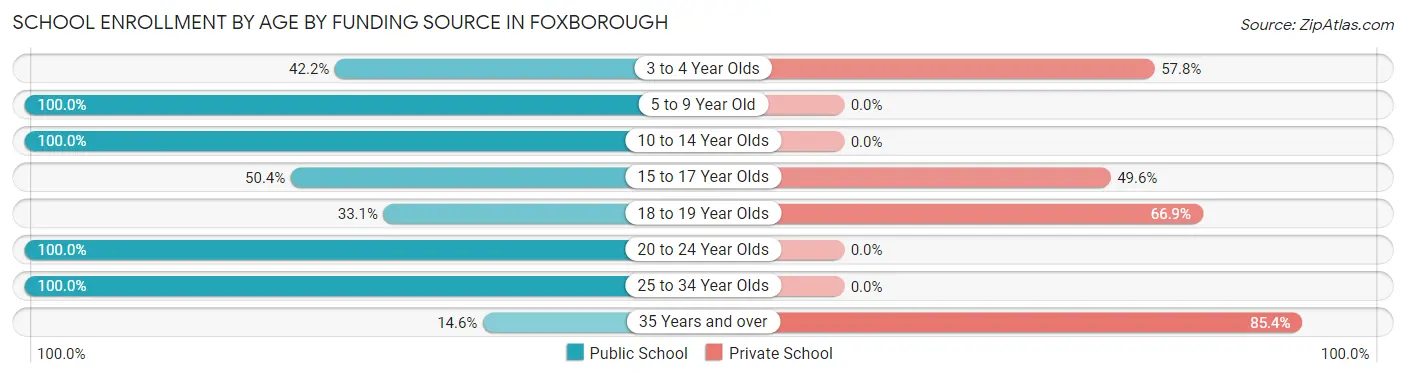
| Age Bracket | Public School | Private School |
| 3 to 4 Year Olds | 43 (42.2%) | 59 (57.8%) |
| 5 to 9 Year Old | 392 (100.0%) | 0 (0.0%) |
| 10 to 14 Year Olds | 555 (100.0%) | 0 (0.0%) |
| 15 to 17 Year Olds | 69 (50.4%) | 68 (49.6%) |
| 18 to 19 Year Olds | 48 (33.1%) | 97 (66.9%) |
| 20 to 24 Year Olds | 90 (100.0%) | 0 (0.0%) |
| 25 to 34 Year Olds | 20 (100.0%) | 0 (0.0%) |
| 35 Years and over | 14 (14.6%) | 82 (85.4%) |
| Total | 1,231 (80.1%) | 306 (19.9%) |
Educational Attainment by Field of Study in Foxborough
Business (596 | 24.0%), education (261 | 10.5%), social sciences (226 | 9.1%), science & technology (179 | 7.2%), and literature & languages (178 | 7.2%) are the most common fields of study among 2,480 individuals in Foxborough who have obtained a bachelor's degree or higher.
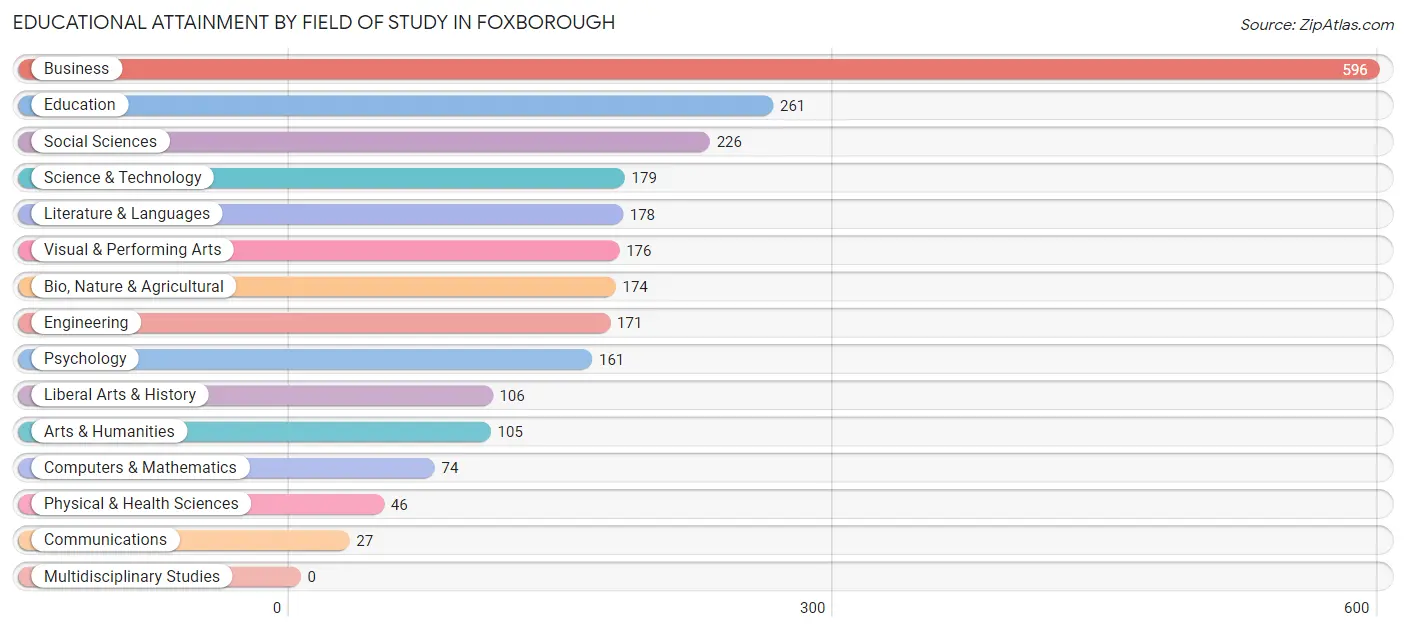
| Field of Study | # Graduates | % Graduates |
| Computers & Mathematics | 74 | 3.0% |
| Bio, Nature & Agricultural | 174 | 7.0% |
| Physical & Health Sciences | 46 | 1.8% |
| Psychology | 161 | 6.5% |
| Social Sciences | 226 | 9.1% |
| Engineering | 171 | 6.9% |
| Multidisciplinary Studies | 0 | 0.0% |
| Science & Technology | 179 | 7.2% |
| Business | 596 | 24.0% |
| Education | 261 | 10.5% |
| Literature & Languages | 178 | 7.2% |
| Liberal Arts & History | 106 | 4.3% |
| Visual & Performing Arts | 176 | 7.1% |
| Communications | 27 | 1.1% |
| Arts & Humanities | 105 | 4.2% |
| Total | 2,480 | 100.0% |
Transportation & Commute in Foxborough
Vehicle Availability by Sex in Foxborough
The most prevalent vehicle ownership categories in Foxborough are males with 2 vehicles (574, accounting for 36.9%) and females with 2 vehicles (460, making up 41.5%).
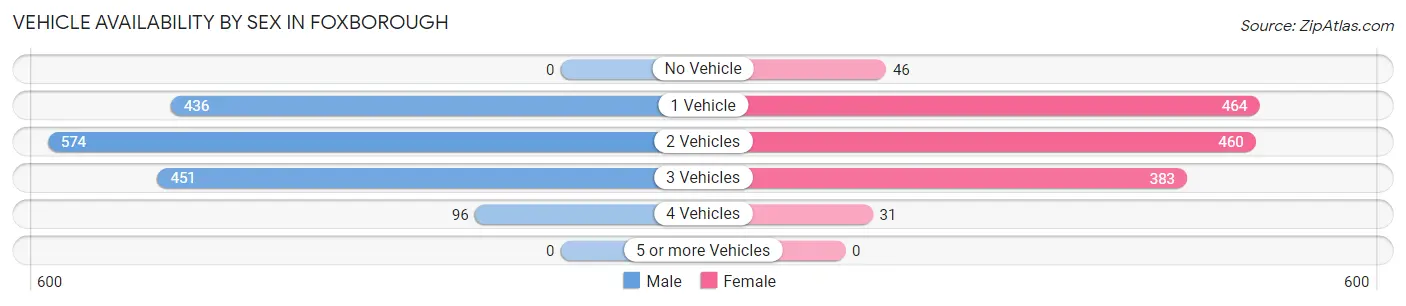
| Vehicles Available | Male | Female |
| No Vehicle | 0 (0.0%) | 46 (3.3%) |
| 1 Vehicle | 436 (28.0%) | 464 (33.5%) |
| 2 Vehicles | 574 (36.9%) | 460 (33.2%) |
| 3 Vehicles | 451 (29.0%) | 383 (27.7%) |
| 4 Vehicles | 96 (6.2%) | 31 (2.2%) |
| 5 or more Vehicles | 0 (0.0%) | 0 (0.0%) |
| Total | 1,557 (100.0%) | 1,384 (100.0%) |
Commute Time in Foxborough
The most frequently occuring commute durations in Foxborough are 30 to 34 minutes (411 commuters, 15.5%), 60 to 89 minutes (352 commuters, 13.3%), and 10 to 14 minutes (303 commuters, 11.4%).
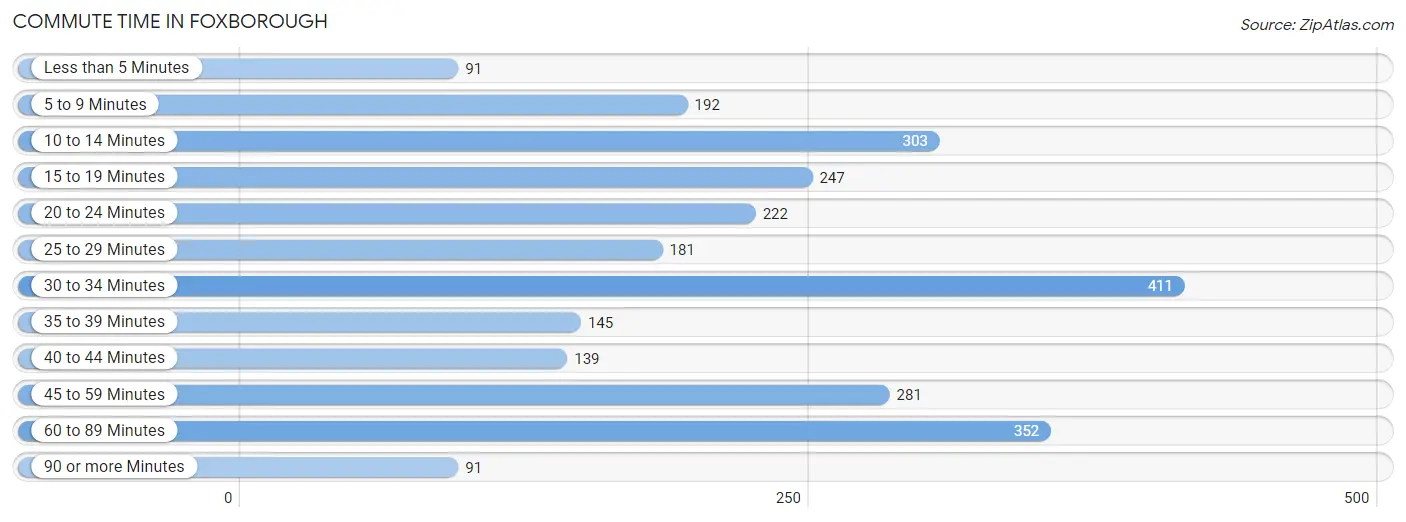
| Commute Time | # Commuters | % Commuters |
| Less than 5 Minutes | 91 | 3.4% |
| 5 to 9 Minutes | 192 | 7.2% |
| 10 to 14 Minutes | 303 | 11.4% |
| 15 to 19 Minutes | 247 | 9.3% |
| 20 to 24 Minutes | 222 | 8.4% |
| 25 to 29 Minutes | 181 | 6.8% |
| 30 to 34 Minutes | 411 | 15.5% |
| 35 to 39 Minutes | 145 | 5.5% |
| 40 to 44 Minutes | 139 | 5.2% |
| 45 to 59 Minutes | 281 | 10.6% |
| 60 to 89 Minutes | 352 | 13.3% |
| 90 or more Minutes | 91 | 3.4% |
Commute Time by Sex in Foxborough
The most common commute times in Foxborough are 30 to 34 minutes (263 commuters, 19.1%) for males and 60 to 89 minutes (228 commuters, 17.8%) for females.
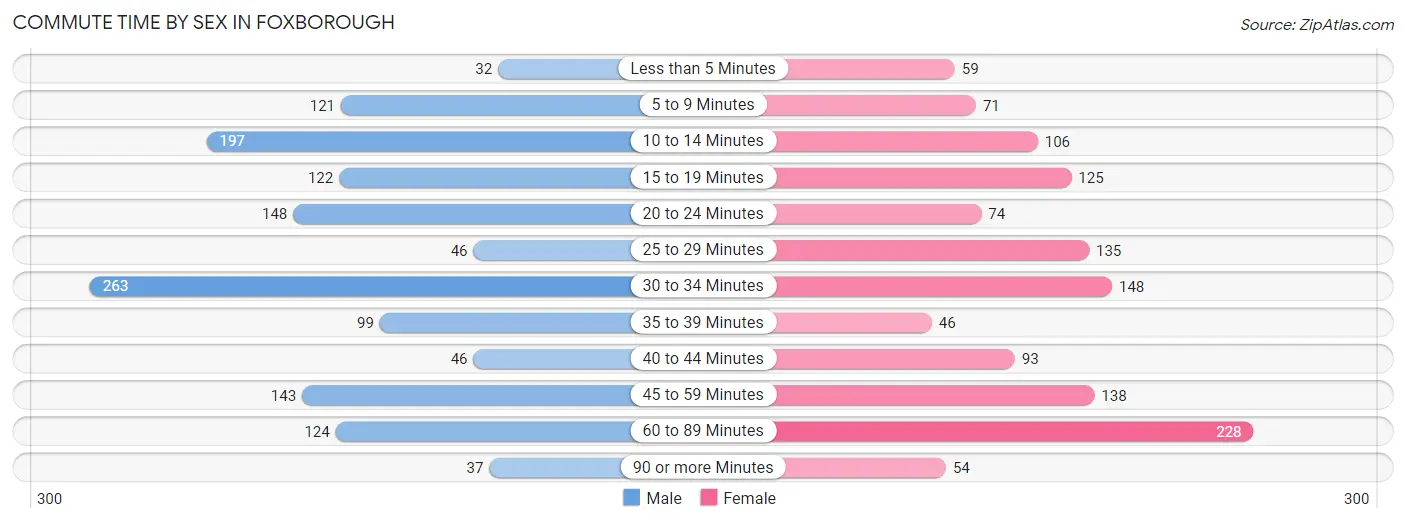
| Commute Time | Male | Female |
| Less than 5 Minutes | 32 (2.3%) | 59 (4.6%) |
| 5 to 9 Minutes | 121 (8.8%) | 71 (5.6%) |
| 10 to 14 Minutes | 197 (14.3%) | 106 (8.3%) |
| 15 to 19 Minutes | 122 (8.8%) | 125 (9.8%) |
| 20 to 24 Minutes | 148 (10.7%) | 74 (5.8%) |
| 25 to 29 Minutes | 46 (3.3%) | 135 (10.6%) |
| 30 to 34 Minutes | 263 (19.1%) | 148 (11.6%) |
| 35 to 39 Minutes | 99 (7.2%) | 46 (3.6%) |
| 40 to 44 Minutes | 46 (3.3%) | 93 (7.3%) |
| 45 to 59 Minutes | 143 (10.4%) | 138 (10.8%) |
| 60 to 89 Minutes | 124 (9.0%) | 228 (17.8%) |
| 90 or more Minutes | 37 (2.7%) | 54 (4.2%) |
Time of Departure to Work by Sex in Foxborough
The most frequent times of departure to work in Foxborough are 7:00 AM to 7:29 AM (262, 19.0%) for males and 8:00 AM to 8:29 AM (290, 22.7%) for females.
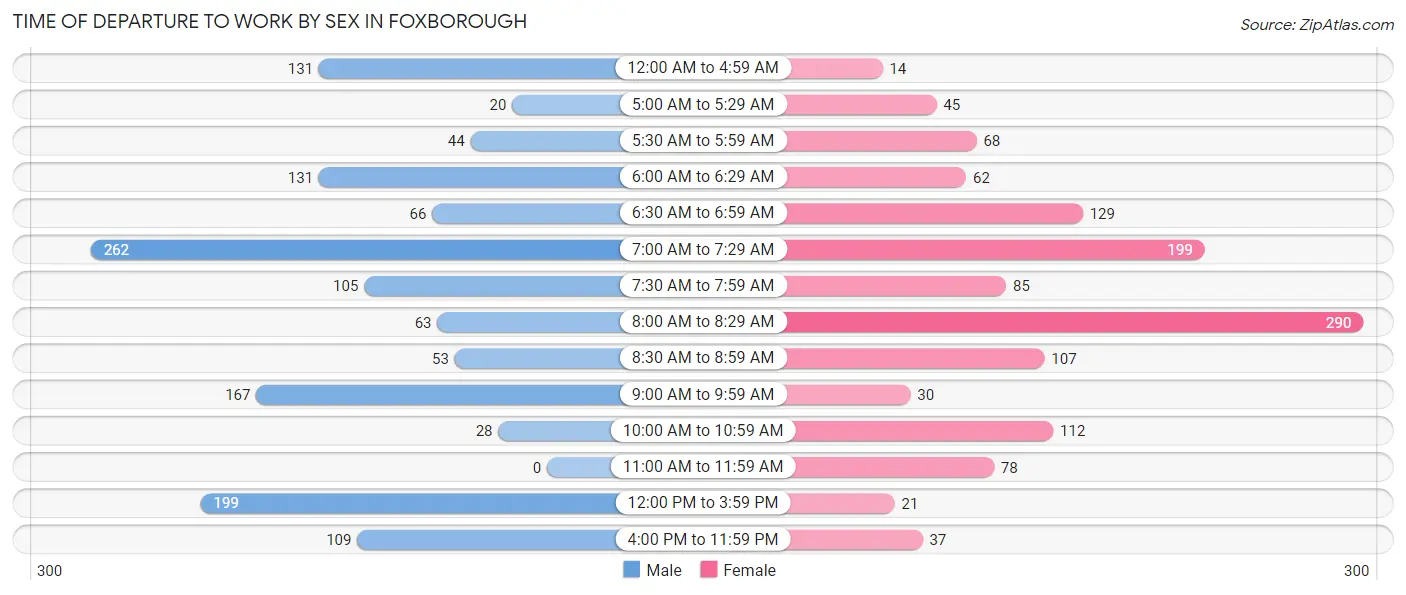
| Time of Departure | Male | Female |
| 12:00 AM to 4:59 AM | 131 (9.5%) | 14 (1.1%) |
| 5:00 AM to 5:29 AM | 20 (1.5%) | 45 (3.5%) |
| 5:30 AM to 5:59 AM | 44 (3.2%) | 68 (5.3%) |
| 6:00 AM to 6:29 AM | 131 (9.5%) | 62 (4.9%) |
| 6:30 AM to 6:59 AM | 66 (4.8%) | 129 (10.1%) |
| 7:00 AM to 7:29 AM | 262 (19.0%) | 199 (15.6%) |
| 7:30 AM to 7:59 AM | 105 (7.6%) | 85 (6.7%) |
| 8:00 AM to 8:29 AM | 63 (4.6%) | 290 (22.7%) |
| 8:30 AM to 8:59 AM | 53 (3.8%) | 107 (8.4%) |
| 9:00 AM to 9:59 AM | 167 (12.1%) | 30 (2.4%) |
| 10:00 AM to 10:59 AM | 28 (2.0%) | 112 (8.8%) |
| 11:00 AM to 11:59 AM | 0 (0.0%) | 78 (6.1%) |
| 12:00 PM to 3:59 PM | 199 (14.4%) | 21 (1.6%) |
| 4:00 PM to 11:59 PM | 109 (7.9%) | 37 (2.9%) |
| Total | 1,378 (100.0%) | 1,277 (100.0%) |
Housing Occupancy in Foxborough
Occupancy by Ownership in Foxborough
Of the total 2,883 dwellings in Foxborough, owner-occupied units account for 1,472 (51.1%), while renter-occupied units make up 1,411 (48.9%).
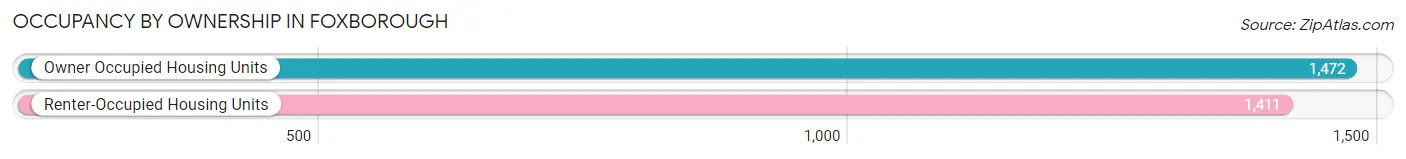
| Occupancy | # Housing Units | % Housing Units |
| Owner Occupied Housing Units | 1,472 | 51.1% |
| Renter-Occupied Housing Units | 1,411 | 48.9% |
| Total Occupied Housing Units | 2,883 | 100.0% |
Occupancy by Household Size in Foxborough
| Household Size | # Housing Units | % Housing Units |
| 1-Person Household | 1,342 | 46.6% |
| 2-Person Household | 686 | 23.8% |
| 3-Person Household | 269 | 9.3% |
| 4+ Person Household | 586 | 20.3% |
| Total Housing Units | 2,883 | 100.0% |
Occupancy by Ownership by Household Size in Foxborough
| Household Size | Owner-occupied | Renter-occupied |
| 1-Person Household | 421 (31.4%) | 921 (68.6%) |
| 2-Person Household | 438 (63.8%) | 248 (36.1%) |
| 3-Person Household | 115 (42.7%) | 154 (57.3%) |
| 4+ Person Household | 498 (85.0%) | 88 (15.0%) |
| Total Housing Units | 1,472 (51.1%) | 1,411 (48.9%) |
Occupancy by Educational Attainment in Foxborough
| Household Size | Owner-occupied | Renter-occupied |
| Less than High School | 81 (68.6%) | 37 (31.4%) |
| High School Diploma | 289 (43.9%) | 369 (56.1%) |
| College/Associate Degree | 258 (39.9%) | 388 (60.1%) |
| Bachelor's Degree or higher | 844 (57.8%) | 617 (42.2%) |
Occupancy by Age of Householder in Foxborough
| Age Bracket | # Households | % Households |
| Under 35 Years | 488 | 16.9% |
| 35 to 44 Years | 306 | 10.6% |
| 45 to 54 Years | 559 | 19.4% |
| 55 to 64 Years | 564 | 19.6% |
| 65 to 74 Years | 631 | 21.9% |
| 75 to 84 Years | 234 | 8.1% |
| 85 Years and Over | 101 | 3.5% |
| Total | 2,883 | 100.0% |
Housing Finances in Foxborough
Median Income by Occupancy in Foxborough
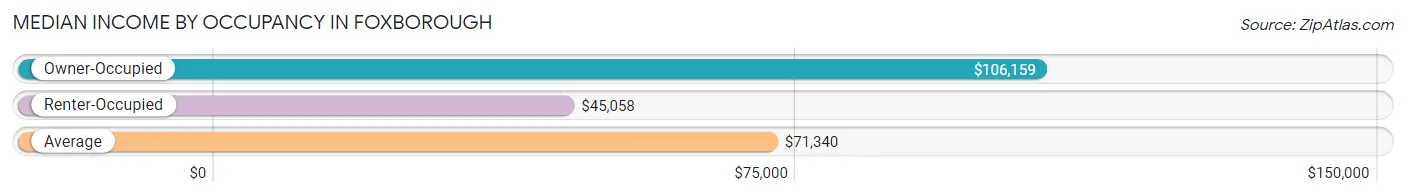
| Occupancy Type | # Households | Median Income |
| Owner-Occupied | 1,472 (51.1%) | $106,159 |
| Renter-Occupied | 1,411 (48.9%) | $45,058 |
| Average | 2,883 (100.0%) | $71,340 |
Occupancy by Householder Income Bracket in Foxborough
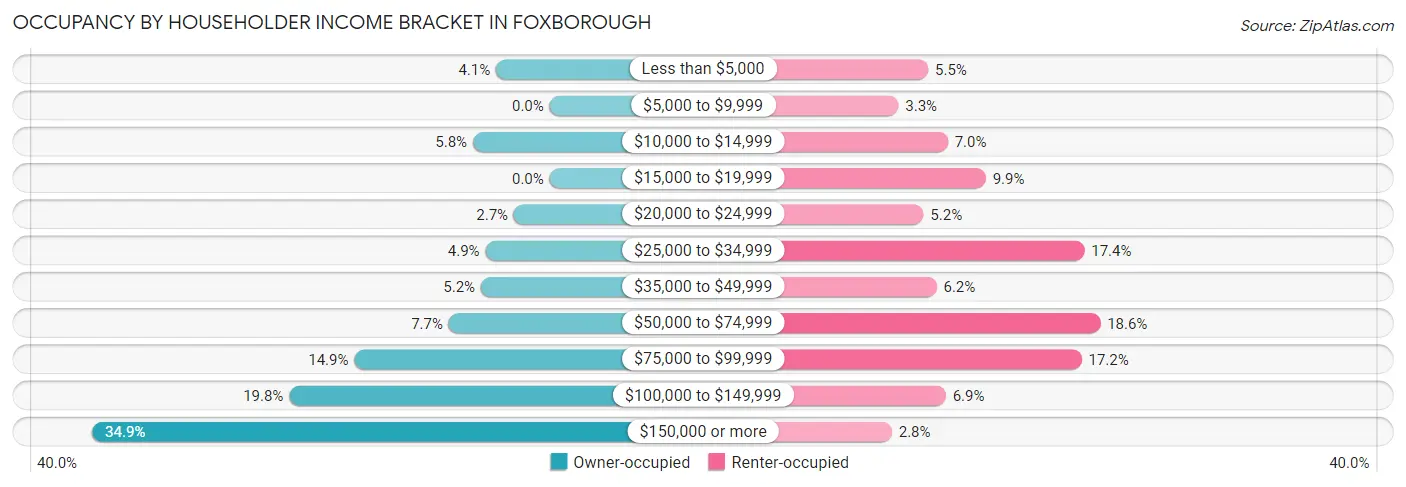
| Income Bracket | Owner-occupied | Renter-occupied |
| Less than $5,000 | 60 (4.1%) | 78 (5.5%) |
| $5,000 to $9,999 | 0 (0.0%) | 46 (3.3%) |
| $10,000 to $14,999 | 86 (5.8%) | 99 (7.0%) |
| $15,000 to $19,999 | 0 (0.0%) | 140 (9.9%) |
| $20,000 to $24,999 | 40 (2.7%) | 73 (5.2%) |
| $25,000 to $34,999 | 72 (4.9%) | 246 (17.4%) |
| $35,000 to $49,999 | 77 (5.2%) | 87 (6.2%) |
| $50,000 to $74,999 | 113 (7.7%) | 263 (18.6%) |
| $75,000 to $99,999 | 219 (14.9%) | 243 (17.2%) |
| $100,000 to $149,999 | 292 (19.8%) | 97 (6.9%) |
| $150,000 or more | 513 (34.8%) | 39 (2.8%) |
| Total | 1,472 (100.0%) | 1,411 (100.0%) |
Monthly Housing Cost Tiers in Foxborough
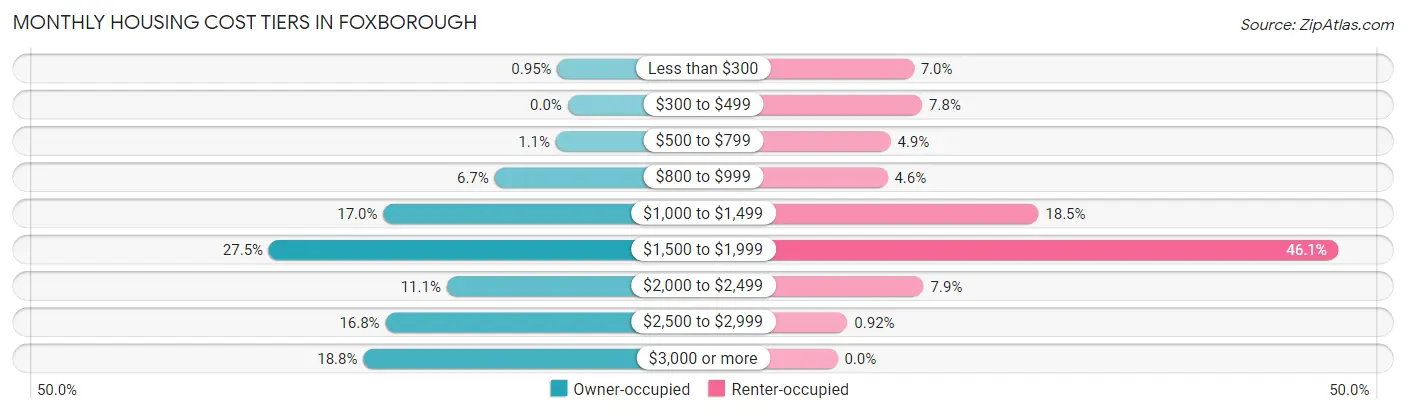
| Monthly Cost | Owner-occupied | Renter-occupied |
| Less than $300 | 14 (0.9%) | 99 (7.0%) |
| $300 to $499 | 0 (0.0%) | 110 (7.8%) |
| $500 to $799 | 16 (1.1%) | 69 (4.9%) |
| $800 to $999 | 99 (6.7%) | 65 (4.6%) |
| $1,000 to $1,499 | 250 (17.0%) | 261 (18.5%) |
| $1,500 to $1,999 | 405 (27.5%) | 651 (46.1%) |
| $2,000 to $2,499 | 164 (11.1%) | 112 (7.9%) |
| $2,500 to $2,999 | 247 (16.8%) | 13 (0.9%) |
| $3,000 or more | 277 (18.8%) | 0 (0.0%) |
| Total | 1,472 (100.0%) | 1,411 (100.0%) |
Physical Housing Characteristics in Foxborough
Housing Structures in Foxborough
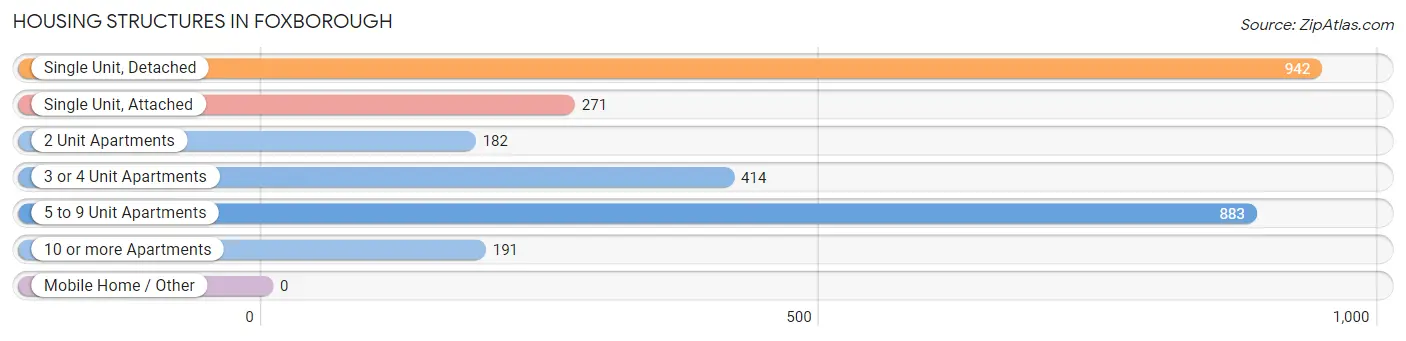
| Structure Type | # Housing Units | % Housing Units |
| Single Unit, Detached | 942 | 32.7% |
| Single Unit, Attached | 271 | 9.4% |
| 2 Unit Apartments | 182 | 6.3% |
| 3 or 4 Unit Apartments | 414 | 14.4% |
| 5 to 9 Unit Apartments | 883 | 30.6% |
| 10 or more Apartments | 191 | 6.6% |
| Mobile Home / Other | 0 | 0.0% |
| Total | 2,883 | 100.0% |
Housing Structures by Occupancy in Foxborough
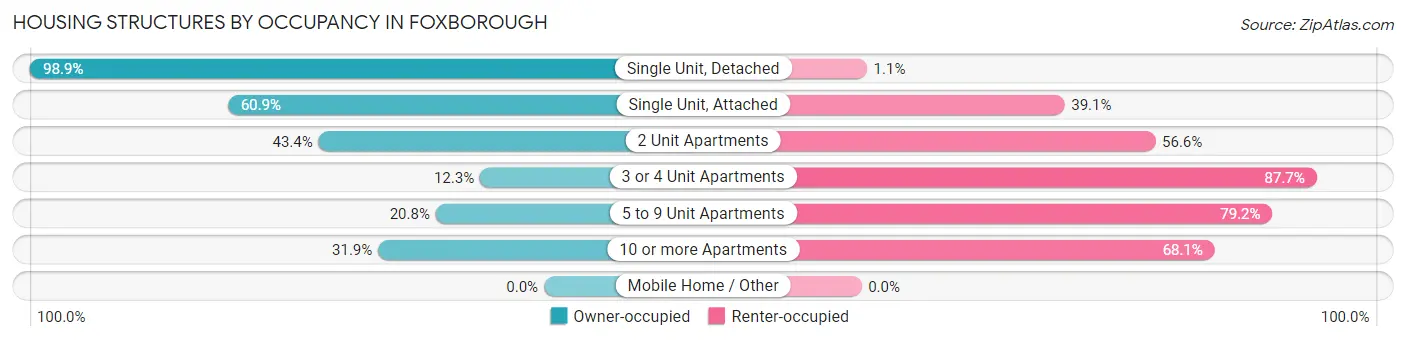
| Structure Type | Owner-occupied | Renter-occupied |
| Single Unit, Detached | 932 (98.9%) | 10 (1.1%) |
| Single Unit, Attached | 165 (60.9%) | 106 (39.1%) |
| 2 Unit Apartments | 79 (43.4%) | 103 (56.6%) |
| 3 or 4 Unit Apartments | 51 (12.3%) | 363 (87.7%) |
| 5 to 9 Unit Apartments | 184 (20.8%) | 699 (79.2%) |
| 10 or more Apartments | 61 (31.9%) | 130 (68.1%) |
| Mobile Home / Other | 0 (0.0%) | 0 (0.0%) |
| Total | 1,472 (51.1%) | 1,411 (48.9%) |
Housing Structures by Number of Rooms in Foxborough
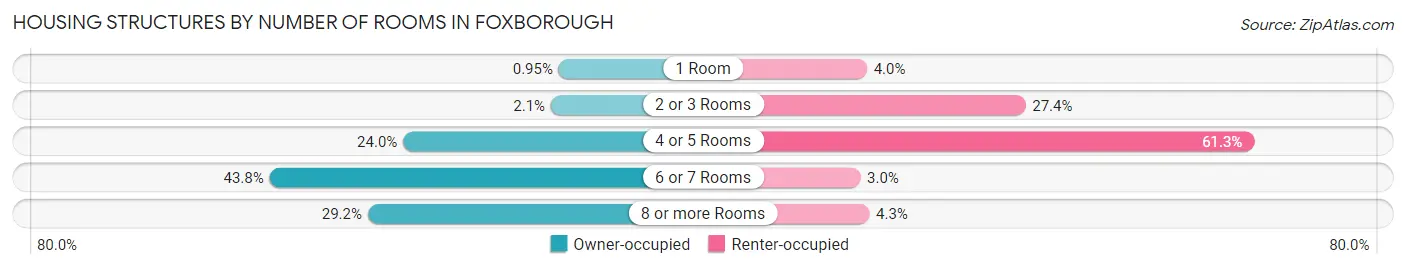
| Number of Rooms | Owner-occupied | Renter-occupied |
| 1 Room | 14 (0.9%) | 56 (4.0%) |
| 2 or 3 Rooms | 31 (2.1%) | 387 (27.4%) |
| 4 or 5 Rooms | 353 (24.0%) | 865 (61.3%) |
| 6 or 7 Rooms | 644 (43.8%) | 42 (3.0%) |
| 8 or more Rooms | 430 (29.2%) | 61 (4.3%) |
| Total | 1,472 (100.0%) | 1,411 (100.0%) |
Housing Structure by Heating Type in Foxborough
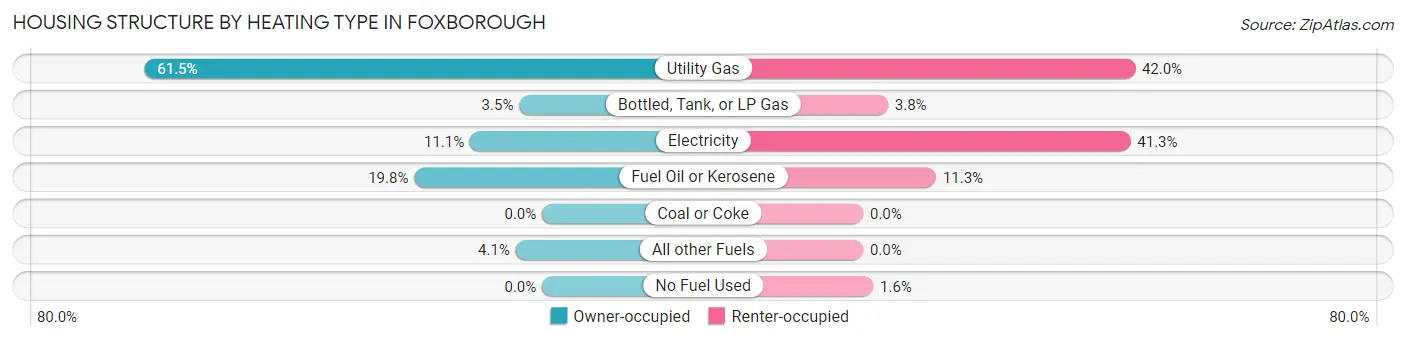
| Heating Type | Owner-occupied | Renter-occupied |
| Utility Gas | 905 (61.5%) | 593 (42.0%) |
| Bottled, Tank, or LP Gas | 52 (3.5%) | 54 (3.8%) |
| Electricity | 164 (11.1%) | 583 (41.3%) |
| Fuel Oil or Kerosene | 291 (19.8%) | 159 (11.3%) |
| Coal or Coke | 0 (0.0%) | 0 (0.0%) |
| All other Fuels | 60 (4.1%) | 0 (0.0%) |
| No Fuel Used | 0 (0.0%) | 22 (1.6%) |
| Total | 1,472 (100.0%) | 1,411 (100.0%) |
Household Vehicle Usage in Foxborough
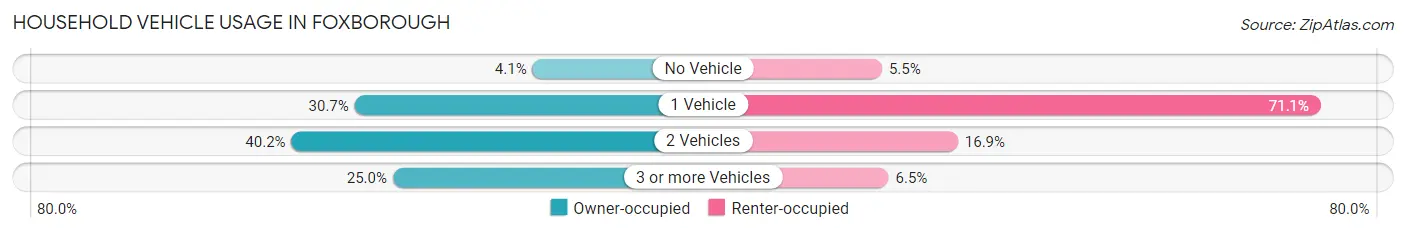
| Vehicles per Household | Owner-occupied | Renter-occupied |
| No Vehicle | 61 (4.1%) | 78 (5.5%) |
| 1 Vehicle | 452 (30.7%) | 1,003 (71.1%) |
| 2 Vehicles | 591 (40.2%) | 238 (16.9%) |
| 3 or more Vehicles | 368 (25.0%) | 92 (6.5%) |
| Total | 1,472 (100.0%) | 1,411 (100.0%) |
Real Estate & Mortgages in Foxborough
Real Estate and Mortgage Overview in Foxborough
| Characteristic | Without Mortgage | With Mortgage |
| Housing Units | 396 | 1,076 |
| Median Property Value | $614,600 | $450,200 |
| Median Household Income | $76,447 | $411 |
| Monthly Housing Costs | $1,160 | $277 |
| Real Estate Taxes | $6,722 | $0 |
Property Value by Mortgage Status in Foxborough
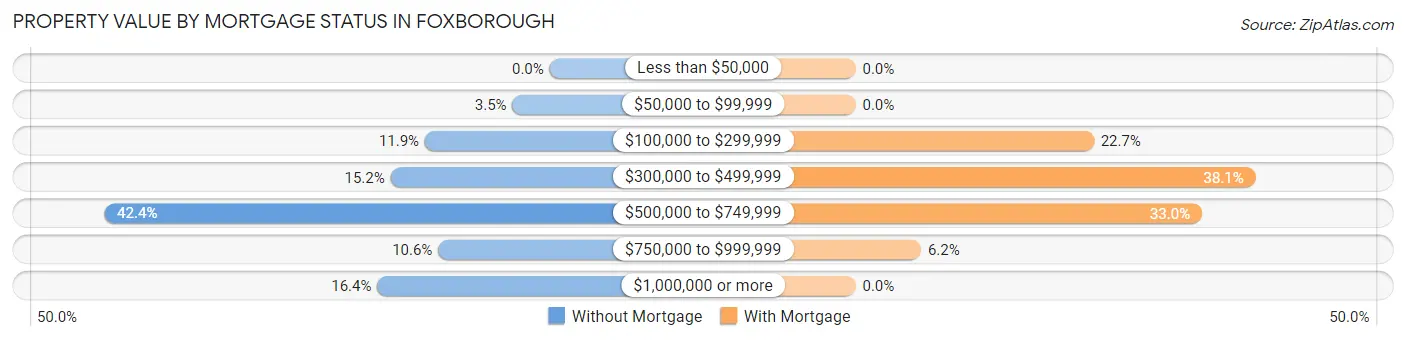
| Property Value | Without Mortgage | With Mortgage |
| Less than $50,000 | 0 (0.0%) | 0 (0.0%) |
| $50,000 to $99,999 | 14 (3.5%) | 0 (0.0%) |
| $100,000 to $299,999 | 47 (11.9%) | 244 (22.7%) |
| $300,000 to $499,999 | 60 (15.1%) | 410 (38.1%) |
| $500,000 to $749,999 | 168 (42.4%) | 355 (33.0%) |
| $750,000 to $999,999 | 42 (10.6%) | 67 (6.2%) |
| $1,000,000 or more | 65 (16.4%) | 0 (0.0%) |
| Total | 396 (100.0%) | 1,076 (100.0%) |
Household Income by Mortgage Status in Foxborough
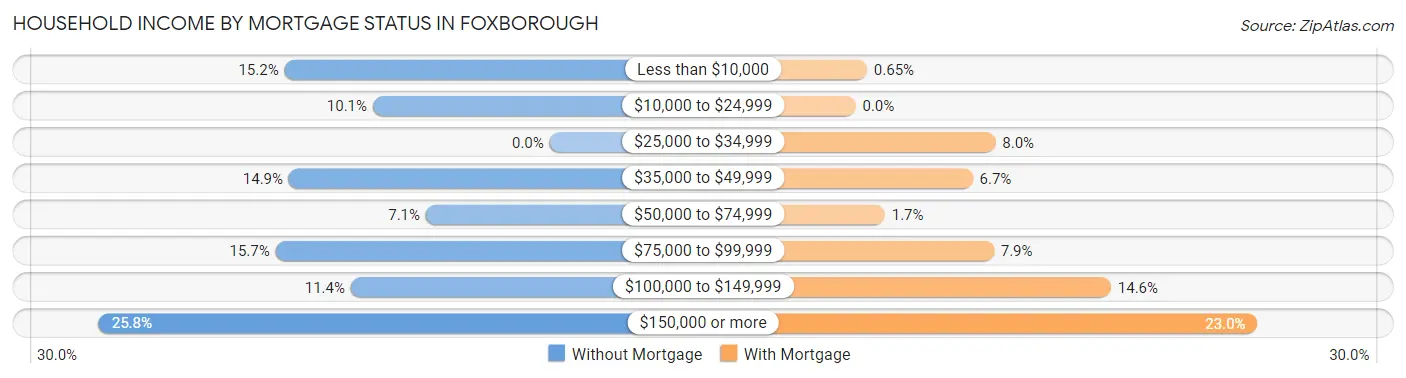
| Household Income | Without Mortgage | With Mortgage |
| Less than $10,000 | 60 (15.1%) | 7 (0.6%) |
| $10,000 to $24,999 | 40 (10.1%) | 0 (0.0%) |
| $25,000 to $34,999 | 0 (0.0%) | 86 (8.0%) |
| $35,000 to $49,999 | 59 (14.9%) | 72 (6.7%) |
| $50,000 to $74,999 | 28 (7.1%) | 18 (1.7%) |
| $75,000 to $99,999 | 62 (15.7%) | 85 (7.9%) |
| $100,000 to $149,999 | 45 (11.4%) | 157 (14.6%) |
| $150,000 or more | 102 (25.8%) | 247 (23.0%) |
| Total | 396 (100.0%) | 1,076 (100.0%) |
Property Value to Household Income Ratio in Foxborough
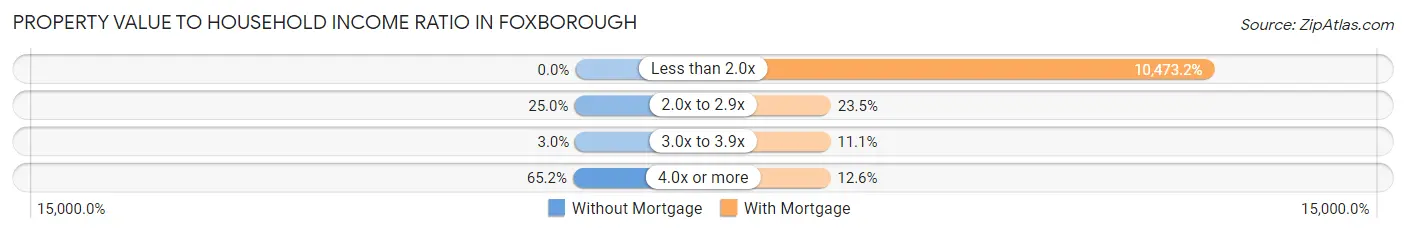
| Value-to-Income Ratio | Without Mortgage | With Mortgage |
| Less than 2.0x | 0 (0.0%) | 112,692 (10,473.2%) |
| 2.0x to 2.9x | 99 (25.0%) | 253 (23.5%) |
| 3.0x to 3.9x | 12 (3.0%) | 119 (11.1%) |
| 4.0x or more | 258 (65.1%) | 136 (12.6%) |
| Total | 396 (100.0%) | 1,076 (100.0%) |
Real Estate Taxes by Mortgage Status in Foxborough
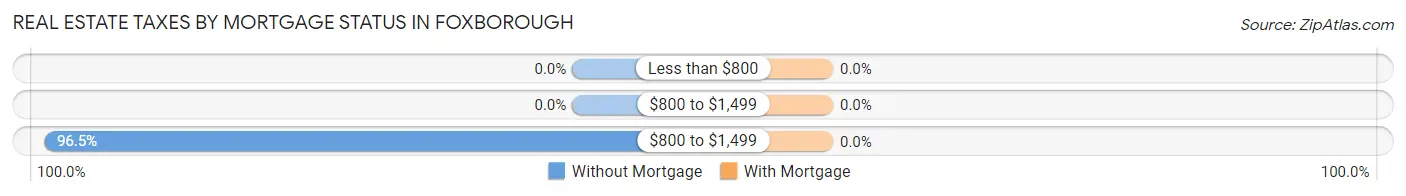
| Property Taxes | Without Mortgage | With Mortgage |
| Less than $800 | 0 (0.0%) | 0 (0.0%) |
| $800 to $1,499 | 0 (0.0%) | 0 (0.0%) |
| $800 to $1,499 | 382 (96.5%) | 0 (0.0%) |
| Total | 396 (100.0%) | 1,076 (100.0%) |
Health & Disability in Foxborough
Health Insurance Coverage by Age in Foxborough
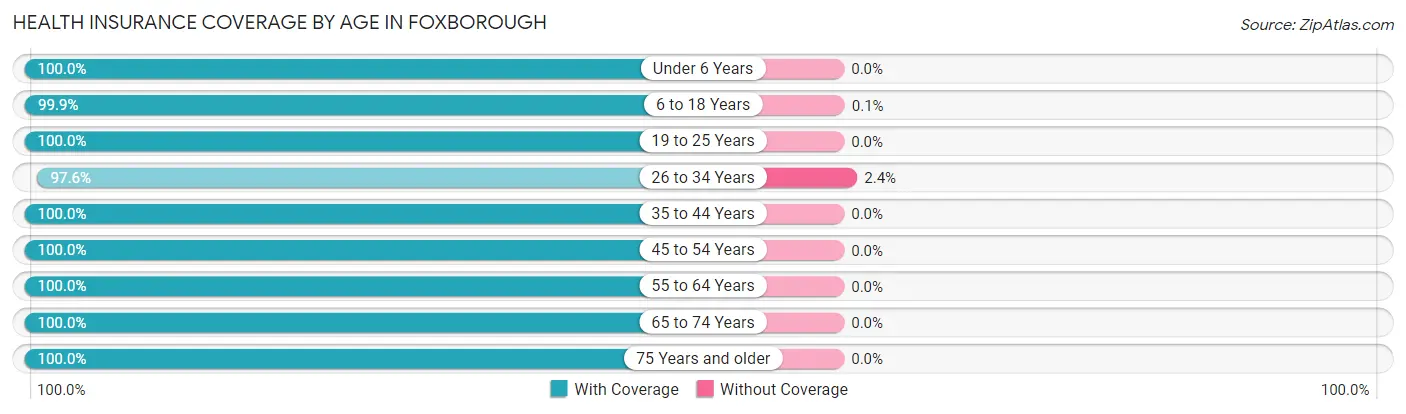
| Age Bracket | With Coverage | Without Coverage |
| Under 6 Years | 400 (100.0%) | 0 (0.0%) |
| 6 to 18 Years | 1,022 (99.9%) | 1 (0.1%) |
| 19 to 25 Years | 439 (100.0%) | 0 (0.0%) |
| 26 to 34 Years | 719 (97.6%) | 18 (2.4%) |
| 35 to 44 Years | 700 (100.0%) | 0 (0.0%) |
| 45 to 54 Years | 991 (100.0%) | 0 (0.0%) |
| 55 to 64 Years | 803 (100.0%) | 0 (0.0%) |
| 65 to 74 Years | 809 (100.0%) | 0 (0.0%) |
| 75 Years and older | 391 (100.0%) | 0 (0.0%) |
| Total | 6,274 (99.7%) | 19 (0.3%) |
Health Insurance Coverage by Citizenship Status in Foxborough
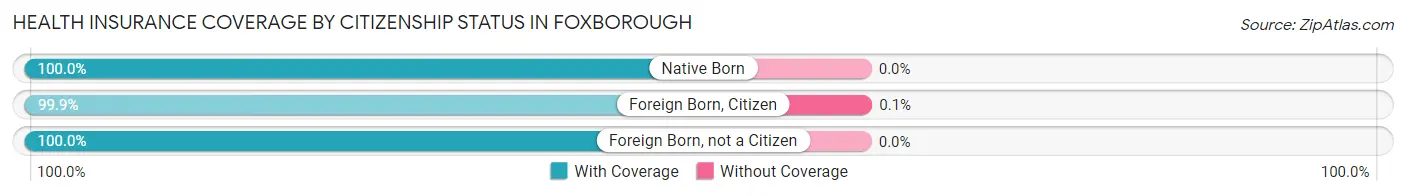
| Citizenship Status | With Coverage | Without Coverage |
| Native Born | 400 (100.0%) | 0 (0.0%) |
| Foreign Born, Citizen | 1,022 (99.9%) | 1 (0.1%) |
| Foreign Born, not a Citizen | 439 (100.0%) | 0 (0.0%) |
Health Insurance Coverage by Household Income in Foxborough
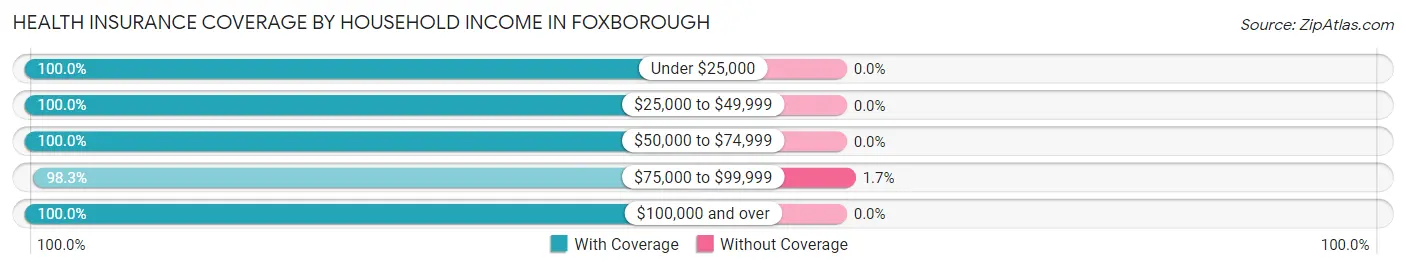
| Household Income | With Coverage | Without Coverage |
| Under $25,000 | 816 (100.0%) | 0 (0.0%) |
| $25,000 to $49,999 | 802 (100.0%) | 0 (0.0%) |
| $50,000 to $74,999 | 577 (100.0%) | 0 (0.0%) |
| $75,000 to $99,999 | 1,061 (98.3%) | 18 (1.7%) |
| $100,000 and over | 3,015 (100.0%) | 0 (0.0%) |
Public vs Private Health Insurance Coverage by Age in Foxborough
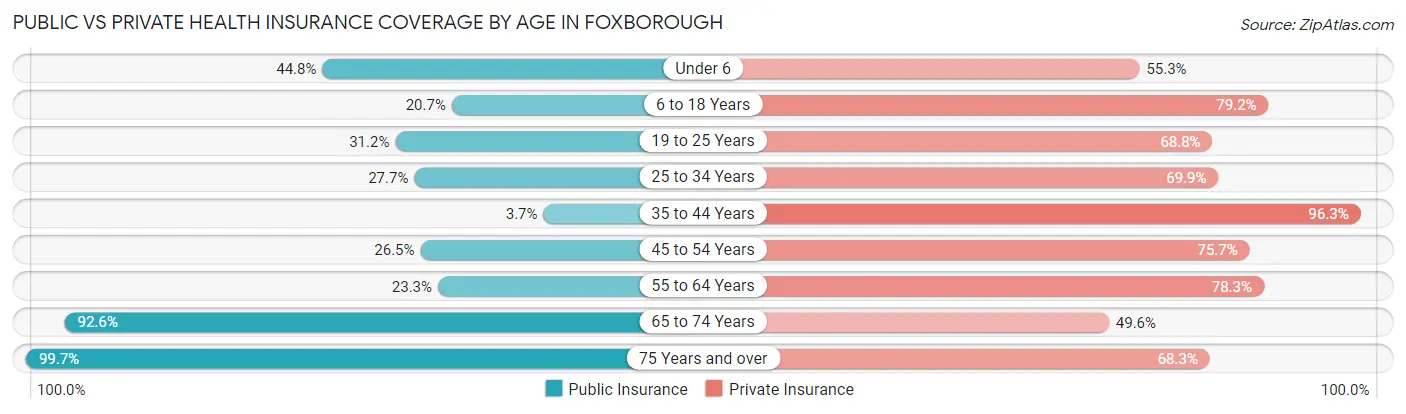
| Age Bracket | Public Insurance | Private Insurance |
| Under 6 | 179 (44.8%) | 221 (55.2%) |
| 6 to 18 Years | 212 (20.7%) | 810 (79.2%) |
| 19 to 25 Years | 137 (31.2%) | 302 (68.8%) |
| 25 to 34 Years | 204 (27.7%) | 515 (69.9%) |
| 35 to 44 Years | 26 (3.7%) | 674 (96.3%) |
| 45 to 54 Years | 263 (26.5%) | 750 (75.7%) |
| 55 to 64 Years | 187 (23.3%) | 629 (78.3%) |
| 65 to 74 Years | 749 (92.6%) | 401 (49.6%) |
| 75 Years and over | 390 (99.7%) | 267 (68.3%) |
| Total | 2,347 (37.3%) | 4,569 (72.6%) |
Disability Status by Sex by Age in Foxborough
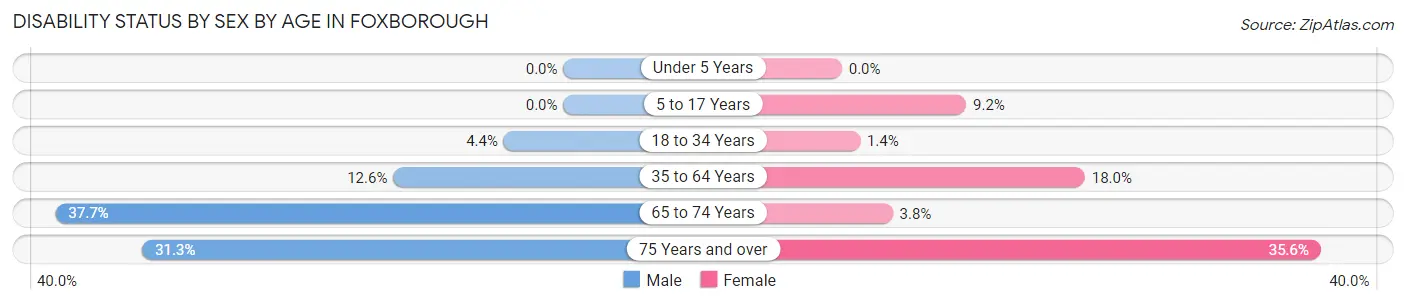
| Age Bracket | Male | Female |
| Under 5 Years | 0 (0.0%) | 0 (0.0%) |
| 5 to 17 Years | 0 (0.0%) | 61 (9.2%) |
| 18 to 34 Years | 18 (4.4%) | 11 (1.3%) |
| 35 to 64 Years | 163 (12.6%) | 217 (18.0%) |
| 65 to 74 Years | 155 (37.7%) | 15 (3.8%) |
| 75 Years and over | 66 (31.3%) | 64 (35.6%) |
Disability Class by Sex by Age in Foxborough
Disability Class: Hearing Difficulty
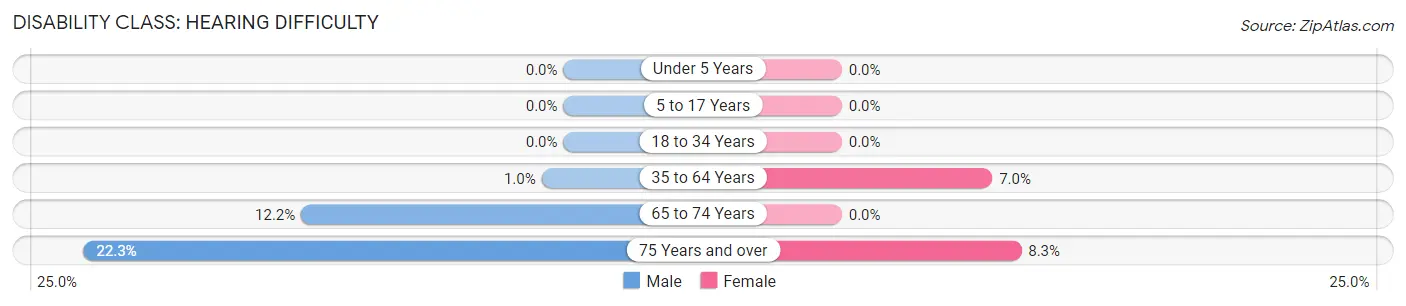
| Age Bracket | Male | Female |
| Under 5 Years | 0 (0.0%) | 0 (0.0%) |
| 5 to 17 Years | 0 (0.0%) | 0 (0.0%) |
| 18 to 34 Years | 0 (0.0%) | 0 (0.0%) |
| 35 to 64 Years | 13 (1.0%) | 84 (7.0%) |
| 65 to 74 Years | 50 (12.2%) | 0 (0.0%) |
| 75 Years and over | 47 (22.3%) | 15 (8.3%) |
Disability Class: Vision Difficulty
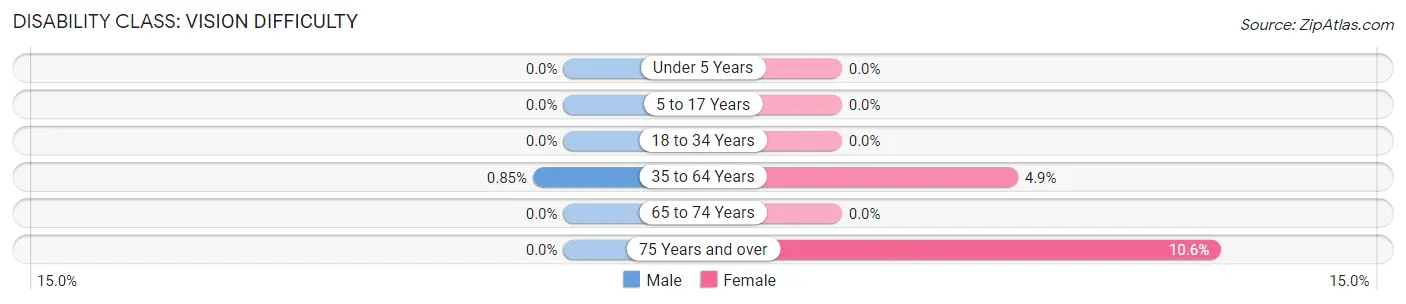
| Age Bracket | Male | Female |
| Under 5 Years | 0 (0.0%) | 0 (0.0%) |
| 5 to 17 Years | 0 (0.0%) | 0 (0.0%) |
| 18 to 34 Years | 0 (0.0%) | 0 (0.0%) |
| 35 to 64 Years | 11 (0.9%) | 59 (4.9%) |
| 65 to 74 Years | 0 (0.0%) | 0 (0.0%) |
| 75 Years and over | 0 (0.0%) | 19 (10.6%) |
Disability Class: Cognitive Difficulty
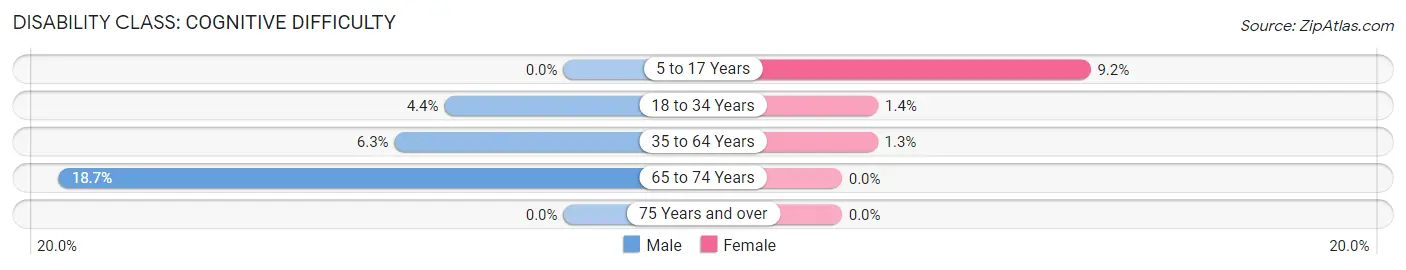
| Age Bracket | Male | Female |
| 5 to 17 Years | 0 (0.0%) | 61 (9.2%) |
| 18 to 34 Years | 18 (4.4%) | 11 (1.3%) |
| 35 to 64 Years | 81 (6.3%) | 16 (1.3%) |
| 65 to 74 Years | 77 (18.7%) | 0 (0.0%) |
| 75 Years and over | 0 (0.0%) | 0 (0.0%) |
Disability Class: Ambulatory Difficulty
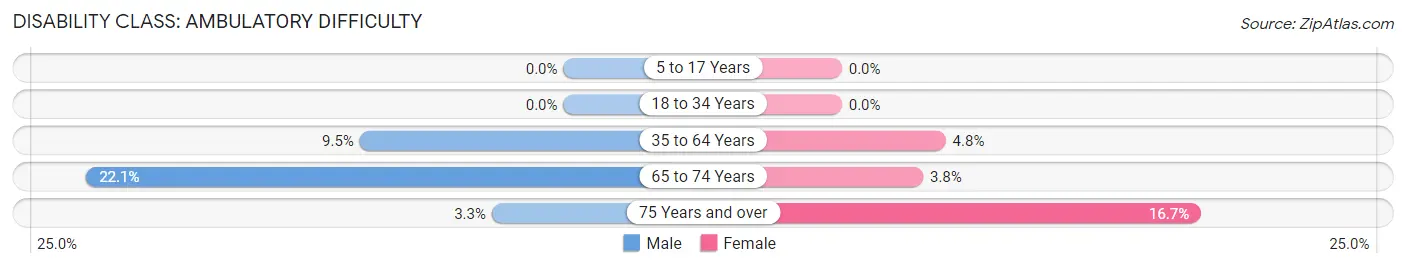
| Age Bracket | Male | Female |
| 5 to 17 Years | 0 (0.0%) | 0 (0.0%) |
| 18 to 34 Years | 0 (0.0%) | 0 (0.0%) |
| 35 to 64 Years | 122 (9.5%) | 58 (4.8%) |
| 65 to 74 Years | 91 (22.1%) | 15 (3.8%) |
| 75 Years and over | 7 (3.3%) | 30 (16.7%) |
Disability Class: Self-Care Difficulty
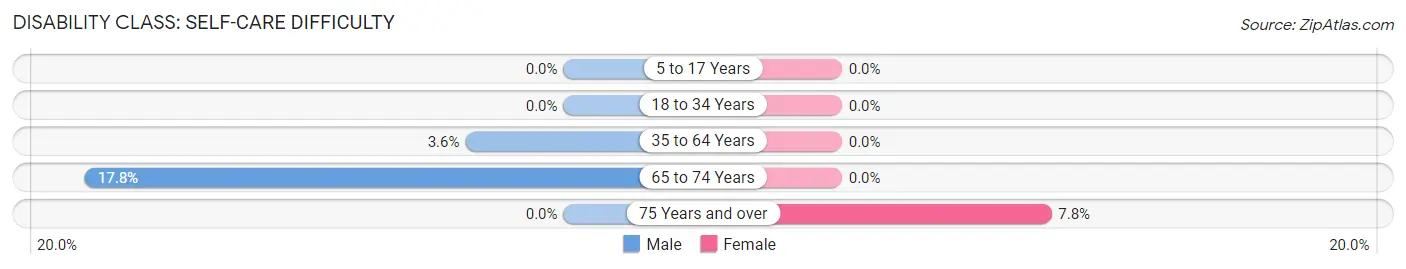
| Age Bracket | Male | Female |
| 5 to 17 Years | 0 (0.0%) | 0 (0.0%) |
| 18 to 34 Years | 0 (0.0%) | 0 (0.0%) |
| 35 to 64 Years | 47 (3.6%) | 0 (0.0%) |
| 65 to 74 Years | 73 (17.8%) | 0 (0.0%) |
| 75 Years and over | 0 (0.0%) | 14 (7.8%) |
Technology Access in Foxborough
Computing Device Access in Foxborough
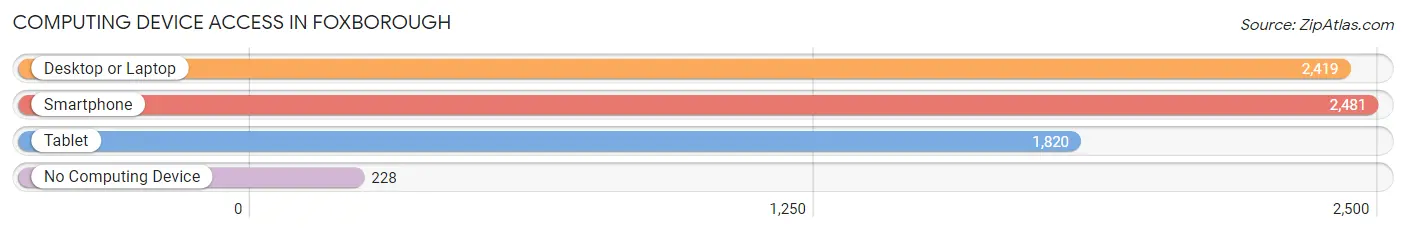
| Device Type | # Households | % Households |
| Desktop or Laptop | 2,419 | 83.9% |
| Smartphone | 2,481 | 86.1% |
| Tablet | 1,820 | 63.1% |
| No Computing Device | 228 | 7.9% |
| Total | 2,883 | 100.0% |
Internet Access in Foxborough
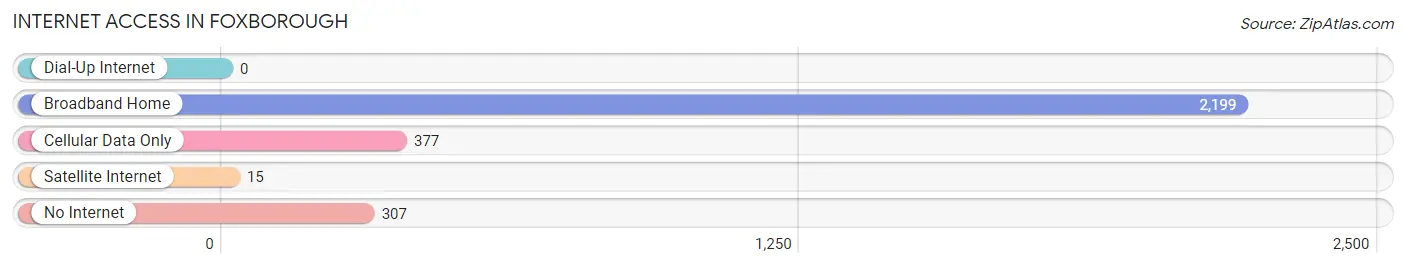
| Internet Type | # Households | % Households |
| Dial-Up Internet | 0 | 0.0% |
| Broadband Home | 2,199 | 76.3% |
| Cellular Data Only | 377 | 13.1% |
| Satellite Internet | 15 | 0.5% |
| No Internet | 307 | 10.6% |
| Total | 2,883 | 100.0% |
Foxborough Summary
Foxborough, Massachusetts is a town located in Norfolk County, Massachusetts, United States. It is part of the Greater Boston metropolitan area. The town was incorporated in 1778 and is home to the New England Patriots of the National Football League.
History
The area that is now Foxborough was first settled in 1694 by Europeans. The town was originally part of the town of Dedham, Massachusetts. In 1778, the town of Foxborough was officially incorporated. The town was named after Charles Fox, a British statesman.
The town was primarily an agricultural community until the mid-19th century. In 1873, the Foxborough State Normal School was established, which later became the Foxborough State Teachers College. The college was closed in 1972.
In 1971, Foxborough was chosen as the site of the New England Patriots football stadium. The stadium, now known as Gillette Stadium, opened in 2002 and is home to the Patriots.
Geography
Foxborough is located in Norfolk County, Massachusetts. It is bordered by the towns of Wrentham, Plainville, Mansfield, and Sharon. The town has a total area of 20.3 square miles, of which 19.9 square miles is land and 0.4 square miles is water.
The town is located in the southeastern part of Massachusetts, about 25 miles southwest of Boston. The town is located in the Charles River watershed. The town is located in the humid continental climate zone, with cold winters and hot, humid summers.
Economy
The economy of Foxborough is largely based on tourism and retail. The town is home to Gillette Stadium, which hosts the New England Patriots and other events. The stadium is a major source of revenue for the town.
The town is also home to several retail outlets, including Patriot Place, a shopping and entertainment complex adjacent to Gillette Stadium. The town is also home to several corporate headquarters, including Reebok, Hasbro, and Gillette.
Demographics
As of the 2010 census, the town had a population of 16,865. The racial makeup of the town was 94.2% White, 1.7% African American, 0.3% Native American, 1.9% Asian, 0.1% Pacific Islander, 0.7% from other races, and 1.2% from two or more races. Hispanic or Latino of any race were 2.5% of the population.
The median household income in the town was $87,837, and the median family income was $103,945. The per capita income for the town was $41,945. About 2.7% of families and 3.7% of the population were below the poverty line.
Common Questions
What is Per Capita Income in Foxborough?
Per Capita income in Foxborough is $56,635.
What is the Median Family Income in Foxborough?
Median Family Income in Foxborough is $100,089.
What is the Median Household income in Foxborough?
Median Household Income in Foxborough is $71,340.
What is Income or Wage Gap in Foxborough?
Income or Wage Gap in Foxborough is 47.0%.
Women in Foxborough earn 53.0 cents for every dollar earned by a man.
What is Inequality or Gini Index in Foxborough?
Inequality or Gini Index in Foxborough is 0.60.
What is the Total Population of Foxborough?
Total Population of Foxborough is 6,312.
What is the Total Male Population of Foxborough?
Total Male Population of Foxborough is 2,847.
What is the Total Female Population of Foxborough?
Total Female Population of Foxborough is 3,465.
What is the Ratio of Males per 100 Females in Foxborough?
There are 82.16 Males per 100 Females in Foxborough.
What is the Ratio of Females per 100 Males in Foxborough?
There are 121.71 Females per 100 Males in Foxborough.
What is the Median Population Age in Foxborough?
Median Population Age in Foxborough is 42.7 Years.
What is the Average Family Size in Foxborough
Average Family Size in Foxborough is 3.2 People.
What is the Average Household Size in Foxborough
Average Household Size in Foxborough is 2.2 People.
How Large is the Labor Force in Foxborough?
There are 3,326 People in the Labor Forcein in Foxborough.
What is the Percentage of People in the Labor Force in Foxborough?
65.7% of People are in the Labor Force in Foxborough.
What is the Unemployment Rate in Foxborough?
Unemployment Rate in Foxborough is 3.4%.