Cochituate, MA Map & Demographics
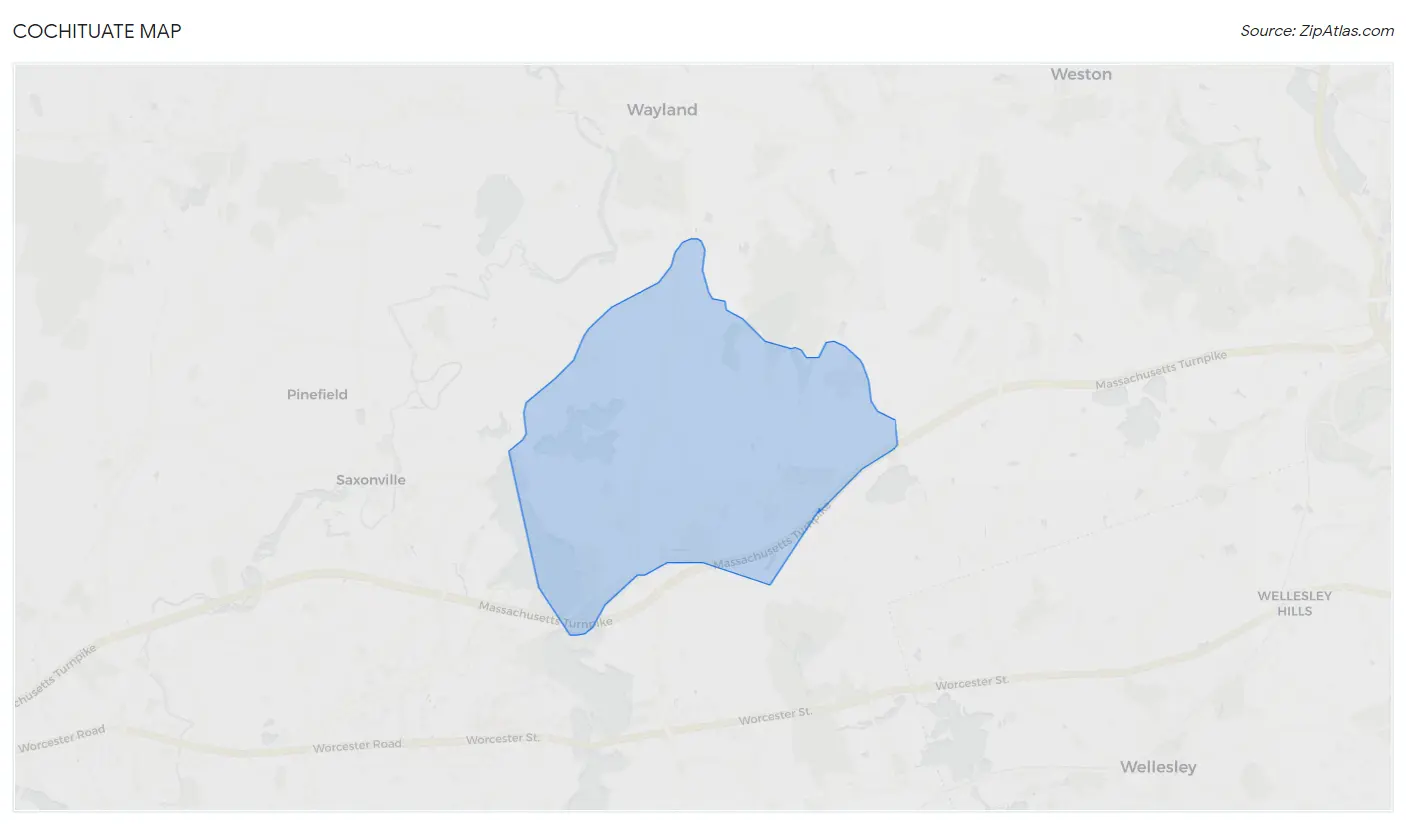
Cochituate Map
Cochituate Overview
$83,410
PER CAPITA INCOME
$235,603
AVG FAMILY INCOME
$181,494
AVG HOUSEHOLD INCOME
49.8%
WAGE / INCOME GAP [ % ]
50.2¢/ $1
WAGE / INCOME GAP [ $ ]
$5,919
FAMILY INCOME DEFICIT
0.41
INEQUALITY / GINI INDEX
6,937
TOTAL POPULATION
3,552
MALE POPULATION
3,385
FEMALE POPULATION
104.93
MALES / 100 FEMALES
95.30
FEMALES / 100 MALES
43.7
MEDIAN AGE
3.1
AVG FAMILY SIZE
2.8
AVG HOUSEHOLD SIZE
3,533
LABOR FORCE [ PEOPLE ]
64.9%
PERCENT IN LABOR FORCE
2.7%
UNEMPLOYMENT RATE
Income in Cochituate
Income Overview in Cochituate
Per Capita Income in Cochituate is $83,410, while median incomes of families and households are $235,603 and $181,494 respectively.
| Characteristic | Number | Measure |
| Per Capita Income | 6,937 | $83,410 |
| Median Family Income | 1,926 | $235,603 |
| Mean Family Income | 1,926 | $273,056 |
| Median Household Income | 2,469 | $181,494 |
| Mean Household Income | 2,469 | $236,833 |
| Income Deficit | 1,926 | $5,919 |
| Wage / Income Gap (%) | 6,937 | 49.79% |
| Wage / Income Gap ($) | 6,937 | 50.21¢ per $1 |
| Gini / Inequality Index | 6,937 | 0.41 |
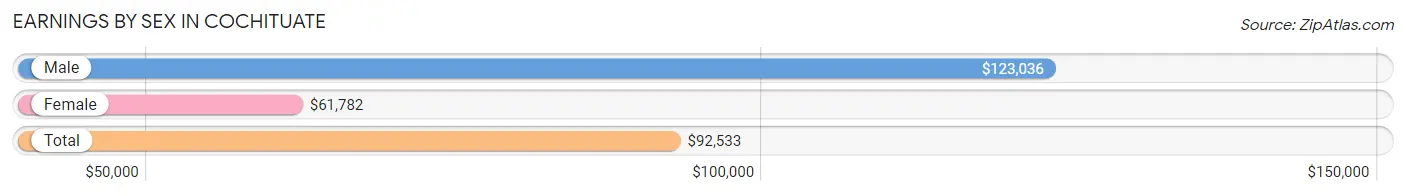
Earnings by Sex in Cochituate
Average Earnings in Cochituate are $92,533, $123,036 for men and $61,782 for women, a difference of 49.8%.
| Sex | Number | Average Earnings |
| Male | 2,091 (53.7%) | $123,036 |
| Female | 1,803 (46.3%) | $61,782 |
| Total | 3,894 (100.0%) | $92,533 |
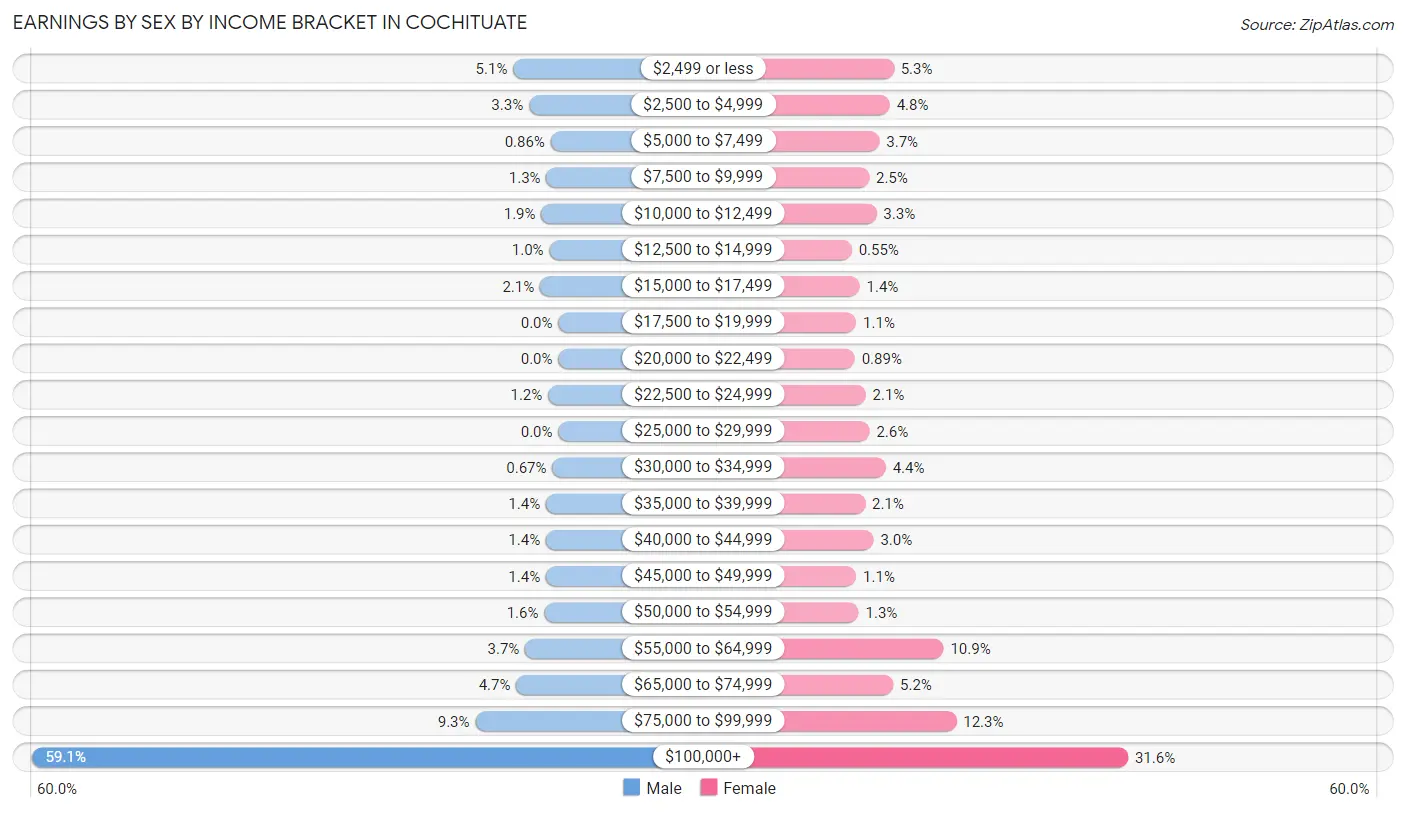
Earnings by Sex by Income Bracket in Cochituate
The most common earnings brackets in Cochituate are $100,000+ for men (1,236 | 59.1%) and $100,000+ for women (570 | 31.6%).
| Income | Male | Female |
| $2,499 or less | 106 (5.1%) | 95 (5.3%) |
| $2,500 to $4,999 | 69 (3.3%) | 87 (4.8%) |
| $5,000 to $7,499 | 18 (0.9%) | 66 (3.7%) |
| $7,500 to $9,999 | 28 (1.3%) | 45 (2.5%) |
| $10,000 to $12,499 | 40 (1.9%) | 60 (3.3%) |
| $12,500 to $14,999 | 21 (1.0%) | 10 (0.5%) |
| $15,000 to $17,499 | 43 (2.1%) | 26 (1.4%) |
| $17,500 to $19,999 | 0 (0.0%) | 19 (1.1%) |
| $20,000 to $22,499 | 0 (0.0%) | 16 (0.9%) |
| $22,500 to $24,999 | 24 (1.1%) | 38 (2.1%) |
| $25,000 to $29,999 | 0 (0.0%) | 46 (2.5%) |
| $30,000 to $34,999 | 14 (0.7%) | 79 (4.4%) |
| $35,000 to $39,999 | 29 (1.4%) | 37 (2.1%) |
| $40,000 to $44,999 | 29 (1.4%) | 54 (3.0%) |
| $45,000 to $49,999 | 29 (1.4%) | 19 (1.1%) |
| $50,000 to $54,999 | 33 (1.6%) | 24 (1.3%) |
| $55,000 to $64,999 | 78 (3.7%) | 196 (10.9%) |
| $65,000 to $74,999 | 99 (4.7%) | 94 (5.2%) |
| $75,000 to $99,999 | 195 (9.3%) | 222 (12.3%) |
| $100,000+ | 1,236 (59.1%) | 570 (31.6%) |
| Total | 2,091 (100.0%) | 1,803 (100.0%) |
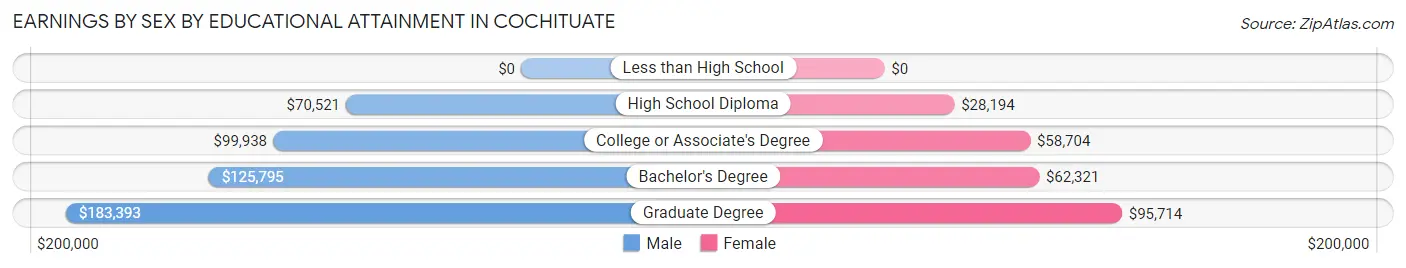
Earnings by Sex by Educational Attainment in Cochituate
Average earnings in Cochituate are $139,034 for men and $74,830 for women, a difference of 46.2%. Men with an educational attainment of graduate degree enjoy the highest average annual earnings of $183,393, while those with high school diploma education earn the least with $70,521. Women with an educational attainment of graduate degree earn the most with the average annual earnings of $95,714, while those with high school diploma education have the smallest earnings of $28,194.
| Educational Attainment | Male Income | Female Income |
| Less than High School | - | - |
| High School Diploma | $70,521 | $28,194 |
| College or Associate's Degree | $99,938 | $58,704 |
| Bachelor's Degree | $125,795 | $62,321 |
| Graduate Degree | $183,393 | $95,714 |
| Total | $139,034 | $74,830 |
Family Income in Cochituate
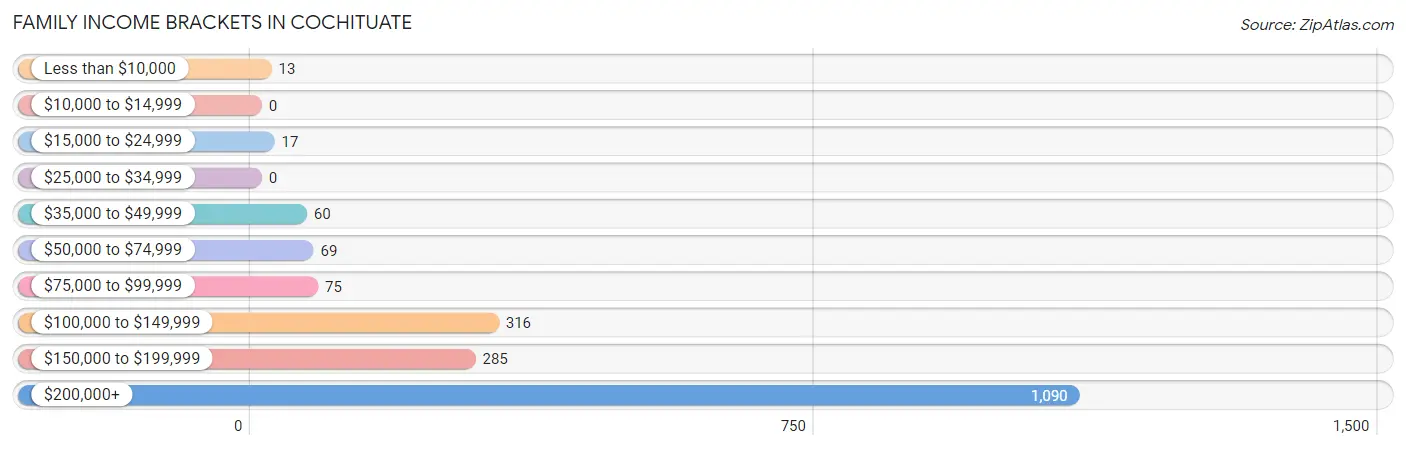
Family Income Brackets in Cochituate
According to the Cochituate family income data, there are 1,090 families falling into the $200,000+ income range, which is the most common income bracket and makes up 56.6% of all families.
| Income Bracket | # Families | % Families |
| Less than $10,000 | 13 | 0.7% |
| $10,000 to $14,999 | 0 | 0.0% |
| $15,000 to $24,999 | 17 | 0.9% |
| $25,000 to $34,999 | 0 | 0.0% |
| $35,000 to $49,999 | 60 | 3.1% |
| $50,000 to $74,999 | 69 | 3.6% |
| $75,000 to $99,999 | 75 | 3.9% |
| $100,000 to $149,999 | 316 | 16.4% |
| $150,000 to $199,999 | 285 | 14.8% |
| $200,000+ | 1,090 | 56.6% |
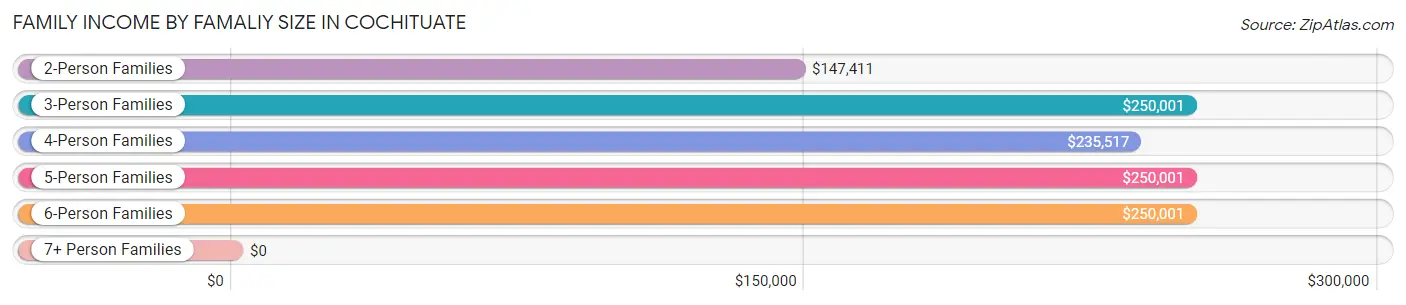
Family Income by Famaliy Size in Cochituate
3-person families (467 | 24.2%) account for the highest median family income in Cochituate with $250,001 per family, while 3-person families (467 | 24.2%) have the highest median income of $83,334 per family member.
| Income Bracket | # Families | Median Income |
| 2-Person Families | 705 (36.6%) | $147,411 |
| 3-Person Families | 467 (24.2%) | $250,001 |
| 4-Person Families | 510 (26.5%) | $235,517 |
| 5-Person Families | 172 (8.9%) | $250,001 |
| 6-Person Families | 60 (3.1%) | $250,001 |
| 7+ Person Families | 12 (0.6%) | $0 |
| Total | 1,926 (100.0%) | $235,603 |
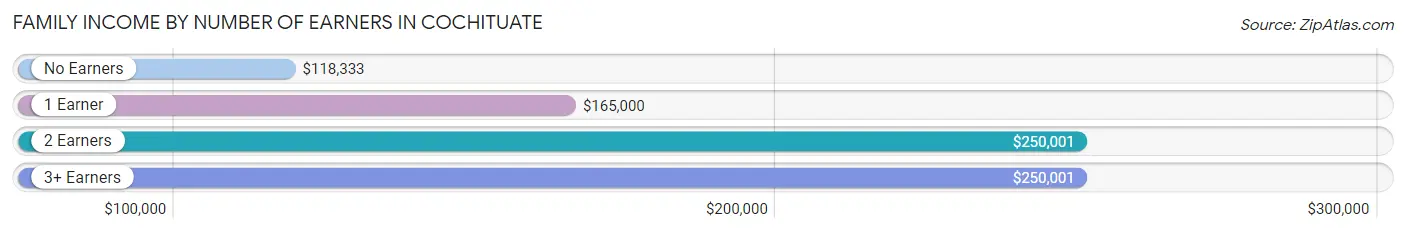
Family Income by Number of Earners in Cochituate
The median family income in Cochituate is $235,603, with families comprising 2 earners (910) having the highest median family income of $250,001, while families with no earners (170) have the lowest median family income of $118,333, accounting for 47.2% and 8.8% of families, respectively.
| Number of Earners | # Families | Median Income |
| No Earners | 170 (8.8%) | $118,333 |
| 1 Earner | 516 (26.8%) | $165,000 |
| 2 Earners | 910 (47.2%) | $250,001 |
| 3+ Earners | 330 (17.1%) | $250,001 |
| Total | 1,926 (100.0%) | $235,603 |
Household Income in Cochituate
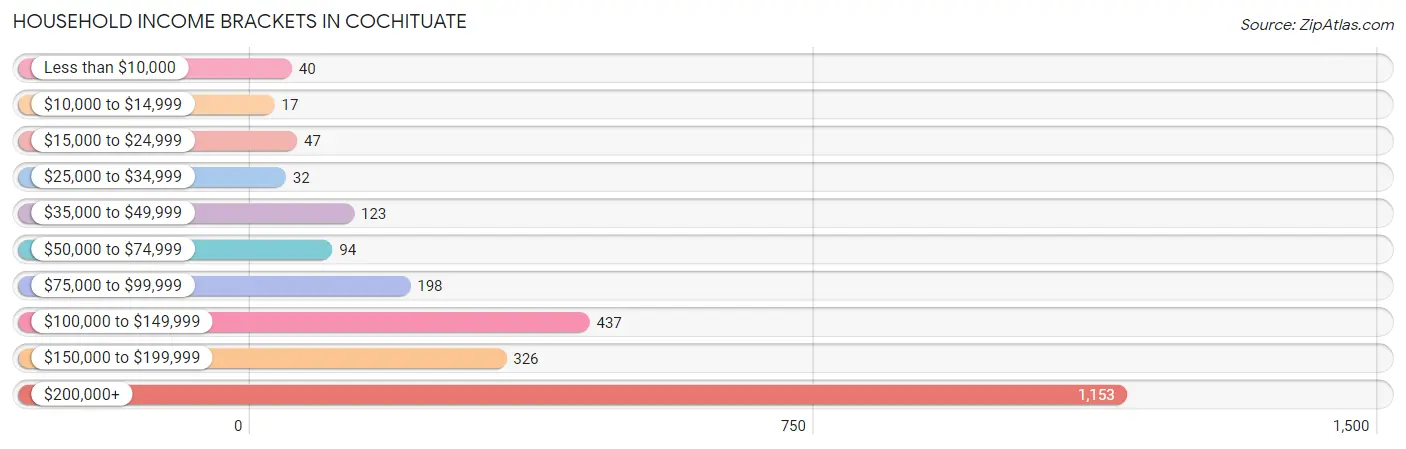
Household Income Brackets in Cochituate
With 1,153 households falling in the category, the $200,000+ income range is the most frequent in Cochituate, accounting for 46.7% of all households. In contrast, only 17 households (0.7%) fall into the $10,000 to $14,999 income bracket, making it the least populous group.
| Income Bracket | # Households | % Households |
| Less than $10,000 | 40 | 1.6% |
| $10,000 to $14,999 | 17 | 0.7% |
| $15,000 to $24,999 | 47 | 1.9% |
| $25,000 to $34,999 | 32 | 1.3% |
| $35,000 to $49,999 | 123 | 5.0% |
| $50,000 to $74,999 | 94 | 3.8% |
| $75,000 to $99,999 | 198 | 8.0% |
| $100,000 to $149,999 | 437 | 17.7% |
| $150,000 to $199,999 | 326 | 13.2% |
| $200,000+ | 1,153 | 46.7% |
Household Income by Householder Age in Cochituate
The median household income in Cochituate is $181,494, with the highest median household income of $250,001 found in the 25 to 44 years age bracket for the primary householder. A total of 637 households (25.8%) fall into this category.
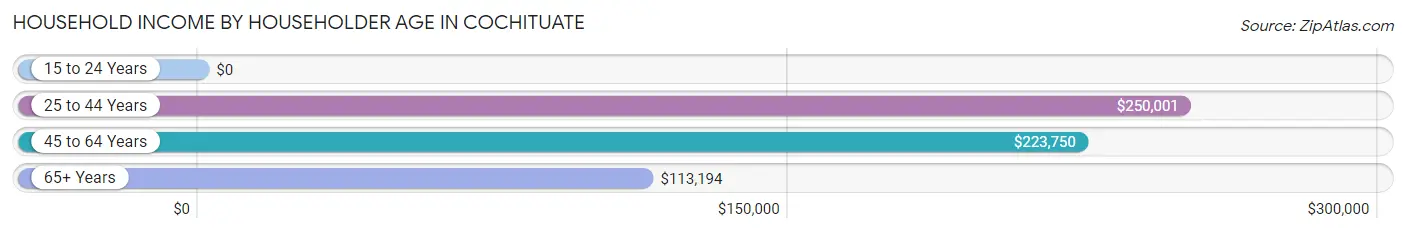
| Income Bracket | # Households | Median Income |
| 15 to 24 Years | 0 (0.0%) | $0 |
| 25 to 44 Years | 637 (25.8%) | $250,001 |
| 45 to 64 Years | 1,101 (44.6%) | $223,750 |
| 65+ Years | 731 (29.6%) | $113,194 |
| Total | 2,469 (100.0%) | $181,494 |
Poverty in Cochituate
Income Below Poverty by Sex and Age in Cochituate
With 3.7% poverty level for males and 2.8% for females among the residents of Cochituate, 16 and 17 year old males and under 5 year old females are the most vulnerable to poverty, with 11 males (22.0%) and 11 females (13.4%) in their respective age groups living below the poverty level.
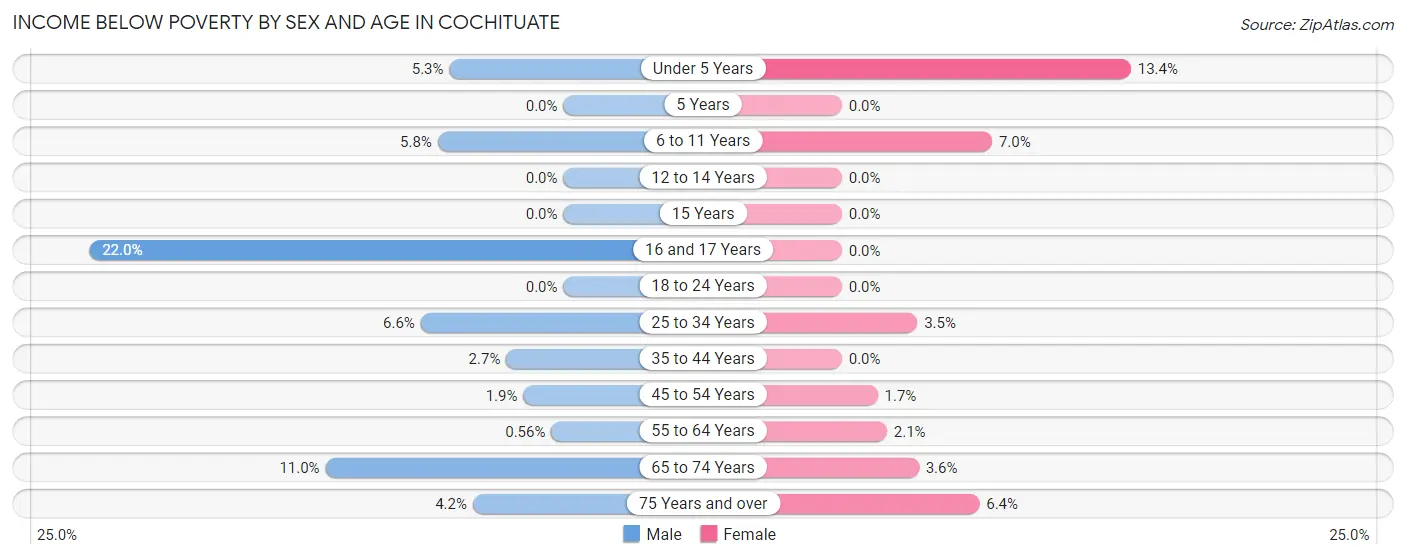
| Age Bracket | Male | Female |
| Under 5 Years | 11 (5.3%) | 11 (13.4%) |
| 5 Years | 0 (0.0%) | 0 (0.0%) |
| 6 to 11 Years | 20 (5.8%) | 20 (7.0%) |
| 12 to 14 Years | 0 (0.0%) | 0 (0.0%) |
| 15 Years | 0 (0.0%) | 0 (0.0%) |
| 16 and 17 Years | 11 (22.0%) | 0 (0.0%) |
| 18 to 24 Years | 0 (0.0%) | 0 (0.0%) |
| 25 to 34 Years | 19 (6.6%) | 11 (3.5%) |
| 35 to 44 Years | 12 (2.6%) | 0 (0.0%) |
| 45 to 54 Years | 9 (1.9%) | 7 (1.7%) |
| 55 to 64 Years | 3 (0.6%) | 12 (2.1%) |
| 65 to 74 Years | 36 (11.0%) | 13 (3.6%) |
| 75 Years and over | 10 (4.2%) | 21 (6.4%) |
| Total | 131 (3.7%) | 95 (2.8%) |
Income Above Poverty by Sex and Age in Cochituate
According to the poverty statistics in Cochituate, males aged 5 years and females aged 5 years are the age groups that are most secure financially, with 100.0% of males and 100.0% of females in these age groups living above the poverty line.
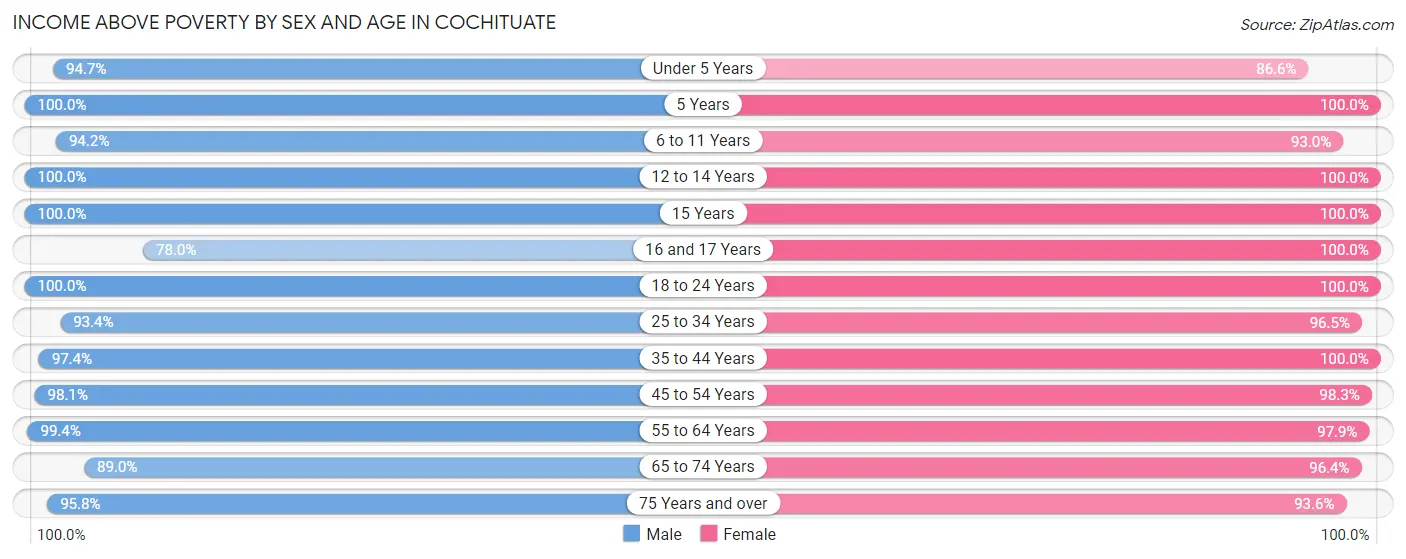
| Age Bracket | Male | Female |
| Under 5 Years | 197 (94.7%) | 71 (86.6%) |
| 5 Years | 70 (100.0%) | 53 (100.0%) |
| 6 to 11 Years | 323 (94.2%) | 267 (93.0%) |
| 12 to 14 Years | 168 (100.0%) | 160 (100.0%) |
| 15 Years | 51 (100.0%) | 39 (100.0%) |
| 16 and 17 Years | 39 (78.0%) | 129 (100.0%) |
| 18 to 24 Years | 288 (100.0%) | 188 (100.0%) |
| 25 to 34 Years | 268 (93.4%) | 303 (96.5%) |
| 35 to 44 Years | 441 (97.4%) | 426 (100.0%) |
| 45 to 54 Years | 475 (98.1%) | 414 (98.3%) |
| 55 to 64 Years | 537 (99.4%) | 563 (97.9%) |
| 65 to 74 Years | 290 (89.0%) | 351 (96.4%) |
| 75 Years and over | 228 (95.8%) | 308 (93.6%) |
| Total | 3,375 (96.3%) | 3,272 (97.2%) |
Income Below Poverty Among Married-Couple Families in Cochituate
The poverty statistics for married-couple families in Cochituate show that 2.4% or 43 of the total 1,760 families live below the poverty line. Families with 5 or more children have the highest poverty rate of 100.0%, comprising of 12 families. On the other hand, families with 3 or 4 children have the lowest poverty rate of 0.0%, which includes 0 families.
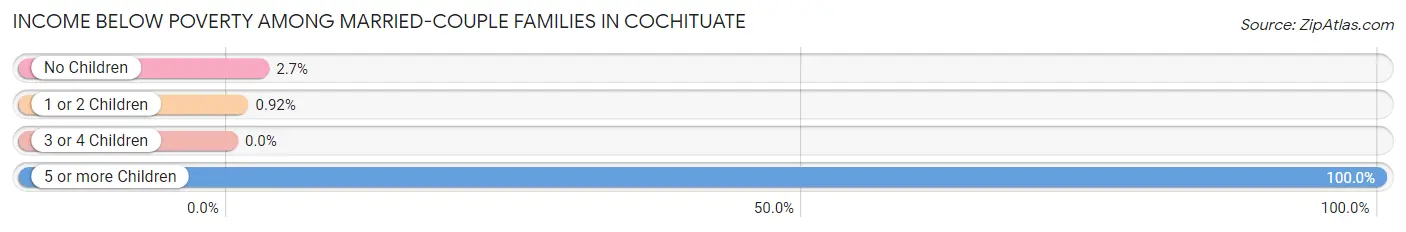
| Children | Above Poverty | Below Poverty |
| No Children | 858 (97.3%) | 24 (2.7%) |
| 1 or 2 Children | 758 (99.1%) | 7 (0.9%) |
| 3 or 4 Children | 101 (100.0%) | 0 (0.0%) |
| 5 or more Children | 0 (0.0%) | 12 (100.0%) |
| Total | 1,717 (97.6%) | 43 (2.4%) |
Income Below Poverty Among Single-Parent Households in Cochituate
| Children | Single Father | Single Mother |
| No Children | 0 (0.0%) | 0 (0.0%) |
| 1 or 2 Children | 0 (0.0%) | 0 (0.0%) |
| 3 or 4 Children | 0 (0.0%) | 0 (0.0%) |
| 5 or more Children | 0 (0.0%) | 0 (0.0%) |
| Total | 0 (0.0%) | 0 (0.0%) |
Income Below Poverty Among Married-Couple vs Single-Parent Households in Cochituate
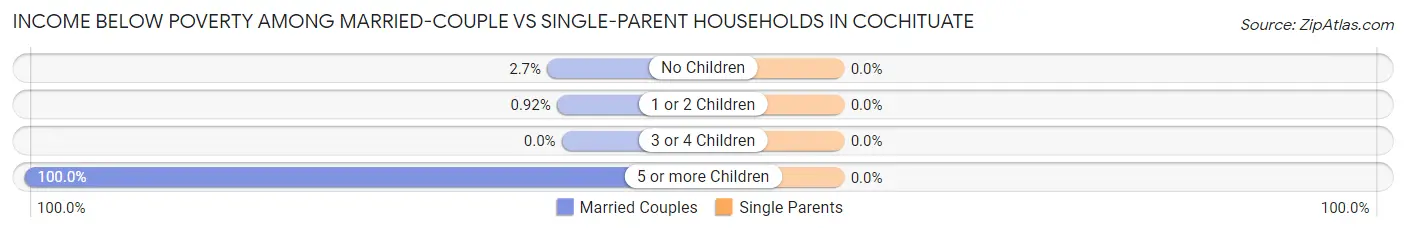
| Children | Married-Couple Families | Single-Parent Households |
| No Children | 24 (2.7%) | 0 (0.0%) |
| 1 or 2 Children | 7 (0.9%) | 0 (0.0%) |
| 3 or 4 Children | 0 (0.0%) | 0 (0.0%) |
| 5 or more Children | 12 (100.0%) | 0 (0.0%) |
| Total | 43 (2.4%) | 0 (0.0%) |
Race in Cochituate
The most populous races in Cochituate are White / Caucasian (5,597 | 80.7%), Asian (970 | 14.0%), and Hispanic or Latino (431 | 6.2%).
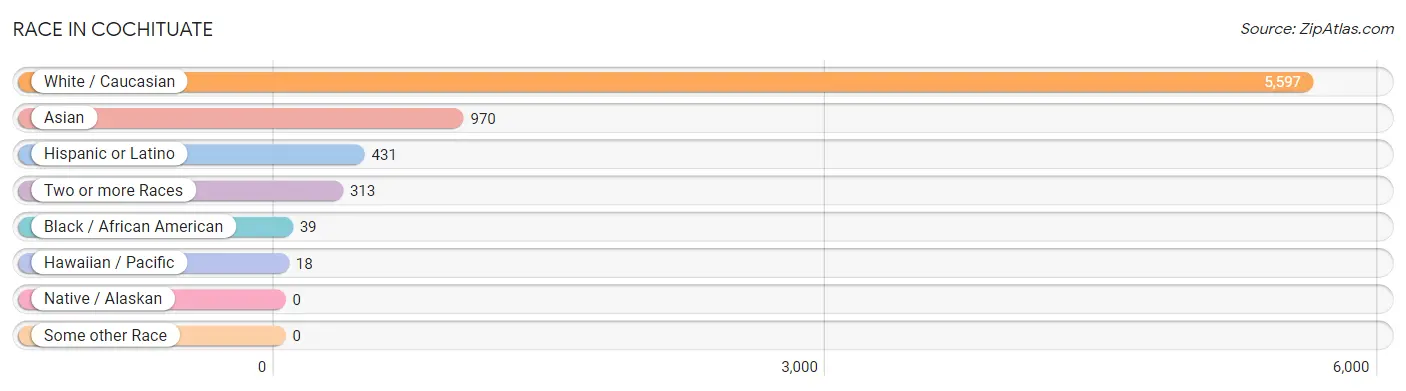
| Race | # Population | % Population |
| Asian | 970 | 14.0% |
| Black / African American | 39 | 0.6% |
| Hawaiian / Pacific | 18 | 0.3% |
| Hispanic or Latino | 431 | 6.2% |
| Native / Alaskan | 0 | 0.0% |
| White / Caucasian | 5,597 | 80.7% |
| Two or more Races | 313 | 4.5% |
| Some other Race | 0 | 0.0% |
| Total | 6,937 | 100.0% |
Ancestry in Cochituate
The most populous ancestries reported in Cochituate are Irish (1,219 | 17.6%), English (875 | 12.6%), Italian (755 | 10.9%), German (747 | 10.8%), and Indian (Asian) (590 | 8.5%), together accounting for 60.3% of all Cochituate residents.
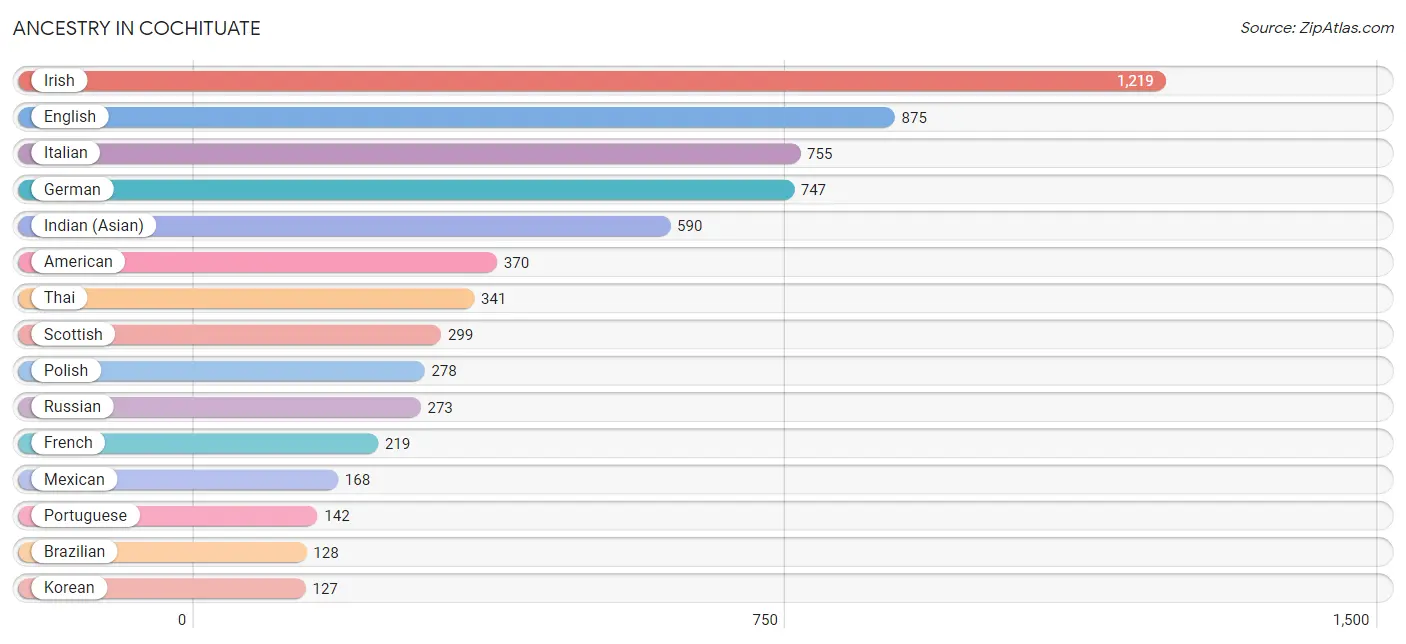
| Ancestry | # Population | % Population |
| American | 370 | 5.3% |
| Arab | 70 | 1.0% |
| Armenian | 37 | 0.5% |
| Austrian | 17 | 0.3% |
| Brazilian | 128 | 1.8% |
| British | 19 | 0.3% |
| Bulgarian | 29 | 0.4% |
| Burmese | 64 | 0.9% |
| Canadian | 9 | 0.1% |
| Central American | 53 | 0.8% |
| Chilean | 102 | 1.5% |
| Croatian | 28 | 0.4% |
| Cuban | 17 | 0.3% |
| Danish | 44 | 0.6% |
| Dutch | 45 | 0.6% |
| Eastern European | 78 | 1.1% |
| Ecuadorian | 21 | 0.3% |
| Egyptian | 34 | 0.5% |
| English | 875 | 12.6% |
| European | 85 | 1.2% |
| Filipino | 21 | 0.3% |
| Finnish | 16 | 0.2% |
| French | 219 | 3.2% |
| French Canadian | 89 | 1.3% |
| German | 747 | 10.8% |
| Ghanaian | 32 | 0.5% |
| Greek | 26 | 0.4% |
| Guatemalan | 53 | 0.8% |
| Hungarian | 34 | 0.5% |
| Indian (Asian) | 590 | 8.5% |
| Iraqi | 31 | 0.4% |
| Irish | 1,219 | 17.6% |
| Italian | 755 | 10.9% |
| Korean | 127 | 1.8% |
| Lithuanian | 68 | 1.0% |
| Mexican | 168 | 2.4% |
| Northern European | 6 | 0.1% |
| Norwegian | 23 | 0.3% |
| Pakistani | 17 | 0.3% |
| Palestinian | 5 | 0.1% |
| Polish | 278 | 4.0% |
| Portuguese | 142 | 2.1% |
| Puerto Rican | 43 | 0.6% |
| Romanian | 33 | 0.5% |
| Russian | 273 | 3.9% |
| Scandinavian | 19 | 0.3% |
| Scotch-Irish | 22 | 0.3% |
| Scottish | 299 | 4.3% |
| Slovene | 53 | 0.8% |
| South American | 123 | 1.8% |
| Spaniard | 27 | 0.4% |
| Subsaharan African | 32 | 0.5% |
| Swedish | 104 | 1.5% |
| Thai | 341 | 4.9% |
| Turkish | 10 | 0.1% |
| Ukrainian | 63 | 0.9% | View All 56 Rows |
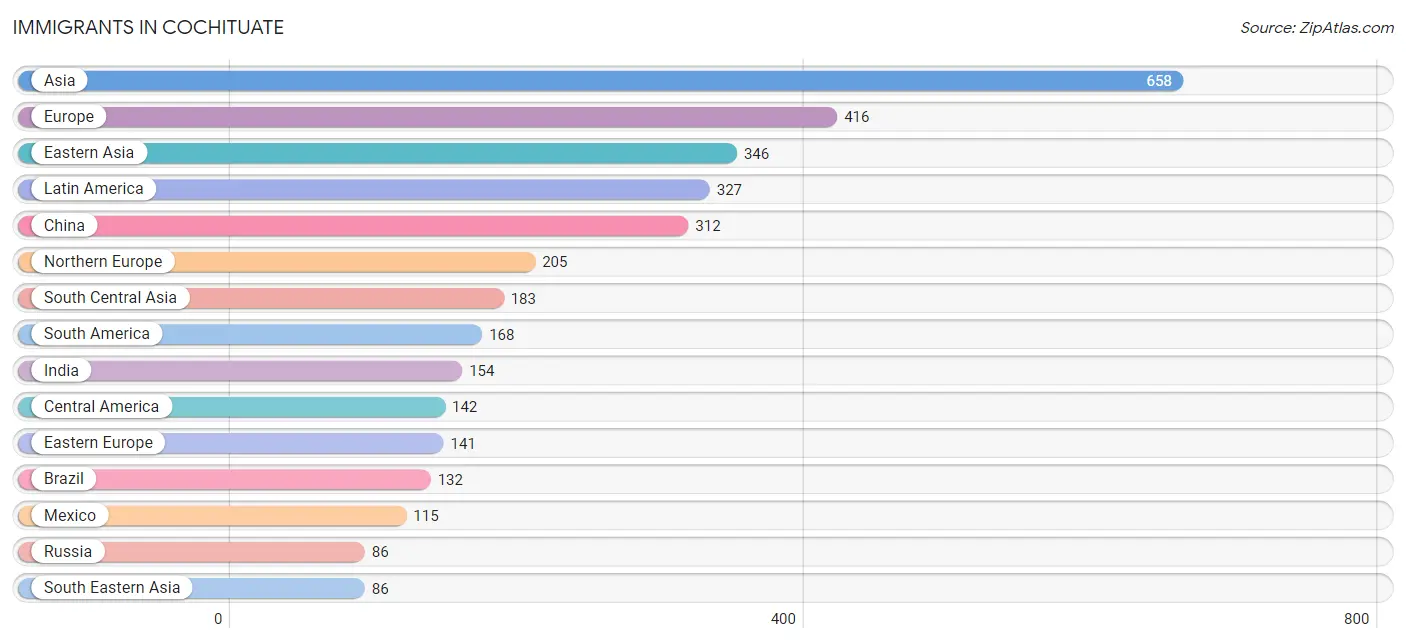
Immigrants in Cochituate
The most numerous immigrant groups reported in Cochituate came from Asia (658 | 9.5%), Europe (416 | 6.0%), Eastern Asia (346 | 5.0%), Latin America (327 | 4.7%), and China (312 | 4.5%), together accounting for 29.7% of all Cochituate residents.
| Immigration Origin | # Population | % Population |
| Africa | 44 | 0.6% |
| Asia | 658 | 9.5% |
| Bangladesh | 29 | 0.4% |
| Brazil | 132 | 1.9% |
| Bulgaria | 29 | 0.4% |
| Canada | 33 | 0.5% |
| Caribbean | 17 | 0.3% |
| Central America | 142 | 2.1% |
| Chile | 36 | 0.5% |
| China | 312 | 4.5% |
| Cuba | 17 | 0.3% |
| Czechoslovakia | 8 | 0.1% |
| Eastern Asia | 346 | 5.0% |
| Eastern Europe | 141 | 2.0% |
| Egypt | 34 | 0.5% |
| England | 41 | 0.6% |
| Europe | 416 | 6.0% |
| France | 34 | 0.5% |
| Germany | 27 | 0.4% |
| Ghana | 10 | 0.1% |
| Greece | 9 | 0.1% |
| Guatemala | 27 | 0.4% |
| Hong Kong | 41 | 0.6% |
| India | 154 | 2.2% |
| Ireland | 65 | 0.9% |
| Israel | 32 | 0.5% |
| Korea | 34 | 0.5% |
| Latin America | 327 | 4.7% |
| Mexico | 115 | 1.7% |
| Northern Africa | 34 | 0.5% |
| Northern Europe | 205 | 3.0% |
| Oceania | 18 | 0.3% |
| Philippines | 77 | 1.1% |
| Poland | 6 | 0.1% |
| Russia | 86 | 1.2% |
| South America | 168 | 2.4% |
| South Central Asia | 183 | 2.6% |
| South Eastern Asia | 86 | 1.2% |
| Southern Europe | 9 | 0.1% |
| Taiwan | 11 | 0.2% |
| Thailand | 9 | 0.1% |
| Turkey | 11 | 0.2% |
| Ukraine | 12 | 0.2% |
| Western Africa | 10 | 0.1% |
| Western Asia | 43 | 0.6% |
| Western Europe | 61 | 0.9% | View All 46 Rows |
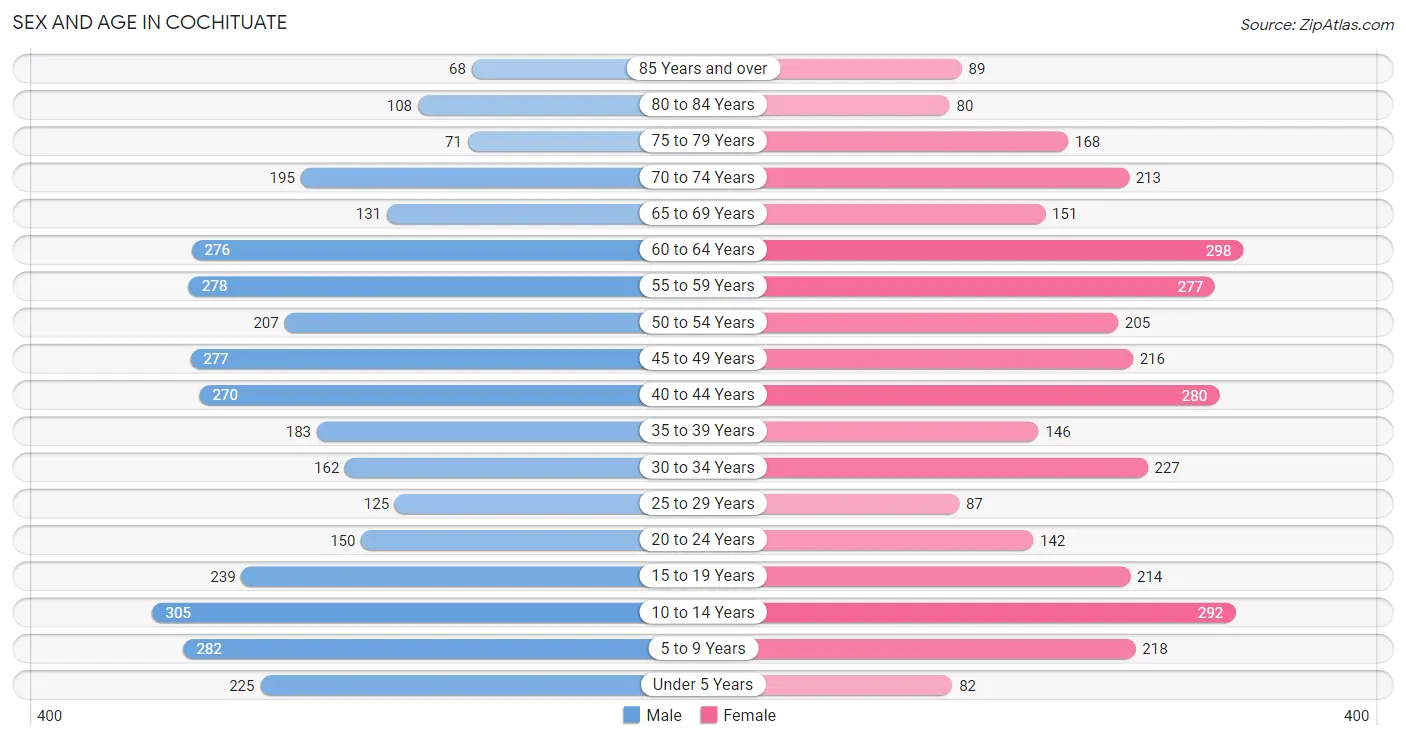
Sex and Age in Cochituate
Sex and Age in Cochituate
The most populous age groups in Cochituate are 10 to 14 Years (305 | 8.6%) for men and 60 to 64 Years (298 | 8.8%) for women.
| Age Bracket | Male | Female |
| Under 5 Years | 225 (6.3%) | 82 (2.4%) |
| 5 to 9 Years | 282 (7.9%) | 218 (6.4%) |
| 10 to 14 Years | 305 (8.6%) | 292 (8.6%) |
| 15 to 19 Years | 239 (6.7%) | 214 (6.3%) |
| 20 to 24 Years | 150 (4.2%) | 142 (4.2%) |
| 25 to 29 Years | 125 (3.5%) | 87 (2.6%) |
| 30 to 34 Years | 162 (4.6%) | 227 (6.7%) |
| 35 to 39 Years | 183 (5.1%) | 146 (4.3%) |
| 40 to 44 Years | 270 (7.6%) | 280 (8.3%) |
| 45 to 49 Years | 277 (7.8%) | 216 (6.4%) |
| 50 to 54 Years | 207 (5.8%) | 205 (6.1%) |
| 55 to 59 Years | 278 (7.8%) | 277 (8.2%) |
| 60 to 64 Years | 276 (7.8%) | 298 (8.8%) |
| 65 to 69 Years | 131 (3.7%) | 151 (4.5%) |
| 70 to 74 Years | 195 (5.5%) | 213 (6.3%) |
| 75 to 79 Years | 71 (2.0%) | 168 (5.0%) |
| 80 to 84 Years | 108 (3.0%) | 80 (2.4%) |
| 85 Years and over | 68 (1.9%) | 89 (2.6%) |
| Total | 3,552 (100.0%) | 3,385 (100.0%) |
Families and Households in Cochituate
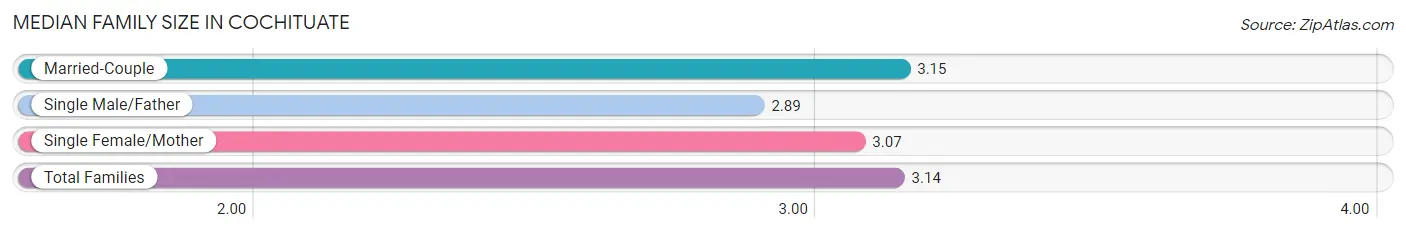
Median Family Size in Cochituate
The median family size in Cochituate is 3.14 persons per family, with married-couple families (1,760 | 91.4%) accounting for the largest median family size of 3.15 persons per family. On the other hand, single male/father families (27 | 1.4%) represent the smallest median family size with 2.89 persons per family.
| Family Type | # Families | Family Size |
| Married-Couple | 1,760 (91.4%) | 3.15 |
| Single Male/Father | 27 (1.4%) | 2.89 |
| Single Female/Mother | 139 (7.2%) | 3.07 |
| Total Families | 1,926 (100.0%) | 3.14 |
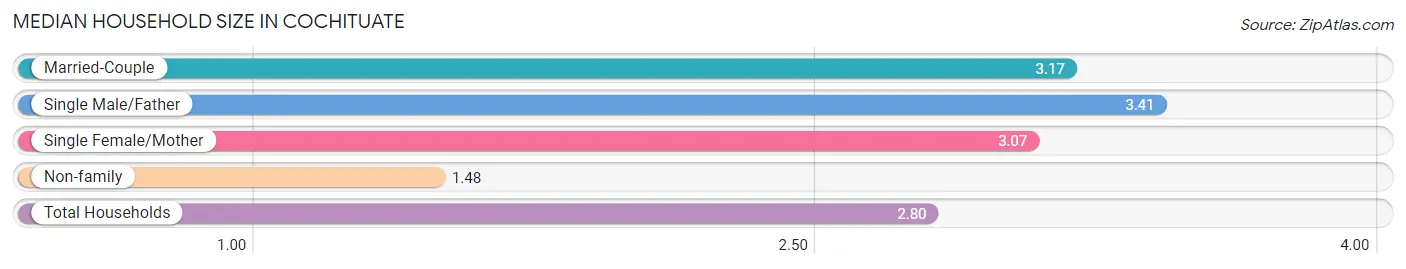
Median Household Size in Cochituate
The median household size in Cochituate is 2.80 persons per household, with single male/father households (27 | 1.1%) accounting for the largest median household size of 3.41 persons per household. non-family households (543 | 22.0%) represent the smallest median household size with 1.48 persons per household.
| Household Type | # Households | Household Size |
| Married-Couple | 1,760 (71.3%) | 3.17 |
| Single Male/Father | 27 (1.1%) | 3.41 |
| Single Female/Mother | 139 (5.6%) | 3.07 |
| Non-family | 543 (22.0%) | 1.48 |
| Total Households | 2,469 (100.0%) | 2.80 |
Household Size by Marriage Status in Cochituate
Out of a total of 2,469 households in Cochituate, 1,926 (78.0%) are family households, while 543 (22.0%) are nonfamily households. The most numerous type of family households are 2-person households, comprising 705, and the most common type of nonfamily households are 1-person households, comprising 409.
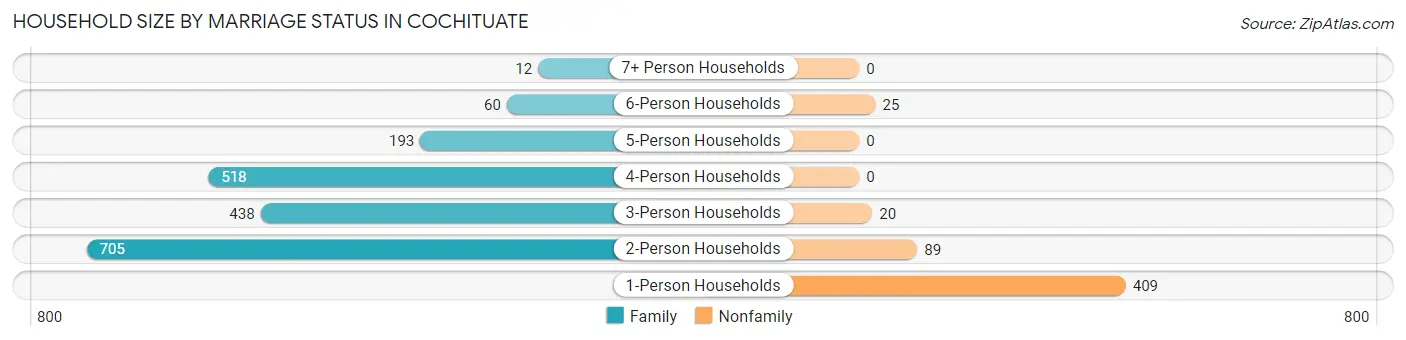
| Household Size | Family Households | Nonfamily Households |
| 1-Person Households | - | 409 (16.6%) |
| 2-Person Households | 705 (28.5%) | 89 (3.6%) |
| 3-Person Households | 438 (17.7%) | 20 (0.8%) |
| 4-Person Households | 518 (21.0%) | 0 (0.0%) |
| 5-Person Households | 193 (7.8%) | 0 (0.0%) |
| 6-Person Households | 60 (2.4%) | 25 (1.0%) |
| 7+ Person Households | 12 (0.5%) | 0 (0.0%) |
| Total | 1,926 (78.0%) | 543 (22.0%) |
Female Fertility in Cochituate
Fertility by Age in Cochituate
Average fertility rate in Cochituate is 51.0 births per 1,000 women. Women in the age bracket of 20 to 34 years have the highest fertility rate with 136.0 births per 1,000 women. Women in the age bracket of 20 to 34 years acount for 89.9% of all women with births.
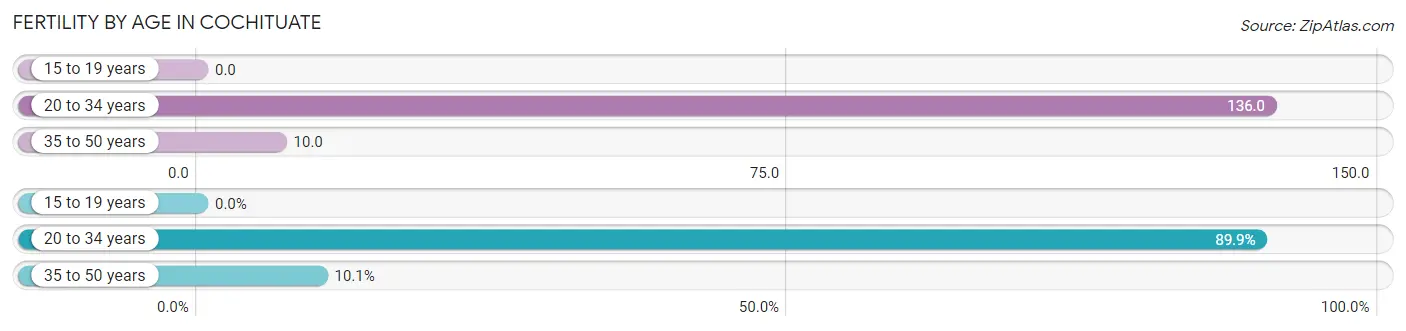
| Age Bracket | Women with Births | Births / 1,000 Women |
| 15 to 19 years | 0 (0.0%) | 0.0 |
| 20 to 34 years | 62 (89.9%) | 136.0 |
| 35 to 50 years | 7 (10.1%) | 10.0 |
| Total | 69 (100.0%) | 51.0 |
Fertility by Age by Marriage Status in Cochituate
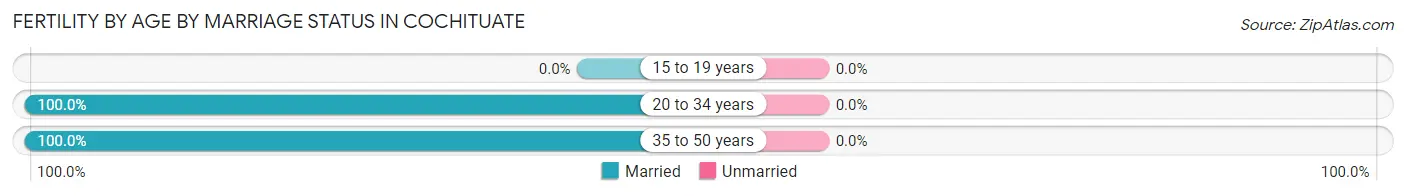
| Age Bracket | Married | Unmarried |
| 15 to 19 years | 0 (0.0%) | 0 (0.0%) |
| 20 to 34 years | 62 (100.0%) | 0 (0.0%) |
| 35 to 50 years | 7 (100.0%) | 0 (0.0%) |
| Total | 69 (100.0%) | 0 (0.0%) |
Fertility by Education in Cochituate
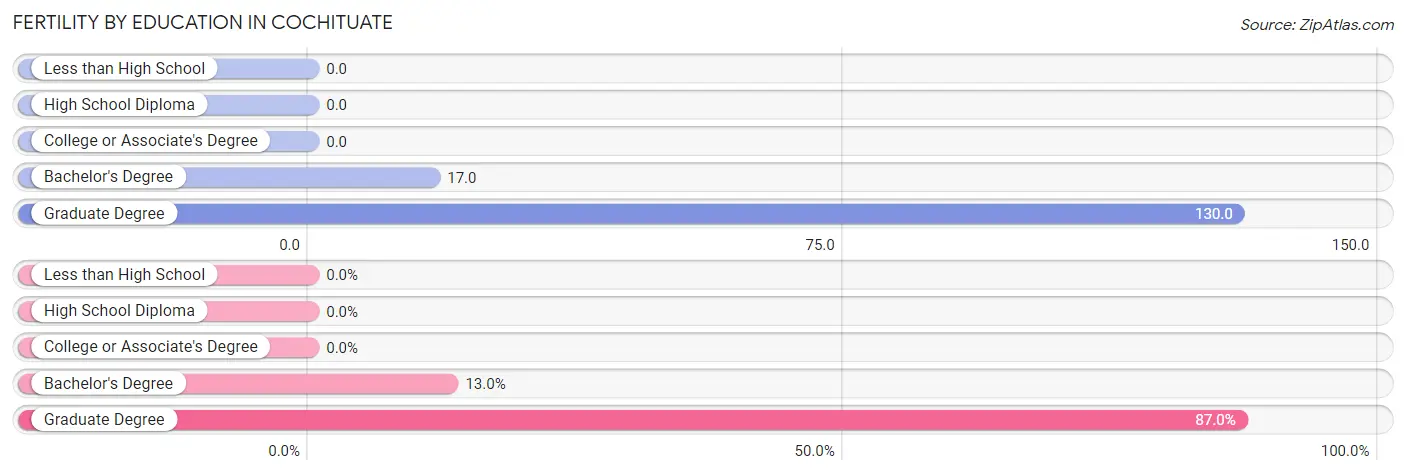
| Educational Attainment | Women with Births | Births / 1,000 Women |
| Less than High School | 0 (0.0%) | 0.0 |
| High School Diploma | 0 (0.0%) | 0.0 |
| College or Associate's Degree | 0 (0.0%) | 0.0 |
| Bachelor's Degree | 9 (13.0%) | 17.0 |
| Graduate Degree | 60 (87.0%) | 130.0 |
| Total | 69 (100.0%) | 51.0 |
Fertility by Education by Marriage Status in Cochituate
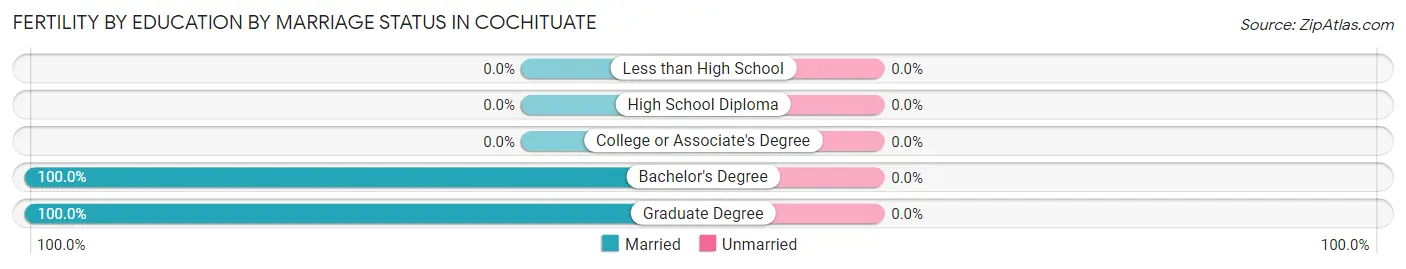
| Educational Attainment | Married | Unmarried |
| Less than High School | 0 (0.0%) | 0 (0.0%) |
| High School Diploma | 0 (0.0%) | 0 (0.0%) |
| College or Associate's Degree | 0 (0.0%) | 0 (0.0%) |
| Bachelor's Degree | 9 (100.0%) | 0 (0.0%) |
| Graduate Degree | 60 (100.0%) | 0 (0.0%) |
| Total | 69 (100.0%) | 0 (0.0%) |
Employment Characteristics in Cochituate
Employment by Class of Employer in Cochituate
Among the 3,429 employed individuals in Cochituate, private company employees (2,242 | 65.4%), not-for-profit organizations (472 | 13.8%), and self-employed (not incorporated) (226 | 6.6%) make up the most common classes of employment.
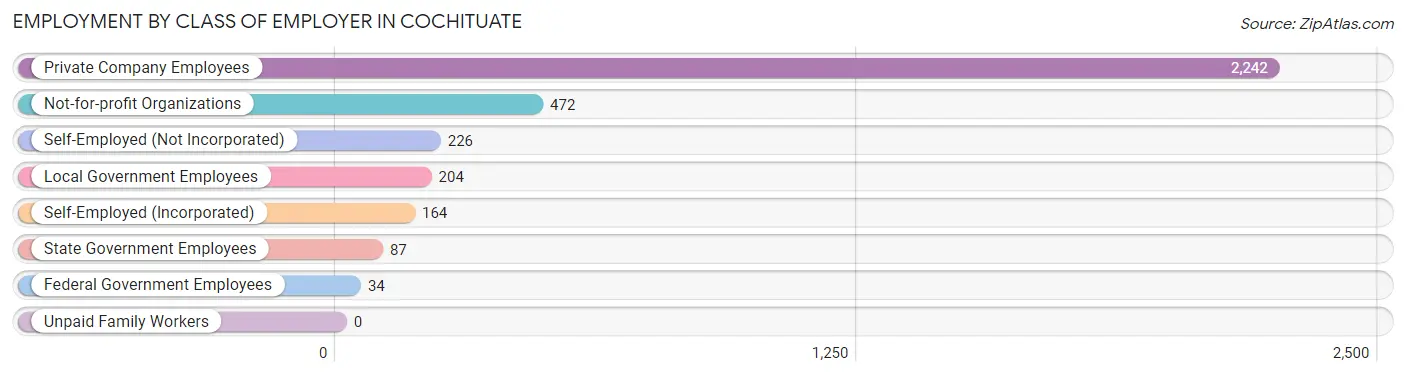
| Employer Class | # Employees | % Employees |
| Private Company Employees | 2,242 | 65.4% |
| Self-Employed (Incorporated) | 164 | 4.8% |
| Self-Employed (Not Incorporated) | 226 | 6.6% |
| Not-for-profit Organizations | 472 | 13.8% |
| Local Government Employees | 204 | 5.9% |
| State Government Employees | 87 | 2.5% |
| Federal Government Employees | 34 | 1.0% |
| Unpaid Family Workers | 0 | 0.0% |
| Total | 3,429 | 100.0% |
Employment Status by Age in Cochituate
According to the labor force statistics for Cochituate, out of the total population over 16 years of age (5,443), 64.9% or 3,533 individuals are in the labor force, with 2.7% or 95 of them unemployed. The age group with the highest labor force participation rate is 45 to 54 years, with 88.8% or 804 individuals in the labor force. Within the labor force, the 55 to 59 years age range has the highest percentage of unemployed individuals, with 10.9% or 43 of them being unemployed.
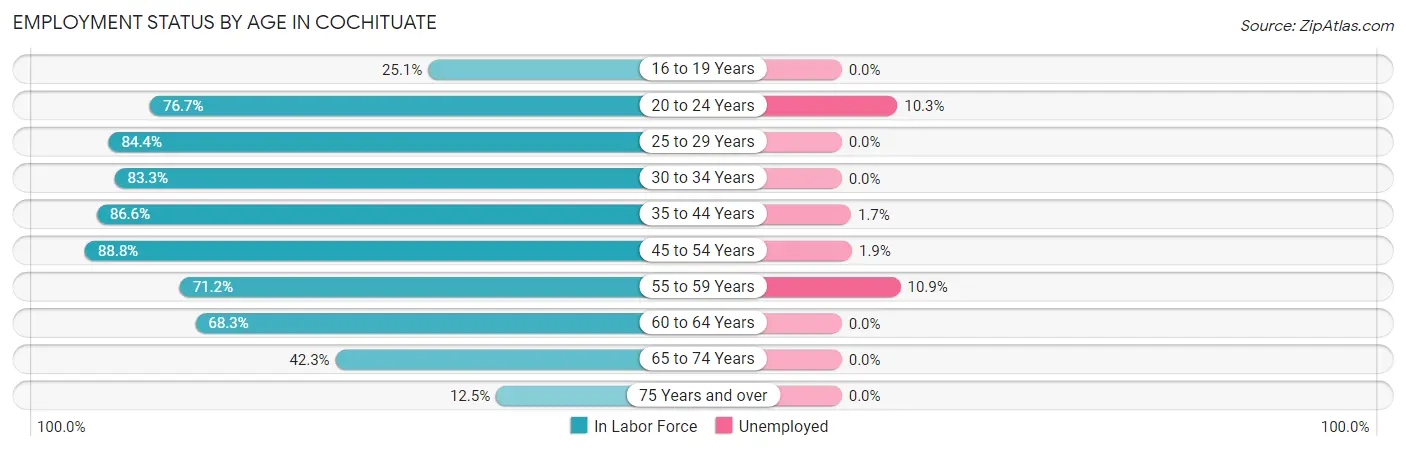
| Age Bracket | In Labor Force | Unemployed |
| 16 to 19 Years | 91 (25.1%) | 0 (0.0%) |
| 20 to 24 Years | 224 (76.7%) | 23 (10.3%) |
| 25 to 29 Years | 179 (84.4%) | 0 (0.0%) |
| 30 to 34 Years | 324 (83.3%) | 0 (0.0%) |
| 35 to 44 Years | 761 (86.6%) | 13 (1.7%) |
| 45 to 54 Years | 804 (88.8%) | 15 (1.9%) |
| 55 to 59 Years | 395 (71.2%) | 43 (10.9%) |
| 60 to 64 Years | 392 (68.3%) | 0 (0.0%) |
| 65 to 74 Years | 292 (42.3%) | 0 (0.0%) |
| 75 Years and over | 73 (12.5%) | 0 (0.0%) |
| Total | 3,533 (64.9%) | 95 (2.7%) |
Employment Status by Educational Attainment in Cochituate
According to labor force statistics for Cochituate, 81.2% of individuals (2,853) out of the total population between 25 and 64 years of age (3,514) are in the labor force, with 2.5% or 71 of them being unemployed. The group with the highest labor force participation rate are those with the educational attainment of bachelor's degree or higher, with 85.8% or 2,343 individuals in the labor force. Within the labor force, individuals with high school diploma education have the highest percentage of unemployment, with 37.1% or 43 of them being unemployed.
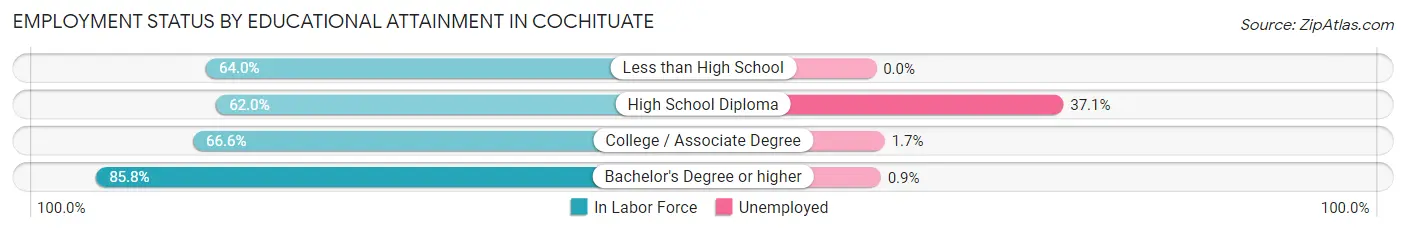
| Educational Attainment | In Labor Force | Unemployed |
| Less than High School | 48 (64.0%) | 0 (0.0%) |
| High School Diploma | 116 (62.0%) | 69 (37.1%) |
| College / Associate Degree | 347 (66.6%) | 9 (1.7%) |
| Bachelor's Degree or higher | 2,343 (85.8%) | 25 (0.9%) |
| Total | 2,853 (81.2%) | 88 (2.5%) |
Employment Occupations by Sex in Cochituate
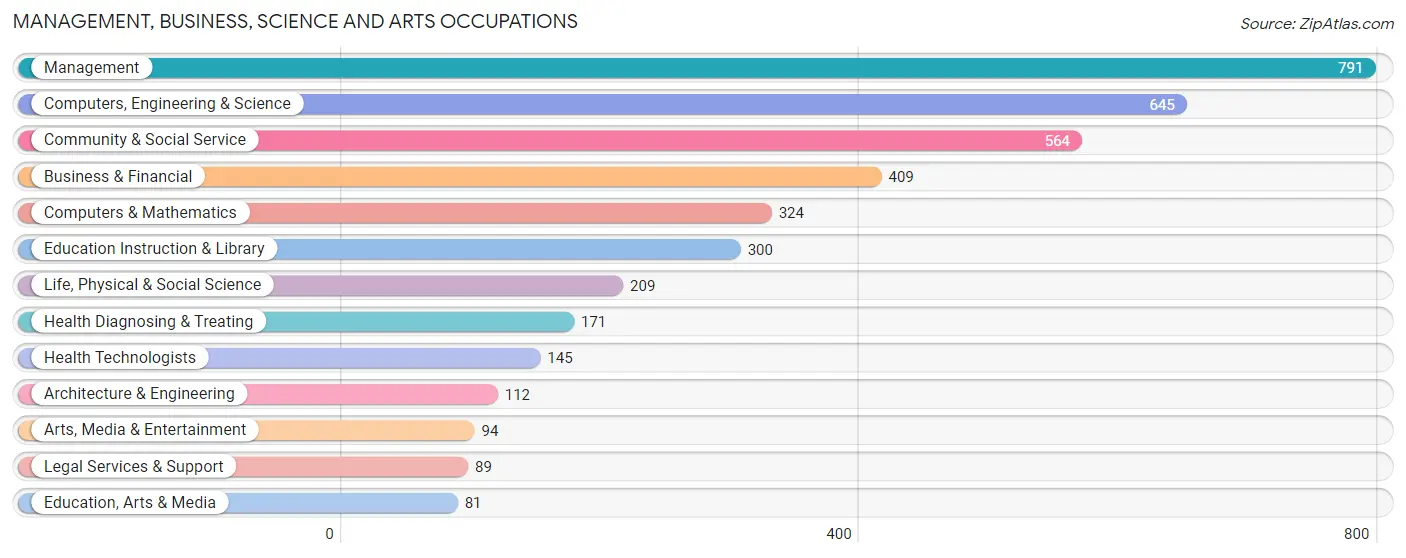
Management, Business, Science and Arts Occupations
The most common Management, Business, Science and Arts occupations in Cochituate are Management (791 | 23.0%), Computers, Engineering & Science (645 | 18.7%), Community & Social Service (564 | 16.4%), Business & Financial (409 | 11.9%), and Computers & Mathematics (324 | 9.4%).
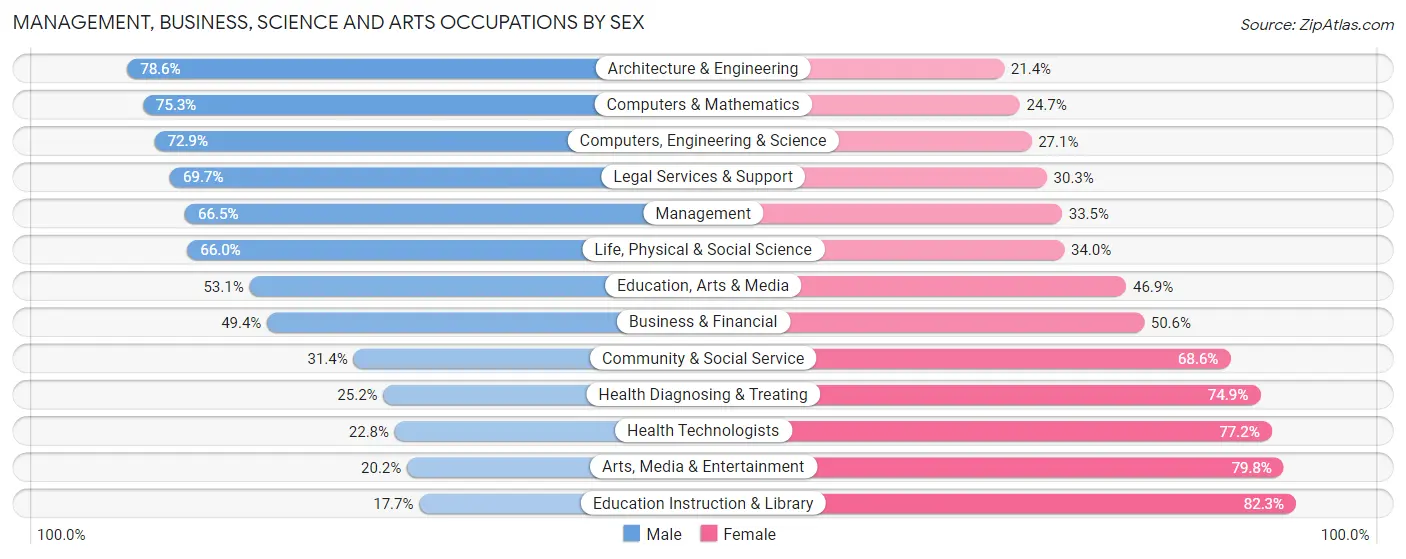
Management, Business, Science and Arts Occupations by Sex
Within the Management, Business, Science and Arts occupations in Cochituate, the most male-oriented occupations are Architecture & Engineering (78.6%), Computers & Mathematics (75.3%), and Computers, Engineering & Science (72.9%), while the most female-oriented occupations are Education Instruction & Library (82.3%), Arts, Media & Entertainment (79.8%), and Health Technologists (77.2%).
| Occupation | Male | Female |
| Management | 526 (66.5%) | 265 (33.5%) |
| Business & Financial | 202 (49.4%) | 207 (50.6%) |
| Computers, Engineering & Science | 470 (72.9%) | 175 (27.1%) |
| Computers & Mathematics | 244 (75.3%) | 80 (24.7%) |
| Architecture & Engineering | 88 (78.6%) | 24 (21.4%) |
| Life, Physical & Social Science | 138 (66.0%) | 71 (34.0%) |
| Community & Social Service | 177 (31.4%) | 387 (68.6%) |
| Education, Arts & Media | 43 (53.1%) | 38 (46.9%) |
| Legal Services & Support | 62 (69.7%) | 27 (30.3%) |
| Education Instruction & Library | 53 (17.7%) | 247 (82.3%) |
| Arts, Media & Entertainment | 19 (20.2%) | 75 (79.8%) |
| Health Diagnosing & Treating | 43 (25.2%) | 128 (74.9%) |
| Health Technologists | 33 (22.8%) | 112 (77.2%) |
| Total (Category) | 1,418 (55.0%) | 1,162 (45.0%) |
| Total (Overall) | 1,791 (52.0%) | 1,650 (47.9%) |
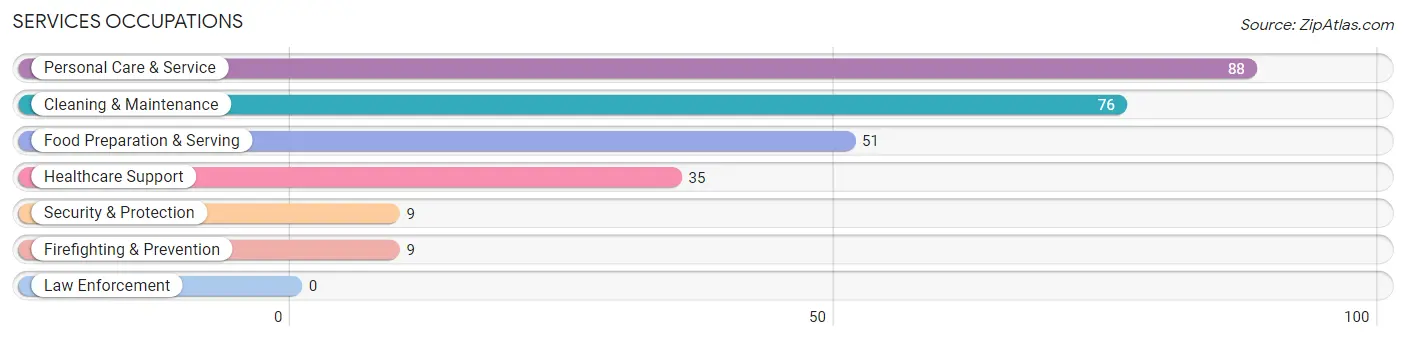
Services Occupations
The most common Services occupations in Cochituate are Personal Care & Service (88 | 2.6%), Cleaning & Maintenance (76 | 2.2%), Food Preparation & Serving (51 | 1.5%), Healthcare Support (35 | 1.0%), and Security & Protection (9 | 0.3%).
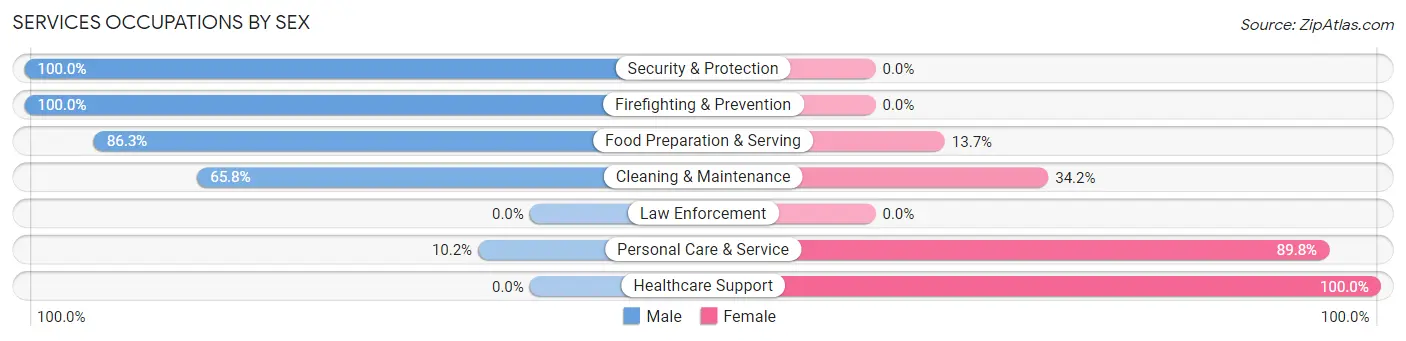
Services Occupations by Sex
Within the Services occupations in Cochituate, the most male-oriented occupations are Security & Protection (100.0%), Firefighting & Prevention (100.0%), and Food Preparation & Serving (86.3%), while the most female-oriented occupations are Healthcare Support (100.0%), Personal Care & Service (89.8%), and Cleaning & Maintenance (34.2%).
| Occupation | Male | Female |
| Healthcare Support | 0 (0.0%) | 35 (100.0%) |
| Security & Protection | 9 (100.0%) | 0 (0.0%) |
| Firefighting & Prevention | 9 (100.0%) | 0 (0.0%) |
| Law Enforcement | 0 (0.0%) | 0 (0.0%) |
| Food Preparation & Serving | 44 (86.3%) | 7 (13.7%) |
| Cleaning & Maintenance | 50 (65.8%) | 26 (34.2%) |
| Personal Care & Service | 9 (10.2%) | 79 (89.8%) |
| Total (Category) | 112 (43.2%) | 147 (56.8%) |
| Total (Overall) | 1,791 (52.0%) | 1,650 (47.9%) |
Sales and Office Occupations
The most common Sales and Office occupations in Cochituate are Sales & Related (271 | 7.9%), and Office & Administration (154 | 4.5%).
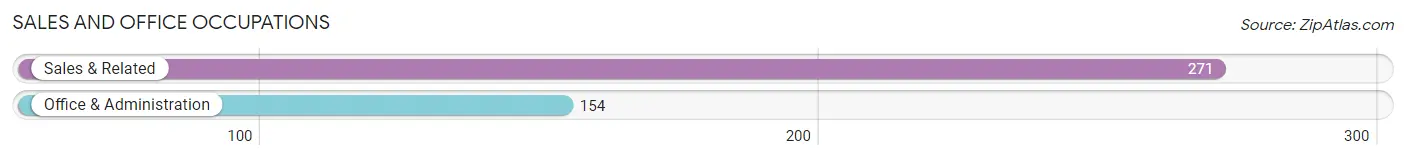
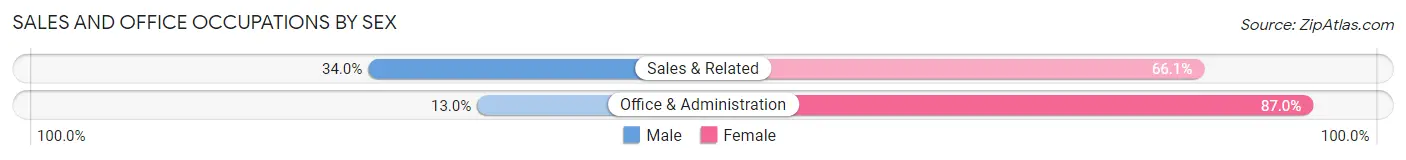
Sales and Office Occupations by Sex
| Occupation | Male | Female |
| Sales & Related | 92 (34.0%) | 179 (66.0%) |
| Office & Administration | 20 (13.0%) | 134 (87.0%) |
| Total (Category) | 112 (26.4%) | 313 (73.7%) |
| Total (Overall) | 1,791 (52.0%) | 1,650 (47.9%) |
Natural Resources, Construction and Maintenance Occupations
The most common Natural Resources, Construction and Maintenance occupations in Cochituate are Construction & Extraction (38 | 1.1%), and Farming, Fishing & Forestry (11 | 0.3%).
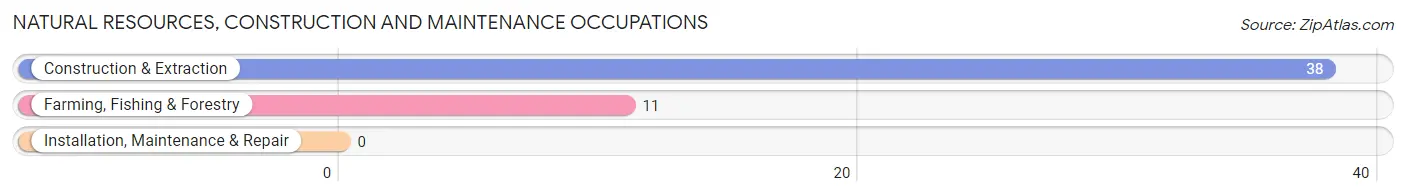
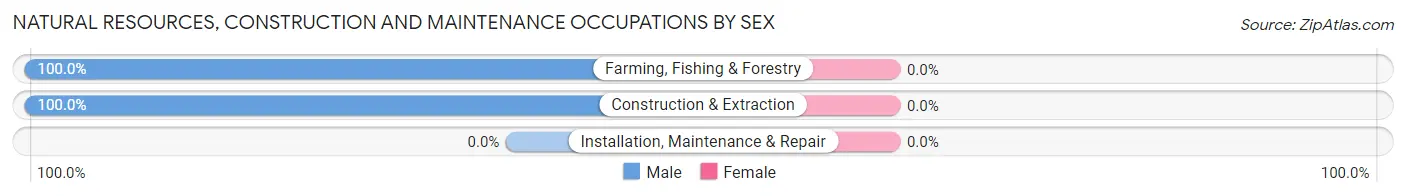
Natural Resources, Construction and Maintenance Occupations by Sex
| Occupation | Male | Female |
| Farming, Fishing & Forestry | 11 (100.0%) | 0 (0.0%) |
| Construction & Extraction | 38 (100.0%) | 0 (0.0%) |
| Installation, Maintenance & Repair | 0 (0.0%) | 0 (0.0%) |
| Total (Category) | 49 (100.0%) | 0 (0.0%) |
| Total (Overall) | 1,791 (52.0%) | 1,650 (47.9%) |
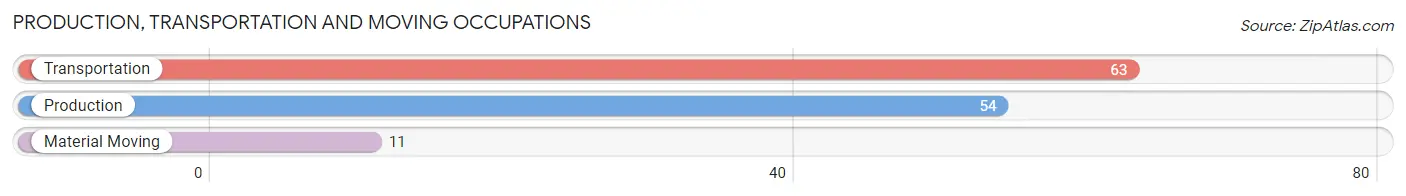
Production, Transportation and Moving Occupations
The most common Production, Transportation and Moving occupations in Cochituate are Transportation (63 | 1.8%), Production (54 | 1.6%), and Material Moving (11 | 0.3%).
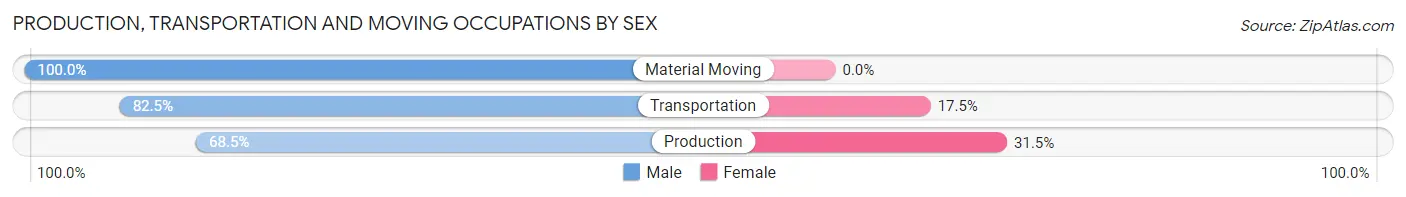
Production, Transportation and Moving Occupations by Sex
| Occupation | Male | Female |
| Production | 37 (68.5%) | 17 (31.5%) |
| Transportation | 52 (82.5%) | 11 (17.5%) |
| Material Moving | 11 (100.0%) | 0 (0.0%) |
| Total (Category) | 100 (78.1%) | 28 (21.9%) |
| Total (Overall) | 1,791 (52.0%) | 1,650 (47.9%) |
Employment Industries by Sex in Cochituate
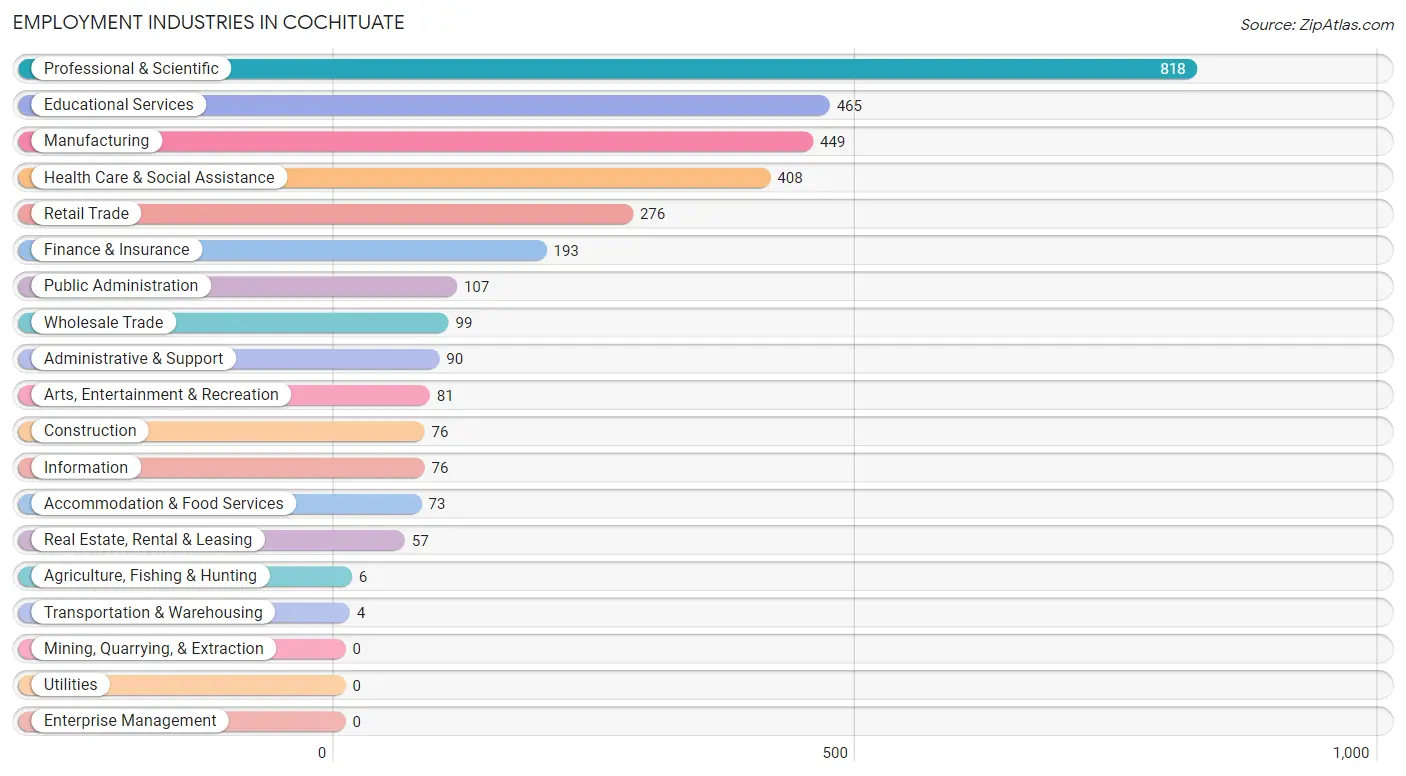
Employment Industries in Cochituate
The major employment industries in Cochituate include Professional & Scientific (818 | 23.8%), Educational Services (465 | 13.5%), Manufacturing (449 | 13.1%), Health Care & Social Assistance (408 | 11.9%), and Retail Trade (276 | 8.0%).
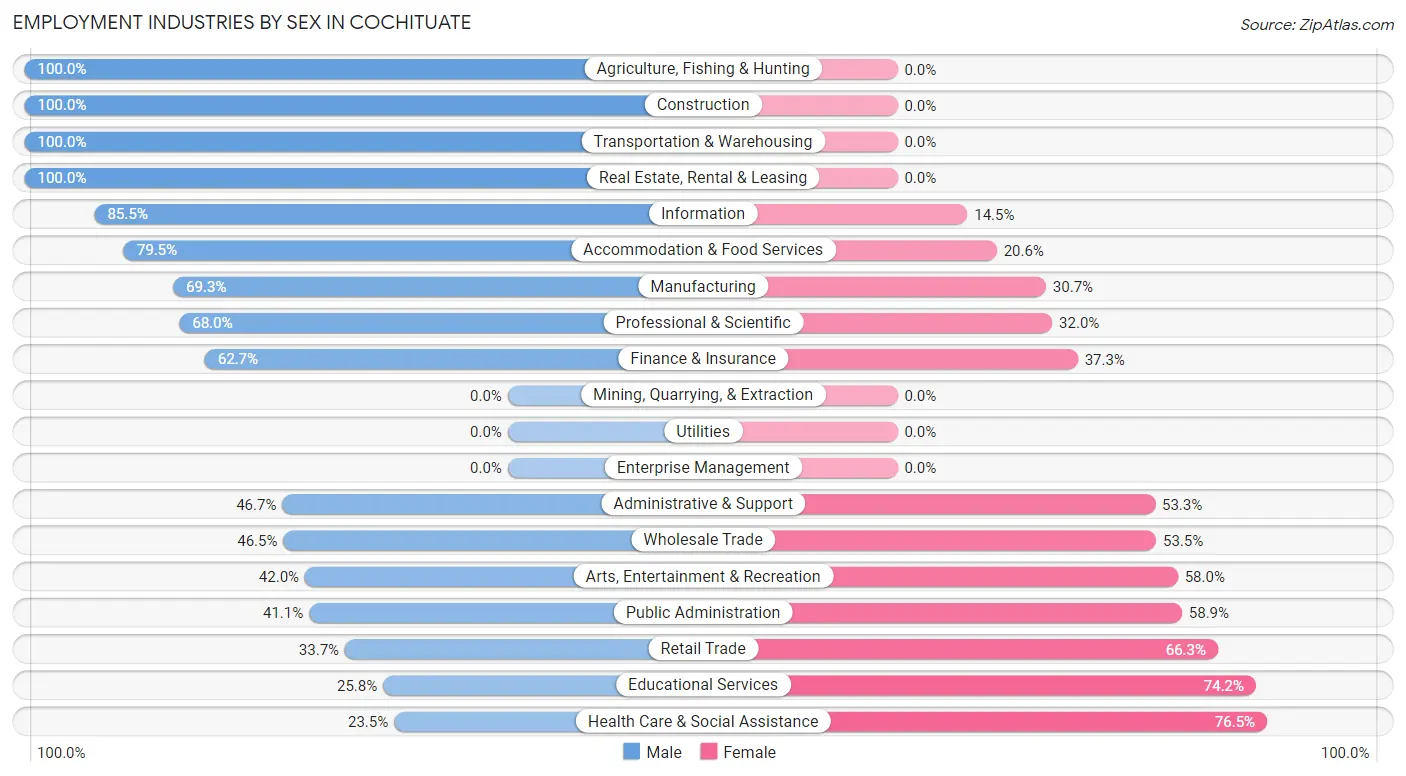
Employment Industries by Sex in Cochituate
The Cochituate industries that see more men than women are Agriculture, Fishing & Hunting (100.0%), Construction (100.0%), and Transportation & Warehousing (100.0%), whereas the industries that tend to have a higher number of women are Health Care & Social Assistance (76.5%), Educational Services (74.2%), and Retail Trade (66.3%).
| Industry | Male | Female |
| Agriculture, Fishing & Hunting | 6 (100.0%) | 0 (0.0%) |
| Mining, Quarrying, & Extraction | 0 (0.0%) | 0 (0.0%) |
| Construction | 76 (100.0%) | 0 (0.0%) |
| Manufacturing | 311 (69.3%) | 138 (30.7%) |
| Wholesale Trade | 46 (46.5%) | 53 (53.5%) |
| Retail Trade | 93 (33.7%) | 183 (66.3%) |
| Transportation & Warehousing | 4 (100.0%) | 0 (0.0%) |
| Utilities | 0 (0.0%) | 0 (0.0%) |
| Information | 65 (85.5%) | 11 (14.5%) |
| Finance & Insurance | 121 (62.7%) | 72 (37.3%) |
| Real Estate, Rental & Leasing | 57 (100.0%) | 0 (0.0%) |
| Professional & Scientific | 556 (68.0%) | 262 (32.0%) |
| Enterprise Management | 0 (0.0%) | 0 (0.0%) |
| Administrative & Support | 42 (46.7%) | 48 (53.3%) |
| Educational Services | 120 (25.8%) | 345 (74.2%) |
| Health Care & Social Assistance | 96 (23.5%) | 312 (76.5%) |
| Arts, Entertainment & Recreation | 34 (42.0%) | 47 (58.0%) |
| Accommodation & Food Services | 58 (79.4%) | 15 (20.5%) |
| Public Administration | 44 (41.1%) | 63 (58.9%) |
| Total | 1,791 (52.0%) | 1,650 (47.9%) |
Education in Cochituate
School Enrollment in Cochituate
The most common levels of schooling among the 1,853 students in Cochituate are high school (474 | 25.6%), elementary school (466 | 25.2%), and middle school (447 | 24.1%).
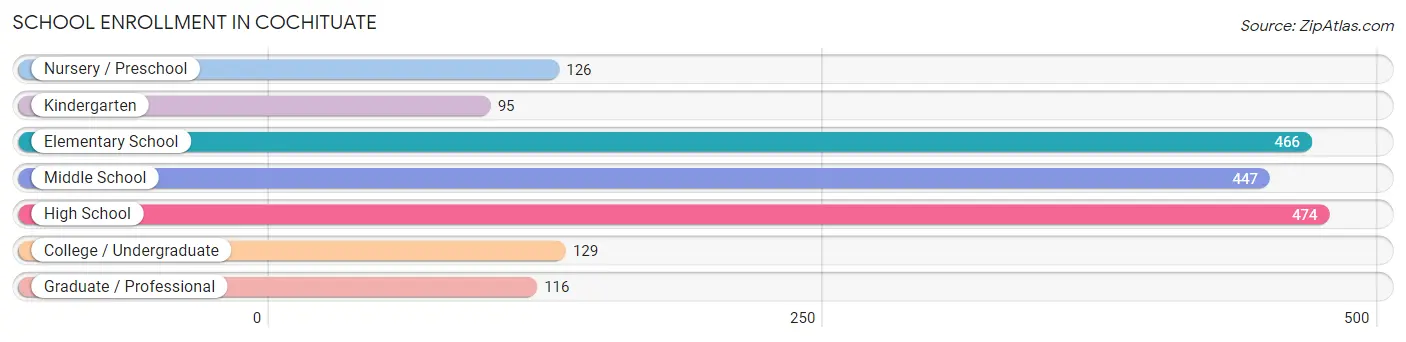
| School Level | # Students | % Students |
| Nursery / Preschool | 126 | 6.8% |
| Kindergarten | 95 | 5.1% |
| Elementary School | 466 | 25.2% |
| Middle School | 447 | 24.1% |
| High School | 474 | 25.6% |
| College / Undergraduate | 129 | 7.0% |
| Graduate / Professional | 116 | 6.3% |
| Total | 1,853 | 100.0% |
School Enrollment by Age by Funding Source in Cochituate
Out of a total of 1,853 students who are enrolled in schools in Cochituate, 280 (15.1%) attend a private institution, while the remaining 1,573 (84.9%) are enrolled in public schools. The age group of 20 to 24 year olds has the highest likelihood of being enrolled in private schools, with 75 (66.4% in the age bracket) enrolled. Conversely, the age group of 10 to 14 year olds has the lowest likelihood of being enrolled in a private school, with 589 (98.7% in the age bracket) attending a public institution.
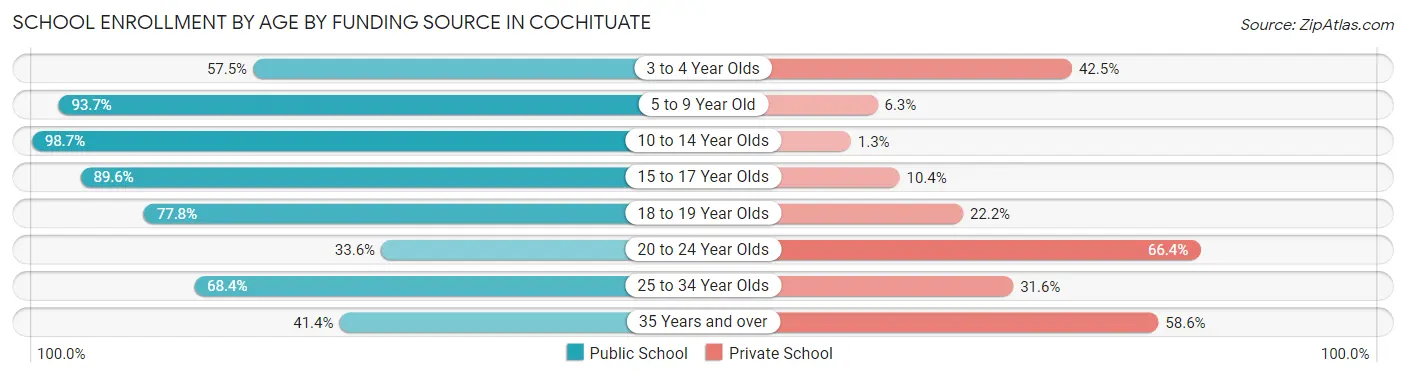
| Age Bracket | Public School | Private School |
| 3 to 4 Year Olds | 50 (57.5%) | 37 (42.5%) |
| 5 to 9 Year Old | 460 (93.7%) | 31 (6.3%) |
| 10 to 14 Year Olds | 589 (98.7%) | 8 (1.3%) |
| 15 to 17 Year Olds | 241 (89.6%) | 28 (10.4%) |
| 18 to 19 Year Olds | 133 (77.8%) | 38 (22.2%) |
| 20 to 24 Year Olds | 38 (33.6%) | 75 (66.4%) |
| 25 to 34 Year Olds | 26 (68.4%) | 12 (31.6%) |
| 35 Years and over | 36 (41.4%) | 51 (58.6%) |
| Total | 1,573 (84.9%) | 280 (15.1%) |
Educational Attainment by Field of Study in Cochituate
Engineering (557 | 14.7%), business (540 | 14.2%), social sciences (431 | 11.4%), bio, nature & agricultural (337 | 8.9%), and computers & mathematics (280 | 7.4%) are the most common fields of study among 3,796 individuals in Cochituate who have obtained a bachelor's degree or higher.
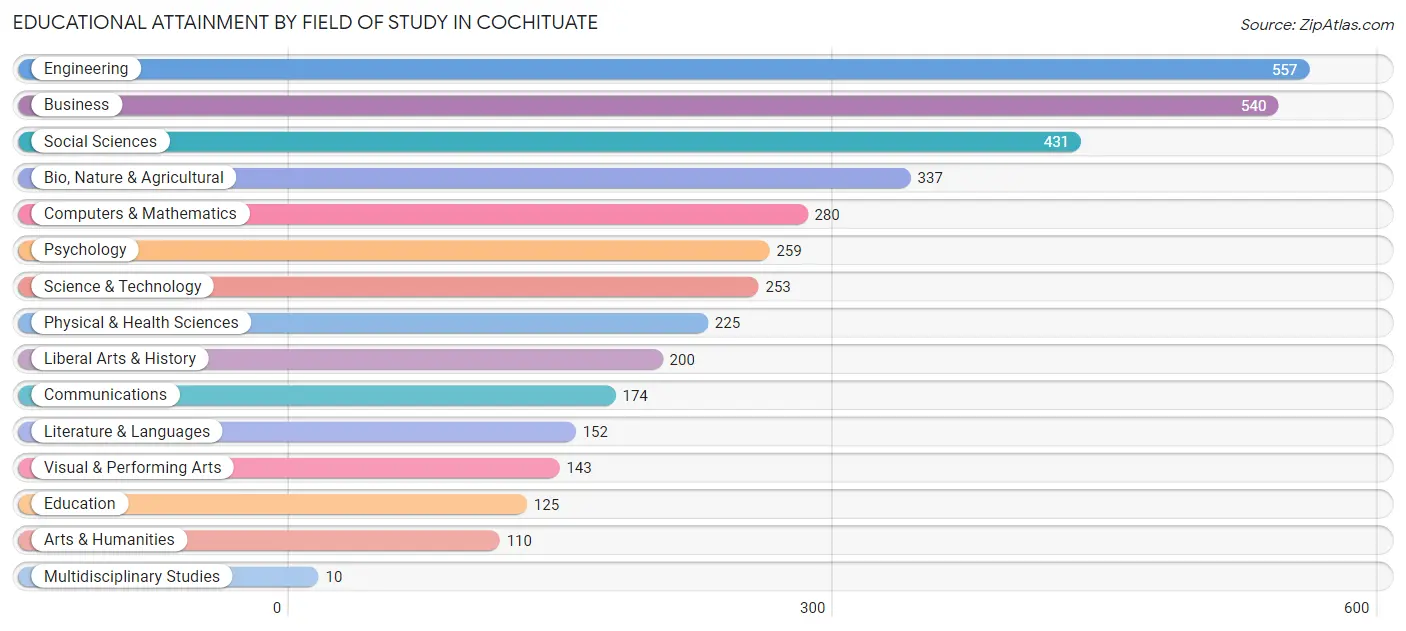
| Field of Study | # Graduates | % Graduates |
| Computers & Mathematics | 280 | 7.4% |
| Bio, Nature & Agricultural | 337 | 8.9% |
| Physical & Health Sciences | 225 | 5.9% |
| Psychology | 259 | 6.8% |
| Social Sciences | 431 | 11.4% |
| Engineering | 557 | 14.7% |
| Multidisciplinary Studies | 10 | 0.3% |
| Science & Technology | 253 | 6.7% |
| Business | 540 | 14.2% |
| Education | 125 | 3.3% |
| Literature & Languages | 152 | 4.0% |
| Liberal Arts & History | 200 | 5.3% |
| Visual & Performing Arts | 143 | 3.8% |
| Communications | 174 | 4.6% |
| Arts & Humanities | 110 | 2.9% |
| Total | 3,796 | 100.0% |
Transportation & Commute in Cochituate
Vehicle Availability by Sex in Cochituate
The most prevalent vehicle ownership categories in Cochituate are males with 2 vehicles (1,021, accounting for 57.0%) and females with 2 vehicles (852, making up 62.3%).
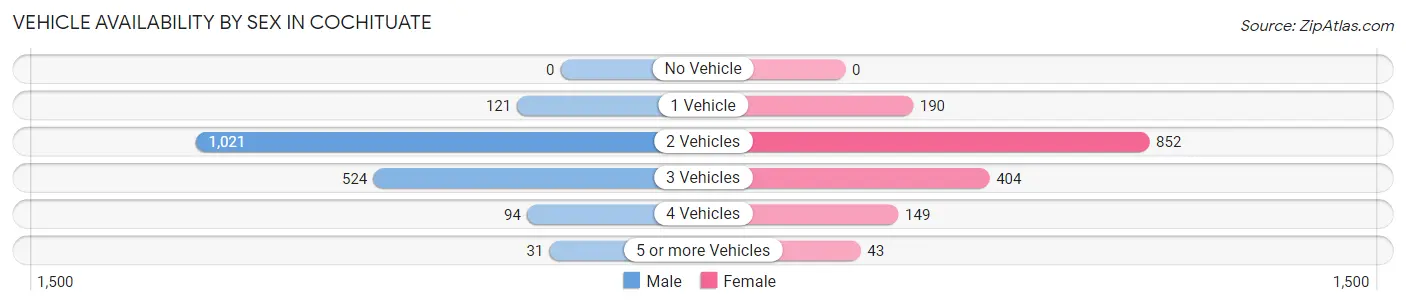
| Vehicles Available | Male | Female |
| No Vehicle | 0 (0.0%) | 0 (0.0%) |
| 1 Vehicle | 121 (6.8%) | 190 (11.6%) |
| 2 Vehicles | 1,021 (57.0%) | 852 (52.0%) |
| 3 Vehicles | 524 (29.3%) | 404 (24.7%) |
| 4 Vehicles | 94 (5.2%) | 149 (9.1%) |
| 5 or more Vehicles | 31 (1.7%) | 43 (2.6%) |
| Total | 1,791 (100.0%) | 1,638 (100.0%) |
Commute Time in Cochituate
The most frequently occuring commute durations in Cochituate are 30 to 34 minutes (456 commuters, 18.6%), 45 to 59 minutes (301 commuters, 12.3%), and 20 to 24 minutes (264 commuters, 10.8%).
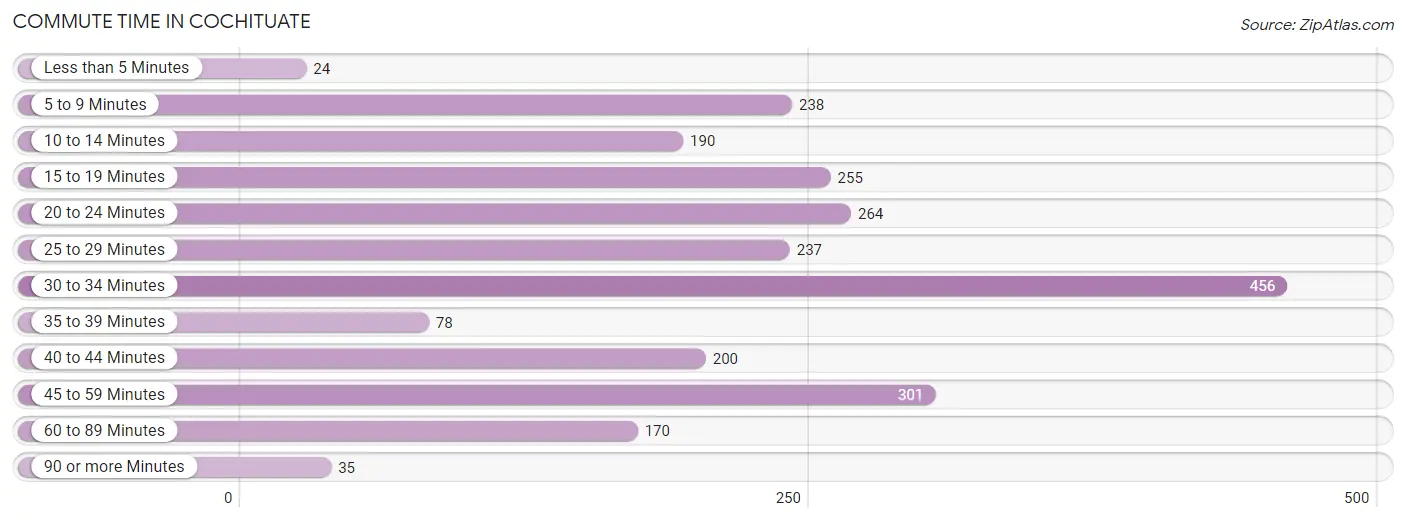
| Commute Time | # Commuters | % Commuters |
| Less than 5 Minutes | 24 | 1.0% |
| 5 to 9 Minutes | 238 | 9.7% |
| 10 to 14 Minutes | 190 | 7.8% |
| 15 to 19 Minutes | 255 | 10.4% |
| 20 to 24 Minutes | 264 | 10.8% |
| 25 to 29 Minutes | 237 | 9.7% |
| 30 to 34 Minutes | 456 | 18.6% |
| 35 to 39 Minutes | 78 | 3.2% |
| 40 to 44 Minutes | 200 | 8.2% |
| 45 to 59 Minutes | 301 | 12.3% |
| 60 to 89 Minutes | 170 | 6.9% |
| 90 or more Minutes | 35 | 1.4% |
Commute Time by Sex in Cochituate
The most common commute times in Cochituate are 30 to 34 minutes (293 commuters, 23.3%) for males and 20 to 24 minutes (194 commuters, 16.3%) for females.
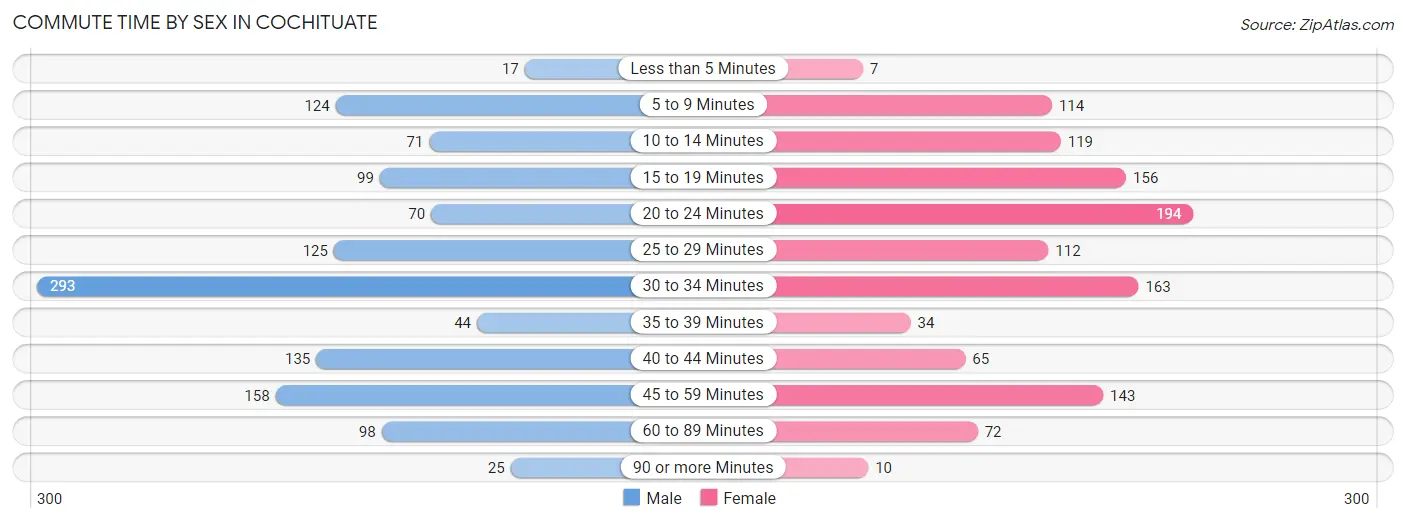
| Commute Time | Male | Female |
| Less than 5 Minutes | 17 (1.3%) | 7 (0.6%) |
| 5 to 9 Minutes | 124 (9.9%) | 114 (9.6%) |
| 10 to 14 Minutes | 71 (5.6%) | 119 (10.0%) |
| 15 to 19 Minutes | 99 (7.9%) | 156 (13.1%) |
| 20 to 24 Minutes | 70 (5.6%) | 194 (16.3%) |
| 25 to 29 Minutes | 125 (9.9%) | 112 (9.4%) |
| 30 to 34 Minutes | 293 (23.3%) | 163 (13.7%) |
| 35 to 39 Minutes | 44 (3.5%) | 34 (2.9%) |
| 40 to 44 Minutes | 135 (10.7%) | 65 (5.5%) |
| 45 to 59 Minutes | 158 (12.6%) | 143 (12.0%) |
| 60 to 89 Minutes | 98 (7.8%) | 72 (6.1%) |
| 90 or more Minutes | 25 (2.0%) | 10 (0.8%) |
Time of Departure to Work by Sex in Cochituate
The most frequent times of departure to work in Cochituate are 8:00 AM to 8:29 AM (373, 29.6%) for males and 7:00 AM to 7:29 AM (234, 19.7%) for females.
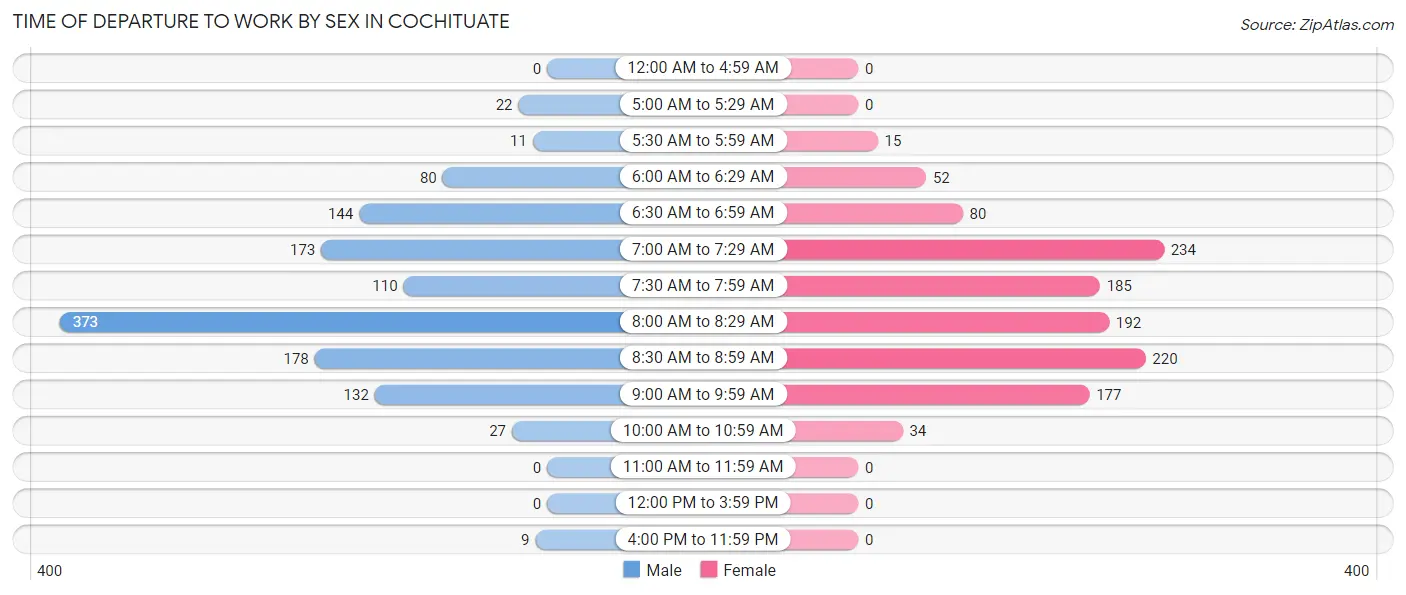
| Time of Departure | Male | Female |
| 12:00 AM to 4:59 AM | 0 (0.0%) | 0 (0.0%) |
| 5:00 AM to 5:29 AM | 22 (1.8%) | 0 (0.0%) |
| 5:30 AM to 5:59 AM | 11 (0.9%) | 15 (1.3%) |
| 6:00 AM to 6:29 AM | 80 (6.4%) | 52 (4.4%) |
| 6:30 AM to 6:59 AM | 144 (11.4%) | 80 (6.7%) |
| 7:00 AM to 7:29 AM | 173 (13.7%) | 234 (19.7%) |
| 7:30 AM to 7:59 AM | 110 (8.7%) | 185 (15.6%) |
| 8:00 AM to 8:29 AM | 373 (29.6%) | 192 (16.2%) |
| 8:30 AM to 8:59 AM | 178 (14.1%) | 220 (18.5%) |
| 9:00 AM to 9:59 AM | 132 (10.5%) | 177 (14.9%) |
| 10:00 AM to 10:59 AM | 27 (2.1%) | 34 (2.9%) |
| 11:00 AM to 11:59 AM | 0 (0.0%) | 0 (0.0%) |
| 12:00 PM to 3:59 PM | 0 (0.0%) | 0 (0.0%) |
| 4:00 PM to 11:59 PM | 9 (0.7%) | 0 (0.0%) |
| Total | 1,259 (100.0%) | 1,189 (100.0%) |
Housing Occupancy in Cochituate
Occupancy by Ownership in Cochituate
Of the total 2,469 dwellings in Cochituate, owner-occupied units account for 2,241 (90.8%), while renter-occupied units make up 228 (9.2%).
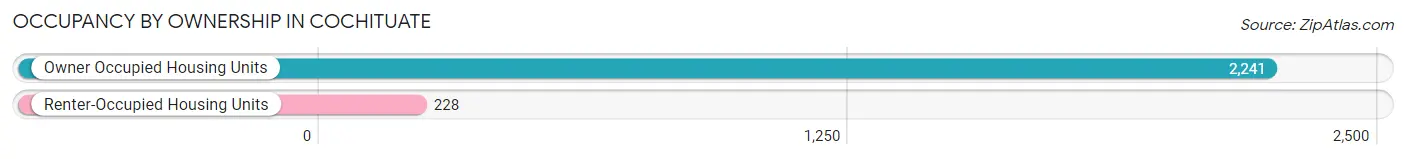
| Occupancy | # Housing Units | % Housing Units |
| Owner Occupied Housing Units | 2,241 | 90.8% |
| Renter-Occupied Housing Units | 228 | 9.2% |
| Total Occupied Housing Units | 2,469 | 100.0% |
Occupancy by Household Size in Cochituate
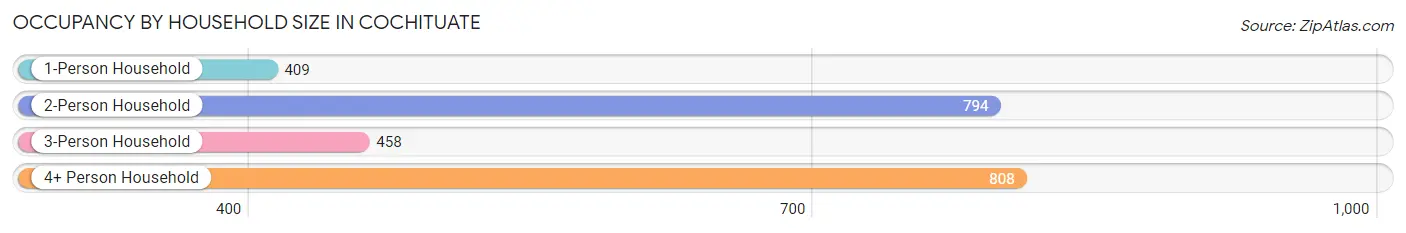
| Household Size | # Housing Units | % Housing Units |
| 1-Person Household | 409 | 16.6% |
| 2-Person Household | 794 | 32.2% |
| 3-Person Household | 458 | 18.5% |
| 4+ Person Household | 808 | 32.7% |
| Total Housing Units | 2,469 | 100.0% |
Occupancy by Ownership by Household Size in Cochituate
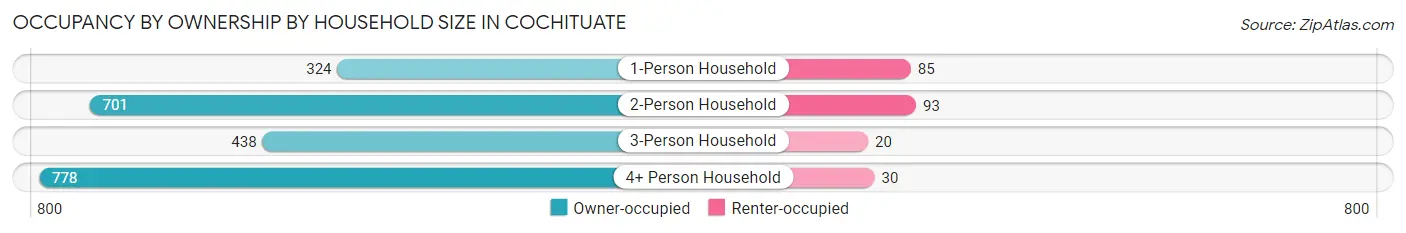
| Household Size | Owner-occupied | Renter-occupied |
| 1-Person Household | 324 (79.2%) | 85 (20.8%) |
| 2-Person Household | 701 (88.3%) | 93 (11.7%) |
| 3-Person Household | 438 (95.6%) | 20 (4.4%) |
| 4+ Person Household | 778 (96.3%) | 30 (3.7%) |
| Total Housing Units | 2,241 (90.8%) | 228 (9.2%) |
Occupancy by Educational Attainment in Cochituate
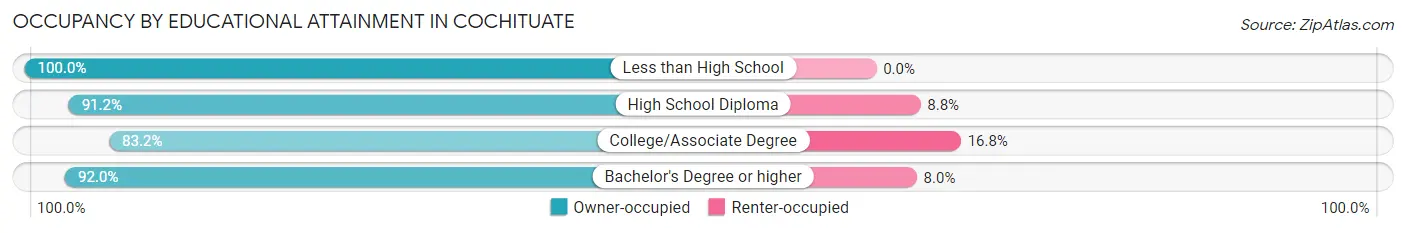
| Household Size | Owner-occupied | Renter-occupied |
| Less than High School | 18 (100.0%) | 0 (0.0%) |
| High School Diploma | 125 (91.2%) | 12 (8.8%) |
| College/Associate Degree | 288 (83.2%) | 58 (16.8%) |
| Bachelor's Degree or higher | 1,810 (92.0%) | 158 (8.0%) |
Occupancy by Age of Householder in Cochituate
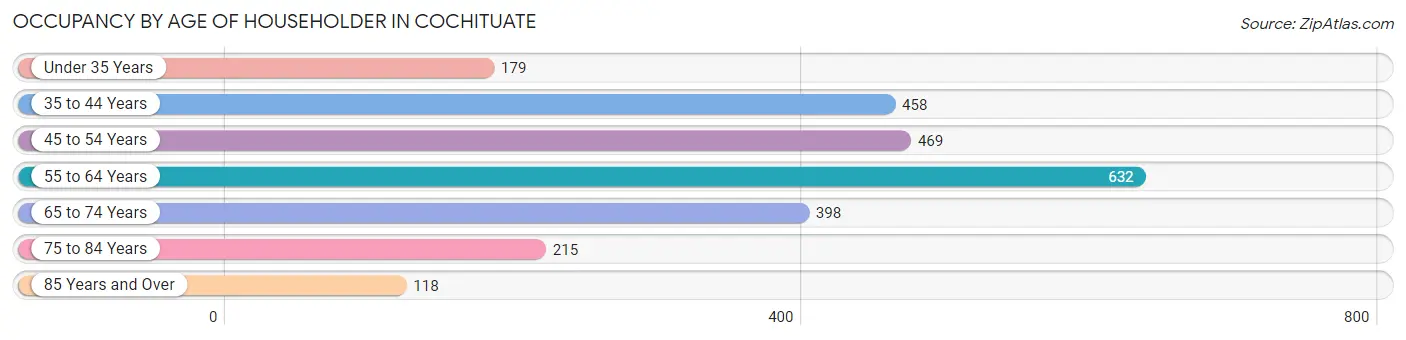
| Age Bracket | # Households | % Households |
| Under 35 Years | 179 | 7.2% |
| 35 to 44 Years | 458 | 18.5% |
| 45 to 54 Years | 469 | 19.0% |
| 55 to 64 Years | 632 | 25.6% |
| 65 to 74 Years | 398 | 16.1% |
| 75 to 84 Years | 215 | 8.7% |
| 85 Years and Over | 118 | 4.8% |
| Total | 2,469 | 100.0% |
Housing Finances in Cochituate
Median Income by Occupancy in Cochituate
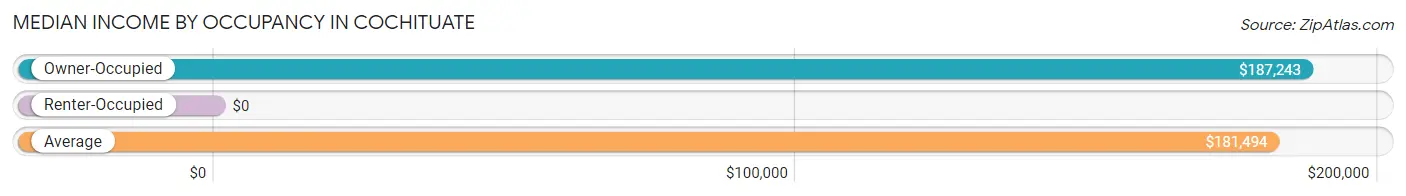
| Occupancy Type | # Households | Median Income |
| Owner-Occupied | 2,241 (90.8%) | $187,243 |
| Renter-Occupied | 228 (9.2%) | $0 |
| Average | 2,469 (100.0%) | $181,494 |
Occupancy by Householder Income Bracket in Cochituate
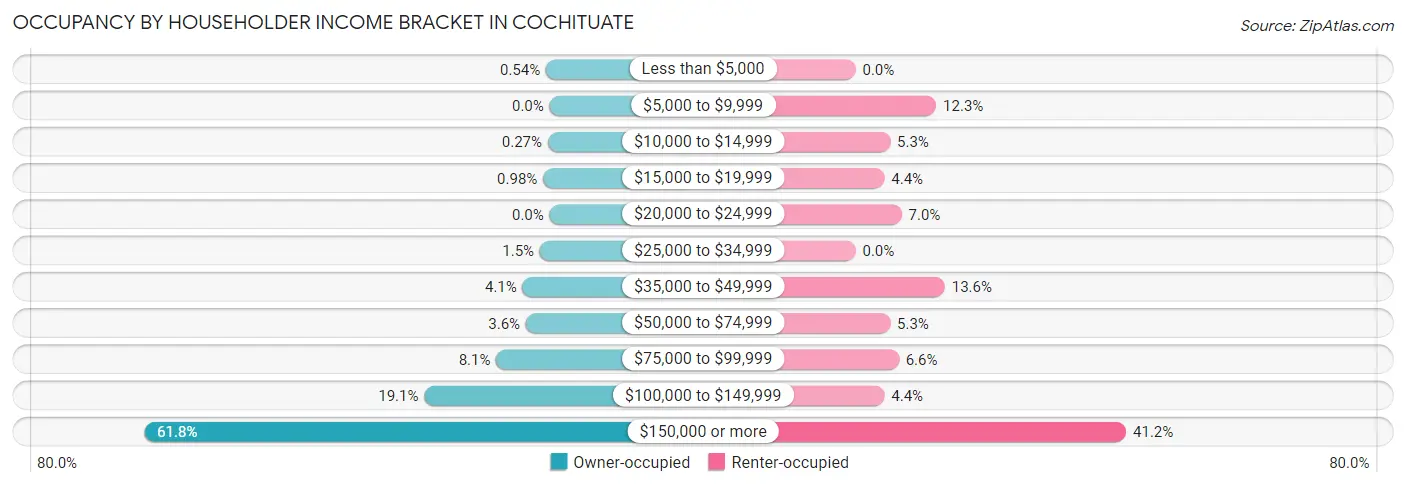
| Income Bracket | Owner-occupied | Renter-occupied |
| Less than $5,000 | 12 (0.5%) | 0 (0.0%) |
| $5,000 to $9,999 | 0 (0.0%) | 28 (12.3%) |
| $10,000 to $14,999 | 6 (0.3%) | 12 (5.3%) |
| $15,000 to $19,999 | 22 (1.0%) | 10 (4.4%) |
| $20,000 to $24,999 | 0 (0.0%) | 16 (7.0%) |
| $25,000 to $34,999 | 33 (1.5%) | 0 (0.0%) |
| $35,000 to $49,999 | 92 (4.1%) | 31 (13.6%) |
| $50,000 to $74,999 | 81 (3.6%) | 12 (5.3%) |
| $75,000 to $99,999 | 182 (8.1%) | 15 (6.6%) |
| $100,000 to $149,999 | 428 (19.1%) | 10 (4.4%) |
| $150,000 or more | 1,385 (61.8%) | 94 (41.2%) |
| Total | 2,241 (100.0%) | 228 (100.0%) |
Monthly Housing Cost Tiers in Cochituate
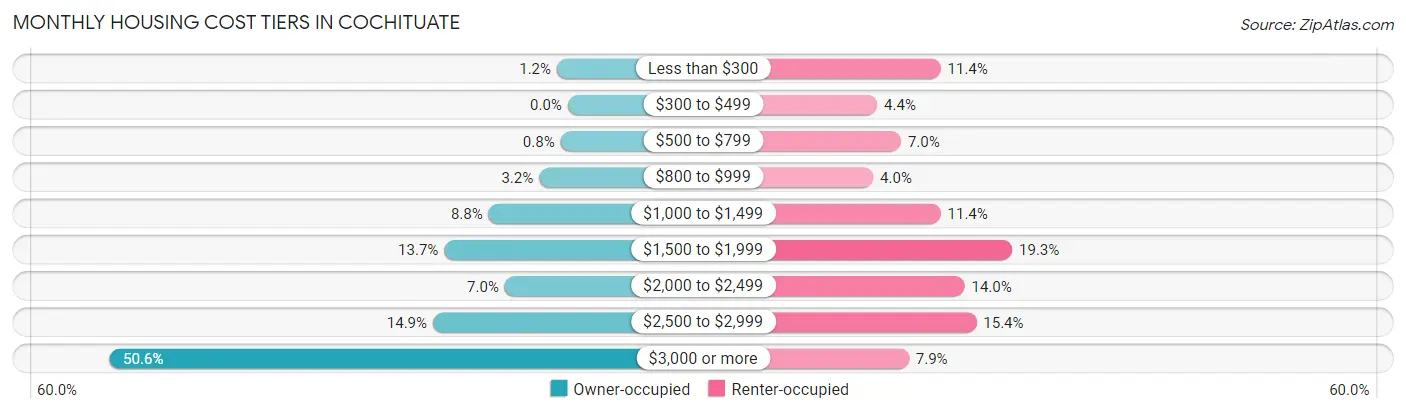
| Monthly Cost | Owner-occupied | Renter-occupied |
| Less than $300 | 27 (1.2%) | 26 (11.4%) |
| $300 to $499 | 0 (0.0%) | 10 (4.4%) |
| $500 to $799 | 18 (0.8%) | 16 (7.0%) |
| $800 to $999 | 71 (3.2%) | 9 (4.0%) |
| $1,000 to $1,499 | 196 (8.7%) | 26 (11.4%) |
| $1,500 to $1,999 | 306 (13.7%) | 44 (19.3%) |
| $2,000 to $2,499 | 156 (7.0%) | 32 (14.0%) |
| $2,500 to $2,999 | 334 (14.9%) | 35 (15.3%) |
| $3,000 or more | 1,133 (50.6%) | 18 (7.9%) |
| Total | 2,241 (100.0%) | 228 (100.0%) |
Physical Housing Characteristics in Cochituate
Housing Structures in Cochituate
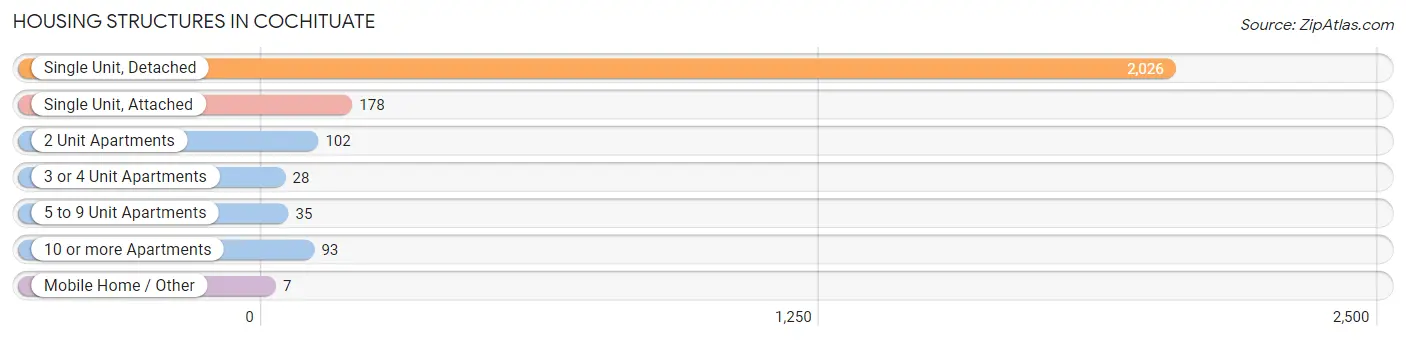
| Structure Type | # Housing Units | % Housing Units |
| Single Unit, Detached | 2,026 | 82.1% |
| Single Unit, Attached | 178 | 7.2% |
| 2 Unit Apartments | 102 | 4.1% |
| 3 or 4 Unit Apartments | 28 | 1.1% |
| 5 to 9 Unit Apartments | 35 | 1.4% |
| 10 or more Apartments | 93 | 3.8% |
| Mobile Home / Other | 7 | 0.3% |
| Total | 2,469 | 100.0% |
Housing Structures by Occupancy in Cochituate
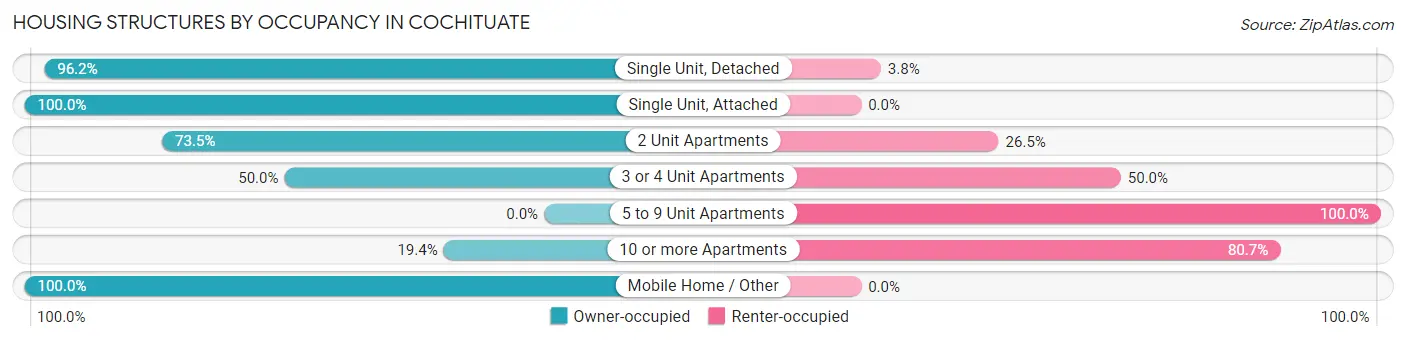
| Structure Type | Owner-occupied | Renter-occupied |
| Single Unit, Detached | 1,949 (96.2%) | 77 (3.8%) |
| Single Unit, Attached | 178 (100.0%) | 0 (0.0%) |
| 2 Unit Apartments | 75 (73.5%) | 27 (26.5%) |
| 3 or 4 Unit Apartments | 14 (50.0%) | 14 (50.0%) |
| 5 to 9 Unit Apartments | 0 (0.0%) | 35 (100.0%) |
| 10 or more Apartments | 18 (19.4%) | 75 (80.6%) |
| Mobile Home / Other | 7 (100.0%) | 0 (0.0%) |
| Total | 2,241 (90.8%) | 228 (9.2%) |
Housing Structures by Number of Rooms in Cochituate
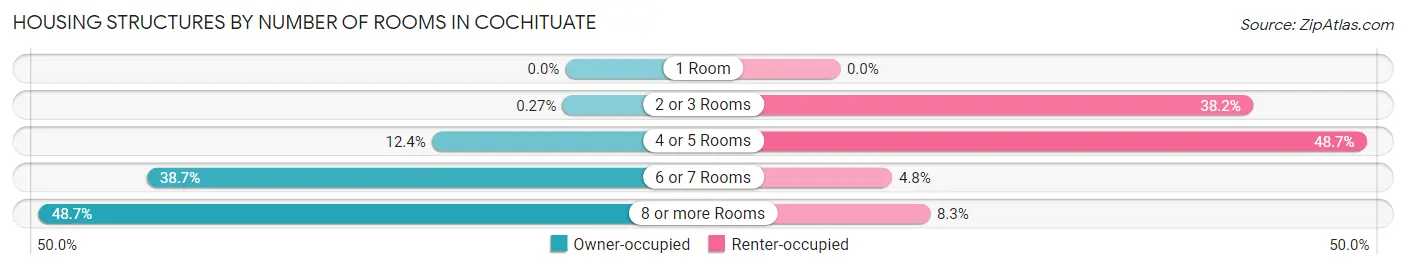
| Number of Rooms | Owner-occupied | Renter-occupied |
| 1 Room | 0 (0.0%) | 0 (0.0%) |
| 2 or 3 Rooms | 6 (0.3%) | 87 (38.2%) |
| 4 or 5 Rooms | 277 (12.4%) | 111 (48.7%) |
| 6 or 7 Rooms | 867 (38.7%) | 11 (4.8%) |
| 8 or more Rooms | 1,091 (48.7%) | 19 (8.3%) |
| Total | 2,241 (100.0%) | 228 (100.0%) |
Housing Structure by Heating Type in Cochituate
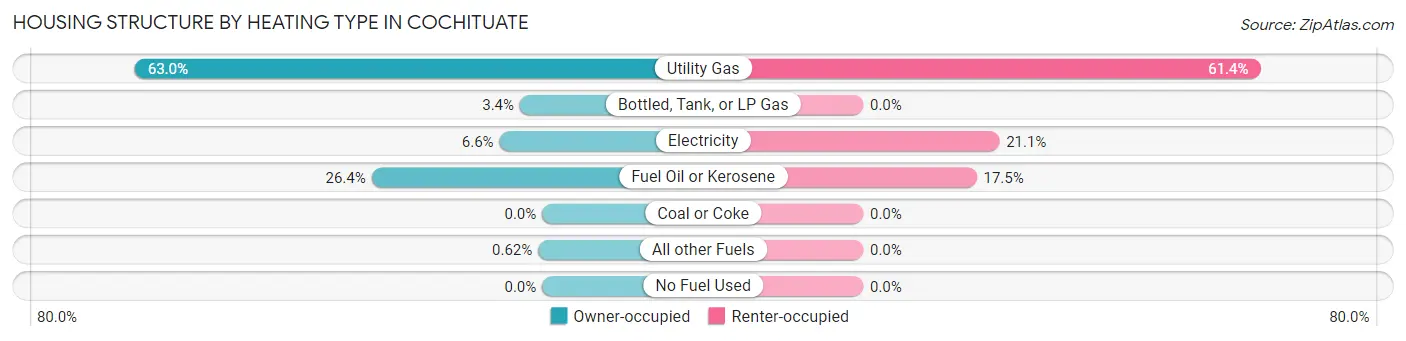
| Heating Type | Owner-occupied | Renter-occupied |
| Utility Gas | 1,411 (63.0%) | 140 (61.4%) |
| Bottled, Tank, or LP Gas | 77 (3.4%) | 0 (0.0%) |
| Electricity | 148 (6.6%) | 48 (21.0%) |
| Fuel Oil or Kerosene | 591 (26.4%) | 40 (17.5%) |
| Coal or Coke | 0 (0.0%) | 0 (0.0%) |
| All other Fuels | 14 (0.6%) | 0 (0.0%) |
| No Fuel Used | 0 (0.0%) | 0 (0.0%) |
| Total | 2,241 (100.0%) | 228 (100.0%) |
Household Vehicle Usage in Cochituate
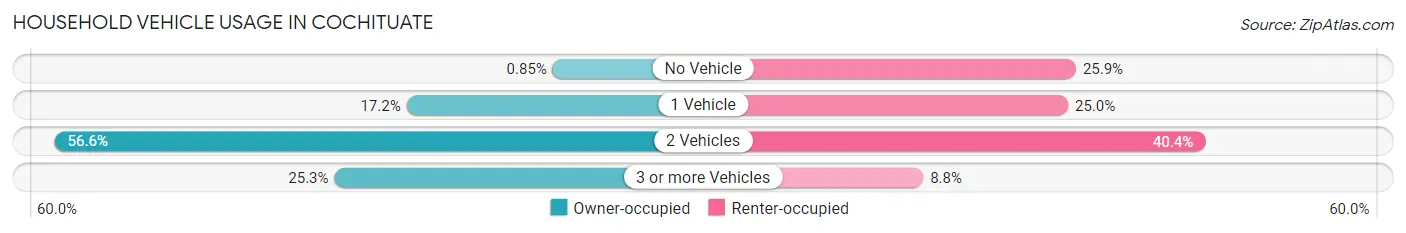
| Vehicles per Household | Owner-occupied | Renter-occupied |
| No Vehicle | 19 (0.9%) | 59 (25.9%) |
| 1 Vehicle | 386 (17.2%) | 57 (25.0%) |
| 2 Vehicles | 1,269 (56.6%) | 92 (40.4%) |
| 3 or more Vehicles | 567 (25.3%) | 20 (8.8%) |
| Total | 2,241 (100.0%) | 228 (100.0%) |
Real Estate & Mortgages in Cochituate
Real Estate and Mortgage Overview in Cochituate
| Characteristic | Without Mortgage | With Mortgage |
| Housing Units | 704 | 1,537 |
| Median Property Value | $805,200 | $810,000 |
| Median Household Income | $125,500 | $1,142 |
| Monthly Housing Costs | $1,501 | $1,109 |
| Real Estate Taxes | $10,001 | $0 |
Property Value by Mortgage Status in Cochituate
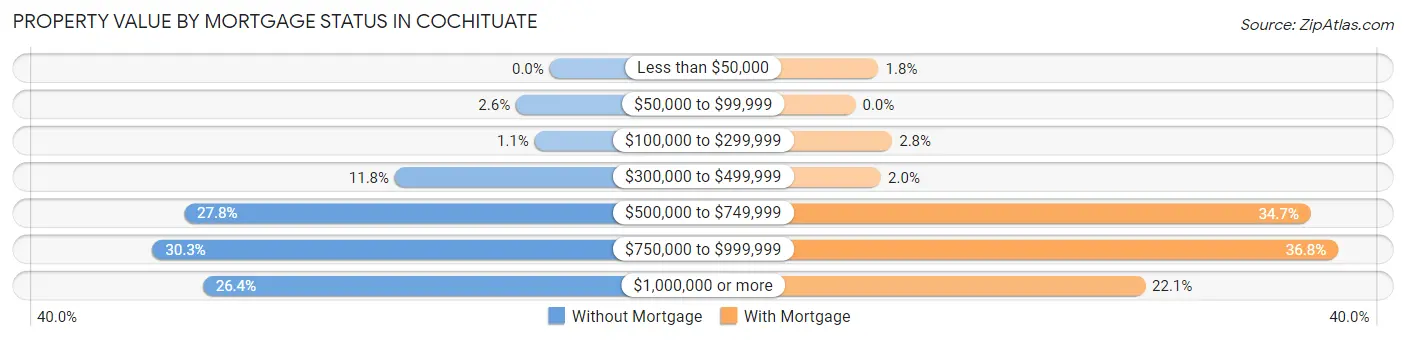
| Property Value | Without Mortgage | With Mortgage |
| Less than $50,000 | 0 (0.0%) | 27 (1.8%) |
| $50,000 to $99,999 | 18 (2.6%) | 0 (0.0%) |
| $100,000 to $299,999 | 8 (1.1%) | 43 (2.8%) |
| $300,000 to $499,999 | 83 (11.8%) | 30 (1.9%) |
| $500,000 to $749,999 | 196 (27.8%) | 533 (34.7%) |
| $750,000 to $999,999 | 213 (30.3%) | 565 (36.8%) |
| $1,000,000 or more | 186 (26.4%) | 339 (22.1%) |
| Total | 704 (100.0%) | 1,537 (100.0%) |
Household Income by Mortgage Status in Cochituate
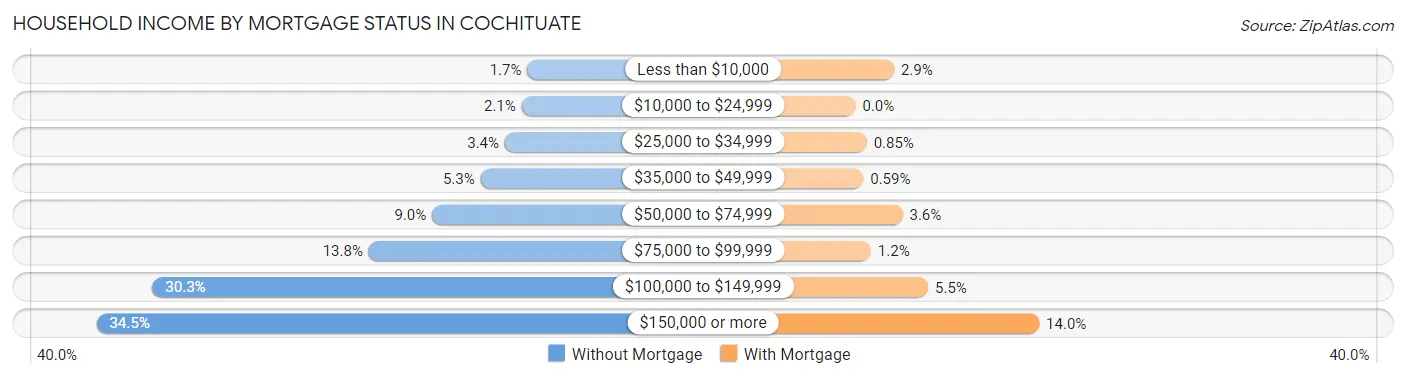
| Household Income | Without Mortgage | With Mortgage |
| Less than $10,000 | 12 (1.7%) | 45 (2.9%) |
| $10,000 to $24,999 | 15 (2.1%) | 0 (0.0%) |
| $25,000 to $34,999 | 24 (3.4%) | 13 (0.9%) |
| $35,000 to $49,999 | 37 (5.3%) | 9 (0.6%) |
| $50,000 to $74,999 | 63 (8.9%) | 55 (3.6%) |
| $75,000 to $99,999 | 97 (13.8%) | 18 (1.2%) |
| $100,000 to $149,999 | 213 (30.3%) | 85 (5.5%) |
| $150,000 or more | 243 (34.5%) | 215 (14.0%) |
| Total | 704 (100.0%) | 1,537 (100.0%) |
Property Value to Household Income Ratio in Cochituate
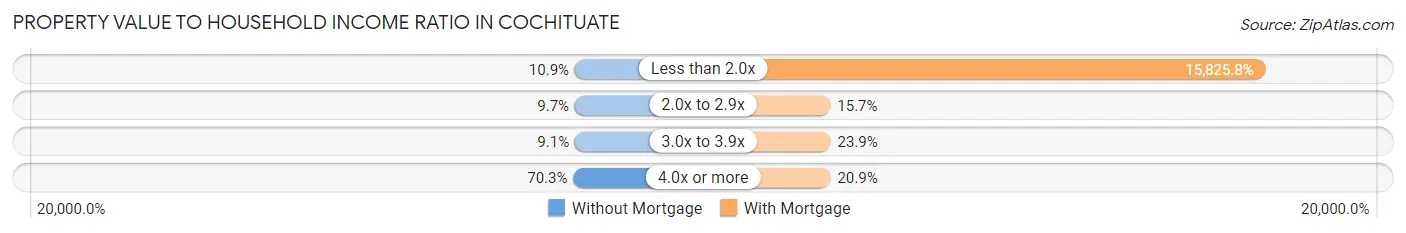
| Value-to-Income Ratio | Without Mortgage | With Mortgage |
| Less than 2.0x | 77 (10.9%) | 243,242 (15,825.8%) |
| 2.0x to 2.9x | 68 (9.7%) | 241 (15.7%) |
| 3.0x to 3.9x | 64 (9.1%) | 368 (23.9%) |
| 4.0x or more | 495 (70.3%) | 321 (20.9%) |
| Total | 704 (100.0%) | 1,537 (100.0%) |
Real Estate Taxes by Mortgage Status in Cochituate
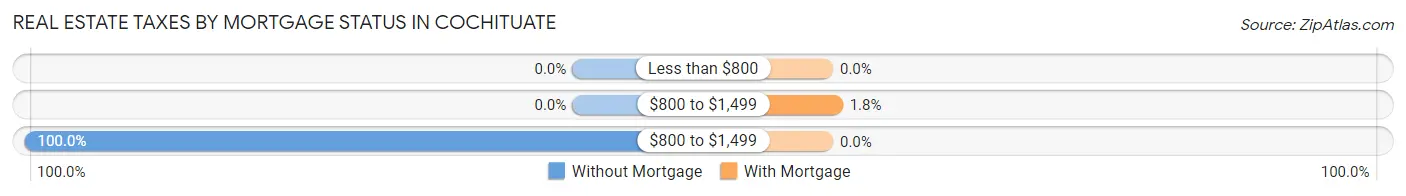
| Property Taxes | Without Mortgage | With Mortgage |
| Less than $800 | 0 (0.0%) | 0 (0.0%) |
| $800 to $1,499 | 0 (0.0%) | 27 (1.8%) |
| $800 to $1,499 | 704 (100.0%) | 0 (0.0%) |
| Total | 704 (100.0%) | 1,537 (100.0%) |
Health & Disability in Cochituate
Health Insurance Coverage by Age in Cochituate
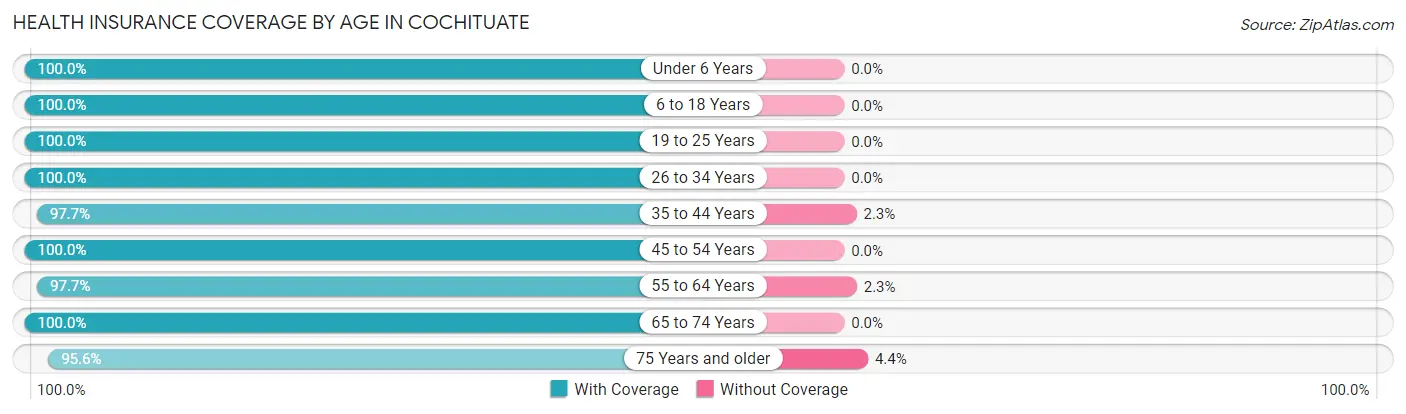
| Age Bracket | With Coverage | Without Coverage |
| Under 6 Years | 435 (100.0%) | 0 (0.0%) |
| 6 to 18 Years | 1,389 (100.0%) | 0 (0.0%) |
| 19 to 25 Years | 345 (100.0%) | 0 (0.0%) |
| 26 to 34 Years | 581 (100.0%) | 0 (0.0%) |
| 35 to 44 Years | 859 (97.7%) | 20 (2.3%) |
| 45 to 54 Years | 905 (100.0%) | 0 (0.0%) |
| 55 to 64 Years | 1,089 (97.7%) | 26 (2.3%) |
| 65 to 74 Years | 690 (100.0%) | 0 (0.0%) |
| 75 Years and older | 542 (95.6%) | 25 (4.4%) |
| Total | 6,835 (99.0%) | 71 (1.0%) |
Health Insurance Coverage by Citizenship Status in Cochituate
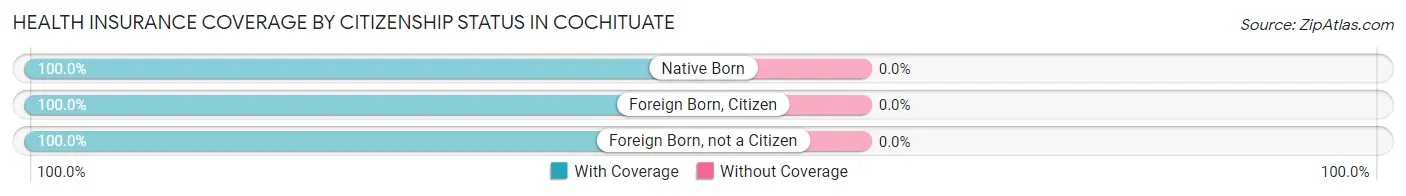
| Citizenship Status | With Coverage | Without Coverage |
| Native Born | 435 (100.0%) | 0 (0.0%) |
| Foreign Born, Citizen | 1,389 (100.0%) | 0 (0.0%) |
| Foreign Born, not a Citizen | 345 (100.0%) | 0 (0.0%) |
Health Insurance Coverage by Household Income in Cochituate
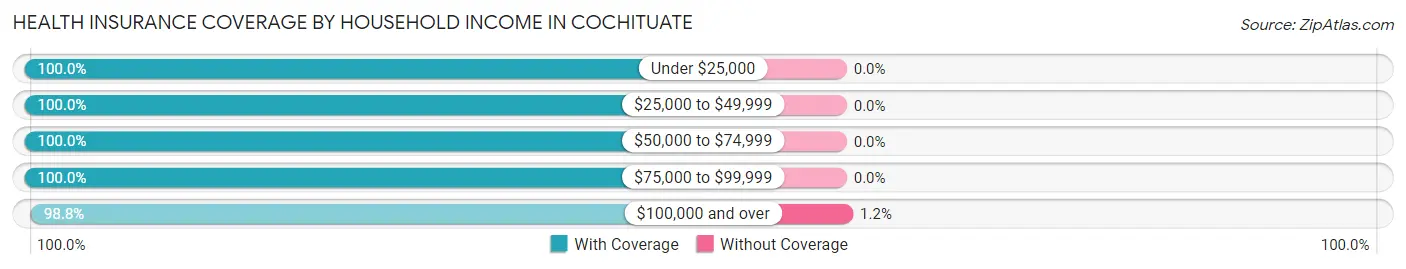
| Household Income | With Coverage | Without Coverage |
| Under $25,000 | 153 (100.0%) | 0 (0.0%) |
| $25,000 to $49,999 | 281 (100.0%) | 0 (0.0%) |
| $50,000 to $74,999 | 178 (100.0%) | 0 (0.0%) |
| $75,000 to $99,999 | 311 (100.0%) | 0 (0.0%) |
| $100,000 and over | 5,907 (98.8%) | 71 (1.2%) |
Public vs Private Health Insurance Coverage by Age in Cochituate
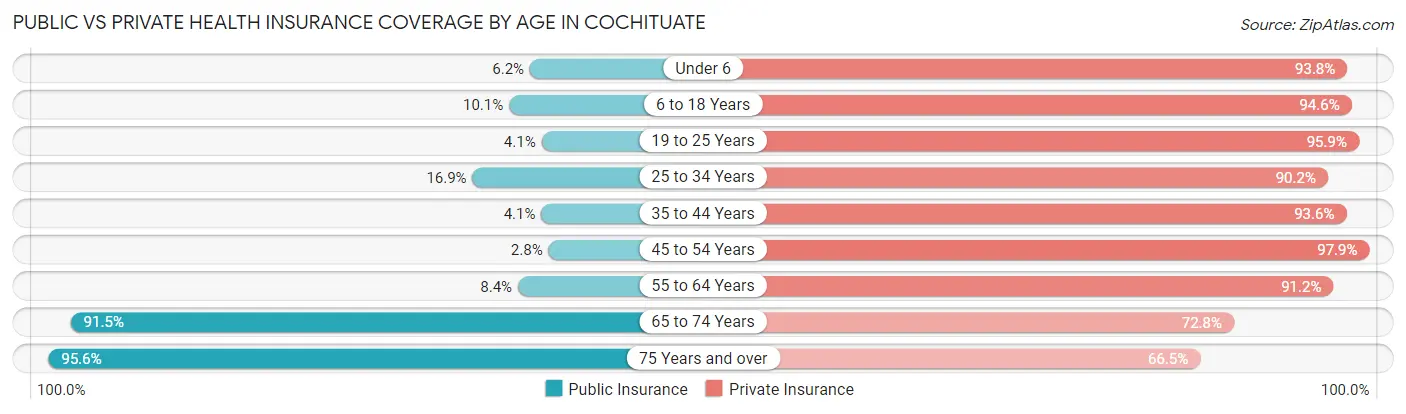
| Age Bracket | Public Insurance | Private Insurance |
| Under 6 | 27 (6.2%) | 408 (93.8%) |
| 6 to 18 Years | 140 (10.1%) | 1,314 (94.6%) |
| 19 to 25 Years | 14 (4.1%) | 331 (95.9%) |
| 25 to 34 Years | 98 (16.9%) | 524 (90.2%) |
| 35 to 44 Years | 36 (4.1%) | 823 (93.6%) |
| 45 to 54 Years | 25 (2.8%) | 886 (97.9%) |
| 55 to 64 Years | 94 (8.4%) | 1,017 (91.2%) |
| 65 to 74 Years | 631 (91.4%) | 502 (72.8%) |
| 75 Years and over | 542 (95.6%) | 377 (66.5%) |
| Total | 1,607 (23.3%) | 6,182 (89.5%) |
Disability Status by Sex by Age in Cochituate
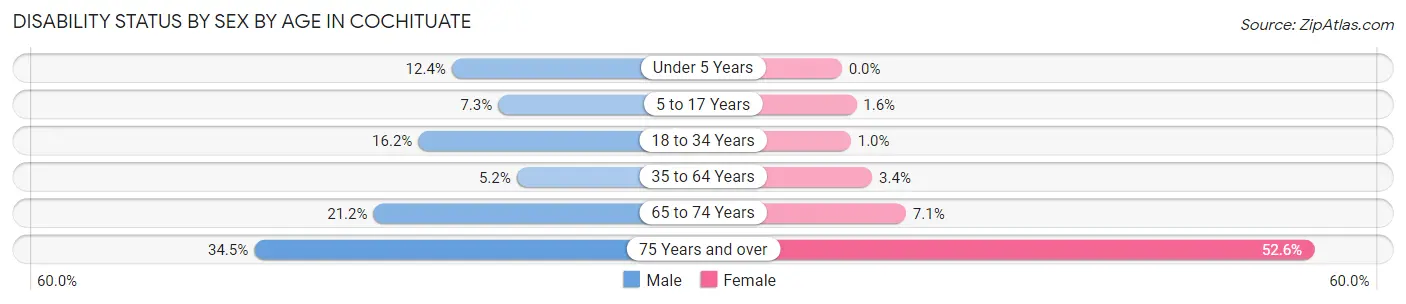
| Age Bracket | Male | Female |
| Under 5 Years | 28 (12.4%) | 0 (0.0%) |
| 5 to 17 Years | 50 (7.3%) | 11 (1.6%) |
| 18 to 34 Years | 93 (16.2%) | 5 (1.0%) |
| 35 to 64 Years | 77 (5.2%) | 48 (3.4%) |
| 65 to 74 Years | 69 (21.2%) | 26 (7.1%) |
| 75 Years and over | 82 (34.4%) | 173 (52.6%) |
Disability Class by Sex by Age in Cochituate
Disability Class: Hearing Difficulty
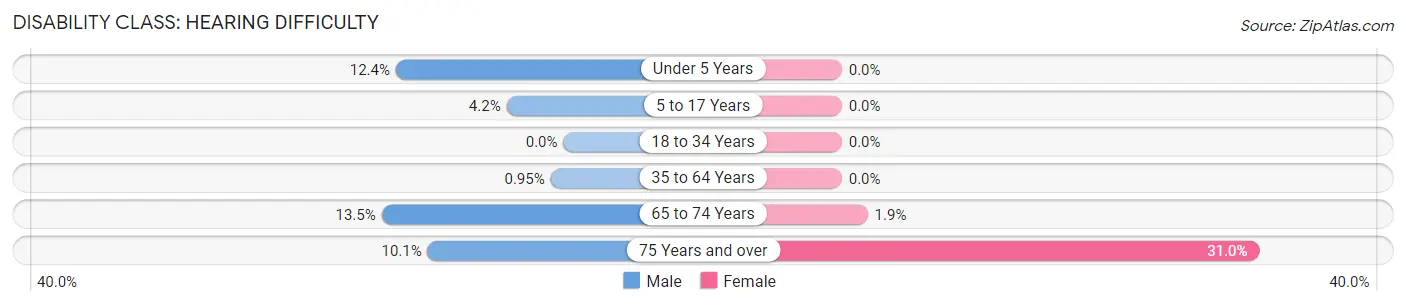
| Age Bracket | Male | Female |
| Under 5 Years | 28 (12.4%) | 0 (0.0%) |
| 5 to 17 Years | 29 (4.2%) | 0 (0.0%) |
| 18 to 34 Years | 0 (0.0%) | 0 (0.0%) |
| 35 to 64 Years | 14 (0.9%) | 0 (0.0%) |
| 65 to 74 Years | 44 (13.5%) | 7 (1.9%) |
| 75 Years and over | 24 (10.1%) | 102 (31.0%) |
Disability Class: Vision Difficulty
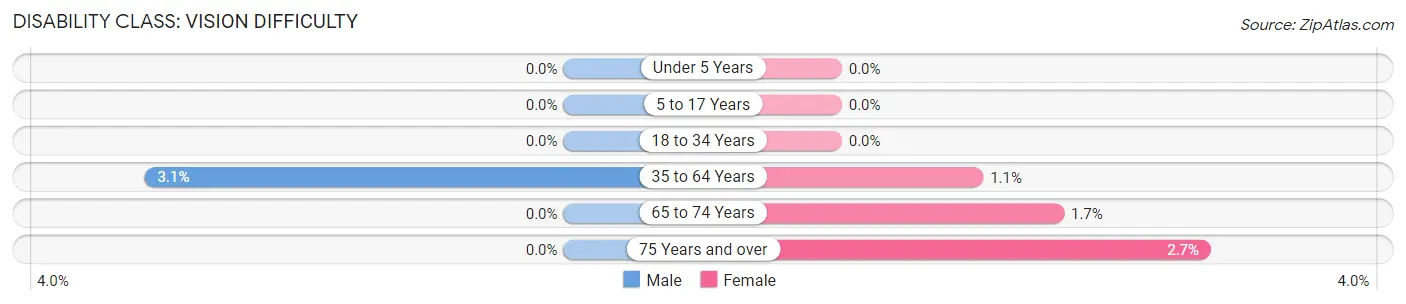
| Age Bracket | Male | Female |
| Under 5 Years | 0 (0.0%) | 0 (0.0%) |
| 5 to 17 Years | 0 (0.0%) | 0 (0.0%) |
| 18 to 34 Years | 0 (0.0%) | 0 (0.0%) |
| 35 to 64 Years | 46 (3.1%) | 15 (1.1%) |
| 65 to 74 Years | 0 (0.0%) | 6 (1.7%) |
| 75 Years and over | 0 (0.0%) | 9 (2.7%) |
Disability Class: Cognitive Difficulty
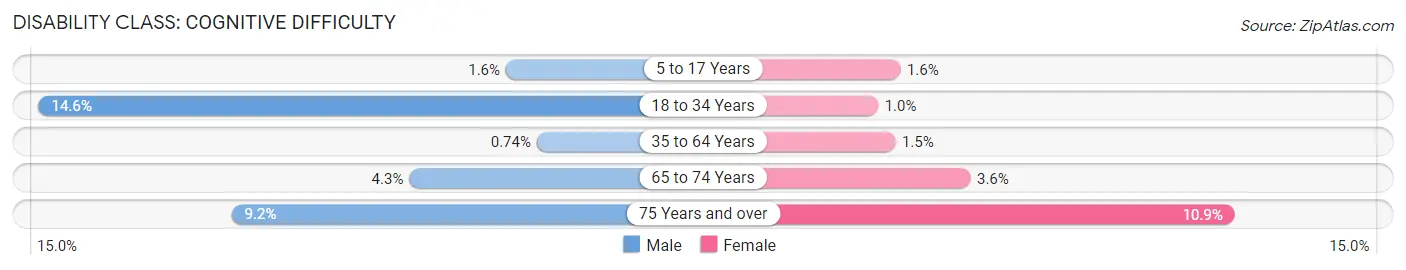
| Age Bracket | Male | Female |
| 5 to 17 Years | 11 (1.6%) | 11 (1.6%) |
| 18 to 34 Years | 84 (14.6%) | 5 (1.0%) |
| 35 to 64 Years | 11 (0.7%) | 21 (1.5%) |
| 65 to 74 Years | 14 (4.3%) | 13 (3.6%) |
| 75 Years and over | 22 (9.2%) | 36 (10.9%) |
Disability Class: Ambulatory Difficulty
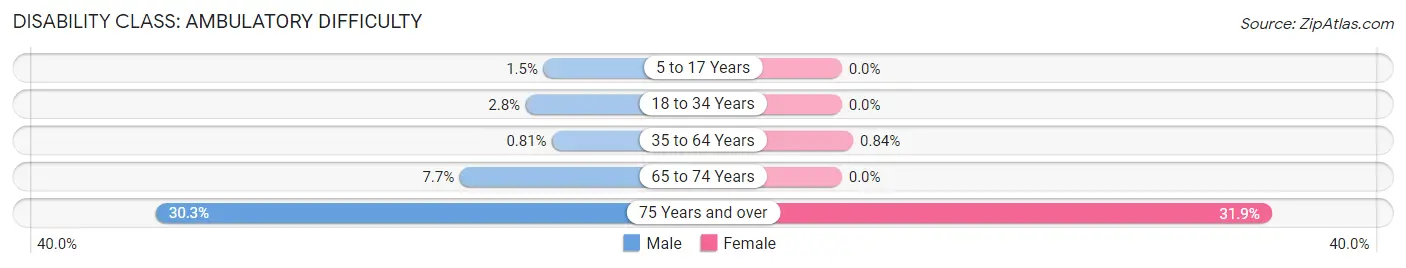
| Age Bracket | Male | Female |
| 5 to 17 Years | 10 (1.5%) | 0 (0.0%) |
| 18 to 34 Years | 16 (2.8%) | 0 (0.0%) |
| 35 to 64 Years | 12 (0.8%) | 12 (0.8%) |
| 65 to 74 Years | 25 (7.7%) | 0 (0.0%) |
| 75 Years and over | 72 (30.2%) | 105 (31.9%) |
Disability Class: Self-Care Difficulty
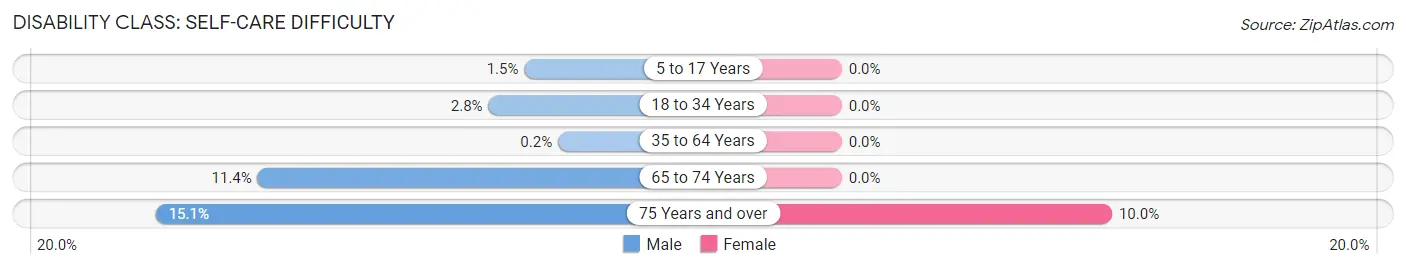
| Age Bracket | Male | Female |
| 5 to 17 Years | 10 (1.5%) | 0 (0.0%) |
| 18 to 34 Years | 16 (2.8%) | 0 (0.0%) |
| 35 to 64 Years | 3 (0.2%) | 0 (0.0%) |
| 65 to 74 Years | 37 (11.4%) | 0 (0.0%) |
| 75 Years and over | 36 (15.1%) | 33 (10.0%) |
Technology Access in Cochituate
Computing Device Access in Cochituate
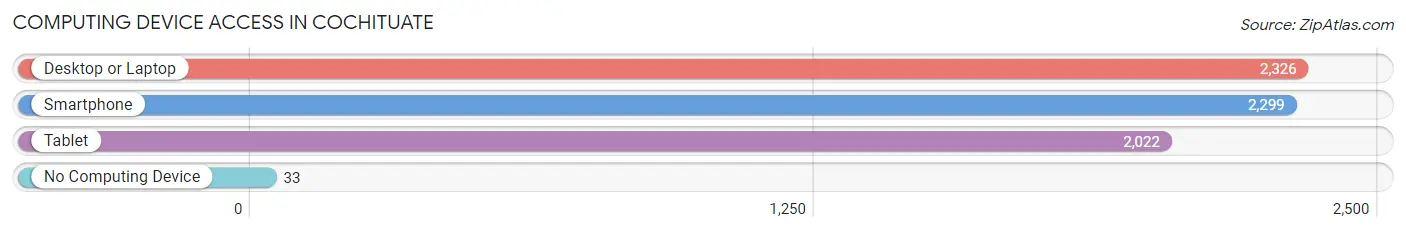
| Device Type | # Households | % Households |
| Desktop or Laptop | 2,326 | 94.2% |
| Smartphone | 2,299 | 93.1% |
| Tablet | 2,022 | 81.9% |
| No Computing Device | 33 | 1.3% |
| Total | 2,469 | 100.0% |
Internet Access in Cochituate
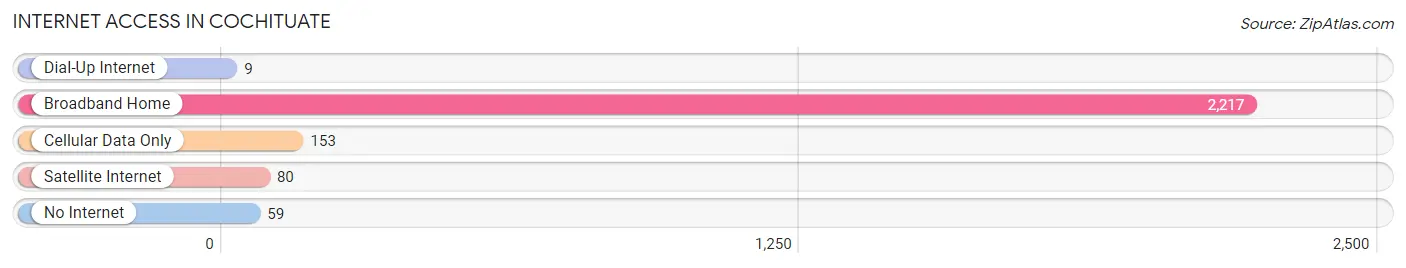
| Internet Type | # Households | % Households |
| Dial-Up Internet | 9 | 0.4% |
| Broadband Home | 2,217 | 89.8% |
| Cellular Data Only | 153 | 6.2% |
| Satellite Internet | 80 | 3.2% |
| No Internet | 59 | 2.4% |
| Total | 2,469 | 100.0% |
Cochituate Summary
Cochituate is a small town located in the state of Massachusetts, in the United States. It is situated in the eastern part of the state, in the county of Middlesex. The town is bordered by the towns of Natick, Wayland, Framingham, and Sudbury. The population of Cochituate was estimated to be 6,845 in the year 2020.
History
Cochituate was first settled in 1660 by a group of settlers from Watertown. The town was originally part of the Natick Plantation, and was known as South Natick. In 1713, the town was officially incorporated as Cochituate, named after the Cochituate River which runs through the town.
The town was primarily an agricultural community for many years, with the main crops being corn, potatoes, and hay. In the late 19th century, the town began to develop into a small industrial center, with several factories being built in the area. The most notable of these was the Cochituate Glass Works, which produced glass bottles and jars.
Geography
Cochituate is located in eastern Massachusetts, in the county of Middlesex. The town is bordered by the towns of Natick, Wayland, Framingham, and Sudbury. The town is situated on the Cochituate River, which runs through the center of town. The town is mostly flat, with some hills in the northern part of town.
The town has a total area of 8.3 square miles, of which 8.2 square miles is land and 0.1 square miles is water. The town is located approximately 20 miles west of Boston.
Economy
The economy of Cochituate is primarily based on the service industry. The town is home to several small businesses, including restaurants, retail stores, and professional services. The town is also home to several large employers, including the Cochituate Glass Works, which produces glass bottles and jars.
The town is also home to several technology companies, including the software company, EMC Corporation. The town is also home to several medical facilities, including the MetroWest Medical Center.
Demographics
As of the 2020 census, the population of Cochituate was estimated to be 6,845. The racial makeup of the town was 87.3% White, 5.2% African American, 0.7% Native American, 2.3% Asian, 0.1% Pacific Islander, 1.7% from other races, and 2.9% from two or more races. Hispanic or Latino of any race were 4.3% of the population.
The median income for a household in the town was $76,945, and the median income for a family was $90,945. The per capita income for the town was $35,945. About 4.3% of families and 5.7% of the population were below the poverty line, including 6.3% of those under age 18 and 4.3% of those age 65 or over.
Common Questions
What is Per Capita Income in Cochituate?
Per Capita income in Cochituate is $83,410.
What is the Median Family Income in Cochituate?
Median Family Income in Cochituate is $235,603.
What is the Median Household income in Cochituate?
Median Household Income in Cochituate is $181,494.
What is Income or Wage Gap in Cochituate?
Income or Wage Gap in Cochituate is 49.8%.
Women in Cochituate earn 50.2 cents for every dollar earned by a man.
What is Family Income Deficit in Cochituate?
Family Income Deficit in Cochituate is $5,919.
Families that are below poverty line in Cochituate earn $5,919 less on average than the poverty threshold level.
What is Inequality or Gini Index in Cochituate?
Inequality or Gini Index in Cochituate is 0.41.
What is the Total Population of Cochituate?
Total Population of Cochituate is 6,937.
What is the Total Male Population of Cochituate?
Total Male Population of Cochituate is 3,552.
What is the Total Female Population of Cochituate?
Total Female Population of Cochituate is 3,385.
What is the Ratio of Males per 100 Females in Cochituate?
There are 104.93 Males per 100 Females in Cochituate.
What is the Ratio of Females per 100 Males in Cochituate?
There are 95.30 Females per 100 Males in Cochituate.
What is the Median Population Age in Cochituate?
Median Population Age in Cochituate is 43.7 Years.
What is the Average Family Size in Cochituate
Average Family Size in Cochituate is 3.1 People.
What is the Average Household Size in Cochituate
Average Household Size in Cochituate is 2.8 People.
How Large is the Labor Force in Cochituate?
There are 3,533 People in the Labor Forcein in Cochituate.
What is the Percentage of People in the Labor Force in Cochituate?
64.9% of People are in the Labor Force in Cochituate.
What is the Unemployment Rate in Cochituate?
Unemployment Rate in Cochituate is 2.7%.