Malden, MA Map & Demographics
Malden Map
Malden Overview
$43,728
PER CAPITA INCOME
$102,510
AVG FAMILY INCOME
$90,295
AVG HOUSEHOLD INCOME
16.5%
WAGE / INCOME GAP [ % ]
83.5¢/ $1
WAGE / INCOME GAP [ $ ]
$8,818
FAMILY INCOME DEFICIT
0.45
INEQUALITY / GINI INDEX
65,463
TOTAL POPULATION
33,848
MALE POPULATION
31,615
FEMALE POPULATION
107.06
MALES / 100 FEMALES
93.40
FEMALES / 100 MALES
35.4
MEDIAN AGE
3.1
AVG FAMILY SIZE
2.5
AVG HOUSEHOLD SIZE
38,436
LABOR FORCE [ PEOPLE ]
70.4%
PERCENT IN LABOR FORCE
6.6%
UNEMPLOYMENT RATE
Malden Zip Codes
Income in Malden
Income Overview in Malden
Per Capita Income in Malden is $43,728, while median incomes of families and households are $102,510 and $90,295 respectively.
| Characteristic | Number | Measure |
| Per Capita Income | 65,463 | $43,728 |
| Median Family Income | 15,985 | $102,510 |
| Mean Family Income | 15,985 | $125,204 |
| Median Household Income | 25,809 | $90,295 |
| Mean Household Income | 25,809 | $111,391 |
| Income Deficit | 15,985 | $8,818 |
| Wage / Income Gap (%) | 65,463 | 16.48% |
| Wage / Income Gap ($) | 65,463 | 83.52¢ per $1 |
| Gini / Inequality Index | 65,463 | 0.45 |
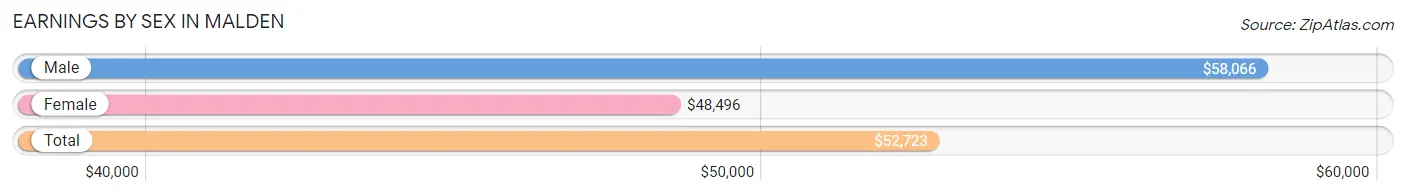
Earnings by Sex in Malden
Average Earnings in Malden are $52,723, $58,066 for men and $48,496 for women, a difference of 16.5%.
| Sex | Number | Average Earnings |
| Male | 21,154 (54.2%) | $58,066 |
| Female | 17,877 (45.8%) | $48,496 |
| Total | 39,031 (100.0%) | $52,723 |
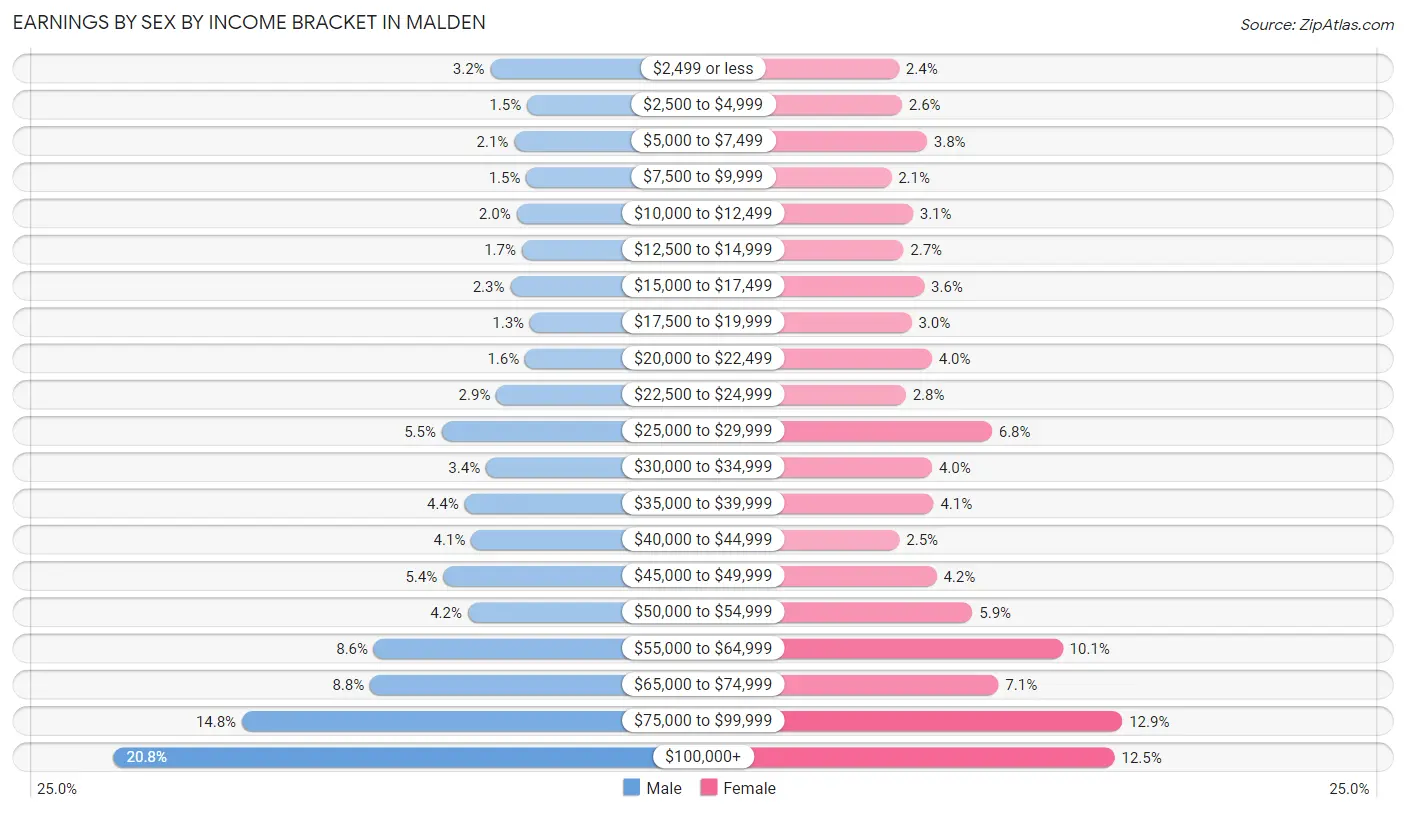
Earnings by Sex by Income Bracket in Malden
The most common earnings brackets in Malden are $100,000+ for men (4,406 | 20.8%) and $75,000 to $99,999 for women (2,306 | 12.9%).
| Income | Male | Female |
| $2,499 or less | 672 (3.2%) | 436 (2.4%) |
| $2,500 to $4,999 | 310 (1.5%) | 461 (2.6%) |
| $5,000 to $7,499 | 438 (2.1%) | 671 (3.7%) |
| $7,500 to $9,999 | 317 (1.5%) | 372 (2.1%) |
| $10,000 to $12,499 | 414 (2.0%) | 553 (3.1%) |
| $12,500 to $14,999 | 361 (1.7%) | 473 (2.6%) |
| $15,000 to $17,499 | 475 (2.2%) | 648 (3.6%) |
| $17,500 to $19,999 | 282 (1.3%) | 542 (3.0%) |
| $20,000 to $22,499 | 331 (1.6%) | 711 (4.0%) |
| $22,500 to $24,999 | 615 (2.9%) | 493 (2.8%) |
| $25,000 to $29,999 | 1,156 (5.5%) | 1,214 (6.8%) |
| $30,000 to $34,999 | 718 (3.4%) | 714 (4.0%) |
| $35,000 to $39,999 | 928 (4.4%) | 725 (4.1%) |
| $40,000 to $44,999 | 864 (4.1%) | 439 (2.5%) |
| $45,000 to $49,999 | 1,142 (5.4%) | 750 (4.2%) |
| $50,000 to $54,999 | 897 (4.2%) | 1,051 (5.9%) |
| $55,000 to $64,999 | 1,828 (8.6%) | 1,807 (10.1%) |
| $65,000 to $74,999 | 1,865 (8.8%) | 1,269 (7.1%) |
| $75,000 to $99,999 | 3,135 (14.8%) | 2,306 (12.9%) |
| $100,000+ | 4,406 (20.8%) | 2,242 (12.5%) |
| Total | 21,154 (100.0%) | 17,877 (100.0%) |
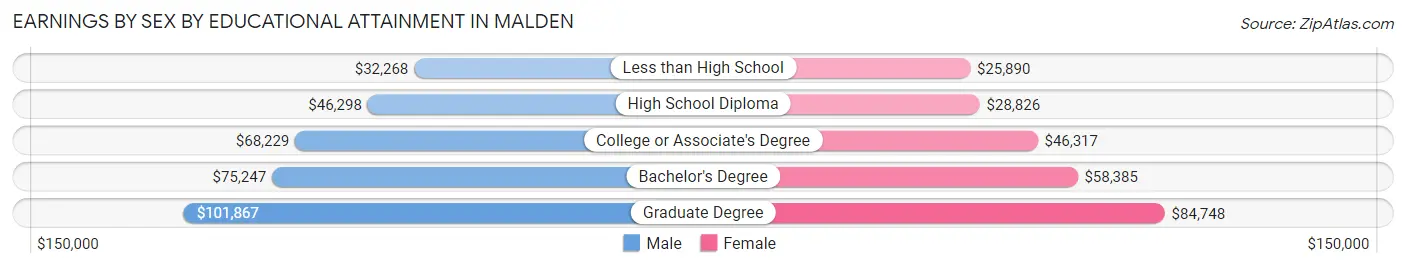
Earnings by Sex by Educational Attainment in Malden
Average earnings in Malden are $65,501 for men and $52,095 for women, a difference of 20.5%. Men with an educational attainment of graduate degree enjoy the highest average annual earnings of $101,867, while those with less than high school education earn the least with $32,268. Women with an educational attainment of graduate degree earn the most with the average annual earnings of $84,748, while those with less than high school education have the smallest earnings of $25,890.
| Educational Attainment | Male Income | Female Income |
| Less than High School | $32,268 | $25,890 |
| High School Diploma | $46,298 | $28,826 |
| College or Associate's Degree | $68,229 | $46,317 |
| Bachelor's Degree | $75,247 | $58,385 |
| Graduate Degree | $101,867 | $84,748 |
| Total | $65,501 | $52,095 |
Family Income in Malden
Family Income Brackets in Malden
According to the Malden family income data, there are 3,229 families falling into the $100,000 to $149,999 income range, which is the most common income bracket and makes up 20.2% of all families. Conversely, the $10,000 to $14,999 income bracket is the least frequent group with only 240 families (1.5%) belonging to this category.
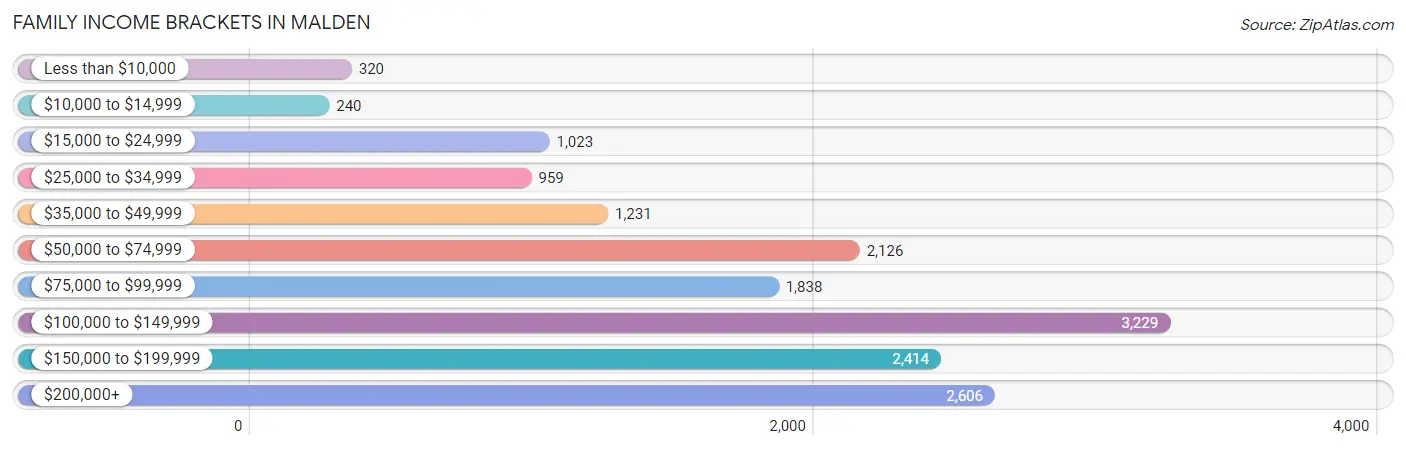
| Income Bracket | # Families | % Families |
| Less than $10,000 | 320 | 2.0% |
| $10,000 to $14,999 | 240 | 1.5% |
| $15,000 to $24,999 | 1,023 | 6.4% |
| $25,000 to $34,999 | 959 | 6.0% |
| $35,000 to $49,999 | 1,231 | 7.7% |
| $50,000 to $74,999 | 2,126 | 13.3% |
| $75,000 to $99,999 | 1,838 | 11.5% |
| $100,000 to $149,999 | 3,229 | 20.2% |
| $150,000 to $199,999 | 2,414 | 15.1% |
| $200,000+ | 2,606 | 16.3% |
Family Income by Famaliy Size in Malden
7+ person families (244 | 1.5%) account for the highest median family income in Malden with $220,221 per family, while 2-person families (6,875 | 43.0%) have the highest median income of $45,612 per family member.
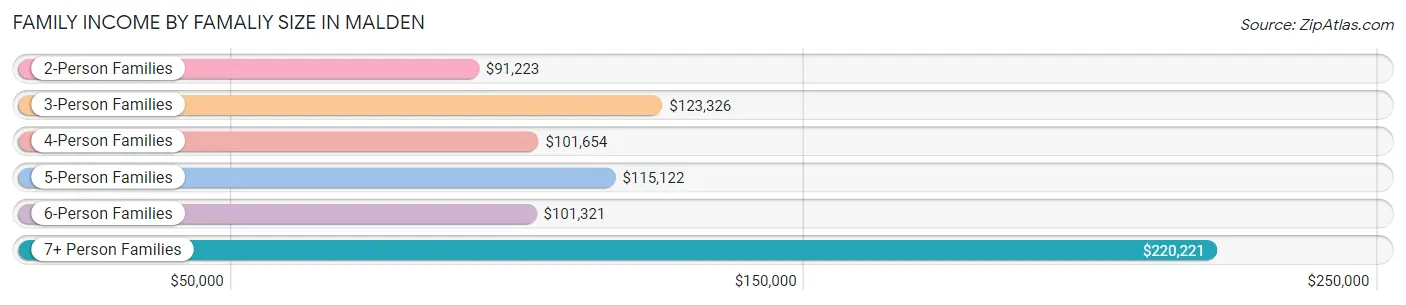
| Income Bracket | # Families | Median Income |
| 2-Person Families | 6,875 (43.0%) | $91,223 |
| 3-Person Families | 3,410 (21.3%) | $123,326 |
| 4-Person Families | 3,843 (24.0%) | $101,654 |
| 5-Person Families | 1,114 (7.0%) | $115,122 |
| 6-Person Families | 499 (3.1%) | $101,321 |
| 7+ Person Families | 244 (1.5%) | $220,221 |
| Total | 15,985 (100.0%) | $102,510 |
Family Income by Number of Earners in Malden
The median family income in Malden is $102,510, with families comprising 3+ earners (2,638) having the highest median family income of $153,833, while families with no earners (1,402) have the lowest median family income of $24,664, accounting for 16.5% and 8.8% of families, respectively.
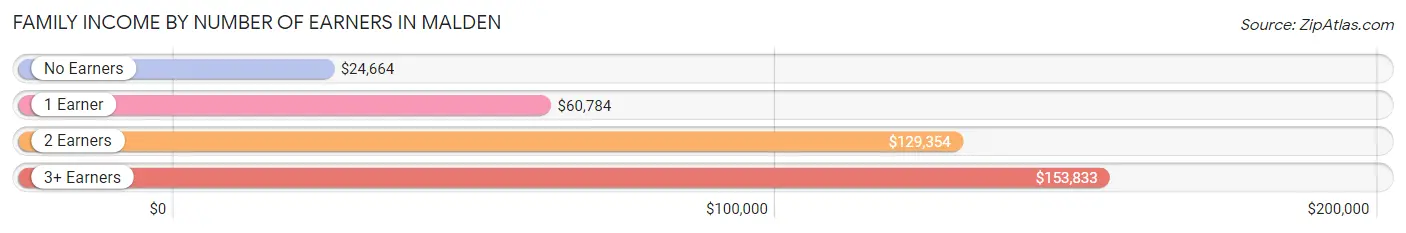
| Number of Earners | # Families | Median Income |
| No Earners | 1,402 (8.8%) | $24,664 |
| 1 Earner | 4,481 (28.0%) | $60,784 |
| 2 Earners | 7,464 (46.7%) | $129,354 |
| 3+ Earners | 2,638 (16.5%) | $153,833 |
| Total | 15,985 (100.0%) | $102,510 |
Household Income in Malden
Household Income Brackets in Malden
With 4,955 households falling in the category, the $100,000 to $149,999 income range is the most frequent in Malden, accounting for 19.2% of all households. In contrast, only 826 households (3.2%) fall into the $10,000 to $14,999 income bracket, making it the least populous group.
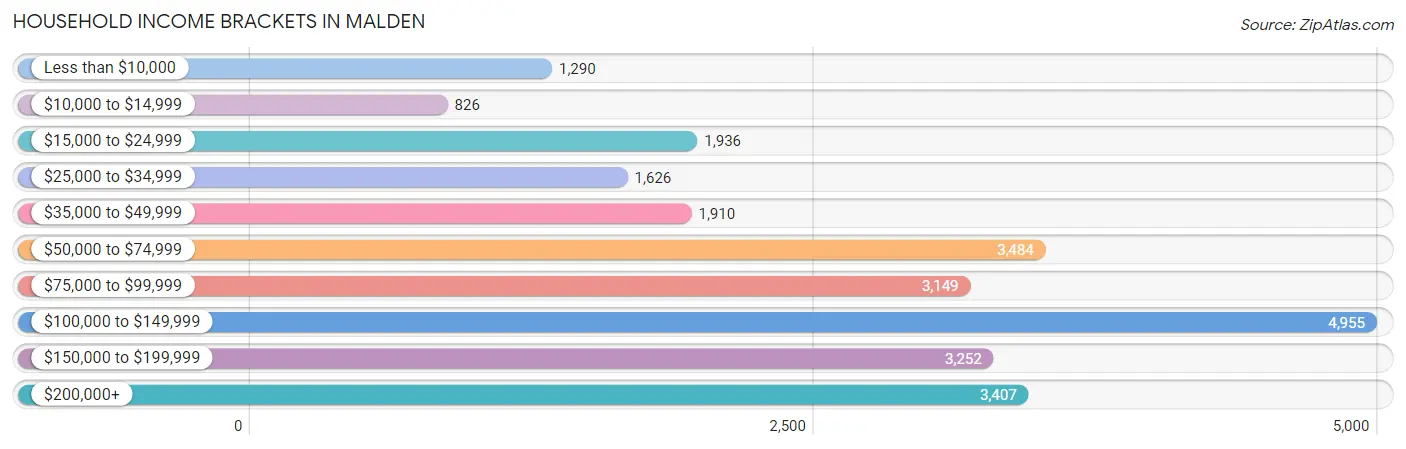
| Income Bracket | # Households | % Households |
| Less than $10,000 | 1,290 | 5.0% |
| $10,000 to $14,999 | 826 | 3.2% |
| $15,000 to $24,999 | 1,936 | 7.5% |
| $25,000 to $34,999 | 1,626 | 6.3% |
| $35,000 to $49,999 | 1,910 | 7.4% |
| $50,000 to $74,999 | 3,484 | 13.5% |
| $75,000 to $99,999 | 3,149 | 12.2% |
| $100,000 to $149,999 | 4,955 | 19.2% |
| $150,000 to $199,999 | 3,252 | 12.6% |
| $200,000+ | 3,407 | 13.2% |
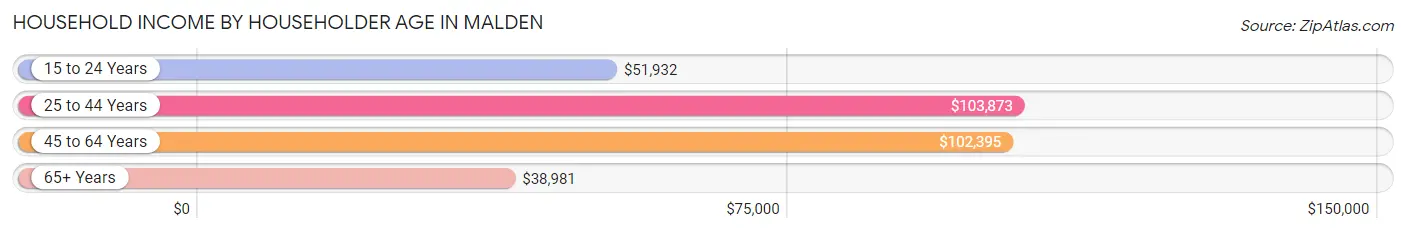
Household Income by Householder Age in Malden
The median household income in Malden is $90,295, with the highest median household income of $103,873 found in the 25 to 44 years age bracket for the primary householder. A total of 10,845 households (42.0%) fall into this category. Meanwhile, the 65+ years age bracket for the primary householder has the lowest median household income of $38,981, with 5,248 households (20.3%) in this group.
| Income Bracket | # Households | Median Income |
| 15 to 24 Years | 1,296 (5.0%) | $51,932 |
| 25 to 44 Years | 10,845 (42.0%) | $103,873 |
| 45 to 64 Years | 8,420 (32.6%) | $102,395 |
| 65+ Years | 5,248 (20.3%) | $38,981 |
| Total | 25,809 (100.0%) | $90,295 |
Poverty in Malden
Income Below Poverty by Sex and Age in Malden
With 13.1% poverty level for males and 13.9% for females among the residents of Malden, 15 year old males and 18 to 24 year old females are the most vulnerable to poverty, with 152 males (37.8%) and 558 females (23.1%) in their respective age groups living below the poverty level.
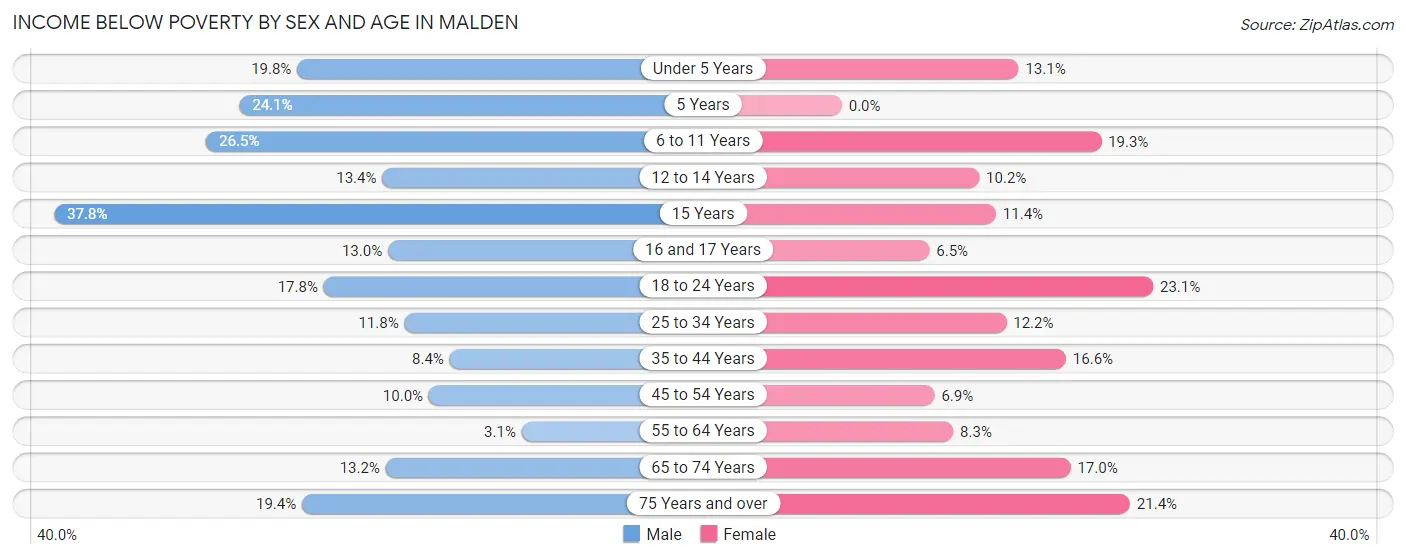
| Age Bracket | Male | Female |
| Under 5 Years | 463 (19.8%) | 232 (13.1%) |
| 5 Years | 135 (24.1%) | 0 (0.0%) |
| 6 to 11 Years | 480 (26.5%) | 331 (19.3%) |
| 12 to 14 Years | 111 (13.4%) | 110 (10.2%) |
| 15 Years | 152 (37.8%) | 27 (11.4%) |
| 16 and 17 Years | 81 (13.0%) | 36 (6.5%) |
| 18 to 24 Years | 681 (17.8%) | 558 (23.1%) |
| 25 to 34 Years | 917 (11.8%) | 748 (12.2%) |
| 35 to 44 Years | 375 (8.4%) | 814 (16.6%) |
| 45 to 54 Years | 413 (10.0%) | 266 (6.9%) |
| 55 to 64 Years | 114 (3.1%) | 315 (8.3%) |
| 65 to 74 Years | 286 (13.2%) | 420 (17.0%) |
| 75 Years and over | 221 (19.4%) | 540 (21.4%) |
| Total | 4,429 (13.1%) | 4,397 (13.9%) |
Income Above Poverty by Sex and Age in Malden
According to the poverty statistics in Malden, males aged 55 to 64 years and females aged 5 years are the age groups that are most secure financially, with 96.9% of males and 100.0% of females in these age groups living above the poverty line.
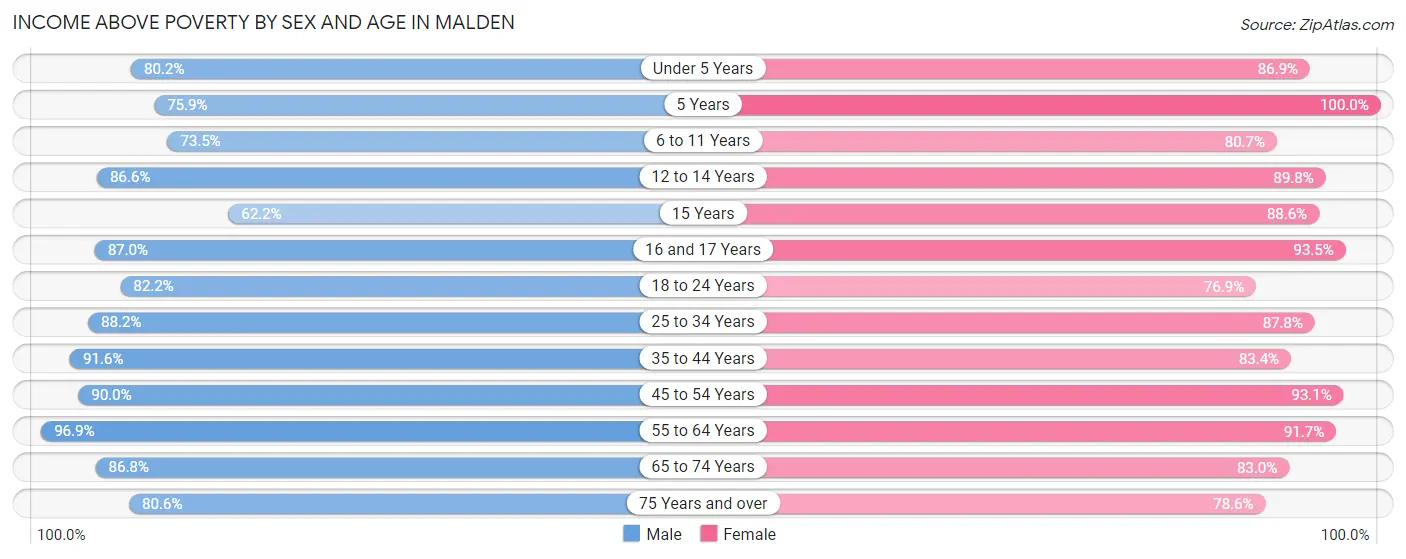
| Age Bracket | Male | Female |
| Under 5 Years | 1,880 (80.2%) | 1,536 (86.9%) |
| 5 Years | 426 (75.9%) | 85 (100.0%) |
| 6 to 11 Years | 1,330 (73.5%) | 1,388 (80.7%) |
| 12 to 14 Years | 715 (86.6%) | 968 (89.8%) |
| 15 Years | 250 (62.2%) | 209 (88.6%) |
| 16 and 17 Years | 541 (87.0%) | 518 (93.5%) |
| 18 to 24 Years | 3,146 (82.2%) | 1,857 (76.9%) |
| 25 to 34 Years | 6,859 (88.2%) | 5,379 (87.8%) |
| 35 to 44 Years | 4,066 (91.6%) | 4,079 (83.4%) |
| 45 to 54 Years | 3,725 (90.0%) | 3,603 (93.1%) |
| 55 to 64 Years | 3,576 (96.9%) | 3,492 (91.7%) |
| 65 to 74 Years | 1,883 (86.8%) | 2,053 (83.0%) |
| 75 Years and over | 918 (80.6%) | 1,985 (78.6%) |
| Total | 29,315 (86.9%) | 27,152 (86.1%) |
Income Below Poverty Among Married-Couple Families in Malden
The poverty statistics for married-couple families in Malden show that 7.1% or 824 of the total 11,605 families live below the poverty line. Families with 5 or more children have the highest poverty rate of 91.7%, comprising of 55 families. On the other hand, families with no children have the lowest poverty rate of 3.2%, which includes 201 families.
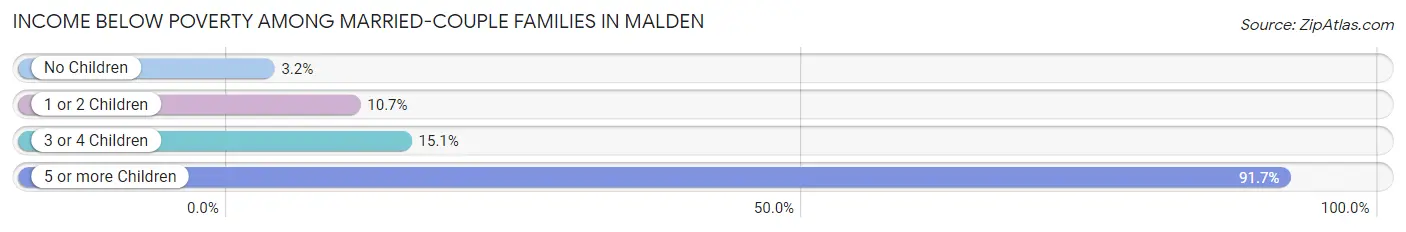
| Children | Above Poverty | Below Poverty |
| No Children | 6,143 (96.8%) | 201 (3.2%) |
| 1 or 2 Children | 4,369 (89.3%) | 521 (10.6%) |
| 3 or 4 Children | 264 (84.9%) | 47 (15.1%) |
| 5 or more Children | 5 (8.3%) | 55 (91.7%) |
| Total | 10,781 (92.9%) | 824 (7.1%) |
Income Below Poverty Among Single-Parent Households in Malden
According to the poverty data in Malden, 9.1% or 155 single-father households and 13.2% or 355 single-mother households are living below the poverty line. Among single-father households, those with 1 or 2 children have the highest poverty rate, with 155 households (22.2%) experiencing poverty. Likewise, among single-mother households, those with 3 or 4 children have the highest poverty rate, with 44 households (64.7%) falling below the poverty line.
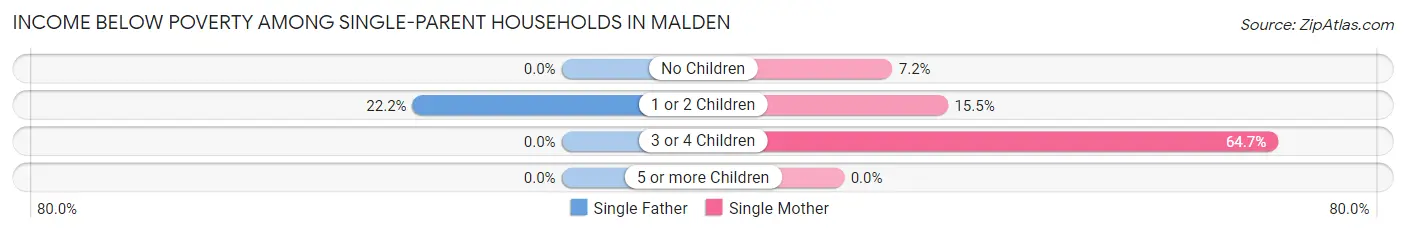
| Children | Single Father | Single Mother |
| No Children | 0 (0.0%) | 81 (7.2%) |
| 1 or 2 Children | 155 (22.2%) | 230 (15.5%) |
| 3 or 4 Children | 0 (0.0%) | 44 (64.7%) |
| 5 or more Children | 0 (0.0%) | 0 (0.0%) |
| Total | 155 (9.1%) | 355 (13.2%) |
Income Below Poverty Among Married-Couple vs Single-Parent Households in Malden
The poverty data for Malden shows that 824 of the married-couple family households (7.1%) and 510 of the single-parent households (11.6%) are living below the poverty level. Within the married-couple family households, those with 5 or more children have the highest poverty rate, with 55 households (91.7%) falling below the poverty line. Among the single-parent households, those with 3 or 4 children have the highest poverty rate, with 44 household (37.0%) living below poverty.
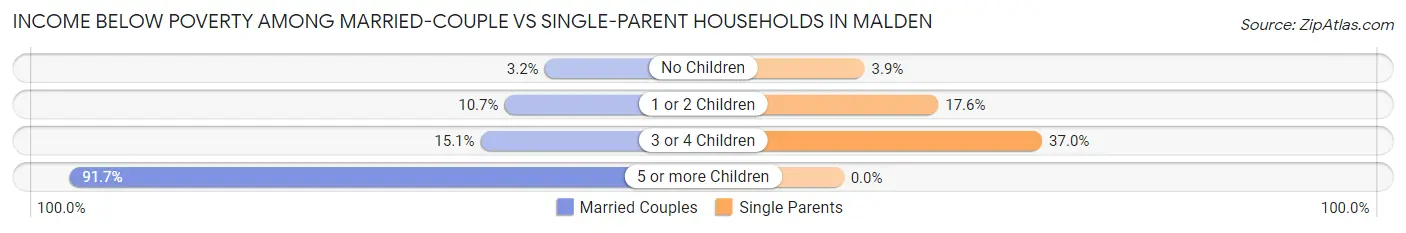
| Children | Married-Couple Families | Single-Parent Households |
| No Children | 201 (3.2%) | 81 (3.9%) |
| 1 or 2 Children | 521 (10.6%) | 385 (17.6%) |
| 3 or 4 Children | 47 (15.1%) | 44 (37.0%) |
| 5 or more Children | 55 (91.7%) | 0 (0.0%) |
| Total | 824 (7.1%) | 510 (11.6%) |
Race in Malden
The most populous races in Malden are White / Caucasian (31,501 | 48.1%), Asian (17,983 | 27.5%), and Black / African American (8,686 | 13.3%).
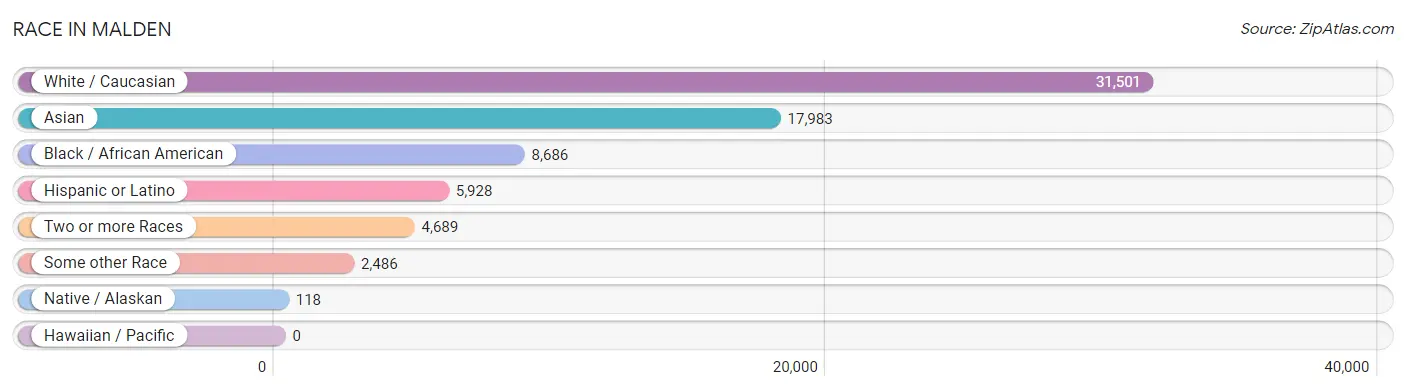
| Race | # Population | % Population |
| Asian | 17,983 | 27.5% |
| Black / African American | 8,686 | 13.3% |
| Hawaiian / Pacific | 0 | 0.0% |
| Hispanic or Latino | 5,928 | 9.1% |
| Native / Alaskan | 118 | 0.2% |
| White / Caucasian | 31,501 | 48.1% |
| Two or more Races | 4,689 | 7.2% |
| Some other Race | 2,486 | 3.8% |
| Total | 65,463 | 100.0% |
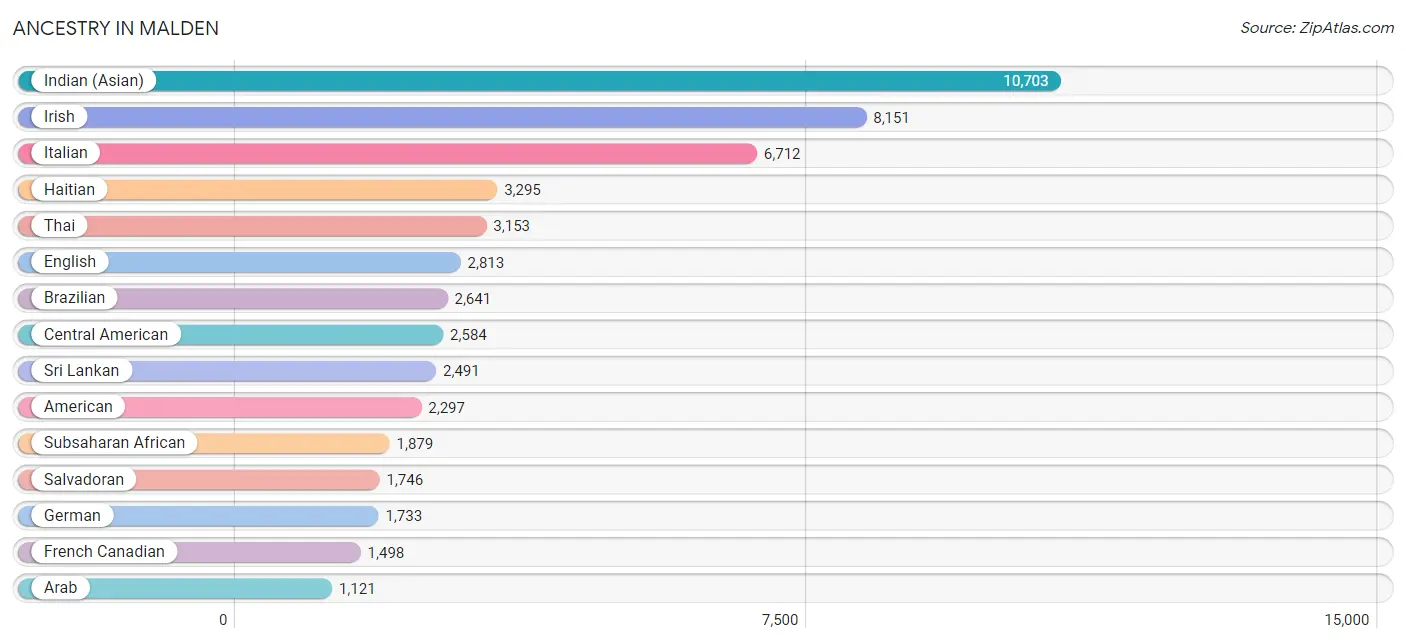
Ancestry in Malden
The most populous ancestries reported in Malden are Indian (Asian) (10,703 | 16.4%), Irish (8,151 | 12.4%), Italian (6,712 | 10.2%), Haitian (3,295 | 5.0%), and Thai (3,153 | 4.8%), together accounting for 48.9% of all Malden residents.
| Ancestry | # Population | % Population |
| African | 665 | 1.0% |
| Albanian | 295 | 0.4% |
| American | 2,297 | 3.5% |
| Arab | 1,121 | 1.7% |
| Argentinean | 79 | 0.1% |
| Armenian | 84 | 0.1% |
| Austrian | 6 | 0.0% |
| Belgian | 14 | 0.0% |
| Bhutanese | 157 | 0.2% |
| Brazilian | 2,641 | 4.0% |
| British | 136 | 0.2% |
| British West Indian | 68 | 0.1% |
| Bulgarian | 97 | 0.2% |
| Burmese | 394 | 0.6% |
| Canadian | 148 | 0.2% |
| Cape Verdean | 83 | 0.1% |
| Central American | 2,584 | 4.0% |
| Central American Indian | 92 | 0.1% |
| Cherokee | 56 | 0.1% |
| Chilean | 161 | 0.3% |
| Colombian | 575 | 0.9% |
| Costa Rican | 10 | 0.0% |
| Creek | 19 | 0.0% |
| Crow | 15 | 0.0% |
| Cuban | 48 | 0.1% |
| Czech | 59 | 0.1% |
| Danish | 67 | 0.1% |
| Dominican | 343 | 0.5% |
| Dutch | 144 | 0.2% |
| Dutch West Indian | 20 | 0.0% |
| Eastern European | 123 | 0.2% |
| Ecuadorian | 38 | 0.1% |
| Egyptian | 25 | 0.0% |
| English | 2,813 | 4.3% |
| Ethiopian | 844 | 1.3% |
| European | 152 | 0.2% |
| Filipino | 90 | 0.1% |
| Finnish | 72 | 0.1% |
| French | 1,050 | 1.6% |
| French Canadian | 1,498 | 2.3% |
| German | 1,733 | 2.6% |
| Ghanaian | 53 | 0.1% |
| Greek | 418 | 0.6% |
| Guatemalan | 732 | 1.1% |
| Guyanese | 21 | 0.0% |
| Haitian | 3,295 | 5.0% |
| Honduran | 19 | 0.0% |
| Hungarian | 22 | 0.0% |
| Indian (Asian) | 10,703 | 16.4% |
| Indonesian | 132 | 0.2% |
| Iranian | 150 | 0.2% |
| Irish | 8,151 | 12.4% |
| Italian | 6,712 | 10.2% |
| Jamaican | 370 | 0.6% |
| Japanese | 171 | 0.3% |
| Kenyan | 13 | 0.0% |
| Korean | 478 | 0.7% |
| Laotian | 32 | 0.1% |
| Latvian | 23 | 0.0% |
| Lebanese | 18 | 0.0% |
| Liberian | 110 | 0.2% |
| Lithuanian | 108 | 0.2% |
| Mexican | 498 | 0.8% |
| Mexican American Indian | 10 | 0.0% |
| Mongolian | 76 | 0.1% |
| Moroccan | 287 | 0.4% |
| Nigerian | 28 | 0.0% |
| Northern European | 3 | 0.0% |
| Norwegian | 222 | 0.3% |
| Palestinian | 64 | 0.1% |
| Panamanian | 77 | 0.1% |
| Pennsylvania German | 16 | 0.0% |
| Peruvian | 11 | 0.0% |
| Polish | 1,031 | 1.6% |
| Portuguese | 718 | 1.1% |
| Puerto Rican | 901 | 1.4% |
| Russian | 370 | 0.6% |
| Salvadoran | 1,746 | 2.7% |
| Scandinavian | 38 | 0.1% |
| Scotch-Irish | 72 | 0.1% |
| Scottish | 446 | 0.7% |
| Serbian | 150 | 0.2% |
| Sioux | 16 | 0.0% |
| Slavic | 9 | 0.0% |
| Slovak | 37 | 0.1% |
| South American | 977 | 1.5% |
| Spaniard | 72 | 0.1% |
| Spanish | 42 | 0.1% |
| Sri Lankan | 2,491 | 3.8% |
| Subsaharan African | 1,879 | 2.9% |
| Sudanese | 18 | 0.0% |
| Swedish | 259 | 0.4% |
| Swiss | 23 | 0.0% |
| Syrian | 68 | 0.1% |
| Taiwanese | 10 | 0.0% |
| Thai | 3,153 | 4.8% |
| Tlingit-Haida | 13 | 0.0% |
| Trinidadian and Tobagonian | 37 | 0.1% |
| Turkish | 311 | 0.5% |
| Ugandan | 3 | 0.0% |
| Ukrainian | 253 | 0.4% |
| Venezuelan | 113 | 0.2% |
| Vietnamese | 112 | 0.2% |
| Welsh | 142 | 0.2% |
| Yugoslavian | 284 | 0.4% | View All 105 Rows |
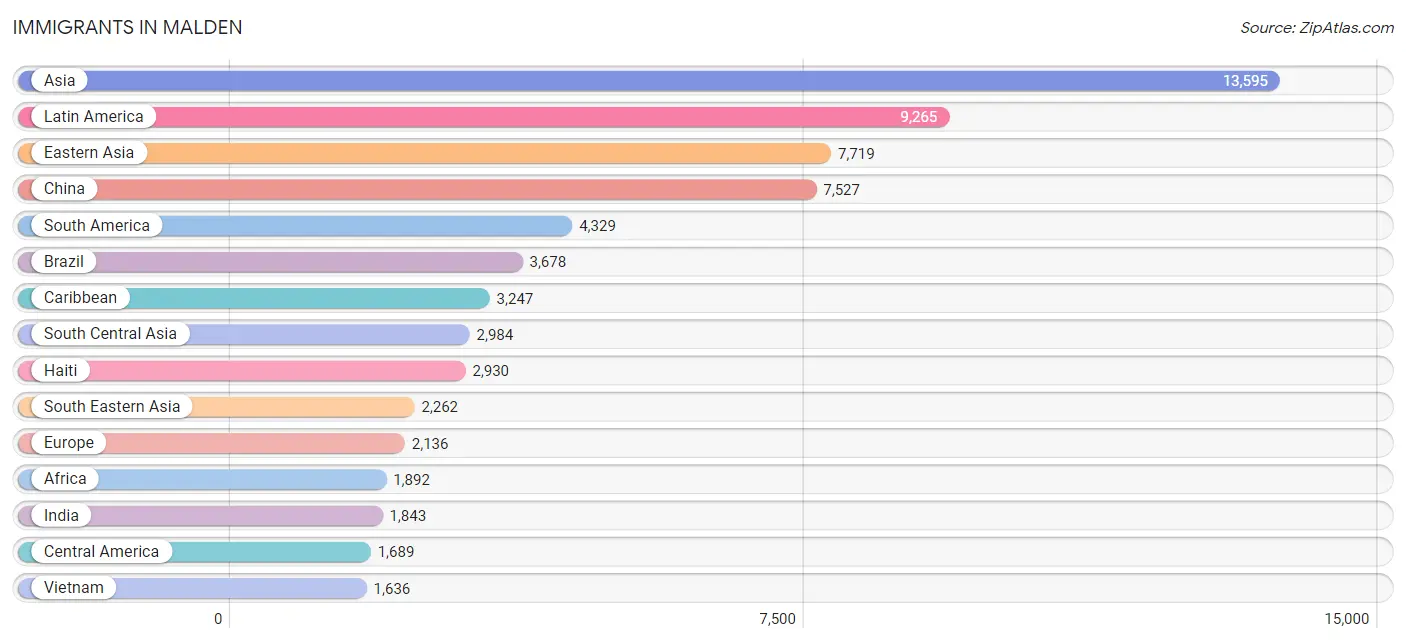
Immigrants in Malden
The most numerous immigrant groups reported in Malden came from Asia (13,595 | 20.8%), Latin America (9,265 | 14.1%), Eastern Asia (7,719 | 11.8%), China (7,527 | 11.5%), and South America (4,329 | 6.6%), together accounting for 64.8% of all Malden residents.
| Immigration Origin | # Population | % Population |
| Africa | 1,892 | 2.9% |
| Albania | 246 | 0.4% |
| Argentina | 42 | 0.1% |
| Armenia | 50 | 0.1% |
| Asia | 13,595 | 20.8% |
| Azores | 44 | 0.1% |
| Bangladesh | 48 | 0.1% |
| Bosnia and Herzegovina | 274 | 0.4% |
| Brazil | 3,678 | 5.6% |
| Bulgaria | 87 | 0.1% |
| Cabo Verde | 72 | 0.1% |
| Cambodia | 108 | 0.2% |
| Cameroon | 57 | 0.1% |
| Canada | 70 | 0.1% |
| Caribbean | 3,247 | 5.0% |
| Central America | 1,689 | 2.6% |
| Chile | 127 | 0.2% |
| China | 7,527 | 11.5% |
| Colombia | 383 | 0.6% |
| Costa Rica | 10 | 0.0% |
| Czechoslovakia | 10 | 0.0% |
| Dominican Republic | 168 | 0.3% |
| Eastern Africa | 851 | 1.3% |
| Eastern Asia | 7,719 | 11.8% |
| Eastern Europe | 1,261 | 1.9% |
| Ecuador | 38 | 0.1% |
| Egypt | 49 | 0.1% |
| El Salvador | 1,069 | 1.6% |
| England | 8 | 0.0% |
| Eritrea | 61 | 0.1% |
| Ethiopia | 774 | 1.2% |
| Europe | 2,136 | 3.3% |
| Germany | 71 | 0.1% |
| Ghana | 53 | 0.1% |
| Greece | 63 | 0.1% |
| Grenada | 68 | 0.1% |
| Guatemala | 384 | 0.6% |
| Haiti | 2,930 | 4.5% |
| Honduras | 48 | 0.1% |
| Hong Kong | 306 | 0.5% |
| Hungary | 6 | 0.0% |
| India | 1,843 | 2.8% |
| Indonesia | 40 | 0.1% |
| Iran | 94 | 0.1% |
| Ireland | 142 | 0.2% |
| Italy | 221 | 0.3% |
| Jamaica | 80 | 0.1% |
| Japan | 22 | 0.0% |
| Kenya | 13 | 0.0% |
| Korea | 170 | 0.3% |
| Kuwait | 55 | 0.1% |
| Latin America | 9,265 | 14.1% |
| Lebanon | 23 | 0.0% |
| Liberia | 68 | 0.1% |
| Malaysia | 100 | 0.2% |
| Mexico | 154 | 0.2% |
| Middle Africa | 72 | 0.1% |
| Morocco | 477 | 0.7% |
| Nepal | 665 | 1.0% |
| Nigeria | 6 | 0.0% |
| Northern Africa | 673 | 1.0% |
| Northern Europe | 351 | 0.5% |
| Pakistan | 305 | 0.5% |
| Panama | 24 | 0.0% |
| Peru | 41 | 0.1% |
| Philippines | 236 | 0.4% |
| Poland | 45 | 0.1% |
| Portugal | 169 | 0.3% |
| Russia | 179 | 0.3% |
| Saudi Arabia | 216 | 0.3% |
| Serbia | 259 | 0.4% |
| South Africa | 17 | 0.0% |
| South America | 4,329 | 6.6% |
| South Central Asia | 2,984 | 4.6% |
| South Eastern Asia | 2,262 | 3.5% |
| Southern Europe | 453 | 0.7% |
| Syria | 35 | 0.1% |
| Taiwan | 348 | 0.5% |
| Trinidad and Tobago | 1 | 0.0% |
| Turkey | 218 | 0.3% |
| Uganda | 3 | 0.0% |
| Ukraine | 145 | 0.2% |
| Uzbekistan | 29 | 0.0% |
| Venezuela | 20 | 0.0% |
| Vietnam | 1,636 | 2.5% |
| Western Africa | 228 | 0.4% |
| Western Asia | 620 | 0.9% |
| Western Europe | 71 | 0.1% |
| Zaire | 15 | 0.0% | View All 89 Rows |
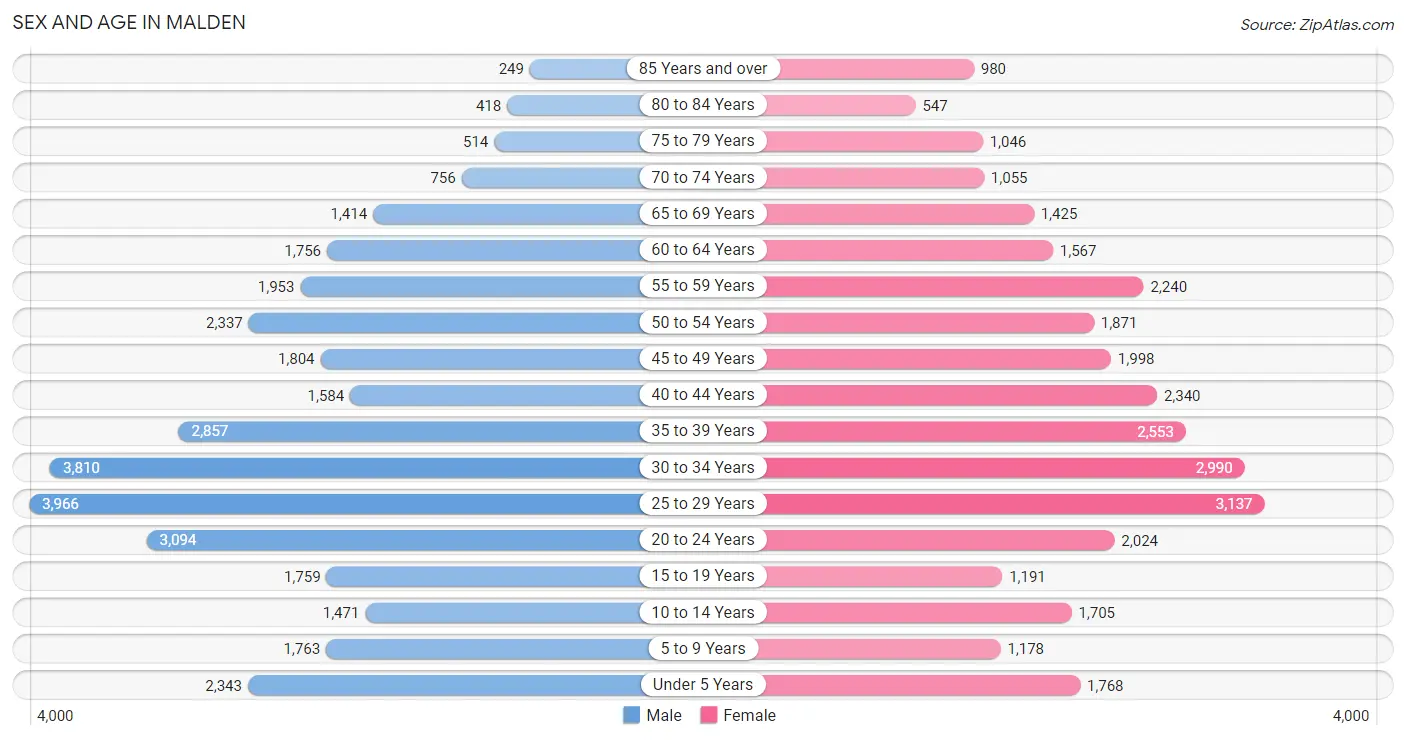
Sex and Age in Malden
Sex and Age in Malden
The most populous age groups in Malden are 25 to 29 Years (3,966 | 11.7%) for men and 25 to 29 Years (3,137 | 9.9%) for women.
| Age Bracket | Male | Female |
| Under 5 Years | 2,343 (6.9%) | 1,768 (5.6%) |
| 5 to 9 Years | 1,763 (5.2%) | 1,178 (3.7%) |
| 10 to 14 Years | 1,471 (4.3%) | 1,705 (5.4%) |
| 15 to 19 Years | 1,759 (5.2%) | 1,191 (3.8%) |
| 20 to 24 Years | 3,094 (9.1%) | 2,024 (6.4%) |
| 25 to 29 Years | 3,966 (11.7%) | 3,137 (9.9%) |
| 30 to 34 Years | 3,810 (11.3%) | 2,990 (9.5%) |
| 35 to 39 Years | 2,857 (8.4%) | 2,553 (8.1%) |
| 40 to 44 Years | 1,584 (4.7%) | 2,340 (7.4%) |
| 45 to 49 Years | 1,804 (5.3%) | 1,998 (6.3%) |
| 50 to 54 Years | 2,337 (6.9%) | 1,871 (5.9%) |
| 55 to 59 Years | 1,953 (5.8%) | 2,240 (7.1%) |
| 60 to 64 Years | 1,756 (5.2%) | 1,567 (5.0%) |
| 65 to 69 Years | 1,414 (4.2%) | 1,425 (4.5%) |
| 70 to 74 Years | 756 (2.2%) | 1,055 (3.3%) |
| 75 to 79 Years | 514 (1.5%) | 1,046 (3.3%) |
| 80 to 84 Years | 418 (1.2%) | 547 (1.7%) |
| 85 Years and over | 249 (0.7%) | 980 (3.1%) |
| Total | 33,848 (100.0%) | 31,615 (100.0%) |
Families and Households in Malden
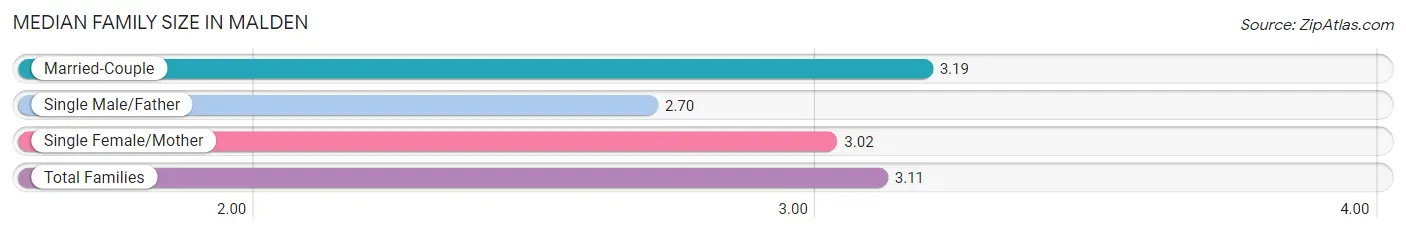
Median Family Size in Malden
The median family size in Malden is 3.11 persons per family, with married-couple families (11,605 | 72.6%) accounting for the largest median family size of 3.19 persons per family. On the other hand, single male/father families (1,697 | 10.6%) represent the smallest median family size with 2.70 persons per family.
| Family Type | # Families | Family Size |
| Married-Couple | 11,605 (72.6%) | 3.19 |
| Single Male/Father | 1,697 (10.6%) | 2.70 |
| Single Female/Mother | 2,683 (16.8%) | 3.02 |
| Total Families | 15,985 (100.0%) | 3.11 |
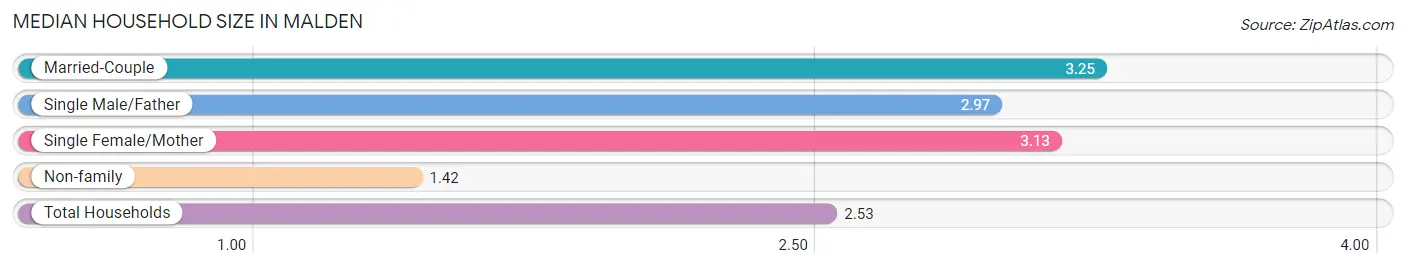
Median Household Size in Malden
The median household size in Malden is 2.53 persons per household, with married-couple households (11,605 | 45.0%) accounting for the largest median household size of 3.25 persons per household. non-family households (9,824 | 38.1%) represent the smallest median household size with 1.42 persons per household.
| Household Type | # Households | Household Size |
| Married-Couple | 11,605 (45.0%) | 3.25 |
| Single Male/Father | 1,697 (6.6%) | 2.97 |
| Single Female/Mother | 2,683 (10.4%) | 3.13 |
| Non-family | 9,824 (38.1%) | 1.42 |
| Total Households | 25,809 (100.0%) | 2.53 |
Household Size by Marriage Status in Malden
Out of a total of 25,809 households in Malden, 15,985 (61.9%) are family households, while 9,824 (38.1%) are nonfamily households. The most numerous type of family households are 2-person households, comprising 6,025, and the most common type of nonfamily households are 1-person households, comprising 6,737.
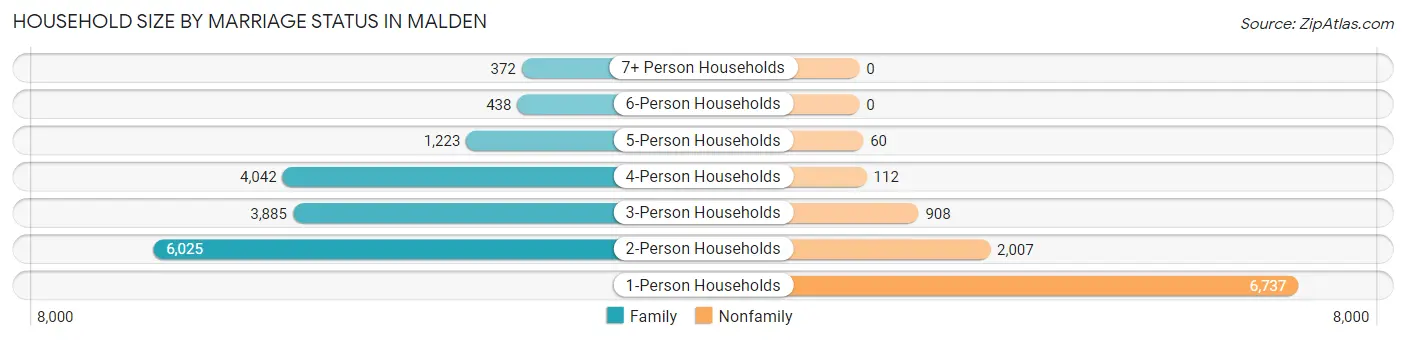
| Household Size | Family Households | Nonfamily Households |
| 1-Person Households | - | 6,737 (26.1%) |
| 2-Person Households | 6,025 (23.3%) | 2,007 (7.8%) |
| 3-Person Households | 3,885 (15.0%) | 908 (3.5%) |
| 4-Person Households | 4,042 (15.7%) | 112 (0.4%) |
| 5-Person Households | 1,223 (4.7%) | 60 (0.2%) |
| 6-Person Households | 438 (1.7%) | 0 (0.0%) |
| 7+ Person Households | 372 (1.4%) | 0 (0.0%) |
| Total | 15,985 (61.9%) | 9,824 (38.1%) |
Female Fertility in Malden
Fertility by Age in Malden
Average fertility rate in Malden is 51.0 births per 1,000 women. Women in the age bracket of 35 to 50 years have the highest fertility rate with 87.0 births per 1,000 women. Women in the age bracket of 35 to 50 years acount for 74.3% of all women with births.
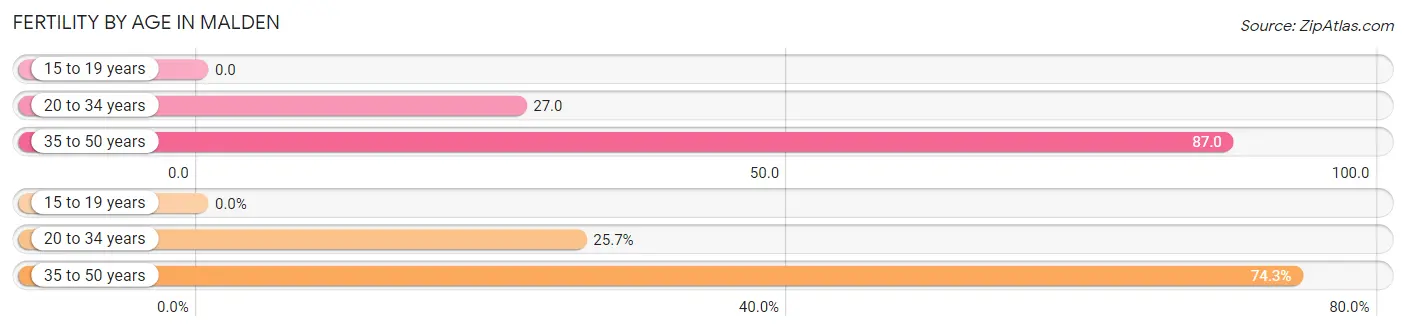
| Age Bracket | Women with Births | Births / 1,000 Women |
| 15 to 19 years | 0 (0.0%) | 0.0 |
| 20 to 34 years | 217 (25.7%) | 27.0 |
| 35 to 50 years | 628 (74.3%) | 87.0 |
| Total | 845 (100.0%) | 51.0 |
Fertility by Age by Marriage Status in Malden
96.1% of women with births (845) in Malden are married. The highest percentage of unmarried women with births falls into 20 to 34 years age bracket with 11.5% of them unmarried at the time of birth, while the lowest percentage of unmarried women with births belong to 35 to 50 years age bracket with 1.3% of them unmarried.
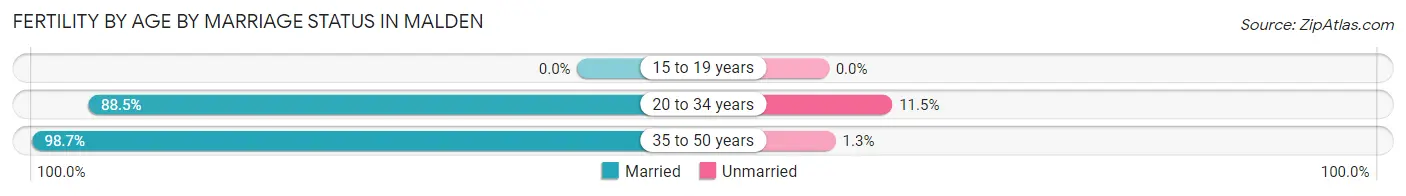
| Age Bracket | Married | Unmarried |
| 15 to 19 years | 0 (0.0%) | 0 (0.0%) |
| 20 to 34 years | 192 (88.5%) | 25 (11.5%) |
| 35 to 50 years | 620 (98.7%) | 8 (1.3%) |
| Total | 812 (96.1%) | 33 (3.9%) |
Fertility by Education in Malden
Average fertility rate in Malden is 51.0 births per 1,000 women. Women with the education attainment of graduate degree have the highest fertility rate of 90.0 births per 1,000 women, while women with the education attainment of college or associate's degree have the lowest fertility at 23.0 births per 1,000 women. Women with the education attainment of graduate degree represent 39.2% of all women with births.
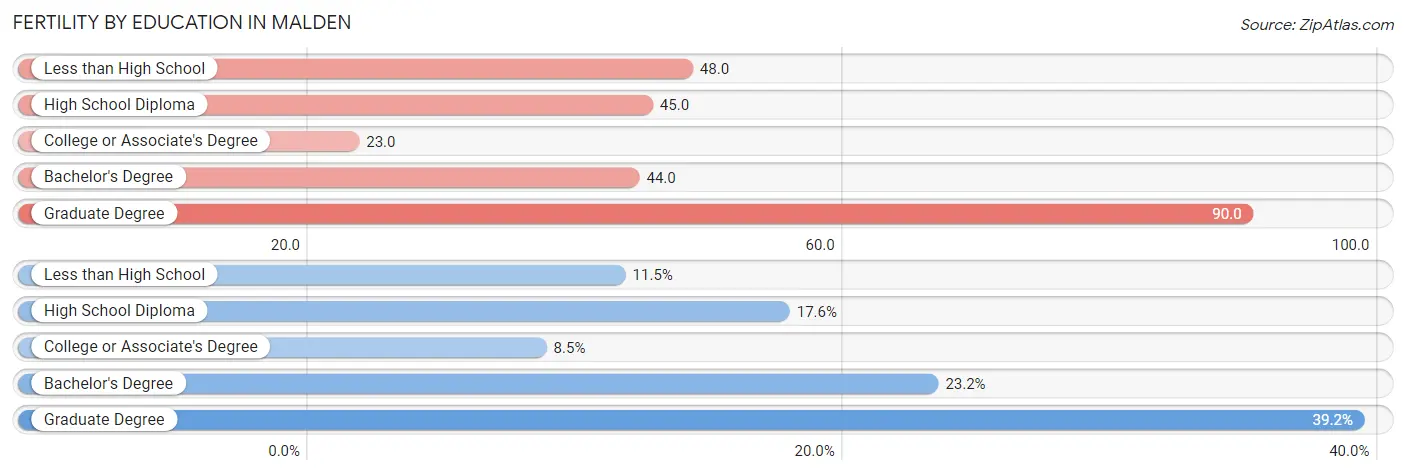
| Educational Attainment | Women with Births | Births / 1,000 Women |
| Less than High School | 97 (11.5%) | 48.0 |
| High School Diploma | 149 (17.6%) | 45.0 |
| College or Associate's Degree | 72 (8.5%) | 23.0 |
| Bachelor's Degree | 196 (23.2%) | 44.0 |
| Graduate Degree | 331 (39.2%) | 90.0 |
| Total | 845 (100.0%) | 51.0 |
Fertility by Education by Marriage Status in Malden
3.9% of women with births in Malden are unmarried. Women with the educational attainment of high school diploma are most likely to be married with 100.0% of them married at childbirth, while women with the educational attainment of less than high school are least likely to be married with 8.3% of them unmarried at childbirth.
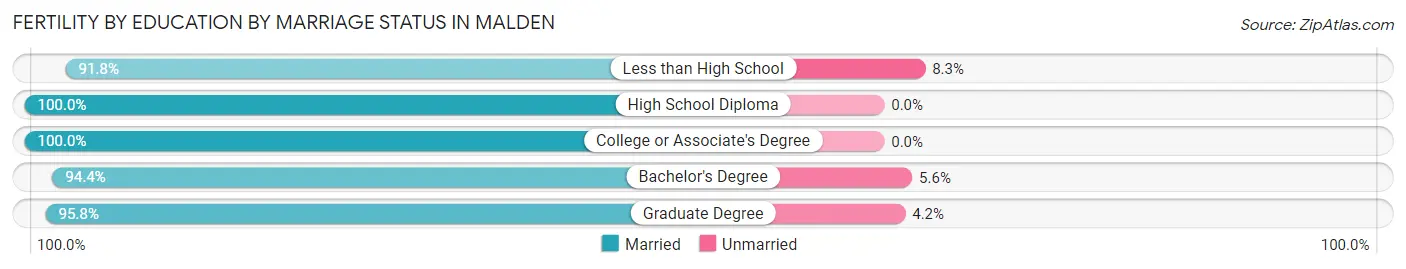
| Educational Attainment | Married | Unmarried |
| Less than High School | 89 (91.7%) | 8 (8.3%) |
| High School Diploma | 149 (100.0%) | 0 (0.0%) |
| College or Associate's Degree | 72 (100.0%) | 0 (0.0%) |
| Bachelor's Degree | 185 (94.4%) | 11 (5.6%) |
| Graduate Degree | 317 (95.8%) | 14 (4.2%) |
| Total | 812 (96.1%) | 33 (3.9%) |
Employment Characteristics in Malden
Employment by Class of Employer in Malden
Among the 34,945 employed individuals in Malden, private company employees (24,667 | 70.6%), not-for-profit organizations (4,391 | 12.6%), and self-employed (not incorporated) (1,672 | 4.8%) make up the most common classes of employment.
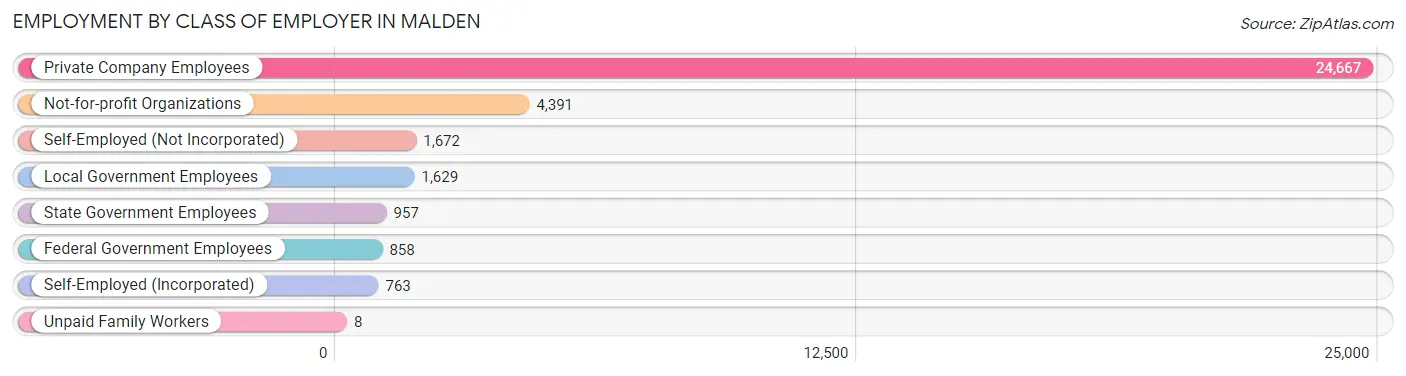
| Employer Class | # Employees | % Employees |
| Private Company Employees | 24,667 | 70.6% |
| Self-Employed (Incorporated) | 763 | 2.2% |
| Self-Employed (Not Incorporated) | 1,672 | 4.8% |
| Not-for-profit Organizations | 4,391 | 12.6% |
| Local Government Employees | 1,629 | 4.7% |
| State Government Employees | 957 | 2.7% |
| Federal Government Employees | 858 | 2.5% |
| Unpaid Family Workers | 8 | 0.0% |
| Total | 34,945 | 100.0% |
Employment Status by Age in Malden
According to the labor force statistics for Malden, out of the total population over 16 years of age (54,597), 70.4% or 38,436 individuals are in the labor force, with 6.6% or 2,537 of them unemployed. The age group with the highest labor force participation rate is 30 to 34 years, with 87.3% or 5,936 individuals in the labor force. Within the labor force, the 16 to 19 years age range has the highest percentage of unemployed individuals, with 41.1% or 311 of them being unemployed.
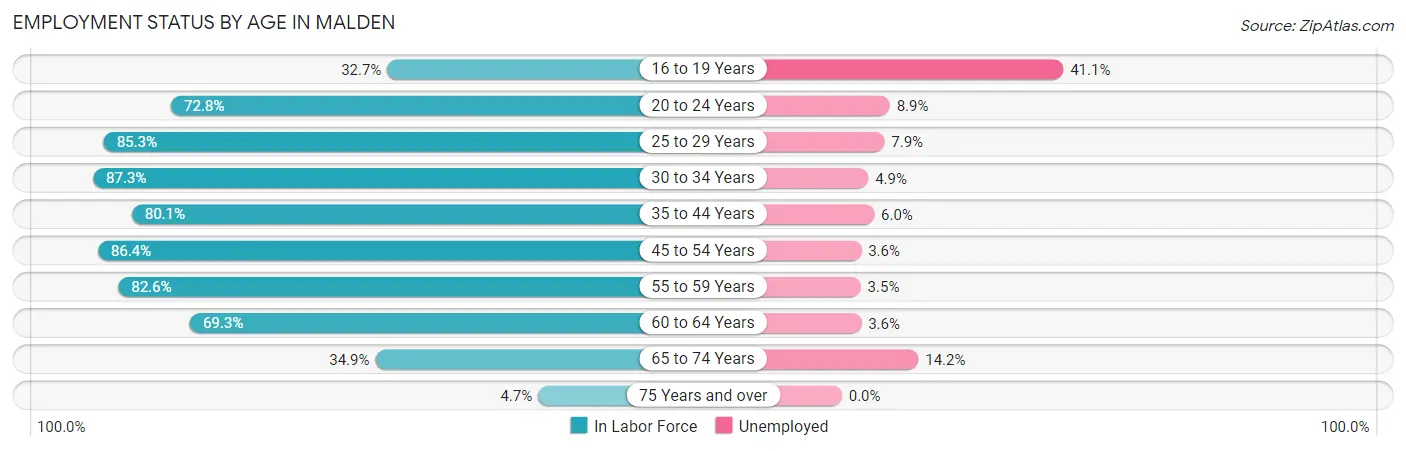
| Age Bracket | In Labor Force | Unemployed |
| 16 to 19 Years | 756 (32.7%) | 311 (41.1%) |
| 20 to 24 Years | 3,726 (72.8%) | 332 (8.9%) |
| 25 to 29 Years | 6,059 (85.3%) | 479 (7.9%) |
| 30 to 34 Years | 5,936 (87.3%) | 291 (4.9%) |
| 35 to 44 Years | 7,477 (80.1%) | 449 (6.0%) |
| 45 to 54 Years | 6,921 (86.4%) | 249 (3.6%) |
| 55 to 59 Years | 3,463 (82.6%) | 121 (3.5%) |
| 60 to 64 Years | 2,303 (69.3%) | 83 (3.6%) |
| 65 to 74 Years | 1,623 (34.9%) | 230 (14.2%) |
| 75 Years and over | 176 (4.7%) | 0 (0.0%) |
| Total | 38,436 (70.4%) | 2,537 (6.6%) |
Employment Status by Educational Attainment in Malden
According to labor force statistics for Malden, 83.0% of individuals (32,173) out of the total population between 25 and 64 years of age (38,763) are in the labor force, with 5.2% or 1,673 of them being unemployed. The group with the highest labor force participation rate are those with the educational attainment of bachelor's degree or higher, with 88.0% or 16,507 individuals in the labor force. Within the labor force, individuals with less than high school education have the highest percentage of unemployment, with 13.4% or 371 of them being unemployed.
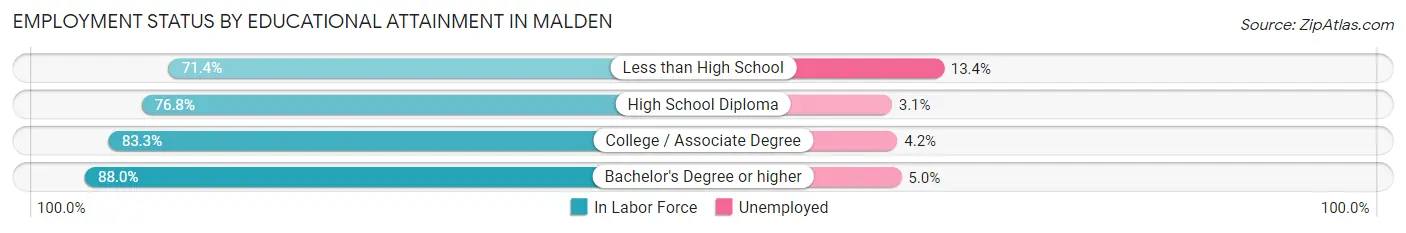
| Educational Attainment | In Labor Force | Unemployed |
| Less than High School | 2,770 (71.4%) | 520 (13.4%) |
| High School Diploma | 6,445 (76.8%) | 260 (3.1%) |
| College / Associate Degree | 6,442 (83.3%) | 325 (4.2%) |
| Bachelor's Degree or higher | 16,507 (88.0%) | 938 (5.0%) |
| Total | 32,173 (83.0%) | 2,016 (5.2%) |
Employment Occupations by Sex in Malden
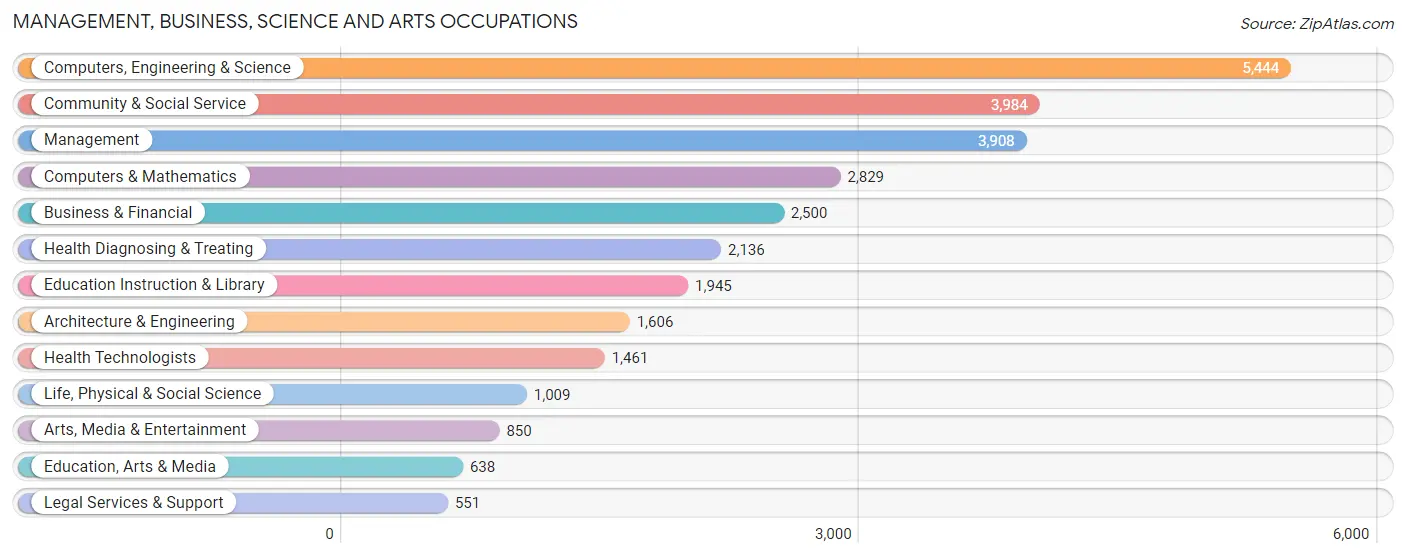
Management, Business, Science and Arts Occupations
The most common Management, Business, Science and Arts occupations in Malden are Computers, Engineering & Science (5,444 | 15.2%), Community & Social Service (3,984 | 11.1%), Management (3,908 | 10.9%), Computers & Mathematics (2,829 | 7.9%), and Business & Financial (2,500 | 7.0%).
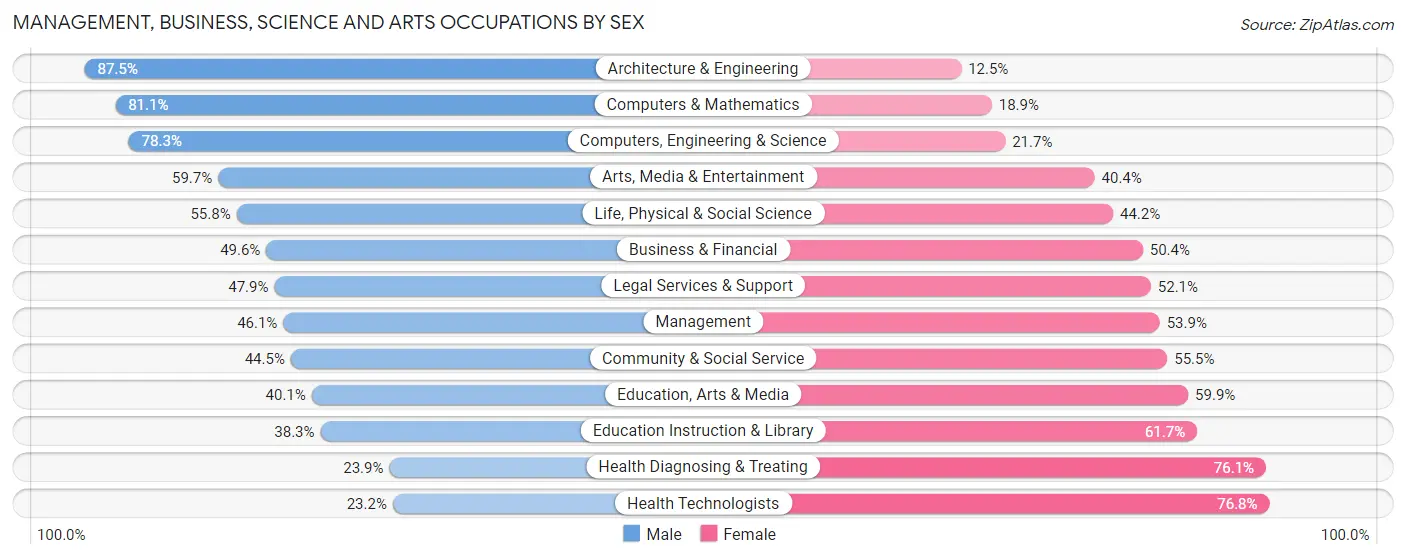
Management, Business, Science and Arts Occupations by Sex
Within the Management, Business, Science and Arts occupations in Malden, the most male-oriented occupations are Architecture & Engineering (87.5%), Computers & Mathematics (81.1%), and Computers, Engineering & Science (78.3%), while the most female-oriented occupations are Health Technologists (76.8%), Health Diagnosing & Treating (76.1%), and Education Instruction & Library (61.7%).
| Occupation | Male | Female |
| Management | 1,800 (46.1%) | 2,108 (53.9%) |
| Business & Financial | 1,240 (49.6%) | 1,260 (50.4%) |
| Computers, Engineering & Science | 4,262 (78.3%) | 1,182 (21.7%) |
| Computers & Mathematics | 2,294 (81.1%) | 535 (18.9%) |
| Architecture & Engineering | 1,405 (87.5%) | 201 (12.5%) |
| Life, Physical & Social Science | 563 (55.8%) | 446 (44.2%) |
| Community & Social Service | 1,772 (44.5%) | 2,212 (55.5%) |
| Education, Arts & Media | 256 (40.1%) | 382 (59.9%) |
| Legal Services & Support | 264 (47.9%) | 287 (52.1%) |
| Education Instruction & Library | 745 (38.3%) | 1,200 (61.7%) |
| Arts, Media & Entertainment | 507 (59.7%) | 343 (40.4%) |
| Health Diagnosing & Treating | 511 (23.9%) | 1,625 (76.1%) |
| Health Technologists | 339 (23.2%) | 1,122 (76.8%) |
| Total (Category) | 9,585 (53.3%) | 8,387 (46.7%) |
| Total (Overall) | 19,136 (53.4%) | 16,703 (46.6%) |
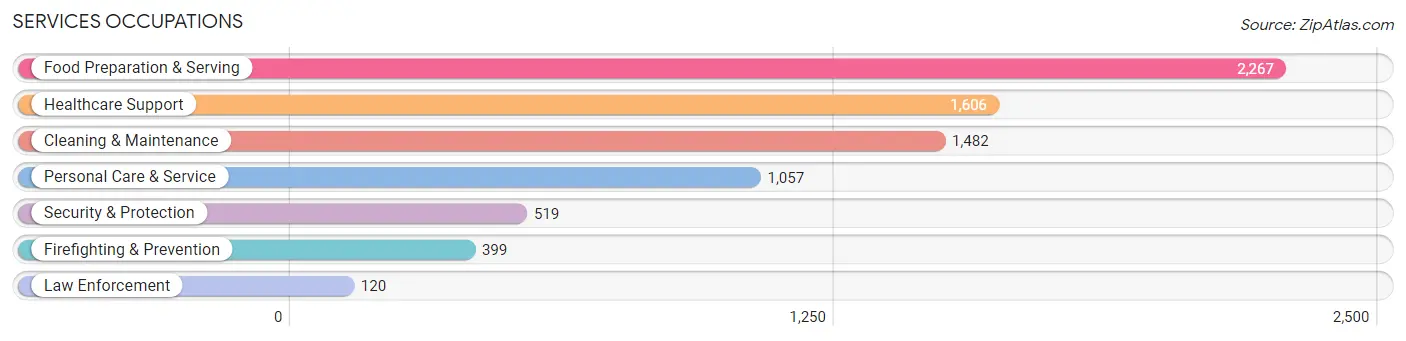
Services Occupations
The most common Services occupations in Malden are Food Preparation & Serving (2,267 | 6.3%), Healthcare Support (1,606 | 4.5%), Cleaning & Maintenance (1,482 | 4.1%), Personal Care & Service (1,057 | 2.9%), and Security & Protection (519 | 1.5%).
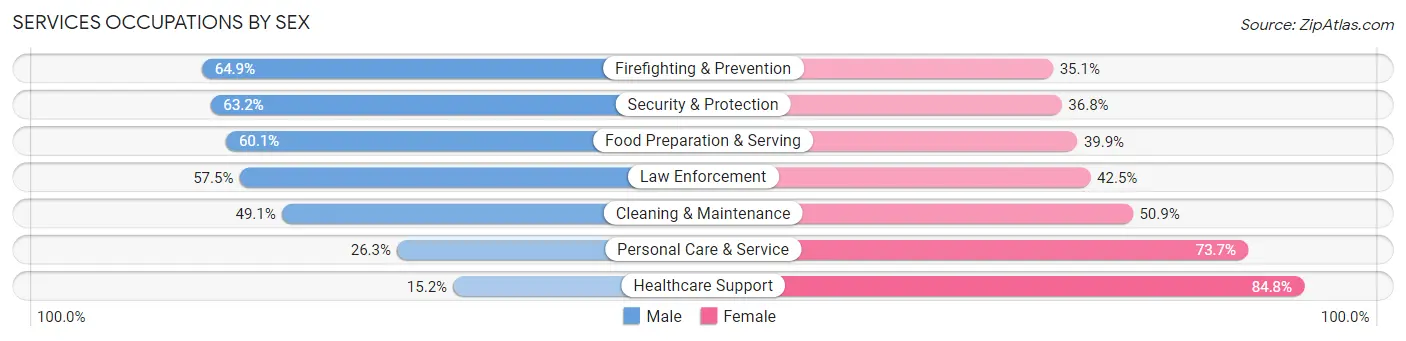
Services Occupations by Sex
Within the Services occupations in Malden, the most male-oriented occupations are Firefighting & Prevention (64.9%), Security & Protection (63.2%), and Food Preparation & Serving (60.1%), while the most female-oriented occupations are Healthcare Support (84.8%), Personal Care & Service (73.7%), and Cleaning & Maintenance (50.9%).
| Occupation | Male | Female |
| Healthcare Support | 244 (15.2%) | 1,362 (84.8%) |
| Security & Protection | 328 (63.2%) | 191 (36.8%) |
| Firefighting & Prevention | 259 (64.9%) | 140 (35.1%) |
| Law Enforcement | 69 (57.5%) | 51 (42.5%) |
| Food Preparation & Serving | 1,363 (60.1%) | 904 (39.9%) |
| Cleaning & Maintenance | 728 (49.1%) | 754 (50.9%) |
| Personal Care & Service | 278 (26.3%) | 779 (73.7%) |
| Total (Category) | 2,941 (42.4%) | 3,990 (57.6%) |
| Total (Overall) | 19,136 (53.4%) | 16,703 (46.6%) |
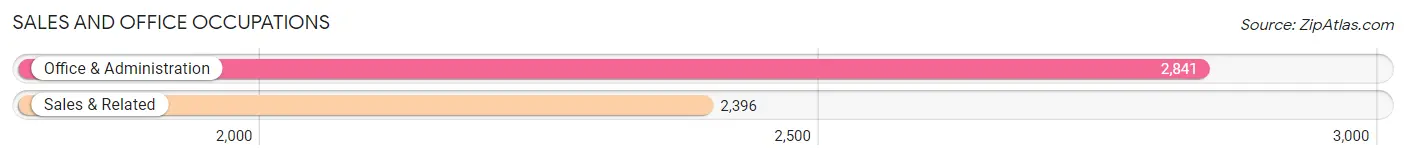
Sales and Office Occupations
The most common Sales and Office occupations in Malden are Office & Administration (2,841 | 7.9%), and Sales & Related (2,396 | 6.7%).
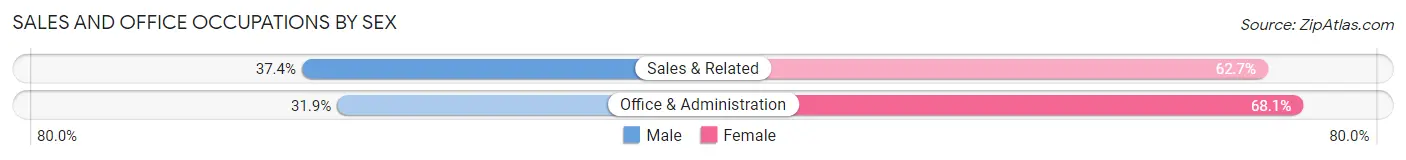
Sales and Office Occupations by Sex
| Occupation | Male | Female |
| Sales & Related | 895 (37.3%) | 1,501 (62.6%) |
| Office & Administration | 907 (31.9%) | 1,934 (68.1%) |
| Total (Category) | 1,802 (34.4%) | 3,435 (65.6%) |
| Total (Overall) | 19,136 (53.4%) | 16,703 (46.6%) |
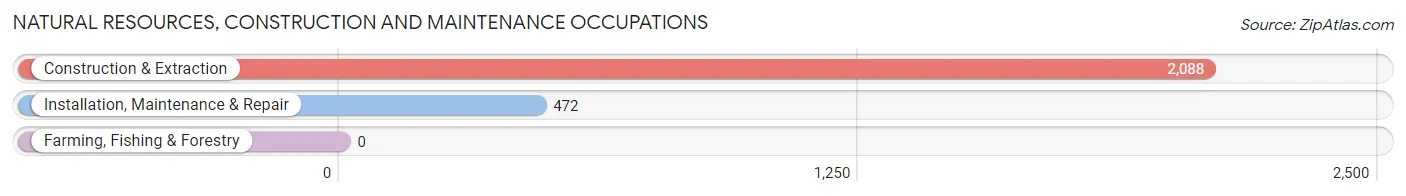
Natural Resources, Construction and Maintenance Occupations
The most common Natural Resources, Construction and Maintenance occupations in Malden are Construction & Extraction (2,088 | 5.8%), and Installation, Maintenance & Repair (472 | 1.3%).
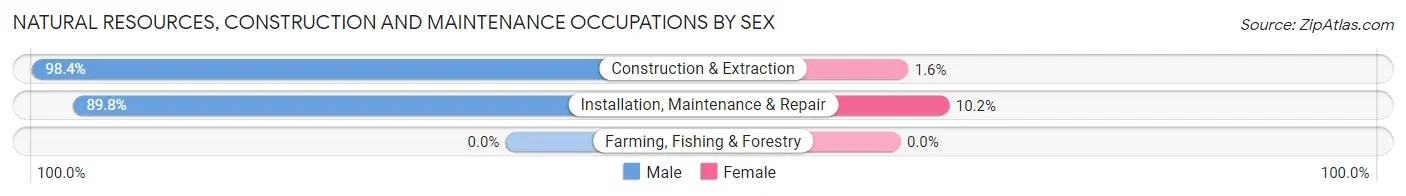
Natural Resources, Construction and Maintenance Occupations by Sex
| Occupation | Male | Female |
| Farming, Fishing & Forestry | 0 (0.0%) | 0 (0.0%) |
| Construction & Extraction | 2,054 (98.4%) | 34 (1.6%) |
| Installation, Maintenance & Repair | 424 (89.8%) | 48 (10.2%) |
| Total (Category) | 2,478 (96.8%) | 82 (3.2%) |
| Total (Overall) | 19,136 (53.4%) | 16,703 (46.6%) |
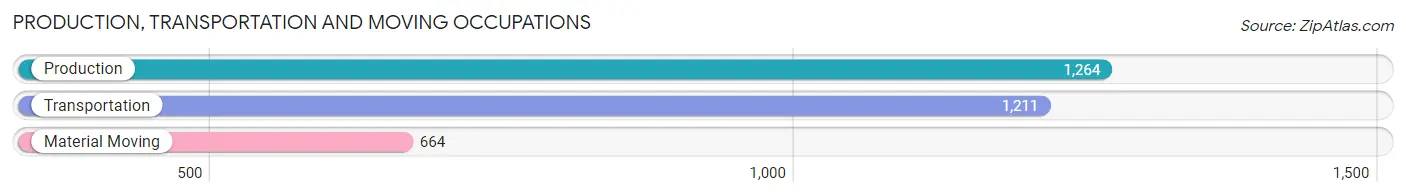
Production, Transportation and Moving Occupations
The most common Production, Transportation and Moving occupations in Malden are Production (1,264 | 3.5%), Transportation (1,211 | 3.4%), and Material Moving (664 | 1.8%).
Production, Transportation and Moving Occupations by Sex
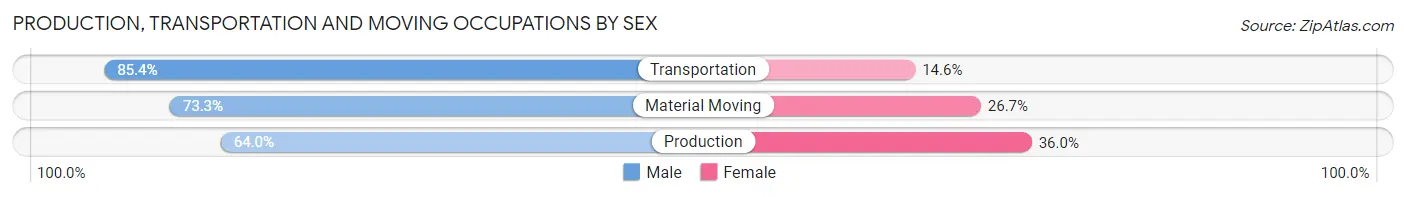
| Occupation | Male | Female |
| Production | 809 (64.0%) | 455 (36.0%) |
| Transportation | 1,034 (85.4%) | 177 (14.6%) |
| Material Moving | 487 (73.3%) | 177 (26.7%) |
| Total (Category) | 2,330 (74.2%) | 809 (25.8%) |
| Total (Overall) | 19,136 (53.4%) | 16,703 (46.6%) |
Employment Industries by Sex in Malden
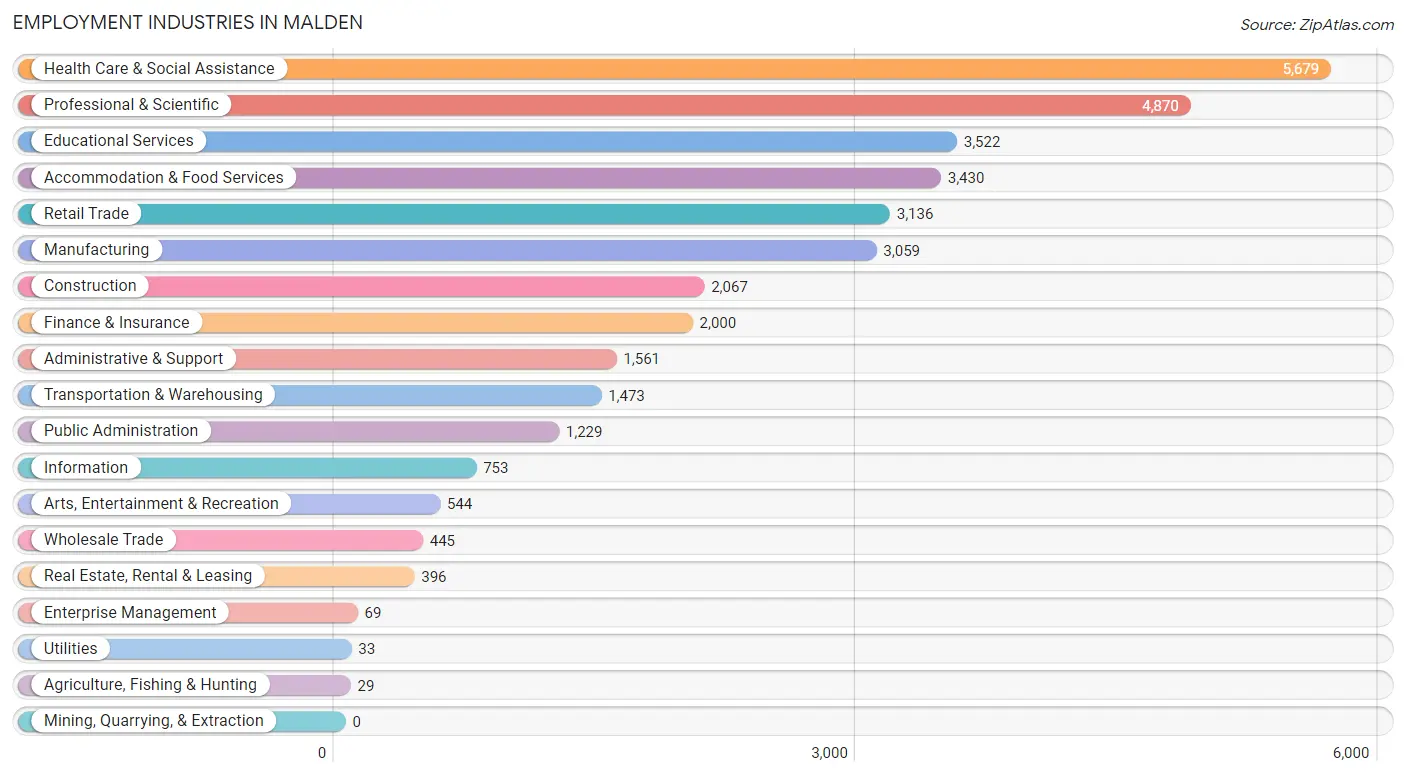
Employment Industries in Malden
The major employment industries in Malden include Health Care & Social Assistance (5,679 | 15.9%), Professional & Scientific (4,870 | 13.6%), Educational Services (3,522 | 9.8%), Accommodation & Food Services (3,430 | 9.6%), and Retail Trade (3,136 | 8.7%).
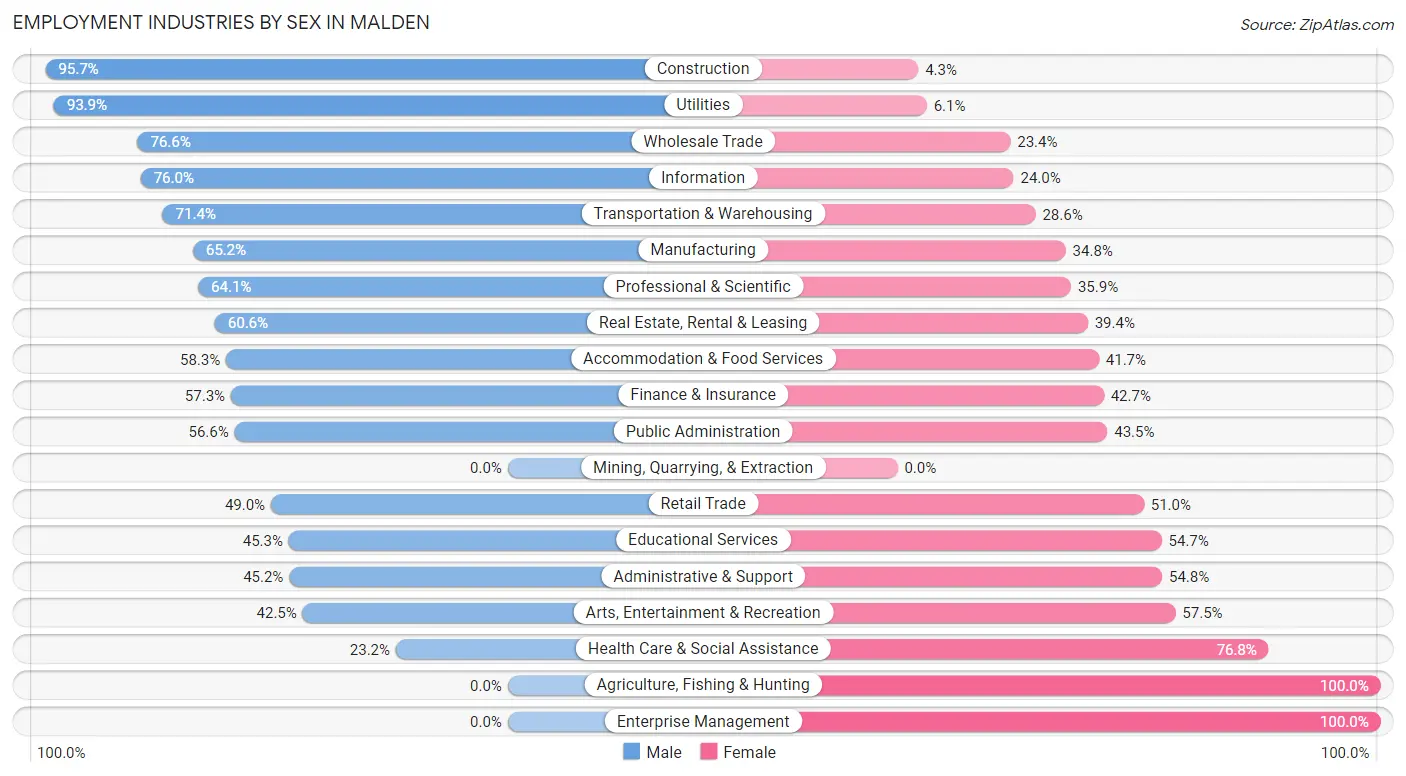
Employment Industries by Sex in Malden
The Malden industries that see more men than women are Construction (95.7%), Utilities (93.9%), and Wholesale Trade (76.6%), whereas the industries that tend to have a higher number of women are Agriculture, Fishing & Hunting (100.0%), Enterprise Management (100.0%), and Health Care & Social Assistance (76.8%).
| Industry | Male | Female |
| Agriculture, Fishing & Hunting | 0 (0.0%) | 29 (100.0%) |
| Mining, Quarrying, & Extraction | 0 (0.0%) | 0 (0.0%) |
| Construction | 1,978 (95.7%) | 89 (4.3%) |
| Manufacturing | 1,994 (65.2%) | 1,065 (34.8%) |
| Wholesale Trade | 341 (76.6%) | 104 (23.4%) |
| Retail Trade | 1,537 (49.0%) | 1,599 (51.0%) |
| Transportation & Warehousing | 1,052 (71.4%) | 421 (28.6%) |
| Utilities | 31 (93.9%) | 2 (6.1%) |
| Information | 572 (76.0%) | 181 (24.0%) |
| Finance & Insurance | 1,146 (57.3%) | 854 (42.7%) |
| Real Estate, Rental & Leasing | 240 (60.6%) | 156 (39.4%) |
| Professional & Scientific | 3,120 (64.1%) | 1,750 (35.9%) |
| Enterprise Management | 0 (0.0%) | 69 (100.0%) |
| Administrative & Support | 706 (45.2%) | 855 (54.8%) |
| Educational Services | 1,596 (45.3%) | 1,926 (54.7%) |
| Health Care & Social Assistance | 1,315 (23.2%) | 4,364 (76.8%) |
| Arts, Entertainment & Recreation | 231 (42.5%) | 313 (57.5%) |
| Accommodation & Food Services | 2,000 (58.3%) | 1,430 (41.7%) |
| Public Administration | 695 (56.6%) | 534 (43.4%) |
| Total | 19,136 (53.4%) | 16,703 (46.6%) |
Education in Malden
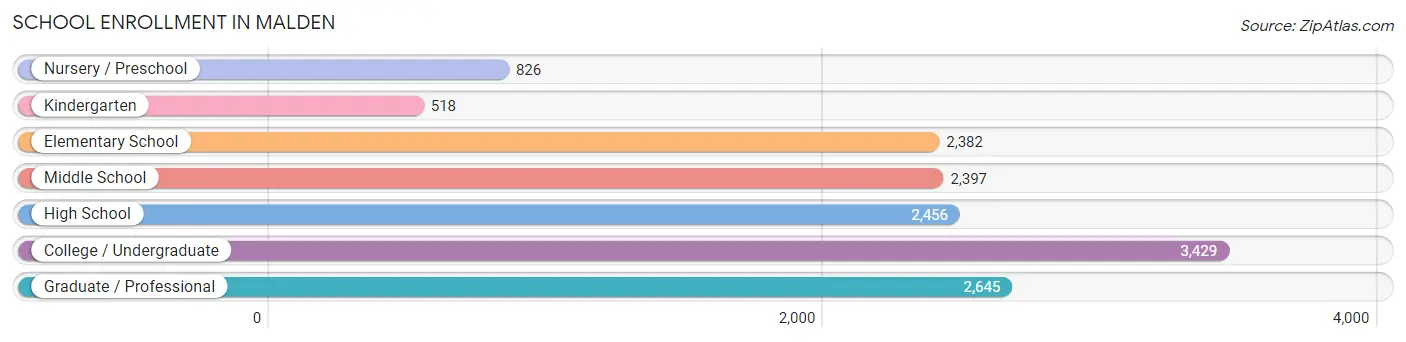
School Enrollment in Malden
The most common levels of schooling among the 14,653 students in Malden are college / undergraduate (3,429 | 23.4%), graduate / professional (2,645 | 18.0%), and high school (2,456 | 16.8%).
| School Level | # Students | % Students |
| Nursery / Preschool | 826 | 5.6% |
| Kindergarten | 518 | 3.5% |
| Elementary School | 2,382 | 16.3% |
| Middle School | 2,397 | 16.4% |
| High School | 2,456 | 16.8% |
| College / Undergraduate | 3,429 | 23.4% |
| Graduate / Professional | 2,645 | 18.0% |
| Total | 14,653 | 100.0% |
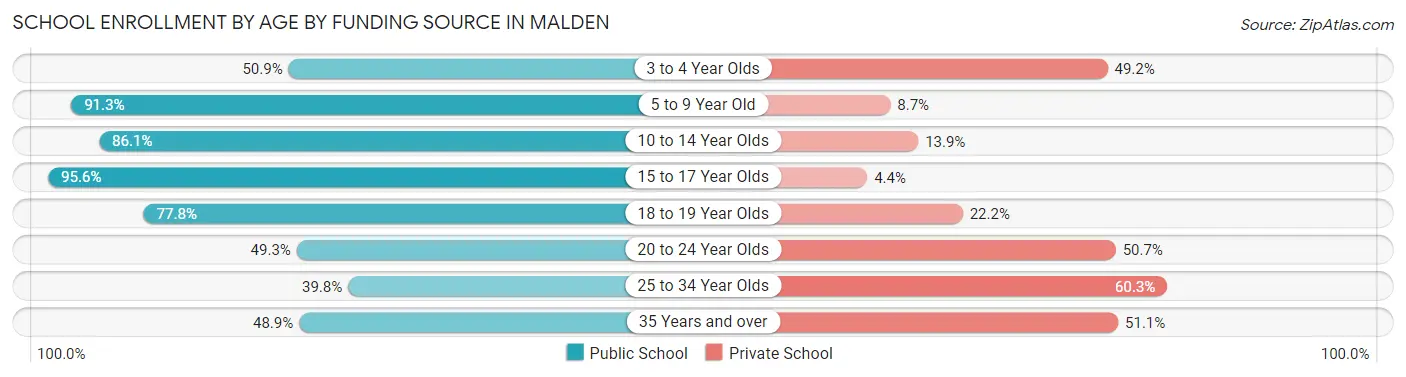
School Enrollment by Age by Funding Source in Malden
Out of a total of 14,653 students who are enrolled in schools in Malden, 4,337 (29.6%) attend a private institution, while the remaining 10,316 (70.4%) are enrolled in public schools. The age group of 25 to 34 year olds has the highest likelihood of being enrolled in private schools, with 1,229 (60.3% in the age bracket) enrolled. Conversely, the age group of 15 to 17 year olds has the lowest likelihood of being enrolled in a private school, with 1,654 (95.6% in the age bracket) attending a public institution.
| Age Bracket | Public School | Private School |
| 3 to 4 Year Olds | 357 (50.8%) | 345 (49.1%) |
| 5 to 9 Year Old | 2,397 (91.3%) | 228 (8.7%) |
| 10 to 14 Year Olds | 2,649 (86.1%) | 427 (13.9%) |
| 15 to 17 Year Olds | 1,654 (95.6%) | 76 (4.4%) |
| 18 to 19 Year Olds | 656 (77.8%) | 187 (22.2%) |
| 20 to 24 Year Olds | 1,025 (49.3%) | 1,053 (50.7%) |
| 25 to 34 Year Olds | 811 (39.8%) | 1,229 (60.3%) |
| 35 Years and over | 762 (48.9%) | 797 (51.1%) |
| Total | 10,316 (70.4%) | 4,337 (29.6%) |
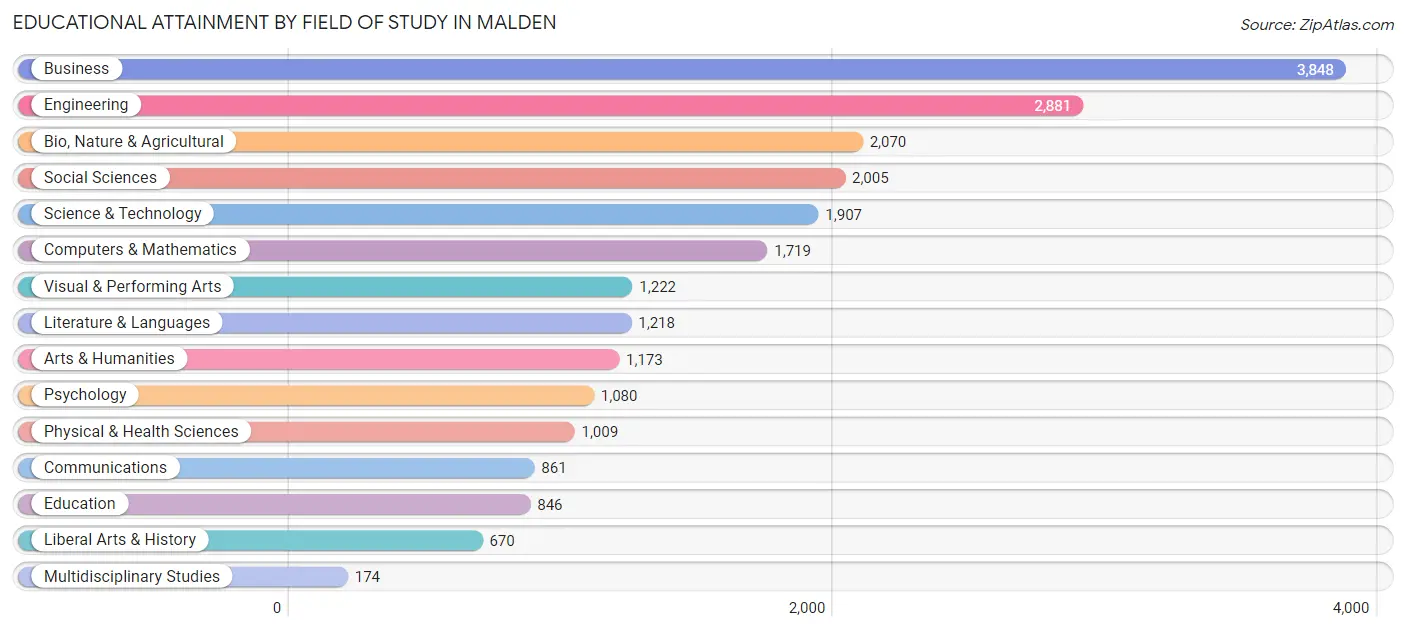
Educational Attainment by Field of Study in Malden
Business (3,848 | 17.0%), engineering (2,881 | 12.7%), bio, nature & agricultural (2,070 | 9.1%), social sciences (2,005 | 8.8%), and science & technology (1,907 | 8.4%) are the most common fields of study among 22,683 individuals in Malden who have obtained a bachelor's degree or higher.
| Field of Study | # Graduates | % Graduates |
| Computers & Mathematics | 1,719 | 7.6% |
| Bio, Nature & Agricultural | 2,070 | 9.1% |
| Physical & Health Sciences | 1,009 | 4.4% |
| Psychology | 1,080 | 4.8% |
| Social Sciences | 2,005 | 8.8% |
| Engineering | 2,881 | 12.7% |
| Multidisciplinary Studies | 174 | 0.8% |
| Science & Technology | 1,907 | 8.4% |
| Business | 3,848 | 17.0% |
| Education | 846 | 3.7% |
| Literature & Languages | 1,218 | 5.4% |
| Liberal Arts & History | 670 | 2.9% |
| Visual & Performing Arts | 1,222 | 5.4% |
| Communications | 861 | 3.8% |
| Arts & Humanities | 1,173 | 5.2% |
| Total | 22,683 | 100.0% |
Transportation & Commute in Malden
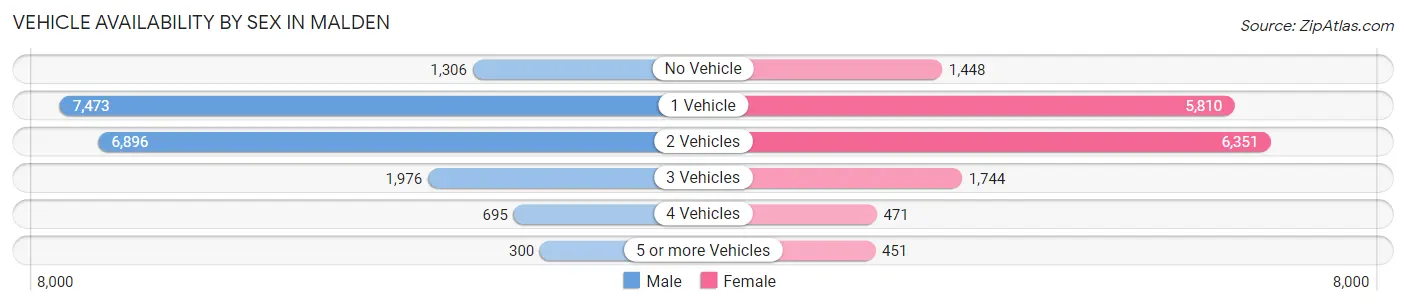
Vehicle Availability by Sex in Malden
The most prevalent vehicle ownership categories in Malden are males with 1 vehicle (7,473, accounting for 40.1%) and females with 1 vehicle (5,810, making up 45.9%).
| Vehicles Available | Male | Female |
| No Vehicle | 1,306 (7.0%) | 1,448 (8.9%) |
| 1 Vehicle | 7,473 (40.1%) | 5,810 (35.7%) |
| 2 Vehicles | 6,896 (37.0%) | 6,351 (39.0%) |
| 3 Vehicles | 1,976 (10.6%) | 1,744 (10.7%) |
| 4 Vehicles | 695 (3.7%) | 471 (2.9%) |
| 5 or more Vehicles | 300 (1.6%) | 451 (2.8%) |
| Total | 18,646 (100.0%) | 16,275 (100.0%) |
Commute Time in Malden
The most frequently occuring commute durations in Malden are 30 to 34 minutes (5,342 commuters, 18.0%), 45 to 59 minutes (5,324 commuters, 17.9%), and 60 to 89 minutes (3,927 commuters, 13.2%).
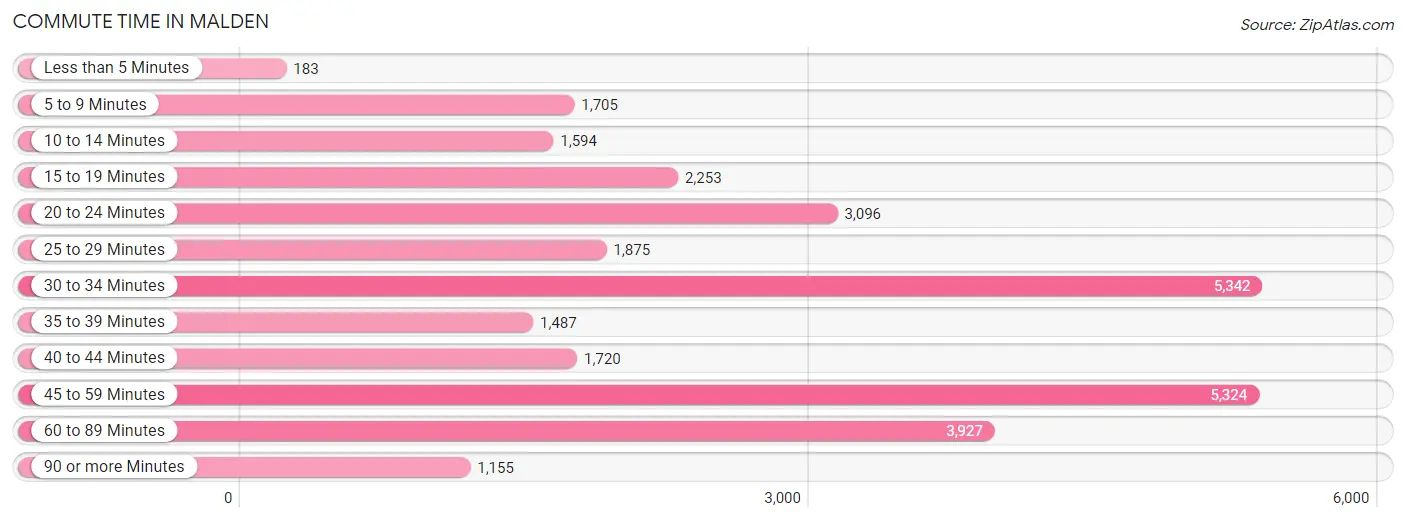
| Commute Time | # Commuters | % Commuters |
| Less than 5 Minutes | 183 | 0.6% |
| 5 to 9 Minutes | 1,705 | 5.8% |
| 10 to 14 Minutes | 1,594 | 5.4% |
| 15 to 19 Minutes | 2,253 | 7.6% |
| 20 to 24 Minutes | 3,096 | 10.4% |
| 25 to 29 Minutes | 1,875 | 6.3% |
| 30 to 34 Minutes | 5,342 | 18.0% |
| 35 to 39 Minutes | 1,487 | 5.0% |
| 40 to 44 Minutes | 1,720 | 5.8% |
| 45 to 59 Minutes | 5,324 | 17.9% |
| 60 to 89 Minutes | 3,927 | 13.2% |
| 90 or more Minutes | 1,155 | 3.9% |
Commute Time by Sex in Malden
The most common commute times in Malden are 30 to 34 minutes (2,711 commuters, 16.9%) for males and 45 to 59 minutes (2,715 commuters, 20.0%) for females.
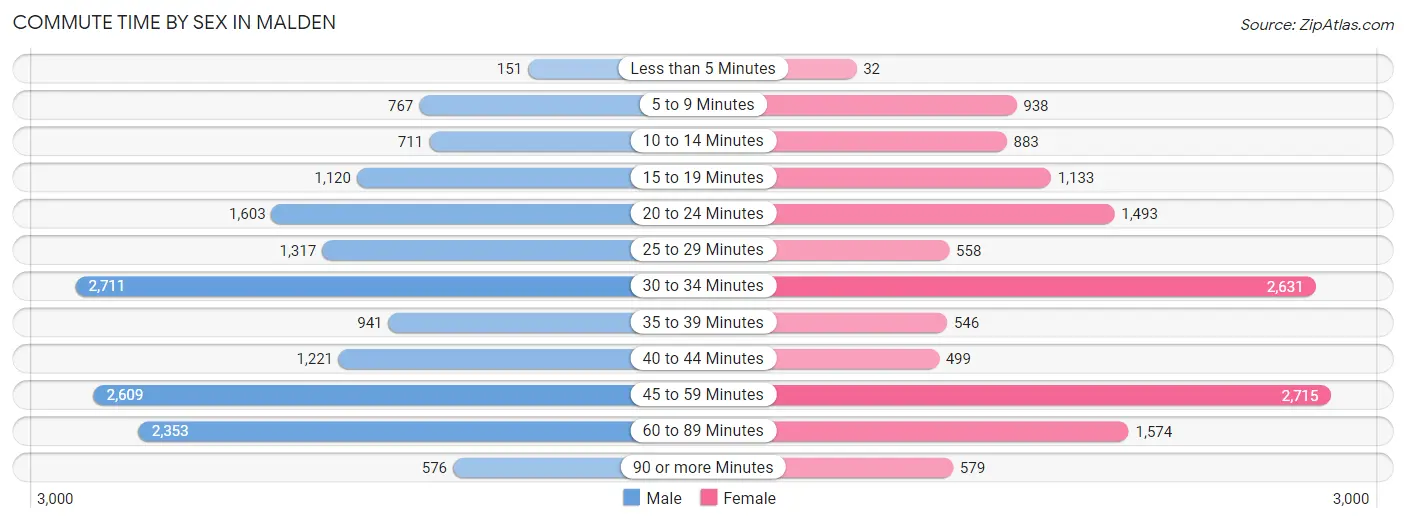
| Commute Time | Male | Female |
| Less than 5 Minutes | 151 (0.9%) | 32 (0.2%) |
| 5 to 9 Minutes | 767 (4.8%) | 938 (6.9%) |
| 10 to 14 Minutes | 711 (4.4%) | 883 (6.5%) |
| 15 to 19 Minutes | 1,120 (7.0%) | 1,133 (8.3%) |
| 20 to 24 Minutes | 1,603 (10.0%) | 1,493 (11.0%) |
| 25 to 29 Minutes | 1,317 (8.2%) | 558 (4.1%) |
| 30 to 34 Minutes | 2,711 (16.9%) | 2,631 (19.4%) |
| 35 to 39 Minutes | 941 (5.9%) | 546 (4.0%) |
| 40 to 44 Minutes | 1,221 (7.6%) | 499 (3.7%) |
| 45 to 59 Minutes | 2,609 (16.2%) | 2,715 (20.0%) |
| 60 to 89 Minutes | 2,353 (14.6%) | 1,574 (11.6%) |
| 90 or more Minutes | 576 (3.6%) | 579 (4.3%) |
Time of Departure to Work by Sex in Malden
The most frequent times of departure to work in Malden are 8:00 AM to 8:29 AM (2,251, 14.0%) for males and 8:00 AM to 8:29 AM (2,163, 15.9%) for females.
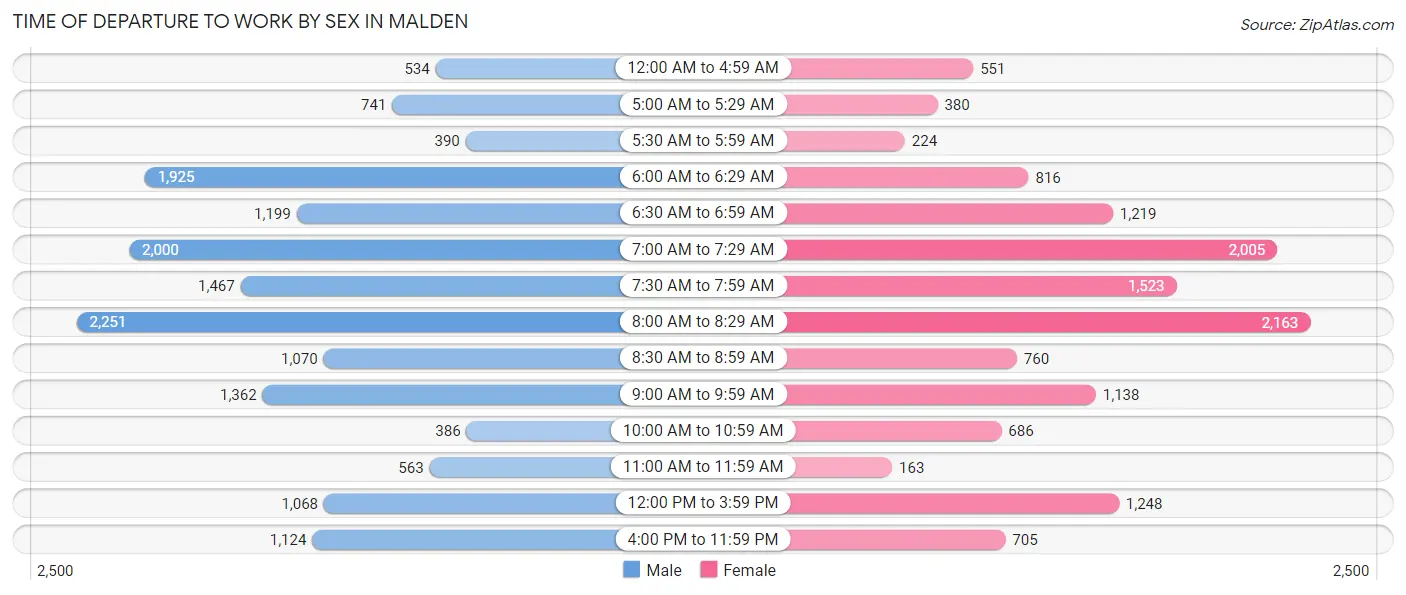
| Time of Departure | Male | Female |
| 12:00 AM to 4:59 AM | 534 (3.3%) | 551 (4.1%) |
| 5:00 AM to 5:29 AM | 741 (4.6%) | 380 (2.8%) |
| 5:30 AM to 5:59 AM | 390 (2.4%) | 224 (1.7%) |
| 6:00 AM to 6:29 AM | 1,925 (12.0%) | 816 (6.0%) |
| 6:30 AM to 6:59 AM | 1,199 (7.5%) | 1,219 (9.0%) |
| 7:00 AM to 7:29 AM | 2,000 (12.4%) | 2,005 (14.8%) |
| 7:30 AM to 7:59 AM | 1,467 (9.1%) | 1,523 (11.2%) |
| 8:00 AM to 8:29 AM | 2,251 (14.0%) | 2,163 (15.9%) |
| 8:30 AM to 8:59 AM | 1,070 (6.7%) | 760 (5.6%) |
| 9:00 AM to 9:59 AM | 1,362 (8.5%) | 1,138 (8.4%) |
| 10:00 AM to 10:59 AM | 386 (2.4%) | 686 (5.1%) |
| 11:00 AM to 11:59 AM | 563 (3.5%) | 163 (1.2%) |
| 12:00 PM to 3:59 PM | 1,068 (6.6%) | 1,248 (9.2%) |
| 4:00 PM to 11:59 PM | 1,124 (7.0%) | 705 (5.2%) |
| Total | 16,080 (100.0%) | 13,581 (100.0%) |
Housing Occupancy in Malden
Occupancy by Ownership in Malden
Of the total 25,809 dwellings in Malden, owner-occupied units account for 11,002 (42.6%), while renter-occupied units make up 14,807 (57.4%).
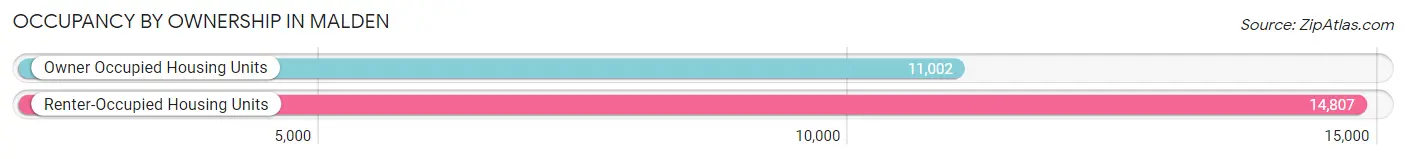
| Occupancy | # Housing Units | % Housing Units |
| Owner Occupied Housing Units | 11,002 | 42.6% |
| Renter-Occupied Housing Units | 14,807 | 57.4% |
| Total Occupied Housing Units | 25,809 | 100.0% |
Occupancy by Household Size in Malden
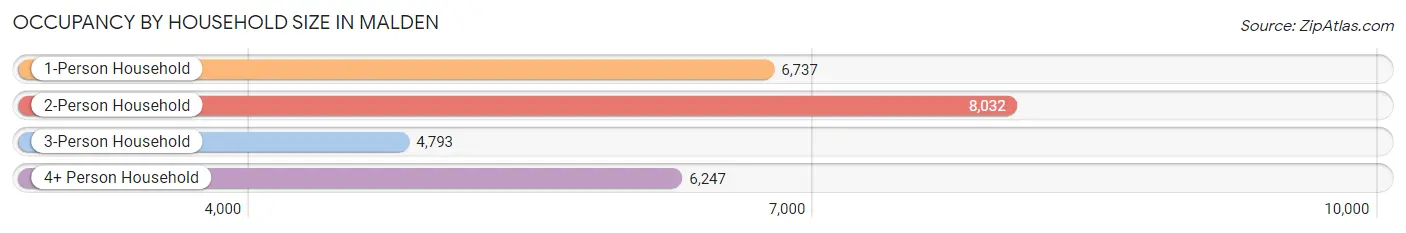
| Household Size | # Housing Units | % Housing Units |
| 1-Person Household | 6,737 | 26.1% |
| 2-Person Household | 8,032 | 31.1% |
| 3-Person Household | 4,793 | 18.6% |
| 4+ Person Household | 6,247 | 24.2% |
| Total Housing Units | 25,809 | 100.0% |
Occupancy by Ownership by Household Size in Malden
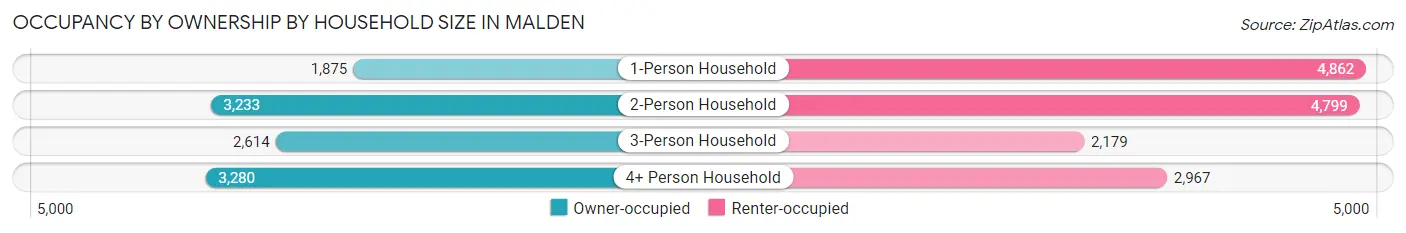
| Household Size | Owner-occupied | Renter-occupied |
| 1-Person Household | 1,875 (27.8%) | 4,862 (72.2%) |
| 2-Person Household | 3,233 (40.3%) | 4,799 (59.8%) |
| 3-Person Household | 2,614 (54.5%) | 2,179 (45.5%) |
| 4+ Person Household | 3,280 (52.5%) | 2,967 (47.5%) |
| Total Housing Units | 11,002 (42.6%) | 14,807 (57.4%) |
Occupancy by Educational Attainment in Malden
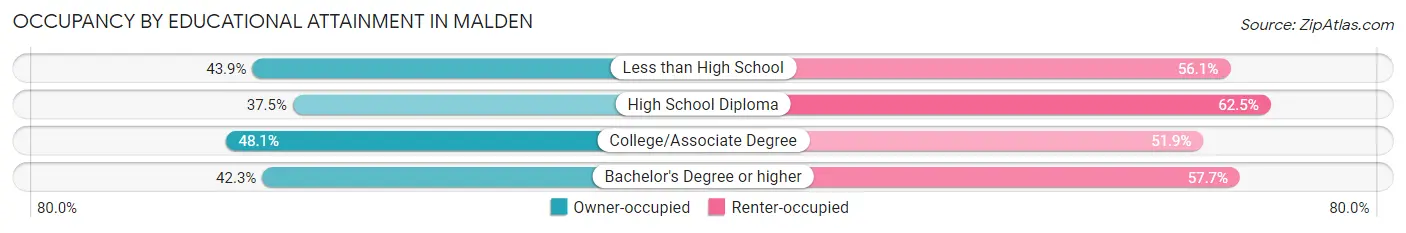
| Household Size | Owner-occupied | Renter-occupied |
| Less than High School | 1,211 (43.9%) | 1,548 (56.1%) |
| High School Diploma | 2,119 (37.5%) | 3,538 (62.5%) |
| College/Associate Degree | 2,583 (48.1%) | 2,786 (51.9%) |
| Bachelor's Degree or higher | 5,089 (42.3%) | 6,935 (57.7%) |
Occupancy by Age of Householder in Malden
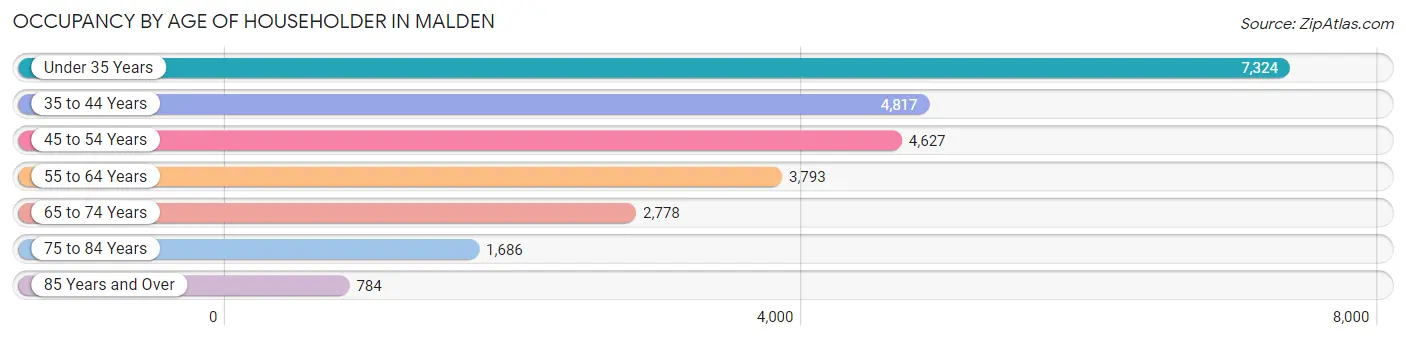
| Age Bracket | # Households | % Households |
| Under 35 Years | 7,324 | 28.4% |
| 35 to 44 Years | 4,817 | 18.7% |
| 45 to 54 Years | 4,627 | 17.9% |
| 55 to 64 Years | 3,793 | 14.7% |
| 65 to 74 Years | 2,778 | 10.8% |
| 75 to 84 Years | 1,686 | 6.5% |
| 85 Years and Over | 784 | 3.0% |
| Total | 25,809 | 100.0% |
Housing Finances in Malden
Median Income by Occupancy in Malden
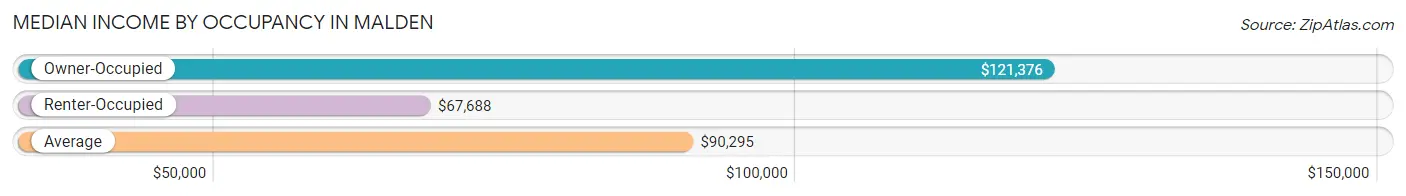
| Occupancy Type | # Households | Median Income |
| Owner-Occupied | 11,002 (42.6%) | $121,376 |
| Renter-Occupied | 14,807 (57.4%) | $67,688 |
| Average | 25,809 (100.0%) | $90,295 |
Occupancy by Householder Income Bracket in Malden
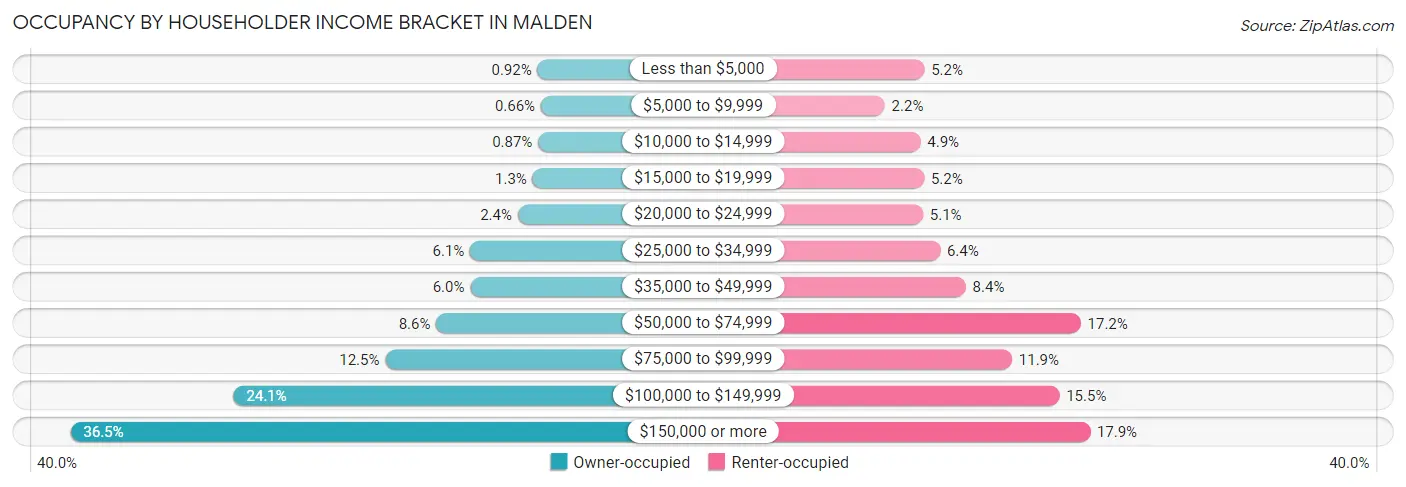
| Income Bracket | Owner-occupied | Renter-occupied |
| Less than $5,000 | 101 (0.9%) | 775 (5.2%) |
| $5,000 to $9,999 | 73 (0.7%) | 329 (2.2%) |
| $10,000 to $14,999 | 96 (0.9%) | 731 (4.9%) |
| $15,000 to $19,999 | 142 (1.3%) | 771 (5.2%) |
| $20,000 to $24,999 | 266 (2.4%) | 760 (5.1%) |
| $25,000 to $34,999 | 666 (6.0%) | 952 (6.4%) |
| $35,000 to $49,999 | 664 (6.0%) | 1,243 (8.4%) |
| $50,000 to $74,999 | 950 (8.6%) | 2,540 (17.2%) |
| $75,000 to $99,999 | 1,377 (12.5%) | 1,763 (11.9%) |
| $100,000 to $149,999 | 2,650 (24.1%) | 2,298 (15.5%) |
| $150,000 or more | 4,017 (36.5%) | 2,645 (17.9%) |
| Total | 11,002 (100.0%) | 14,807 (100.0%) |
Monthly Housing Cost Tiers in Malden
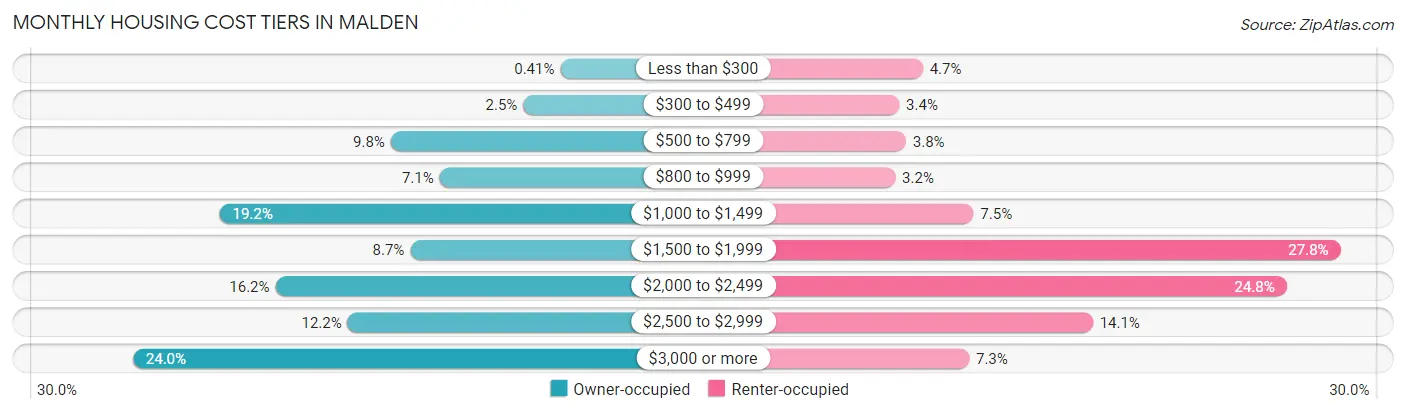
| Monthly Cost | Owner-occupied | Renter-occupied |
| Less than $300 | 45 (0.4%) | 698 (4.7%) |
| $300 to $499 | 271 (2.5%) | 505 (3.4%) |
| $500 to $799 | 1,076 (9.8%) | 559 (3.8%) |
| $800 to $999 | 779 (7.1%) | 473 (3.2%) |
| $1,000 to $1,499 | 2,116 (19.2%) | 1,112 (7.5%) |
| $1,500 to $1,999 | 957 (8.7%) | 4,113 (27.8%) |
| $2,000 to $2,499 | 1,777 (16.2%) | 3,673 (24.8%) |
| $2,500 to $2,999 | 1,338 (12.2%) | 2,088 (14.1%) |
| $3,000 or more | 2,643 (24.0%) | 1,076 (7.3%) |
| Total | 11,002 (100.0%) | 14,807 (100.0%) |
Physical Housing Characteristics in Malden
Housing Structures in Malden
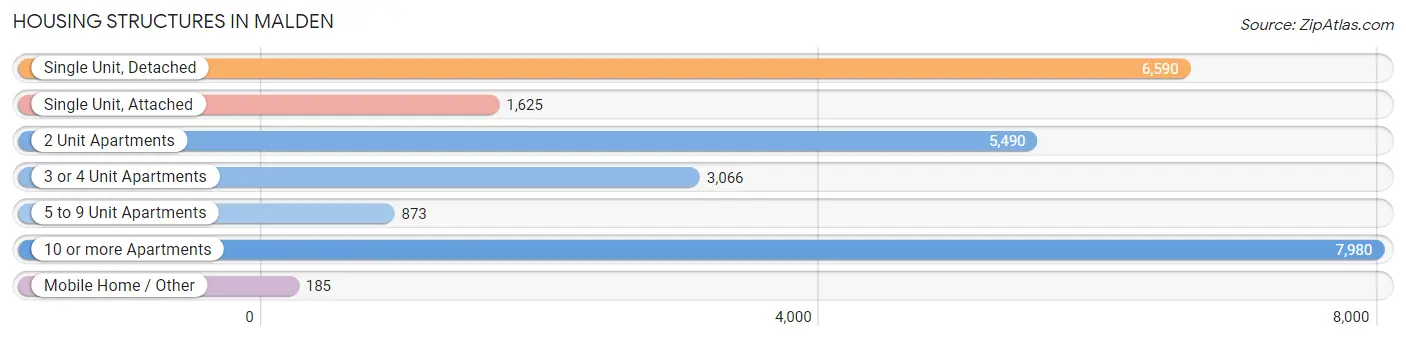
| Structure Type | # Housing Units | % Housing Units |
| Single Unit, Detached | 6,590 | 25.5% |
| Single Unit, Attached | 1,625 | 6.3% |
| 2 Unit Apartments | 5,490 | 21.3% |
| 3 or 4 Unit Apartments | 3,066 | 11.9% |
| 5 to 9 Unit Apartments | 873 | 3.4% |
| 10 or more Apartments | 7,980 | 30.9% |
| Mobile Home / Other | 185 | 0.7% |
| Total | 25,809 | 100.0% |
Housing Structures by Occupancy in Malden
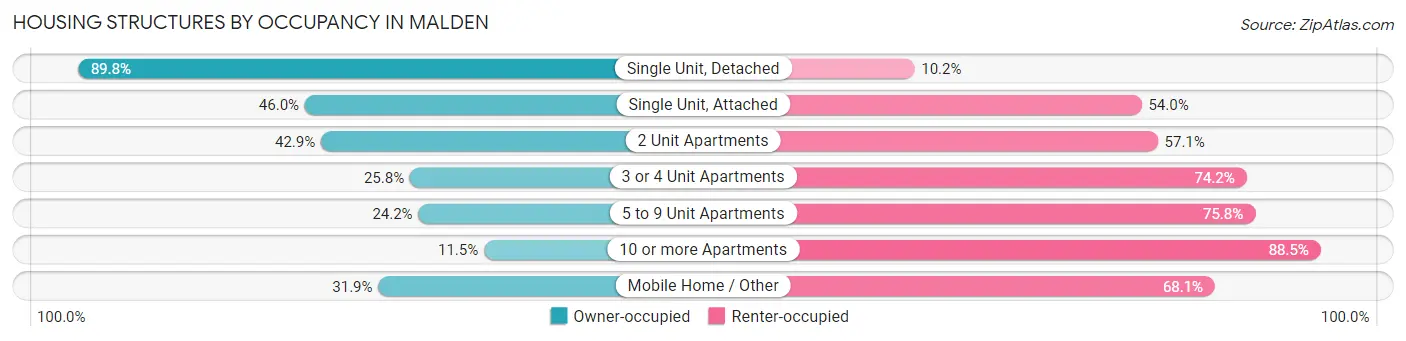
| Structure Type | Owner-occupied | Renter-occupied |
| Single Unit, Detached | 5,916 (89.8%) | 674 (10.2%) |
| Single Unit, Attached | 748 (46.0%) | 877 (54.0%) |
| 2 Unit Apartments | 2,357 (42.9%) | 3,133 (57.1%) |
| 3 or 4 Unit Apartments | 791 (25.8%) | 2,275 (74.2%) |
| 5 to 9 Unit Apartments | 211 (24.2%) | 662 (75.8%) |
| 10 or more Apartments | 920 (11.5%) | 7,060 (88.5%) |
| Mobile Home / Other | 59 (31.9%) | 126 (68.1%) |
| Total | 11,002 (42.6%) | 14,807 (57.4%) |
Housing Structures by Number of Rooms in Malden
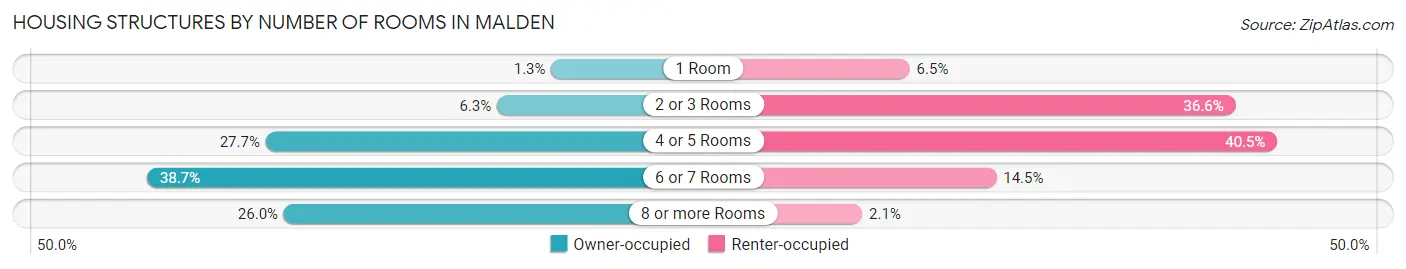
| Number of Rooms | Owner-occupied | Renter-occupied |
| 1 Room | 141 (1.3%) | 955 (6.5%) |
| 2 or 3 Rooms | 693 (6.3%) | 5,418 (36.6%) |
| 4 or 5 Rooms | 3,048 (27.7%) | 5,989 (40.5%) |
| 6 or 7 Rooms | 4,257 (38.7%) | 2,141 (14.5%) |
| 8 or more Rooms | 2,863 (26.0%) | 304 (2.1%) |
| Total | 11,002 (100.0%) | 14,807 (100.0%) |
Housing Structure by Heating Type in Malden
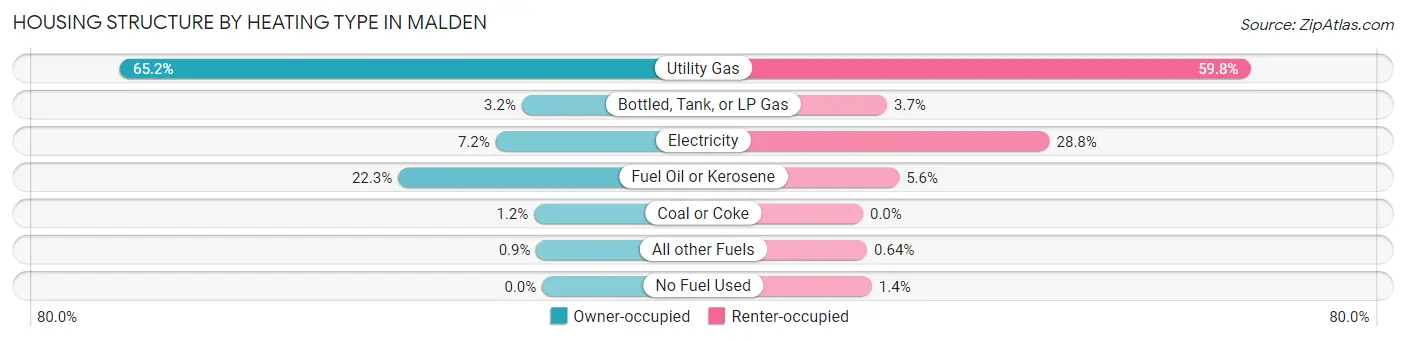
| Heating Type | Owner-occupied | Renter-occupied |
| Utility Gas | 7,178 (65.2%) | 8,860 (59.8%) |
| Bottled, Tank, or LP Gas | 347 (3.2%) | 551 (3.7%) |
| Electricity | 792 (7.2%) | 4,270 (28.8%) |
| Fuel Oil or Kerosene | 2,451 (22.3%) | 828 (5.6%) |
| Coal or Coke | 135 (1.2%) | 0 (0.0%) |
| All other Fuels | 99 (0.9%) | 95 (0.6%) |
| No Fuel Used | 0 (0.0%) | 203 (1.4%) |
| Total | 11,002 (100.0%) | 14,807 (100.0%) |
Household Vehicle Usage in Malden
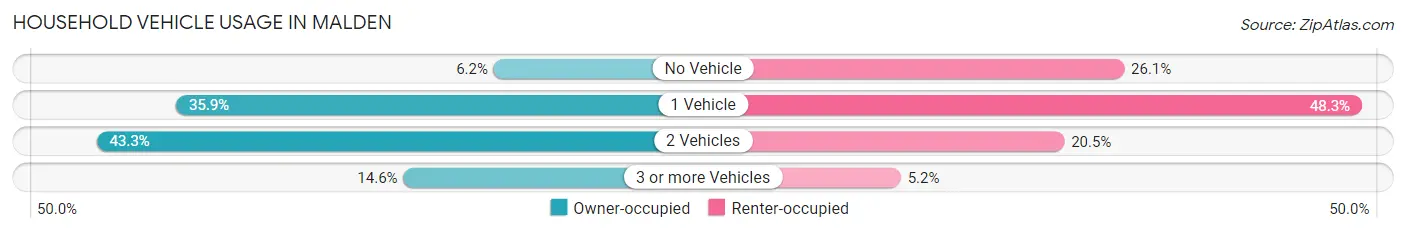
| Vehicles per Household | Owner-occupied | Renter-occupied |
| No Vehicle | 682 (6.2%) | 3,858 (26.1%) |
| 1 Vehicle | 3,946 (35.9%) | 7,146 (48.3%) |
| 2 Vehicles | 4,763 (43.3%) | 3,031 (20.5%) |
| 3 or more Vehicles | 1,611 (14.6%) | 772 (5.2%) |
| Total | 11,002 (100.0%) | 14,807 (100.0%) |
Real Estate & Mortgages in Malden
Real Estate and Mortgage Overview in Malden
| Characteristic | Without Mortgage | With Mortgage |
| Housing Units | 3,712 | 7,290 |
| Median Property Value | $519,200 | $590,100 |
| Median Household Income | $83,896 | $3,432 |
| Monthly Housing Costs | $959 | $2,635 |
| Real Estate Taxes | $5,041 | $101 |
Property Value by Mortgage Status in Malden
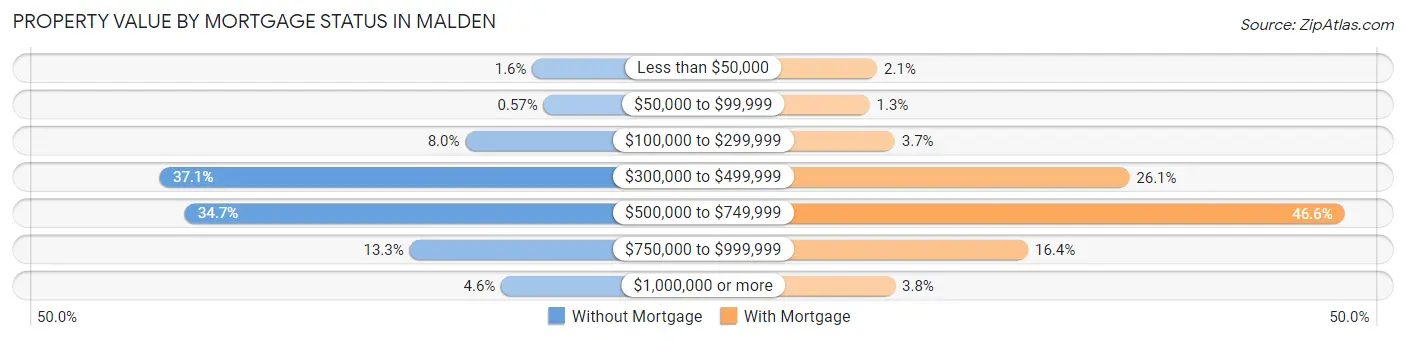
| Property Value | Without Mortgage | With Mortgage |
| Less than $50,000 | 61 (1.6%) | 150 (2.1%) |
| $50,000 to $99,999 | 21 (0.6%) | 98 (1.3%) |
| $100,000 to $299,999 | 298 (8.0%) | 273 (3.7%) |
| $300,000 to $499,999 | 1,377 (37.1%) | 1,901 (26.1%) |
| $500,000 to $749,999 | 1,289 (34.7%) | 3,395 (46.6%) |
| $750,000 to $999,999 | 495 (13.3%) | 1,198 (16.4%) |
| $1,000,000 or more | 171 (4.6%) | 275 (3.8%) |
| Total | 3,712 (100.0%) | 7,290 (100.0%) |
Household Income by Mortgage Status in Malden
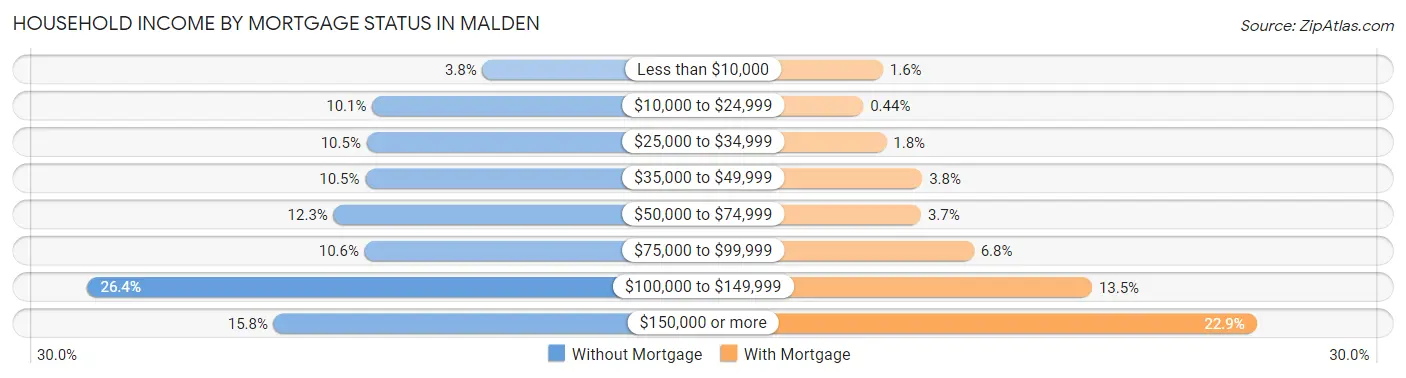
| Household Income | Without Mortgage | With Mortgage |
| Less than $10,000 | 142 (3.8%) | 114 (1.6%) |
| $10,000 to $24,999 | 376 (10.1%) | 32 (0.4%) |
| $25,000 to $34,999 | 388 (10.4%) | 128 (1.8%) |
| $35,000 to $49,999 | 391 (10.5%) | 278 (3.8%) |
| $50,000 to $74,999 | 458 (12.3%) | 273 (3.7%) |
| $75,000 to $99,999 | 392 (10.6%) | 492 (6.8%) |
| $100,000 to $149,999 | 980 (26.4%) | 985 (13.5%) |
| $150,000 or more | 585 (15.8%) | 1,670 (22.9%) |
| Total | 3,712 (100.0%) | 7,290 (100.0%) |
Property Value to Household Income Ratio in Malden
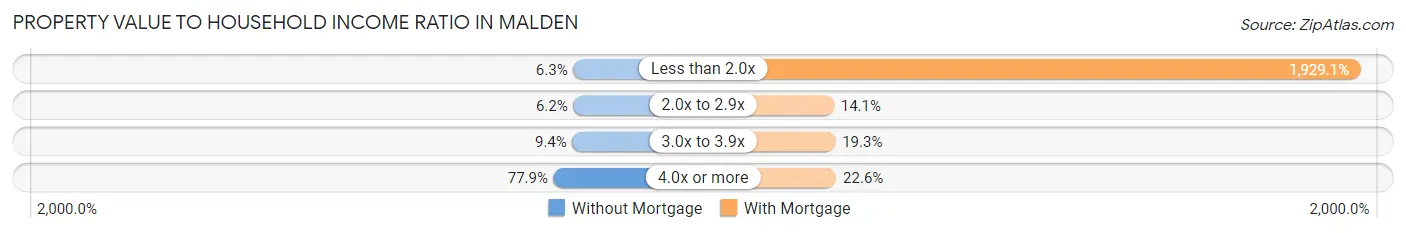
| Value-to-Income Ratio | Without Mortgage | With Mortgage |
| Less than 2.0x | 233 (6.3%) | 140,632 (1,929.1%) |
| 2.0x to 2.9x | 229 (6.2%) | 1,028 (14.1%) |
| 3.0x to 3.9x | 349 (9.4%) | 1,405 (19.3%) |
| 4.0x or more | 2,891 (77.9%) | 1,648 (22.6%) |
| Total | 3,712 (100.0%) | 7,290 (100.0%) |
Real Estate Taxes by Mortgage Status in Malden

| Property Taxes | Without Mortgage | With Mortgage |
| Less than $800 | 79 (2.1%) | 32 (0.4%) |
| $800 to $1,499 | 153 (4.1%) | 266 (3.6%) |
| $800 to $1,499 | 3,288 (88.6%) | 432 (5.9%) |
| Total | 3,712 (100.0%) | 7,290 (100.0%) |
Health & Disability in Malden
Health Insurance Coverage by Age in Malden
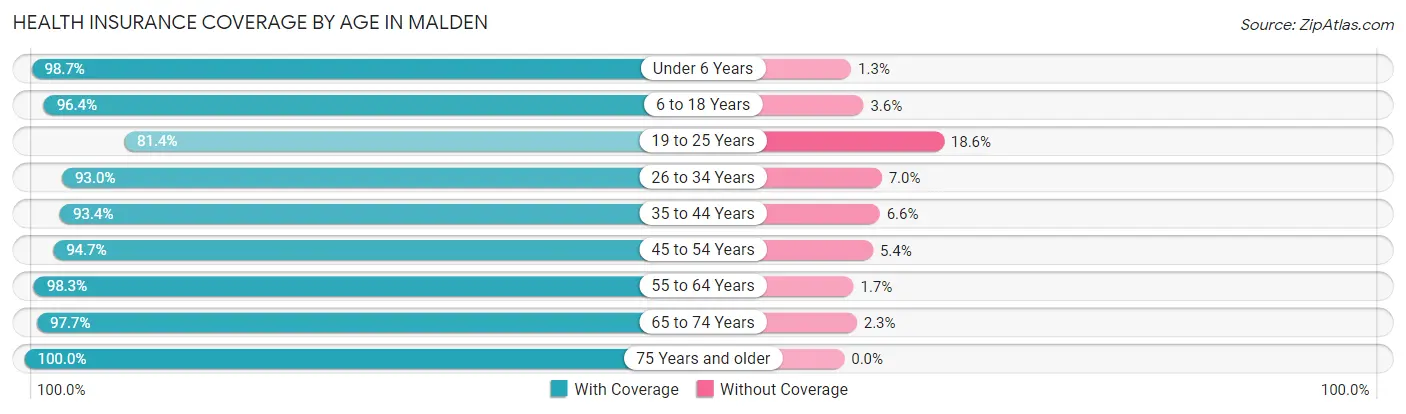
| Age Bracket | With Coverage | Without Coverage |
| Under 6 Years | 4,696 (98.7%) | 61 (1.3%) |
| 6 to 18 Years | 7,563 (96.4%) | 281 (3.6%) |
| 19 to 25 Years | 5,893 (81.4%) | 1,344 (18.6%) |
| 26 to 34 Years | 11,453 (93.0%) | 859 (7.0%) |
| 35 to 44 Years | 8,698 (93.4%) | 615 (6.6%) |
| 45 to 54 Years | 7,579 (94.7%) | 428 (5.3%) |
| 55 to 64 Years | 7,368 (98.3%) | 129 (1.7%) |
| 65 to 74 Years | 4,534 (97.7%) | 108 (2.3%) |
| 75 Years and older | 3,664 (100.0%) | 0 (0.0%) |
| Total | 61,448 (94.1%) | 3,825 (5.9%) |
Health Insurance Coverage by Citizenship Status in Malden

| Citizenship Status | With Coverage | Without Coverage |
| Native Born | 4,696 (98.7%) | 61 (1.3%) |
| Foreign Born, Citizen | 7,563 (96.4%) | 281 (3.6%) |
| Foreign Born, not a Citizen | 5,893 (81.4%) | 1,344 (18.6%) |
Health Insurance Coverage by Household Income in Malden
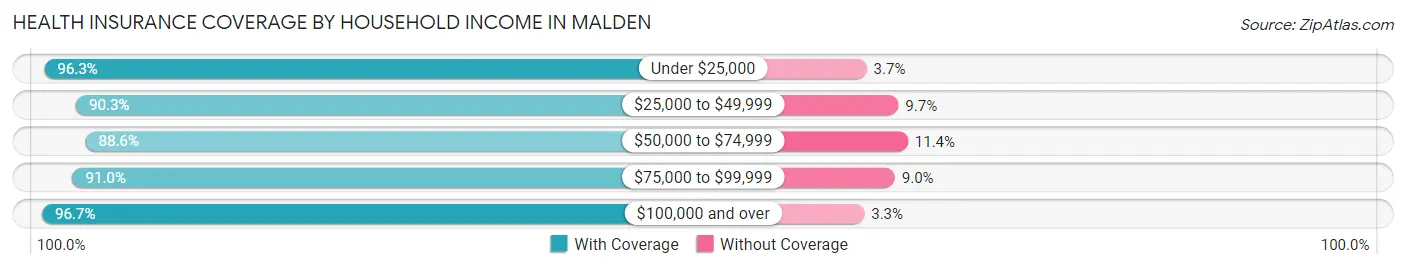
| Household Income | With Coverage | Without Coverage |
| Under $25,000 | 7,326 (96.3%) | 283 (3.7%) |
| $25,000 to $49,999 | 7,726 (90.3%) | 827 (9.7%) |
| $50,000 to $74,999 | 7,076 (88.6%) | 914 (11.4%) |
| $75,000 to $99,999 | 7,222 (91.0%) | 714 (9.0%) |
| $100,000 and over | 31,948 (96.7%) | 1,082 (3.3%) |
Public vs Private Health Insurance Coverage by Age in Malden
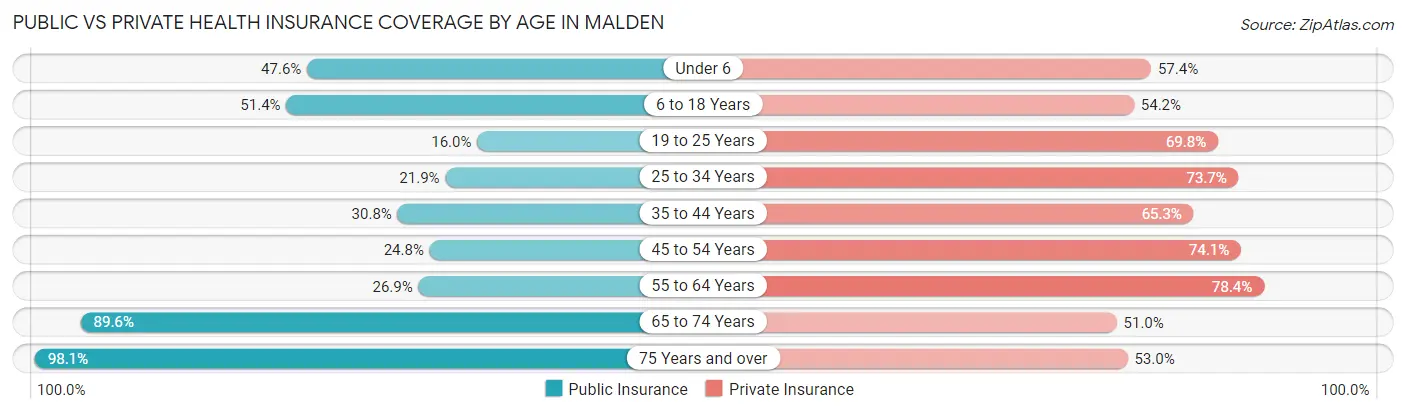
| Age Bracket | Public Insurance | Private Insurance |
| Under 6 | 2,262 (47.5%) | 2,730 (57.4%) |
| 6 to 18 Years | 4,032 (51.4%) | 4,252 (54.2%) |
| 19 to 25 Years | 1,156 (16.0%) | 5,053 (69.8%) |
| 25 to 34 Years | 2,695 (21.9%) | 9,068 (73.7%) |
| 35 to 44 Years | 2,865 (30.8%) | 6,082 (65.3%) |
| 45 to 54 Years | 1,986 (24.8%) | 5,934 (74.1%) |
| 55 to 64 Years | 2,015 (26.9%) | 5,876 (78.4%) |
| 65 to 74 Years | 4,159 (89.6%) | 2,368 (51.0%) |
| 75 Years and over | 3,594 (98.1%) | 1,943 (53.0%) |
| Total | 24,764 (37.9%) | 43,306 (66.3%) |
Disability Status by Sex by Age in Malden
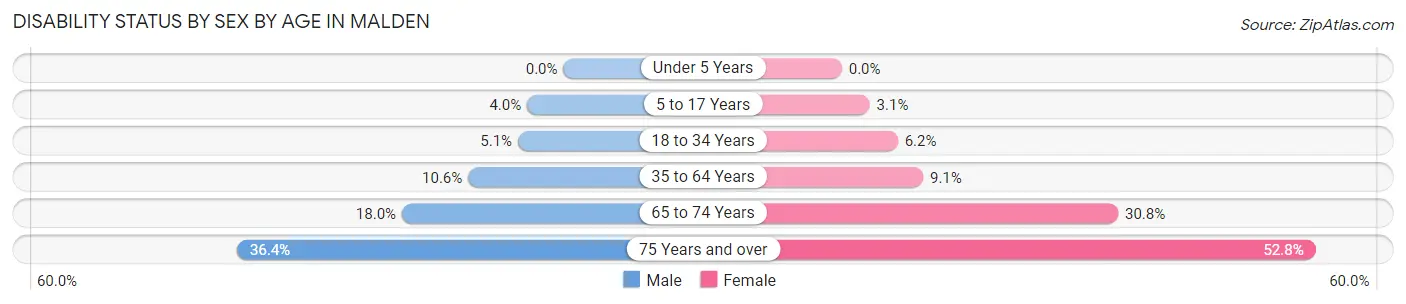
| Age Bracket | Male | Female |
| Under 5 Years | 0 (0.0%) | 0 (0.0%) |
| 5 to 17 Years | 172 (4.0%) | 114 (3.1%) |
| 18 to 34 Years | 585 (5.1%) | 532 (6.2%) |
| 35 to 64 Years | 1,299 (10.6%) | 1,138 (9.0%) |
| 65 to 74 Years | 390 (18.0%) | 761 (30.8%) |
| 75 Years and over | 414 (36.3%) | 1,332 (52.7%) |
Disability Class by Sex by Age in Malden
Disability Class: Hearing Difficulty
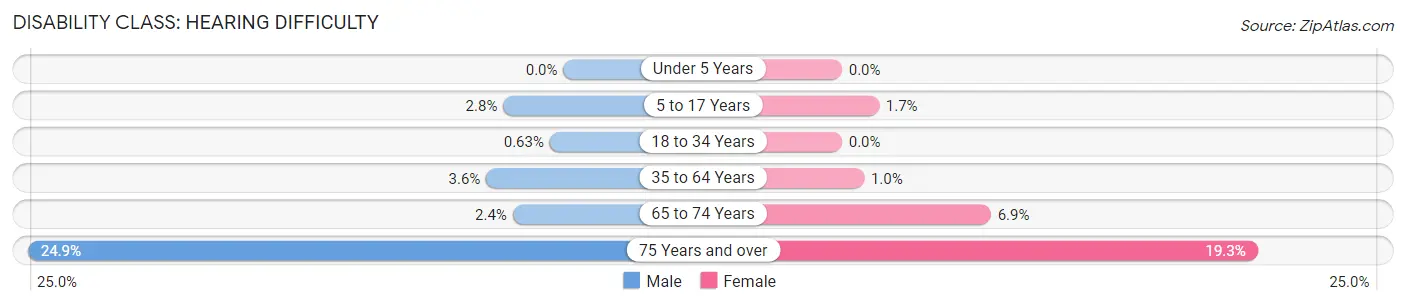
| Age Bracket | Male | Female |
| Under 5 Years | 0 (0.0%) | 0 (0.0%) |
| 5 to 17 Years | 119 (2.8%) | 63 (1.7%) |
| 18 to 34 Years | 73 (0.6%) | 0 (0.0%) |
| 35 to 64 Years | 439 (3.6%) | 129 (1.0%) |
| 65 to 74 Years | 51 (2.4%) | 171 (6.9%) |
| 75 Years and over | 283 (24.8%) | 487 (19.3%) |
Disability Class: Vision Difficulty
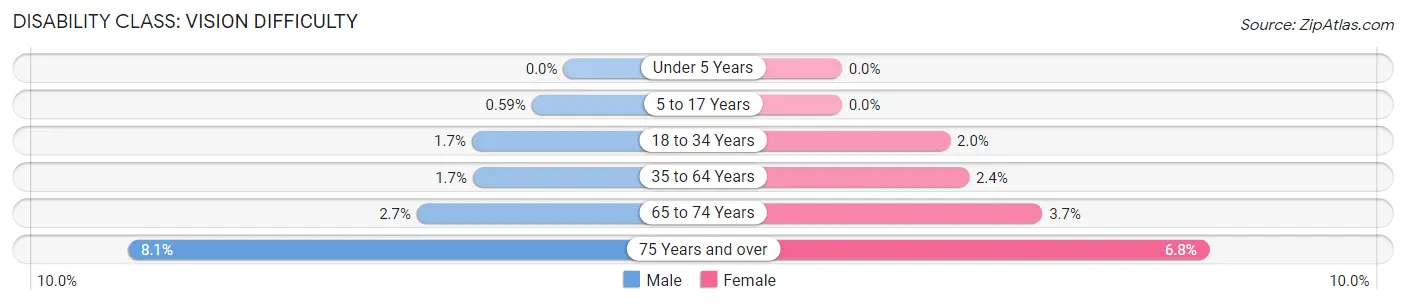
| Age Bracket | Male | Female |
| Under 5 Years | 0 (0.0%) | 0 (0.0%) |
| 5 to 17 Years | 25 (0.6%) | 0 (0.0%) |
| 18 to 34 Years | 197 (1.7%) | 172 (2.0%) |
| 35 to 64 Years | 206 (1.7%) | 296 (2.4%) |
| 65 to 74 Years | 59 (2.7%) | 92 (3.7%) |
| 75 Years and over | 92 (8.1%) | 172 (6.8%) |
Disability Class: Cognitive Difficulty
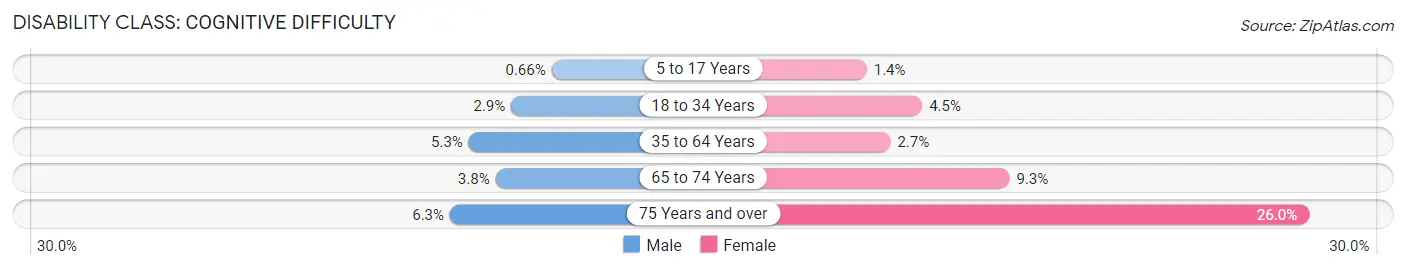
| Age Bracket | Male | Female |
| 5 to 17 Years | 28 (0.7%) | 51 (1.4%) |
| 18 to 34 Years | 337 (2.9%) | 383 (4.5%) |
| 35 to 64 Years | 645 (5.3%) | 341 (2.7%) |
| 65 to 74 Years | 82 (3.8%) | 231 (9.3%) |
| 75 Years and over | 72 (6.3%) | 657 (26.0%) |
Disability Class: Ambulatory Difficulty
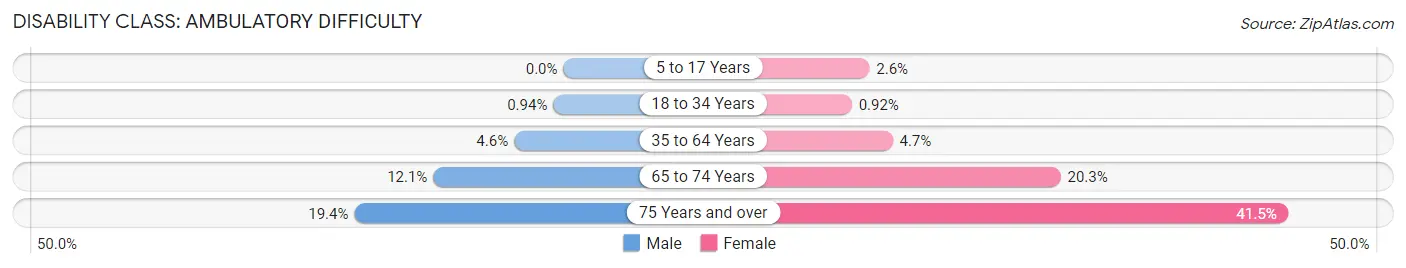
| Age Bracket | Male | Female |
| 5 to 17 Years | 0 (0.0%) | 94 (2.6%) |
| 18 to 34 Years | 109 (0.9%) | 79 (0.9%) |
| 35 to 64 Years | 561 (4.6%) | 592 (4.7%) |
| 65 to 74 Years | 262 (12.1%) | 502 (20.3%) |
| 75 Years and over | 221 (19.4%) | 1,047 (41.5%) |
Disability Class: Self-Care Difficulty
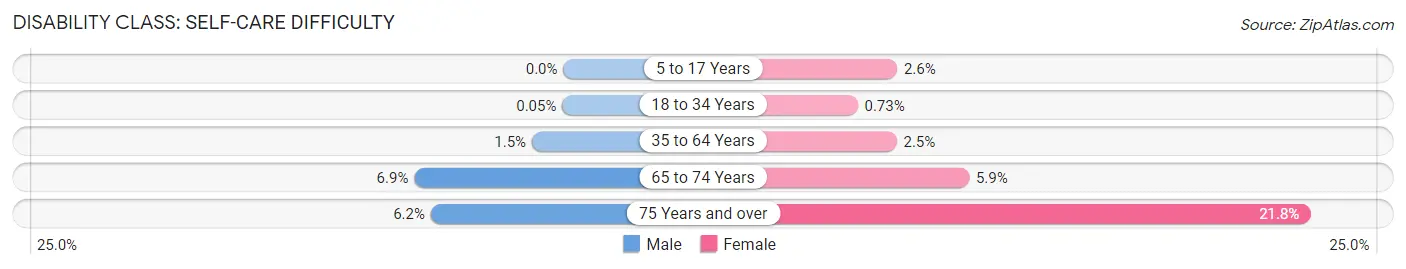
| Age Bracket | Male | Female |
| 5 to 17 Years | 0 (0.0%) | 94 (2.6%) |
| 18 to 34 Years | 6 (0.1%) | 62 (0.7%) |
| 35 to 64 Years | 179 (1.5%) | 319 (2.5%) |
| 65 to 74 Years | 150 (6.9%) | 146 (5.9%) |
| 75 Years and over | 70 (6.1%) | 550 (21.8%) |
Technology Access in Malden
Computing Device Access in Malden
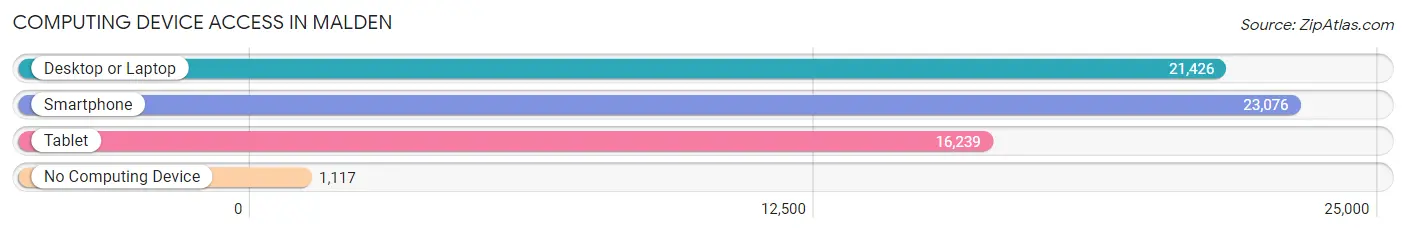
| Device Type | # Households | % Households |
| Desktop or Laptop | 21,426 | 83.0% |
| Smartphone | 23,076 | 89.4% |
| Tablet | 16,239 | 62.9% |
| No Computing Device | 1,117 | 4.3% |
| Total | 25,809 | 100.0% |
Internet Access in Malden
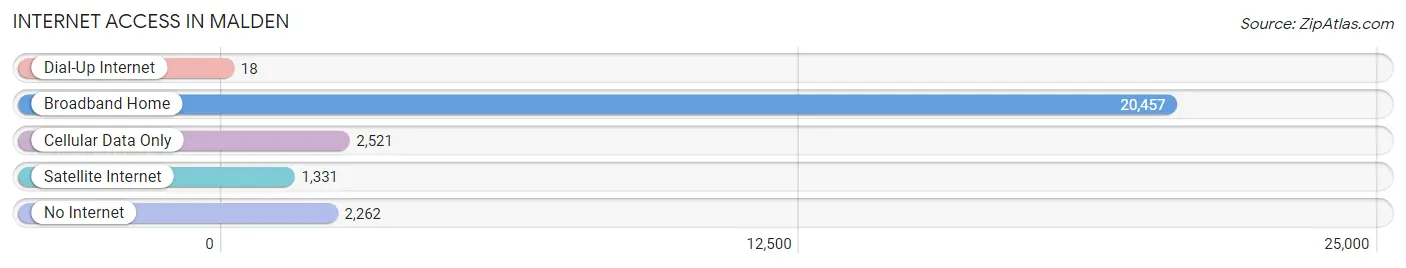
| Internet Type | # Households | % Households |
| Dial-Up Internet | 18 | 0.1% |
| Broadband Home | 20,457 | 79.3% |
| Cellular Data Only | 2,521 | 9.8% |
| Satellite Internet | 1,331 | 5.2% |
| No Internet | 2,262 | 8.8% |
| Total | 25,809 | 100.0% |
Malden Summary
Malden is a city located in Middlesex County, Massachusetts, United States. It is located just north of Boston and is part of the Greater Boston metropolitan area. As of the 2010 United States Census, the population of Malden was 59,450, making it the 12th largest city in Massachusetts.
History
Malden was first settled in 1640 by Puritans from the Massachusetts Bay Colony. The area was originally known as the "Mistick Side" and was a part of Charlestown. In 1649, the area was incorporated as a town and was named after Malden, Essex in England. The town grew rapidly and by the mid-19th century, it had become an industrial center. In 1845, the town was incorporated as a city.
In the late 19th and early 20th centuries, Malden experienced a period of growth and prosperity. The city was home to several factories and mills, including the Malden Mills, which was founded in 1876 and was one of the largest employers in the city. The city also had a thriving retail sector, with several department stores and other businesses.
In the mid-20th century, Malden began to experience a period of decline. The city's factories and mills began to close and the city's population began to decline. In the late 20th century, the city began to experience a period of revitalization. The city has seen an influx of new businesses and residents, and has become a popular destination for young professionals.
Geography
Malden is located at 42°27′N 71°05′W (42.45, -71.08). According to the United States Census Bureau, the city has a total area of 5.1 square miles (13.2 km2), of which 5.0 square miles (13.0 km2) is land and 0.1 square miles (0.2 km2) is water.
Malden is bordered by the cities of Medford to the west, Everett to the north, Revere to the east, and Melrose to the south. The Mystic River forms the city's eastern border.
Economy
Malden's economy is largely based on the service sector. The city is home to several large employers, including the Malden Mills, which is one of the largest employers in the city. Other major employers include the Massachusetts General Hospital, the City of Malden, and the Malden Public Schools.
The city also has a thriving retail sector, with several department stores and other businesses. The city is also home to several technology companies, including the software company, EMC Corporation.
Demographics
As of the 2010 United States Census, there were 59,450 people, 24,845 households, and 14,845 families residing in the city. The population density was 11,845.7 people per square mile (4,567.2/km2). There were 25,845 housing units at an average density of 5,097.3 per square mile (1,967.2/km2). The racial makeup of the city was 68.2% White, 11.2% African American, 0.3% Native American, 11.2% Asian, 0.1% Pacific Islander, 5.2% from other races, and 3.9% from two or more races. Hispanic or Latino of any race were 11.2% of the population.
There were 24,845 households, out of which 28.2% had children under the age of 18 living with them, 41.2% were married couples living together, 14.3% had a female householder with no husband present, and 39.7% were non-families. 32.2% of all households were made up of individuals, and 11.2% had someone living alone who was 65 years of age or older. The average household size was 2.38 and the average family size was 3.04.
In the city, the population was spread out, with 22.2% under the age of 18, 8.2% from 18 to 24, 33.2% from 25 to 44, 22.2% from 45 to 64, and 14.2% who were 65 years of age or older. The median age was 36 years. For every 100 females, there were 92.2 males. For every 100 females age 18 and over, there were 88.7 males.
The median income for a household in the city was $45,837, and the median income for a family was $54,837. Males had a median income of $41,837 versus $32,837 for females. The per capita income for the city was $23,837. About 8.2% of families and 10.2% of the population were below the poverty line, including 14.2% of those under age 18 and 8.2% of those age 65 or over.
Common Questions
What is Per Capita Income in Malden?
Per Capita income in Malden is $43,728.
What is the Median Family Income in Malden?
Median Family Income in Malden is $102,510.
What is the Median Household income in Malden?
Median Household Income in Malden is $90,295.
What is Income or Wage Gap in Malden?
Income or Wage Gap in Malden is 16.5%.
Women in Malden earn 83.5 cents for every dollar earned by a man.
What is Family Income Deficit in Malden?
Family Income Deficit in Malden is $8,818.
Families that are below poverty line in Malden earn $8,818 less on average than the poverty threshold level.
What is Inequality or Gini Index in Malden?
Inequality or Gini Index in Malden is 0.45.
What is the Total Population of Malden?
Total Population of Malden is 65,463.
What is the Total Male Population of Malden?
Total Male Population of Malden is 33,848.
What is the Total Female Population of Malden?
Total Female Population of Malden is 31,615.
What is the Ratio of Males per 100 Females in Malden?
There are 107.06 Males per 100 Females in Malden.
What is the Ratio of Females per 100 Males in Malden?
There are 93.40 Females per 100 Males in Malden.
What is the Median Population Age in Malden?
Median Population Age in Malden is 35.4 Years.
What is the Average Family Size in Malden
Average Family Size in Malden is 3.1 People.
What is the Average Household Size in Malden
Average Household Size in Malden is 2.5 People.
How Large is the Labor Force in Malden?
There are 38,436 People in the Labor Forcein in Malden.
What is the Percentage of People in the Labor Force in Malden?
70.4% of People are in the Labor Force in Malden.
What is the Unemployment Rate in Malden?
Unemployment Rate in Malden is 6.6%.