Bourne, MA Map & Demographics
Bourne Map
Bourne Overview
$55,732
PER CAPITA INCOME
$101,985
AVG FAMILY INCOME
$76,103
AVG HOUSEHOLD INCOME
0.54
INEQUALITY / GINI INDEX
1,782
TOTAL POPULATION
782
MALE POPULATION
1,000
FEMALE POPULATION
78.20
MALES / 100 FEMALES
127.88
FEMALES / 100 MALES
57.6
MEDIAN AGE
2.7
AVG FAMILY SIZE
2.1
AVG HOUSEHOLD SIZE
638
LABOR FORCE [ PEOPLE ]
43.3%
PERCENT IN LABOR FORCE
Income in Bourne
Income Overview in Bourne
Per Capita Income in Bourne is $55,732, while median incomes of families and households are $101,985 and $76,103 respectively.
| Characteristic | Number | Measure |
| Per Capita Income | 1,782 | $55,732 |
| Median Family Income | 503 | $101,985 |
| Mean Family Income | 503 | $154,628 |
| Median Household Income | 858 | $76,103 |
| Mean Household Income | 858 | $113,027 |
| Income Deficit | 503 | $0 |
| Wage / Income Gap (%) | 1,782 | 0.00% |
| Wage / Income Gap ($) | 1,782 | 100.00¢ per $1 |
| Gini / Inequality Index | 1,782 | 0.54 |
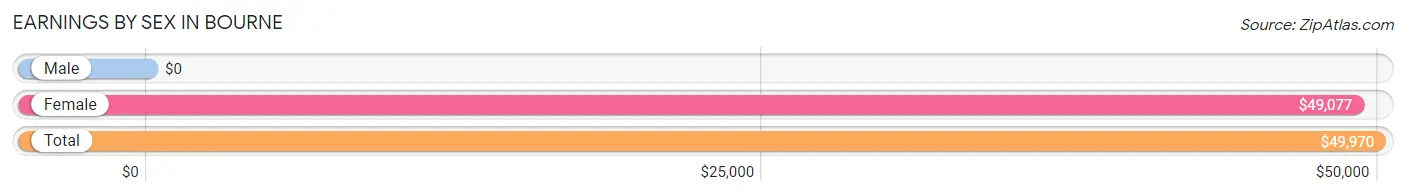
Earnings by Sex in Bourne
| Sex | Number | Average Earnings |
| Male | 354 (47.1%) | $0 |
| Female | 397 (52.9%) | $49,077 |
| Total | 751 (100.0%) | $49,970 |
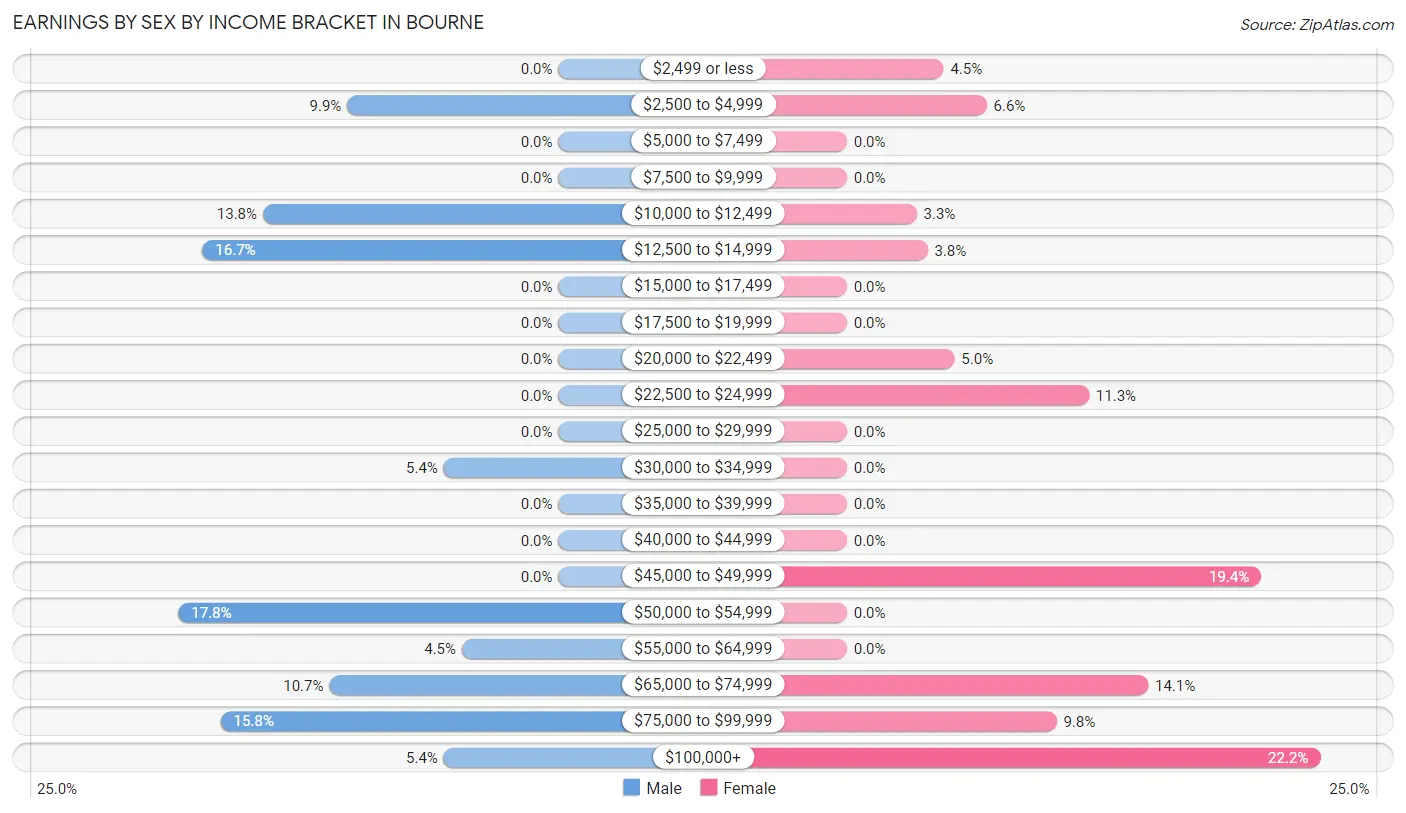
Earnings by Sex by Income Bracket in Bourne
The most common earnings brackets in Bourne are $50,000 to $54,999 for men (63 | 17.8%) and $100,000+ for women (88 | 22.2%).
| Income | Male | Female |
| $2,499 or less | 0 (0.0%) | 18 (4.5%) |
| $2,500 to $4,999 | 35 (9.9%) | 26 (6.6%) |
| $5,000 to $7,499 | 0 (0.0%) | 0 (0.0%) |
| $7,500 to $9,999 | 0 (0.0%) | 0 (0.0%) |
| $10,000 to $12,499 | 49 (13.8%) | 13 (3.3%) |
| $12,500 to $14,999 | 59 (16.7%) | 15 (3.8%) |
| $15,000 to $17,499 | 0 (0.0%) | 0 (0.0%) |
| $17,500 to $19,999 | 0 (0.0%) | 0 (0.0%) |
| $20,000 to $22,499 | 0 (0.0%) | 20 (5.0%) |
| $22,500 to $24,999 | 0 (0.0%) | 45 (11.3%) |
| $25,000 to $29,999 | 0 (0.0%) | 0 (0.0%) |
| $30,000 to $34,999 | 19 (5.4%) | 0 (0.0%) |
| $35,000 to $39,999 | 0 (0.0%) | 0 (0.0%) |
| $40,000 to $44,999 | 0 (0.0%) | 0 (0.0%) |
| $45,000 to $49,999 | 0 (0.0%) | 77 (19.4%) |
| $50,000 to $54,999 | 63 (17.8%) | 0 (0.0%) |
| $55,000 to $64,999 | 16 (4.5%) | 0 (0.0%) |
| $65,000 to $74,999 | 38 (10.7%) | 56 (14.1%) |
| $75,000 to $99,999 | 56 (15.8%) | 39 (9.8%) |
| $100,000+ | 19 (5.4%) | 88 (22.2%) |
| Total | 354 (100.0%) | 397 (100.0%) |
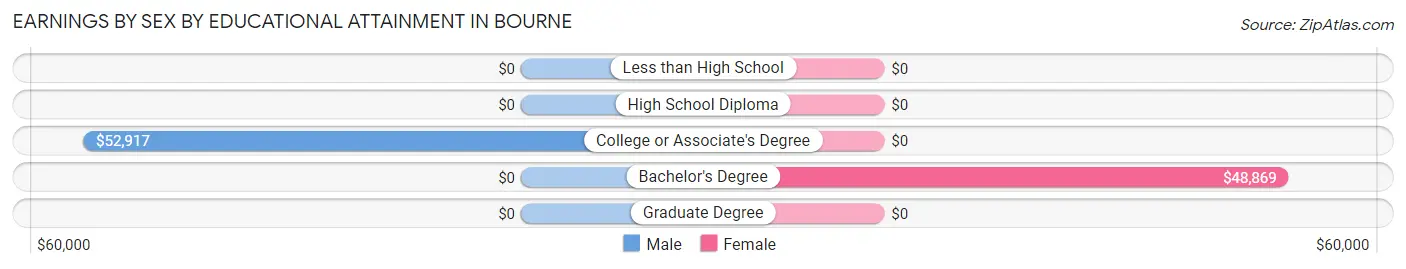
Earnings by Sex by Educational Attainment in Bourne
Average earnings in Bourne are $54,306 for men and $65,536 for women, a difference of 17.1%. Men with an educational attainment of college or associate's degree enjoy the highest average annual earnings of $52,917, while those with college or associate's degree education earn the least with $52,917. Women with an educational attainment of bachelor's degree earn the most with the average annual earnings of $48,869, while those with bachelor's degree education have the smallest earnings of $48,869.
| Educational Attainment | Male Income | Female Income |
| Less than High School | - | - |
| High School Diploma | - | - |
| College or Associate's Degree | $52,917 | $0 |
| Bachelor's Degree | - | - |
| Graduate Degree | - | - |
| Total | $54,306 | $65,536 |
Family Income in Bourne
Family Income Brackets in Bourne
According to the Bourne family income data, there are 113 families falling into the $150,000 to $199,999 income range, which is the most common income bracket and makes up 22.5% of all families.
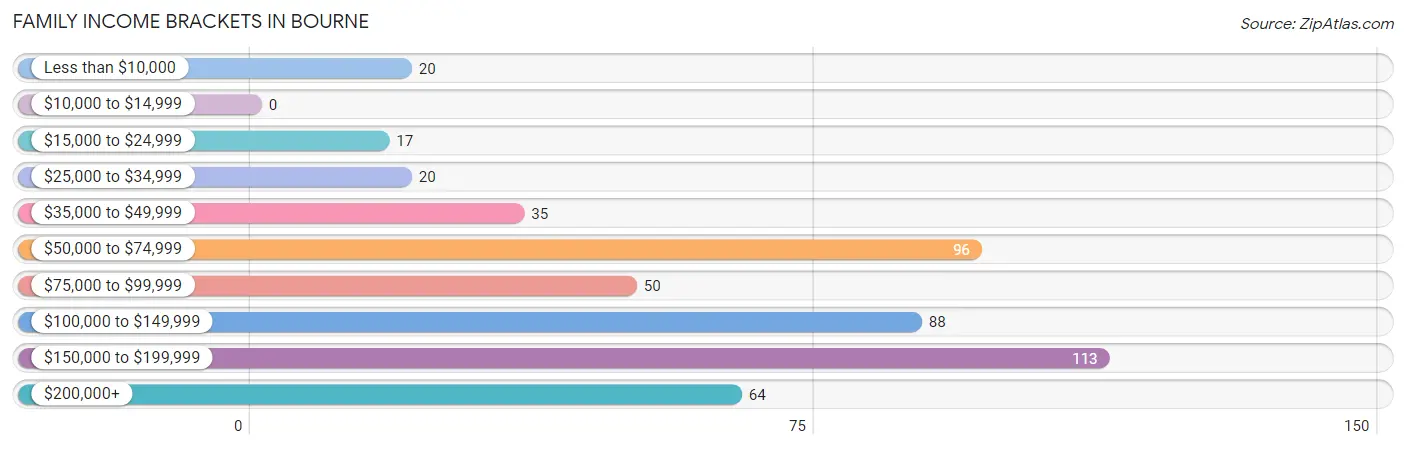
| Income Bracket | # Families | % Families |
| Less than $10,000 | 20 | 4.0% |
| $10,000 to $14,999 | 0 | 0.0% |
| $15,000 to $24,999 | 17 | 3.4% |
| $25,000 to $34,999 | 20 | 4.0% |
| $35,000 to $49,999 | 35 | 7.0% |
| $50,000 to $74,999 | 96 | 19.1% |
| $75,000 to $99,999 | 50 | 9.9% |
| $100,000 to $149,999 | 88 | 17.5% |
| $150,000 to $199,999 | 113 | 22.5% |
| $200,000+ | 64 | 12.7% |
Family Income by Famaliy Size in Bourne
2-person families (370 | 73.6%) account for the highest median family income in Bourne with $135,329 per family, while 2-person families (370 | 73.6%) have the highest median income of $67,664 per family member.
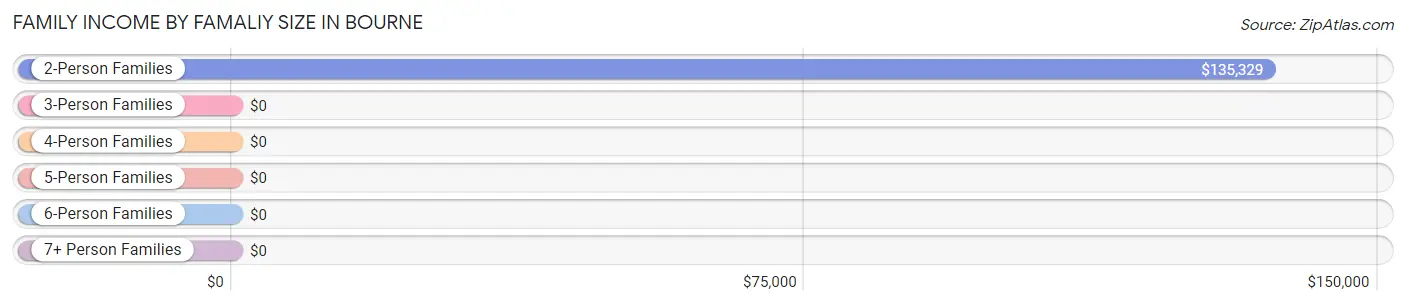
| Income Bracket | # Families | Median Income |
| 2-Person Families | 370 (73.6%) | $135,329 |
| 3-Person Families | 35 (7.0%) | $0 |
| 4-Person Families | 0 (0.0%) | $0 |
| 5-Person Families | 73 (14.5%) | $0 |
| 6-Person Families | 25 (5.0%) | $0 |
| 7+ Person Families | 0 (0.0%) | $0 |
| Total | 503 (100.0%) | $101,985 |
Family Income by Number of Earners in Bourne
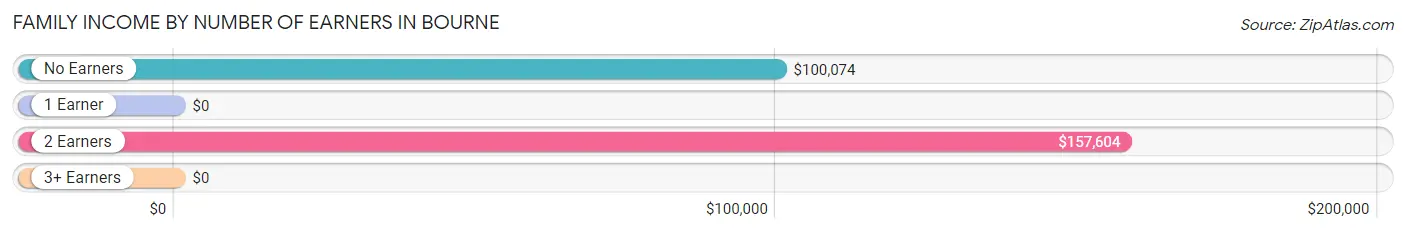
| Number of Earners | # Families | Median Income |
| No Earners | 137 (27.2%) | $100,074 |
| 1 Earner | 263 (52.3%) | $0 |
| 2 Earners | 78 (15.5%) | $157,604 |
| 3+ Earners | 25 (5.0%) | $0 |
| Total | 503 (100.0%) | $101,985 |
Household Income in Bourne
Household Income Brackets in Bourne
With 142 households falling in the category, the $100,000 to $149,999 income range is the most frequent in Bourne, accounting for 16.6% of all households. In contrast, only 33 households (3.8%) fall into the $25,000 to $34,999 income bracket, making it the least populous group.
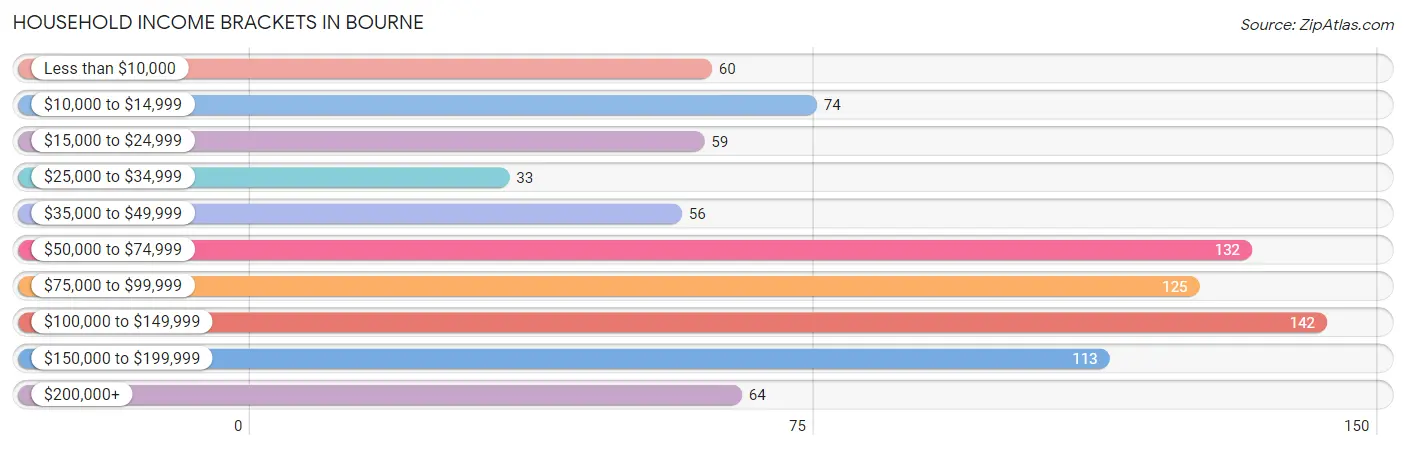
| Income Bracket | # Households | % Households |
| Less than $10,000 | 60 | 7.0% |
| $10,000 to $14,999 | 74 | 8.6% |
| $15,000 to $24,999 | 59 | 6.9% |
| $25,000 to $34,999 | 33 | 3.8% |
| $35,000 to $49,999 | 56 | 6.5% |
| $50,000 to $74,999 | 132 | 15.4% |
| $75,000 to $99,999 | 125 | 14.6% |
| $100,000 to $149,999 | 142 | 16.6% |
| $150,000 to $199,999 | 113 | 13.2% |
| $200,000+ | 64 | 7.5% |
Household Income by Householder Age in Bourne
The median household income in Bourne is $76,103, with the highest median household income of $137,303 found in the 45 to 64 years age bracket for the primary householder. A total of 150 households (17.5%) fall into this category.
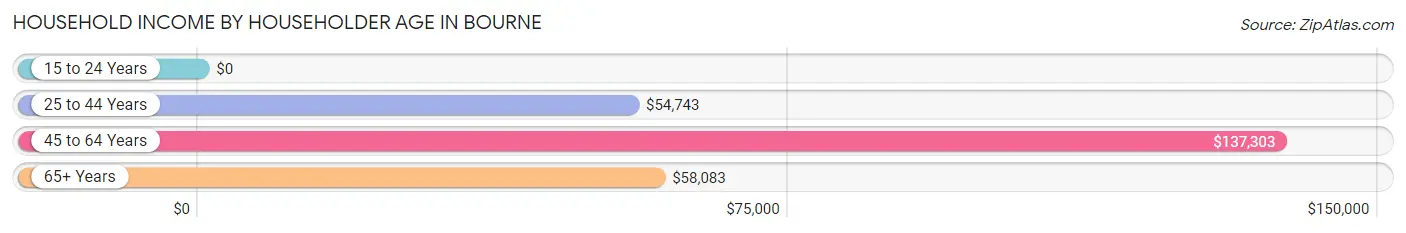
| Income Bracket | # Households | Median Income |
| 15 to 24 Years | 0 (0.0%) | $0 |
| 25 to 44 Years | 159 (18.5%) | $54,743 |
| 45 to 64 Years | 150 (17.5%) | $137,303 |
| 65+ Years | 549 (64.0%) | $58,083 |
| Total | 858 (100.0%) | $76,103 |
Poverty in Bourne
Income Below Poverty by Sex and Age in Bourne
With 12.0% poverty level for males and 13.8% for females among the residents of Bourne, 65 to 74 year old males and 55 to 64 year old females are the most vulnerable to poverty, with 77 males (33.3%) and 38 females (52.0%) in their respective age groups living below the poverty level.
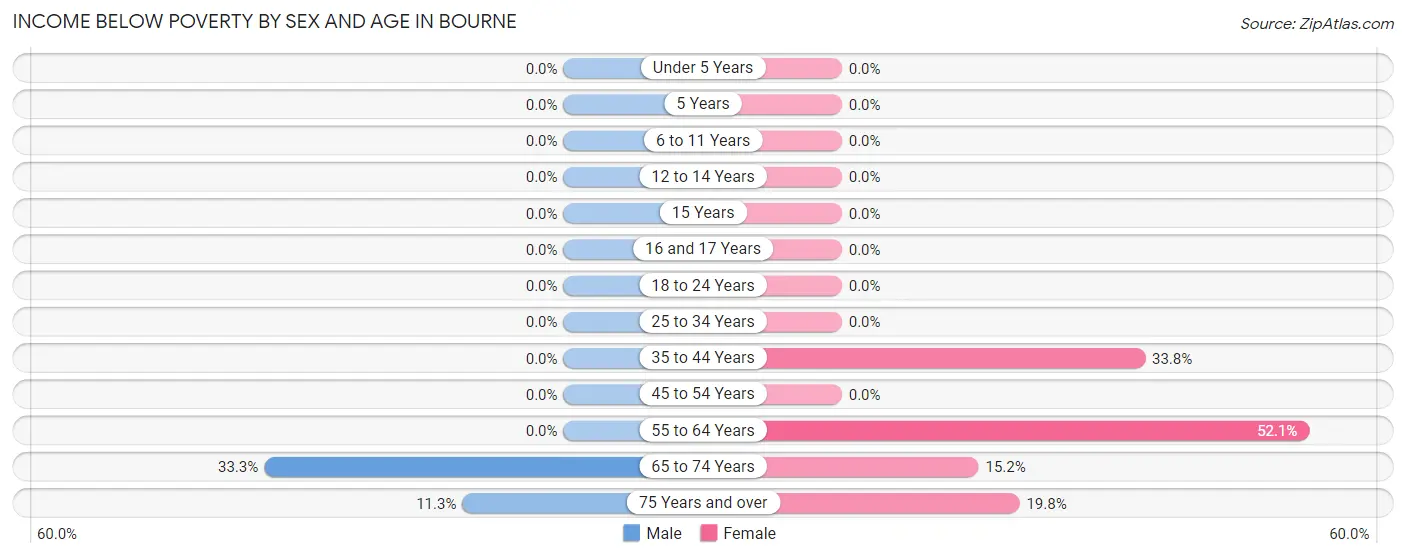
| Age Bracket | Male | Female |
| Under 5 Years | 0 (0.0%) | 0 (0.0%) |
| 5 Years | 0 (0.0%) | 0 (0.0%) |
| 6 to 11 Years | 0 (0.0%) | 0 (0.0%) |
| 12 to 14 Years | 0 (0.0%) | 0 (0.0%) |
| 15 Years | 0 (0.0%) | 0 (0.0%) |
| 16 and 17 Years | 0 (0.0%) | 0 (0.0%) |
| 18 to 24 Years | 0 (0.0%) | 0 (0.0%) |
| 25 to 34 Years | 0 (0.0%) | 0 (0.0%) |
| 35 to 44 Years | 0 (0.0%) | 26 (33.8%) |
| 45 to 54 Years | 0 (0.0%) | 0 (0.0%) |
| 55 to 64 Years | 0 (0.0%) | 38 (52.0%) |
| 65 to 74 Years | 77 (33.3%) | 37 (15.2%) |
| 75 Years and over | 17 (11.3%) | 37 (19.8%) |
| Total | 94 (12.0%) | 138 (13.8%) |
Income Above Poverty by Sex and Age in Bourne
According to the poverty statistics in Bourne, males aged under 5 years and females aged under 5 years are the age groups that are most secure financially, with 100.0% of males and 100.0% of females in these age groups living above the poverty line.
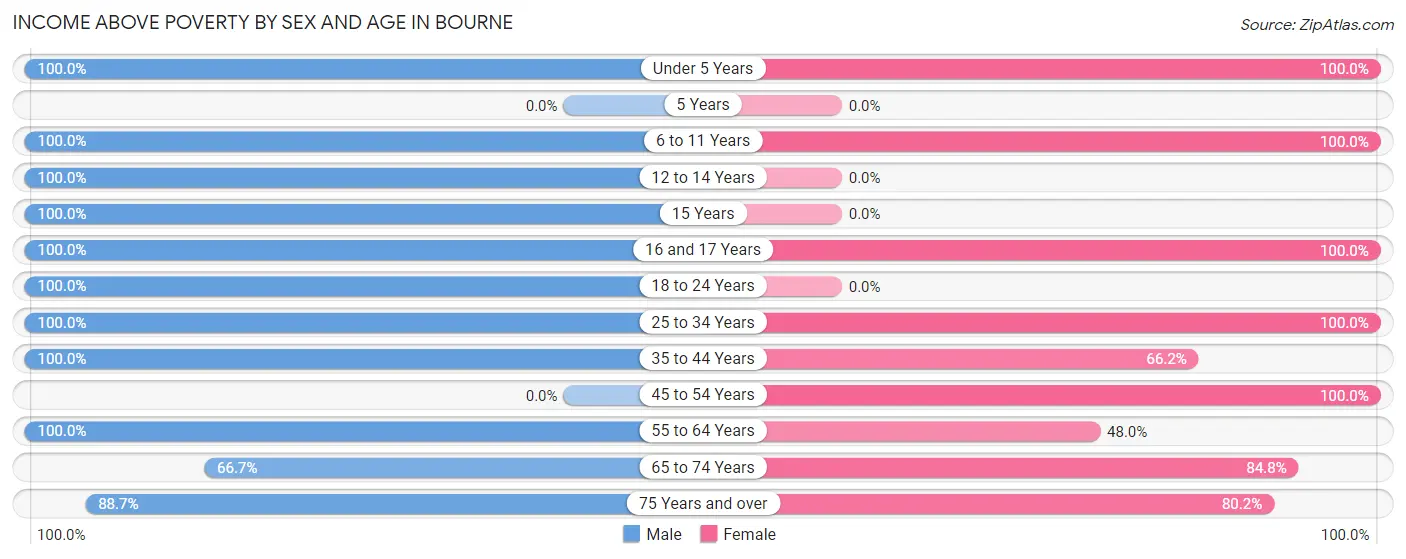
| Age Bracket | Male | Female |
| Under 5 Years | 72 (100.0%) | 76 (100.0%) |
| 5 Years | 0 (0.0%) | 0 (0.0%) |
| 6 to 11 Years | 31 (100.0%) | 70 (100.0%) |
| 12 to 14 Years | 32 (100.0%) | 0 (0.0%) |
| 15 Years | 28 (100.0%) | 0 (0.0%) |
| 16 and 17 Years | 26 (100.0%) | 46 (100.0%) |
| 18 to 24 Years | 35 (100.0%) | 0 (0.0%) |
| 25 to 34 Years | 63 (100.0%) | 108 (100.0%) |
| 35 to 44 Years | 35 (100.0%) | 51 (66.2%) |
| 45 to 54 Years | 0 (0.0%) | 120 (100.0%) |
| 55 to 64 Years | 78 (100.0%) | 35 (47.9%) |
| 65 to 74 Years | 154 (66.7%) | 206 (84.8%) |
| 75 Years and over | 134 (88.7%) | 150 (80.2%) |
| Total | 688 (88.0%) | 862 (86.2%) |
Income Below Poverty Among Married-Couple Families in Bourne
The poverty statistics for married-couple families in Bourne show that 4.8% or 17 of the total 356 families live below the poverty line. Families with no children have the highest poverty rate of 6.6%, comprising of 17 families. On the other hand, families with 1 or 2 children have the lowest poverty rate of 0.0%, which includes 0 families.
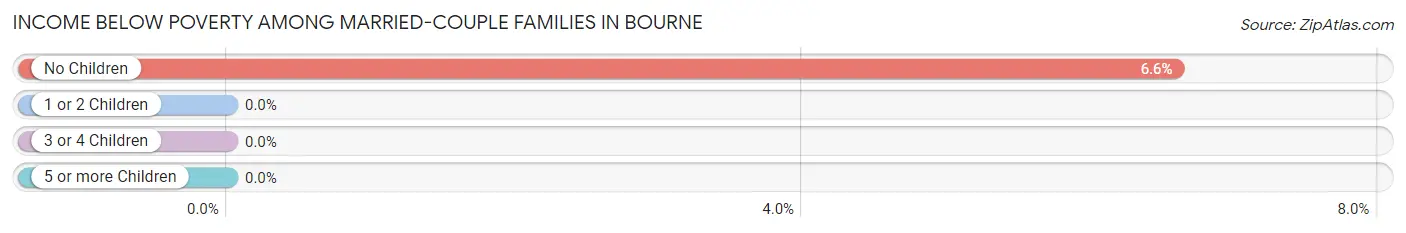
| Children | Above Poverty | Below Poverty |
| No Children | 241 (93.4%) | 17 (6.6%) |
| 1 or 2 Children | 25 (100.0%) | 0 (0.0%) |
| 3 or 4 Children | 73 (100.0%) | 0 (0.0%) |
| 5 or more Children | 0 (0.0%) | 0 (0.0%) |
| Total | 339 (95.2%) | 17 (4.8%) |
Income Below Poverty Among Single-Parent Households in Bourne
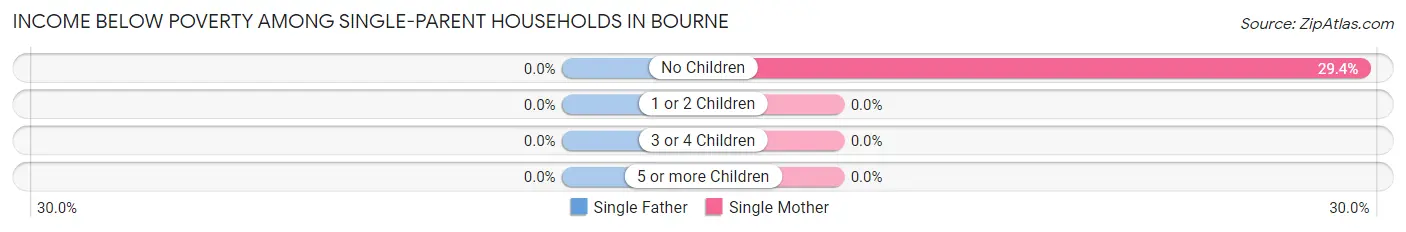
| Children | Single Father | Single Mother |
| No Children | 0 (0.0%) | 20 (29.4%) |
| 1 or 2 Children | 0 (0.0%) | 0 (0.0%) |
| 3 or 4 Children | 0 (0.0%) | 0 (0.0%) |
| 5 or more Children | 0 (0.0%) | 0 (0.0%) |
| Total | 0 (0.0%) | 20 (13.6%) |
Income Below Poverty Among Married-Couple vs Single-Parent Households in Bourne
The poverty data for Bourne shows that 17 of the married-couple family households (4.8%) and 20 of the single-parent households (13.6%) are living below the poverty level. Within the married-couple family households, those with no children have the highest poverty rate, with 17 households (6.6%) falling below the poverty line. Among the single-parent households, those with no children have the highest poverty rate, with 20 household (29.4%) living below poverty.
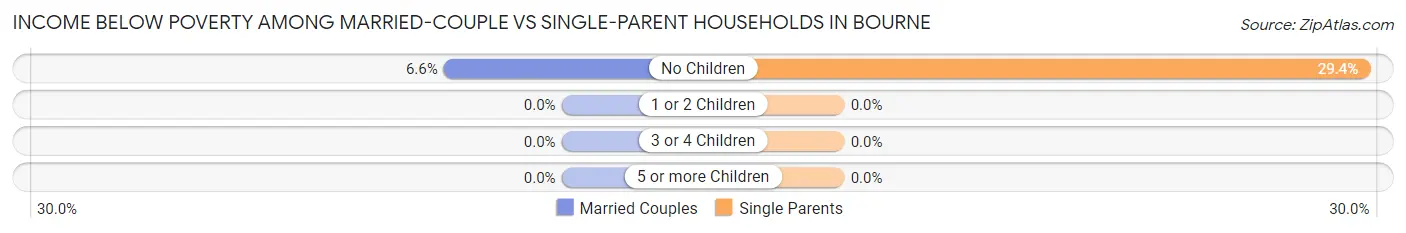
| Children | Married-Couple Families | Single-Parent Households |
| No Children | 17 (6.6%) | 20 (29.4%) |
| 1 or 2 Children | 0 (0.0%) | 0 (0.0%) |
| 3 or 4 Children | 0 (0.0%) | 0 (0.0%) |
| 5 or more Children | 0 (0.0%) | 0 (0.0%) |
| Total | 17 (4.8%) | 20 (13.6%) |
Race in Bourne
The most populous races in Bourne are White / Caucasian (1,778 | 99.8%), Hispanic or Latino (4 | 0.2%), and Two or more Races (4 | 0.2%).
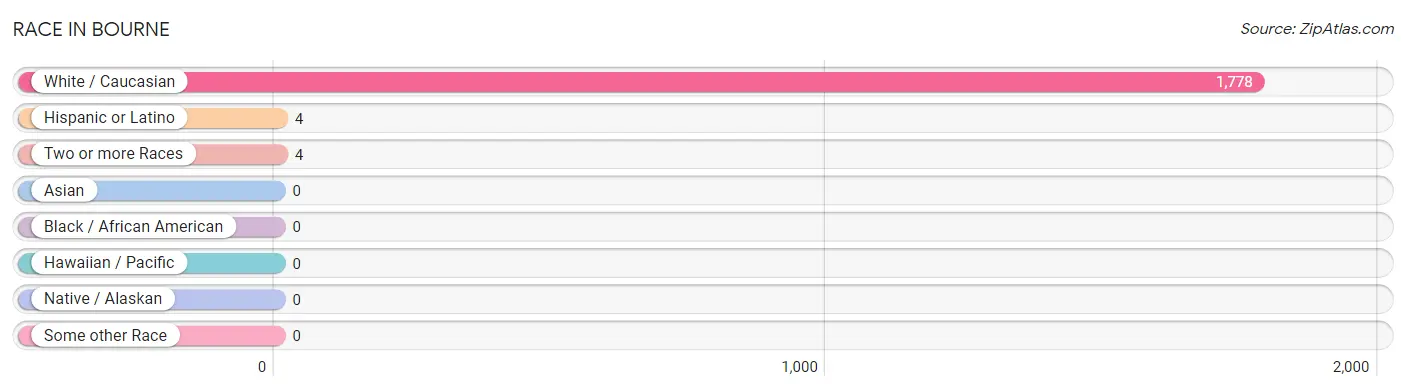
| Race | # Population | % Population |
| Asian | 0 | 0.0% |
| Black / African American | 0 | 0.0% |
| Hawaiian / Pacific | 0 | 0.0% |
| Hispanic or Latino | 4 | 0.2% |
| Native / Alaskan | 0 | 0.0% |
| White / Caucasian | 1,778 | 99.8% |
| Two or more Races | 4 | 0.2% |
| Some other Race | 0 | 0.0% |
| Total | 1,782 | 100.0% |
Ancestry in Bourne
The most populous ancestries reported in Bourne are Irish (564 | 31.7%), English (272 | 15.3%), German (202 | 11.3%), Polish (167 | 9.4%), and Italian (131 | 7.3%), together accounting for 75.0% of all Bourne residents.
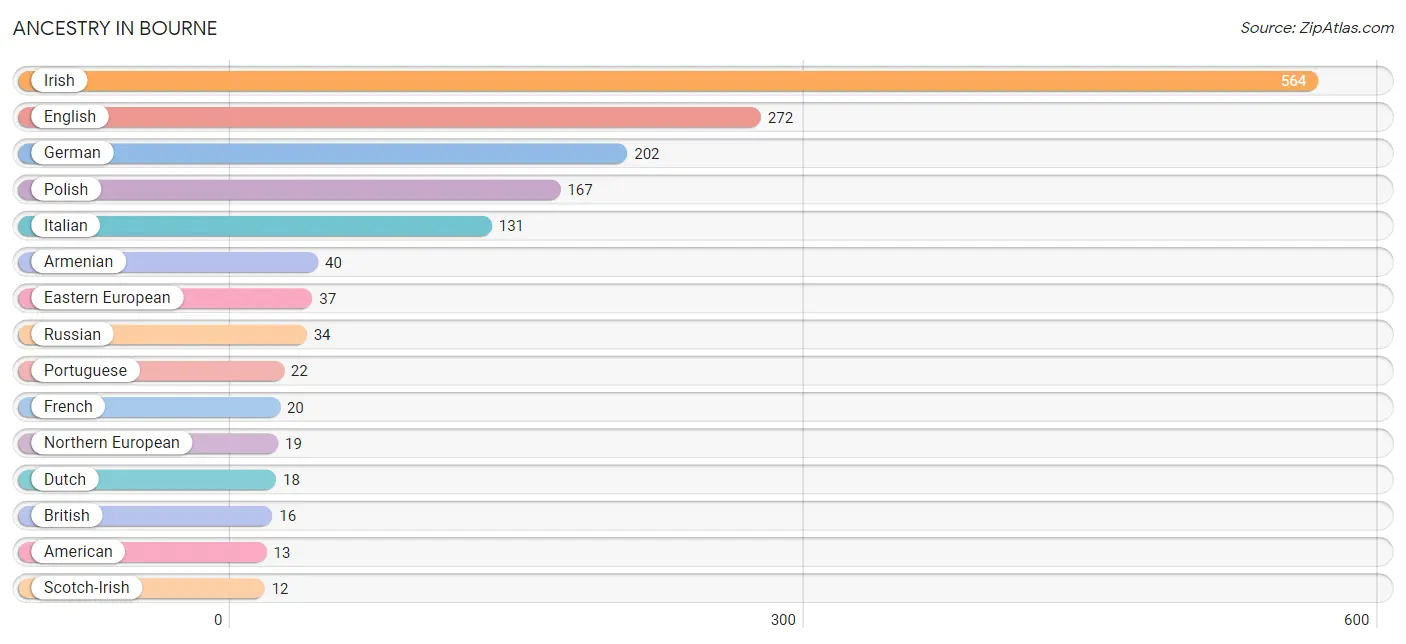
| Ancestry | # Population | % Population |
| American | 13 | 0.7% |
| Armenian | 40 | 2.2% |
| British | 16 | 0.9% |
| Cuban | 4 | 0.2% |
| Dutch | 18 | 1.0% |
| Eastern European | 37 | 2.1% |
| English | 272 | 15.3% |
| French | 20 | 1.1% |
| German | 202 | 11.3% |
| Irish | 564 | 31.7% |
| Italian | 131 | 7.3% |
| Northern European | 19 | 1.1% |
| Polish | 167 | 9.4% |
| Portuguese | 22 | 1.2% |
| Russian | 34 | 1.9% |
| Scotch-Irish | 12 | 0.7% | View All 16 Rows |
Immigrants in Bourne
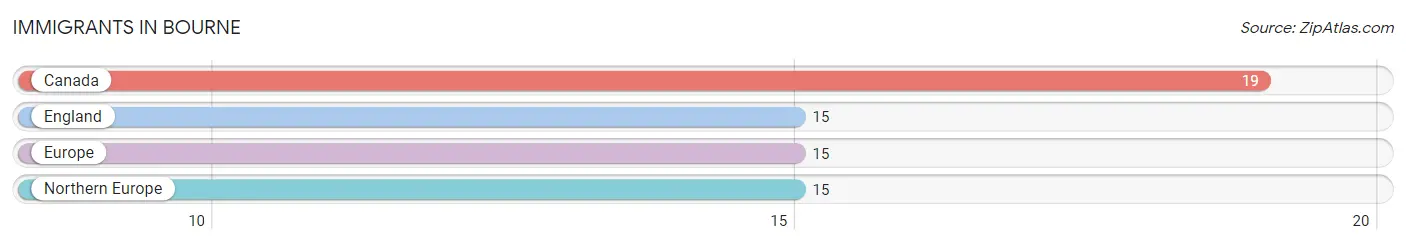
The most numerous immigrant groups reported in Bourne came from Canada (19 | 1.1%), England (15 | 0.8%), Europe (15 | 0.8%), and Northern Europe (15 | 0.8%), together accounting for 3.6% of all Bourne residents.
| Immigration Origin | # Population | % Population |
| Canada | 19 | 1.1% |
| England | 15 | 0.8% |
| Europe | 15 | 0.8% |
| Northern Europe | 15 | 0.8% | View All 4 Rows |
Sex and Age in Bourne
Sex and Age in Bourne
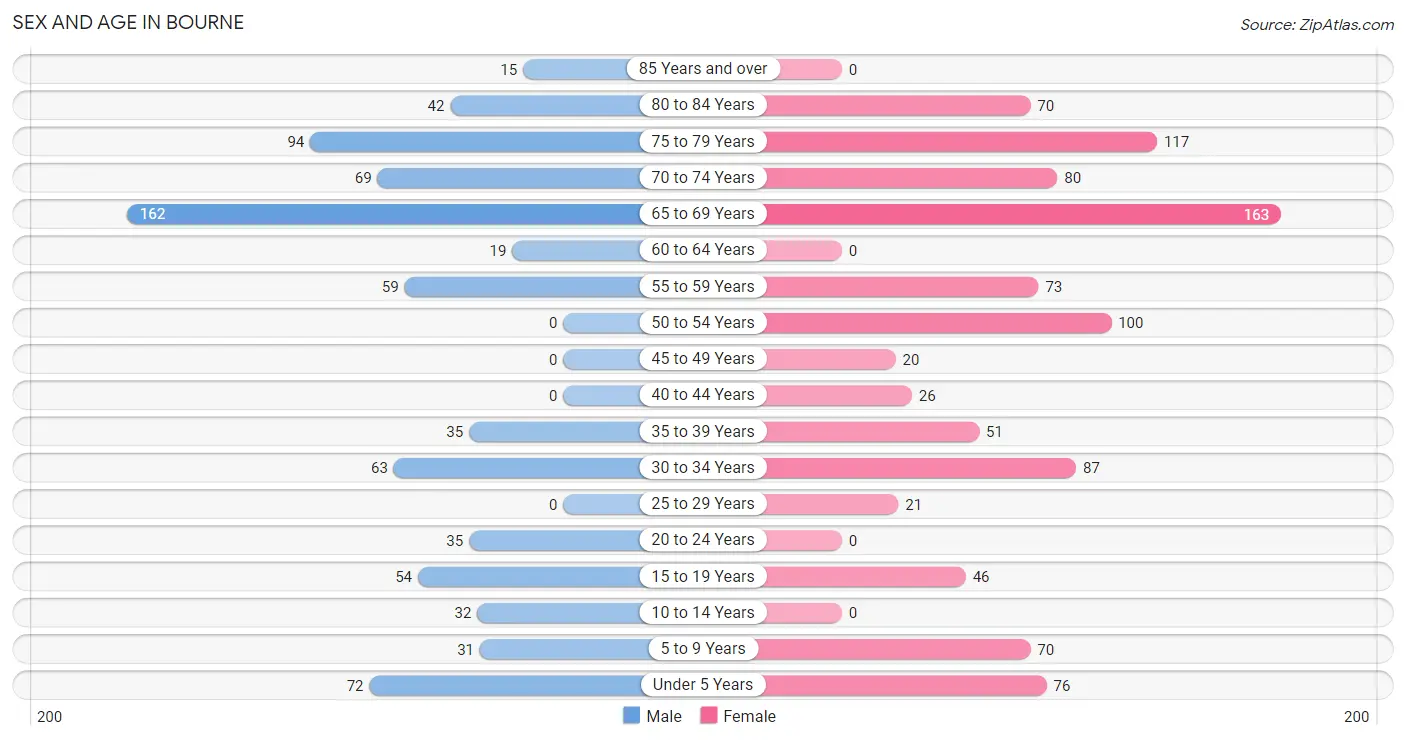
The most populous age groups in Bourne are 65 to 69 Years (162 | 20.7%) for men and 65 to 69 Years (163 | 16.3%) for women.
| Age Bracket | Male | Female |
| Under 5 Years | 72 (9.2%) | 76 (7.6%) |
| 5 to 9 Years | 31 (4.0%) | 70 (7.0%) |
| 10 to 14 Years | 32 (4.1%) | 0 (0.0%) |
| 15 to 19 Years | 54 (6.9%) | 46 (4.6%) |
| 20 to 24 Years | 35 (4.5%) | 0 (0.0%) |
| 25 to 29 Years | 0 (0.0%) | 21 (2.1%) |
| 30 to 34 Years | 63 (8.1%) | 87 (8.7%) |
| 35 to 39 Years | 35 (4.5%) | 51 (5.1%) |
| 40 to 44 Years | 0 (0.0%) | 26 (2.6%) |
| 45 to 49 Years | 0 (0.0%) | 20 (2.0%) |
| 50 to 54 Years | 0 (0.0%) | 100 (10.0%) |
| 55 to 59 Years | 59 (7.5%) | 73 (7.3%) |
| 60 to 64 Years | 19 (2.4%) | 0 (0.0%) |
| 65 to 69 Years | 162 (20.7%) | 163 (16.3%) |
| 70 to 74 Years | 69 (8.8%) | 80 (8.0%) |
| 75 to 79 Years | 94 (12.0%) | 117 (11.7%) |
| 80 to 84 Years | 42 (5.4%) | 70 (7.0%) |
| 85 Years and over | 15 (1.9%) | 0 (0.0%) |
| Total | 782 (100.0%) | 1,000 (100.0%) |
Families and Households in Bourne
Median Family Size in Bourne
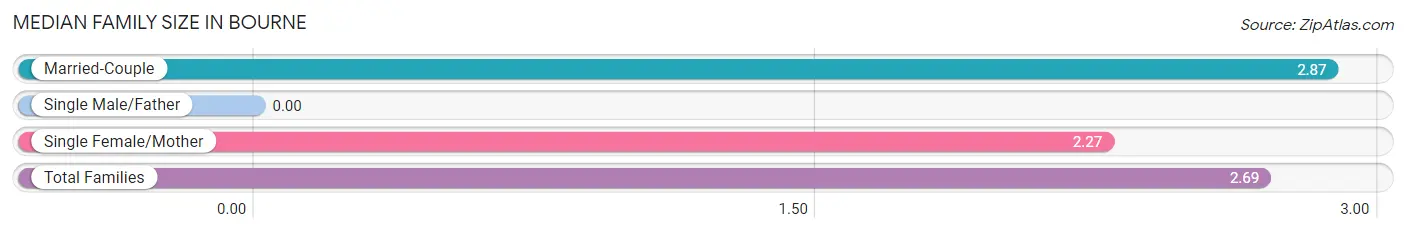
| Family Type | # Families | Family Size |
| Married-Couple | 356 (70.8%) | 2.87 |
| Single Male/Father | 0 (0.0%) | - |
| Single Female/Mother | 147 (29.2%) | 2.27 |
| Total Families | 503 (100.0%) | 2.69 |
Median Household Size in Bourne
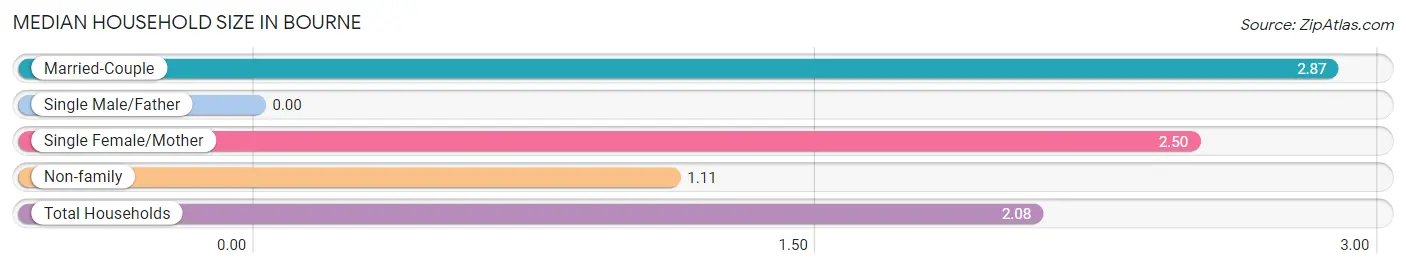
| Household Type | # Households | Household Size |
| Married-Couple | 356 (41.5%) | 2.87 |
| Single Male/Father | 0 (0.0%) | - |
| Single Female/Mother | 147 (17.1%) | 2.50 |
| Non-family | 355 (41.4%) | 1.11 |
| Total Households | 858 (100.0%) | 2.08 |
Household Size by Marriage Status in Bourne
Out of a total of 858 households in Bourne, 503 (58.6%) are family households, while 355 (41.4%) are nonfamily households. The most numerous type of family households are 2-person households, comprising 370, and the most common type of nonfamily households are 1-person households, comprising 317.
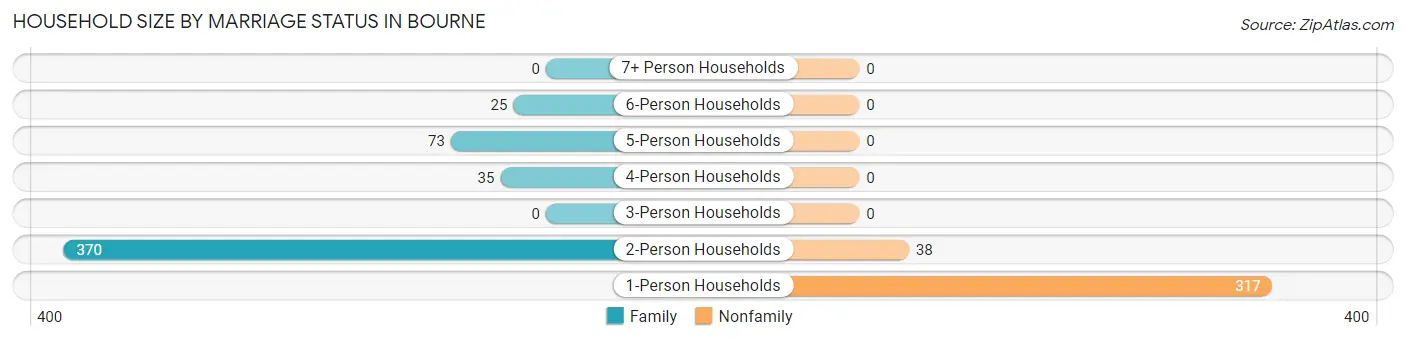
| Household Size | Family Households | Nonfamily Households |
| 1-Person Households | - | 317 (36.9%) |
| 2-Person Households | 370 (43.1%) | 38 (4.4%) |
| 3-Person Households | 0 (0.0%) | 0 (0.0%) |
| 4-Person Households | 35 (4.1%) | 0 (0.0%) |
| 5-Person Households | 73 (8.5%) | 0 (0.0%) |
| 6-Person Households | 25 (2.9%) | 0 (0.0%) |
| 7+ Person Households | 0 (0.0%) | 0 (0.0%) |
| Total | 503 (58.6%) | 355 (41.4%) |
Female Fertility in Bourne
Fertility by Age in Bourne
| Age Bracket | Women with Births | Births / 1,000 Women |
| 15 to 19 years | 0 (0.0%) | 0.0 |
| 20 to 34 years | 0 (0.0%) | 0.0 |
| 35 to 50 years | 0 (0.0%) | 0.0 |
| Total | 0 (0.0%) | 0.0 |
Fertility by Age by Marriage Status in Bourne
| Age Bracket | Married | Unmarried |
| 15 to 19 years | 0 (0.0%) | 0 (0.0%) |
| 20 to 34 years | 0 (0.0%) | 0 (0.0%) |
| 35 to 50 years | 0 (0.0%) | 0 (0.0%) |
| Total | 0 (0.0%) | 0 (0.0%) |
Fertility by Education in Bourne
| Educational Attainment | Women with Births | Births / 1,000 Women |
| Less than High School | 0 (0.0%) | 0.0 |
| High School Diploma | 0 (0.0%) | 0.0 |
| College or Associate's Degree | 0 (0.0%) | 0.0 |
| Bachelor's Degree | 0 (0.0%) | 0.0 |
| Graduate Degree | 0 (0.0%) | 0.0 |
| Total | 0 (0.0%) | 0.0 |
Fertility by Education by Marriage Status in Bourne
| Educational Attainment | Married | Unmarried |
| Less than High School | 0 (0.0%) | 0 (0.0%) |
| High School Diploma | 0 (0.0%) | 0 (0.0%) |
| College or Associate's Degree | 0 (0.0%) | 0 (0.0%) |
| Bachelor's Degree | 0 (0.0%) | 0 (0.0%) |
| Graduate Degree | 0 (0.0%) | 0 (0.0%) |
| Total | 0 (0.0%) | 0 (0.0%) |
Employment Characteristics in Bourne
Employment by Class of Employer in Bourne
Among the 638 employed individuals in Bourne, private company employees (583 | 91.4%), and not-for-profit organizations (55 | 8.6%) make up the most common classes of employment.
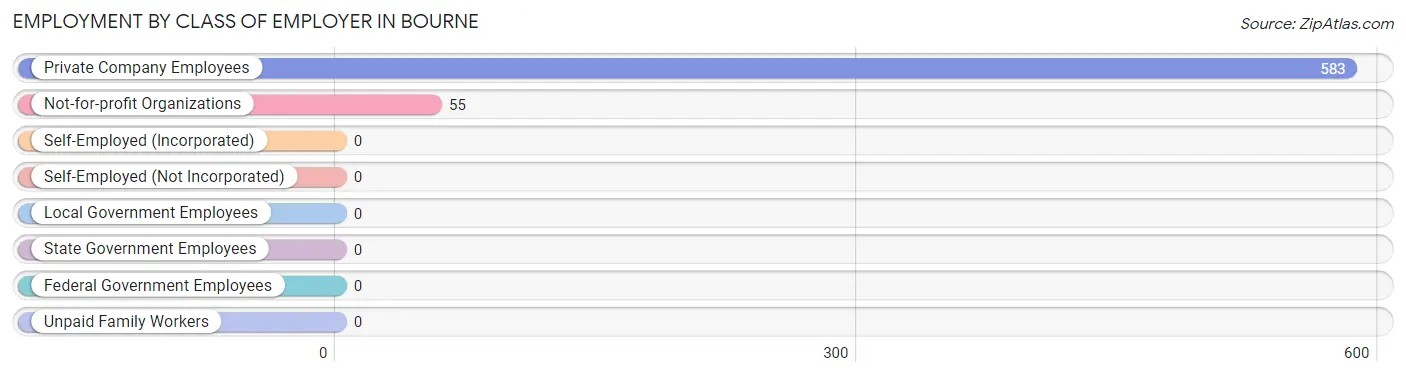
| Employer Class | # Employees | % Employees |
| Private Company Employees | 583 | 91.4% |
| Self-Employed (Incorporated) | 0 | 0.0% |
| Self-Employed (Not Incorporated) | 0 | 0.0% |
| Not-for-profit Organizations | 55 | 8.6% |
| Local Government Employees | 0 | 0.0% |
| State Government Employees | 0 | 0.0% |
| Federal Government Employees | 0 | 0.0% |
| Unpaid Family Workers | 0 | 0.0% |
| Total | 638 | 100.0% |
Employment Status by Age in Bourne
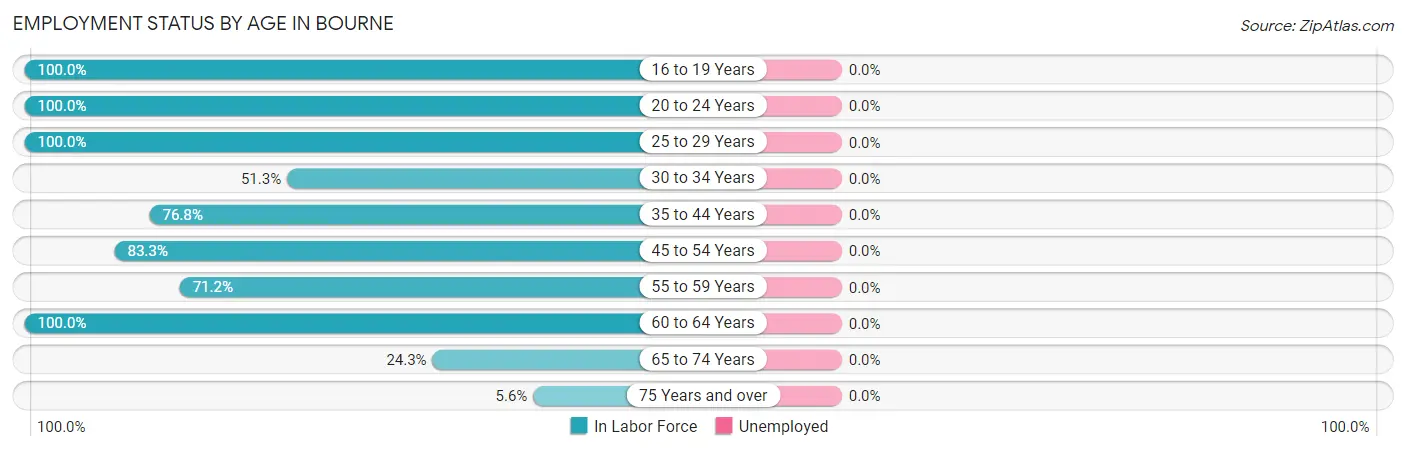
| Age Bracket | In Labor Force | Unemployed |
| 16 to 19 Years | 72 (100.0%) | 0 (0.0%) |
| 20 to 24 Years | 35 (100.0%) | 0 (0.0%) |
| 25 to 29 Years | 21 (100.0%) | 0 (0.0%) |
| 30 to 34 Years | 77 (51.3%) | 0 (0.0%) |
| 35 to 44 Years | 86 (76.8%) | 0 (0.0%) |
| 45 to 54 Years | 100 (83.3%) | 0 (0.0%) |
| 55 to 59 Years | 94 (71.2%) | 0 (0.0%) |
| 60 to 64 Years | 19 (100.0%) | 0 (0.0%) |
| 65 to 74 Years | 115 (24.3%) | 0 (0.0%) |
| 75 Years and over | 19 (5.6%) | 0 (0.0%) |
| Total | 638 (43.3%) | 0 (0.0%) |
Employment Status by Educational Attainment in Bourne
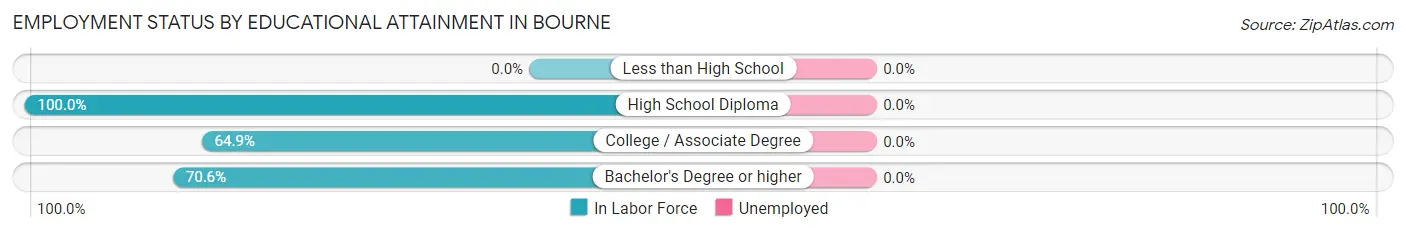
| Educational Attainment | In Labor Force | Unemployed |
| Less than High School | 0 (0.0%) | 0 (0.0%) |
| High School Diploma | 56 (100.0%) | 0 (0.0%) |
| College / Associate Degree | 122 (64.9%) | 0 (0.0%) |
| Bachelor's Degree or higher | 219 (70.6%) | 0 (0.0%) |
| Total | 397 (71.7%) | 0 (0.0%) |
Employment Occupations by Sex in Bourne
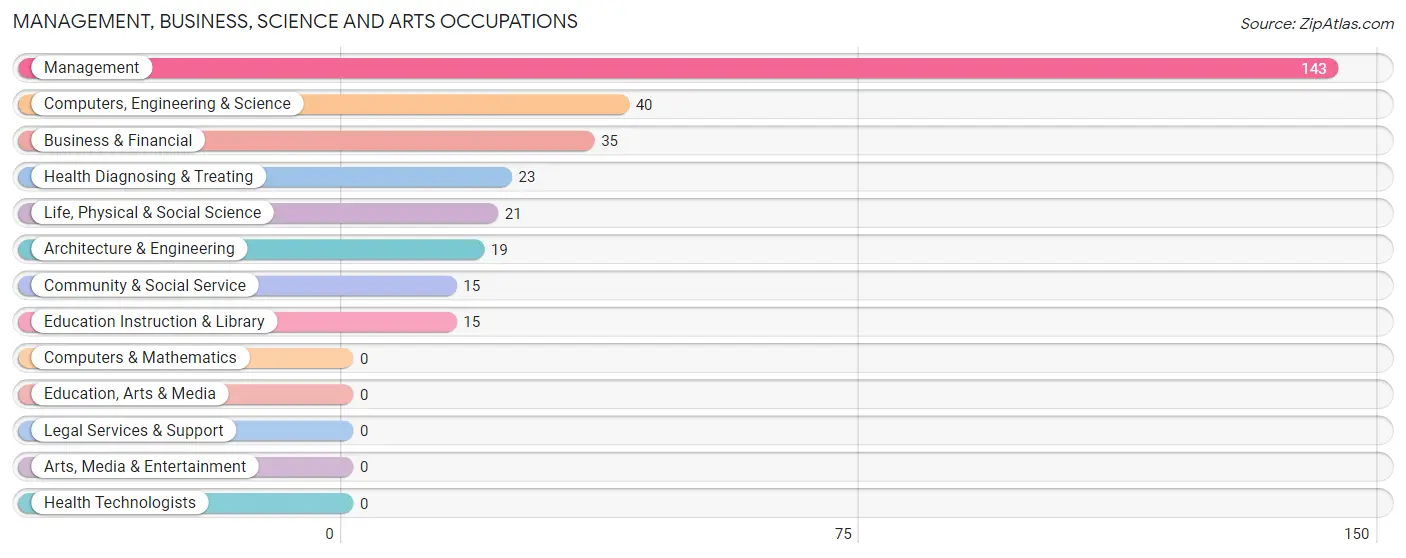
Management, Business, Science and Arts Occupations
The most common Management, Business, Science and Arts occupations in Bourne are Management (143 | 22.4%), Computers, Engineering & Science (40 | 6.3%), Business & Financial (35 | 5.5%), Health Diagnosing & Treating (23 | 3.6%), and Life, Physical & Social Science (21 | 3.3%).
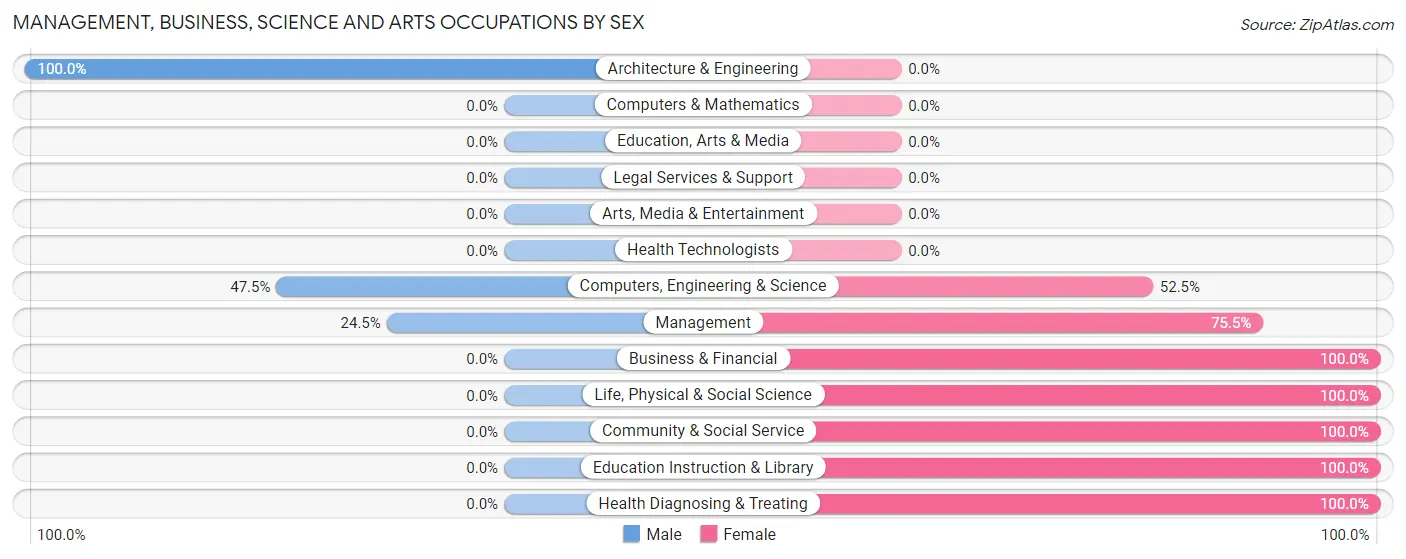
Management, Business, Science and Arts Occupations by Sex
Within the Management, Business, Science and Arts occupations in Bourne, the most male-oriented occupations are Architecture & Engineering (100.0%), Computers, Engineering & Science (47.5%), and Management (24.5%), while the most female-oriented occupations are Business & Financial (100.0%), Life, Physical & Social Science (100.0%), and Community & Social Service (100.0%).
| Occupation | Male | Female |
| Management | 35 (24.5%) | 108 (75.5%) |
| Business & Financial | 0 (0.0%) | 35 (100.0%) |
| Computers, Engineering & Science | 19 (47.5%) | 21 (52.5%) |
| Computers & Mathematics | 0 (0.0%) | 0 (0.0%) |
| Architecture & Engineering | 19 (100.0%) | 0 (0.0%) |
| Life, Physical & Social Science | 0 (0.0%) | 21 (100.0%) |
| Community & Social Service | 0 (0.0%) | 15 (100.0%) |
| Education, Arts & Media | 0 (0.0%) | 0 (0.0%) |
| Legal Services & Support | 0 (0.0%) | 0 (0.0%) |
| Education Instruction & Library | 0 (0.0%) | 15 (100.0%) |
| Arts, Media & Entertainment | 0 (0.0%) | 0 (0.0%) |
| Health Diagnosing & Treating | 0 (0.0%) | 23 (100.0%) |
| Health Technologists | 0 (0.0%) | 0 (0.0%) |
| Total (Category) | 54 (21.1%) | 202 (78.9%) |
| Total (Overall) | 272 (42.6%) | 366 (57.4%) |
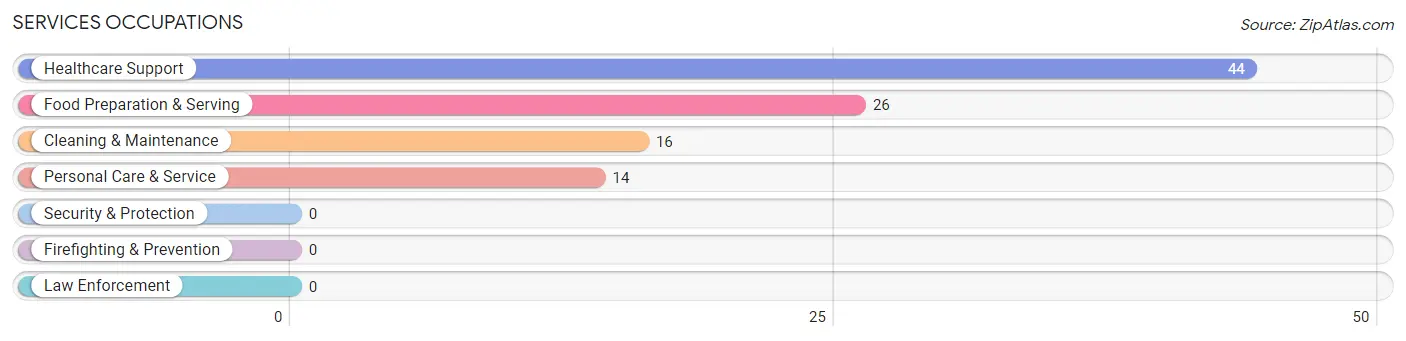
Services Occupations
The most common Services occupations in Bourne are Healthcare Support (44 | 6.9%), Food Preparation & Serving (26 | 4.1%), Cleaning & Maintenance (16 | 2.5%), and Personal Care & Service (14 | 2.2%).
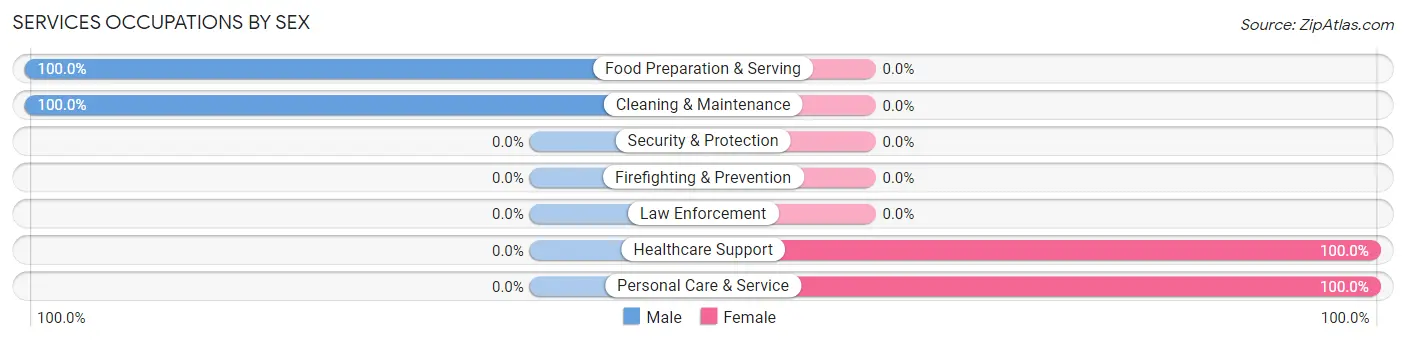
Services Occupations by Sex
Within the Services occupations in Bourne, the most male-oriented occupations are Food Preparation & Serving (100.0%), and Cleaning & Maintenance (100.0%), while the most female-oriented occupations are Healthcare Support (100.0%), and Personal Care & Service (100.0%).
| Occupation | Male | Female |
| Healthcare Support | 0 (0.0%) | 44 (100.0%) |
| Security & Protection | 0 (0.0%) | 0 (0.0%) |
| Firefighting & Prevention | 0 (0.0%) | 0 (0.0%) |
| Law Enforcement | 0 (0.0%) | 0 (0.0%) |
| Food Preparation & Serving | 26 (100.0%) | 0 (0.0%) |
| Cleaning & Maintenance | 16 (100.0%) | 0 (0.0%) |
| Personal Care & Service | 0 (0.0%) | 14 (100.0%) |
| Total (Category) | 42 (42.0%) | 58 (58.0%) |
| Total (Overall) | 272 (42.6%) | 366 (57.4%) |
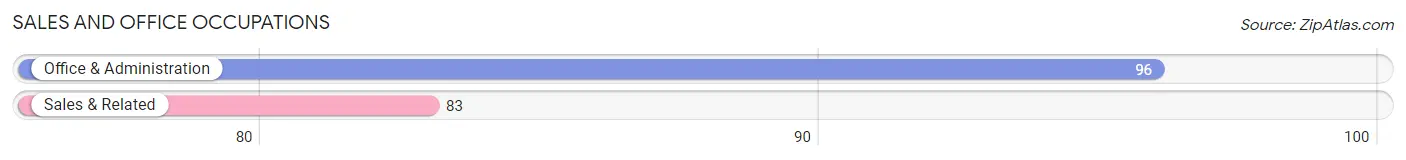
Sales and Office Occupations
The most common Sales and Office occupations in Bourne are Office & Administration (96 | 15.0%), and Sales & Related (83 | 13.0%).
Sales and Office Occupations by Sex
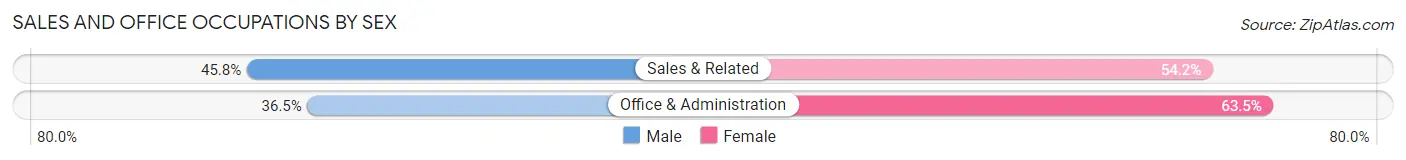
| Occupation | Male | Female |
| Sales & Related | 38 (45.8%) | 45 (54.2%) |
| Office & Administration | 35 (36.5%) | 61 (63.5%) |
| Total (Category) | 73 (40.8%) | 106 (59.2%) |
| Total (Overall) | 272 (42.6%) | 366 (57.4%) |
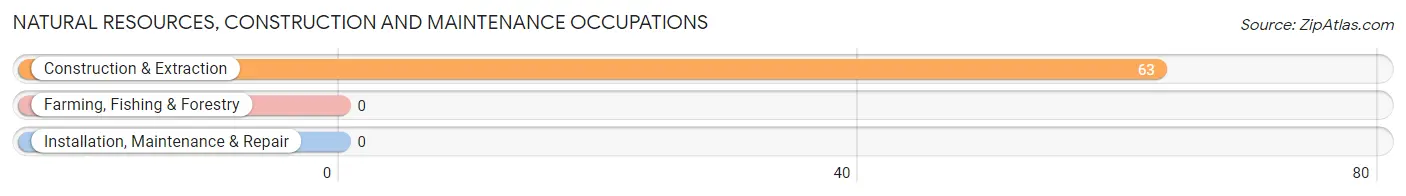
Natural Resources, Construction and Maintenance Occupations
The most common Natural Resources, Construction and Maintenance occupations in Bourne are , and Construction & Extraction (63 | 9.9%).
Natural Resources, Construction and Maintenance Occupations by Sex
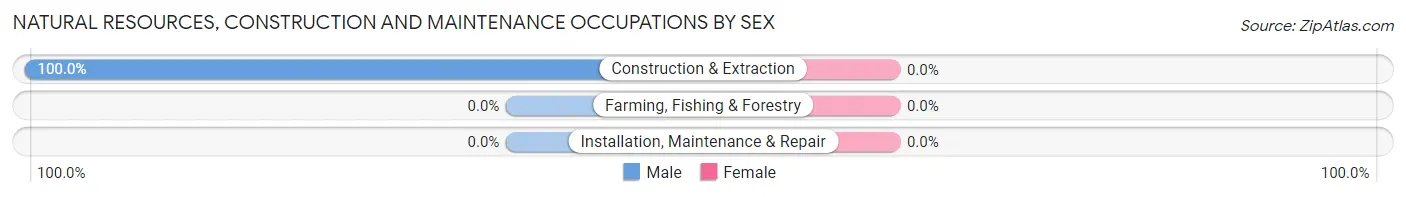
| Occupation | Male | Female |
| Farming, Fishing & Forestry | 0 (0.0%) | 0 (0.0%) |
| Construction & Extraction | 63 (100.0%) | 0 (0.0%) |
| Installation, Maintenance & Repair | 0 (0.0%) | 0 (0.0%) |
| Total (Category) | 63 (100.0%) | 0 (0.0%) |
| Total (Overall) | 272 (42.6%) | 366 (57.4%) |
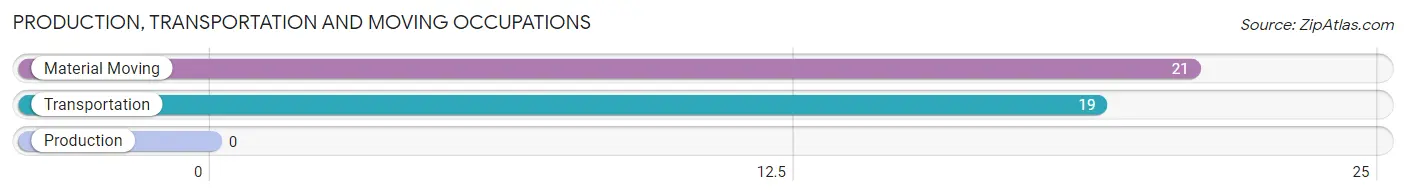
Production, Transportation and Moving Occupations
The most common Production, Transportation and Moving occupations in Bourne are Material Moving (21 | 3.3%), and Transportation (19 | 3.0%).
Production, Transportation and Moving Occupations by Sex
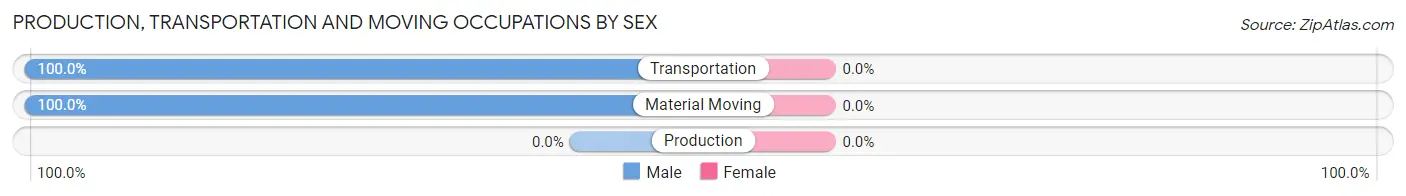
| Occupation | Male | Female |
| Production | 0 (0.0%) | 0 (0.0%) |
| Transportation | 19 (100.0%) | 0 (0.0%) |
| Material Moving | 21 (100.0%) | 0 (0.0%) |
| Total (Category) | 40 (100.0%) | 0 (0.0%) |
| Total (Overall) | 272 (42.6%) | 366 (57.4%) |
Employment Industries by Sex in Bourne
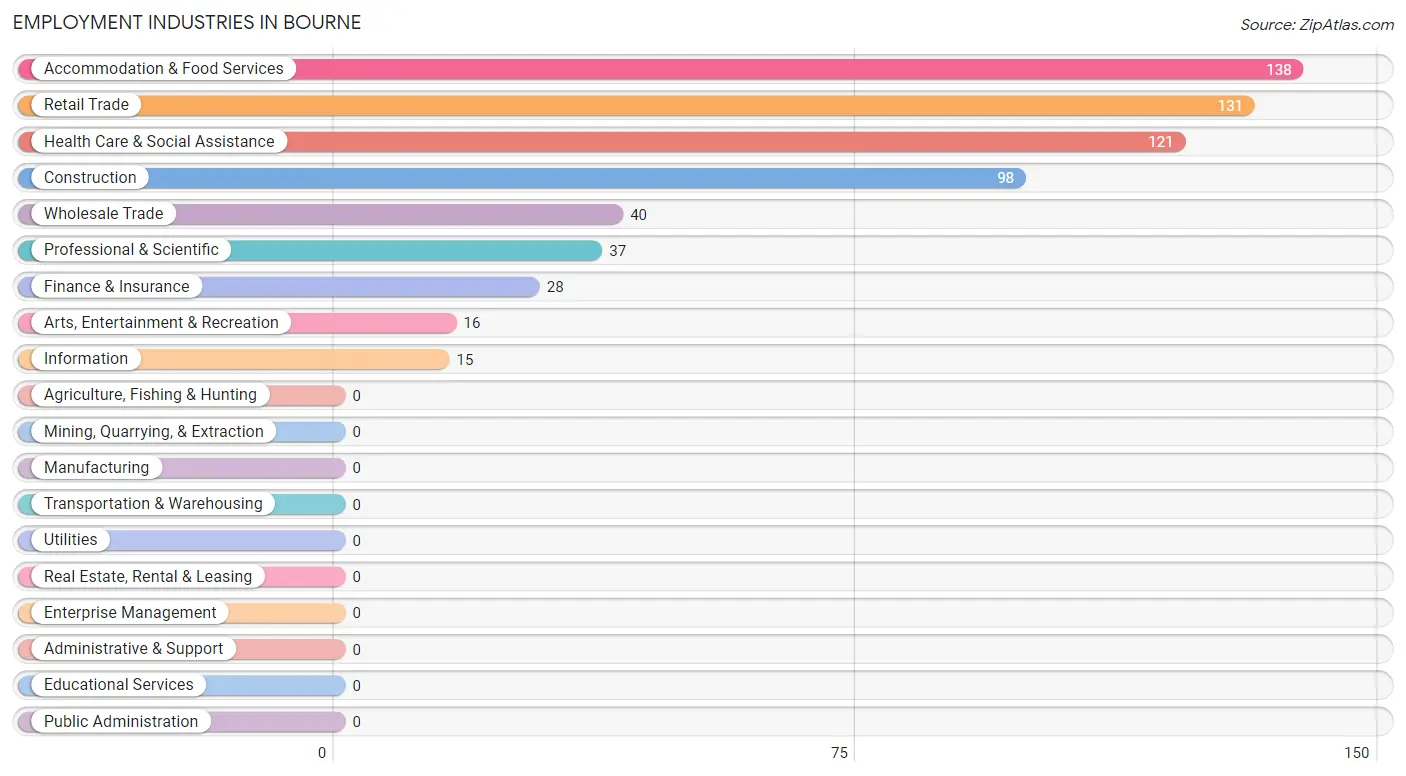
Employment Industries in Bourne
The major employment industries in Bourne include Accommodation & Food Services (138 | 21.6%), Retail Trade (131 | 20.5%), Health Care & Social Assistance (121 | 19.0%), Construction (98 | 15.4%), and Wholesale Trade (40 | 6.3%).
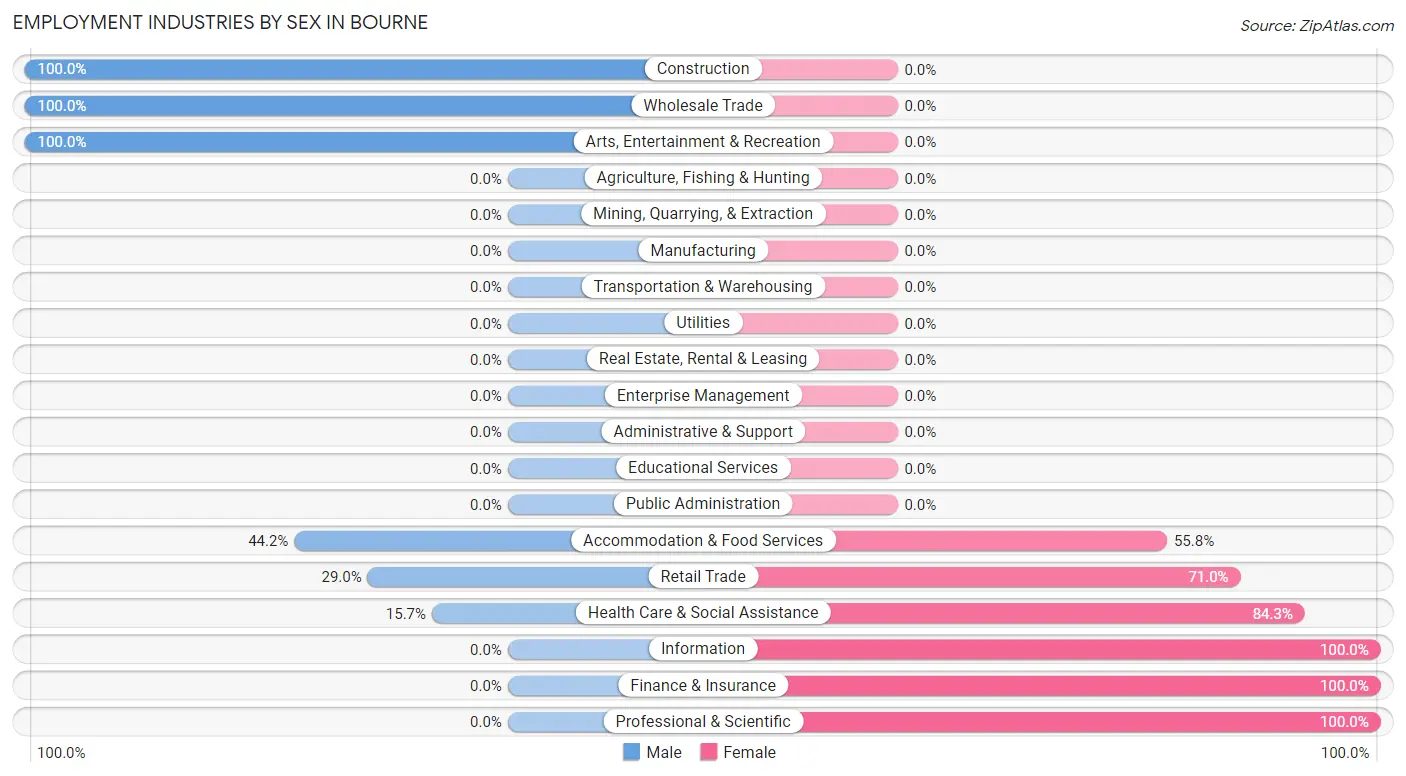
Employment Industries by Sex in Bourne
The Bourne industries that see more men than women are Construction (100.0%), Wholesale Trade (100.0%), and Arts, Entertainment & Recreation (100.0%), whereas the industries that tend to have a higher number of women are Information (100.0%), Finance & Insurance (100.0%), and Professional & Scientific (100.0%).
| Industry | Male | Female |
| Agriculture, Fishing & Hunting | 0 (0.0%) | 0 (0.0%) |
| Mining, Quarrying, & Extraction | 0 (0.0%) | 0 (0.0%) |
| Construction | 98 (100.0%) | 0 (0.0%) |
| Manufacturing | 0 (0.0%) | 0 (0.0%) |
| Wholesale Trade | 40 (100.0%) | 0 (0.0%) |
| Retail Trade | 38 (29.0%) | 93 (71.0%) |
| Transportation & Warehousing | 0 (0.0%) | 0 (0.0%) |
| Utilities | 0 (0.0%) | 0 (0.0%) |
| Information | 0 (0.0%) | 15 (100.0%) |
| Finance & Insurance | 0 (0.0%) | 28 (100.0%) |
| Real Estate, Rental & Leasing | 0 (0.0%) | 0 (0.0%) |
| Professional & Scientific | 0 (0.0%) | 37 (100.0%) |
| Enterprise Management | 0 (0.0%) | 0 (0.0%) |
| Administrative & Support | 0 (0.0%) | 0 (0.0%) |
| Educational Services | 0 (0.0%) | 0 (0.0%) |
| Health Care & Social Assistance | 19 (15.7%) | 102 (84.3%) |
| Arts, Entertainment & Recreation | 16 (100.0%) | 0 (0.0%) |
| Accommodation & Food Services | 61 (44.2%) | 77 (55.8%) |
| Public Administration | 0 (0.0%) | 0 (0.0%) |
| Total | 272 (42.6%) | 366 (57.4%) |
Education in Bourne
School Enrollment in Bourne
The most common levels of schooling among the 344 students in Bourne are high school (100 | 29.1%), nursery / preschool (76 | 22.1%), and kindergarten (70 | 20.3%).
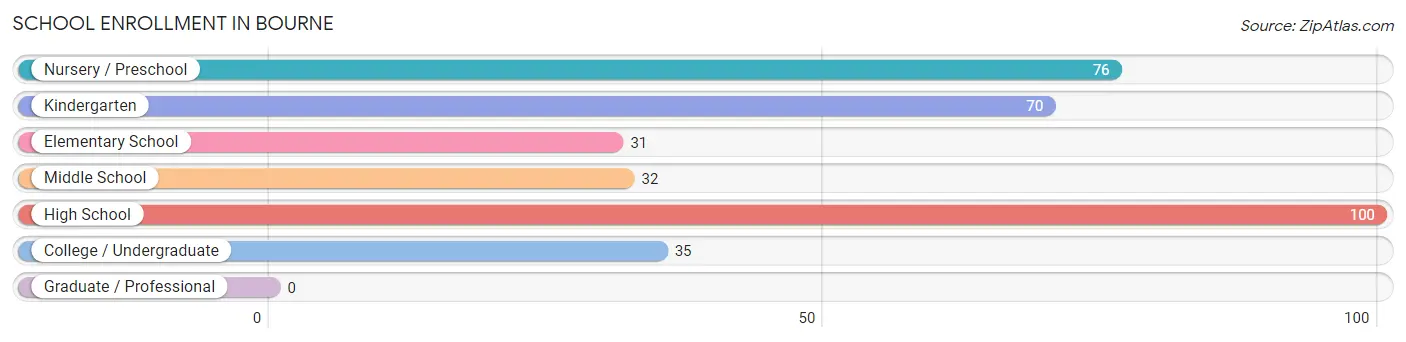
| School Level | # Students | % Students |
| Nursery / Preschool | 76 | 22.1% |
| Kindergarten | 70 | 20.3% |
| Elementary School | 31 | 9.0% |
| Middle School | 32 | 9.3% |
| High School | 100 | 29.1% |
| College / Undergraduate | 35 | 10.2% |
| Graduate / Professional | 0 | 0.0% |
| Total | 344 | 100.0% |
School Enrollment by Age by Funding Source in Bourne
Out of a total of 344 students who are enrolled in schools in Bourne, 35 (10.2%) attend a private institution, while the remaining 309 (89.8%) are enrolled in public schools. The age group of 20 to 24 year olds has the highest likelihood of being enrolled in private schools, with 35 (100.0% in the age bracket) enrolled. Conversely, the age group of 3 to 4 year olds has the lowest likelihood of being enrolled in a private school, with 76 (100.0% in the age bracket) attending a public institution.
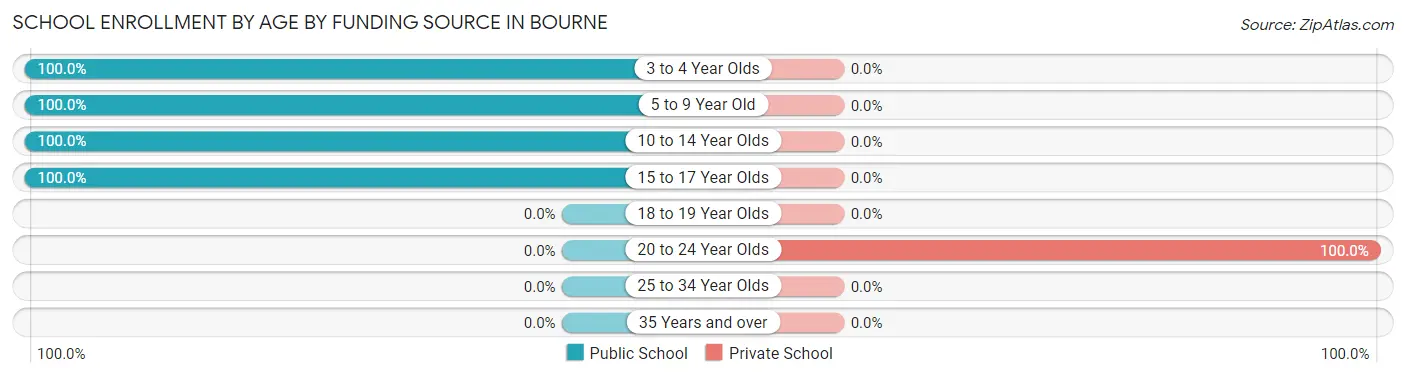
| Age Bracket | Public School | Private School |
| 3 to 4 Year Olds | 76 (100.0%) | 0 (0.0%) |
| 5 to 9 Year Old | 101 (100.0%) | 0 (0.0%) |
| 10 to 14 Year Olds | 32 (100.0%) | 0 (0.0%) |
| 15 to 17 Year Olds | 100 (100.0%) | 0 (0.0%) |
| 18 to 19 Year Olds | 0 (0.0%) | 0 (0.0%) |
| 20 to 24 Year Olds | 0 (0.0%) | 35 (100.0%) |
| 25 to 34 Year Olds | 0 (0.0%) | 0 (0.0%) |
| 35 Years and over | 0 (0.0%) | 0 (0.0%) |
| Total | 309 (89.8%) | 35 (10.2%) |
Educational Attainment by Field of Study in Bourne
Business (215 | 23.5%), liberal arts & history (140 | 15.3%), psychology (96 | 10.5%), social sciences (66 | 7.2%), and literature & languages (66 | 7.2%) are the most common fields of study among 914 individuals in Bourne who have obtained a bachelor's degree or higher.
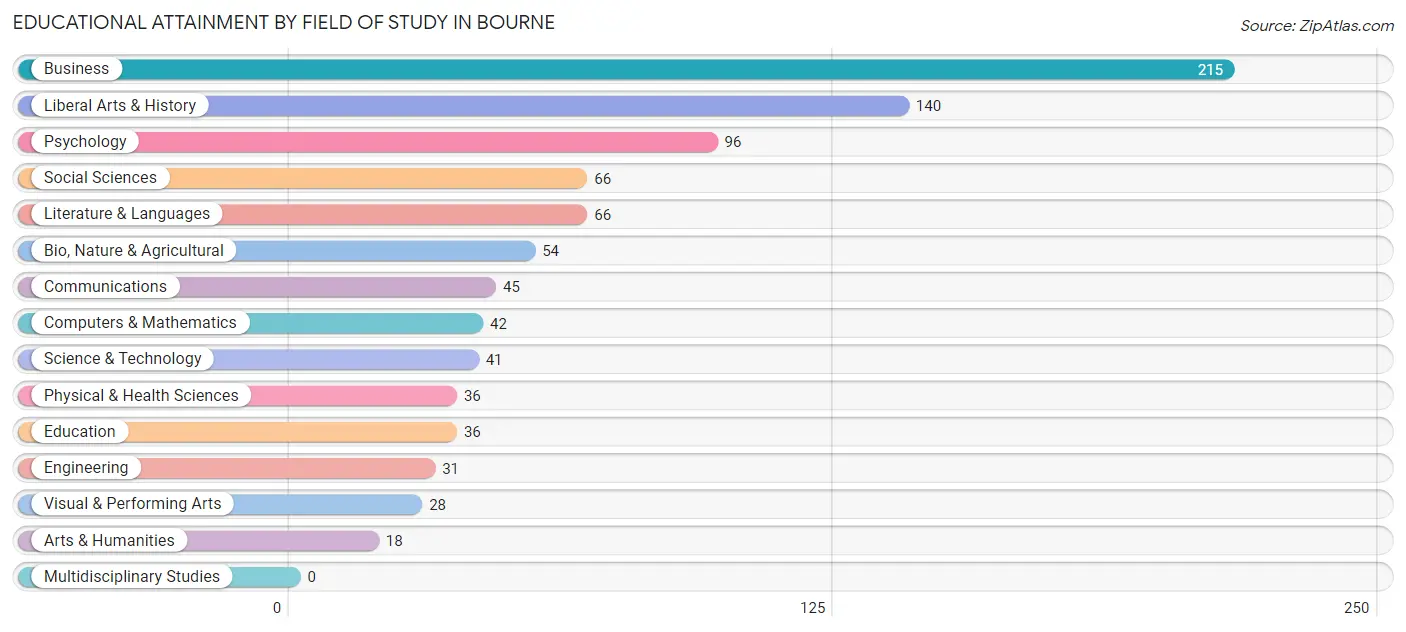
| Field of Study | # Graduates | % Graduates |
| Computers & Mathematics | 42 | 4.6% |
| Bio, Nature & Agricultural | 54 | 5.9% |
| Physical & Health Sciences | 36 | 3.9% |
| Psychology | 96 | 10.5% |
| Social Sciences | 66 | 7.2% |
| Engineering | 31 | 3.4% |
| Multidisciplinary Studies | 0 | 0.0% |
| Science & Technology | 41 | 4.5% |
| Business | 215 | 23.5% |
| Education | 36 | 3.9% |
| Literature & Languages | 66 | 7.2% |
| Liberal Arts & History | 140 | 15.3% |
| Visual & Performing Arts | 28 | 3.1% |
| Communications | 45 | 4.9% |
| Arts & Humanities | 18 | 2.0% |
| Total | 914 | 100.0% |
Transportation & Commute in Bourne
Vehicle Availability by Sex in Bourne
The most prevalent vehicle ownership categories in Bourne are males with 3 vehicles (108, accounting for 39.7%) and females with 3 vehicles (124, making up 29.5%).
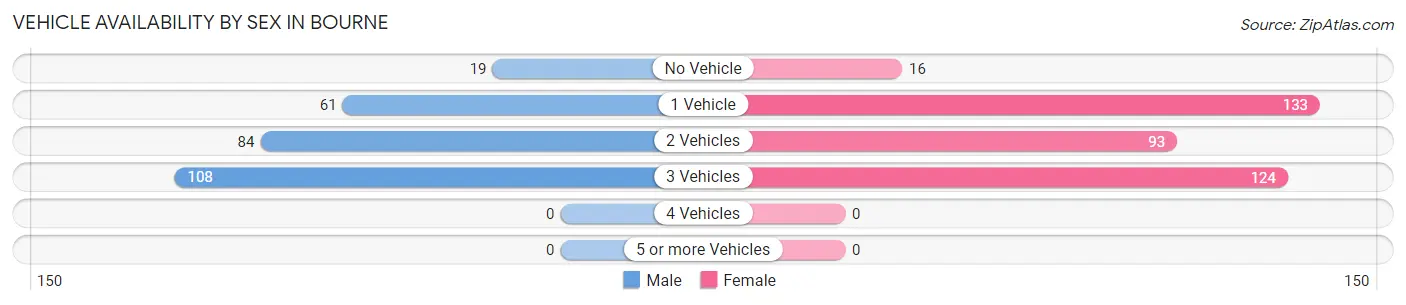
| Vehicles Available | Male | Female |
| No Vehicle | 19 (7.0%) | 16 (4.4%) |
| 1 Vehicle | 61 (22.4%) | 133 (36.3%) |
| 2 Vehicles | 84 (30.9%) | 93 (25.4%) |
| 3 Vehicles | 108 (39.7%) | 124 (33.9%) |
| 4 Vehicles | 0 (0.0%) | 0 (0.0%) |
| 5 or more Vehicles | 0 (0.0%) | 0 (0.0%) |
| Total | 272 (100.0%) | 366 (100.0%) |
Commute Time in Bourne
The most frequently occuring commute durations in Bourne are 10 to 14 minutes (219 commuters, 34.3%), 60 to 89 minutes (118 commuters, 18.5%), and 5 to 9 minutes (83 commuters, 13.0%).
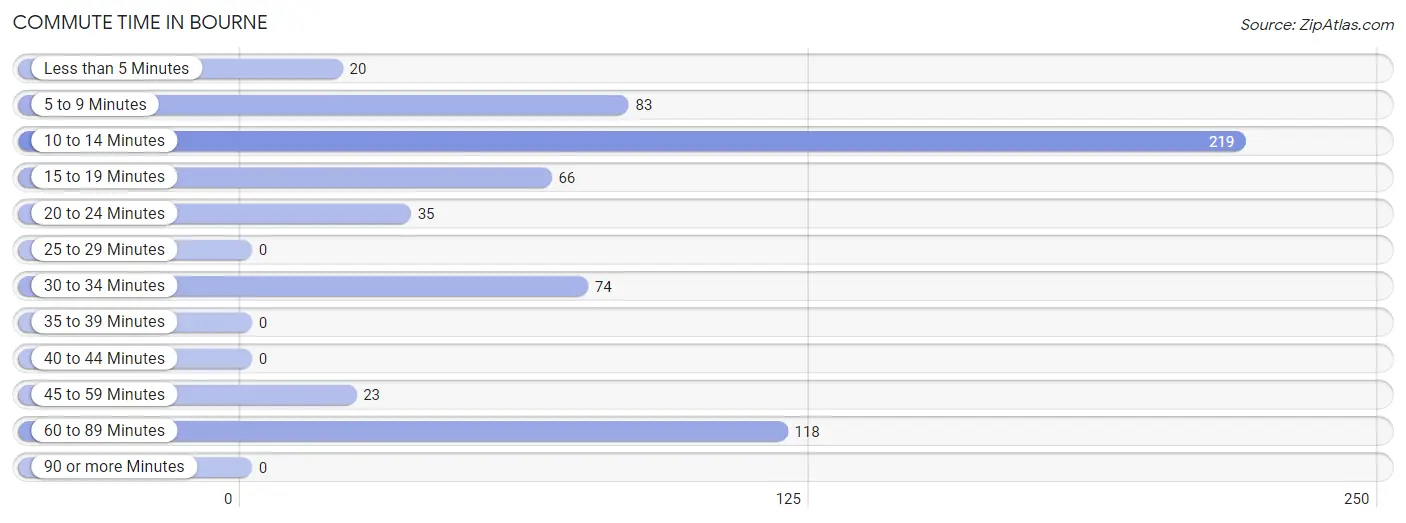
| Commute Time | # Commuters | % Commuters |
| Less than 5 Minutes | 20 | 3.1% |
| 5 to 9 Minutes | 83 | 13.0% |
| 10 to 14 Minutes | 219 | 34.3% |
| 15 to 19 Minutes | 66 | 10.3% |
| 20 to 24 Minutes | 35 | 5.5% |
| 25 to 29 Minutes | 0 | 0.0% |
| 30 to 34 Minutes | 74 | 11.6% |
| 35 to 39 Minutes | 0 | 0.0% |
| 40 to 44 Minutes | 0 | 0.0% |
| 45 to 59 Minutes | 23 | 3.6% |
| 60 to 89 Minutes | 118 | 18.5% |
| 90 or more Minutes | 0 | 0.0% |
Commute Time by Sex in Bourne
The most common commute times in Bourne are 10 to 14 minutes (162 commuters, 59.6%) for males and 60 to 89 minutes (83 commuters, 22.7%) for females.
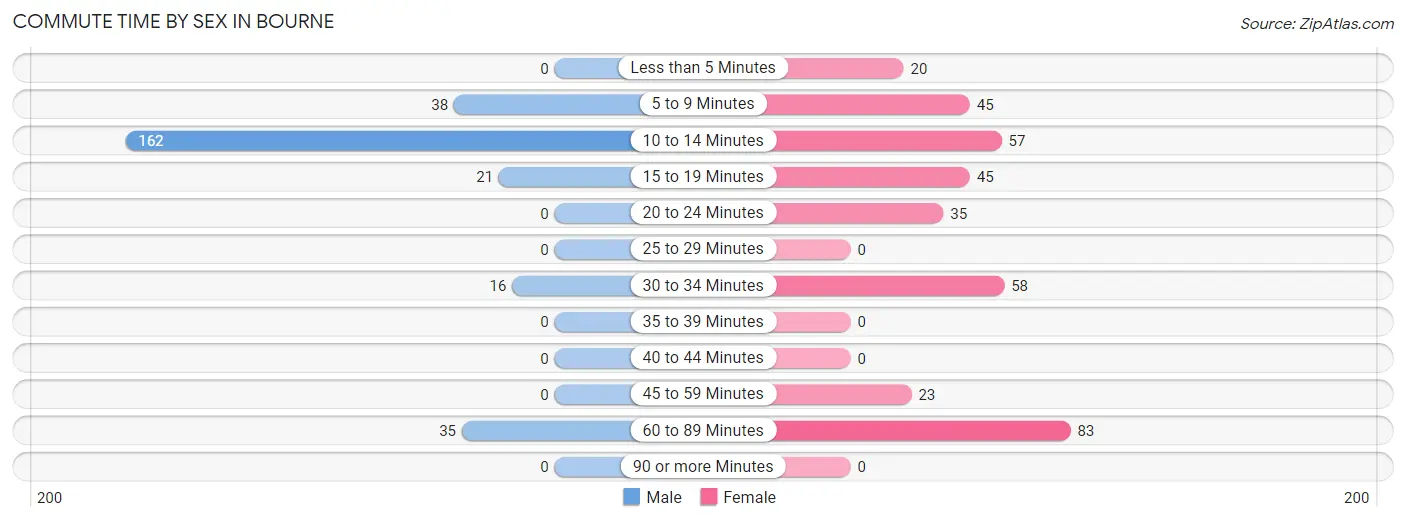
| Commute Time | Male | Female |
| Less than 5 Minutes | 0 (0.0%) | 20 (5.5%) |
| 5 to 9 Minutes | 38 (14.0%) | 45 (12.3%) |
| 10 to 14 Minutes | 162 (59.6%) | 57 (15.6%) |
| 15 to 19 Minutes | 21 (7.7%) | 45 (12.3%) |
| 20 to 24 Minutes | 0 (0.0%) | 35 (9.6%) |
| 25 to 29 Minutes | 0 (0.0%) | 0 (0.0%) |
| 30 to 34 Minutes | 16 (5.9%) | 58 (15.9%) |
| 35 to 39 Minutes | 0 (0.0%) | 0 (0.0%) |
| 40 to 44 Minutes | 0 (0.0%) | 0 (0.0%) |
| 45 to 59 Minutes | 0 (0.0%) | 23 (6.3%) |
| 60 to 89 Minutes | 35 (12.9%) | 83 (22.7%) |
| 90 or more Minutes | 0 (0.0%) | 0 (0.0%) |
Time of Departure to Work by Sex in Bourne
The most frequent times of departure to work in Bourne are 7:00 AM to 7:29 AM (82, 30.1%) for males and 8:00 AM to 8:29 AM (145, 39.6%) for females.
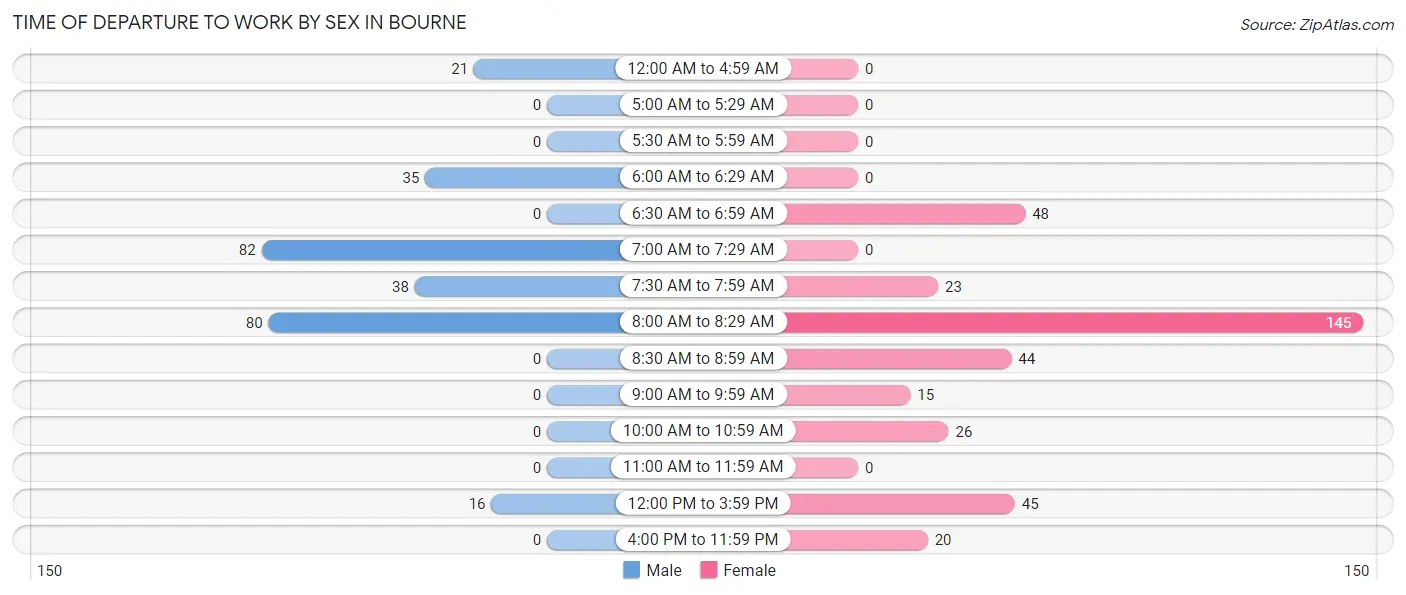
| Time of Departure | Male | Female |
| 12:00 AM to 4:59 AM | 21 (7.7%) | 0 (0.0%) |
| 5:00 AM to 5:29 AM | 0 (0.0%) | 0 (0.0%) |
| 5:30 AM to 5:59 AM | 0 (0.0%) | 0 (0.0%) |
| 6:00 AM to 6:29 AM | 35 (12.9%) | 0 (0.0%) |
| 6:30 AM to 6:59 AM | 0 (0.0%) | 48 (13.1%) |
| 7:00 AM to 7:29 AM | 82 (30.1%) | 0 (0.0%) |
| 7:30 AM to 7:59 AM | 38 (14.0%) | 23 (6.3%) |
| 8:00 AM to 8:29 AM | 80 (29.4%) | 145 (39.6%) |
| 8:30 AM to 8:59 AM | 0 (0.0%) | 44 (12.0%) |
| 9:00 AM to 9:59 AM | 0 (0.0%) | 15 (4.1%) |
| 10:00 AM to 10:59 AM | 0 (0.0%) | 26 (7.1%) |
| 11:00 AM to 11:59 AM | 0 (0.0%) | 0 (0.0%) |
| 12:00 PM to 3:59 PM | 16 (5.9%) | 45 (12.3%) |
| 4:00 PM to 11:59 PM | 0 (0.0%) | 20 (5.5%) |
| Total | 272 (100.0%) | 366 (100.0%) |
Housing Occupancy in Bourne
Occupancy by Ownership in Bourne
Of the total 858 dwellings in Bourne, owner-occupied units account for 605 (70.5%), while renter-occupied units make up 253 (29.5%).
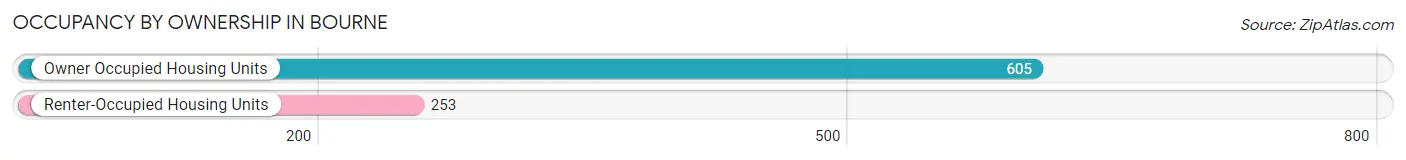
| Occupancy | # Housing Units | % Housing Units |
| Owner Occupied Housing Units | 605 | 70.5% |
| Renter-Occupied Housing Units | 253 | 29.5% |
| Total Occupied Housing Units | 858 | 100.0% |
Occupancy by Household Size in Bourne
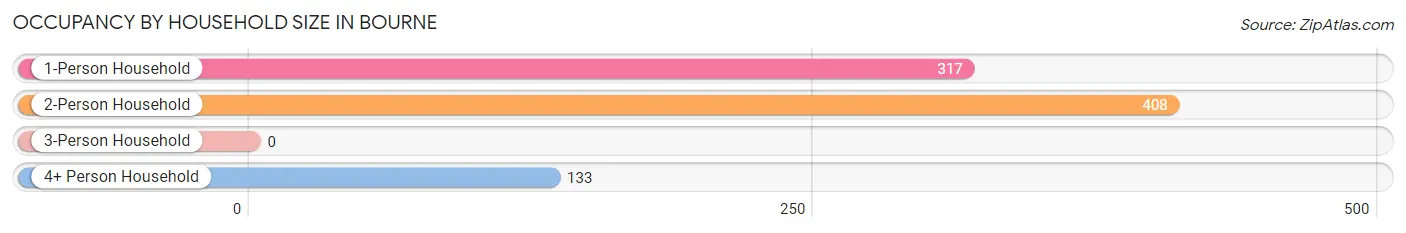
| Household Size | # Housing Units | % Housing Units |
| 1-Person Household | 317 | 36.9% |
| 2-Person Household | 408 | 47.5% |
| 3-Person Household | 0 | 0.0% |
| 4+ Person Household | 133 | 15.5% |
| Total Housing Units | 858 | 100.0% |
Occupancy by Ownership by Household Size in Bourne
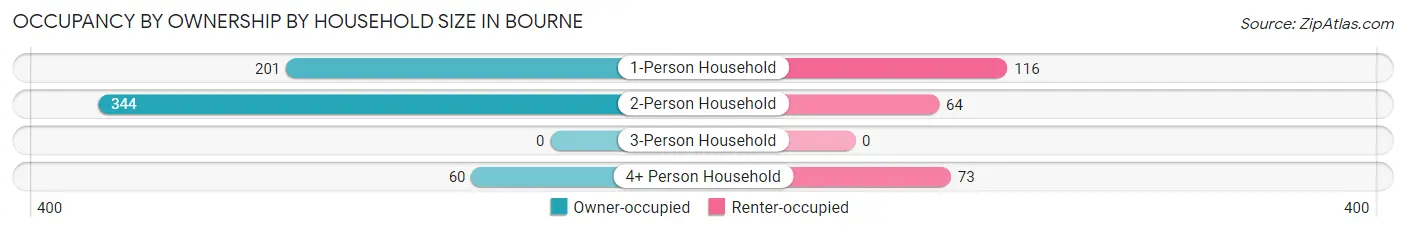
| Household Size | Owner-occupied | Renter-occupied |
| 1-Person Household | 201 (63.4%) | 116 (36.6%) |
| 2-Person Household | 344 (84.3%) | 64 (15.7%) |
| 3-Person Household | 0 (0.0%) | 0 (0.0%) |
| 4+ Person Household | 60 (45.1%) | 73 (54.9%) |
| Total Housing Units | 605 (70.5%) | 253 (29.5%) |
Occupancy by Educational Attainment in Bourne
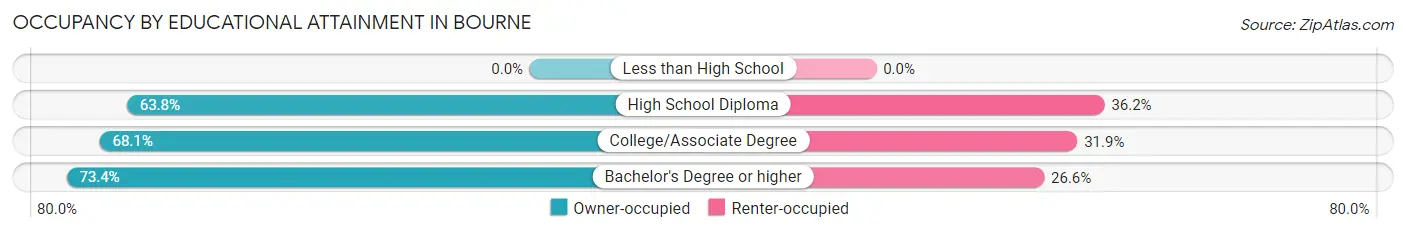
| Household Size | Owner-occupied | Renter-occupied |
| Less than High School | 0 (0.0%) | 0 (0.0%) |
| High School Diploma | 74 (63.8%) | 42 (36.2%) |
| College/Associate Degree | 173 (68.1%) | 81 (31.9%) |
| Bachelor's Degree or higher | 358 (73.4%) | 130 (26.6%) |
Occupancy by Age of Householder in Bourne
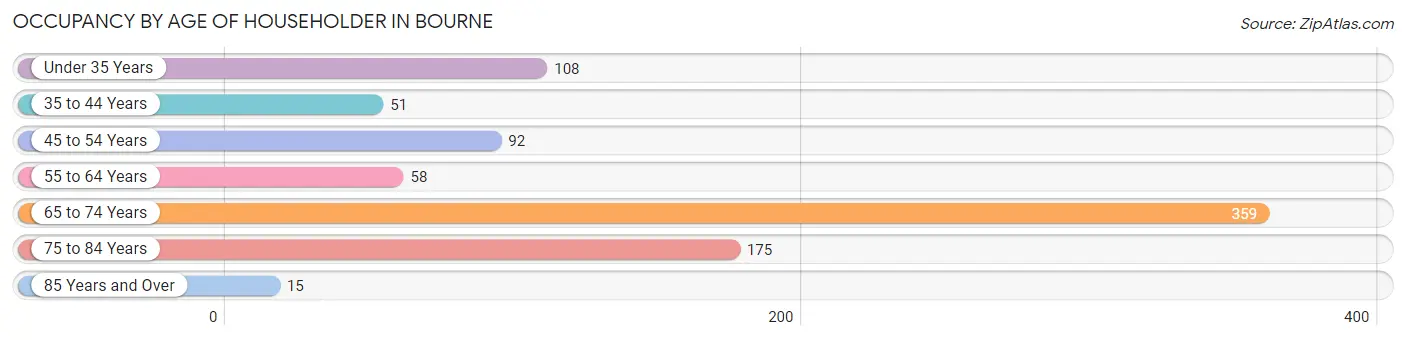
| Age Bracket | # Households | % Households |
| Under 35 Years | 108 | 12.6% |
| 35 to 44 Years | 51 | 5.9% |
| 45 to 54 Years | 92 | 10.7% |
| 55 to 64 Years | 58 | 6.8% |
| 65 to 74 Years | 359 | 41.8% |
| 75 to 84 Years | 175 | 20.4% |
| 85 Years and Over | 15 | 1.8% |
| Total | 858 | 100.0% |
Housing Finances in Bourne
Median Income by Occupancy in Bourne
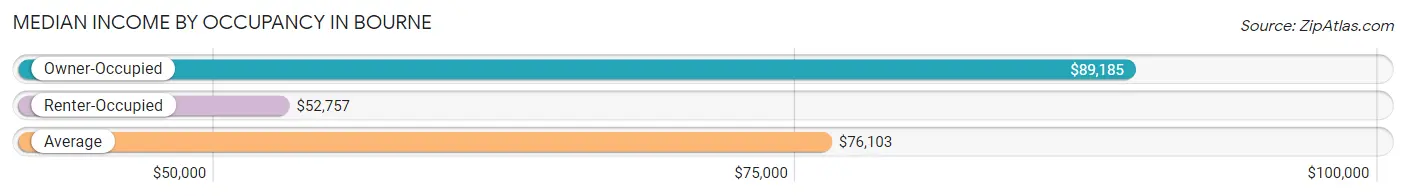
| Occupancy Type | # Households | Median Income |
| Owner-Occupied | 605 (70.5%) | $89,185 |
| Renter-Occupied | 253 (29.5%) | $52,757 |
| Average | 858 (100.0%) | $76,103 |
Occupancy by Householder Income Bracket in Bourne
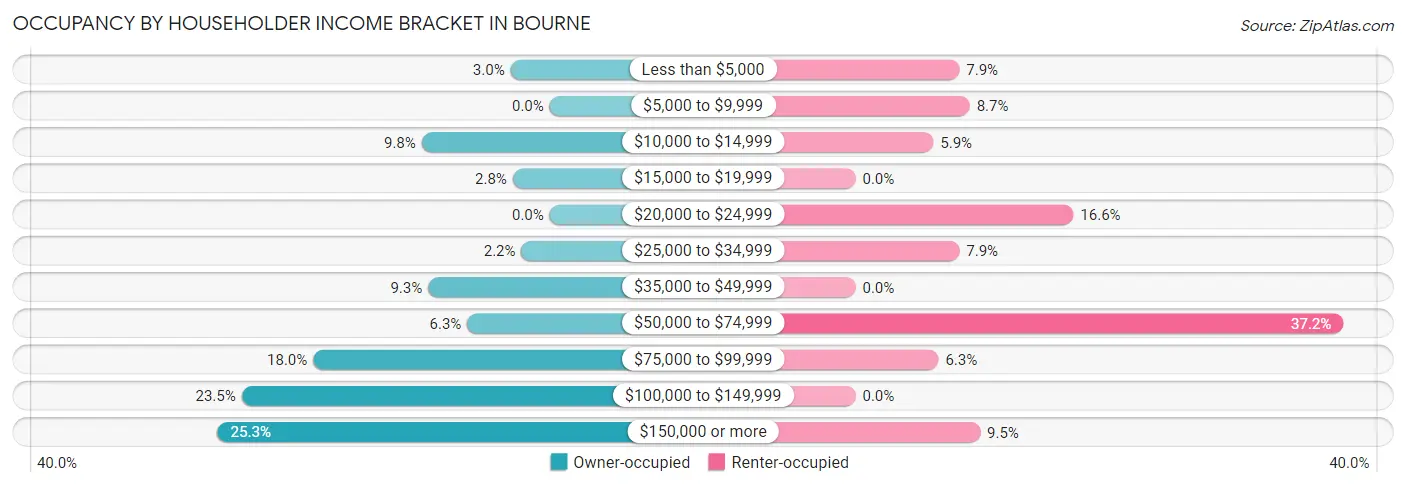
| Income Bracket | Owner-occupied | Renter-occupied |
| Less than $5,000 | 18 (3.0%) | 20 (7.9%) |
| $5,000 to $9,999 | 0 (0.0%) | 22 (8.7%) |
| $10,000 to $14,999 | 59 (9.8%) | 15 (5.9%) |
| $15,000 to $19,999 | 17 (2.8%) | 0 (0.0%) |
| $20,000 to $24,999 | 0 (0.0%) | 42 (16.6%) |
| $25,000 to $34,999 | 13 (2.1%) | 20 (7.9%) |
| $35,000 to $49,999 | 56 (9.3%) | 0 (0.0%) |
| $50,000 to $74,999 | 38 (6.3%) | 94 (37.1%) |
| $75,000 to $99,999 | 109 (18.0%) | 16 (6.3%) |
| $100,000 to $149,999 | 142 (23.5%) | 0 (0.0%) |
| $150,000 or more | 153 (25.3%) | 24 (9.5%) |
| Total | 605 (100.0%) | 253 (100.0%) |
Monthly Housing Cost Tiers in Bourne
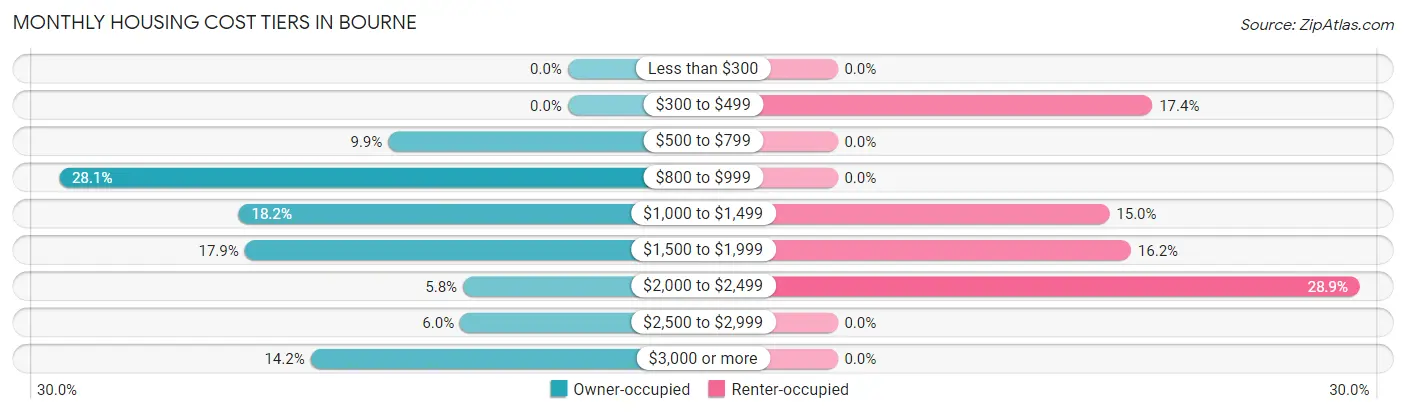
| Monthly Cost | Owner-occupied | Renter-occupied |
| Less than $300 | 0 (0.0%) | 0 (0.0%) |
| $300 to $499 | 0 (0.0%) | 44 (17.4%) |
| $500 to $799 | 60 (9.9%) | 0 (0.0%) |
| $800 to $999 | 170 (28.1%) | 0 (0.0%) |
| $1,000 to $1,499 | 110 (18.2%) | 38 (15.0%) |
| $1,500 to $1,999 | 108 (17.8%) | 41 (16.2%) |
| $2,000 to $2,499 | 35 (5.8%) | 73 (28.8%) |
| $2,500 to $2,999 | 36 (5.9%) | 0 (0.0%) |
| $3,000 or more | 86 (14.2%) | 0 (0.0%) |
| Total | 605 (100.0%) | 253 (100.0%) |
Physical Housing Characteristics in Bourne
Housing Structures in Bourne
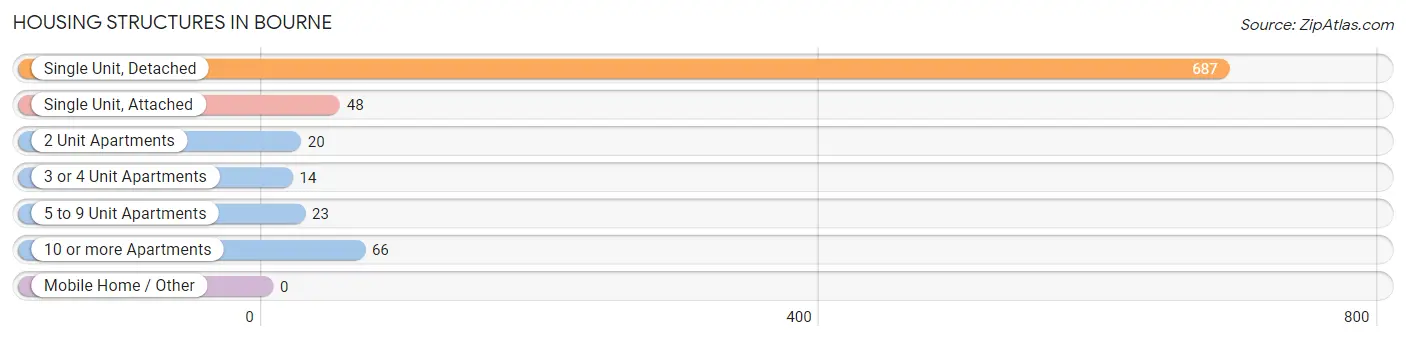
| Structure Type | # Housing Units | % Housing Units |
| Single Unit, Detached | 687 | 80.1% |
| Single Unit, Attached | 48 | 5.6% |
| 2 Unit Apartments | 20 | 2.3% |
| 3 or 4 Unit Apartments | 14 | 1.6% |
| 5 to 9 Unit Apartments | 23 | 2.7% |
| 10 or more Apartments | 66 | 7.7% |
| Mobile Home / Other | 0 | 0.0% |
| Total | 858 | 100.0% |
Housing Structures by Occupancy in Bourne
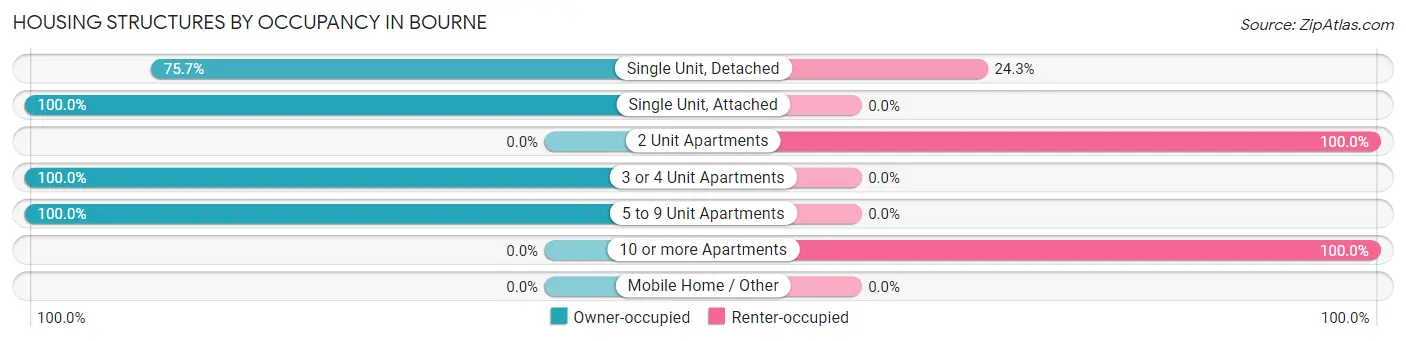
| Structure Type | Owner-occupied | Renter-occupied |
| Single Unit, Detached | 520 (75.7%) | 167 (24.3%) |
| Single Unit, Attached | 48 (100.0%) | 0 (0.0%) |
| 2 Unit Apartments | 0 (0.0%) | 20 (100.0%) |
| 3 or 4 Unit Apartments | 14 (100.0%) | 0 (0.0%) |
| 5 to 9 Unit Apartments | 23 (100.0%) | 0 (0.0%) |
| 10 or more Apartments | 0 (0.0%) | 66 (100.0%) |
| Mobile Home / Other | 0 (0.0%) | 0 (0.0%) |
| Total | 605 (70.5%) | 253 (29.5%) |
Housing Structures by Number of Rooms in Bourne
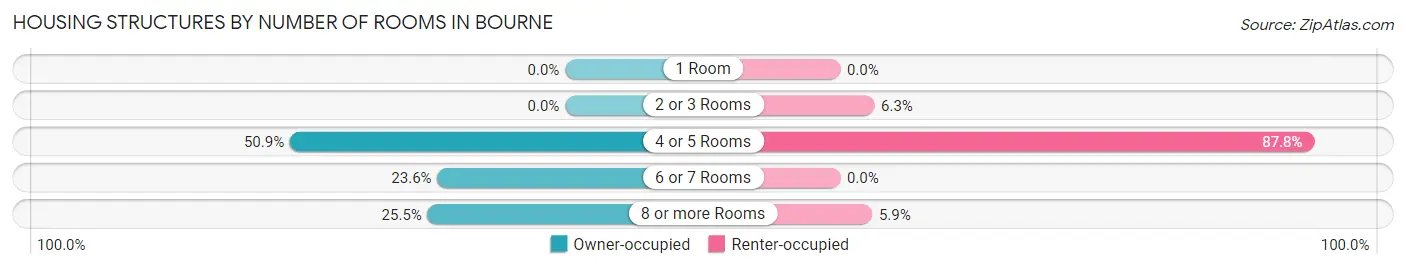
| Number of Rooms | Owner-occupied | Renter-occupied |
| 1 Room | 0 (0.0%) | 0 (0.0%) |
| 2 or 3 Rooms | 0 (0.0%) | 16 (6.3%) |
| 4 or 5 Rooms | 308 (50.9%) | 222 (87.7%) |
| 6 or 7 Rooms | 143 (23.6%) | 0 (0.0%) |
| 8 or more Rooms | 154 (25.5%) | 15 (5.9%) |
| Total | 605 (100.0%) | 253 (100.0%) |
Housing Structure by Heating Type in Bourne
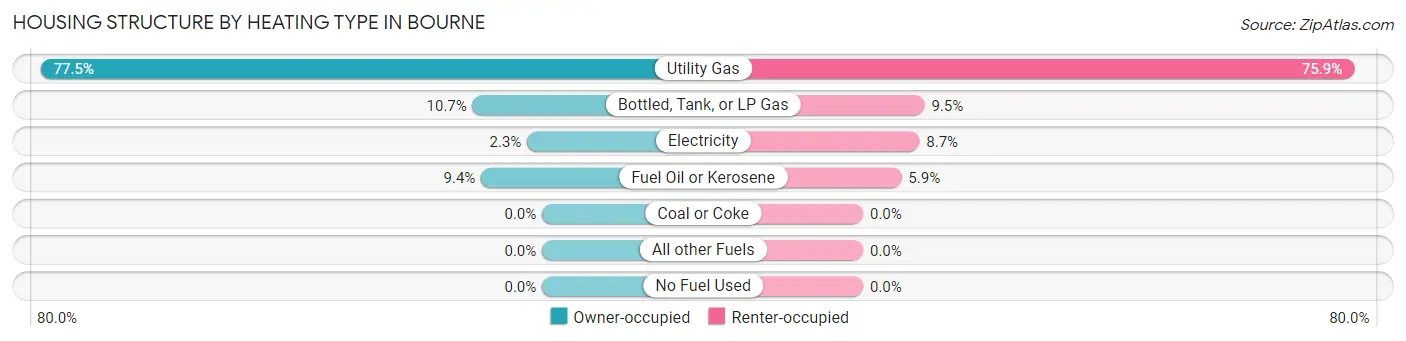
| Heating Type | Owner-occupied | Renter-occupied |
| Utility Gas | 469 (77.5%) | 192 (75.9%) |
| Bottled, Tank, or LP Gas | 65 (10.7%) | 24 (9.5%) |
| Electricity | 14 (2.3%) | 22 (8.7%) |
| Fuel Oil or Kerosene | 57 (9.4%) | 15 (5.9%) |
| Coal or Coke | 0 (0.0%) | 0 (0.0%) |
| All other Fuels | 0 (0.0%) | 0 (0.0%) |
| No Fuel Used | 0 (0.0%) | 0 (0.0%) |
| Total | 605 (100.0%) | 253 (100.0%) |
Household Vehicle Usage in Bourne
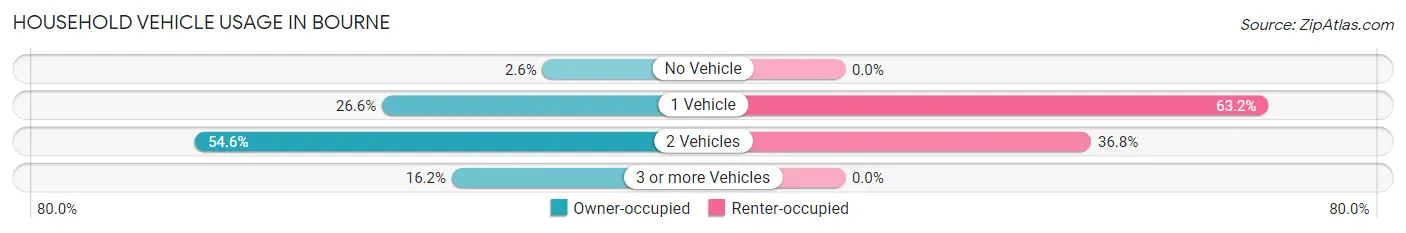
| Vehicles per Household | Owner-occupied | Renter-occupied |
| No Vehicle | 16 (2.6%) | 0 (0.0%) |
| 1 Vehicle | 161 (26.6%) | 160 (63.2%) |
| 2 Vehicles | 330 (54.5%) | 93 (36.8%) |
| 3 or more Vehicles | 98 (16.2%) | 0 (0.0%) |
| Total | 605 (100.0%) | 253 (100.0%) |
Real Estate & Mortgages in Bourne
Real Estate and Mortgage Overview in Bourne
| Characteristic | Without Mortgage | With Mortgage |
| Housing Units | 301 | 304 |
| Median Property Value | $487,500 | $419,800 |
| Median Household Income | $88,424 | $67 |
| Monthly Housing Costs | $908 | $86 |
| Real Estate Taxes | $5,480 | $0 |
Property Value by Mortgage Status in Bourne
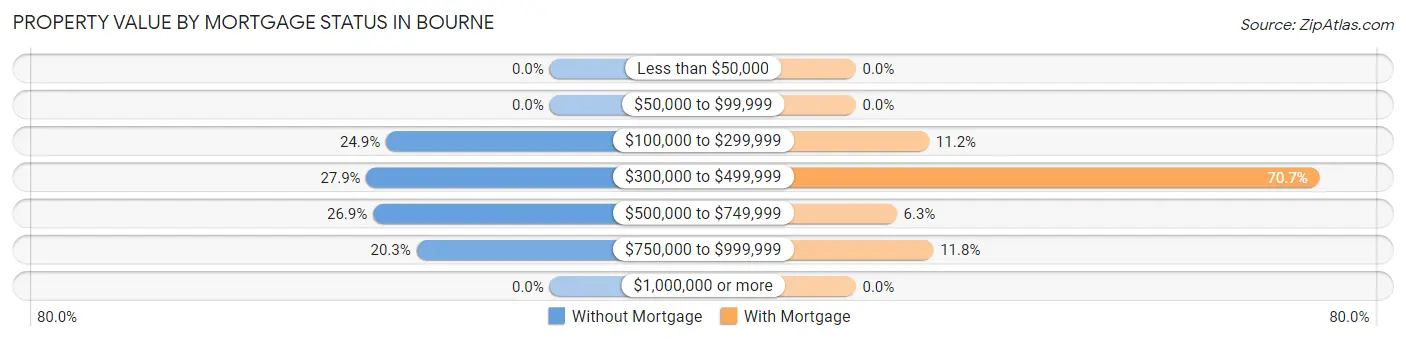
| Property Value | Without Mortgage | With Mortgage |
| Less than $50,000 | 0 (0.0%) | 0 (0.0%) |
| $50,000 to $99,999 | 0 (0.0%) | 0 (0.0%) |
| $100,000 to $299,999 | 75 (24.9%) | 34 (11.2%) |
| $300,000 to $499,999 | 84 (27.9%) | 215 (70.7%) |
| $500,000 to $749,999 | 81 (26.9%) | 19 (6.2%) |
| $750,000 to $999,999 | 61 (20.3%) | 36 (11.8%) |
| $1,000,000 or more | 0 (0.0%) | 0 (0.0%) |
| Total | 301 (100.0%) | 304 (100.0%) |
Household Income by Mortgage Status in Bourne
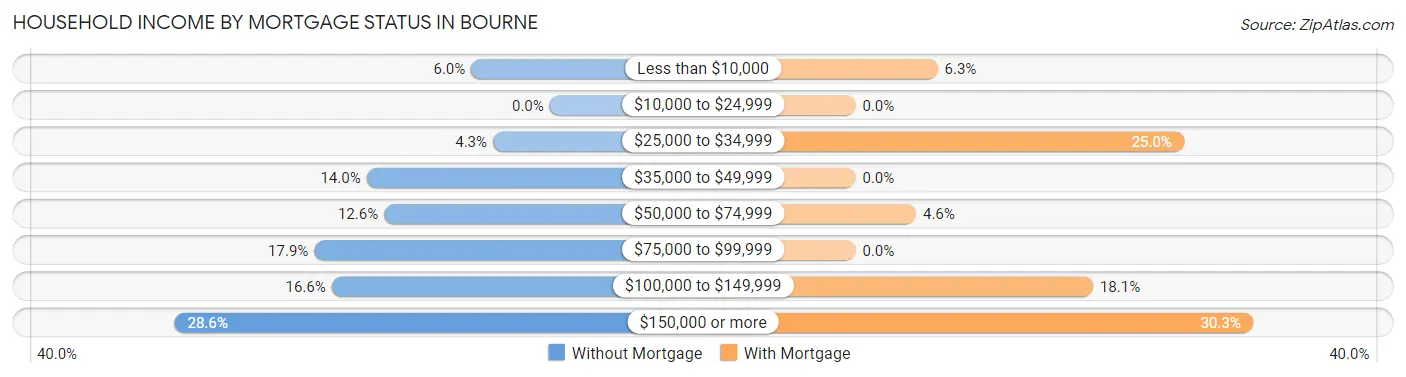
| Household Income | Without Mortgage | With Mortgage |
| Less than $10,000 | 18 (6.0%) | 19 (6.2%) |
| $10,000 to $24,999 | 0 (0.0%) | 0 (0.0%) |
| $25,000 to $34,999 | 13 (4.3%) | 76 (25.0%) |
| $35,000 to $49,999 | 42 (14.0%) | 0 (0.0%) |
| $50,000 to $74,999 | 38 (12.6%) | 14 (4.6%) |
| $75,000 to $99,999 | 54 (17.9%) | 0 (0.0%) |
| $100,000 to $149,999 | 50 (16.6%) | 55 (18.1%) |
| $150,000 or more | 86 (28.6%) | 92 (30.3%) |
| Total | 301 (100.0%) | 304 (100.0%) |
Property Value to Household Income Ratio in Bourne
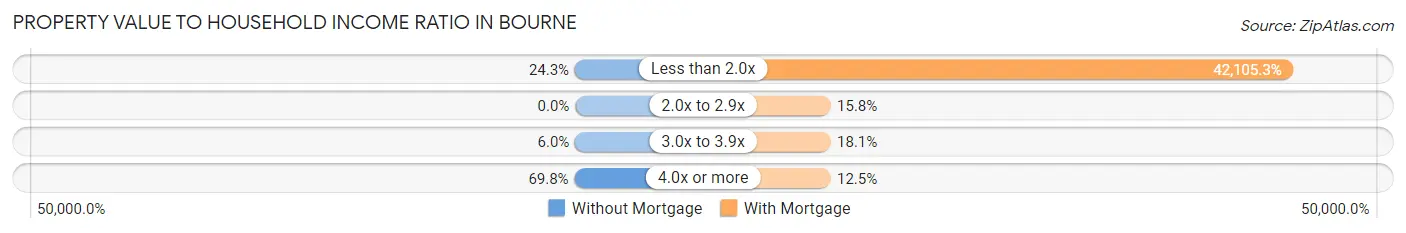
| Value-to-Income Ratio | Without Mortgage | With Mortgage |
| Less than 2.0x | 73 (24.2%) | 128,000 (42,105.3%) |
| 2.0x to 2.9x | 0 (0.0%) | 48 (15.8%) |
| 3.0x to 3.9x | 18 (6.0%) | 55 (18.1%) |
| 4.0x or more | 210 (69.8%) | 38 (12.5%) |
| Total | 301 (100.0%) | 304 (100.0%) |
Real Estate Taxes by Mortgage Status in Bourne
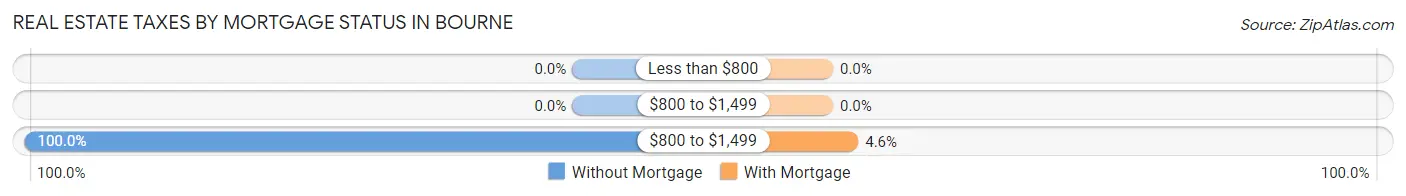
| Property Taxes | Without Mortgage | With Mortgage |
| Less than $800 | 0 (0.0%) | 0 (0.0%) |
| $800 to $1,499 | 0 (0.0%) | 0 (0.0%) |
| $800 to $1,499 | 301 (100.0%) | 14 (4.6%) |
| Total | 301 (100.0%) | 304 (100.0%) |
Health & Disability in Bourne
Health Insurance Coverage by Age in Bourne
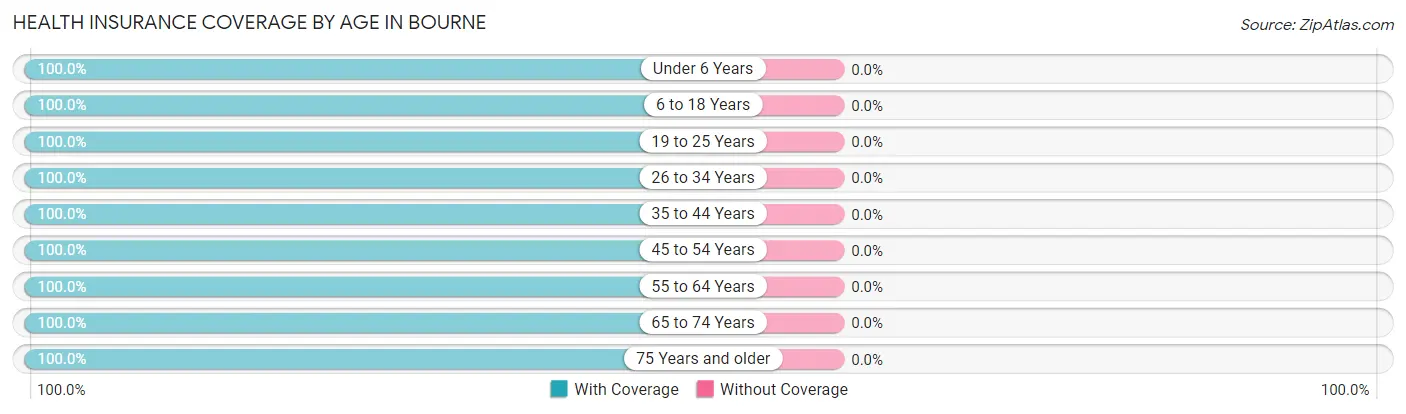
| Age Bracket | With Coverage | Without Coverage |
| Under 6 Years | 148 (100.0%) | 0 (0.0%) |
| 6 to 18 Years | 233 (100.0%) | 0 (0.0%) |
| 19 to 25 Years | 35 (100.0%) | 0 (0.0%) |
| 26 to 34 Years | 171 (100.0%) | 0 (0.0%) |
| 35 to 44 Years | 112 (100.0%) | 0 (0.0%) |
| 45 to 54 Years | 120 (100.0%) | 0 (0.0%) |
| 55 to 64 Years | 151 (100.0%) | 0 (0.0%) |
| 65 to 74 Years | 474 (100.0%) | 0 (0.0%) |
| 75 Years and older | 338 (100.0%) | 0 (0.0%) |
| Total | 1,782 (100.0%) | 0 (0.0%) |
Health Insurance Coverage by Citizenship Status in Bourne
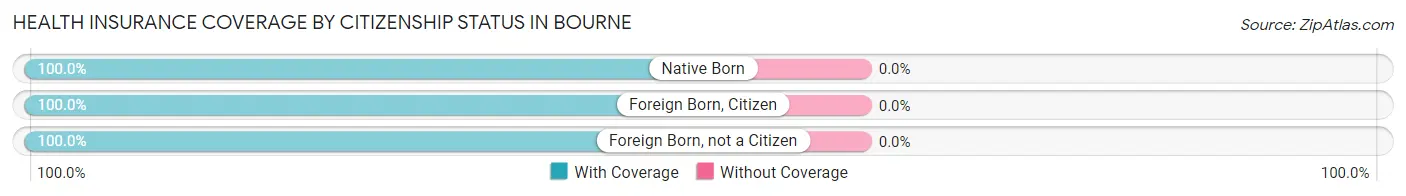
| Citizenship Status | With Coverage | Without Coverage |
| Native Born | 148 (100.0%) | 0 (0.0%) |
| Foreign Born, Citizen | 233 (100.0%) | 0 (0.0%) |
| Foreign Born, not a Citizen | 35 (100.0%) | 0 (0.0%) |
Health Insurance Coverage by Household Income in Bourne
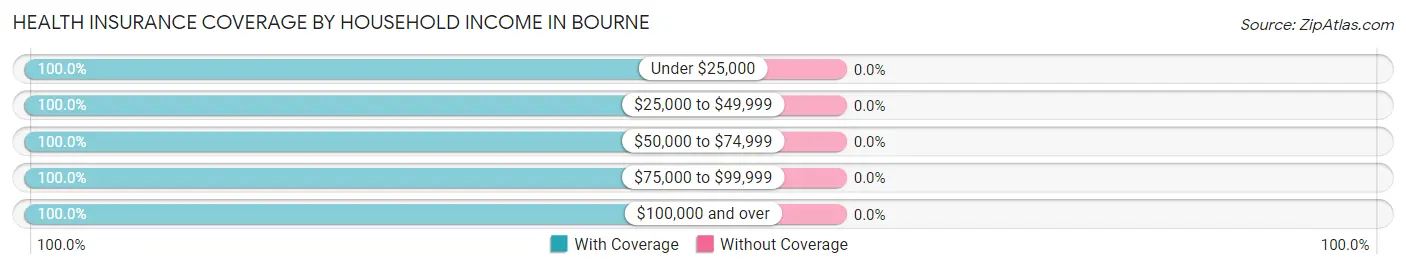
| Household Income | With Coverage | Without Coverage |
| Under $25,000 | 254 (100.0%) | 0 (0.0%) |
| $25,000 to $49,999 | 109 (100.0%) | 0 (0.0%) |
| $50,000 to $74,999 | 417 (100.0%) | 0 (0.0%) |
| $75,000 to $99,999 | 198 (100.0%) | 0 (0.0%) |
| $100,000 and over | 804 (100.0%) | 0 (0.0%) |
Public vs Private Health Insurance Coverage by Age in Bourne
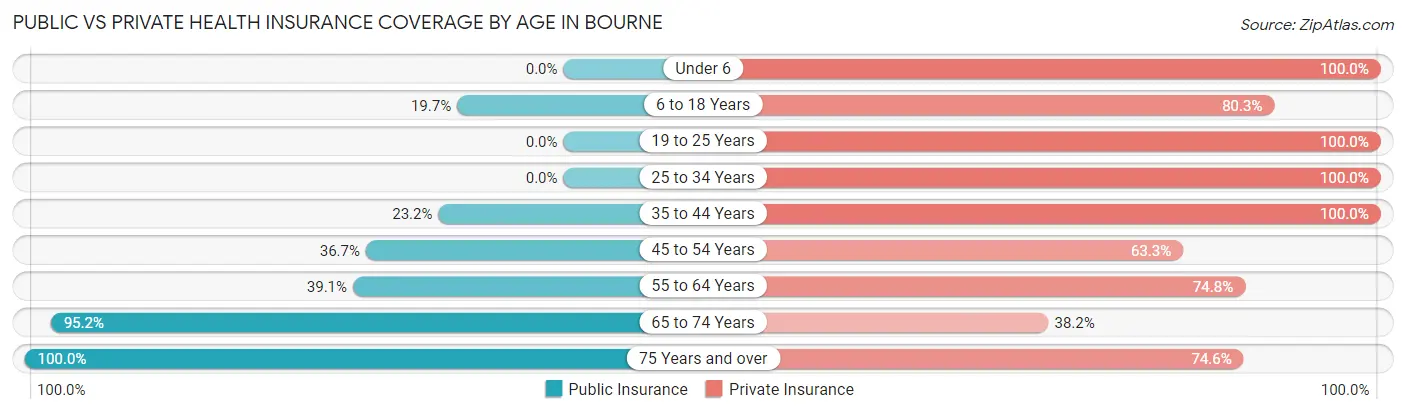
| Age Bracket | Public Insurance | Private Insurance |
| Under 6 | 0 (0.0%) | 148 (100.0%) |
| 6 to 18 Years | 46 (19.7%) | 187 (80.3%) |
| 19 to 25 Years | 0 (0.0%) | 35 (100.0%) |
| 25 to 34 Years | 0 (0.0%) | 171 (100.0%) |
| 35 to 44 Years | 26 (23.2%) | 112 (100.0%) |
| 45 to 54 Years | 44 (36.7%) | 76 (63.3%) |
| 55 to 64 Years | 59 (39.1%) | 113 (74.8%) |
| 65 to 74 Years | 451 (95.2%) | 181 (38.2%) |
| 75 Years and over | 338 (100.0%) | 252 (74.6%) |
| Total | 964 (54.1%) | 1,275 (71.6%) |
Disability Status by Sex by Age in Bourne
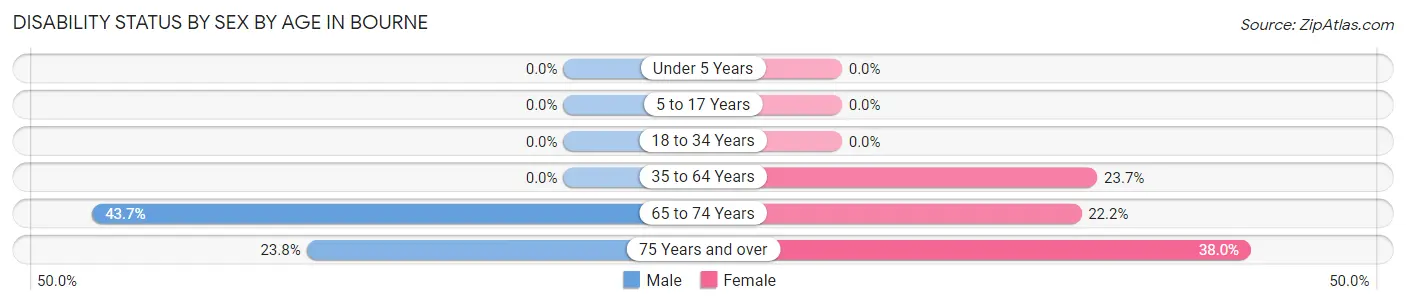
| Age Bracket | Male | Female |
| Under 5 Years | 0 (0.0%) | 0 (0.0%) |
| 5 to 17 Years | 0 (0.0%) | 0 (0.0%) |
| 18 to 34 Years | 0 (0.0%) | 0 (0.0%) |
| 35 to 64 Years | 0 (0.0%) | 64 (23.7%) |
| 65 to 74 Years | 101 (43.7%) | 54 (22.2%) |
| 75 Years and over | 36 (23.8%) | 71 (38.0%) |
Disability Class by Sex by Age in Bourne
Disability Class: Hearing Difficulty
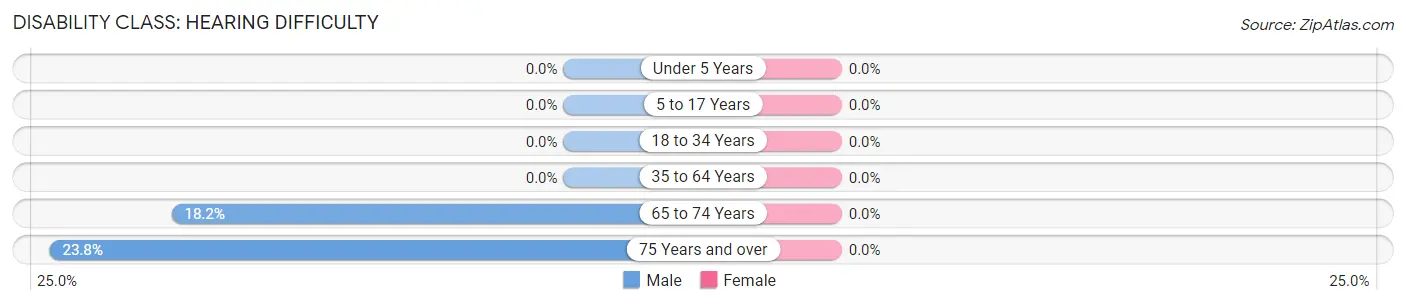
| Age Bracket | Male | Female |
| Under 5 Years | 0 (0.0%) | 0 (0.0%) |
| 5 to 17 Years | 0 (0.0%) | 0 (0.0%) |
| 18 to 34 Years | 0 (0.0%) | 0 (0.0%) |
| 35 to 64 Years | 0 (0.0%) | 0 (0.0%) |
| 65 to 74 Years | 42 (18.2%) | 0 (0.0%) |
| 75 Years and over | 36 (23.8%) | 0 (0.0%) |
Disability Class: Vision Difficulty
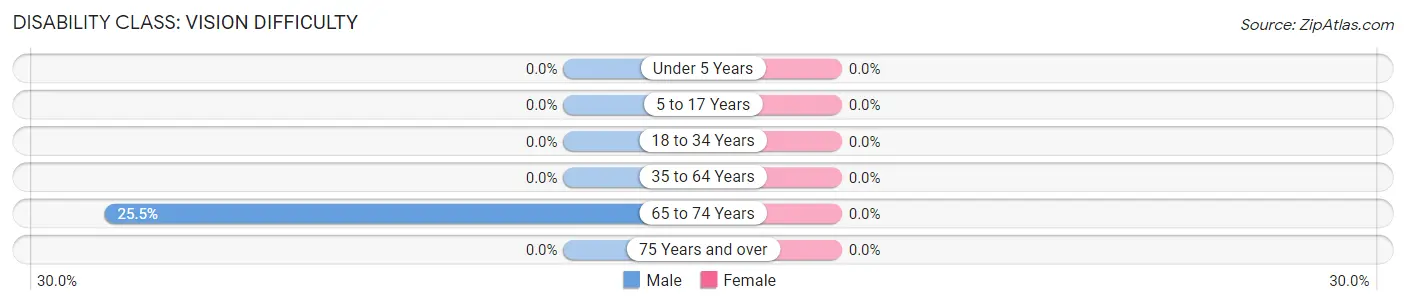
| Age Bracket | Male | Female |
| Under 5 Years | 0 (0.0%) | 0 (0.0%) |
| 5 to 17 Years | 0 (0.0%) | 0 (0.0%) |
| 18 to 34 Years | 0 (0.0%) | 0 (0.0%) |
| 35 to 64 Years | 0 (0.0%) | 0 (0.0%) |
| 65 to 74 Years | 59 (25.5%) | 0 (0.0%) |
| 75 Years and over | 0 (0.0%) | 0 (0.0%) |
Disability Class: Cognitive Difficulty
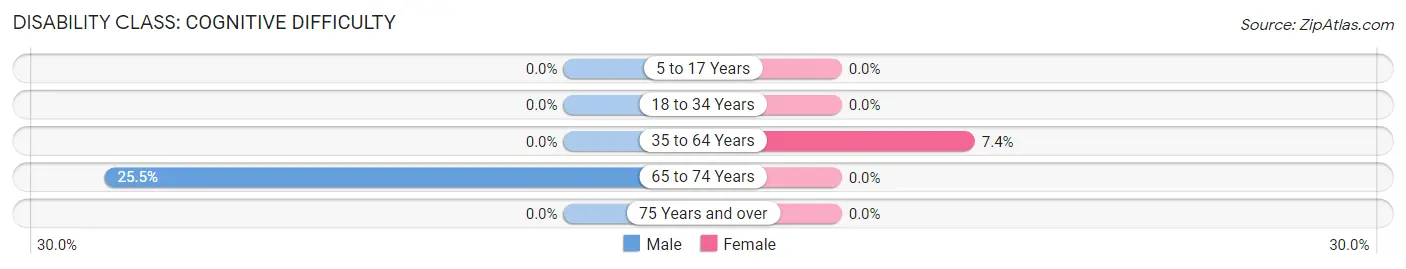
| Age Bracket | Male | Female |
| 5 to 17 Years | 0 (0.0%) | 0 (0.0%) |
| 18 to 34 Years | 0 (0.0%) | 0 (0.0%) |
| 35 to 64 Years | 0 (0.0%) | 20 (7.4%) |
| 65 to 74 Years | 59 (25.5%) | 0 (0.0%) |
| 75 Years and over | 0 (0.0%) | 0 (0.0%) |
Disability Class: Ambulatory Difficulty
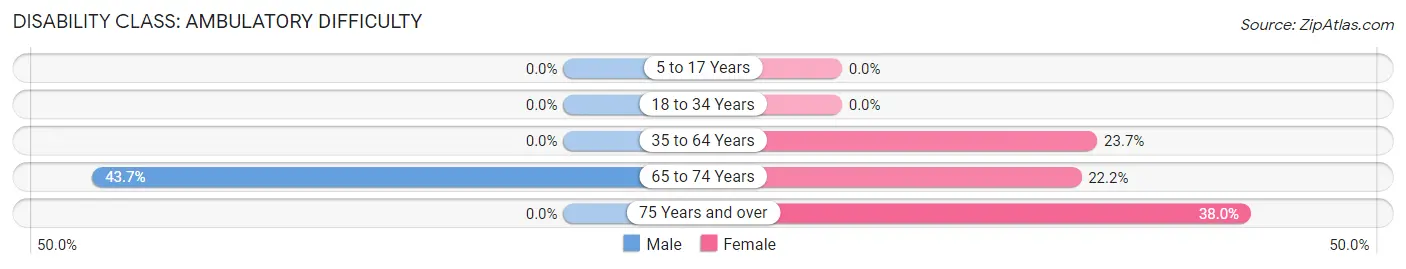
| Age Bracket | Male | Female |
| 5 to 17 Years | 0 (0.0%) | 0 (0.0%) |
| 18 to 34 Years | 0 (0.0%) | 0 (0.0%) |
| 35 to 64 Years | 0 (0.0%) | 64 (23.7%) |
| 65 to 74 Years | 101 (43.7%) | 54 (22.2%) |
| 75 Years and over | 0 (0.0%) | 71 (38.0%) |
Disability Class: Self-Care Difficulty
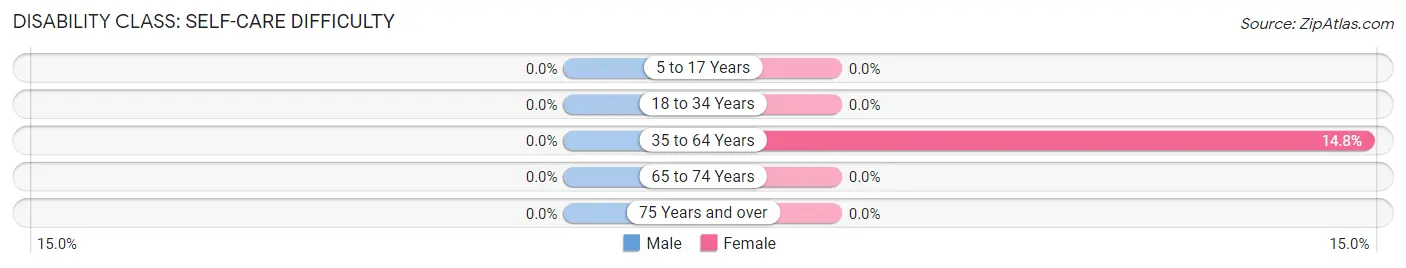
| Age Bracket | Male | Female |
| 5 to 17 Years | 0 (0.0%) | 0 (0.0%) |
| 18 to 34 Years | 0 (0.0%) | 0 (0.0%) |
| 35 to 64 Years | 0 (0.0%) | 40 (14.8%) |
| 65 to 74 Years | 0 (0.0%) | 0 (0.0%) |
| 75 Years and over | 0 (0.0%) | 0 (0.0%) |
Technology Access in Bourne
Computing Device Access in Bourne
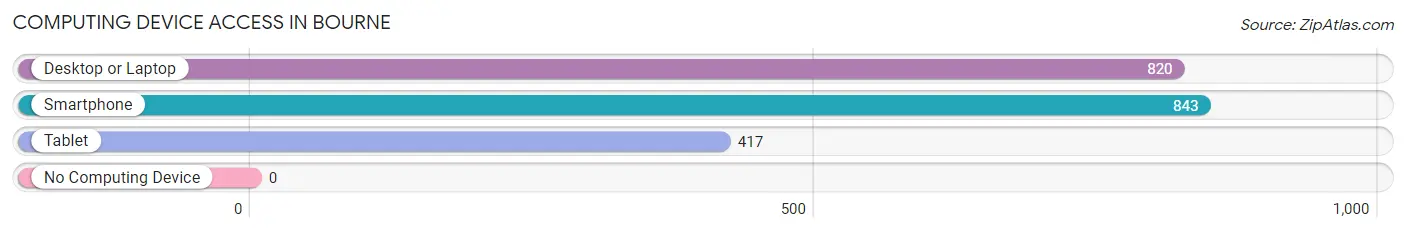
| Device Type | # Households | % Households |
| Desktop or Laptop | 820 | 95.6% |
| Smartphone | 843 | 98.3% |
| Tablet | 417 | 48.6% |
| No Computing Device | 0 | 0.0% |
| Total | 858 | 100.0% |
Internet Access in Bourne
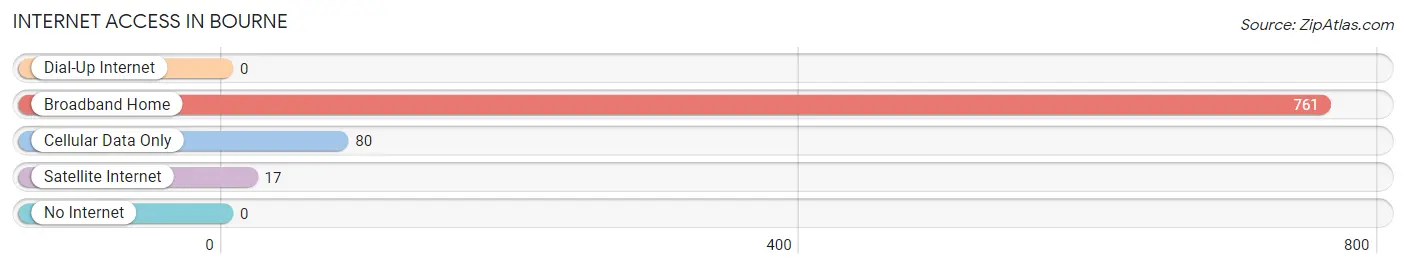
| Internet Type | # Households | % Households |
| Dial-Up Internet | 0 | 0.0% |
| Broadband Home | 761 | 88.7% |
| Cellular Data Only | 80 | 9.3% |
| Satellite Internet | 17 | 2.0% |
| No Internet | 0 | 0.0% |
| Total | 858 | 100.0% |
Bourne Summary
Bourne is a town located in Barnstable County, Massachusetts, United States. It is situated on the western side of Cape Cod, and is bordered by Sandwich to the east, Falmouth to the south, and Plymouth to the north. The town is named after Jonathan Bourne, who was a prominent local landowner in the late 18th century. As of the 2010 census, the town had a population of 19,754.
History
The area that is now Bourne was originally inhabited by the Wampanoag people. The first European settlers arrived in the area in 1640, and the town was officially incorporated in 1884. The town was named after Jonathan Bourne, who was a prominent local landowner in the late 18th century.
Geography
Bourne is located at 41°45'N 70°37'W (41.75, -70.62). According to the United States Census Bureau, the town has a total area of 28.2 square miles (73.1 km2), of which 25.2 square miles (65.3 km2) is land and 3.0 square miles (7.8 km2) is water.
Economy
Bourne is home to several businesses, including the Massachusetts Maritime Academy, the Cape Cod Canal Visitor Center, and the Massachusetts Military Reservation. The town is also home to several tourist attractions, such as the Monument Beach Boardwalk, the Bourne Scenic Park, and the Cape Cod Canal.
Demographics
As of the 2010 census, there were 19,754 people, 8,072 households, and 5,541 families residing in the town. The population density was 786.3 people per square mile (303.7/km2). There were 8,837 housing units at an average density of 351.3 per square mile (135.8/km2). The racial makeup of the town was 94.2% White, 1.3% African American, 0.3% Native American, 1.2% Asian, 0.1% Pacific Islander, 1.2% from other races, and 1.7% from two or more races. Hispanic or Latino of any race were 3.2% of the population.
The median income for a household in the town was $60,945, and the median income for a family was $71,945. Males had a median income of $50,945 versus $37,945 for females. The per capita income for the town was $30,945. About 4.2% of families and 5.7% of the population were below the poverty line, including 6.7% of those under age 18 and 4.2% of those age 65 or over.
Common Questions
What is Per Capita Income in Bourne?
Per Capita income in Bourne is $55,732.
What is the Median Family Income in Bourne?
Median Family Income in Bourne is $101,985.
What is the Median Household income in Bourne?
Median Household Income in Bourne is $76,103.
What is Inequality or Gini Index in Bourne?
Inequality or Gini Index in Bourne is 0.54.
What is the Total Population of Bourne?
Total Population of Bourne is 1,782.
What is the Total Male Population of Bourne?
Total Male Population of Bourne is 782.
What is the Total Female Population of Bourne?
Total Female Population of Bourne is 1,000.
What is the Ratio of Males per 100 Females in Bourne?
There are 78.20 Males per 100 Females in Bourne.
What is the Ratio of Females per 100 Males in Bourne?
There are 127.88 Females per 100 Males in Bourne.
What is the Median Population Age in Bourne?
Median Population Age in Bourne is 57.6 Years.
What is the Average Family Size in Bourne
Average Family Size in Bourne is 2.7 People.
What is the Average Household Size in Bourne
Average Household Size in Bourne is 2.1 People.
How Large is the Labor Force in Bourne?
There are 638 People in the Labor Forcein in Bourne.
What is the Percentage of People in the Labor Force in Bourne?
43.3% of People are in the Labor Force in Bourne.