Hanson, MA Map & Demographics
Hanson Map
Hanson Overview
$41,707
PER CAPITA INCOME
$132,083
AVG FAMILY INCOME
$110,096
AVG HOUSEHOLD INCOME
35.8%
WAGE / INCOME GAP [ % ]
64.2¢/ $1
WAGE / INCOME GAP [ $ ]
0.37
INEQUALITY / GINI INDEX
2,087
TOTAL POPULATION
1,009
MALE POPULATION
1,078
FEMALE POPULATION
93.60
MALES / 100 FEMALES
106.84
FEMALES / 100 MALES
39.6
MEDIAN AGE
3.5
AVG FAMILY SIZE
3.0
AVG HOUSEHOLD SIZE
1,064
LABOR FORCE [ PEOPLE ]
67.4%
PERCENT IN LABOR FORCE
5.8%
UNEMPLOYMENT RATE
Hanson Zip Codes
Income in Hanson
Income Overview in Hanson
Per Capita Income in Hanson is $41,707, while median incomes of families and households are $132,083 and $110,096 respectively.
| Characteristic | Number | Measure |
| Per Capita Income | 2,087 | $41,707 |
| Median Family Income | 526 | $132,083 |
| Mean Family Income | 526 | $139,857 |
| Median Household Income | 703 | $110,096 |
| Mean Household Income | 703 | $124,519 |
| Income Deficit | 526 | $0 |
| Wage / Income Gap (%) | 2,087 | 35.84% |
| Wage / Income Gap ($) | 2,087 | 64.16¢ per $1 |
| Gini / Inequality Index | 2,087 | 0.37 |
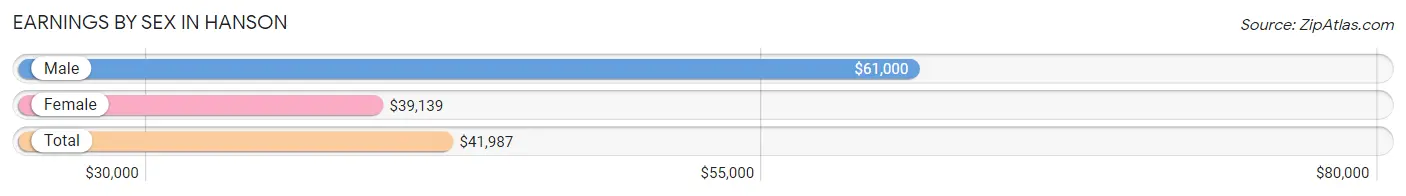
Earnings by Sex in Hanson
Average Earnings in Hanson are $41,987, $61,000 for men and $39,139 for women, a difference of 35.8%.
| Sex | Number | Average Earnings |
| Male | 590 (52.3%) | $61,000 |
| Female | 537 (47.6%) | $39,139 |
| Total | 1,127 (100.0%) | $41,987 |
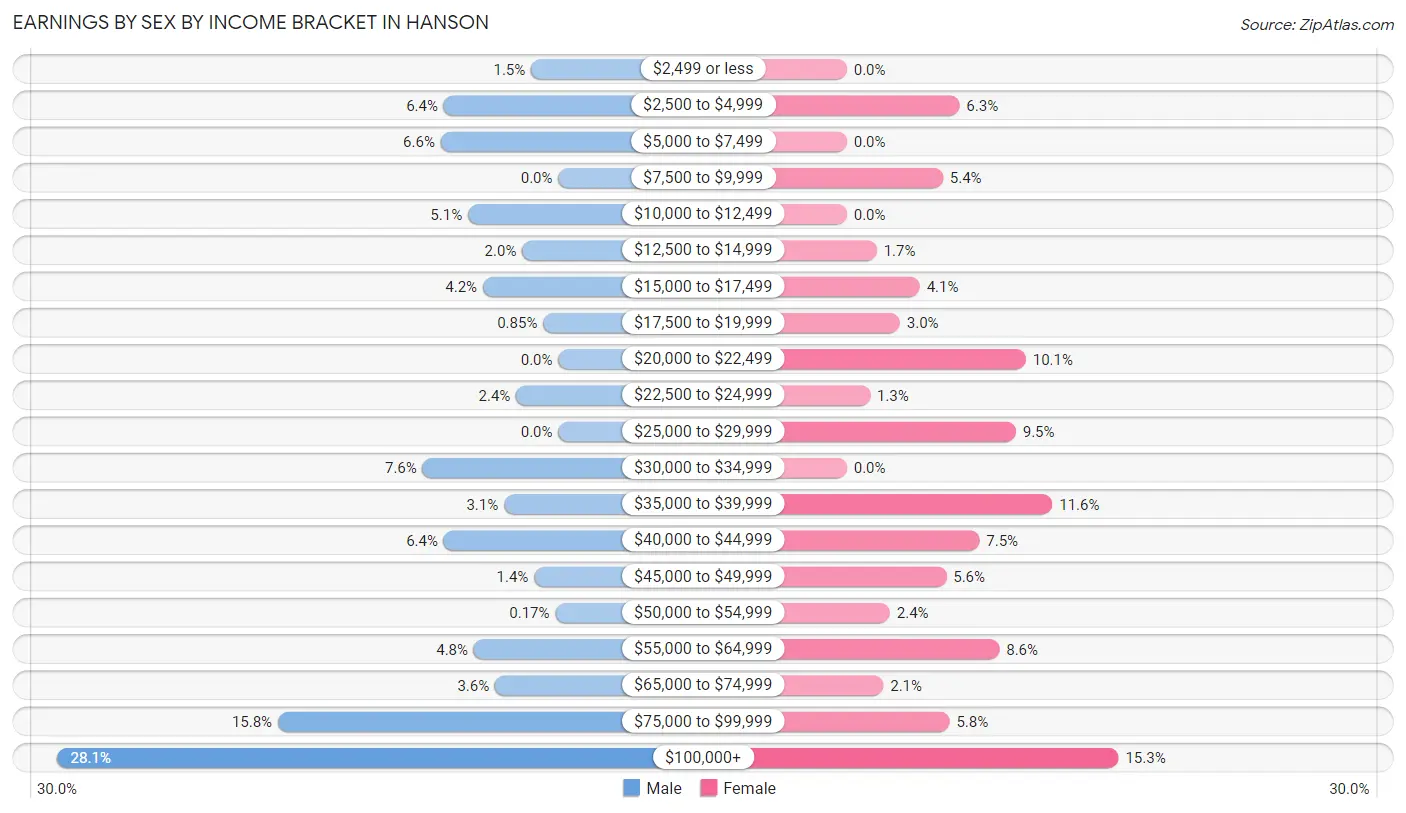
Earnings by Sex by Income Bracket in Hanson
The most common earnings brackets in Hanson are $100,000+ for men (166 | 28.1%) and $100,000+ for women (82 | 15.3%).
| Income | Male | Female |
| $2,499 or less | 9 (1.5%) | 0 (0.0%) |
| $2,500 to $4,999 | 38 (6.4%) | 34 (6.3%) |
| $5,000 to $7,499 | 39 (6.6%) | 0 (0.0%) |
| $7,500 to $9,999 | 0 (0.0%) | 29 (5.4%) |
| $10,000 to $12,499 | 30 (5.1%) | 0 (0.0%) |
| $12,500 to $14,999 | 12 (2.0%) | 9 (1.7%) |
| $15,000 to $17,499 | 25 (4.2%) | 22 (4.1%) |
| $17,500 to $19,999 | 5 (0.9%) | 16 (3.0%) |
| $20,000 to $22,499 | 0 (0.0%) | 54 (10.1%) |
| $22,500 to $24,999 | 14 (2.4%) | 7 (1.3%) |
| $25,000 to $29,999 | 0 (0.0%) | 51 (9.5%) |
| $30,000 to $34,999 | 45 (7.6%) | 0 (0.0%) |
| $35,000 to $39,999 | 18 (3.0%) | 62 (11.6%) |
| $40,000 to $44,999 | 38 (6.4%) | 40 (7.4%) |
| $45,000 to $49,999 | 8 (1.4%) | 30 (5.6%) |
| $50,000 to $54,999 | 1 (0.2%) | 13 (2.4%) |
| $55,000 to $64,999 | 28 (4.8%) | 46 (8.6%) |
| $65,000 to $74,999 | 21 (3.6%) | 11 (2.1%) |
| $75,000 to $99,999 | 93 (15.8%) | 31 (5.8%) |
| $100,000+ | 166 (28.1%) | 82 (15.3%) |
| Total | 590 (100.0%) | 537 (100.0%) |
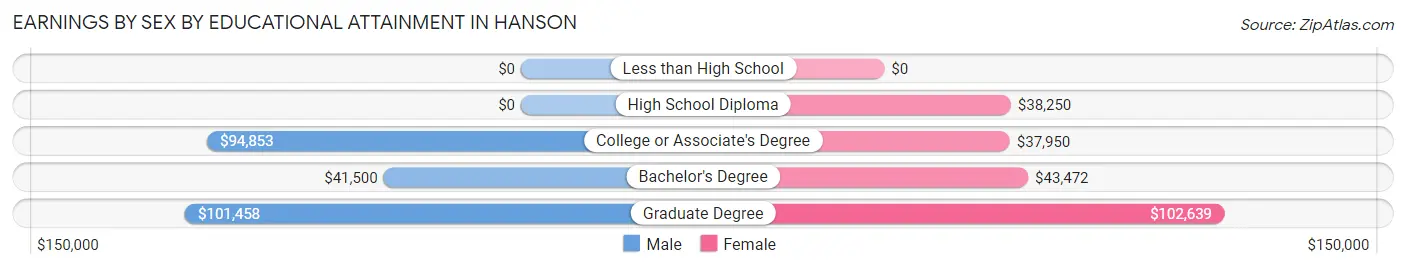
Earnings by Sex by Educational Attainment in Hanson
Average earnings in Hanson are $75,304 for men and $41,902 for women, a difference of 44.4%. Men with an educational attainment of graduate degree enjoy the highest average annual earnings of $101,458, while those with bachelor's degree education earn the least with $41,500. Women with an educational attainment of graduate degree earn the most with the average annual earnings of $102,639, while those with college or associate's degree education have the smallest earnings of $37,950.
| Educational Attainment | Male Income | Female Income |
| Less than High School | - | - |
| High School Diploma | - | - |
| College or Associate's Degree | $94,853 | $37,950 |
| Bachelor's Degree | $41,500 | $43,472 |
| Graduate Degree | $101,458 | $102,639 |
| Total | $75,304 | $41,902 |
Family Income in Hanson
Family Income Brackets in Hanson
According to the Hanson family income data, there are 138 families falling into the $100,000 to $149,999 income range, which is the most common income bracket and makes up 26.2% of all families.
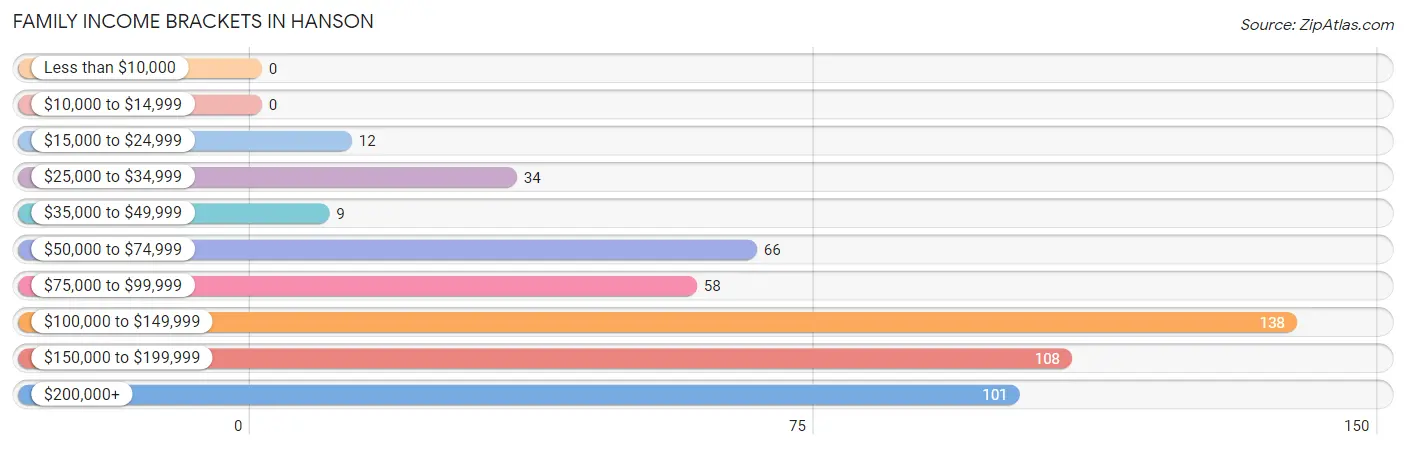
| Income Bracket | # Families | % Families |
| Less than $10,000 | 0 | 0.0% |
| $10,000 to $14,999 | 0 | 0.0% |
| $15,000 to $24,999 | 12 | 2.3% |
| $25,000 to $34,999 | 34 | 6.5% |
| $35,000 to $49,999 | 9 | 1.7% |
| $50,000 to $74,999 | 66 | 12.5% |
| $75,000 to $99,999 | 58 | 11.0% |
| $100,000 to $149,999 | 138 | 26.2% |
| $150,000 to $199,999 | 108 | 20.5% |
| $200,000+ | 101 | 19.2% |
Family Income by Famaliy Size in Hanson
5-person families (75 | 14.3%) account for the highest median family income in Hanson with $165,313 per family, while 2-person families (148 | 28.1%) have the highest median income of $56,328 per family member.
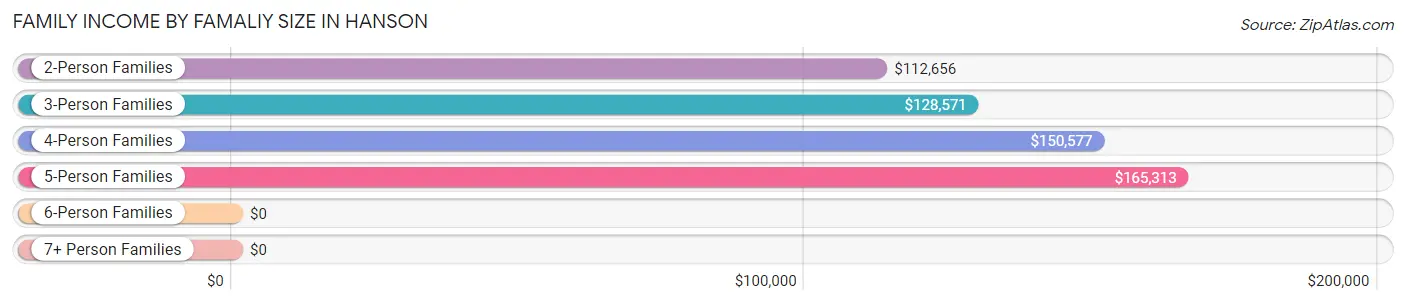
| Income Bracket | # Families | Median Income |
| 2-Person Families | 148 (28.1%) | $112,656 |
| 3-Person Families | 162 (30.8%) | $128,571 |
| 4-Person Families | 126 (23.9%) | $150,577 |
| 5-Person Families | 75 (14.3%) | $165,313 |
| 6-Person Families | 15 (2.9%) | $0 |
| 7+ Person Families | 0 (0.0%) | $0 |
| Total | 526 (100.0%) | $132,083 |
Family Income by Number of Earners in Hanson
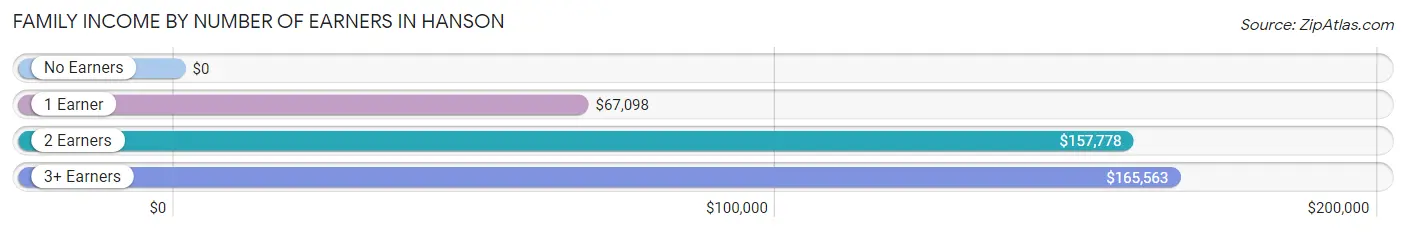
| Number of Earners | # Families | Median Income |
| No Earners | 20 (3.8%) | $0 |
| 1 Earner | 153 (29.1%) | $67,098 |
| 2 Earners | 252 (47.9%) | $157,778 |
| 3+ Earners | 101 (19.2%) | $165,563 |
| Total | 526 (100.0%) | $132,083 |
Household Income in Hanson
Household Income Brackets in Hanson
With 164 households falling in the category, the $100,000 to $149,999 income range is the most frequent in Hanson, accounting for 23.3% of all households. In contrast, only 9 households (1.3%) fall into the less than $10,000 income bracket, making it the least populous group.
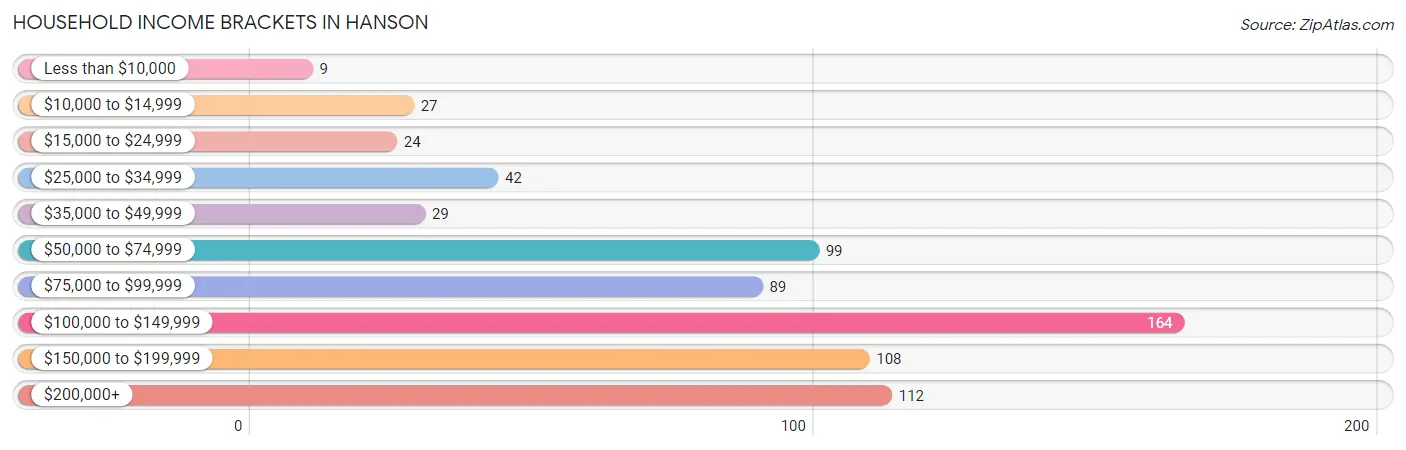
| Income Bracket | # Households | % Households |
| Less than $10,000 | 9 | 1.3% |
| $10,000 to $14,999 | 27 | 3.8% |
| $15,000 to $24,999 | 24 | 3.4% |
| $25,000 to $34,999 | 42 | 6.0% |
| $35,000 to $49,999 | 29 | 4.1% |
| $50,000 to $74,999 | 99 | 14.1% |
| $75,000 to $99,999 | 89 | 12.7% |
| $100,000 to $149,999 | 164 | 23.3% |
| $150,000 to $199,999 | 108 | 15.4% |
| $200,000+ | 112 | 15.9% |
Household Income by Householder Age in Hanson
The median household income in Hanson is $110,096, with the highest median household income of $140,833 found in the 45 to 64 years age bracket for the primary householder. A total of 238 households (33.9%) fall into this category.
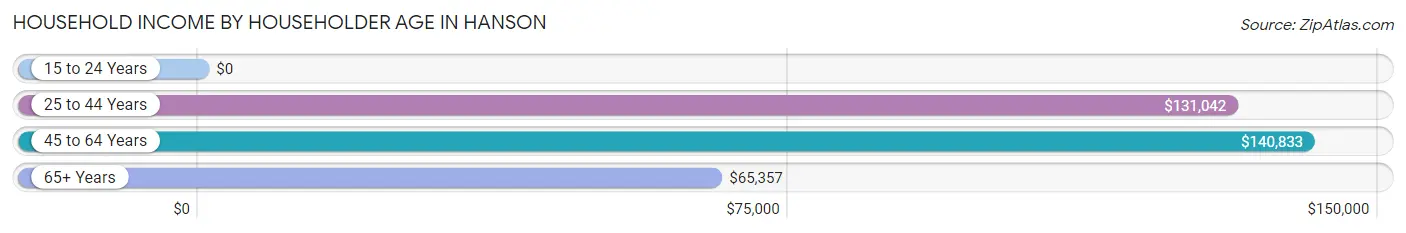
| Income Bracket | # Households | Median Income |
| 15 to 24 Years | 0 (0.0%) | $0 |
| 25 to 44 Years | 215 (30.6%) | $131,042 |
| 45 to 64 Years | 238 (33.9%) | $140,833 |
| 65+ Years | 250 (35.6%) | $65,357 |
| Total | 703 (100.0%) | $110,096 |
Poverty in Hanson
Income Below Poverty by Sex and Age in Hanson
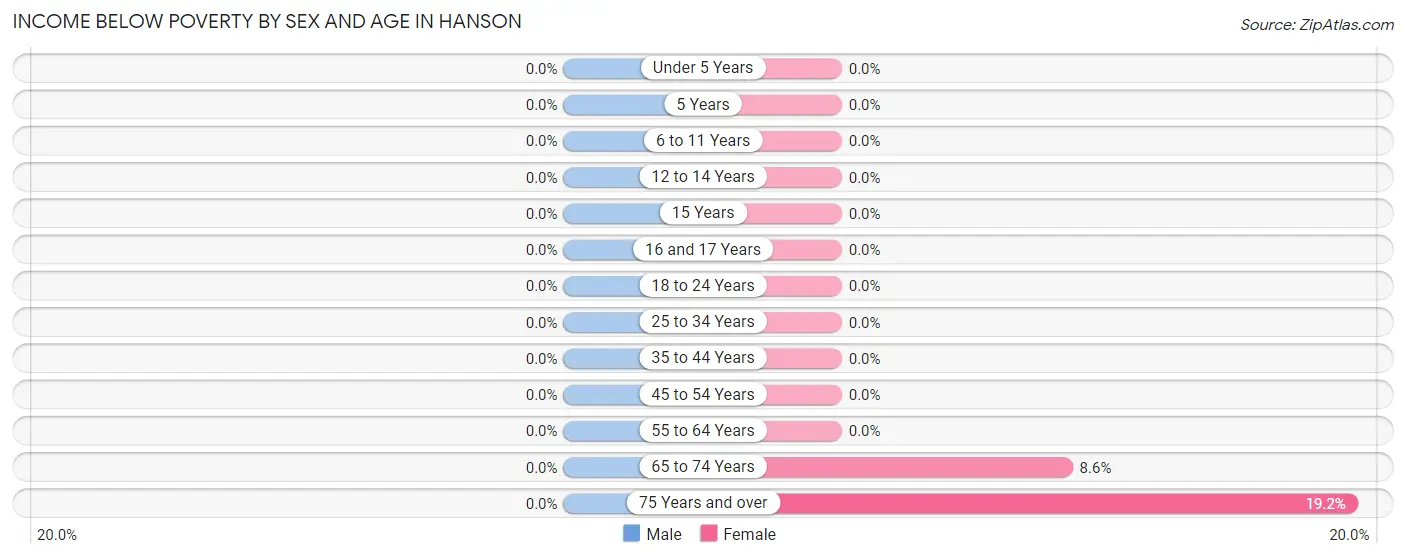
| Age Bracket | Male | Female |
| Under 5 Years | 0 (0.0%) | 0 (0.0%) |
| 5 Years | 0 (0.0%) | 0 (0.0%) |
| 6 to 11 Years | 0 (0.0%) | 0 (0.0%) |
| 12 to 14 Years | 0 (0.0%) | 0 (0.0%) |
| 15 Years | 0 (0.0%) | 0 (0.0%) |
| 16 and 17 Years | 0 (0.0%) | 0 (0.0%) |
| 18 to 24 Years | 0 (0.0%) | 0 (0.0%) |
| 25 to 34 Years | 0 (0.0%) | 0 (0.0%) |
| 35 to 44 Years | 0 (0.0%) | 0 (0.0%) |
| 45 to 54 Years | 0 (0.0%) | 0 (0.0%) |
| 55 to 64 Years | 0 (0.0%) | 0 (0.0%) |
| 65 to 74 Years | 0 (0.0%) | 9 (8.6%) |
| 75 Years and over | 0 (0.0%) | 27 (19.2%) |
| Total | 0 (0.0%) | 36 (3.3%) |
Income Above Poverty by Sex and Age in Hanson
According to the poverty statistics in Hanson, males aged under 5 years and females aged under 5 years are the age groups that are most secure financially, with 100.0% of males and 100.0% of females in these age groups living above the poverty line.
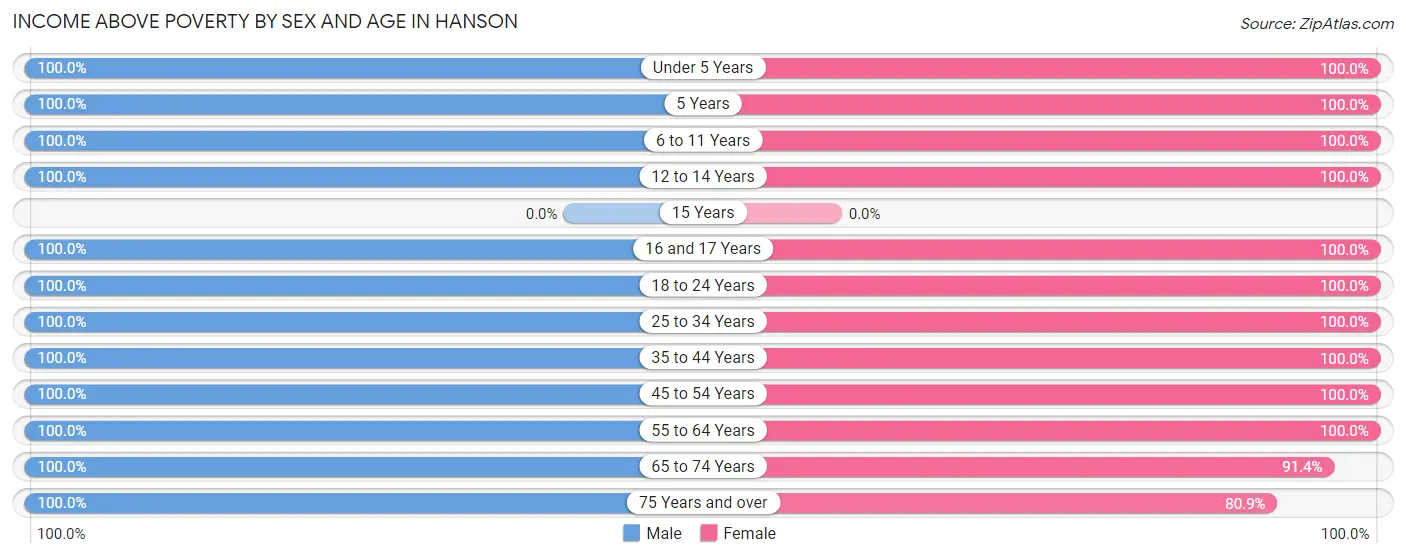
| Age Bracket | Male | Female |
| Under 5 Years | 29 (100.0%) | 66 (100.0%) |
| 5 Years | 50 (100.0%) | 18 (100.0%) |
| 6 to 11 Years | 101 (100.0%) | 144 (100.0%) |
| 12 to 14 Years | 37 (100.0%) | 11 (100.0%) |
| 15 Years | 0 (0.0%) | 0 (0.0%) |
| 16 and 17 Years | 12 (100.0%) | 32 (100.0%) |
| 18 to 24 Years | 96 (100.0%) | 50 (100.0%) |
| 25 to 34 Years | 133 (100.0%) | 108 (100.0%) |
| 35 to 44 Years | 112 (100.0%) | 160 (100.0%) |
| 45 to 54 Years | 156 (100.0%) | 114 (100.0%) |
| 55 to 64 Years | 123 (100.0%) | 129 (100.0%) |
| 65 to 74 Years | 70 (100.0%) | 96 (91.4%) |
| 75 Years and over | 37 (100.0%) | 114 (80.8%) |
| Total | 956 (100.0%) | 1,042 (96.7%) |
Income Below Poverty Among Married-Couple Families in Hanson
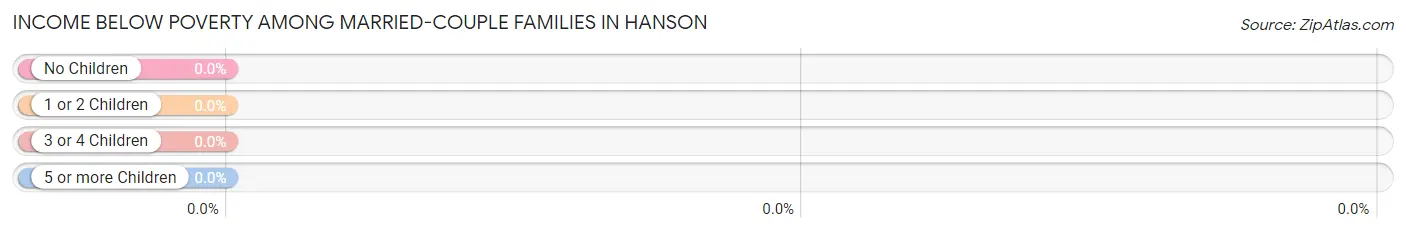
| Children | Above Poverty | Below Poverty |
| No Children | 205 (100.0%) | 0 (0.0%) |
| 1 or 2 Children | 201 (100.0%) | 0 (0.0%) |
| 3 or 4 Children | 44 (100.0%) | 0 (0.0%) |
| 5 or more Children | 0 (0.0%) | 0 (0.0%) |
| Total | 450 (100.0%) | 0 (0.0%) |
Income Below Poverty Among Single-Parent Households in Hanson
| Children | Single Father | Single Mother |
| No Children | 0 (0.0%) | 0 (0.0%) |
| 1 or 2 Children | 0 (0.0%) | 0 (0.0%) |
| 3 or 4 Children | 0 (0.0%) | 0 (0.0%) |
| 5 or more Children | 0 (0.0%) | 0 (0.0%) |
| Total | 0 (0.0%) | 0 (0.0%) |
Income Below Poverty Among Married-Couple vs Single-Parent Households in Hanson
| Children | Married-Couple Families | Single-Parent Households |
| No Children | 0 (0.0%) | 0 (0.0%) |
| 1 or 2 Children | 0 (0.0%) | 0 (0.0%) |
| 3 or 4 Children | 0 (0.0%) | 0 (0.0%) |
| 5 or more Children | 0 (0.0%) | 0 (0.0%) |
| Total | 0 (0.0%) | 0 (0.0%) |
Race in Hanson
The most populous races in Hanson are White / Caucasian (1,972 | 94.5%), Hispanic or Latino (135 | 6.5%), and Two or more Races (63 | 3.0%).
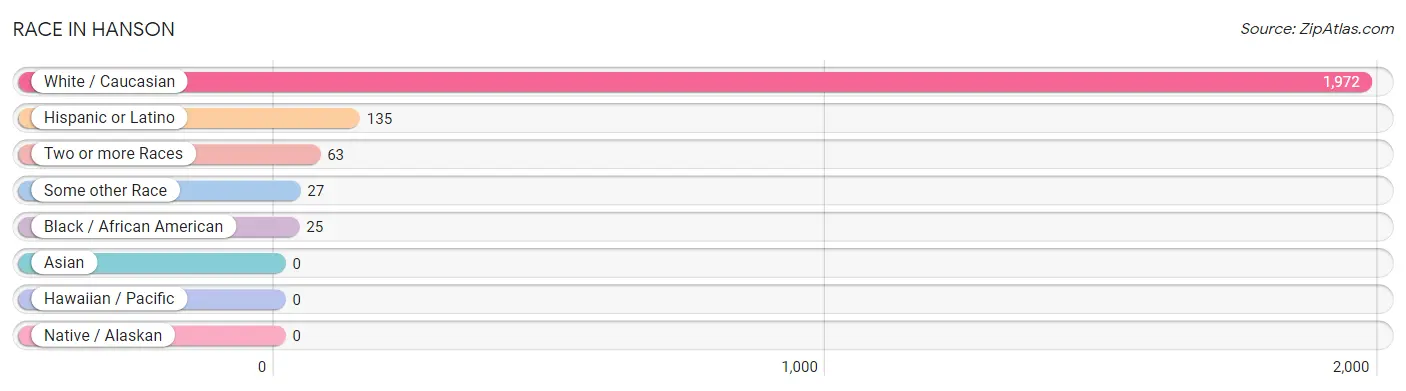
| Race | # Population | % Population |
| Asian | 0 | 0.0% |
| Black / African American | 25 | 1.2% |
| Hawaiian / Pacific | 0 | 0.0% |
| Hispanic or Latino | 135 | 6.5% |
| Native / Alaskan | 0 | 0.0% |
| White / Caucasian | 1,972 | 94.5% |
| Two or more Races | 63 | 3.0% |
| Some other Race | 27 | 1.3% |
| Total | 2,087 | 100.0% |
Ancestry in Hanson
The most populous ancestries reported in Hanson are Irish (793 | 38.0%), Italian (387 | 18.5%), English (228 | 10.9%), American (226 | 10.8%), and German (161 | 7.7%), together accounting for 86.0% of all Hanson residents.
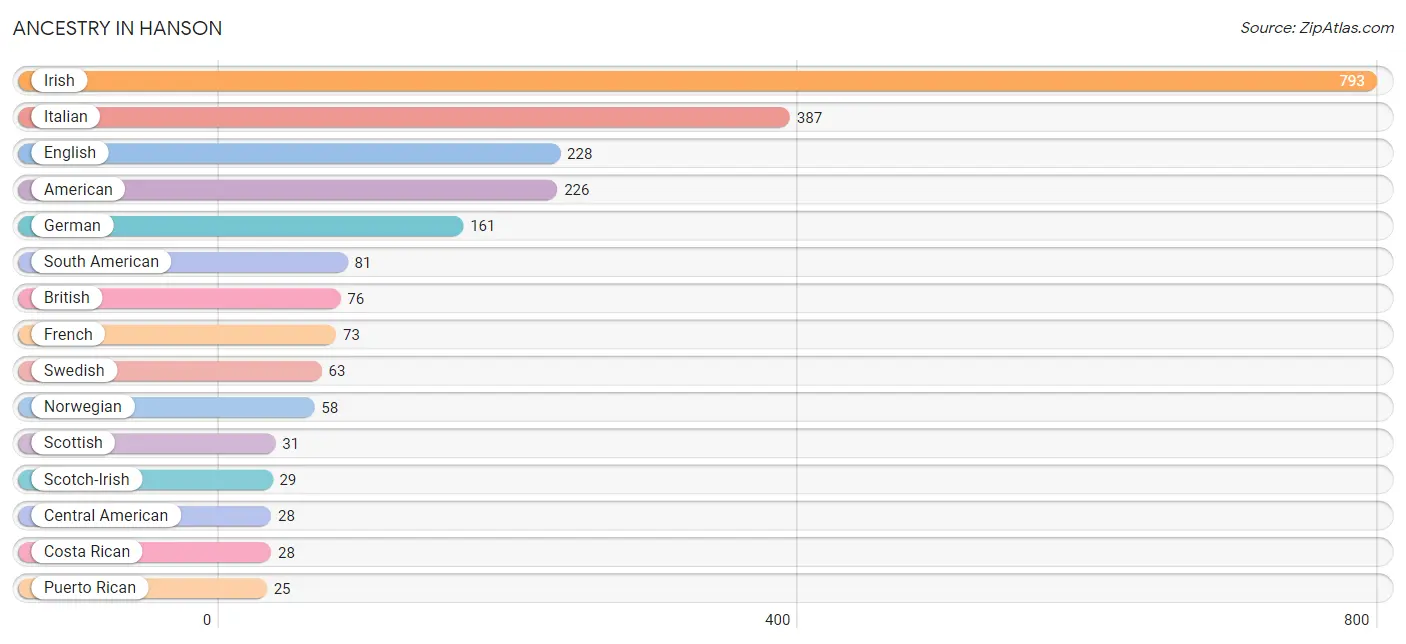
| Ancestry | # Population | % Population |
| American | 226 | 10.8% |
| Arab | 9 | 0.4% |
| Bolivian | 16 | 0.8% |
| British | 76 | 3.6% |
| Central American | 28 | 1.3% |
| Colombian | 6 | 0.3% |
| Costa Rican | 28 | 1.3% |
| Cuban | 1 | 0.1% |
| Czech | 5 | 0.2% |
| Danish | 8 | 0.4% |
| English | 228 | 10.9% |
| European | 19 | 0.9% |
| Fijian | 16 | 0.8% |
| French | 73 | 3.5% |
| French Canadian | 12 | 0.6% |
| German | 161 | 7.7% |
| Greek | 13 | 0.6% |
| Irish | 793 | 38.0% |
| Italian | 387 | 18.5% |
| Lithuanian | 13 | 0.6% |
| Norwegian | 58 | 2.8% |
| Peruvian | 14 | 0.7% |
| Polish | 17 | 0.8% |
| Puerto Rican | 25 | 1.2% |
| Scotch-Irish | 29 | 1.4% |
| Scottish | 31 | 1.5% |
| Slovak | 6 | 0.3% |
| South American | 81 | 3.9% |
| Sri Lankan | 16 | 0.8% |
| Swedish | 63 | 3.0% |
| Syrian | 9 | 0.4% |
| Welsh | 6 | 0.3% | View All 32 Rows |
Immigrants in Hanson
The most numerous immigrant groups reported in Hanson came from Latin America (52 | 2.5%), South America (51 | 2.4%), Brazil (45 | 2.2%), Africa (27 | 1.3%), and Cabo Verde (27 | 1.3%), together accounting for 9.7% of all Hanson residents.
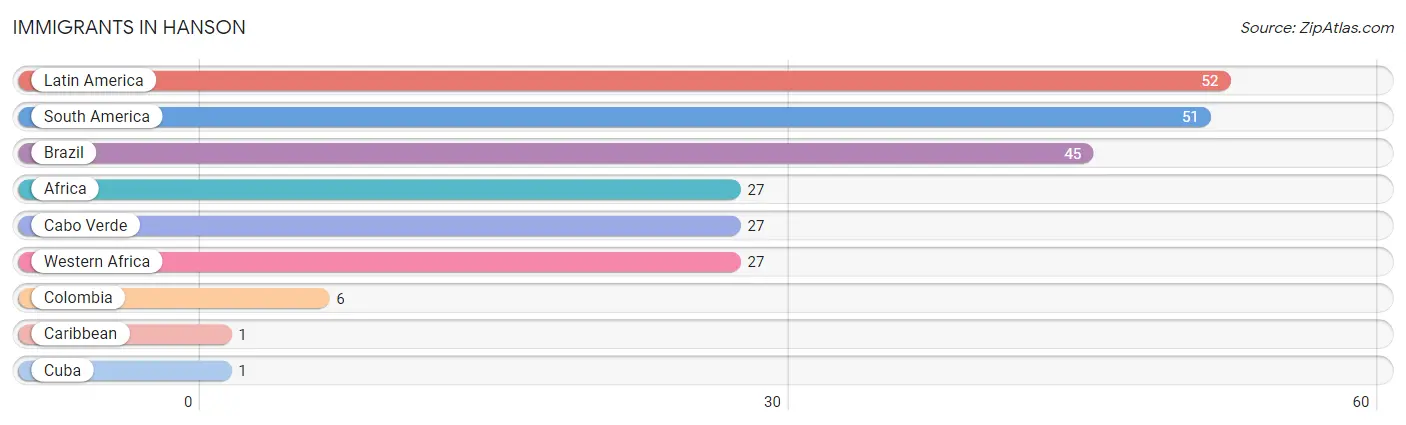
| Immigration Origin | # Population | % Population |
| Africa | 27 | 1.3% |
| Brazil | 45 | 2.2% |
| Cabo Verde | 27 | 1.3% |
| Caribbean | 1 | 0.1% |
| Colombia | 6 | 0.3% |
| Cuba | 1 | 0.1% |
| Latin America | 52 | 2.5% |
| South America | 51 | 2.4% |
| Western Africa | 27 | 1.3% | View All 9 Rows |
Sex and Age in Hanson
Sex and Age in Hanson
The most populous age groups in Hanson are 5 to 9 Years (181 | 17.9%) for men and 5 to 9 Years (100 | 9.3%) for women.
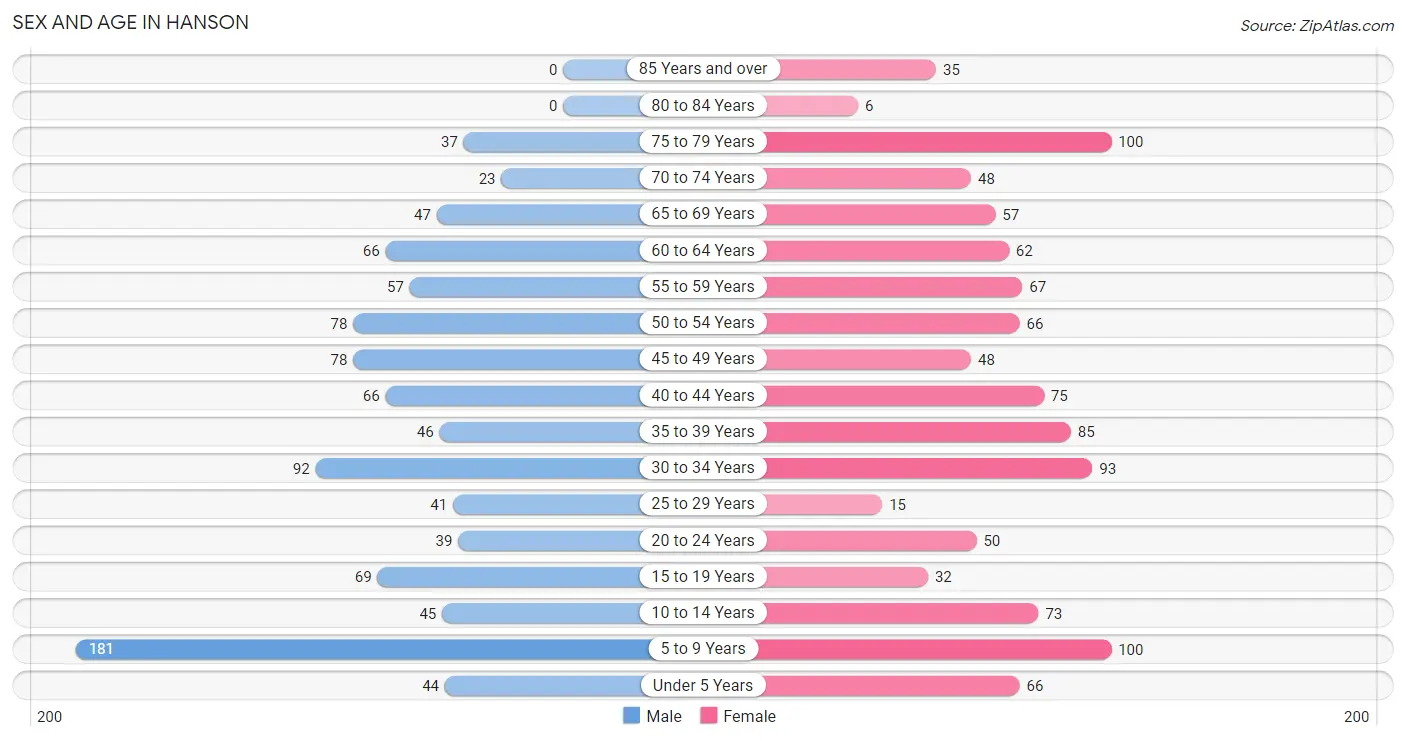
| Age Bracket | Male | Female |
| Under 5 Years | 44 (4.4%) | 66 (6.1%) |
| 5 to 9 Years | 181 (17.9%) | 100 (9.3%) |
| 10 to 14 Years | 45 (4.5%) | 73 (6.8%) |
| 15 to 19 Years | 69 (6.8%) | 32 (3.0%) |
| 20 to 24 Years | 39 (3.9%) | 50 (4.6%) |
| 25 to 29 Years | 41 (4.1%) | 15 (1.4%) |
| 30 to 34 Years | 92 (9.1%) | 93 (8.6%) |
| 35 to 39 Years | 46 (4.6%) | 85 (7.9%) |
| 40 to 44 Years | 66 (6.5%) | 75 (7.0%) |
| 45 to 49 Years | 78 (7.7%) | 48 (4.4%) |
| 50 to 54 Years | 78 (7.7%) | 66 (6.1%) |
| 55 to 59 Years | 57 (5.7%) | 67 (6.2%) |
| 60 to 64 Years | 66 (6.5%) | 62 (5.8%) |
| 65 to 69 Years | 47 (4.7%) | 57 (5.3%) |
| 70 to 74 Years | 23 (2.3%) | 48 (4.4%) |
| 75 to 79 Years | 37 (3.7%) | 100 (9.3%) |
| 80 to 84 Years | 0 (0.0%) | 6 (0.6%) |
| 85 Years and over | 0 (0.0%) | 35 (3.3%) |
| Total | 1,009 (100.0%) | 1,078 (100.0%) |
Families and Households in Hanson
Median Family Size in Hanson
The median family size in Hanson is 3.49 persons per family, with married-couple families (450 | 85.6%) accounting for the largest median family size of 3.63 persons per family. On the other hand, single female/mother families (61 | 11.6%) represent the smallest median family size with 2.57 persons per family.
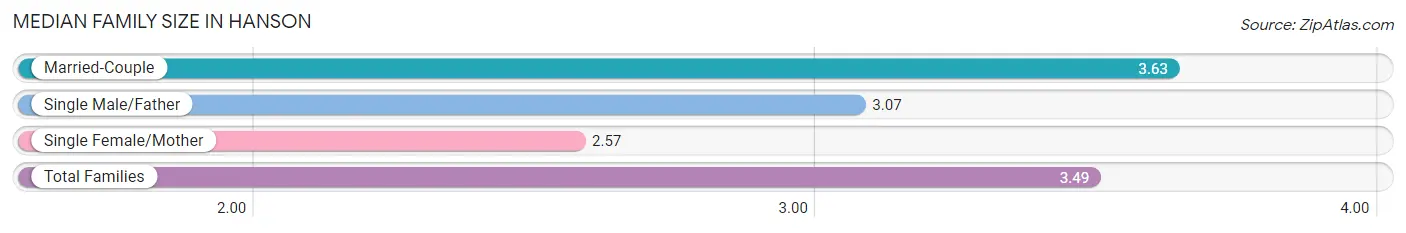
| Family Type | # Families | Family Size |
| Married-Couple | 450 (85.6%) | 3.63 |
| Single Male/Father | 15 (2.9%) | 3.07 |
| Single Female/Mother | 61 (11.6%) | 2.57 |
| Total Families | 526 (100.0%) | 3.49 |
Median Household Size in Hanson
The median household size in Hanson is 2.97 persons per household, with married-couple households (450 | 64.0%) accounting for the largest median household size of 3.74 persons per household. non-family households (177 | 25.2%) represent the smallest median household size with 1.05 persons per household.
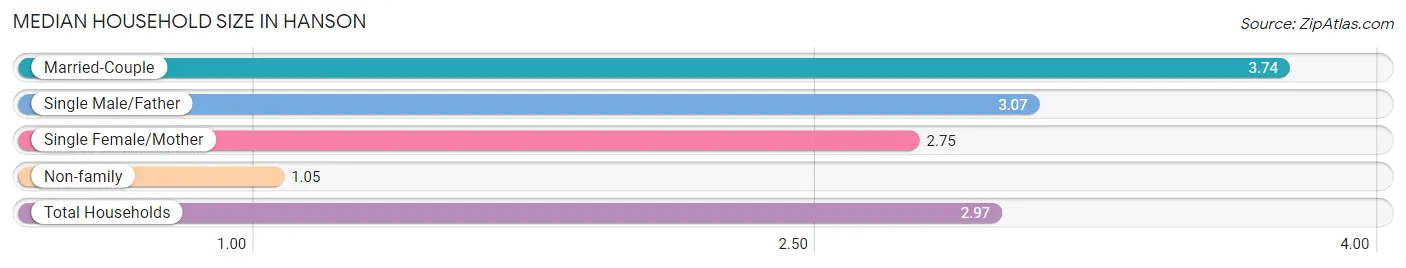
| Household Type | # Households | Household Size |
| Married-Couple | 450 (64.0%) | 3.74 |
| Single Male/Father | 15 (2.1%) | 3.07 |
| Single Female/Mother | 61 (8.7%) | 2.75 |
| Non-family | 177 (25.2%) | 1.05 |
| Total Households | 703 (100.0%) | 2.97 |
Household Size by Marriage Status in Hanson
Out of a total of 703 households in Hanson, 526 (74.8%) are family households, while 177 (25.2%) are nonfamily households. The most numerous type of family households are 3-person households, comprising 174, and the most common type of nonfamily households are 1-person households, comprising 166.
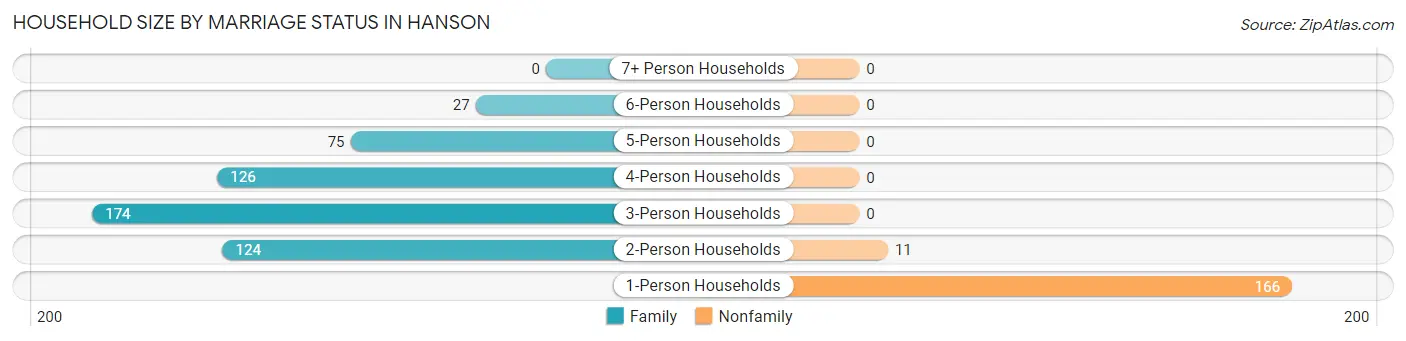
| Household Size | Family Households | Nonfamily Households |
| 1-Person Households | - | 166 (23.6%) |
| 2-Person Households | 124 (17.6%) | 11 (1.6%) |
| 3-Person Households | 174 (24.7%) | 0 (0.0%) |
| 4-Person Households | 126 (17.9%) | 0 (0.0%) |
| 5-Person Households | 75 (10.7%) | 0 (0.0%) |
| 6-Person Households | 27 (3.8%) | 0 (0.0%) |
| 7+ Person Households | 0 (0.0%) | 0 (0.0%) |
| Total | 526 (74.8%) | 177 (25.2%) |
Female Fertility in Hanson
Fertility by Age in Hanson
Average fertility rate in Hanson is 50.0 births per 1,000 women. Women in the age bracket of 20 to 34 years have the highest fertility rate with 127.0 births per 1,000 women. Women in the age bracket of 20 to 34 years acount for 100.0% of all women with births.
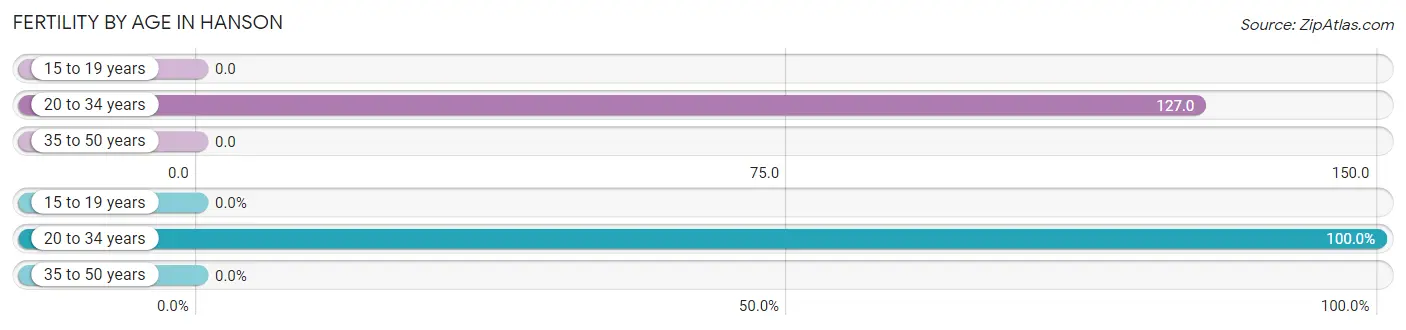
| Age Bracket | Women with Births | Births / 1,000 Women |
| 15 to 19 years | 0 (0.0%) | 0.0 |
| 20 to 34 years | 20 (100.0%) | 127.0 |
| 35 to 50 years | 0 (0.0%) | 0.0 |
| Total | 20 (100.0%) | 50.0 |
Fertility by Age by Marriage Status in Hanson
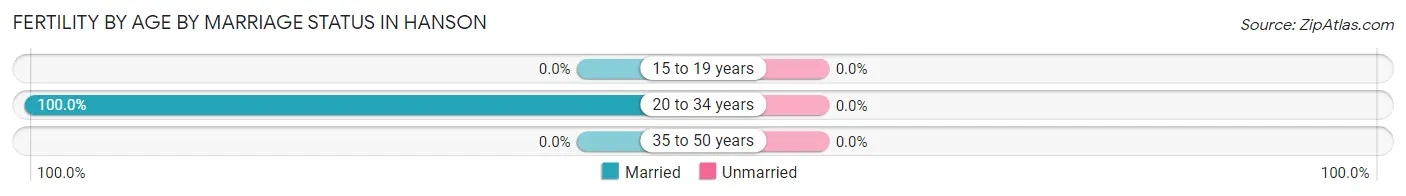
| Age Bracket | Married | Unmarried |
| 15 to 19 years | 0 (0.0%) | 0 (0.0%) |
| 20 to 34 years | 20 (100.0%) | 0 (0.0%) |
| 35 to 50 years | 0 (0.0%) | 0 (0.0%) |
| Total | 20 (100.0%) | 0 (0.0%) |
Fertility by Education in Hanson
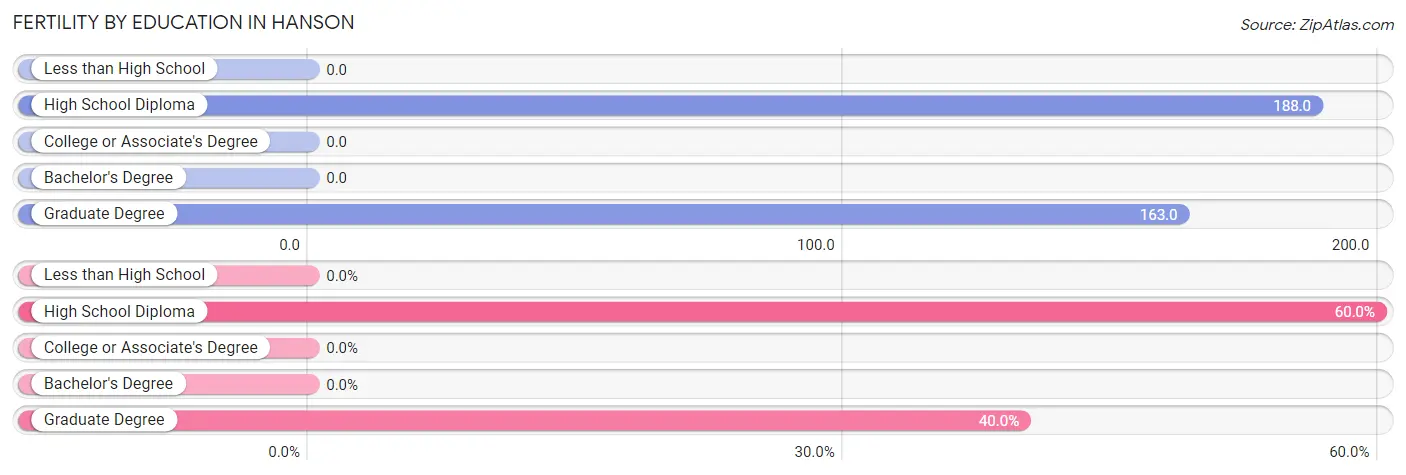
| Educational Attainment | Women with Births | Births / 1,000 Women |
| Less than High School | 0 (0.0%) | 0.0 |
| High School Diploma | 12 (60.0%) | 188.0 |
| College or Associate's Degree | 0 (0.0%) | 0.0 |
| Bachelor's Degree | 0 (0.0%) | 0.0 |
| Graduate Degree | 8 (40.0%) | 163.0 |
| Total | 20 (100.0%) | 50.0 |
Fertility by Education by Marriage Status in Hanson
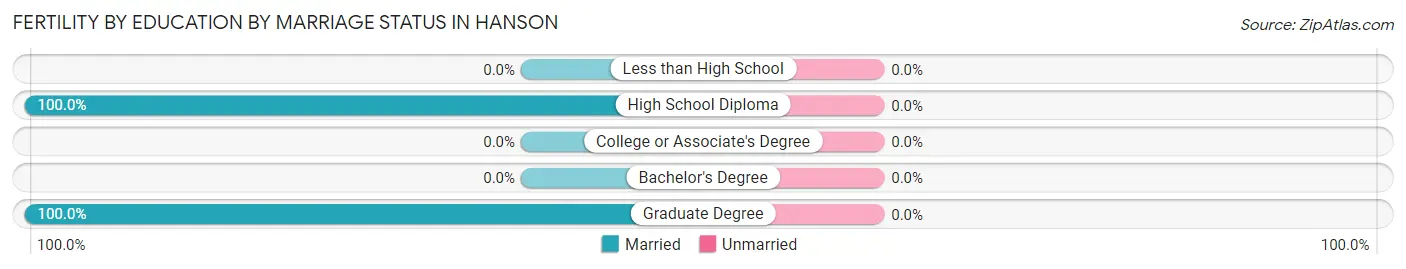
| Educational Attainment | Married | Unmarried |
| Less than High School | 0 (0.0%) | 0 (0.0%) |
| High School Diploma | 12 (100.0%) | 0 (0.0%) |
| College or Associate's Degree | 0 (0.0%) | 0 (0.0%) |
| Bachelor's Degree | 0 (0.0%) | 0 (0.0%) |
| Graduate Degree | 8 (100.0%) | 0 (0.0%) |
| Total | 20 (100.0%) | 0 (0.0%) |
Employment Characteristics in Hanson
Employment by Class of Employer in Hanson
Among the 1,002 employed individuals in Hanson, private company employees (660 | 65.9%), local government employees (191 | 19.1%), and not-for-profit organizations (103 | 10.3%) make up the most common classes of employment.
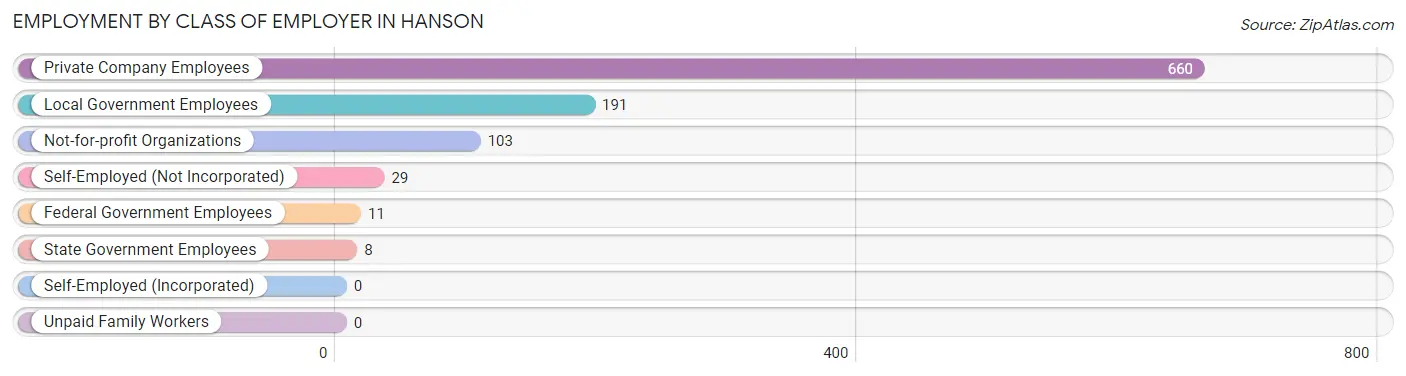
| Employer Class | # Employees | % Employees |
| Private Company Employees | 660 | 65.9% |
| Self-Employed (Incorporated) | 0 | 0.0% |
| Self-Employed (Not Incorporated) | 29 | 2.9% |
| Not-for-profit Organizations | 103 | 10.3% |
| Local Government Employees | 191 | 19.1% |
| State Government Employees | 8 | 0.8% |
| Federal Government Employees | 11 | 1.1% |
| Unpaid Family Workers | 0 | 0.0% |
| Total | 1,002 | 100.0% |
Employment Status by Age in Hanson
According to the labor force statistics for Hanson, out of the total population over 16 years of age (1,578), 67.4% or 1,064 individuals are in the labor force, with 5.8% or 62 of them unemployed. The age group with the highest labor force participation rate is 45 to 54 years, with 92.6% or 250 individuals in the labor force. Within the labor force, the 25 to 29 years age range has the highest percentage of unemployed individuals, with 51.0% or 25 of them being unemployed.
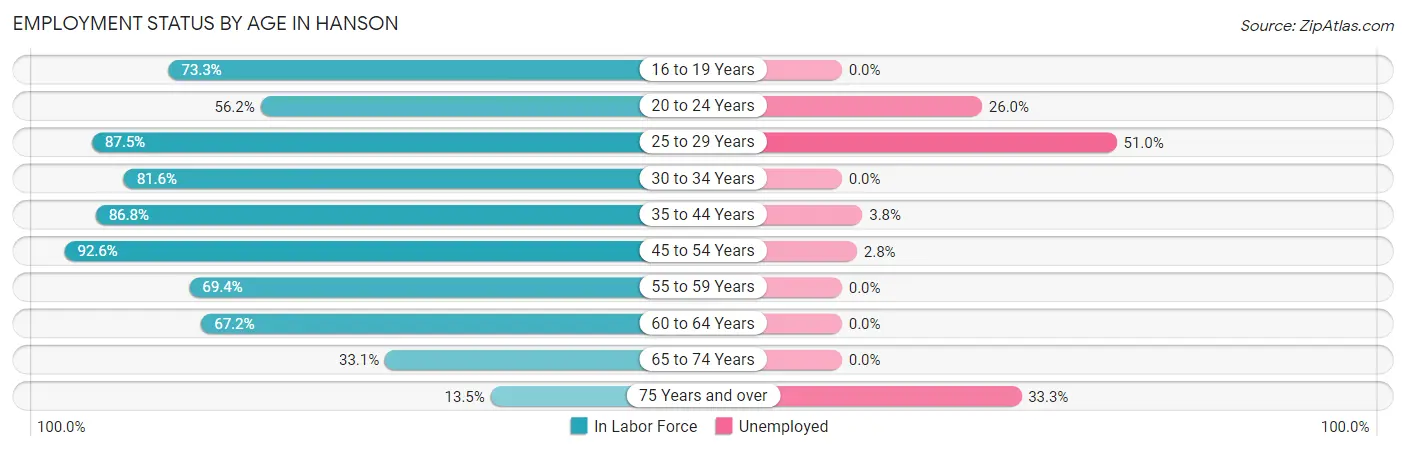
| Age Bracket | In Labor Force | Unemployed |
| 16 to 19 Years | 74 (73.3%) | 0 (0.0%) |
| 20 to 24 Years | 50 (56.2%) | 13 (26.0%) |
| 25 to 29 Years | 49 (87.5%) | 25 (51.0%) |
| 30 to 34 Years | 151 (81.6%) | 0 (0.0%) |
| 35 to 44 Years | 236 (86.8%) | 9 (3.8%) |
| 45 to 54 Years | 250 (92.6%) | 7 (2.8%) |
| 55 to 59 Years | 86 (69.4%) | 0 (0.0%) |
| 60 to 64 Years | 86 (67.2%) | 0 (0.0%) |
| 65 to 74 Years | 58 (33.1%) | 0 (0.0%) |
| 75 Years and over | 24 (13.5%) | 8 (33.3%) |
| Total | 1,064 (67.4%) | 62 (5.8%) |
Employment Status by Educational Attainment in Hanson
According to labor force statistics for Hanson, 82.9% of individuals (858) out of the total population between 25 and 64 years of age (1,035) are in the labor force, with 4.8% or 41 of them being unemployed. The group with the highest labor force participation rate are those with the educational attainment of college / associate degree, with 92.8% or 257 individuals in the labor force. Within the labor force, individuals with bachelor's degree or higher education have the highest percentage of unemployment, with 8.1% or 32 of them being unemployed.
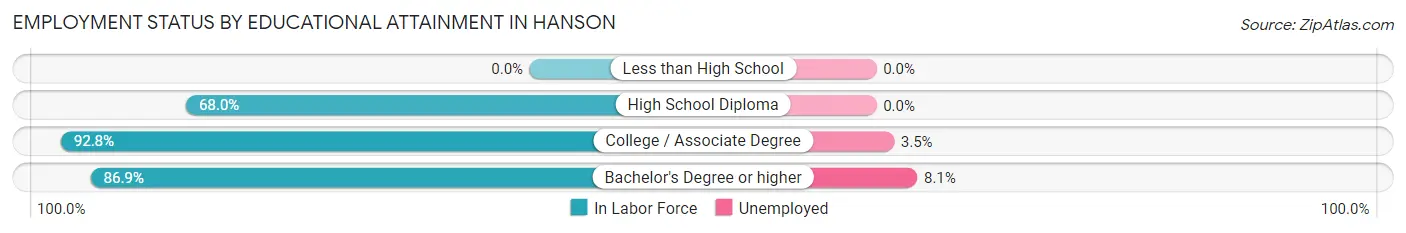
| Educational Attainment | In Labor Force | Unemployed |
| Less than High School | 0 (0.0%) | 0 (0.0%) |
| High School Diploma | 208 (68.0%) | 0 (0.0%) |
| College / Associate Degree | 257 (92.8%) | 10 (3.5%) |
| Bachelor's Degree or higher | 393 (86.9%) | 37 (8.1%) |
| Total | 858 (82.9%) | 50 (4.8%) |
Employment Occupations by Sex in Hanson
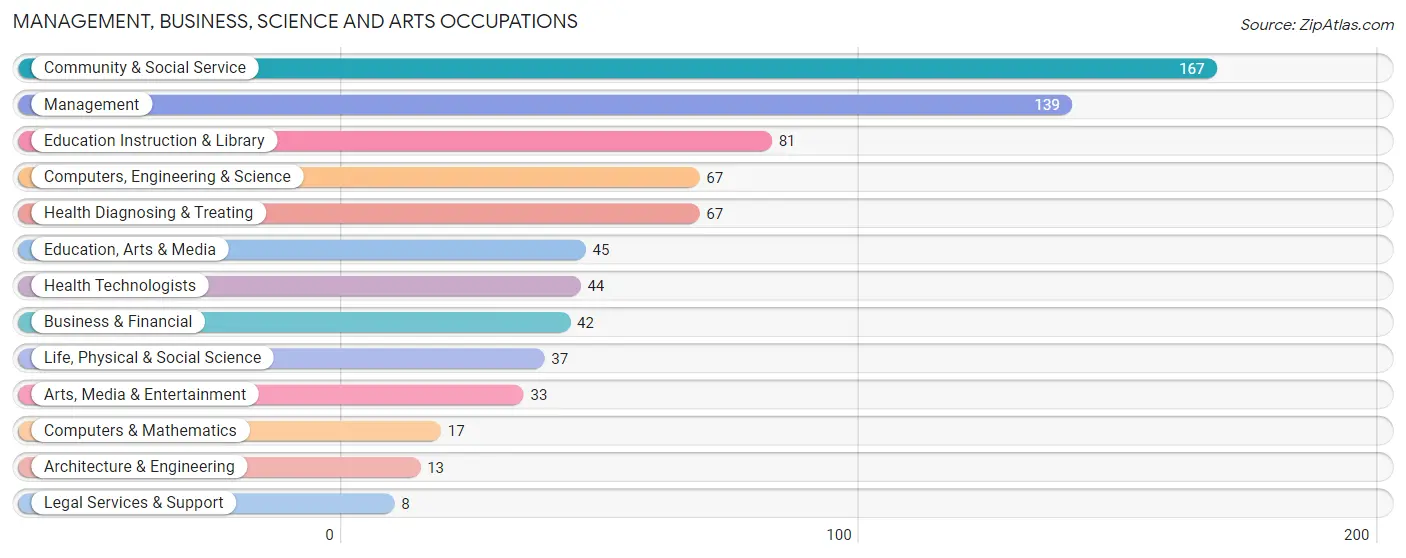
Management, Business, Science and Arts Occupations
The most common Management, Business, Science and Arts occupations in Hanson are Community & Social Service (167 | 16.7%), Management (139 | 13.9%), Education Instruction & Library (81 | 8.1%), Computers, Engineering & Science (67 | 6.7%), and Health Diagnosing & Treating (67 | 6.7%).
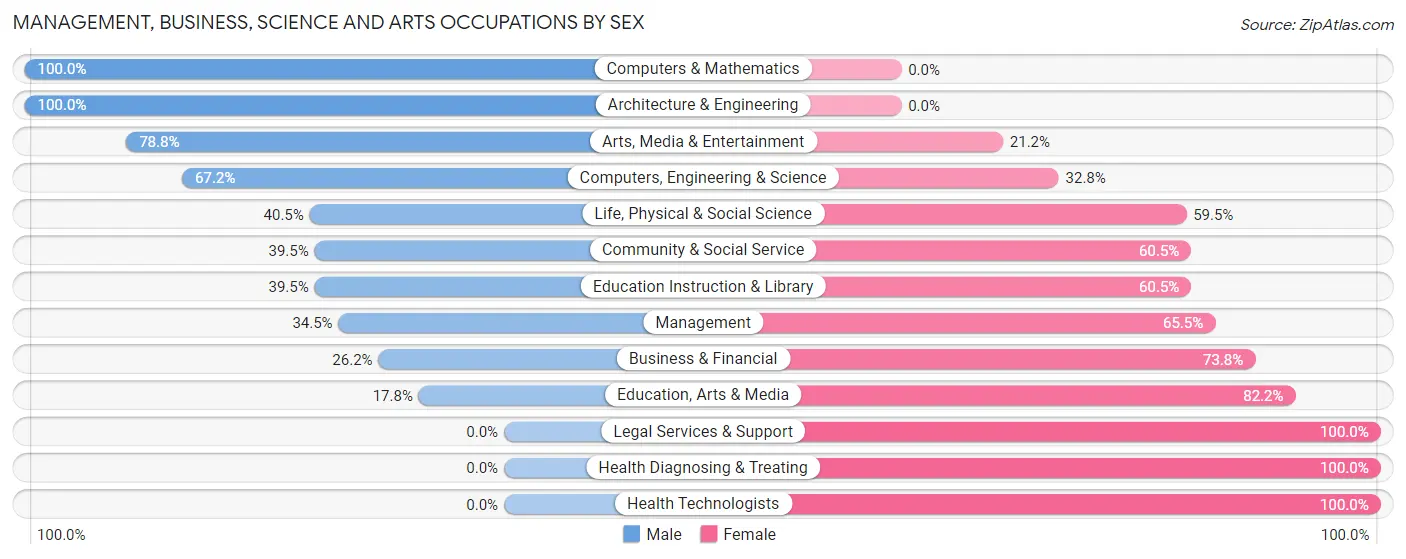
Management, Business, Science and Arts Occupations by Sex
Within the Management, Business, Science and Arts occupations in Hanson, the most male-oriented occupations are Computers & Mathematics (100.0%), Architecture & Engineering (100.0%), and Arts, Media & Entertainment (78.8%), while the most female-oriented occupations are Legal Services & Support (100.0%), Health Diagnosing & Treating (100.0%), and Health Technologists (100.0%).
| Occupation | Male | Female |
| Management | 48 (34.5%) | 91 (65.5%) |
| Business & Financial | 11 (26.2%) | 31 (73.8%) |
| Computers, Engineering & Science | 45 (67.2%) | 22 (32.8%) |
| Computers & Mathematics | 17 (100.0%) | 0 (0.0%) |
| Architecture & Engineering | 13 (100.0%) | 0 (0.0%) |
| Life, Physical & Social Science | 15 (40.5%) | 22 (59.5%) |
| Community & Social Service | 66 (39.5%) | 101 (60.5%) |
| Education, Arts & Media | 8 (17.8%) | 37 (82.2%) |
| Legal Services & Support | 0 (0.0%) | 8 (100.0%) |
| Education Instruction & Library | 32 (39.5%) | 49 (60.5%) |
| Arts, Media & Entertainment | 26 (78.8%) | 7 (21.2%) |
| Health Diagnosing & Treating | 0 (0.0%) | 67 (100.0%) |
| Health Technologists | 0 (0.0%) | 44 (100.0%) |
| Total (Category) | 170 (35.3%) | 312 (64.7%) |
| Total (Overall) | 493 (49.2%) | 509 (50.8%) |
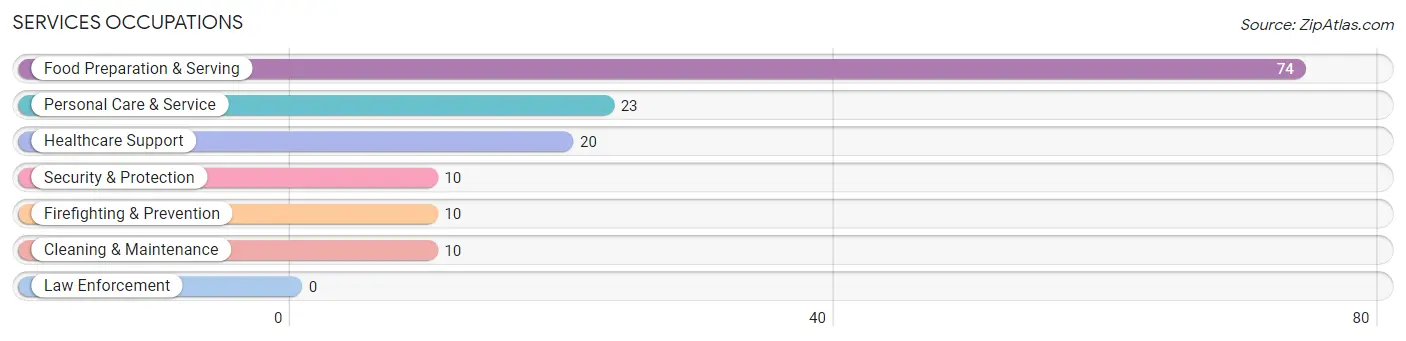
Services Occupations
The most common Services occupations in Hanson are Food Preparation & Serving (74 | 7.4%), Personal Care & Service (23 | 2.3%), Healthcare Support (20 | 2.0%), Security & Protection (10 | 1.0%), and Firefighting & Prevention (10 | 1.0%).
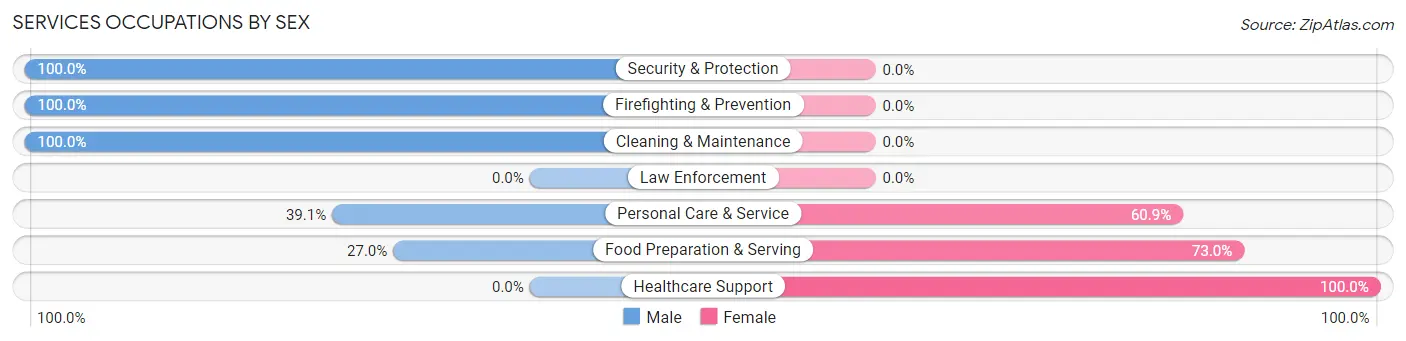
Services Occupations by Sex
Within the Services occupations in Hanson, the most male-oriented occupations are Security & Protection (100.0%), Firefighting & Prevention (100.0%), and Cleaning & Maintenance (100.0%), while the most female-oriented occupations are Healthcare Support (100.0%), Food Preparation & Serving (73.0%), and Personal Care & Service (60.9%).
| Occupation | Male | Female |
| Healthcare Support | 0 (0.0%) | 20 (100.0%) |
| Security & Protection | 10 (100.0%) | 0 (0.0%) |
| Firefighting & Prevention | 10 (100.0%) | 0 (0.0%) |
| Law Enforcement | 0 (0.0%) | 0 (0.0%) |
| Food Preparation & Serving | 20 (27.0%) | 54 (73.0%) |
| Cleaning & Maintenance | 10 (100.0%) | 0 (0.0%) |
| Personal Care & Service | 9 (39.1%) | 14 (60.9%) |
| Total (Category) | 49 (35.8%) | 88 (64.2%) |
| Total (Overall) | 493 (49.2%) | 509 (50.8%) |
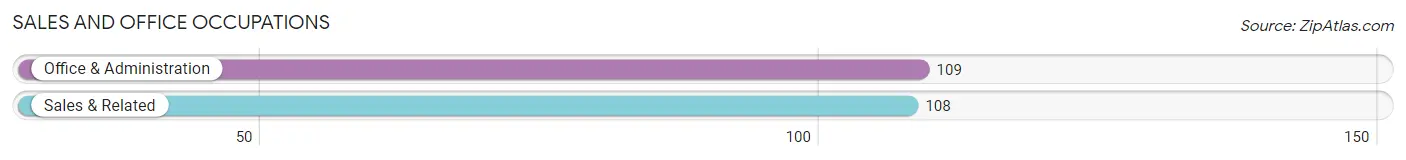
Sales and Office Occupations
The most common Sales and Office occupations in Hanson are Office & Administration (109 | 10.9%), and Sales & Related (108 | 10.8%).
Sales and Office Occupations by Sex
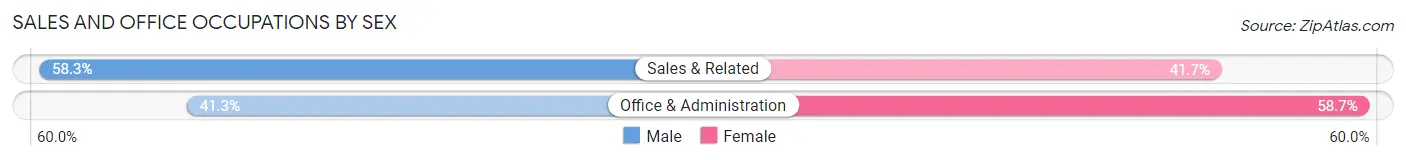
| Occupation | Male | Female |
| Sales & Related | 63 (58.3%) | 45 (41.7%) |
| Office & Administration | 45 (41.3%) | 64 (58.7%) |
| Total (Category) | 108 (49.8%) | 109 (50.2%) |
| Total (Overall) | 493 (49.2%) | 509 (50.8%) |
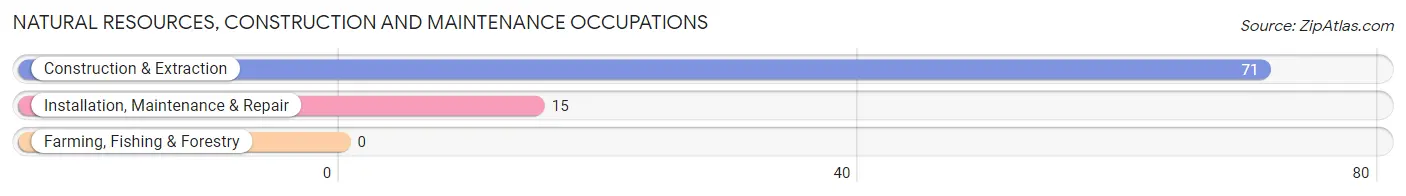
Natural Resources, Construction and Maintenance Occupations
The most common Natural Resources, Construction and Maintenance occupations in Hanson are Construction & Extraction (71 | 7.1%), and Installation, Maintenance & Repair (15 | 1.5%).
Natural Resources, Construction and Maintenance Occupations by Sex
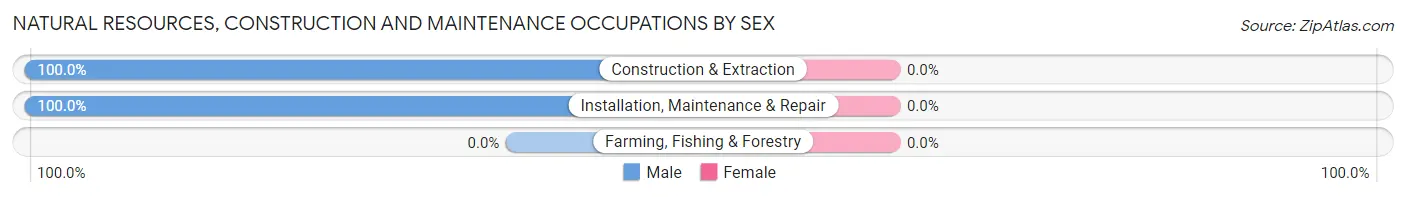
| Occupation | Male | Female |
| Farming, Fishing & Forestry | 0 (0.0%) | 0 (0.0%) |
| Construction & Extraction | 71 (100.0%) | 0 (0.0%) |
| Installation, Maintenance & Repair | 15 (100.0%) | 0 (0.0%) |
| Total (Category) | 86 (100.0%) | 0 (0.0%) |
| Total (Overall) | 493 (49.2%) | 509 (50.8%) |
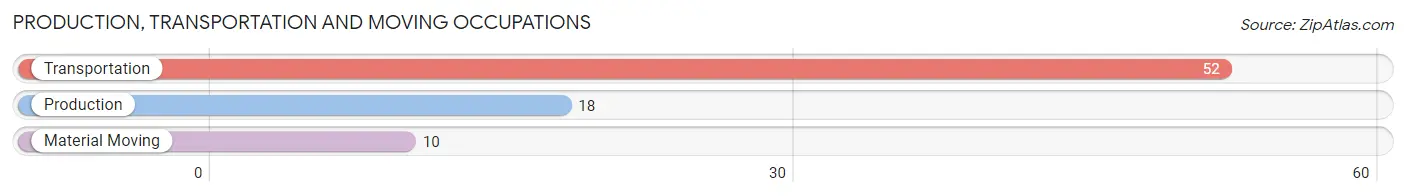
Production, Transportation and Moving Occupations
The most common Production, Transportation and Moving occupations in Hanson are Transportation (52 | 5.2%), Production (18 | 1.8%), and Material Moving (10 | 1.0%).
Production, Transportation and Moving Occupations by Sex
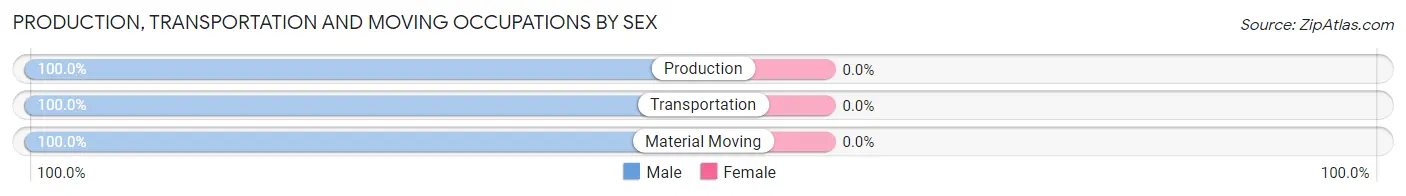
| Occupation | Male | Female |
| Production | 18 (100.0%) | 0 (0.0%) |
| Transportation | 52 (100.0%) | 0 (0.0%) |
| Material Moving | 10 (100.0%) | 0 (0.0%) |
| Total (Category) | 80 (100.0%) | 0 (0.0%) |
| Total (Overall) | 493 (49.2%) | 509 (50.8%) |
Employment Industries by Sex in Hanson
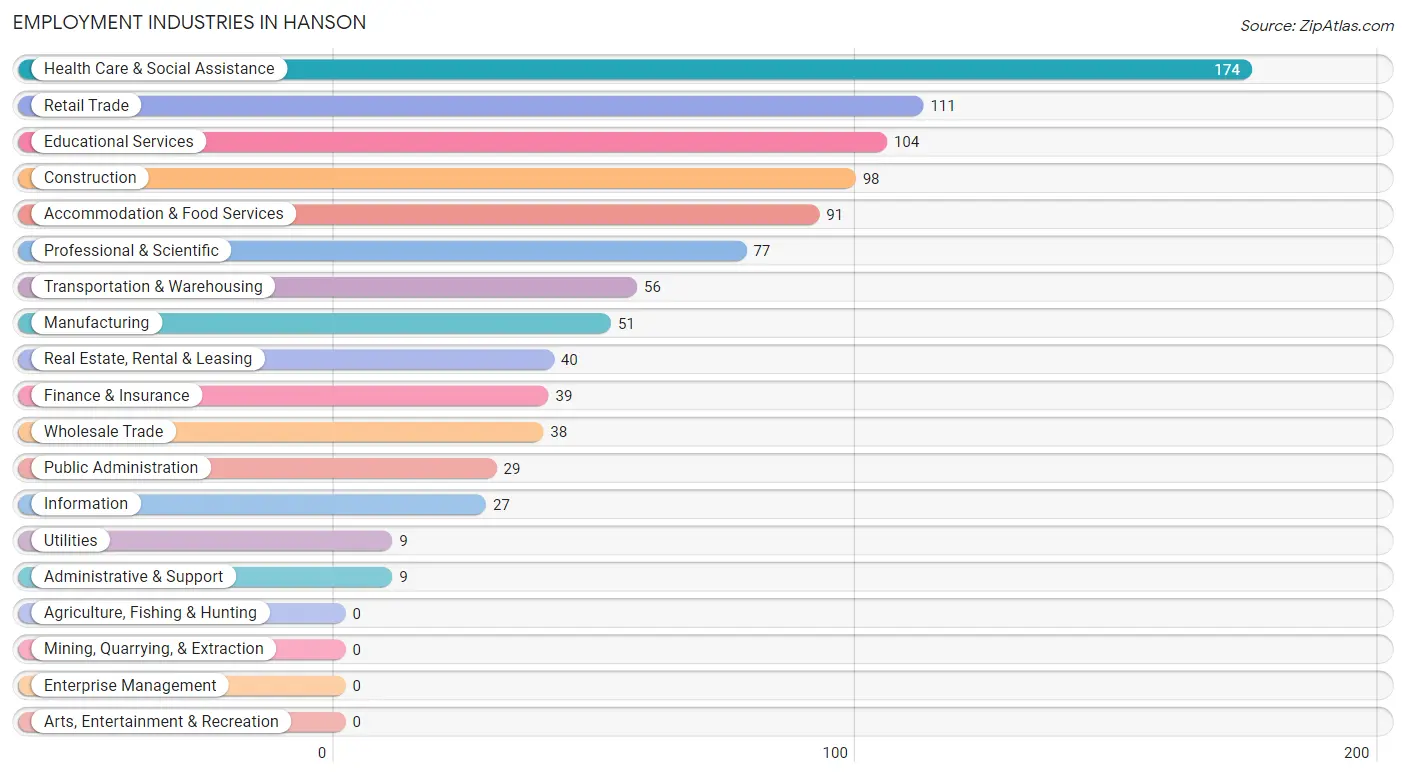
Employment Industries in Hanson
The major employment industries in Hanson include Health Care & Social Assistance (174 | 17.4%), Retail Trade (111 | 11.1%), Educational Services (104 | 10.4%), Construction (98 | 9.8%), and Accommodation & Food Services (91 | 9.1%).
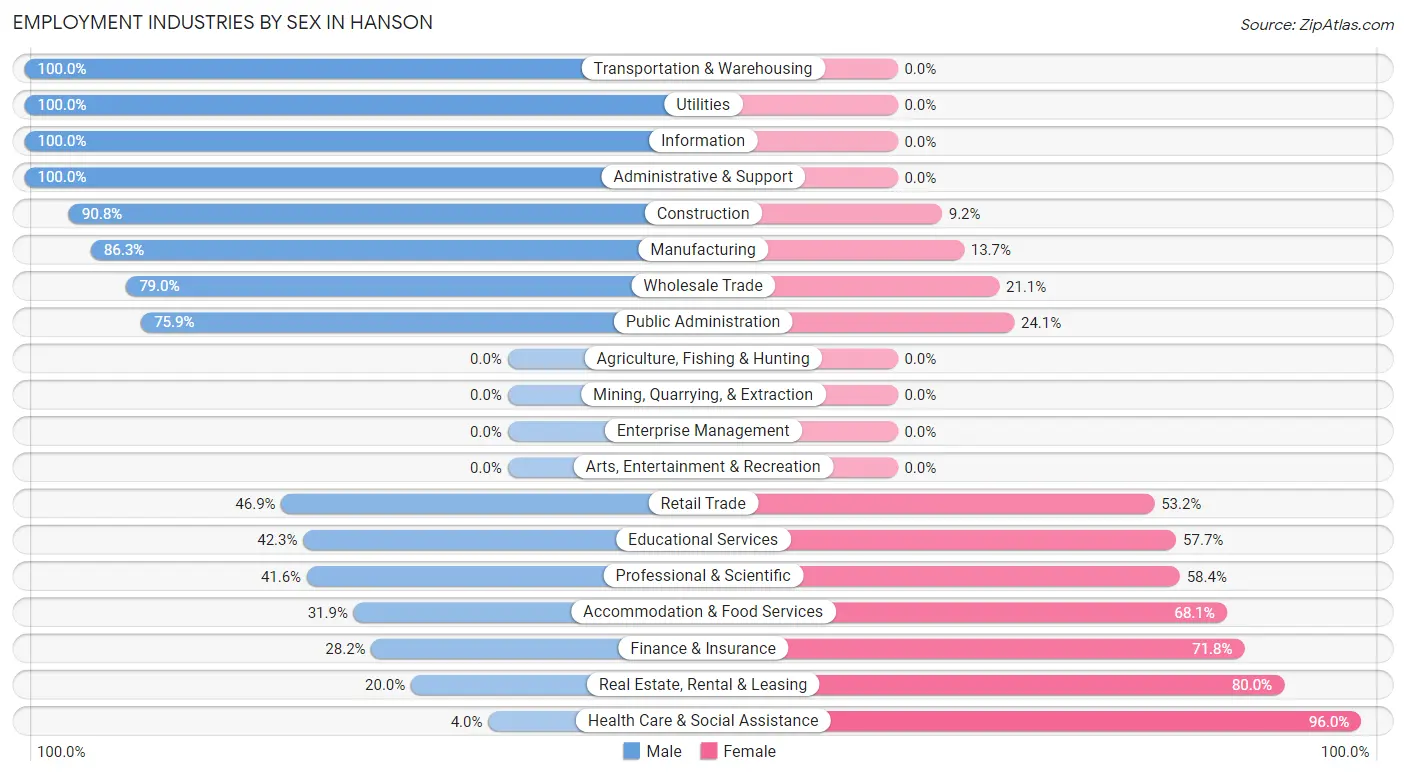
Employment Industries by Sex in Hanson
The Hanson industries that see more men than women are Transportation & Warehousing (100.0%), Utilities (100.0%), and Information (100.0%), whereas the industries that tend to have a higher number of women are Health Care & Social Assistance (96.0%), Real Estate, Rental & Leasing (80.0%), and Finance & Insurance (71.8%).
| Industry | Male | Female |
| Agriculture, Fishing & Hunting | 0 (0.0%) | 0 (0.0%) |
| Mining, Quarrying, & Extraction | 0 (0.0%) | 0 (0.0%) |
| Construction | 89 (90.8%) | 9 (9.2%) |
| Manufacturing | 44 (86.3%) | 7 (13.7%) |
| Wholesale Trade | 30 (78.9%) | 8 (21.0%) |
| Retail Trade | 52 (46.9%) | 59 (53.1%) |
| Transportation & Warehousing | 56 (100.0%) | 0 (0.0%) |
| Utilities | 9 (100.0%) | 0 (0.0%) |
| Information | 27 (100.0%) | 0 (0.0%) |
| Finance & Insurance | 11 (28.2%) | 28 (71.8%) |
| Real Estate, Rental & Leasing | 8 (20.0%) | 32 (80.0%) |
| Professional & Scientific | 32 (41.6%) | 45 (58.4%) |
| Enterprise Management | 0 (0.0%) | 0 (0.0%) |
| Administrative & Support | 9 (100.0%) | 0 (0.0%) |
| Educational Services | 44 (42.3%) | 60 (57.7%) |
| Health Care & Social Assistance | 7 (4.0%) | 167 (96.0%) |
| Arts, Entertainment & Recreation | 0 (0.0%) | 0 (0.0%) |
| Accommodation & Food Services | 29 (31.9%) | 62 (68.1%) |
| Public Administration | 22 (75.9%) | 7 (24.1%) |
| Total | 493 (49.2%) | 509 (50.8%) |
Education in Hanson
School Enrollment in Hanson
The most common levels of schooling among the 516 students in Hanson are elementary school (188 | 36.4%), middle school (99 | 19.2%), and high school (55 | 10.7%).
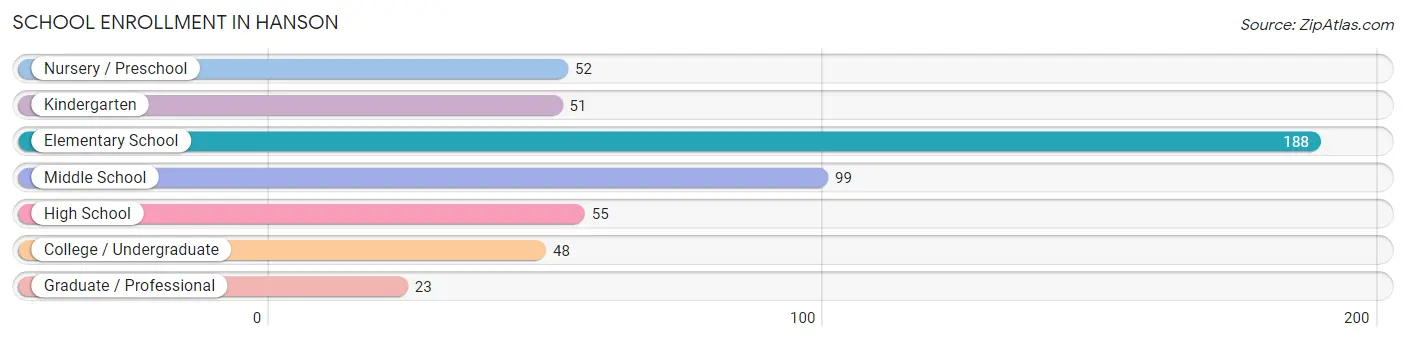
| School Level | # Students | % Students |
| Nursery / Preschool | 52 | 10.1% |
| Kindergarten | 51 | 9.9% |
| Elementary School | 188 | 36.4% |
| Middle School | 99 | 19.2% |
| High School | 55 | 10.7% |
| College / Undergraduate | 48 | 9.3% |
| Graduate / Professional | 23 | 4.5% |
| Total | 516 | 100.0% |
School Enrollment by Age by Funding Source in Hanson
Out of a total of 516 students who are enrolled in schools in Hanson, 52 (10.1%) attend a private institution, while the remaining 464 (89.9%) are enrolled in public schools. The age group of 25 to 34 year olds has the highest likelihood of being enrolled in private schools, with 9 (64.3% in the age bracket) enrolled. Conversely, the age group of 3 to 4 year olds has the lowest likelihood of being enrolled in a private school, with 19 (100.0% in the age bracket) attending a public institution.
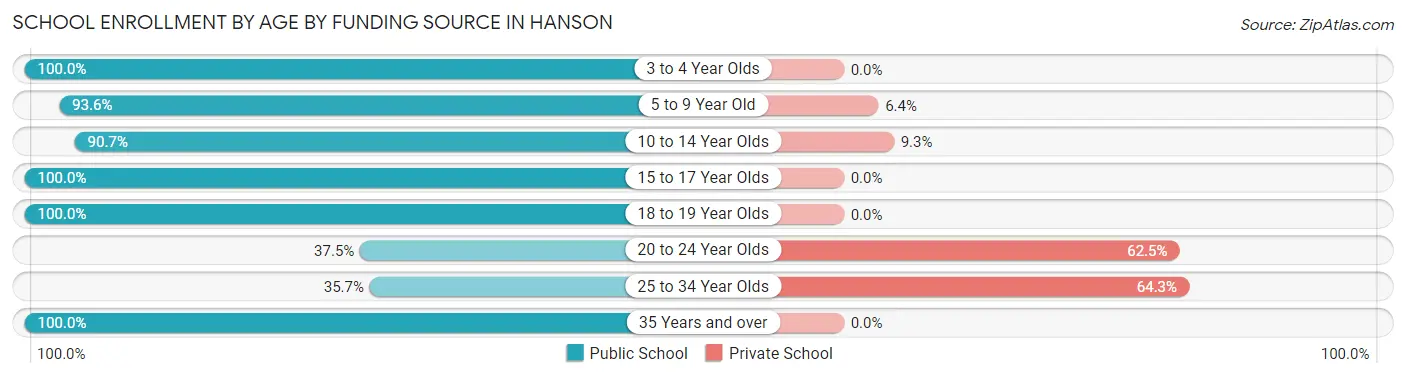
| Age Bracket | Public School | Private School |
| 3 to 4 Year Olds | 19 (100.0%) | 0 (0.0%) |
| 5 to 9 Year Old | 247 (93.6%) | 17 (6.4%) |
| 10 to 14 Year Olds | 107 (90.7%) | 11 (9.3%) |
| 15 to 17 Year Olds | 44 (100.0%) | 0 (0.0%) |
| 18 to 19 Year Olds | 15 (100.0%) | 0 (0.0%) |
| 20 to 24 Year Olds | 9 (37.5%) | 15 (62.5%) |
| 25 to 34 Year Olds | 5 (35.7%) | 9 (64.3%) |
| 35 Years and over | 18 (100.0%) | 0 (0.0%) |
| Total | 464 (89.9%) | 52 (10.1%) |
Educational Attainment by Field of Study in Hanson
Education (98 | 17.0%), science & technology (90 | 15.6%), business (78 | 13.5%), psychology (63 | 10.9%), and literature & languages (52 | 9.0%) are the most common fields of study among 577 individuals in Hanson who have obtained a bachelor's degree or higher.
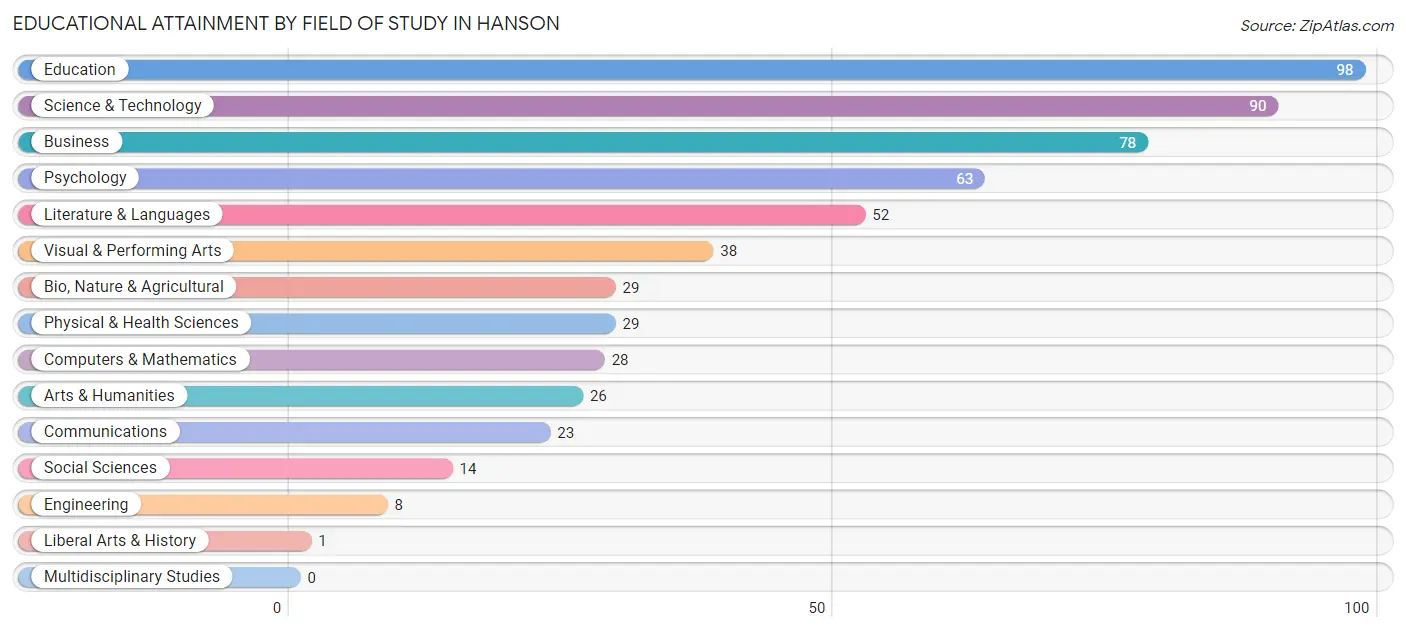
| Field of Study | # Graduates | % Graduates |
| Computers & Mathematics | 28 | 4.9% |
| Bio, Nature & Agricultural | 29 | 5.0% |
| Physical & Health Sciences | 29 | 5.0% |
| Psychology | 63 | 10.9% |
| Social Sciences | 14 | 2.4% |
| Engineering | 8 | 1.4% |
| Multidisciplinary Studies | 0 | 0.0% |
| Science & Technology | 90 | 15.6% |
| Business | 78 | 13.5% |
| Education | 98 | 17.0% |
| Literature & Languages | 52 | 9.0% |
| Liberal Arts & History | 1 | 0.2% |
| Visual & Performing Arts | 38 | 6.6% |
| Communications | 23 | 4.0% |
| Arts & Humanities | 26 | 4.5% |
| Total | 577 | 100.0% |
Transportation & Commute in Hanson
Vehicle Availability by Sex in Hanson
The most prevalent vehicle ownership categories in Hanson are males with 2 vehicles (257, accounting for 52.3%) and females with 2 vehicles (198, making up 50.5%).
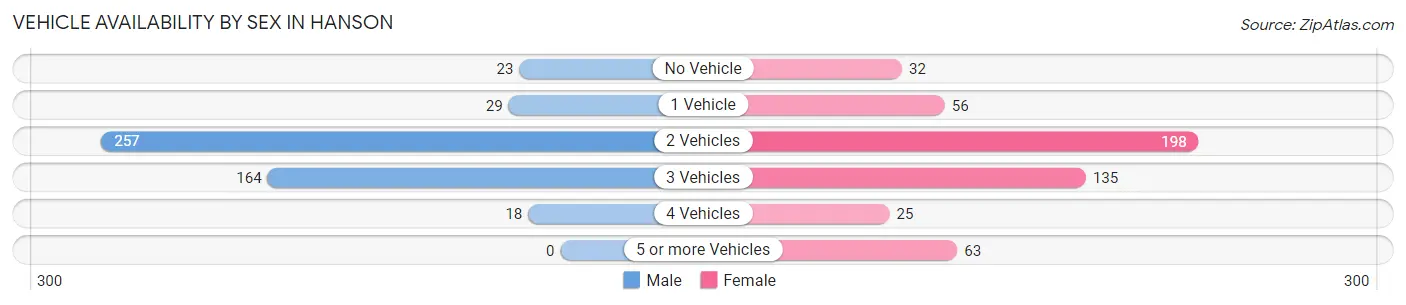
| Vehicles Available | Male | Female |
| No Vehicle | 23 (4.7%) | 32 (6.3%) |
| 1 Vehicle | 29 (5.9%) | 56 (11.0%) |
| 2 Vehicles | 257 (52.3%) | 198 (38.9%) |
| 3 Vehicles | 164 (33.4%) | 135 (26.5%) |
| 4 Vehicles | 18 (3.7%) | 25 (4.9%) |
| 5 or more Vehicles | 0 (0.0%) | 63 (12.4%) |
| Total | 491 (100.0%) | 509 (100.0%) |
Commute Time in Hanson
The most frequently occuring commute durations in Hanson are 30 to 34 minutes (184 commuters, 19.9%), 15 to 19 minutes (153 commuters, 16.5%), and 60 to 89 minutes (116 commuters, 12.5%).
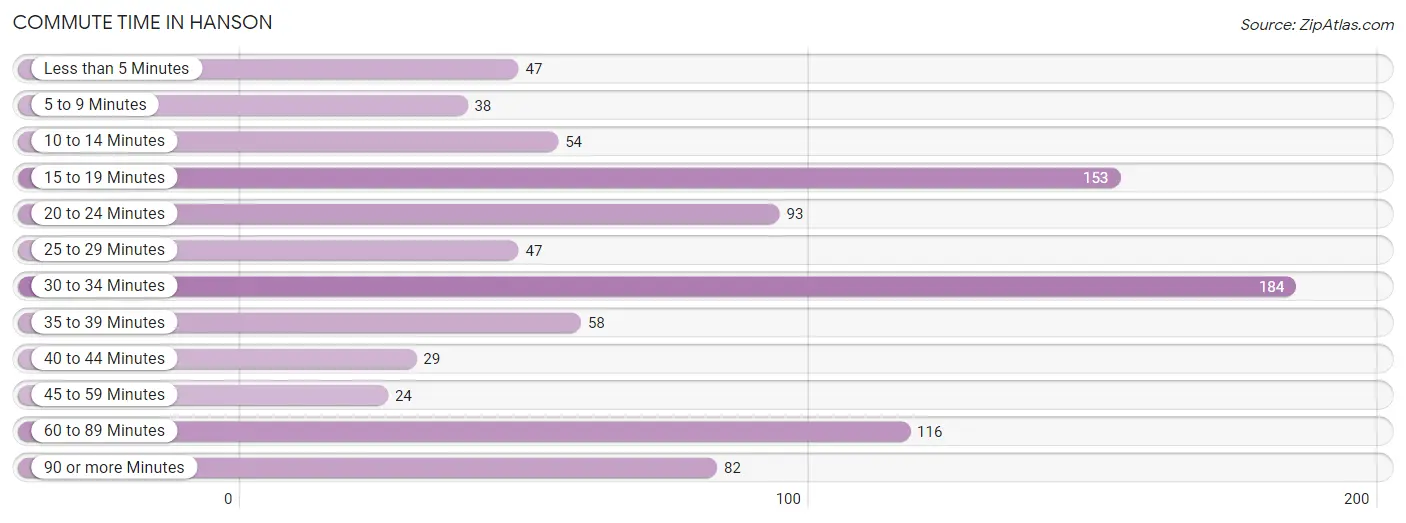
| Commute Time | # Commuters | % Commuters |
| Less than 5 Minutes | 47 | 5.1% |
| 5 to 9 Minutes | 38 | 4.1% |
| 10 to 14 Minutes | 54 | 5.8% |
| 15 to 19 Minutes | 153 | 16.5% |
| 20 to 24 Minutes | 93 | 10.1% |
| 25 to 29 Minutes | 47 | 5.1% |
| 30 to 34 Minutes | 184 | 19.9% |
| 35 to 39 Minutes | 58 | 6.3% |
| 40 to 44 Minutes | 29 | 3.1% |
| 45 to 59 Minutes | 24 | 2.6% |
| 60 to 89 Minutes | 116 | 12.5% |
| 90 or more Minutes | 82 | 8.9% |
Commute Time by Sex in Hanson
The most common commute times in Hanson are 15 to 19 minutes (122 commuters, 26.7%) for males and 30 to 34 minutes (120 commuters, 25.6%) for females.
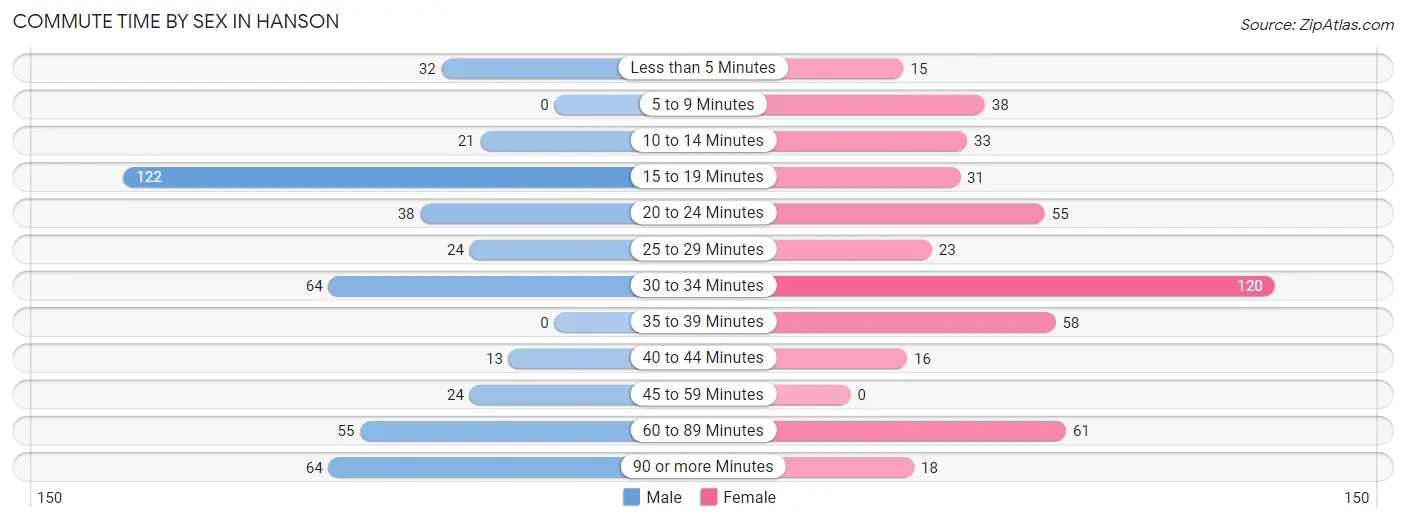
| Commute Time | Male | Female |
| Less than 5 Minutes | 32 (7.0%) | 15 (3.2%) |
| 5 to 9 Minutes | 0 (0.0%) | 38 (8.1%) |
| 10 to 14 Minutes | 21 (4.6%) | 33 (7.0%) |
| 15 to 19 Minutes | 122 (26.7%) | 31 (6.6%) |
| 20 to 24 Minutes | 38 (8.3%) | 55 (11.7%) |
| 25 to 29 Minutes | 24 (5.2%) | 23 (4.9%) |
| 30 to 34 Minutes | 64 (14.0%) | 120 (25.6%) |
| 35 to 39 Minutes | 0 (0.0%) | 58 (12.4%) |
| 40 to 44 Minutes | 13 (2.8%) | 16 (3.4%) |
| 45 to 59 Minutes | 24 (5.2%) | 0 (0.0%) |
| 60 to 89 Minutes | 55 (12.0%) | 61 (13.0%) |
| 90 or more Minutes | 64 (14.0%) | 18 (3.8%) |
Time of Departure to Work by Sex in Hanson
The most frequent times of departure to work in Hanson are 7:00 AM to 7:29 AM (86, 18.8%) for males and 4:00 PM to 11:59 PM (98, 20.9%) for females.
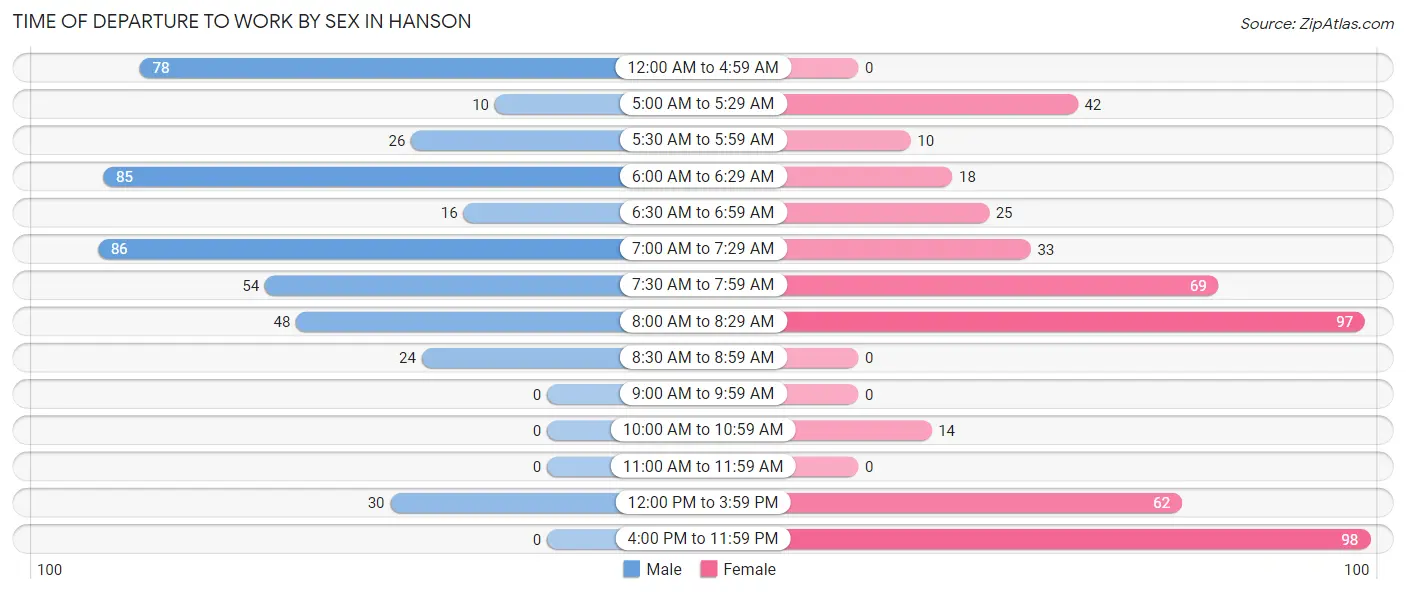
| Time of Departure | Male | Female |
| 12:00 AM to 4:59 AM | 78 (17.1%) | 0 (0.0%) |
| 5:00 AM to 5:29 AM | 10 (2.2%) | 42 (9.0%) |
| 5:30 AM to 5:59 AM | 26 (5.7%) | 10 (2.1%) |
| 6:00 AM to 6:29 AM | 85 (18.6%) | 18 (3.8%) |
| 6:30 AM to 6:59 AM | 16 (3.5%) | 25 (5.3%) |
| 7:00 AM to 7:29 AM | 86 (18.8%) | 33 (7.0%) |
| 7:30 AM to 7:59 AM | 54 (11.8%) | 69 (14.7%) |
| 8:00 AM to 8:29 AM | 48 (10.5%) | 97 (20.7%) |
| 8:30 AM to 8:59 AM | 24 (5.2%) | 0 (0.0%) |
| 9:00 AM to 9:59 AM | 0 (0.0%) | 0 (0.0%) |
| 10:00 AM to 10:59 AM | 0 (0.0%) | 14 (3.0%) |
| 11:00 AM to 11:59 AM | 0 (0.0%) | 0 (0.0%) |
| 12:00 PM to 3:59 PM | 30 (6.6%) | 62 (13.3%) |
| 4:00 PM to 11:59 PM | 0 (0.0%) | 98 (20.9%) |
| Total | 457 (100.0%) | 468 (100.0%) |
Housing Occupancy in Hanson
Occupancy by Ownership in Hanson
Of the total 703 dwellings in Hanson, owner-occupied units account for 703 (100.0%), while renter-occupied units make up 0 (0.0%).
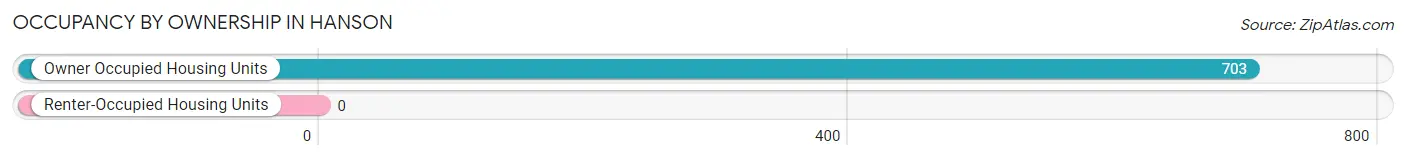
| Occupancy | # Housing Units | % Housing Units |
| Owner Occupied Housing Units | 703 | 100.0% |
| Renter-Occupied Housing Units | 0 | 0.0% |
| Total Occupied Housing Units | 703 | 100.0% |
Occupancy by Household Size in Hanson
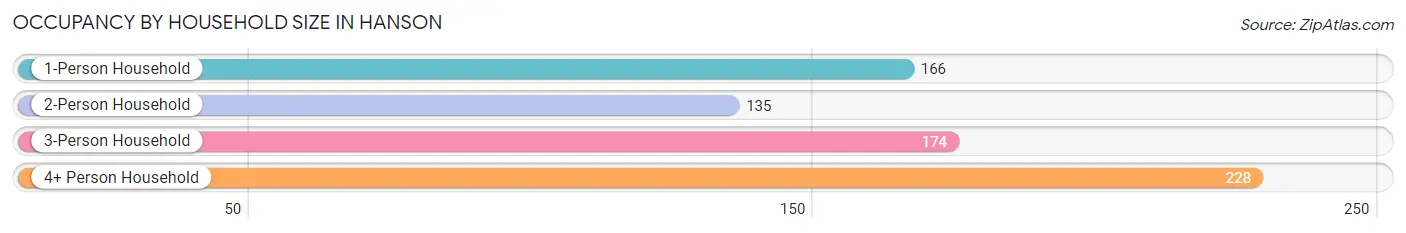
| Household Size | # Housing Units | % Housing Units |
| 1-Person Household | 166 | 23.6% |
| 2-Person Household | 135 | 19.2% |
| 3-Person Household | 174 | 24.7% |
| 4+ Person Household | 228 | 32.4% |
| Total Housing Units | 703 | 100.0% |
Occupancy by Ownership by Household Size in Hanson
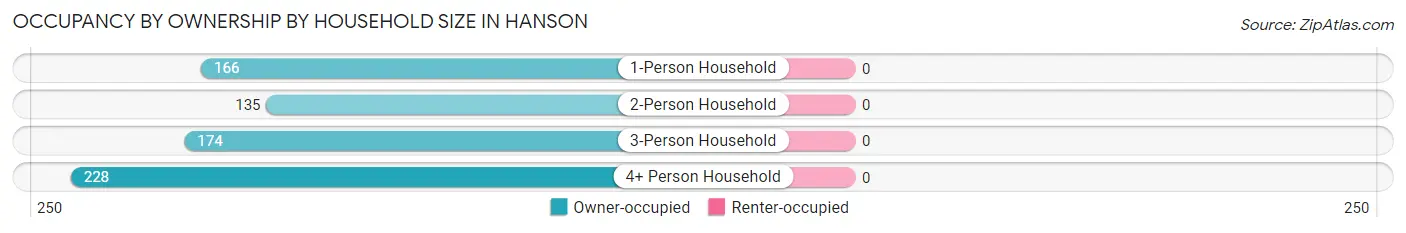
| Household Size | Owner-occupied | Renter-occupied |
| 1-Person Household | 166 (100.0%) | 0 (0.0%) |
| 2-Person Household | 135 (100.0%) | 0 (0.0%) |
| 3-Person Household | 174 (100.0%) | 0 (0.0%) |
| 4+ Person Household | 228 (100.0%) | 0 (0.0%) |
| Total Housing Units | 703 (100.0%) | 0 (0.0%) |
Occupancy by Educational Attainment in Hanson
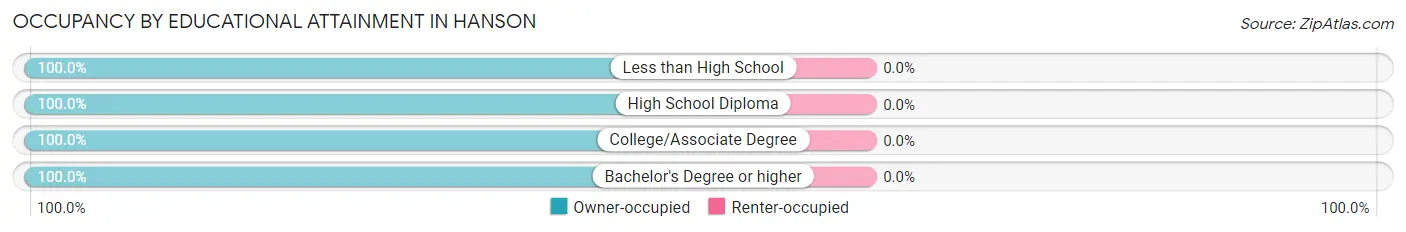
| Household Size | Owner-occupied | Renter-occupied |
| Less than High School | 46 (100.0%) | 0 (0.0%) |
| High School Diploma | 207 (100.0%) | 0 (0.0%) |
| College/Associate Degree | 143 (100.0%) | 0 (0.0%) |
| Bachelor's Degree or higher | 307 (100.0%) | 0 (0.0%) |
Occupancy by Age of Householder in Hanson
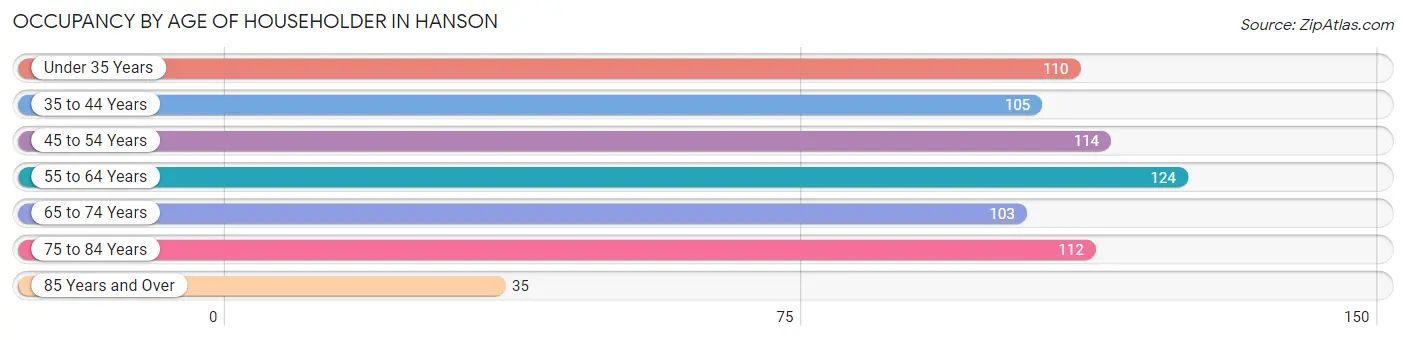
| Age Bracket | # Households | % Households |
| Under 35 Years | 110 | 15.7% |
| 35 to 44 Years | 105 | 14.9% |
| 45 to 54 Years | 114 | 16.2% |
| 55 to 64 Years | 124 | 17.6% |
| 65 to 74 Years | 103 | 14.6% |
| 75 to 84 Years | 112 | 15.9% |
| 85 Years and Over | 35 | 5.0% |
| Total | 703 | 100.0% |
Housing Finances in Hanson
Median Income by Occupancy in Hanson
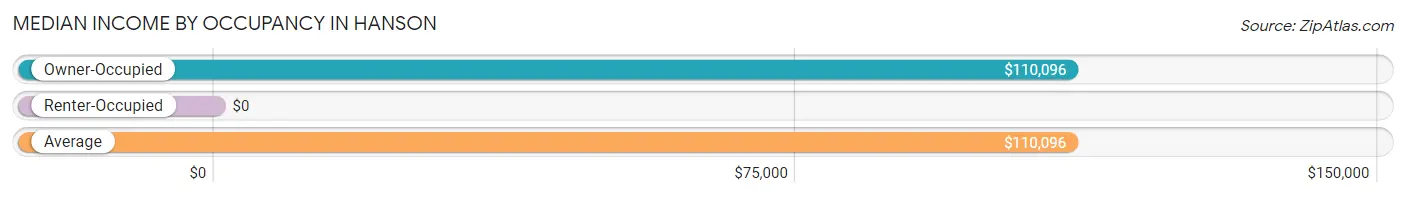
| Occupancy Type | # Households | Median Income |
| Owner-Occupied | 703 (100.0%) | $110,096 |
| Renter-Occupied | 0 (0.0%) | $0 |
| Average | 703 (100.0%) | $110,096 |
Occupancy by Householder Income Bracket in Hanson
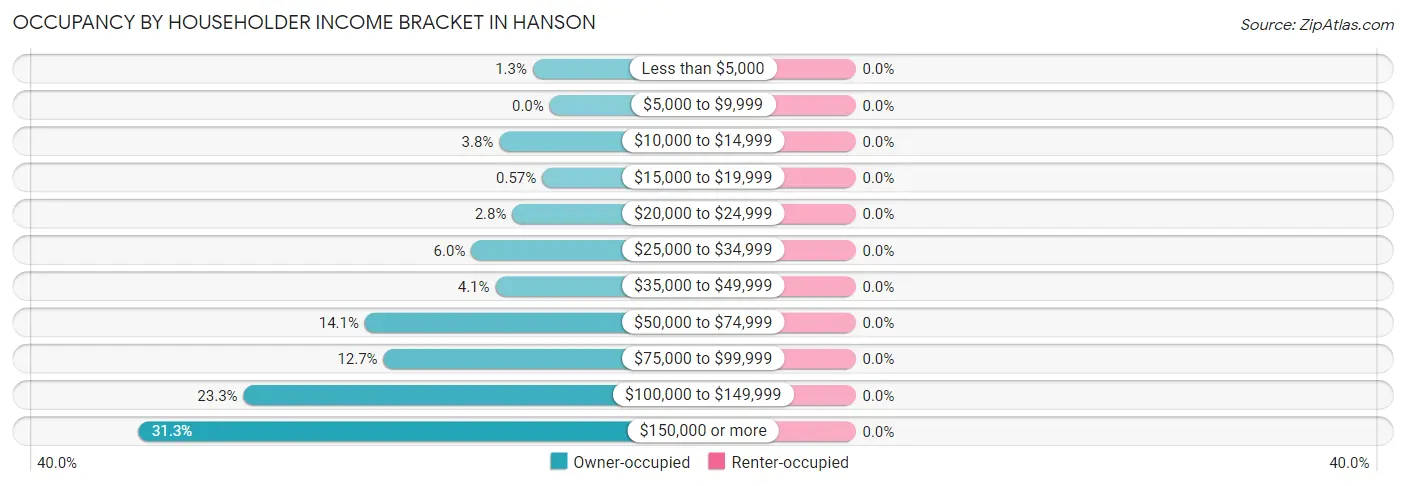
| Income Bracket | Owner-occupied | Renter-occupied |
| Less than $5,000 | 9 (1.3%) | 0 (0.0%) |
| $5,000 to $9,999 | 0 (0.0%) | 0 (0.0%) |
| $10,000 to $14,999 | 27 (3.8%) | 0 (0.0%) |
| $15,000 to $19,999 | 4 (0.6%) | 0 (0.0%) |
| $20,000 to $24,999 | 20 (2.8%) | 0 (0.0%) |
| $25,000 to $34,999 | 42 (6.0%) | 0 (0.0%) |
| $35,000 to $49,999 | 29 (4.1%) | 0 (0.0%) |
| $50,000 to $74,999 | 99 (14.1%) | 0 (0.0%) |
| $75,000 to $99,999 | 89 (12.7%) | 0 (0.0%) |
| $100,000 to $149,999 | 164 (23.3%) | 0 (0.0%) |
| $150,000 or more | 220 (31.3%) | 0 (0.0%) |
| Total | 703 (100.0%) | 0 (0.0%) |
Monthly Housing Cost Tiers in Hanson
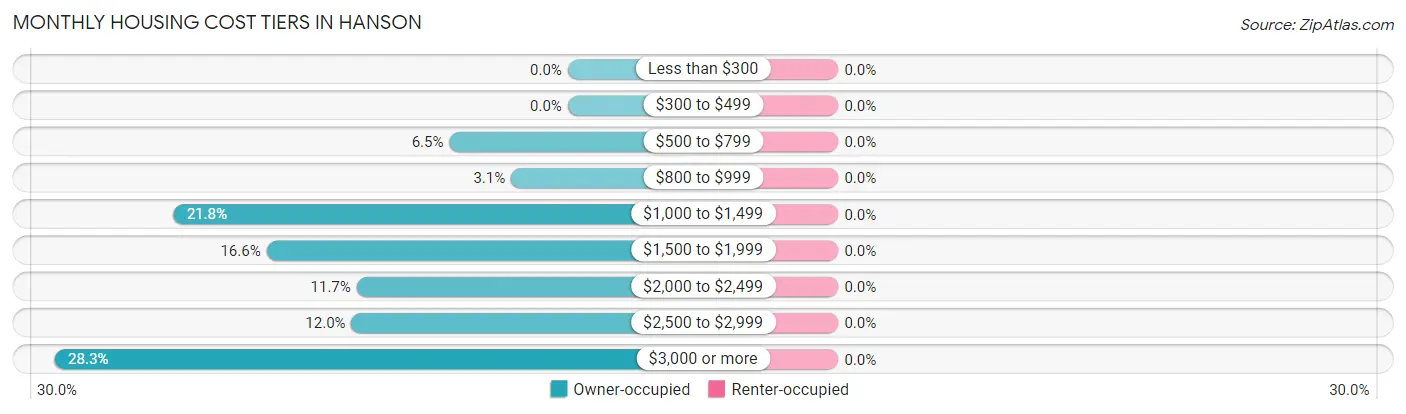
| Monthly Cost | Owner-occupied | Renter-occupied |
| Less than $300 | 0 (0.0%) | 0 (0.0%) |
| $300 to $499 | 0 (0.0%) | 0 (0.0%) |
| $500 to $799 | 46 (6.5%) | 0 (0.0%) |
| $800 to $999 | 22 (3.1%) | 0 (0.0%) |
| $1,000 to $1,499 | 153 (21.8%) | 0 (0.0%) |
| $1,500 to $1,999 | 117 (16.6%) | 0 (0.0%) |
| $2,000 to $2,499 | 82 (11.7%) | 0 (0.0%) |
| $2,500 to $2,999 | 84 (11.9%) | 0 (0.0%) |
| $3,000 or more | 199 (28.3%) | 0 (0.0%) |
| Total | 703 (100.0%) | 0 (0.0%) |
Physical Housing Characteristics in Hanson
Housing Structures in Hanson
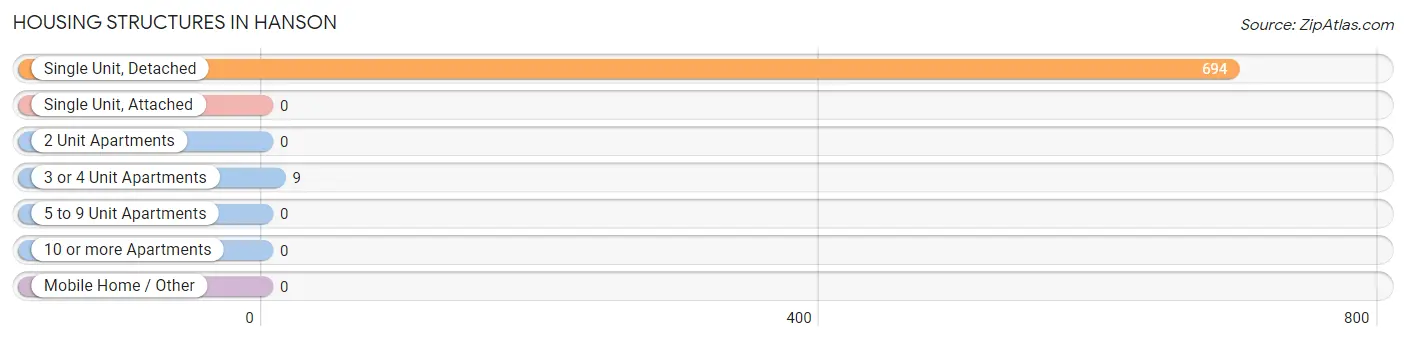
| Structure Type | # Housing Units | % Housing Units |
| Single Unit, Detached | 694 | 98.7% |
| Single Unit, Attached | 0 | 0.0% |
| 2 Unit Apartments | 0 | 0.0% |
| 3 or 4 Unit Apartments | 9 | 1.3% |
| 5 to 9 Unit Apartments | 0 | 0.0% |
| 10 or more Apartments | 0 | 0.0% |
| Mobile Home / Other | 0 | 0.0% |
| Total | 703 | 100.0% |
Housing Structures by Occupancy in Hanson
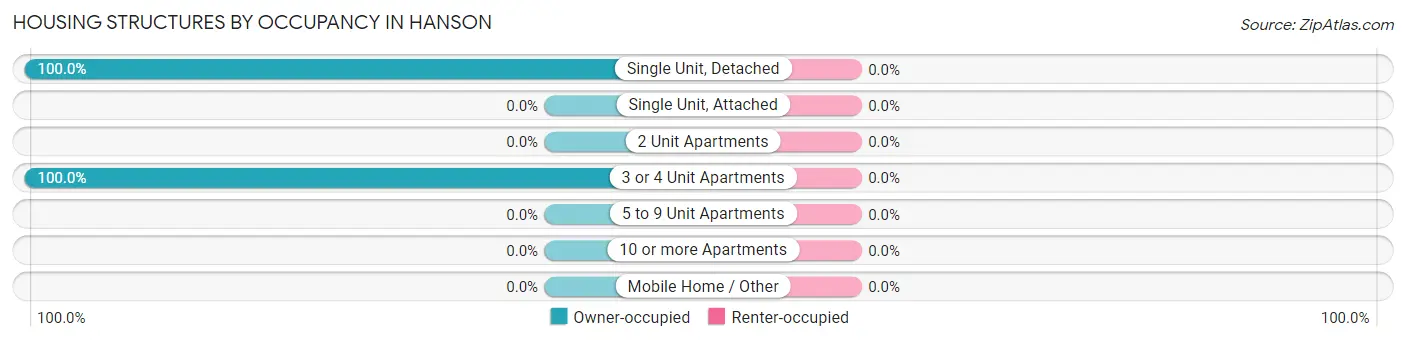
| Structure Type | Owner-occupied | Renter-occupied |
| Single Unit, Detached | 694 (100.0%) | 0 (0.0%) |
| Single Unit, Attached | 0 (0.0%) | 0 (0.0%) |
| 2 Unit Apartments | 0 (0.0%) | 0 (0.0%) |
| 3 or 4 Unit Apartments | 9 (100.0%) | 0 (0.0%) |
| 5 to 9 Unit Apartments | 0 (0.0%) | 0 (0.0%) |
| 10 or more Apartments | 0 (0.0%) | 0 (0.0%) |
| Mobile Home / Other | 0 (0.0%) | 0 (0.0%) |
| Total | 703 (100.0%) | 0 (0.0%) |
Housing Structures by Number of Rooms in Hanson
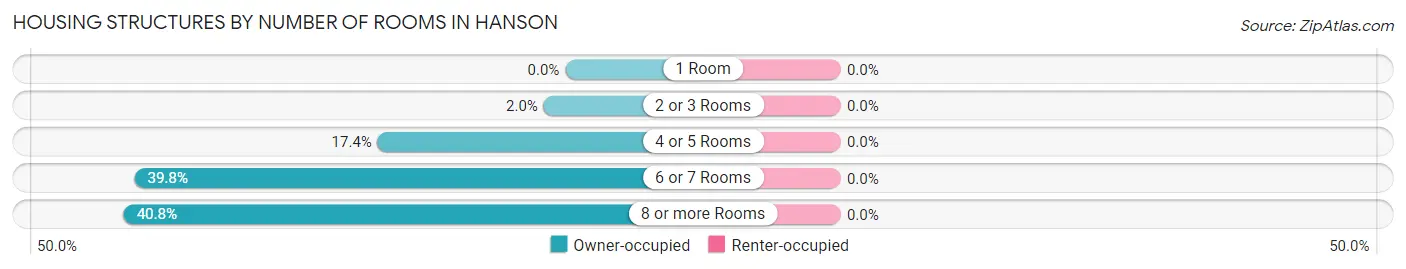
| Number of Rooms | Owner-occupied | Renter-occupied |
| 1 Room | 0 (0.0%) | 0 (0.0%) |
| 2 or 3 Rooms | 14 (2.0%) | 0 (0.0%) |
| 4 or 5 Rooms | 122 (17.3%) | 0 (0.0%) |
| 6 or 7 Rooms | 280 (39.8%) | 0 (0.0%) |
| 8 or more Rooms | 287 (40.8%) | 0 (0.0%) |
| Total | 703 (100.0%) | 0 (0.0%) |
Housing Structure by Heating Type in Hanson
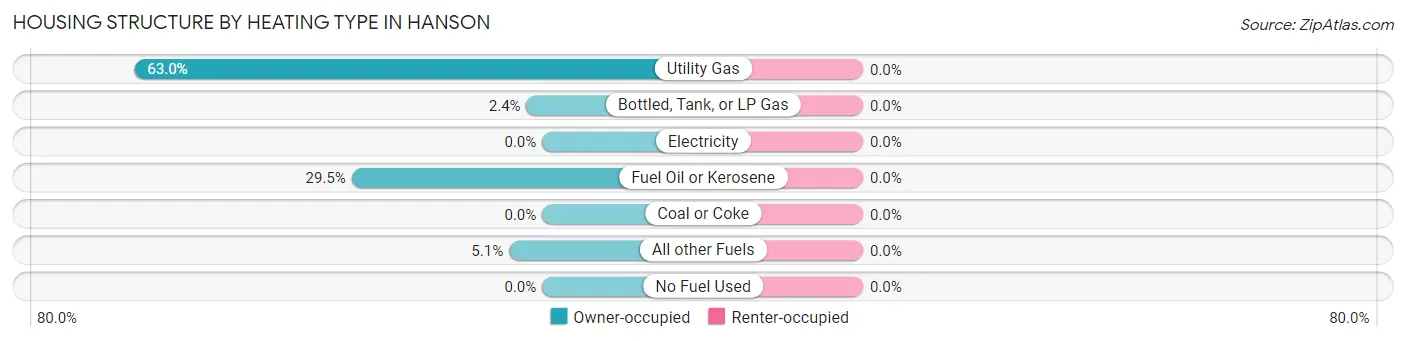
| Heating Type | Owner-occupied | Renter-occupied |
| Utility Gas | 443 (63.0%) | 0 (0.0%) |
| Bottled, Tank, or LP Gas | 17 (2.4%) | 0 (0.0%) |
| Electricity | 0 (0.0%) | 0 (0.0%) |
| Fuel Oil or Kerosene | 207 (29.4%) | 0 (0.0%) |
| Coal or Coke | 0 (0.0%) | 0 (0.0%) |
| All other Fuels | 36 (5.1%) | 0 (0.0%) |
| No Fuel Used | 0 (0.0%) | 0 (0.0%) |
| Total | 703 (100.0%) | 0 (0.0%) |
Household Vehicle Usage in Hanson
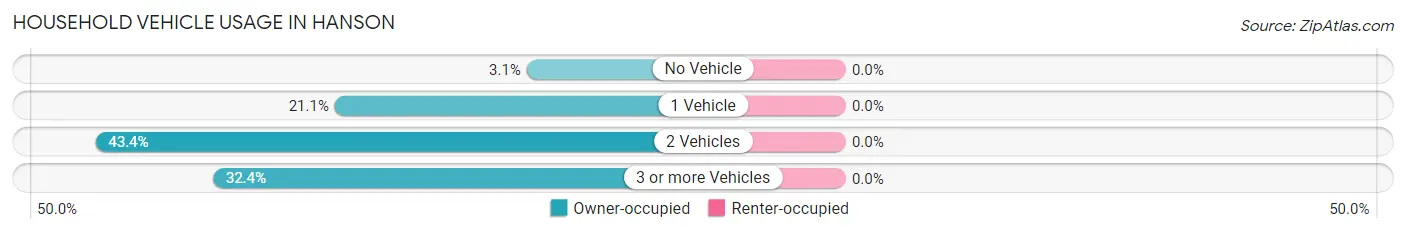
| Vehicles per Household | Owner-occupied | Renter-occupied |
| No Vehicle | 22 (3.1%) | 0 (0.0%) |
| 1 Vehicle | 148 (21.0%) | 0 (0.0%) |
| 2 Vehicles | 305 (43.4%) | 0 (0.0%) |
| 3 or more Vehicles | 228 (32.4%) | 0 (0.0%) |
| Total | 703 (100.0%) | 0 (0.0%) |
Real Estate & Mortgages in Hanson
Real Estate and Mortgage Overview in Hanson
| Characteristic | Without Mortgage | With Mortgage |
| Housing Units | 210 | 493 |
| Median Property Value | $455,100 | $463,500 |
| Median Household Income | $66,964 | $177 |
| Monthly Housing Costs | $1,088 | $199 |
| Real Estate Taxes | $6,357 | $0 |
Property Value by Mortgage Status in Hanson
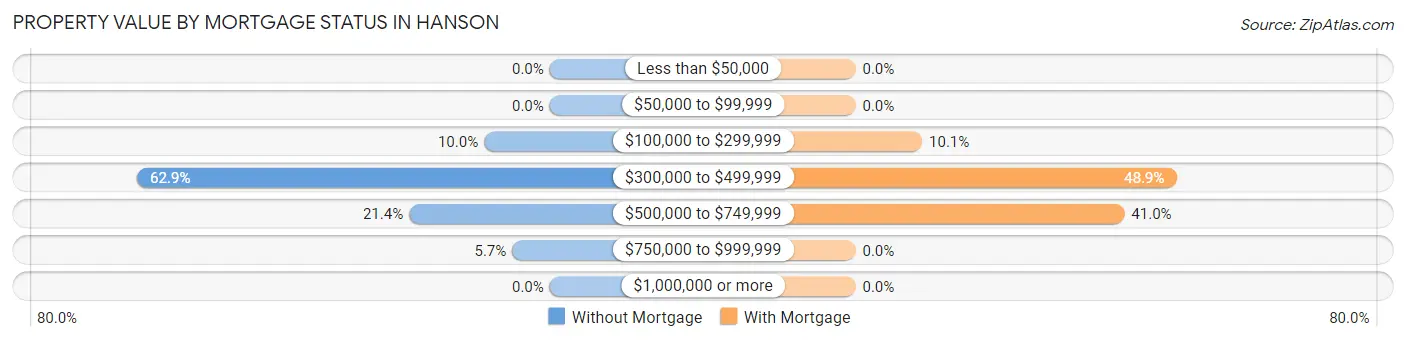
| Property Value | Without Mortgage | With Mortgage |
| Less than $50,000 | 0 (0.0%) | 0 (0.0%) |
| $50,000 to $99,999 | 0 (0.0%) | 0 (0.0%) |
| $100,000 to $299,999 | 21 (10.0%) | 50 (10.1%) |
| $300,000 to $499,999 | 132 (62.9%) | 241 (48.9%) |
| $500,000 to $749,999 | 45 (21.4%) | 202 (41.0%) |
| $750,000 to $999,999 | 12 (5.7%) | 0 (0.0%) |
| $1,000,000 or more | 0 (0.0%) | 0 (0.0%) |
| Total | 210 (100.0%) | 493 (100.0%) |
Household Income by Mortgage Status in Hanson
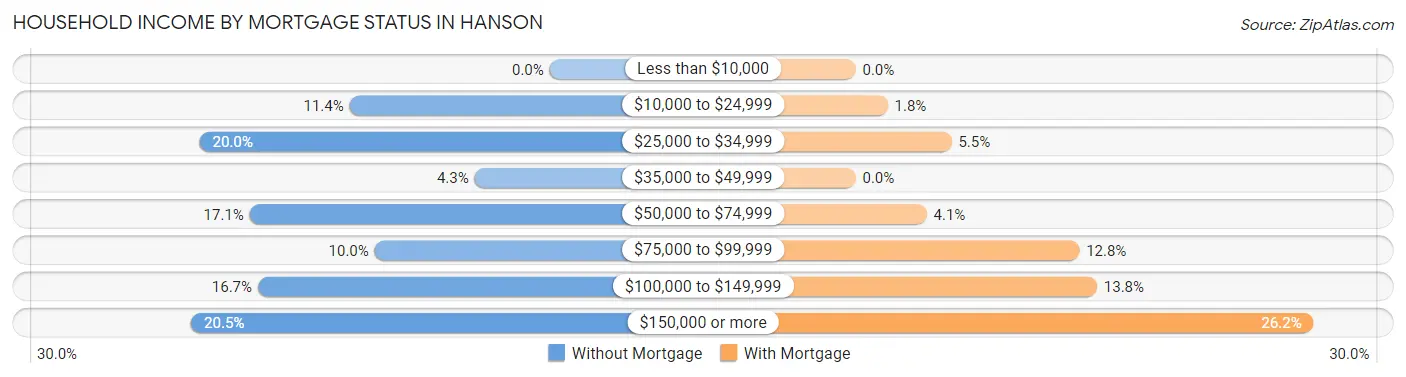
| Household Income | Without Mortgage | With Mortgage |
| Less than $10,000 | 0 (0.0%) | 0 (0.0%) |
| $10,000 to $24,999 | 24 (11.4%) | 9 (1.8%) |
| $25,000 to $34,999 | 42 (20.0%) | 27 (5.5%) |
| $35,000 to $49,999 | 9 (4.3%) | 0 (0.0%) |
| $50,000 to $74,999 | 36 (17.1%) | 20 (4.1%) |
| $75,000 to $99,999 | 21 (10.0%) | 63 (12.8%) |
| $100,000 to $149,999 | 35 (16.7%) | 68 (13.8%) |
| $150,000 or more | 43 (20.5%) | 129 (26.2%) |
| Total | 210 (100.0%) | 493 (100.0%) |
Property Value to Household Income Ratio in Hanson
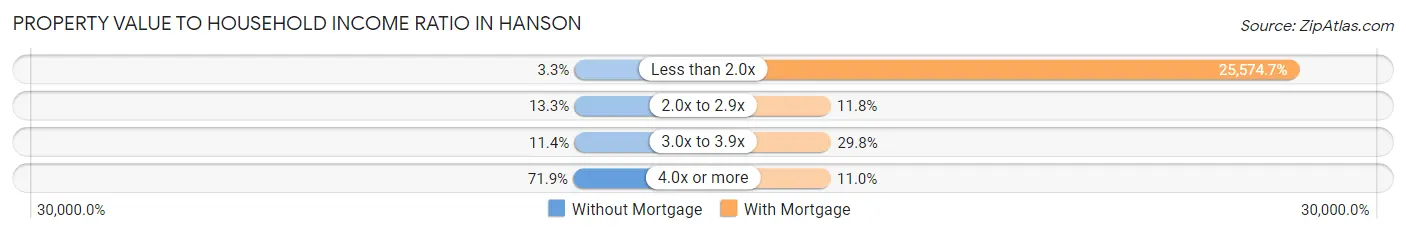
| Value-to-Income Ratio | Without Mortgage | With Mortgage |
| Less than 2.0x | 7 (3.3%) | 126,083 (25,574.6%) |
| 2.0x to 2.9x | 28 (13.3%) | 58 (11.8%) |
| 3.0x to 3.9x | 24 (11.4%) | 147 (29.8%) |
| 4.0x or more | 151 (71.9%) | 54 (11.0%) |
| Total | 210 (100.0%) | 493 (100.0%) |
Real Estate Taxes by Mortgage Status in Hanson
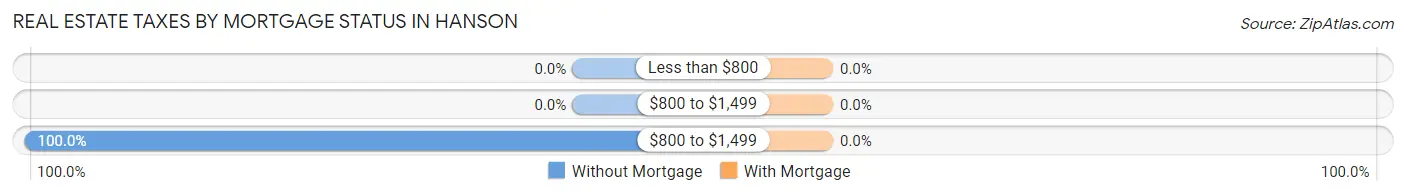
| Property Taxes | Without Mortgage | With Mortgage |
| Less than $800 | 0 (0.0%) | 0 (0.0%) |
| $800 to $1,499 | 0 (0.0%) | 0 (0.0%) |
| $800 to $1,499 | 210 (100.0%) | 0 (0.0%) |
| Total | 210 (100.0%) | 493 (100.0%) |
Health & Disability in Hanson
Health Insurance Coverage by Age in Hanson
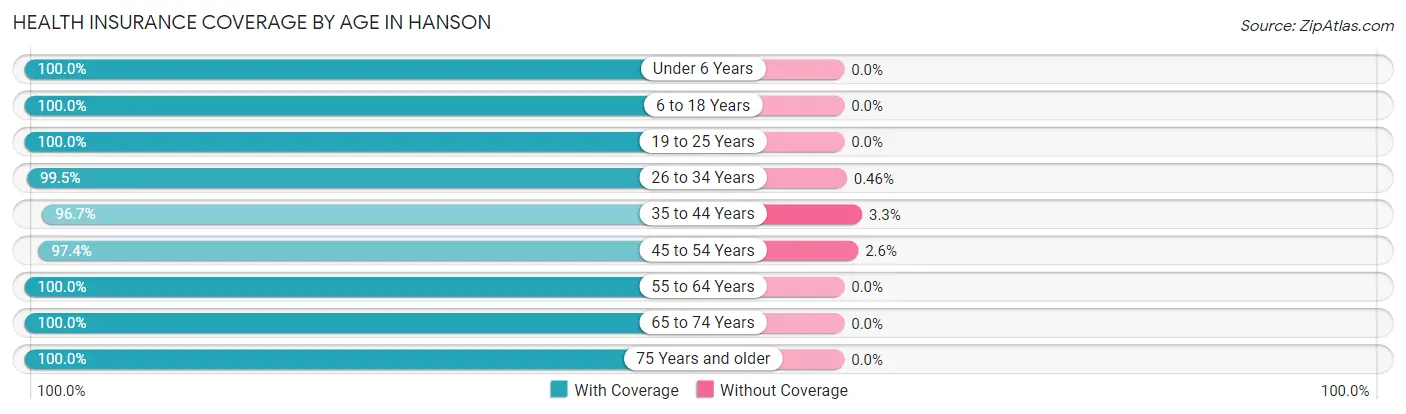
| Age Bracket | With Coverage | Without Coverage |
| Under 6 Years | 178 (100.0%) | 0 (0.0%) |
| 6 to 18 Years | 390 (100.0%) | 0 (0.0%) |
| 19 to 25 Years | 156 (100.0%) | 0 (0.0%) |
| 26 to 34 Years | 215 (99.5%) | 1 (0.5%) |
| 35 to 44 Years | 263 (96.7%) | 9 (3.3%) |
| 45 to 54 Years | 263 (97.4%) | 7 (2.6%) |
| 55 to 64 Years | 252 (100.0%) | 0 (0.0%) |
| 65 to 74 Years | 175 (100.0%) | 0 (0.0%) |
| 75 Years and older | 178 (100.0%) | 0 (0.0%) |
| Total | 2,070 (99.2%) | 17 (0.8%) |
Health Insurance Coverage by Citizenship Status in Hanson
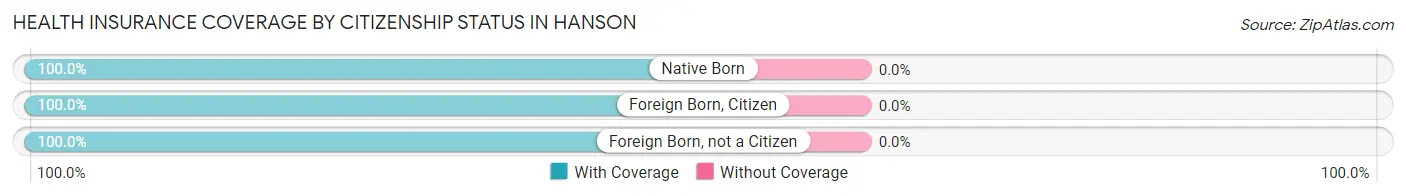
| Citizenship Status | With Coverage | Without Coverage |
| Native Born | 178 (100.0%) | 0 (0.0%) |
| Foreign Born, Citizen | 390 (100.0%) | 0 (0.0%) |
| Foreign Born, not a Citizen | 156 (100.0%) | 0 (0.0%) |
Health Insurance Coverage by Household Income in Hanson
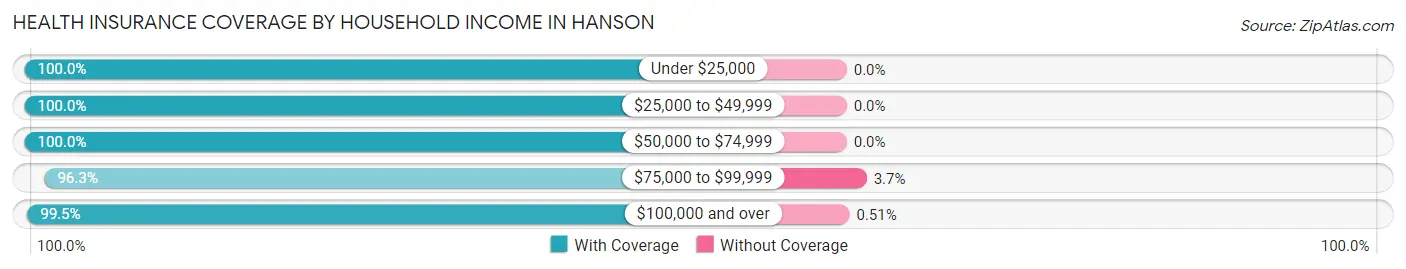
| Household Income | With Coverage | Without Coverage |
| Under $25,000 | 60 (100.0%) | 0 (0.0%) |
| $25,000 to $49,999 | 204 (100.0%) | 0 (0.0%) |
| $50,000 to $74,999 | 208 (100.0%) | 0 (0.0%) |
| $75,000 to $99,999 | 232 (96.3%) | 9 (3.7%) |
| $100,000 and over | 1,365 (99.5%) | 7 (0.5%) |
Public vs Private Health Insurance Coverage by Age in Hanson
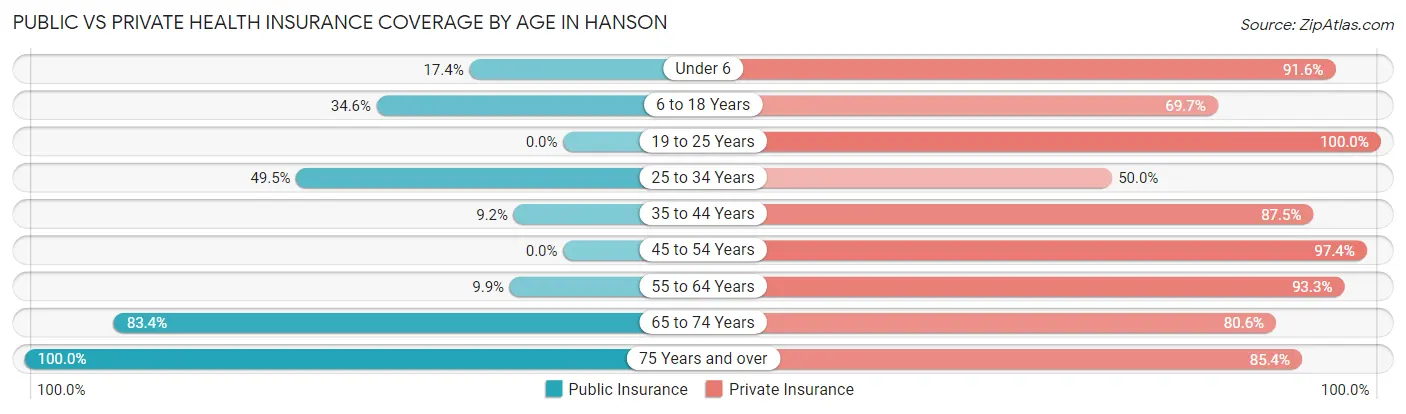
| Age Bracket | Public Insurance | Private Insurance |
| Under 6 | 31 (17.4%) | 163 (91.6%) |
| 6 to 18 Years | 135 (34.6%) | 272 (69.7%) |
| 19 to 25 Years | 0 (0.0%) | 156 (100.0%) |
| 25 to 34 Years | 107 (49.5%) | 108 (50.0%) |
| 35 to 44 Years | 25 (9.2%) | 238 (87.5%) |
| 45 to 54 Years | 0 (0.0%) | 263 (97.4%) |
| 55 to 64 Years | 25 (9.9%) | 235 (93.2%) |
| 65 to 74 Years | 146 (83.4%) | 141 (80.6%) |
| 75 Years and over | 178 (100.0%) | 152 (85.4%) |
| Total | 647 (31.0%) | 1,728 (82.8%) |
Disability Status by Sex by Age in Hanson
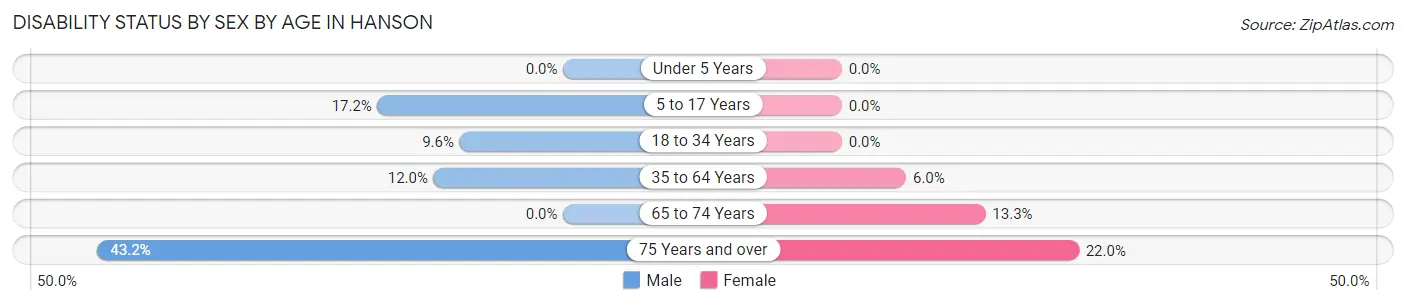
| Age Bracket | Male | Female |
| Under 5 Years | 0 (0.0%) | 0 (0.0%) |
| 5 to 17 Years | 41 (17.2%) | 0 (0.0%) |
| 18 to 34 Years | 22 (9.6%) | 0 (0.0%) |
| 35 to 64 Years | 47 (12.0%) | 24 (6.0%) |
| 65 to 74 Years | 0 (0.0%) | 14 (13.3%) |
| 75 Years and over | 16 (43.2%) | 31 (22.0%) |
Disability Class by Sex by Age in Hanson
Disability Class: Hearing Difficulty
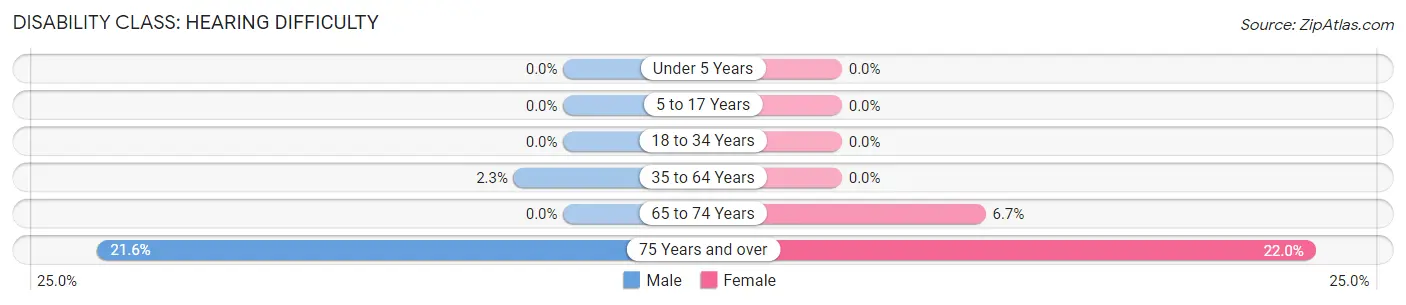
| Age Bracket | Male | Female |
| Under 5 Years | 0 (0.0%) | 0 (0.0%) |
| 5 to 17 Years | 0 (0.0%) | 0 (0.0%) |
| 18 to 34 Years | 0 (0.0%) | 0 (0.0%) |
| 35 to 64 Years | 9 (2.3%) | 0 (0.0%) |
| 65 to 74 Years | 0 (0.0%) | 7 (6.7%) |
| 75 Years and over | 8 (21.6%) | 31 (22.0%) |
Disability Class: Vision Difficulty
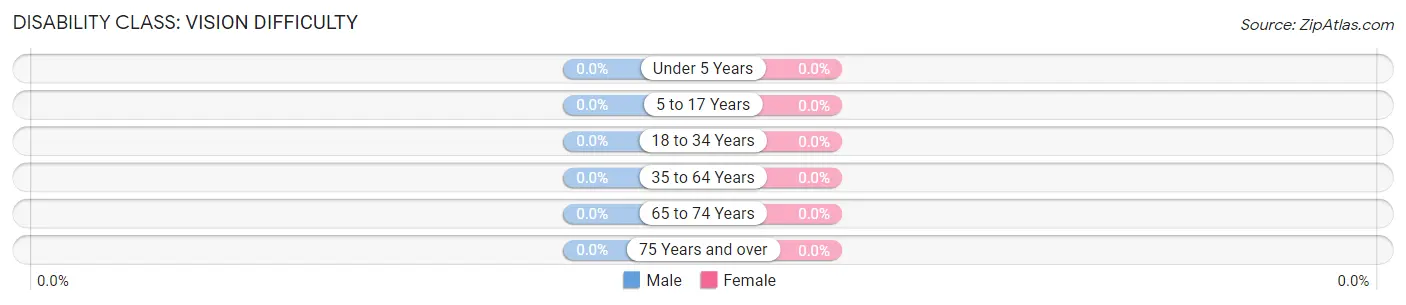
| Age Bracket | Male | Female |
| Under 5 Years | 0 (0.0%) | 0 (0.0%) |
| 5 to 17 Years | 0 (0.0%) | 0 (0.0%) |
| 18 to 34 Years | 0 (0.0%) | 0 (0.0%) |
| 35 to 64 Years | 0 (0.0%) | 0 (0.0%) |
| 65 to 74 Years | 0 (0.0%) | 0 (0.0%) |
| 75 Years and over | 0 (0.0%) | 0 (0.0%) |
Disability Class: Cognitive Difficulty
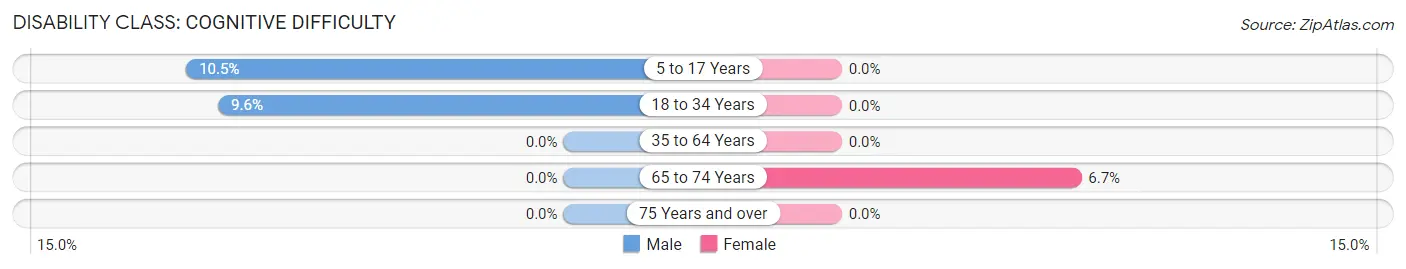
| Age Bracket | Male | Female |
| 5 to 17 Years | 25 (10.5%) | 0 (0.0%) |
| 18 to 34 Years | 22 (9.6%) | 0 (0.0%) |
| 35 to 64 Years | 0 (0.0%) | 0 (0.0%) |
| 65 to 74 Years | 0 (0.0%) | 7 (6.7%) |
| 75 Years and over | 0 (0.0%) | 0 (0.0%) |
Disability Class: Ambulatory Difficulty
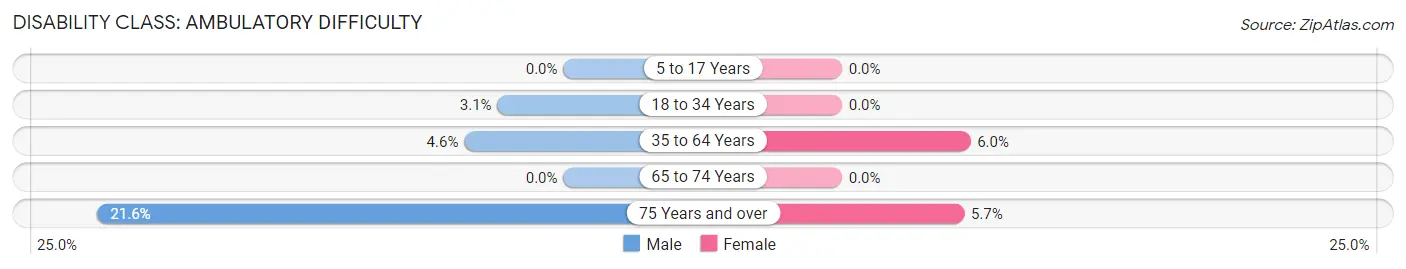
| Age Bracket | Male | Female |
| 5 to 17 Years | 0 (0.0%) | 0 (0.0%) |
| 18 to 34 Years | 7 (3.1%) | 0 (0.0%) |
| 35 to 64 Years | 18 (4.6%) | 24 (6.0%) |
| 65 to 74 Years | 0 (0.0%) | 0 (0.0%) |
| 75 Years and over | 8 (21.6%) | 8 (5.7%) |
Disability Class: Self-Care Difficulty
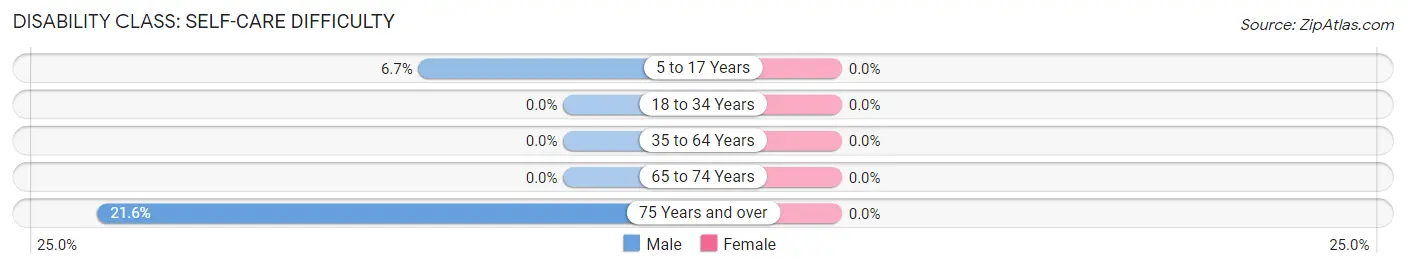
| Age Bracket | Male | Female |
| 5 to 17 Years | 16 (6.7%) | 0 (0.0%) |
| 18 to 34 Years | 0 (0.0%) | 0 (0.0%) |
| 35 to 64 Years | 0 (0.0%) | 0 (0.0%) |
| 65 to 74 Years | 0 (0.0%) | 0 (0.0%) |
| 75 Years and over | 8 (21.6%) | 0 (0.0%) |
Technology Access in Hanson
Computing Device Access in Hanson
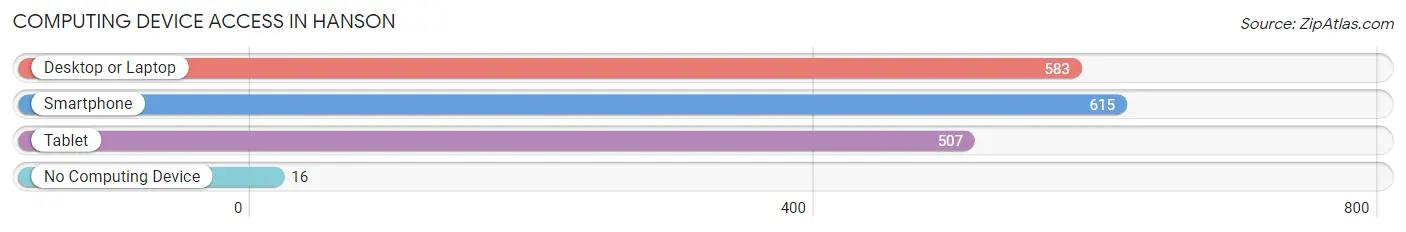
| Device Type | # Households | % Households |
| Desktop or Laptop | 583 | 82.9% |
| Smartphone | 615 | 87.5% |
| Tablet | 507 | 72.1% |
| No Computing Device | 16 | 2.3% |
| Total | 703 | 100.0% |
Internet Access in Hanson
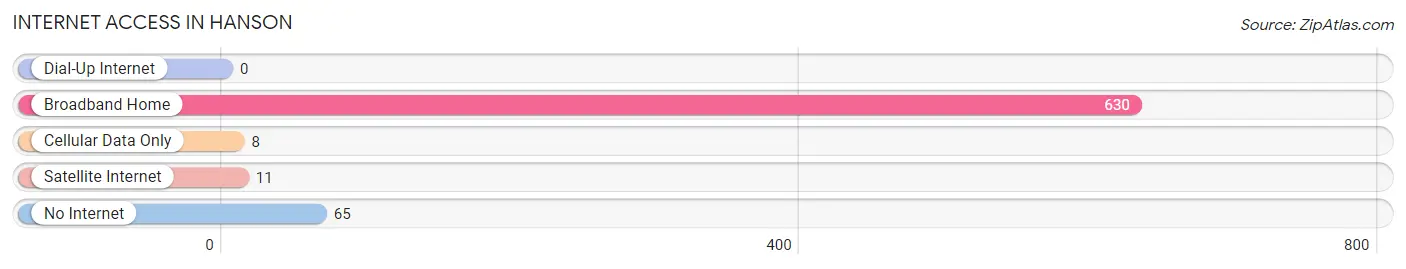
| Internet Type | # Households | % Households |
| Dial-Up Internet | 0 | 0.0% |
| Broadband Home | 630 | 89.6% |
| Cellular Data Only | 8 | 1.1% |
| Satellite Internet | 11 | 1.6% |
| No Internet | 65 | 9.2% |
| Total | 703 | 100.0% |
Hanson Summary
Hanson is a town located in Plymouth County, Massachusetts, United States. It is part of the Greater Boston metropolitan area and is located approximately 20 miles south of Boston. The population was 10,209 at the 2010 census.
History
Hanson was first settled in 1632 and was officially incorporated in 1820. The town was named after the first settler, Thomas Hanson. The town was originally part of the town of Pembroke, which was incorporated in 1712. In 1820, Hanson separated from Pembroke and was incorporated as its own town.
Hanson was primarily an agricultural town until the mid-19th century. In the late 19th century, the town began to industrialize, with the development of several mills and factories. The town also became a popular summer resort destination, with several hotels and resorts being built in the area.
Geography
Hanson is located in southeastern Massachusetts, in Plymouth County. It is bordered by the towns of Halifax to the north, Pembroke to the east, Whitman to the south, and East Bridgewater to the west. The town is located approximately 20 miles south of Boston.
The town is mostly rural, with a few small villages and hamlets. The town is mostly flat, with some hills in the northern part of town. The town is drained by the Indian Head River, which flows through the center of town.
Economy
Hanson is primarily a residential community, with a few small businesses located in the town. The town is home to several small manufacturing companies, including Hanson Manufacturing, which produces industrial equipment, and Hanson Plastics, which produces plastic products.
The town is also home to several retail stores, including a grocery store, a hardware store, and a few restaurants. The town is also home to several small businesses, including a landscaping company, a plumbing company, and a few auto repair shops.
Demographics
As of the 2010 census, there were 10,209 people, 3,845 households, and 2,845 families residing in the town. The population density was 545.3 people per square mile (210.9/km2). There were 4,039 housing units at an average density of 218.3 per square mile (84.2/km2). The racial makeup of the town was 97.2% White, 0.7% African American, 0.2% Native American, 0.6% Asian, 0.1% Pacific Islander, 0.4% from other races, and 0.9% from two or more races. Hispanic or Latino of any race were 1.3% of the population.
There were 3,845 households, out of which 33.2% had children under the age of 18 living with them, 59.2% were married couples living together, 9.7% had a female householder with no husband present, and 27.2% were non-families. 22.2% of all households were made up of individuals, and 9.2% had someone living alone who was 65 years of age or older. The average household size was 2.63 and the average family size was 3.09.
In the town, the population was spread out, with 24.7% under the age of 18, 6.2% from 18 to 24, 28.3% from 25 to 44, 28.2% from 45 to 64, and 12.6% who were 65 years of age or older. The median age was 40 years. For every 100 females, there were 95.2 males. For every 100 females age 18 and over, there were 92.2 males.
The median income for a household in the town was $63,958, and the median income for a family was $71,944. Males had a median income of $50,917 versus $37,917 for females. The per capita income for the town was $27,945. About 3.2% of families and 4.3% of the population were below the poverty line, including 5.2% of those under age 18 and 4.2% of those age 65 or over.
Common Questions
What is Per Capita Income in Hanson?
Per Capita income in Hanson is $41,707.
What is the Median Family Income in Hanson?
Median Family Income in Hanson is $132,083.
What is the Median Household income in Hanson?
Median Household Income in Hanson is $110,096.
What is Income or Wage Gap in Hanson?
Income or Wage Gap in Hanson is 35.8%.
Women in Hanson earn 64.2 cents for every dollar earned by a man.
What is Inequality or Gini Index in Hanson?
Inequality or Gini Index in Hanson is 0.37.
What is the Total Population of Hanson?
Total Population of Hanson is 2,087.
What is the Total Male Population of Hanson?
Total Male Population of Hanson is 1,009.
What is the Total Female Population of Hanson?
Total Female Population of Hanson is 1,078.
What is the Ratio of Males per 100 Females in Hanson?
There are 93.60 Males per 100 Females in Hanson.
What is the Ratio of Females per 100 Males in Hanson?
There are 106.84 Females per 100 Males in Hanson.
What is the Median Population Age in Hanson?
Median Population Age in Hanson is 39.6 Years.
What is the Average Family Size in Hanson
Average Family Size in Hanson is 3.5 People.
What is the Average Household Size in Hanson
Average Household Size in Hanson is 3.0 People.
How Large is the Labor Force in Hanson?
There are 1,064 People in the Labor Forcein in Hanson.
What is the Percentage of People in the Labor Force in Hanson?
67.4% of People are in the Labor Force in Hanson.
What is the Unemployment Rate in Hanson?
Unemployment Rate in Hanson is 5.8%.