West Concord, MA Map & Demographics
West Concord Map
West Concord Overview
$67,907
PER CAPITA INCOME
$201,801
AVG FAMILY INCOME
$170,040
AVG HOUSEHOLD INCOME
40.5%
WAGE / INCOME GAP [ % ]
59.5¢/ $1
WAGE / INCOME GAP [ $ ]
0.40
INEQUALITY / GINI INDEX
6,450
TOTAL POPULATION
3,452
MALE POPULATION
2,998
FEMALE POPULATION
115.14
MALES / 100 FEMALES
86.85
FEMALES / 100 MALES
46.0
MEDIAN AGE
3.1
AVG FAMILY SIZE
2.4
AVG HOUSEHOLD SIZE
2,703
LABOR FORCE [ PEOPLE ]
50.6%
PERCENT IN LABOR FORCE
5.0%
UNEMPLOYMENT RATE
Income in West Concord
Income Overview in West Concord
Per Capita Income in West Concord is $67,907, while median incomes of families and households are $201,801 and $170,040 respectively.
| Characteristic | Number | Measure |
| Per Capita Income | 6,450 | $67,907 |
| Median Family Income | 1,439 | $201,801 |
| Mean Family Income | 1,439 | $222,076 |
| Median Household Income | 2,420 | $170,040 |
| Mean Household Income | 2,420 | $177,713 |
| Income Deficit | 1,439 | $0 |
| Wage / Income Gap (%) | 6,450 | 40.53% |
| Wage / Income Gap ($) | 6,450 | 59.47¢ per $1 |
| Gini / Inequality Index | 6,450 | 0.40 |
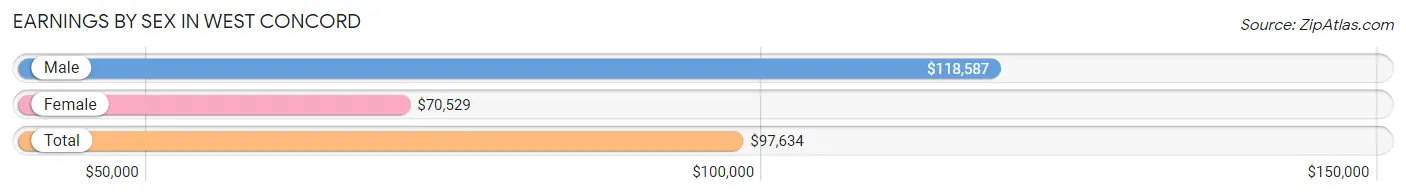
Earnings by Sex in West Concord
Average Earnings in West Concord are $97,634, $118,587 for men and $70,529 for women, a difference of 40.5%.
| Sex | Number | Average Earnings |
| Male | 1,406 (47.8%) | $118,587 |
| Female | 1,537 (52.2%) | $70,529 |
| Total | 2,943 (100.0%) | $97,634 |
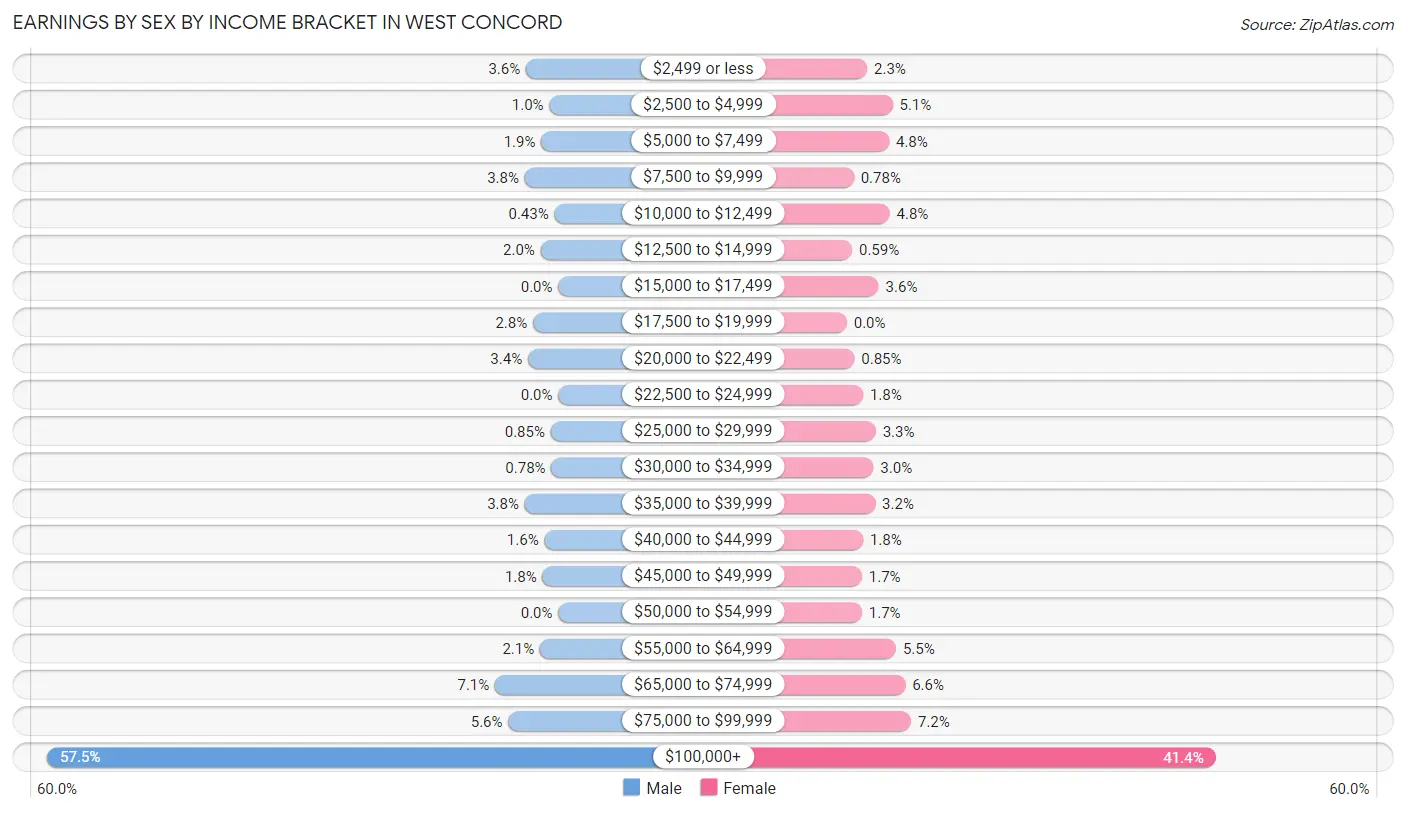
Earnings by Sex by Income Bracket in West Concord
The most common earnings brackets in West Concord are $100,000+ for men (808 | 57.5%) and $100,000+ for women (637 | 41.4%).
| Income | Male | Female |
| $2,499 or less | 51 (3.6%) | 35 (2.3%) |
| $2,500 to $4,999 | 14 (1.0%) | 79 (5.1%) |
| $5,000 to $7,499 | 27 (1.9%) | 73 (4.8%) |
| $7,500 to $9,999 | 53 (3.8%) | 12 (0.8%) |
| $10,000 to $12,499 | 6 (0.4%) | 74 (4.8%) |
| $12,500 to $14,999 | 28 (2.0%) | 9 (0.6%) |
| $15,000 to $17,499 | 0 (0.0%) | 55 (3.6%) |
| $17,500 to $19,999 | 40 (2.8%) | 0 (0.0%) |
| $20,000 to $22,499 | 48 (3.4%) | 13 (0.9%) |
| $22,500 to $24,999 | 0 (0.0%) | 28 (1.8%) |
| $25,000 to $29,999 | 12 (0.9%) | 50 (3.3%) |
| $30,000 to $34,999 | 11 (0.8%) | 46 (3.0%) |
| $35,000 to $39,999 | 53 (3.8%) | 49 (3.2%) |
| $40,000 to $44,999 | 22 (1.6%) | 28 (1.8%) |
| $45,000 to $49,999 | 25 (1.8%) | 26 (1.7%) |
| $50,000 to $54,999 | 0 (0.0%) | 26 (1.7%) |
| $55,000 to $64,999 | 29 (2.1%) | 85 (5.5%) |
| $65,000 to $74,999 | 100 (7.1%) | 101 (6.6%) |
| $75,000 to $99,999 | 79 (5.6%) | 111 (7.2%) |
| $100,000+ | 808 (57.5%) | 637 (41.4%) |
| Total | 1,406 (100.0%) | 1,537 (100.0%) |
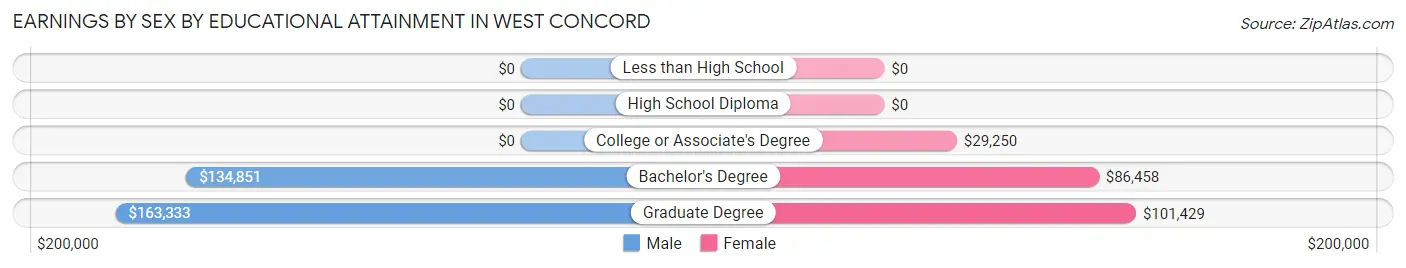
Earnings by Sex by Educational Attainment in West Concord
Average earnings in West Concord are $133,810 for men and $97,634 for women, a difference of 27.0%. Men with an educational attainment of graduate degree enjoy the highest average annual earnings of $163,333, while those with bachelor's degree education earn the least with $134,851. Women with an educational attainment of graduate degree earn the most with the average annual earnings of $101,429, while those with college or associate's degree education have the smallest earnings of $29,250.
| Educational Attainment | Male Income | Female Income |
| Less than High School | - | - |
| High School Diploma | - | - |
| College or Associate's Degree | - | - |
| Bachelor's Degree | $134,851 | $86,458 |
| Graduate Degree | $163,333 | $101,429 |
| Total | $133,810 | $97,634 |
Family Income in West Concord
Family Income Brackets in West Concord
According to the West Concord family income data, there are 744 families falling into the $200,000+ income range, which is the most common income bracket and makes up 51.7% of all families.
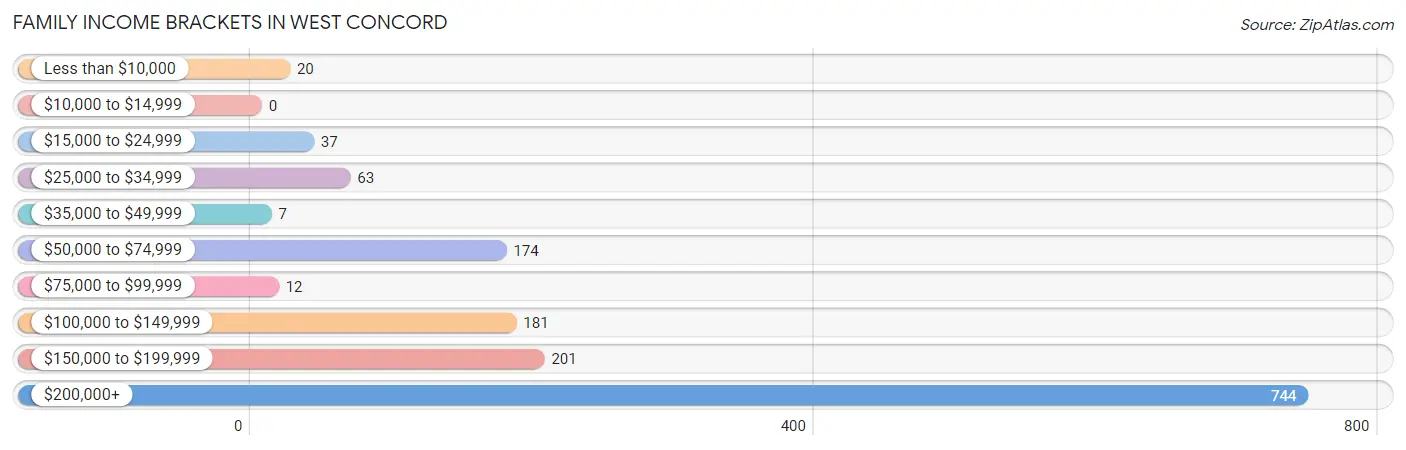
| Income Bracket | # Families | % Families |
| Less than $10,000 | 20 | 1.4% |
| $10,000 to $14,999 | 0 | 0.0% |
| $15,000 to $24,999 | 37 | 2.6% |
| $25,000 to $34,999 | 63 | 4.4% |
| $35,000 to $49,999 | 7 | 0.5% |
| $50,000 to $74,999 | 174 | 12.1% |
| $75,000 to $99,999 | 12 | 0.8% |
| $100,000 to $149,999 | 181 | 12.6% |
| $150,000 to $199,999 | 201 | 14.0% |
| $200,000+ | 744 | 51.7% |
Family Income by Famaliy Size in West Concord
4-person families (418 | 29.0%) account for the highest median family income in West Concord with $250,001 per family, while 2-person families (552 | 38.4%) have the highest median income of $68,650 per family member.
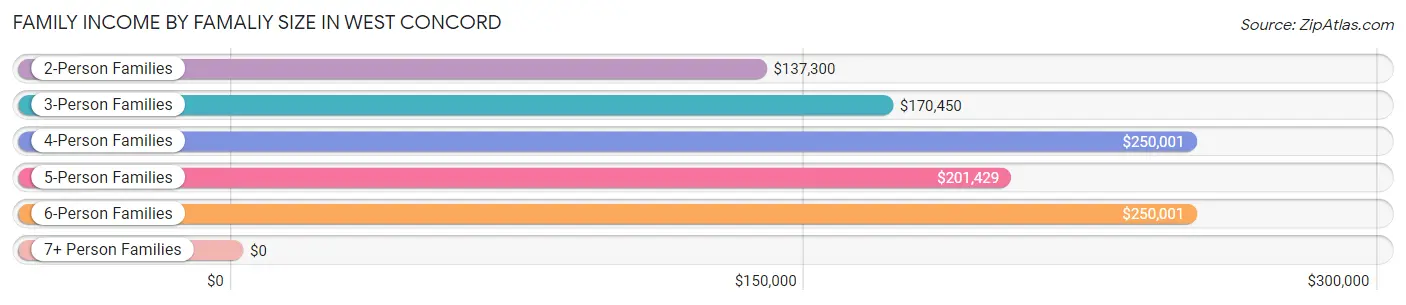
| Income Bracket | # Families | Median Income |
| 2-Person Families | 552 (38.4%) | $137,300 |
| 3-Person Families | 389 (27.0%) | $170,450 |
| 4-Person Families | 418 (29.0%) | $250,001 |
| 5-Person Families | 38 (2.6%) | $201,429 |
| 6-Person Families | 42 (2.9%) | $250,001 |
| 7+ Person Families | 0 (0.0%) | $0 |
| Total | 1,439 (100.0%) | $201,801 |
Family Income by Number of Earners in West Concord
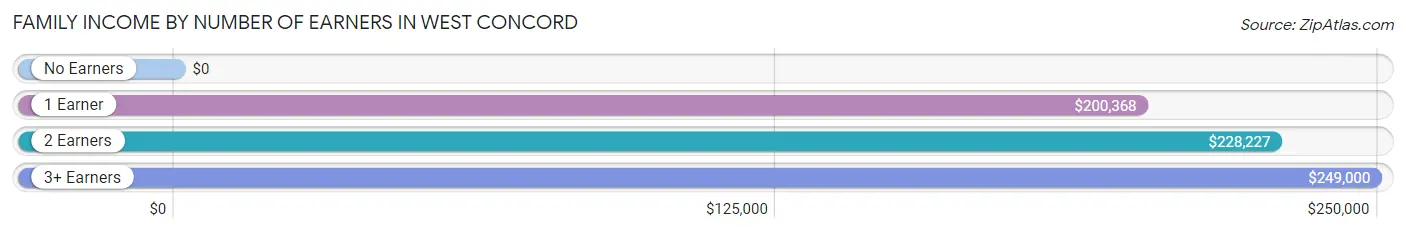
| Number of Earners | # Families | Median Income |
| No Earners | 269 (18.7%) | $0 |
| 1 Earner | 388 (27.0%) | $200,368 |
| 2 Earners | 602 (41.8%) | $228,227 |
| 3+ Earners | 180 (12.5%) | $249,000 |
| Total | 1,439 (100.0%) | $201,801 |
Household Income in West Concord
Household Income Brackets in West Concord
With 864 households falling in the category, the $200,000+ income range is the most frequent in West Concord, accounting for 35.7% of all households.
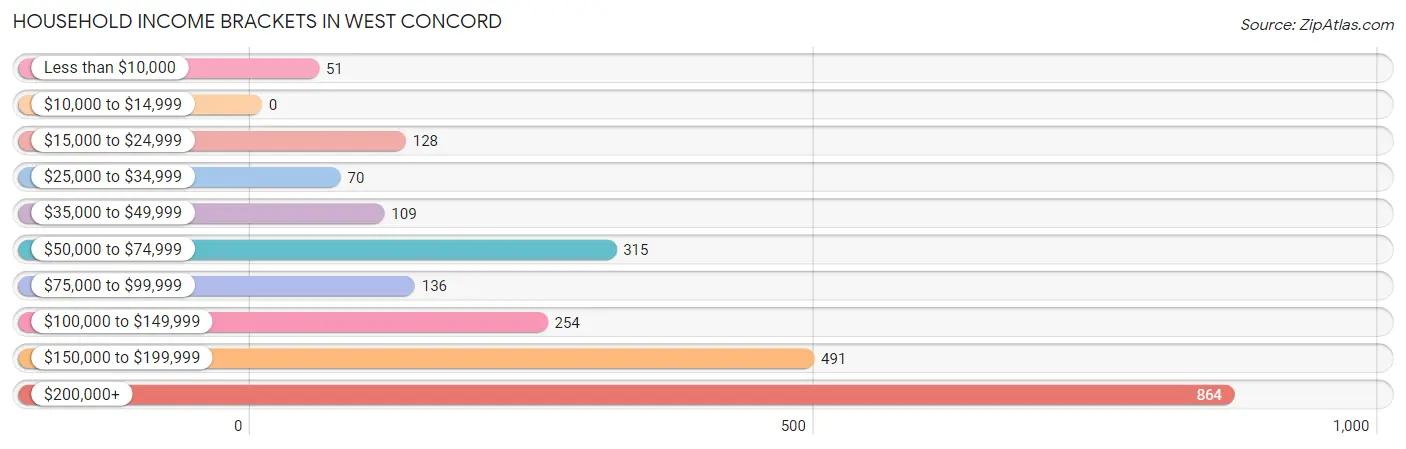
| Income Bracket | # Households | % Households |
| Less than $10,000 | 51 | 2.1% |
| $10,000 to $14,999 | 0 | 0.0% |
| $15,000 to $24,999 | 128 | 5.3% |
| $25,000 to $34,999 | 70 | 2.9% |
| $35,000 to $49,999 | 109 | 4.5% |
| $50,000 to $74,999 | 315 | 13.0% |
| $75,000 to $99,999 | 136 | 5.6% |
| $100,000 to $149,999 | 254 | 10.5% |
| $150,000 to $199,999 | 491 | 20.3% |
| $200,000+ | 864 | 35.7% |
Household Income by Householder Age in West Concord
The median household income in West Concord is $170,040, with the highest median household income of $200,993 found in the 25 to 44 years age bracket for the primary householder. A total of 481 households (19.9%) fall into this category. Meanwhile, the 15 to 24 years age bracket for the primary householder has the lowest median household income of $0, with 17 households (0.7%) in this group.
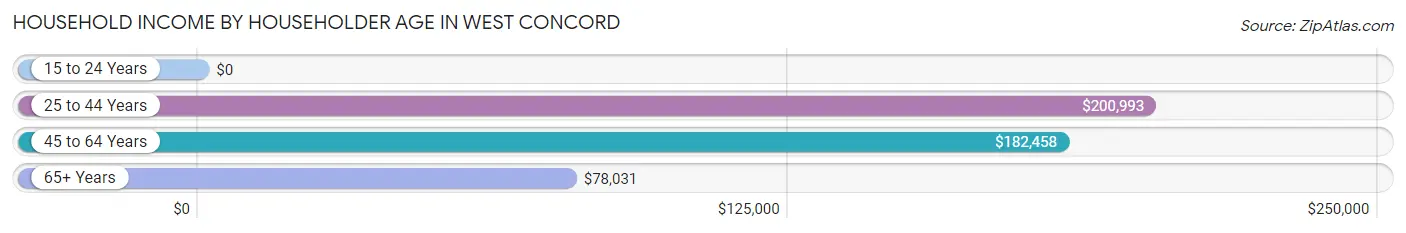
| Income Bracket | # Households | Median Income |
| 15 to 24 Years | 17 (0.7%) | $0 |
| 25 to 44 Years | 481 (19.9%) | $200,993 |
| 45 to 64 Years | 943 (39.0%) | $182,458 |
| 65+ Years | 979 (40.5%) | $78,031 |
| Total | 2,420 (100.0%) | $170,040 |
Poverty in West Concord
Income Below Poverty by Sex and Age in West Concord
With 3.9% poverty level for males and 4.5% for females among the residents of West Concord, 25 to 34 year old males and 18 to 24 year old females are the most vulnerable to poverty, with 26 males (21.3%) and 54 females (28.7%) in their respective age groups living below the poverty level.
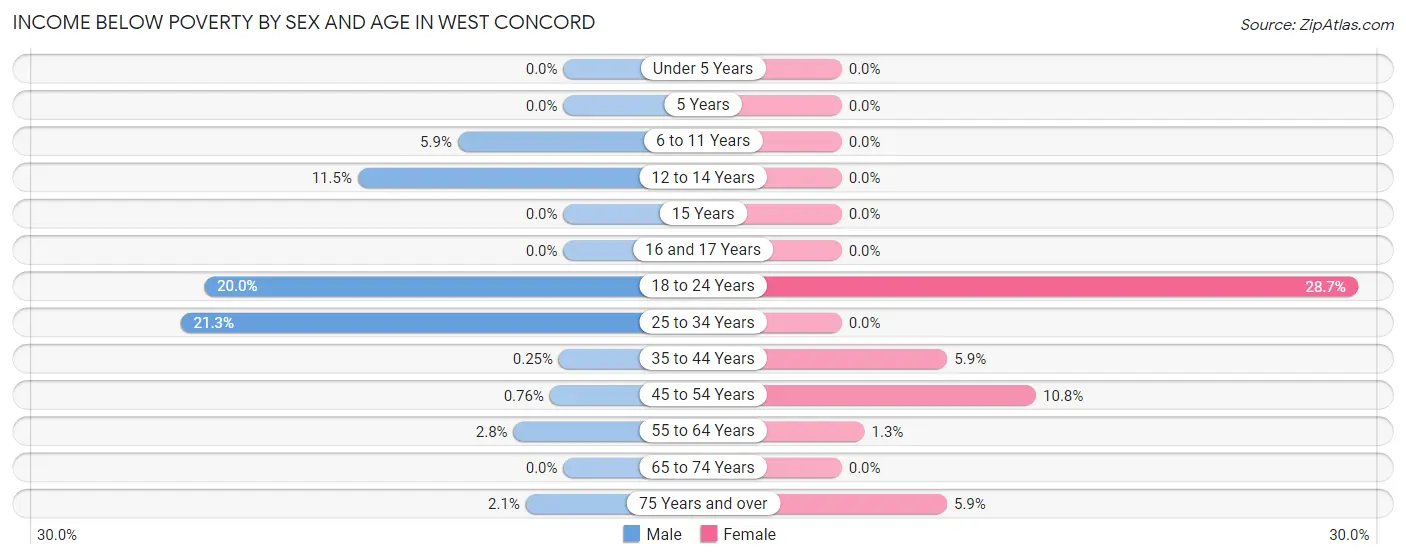
| Age Bracket | Male | Female |
| Under 5 Years | 0 (0.0%) | 0 (0.0%) |
| 5 Years | 0 (0.0%) | 0 (0.0%) |
| 6 to 11 Years | 12 (5.9%) | 0 (0.0%) |
| 12 to 14 Years | 15 (11.5%) | 0 (0.0%) |
| 15 Years | 0 (0.0%) | 0 (0.0%) |
| 16 and 17 Years | 0 (0.0%) | 0 (0.0%) |
| 18 to 24 Years | 32 (20.0%) | 54 (28.7%) |
| 25 to 34 Years | 26 (21.3%) | 0 (0.0%) |
| 35 to 44 Years | 1 (0.3%) | 20 (5.9%) |
| 45 to 54 Years | 2 (0.8%) | 37 (10.8%) |
| 55 to 64 Years | 11 (2.8%) | 7 (1.3%) |
| 65 to 74 Years | 0 (0.0%) | 0 (0.0%) |
| 75 Years and over | 7 (2.1%) | 18 (5.9%) |
| Total | 106 (3.9%) | 136 (4.5%) |
Income Above Poverty by Sex and Age in West Concord
According to the poverty statistics in West Concord, males aged under 5 years and females aged under 5 years are the age groups that are most secure financially, with 100.0% of males and 100.0% of females in these age groups living above the poverty line.
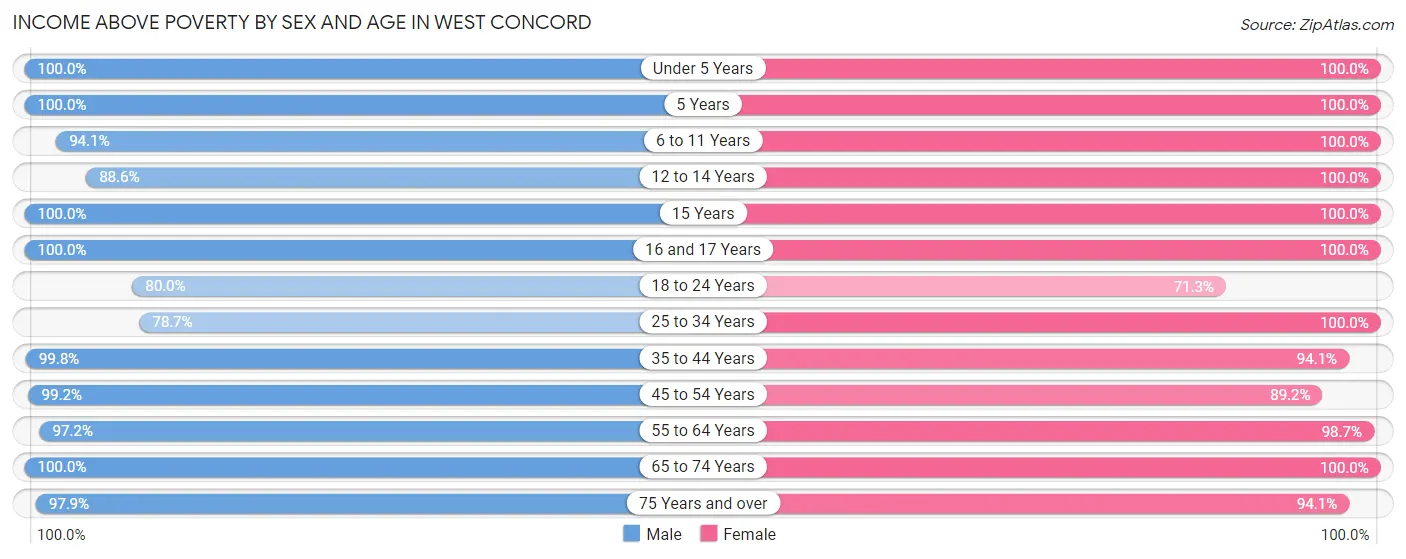
| Age Bracket | Male | Female |
| Under 5 Years | 209 (100.0%) | 126 (100.0%) |
| 5 Years | 86 (100.0%) | 32 (100.0%) |
| 6 to 11 Years | 192 (94.1%) | 123 (100.0%) |
| 12 to 14 Years | 116 (88.5%) | 111 (100.0%) |
| 15 Years | 54 (100.0%) | 33 (100.0%) |
| 16 and 17 Years | 47 (100.0%) | 84 (100.0%) |
| 18 to 24 Years | 128 (80.0%) | 134 (71.3%) |
| 25 to 34 Years | 96 (78.7%) | 262 (100.0%) |
| 35 to 44 Years | 400 (99.8%) | 320 (94.1%) |
| 45 to 54 Years | 260 (99.2%) | 305 (89.2%) |
| 55 to 64 Years | 384 (97.2%) | 544 (98.7%) |
| 65 to 74 Years | 295 (100.0%) | 499 (100.0%) |
| 75 Years and over | 327 (97.9%) | 289 (94.1%) |
| Total | 2,594 (96.1%) | 2,862 (95.5%) |
Income Below Poverty Among Married-Couple Families in West Concord
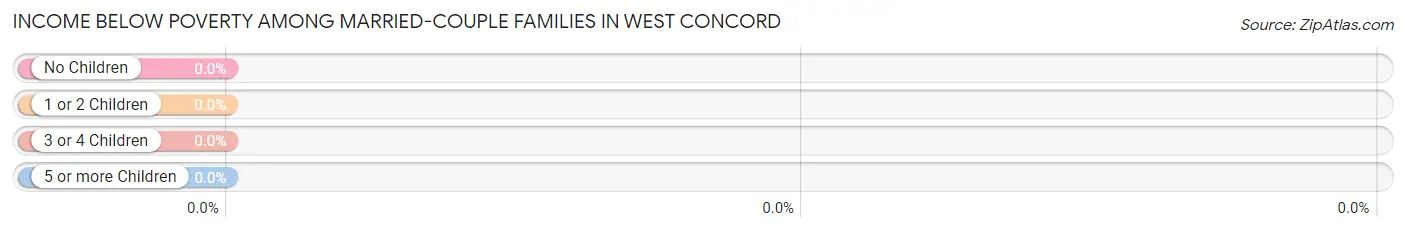
| Children | Above Poverty | Below Poverty |
| No Children | 654 (100.0%) | 0 (0.0%) |
| 1 or 2 Children | 457 (100.0%) | 0 (0.0%) |
| 3 or 4 Children | 56 (100.0%) | 0 (0.0%) |
| 5 or more Children | 0 (0.0%) | 0 (0.0%) |
| Total | 1,167 (100.0%) | 0 (0.0%) |
Income Below Poverty Among Single-Parent Households in West Concord
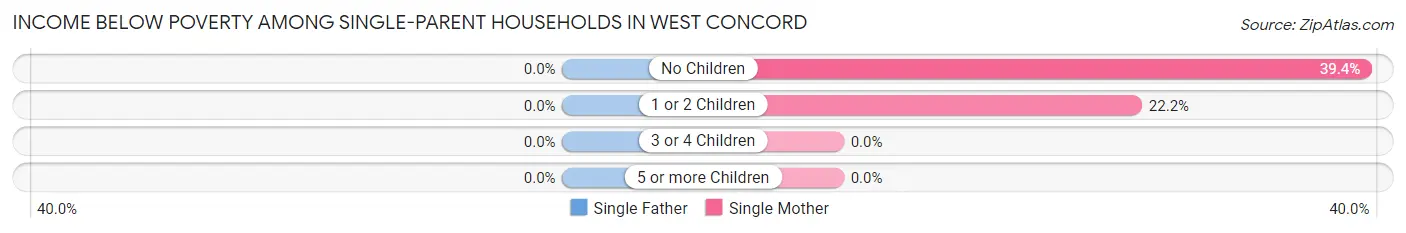
| Children | Single Father | Single Mother |
| No Children | 0 (0.0%) | 37 (39.4%) |
| 1 or 2 Children | 0 (0.0%) | 20 (22.2%) |
| 3 or 4 Children | 0 (0.0%) | 0 (0.0%) |
| 5 or more Children | 0 (0.0%) | 0 (0.0%) |
| Total | 0 (0.0%) | 57 (31.0%) |
Income Below Poverty Among Married-Couple vs Single-Parent Households in West Concord
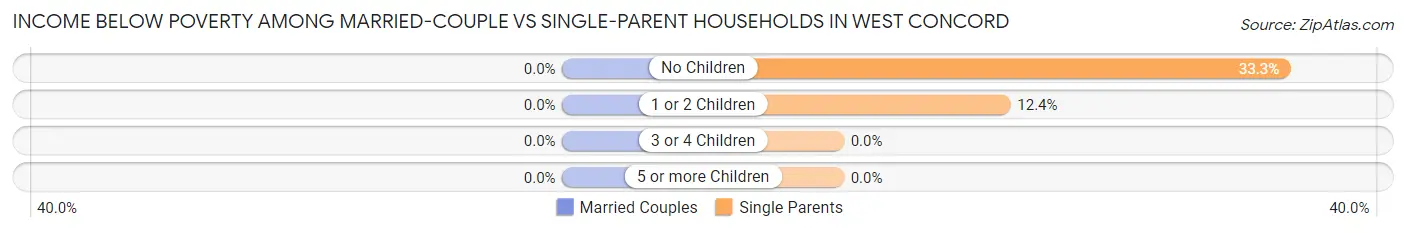
| Children | Married-Couple Families | Single-Parent Households |
| No Children | 0 (0.0%) | 37 (33.3%) |
| 1 or 2 Children | 0 (0.0%) | 20 (12.4%) |
| 3 or 4 Children | 0 (0.0%) | 0 (0.0%) |
| 5 or more Children | 0 (0.0%) | 0 (0.0%) |
| Total | 0 (0.0%) | 57 (21.0%) |
Race in West Concord
The most populous races in West Concord are White / Caucasian (4,972 | 77.1%), Hispanic or Latino (575 | 8.9%), and Black / African American (494 | 7.7%).
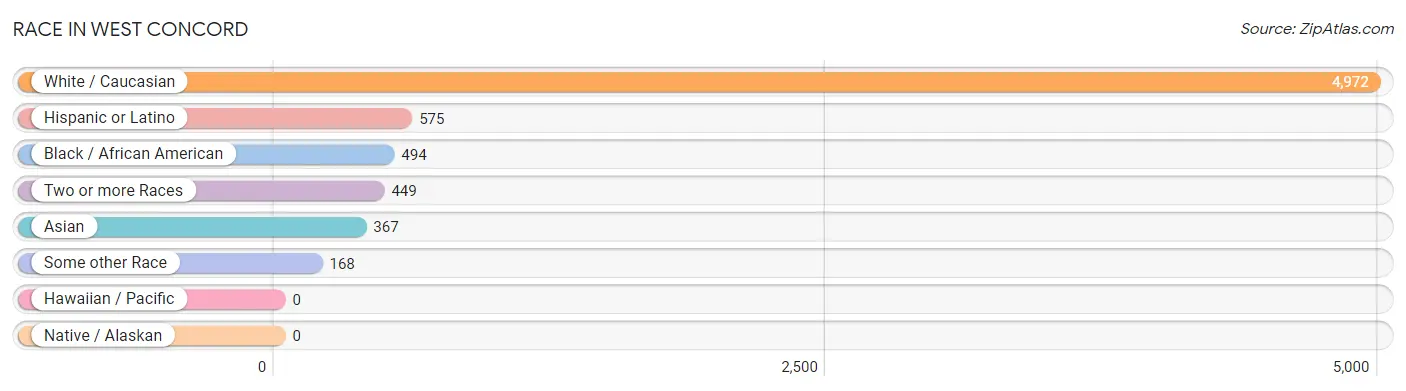
| Race | # Population | % Population |
| Asian | 367 | 5.7% |
| Black / African American | 494 | 7.7% |
| Hawaiian / Pacific | 0 | 0.0% |
| Hispanic or Latino | 575 | 8.9% |
| Native / Alaskan | 0 | 0.0% |
| White / Caucasian | 4,972 | 77.1% |
| Two or more Races | 449 | 7.0% |
| Some other Race | 168 | 2.6% |
| Total | 6,450 | 100.0% |
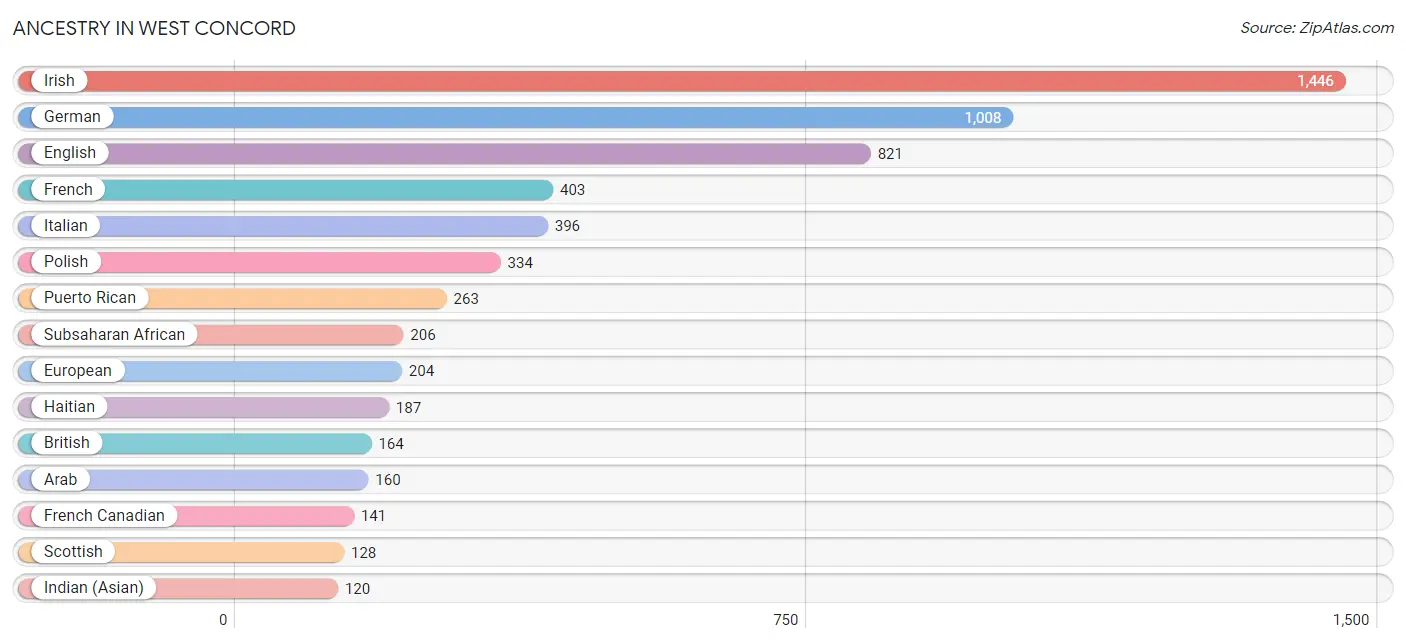
Ancestry in West Concord
The most populous ancestries reported in West Concord are Irish (1,446 | 22.4%), German (1,008 | 15.6%), English (821 | 12.7%), French (403 | 6.2%), and Italian (396 | 6.1%), together accounting for 63.2% of all West Concord residents.
| Ancestry | # Population | % Population |
| African | 11 | 0.2% |
| American | 67 | 1.0% |
| Arab | 160 | 2.5% |
| Armenian | 73 | 1.1% |
| Bhutanese | 90 | 1.4% |
| British | 164 | 2.5% |
| Bulgarian | 39 | 0.6% |
| Burmese | 50 | 0.8% |
| Canadian | 74 | 1.1% |
| Cape Verdean | 93 | 1.4% |
| Central American | 7 | 0.1% |
| Cherokee | 59 | 0.9% |
| Cheyenne | 5 | 0.1% |
| Colombian | 32 | 0.5% |
| Cuban | 35 | 0.5% |
| Danish | 51 | 0.8% |
| Dominican | 13 | 0.2% |
| Dutch | 84 | 1.3% |
| Eastern European | 114 | 1.8% |
| Egyptian | 45 | 0.7% |
| English | 821 | 12.7% |
| Ethiopian | 17 | 0.3% |
| European | 204 | 3.2% |
| Finnish | 100 | 1.5% |
| French | 403 | 6.2% |
| French Canadian | 141 | 2.2% |
| German | 1,008 | 15.6% |
| Greek | 54 | 0.8% |
| Haitian | 187 | 2.9% |
| Honduran | 1 | 0.0% |
| Hopi | 8 | 0.1% |
| Hungarian | 41 | 0.6% |
| Indian (Asian) | 120 | 1.9% |
| Irish | 1,446 | 22.4% |
| Italian | 396 | 6.1% |
| Korean | 43 | 0.7% |
| Liberian | 80 | 1.2% |
| Lithuanian | 42 | 0.6% |
| Malaysian | 10 | 0.2% |
| Mexican | 119 | 1.8% |
| Nigerian | 5 | 0.1% |
| Northern European | 31 | 0.5% |
| Norwegian | 45 | 0.7% |
| Palestinian | 115 | 1.8% |
| Paraguayan | 6 | 0.1% |
| Polish | 334 | 5.2% |
| Portuguese | 116 | 1.8% |
| Puerto Rican | 263 | 4.1% |
| Russian | 39 | 0.6% |
| Salvadoran | 6 | 0.1% |
| Scandinavian | 13 | 0.2% |
| Scotch-Irish | 38 | 0.6% |
| Scottish | 128 | 2.0% |
| Sioux | 12 | 0.2% |
| Slovak | 58 | 0.9% |
| South American | 61 | 0.9% |
| Spaniard | 11 | 0.2% |
| Spanish | 31 | 0.5% |
| Sri Lankan | 54 | 0.8% |
| Subsaharan African | 206 | 3.2% |
| Swedish | 30 | 0.5% |
| Swiss | 30 | 0.5% |
| Thai | 105 | 1.6% |
| Trinidadian and Tobagonian | 8 | 0.1% |
| Ukrainian | 42 | 0.6% |
| Venezuelan | 23 | 0.4% |
| Welsh | 22 | 0.3% | View All 67 Rows |
Immigrants in West Concord
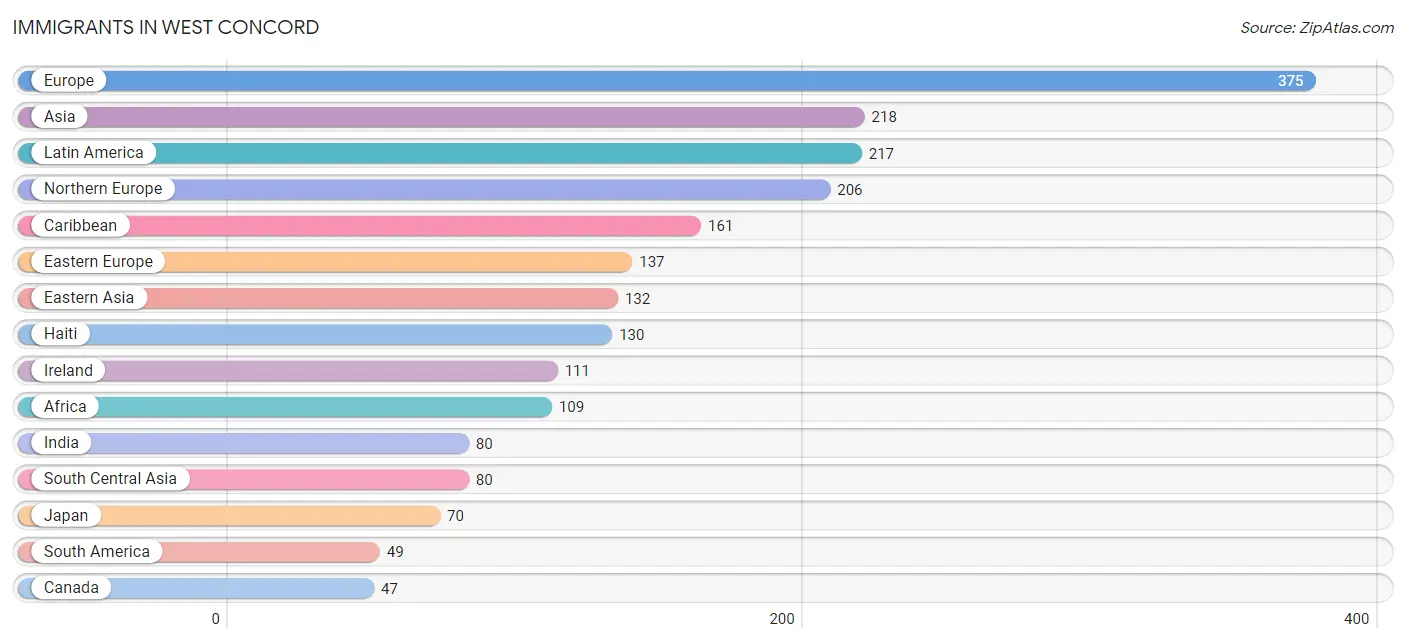
The most numerous immigrant groups reported in West Concord came from Europe (375 | 5.8%), Asia (218 | 3.4%), Latin America (217 | 3.4%), Northern Europe (206 | 3.2%), and Caribbean (161 | 2.5%), together accounting for 18.2% of all West Concord residents.
| Immigration Origin | # Population | % Population |
| Africa | 109 | 1.7% |
| Asia | 218 | 3.4% |
| Bulgaria | 27 | 0.4% |
| Canada | 47 | 0.7% |
| Caribbean | 161 | 2.5% |
| Central America | 7 | 0.1% |
| China | 36 | 0.6% |
| Colombia | 32 | 0.5% |
| Cuba | 24 | 0.4% |
| Czechoslovakia | 42 | 0.6% |
| Dominican Republic | 7 | 0.1% |
| Eastern Africa | 17 | 0.3% |
| Eastern Asia | 132 | 2.1% |
| Eastern Europe | 137 | 2.1% |
| Egypt | 45 | 0.7% |
| El Salvador | 6 | 0.1% |
| England | 13 | 0.2% |
| Ethiopia | 17 | 0.3% |
| Europe | 375 | 5.8% |
| Germany | 11 | 0.2% |
| Haiti | 130 | 2.0% |
| Honduras | 1 | 0.0% |
| India | 80 | 1.2% |
| Ireland | 111 | 1.7% |
| Japan | 70 | 1.1% |
| Korea | 26 | 0.4% |
| Latin America | 217 | 3.4% |
| Liberia | 42 | 0.6% |
| Lithuania | 30 | 0.5% |
| Netherlands | 21 | 0.3% |
| Nigeria | 5 | 0.1% |
| Northern Africa | 45 | 0.7% |
| Northern Europe | 206 | 3.2% |
| Russia | 14 | 0.2% |
| South America | 49 | 0.8% |
| South Central Asia | 80 | 1.2% |
| South Eastern Asia | 6 | 0.1% |
| Taiwan | 17 | 0.3% |
| Ukraine | 24 | 0.4% |
| Venezuela | 11 | 0.2% |
| Vietnam | 6 | 0.1% |
| Western Africa | 47 | 0.7% |
| Western Europe | 32 | 0.5% | View All 43 Rows |
Sex and Age in West Concord
Sex and Age in West Concord
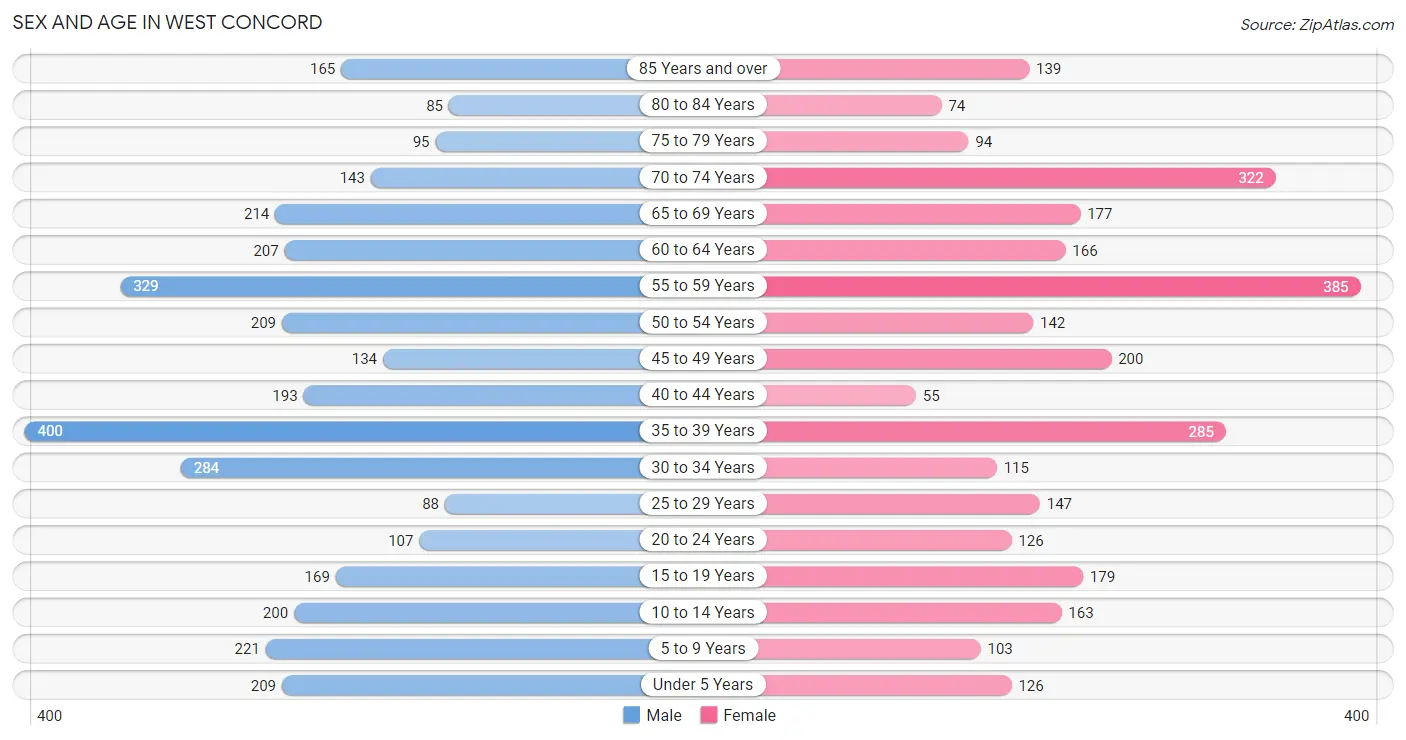
The most populous age groups in West Concord are 35 to 39 Years (400 | 11.6%) for men and 55 to 59 Years (385 | 12.8%) for women.
| Age Bracket | Male | Female |
| Under 5 Years | 209 (6.0%) | 126 (4.2%) |
| 5 to 9 Years | 221 (6.4%) | 103 (3.4%) |
| 10 to 14 Years | 200 (5.8%) | 163 (5.4%) |
| 15 to 19 Years | 169 (4.9%) | 179 (6.0%) |
| 20 to 24 Years | 107 (3.1%) | 126 (4.2%) |
| 25 to 29 Years | 88 (2.5%) | 147 (4.9%) |
| 30 to 34 Years | 284 (8.2%) | 115 (3.8%) |
| 35 to 39 Years | 400 (11.6%) | 285 (9.5%) |
| 40 to 44 Years | 193 (5.6%) | 55 (1.8%) |
| 45 to 49 Years | 134 (3.9%) | 200 (6.7%) |
| 50 to 54 Years | 209 (6.0%) | 142 (4.7%) |
| 55 to 59 Years | 329 (9.5%) | 385 (12.8%) |
| 60 to 64 Years | 207 (6.0%) | 166 (5.5%) |
| 65 to 69 Years | 214 (6.2%) | 177 (5.9%) |
| 70 to 74 Years | 143 (4.1%) | 322 (10.7%) |
| 75 to 79 Years | 95 (2.8%) | 94 (3.1%) |
| 80 to 84 Years | 85 (2.5%) | 74 (2.5%) |
| 85 Years and over | 165 (4.8%) | 139 (4.6%) |
| Total | 3,452 (100.0%) | 2,998 (100.0%) |
Families and Households in West Concord
Median Family Size in West Concord
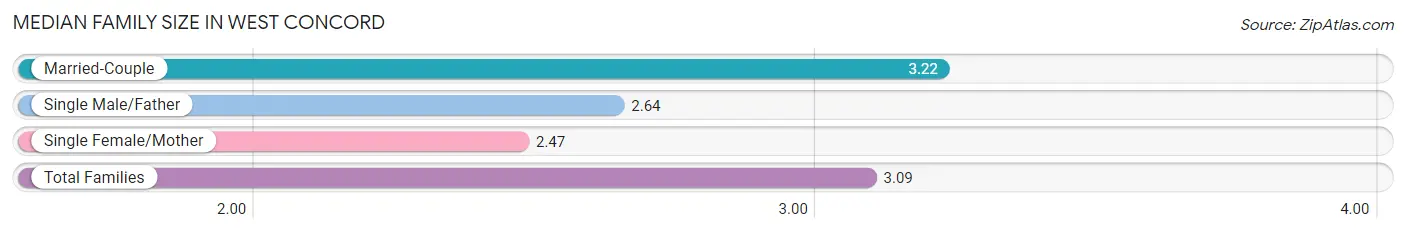
The median family size in West Concord is 3.09 persons per family, with married-couple families (1,167 | 81.1%) accounting for the largest median family size of 3.22 persons per family. On the other hand, single female/mother families (184 | 12.8%) represent the smallest median family size with 2.47 persons per family.
| Family Type | # Families | Family Size |
| Married-Couple | 1,167 (81.1%) | 3.22 |
| Single Male/Father | 88 (6.1%) | 2.64 |
| Single Female/Mother | 184 (12.8%) | 2.47 |
| Total Families | 1,439 (100.0%) | 3.09 |
Median Household Size in West Concord
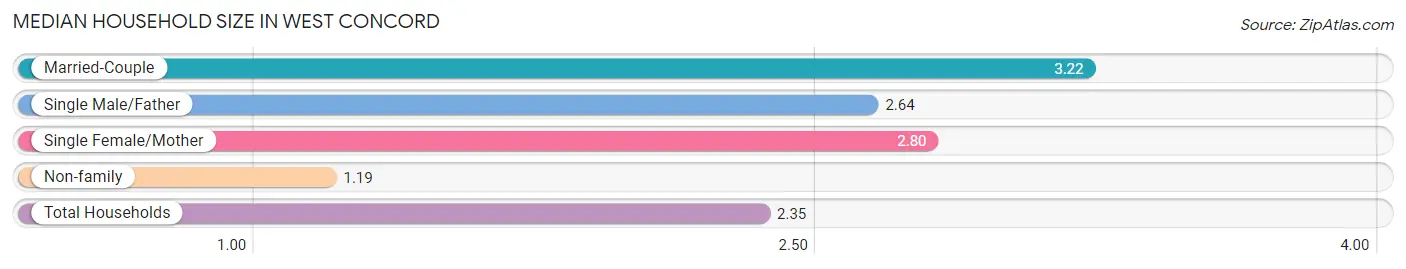
The median household size in West Concord is 2.35 persons per household, with married-couple households (1,167 | 48.2%) accounting for the largest median household size of 3.22 persons per household. non-family households (981 | 40.5%) represent the smallest median household size with 1.19 persons per household.
| Household Type | # Households | Household Size |
| Married-Couple | 1,167 (48.2%) | 3.22 |
| Single Male/Father | 88 (3.6%) | 2.64 |
| Single Female/Mother | 184 (7.6%) | 2.80 |
| Non-family | 981 (40.5%) | 1.19 |
| Total Households | 2,420 (100.0%) | 2.35 |
Household Size by Marriage Status in West Concord
Out of a total of 2,420 households in West Concord, 1,439 (59.5%) are family households, while 981 (40.5%) are nonfamily households. The most numerous type of family households are 2-person households, comprising 535, and the most common type of nonfamily households are 1-person households, comprising 803.
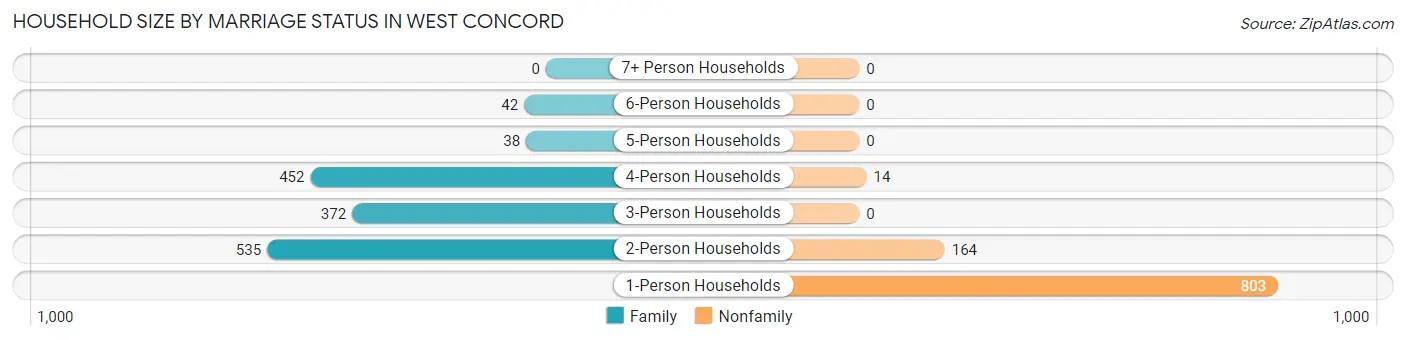
| Household Size | Family Households | Nonfamily Households |
| 1-Person Households | - | 803 (33.2%) |
| 2-Person Households | 535 (22.1%) | 164 (6.8%) |
| 3-Person Households | 372 (15.4%) | 0 (0.0%) |
| 4-Person Households | 452 (18.7%) | 14 (0.6%) |
| 5-Person Households | 38 (1.6%) | 0 (0.0%) |
| 6-Person Households | 42 (1.7%) | 0 (0.0%) |
| 7+ Person Households | 0 (0.0%) | 0 (0.0%) |
| Total | 1,439 (59.5%) | 981 (40.5%) |
Female Fertility in West Concord
Fertility by Age in West Concord
Average fertility rate in West Concord is 77.0 births per 1,000 women. Women in the age bracket of 20 to 34 years have the highest fertility rate with 162.0 births per 1,000 women. Women in the age bracket of 20 to 34 years acount for 72.4% of all women with births.
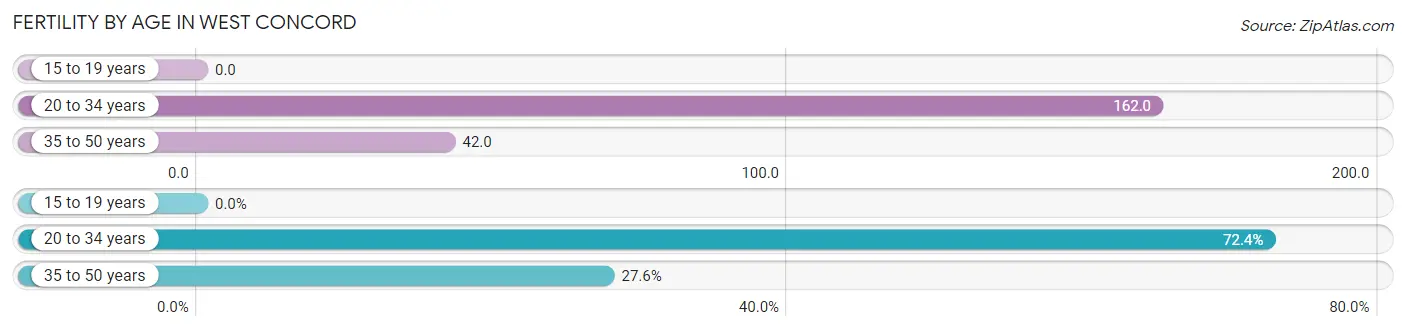
| Age Bracket | Women with Births | Births / 1,000 Women |
| 15 to 19 years | 0 (0.0%) | 0.0 |
| 20 to 34 years | 63 (72.4%) | 162.0 |
| 35 to 50 years | 24 (27.6%) | 42.0 |
| Total | 87 (100.0%) | 77.0 |
Fertility by Age by Marriage Status in West Concord
80.5% of women with births (87) in West Concord are married. The highest percentage of unmarried women with births falls into 20 to 34 years age bracket with 27.0% of them unmarried at the time of birth, while the lowest percentage of unmarried women with births belong to 35 to 50 years age bracket with 0.0% of them unmarried.
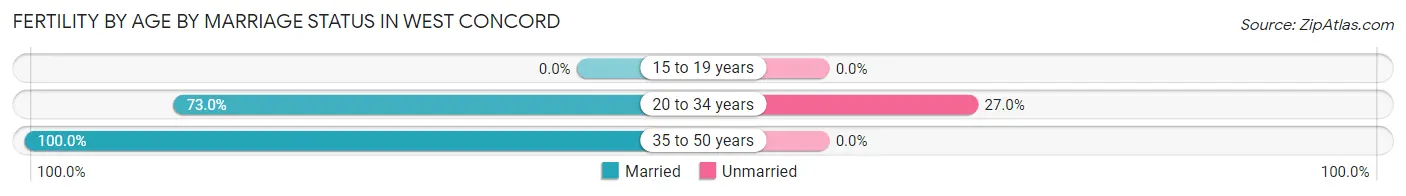
| Age Bracket | Married | Unmarried |
| 15 to 19 years | 0 (0.0%) | 0 (0.0%) |
| 20 to 34 years | 46 (73.0%) | 17 (27.0%) |
| 35 to 50 years | 24 (100.0%) | 0 (0.0%) |
| Total | 70 (80.5%) | 17 (19.5%) |
Fertility by Education in West Concord
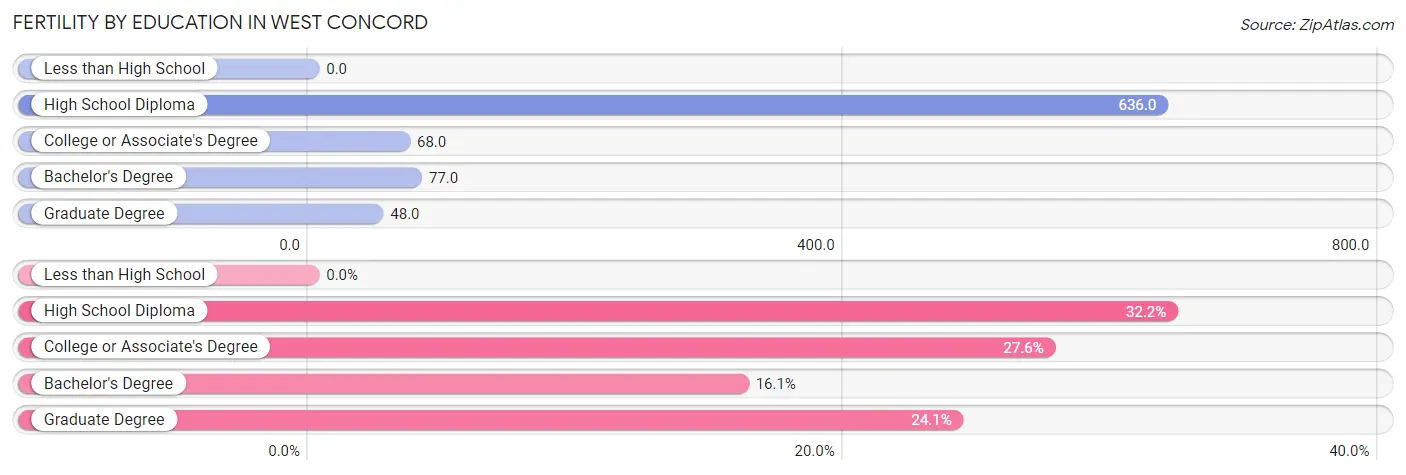
| Educational Attainment | Women with Births | Births / 1,000 Women |
| Less than High School | 0 (0.0%) | 0.0 |
| High School Diploma | 28 (32.2%) | 636.0 |
| College or Associate's Degree | 24 (27.6%) | 68.0 |
| Bachelor's Degree | 14 (16.1%) | 77.0 |
| Graduate Degree | 21 (24.1%) | 48.0 |
| Total | 87 (100.0%) | 77.0 |
Fertility by Education by Marriage Status in West Concord
19.5% of women with births in West Concord are unmarried. Women with the educational attainment of college or associate's degree are most likely to be married with 100.0% of them married at childbirth, while women with the educational attainment of high school diploma are least likely to be married with 60.7% of them unmarried at childbirth.
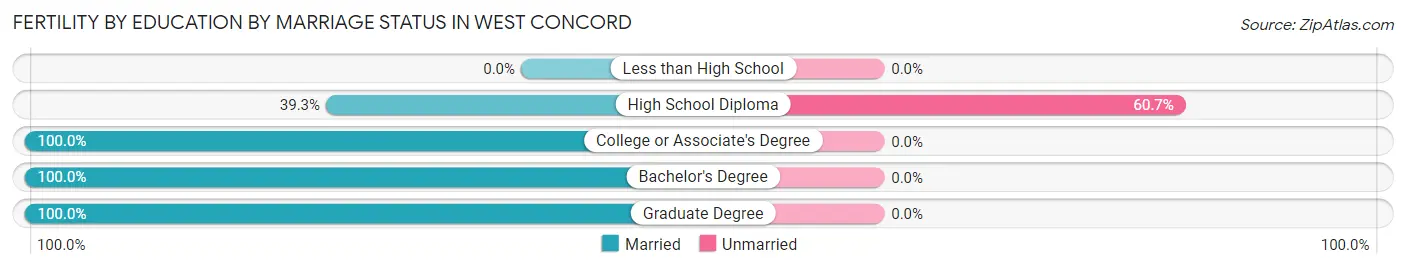
| Educational Attainment | Married | Unmarried |
| Less than High School | 0 (0.0%) | 0 (0.0%) |
| High School Diploma | 11 (39.3%) | 17 (60.7%) |
| College or Associate's Degree | 24 (100.0%) | 0 (0.0%) |
| Bachelor's Degree | 14 (100.0%) | 0 (0.0%) |
| Graduate Degree | 21 (100.0%) | 0 (0.0%) |
| Total | 70 (80.5%) | 17 (19.5%) |
Employment Characteristics in West Concord
Employment by Class of Employer in West Concord
Among the 2,521 employed individuals in West Concord, private company employees (1,493 | 59.2%), not-for-profit organizations (365 | 14.5%), and self-employed (incorporated) (245 | 9.7%) make up the most common classes of employment.
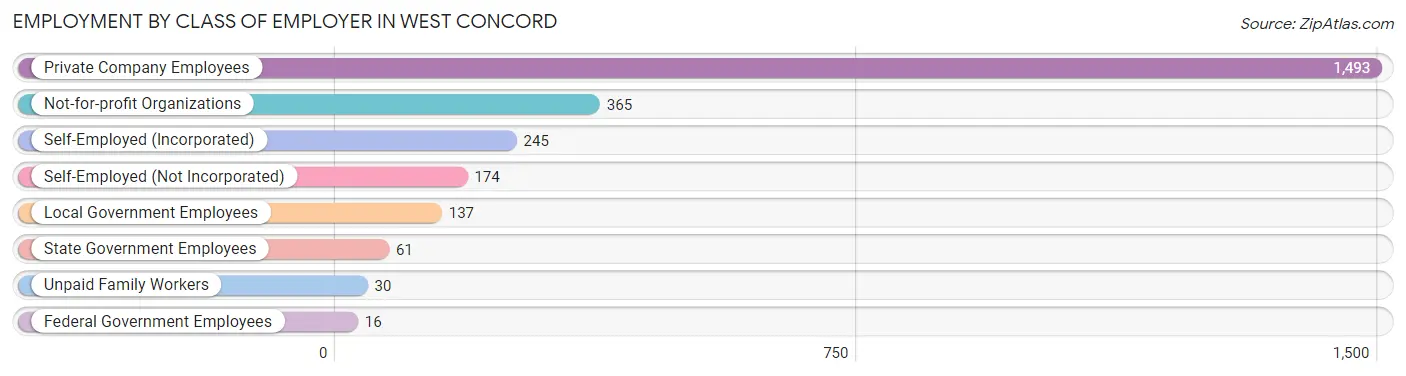
| Employer Class | # Employees | % Employees |
| Private Company Employees | 1,493 | 59.2% |
| Self-Employed (Incorporated) | 245 | 9.7% |
| Self-Employed (Not Incorporated) | 174 | 6.9% |
| Not-for-profit Organizations | 365 | 14.5% |
| Local Government Employees | 137 | 5.4% |
| State Government Employees | 61 | 2.4% |
| Federal Government Employees | 16 | 0.6% |
| Unpaid Family Workers | 30 | 1.2% |
| Total | 2,521 | 100.0% |
Employment Status by Age in West Concord
According to the labor force statistics for West Concord, out of the total population over 16 years of age (5,341), 50.6% or 2,703 individuals are in the labor force, with 5.0% or 135 of them unemployed. The age group with the highest labor force participation rate is 60 to 64 years, with 82.3% or 307 individuals in the labor force. Within the labor force, the 20 to 24 years age range has the highest percentage of unemployed individuals, with 14.9% or 17 of them being unemployed.
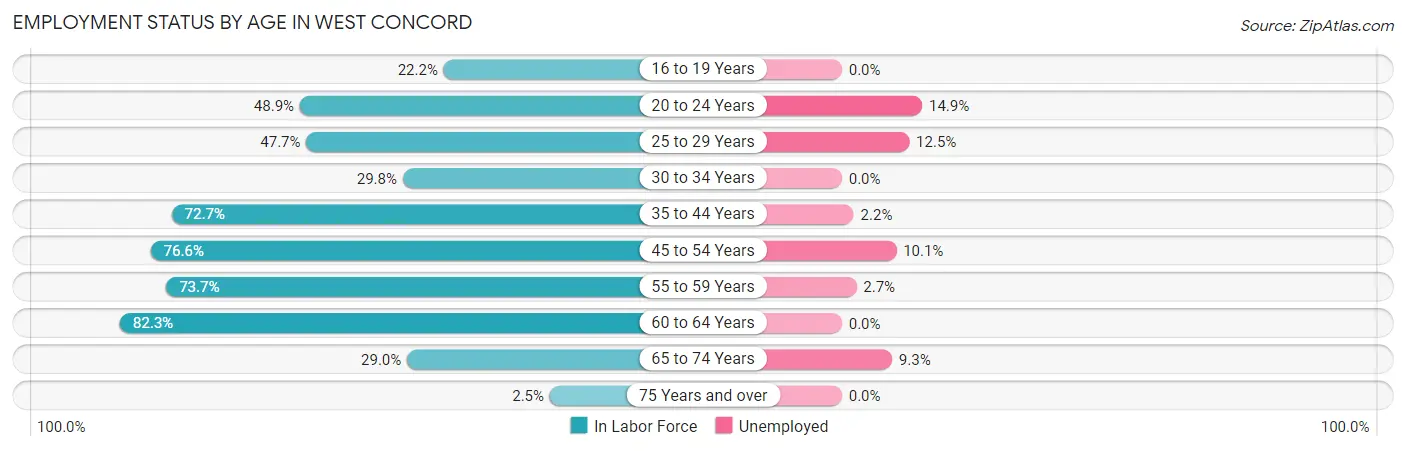
| Age Bracket | In Labor Force | Unemployed |
| 16 to 19 Years | 58 (22.2%) | 0 (0.0%) |
| 20 to 24 Years | 114 (48.9%) | 17 (14.9%) |
| 25 to 29 Years | 112 (47.7%) | 14 (12.5%) |
| 30 to 34 Years | 119 (29.8%) | 0 (0.0%) |
| 35 to 44 Years | 678 (72.7%) | 15 (2.2%) |
| 45 to 54 Years | 525 (76.6%) | 53 (10.1%) |
| 55 to 59 Years | 526 (73.7%) | 14 (2.7%) |
| 60 to 64 Years | 307 (82.3%) | 0 (0.0%) |
| 65 to 74 Years | 248 (29.0%) | 23 (9.3%) |
| 75 Years and over | 16 (2.5%) | 0 (0.0%) |
| Total | 2,703 (50.6%) | 135 (5.0%) |
Employment Status by Educational Attainment in West Concord
According to labor force statistics for West Concord, 67.9% of individuals (2,267) out of the total population between 25 and 64 years of age (3,339) are in the labor force, with 4.2% or 95 of them being unemployed. The group with the highest labor force participation rate are those with the educational attainment of bachelor's degree or higher, with 89.9% or 1,984 individuals in the labor force. Within the labor force, individuals with college / associate degree education have the highest percentage of unemployment, with 17.2% or 37 of them being unemployed.
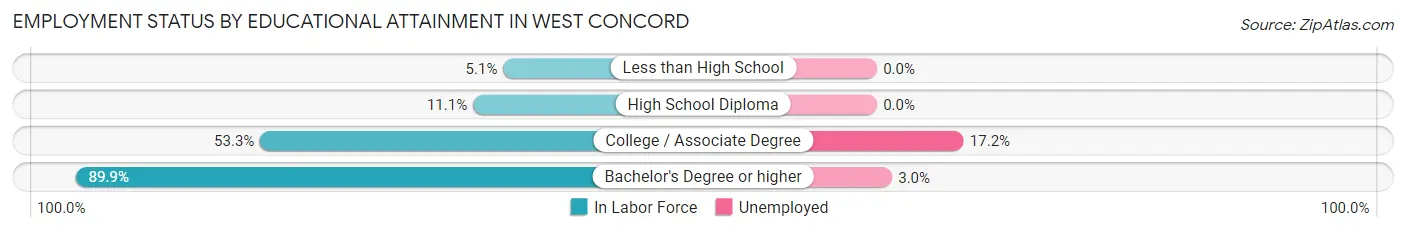
| Educational Attainment | In Labor Force | Unemployed |
| Less than High School | 11 (5.1%) | 0 (0.0%) |
| High School Diploma | 57 (11.1%) | 0 (0.0%) |
| College / Associate Degree | 215 (53.3%) | 69 (17.2%) |
| Bachelor's Degree or higher | 1,984 (89.9%) | 66 (3.0%) |
| Total | 2,267 (67.9%) | 140 (4.2%) |
Employment Occupations by Sex in West Concord
Management, Business, Science and Arts Occupations
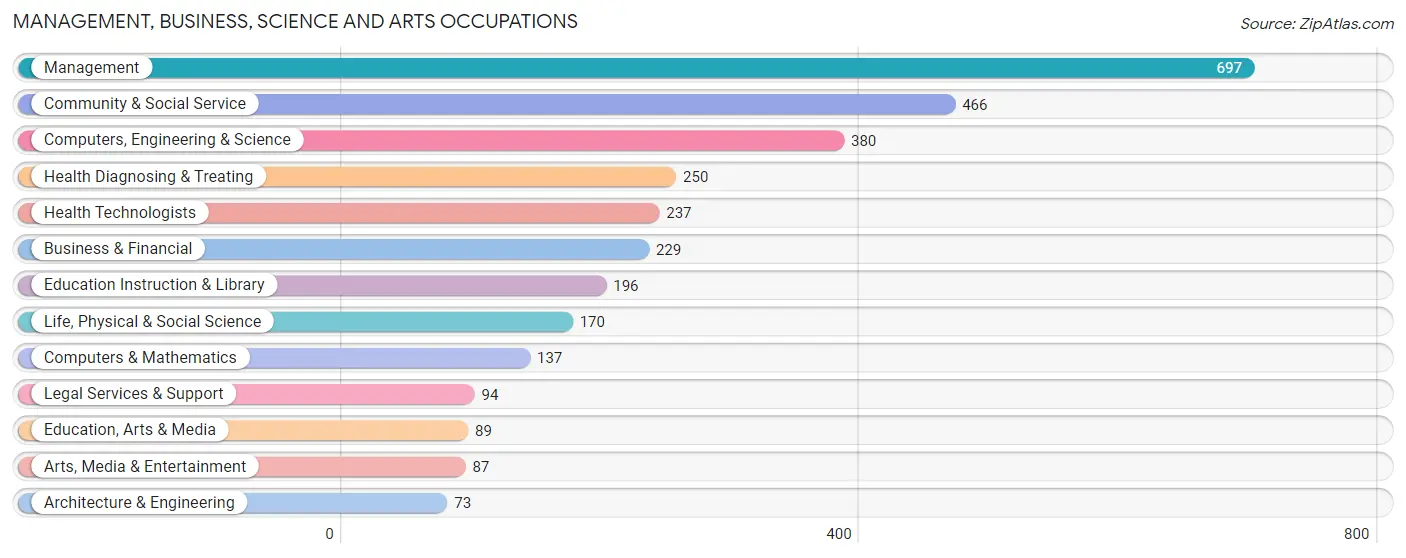
The most common Management, Business, Science and Arts occupations in West Concord are Management (697 | 27.2%), Community & Social Service (466 | 18.1%), Computers, Engineering & Science (380 | 14.8%), Health Diagnosing & Treating (250 | 9.7%), and Health Technologists (237 | 9.2%).
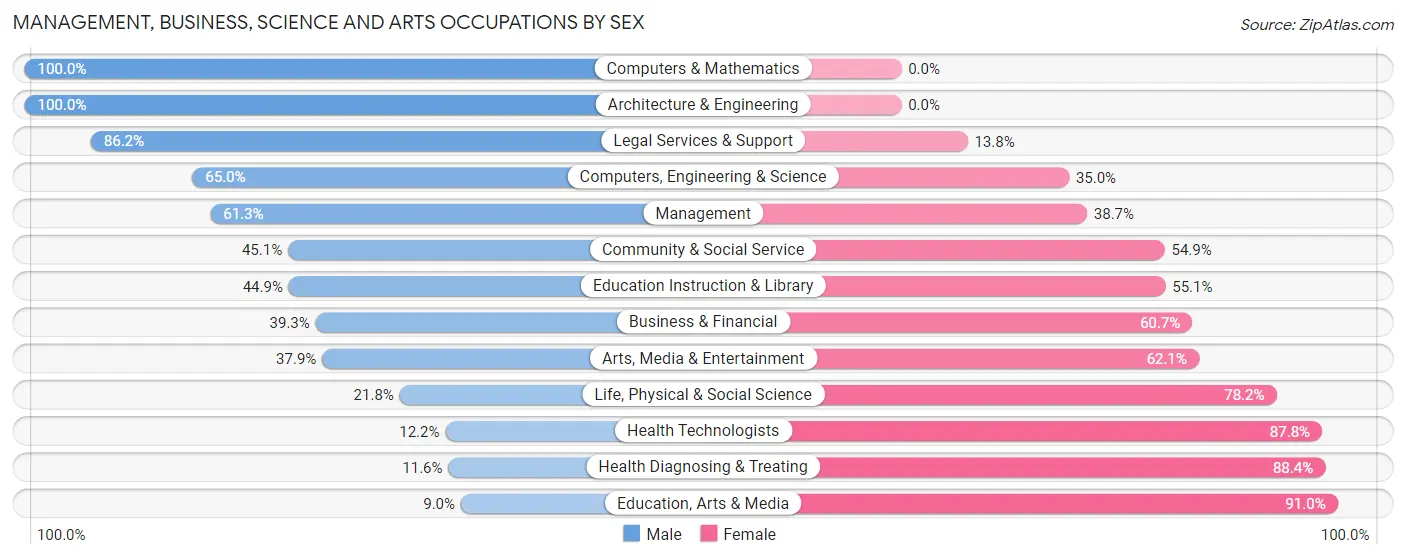
Management, Business, Science and Arts Occupations by Sex
Within the Management, Business, Science and Arts occupations in West Concord, the most male-oriented occupations are Computers & Mathematics (100.0%), Architecture & Engineering (100.0%), and Legal Services & Support (86.2%), while the most female-oriented occupations are Education, Arts & Media (91.0%), Health Diagnosing & Treating (88.4%), and Health Technologists (87.8%).
| Occupation | Male | Female |
| Management | 427 (61.3%) | 270 (38.7%) |
| Business & Financial | 90 (39.3%) | 139 (60.7%) |
| Computers, Engineering & Science | 247 (65.0%) | 133 (35.0%) |
| Computers & Mathematics | 137 (100.0%) | 0 (0.0%) |
| Architecture & Engineering | 73 (100.0%) | 0 (0.0%) |
| Life, Physical & Social Science | 37 (21.8%) | 133 (78.2%) |
| Community & Social Service | 210 (45.1%) | 256 (54.9%) |
| Education, Arts & Media | 8 (9.0%) | 81 (91.0%) |
| Legal Services & Support | 81 (86.2%) | 13 (13.8%) |
| Education Instruction & Library | 88 (44.9%) | 108 (55.1%) |
| Arts, Media & Entertainment | 33 (37.9%) | 54 (62.1%) |
| Health Diagnosing & Treating | 29 (11.6%) | 221 (88.4%) |
| Health Technologists | 29 (12.2%) | 208 (87.8%) |
| Total (Category) | 1,003 (49.6%) | 1,019 (50.4%) |
| Total (Overall) | 1,193 (46.5%) | 1,374 (53.5%) |
Services Occupations
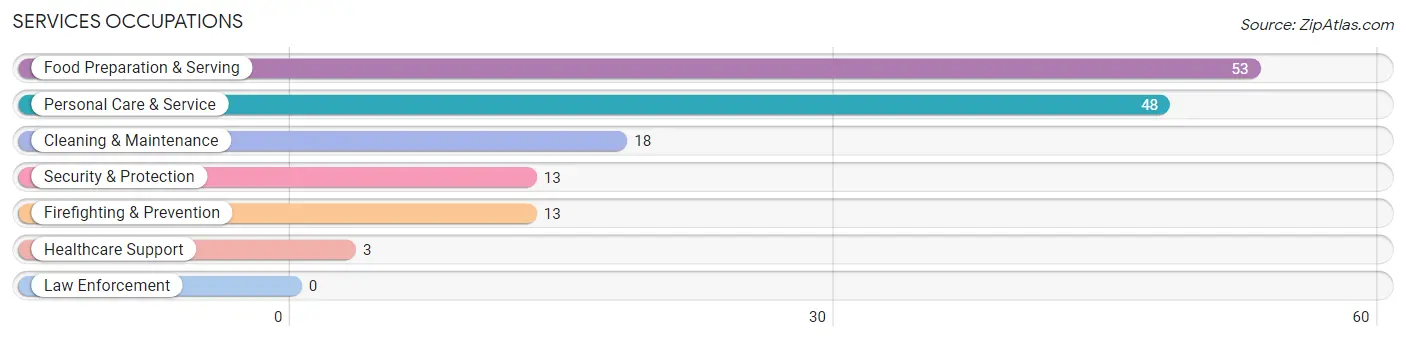
The most common Services occupations in West Concord are Food Preparation & Serving (53 | 2.1%), Personal Care & Service (48 | 1.9%), Cleaning & Maintenance (18 | 0.7%), Security & Protection (13 | 0.5%), and Firefighting & Prevention (13 | 0.5%).
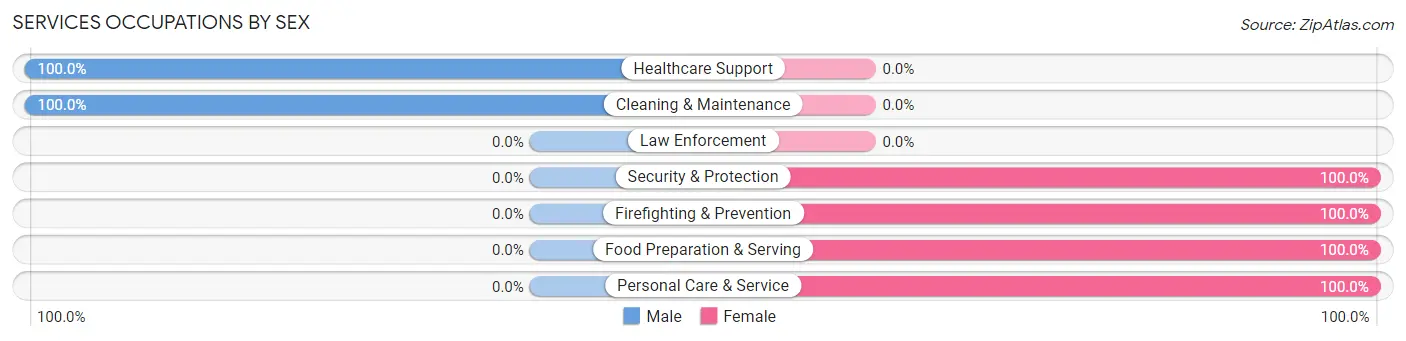
Services Occupations by Sex
Within the Services occupations in West Concord, the most male-oriented occupations are Healthcare Support (100.0%), and Cleaning & Maintenance (100.0%), while the most female-oriented occupations are Security & Protection (100.0%), Firefighting & Prevention (100.0%), and Food Preparation & Serving (100.0%).
| Occupation | Male | Female |
| Healthcare Support | 3 (100.0%) | 0 (0.0%) |
| Security & Protection | 0 (0.0%) | 13 (100.0%) |
| Firefighting & Prevention | 0 (0.0%) | 13 (100.0%) |
| Law Enforcement | 0 (0.0%) | 0 (0.0%) |
| Food Preparation & Serving | 0 (0.0%) | 53 (100.0%) |
| Cleaning & Maintenance | 18 (100.0%) | 0 (0.0%) |
| Personal Care & Service | 0 (0.0%) | 48 (100.0%) |
| Total (Category) | 21 (15.6%) | 114 (84.4%) |
| Total (Overall) | 1,193 (46.5%) | 1,374 (53.5%) |
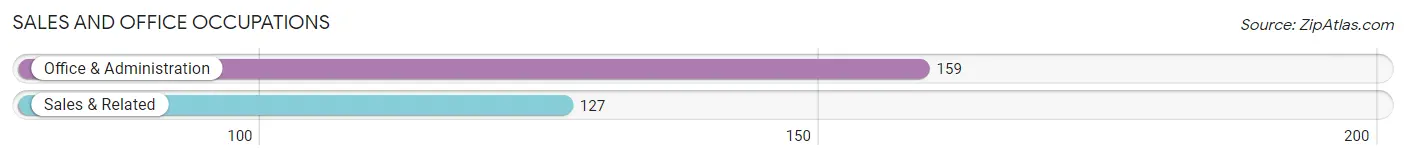
Sales and Office Occupations
The most common Sales and Office occupations in West Concord are Office & Administration (159 | 6.2%), and Sales & Related (127 | 5.0%).
Sales and Office Occupations by Sex
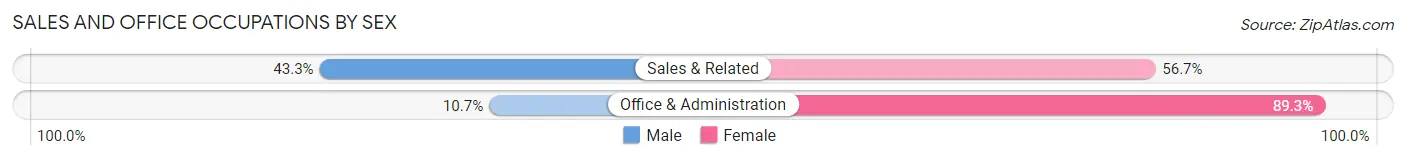
| Occupation | Male | Female |
| Sales & Related | 55 (43.3%) | 72 (56.7%) |
| Office & Administration | 17 (10.7%) | 142 (89.3%) |
| Total (Category) | 72 (25.2%) | 214 (74.8%) |
| Total (Overall) | 1,193 (46.5%) | 1,374 (53.5%) |
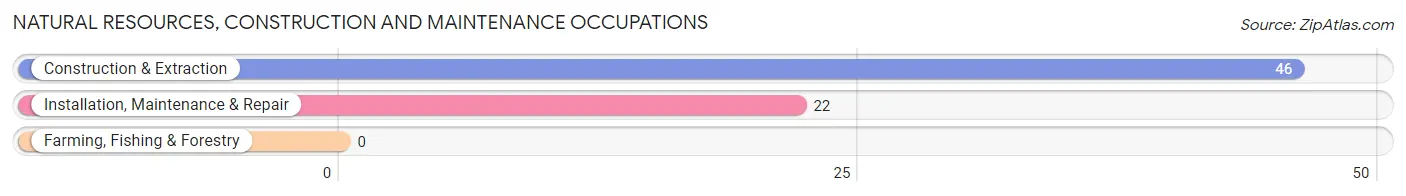
Natural Resources, Construction and Maintenance Occupations
The most common Natural Resources, Construction and Maintenance occupations in West Concord are Construction & Extraction (46 | 1.8%), and Installation, Maintenance & Repair (22 | 0.9%).
Natural Resources, Construction and Maintenance Occupations by Sex
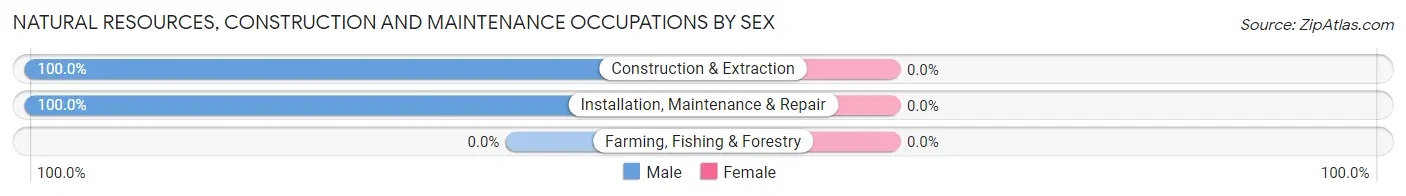
| Occupation | Male | Female |
| Farming, Fishing & Forestry | 0 (0.0%) | 0 (0.0%) |
| Construction & Extraction | 46 (100.0%) | 0 (0.0%) |
| Installation, Maintenance & Repair | 22 (100.0%) | 0 (0.0%) |
| Total (Category) | 68 (100.0%) | 0 (0.0%) |
| Total (Overall) | 1,193 (46.5%) | 1,374 (53.5%) |
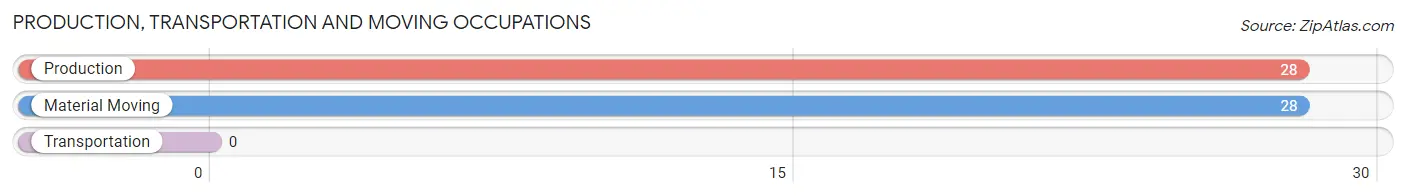
Production, Transportation and Moving Occupations
The most common Production, Transportation and Moving occupations in West Concord are Production (28 | 1.1%), and Material Moving (28 | 1.1%).
Production, Transportation and Moving Occupations by Sex
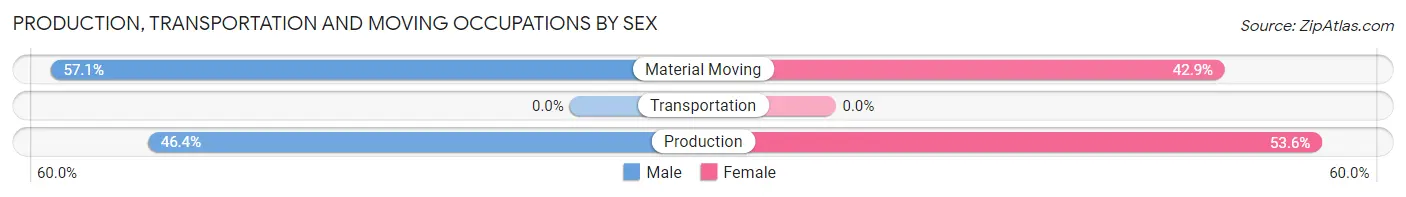
| Occupation | Male | Female |
| Production | 13 (46.4%) | 15 (53.6%) |
| Transportation | 0 (0.0%) | 0 (0.0%) |
| Material Moving | 16 (57.1%) | 12 (42.9%) |
| Total (Category) | 29 (51.8%) | 27 (48.2%) |
| Total (Overall) | 1,193 (46.5%) | 1,374 (53.5%) |
Employment Industries by Sex in West Concord
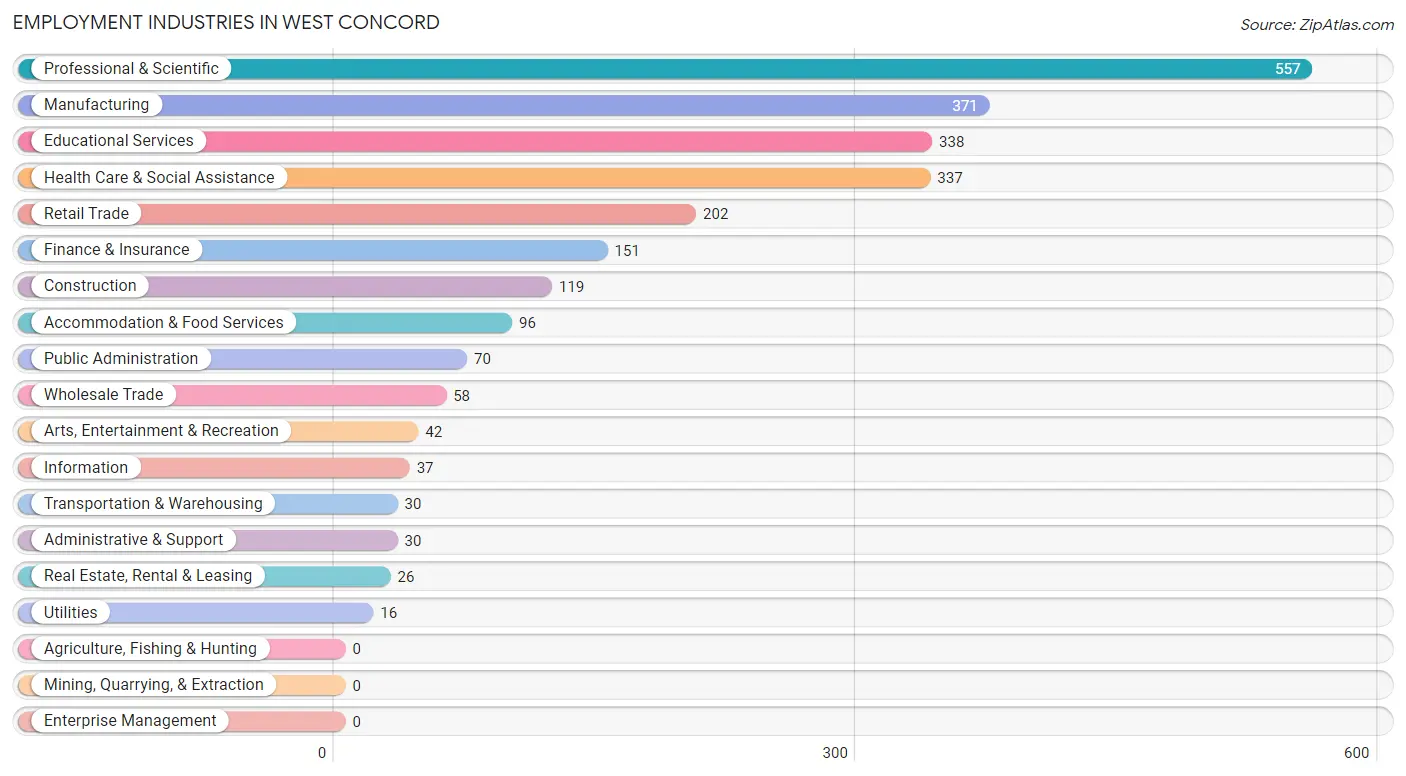
Employment Industries in West Concord
The major employment industries in West Concord include Professional & Scientific (557 | 21.7%), Manufacturing (371 | 14.4%), Educational Services (338 | 13.2%), Health Care & Social Assistance (337 | 13.1%), and Retail Trade (202 | 7.9%).
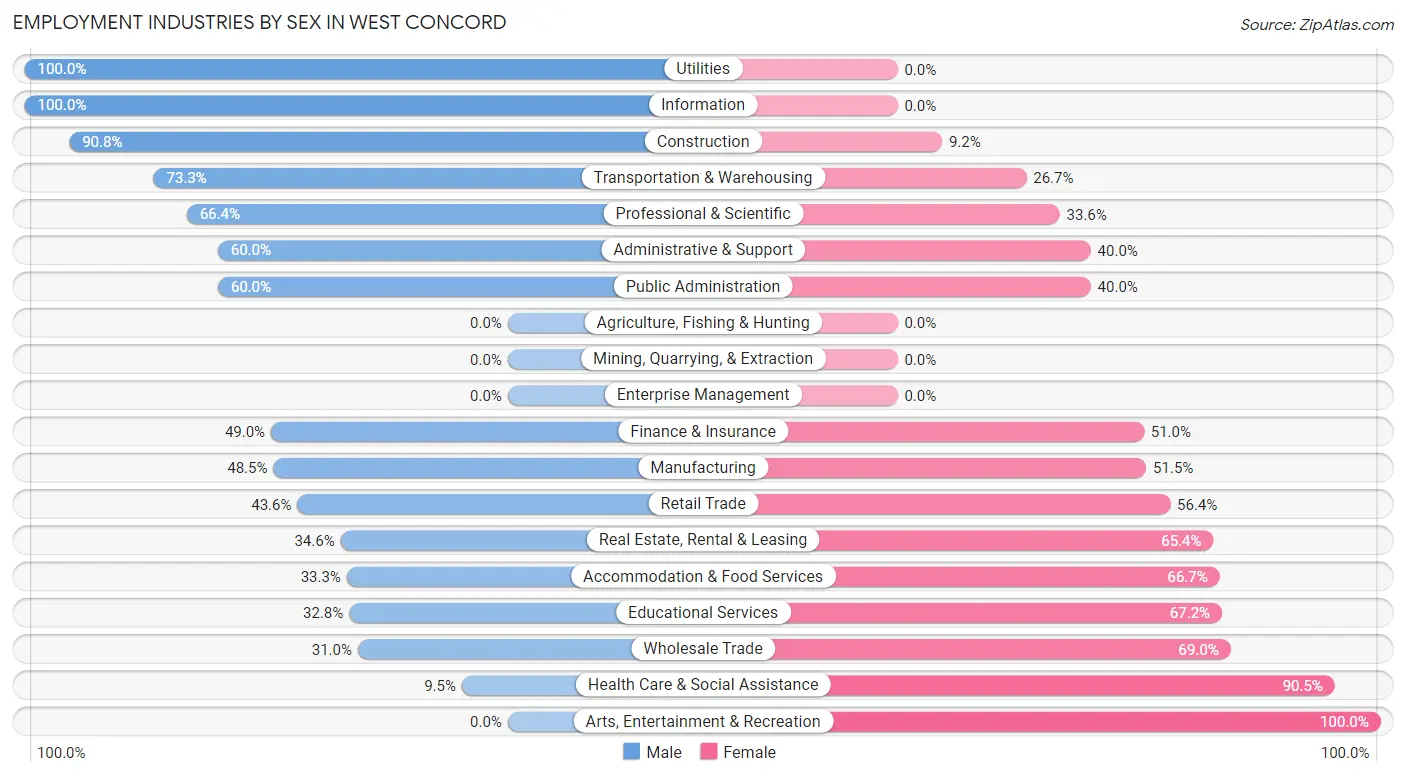
Employment Industries by Sex in West Concord
The West Concord industries that see more men than women are Utilities (100.0%), Information (100.0%), and Construction (90.8%), whereas the industries that tend to have a higher number of women are Arts, Entertainment & Recreation (100.0%), Health Care & Social Assistance (90.5%), and Wholesale Trade (69.0%).
| Industry | Male | Female |
| Agriculture, Fishing & Hunting | 0 (0.0%) | 0 (0.0%) |
| Mining, Quarrying, & Extraction | 0 (0.0%) | 0 (0.0%) |
| Construction | 108 (90.8%) | 11 (9.2%) |
| Manufacturing | 180 (48.5%) | 191 (51.5%) |
| Wholesale Trade | 18 (31.0%) | 40 (69.0%) |
| Retail Trade | 88 (43.6%) | 114 (56.4%) |
| Transportation & Warehousing | 22 (73.3%) | 8 (26.7%) |
| Utilities | 16 (100.0%) | 0 (0.0%) |
| Information | 37 (100.0%) | 0 (0.0%) |
| Finance & Insurance | 74 (49.0%) | 77 (51.0%) |
| Real Estate, Rental & Leasing | 9 (34.6%) | 17 (65.4%) |
| Professional & Scientific | 370 (66.4%) | 187 (33.6%) |
| Enterprise Management | 0 (0.0%) | 0 (0.0%) |
| Administrative & Support | 18 (60.0%) | 12 (40.0%) |
| Educational Services | 111 (32.8%) | 227 (67.2%) |
| Health Care & Social Assistance | 32 (9.5%) | 305 (90.5%) |
| Arts, Entertainment & Recreation | 0 (0.0%) | 42 (100.0%) |
| Accommodation & Food Services | 32 (33.3%) | 64 (66.7%) |
| Public Administration | 42 (60.0%) | 28 (40.0%) |
| Total | 1,193 (46.5%) | 1,374 (53.5%) |
Education in West Concord
School Enrollment in West Concord
The most common levels of schooling among the 1,327 students in West Concord are high school (344 | 25.9%), middle school (266 | 20.1%), and college / undergraduate (242 | 18.2%).
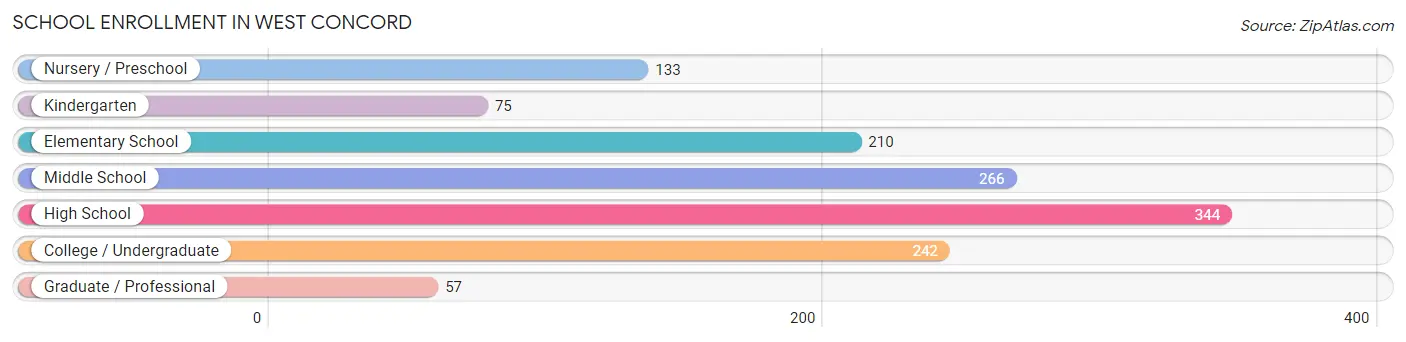
| School Level | # Students | % Students |
| Nursery / Preschool | 133 | 10.0% |
| Kindergarten | 75 | 5.7% |
| Elementary School | 210 | 15.8% |
| Middle School | 266 | 20.1% |
| High School | 344 | 25.9% |
| College / Undergraduate | 242 | 18.2% |
| Graduate / Professional | 57 | 4.3% |
| Total | 1,327 | 100.0% |
School Enrollment by Age by Funding Source in West Concord
Out of a total of 1,327 students who are enrolled in schools in West Concord, 230 (17.3%) attend a private institution, while the remaining 1,097 (82.7%) are enrolled in public schools. The age group of 20 to 24 year olds has the highest likelihood of being enrolled in private schools, with 93 (63.3% in the age bracket) enrolled. Conversely, the age group of 5 to 9 year old has the lowest likelihood of being enrolled in a private school, with 296 (100.0% in the age bracket) attending a public institution.
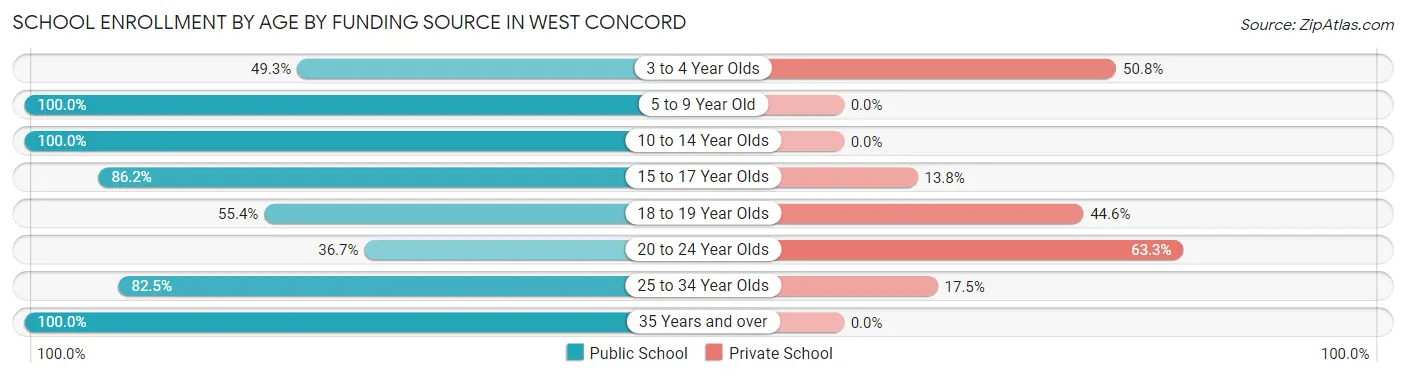
| Age Bracket | Public School | Private School |
| 3 to 4 Year Olds | 33 (49.2%) | 34 (50.7%) |
| 5 to 9 Year Old | 296 (100.0%) | 0 (0.0%) |
| 10 to 14 Year Olds | 334 (100.0%) | 0 (0.0%) |
| 15 to 17 Year Olds | 188 (86.2%) | 30 (13.8%) |
| 18 to 19 Year Olds | 72 (55.4%) | 58 (44.6%) |
| 20 to 24 Year Olds | 54 (36.7%) | 93 (63.3%) |
| 25 to 34 Year Olds | 66 (82.5%) | 14 (17.5%) |
| 35 Years and over | 55 (100.0%) | 0 (0.0%) |
| Total | 1,097 (82.7%) | 230 (17.3%) |
Educational Attainment by Field of Study in West Concord
Business (516 | 14.7%), engineering (452 | 12.9%), social sciences (376 | 10.7%), science & technology (337 | 9.6%), and literature & languages (303 | 8.6%) are the most common fields of study among 3,504 individuals in West Concord who have obtained a bachelor's degree or higher.
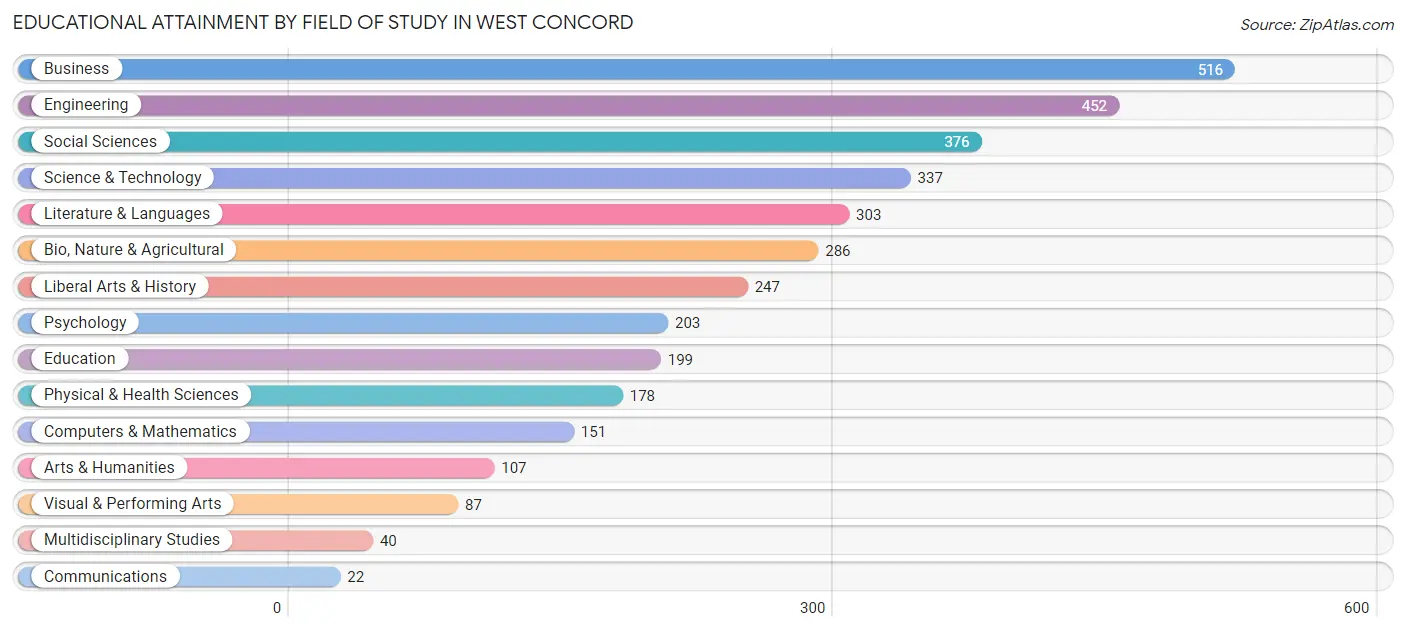
| Field of Study | # Graduates | % Graduates |
| Computers & Mathematics | 151 | 4.3% |
| Bio, Nature & Agricultural | 286 | 8.2% |
| Physical & Health Sciences | 178 | 5.1% |
| Psychology | 203 | 5.8% |
| Social Sciences | 376 | 10.7% |
| Engineering | 452 | 12.9% |
| Multidisciplinary Studies | 40 | 1.1% |
| Science & Technology | 337 | 9.6% |
| Business | 516 | 14.7% |
| Education | 199 | 5.7% |
| Literature & Languages | 303 | 8.6% |
| Liberal Arts & History | 247 | 7.0% |
| Visual & Performing Arts | 87 | 2.5% |
| Communications | 22 | 0.6% |
| Arts & Humanities | 107 | 3.0% |
| Total | 3,504 | 100.0% |
Transportation & Commute in West Concord
Vehicle Availability by Sex in West Concord
The most prevalent vehicle ownership categories in West Concord are males with 2 vehicles (631, accounting for 53.3%) and females with 2 vehicles (703, making up 47.5%).
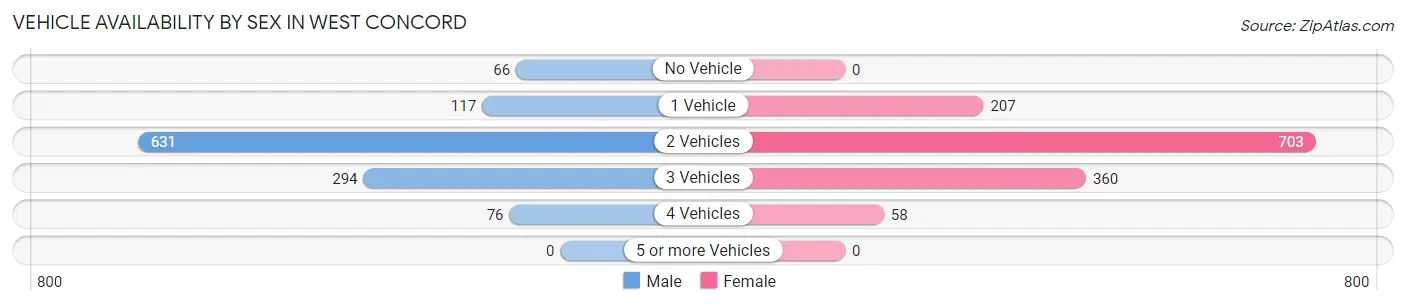
| Vehicles Available | Male | Female |
| No Vehicle | 66 (5.6%) | 0 (0.0%) |
| 1 Vehicle | 117 (9.9%) | 207 (15.6%) |
| 2 Vehicles | 631 (53.3%) | 703 (52.9%) |
| 3 Vehicles | 294 (24.8%) | 360 (27.1%) |
| 4 Vehicles | 76 (6.4%) | 58 (4.4%) |
| 5 or more Vehicles | 0 (0.0%) | 0 (0.0%) |
| Total | 1,184 (100.0%) | 1,328 (100.0%) |
Commute Time in West Concord
The most frequently occuring commute durations in West Concord are 45 to 59 minutes (210 commuters, 10.8%), 10 to 14 minutes (205 commuters, 10.6%), and 25 to 29 minutes (200 commuters, 10.3%).
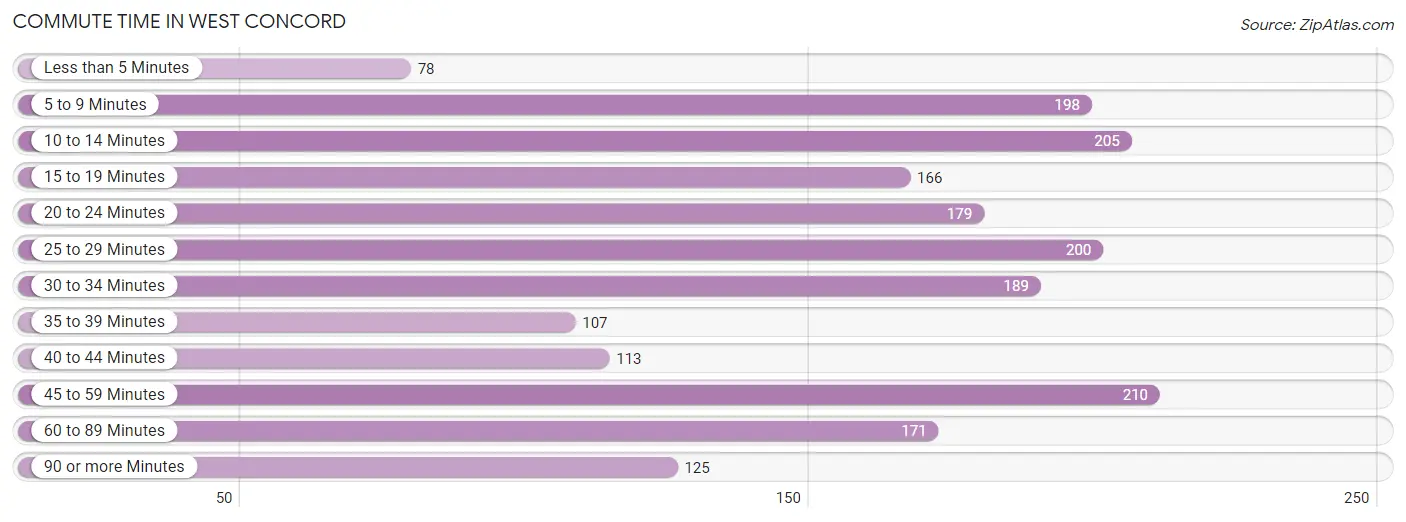
| Commute Time | # Commuters | % Commuters |
| Less than 5 Minutes | 78 | 4.0% |
| 5 to 9 Minutes | 198 | 10.2% |
| 10 to 14 Minutes | 205 | 10.6% |
| 15 to 19 Minutes | 166 | 8.6% |
| 20 to 24 Minutes | 179 | 9.2% |
| 25 to 29 Minutes | 200 | 10.3% |
| 30 to 34 Minutes | 189 | 9.7% |
| 35 to 39 Minutes | 107 | 5.5% |
| 40 to 44 Minutes | 113 | 5.8% |
| 45 to 59 Minutes | 210 | 10.8% |
| 60 to 89 Minutes | 171 | 8.8% |
| 90 or more Minutes | 125 | 6.4% |
Commute Time by Sex in West Concord
The most common commute times in West Concord are 10 to 14 minutes (146 commuters, 17.1%) for males and 5 to 9 minutes (168 commuters, 15.5%) for females.
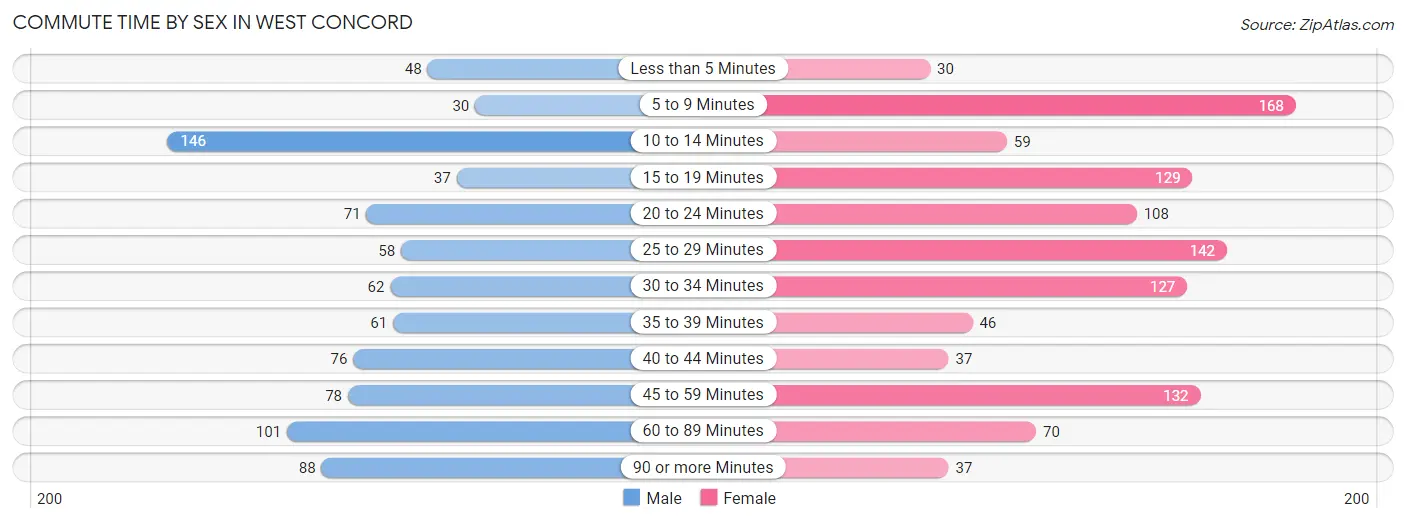
| Commute Time | Male | Female |
| Less than 5 Minutes | 48 (5.6%) | 30 (2.8%) |
| 5 to 9 Minutes | 30 (3.5%) | 168 (15.5%) |
| 10 to 14 Minutes | 146 (17.1%) | 59 (5.4%) |
| 15 to 19 Minutes | 37 (4.3%) | 129 (11.9%) |
| 20 to 24 Minutes | 71 (8.3%) | 108 (10.0%) |
| 25 to 29 Minutes | 58 (6.8%) | 142 (13.1%) |
| 30 to 34 Minutes | 62 (7.2%) | 127 (11.7%) |
| 35 to 39 Minutes | 61 (7.1%) | 46 (4.2%) |
| 40 to 44 Minutes | 76 (8.9%) | 37 (3.4%) |
| 45 to 59 Minutes | 78 (9.1%) | 132 (12.2%) |
| 60 to 89 Minutes | 101 (11.8%) | 70 (6.5%) |
| 90 or more Minutes | 88 (10.3%) | 37 (3.4%) |
Time of Departure to Work by Sex in West Concord
The most frequent times of departure to work in West Concord are 6:30 AM to 6:59 AM (152, 17.8%) for males and 9:00 AM to 9:59 AM (270, 24.9%) for females.
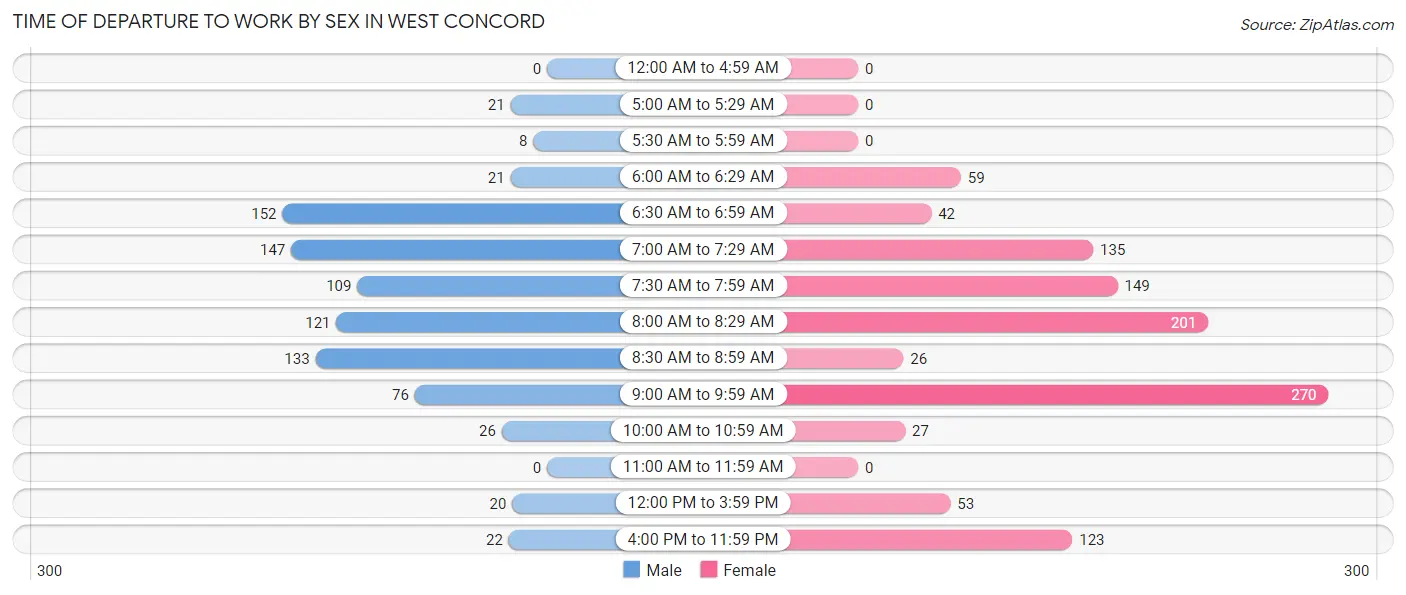
| Time of Departure | Male | Female |
| 12:00 AM to 4:59 AM | 0 (0.0%) | 0 (0.0%) |
| 5:00 AM to 5:29 AM | 21 (2.5%) | 0 (0.0%) |
| 5:30 AM to 5:59 AM | 8 (0.9%) | 0 (0.0%) |
| 6:00 AM to 6:29 AM | 21 (2.5%) | 59 (5.4%) |
| 6:30 AM to 6:59 AM | 152 (17.8%) | 42 (3.9%) |
| 7:00 AM to 7:29 AM | 147 (17.2%) | 135 (12.4%) |
| 7:30 AM to 7:59 AM | 109 (12.7%) | 149 (13.7%) |
| 8:00 AM to 8:29 AM | 121 (14.1%) | 201 (18.5%) |
| 8:30 AM to 8:59 AM | 133 (15.5%) | 26 (2.4%) |
| 9:00 AM to 9:59 AM | 76 (8.9%) | 270 (24.9%) |
| 10:00 AM to 10:59 AM | 26 (3.0%) | 27 (2.5%) |
| 11:00 AM to 11:59 AM | 0 (0.0%) | 0 (0.0%) |
| 12:00 PM to 3:59 PM | 20 (2.3%) | 53 (4.9%) |
| 4:00 PM to 11:59 PM | 22 (2.6%) | 123 (11.3%) |
| Total | 856 (100.0%) | 1,085 (100.0%) |
Housing Occupancy in West Concord
Occupancy by Ownership in West Concord
Of the total 2,420 dwellings in West Concord, owner-occupied units account for 1,387 (57.3%), while renter-occupied units make up 1,033 (42.7%).
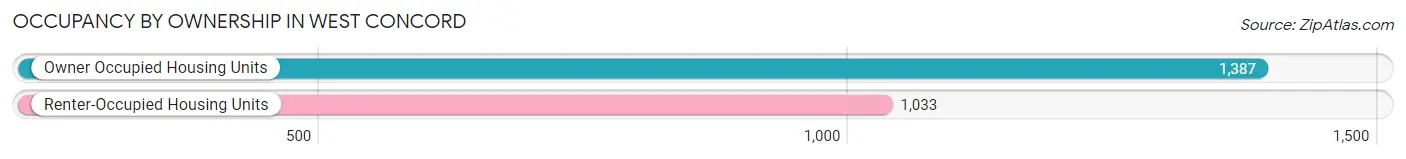
| Occupancy | # Housing Units | % Housing Units |
| Owner Occupied Housing Units | 1,387 | 57.3% |
| Renter-Occupied Housing Units | 1,033 | 42.7% |
| Total Occupied Housing Units | 2,420 | 100.0% |
Occupancy by Household Size in West Concord
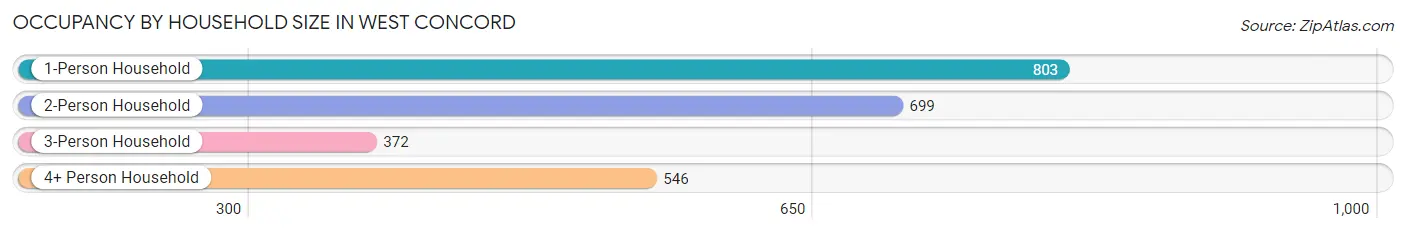
| Household Size | # Housing Units | % Housing Units |
| 1-Person Household | 803 | 33.2% |
| 2-Person Household | 699 | 28.9% |
| 3-Person Household | 372 | 15.4% |
| 4+ Person Household | 546 | 22.6% |
| Total Housing Units | 2,420 | 100.0% |
Occupancy by Ownership by Household Size in West Concord
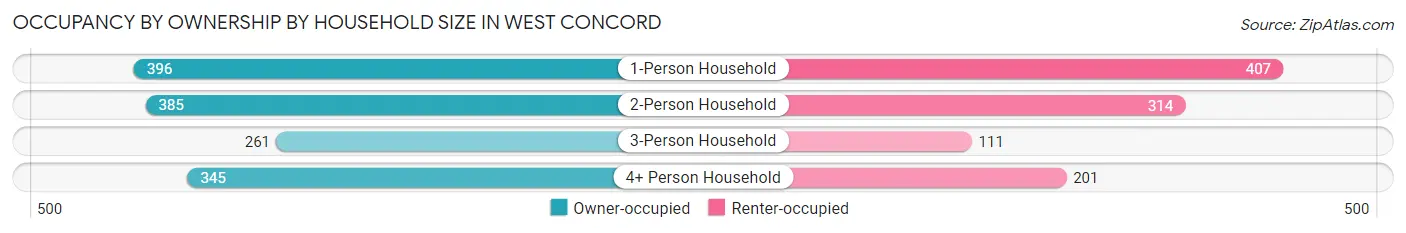
| Household Size | Owner-occupied | Renter-occupied |
| 1-Person Household | 396 (49.3%) | 407 (50.7%) |
| 2-Person Household | 385 (55.1%) | 314 (44.9%) |
| 3-Person Household | 261 (70.2%) | 111 (29.8%) |
| 4+ Person Household | 345 (63.2%) | 201 (36.8%) |
| Total Housing Units | 1,387 (57.3%) | 1,033 (42.7%) |
Occupancy by Educational Attainment in West Concord
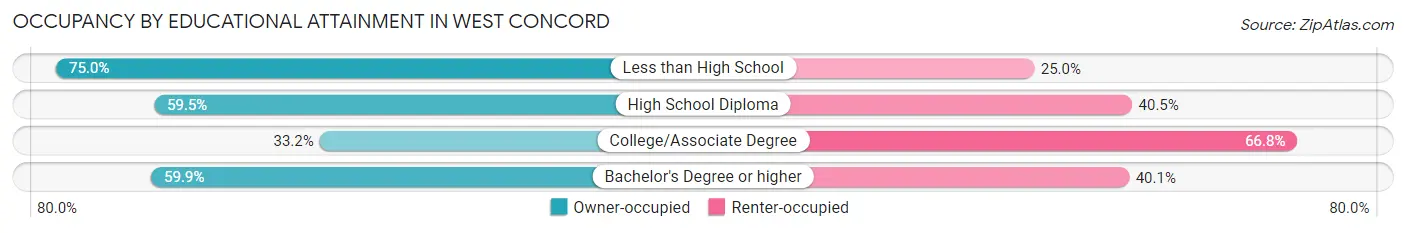
| Household Size | Owner-occupied | Renter-occupied |
| Less than High School | 63 (75.0%) | 21 (25.0%) |
| High School Diploma | 69 (59.5%) | 47 (40.5%) |
| College/Associate Degree | 94 (33.2%) | 189 (66.8%) |
| Bachelor's Degree or higher | 1,161 (59.9%) | 776 (40.1%) |
Occupancy by Age of Householder in West Concord
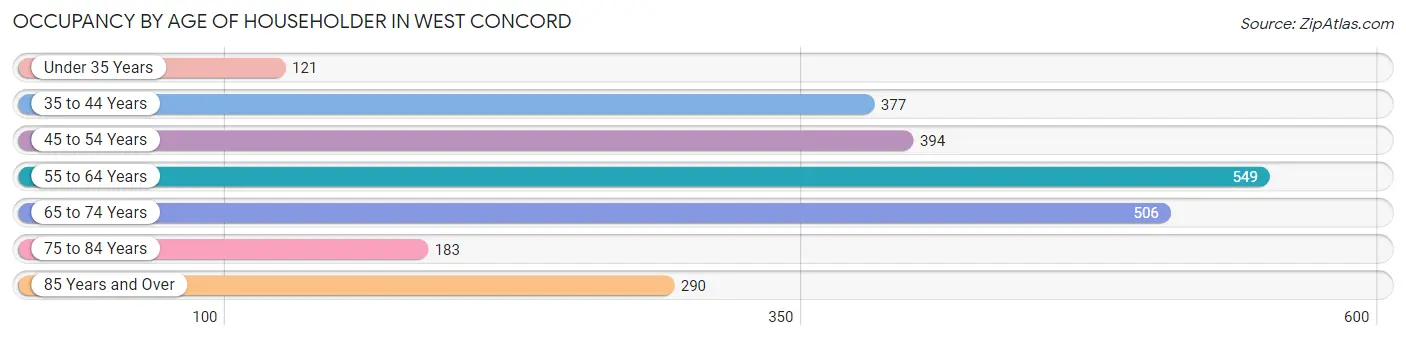
| Age Bracket | # Households | % Households |
| Under 35 Years | 121 | 5.0% |
| 35 to 44 Years | 377 | 15.6% |
| 45 to 54 Years | 394 | 16.3% |
| 55 to 64 Years | 549 | 22.7% |
| 65 to 74 Years | 506 | 20.9% |
| 75 to 84 Years | 183 | 7.6% |
| 85 Years and Over | 290 | 12.0% |
| Total | 2,420 | 100.0% |
Housing Finances in West Concord
Median Income by Occupancy in West Concord
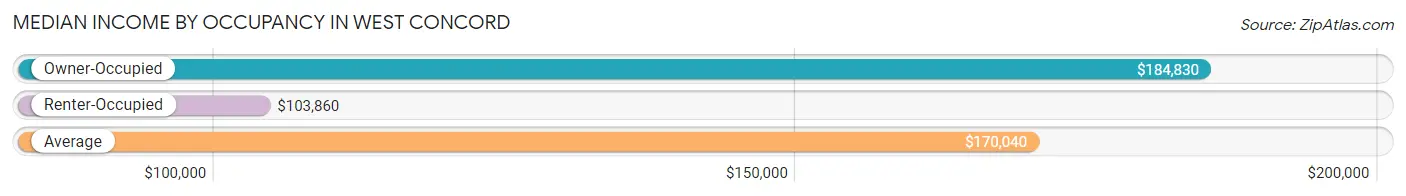
| Occupancy Type | # Households | Median Income |
| Owner-Occupied | 1,387 (57.3%) | $184,830 |
| Renter-Occupied | 1,033 (42.7%) | $103,860 |
| Average | 2,420 (100.0%) | $170,040 |
Occupancy by Householder Income Bracket in West Concord
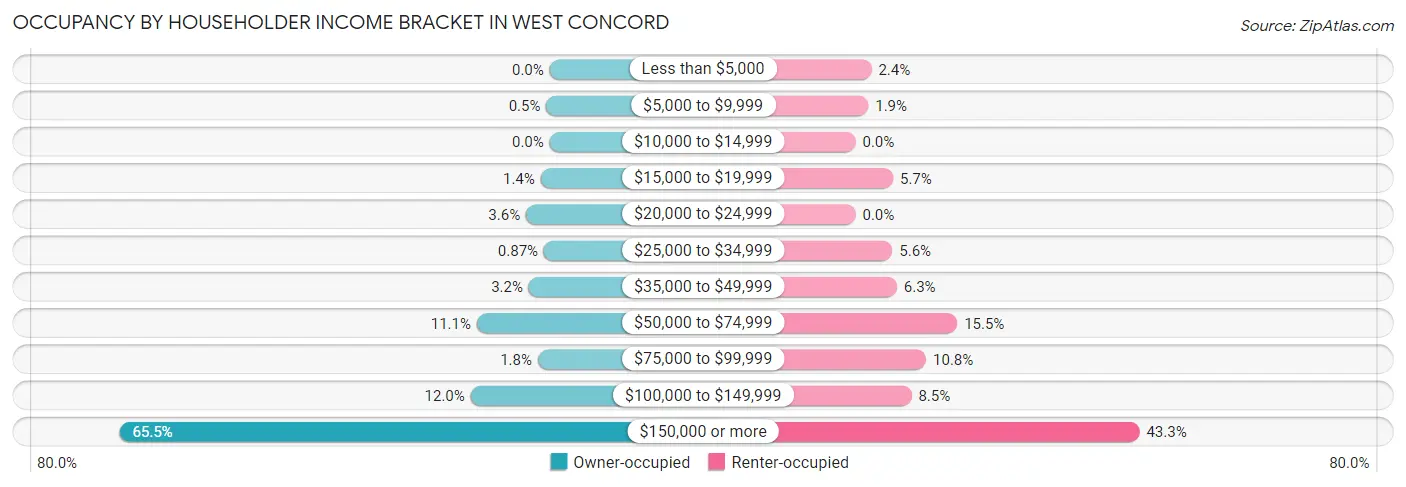
| Income Bracket | Owner-occupied | Renter-occupied |
| Less than $5,000 | 0 (0.0%) | 25 (2.4%) |
| $5,000 to $9,999 | 7 (0.5%) | 20 (1.9%) |
| $10,000 to $14,999 | 0 (0.0%) | 0 (0.0%) |
| $15,000 to $19,999 | 19 (1.4%) | 59 (5.7%) |
| $20,000 to $24,999 | 50 (3.6%) | 0 (0.0%) |
| $25,000 to $34,999 | 12 (0.9%) | 58 (5.6%) |
| $35,000 to $49,999 | 44 (3.2%) | 65 (6.3%) |
| $50,000 to $74,999 | 154 (11.1%) | 160 (15.5%) |
| $75,000 to $99,999 | 25 (1.8%) | 111 (10.7%) |
| $100,000 to $149,999 | 167 (12.0%) | 88 (8.5%) |
| $150,000 or more | 909 (65.5%) | 447 (43.3%) |
| Total | 1,387 (100.0%) | 1,033 (100.0%) |
Monthly Housing Cost Tiers in West Concord
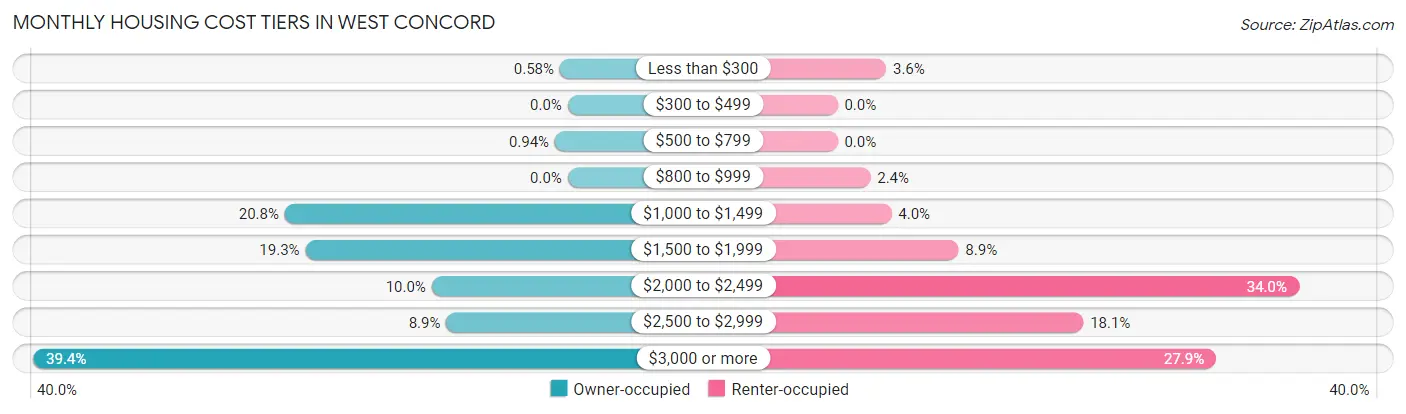
| Monthly Cost | Owner-occupied | Renter-occupied |
| Less than $300 | 8 (0.6%) | 37 (3.6%) |
| $300 to $499 | 0 (0.0%) | 0 (0.0%) |
| $500 to $799 | 13 (0.9%) | 0 (0.0%) |
| $800 to $999 | 0 (0.0%) | 25 (2.4%) |
| $1,000 to $1,499 | 289 (20.8%) | 41 (4.0%) |
| $1,500 to $1,999 | 268 (19.3%) | 92 (8.9%) |
| $2,000 to $2,499 | 139 (10.0%) | 351 (34.0%) |
| $2,500 to $2,999 | 124 (8.9%) | 187 (18.1%) |
| $3,000 or more | 546 (39.4%) | 288 (27.9%) |
| Total | 1,387 (100.0%) | 1,033 (100.0%) |
Physical Housing Characteristics in West Concord
Housing Structures in West Concord
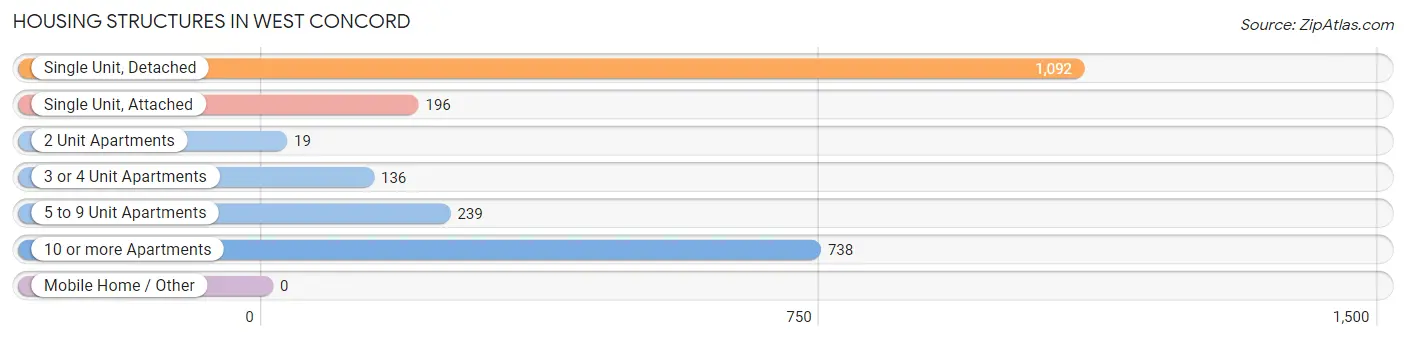
| Structure Type | # Housing Units | % Housing Units |
| Single Unit, Detached | 1,092 | 45.1% |
| Single Unit, Attached | 196 | 8.1% |
| 2 Unit Apartments | 19 | 0.8% |
| 3 or 4 Unit Apartments | 136 | 5.6% |
| 5 to 9 Unit Apartments | 239 | 9.9% |
| 10 or more Apartments | 738 | 30.5% |
| Mobile Home / Other | 0 | 0.0% |
| Total | 2,420 | 100.0% |
Housing Structures by Occupancy in West Concord
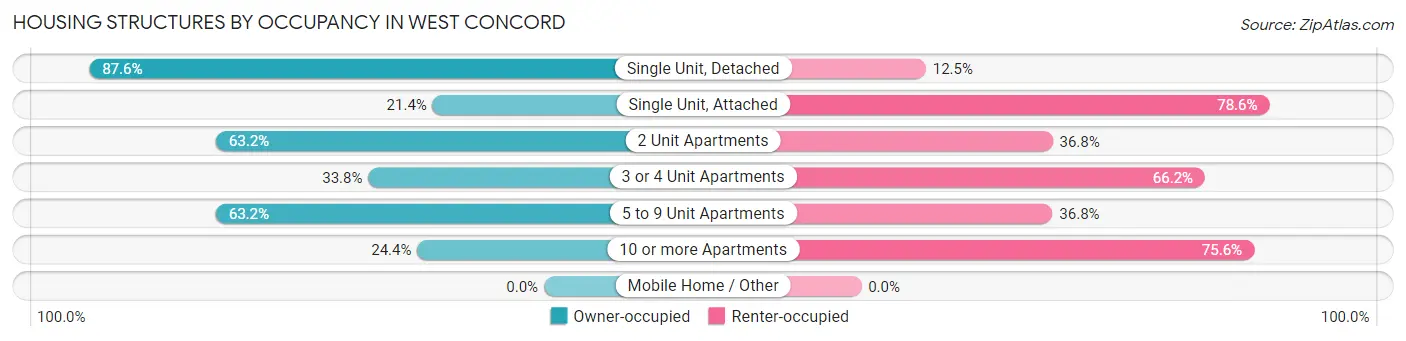
| Structure Type | Owner-occupied | Renter-occupied |
| Single Unit, Detached | 956 (87.5%) | 136 (12.4%) |
| Single Unit, Attached | 42 (21.4%) | 154 (78.6%) |
| 2 Unit Apartments | 12 (63.2%) | 7 (36.8%) |
| 3 or 4 Unit Apartments | 46 (33.8%) | 90 (66.2%) |
| 5 to 9 Unit Apartments | 151 (63.2%) | 88 (36.8%) |
| 10 or more Apartments | 180 (24.4%) | 558 (75.6%) |
| Mobile Home / Other | 0 (0.0%) | 0 (0.0%) |
| Total | 1,387 (57.3%) | 1,033 (42.7%) |
Housing Structures by Number of Rooms in West Concord
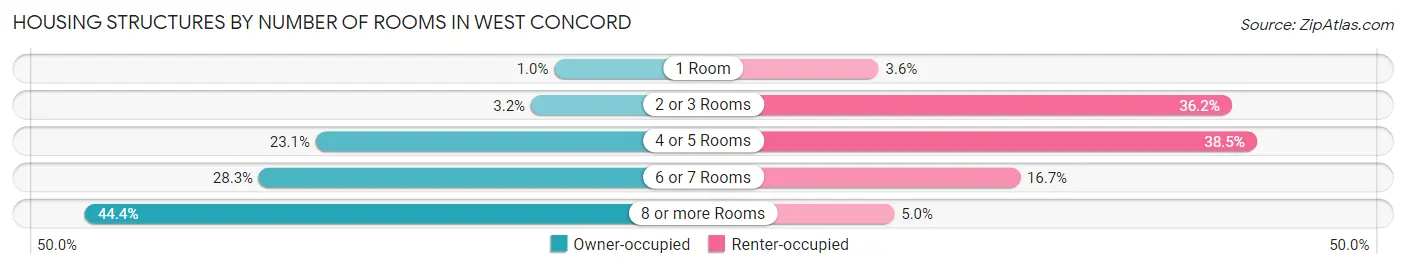
| Number of Rooms | Owner-occupied | Renter-occupied |
| 1 Room | 14 (1.0%) | 37 (3.6%) |
| 2 or 3 Rooms | 44 (3.2%) | 374 (36.2%) |
| 4 or 5 Rooms | 320 (23.1%) | 398 (38.5%) |
| 6 or 7 Rooms | 393 (28.3%) | 172 (16.7%) |
| 8 or more Rooms | 616 (44.4%) | 52 (5.0%) |
| Total | 1,387 (100.0%) | 1,033 (100.0%) |
Housing Structure by Heating Type in West Concord
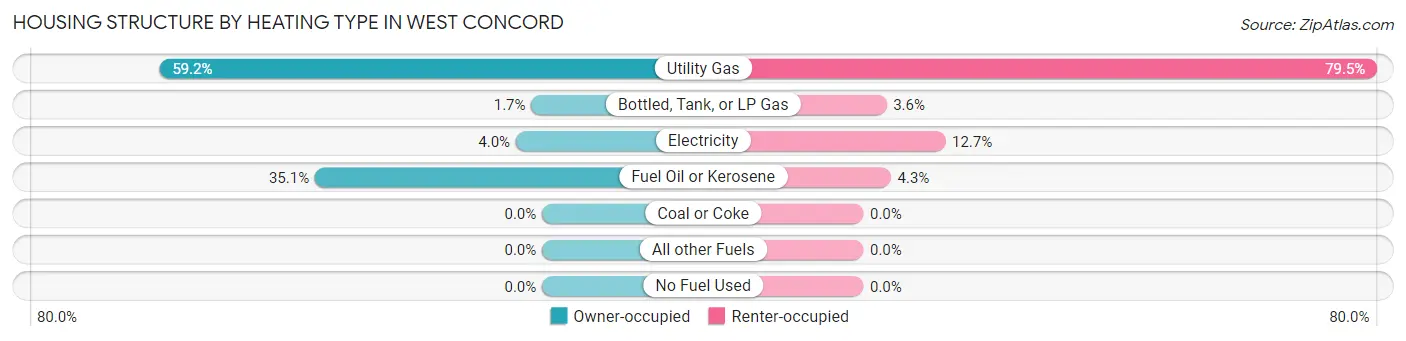
| Heating Type | Owner-occupied | Renter-occupied |
| Utility Gas | 821 (59.2%) | 821 (79.5%) |
| Bottled, Tank, or LP Gas | 23 (1.7%) | 37 (3.6%) |
| Electricity | 56 (4.0%) | 131 (12.7%) |
| Fuel Oil or Kerosene | 487 (35.1%) | 44 (4.3%) |
| Coal or Coke | 0 (0.0%) | 0 (0.0%) |
| All other Fuels | 0 (0.0%) | 0 (0.0%) |
| No Fuel Used | 0 (0.0%) | 0 (0.0%) |
| Total | 1,387 (100.0%) | 1,033 (100.0%) |
Household Vehicle Usage in West Concord
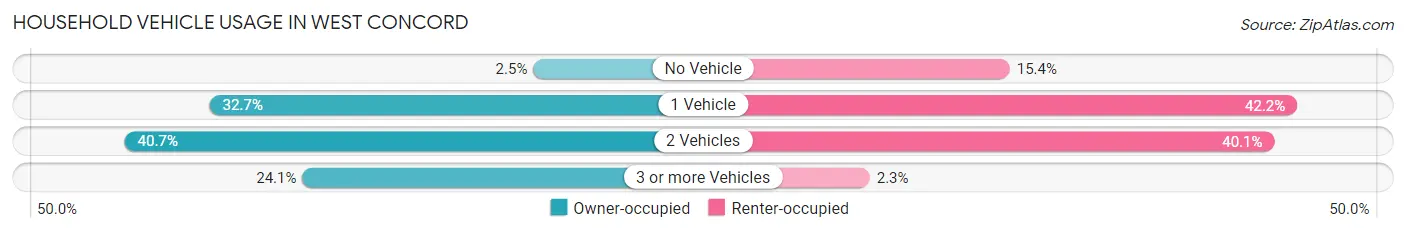
| Vehicles per Household | Owner-occupied | Renter-occupied |
| No Vehicle | 35 (2.5%) | 159 (15.4%) |
| 1 Vehicle | 454 (32.7%) | 436 (42.2%) |
| 2 Vehicles | 564 (40.7%) | 414 (40.1%) |
| 3 or more Vehicles | 334 (24.1%) | 24 (2.3%) |
| Total | 1,387 (100.0%) | 1,033 (100.0%) |
Real Estate & Mortgages in West Concord
Real Estate and Mortgage Overview in West Concord
| Characteristic | Without Mortgage | With Mortgage |
| Housing Units | 583 | 804 |
| Median Property Value | $640,000 | $867,400 |
| Median Household Income | $137,250 | $620 |
| Monthly Housing Costs | $1,501 | $535 |
| Real Estate Taxes | $8,535 | $0 |
Property Value by Mortgage Status in West Concord
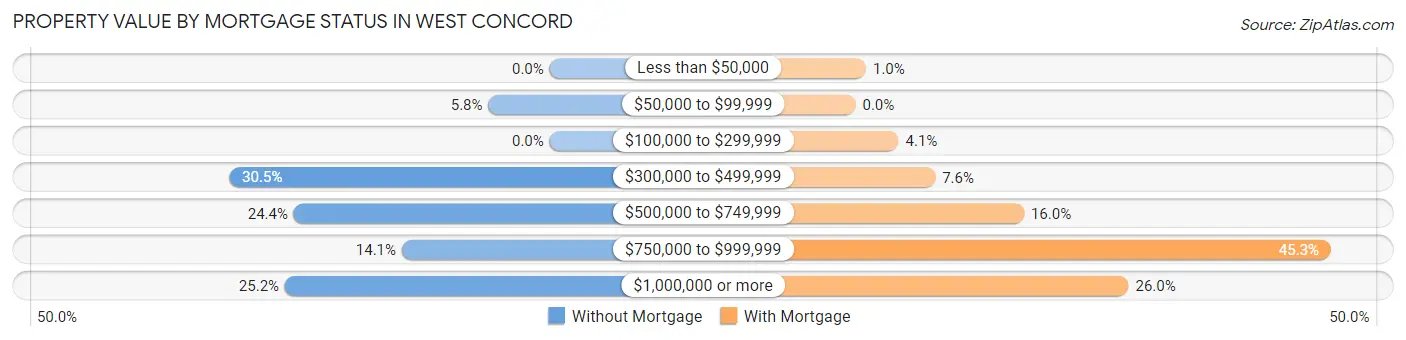
| Property Value | Without Mortgage | With Mortgage |
| Less than $50,000 | 0 (0.0%) | 8 (1.0%) |
| $50,000 to $99,999 | 34 (5.8%) | 0 (0.0%) |
| $100,000 to $299,999 | 0 (0.0%) | 33 (4.1%) |
| $300,000 to $499,999 | 178 (30.5%) | 61 (7.6%) |
| $500,000 to $749,999 | 142 (24.4%) | 129 (16.0%) |
| $750,000 to $999,999 | 82 (14.1%) | 364 (45.3%) |
| $1,000,000 or more | 147 (25.2%) | 209 (26.0%) |
| Total | 583 (100.0%) | 804 (100.0%) |
Household Income by Mortgage Status in West Concord
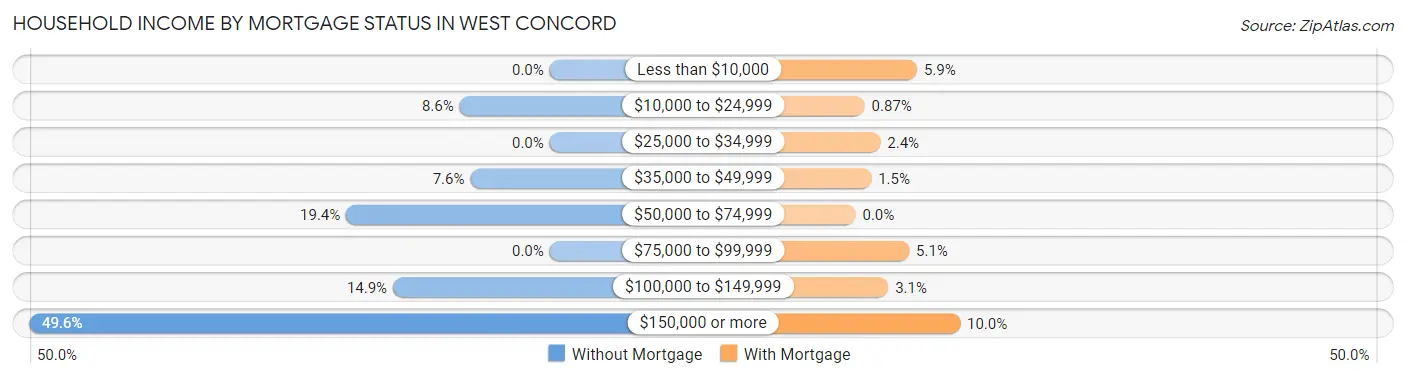
| Household Income | Without Mortgage | With Mortgage |
| Less than $10,000 | 0 (0.0%) | 47 (5.9%) |
| $10,000 to $24,999 | 50 (8.6%) | 7 (0.9%) |
| $25,000 to $34,999 | 0 (0.0%) | 19 (2.4%) |
| $35,000 to $49,999 | 44 (7.5%) | 12 (1.5%) |
| $50,000 to $74,999 | 113 (19.4%) | 0 (0.0%) |
| $75,000 to $99,999 | 0 (0.0%) | 41 (5.1%) |
| $100,000 to $149,999 | 87 (14.9%) | 25 (3.1%) |
| $150,000 or more | 289 (49.6%) | 80 (10.0%) |
| Total | 583 (100.0%) | 804 (100.0%) |
Property Value to Household Income Ratio in West Concord
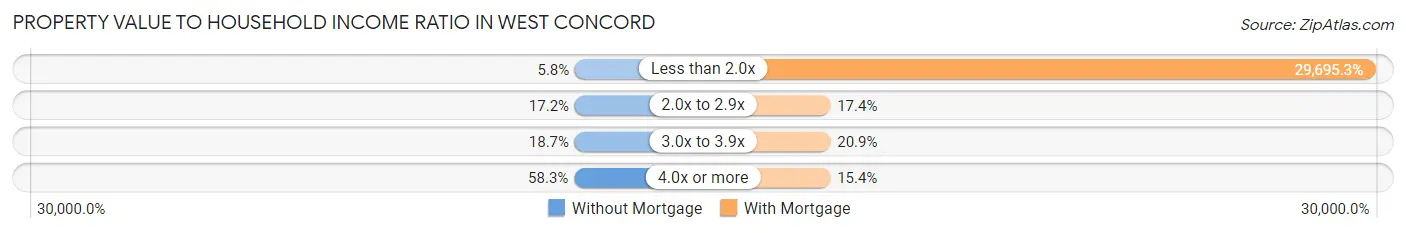
| Value-to-Income Ratio | Without Mortgage | With Mortgage |
| Less than 2.0x | 34 (5.8%) | 238,750 (29,695.3%) |
| 2.0x to 2.9x | 100 (17.2%) | 140 (17.4%) |
| 3.0x to 3.9x | 109 (18.7%) | 168 (20.9%) |
| 4.0x or more | 340 (58.3%) | 124 (15.4%) |
| Total | 583 (100.0%) | 804 (100.0%) |
Real Estate Taxes by Mortgage Status in West Concord
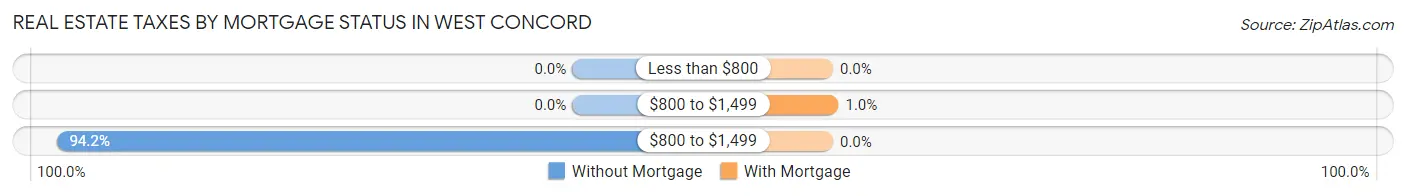
| Property Taxes | Without Mortgage | With Mortgage |
| Less than $800 | 0 (0.0%) | 0 (0.0%) |
| $800 to $1,499 | 0 (0.0%) | 8 (1.0%) |
| $800 to $1,499 | 549 (94.2%) | 0 (0.0%) |
| Total | 583 (100.0%) | 804 (100.0%) |
Health & Disability in West Concord
Health Insurance Coverage by Age in West Concord
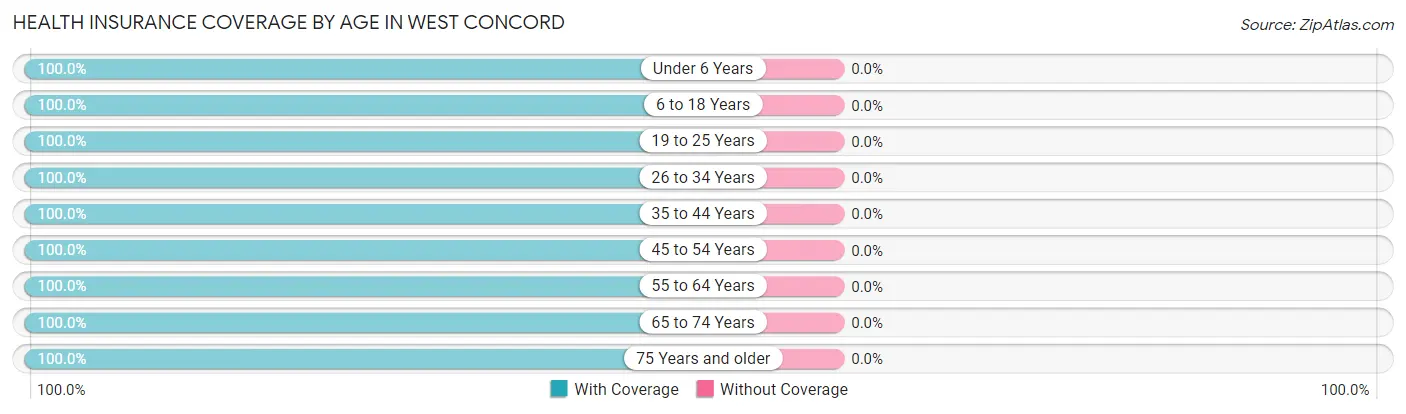
| Age Bracket | With Coverage | Without Coverage |
| Under 6 Years | 453 (100.0%) | 0 (0.0%) |
| 6 to 18 Years | 870 (100.0%) | 0 (0.0%) |
| 19 to 25 Years | 279 (100.0%) | 0 (0.0%) |
| 26 to 34 Years | 370 (100.0%) | 0 (0.0%) |
| 35 to 44 Years | 741 (100.0%) | 0 (0.0%) |
| 45 to 54 Years | 604 (100.0%) | 0 (0.0%) |
| 55 to 64 Years | 946 (100.0%) | 0 (0.0%) |
| 65 to 74 Years | 794 (100.0%) | 0 (0.0%) |
| 75 Years and older | 641 (100.0%) | 0 (0.0%) |
| Total | 5,698 (100.0%) | 0 (0.0%) |
Health Insurance Coverage by Citizenship Status in West Concord
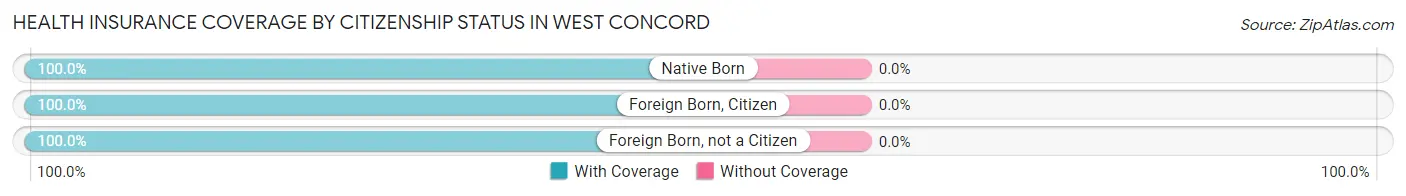
| Citizenship Status | With Coverage | Without Coverage |
| Native Born | 453 (100.0%) | 0 (0.0%) |
| Foreign Born, Citizen | 870 (100.0%) | 0 (0.0%) |
| Foreign Born, not a Citizen | 279 (100.0%) | 0 (0.0%) |
Health Insurance Coverage by Household Income in West Concord
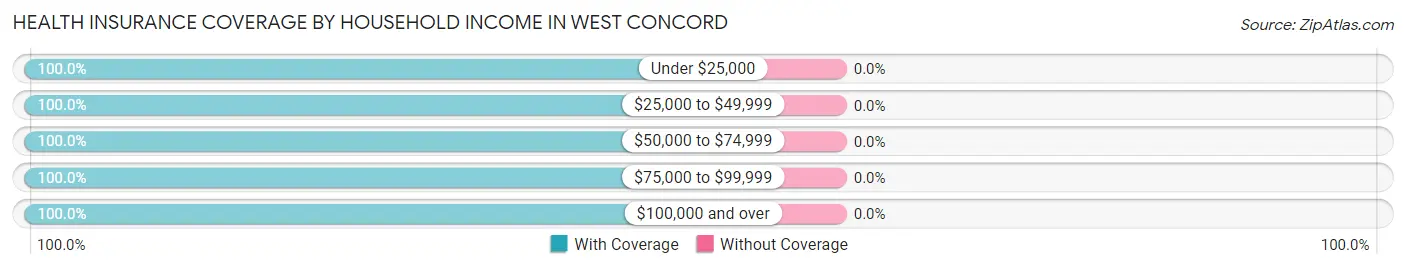
| Household Income | With Coverage | Without Coverage |
| Under $25,000 | 244 (100.0%) | 0 (0.0%) |
| $25,000 to $49,999 | 296 (100.0%) | 0 (0.0%) |
| $50,000 to $74,999 | 599 (100.0%) | 0 (0.0%) |
| $75,000 to $99,999 | 200 (100.0%) | 0 (0.0%) |
| $100,000 and over | 4,336 (100.0%) | 0 (0.0%) |
Public vs Private Health Insurance Coverage by Age in West Concord
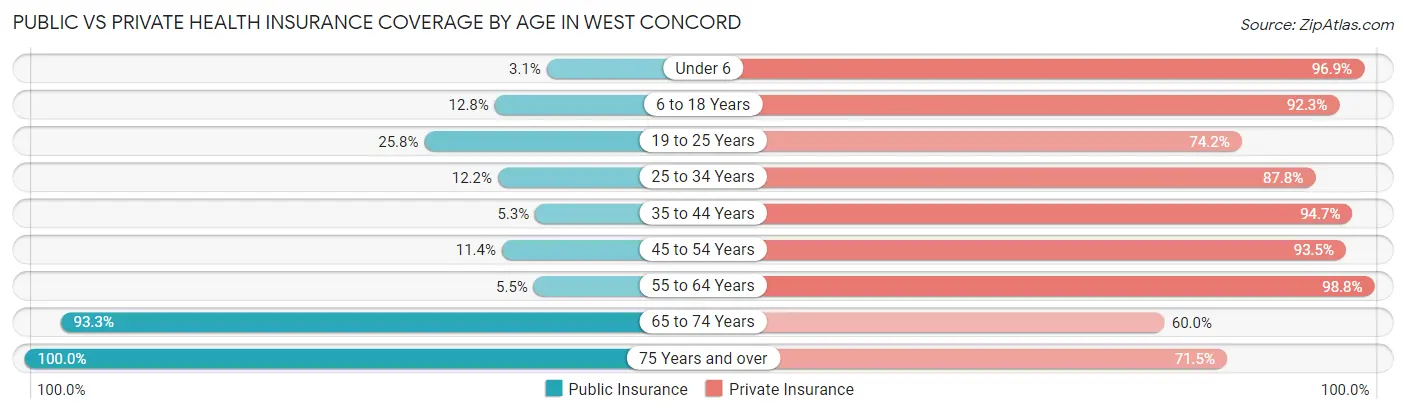
| Age Bracket | Public Insurance | Private Insurance |
| Under 6 | 14 (3.1%) | 439 (96.9%) |
| 6 to 18 Years | 111 (12.8%) | 803 (92.3%) |
| 19 to 25 Years | 72 (25.8%) | 207 (74.2%) |
| 25 to 34 Years | 45 (12.2%) | 325 (87.8%) |
| 35 to 44 Years | 39 (5.3%) | 702 (94.7%) |
| 45 to 54 Years | 69 (11.4%) | 565 (93.5%) |
| 55 to 64 Years | 52 (5.5%) | 935 (98.8%) |
| 65 to 74 Years | 741 (93.3%) | 476 (60.0%) |
| 75 Years and over | 641 (100.0%) | 458 (71.5%) |
| Total | 1,784 (31.3%) | 4,910 (86.2%) |
Disability Status by Sex by Age in West Concord
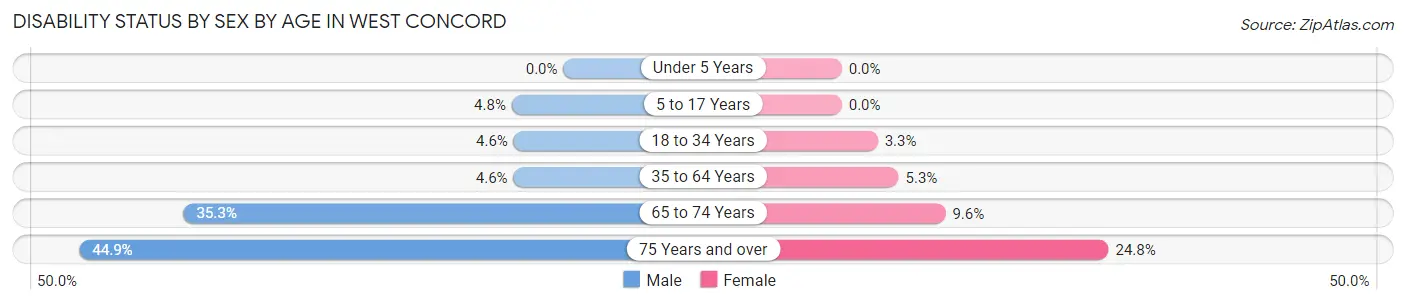
| Age Bracket | Male | Female |
| Under 5 Years | 0 (0.0%) | 0 (0.0%) |
| 5 to 17 Years | 25 (4.8%) | 0 (0.0%) |
| 18 to 34 Years | 13 (4.6%) | 15 (3.3%) |
| 35 to 64 Years | 49 (4.6%) | 65 (5.3%) |
| 65 to 74 Years | 104 (35.2%) | 48 (9.6%) |
| 75 Years and over | 150 (44.9%) | 76 (24.8%) |
Disability Class by Sex by Age in West Concord
Disability Class: Hearing Difficulty
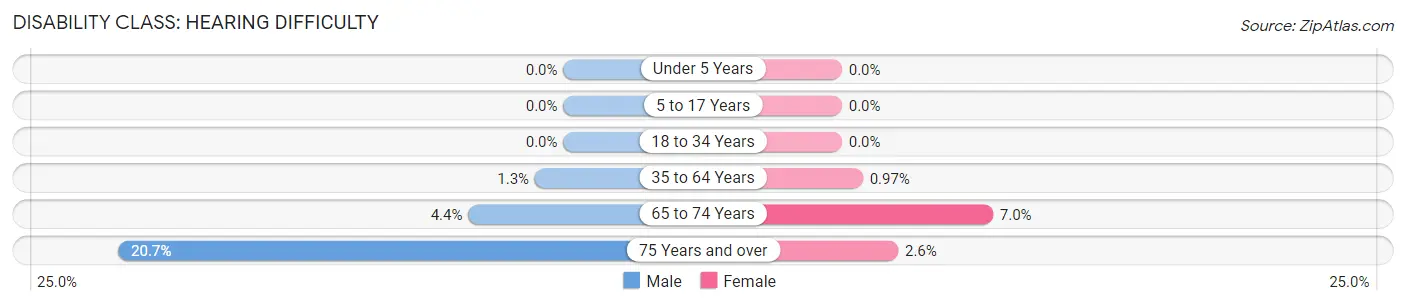
| Age Bracket | Male | Female |
| Under 5 Years | 0 (0.0%) | 0 (0.0%) |
| 5 to 17 Years | 0 (0.0%) | 0 (0.0%) |
| 18 to 34 Years | 0 (0.0%) | 0 (0.0%) |
| 35 to 64 Years | 14 (1.3%) | 12 (1.0%) |
| 65 to 74 Years | 13 (4.4%) | 35 (7.0%) |
| 75 Years and over | 69 (20.7%) | 8 (2.6%) |
Disability Class: Vision Difficulty
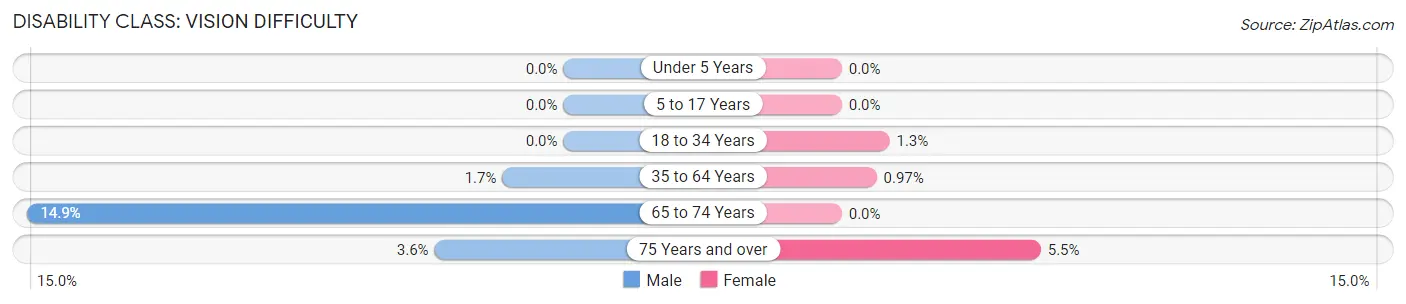
| Age Bracket | Male | Female |
| Under 5 Years | 0 (0.0%) | 0 (0.0%) |
| 5 to 17 Years | 0 (0.0%) | 0 (0.0%) |
| 18 to 34 Years | 0 (0.0%) | 6 (1.3%) |
| 35 to 64 Years | 18 (1.7%) | 12 (1.0%) |
| 65 to 74 Years | 44 (14.9%) | 0 (0.0%) |
| 75 Years and over | 12 (3.6%) | 17 (5.5%) |
Disability Class: Cognitive Difficulty
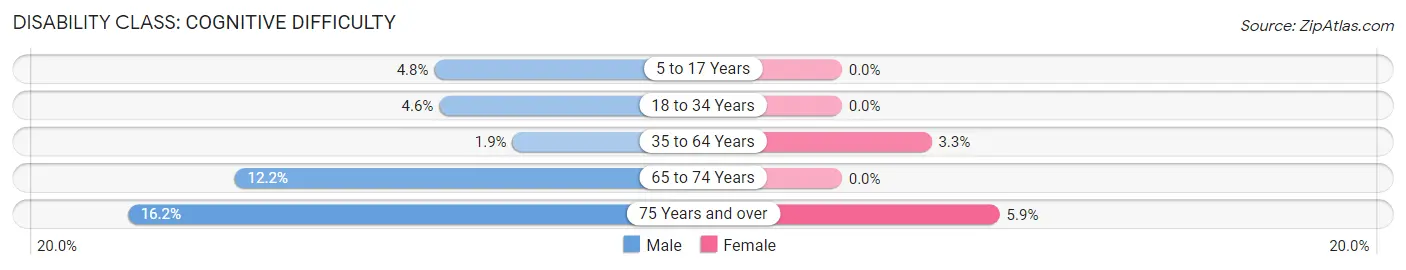
| Age Bracket | Male | Female |
| 5 to 17 Years | 25 (4.8%) | 0 (0.0%) |
| 18 to 34 Years | 13 (4.6%) | 0 (0.0%) |
| 35 to 64 Years | 20 (1.9%) | 41 (3.3%) |
| 65 to 74 Years | 36 (12.2%) | 0 (0.0%) |
| 75 Years and over | 54 (16.2%) | 18 (5.9%) |
Disability Class: Ambulatory Difficulty
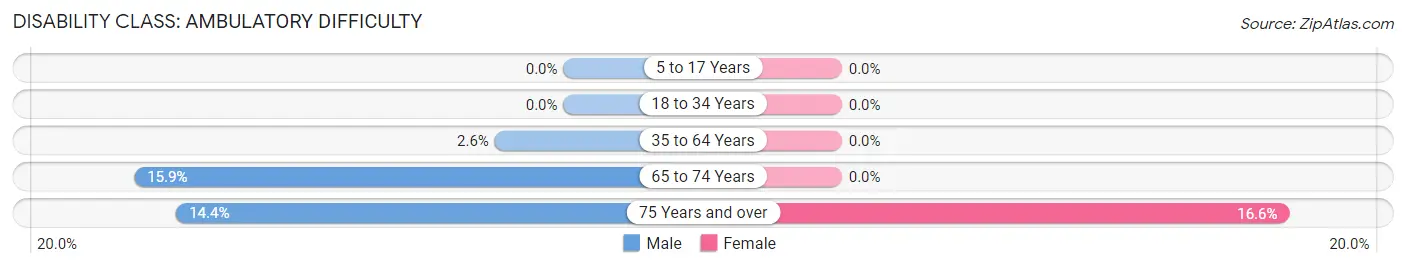
| Age Bracket | Male | Female |
| 5 to 17 Years | 0 (0.0%) | 0 (0.0%) |
| 18 to 34 Years | 0 (0.0%) | 0 (0.0%) |
| 35 to 64 Years | 27 (2.5%) | 0 (0.0%) |
| 65 to 74 Years | 47 (15.9%) | 0 (0.0%) |
| 75 Years and over | 48 (14.4%) | 51 (16.6%) |
Disability Class: Self-Care Difficulty
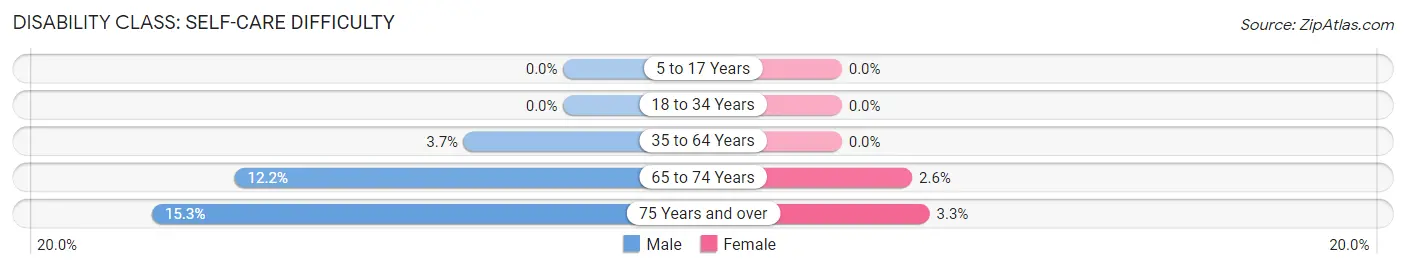
| Age Bracket | Male | Female |
| 5 to 17 Years | 0 (0.0%) | 0 (0.0%) |
| 18 to 34 Years | 0 (0.0%) | 0 (0.0%) |
| 35 to 64 Years | 39 (3.7%) | 0 (0.0%) |
| 65 to 74 Years | 36 (12.2%) | 13 (2.6%) |
| 75 Years and over | 51 (15.3%) | 10 (3.3%) |
Technology Access in West Concord
Computing Device Access in West Concord
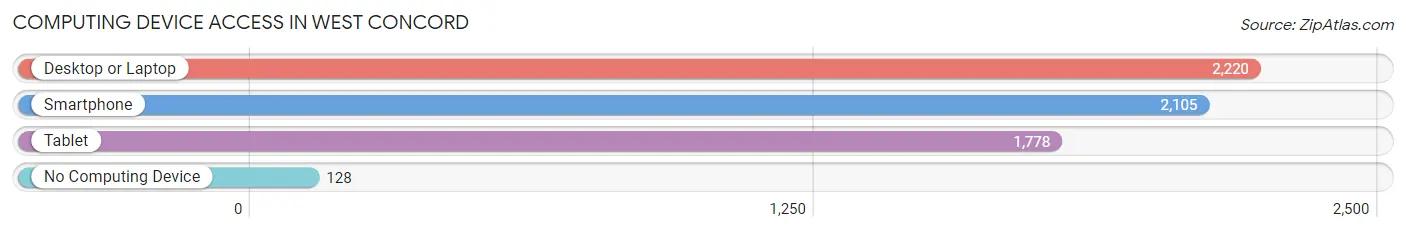
| Device Type | # Households | % Households |
| Desktop or Laptop | 2,220 | 91.7% |
| Smartphone | 2,105 | 87.0% |
| Tablet | 1,778 | 73.5% |
| No Computing Device | 128 | 5.3% |
| Total | 2,420 | 100.0% |
Internet Access in West Concord
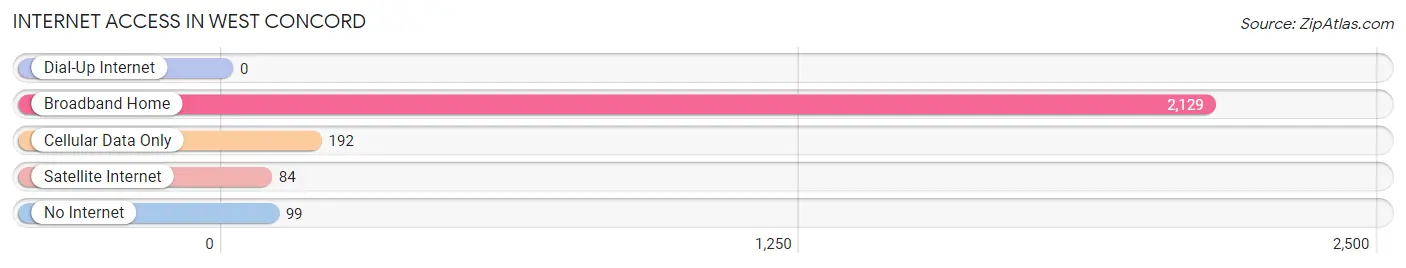
| Internet Type | # Households | % Households |
| Dial-Up Internet | 0 | 0.0% |
| Broadband Home | 2,129 | 88.0% |
| Cellular Data Only | 192 | 7.9% |
| Satellite Internet | 84 | 3.5% |
| No Internet | 99 | 4.1% |
| Total | 2,420 | 100.0% |
West Concord Summary
History
West Concord, Massachusetts is a small town located in Middlesex County, about 20 miles west of Boston. It was first settled in 1635 and was originally part of the town of Concord. In 1807, the town of West Concord was officially incorporated.
The town was originally an agricultural community, with many of the early settlers being farmers. The town was also home to a number of mills, including a grist mill, a saw mill, and a paper mill. The paper mill was the largest employer in the town for many years.
In the late 19th century, the town began to experience a period of growth and development. The railroad arrived in 1881, connecting West Concord to Boston and other nearby towns. This allowed for the development of a number of businesses, including a shoe factory, a brickyard, and a furniture factory.
The town continued to grow in the 20th century, with the population reaching its peak in the 1950s. Since then, the population has declined slightly, but the town remains a vibrant community.
Geography
West Concord is located in Middlesex County, about 20 miles west of Boston. It is bordered by the towns of Acton, Carlisle, Concord, Lincoln, and Sudbury. The town is situated on the Concord River, which flows through the center of town.
The town is mostly rural, with a few small neighborhoods. The town center is located on Main Street, which is lined with small shops and businesses. The town also has a number of parks and open spaces, including the Great Meadows National Wildlife Refuge.
Economy
West Concord is a primarily residential community, with a few small businesses located in the town center. The largest employer in the town is the Concord-Carlisle Regional School District, which employs over 500 people. Other employers include a number of small businesses, such as restaurants, retail stores, and professional services.
The town also has a number of small farms, which produce a variety of fruits and vegetables. The town is also home to a number of wineries, which produce a variety of wines.
Demographics
As of the 2010 census, the population of West Concord was 6,170. The racial makeup of the town was 94.3% White, 1.3% African American, 0.3% Native American, 1.7% Asian, 0.1% Pacific Islander, and 1.3% from other races. Hispanic or Latino of any race were 2.7% of the population.
The median household income in West Concord was $107,917, and the median family income was $125,917. The per capita income was $50,917. About 2.7% of families and 3.7% of the population were below the poverty line.
Common Questions
What is Per Capita Income in West Concord?
Per Capita income in West Concord is $67,907.
What is the Median Family Income in West Concord?
Median Family Income in West Concord is $201,801.
What is the Median Household income in West Concord?
Median Household Income in West Concord is $170,040.
What is Income or Wage Gap in West Concord?
Income or Wage Gap in West Concord is 40.5%.
Women in West Concord earn 59.5 cents for every dollar earned by a man.
What is Inequality or Gini Index in West Concord?
Inequality or Gini Index in West Concord is 0.40.
What is the Total Population of West Concord?
Total Population of West Concord is 6,450.
What is the Total Male Population of West Concord?
Total Male Population of West Concord is 3,452.
What is the Total Female Population of West Concord?
Total Female Population of West Concord is 2,998.
What is the Ratio of Males per 100 Females in West Concord?
There are 115.14 Males per 100 Females in West Concord.
What is the Ratio of Females per 100 Males in West Concord?
There are 86.85 Females per 100 Males in West Concord.
What is the Median Population Age in West Concord?
Median Population Age in West Concord is 46.0 Years.
What is the Average Family Size in West Concord
Average Family Size in West Concord is 3.1 People.
What is the Average Household Size in West Concord
Average Household Size in West Concord is 2.4 People.
How Large is the Labor Force in West Concord?
There are 2,703 People in the Labor Forcein in West Concord.
What is the Percentage of People in the Labor Force in West Concord?
50.6% of People are in the Labor Force in West Concord.
What is the Unemployment Rate in West Concord?
Unemployment Rate in West Concord is 5.0%.