Devens, MA Map & Demographics
Devens Map
Devens Overview
$31,493
PER CAPITA INCOME
$131,643
AVG FAMILY INCOME
$106,875
AVG HOUSEHOLD INCOME
25.6%
WAGE / INCOME GAP [ % ]
74.4¢/ $1
WAGE / INCOME GAP [ $ ]
0.40
INEQUALITY / GINI INDEX
1,763
TOTAL POPULATION
1,396
MALE POPULATION
367
FEMALE POPULATION
380.38
MALES / 100 FEMALES
26.29
FEMALES / 100 MALES
46.0
MEDIAN AGE
3.4
AVG FAMILY SIZE
2.7
AVG HOUSEHOLD SIZE
489
LABOR FORCE [ PEOPLE ]
30.6%
PERCENT IN LABOR FORCE
1.0%
UNEMPLOYMENT RATE
Devens Zip Codes
Income in Devens
Income Overview in Devens
Per Capita Income in Devens is $31,493, while median incomes of families and households are $131,643 and $106,875 respectively.
| Characteristic | Number | Measure |
| Per Capita Income | 1,763 | $31,493 |
| Median Family Income | 194 | $131,643 |
| Mean Family Income | 194 | $168,472 |
| Median Household Income | 278 | $106,875 |
| Mean Household Income | 278 | $143,951 |
| Income Deficit | 194 | $0 |
| Wage / Income Gap (%) | 1,763 | 25.59% |
| Wage / Income Gap ($) | 1,763 | 74.41¢ per $1 |
| Gini / Inequality Index | 1,763 | 0.40 |
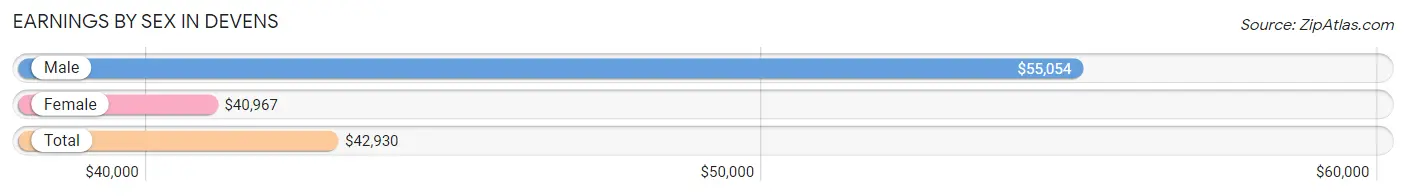
Earnings by Sex in Devens
Average Earnings in Devens are $42,930, $55,054 for men and $40,967 for women, a difference of 25.6%.
| Sex | Number | Average Earnings |
| Male | 428 (65.1%) | $55,054 |
| Female | 229 (34.9%) | $40,967 |
| Total | 657 (100.0%) | $42,930 |
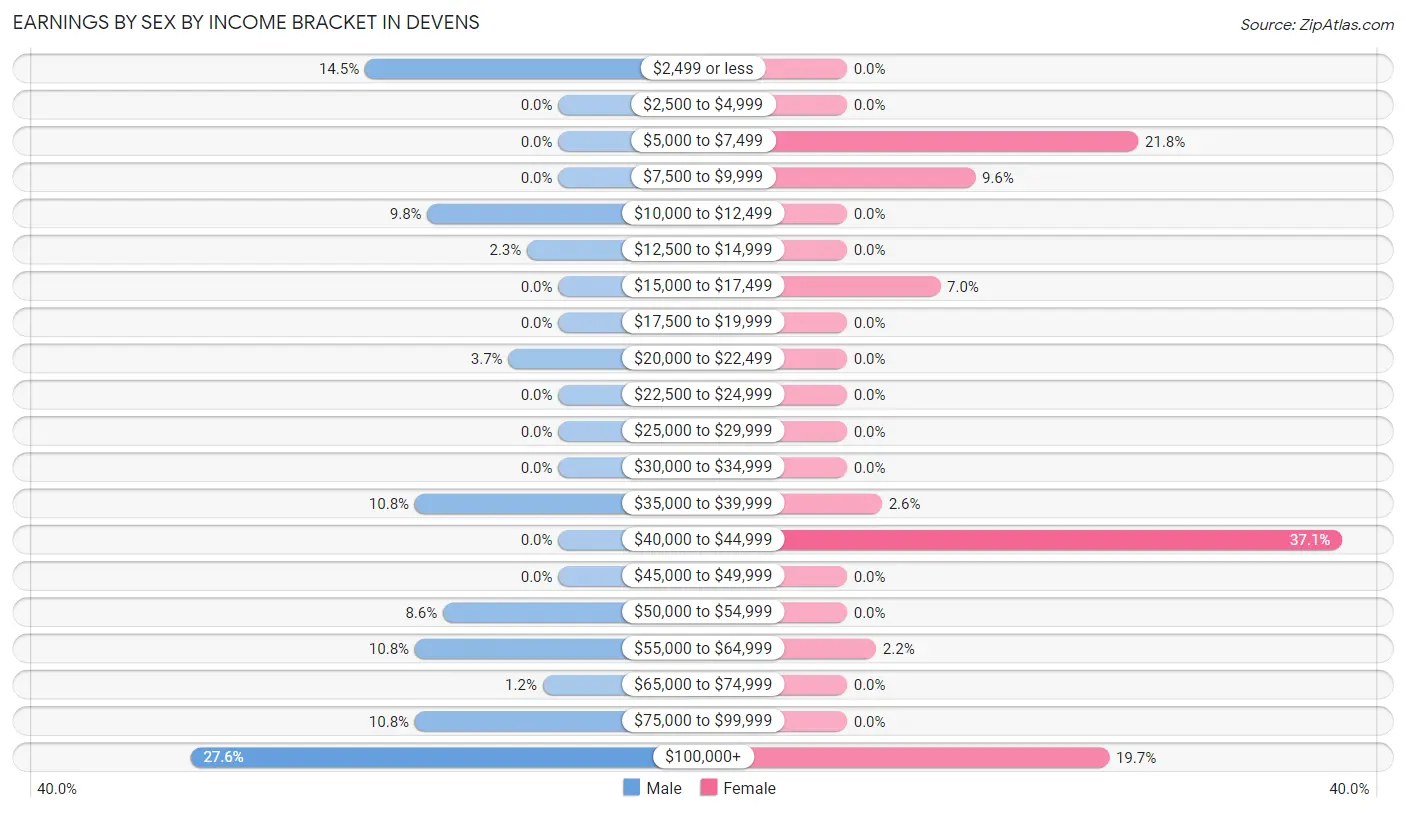
Earnings by Sex by Income Bracket in Devens
The most common earnings brackets in Devens are $100,000+ for men (118 | 27.6%) and $40,000 to $44,999 for women (85 | 37.1%).
| Income | Male | Female |
| $2,499 or less | 62 (14.5%) | 0 (0.0%) |
| $2,500 to $4,999 | 0 (0.0%) | 0 (0.0%) |
| $5,000 to $7,499 | 0 (0.0%) | 50 (21.8%) |
| $7,500 to $9,999 | 0 (0.0%) | 22 (9.6%) |
| $10,000 to $12,499 | 42 (9.8%) | 0 (0.0%) |
| $12,500 to $14,999 | 10 (2.3%) | 0 (0.0%) |
| $15,000 to $17,499 | 0 (0.0%) | 16 (7.0%) |
| $17,500 to $19,999 | 0 (0.0%) | 0 (0.0%) |
| $20,000 to $22,499 | 16 (3.7%) | 0 (0.0%) |
| $22,500 to $24,999 | 0 (0.0%) | 0 (0.0%) |
| $25,000 to $29,999 | 0 (0.0%) | 0 (0.0%) |
| $30,000 to $34,999 | 0 (0.0%) | 0 (0.0%) |
| $35,000 to $39,999 | 46 (10.7%) | 6 (2.6%) |
| $40,000 to $44,999 | 0 (0.0%) | 85 (37.1%) |
| $45,000 to $49,999 | 0 (0.0%) | 0 (0.0%) |
| $50,000 to $54,999 | 37 (8.6%) | 0 (0.0%) |
| $55,000 to $64,999 | 46 (10.7%) | 5 (2.2%) |
| $65,000 to $74,999 | 5 (1.2%) | 0 (0.0%) |
| $75,000 to $99,999 | 46 (10.7%) | 0 (0.0%) |
| $100,000+ | 118 (27.6%) | 45 (19.7%) |
| Total | 428 (100.0%) | 229 (100.0%) |
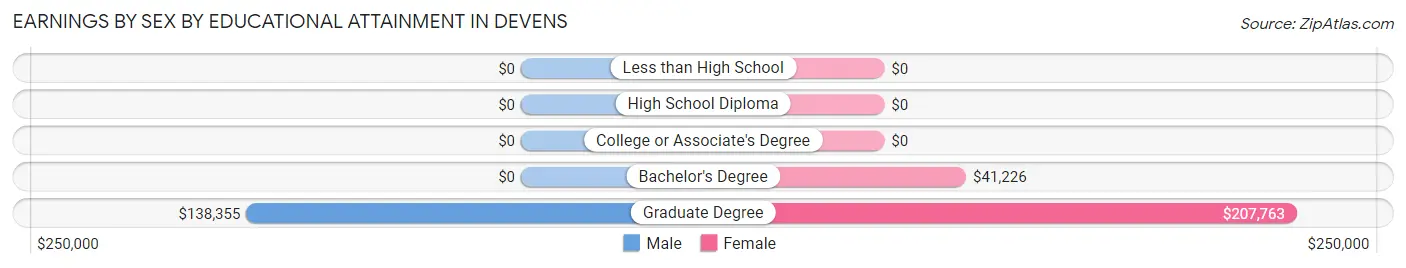
Earnings by Sex by Educational Attainment in Devens
Average earnings in Devens are $55,353 for men and $42,578 for women, a difference of 23.1%. Men with an educational attainment of graduate degree enjoy the highest average annual earnings of $138,355, while those with graduate degree education earn the least with $138,355. Women with an educational attainment of graduate degree earn the most with the average annual earnings of $207,763, while those with bachelor's degree education have the smallest earnings of $41,226.
| Educational Attainment | Male Income | Female Income |
| Less than High School | - | - |
| High School Diploma | - | - |
| College or Associate's Degree | - | - |
| Bachelor's Degree | - | - |
| Graduate Degree | $138,355 | $207,763 |
| Total | $55,353 | $42,578 |
Family Income in Devens
Family Income Brackets in Devens
According to the Devens family income data, there are 104 families falling into the $100,000 to $149,999 income range, which is the most common income bracket and makes up 53.6% of all families.
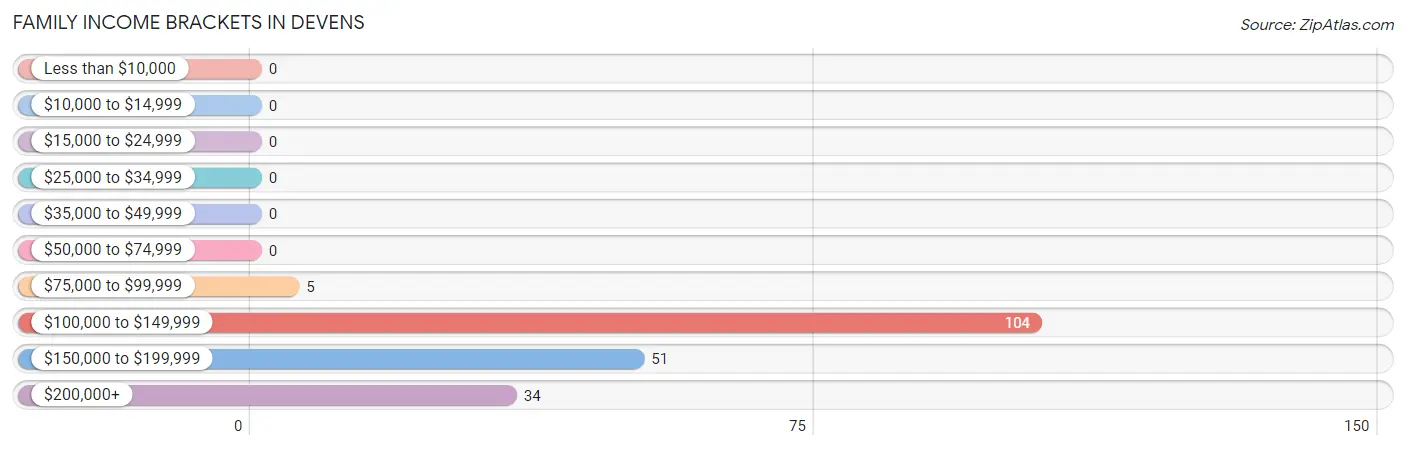
| Income Bracket | # Families | % Families |
| Less than $10,000 | 0 | 0.0% |
| $10,000 to $14,999 | 0 | 0.0% |
| $15,000 to $24,999 | 0 | 0.0% |
| $25,000 to $34,999 | 0 | 0.0% |
| $35,000 to $49,999 | 0 | 0.0% |
| $50,000 to $74,999 | 0 | 0.0% |
| $75,000 to $99,999 | 5 | 2.6% |
| $100,000 to $149,999 | 104 | 53.6% |
| $150,000 to $199,999 | 51 | 26.3% |
| $200,000+ | 34 | 17.5% |
Family Income by Famaliy Size in Devens
2-person families (27 | 13.9%) account for the highest median family income in Devens with $250,001 per family, while 2-person families (27 | 13.9%) have the highest median income of $125,000 per family member.
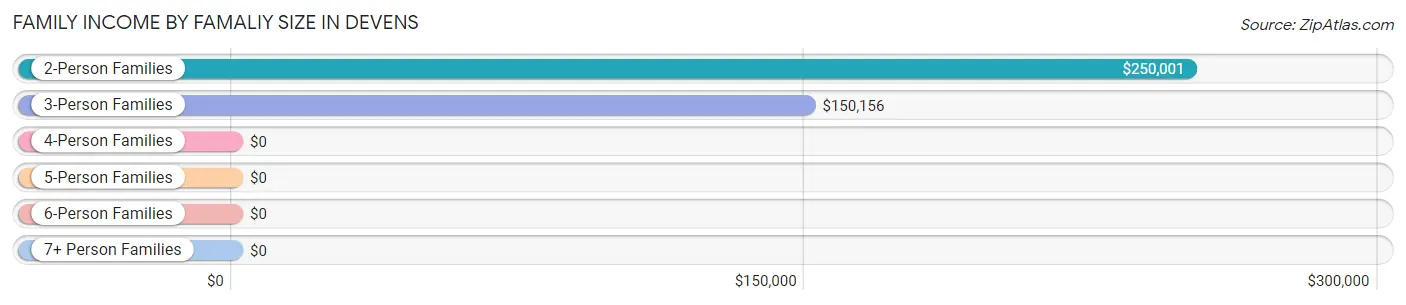
| Income Bracket | # Families | Median Income |
| 2-Person Families | 27 (13.9%) | $250,001 |
| 3-Person Families | 83 (42.8%) | $150,156 |
| 4-Person Families | 68 (35.0%) | $0 |
| 5-Person Families | 16 (8.3%) | $0 |
| 6-Person Families | 0 (0.0%) | $0 |
| 7+ Person Families | 0 (0.0%) | $0 |
| Total | 194 (100.0%) | $131,643 |
Family Income by Number of Earners in Devens
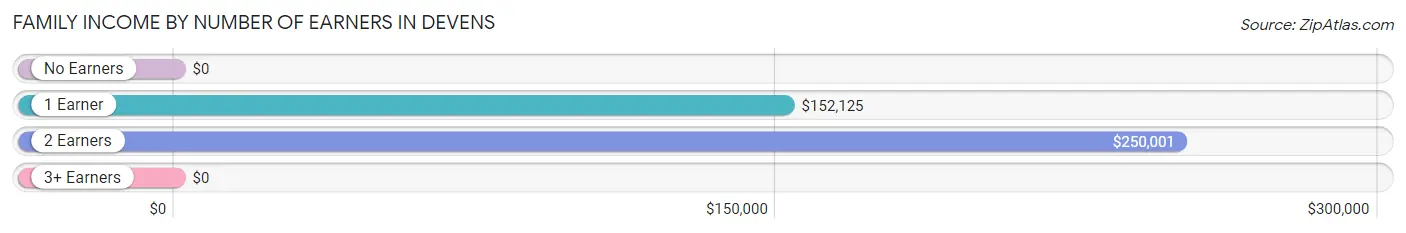
| Number of Earners | # Families | Median Income |
| No Earners | 0 (0.0%) | $0 |
| 1 Earner | 51 (26.3%) | $152,125 |
| 2 Earners | 55 (28.3%) | $250,001 |
| 3+ Earners | 88 (45.4%) | $0 |
| Total | 194 (100.0%) | $131,643 |
Household Income in Devens
Household Income Brackets in Devens
With 110 households falling in the category, the $100,000 to $149,999 income range is the most frequent in Devens, accounting for 39.6% of all households.
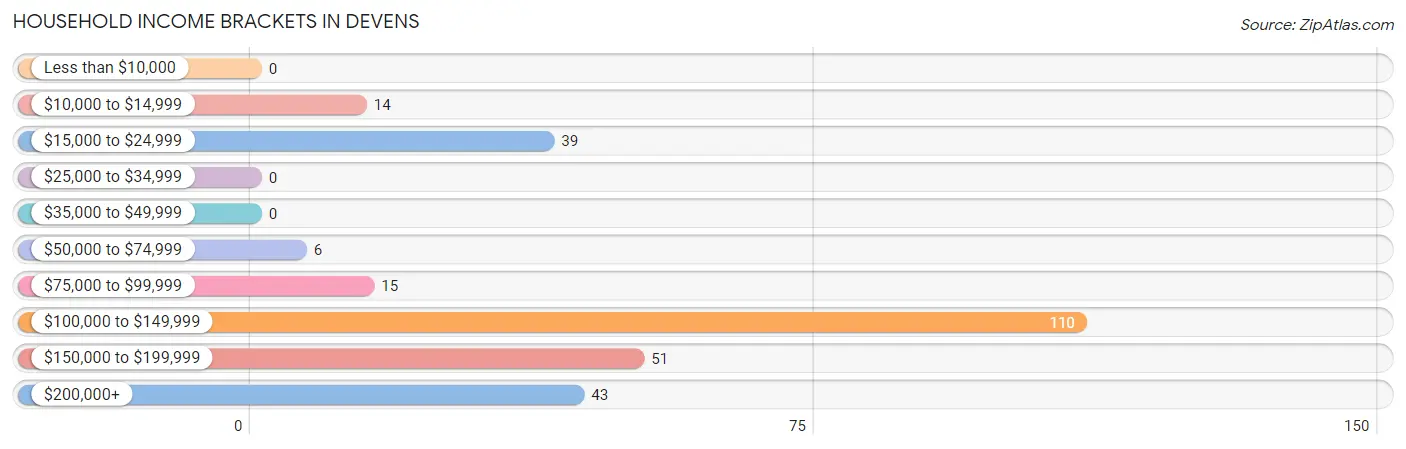
| Income Bracket | # Households | % Households |
| Less than $10,000 | 0 | 0.0% |
| $10,000 to $14,999 | 14 | 5.0% |
| $15,000 to $24,999 | 39 | 14.0% |
| $25,000 to $34,999 | 0 | 0.0% |
| $35,000 to $49,999 | 0 | 0.0% |
| $50,000 to $74,999 | 6 | 2.2% |
| $75,000 to $99,999 | 15 | 5.4% |
| $100,000 to $149,999 | 110 | 39.6% |
| $150,000 to $199,999 | 51 | 18.3% |
| $200,000+ | 43 | 15.5% |
Household Income by Householder Age in Devens
The median household income in Devens is $106,875, with the highest median household income of $150,469 found in the 25 to 44 years age bracket for the primary householder. A total of 69 households (24.8%) fall into this category.
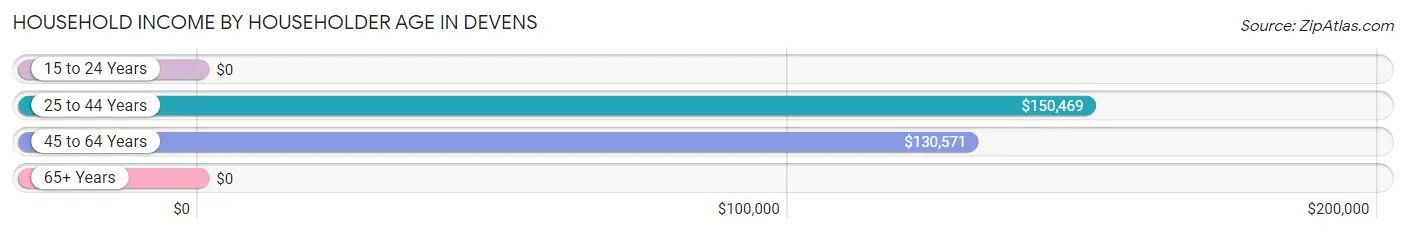
| Income Bracket | # Households | Median Income |
| 15 to 24 Years | 0 (0.0%) | $0 |
| 25 to 44 Years | 69 (24.8%) | $150,469 |
| 45 to 64 Years | 164 (59.0%) | $130,571 |
| 65+ Years | 45 (16.2%) | $0 |
| Total | 278 (100.0%) | $106,875 |
Poverty in Devens
Income Below Poverty by Sex and Age in Devens
With 4.7% poverty level for males and 16.6% for females among the residents of Devens, 25 to 34 year old males and 75 year old and over females are the most vulnerable to poverty, with 14 males (20.9%) and 22 females (100.0%) in their respective age groups living below the poverty level.
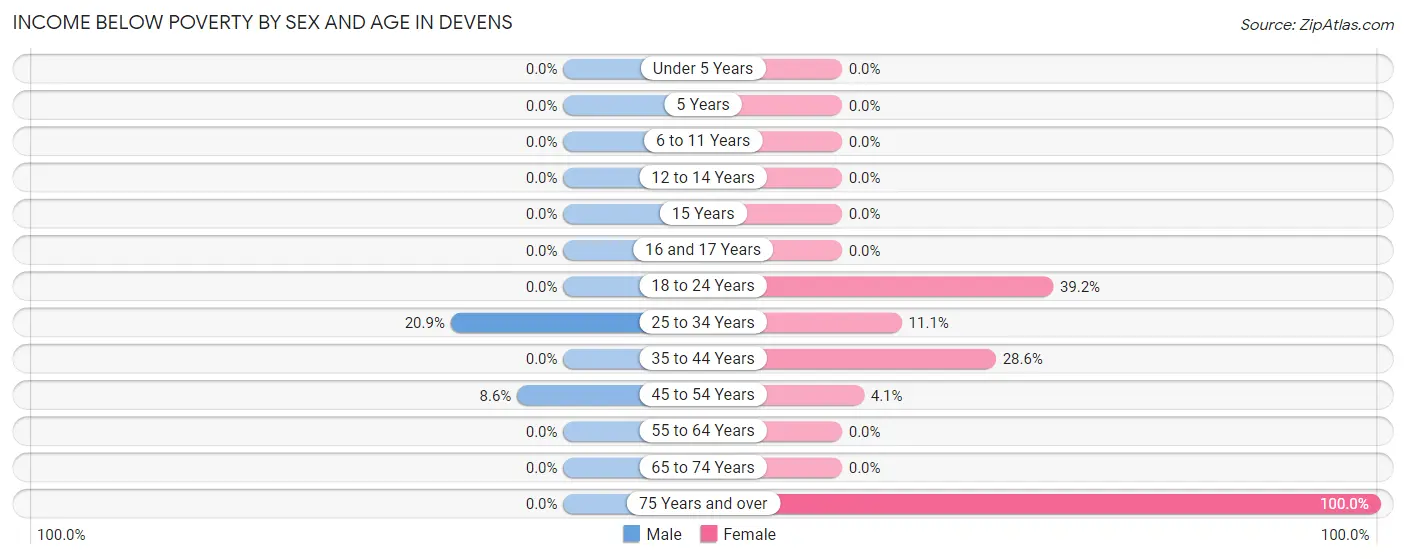
| Age Bracket | Male | Female |
| Under 5 Years | 0 (0.0%) | 0 (0.0%) |
| 5 Years | 0 (0.0%) | 0 (0.0%) |
| 6 to 11 Years | 0 (0.0%) | 0 (0.0%) |
| 12 to 14 Years | 0 (0.0%) | 0 (0.0%) |
| 15 Years | 0 (0.0%) | 0 (0.0%) |
| 16 and 17 Years | 0 (0.0%) | 0 (0.0%) |
| 18 to 24 Years | 0 (0.0%) | 29 (39.2%) |
| 25 to 34 Years | 14 (20.9%) | 2 (11.1%) |
| 35 to 44 Years | 0 (0.0%) | 2 (28.6%) |
| 45 to 54 Years | 9 (8.6%) | 4 (4.1%) |
| 55 to 64 Years | 0 (0.0%) | 0 (0.0%) |
| 65 to 74 Years | 0 (0.0%) | 0 (0.0%) |
| 75 Years and over | 0 (0.0%) | 22 (100.0%) |
| Total | 23 (4.7%) | 59 (16.6%) |
Income Above Poverty by Sex and Age in Devens
According to the poverty statistics in Devens, males aged 6 to 11 years and females aged 6 to 11 years are the age groups that are most secure financially, with 100.0% of males and 100.0% of females in these age groups living above the poverty line.
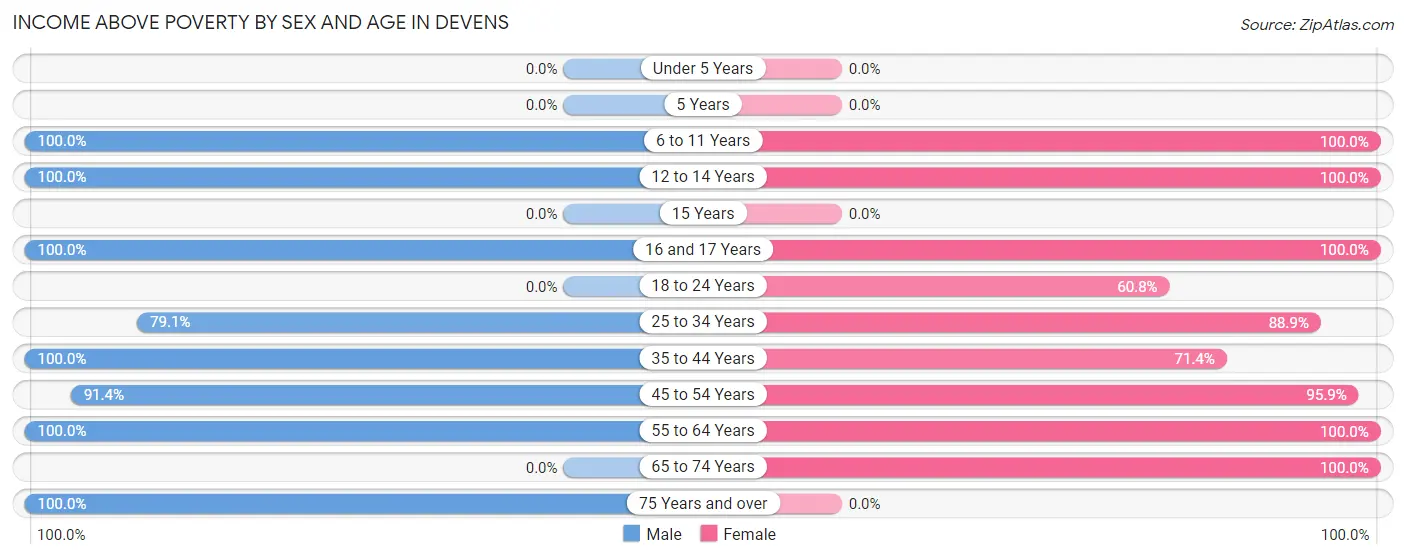
| Age Bracket | Male | Female |
| Under 5 Years | 0 (0.0%) | 0 (0.0%) |
| 5 Years | 0 (0.0%) | 0 (0.0%) |
| 6 to 11 Years | 84 (100.0%) | 50 (100.0%) |
| 12 to 14 Years | 5 (100.0%) | 15 (100.0%) |
| 15 Years | 0 (0.0%) | 0 (0.0%) |
| 16 and 17 Years | 64 (100.0%) | 19 (100.0%) |
| 18 to 24 Years | 0 (0.0%) | 45 (60.8%) |
| 25 to 34 Years | 53 (79.1%) | 16 (88.9%) |
| 35 to 44 Years | 39 (100.0%) | 5 (71.4%) |
| 45 to 54 Years | 96 (91.4%) | 94 (95.9%) |
| 55 to 64 Years | 91 (100.0%) | 47 (100.0%) |
| 65 to 74 Years | 0 (0.0%) | 6 (100.0%) |
| 75 Years and over | 39 (100.0%) | 0 (0.0%) |
| Total | 471 (95.3%) | 297 (83.4%) |
Income Below Poverty Among Married-Couple Families in Devens
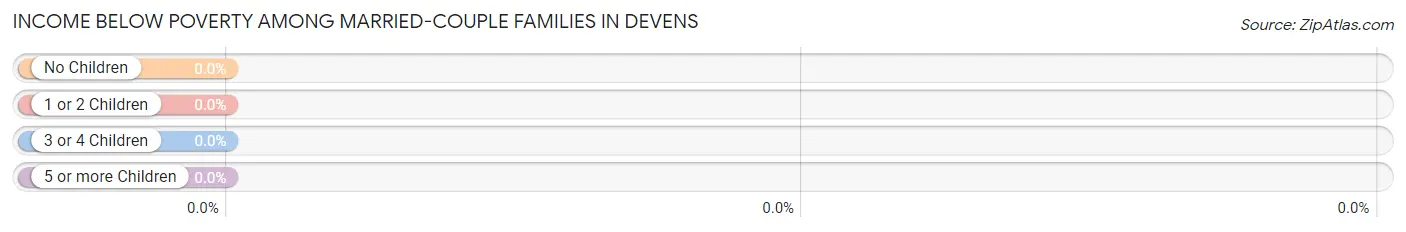
| Children | Above Poverty | Below Poverty |
| No Children | 62 (100.0%) | 0 (0.0%) |
| 1 or 2 Children | 77 (100.0%) | 0 (0.0%) |
| 3 or 4 Children | 16 (100.0%) | 0 (0.0%) |
| 5 or more Children | 0 (0.0%) | 0 (0.0%) |
| Total | 155 (100.0%) | 0 (0.0%) |
Income Below Poverty Among Single-Parent Households in Devens
| Children | Single Father | Single Mother |
| No Children | 0 (0.0%) | 0 (0.0%) |
| 1 or 2 Children | 0 (0.0%) | 0 (0.0%) |
| 3 or 4 Children | 0 (0.0%) | 0 (0.0%) |
| 5 or more Children | 0 (0.0%) | 0 (0.0%) |
| Total | 0 (0.0%) | 0 (0.0%) |
Income Below Poverty Among Married-Couple vs Single-Parent Households in Devens
| Children | Married-Couple Families | Single-Parent Households |
| No Children | 0 (0.0%) | 0 (0.0%) |
| 1 or 2 Children | 0 (0.0%) | 0 (0.0%) |
| 3 or 4 Children | 0 (0.0%) | 0 (0.0%) |
| 5 or more Children | 0 (0.0%) | 0 (0.0%) |
| Total | 0 (0.0%) | 0 (0.0%) |
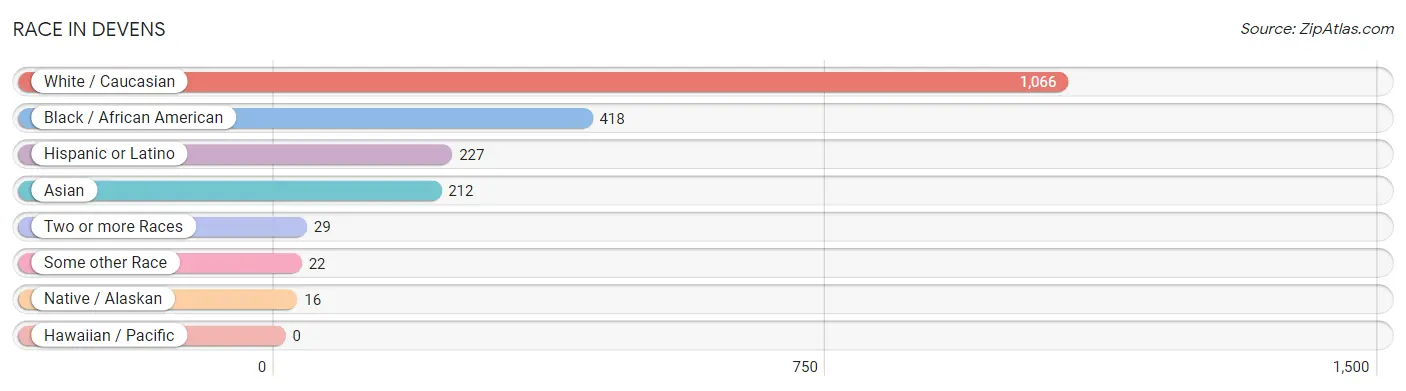
Race in Devens
The most populous races in Devens are White / Caucasian (1,066 | 60.5%), Black / African American (418 | 23.7%), and Hispanic or Latino (227 | 12.9%).
| Race | # Population | % Population |
| Asian | 212 | 12.0% |
| Black / African American | 418 | 23.7% |
| Hawaiian / Pacific | 0 | 0.0% |
| Hispanic or Latino | 227 | 12.9% |
| Native / Alaskan | 16 | 0.9% |
| White / Caucasian | 1,066 | 60.5% |
| Two or more Races | 29 | 1.6% |
| Some other Race | 22 | 1.3% |
| Total | 1,763 | 100.0% |
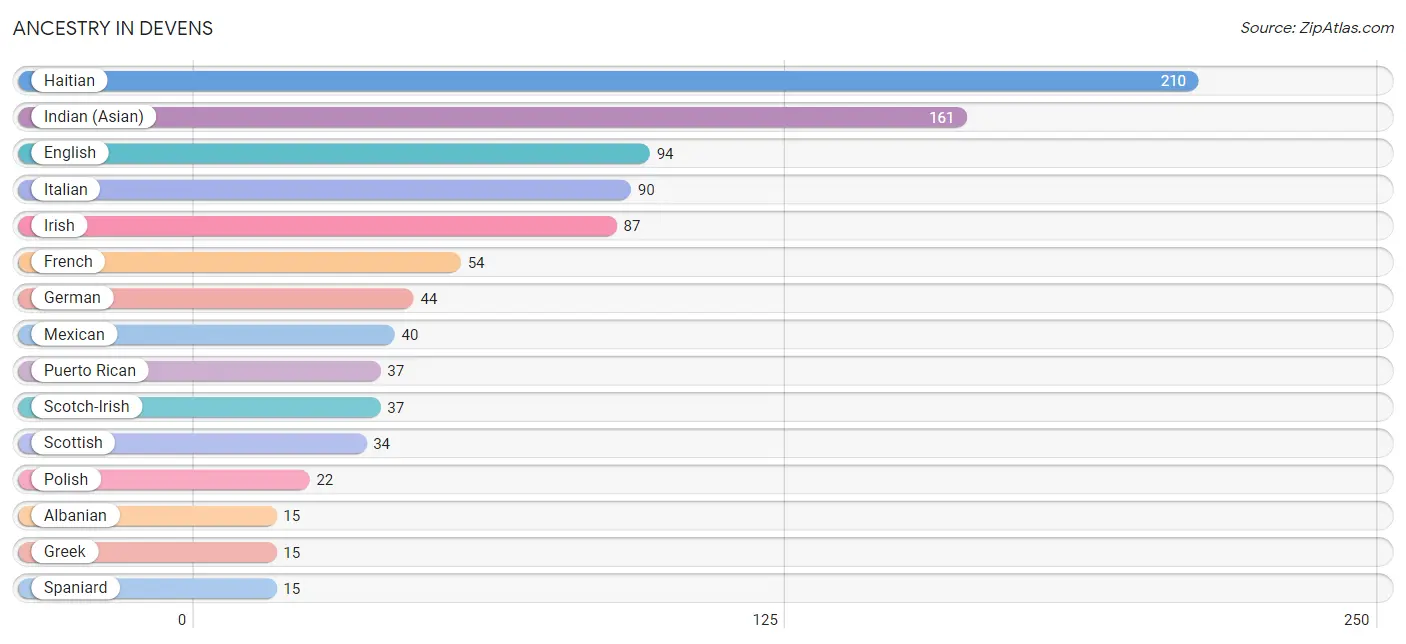
Ancestry in Devens
The most populous ancestries reported in Devens are Haitian (210 | 11.9%), Indian (Asian) (161 | 9.1%), English (94 | 5.3%), Italian (90 | 5.1%), and Irish (87 | 4.9%), together accounting for 36.4% of all Devens residents.
| Ancestry | # Population | % Population |
| African | 10 | 0.6% |
| Albanian | 15 | 0.9% |
| American | 10 | 0.6% |
| Arab | 12 | 0.7% |
| Armenian | 7 | 0.4% |
| British | 10 | 0.6% |
| Burmese | 7 | 0.4% |
| Canadian | 10 | 0.6% |
| Cuban | 10 | 0.6% |
| Dominican | 11 | 0.6% |
| English | 94 | 5.3% |
| European | 14 | 0.8% |
| Filipino | 5 | 0.3% |
| French | 54 | 3.1% |
| French Canadian | 6 | 0.3% |
| German | 44 | 2.5% |
| Greek | 15 | 0.9% |
| Haitian | 210 | 11.9% |
| Indian (Asian) | 161 | 9.1% |
| Irish | 87 | 4.9% |
| Italian | 90 | 5.1% |
| Japanese | 11 | 0.6% |
| Korean | 10 | 0.6% |
| Lebanese | 12 | 0.7% |
| Lithuanian | 7 | 0.4% |
| Mexican | 40 | 2.3% |
| Polish | 22 | 1.3% |
| Portuguese | 2 | 0.1% |
| Puerto Rican | 37 | 2.1% |
| Russian | 5 | 0.3% |
| Scotch-Irish | 37 | 2.1% |
| Scottish | 34 | 1.9% |
| Spaniard | 15 | 0.9% |
| Subsaharan African | 10 | 0.6% |
| Thai | 11 | 0.6% |
| Ukrainian | 9 | 0.5% | View All 36 Rows |
Immigrants in Devens
The most numerous immigrant groups reported in Devens came from Latin America (187 | 10.6%), Asia (126 | 7.1%), Caribbean (124 | 7.0%), Eastern Asia (115 | 6.5%), and China (110 | 6.2%), together accounting for 37.6% of all Devens residents.
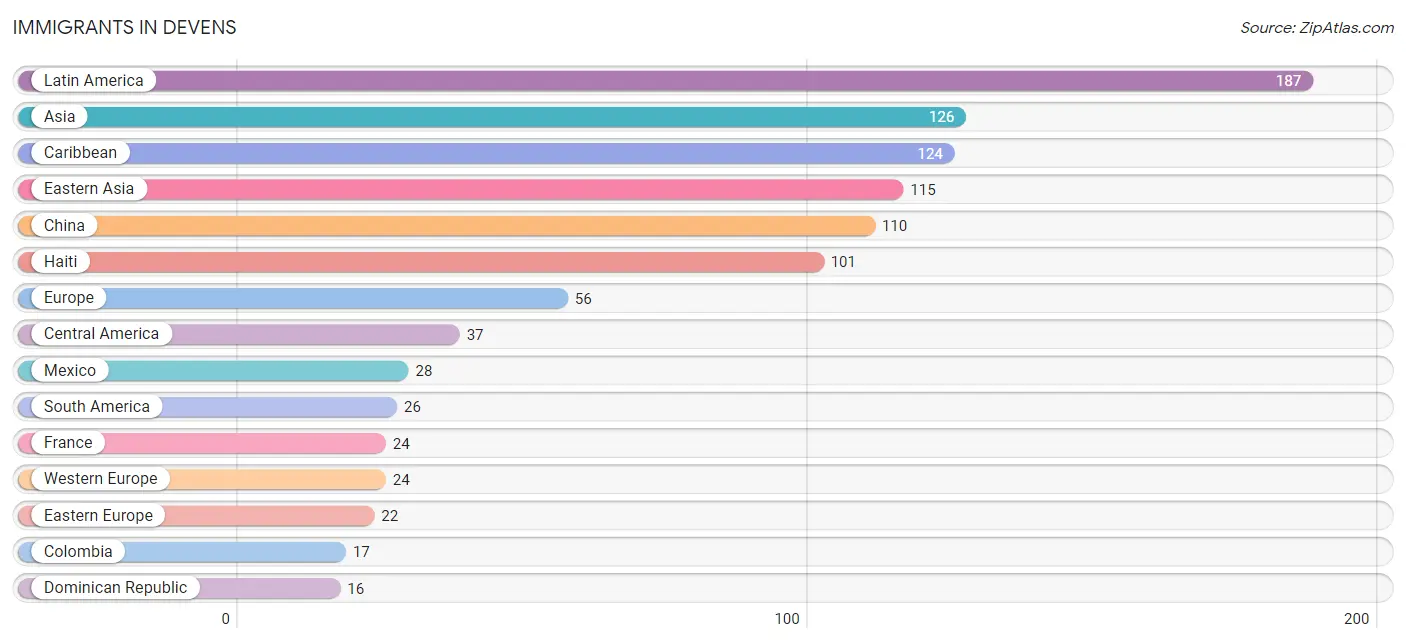
| Immigration Origin | # Population | % Population |
| Africa | 12 | 0.7% |
| Asia | 126 | 7.1% |
| Brazil | 9 | 0.5% |
| Caribbean | 124 | 7.0% |
| Central America | 37 | 2.1% |
| China | 110 | 6.2% |
| Colombia | 17 | 1.0% |
| Dominican Republic | 16 | 0.9% |
| Eastern Asia | 115 | 6.5% |
| Eastern Europe | 22 | 1.3% |
| El Salvador | 9 | 0.5% |
| Europe | 56 | 3.2% |
| France | 24 | 1.4% |
| Ghana | 6 | 0.3% |
| Haiti | 101 | 5.7% |
| Jamaica | 7 | 0.4% |
| Korea | 5 | 0.3% |
| Latin America | 187 | 10.6% |
| Mexico | 28 | 1.6% |
| Northern Europe | 10 | 0.6% |
| Pakistan | 11 | 0.6% |
| Sierra Leone | 6 | 0.3% |
| South America | 26 | 1.5% |
| South Central Asia | 11 | 0.6% |
| Taiwan | 5 | 0.3% |
| Ukraine | 7 | 0.4% |
| Western Africa | 12 | 0.7% |
| Western Europe | 24 | 1.4% | View All 28 Rows |
Sex and Age in Devens
Sex and Age in Devens
The most populous age groups in Devens are 50 to 54 Years (202 | 14.5%) for men and 15 to 19 Years (70 | 19.1%) for women.
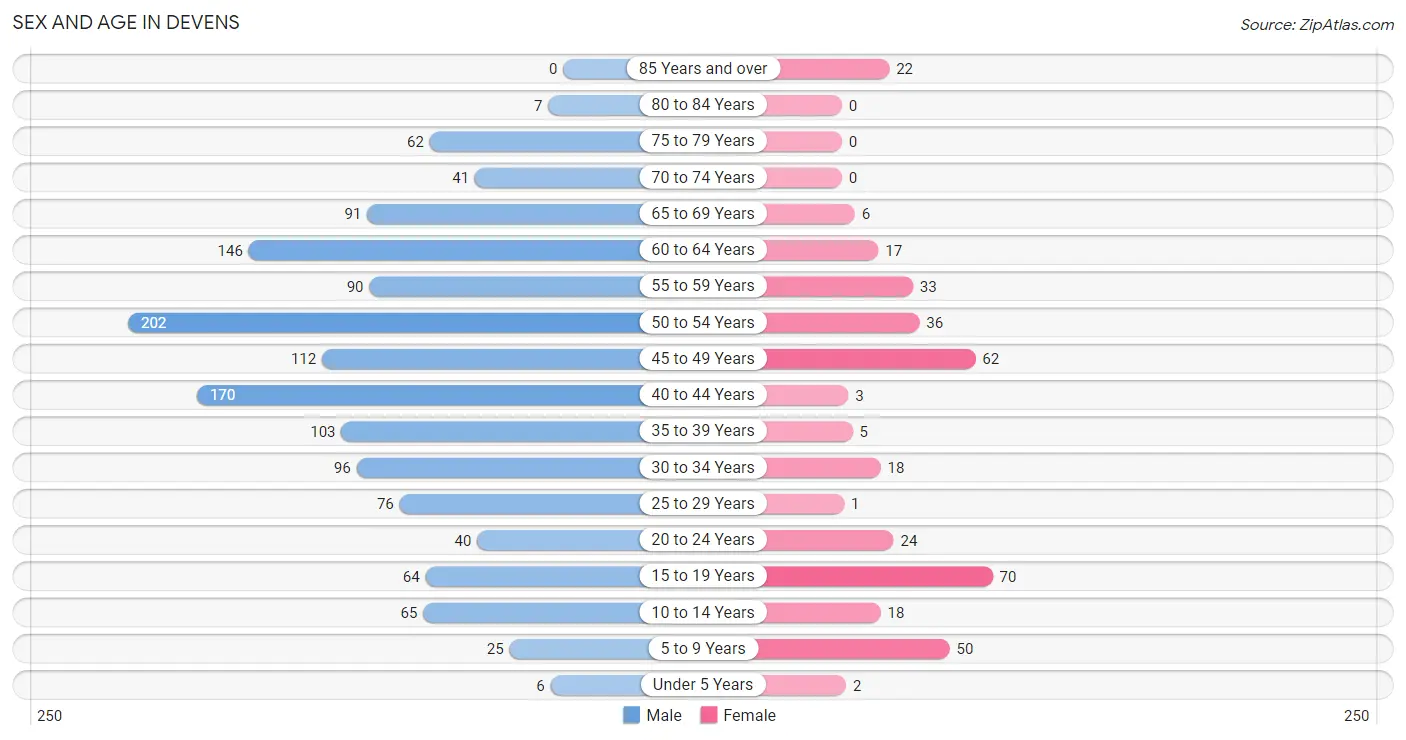
| Age Bracket | Male | Female |
| Under 5 Years | 6 (0.4%) | 2 (0.5%) |
| 5 to 9 Years | 25 (1.8%) | 50 (13.6%) |
| 10 to 14 Years | 65 (4.7%) | 18 (4.9%) |
| 15 to 19 Years | 64 (4.6%) | 70 (19.1%) |
| 20 to 24 Years | 40 (2.9%) | 24 (6.5%) |
| 25 to 29 Years | 76 (5.4%) | 1 (0.3%) |
| 30 to 34 Years | 96 (6.9%) | 18 (4.9%) |
| 35 to 39 Years | 103 (7.4%) | 5 (1.4%) |
| 40 to 44 Years | 170 (12.2%) | 3 (0.8%) |
| 45 to 49 Years | 112 (8.0%) | 62 (16.9%) |
| 50 to 54 Years | 202 (14.5%) | 36 (9.8%) |
| 55 to 59 Years | 90 (6.5%) | 33 (9.0%) |
| 60 to 64 Years | 146 (10.5%) | 17 (4.6%) |
| 65 to 69 Years | 91 (6.5%) | 6 (1.6%) |
| 70 to 74 Years | 41 (2.9%) | 0 (0.0%) |
| 75 to 79 Years | 62 (4.4%) | 0 (0.0%) |
| 80 to 84 Years | 7 (0.5%) | 0 (0.0%) |
| 85 Years and over | 0 (0.0%) | 22 (6.0%) |
| Total | 1,396 (100.0%) | 367 (100.0%) |
Families and Households in Devens
Median Family Size in Devens
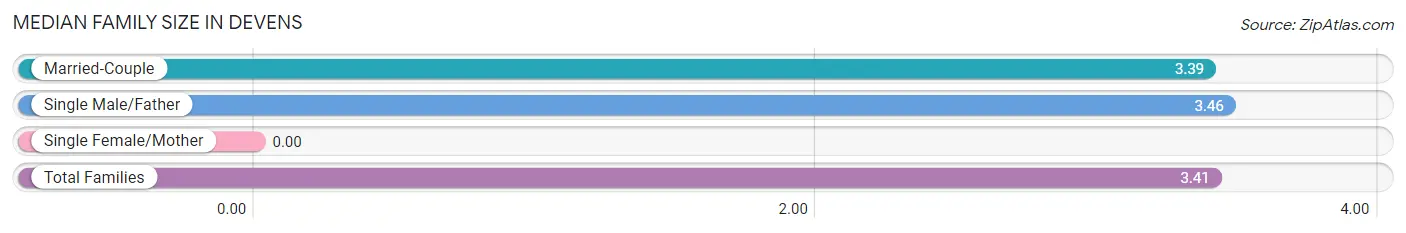
| Family Type | # Families | Family Size |
| Married-Couple | 155 (79.9%) | 3.39 |
| Single Male/Father | 39 (20.1%) | 3.46 |
| Single Female/Mother | 0 (0.0%) | - |
| Total Families | 194 (100.0%) | 3.41 |
Median Household Size in Devens
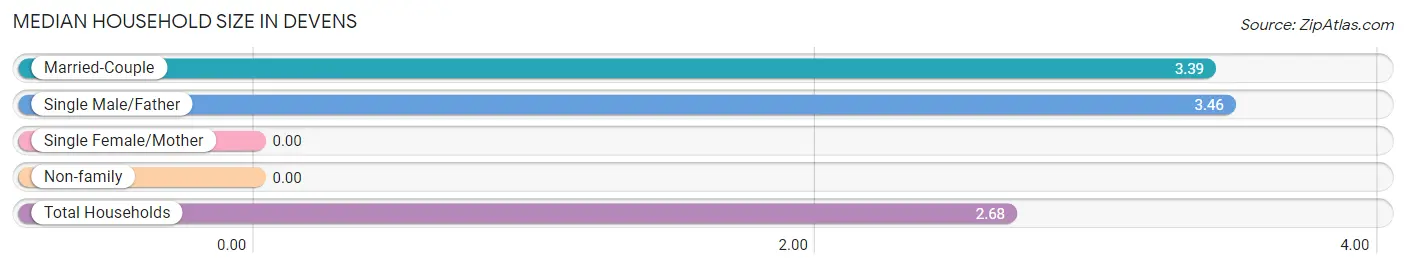
| Household Type | # Households | Household Size |
| Married-Couple | 155 (55.8%) | 3.39 |
| Single Male/Father | 39 (14.0%) | 3.46 |
| Single Female/Mother | 0 (0.0%) | - |
| Non-family | 84 (30.2%) | - |
| Total Households | 278 (100.0%) | 2.68 |
Household Size by Marriage Status in Devens
Out of a total of 278 households in Devens, 194 (69.8%) are family households, while 84 (30.2%) are nonfamily households. The most numerous type of family households are 3-person households, comprising 83, and the most common type of nonfamily households are 1-person households, comprising 84.
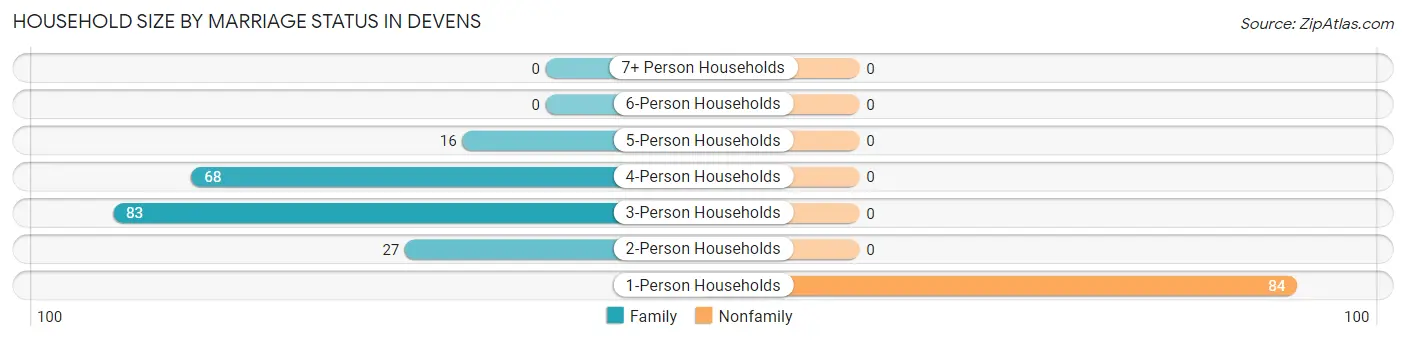
| Household Size | Family Households | Nonfamily Households |
| 1-Person Households | - | 84 (30.2%) |
| 2-Person Households | 27 (9.7%) | 0 (0.0%) |
| 3-Person Households | 83 (29.9%) | 0 (0.0%) |
| 4-Person Households | 68 (24.5%) | 0 (0.0%) |
| 5-Person Households | 16 (5.8%) | 0 (0.0%) |
| 6-Person Households | 0 (0.0%) | 0 (0.0%) |
| 7+ Person Households | 0 (0.0%) | 0 (0.0%) |
| Total | 194 (69.8%) | 84 (30.2%) |
Female Fertility in Devens
Fertility by Age in Devens
Average fertility rate in Devens is 37.0 births per 1,000 women. Women in the age bracket of 35 to 50 years have the highest fertility rate with 67.0 births per 1,000 women. Women in the age bracket of 35 to 50 years acount for 71.4% of all women with births.
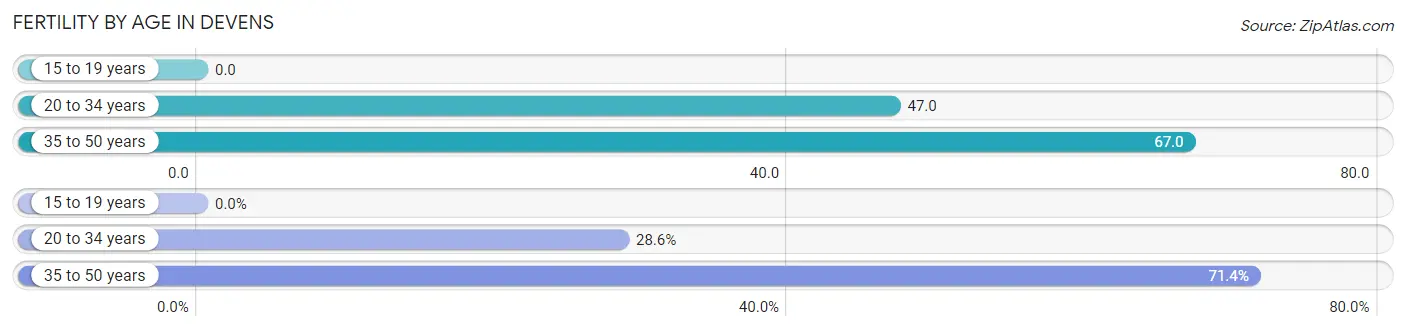
| Age Bracket | Women with Births | Births / 1,000 Women |
| 15 to 19 years | 0 (0.0%) | 0.0 |
| 20 to 34 years | 2 (28.6%) | 47.0 |
| 35 to 50 years | 5 (71.4%) | 67.0 |
| Total | 7 (100.0%) | 37.0 |
Fertility by Age by Marriage Status in Devens
71.4% of women with births (7) in Devens are married. The highest percentage of unmarried women with births falls into 20 to 34 years age bracket with 100.0% of them unmarried at the time of birth, while the lowest percentage of unmarried women with births belong to 35 to 50 years age bracket with 0.0% of them unmarried.
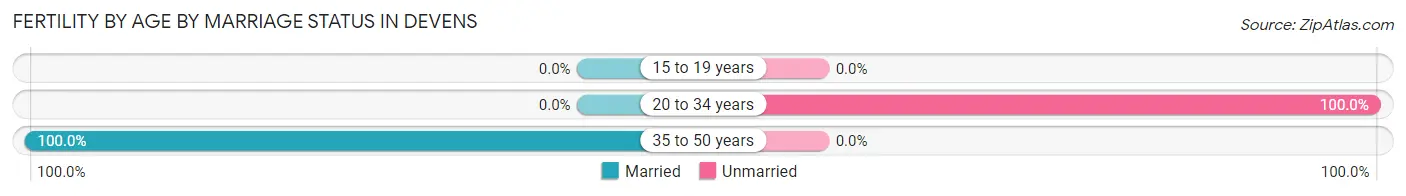
| Age Bracket | Married | Unmarried |
| 15 to 19 years | 0 (0.0%) | 0 (0.0%) |
| 20 to 34 years | 0 (0.0%) | 2 (100.0%) |
| 35 to 50 years | 5 (100.0%) | 0 (0.0%) |
| Total | 5 (71.4%) | 2 (28.6%) |
Fertility by Education in Devens
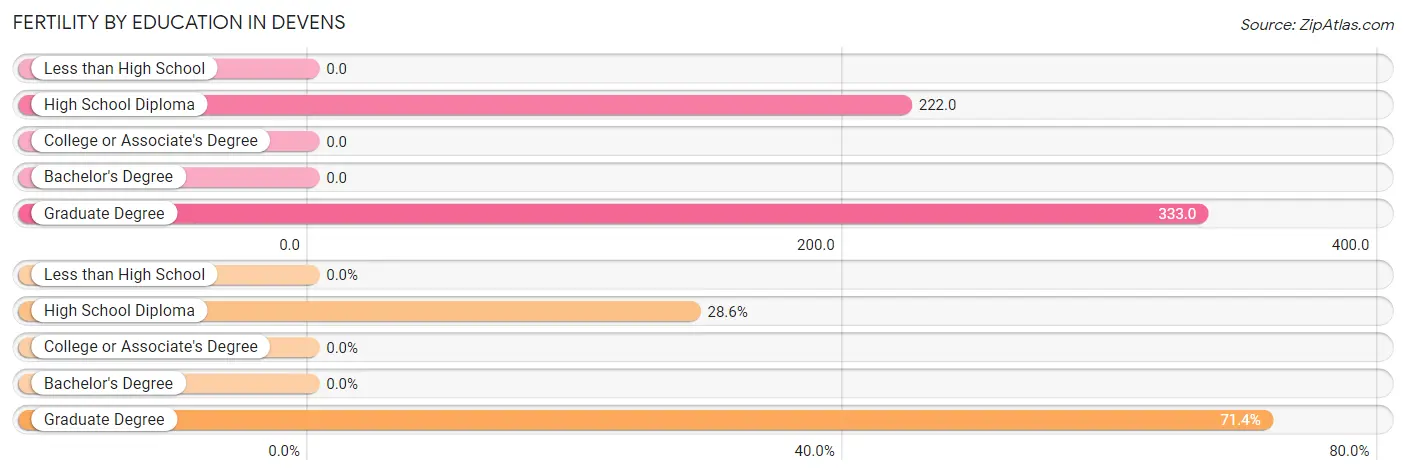
| Educational Attainment | Women with Births | Births / 1,000 Women |
| Less than High School | 0 (0.0%) | 0.0 |
| High School Diploma | 2 (28.6%) | 222.0 |
| College or Associate's Degree | 0 (0.0%) | 0.0 |
| Bachelor's Degree | 0 (0.0%) | 0.0 |
| Graduate Degree | 5 (71.4%) | 333.0 |
| Total | 7 (100.0%) | 37.0 |
Fertility by Education by Marriage Status in Devens
28.6% of women with births in Devens are unmarried. Women with the educational attainment of graduate degree are most likely to be married with 100.0% of them married at childbirth, while women with the educational attainment of high school diploma are least likely to be married with 100.0% of them unmarried at childbirth.
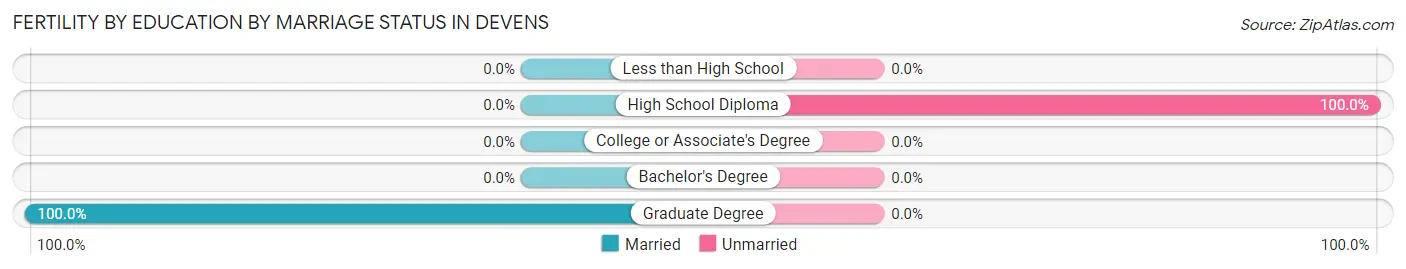
| Educational Attainment | Married | Unmarried |
| Less than High School | 0 (0.0%) | 0 (0.0%) |
| High School Diploma | 0 (0.0%) | 2 (100.0%) |
| College or Associate's Degree | 0 (0.0%) | 0 (0.0%) |
| Bachelor's Degree | 0 (0.0%) | 0 (0.0%) |
| Graduate Degree | 5 (100.0%) | 0 (0.0%) |
| Total | 5 (71.4%) | 2 (28.6%) |
Employment Characteristics in Devens
Employment by Class of Employer in Devens
Among the 479 employed individuals in Devens, private company employees (401 | 83.7%), not-for-profit organizations (37 | 7.7%), and self-employed (incorporated) (35 | 7.3%) make up the most common classes of employment.
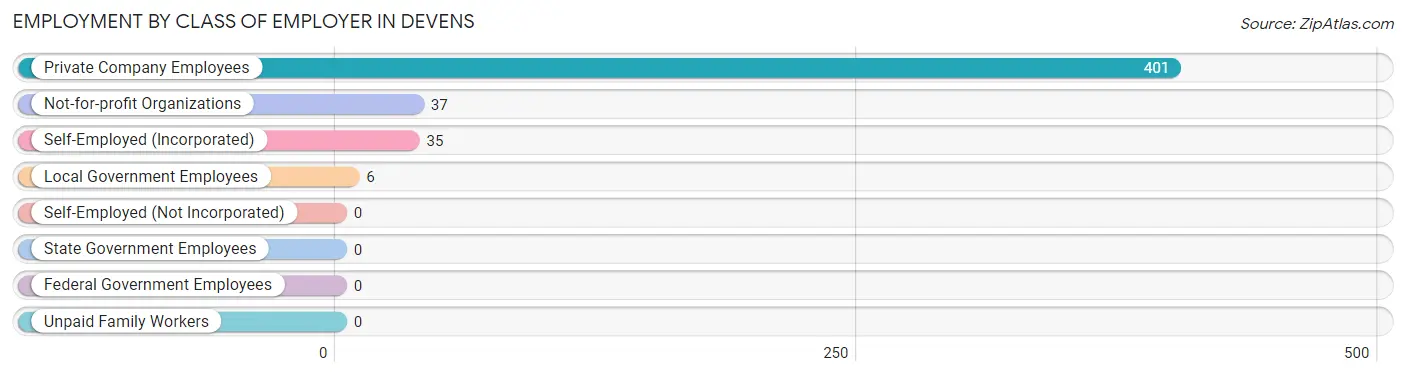
| Employer Class | # Employees | % Employees |
| Private Company Employees | 401 | 83.7% |
| Self-Employed (Incorporated) | 35 | 7.3% |
| Self-Employed (Not Incorporated) | 0 | 0.0% |
| Not-for-profit Organizations | 37 | 7.7% |
| Local Government Employees | 6 | 1.3% |
| State Government Employees | 0 | 0.0% |
| Federal Government Employees | 0 | 0.0% |
| Unpaid Family Workers | 0 | 0.0% |
| Total | 479 | 100.0% |
Employment Status by Age in Devens
According to the labor force statistics for Devens, out of the total population over 16 years of age (1,597), 30.6% or 489 individuals are in the labor force, with 1.0% or 5 of them unemployed. The age group with the highest labor force participation rate is 25 to 29 years, with 66.2% or 51 individuals in the labor force. Within the labor force, the 16 to 19 years age range has the highest percentage of unemployed individuals, with 10.0% or 5 of them being unemployed.
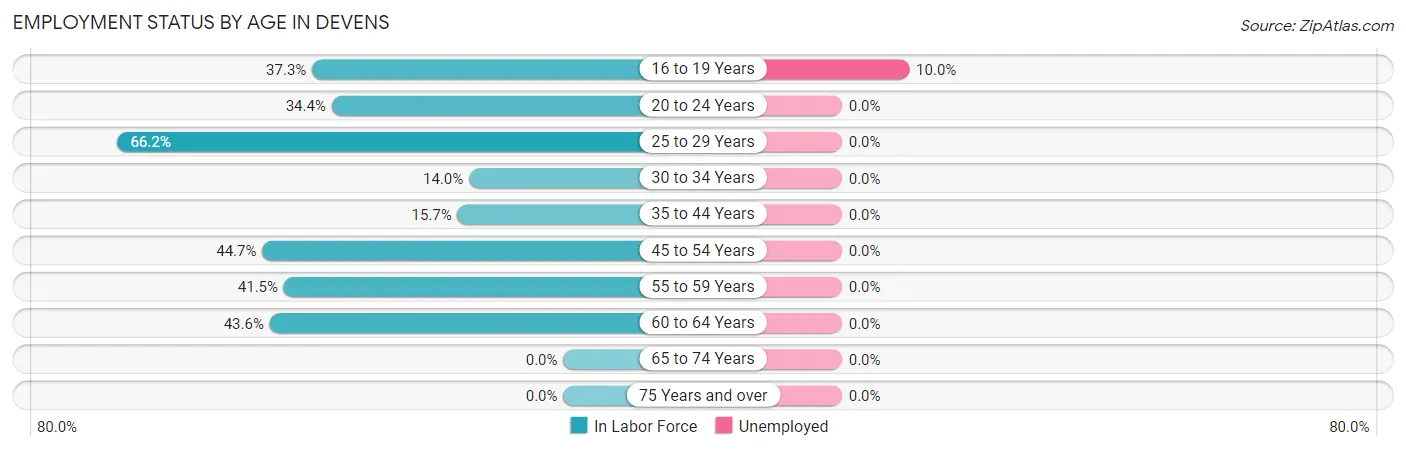
| Age Bracket | In Labor Force | Unemployed |
| 16 to 19 Years | 50 (37.3%) | 5 (10.0%) |
| 20 to 24 Years | 22 (34.4%) | 0 (0.0%) |
| 25 to 29 Years | 51 (66.2%) | 0 (0.0%) |
| 30 to 34 Years | 16 (14.0%) | 0 (0.0%) |
| 35 to 44 Years | 44 (15.7%) | 0 (0.0%) |
| 45 to 54 Years | 184 (44.7%) | 0 (0.0%) |
| 55 to 59 Years | 51 (41.5%) | 0 (0.0%) |
| 60 to 64 Years | 71 (43.6%) | 0 (0.0%) |
| 65 to 74 Years | 0 (0.0%) | 0 (0.0%) |
| 75 Years and over | 0 (0.0%) | 0 (0.0%) |
| Total | 489 (30.6%) | 5 (1.0%) |
Employment Status by Educational Attainment in Devens
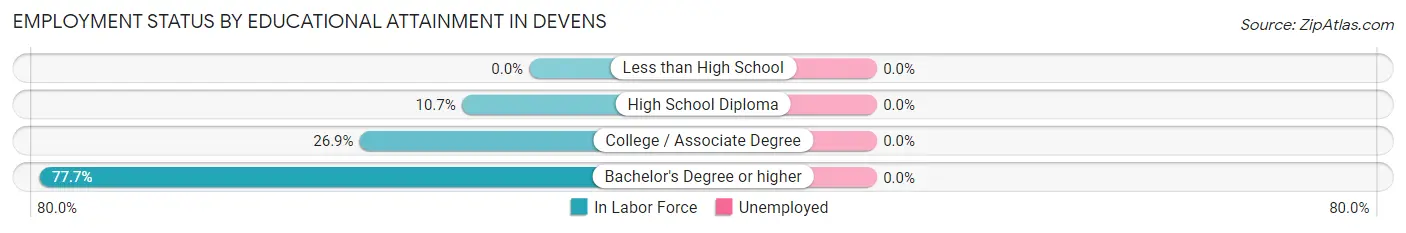
| Educational Attainment | In Labor Force | Unemployed |
| Less than High School | 0 (0.0%) | 0 (0.0%) |
| High School Diploma | 35 (10.7%) | 0 (0.0%) |
| College / Associate Degree | 75 (26.9%) | 0 (0.0%) |
| Bachelor's Degree or higher | 307 (77.7%) | 0 (0.0%) |
| Total | 417 (35.6%) | 0 (0.0%) |
Employment Occupations by Sex in Devens
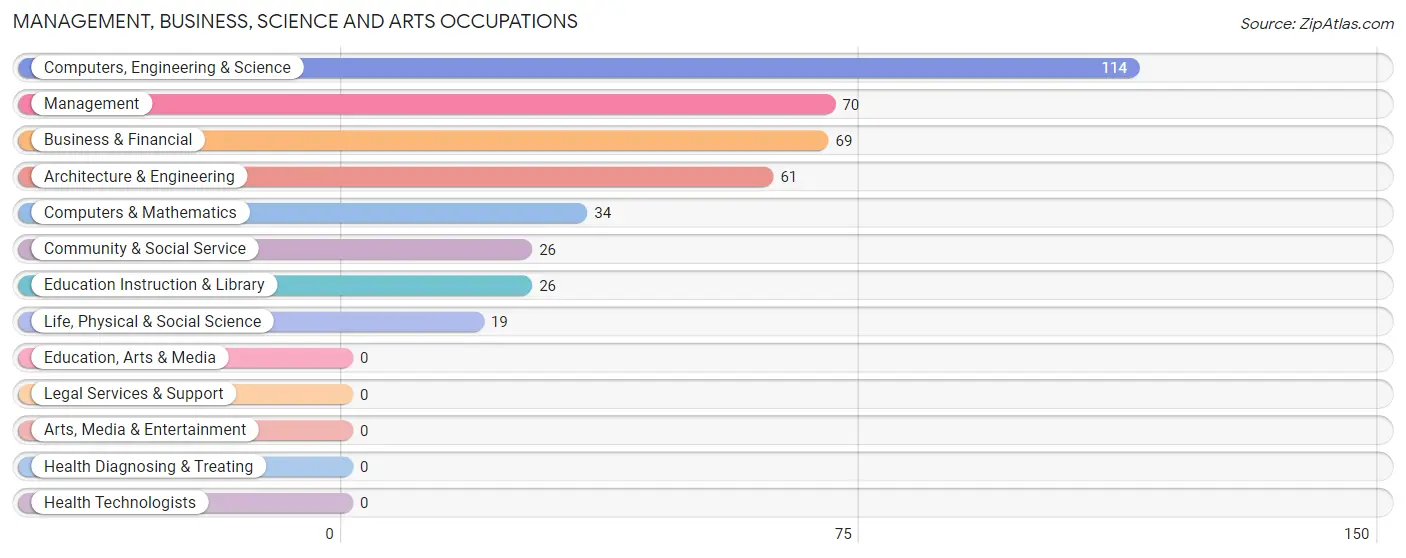
Management, Business, Science and Arts Occupations
The most common Management, Business, Science and Arts occupations in Devens are Computers, Engineering & Science (114 | 23.5%), Management (70 | 14.5%), Business & Financial (69 | 14.3%), Architecture & Engineering (61 | 12.6%), and Computers & Mathematics (34 | 7.0%).
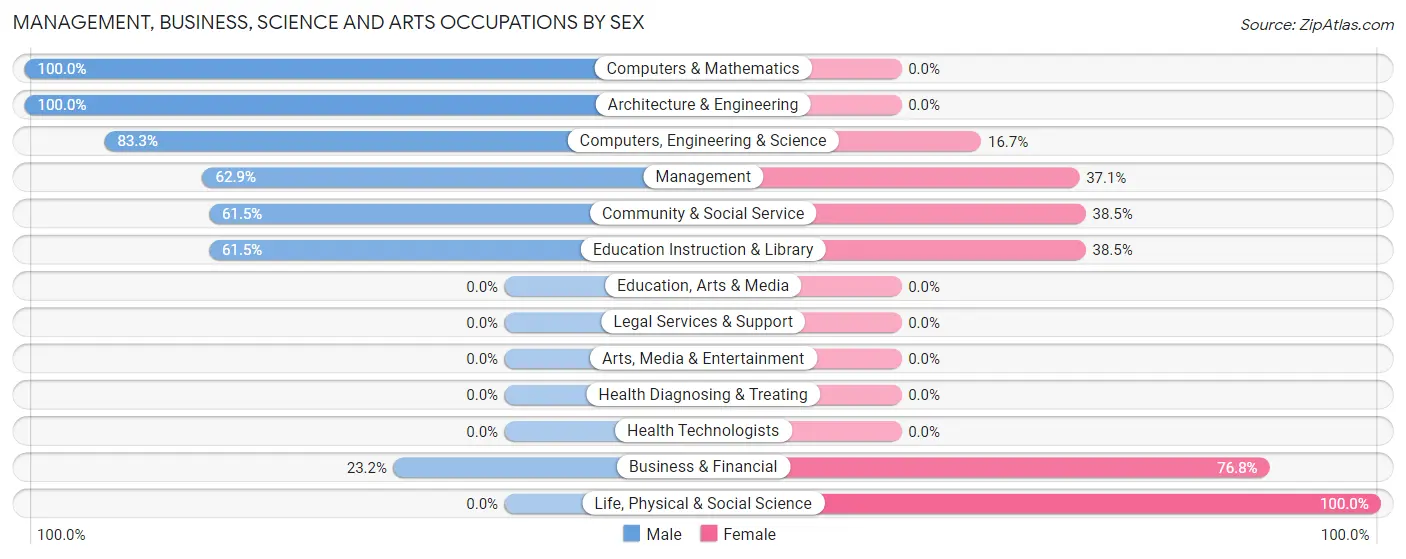
Management, Business, Science and Arts Occupations by Sex
Within the Management, Business, Science and Arts occupations in Devens, the most male-oriented occupations are Computers & Mathematics (100.0%), Architecture & Engineering (100.0%), and Computers, Engineering & Science (83.3%), while the most female-oriented occupations are Life, Physical & Social Science (100.0%), Business & Financial (76.8%), and Community & Social Service (38.5%).
| Occupation | Male | Female |
| Management | 44 (62.9%) | 26 (37.1%) |
| Business & Financial | 16 (23.2%) | 53 (76.8%) |
| Computers, Engineering & Science | 95 (83.3%) | 19 (16.7%) |
| Computers & Mathematics | 34 (100.0%) | 0 (0.0%) |
| Architecture & Engineering | 61 (100.0%) | 0 (0.0%) |
| Life, Physical & Social Science | 0 (0.0%) | 19 (100.0%) |
| Community & Social Service | 16 (61.5%) | 10 (38.5%) |
| Education, Arts & Media | 0 (0.0%) | 0 (0.0%) |
| Legal Services & Support | 0 (0.0%) | 0 (0.0%) |
| Education Instruction & Library | 16 (61.5%) | 10 (38.5%) |
| Arts, Media & Entertainment | 0 (0.0%) | 0 (0.0%) |
| Health Diagnosing & Treating | 0 (0.0%) | 0 (0.0%) |
| Health Technologists | 0 (0.0%) | 0 (0.0%) |
| Total (Category) | 171 (61.3%) | 108 (38.7%) |
| Total (Overall) | 277 (57.2%) | 207 (42.8%) |
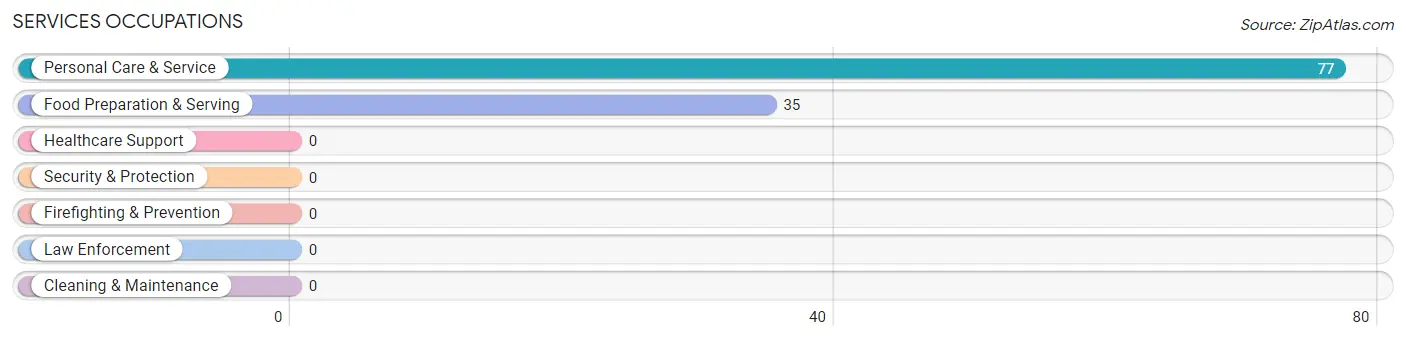
Services Occupations
The most common Services occupations in Devens are Personal Care & Service (77 | 15.9%), and Food Preparation & Serving (35 | 7.2%).
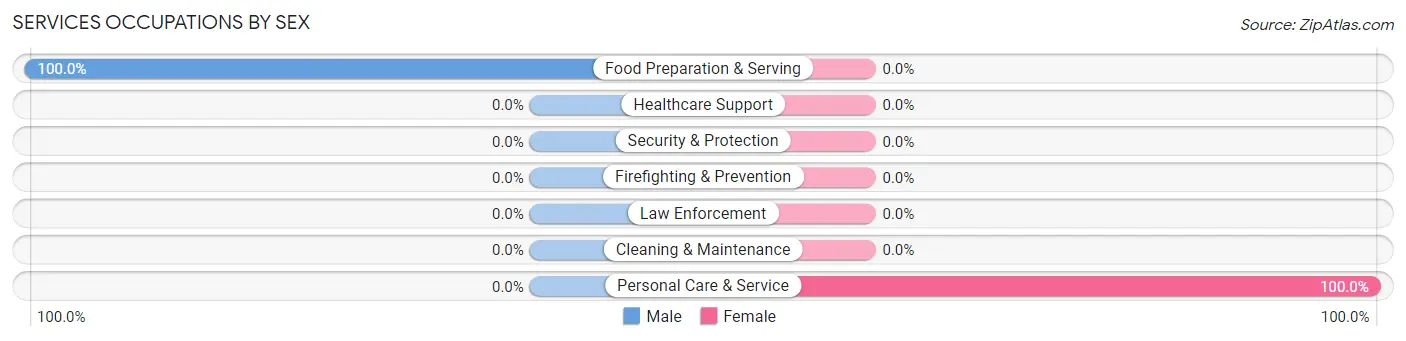
Services Occupations by Sex
| Occupation | Male | Female |
| Healthcare Support | 0 (0.0%) | 0 (0.0%) |
| Security & Protection | 0 (0.0%) | 0 (0.0%) |
| Firefighting & Prevention | 0 (0.0%) | 0 (0.0%) |
| Law Enforcement | 0 (0.0%) | 0 (0.0%) |
| Food Preparation & Serving | 35 (100.0%) | 0 (0.0%) |
| Cleaning & Maintenance | 0 (0.0%) | 0 (0.0%) |
| Personal Care & Service | 0 (0.0%) | 77 (100.0%) |
| Total (Category) | 35 (31.2%) | 77 (68.8%) |
| Total (Overall) | 277 (57.2%) | 207 (42.8%) |
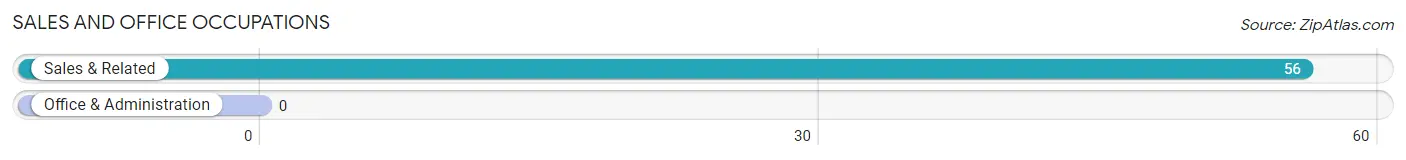
Sales and Office Occupations
The most common Sales and Office occupations in Devens are , and Sales & Related (56 | 11.6%).
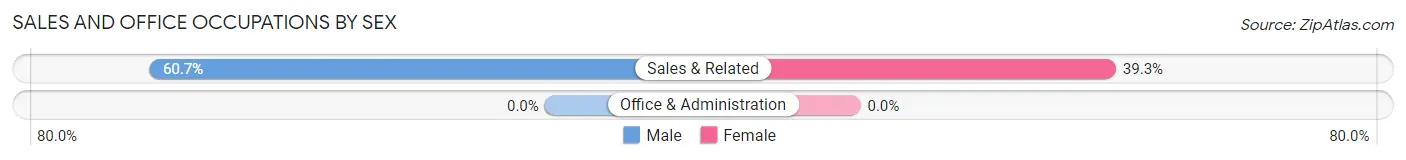
Sales and Office Occupations by Sex
| Occupation | Male | Female |
| Sales & Related | 34 (60.7%) | 22 (39.3%) |
| Office & Administration | 0 (0.0%) | 0 (0.0%) |
| Total (Category) | 34 (60.7%) | 22 (39.3%) |
| Total (Overall) | 277 (57.2%) | 207 (42.8%) |
Natural Resources, Construction and Maintenance Occupations
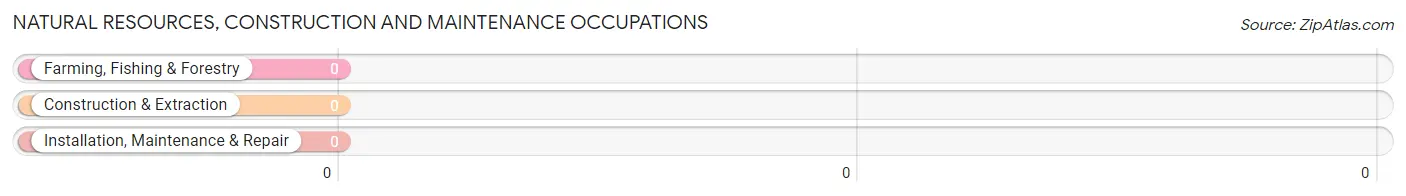
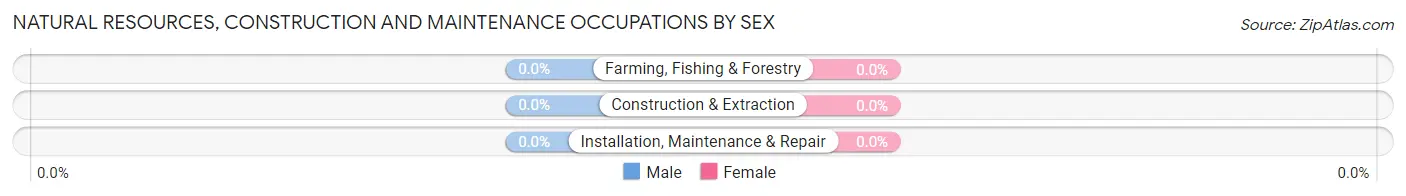
Natural Resources, Construction and Maintenance Occupations by Sex
| Occupation | Male | Female |
| Farming, Fishing & Forestry | 0 (0.0%) | 0 (0.0%) |
| Construction & Extraction | 0 (0.0%) | 0 (0.0%) |
| Installation, Maintenance & Repair | 0 (0.0%) | 0 (0.0%) |
| Total (Category) | 0 (0.0%) | 0 (0.0%) |
| Total (Overall) | 277 (57.2%) | 207 (42.8%) |
Production, Transportation and Moving Occupations
The most common Production, Transportation and Moving occupations in Devens are , and Production (37 | 7.6%).
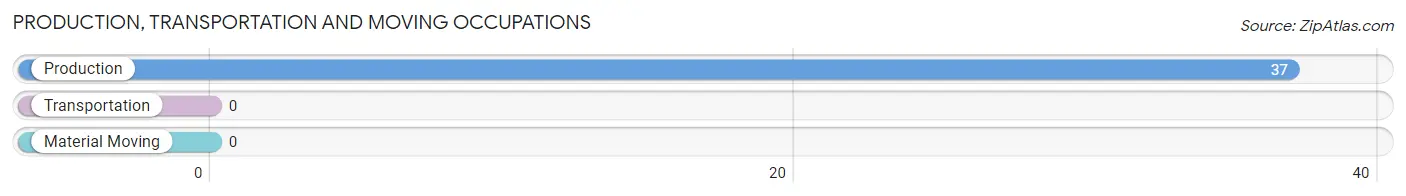
Production, Transportation and Moving Occupations by Sex
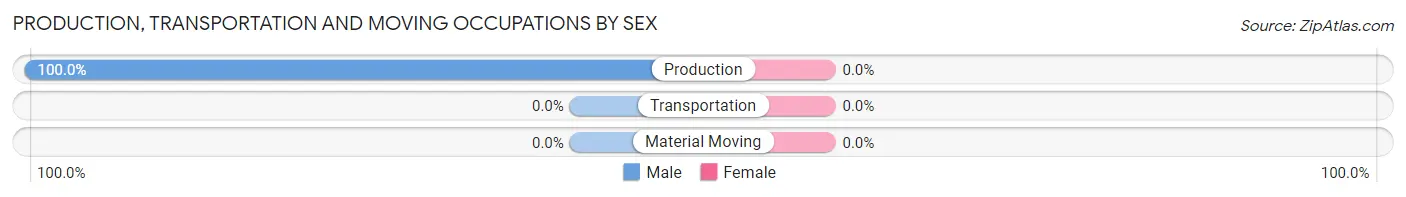
| Occupation | Male | Female |
| Production | 37 (100.0%) | 0 (0.0%) |
| Transportation | 0 (0.0%) | 0 (0.0%) |
| Material Moving | 0 (0.0%) | 0 (0.0%) |
| Total (Category) | 37 (100.0%) | 0 (0.0%) |
| Total (Overall) | 277 (57.2%) | 207 (42.8%) |
Employment Industries by Sex in Devens
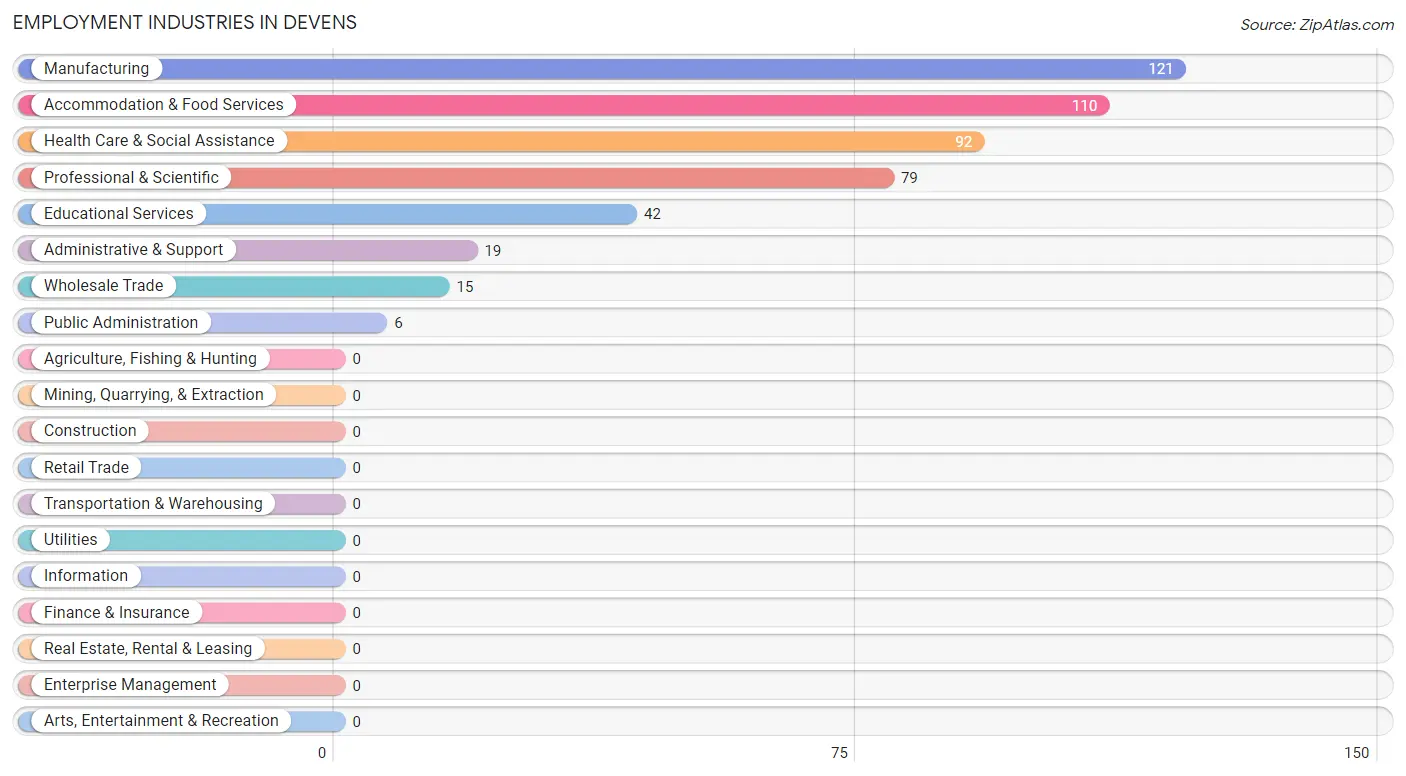
Employment Industries in Devens
The major employment industries in Devens include Manufacturing (121 | 25.0%), Accommodation & Food Services (110 | 22.7%), Health Care & Social Assistance (92 | 19.0%), Professional & Scientific (79 | 16.3%), and Educational Services (42 | 8.7%).
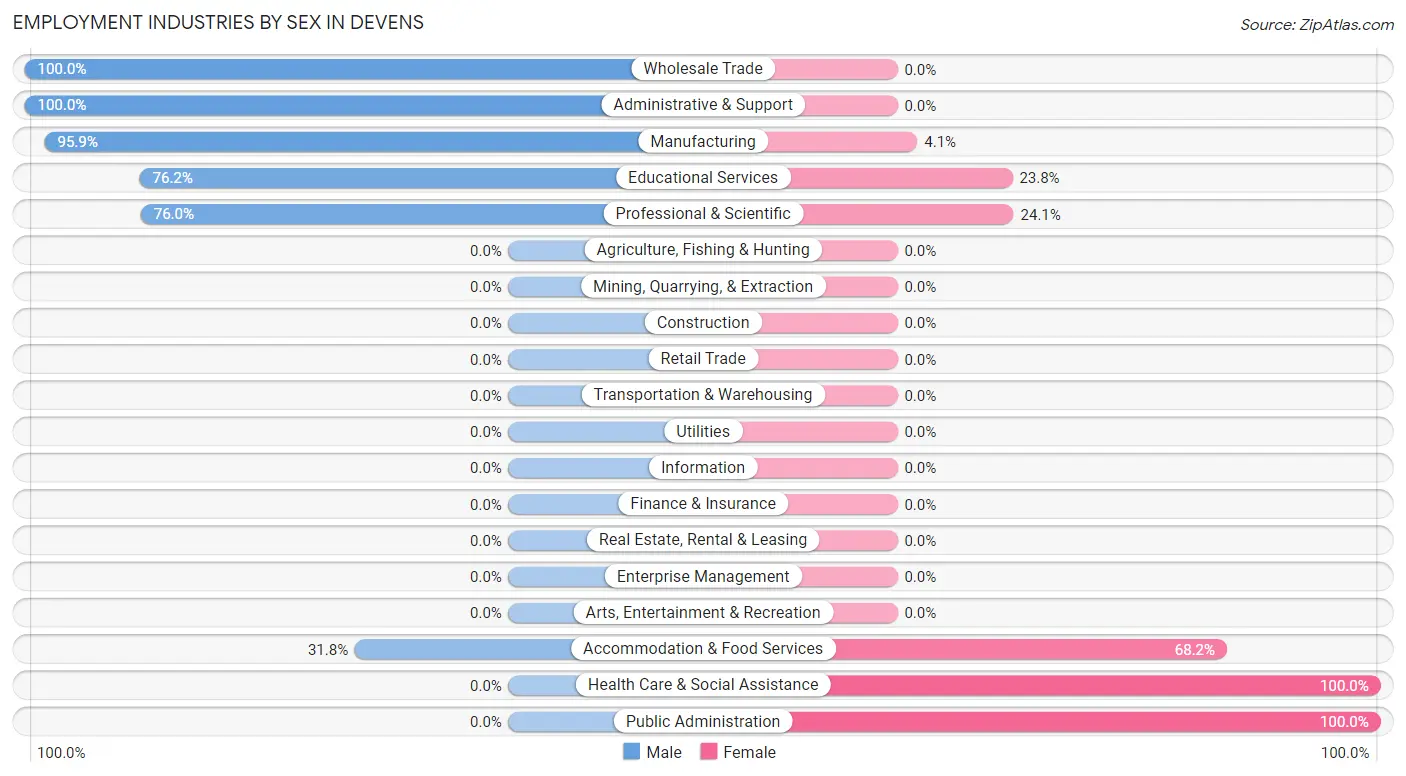
Employment Industries by Sex in Devens
The Devens industries that see more men than women are Wholesale Trade (100.0%), Administrative & Support (100.0%), and Manufacturing (95.9%), whereas the industries that tend to have a higher number of women are Health Care & Social Assistance (100.0%), Public Administration (100.0%), and Accommodation & Food Services (68.2%).
| Industry | Male | Female |
| Agriculture, Fishing & Hunting | 0 (0.0%) | 0 (0.0%) |
| Mining, Quarrying, & Extraction | 0 (0.0%) | 0 (0.0%) |
| Construction | 0 (0.0%) | 0 (0.0%) |
| Manufacturing | 116 (95.9%) | 5 (4.1%) |
| Wholesale Trade | 15 (100.0%) | 0 (0.0%) |
| Retail Trade | 0 (0.0%) | 0 (0.0%) |
| Transportation & Warehousing | 0 (0.0%) | 0 (0.0%) |
| Utilities | 0 (0.0%) | 0 (0.0%) |
| Information | 0 (0.0%) | 0 (0.0%) |
| Finance & Insurance | 0 (0.0%) | 0 (0.0%) |
| Real Estate, Rental & Leasing | 0 (0.0%) | 0 (0.0%) |
| Professional & Scientific | 60 (75.9%) | 19 (24.0%) |
| Enterprise Management | 0 (0.0%) | 0 (0.0%) |
| Administrative & Support | 19 (100.0%) | 0 (0.0%) |
| Educational Services | 32 (76.2%) | 10 (23.8%) |
| Health Care & Social Assistance | 0 (0.0%) | 92 (100.0%) |
| Arts, Entertainment & Recreation | 0 (0.0%) | 0 (0.0%) |
| Accommodation & Food Services | 35 (31.8%) | 75 (68.2%) |
| Public Administration | 0 (0.0%) | 6 (100.0%) |
| Total | 277 (57.2%) | 207 (42.8%) |
Education in Devens
School Enrollment in Devens
The most common levels of schooling among the 353 students in Devens are high school (101 | 28.6%), middle school (80 | 22.7%), and elementary school (75 | 21.2%).
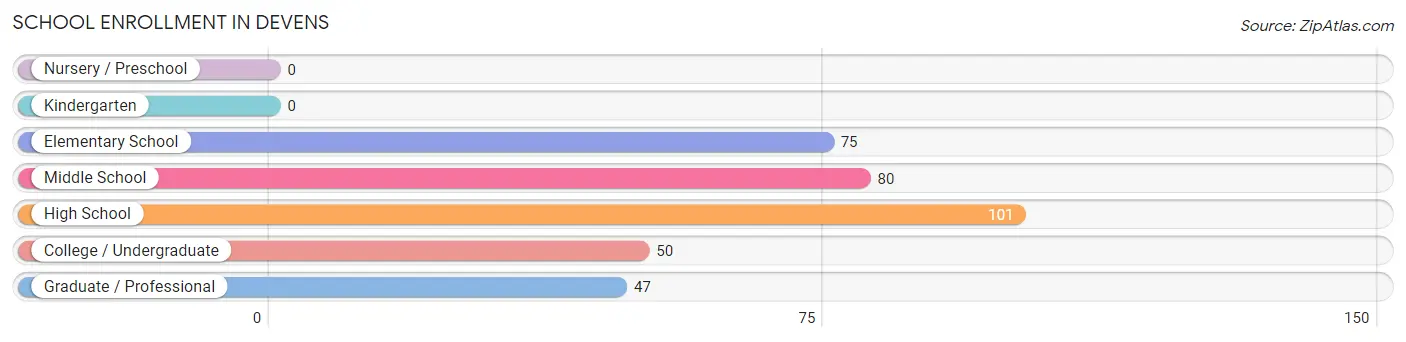
| School Level | # Students | % Students |
| Nursery / Preschool | 0 | 0.0% |
| Kindergarten | 0 | 0.0% |
| Elementary School | 75 | 21.2% |
| Middle School | 80 | 22.7% |
| High School | 101 | 28.6% |
| College / Undergraduate | 50 | 14.2% |
| Graduate / Professional | 47 | 13.3% |
| Total | 353 | 100.0% |
School Enrollment by Age by Funding Source in Devens
Out of a total of 353 students who are enrolled in schools in Devens, 78 (22.1%) attend a private institution, while the remaining 275 (77.9%) are enrolled in public schools. The age group of 18 to 19 year olds has the highest likelihood of being enrolled in private schools, with 50 (100.0% in the age bracket) enrolled. Conversely, the age group of 5 to 9 year old has the lowest likelihood of being enrolled in a private school, with 75 (100.0% in the age bracket) attending a public institution.
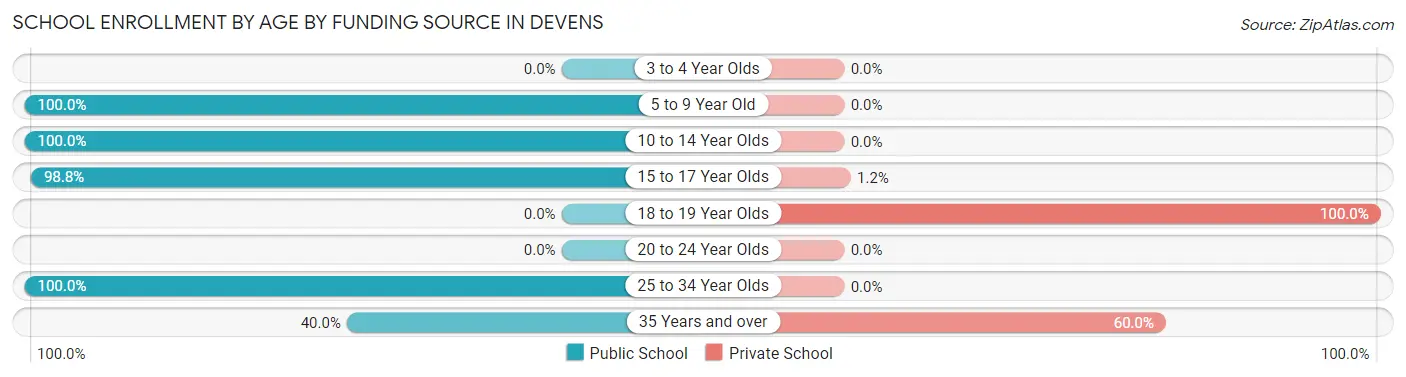
| Age Bracket | Public School | Private School |
| 3 to 4 Year Olds | 0 (0.0%) | 0 (0.0%) |
| 5 to 9 Year Old | 75 (100.0%) | 0 (0.0%) |
| 10 to 14 Year Olds | 83 (100.0%) | 0 (0.0%) |
| 15 to 17 Year Olds | 83 (98.8%) | 1 (1.2%) |
| 18 to 19 Year Olds | 0 (0.0%) | 50 (100.0%) |
| 20 to 24 Year Olds | 0 (0.0%) | 0 (0.0%) |
| 25 to 34 Year Olds | 16 (100.0%) | 0 (0.0%) |
| 35 Years and over | 18 (40.0%) | 27 (60.0%) |
| Total | 275 (77.9%) | 78 (22.1%) |
Educational Attainment by Field of Study in Devens
Psychology (76 | 15.0%), bio, nature & agricultural (68 | 13.4%), business (67 | 13.2%), engineering (55 | 10.8%), and arts & humanities (42 | 8.3%) are the most common fields of study among 507 individuals in Devens who have obtained a bachelor's degree or higher.
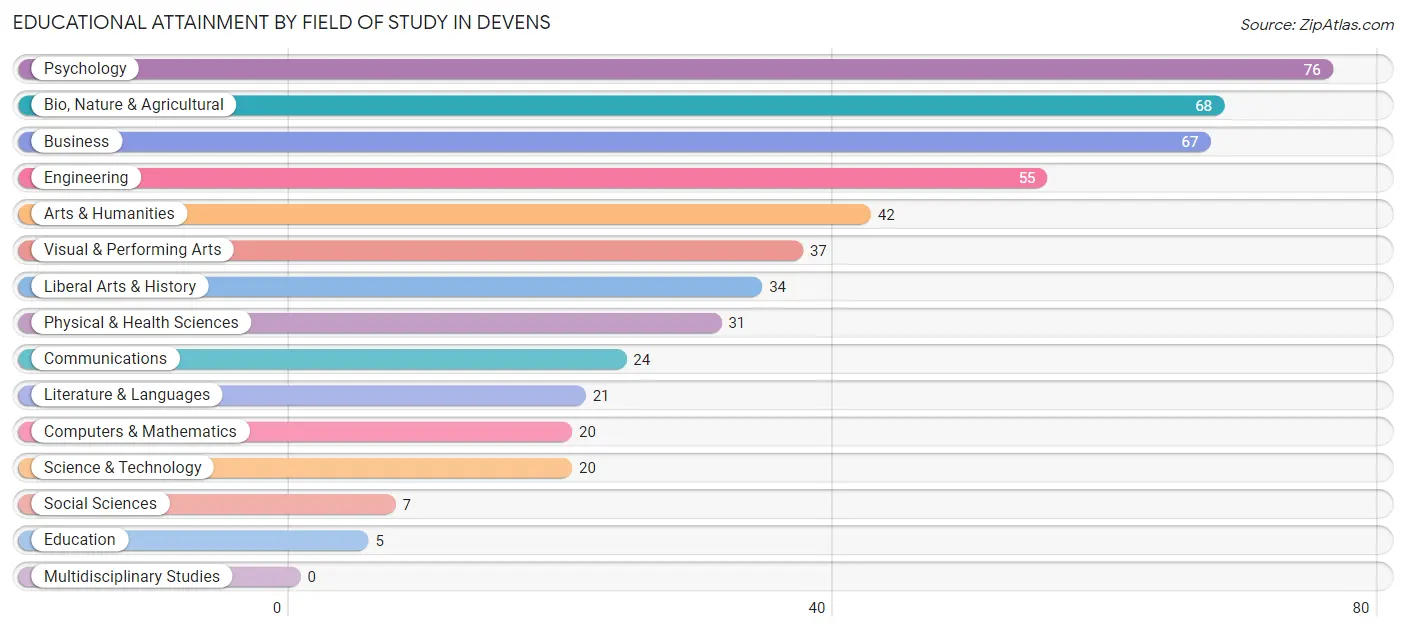
| Field of Study | # Graduates | % Graduates |
| Computers & Mathematics | 20 | 3.9% |
| Bio, Nature & Agricultural | 68 | 13.4% |
| Physical & Health Sciences | 31 | 6.1% |
| Psychology | 76 | 15.0% |
| Social Sciences | 7 | 1.4% |
| Engineering | 55 | 10.8% |
| Multidisciplinary Studies | 0 | 0.0% |
| Science & Technology | 20 | 3.9% |
| Business | 67 | 13.2% |
| Education | 5 | 1.0% |
| Literature & Languages | 21 | 4.1% |
| Liberal Arts & History | 34 | 6.7% |
| Visual & Performing Arts | 37 | 7.3% |
| Communications | 24 | 4.7% |
| Arts & Humanities | 42 | 8.3% |
| Total | 507 | 100.0% |
Transportation & Commute in Devens
Vehicle Availability by Sex in Devens
The most prevalent vehicle ownership categories in Devens are males with 2 vehicles (92, accounting for 37.6%) and females with 2 vehicles (113, making up 52.6%).
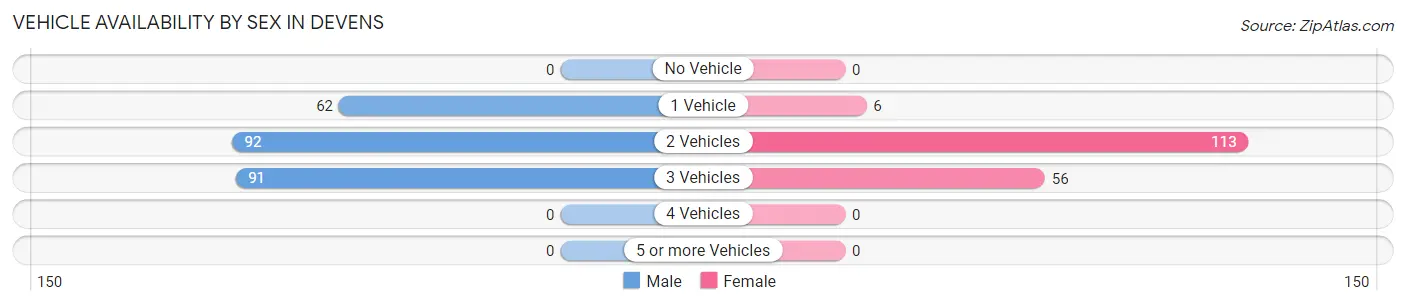
| Vehicles Available | Male | Female |
| No Vehicle | 0 (0.0%) | 0 (0.0%) |
| 1 Vehicle | 62 (25.3%) | 6 (3.4%) |
| 2 Vehicles | 92 (37.6%) | 113 (64.6%) |
| 3 Vehicles | 91 (37.1%) | 56 (32.0%) |
| 4 Vehicles | 0 (0.0%) | 0 (0.0%) |
| 5 or more Vehicles | 0 (0.0%) | 0 (0.0%) |
| Total | 245 (100.0%) | 175 (100.0%) |
Commute Time in Devens
The most frequently occuring commute durations in Devens are 20 to 24 minutes (101 commuters, 22.5%), 45 to 59 minutes (93 commuters, 20.7%), and 10 to 14 minutes (75 commuters, 16.7%).
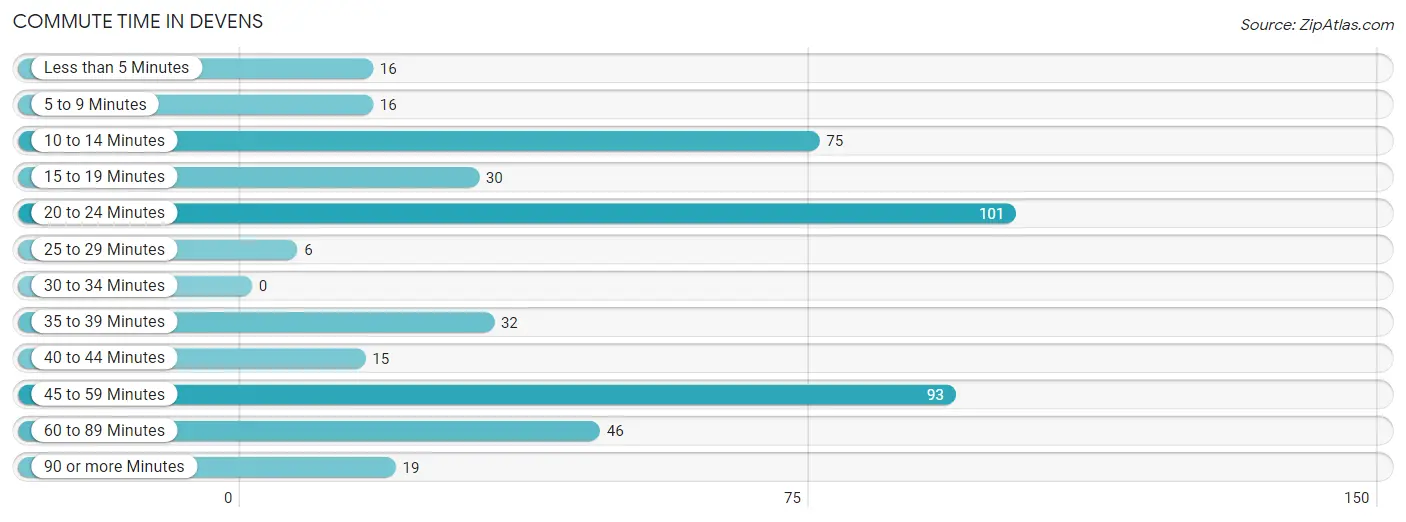
| Commute Time | # Commuters | % Commuters |
| Less than 5 Minutes | 16 | 3.6% |
| 5 to 9 Minutes | 16 | 3.6% |
| 10 to 14 Minutes | 75 | 16.7% |
| 15 to 19 Minutes | 30 | 6.7% |
| 20 to 24 Minutes | 101 | 22.5% |
| 25 to 29 Minutes | 6 | 1.3% |
| 30 to 34 Minutes | 0 | 0.0% |
| 35 to 39 Minutes | 32 | 7.1% |
| 40 to 44 Minutes | 15 | 3.3% |
| 45 to 59 Minutes | 93 | 20.7% |
| 60 to 89 Minutes | 46 | 10.2% |
| 90 or more Minutes | 19 | 4.2% |
Commute Time by Sex in Devens
The most common commute times in Devens are 20 to 24 minutes (101 commuters, 39.3%) for males and 10 to 14 minutes (75 commuters, 39.1%) for females.
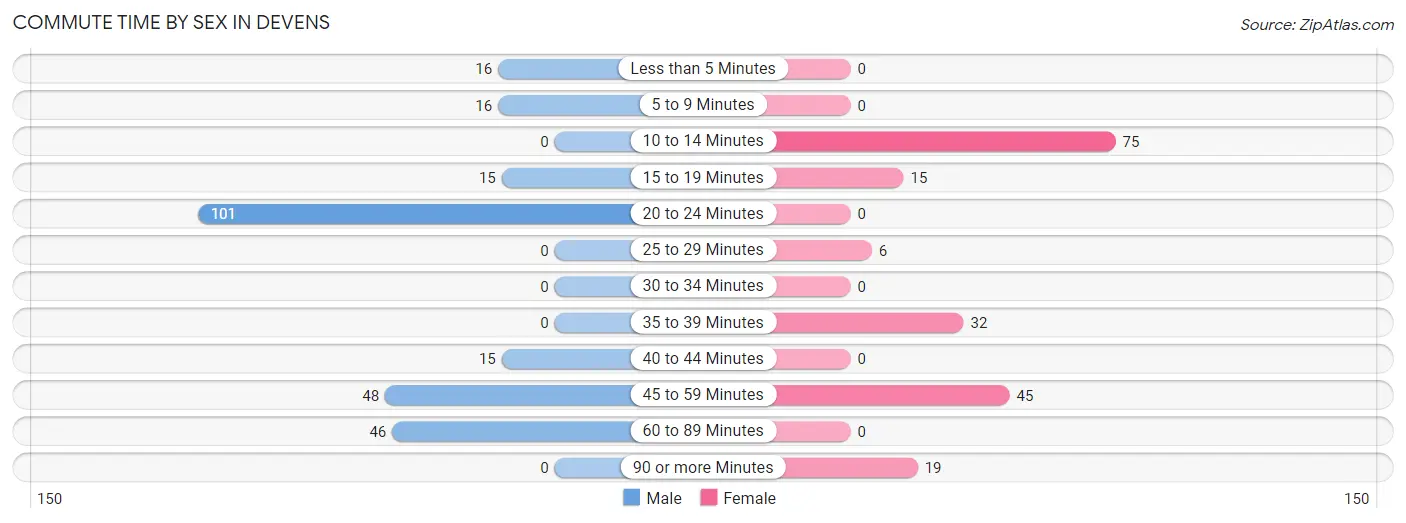
| Commute Time | Male | Female |
| Less than 5 Minutes | 16 (6.2%) | 0 (0.0%) |
| 5 to 9 Minutes | 16 (6.2%) | 0 (0.0%) |
| 10 to 14 Minutes | 0 (0.0%) | 75 (39.1%) |
| 15 to 19 Minutes | 15 (5.8%) | 15 (7.8%) |
| 20 to 24 Minutes | 101 (39.3%) | 0 (0.0%) |
| 25 to 29 Minutes | 0 (0.0%) | 6 (3.1%) |
| 30 to 34 Minutes | 0 (0.0%) | 0 (0.0%) |
| 35 to 39 Minutes | 0 (0.0%) | 32 (16.7%) |
| 40 to 44 Minutes | 15 (5.8%) | 0 (0.0%) |
| 45 to 59 Minutes | 48 (18.7%) | 45 (23.4%) |
| 60 to 89 Minutes | 46 (17.9%) | 0 (0.0%) |
| 90 or more Minutes | 0 (0.0%) | 19 (9.9%) |
Time of Departure to Work by Sex in Devens
The most frequent times of departure to work in Devens are 10:00 AM to 10:59 AM (72, 28.0%) for males and 4:00 PM to 11:59 PM (120, 62.5%) for females.
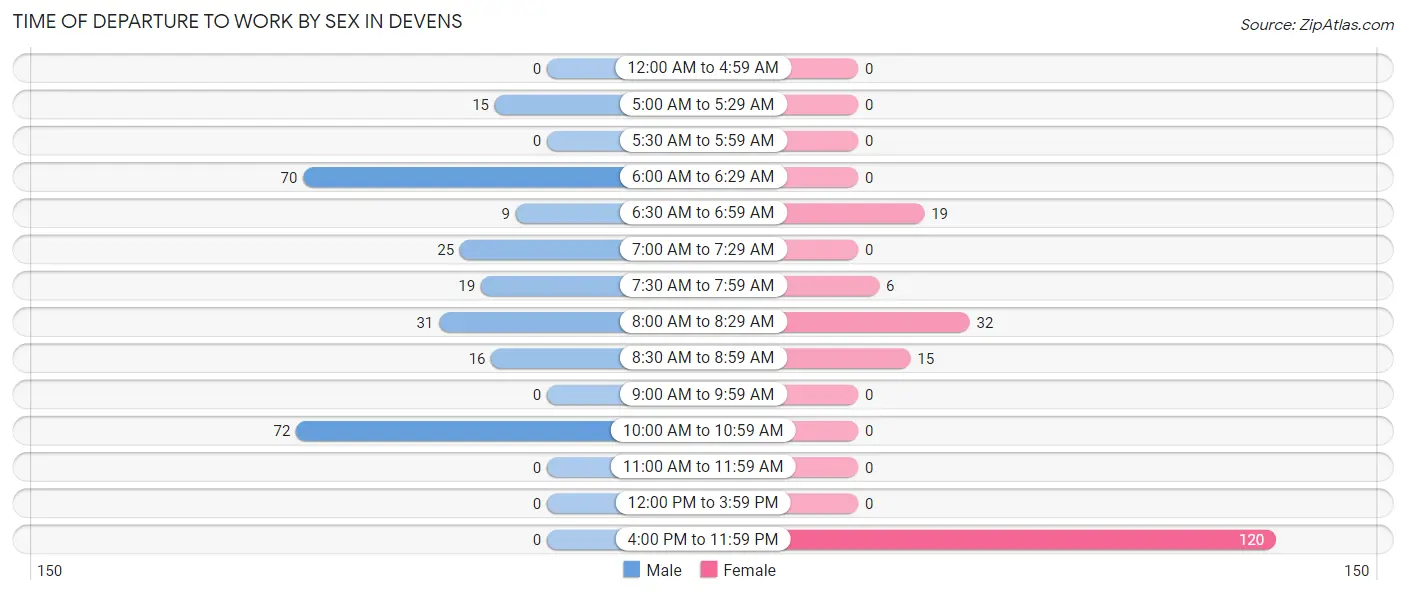
| Time of Departure | Male | Female |
| 12:00 AM to 4:59 AM | 0 (0.0%) | 0 (0.0%) |
| 5:00 AM to 5:29 AM | 15 (5.8%) | 0 (0.0%) |
| 5:30 AM to 5:59 AM | 0 (0.0%) | 0 (0.0%) |
| 6:00 AM to 6:29 AM | 70 (27.2%) | 0 (0.0%) |
| 6:30 AM to 6:59 AM | 9 (3.5%) | 19 (9.9%) |
| 7:00 AM to 7:29 AM | 25 (9.7%) | 0 (0.0%) |
| 7:30 AM to 7:59 AM | 19 (7.4%) | 6 (3.1%) |
| 8:00 AM to 8:29 AM | 31 (12.1%) | 32 (16.7%) |
| 8:30 AM to 8:59 AM | 16 (6.2%) | 15 (7.8%) |
| 9:00 AM to 9:59 AM | 0 (0.0%) | 0 (0.0%) |
| 10:00 AM to 10:59 AM | 72 (28.0%) | 0 (0.0%) |
| 11:00 AM to 11:59 AM | 0 (0.0%) | 0 (0.0%) |
| 12:00 PM to 3:59 PM | 0 (0.0%) | 0 (0.0%) |
| 4:00 PM to 11:59 PM | 0 (0.0%) | 120 (62.5%) |
| Total | 257 (100.0%) | 192 (100.0%) |
Housing Occupancy in Devens
Occupancy by Ownership in Devens
Of the total 278 dwellings in Devens, owner-occupied units account for 233 (83.8%), while renter-occupied units make up 45 (16.2%).
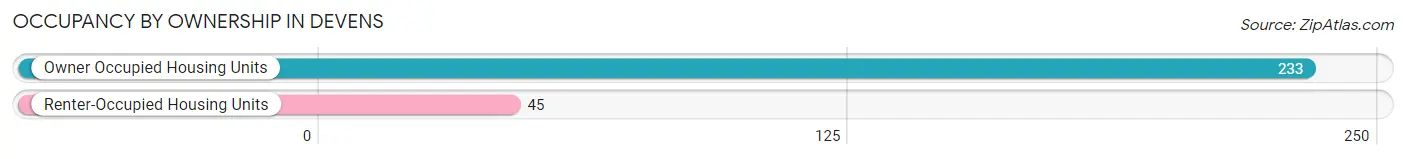
| Occupancy | # Housing Units | % Housing Units |
| Owner Occupied Housing Units | 233 | 83.8% |
| Renter-Occupied Housing Units | 45 | 16.2% |
| Total Occupied Housing Units | 278 | 100.0% |
Occupancy by Household Size in Devens
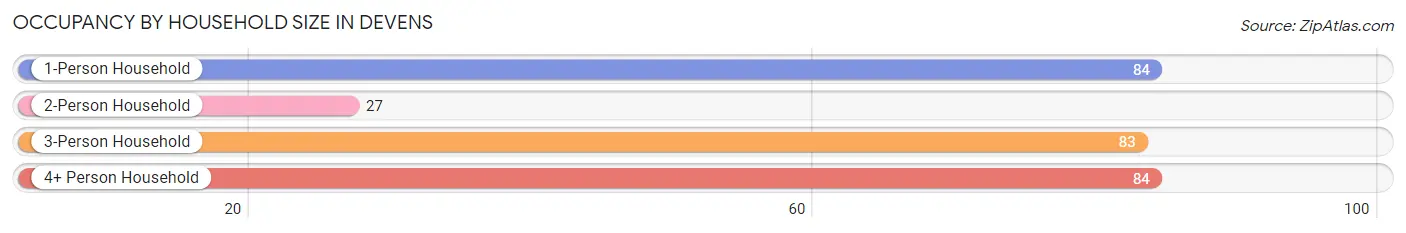
| Household Size | # Housing Units | % Housing Units |
| 1-Person Household | 84 | 30.2% |
| 2-Person Household | 27 | 9.7% |
| 3-Person Household | 83 | 29.9% |
| 4+ Person Household | 84 | 30.2% |
| Total Housing Units | 278 | 100.0% |
Occupancy by Ownership by Household Size in Devens
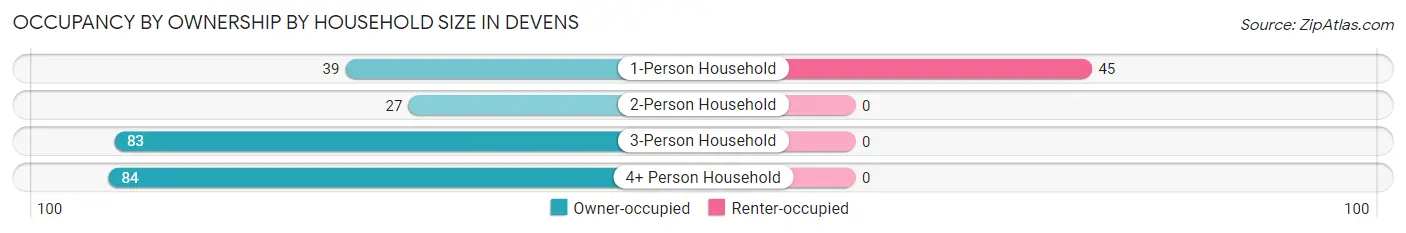
| Household Size | Owner-occupied | Renter-occupied |
| 1-Person Household | 39 (46.4%) | 45 (53.6%) |
| 2-Person Household | 27 (100.0%) | 0 (0.0%) |
| 3-Person Household | 83 (100.0%) | 0 (0.0%) |
| 4+ Person Household | 84 (100.0%) | 0 (0.0%) |
| Total Housing Units | 233 (83.8%) | 45 (16.2%) |
Occupancy by Educational Attainment in Devens
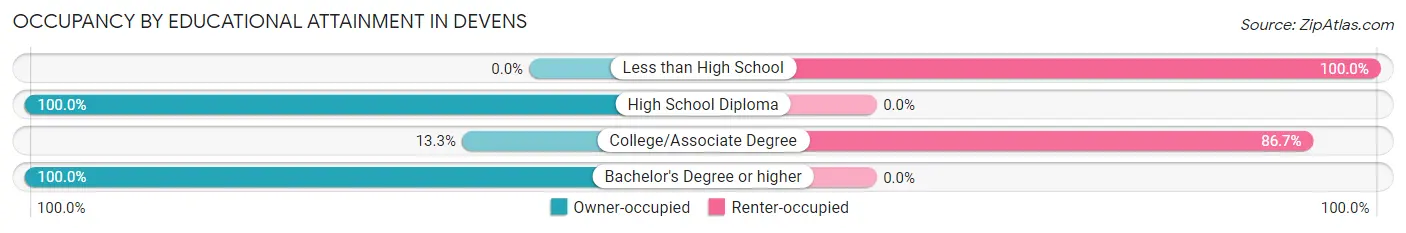
| Household Size | Owner-occupied | Renter-occupied |
| Less than High School | 0 (0.0%) | 6 (100.0%) |
| High School Diploma | 35 (100.0%) | 0 (0.0%) |
| College/Associate Degree | 6 (13.3%) | 39 (86.7%) |
| Bachelor's Degree or higher | 192 (100.0%) | 0 (0.0%) |
Occupancy by Age of Householder in Devens
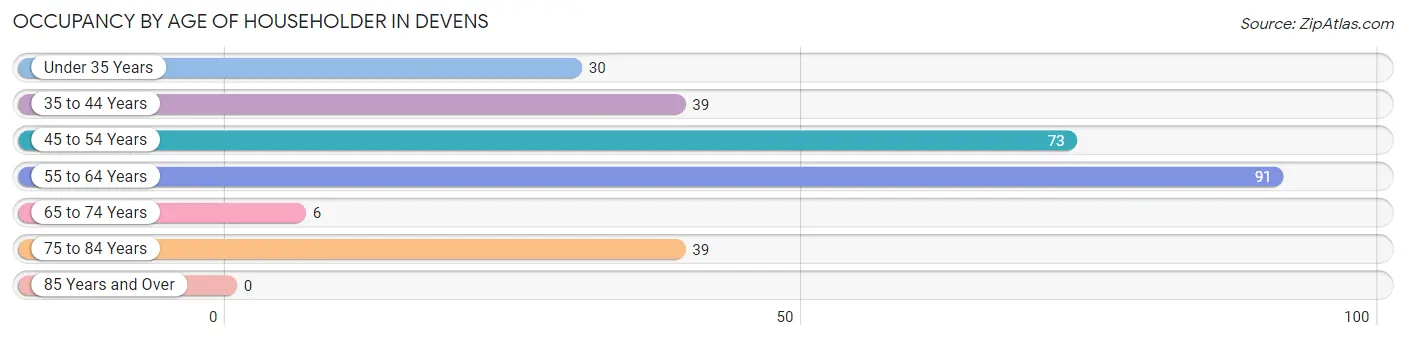
| Age Bracket | # Households | % Households |
| Under 35 Years | 30 | 10.8% |
| 35 to 44 Years | 39 | 14.0% |
| 45 to 54 Years | 73 | 26.3% |
| 55 to 64 Years | 91 | 32.7% |
| 65 to 74 Years | 6 | 2.2% |
| 75 to 84 Years | 39 | 14.0% |
| 85 Years and Over | 0 | 0.0% |
| Total | 278 | 100.0% |
Housing Finances in Devens
Median Income by Occupancy in Devens
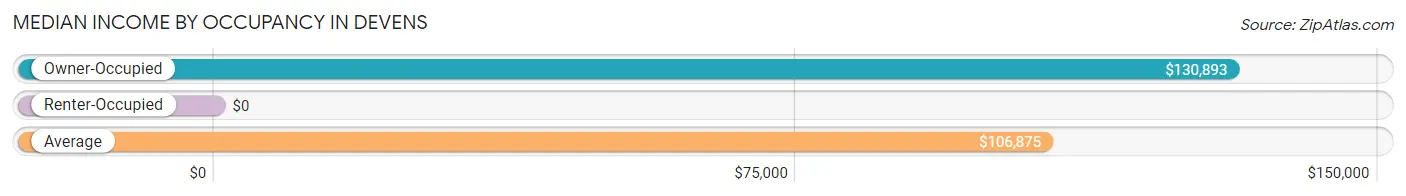
| Occupancy Type | # Households | Median Income |
| Owner-Occupied | 233 (83.8%) | $130,893 |
| Renter-Occupied | 45 (16.2%) | $0 |
| Average | 278 (100.0%) | $106,875 |
Occupancy by Householder Income Bracket in Devens
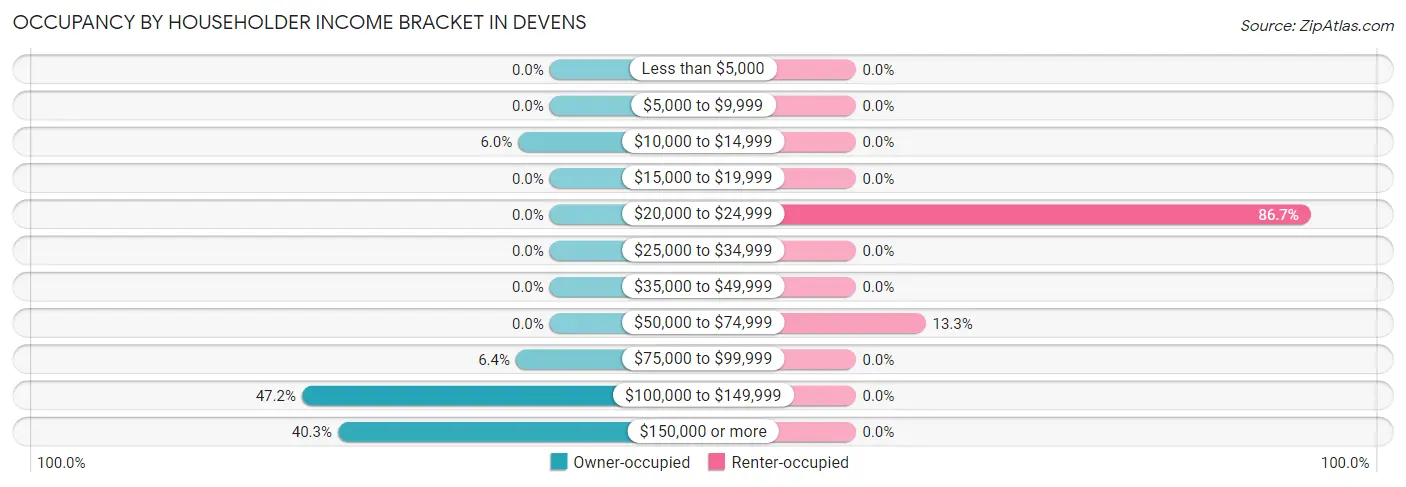
| Income Bracket | Owner-occupied | Renter-occupied |
| Less than $5,000 | 0 (0.0%) | 0 (0.0%) |
| $5,000 to $9,999 | 0 (0.0%) | 0 (0.0%) |
| $10,000 to $14,999 | 14 (6.0%) | 0 (0.0%) |
| $15,000 to $19,999 | 0 (0.0%) | 0 (0.0%) |
| $20,000 to $24,999 | 0 (0.0%) | 39 (86.7%) |
| $25,000 to $34,999 | 0 (0.0%) | 0 (0.0%) |
| $35,000 to $49,999 | 0 (0.0%) | 0 (0.0%) |
| $50,000 to $74,999 | 0 (0.0%) | 6 (13.3%) |
| $75,000 to $99,999 | 15 (6.4%) | 0 (0.0%) |
| $100,000 to $149,999 | 110 (47.2%) | 0 (0.0%) |
| $150,000 or more | 94 (40.3%) | 0 (0.0%) |
| Total | 233 (100.0%) | 45 (100.0%) |
Monthly Housing Cost Tiers in Devens
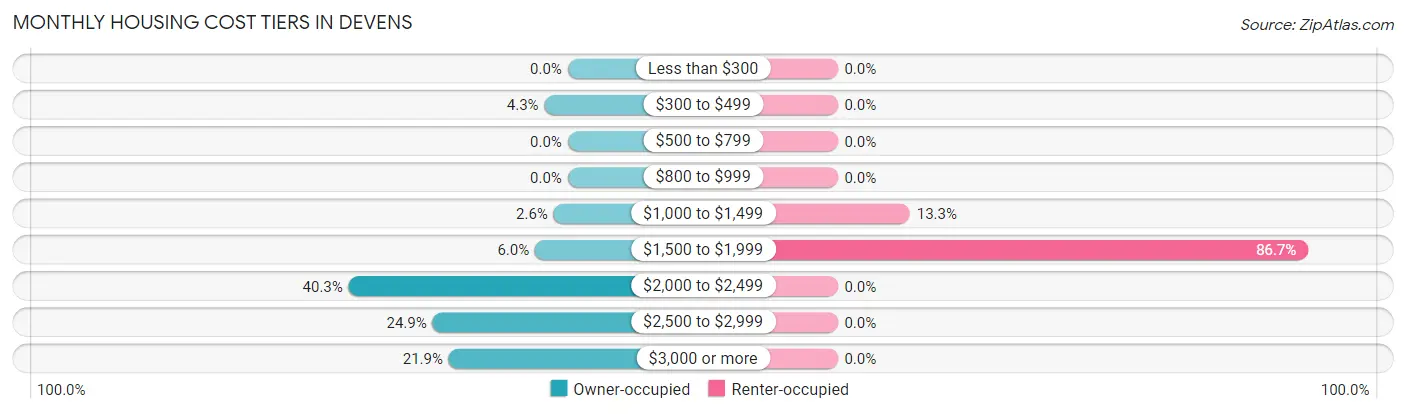
| Monthly Cost | Owner-occupied | Renter-occupied |
| Less than $300 | 0 (0.0%) | 0 (0.0%) |
| $300 to $499 | 10 (4.3%) | 0 (0.0%) |
| $500 to $799 | 0 (0.0%) | 0 (0.0%) |
| $800 to $999 | 0 (0.0%) | 0 (0.0%) |
| $1,000 to $1,499 | 6 (2.6%) | 6 (13.3%) |
| $1,500 to $1,999 | 14 (6.0%) | 39 (86.7%) |
| $2,000 to $2,499 | 94 (40.3%) | 0 (0.0%) |
| $2,500 to $2,999 | 58 (24.9%) | 0 (0.0%) |
| $3,000 or more | 51 (21.9%) | 0 (0.0%) |
| Total | 233 (100.0%) | 45 (100.0%) |
Physical Housing Characteristics in Devens
Housing Structures in Devens
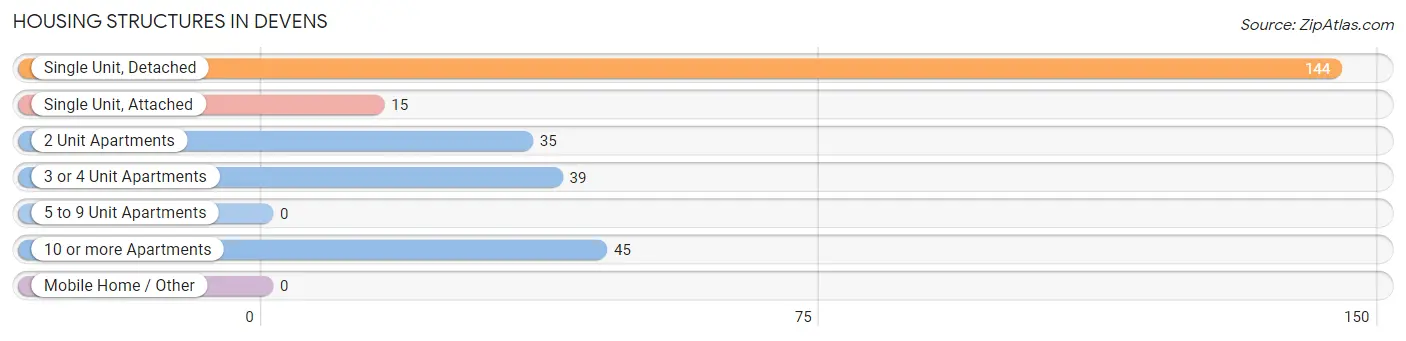
| Structure Type | # Housing Units | % Housing Units |
| Single Unit, Detached | 144 | 51.8% |
| Single Unit, Attached | 15 | 5.4% |
| 2 Unit Apartments | 35 | 12.6% |
| 3 or 4 Unit Apartments | 39 | 14.0% |
| 5 to 9 Unit Apartments | 0 | 0.0% |
| 10 or more Apartments | 45 | 16.2% |
| Mobile Home / Other | 0 | 0.0% |
| Total | 278 | 100.0% |
Housing Structures by Occupancy in Devens
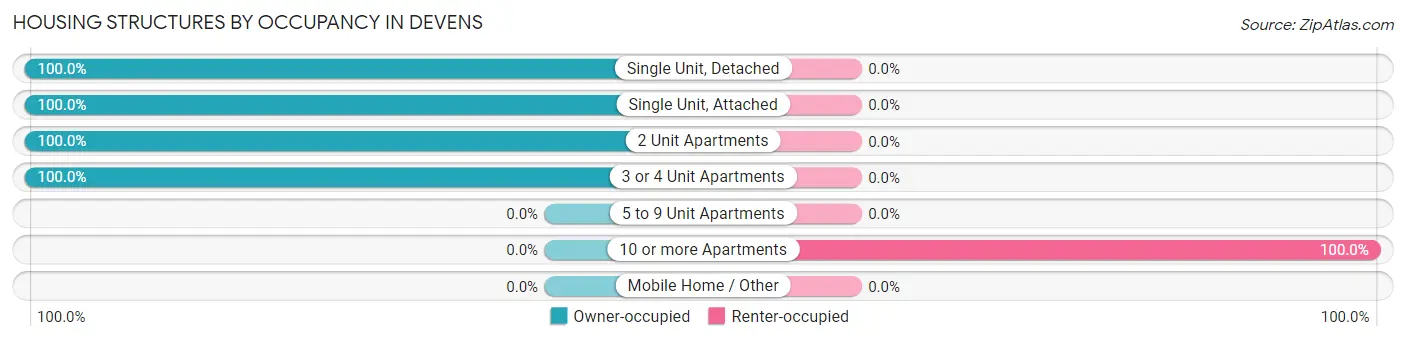
| Structure Type | Owner-occupied | Renter-occupied |
| Single Unit, Detached | 144 (100.0%) | 0 (0.0%) |
| Single Unit, Attached | 15 (100.0%) | 0 (0.0%) |
| 2 Unit Apartments | 35 (100.0%) | 0 (0.0%) |
| 3 or 4 Unit Apartments | 39 (100.0%) | 0 (0.0%) |
| 5 to 9 Unit Apartments | 0 (0.0%) | 0 (0.0%) |
| 10 or more Apartments | 0 (0.0%) | 45 (100.0%) |
| Mobile Home / Other | 0 (0.0%) | 0 (0.0%) |
| Total | 233 (83.8%) | 45 (16.2%) |
Housing Structures by Number of Rooms in Devens
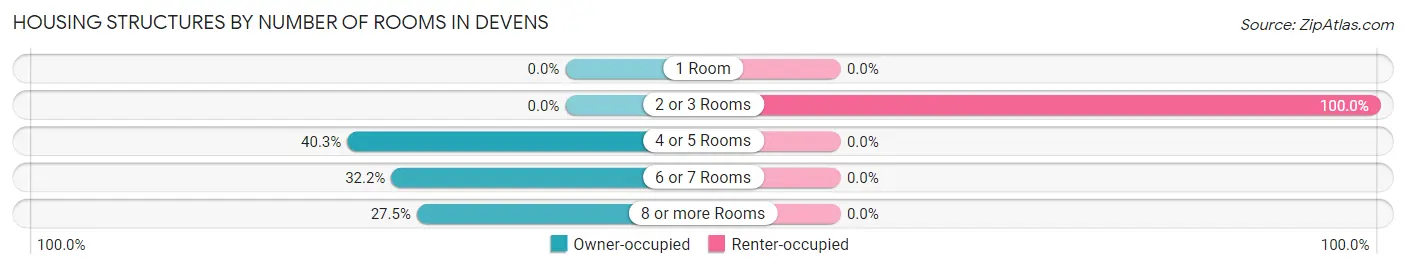
| Number of Rooms | Owner-occupied | Renter-occupied |
| 1 Room | 0 (0.0%) | 0 (0.0%) |
| 2 or 3 Rooms | 0 (0.0%) | 45 (100.0%) |
| 4 or 5 Rooms | 94 (40.3%) | 0 (0.0%) |
| 6 or 7 Rooms | 75 (32.2%) | 0 (0.0%) |
| 8 or more Rooms | 64 (27.5%) | 0 (0.0%) |
| Total | 233 (100.0%) | 45 (100.0%) |
Housing Structure by Heating Type in Devens
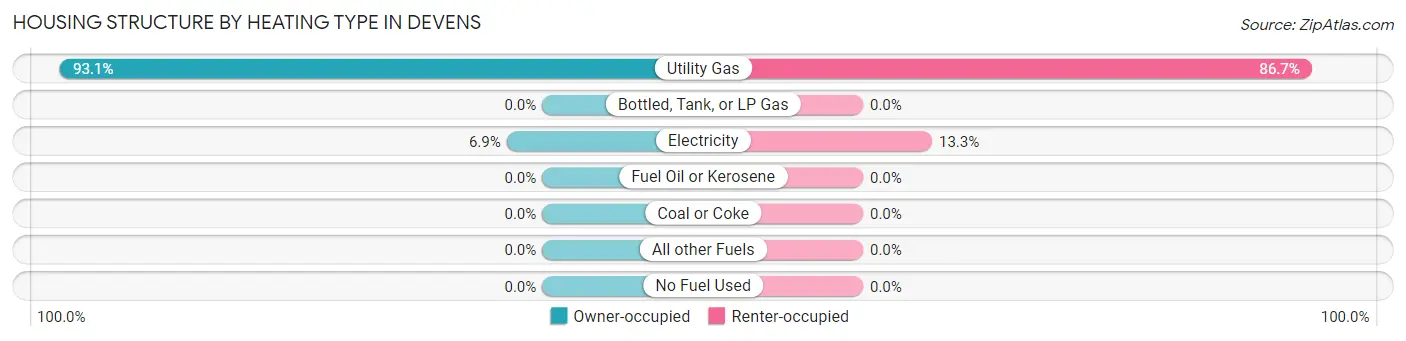
| Heating Type | Owner-occupied | Renter-occupied |
| Utility Gas | 217 (93.1%) | 39 (86.7%) |
| Bottled, Tank, or LP Gas | 0 (0.0%) | 0 (0.0%) |
| Electricity | 16 (6.9%) | 6 (13.3%) |
| Fuel Oil or Kerosene | 0 (0.0%) | 0 (0.0%) |
| Coal or Coke | 0 (0.0%) | 0 (0.0%) |
| All other Fuels | 0 (0.0%) | 0 (0.0%) |
| No Fuel Used | 0 (0.0%) | 0 (0.0%) |
| Total | 233 (100.0%) | 45 (100.0%) |
Household Vehicle Usage in Devens
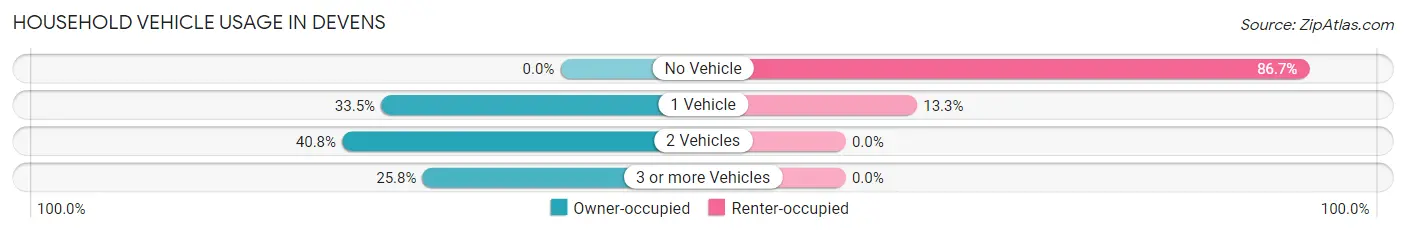
| Vehicles per Household | Owner-occupied | Renter-occupied |
| No Vehicle | 0 (0.0%) | 39 (86.7%) |
| 1 Vehicle | 78 (33.5%) | 6 (13.3%) |
| 2 Vehicles | 95 (40.8%) | 0 (0.0%) |
| 3 or more Vehicles | 60 (25.8%) | 0 (0.0%) |
| Total | 233 (100.0%) | 45 (100.0%) |
Real Estate & Mortgages in Devens
Real Estate and Mortgage Overview in Devens
| Characteristic | Without Mortgage | With Mortgage |
| Housing Units | 16 | 217 |
| Median Property Value | - | - |
| Median Household Income | - | - |
| Monthly Housing Costs | - | - |
| Real Estate Taxes | - | - |
Property Value by Mortgage Status in Devens
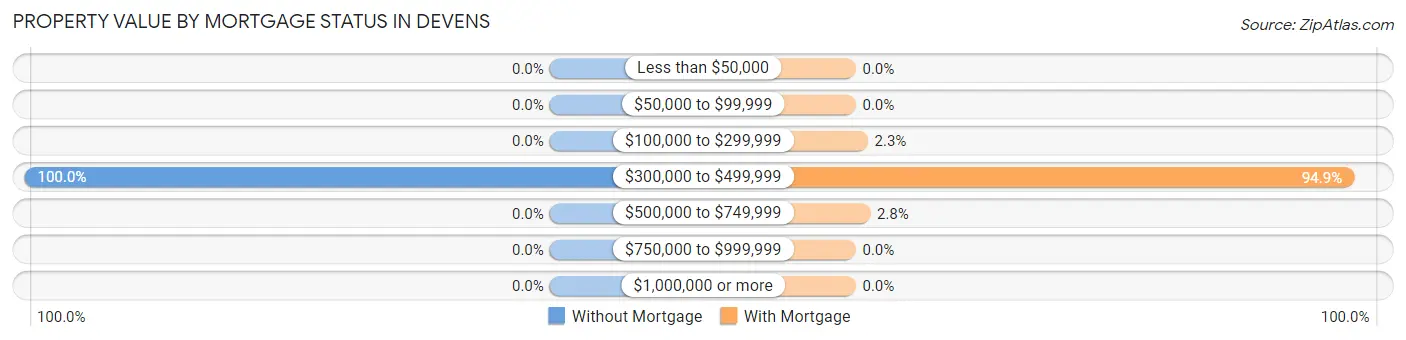
| Property Value | Without Mortgage | With Mortgage |
| Less than $50,000 | 0 (0.0%) | 0 (0.0%) |
| $50,000 to $99,999 | 0 (0.0%) | 0 (0.0%) |
| $100,000 to $299,999 | 0 (0.0%) | 5 (2.3%) |
| $300,000 to $499,999 | 16 (100.0%) | 206 (94.9%) |
| $500,000 to $749,999 | 0 (0.0%) | 6 (2.8%) |
| $750,000 to $999,999 | 0 (0.0%) | 0 (0.0%) |
| $1,000,000 or more | 0 (0.0%) | 0 (0.0%) |
| Total | 16 (100.0%) | 217 (100.0%) |
Household Income by Mortgage Status in Devens
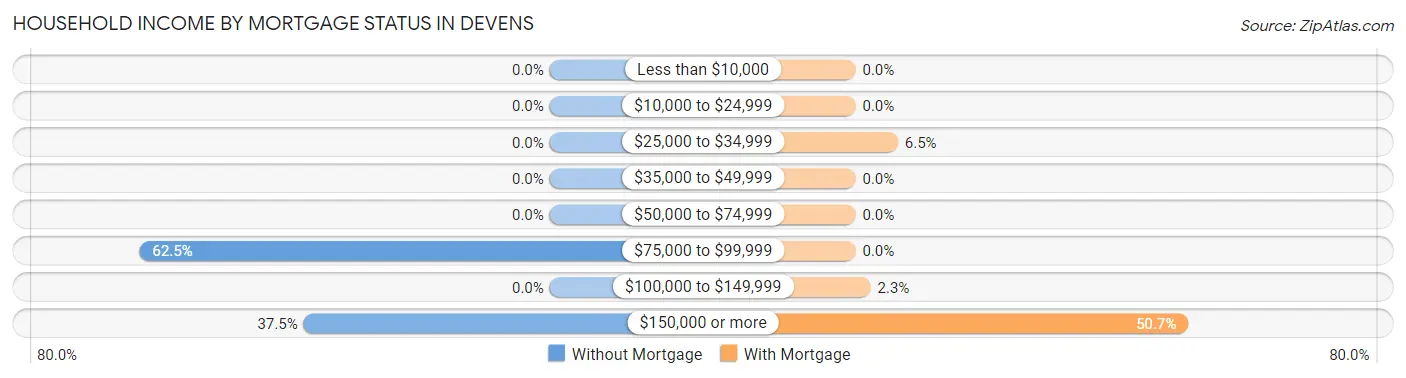
| Household Income | Without Mortgage | With Mortgage |
| Less than $10,000 | 0 (0.0%) | 0 (0.0%) |
| $10,000 to $24,999 | 0 (0.0%) | 0 (0.0%) |
| $25,000 to $34,999 | 0 (0.0%) | 14 (6.5%) |
| $35,000 to $49,999 | 0 (0.0%) | 0 (0.0%) |
| $50,000 to $74,999 | 0 (0.0%) | 0 (0.0%) |
| $75,000 to $99,999 | 10 (62.5%) | 0 (0.0%) |
| $100,000 to $149,999 | 0 (0.0%) | 5 (2.3%) |
| $150,000 or more | 6 (37.5%) | 110 (50.7%) |
| Total | 16 (100.0%) | 217 (100.0%) |
Property Value to Household Income Ratio in Devens
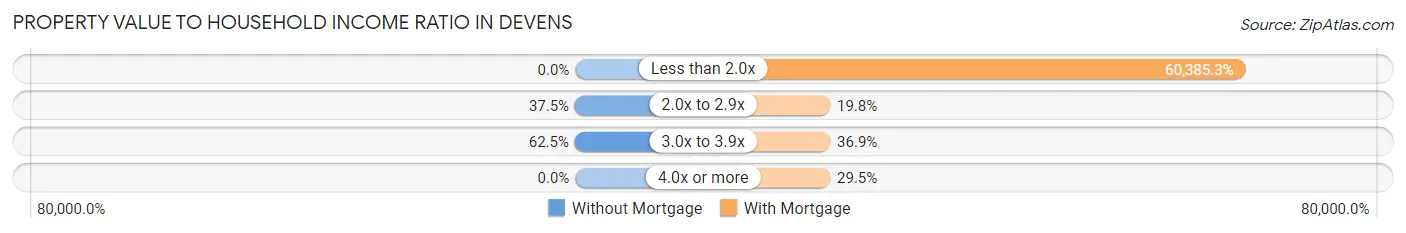
| Value-to-Income Ratio | Without Mortgage | With Mortgage |
| Less than 2.0x | 0 (0.0%) | 131,036 (60,385.2%) |
| 2.0x to 2.9x | 6 (37.5%) | 43 (19.8%) |
| 3.0x to 3.9x | 10 (62.5%) | 80 (36.9%) |
| 4.0x or more | 0 (0.0%) | 64 (29.5%) |
| Total | 16 (100.0%) | 217 (100.0%) |
Real Estate Taxes by Mortgage Status in Devens
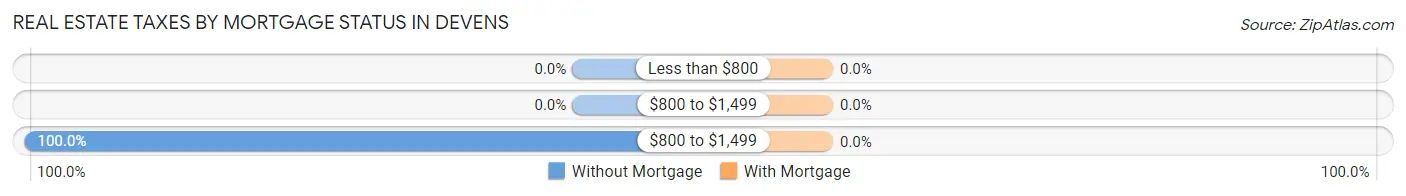
| Property Taxes | Without Mortgage | With Mortgage |
| Less than $800 | 0 (0.0%) | 0 (0.0%) |
| $800 to $1,499 | 0 (0.0%) | 0 (0.0%) |
| $800 to $1,499 | 16 (100.0%) | 0 (0.0%) |
| Total | 16 (100.0%) | 217 (100.0%) |
Health & Disability in Devens
Health Insurance Coverage by Age in Devens
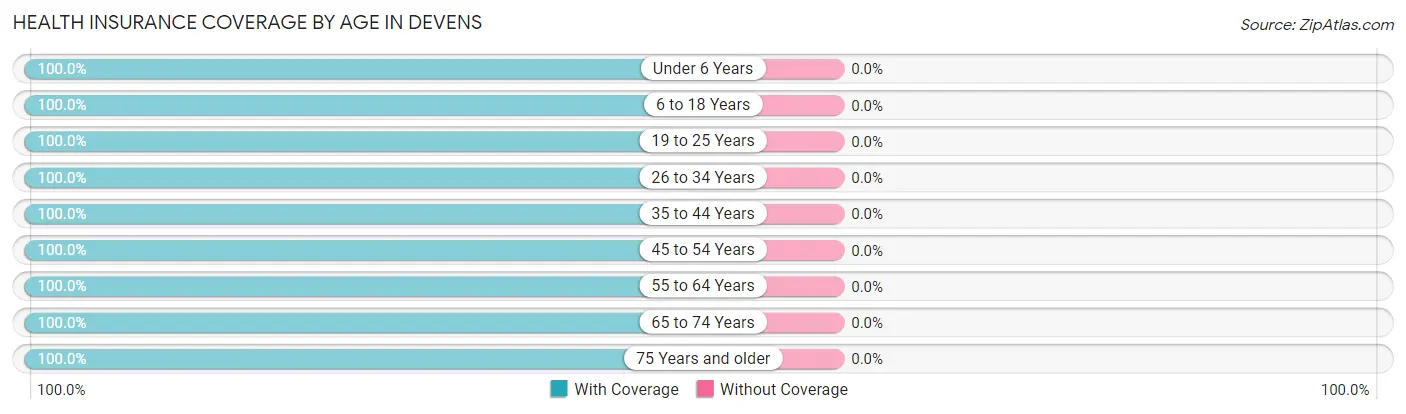
| Age Bracket | With Coverage | Without Coverage |
| Under 6 Years | 8 (100.0%) | 0 (0.0%) |
| 6 to 18 Years | 244 (100.0%) | 0 (0.0%) |
| 19 to 25 Years | 69 (100.0%) | 0 (0.0%) |
| 26 to 34 Years | 85 (100.0%) | 0 (0.0%) |
| 35 to 44 Years | 46 (100.0%) | 0 (0.0%) |
| 45 to 54 Years | 203 (100.0%) | 0 (0.0%) |
| 55 to 64 Years | 138 (100.0%) | 0 (0.0%) |
| 65 to 74 Years | 6 (100.0%) | 0 (0.0%) |
| 75 Years and older | 61 (100.0%) | 0 (0.0%) |
| Total | 860 (100.0%) | 0 (0.0%) |
Health Insurance Coverage by Citizenship Status in Devens
| Citizenship Status | With Coverage | Without Coverage |
| Native Born | 8 (100.0%) | 0 (0.0%) |
| Foreign Born, Citizen | 244 (100.0%) | 0 (0.0%) |
| Foreign Born, not a Citizen | 69 (100.0%) | 0 (0.0%) |
Health Insurance Coverage by Household Income in Devens
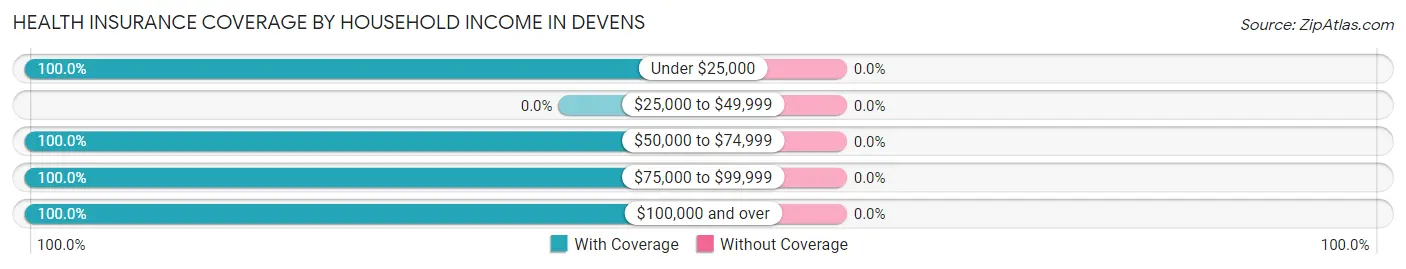
| Household Income | With Coverage | Without Coverage |
| Under $25,000 | 53 (100.0%) | 0 (0.0%) |
| $25,000 to $49,999 | 0 (0.0%) | 0 (0.0%) |
| $50,000 to $74,999 | 6 (100.0%) | 0 (0.0%) |
| $75,000 to $99,999 | 25 (100.0%) | 0 (0.0%) |
| $100,000 and over | 661 (100.0%) | 0 (0.0%) |
Public vs Private Health Insurance Coverage by Age in Devens
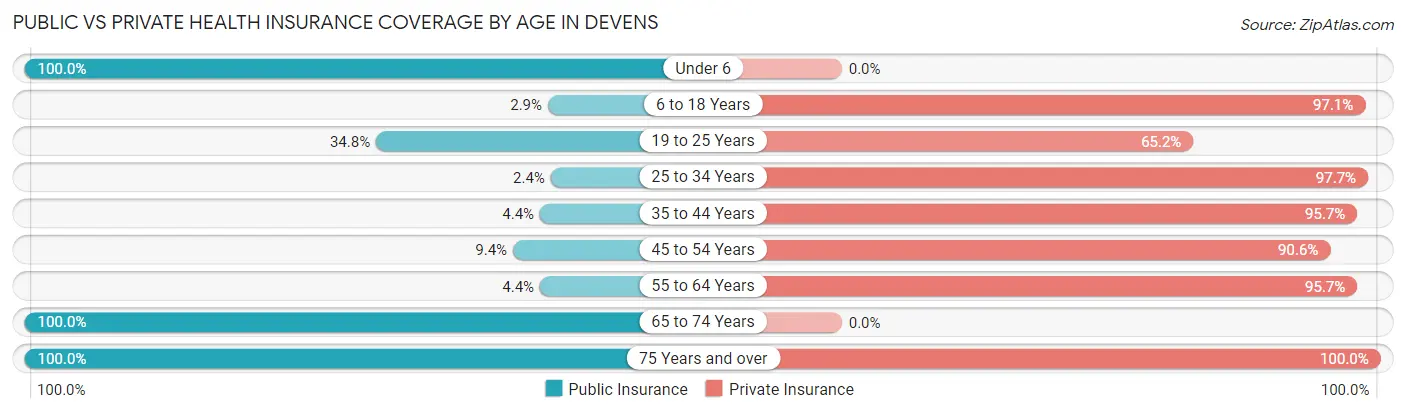
| Age Bracket | Public Insurance | Private Insurance |
| Under 6 | 8 (100.0%) | 0 (0.0%) |
| 6 to 18 Years | 7 (2.9%) | 237 (97.1%) |
| 19 to 25 Years | 24 (34.8%) | 45 (65.2%) |
| 25 to 34 Years | 2 (2.4%) | 83 (97.7%) |
| 35 to 44 Years | 2 (4.3%) | 44 (95.7%) |
| 45 to 54 Years | 19 (9.4%) | 184 (90.6%) |
| 55 to 64 Years | 6 (4.3%) | 132 (95.7%) |
| 65 to 74 Years | 6 (100.0%) | 0 (0.0%) |
| 75 Years and over | 61 (100.0%) | 61 (100.0%) |
| Total | 135 (15.7%) | 786 (91.4%) |
Disability Status by Sex by Age in Devens
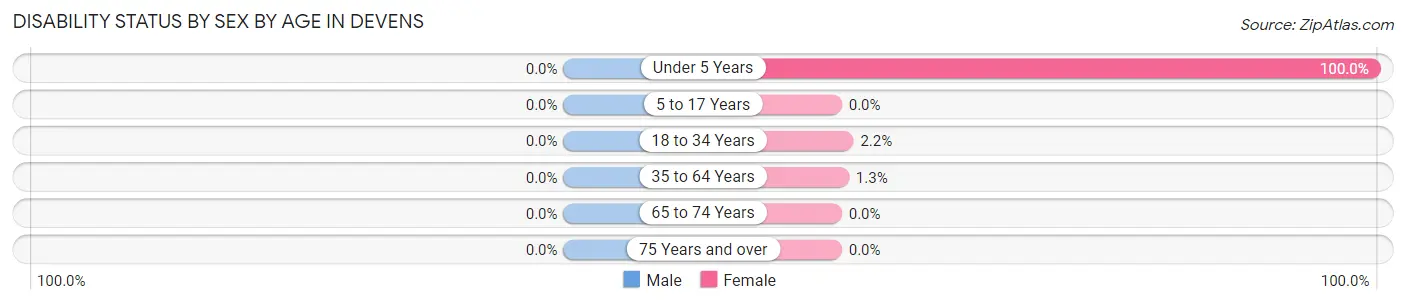
| Age Bracket | Male | Female |
| Under 5 Years | 0 (0.0%) | 2 (100.0%) |
| 5 to 17 Years | 0 (0.0%) | 0 (0.0%) |
| 18 to 34 Years | 0 (0.0%) | 2 (2.2%) |
| 35 to 64 Years | 0 (0.0%) | 2 (1.3%) |
| 65 to 74 Years | 0 (0.0%) | 0 (0.0%) |
| 75 Years and over | 0 (0.0%) | 0 (0.0%) |
Disability Class by Sex by Age in Devens
Disability Class: Hearing Difficulty
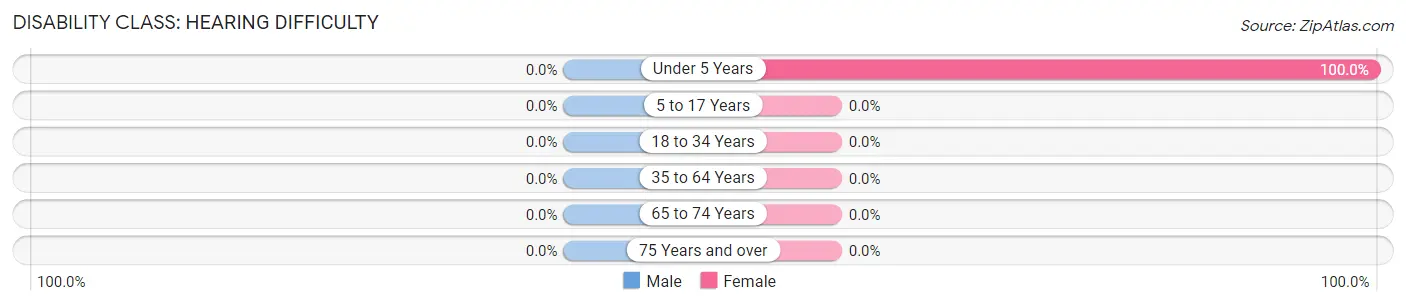
| Age Bracket | Male | Female |
| Under 5 Years | 0 (0.0%) | 2 (100.0%) |
| 5 to 17 Years | 0 (0.0%) | 0 (0.0%) |
| 18 to 34 Years | 0 (0.0%) | 0 (0.0%) |
| 35 to 64 Years | 0 (0.0%) | 0 (0.0%) |
| 65 to 74 Years | 0 (0.0%) | 0 (0.0%) |
| 75 Years and over | 0 (0.0%) | 0 (0.0%) |
Disability Class: Vision Difficulty
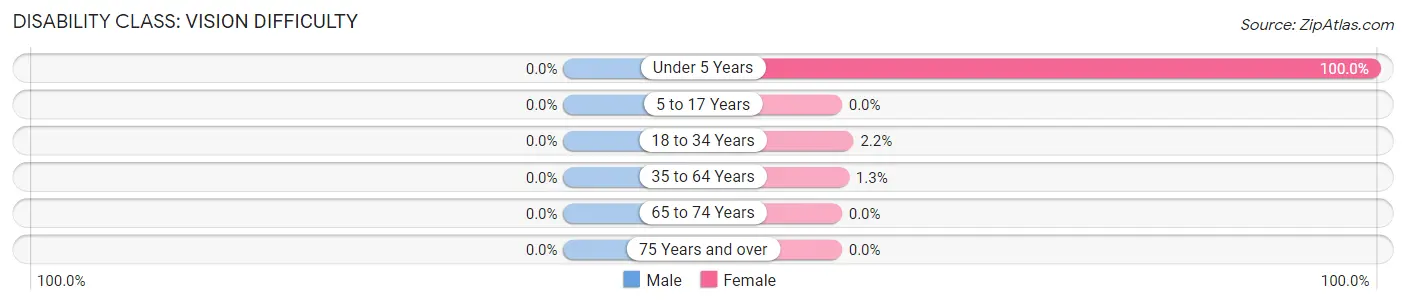
| Age Bracket | Male | Female |
| Under 5 Years | 0 (0.0%) | 2 (100.0%) |
| 5 to 17 Years | 0 (0.0%) | 0 (0.0%) |
| 18 to 34 Years | 0 (0.0%) | 2 (2.2%) |
| 35 to 64 Years | 0 (0.0%) | 2 (1.3%) |
| 65 to 74 Years | 0 (0.0%) | 0 (0.0%) |
| 75 Years and over | 0 (0.0%) | 0 (0.0%) |
Disability Class: Cognitive Difficulty
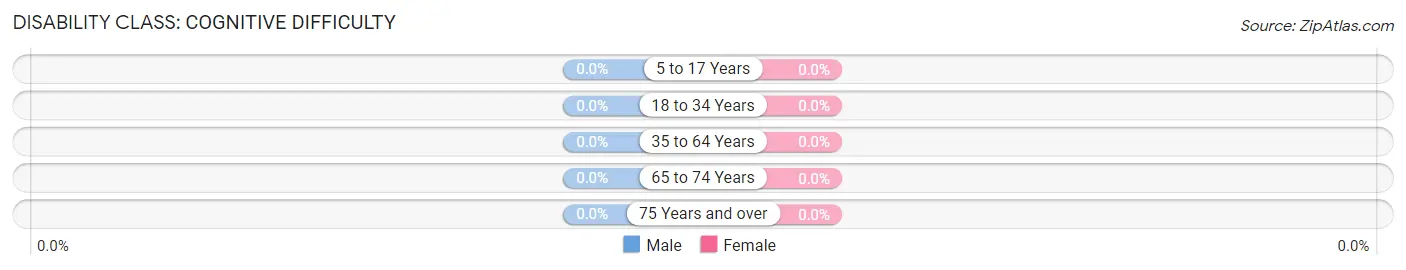
| Age Bracket | Male | Female |
| 5 to 17 Years | 0 (0.0%) | 0 (0.0%) |
| 18 to 34 Years | 0 (0.0%) | 0 (0.0%) |
| 35 to 64 Years | 0 (0.0%) | 0 (0.0%) |
| 65 to 74 Years | 0 (0.0%) | 0 (0.0%) |
| 75 Years and over | 0 (0.0%) | 0 (0.0%) |
Disability Class: Ambulatory Difficulty
| Age Bracket | Male | Female |
| 5 to 17 Years | 0 (0.0%) | 0 (0.0%) |
| 18 to 34 Years | 0 (0.0%) | 0 (0.0%) |
| 35 to 64 Years | 0 (0.0%) | 0 (0.0%) |
| 65 to 74 Years | 0 (0.0%) | 0 (0.0%) |
| 75 Years and over | 0 (0.0%) | 0 (0.0%) |
Disability Class: Self-Care Difficulty
| Age Bracket | Male | Female |
| 5 to 17 Years | 0 (0.0%) | 0 (0.0%) |
| 18 to 34 Years | 0 (0.0%) | 0 (0.0%) |
| 35 to 64 Years | 0 (0.0%) | 0 (0.0%) |
| 65 to 74 Years | 0 (0.0%) | 0 (0.0%) |
| 75 Years and over | 0 (0.0%) | 0 (0.0%) |
Technology Access in Devens
Computing Device Access in Devens
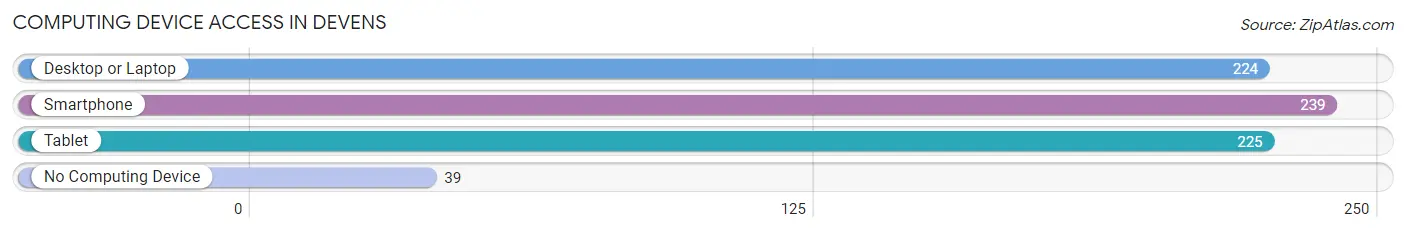
| Device Type | # Households | % Households |
| Desktop or Laptop | 224 | 80.6% |
| Smartphone | 239 | 86.0% |
| Tablet | 225 | 80.9% |
| No Computing Device | 39 | 14.0% |
| Total | 278 | 100.0% |
Internet Access in Devens
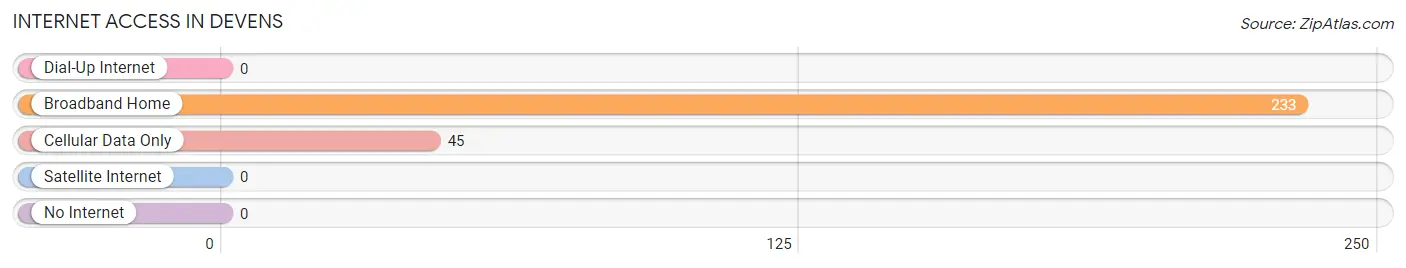
| Internet Type | # Households | % Households |
| Dial-Up Internet | 0 | 0.0% |
| Broadband Home | 233 | 83.8% |
| Cellular Data Only | 45 | 16.2% |
| Satellite Internet | 0 | 0.0% |
| No Internet | 0 | 0.0% |
| Total | 278 | 100.0% |
Devens Summary
Devens is a census-designated place (CDP) located in the towns of Ayer and Harvard, Massachusetts, in the United States. It is located in the northern part of Middlesex County, about 25 miles northwest of Boston. The population of Devens was 4,731 at the 2010 census.
History
Devens was originally part of the towns of Ayer and Harvard, and was known as "Fort Devens" until 1996. The area was first settled in 1642 and was named after General Charles Devens, who served in the Civil War. The area was used as a military base from 1917 to 1996, when it was closed by the Base Realignment and Closure Commission. The base was used by the United States Army and the United States Air Force.
In 1996, the base was transferred to the Massachusetts Development Finance Agency, which began to redevelop the area. The agency created the Devens Enterprise Commission to oversee the redevelopment of the area. The commission has been successful in attracting businesses to the area, and the population of Devens has grown significantly since the base was closed.
Geography
Devens is located at (42.539, -71.567). According to the United States Census Bureau, the CDP has a total area of 8.2 square miles (21.2 km2), of which 8.1 square miles (21.0 km2) is land and 0.1 square miles (0.2 km2) (1.25%) is water.
Economy
Devens is home to a variety of businesses, including technology, manufacturing, and healthcare companies. The largest employers in the area are the Massachusetts Development Finance Agency, the Devens Enterprise Commission, and the Devens Common Center.
The area is also home to a number of retail stores, restaurants, and other businesses. The Devens Common Center is a shopping center located in the center of Devens, and includes a variety of stores and restaurants.
Demographics
As of the 2010 census, there were 4,731 people, 1,845 households, and 1,093 families residing in the CDP. The population density was 583.3 people per square mile (225.7/km2). There were 1,945 housing units at an average density of 239.3 per square mile (92.3/km2). The racial makeup of the CDP was 87.2% White, 5.2% African American, 0.3% Native American, 3.2% Asian, 0.1% Pacific Islander, 1.2% from other races, and 2.9% from two or more races. Hispanic or Latino of any race were 3.7% of the population.
There were 1,845 households, out of which 28.2% had children under the age of 18 living with them, 43.2% were married couples living together, 11.2% had a female householder with no husband present, and 41.2% were non-families. 33.2% of all households were made up of individuals, and 8.2% had someone living alone who was 65 years of age or older. The average household size was 2.41 and the average family size was 3.09.
In the CDP, the population was spread out, with 22.7% under the age of 18, 8.2% from 18 to 24, 33.2% from 25 to 44, 25.2% from 45 to 64, and 10.7% who were 65 years of age or older. The median age was 36 years. For every 100 females, there were 97.2 males. For every 100 females age 18 and over, there were 95.2 males.
The median income for a household in the CDP was $60,938, and the median income for a family was $71,250. Males had a median income of $50,000 versus $41,250 for females. The per capita income for the CDP was $27,945. About 4.2% of families and 5.7% of the population were below the poverty line, including 6.2% of those under age 18 and 6.3% of those age 65 or over.
Common Questions
What is Per Capita Income in Devens?
Per Capita income in Devens is $31,493.
What is the Median Family Income in Devens?
Median Family Income in Devens is $131,643.
What is the Median Household income in Devens?
Median Household Income in Devens is $106,875.
What is Income or Wage Gap in Devens?
Income or Wage Gap in Devens is 25.6%.
Women in Devens earn 74.4 cents for every dollar earned by a man.
What is Inequality or Gini Index in Devens?
Inequality or Gini Index in Devens is 0.40.
What is the Total Population of Devens?
Total Population of Devens is 1,763.
What is the Total Male Population of Devens?
Total Male Population of Devens is 1,396.
What is the Total Female Population of Devens?
Total Female Population of Devens is 367.
What is the Ratio of Males per 100 Females in Devens?
There are 380.38 Males per 100 Females in Devens.
What is the Ratio of Females per 100 Males in Devens?
There are 26.29 Females per 100 Males in Devens.
What is the Median Population Age in Devens?
Median Population Age in Devens is 46.0 Years.
What is the Average Family Size in Devens
Average Family Size in Devens is 3.4 People.
What is the Average Household Size in Devens
Average Household Size in Devens is 2.7 People.
How Large is the Labor Force in Devens?
There are 489 People in the Labor Forcein in Devens.
What is the Percentage of People in the Labor Force in Devens?
30.6% of People are in the Labor Force in Devens.
What is the Unemployment Rate in Devens?
Unemployment Rate in Devens is 1.0%.