Lowell, MA Map & Demographics
Lowell Map
Lowell Overview
$33,574
PER CAPITA INCOME
$84,723
AVG FAMILY INCOME
$73,008
AVG HOUSEHOLD INCOME
19.1%
WAGE / INCOME GAP [ % ]
80.9¢/ $1
WAGE / INCOME GAP [ $ ]
$11,905
FAMILY INCOME DEFICIT
0.44
INEQUALITY / GINI INDEX
114,737
TOTAL POPULATION
56,986
MALE POPULATION
57,751
FEMALE POPULATION
98.68
MALES / 100 FEMALES
101.34
FEMALES / 100 MALES
34.6
MEDIAN AGE
3.2
AVG FAMILY SIZE
2.6
AVG HOUSEHOLD SIZE
62,650
LABOR FORCE [ PEOPLE ]
67.3%
PERCENT IN LABOR FORCE
5.7%
UNEMPLOYMENT RATE
Income in Lowell
Income Overview in Lowell
Per Capita Income in Lowell is $33,574, while median incomes of families and households are $84,723 and $73,008 respectively.
| Characteristic | Number | Measure |
| Per Capita Income | 114,737 | $33,574 |
| Median Family Income | 25,280 | $84,723 |
| Mean Family Income | 25,280 | $102,383 |
| Median Household Income | 42,343 | $73,008 |
| Mean Household Income | 42,343 | $90,265 |
| Income Deficit | 25,280 | $11,905 |
| Wage / Income Gap (%) | 114,737 | 19.06% |
| Wage / Income Gap ($) | 114,737 | 80.94¢ per $1 |
| Gini / Inequality Index | 114,737 | 0.44 |
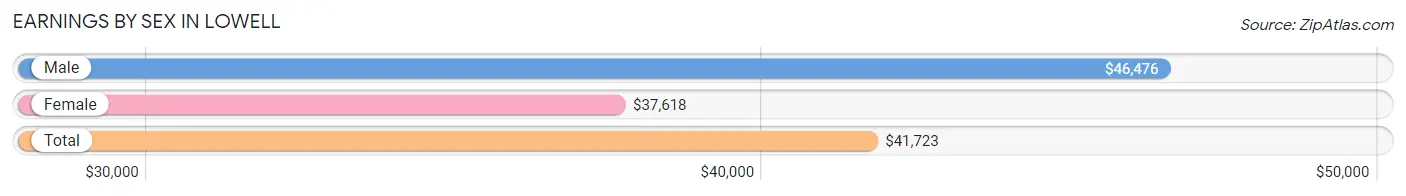
Earnings by Sex in Lowell
Average Earnings in Lowell are $41,723, $46,476 for men and $37,618 for women, a difference of 19.1%.
| Sex | Number | Average Earnings |
| Male | 33,609 (52.3%) | $46,476 |
| Female | 30,652 (47.7%) | $37,618 |
| Total | 64,261 (100.0%) | $41,723 |
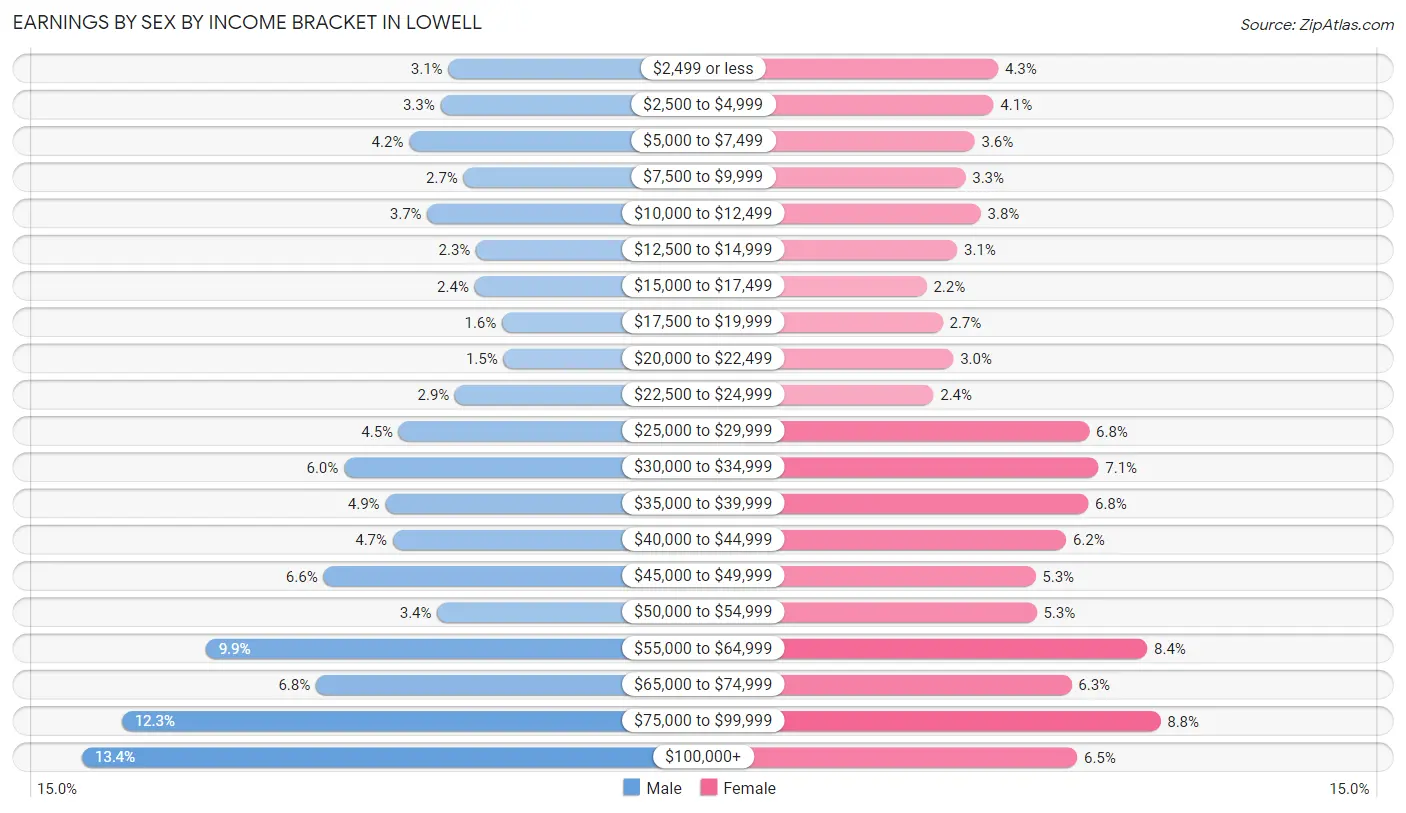
Earnings by Sex by Income Bracket in Lowell
The most common earnings brackets in Lowell are $100,000+ for men (4,500 | 13.4%) and $75,000 to $99,999 for women (2,701 | 8.8%).
| Income | Male | Female |
| $2,499 or less | 1,038 (3.1%) | 1,302 (4.3%) |
| $2,500 to $4,999 | 1,111 (3.3%) | 1,264 (4.1%) |
| $5,000 to $7,499 | 1,409 (4.2%) | 1,101 (3.6%) |
| $7,500 to $9,999 | 894 (2.7%) | 1,021 (3.3%) |
| $10,000 to $12,499 | 1,237 (3.7%) | 1,154 (3.8%) |
| $12,500 to $14,999 | 777 (2.3%) | 950 (3.1%) |
| $15,000 to $17,499 | 789 (2.4%) | 688 (2.2%) |
| $17,500 to $19,999 | 532 (1.6%) | 824 (2.7%) |
| $20,000 to $22,499 | 517 (1.5%) | 918 (3.0%) |
| $22,500 to $24,999 | 975 (2.9%) | 744 (2.4%) |
| $25,000 to $29,999 | 1,506 (4.5%) | 2,088 (6.8%) |
| $30,000 to $34,999 | 2,022 (6.0%) | 2,168 (7.1%) |
| $35,000 to $39,999 | 1,633 (4.9%) | 2,077 (6.8%) |
| $40,000 to $44,999 | 1,564 (4.6%) | 1,889 (6.2%) |
| $45,000 to $49,999 | 2,219 (6.6%) | 1,626 (5.3%) |
| $50,000 to $54,999 | 1,144 (3.4%) | 1,634 (5.3%) |
| $55,000 to $64,999 | 3,329 (9.9%) | 2,587 (8.4%) |
| $65,000 to $74,999 | 2,289 (6.8%) | 1,934 (6.3%) |
| $75,000 to $99,999 | 4,124 (12.3%) | 2,701 (8.8%) |
| $100,000+ | 4,500 (13.4%) | 1,982 (6.5%) |
| Total | 33,609 (100.0%) | 30,652 (100.0%) |
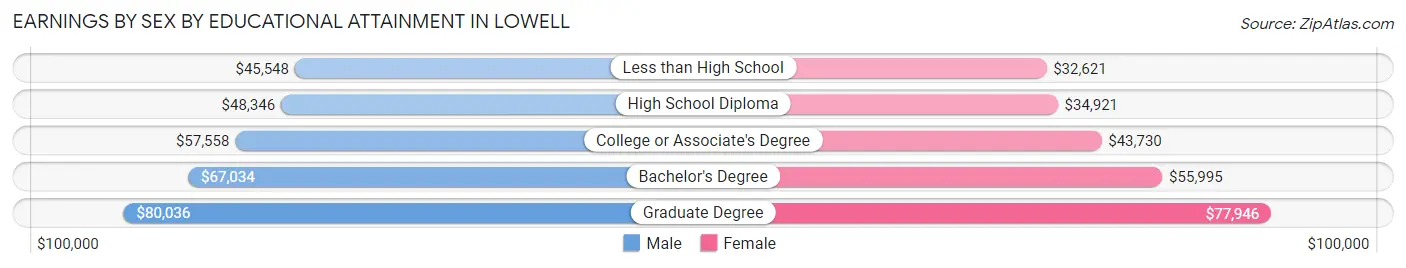
Earnings by Sex by Educational Attainment in Lowell
Average earnings in Lowell are $56,194 for men and $44,071 for women, a difference of 21.6%. Men with an educational attainment of graduate degree enjoy the highest average annual earnings of $80,036, while those with less than high school education earn the least with $45,548. Women with an educational attainment of graduate degree earn the most with the average annual earnings of $77,946, while those with less than high school education have the smallest earnings of $32,621.
| Educational Attainment | Male Income | Female Income |
| Less than High School | $45,548 | $32,621 |
| High School Diploma | $48,346 | $34,921 |
| College or Associate's Degree | $57,558 | $43,730 |
| Bachelor's Degree | $67,034 | $55,995 |
| Graduate Degree | $80,036 | $77,946 |
| Total | $56,194 | $44,071 |
Family Income in Lowell
Family Income Brackets in Lowell
According to the Lowell family income data, there are 5,814 families falling into the $100,000 to $149,999 income range, which is the most common income bracket and makes up 23.0% of all families. Conversely, the $10,000 to $14,999 income bracket is the least frequent group with only 581 families (2.3%) belonging to this category.
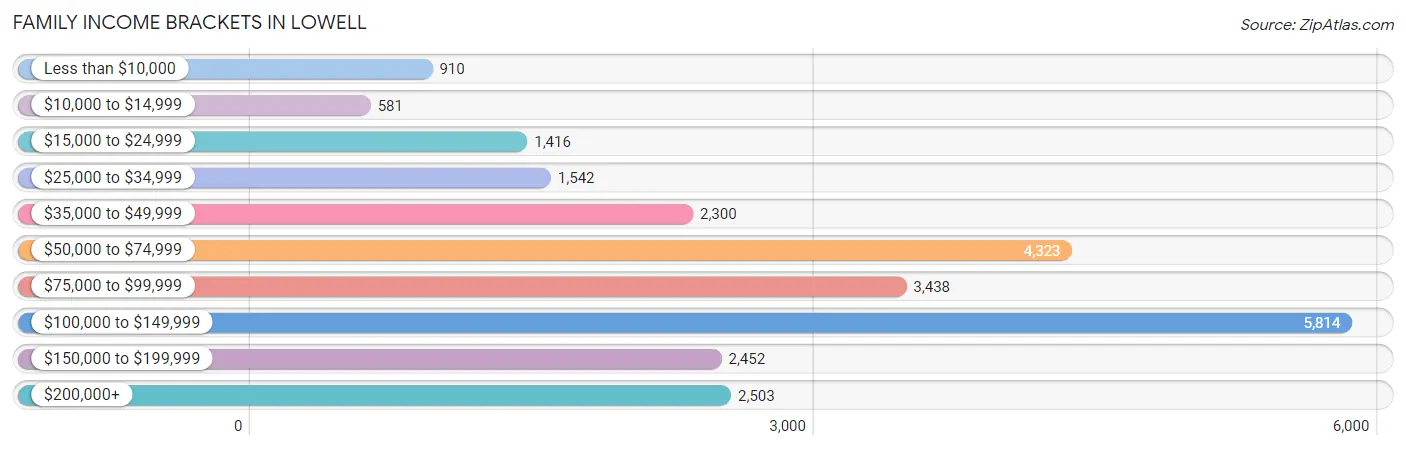
| Income Bracket | # Families | % Families |
| Less than $10,000 | 910 | 3.6% |
| $10,000 to $14,999 | 581 | 2.3% |
| $15,000 to $24,999 | 1,416 | 5.6% |
| $25,000 to $34,999 | 1,542 | 6.1% |
| $35,000 to $49,999 | 2,300 | 9.1% |
| $50,000 to $74,999 | 4,323 | 17.1% |
| $75,000 to $99,999 | 3,438 | 13.6% |
| $100,000 to $149,999 | 5,814 | 23.0% |
| $150,000 to $199,999 | 2,452 | 9.7% |
| $200,000+ | 2,503 | 9.9% |
Family Income by Famaliy Size in Lowell
7+ person families (492 | 1.9%) account for the highest median family income in Lowell with $114,722 per family, while 2-person families (9,351 | 37.0%) have the highest median income of $34,749 per family member.
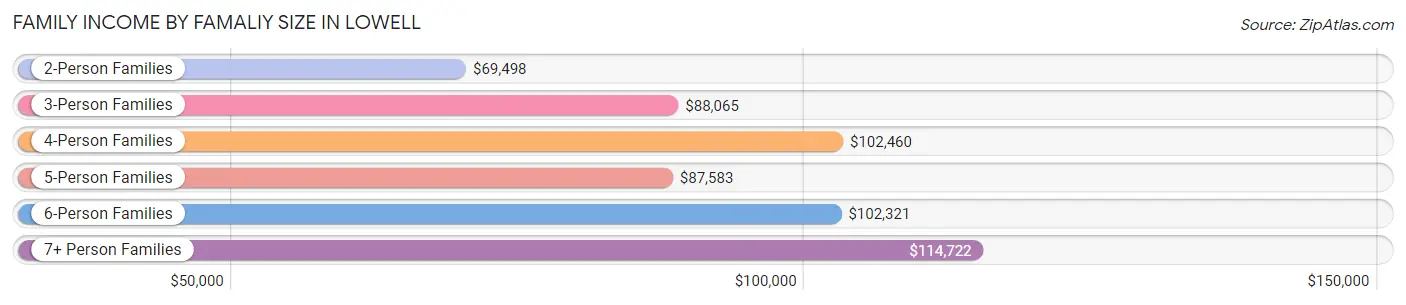
| Income Bracket | # Families | Median Income |
| 2-Person Families | 9,351 (37.0%) | $69,498 |
| 3-Person Families | 6,560 (26.0%) | $88,065 |
| 4-Person Families | 5,617 (22.2%) | $102,460 |
| 5-Person Families | 2,297 (9.1%) | $87,583 |
| 6-Person Families | 963 (3.8%) | $102,321 |
| 7+ Person Families | 492 (1.9%) | $114,722 |
| Total | 25,280 (100.0%) | $84,723 |
Family Income by Number of Earners in Lowell
The median family income in Lowell is $84,723, with families comprising 3+ earners (4,407) having the highest median family income of $138,763, while families with no earners (2,645) have the lowest median family income of $23,627, accounting for 17.4% and 10.5% of families, respectively.
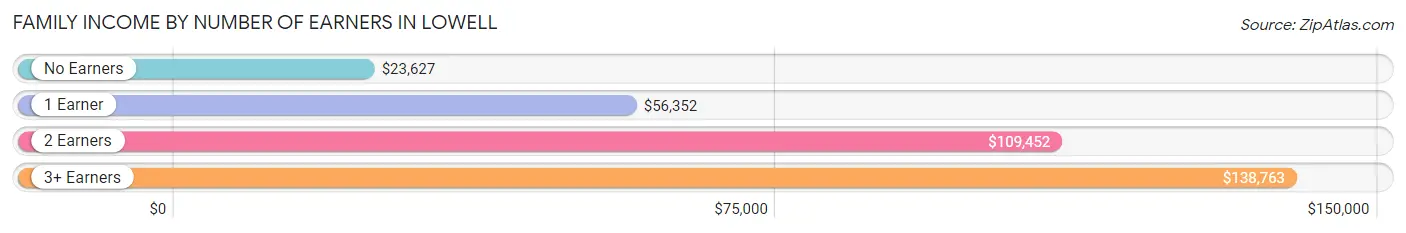
| Number of Earners | # Families | Median Income |
| No Earners | 2,645 (10.5%) | $23,627 |
| 1 Earner | 8,480 (33.5%) | $56,352 |
| 2 Earners | 9,748 (38.6%) | $109,452 |
| 3+ Earners | 4,407 (17.4%) | $138,763 |
| Total | 25,280 (100.0%) | $84,723 |
Household Income in Lowell
Household Income Brackets in Lowell
With 8,384 households falling in the category, the $100,000 to $149,999 income range is the most frequent in Lowell, accounting for 19.8% of all households. In contrast, only 2,244 households (5.3%) fall into the less than $10,000 income bracket, making it the least populous group.
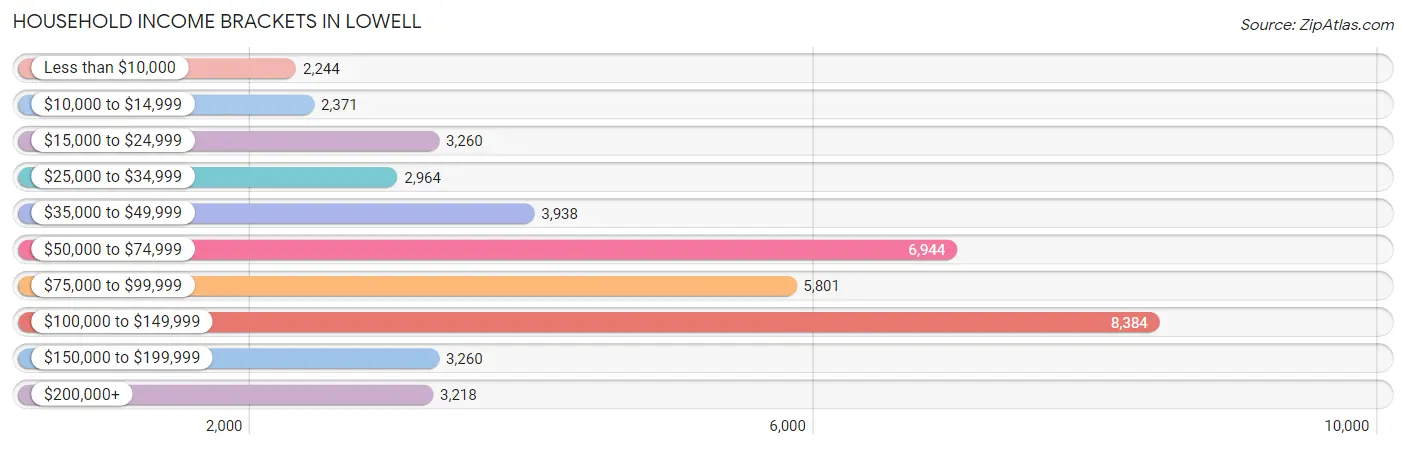
| Income Bracket | # Households | % Households |
| Less than $10,000 | 2,244 | 5.3% |
| $10,000 to $14,999 | 2,371 | 5.6% |
| $15,000 to $24,999 | 3,260 | 7.7% |
| $25,000 to $34,999 | 2,964 | 7.0% |
| $35,000 to $49,999 | 3,938 | 9.3% |
| $50,000 to $74,999 | 6,944 | 16.4% |
| $75,000 to $99,999 | 5,801 | 13.7% |
| $100,000 to $149,999 | 8,384 | 19.8% |
| $150,000 to $199,999 | 3,260 | 7.7% |
| $200,000+ | 3,218 | 7.6% |
Household Income by Householder Age in Lowell
The median household income in Lowell is $73,008, with the highest median household income of $83,377 found in the 25 to 44 years age bracket for the primary householder. A total of 16,398 households (38.7%) fall into this category. Meanwhile, the 15 to 24 years age bracket for the primary householder has the lowest median household income of $45,568, with 2,185 households (5.2%) in this group.
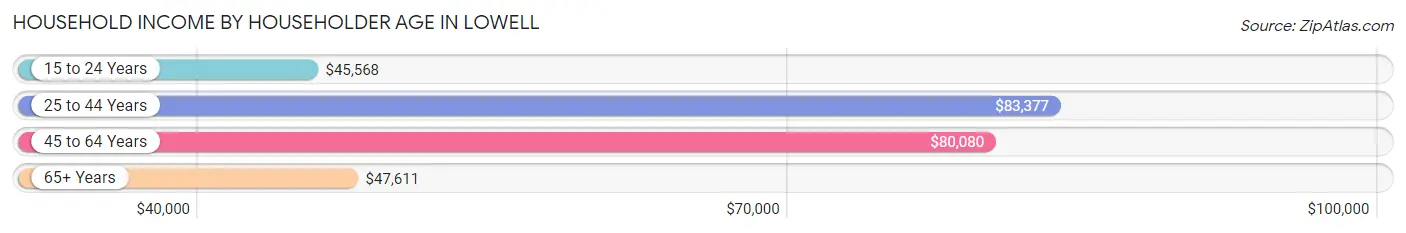
| Income Bracket | # Households | Median Income |
| 15 to 24 Years | 2,185 (5.2%) | $45,568 |
| 25 to 44 Years | 16,398 (38.7%) | $83,377 |
| 45 to 64 Years | 16,341 (38.6%) | $80,080 |
| 65+ Years | 7,419 (17.5%) | $47,611 |
| Total | 42,343 (100.0%) | $73,008 |
Poverty in Lowell
Income Below Poverty by Sex and Age in Lowell
With 15.5% poverty level for males and 17.7% for females among the residents of Lowell, 5 year old males and under 5 year old females are the most vulnerable to poverty, with 138 males (25.9%) and 999 females (31.9%) in their respective age groups living below the poverty level.
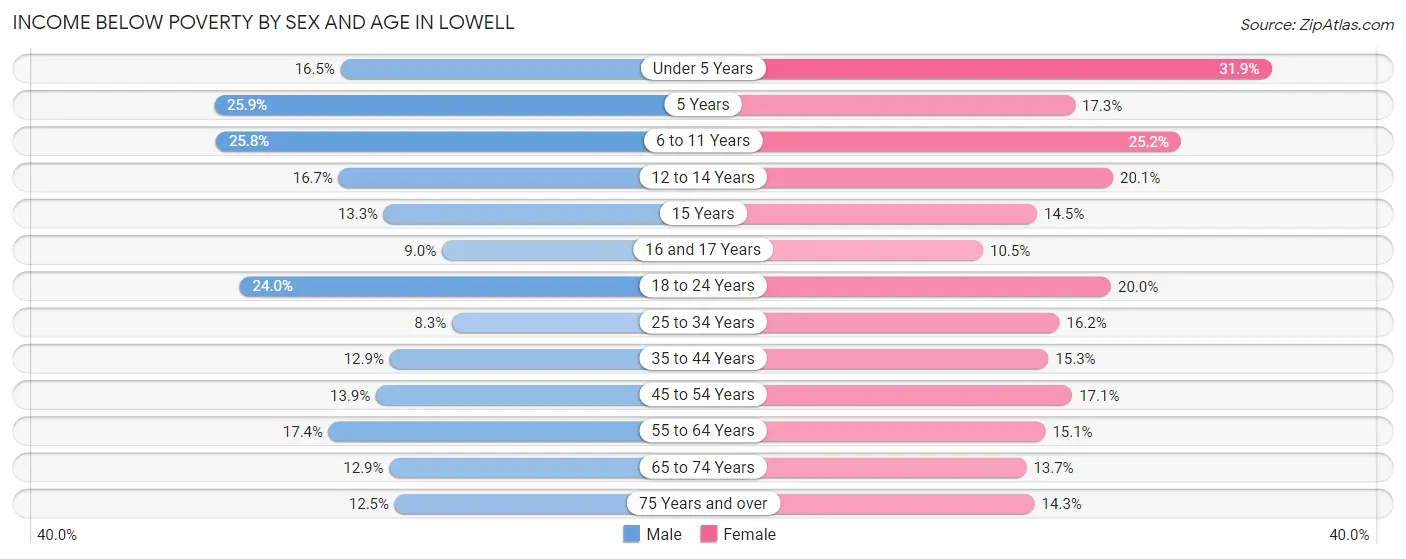
| Age Bracket | Male | Female |
| Under 5 Years | 530 (16.5%) | 999 (31.9%) |
| 5 Years | 138 (25.9%) | 142 (17.3%) |
| 6 to 11 Years | 998 (25.8%) | 983 (25.2%) |
| 12 to 14 Years | 397 (16.7%) | 435 (20.1%) |
| 15 Years | 77 (13.3%) | 106 (14.5%) |
| 16 and 17 Years | 94 (9.0%) | 104 (10.5%) |
| 18 to 24 Years | 1,553 (24.0%) | 1,175 (20.0%) |
| 25 to 34 Years | 756 (8.3%) | 1,553 (16.2%) |
| 35 to 44 Years | 975 (12.9%) | 1,211 (15.3%) |
| 45 to 54 Years | 918 (13.9%) | 1,099 (17.1%) |
| 55 to 64 Years | 1,278 (17.4%) | 1,114 (15.1%) |
| 65 to 74 Years | 509 (12.9%) | 603 (13.7%) |
| 75 Years and over | 219 (12.5%) | 366 (14.3%) |
| Total | 8,442 (15.5%) | 9,890 (17.7%) |
Income Above Poverty by Sex and Age in Lowell
According to the poverty statistics in Lowell, males aged 25 to 34 years and females aged 16 and 17 years are the age groups that are most secure financially, with 91.7% of males and 89.5% of females in these age groups living above the poverty line.
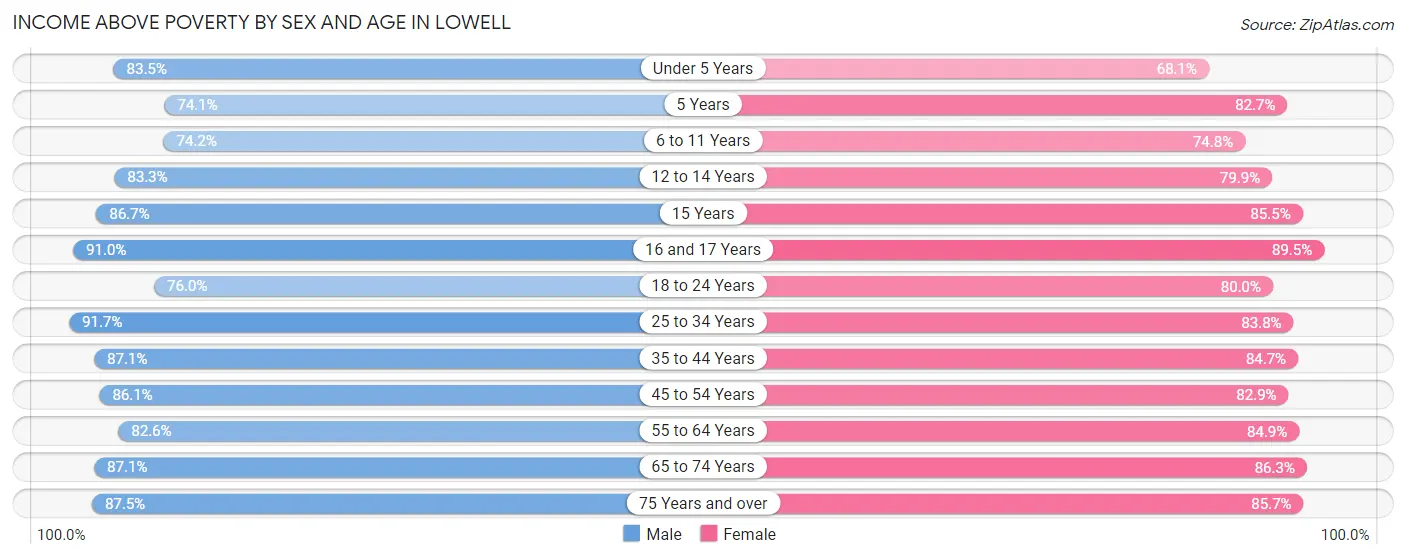
| Age Bracket | Male | Female |
| Under 5 Years | 2,676 (83.5%) | 2,134 (68.1%) |
| 5 Years | 394 (74.1%) | 678 (82.7%) |
| 6 to 11 Years | 2,871 (74.2%) | 2,923 (74.8%) |
| 12 to 14 Years | 1,985 (83.3%) | 1,725 (79.9%) |
| 15 Years | 501 (86.7%) | 625 (85.5%) |
| 16 and 17 Years | 949 (91.0%) | 887 (89.5%) |
| 18 to 24 Years | 4,909 (76.0%) | 4,704 (80.0%) |
| 25 to 34 Years | 8,384 (91.7%) | 8,052 (83.8%) |
| 35 to 44 Years | 6,590 (87.1%) | 6,682 (84.7%) |
| 45 to 54 Years | 5,688 (86.1%) | 5,323 (82.9%) |
| 55 to 64 Years | 6,062 (82.6%) | 6,255 (84.9%) |
| 65 to 74 Years | 3,431 (87.1%) | 3,795 (86.3%) |
| 75 Years and over | 1,532 (87.5%) | 2,189 (85.7%) |
| Total | 45,972 (84.5%) | 45,972 (82.3%) |
Income Below Poverty Among Married-Couple Families in Lowell
The poverty statistics for married-couple families in Lowell show that 5.0% or 745 of the total 14,936 families live below the poverty line. Families with 5 or more children have the highest poverty rate of 51.7%, comprising of 60 families. On the other hand, families with no children have the lowest poverty rate of 1.7%, which includes 133 families.
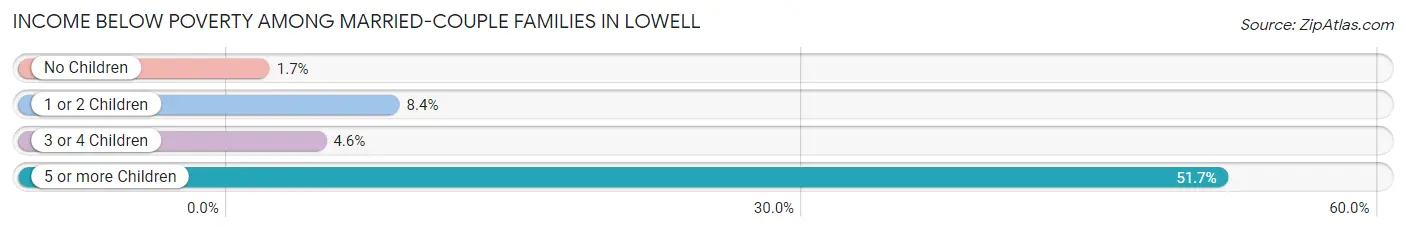
| Children | Above Poverty | Below Poverty |
| No Children | 7,860 (98.3%) | 133 (1.7%) |
| 1 or 2 Children | 5,676 (91.6%) | 523 (8.4%) |
| 3 or 4 Children | 599 (95.4%) | 29 (4.6%) |
| 5 or more Children | 56 (48.3%) | 60 (51.7%) |
| Total | 14,191 (95.0%) | 745 (5.0%) |
Income Below Poverty Among Single-Parent Households in Lowell
According to the poverty data in Lowell, 15.6% or 460 single-father households and 21.7% or 1,606 single-mother households are living below the poverty line. Among single-father households, those with 3 or 4 children have the highest poverty rate, with 119 households (43.4%) experiencing poverty. Likewise, among single-mother households, those with 3 or 4 children have the highest poverty rate, with 496 households (45.7%) falling below the poverty line.
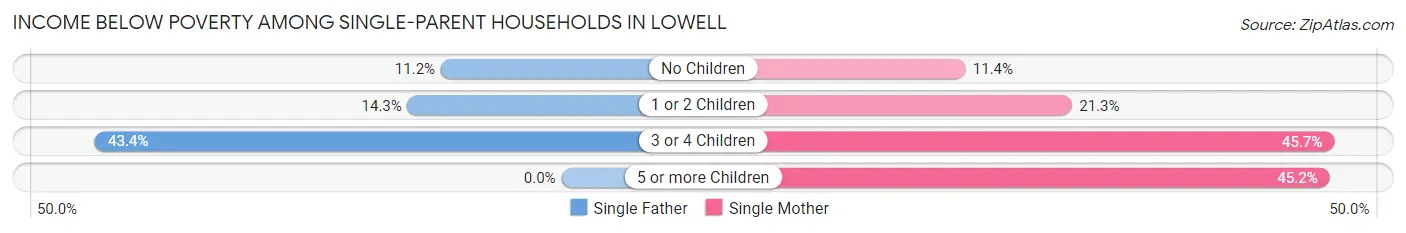
| Children | Single Father | Single Mother |
| No Children | 150 (11.2%) | 281 (11.4%) |
| 1 or 2 Children | 191 (14.3%) | 810 (21.3%) |
| 3 or 4 Children | 119 (43.4%) | 496 (45.7%) |
| 5 or more Children | 0 (0.0%) | 19 (45.2%) |
| Total | 460 (15.6%) | 1,606 (21.7%) |
Income Below Poverty Among Married-Couple vs Single-Parent Households in Lowell
The poverty data for Lowell shows that 745 of the married-couple family households (5.0%) and 2,066 of the single-parent households (20.0%) are living below the poverty level. Within the married-couple family households, those with 5 or more children have the highest poverty rate, with 60 households (51.7%) falling below the poverty line. Among the single-parent households, those with 5 or more children have the highest poverty rate, with 19 household (45.2%) living below poverty.
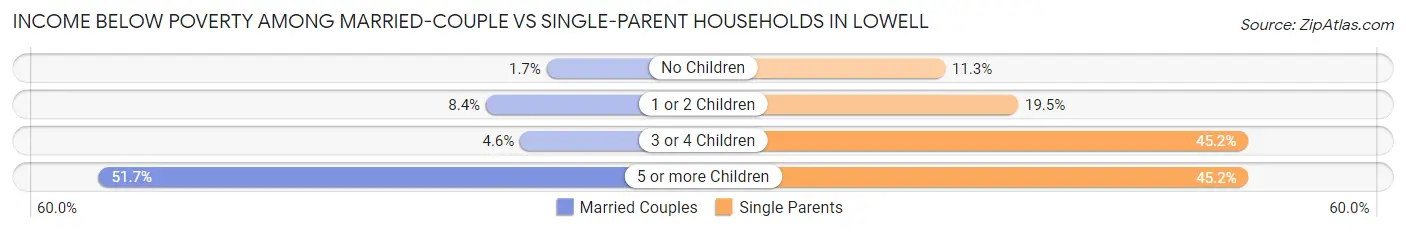
| Children | Married-Couple Families | Single-Parent Households |
| No Children | 133 (1.7%) | 431 (11.3%) |
| 1 or 2 Children | 523 (8.4%) | 1,001 (19.5%) |
| 3 or 4 Children | 29 (4.6%) | 615 (45.2%) |
| 5 or more Children | 60 (51.7%) | 19 (45.2%) |
| Total | 745 (5.0%) | 2,066 (20.0%) |
Race in Lowell
The most populous races in Lowell are White / Caucasian (62,300 | 54.3%), Asian (25,913 | 22.6%), and Hispanic or Latino (20,393 | 17.8%).
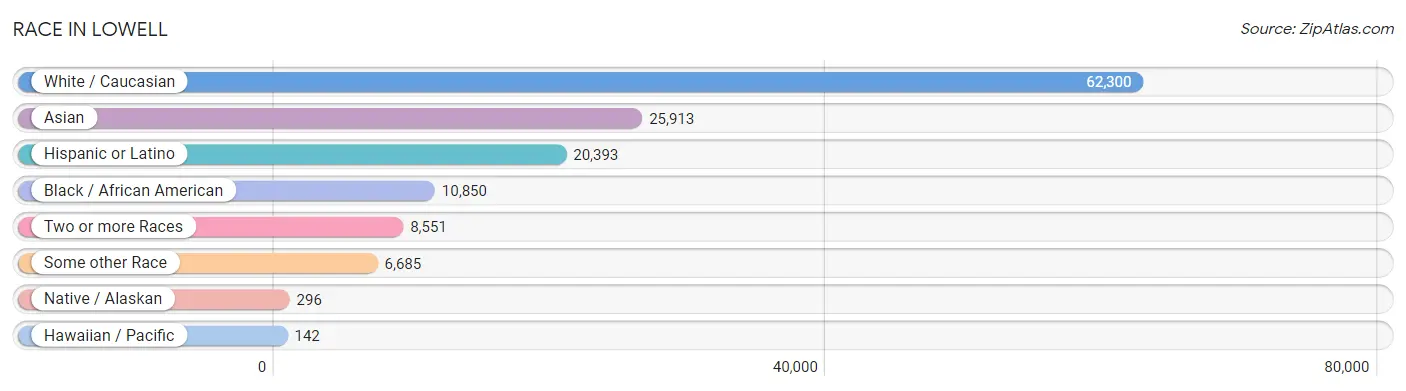
| Race | # Population | % Population |
| Asian | 25,913 | 22.6% |
| Black / African American | 10,850 | 9.5% |
| Hawaiian / Pacific | 142 | 0.1% |
| Hispanic or Latino | 20,393 | 17.8% |
| Native / Alaskan | 296 | 0.3% |
| White / Caucasian | 62,300 | 54.3% |
| Two or more Races | 8,551 | 7.4% |
| Some other Race | 6,685 | 5.8% |
| Total | 114,737 | 100.0% |
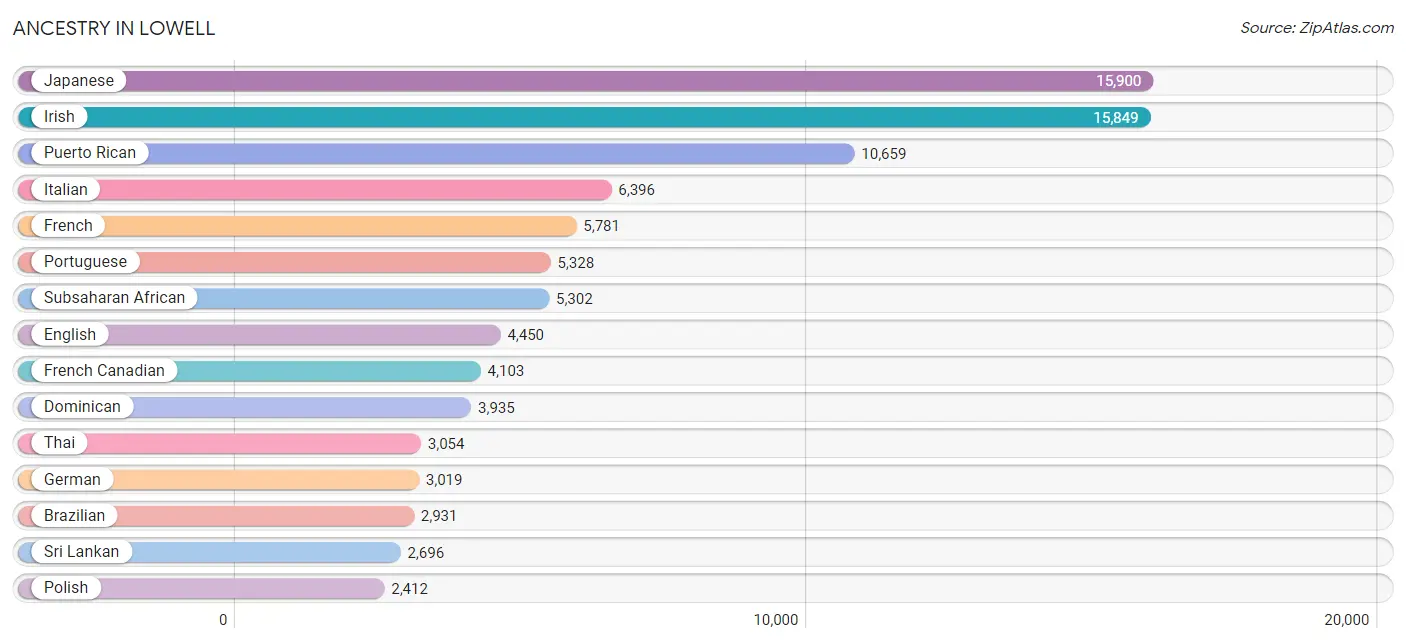
Ancestry in Lowell
The most populous ancestries reported in Lowell are Japanese (15,900 | 13.9%), Irish (15,849 | 13.8%), Puerto Rican (10,659 | 9.3%), Italian (6,396 | 5.6%), and French (5,781 | 5.0%), together accounting for 47.6% of all Lowell residents.
| Ancestry | # Population | % Population |
| Afghan | 31 | 0.0% |
| African | 2,381 | 2.1% |
| Albanian | 60 | 0.1% |
| American | 2,340 | 2.0% |
| Arab | 893 | 0.8% |
| Argentinean | 65 | 0.1% |
| Armenian | 200 | 0.2% |
| Australian | 35 | 0.0% |
| Austrian | 50 | 0.0% |
| Bahamian | 11 | 0.0% |
| Barbadian | 125 | 0.1% |
| Basque | 20 | 0.0% |
| Belgian | 13 | 0.0% |
| Bermudan | 38 | 0.0% |
| Bhutanese | 132 | 0.1% |
| Brazilian | 2,931 | 2.5% |
| British | 444 | 0.4% |
| Burmese | 377 | 0.3% |
| Canadian | 173 | 0.2% |
| Cape Verdean | 204 | 0.2% |
| Celtic | 2 | 0.0% |
| Central American | 1,367 | 1.2% |
| Central American Indian | 63 | 0.1% |
| Cherokee | 149 | 0.1% |
| Chilean | 34 | 0.0% |
| Choctaw | 32 | 0.0% |
| Colombian | 1,776 | 1.5% |
| Costa Rican | 69 | 0.1% |
| Cree | 77 | 0.1% |
| Croatian | 36 | 0.0% |
| Cuban | 86 | 0.1% |
| Czech | 36 | 0.0% |
| Danish | 31 | 0.0% |
| Dominican | 3,935 | 3.4% |
| Dutch | 61 | 0.1% |
| Eastern European | 254 | 0.2% |
| Ecuadorian | 389 | 0.3% |
| Egyptian | 18 | 0.0% |
| English | 4,450 | 3.9% |
| Ethiopian | 1 | 0.0% |
| European | 656 | 0.6% |
| Filipino | 18 | 0.0% |
| Finnish | 40 | 0.0% |
| French | 5,781 | 5.0% |
| French American Indian | 12 | 0.0% |
| French Canadian | 4,103 | 3.6% |
| German | 3,019 | 2.6% |
| Ghanaian | 183 | 0.2% |
| Greek | 1,606 | 1.4% |
| Guamanian / Chamorro | 48 | 0.0% |
| Guatemalan | 430 | 0.4% |
| Guyanese | 15 | 0.0% |
| Haitian | 523 | 0.5% |
| Honduran | 84 | 0.1% |
| Hungarian | 160 | 0.1% |
| Indian (Asian) | 1,164 | 1.0% |
| Indonesian | 488 | 0.4% |
| Iranian | 141 | 0.1% |
| Iraqi | 94 | 0.1% |
| Irish | 15,849 | 13.8% |
| Israeli | 22 | 0.0% |
| Italian | 6,396 | 5.6% |
| Jamaican | 219 | 0.2% |
| Japanese | 15,900 | 13.9% |
| Kenyan | 766 | 0.7% |
| Korean | 194 | 0.2% |
| Laotian | 179 | 0.2% |
| Latvian | 14 | 0.0% |
| Lebanese | 292 | 0.3% |
| Liberian | 365 | 0.3% |
| Lithuanian | 448 | 0.4% |
| Malaysian | 1,444 | 1.3% |
| Mexican | 874 | 0.8% |
| Mongolian | 9 | 0.0% |
| Moroccan | 272 | 0.2% |
| Native Hawaiian | 40 | 0.0% |
| Nicaraguan | 23 | 0.0% |
| Nigerian | 328 | 0.3% |
| Northern European | 87 | 0.1% |
| Norwegian | 154 | 0.1% |
| Pakistani | 101 | 0.1% |
| Panamanian | 146 | 0.1% |
| Peruvian | 99 | 0.1% |
| Polish | 2,412 | 2.1% |
| Portuguese | 5,328 | 4.6% |
| Puerto Rican | 10,659 | 9.3% |
| Romanian | 53 | 0.1% |
| Russian | 459 | 0.4% |
| Salvadoran | 615 | 0.5% |
| Samoan | 99 | 0.1% |
| Scandinavian | 64 | 0.1% |
| Scotch-Irish | 282 | 0.3% |
| Scottish | 742 | 0.6% |
| Sierra Leonean | 476 | 0.4% |
| Slovak | 16 | 0.0% |
| Slovene | 9 | 0.0% |
| Somali | 18 | 0.0% |
| South African | 13 | 0.0% |
| South American | 2,407 | 2.1% |
| South American Indian | 71 | 0.1% |
| Spaniard | 69 | 0.1% |
| Spanish | 189 | 0.2% |
| Sri Lankan | 2,696 | 2.4% |
| Subsaharan African | 5,302 | 4.6% |
| Swedish | 395 | 0.3% |
| Swiss | 39 | 0.0% |
| Syrian | 119 | 0.1% |
| Thai | 3,054 | 2.7% |
| Trinidadian and Tobagonian | 39 | 0.0% |
| Turkish | 162 | 0.1% |
| U.S. Virgin Islander | 10 | 0.0% |
| Ugandan | 295 | 0.3% |
| Ukrainian | 58 | 0.1% |
| Uruguayan | 8 | 0.0% |
| Venezuelan | 25 | 0.0% |
| Vietnamese | 100 | 0.1% |
| Welsh | 176 | 0.2% |
| West Indian | 70 | 0.1% |
| Zimbabwean | 15 | 0.0% | View All 119 Rows |
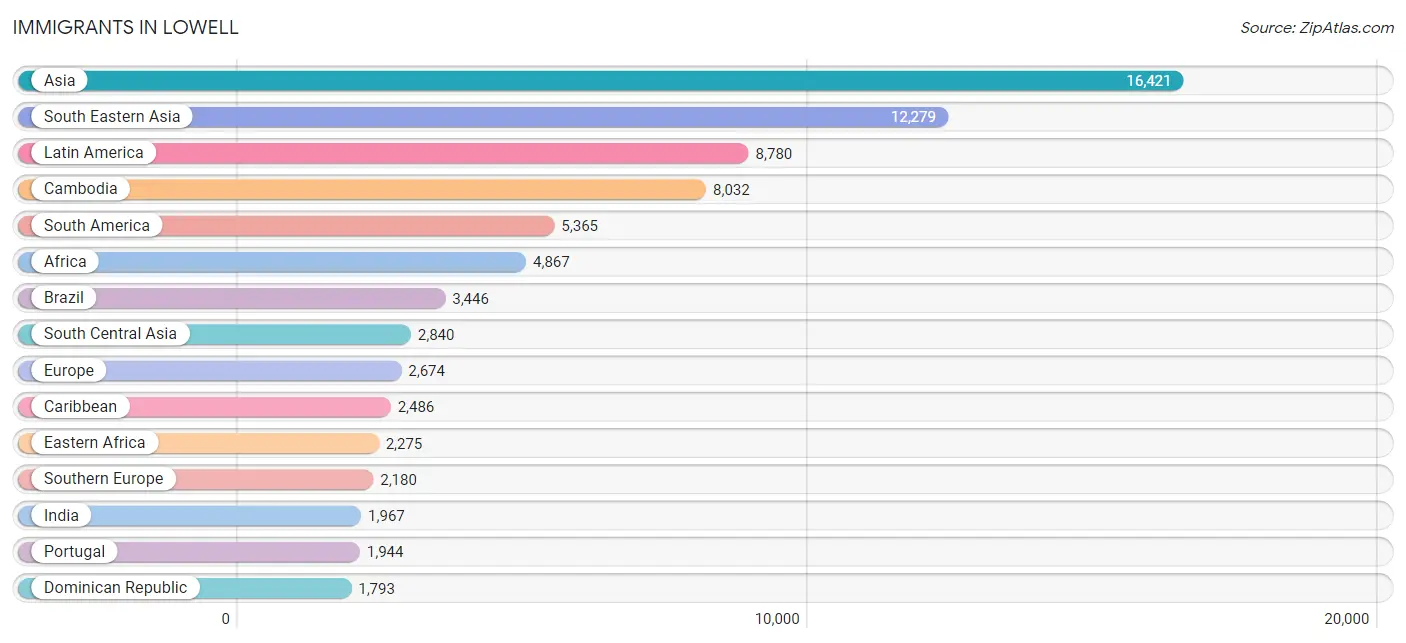
Immigrants in Lowell
The most numerous immigrant groups reported in Lowell came from Asia (16,421 | 14.3%), South Eastern Asia (12,279 | 10.7%), Latin America (8,780 | 7.6%), Cambodia (8,032 | 7.0%), and South America (5,365 | 4.7%), together accounting for 44.3% of all Lowell residents.
| Immigration Origin | # Population | % Population |
| Afghanistan | 89 | 0.1% |
| Africa | 4,867 | 4.2% |
| Albania | 37 | 0.0% |
| Argentina | 10 | 0.0% |
| Asia | 16,421 | 14.3% |
| Austria | 26 | 0.0% |
| Azores | 329 | 0.3% |
| Bahamas | 24 | 0.0% |
| Bangladesh | 126 | 0.1% |
| Barbados | 54 | 0.1% |
| Brazil | 3,446 | 3.0% |
| Cabo Verde | 4 | 0.0% |
| Cambodia | 8,032 | 7.0% |
| Cameroon | 195 | 0.2% |
| Canada | 163 | 0.1% |
| Caribbean | 2,486 | 2.2% |
| Central America | 929 | 0.8% |
| Chile | 13 | 0.0% |
| China | 433 | 0.4% |
| Colombia | 1,502 | 1.3% |
| Congo | 43 | 0.0% |
| Costa Rica | 69 | 0.1% |
| Croatia | 13 | 0.0% |
| Cuba | 44 | 0.0% |
| Dominican Republic | 1,793 | 1.6% |
| Eastern Africa | 2,275 | 2.0% |
| Eastern Asia | 734 | 0.6% |
| Eastern Europe | 251 | 0.2% |
| Ecuador | 232 | 0.2% |
| Egypt | 19 | 0.0% |
| El Salvador | 396 | 0.4% |
| England | 31 | 0.0% |
| Ethiopia | 17 | 0.0% |
| Europe | 2,674 | 2.3% |
| France | 63 | 0.1% |
| Germany | 66 | 0.1% |
| Ghana | 123 | 0.1% |
| Greece | 184 | 0.2% |
| Guatemala | 216 | 0.2% |
| Guyana | 15 | 0.0% |
| Haiti | 382 | 0.3% |
| Honduras | 102 | 0.1% |
| Hong Kong | 5 | 0.0% |
| India | 1,967 | 1.7% |
| Indonesia | 122 | 0.1% |
| Iran | 164 | 0.1% |
| Iraq | 78 | 0.1% |
| Ireland | 29 | 0.0% |
| Israel | 25 | 0.0% |
| Italy | 30 | 0.0% |
| Jamaica | 128 | 0.1% |
| Japan | 60 | 0.1% |
| Jordan | 7 | 0.0% |
| Kenya | 1,512 | 1.3% |
| Korea | 241 | 0.2% |
| Laos | 789 | 0.7% |
| Latin America | 8,780 | 7.6% |
| Lebanon | 110 | 0.1% |
| Liberia | 425 | 0.4% |
| Malaysia | 32 | 0.0% |
| Mexico | 146 | 0.1% |
| Micronesia | 58 | 0.1% |
| Middle Africa | 238 | 0.2% |
| Morocco | 143 | 0.1% |
| Nepal | 149 | 0.1% |
| Nigeria | 576 | 0.5% |
| Northern Africa | 162 | 0.1% |
| Northern Europe | 88 | 0.1% |
| Oceania | 68 | 0.1% |
| Pakistan | 167 | 0.2% |
| Peru | 28 | 0.0% |
| Philippines | 323 | 0.3% |
| Poland | 66 | 0.1% |
| Portugal | 1,944 | 1.7% |
| Romania | 6 | 0.0% |
| Russia | 105 | 0.1% |
| Saudi Arabia | 54 | 0.1% |
| Sierra Leone | 362 | 0.3% |
| Somalia | 18 | 0.0% |
| South Africa | 50 | 0.0% |
| South America | 5,365 | 4.7% |
| South Central Asia | 2,840 | 2.5% |
| South Eastern Asia | 12,279 | 10.7% |
| Southern Europe | 2,180 | 1.9% |
| Spain | 22 | 0.0% |
| Syria | 45 | 0.0% |
| Taiwan | 94 | 0.1% |
| Thailand | 871 | 0.8% |
| Trinidad and Tobago | 21 | 0.0% |
| Turkey | 170 | 0.2% |
| Uganda | 646 | 0.6% |
| Ukraine | 24 | 0.0% |
| Uruguay | 73 | 0.1% |
| Venezuela | 46 | 0.0% |
| Vietnam | 1,733 | 1.5% |
| West Indies | 13 | 0.0% |
| Western Africa | 1,585 | 1.4% |
| Western Asia | 531 | 0.5% |
| Western Europe | 155 | 0.1% |
| Zimbabwe | 15 | 0.0% | View All 100 Rows |
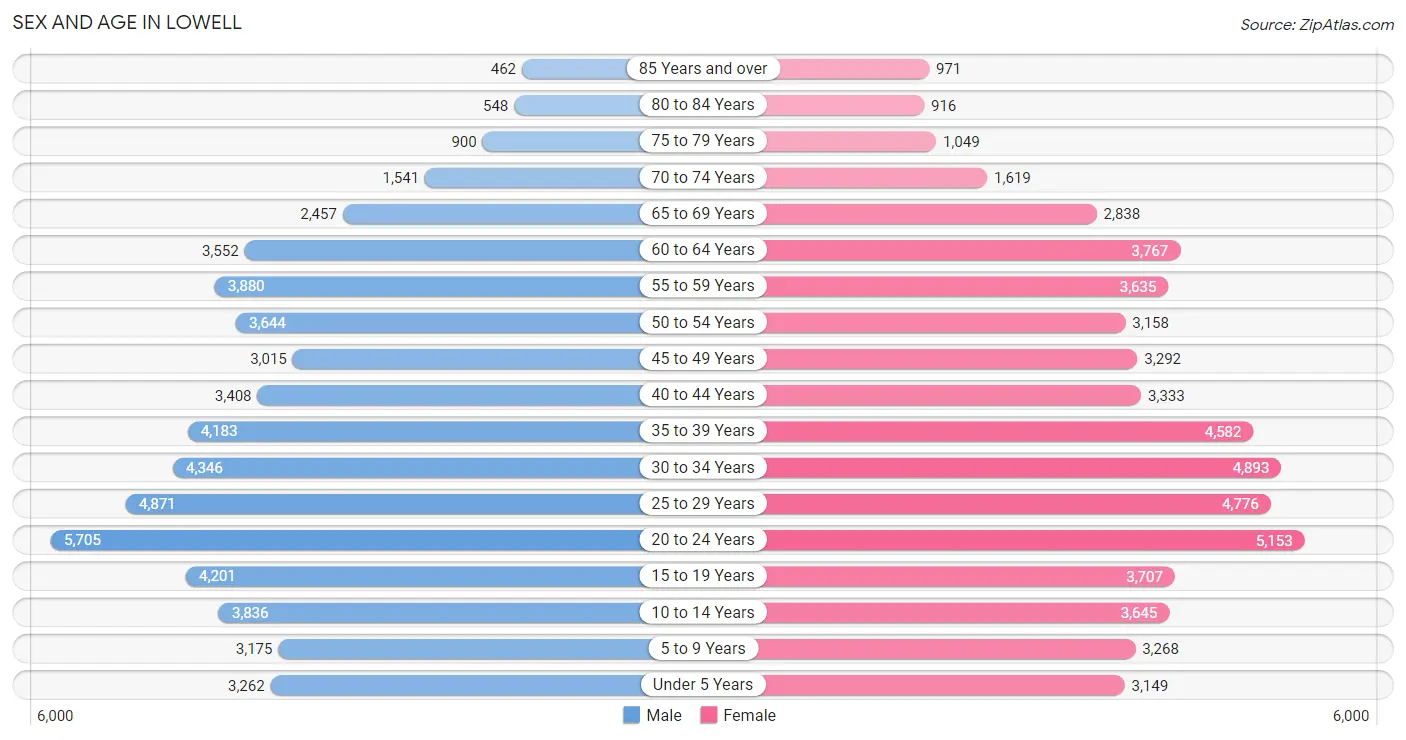
Sex and Age in Lowell
Sex and Age in Lowell
The most populous age groups in Lowell are 20 to 24 Years (5,705 | 10.0%) for men and 20 to 24 Years (5,153 | 8.9%) for women.
| Age Bracket | Male | Female |
| Under 5 Years | 3,262 (5.7%) | 3,149 (5.4%) |
| 5 to 9 Years | 3,175 (5.6%) | 3,268 (5.7%) |
| 10 to 14 Years | 3,836 (6.7%) | 3,645 (6.3%) |
| 15 to 19 Years | 4,201 (7.4%) | 3,707 (6.4%) |
| 20 to 24 Years | 5,705 (10.0%) | 5,153 (8.9%) |
| 25 to 29 Years | 4,871 (8.6%) | 4,776 (8.3%) |
| 30 to 34 Years | 4,346 (7.6%) | 4,893 (8.5%) |
| 35 to 39 Years | 4,183 (7.3%) | 4,582 (7.9%) |
| 40 to 44 Years | 3,408 (6.0%) | 3,333 (5.8%) |
| 45 to 49 Years | 3,015 (5.3%) | 3,292 (5.7%) |
| 50 to 54 Years | 3,644 (6.4%) | 3,158 (5.5%) |
| 55 to 59 Years | 3,880 (6.8%) | 3,635 (6.3%) |
| 60 to 64 Years | 3,552 (6.2%) | 3,767 (6.5%) |
| 65 to 69 Years | 2,457 (4.3%) | 2,838 (4.9%) |
| 70 to 74 Years | 1,541 (2.7%) | 1,619 (2.8%) |
| 75 to 79 Years | 900 (1.6%) | 1,049 (1.8%) |
| 80 to 84 Years | 548 (1.0%) | 916 (1.6%) |
| 85 Years and over | 462 (0.8%) | 971 (1.7%) |
| Total | 56,986 (100.0%) | 57,751 (100.0%) |
Families and Households in Lowell
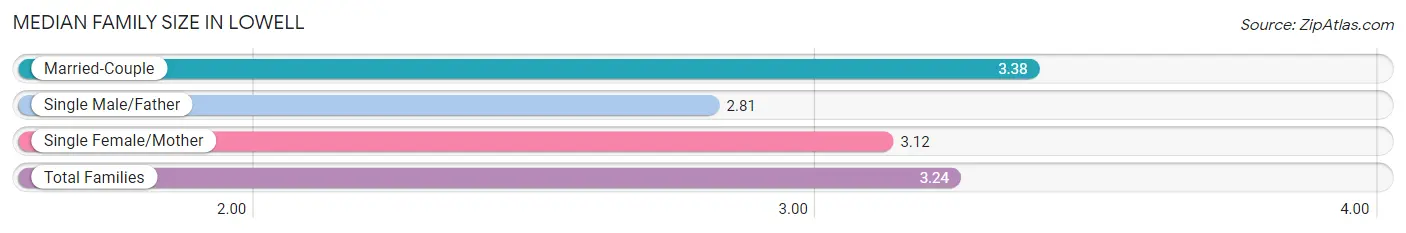
Median Family Size in Lowell
The median family size in Lowell is 3.24 persons per family, with married-couple families (14,936 | 59.1%) accounting for the largest median family size of 3.38 persons per family. On the other hand, single male/father families (2,943 | 11.6%) represent the smallest median family size with 2.81 persons per family.
| Family Type | # Families | Family Size |
| Married-Couple | 14,936 (59.1%) | 3.38 |
| Single Male/Father | 2,943 (11.6%) | 2.81 |
| Single Female/Mother | 7,401 (29.3%) | 3.12 |
| Total Families | 25,280 (100.0%) | 3.24 |
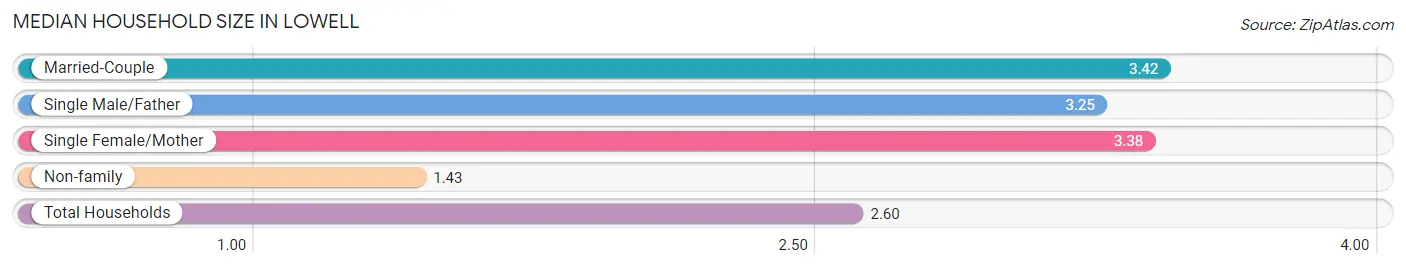
Median Household Size in Lowell
The median household size in Lowell is 2.60 persons per household, with married-couple households (14,936 | 35.3%) accounting for the largest median household size of 3.42 persons per household. non-family households (17,063 | 40.3%) represent the smallest median household size with 1.43 persons per household.
| Household Type | # Households | Household Size |
| Married-Couple | 14,936 (35.3%) | 3.42 |
| Single Male/Father | 2,943 (7.0%) | 3.25 |
| Single Female/Mother | 7,401 (17.5%) | 3.38 |
| Non-family | 17,063 (40.3%) | 1.43 |
| Total Households | 42,343 (100.0%) | 2.60 |
Household Size by Marriage Status in Lowell
Out of a total of 42,343 households in Lowell, 25,280 (59.7%) are family households, while 17,063 (40.3%) are nonfamily households. The most numerous type of family households are 2-person households, comprising 8,060, and the most common type of nonfamily households are 1-person households, comprising 12,010.
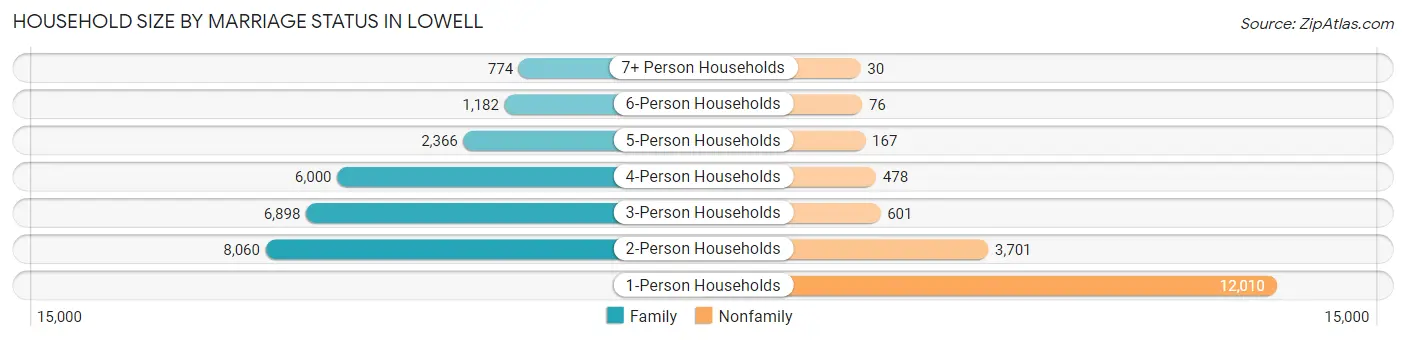
| Household Size | Family Households | Nonfamily Households |
| 1-Person Households | - | 12,010 (28.4%) |
| 2-Person Households | 8,060 (19.0%) | 3,701 (8.7%) |
| 3-Person Households | 6,898 (16.3%) | 601 (1.4%) |
| 4-Person Households | 6,000 (14.2%) | 478 (1.1%) |
| 5-Person Households | 2,366 (5.6%) | 167 (0.4%) |
| 6-Person Households | 1,182 (2.8%) | 76 (0.2%) |
| 7+ Person Households | 774 (1.8%) | 30 (0.1%) |
| Total | 25,280 (59.7%) | 17,063 (40.3%) |
Female Fertility in Lowell
Fertility by Age in Lowell
Average fertility rate in Lowell is 64.0 births per 1,000 women. Women in the age bracket of 20 to 34 years have the highest fertility rate with 102.0 births per 1,000 women. Women in the age bracket of 20 to 34 years acount for 78.4% of all women with births.
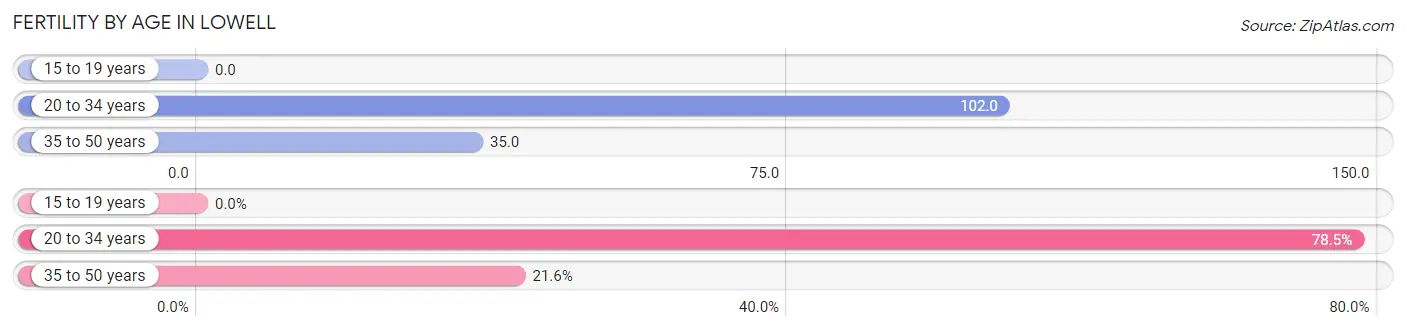
| Age Bracket | Women with Births | Births / 1,000 Women |
| 15 to 19 years | 0 (0.0%) | 0.0 |
| 20 to 34 years | 1,518 (78.4%) | 102.0 |
| 35 to 50 years | 417 (21.5%) | 35.0 |
| Total | 1,935 (100.0%) | 64.0 |
Fertility by Age by Marriage Status in Lowell
43.6% of women with births (1,935) in Lowell are married. The highest percentage of unmarried women with births falls into 20 to 34 years age bracket with 64.8% of them unmarried at the time of birth, while the lowest percentage of unmarried women with births belong to 35 to 50 years age bracket with 25.9% of them unmarried.
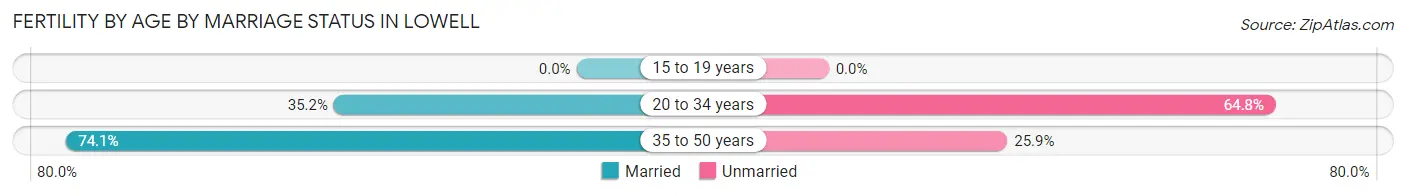
| Age Bracket | Married | Unmarried |
| 15 to 19 years | 0 (0.0%) | 0 (0.0%) |
| 20 to 34 years | 534 (35.2%) | 984 (64.8%) |
| 35 to 50 years | 309 (74.1%) | 108 (25.9%) |
| Total | 844 (43.6%) | 1,091 (56.4%) |
Fertility by Education in Lowell
Average fertility rate in Lowell is 64.0 births per 1,000 women. Women with the education attainment of high school diploma have the highest fertility rate of 82.0 births per 1,000 women, while women with the education attainment of graduate degree have the lowest fertility at 19.0 births per 1,000 women. Women with the education attainment of high school diploma represent 34.6% of all women with births.
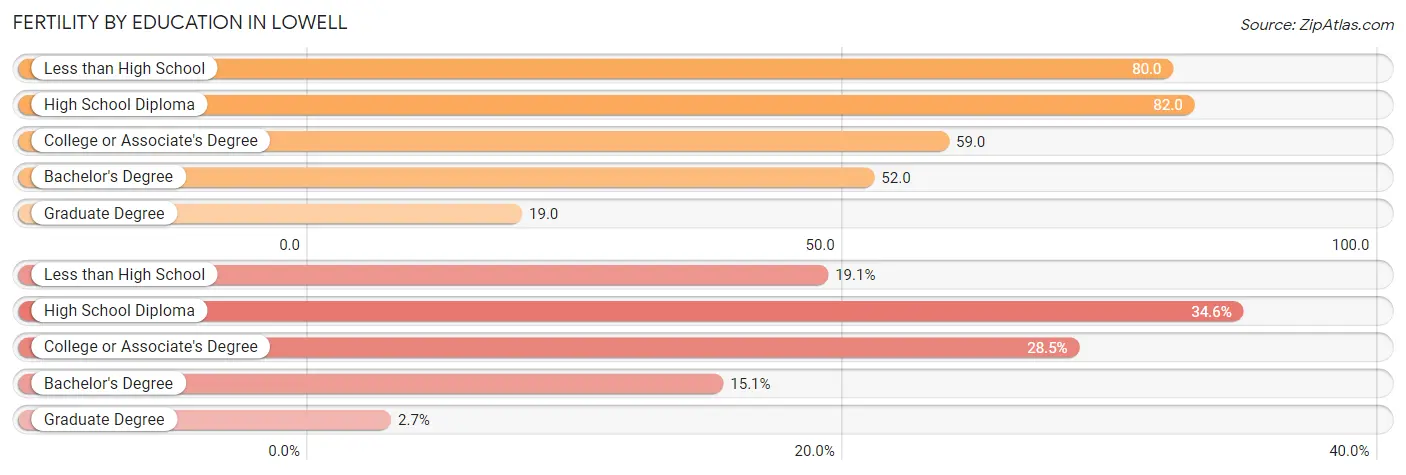
| Educational Attainment | Women with Births | Births / 1,000 Women |
| Less than High School | 369 (19.1%) | 80.0 |
| High School Diploma | 670 (34.6%) | 82.0 |
| College or Associate's Degree | 551 (28.5%) | 59.0 |
| Bachelor's Degree | 293 (15.1%) | 52.0 |
| Graduate Degree | 52 (2.7%) | 19.0 |
| Total | 1,935 (100.0%) | 64.0 |
Fertility by Education by Marriage Status in Lowell
56.4% of women with births in Lowell are unmarried. Women with the educational attainment of graduate degree are most likely to be married with 90.4% of them married at childbirth, while women with the educational attainment of college or associate's degree are least likely to be married with 71.9% of them unmarried at childbirth.
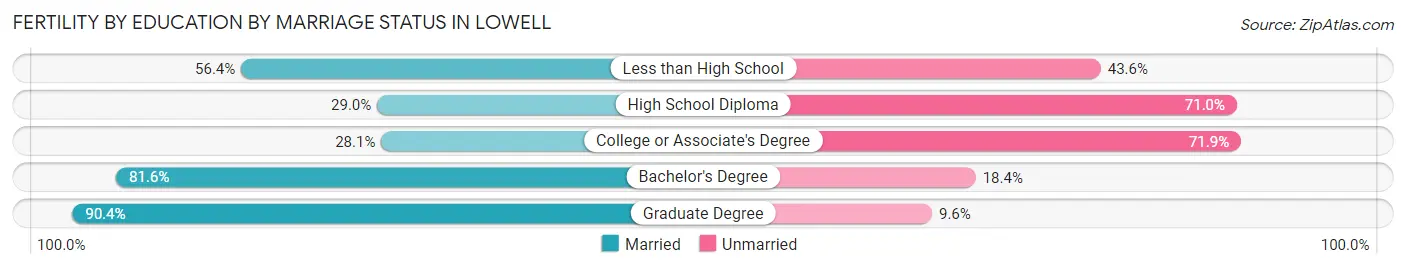
| Educational Attainment | Married | Unmarried |
| Less than High School | 208 (56.4%) | 161 (43.6%) |
| High School Diploma | 194 (29.0%) | 476 (71.0%) |
| College or Associate's Degree | 155 (28.1%) | 396 (71.9%) |
| Bachelor's Degree | 239 (81.6%) | 54 (18.4%) |
| Graduate Degree | 47 (90.4%) | 5 (9.6%) |
| Total | 844 (43.6%) | 1,091 (56.4%) |
Employment Characteristics in Lowell
Employment by Class of Employer in Lowell
Among the 57,460 employed individuals in Lowell, private company employees (42,587 | 74.1%), not-for-profit organizations (4,607 | 8.0%), and local government employees (3,022 | 5.3%) make up the most common classes of employment.
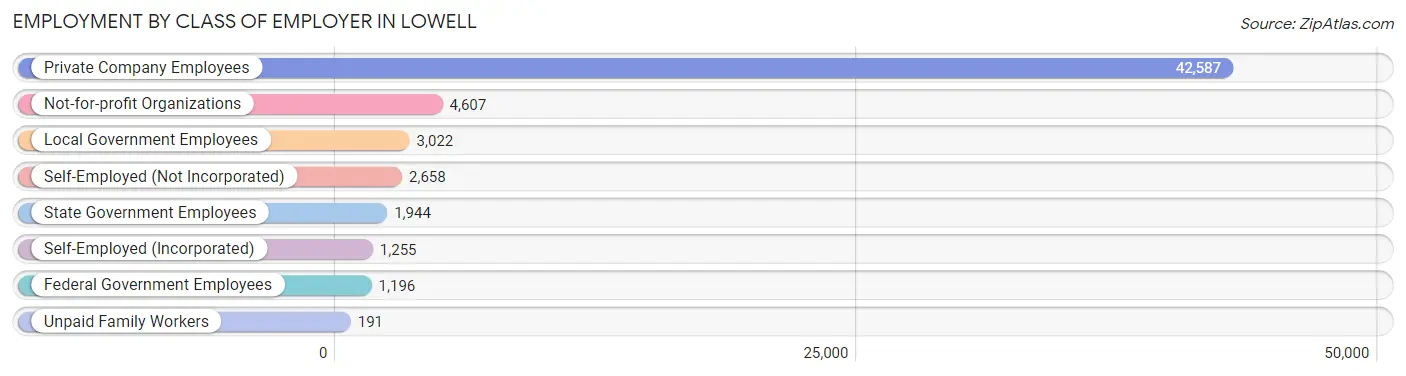
| Employer Class | # Employees | % Employees |
| Private Company Employees | 42,587 | 74.1% |
| Self-Employed (Incorporated) | 1,255 | 2.2% |
| Self-Employed (Not Incorporated) | 2,658 | 4.6% |
| Not-for-profit Organizations | 4,607 | 8.0% |
| Local Government Employees | 3,022 | 5.3% |
| State Government Employees | 1,944 | 3.4% |
| Federal Government Employees | 1,196 | 2.1% |
| Unpaid Family Workers | 191 | 0.3% |
| Total | 57,460 | 100.0% |
Employment Status by Age in Lowell
According to the labor force statistics for Lowell, out of the total population over 16 years of age (93,090), 67.3% or 62,650 individuals are in the labor force, with 5.7% or 3,571 of them unemployed. The age group with the highest labor force participation rate is 35 to 44 years, with 86.0% or 13,335 individuals in the labor force. Within the labor force, the 16 to 19 years age range has the highest percentage of unemployed individuals, with 12.3% or 365 of them being unemployed.
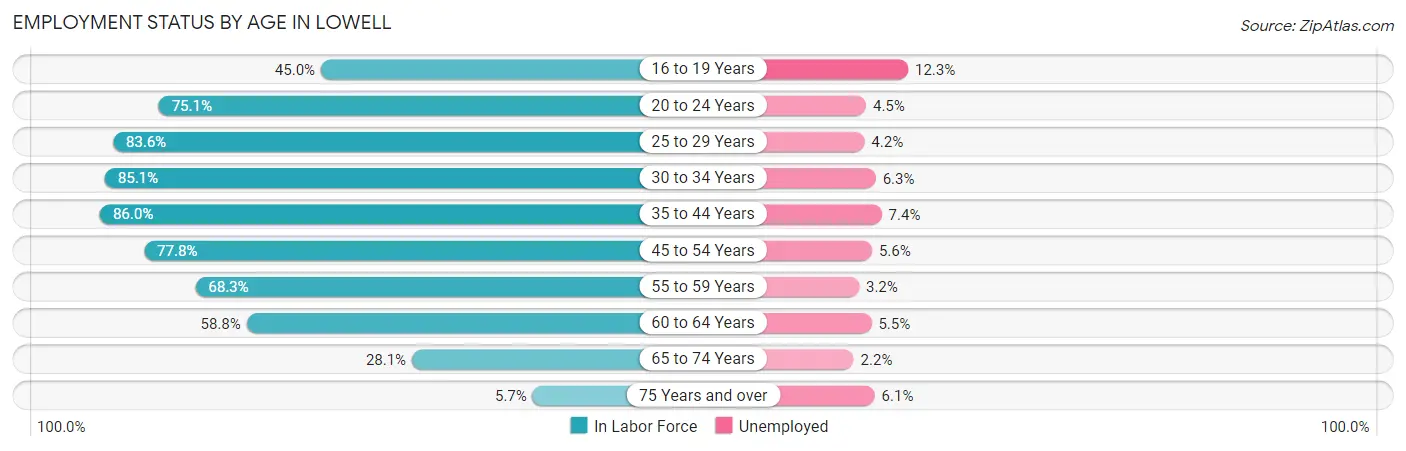
| Age Bracket | In Labor Force | Unemployed |
| 16 to 19 Years | 2,968 (45.0%) | 365 (12.3%) |
| 20 to 24 Years | 8,154 (75.1%) | 367 (4.5%) |
| 25 to 29 Years | 8,065 (83.6%) | 339 (4.2%) |
| 30 to 34 Years | 7,862 (85.1%) | 495 (6.3%) |
| 35 to 44 Years | 13,335 (86.0%) | 987 (7.4%) |
| 45 to 54 Years | 10,199 (77.8%) | 571 (5.6%) |
| 55 to 59 Years | 5,133 (68.3%) | 164 (3.2%) |
| 60 to 64 Years | 4,304 (58.8%) | 237 (5.5%) |
| 65 to 74 Years | 2,376 (28.1%) | 52 (2.2%) |
| 75 Years and over | 276 (5.7%) | 17 (6.1%) |
| Total | 62,650 (67.3%) | 3,571 (5.7%) |
Employment Status by Educational Attainment in Lowell
According to labor force statistics for Lowell, 78.4% of individuals (48,871) out of the total population between 25 and 64 years of age (62,335) are in the labor force, with 5.7% or 2,786 of them being unemployed. The group with the highest labor force participation rate are those with the educational attainment of bachelor's degree or higher, with 90.1% or 16,686 individuals in the labor force. Within the labor force, individuals with less than high school education have the highest percentage of unemployment, with 12.5% or 673 of them being unemployed.
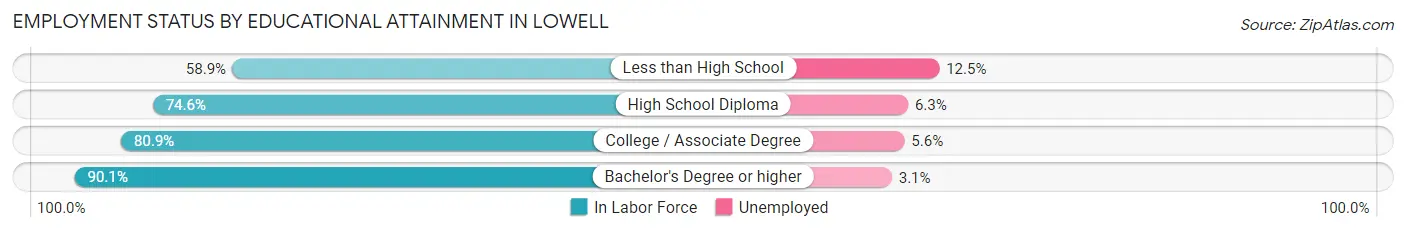
| Educational Attainment | In Labor Force | Unemployed |
| Less than High School | 5,384 (58.9%) | 1,143 (12.5%) |
| High School Diploma | 14,462 (74.6%) | 1,221 (6.3%) |
| College / Associate Degree | 12,369 (80.9%) | 856 (5.6%) |
| Bachelor's Degree or higher | 16,686 (90.1%) | 574 (3.1%) |
| Total | 48,871 (78.4%) | 3,553 (5.7%) |
Employment Occupations by Sex in Lowell
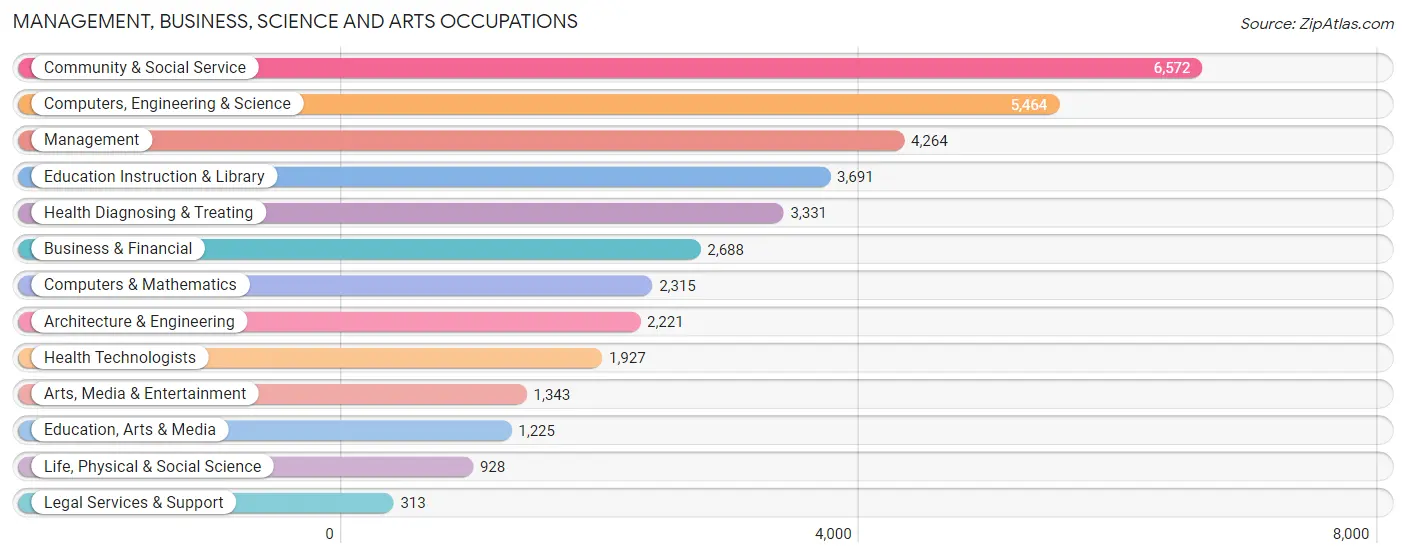
Management, Business, Science and Arts Occupations
The most common Management, Business, Science and Arts occupations in Lowell are Community & Social Service (6,572 | 11.1%), Computers, Engineering & Science (5,464 | 9.3%), Management (4,264 | 7.2%), Education Instruction & Library (3,691 | 6.2%), and Health Diagnosing & Treating (3,331 | 5.6%).
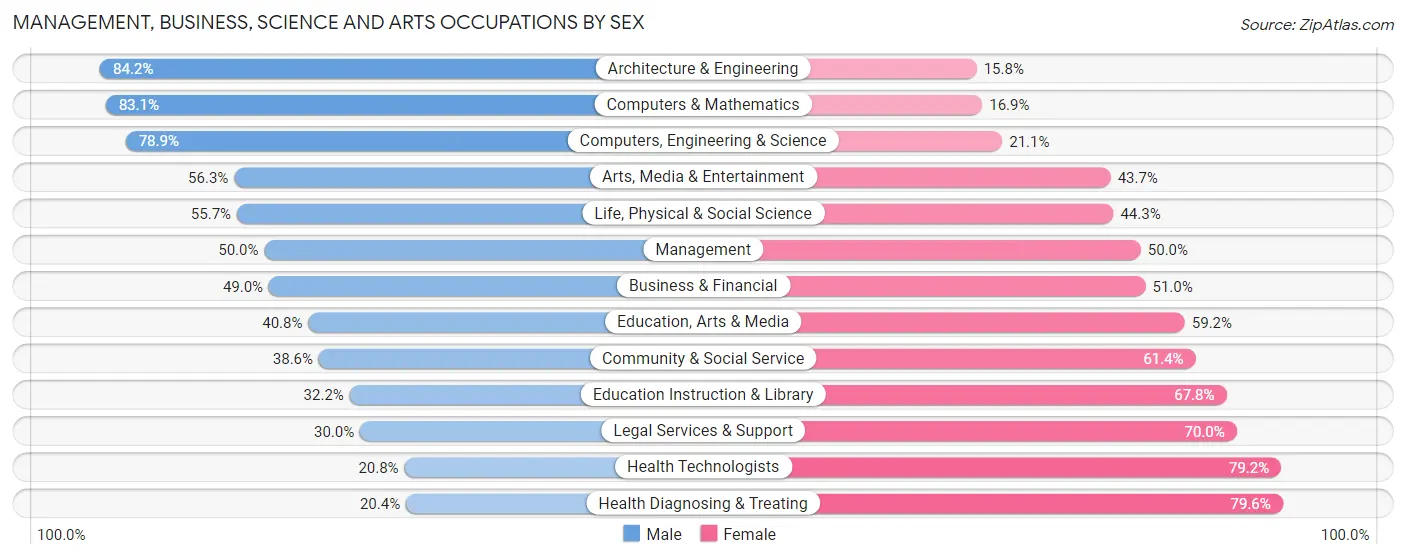
Management, Business, Science and Arts Occupations by Sex
Within the Management, Business, Science and Arts occupations in Lowell, the most male-oriented occupations are Architecture & Engineering (84.2%), Computers & Mathematics (83.1%), and Computers, Engineering & Science (78.9%), while the most female-oriented occupations are Health Diagnosing & Treating (79.6%), Health Technologists (79.2%), and Legal Services & Support (70.0%).
| Occupation | Male | Female |
| Management | 2,132 (50.0%) | 2,132 (50.0%) |
| Business & Financial | 1,318 (49.0%) | 1,370 (51.0%) |
| Computers, Engineering & Science | 4,311 (78.9%) | 1,153 (21.1%) |
| Computers & Mathematics | 1,923 (83.1%) | 392 (16.9%) |
| Architecture & Engineering | 1,871 (84.2%) | 350 (15.8%) |
| Life, Physical & Social Science | 517 (55.7%) | 411 (44.3%) |
| Community & Social Service | 2,538 (38.6%) | 4,034 (61.4%) |
| Education, Arts & Media | 500 (40.8%) | 725 (59.2%) |
| Legal Services & Support | 94 (30.0%) | 219 (70.0%) |
| Education Instruction & Library | 1,188 (32.2%) | 2,503 (67.8%) |
| Arts, Media & Entertainment | 756 (56.3%) | 587 (43.7%) |
| Health Diagnosing & Treating | 681 (20.4%) | 2,650 (79.6%) |
| Health Technologists | 400 (20.8%) | 1,527 (79.2%) |
| Total (Category) | 10,980 (49.2%) | 11,339 (50.8%) |
| Total (Overall) | 30,609 (51.9%) | 28,418 (48.1%) |
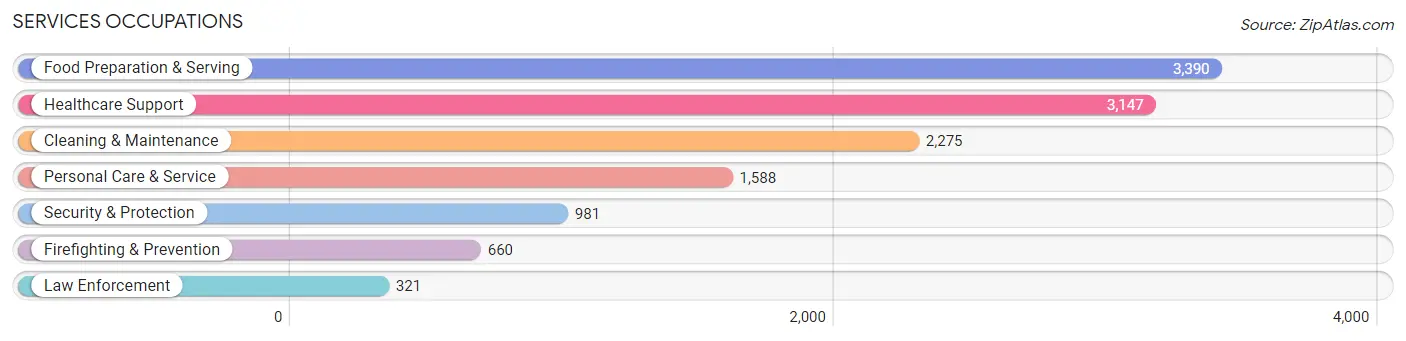
Services Occupations
The most common Services occupations in Lowell are Food Preparation & Serving (3,390 | 5.7%), Healthcare Support (3,147 | 5.3%), Cleaning & Maintenance (2,275 | 3.8%), Personal Care & Service (1,588 | 2.7%), and Security & Protection (981 | 1.7%).
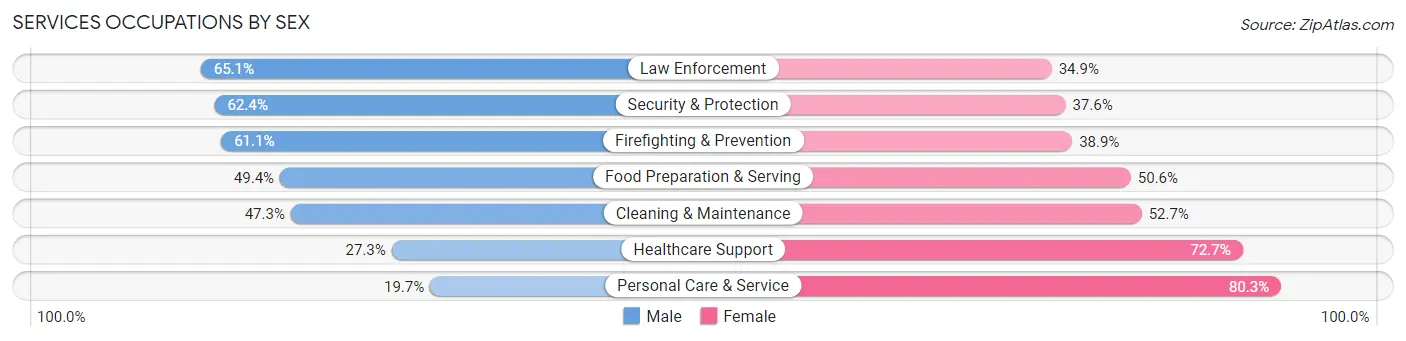
Services Occupations by Sex
Within the Services occupations in Lowell, the most male-oriented occupations are Law Enforcement (65.1%), Security & Protection (62.4%), and Firefighting & Prevention (61.1%), while the most female-oriented occupations are Personal Care & Service (80.3%), Healthcare Support (72.7%), and Cleaning & Maintenance (52.7%).
| Occupation | Male | Female |
| Healthcare Support | 860 (27.3%) | 2,287 (72.7%) |
| Security & Protection | 612 (62.4%) | 369 (37.6%) |
| Firefighting & Prevention | 403 (61.1%) | 257 (38.9%) |
| Law Enforcement | 209 (65.1%) | 112 (34.9%) |
| Food Preparation & Serving | 1,676 (49.4%) | 1,714 (50.6%) |
| Cleaning & Maintenance | 1,076 (47.3%) | 1,199 (52.7%) |
| Personal Care & Service | 313 (19.7%) | 1,275 (80.3%) |
| Total (Category) | 4,537 (39.9%) | 6,844 (60.1%) |
| Total (Overall) | 30,609 (51.9%) | 28,418 (48.1%) |
Sales and Office Occupations
The most common Sales and Office occupations in Lowell are Office & Administration (5,443 | 9.2%), and Sales & Related (4,567 | 7.7%).

Sales and Office Occupations by Sex
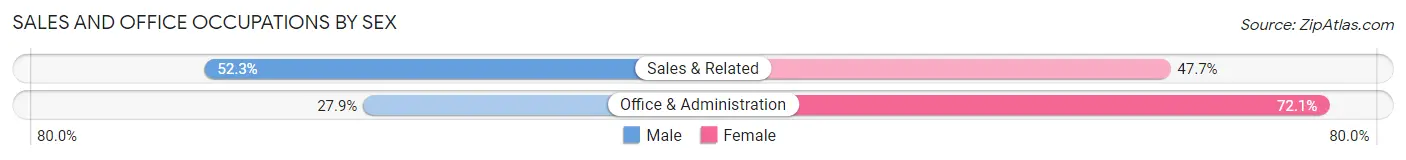
| Occupation | Male | Female |
| Sales & Related | 2,390 (52.3%) | 2,177 (47.7%) |
| Office & Administration | 1,519 (27.9%) | 3,924 (72.1%) |
| Total (Category) | 3,909 (39.1%) | 6,101 (61.0%) |
| Total (Overall) | 30,609 (51.9%) | 28,418 (48.1%) |
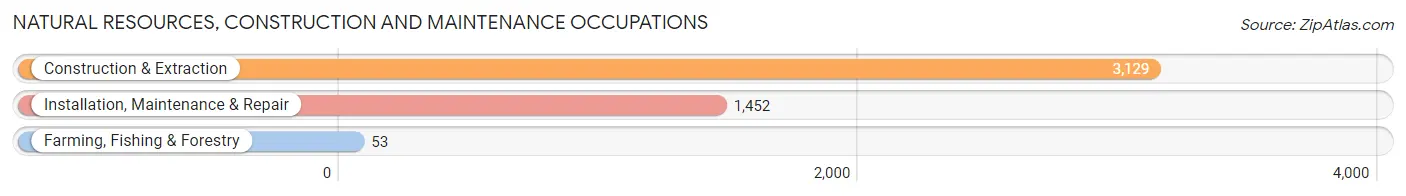
Natural Resources, Construction and Maintenance Occupations
The most common Natural Resources, Construction and Maintenance occupations in Lowell are Construction & Extraction (3,129 | 5.3%), Installation, Maintenance & Repair (1,452 | 2.5%), and Farming, Fishing & Forestry (53 | 0.1%).
Natural Resources, Construction and Maintenance Occupations by Sex
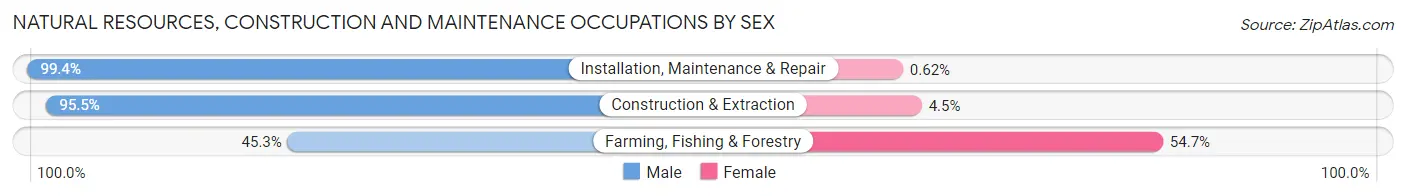
| Occupation | Male | Female |
| Farming, Fishing & Forestry | 24 (45.3%) | 29 (54.7%) |
| Construction & Extraction | 2,987 (95.5%) | 142 (4.5%) |
| Installation, Maintenance & Repair | 1,443 (99.4%) | 9 (0.6%) |
| Total (Category) | 4,454 (96.1%) | 180 (3.9%) |
| Total (Overall) | 30,609 (51.9%) | 28,418 (48.1%) |
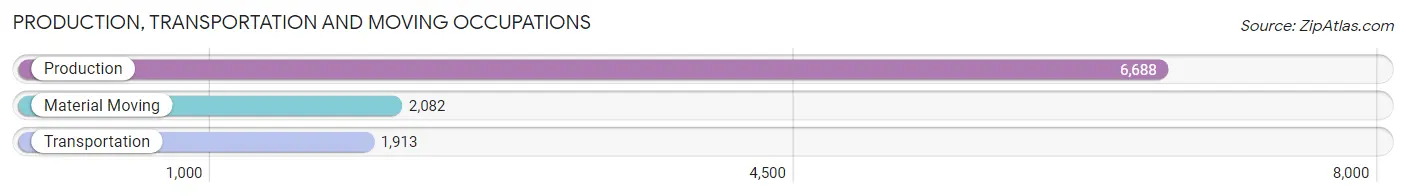
Production, Transportation and Moving Occupations
The most common Production, Transportation and Moving occupations in Lowell are Production (6,688 | 11.3%), Material Moving (2,082 | 3.5%), and Transportation (1,913 | 3.2%).
Production, Transportation and Moving Occupations by Sex
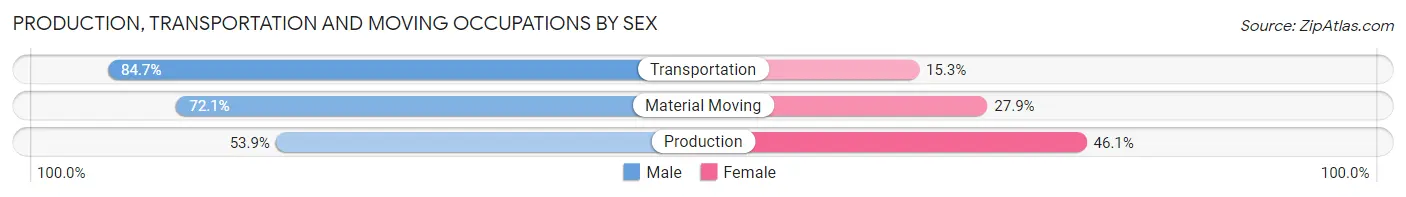
| Occupation | Male | Female |
| Production | 3,607 (53.9%) | 3,081 (46.1%) |
| Transportation | 1,620 (84.7%) | 293 (15.3%) |
| Material Moving | 1,502 (72.1%) | 580 (27.9%) |
| Total (Category) | 6,729 (63.0%) | 3,954 (37.0%) |
| Total (Overall) | 30,609 (51.9%) | 28,418 (48.1%) |
Employment Industries by Sex in Lowell
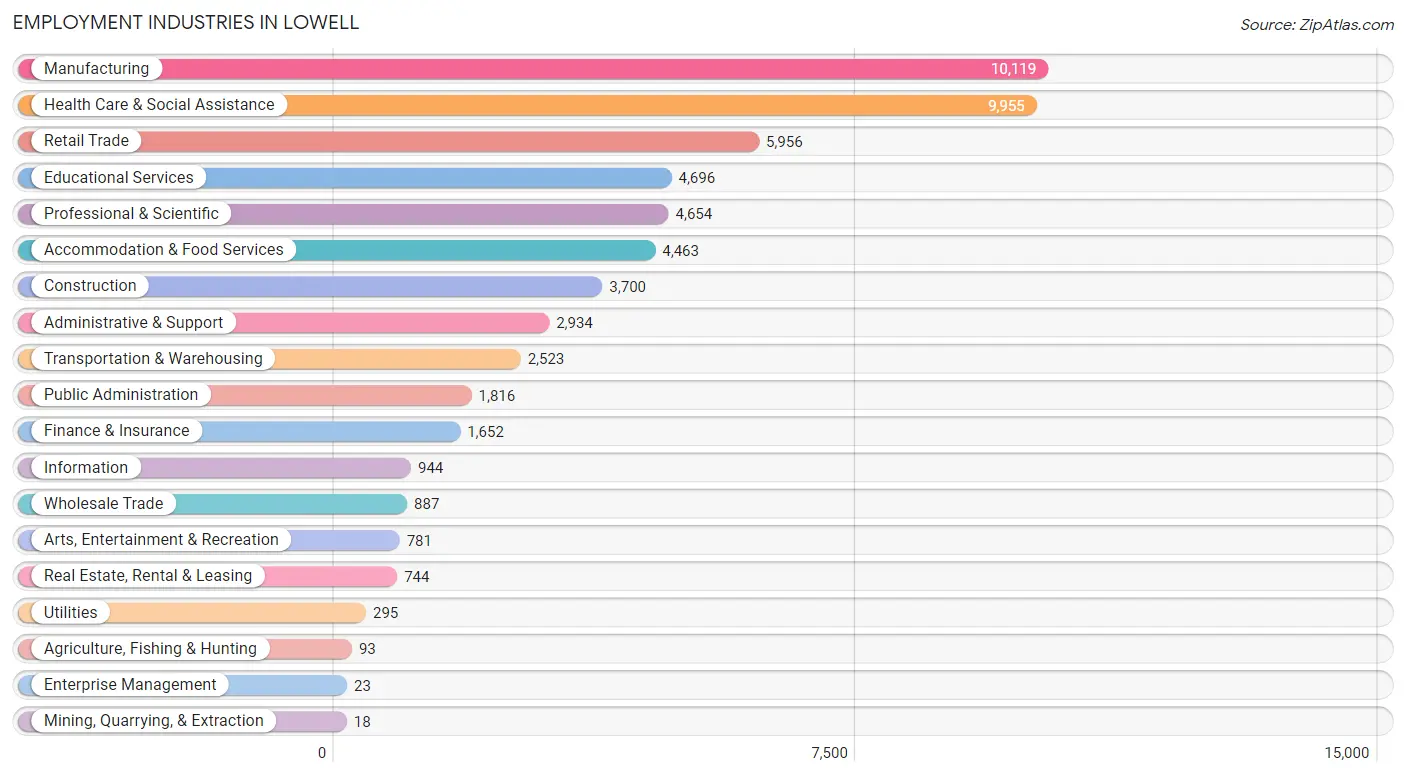
Employment Industries in Lowell
The major employment industries in Lowell include Manufacturing (10,119 | 17.1%), Health Care & Social Assistance (9,955 | 16.9%), Retail Trade (5,956 | 10.1%), Educational Services (4,696 | 8.0%), and Professional & Scientific (4,654 | 7.9%).
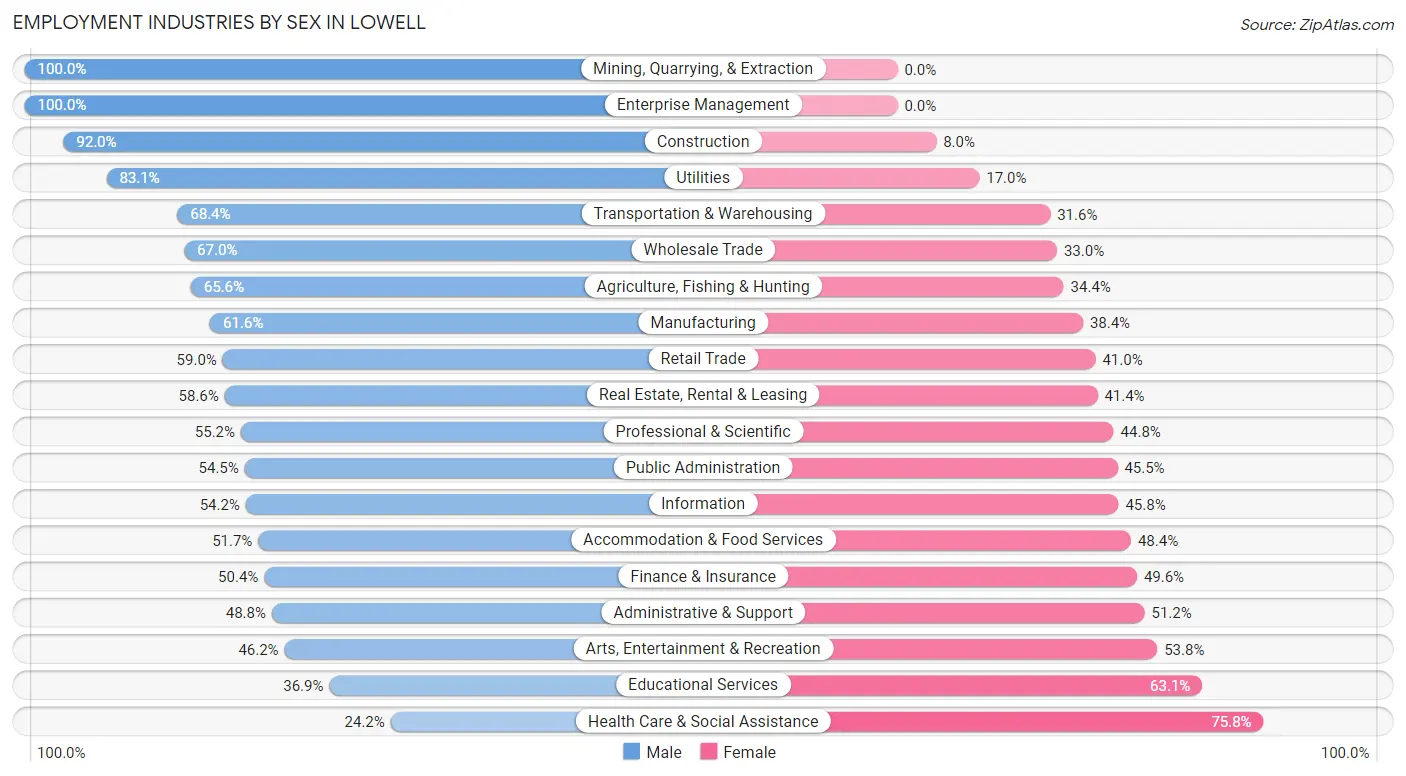
Employment Industries by Sex in Lowell
The Lowell industries that see more men than women are Mining, Quarrying, & Extraction (100.0%), Enterprise Management (100.0%), and Construction (92.0%), whereas the industries that tend to have a higher number of women are Health Care & Social Assistance (75.8%), Educational Services (63.1%), and Arts, Entertainment & Recreation (53.8%).
| Industry | Male | Female |
| Agriculture, Fishing & Hunting | 61 (65.6%) | 32 (34.4%) |
| Mining, Quarrying, & Extraction | 18 (100.0%) | 0 (0.0%) |
| Construction | 3,403 (92.0%) | 297 (8.0%) |
| Manufacturing | 6,233 (61.6%) | 3,886 (38.4%) |
| Wholesale Trade | 594 (67.0%) | 293 (33.0%) |
| Retail Trade | 3,514 (59.0%) | 2,442 (41.0%) |
| Transportation & Warehousing | 1,725 (68.4%) | 798 (31.6%) |
| Utilities | 245 (83.1%) | 50 (17.0%) |
| Information | 512 (54.2%) | 432 (45.8%) |
| Finance & Insurance | 833 (50.4%) | 819 (49.6%) |
| Real Estate, Rental & Leasing | 436 (58.6%) | 308 (41.4%) |
| Professional & Scientific | 2,571 (55.2%) | 2,083 (44.8%) |
| Enterprise Management | 23 (100.0%) | 0 (0.0%) |
| Administrative & Support | 1,433 (48.8%) | 1,501 (51.2%) |
| Educational Services | 1,734 (36.9%) | 2,962 (63.1%) |
| Health Care & Social Assistance | 2,413 (24.2%) | 7,542 (75.8%) |
| Arts, Entertainment & Recreation | 361 (46.2%) | 420 (53.8%) |
| Accommodation & Food Services | 2,305 (51.6%) | 2,158 (48.3%) |
| Public Administration | 989 (54.5%) | 827 (45.5%) |
| Total | 30,609 (51.9%) | 28,418 (48.1%) |
Education in Lowell
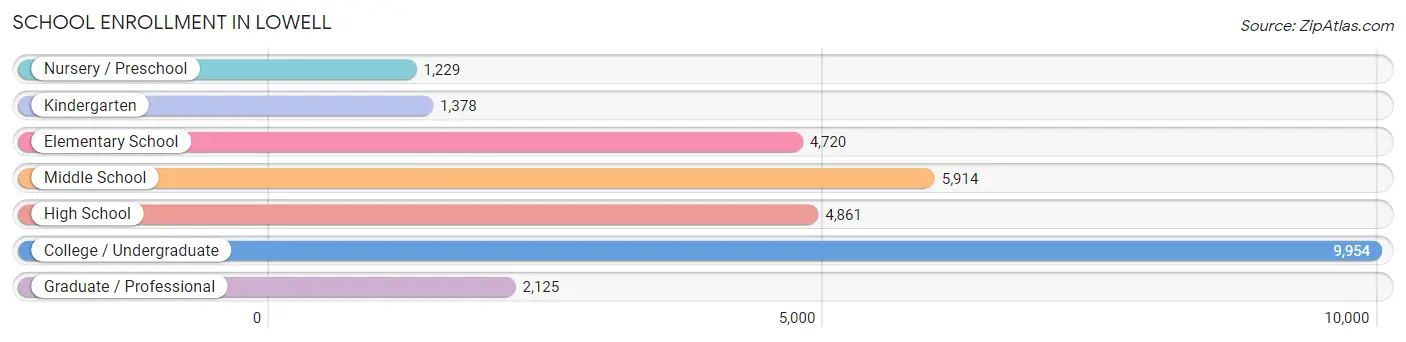
School Enrollment in Lowell
The most common levels of schooling among the 30,181 students in Lowell are college / undergraduate (9,954 | 33.0%), middle school (5,914 | 19.6%), and high school (4,861 | 16.1%).
| School Level | # Students | % Students |
| Nursery / Preschool | 1,229 | 4.1% |
| Kindergarten | 1,378 | 4.6% |
| Elementary School | 4,720 | 15.6% |
| Middle School | 5,914 | 19.6% |
| High School | 4,861 | 16.1% |
| College / Undergraduate | 9,954 | 33.0% |
| Graduate / Professional | 2,125 | 7.0% |
| Total | 30,181 | 100.0% |
School Enrollment by Age by Funding Source in Lowell
Out of a total of 30,181 students who are enrolled in schools in Lowell, 5,282 (17.5%) attend a private institution, while the remaining 24,899 (82.5%) are enrolled in public schools. The age group of 35 years and over has the highest likelihood of being enrolled in private schools, with 505 (35.4% in the age bracket) enrolled. Conversely, the age group of 10 to 14 year olds has the lowest likelihood of being enrolled in a private school, with 6,652 (92.4% in the age bracket) attending a public institution.
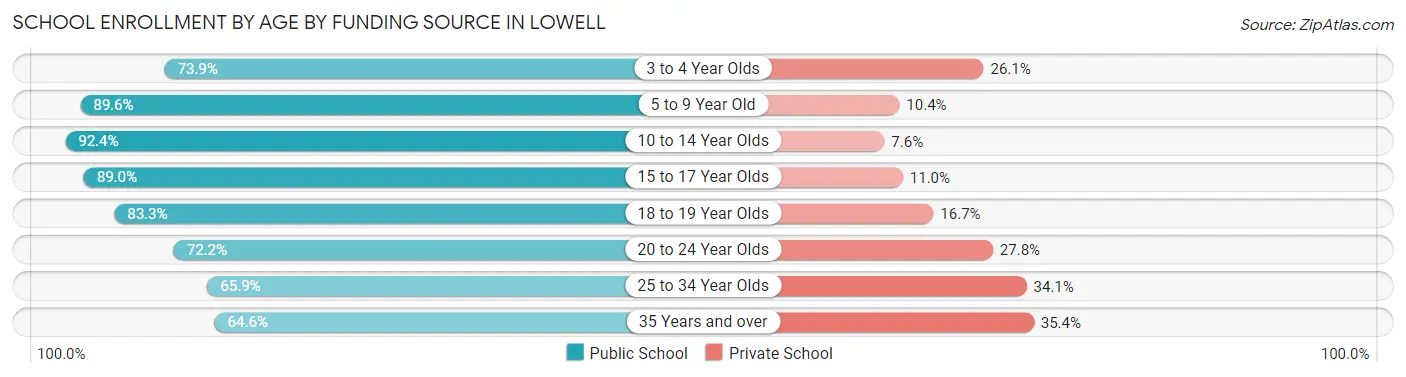
| Age Bracket | Public School | Private School |
| 3 to 4 Year Olds | 803 (73.9%) | 283 (26.1%) |
| 5 to 9 Year Old | 5,120 (89.6%) | 593 (10.4%) |
| 10 to 14 Year Olds | 6,652 (92.4%) | 546 (7.6%) |
| 15 to 17 Year Olds | 2,848 (89.0%) | 353 (11.0%) |
| 18 to 19 Year Olds | 2,936 (83.3%) | 589 (16.7%) |
| 20 to 24 Year Olds | 3,874 (72.2%) | 1,492 (27.8%) |
| 25 to 34 Year Olds | 1,758 (65.9%) | 908 (34.1%) |
| 35 Years and over | 921 (64.6%) | 505 (35.4%) |
| Total | 24,899 (82.5%) | 5,282 (17.5%) |
Educational Attainment by Field of Study in Lowell
Business (4,247 | 18.3%), engineering (2,514 | 10.9%), education (2,159 | 9.3%), social sciences (1,869 | 8.1%), and science & technology (1,750 | 7.6%) are the most common fields of study among 23,139 individuals in Lowell who have obtained a bachelor's degree or higher.
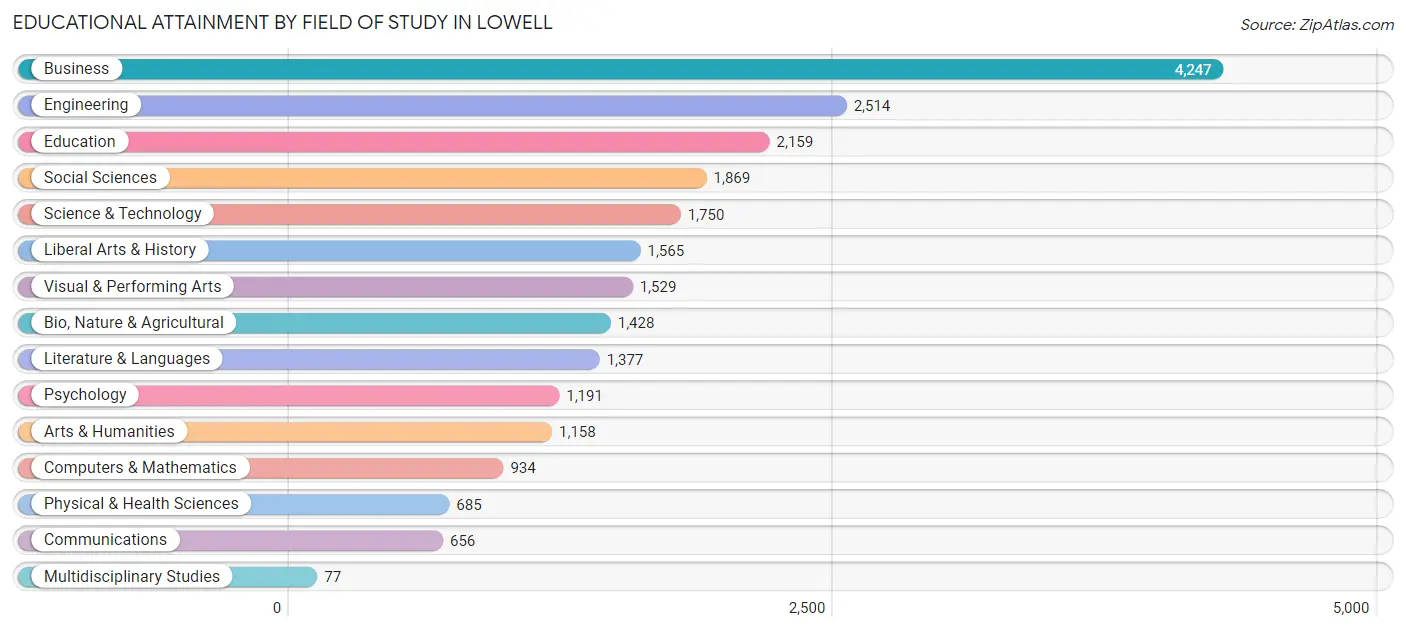
| Field of Study | # Graduates | % Graduates |
| Computers & Mathematics | 934 | 4.0% |
| Bio, Nature & Agricultural | 1,428 | 6.2% |
| Physical & Health Sciences | 685 | 3.0% |
| Psychology | 1,191 | 5.1% |
| Social Sciences | 1,869 | 8.1% |
| Engineering | 2,514 | 10.9% |
| Multidisciplinary Studies | 77 | 0.3% |
| Science & Technology | 1,750 | 7.6% |
| Business | 4,247 | 18.3% |
| Education | 2,159 | 9.3% |
| Literature & Languages | 1,377 | 5.9% |
| Liberal Arts & History | 1,565 | 6.8% |
| Visual & Performing Arts | 1,529 | 6.6% |
| Communications | 656 | 2.8% |
| Arts & Humanities | 1,158 | 5.0% |
| Total | 23,139 | 100.0% |
Transportation & Commute in Lowell
Vehicle Availability by Sex in Lowell
The most prevalent vehicle ownership categories in Lowell are males with 2 vehicles (11,270, accounting for 38.5%) and females with 2 vehicles (10,240, making up 42.0%).
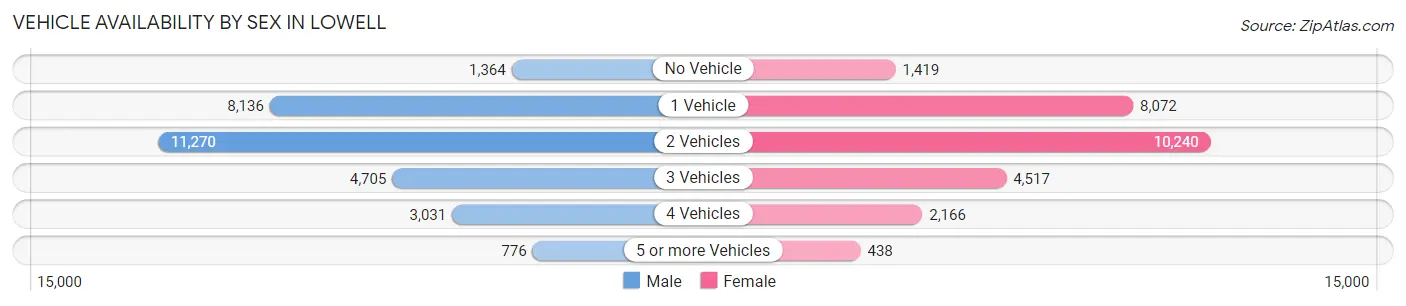
| Vehicles Available | Male | Female |
| No Vehicle | 1,364 (4.7%) | 1,419 (5.3%) |
| 1 Vehicle | 8,136 (27.8%) | 8,072 (30.1%) |
| 2 Vehicles | 11,270 (38.5%) | 10,240 (38.1%) |
| 3 Vehicles | 4,705 (16.1%) | 4,517 (16.8%) |
| 4 Vehicles | 3,031 (10.3%) | 2,166 (8.1%) |
| 5 or more Vehicles | 776 (2.6%) | 438 (1.6%) |
| Total | 29,282 (100.0%) | 26,852 (100.0%) |
Commute Time in Lowell
The most frequently occuring commute durations in Lowell are 30 to 34 minutes (8,451 commuters, 16.1%), 20 to 24 minutes (7,741 commuters, 14.8%), and 15 to 19 minutes (7,699 commuters, 14.7%).
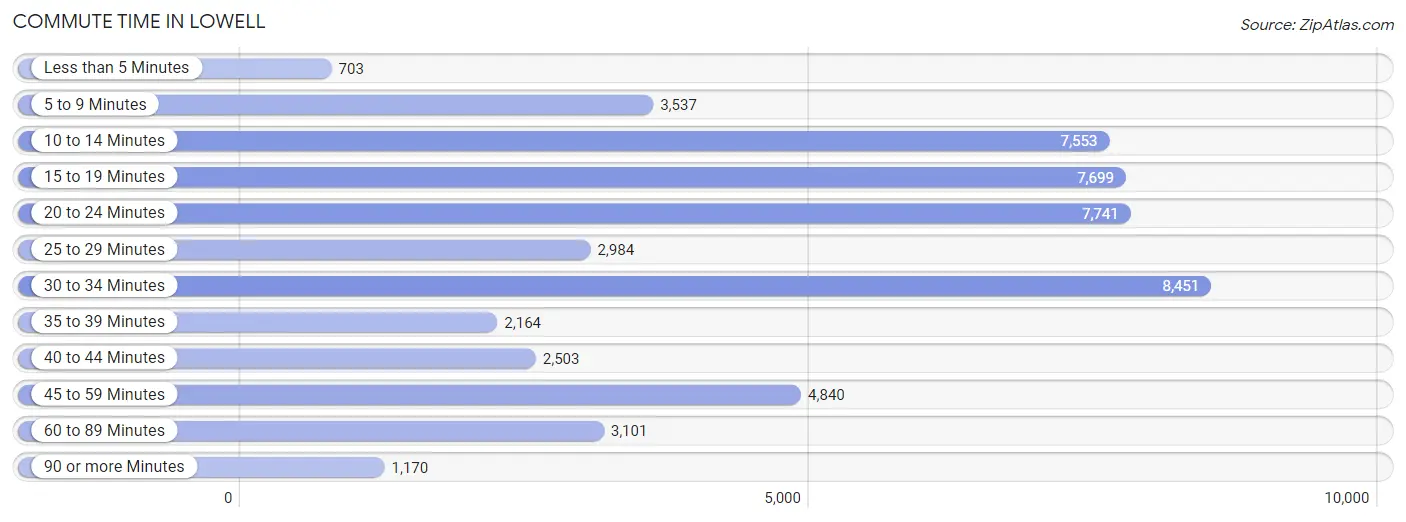
| Commute Time | # Commuters | % Commuters |
| Less than 5 Minutes | 703 | 1.3% |
| 5 to 9 Minutes | 3,537 | 6.7% |
| 10 to 14 Minutes | 7,553 | 14.4% |
| 15 to 19 Minutes | 7,699 | 14.7% |
| 20 to 24 Minutes | 7,741 | 14.8% |
| 25 to 29 Minutes | 2,984 | 5.7% |
| 30 to 34 Minutes | 8,451 | 16.1% |
| 35 to 39 Minutes | 2,164 | 4.1% |
| 40 to 44 Minutes | 2,503 | 4.8% |
| 45 to 59 Minutes | 4,840 | 9.2% |
| 60 to 89 Minutes | 3,101 | 5.9% |
| 90 or more Minutes | 1,170 | 2.2% |
Commute Time by Sex in Lowell
The most common commute times in Lowell are 30 to 34 minutes (4,970 commuters, 17.9%) for males and 15 to 19 minutes (4,257 commuters, 17.2%) for females.
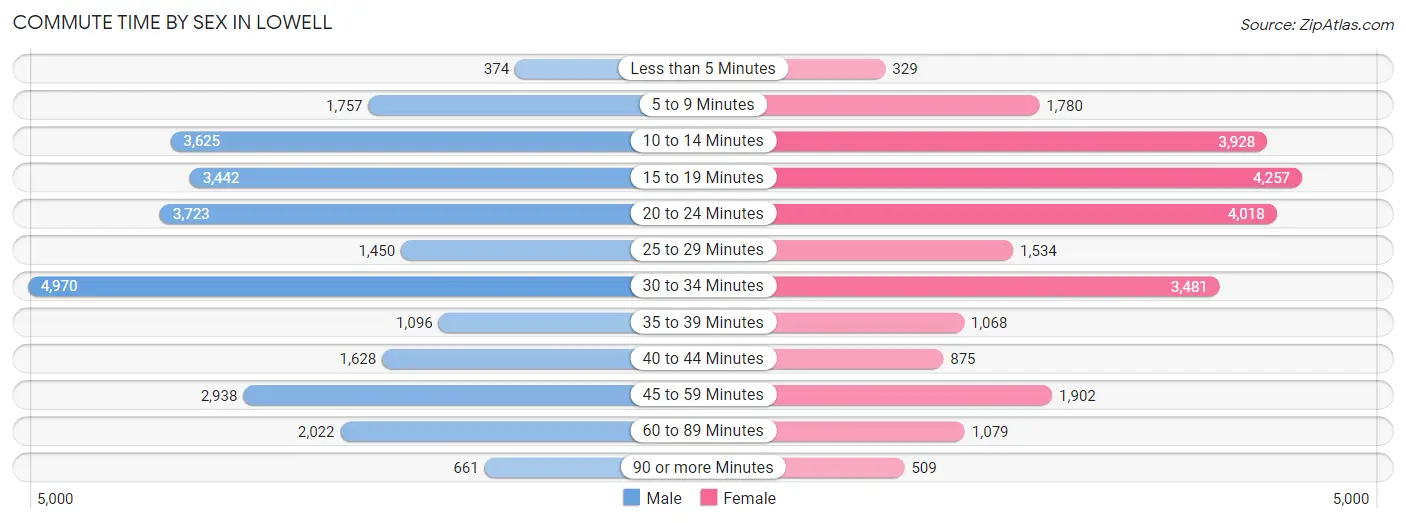
| Commute Time | Male | Female |
| Less than 5 Minutes | 374 (1.3%) | 329 (1.3%) |
| 5 to 9 Minutes | 1,757 (6.4%) | 1,780 (7.2%) |
| 10 to 14 Minutes | 3,625 (13.1%) | 3,928 (15.9%) |
| 15 to 19 Minutes | 3,442 (12.4%) | 4,257 (17.2%) |
| 20 to 24 Minutes | 3,723 (13.5%) | 4,018 (16.2%) |
| 25 to 29 Minutes | 1,450 (5.2%) | 1,534 (6.2%) |
| 30 to 34 Minutes | 4,970 (17.9%) | 3,481 (14.1%) |
| 35 to 39 Minutes | 1,096 (4.0%) | 1,068 (4.3%) |
| 40 to 44 Minutes | 1,628 (5.9%) | 875 (3.5%) |
| 45 to 59 Minutes | 2,938 (10.6%) | 1,902 (7.7%) |
| 60 to 89 Minutes | 2,022 (7.3%) | 1,079 (4.4%) |
| 90 or more Minutes | 661 (2.4%) | 509 (2.1%) |
Time of Departure to Work by Sex in Lowell
The most frequent times of departure to work in Lowell are 7:00 AM to 7:29 AM (3,807, 13.8%) for males and 7:00 AM to 7:29 AM (3,339, 13.5%) for females.
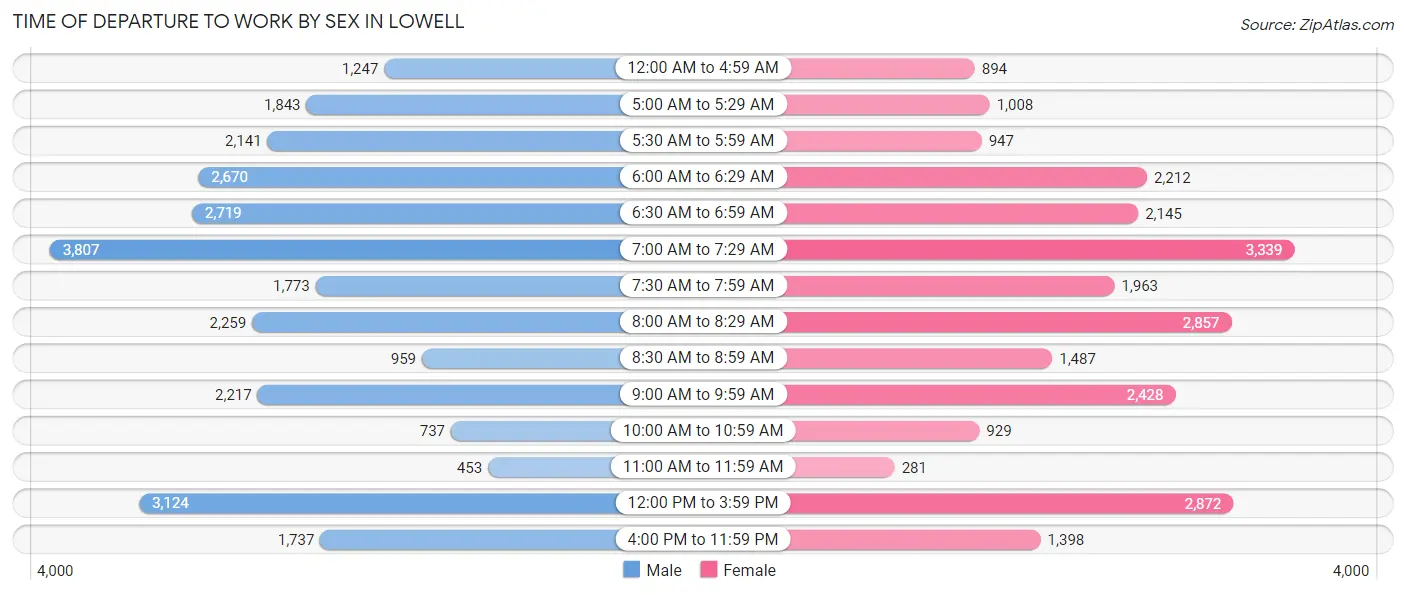
| Time of Departure | Male | Female |
| 12:00 AM to 4:59 AM | 1,247 (4.5%) | 894 (3.6%) |
| 5:00 AM to 5:29 AM | 1,843 (6.7%) | 1,008 (4.1%) |
| 5:30 AM to 5:59 AM | 2,141 (7.7%) | 947 (3.8%) |
| 6:00 AM to 6:29 AM | 2,670 (9.6%) | 2,212 (8.9%) |
| 6:30 AM to 6:59 AM | 2,719 (9.8%) | 2,145 (8.7%) |
| 7:00 AM to 7:29 AM | 3,807 (13.8%) | 3,339 (13.5%) |
| 7:30 AM to 7:59 AM | 1,773 (6.4%) | 1,963 (7.9%) |
| 8:00 AM to 8:29 AM | 2,259 (8.2%) | 2,857 (11.5%) |
| 8:30 AM to 8:59 AM | 959 (3.5%) | 1,487 (6.0%) |
| 9:00 AM to 9:59 AM | 2,217 (8.0%) | 2,428 (9.8%) |
| 10:00 AM to 10:59 AM | 737 (2.7%) | 929 (3.7%) |
| 11:00 AM to 11:59 AM | 453 (1.6%) | 281 (1.1%) |
| 12:00 PM to 3:59 PM | 3,124 (11.3%) | 2,872 (11.6%) |
| 4:00 PM to 11:59 PM | 1,737 (6.3%) | 1,398 (5.7%) |
| Total | 27,686 (100.0%) | 24,760 (100.0%) |
Housing Occupancy in Lowell
Occupancy by Ownership in Lowell
Of the total 42,343 dwellings in Lowell, owner-occupied units account for 18,352 (43.3%), while renter-occupied units make up 23,991 (56.7%).
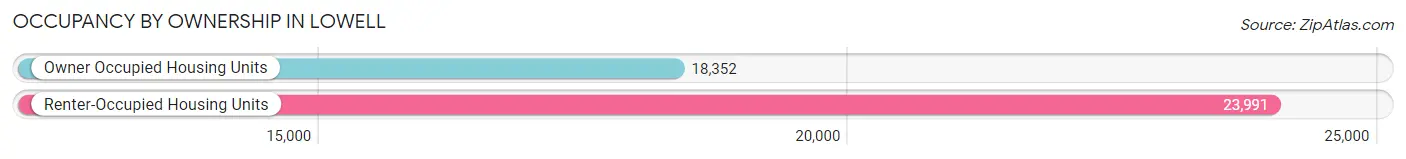
| Occupancy | # Housing Units | % Housing Units |
| Owner Occupied Housing Units | 18,352 | 43.3% |
| Renter-Occupied Housing Units | 23,991 | 56.7% |
| Total Occupied Housing Units | 42,343 | 100.0% |
Occupancy by Household Size in Lowell
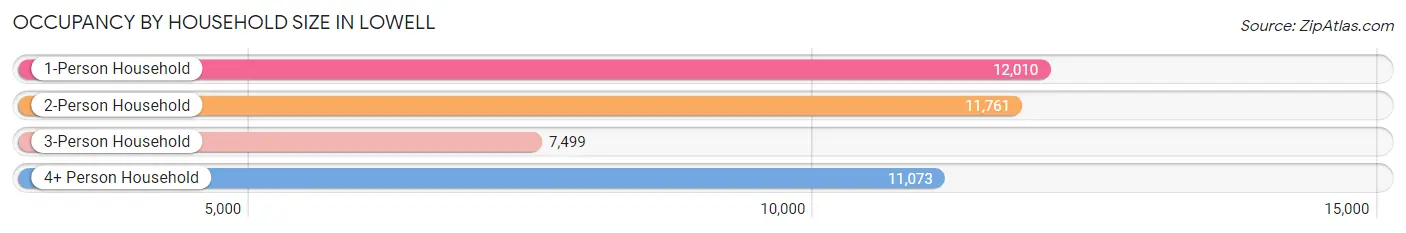
| Household Size | # Housing Units | % Housing Units |
| 1-Person Household | 12,010 | 28.4% |
| 2-Person Household | 11,761 | 27.8% |
| 3-Person Household | 7,499 | 17.7% |
| 4+ Person Household | 11,073 | 26.2% |
| Total Housing Units | 42,343 | 100.0% |
Occupancy by Ownership by Household Size in Lowell
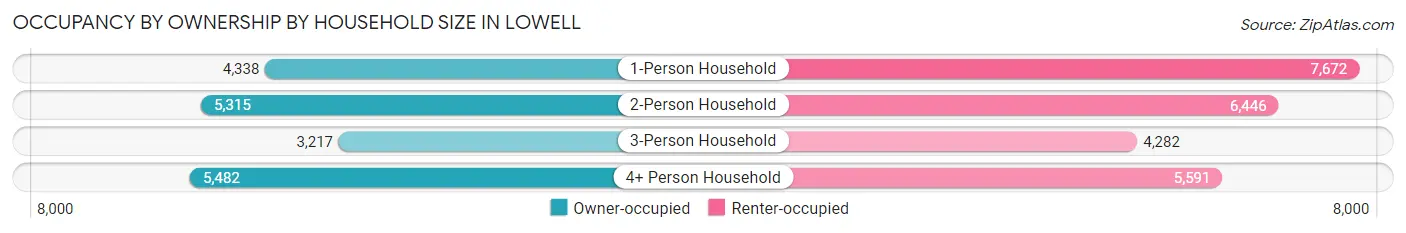
| Household Size | Owner-occupied | Renter-occupied |
| 1-Person Household | 4,338 (36.1%) | 7,672 (63.9%) |
| 2-Person Household | 5,315 (45.2%) | 6,446 (54.8%) |
| 3-Person Household | 3,217 (42.9%) | 4,282 (57.1%) |
| 4+ Person Household | 5,482 (49.5%) | 5,591 (50.5%) |
| Total Housing Units | 18,352 (43.3%) | 23,991 (56.7%) |
Occupancy by Educational Attainment in Lowell
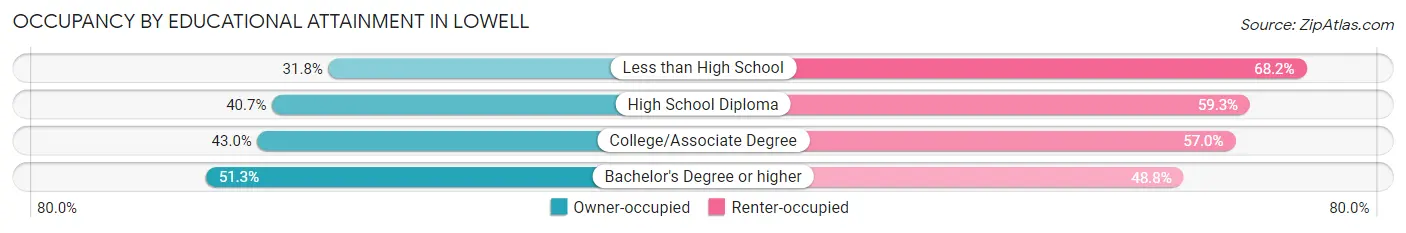
| Household Size | Owner-occupied | Renter-occupied |
| Less than High School | 1,877 (31.8%) | 4,032 (68.2%) |
| High School Diploma | 4,979 (40.7%) | 7,249 (59.3%) |
| College/Associate Degree | 4,765 (43.0%) | 6,308 (57.0%) |
| Bachelor's Degree or higher | 6,731 (51.2%) | 6,402 (48.7%) |
Occupancy by Age of Householder in Lowell
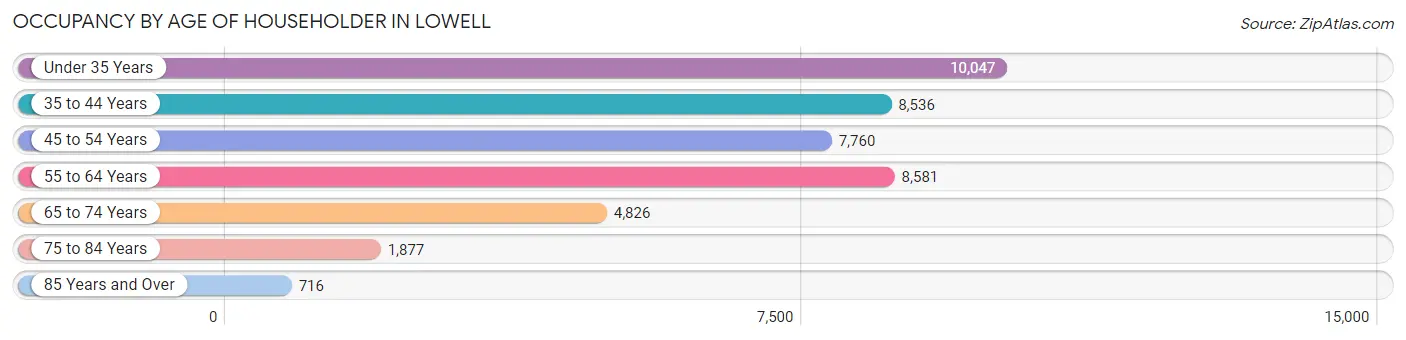
| Age Bracket | # Households | % Households |
| Under 35 Years | 10,047 | 23.7% |
| 35 to 44 Years | 8,536 | 20.2% |
| 45 to 54 Years | 7,760 | 18.3% |
| 55 to 64 Years | 8,581 | 20.3% |
| 65 to 74 Years | 4,826 | 11.4% |
| 75 to 84 Years | 1,877 | 4.4% |
| 85 Years and Over | 716 | 1.7% |
| Total | 42,343 | 100.0% |
Housing Finances in Lowell
Median Income by Occupancy in Lowell
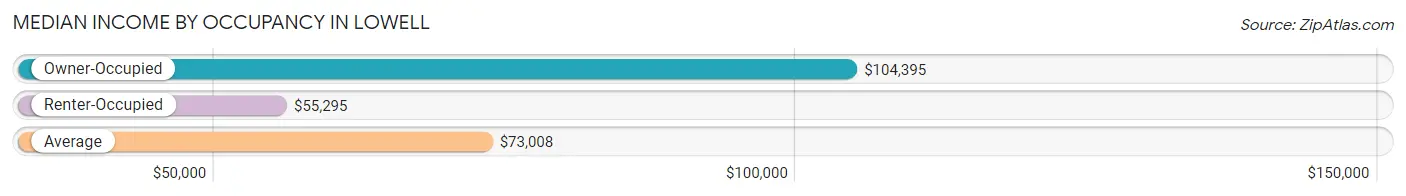
| Occupancy Type | # Households | Median Income |
| Owner-Occupied | 18,352 (43.3%) | $104,395 |
| Renter-Occupied | 23,991 (56.7%) | $55,295 |
| Average | 42,343 (100.0%) | $73,008 |
Occupancy by Householder Income Bracket in Lowell
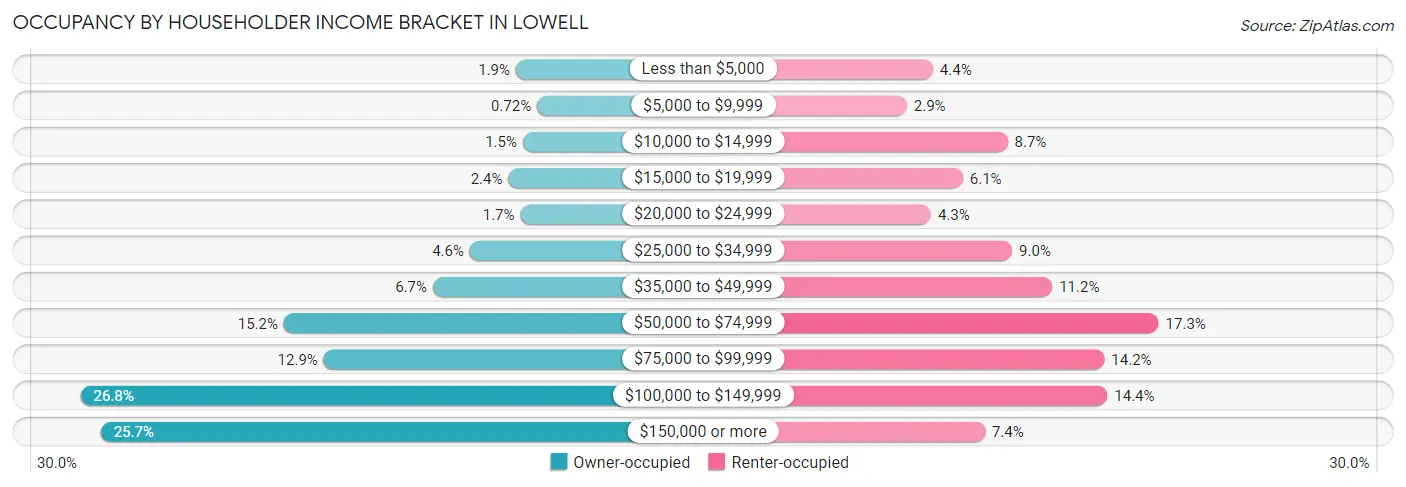
| Income Bracket | Owner-occupied | Renter-occupied |
| Less than $5,000 | 354 (1.9%) | 1,061 (4.4%) |
| $5,000 to $9,999 | 132 (0.7%) | 703 (2.9%) |
| $10,000 to $14,999 | 280 (1.5%) | 2,084 (8.7%) |
| $15,000 to $19,999 | 434 (2.4%) | 1,471 (6.1%) |
| $20,000 to $24,999 | 307 (1.7%) | 1,033 (4.3%) |
| $25,000 to $34,999 | 837 (4.6%) | 2,146 (8.9%) |
| $35,000 to $49,999 | 1,224 (6.7%) | 2,697 (11.2%) |
| $50,000 to $74,999 | 2,788 (15.2%) | 4,156 (17.3%) |
| $75,000 to $99,999 | 2,370 (12.9%) | 3,411 (14.2%) |
| $100,000 to $149,999 | 4,919 (26.8%) | 3,453 (14.4%) |
| $150,000 or more | 4,707 (25.7%) | 1,776 (7.4%) |
| Total | 18,352 (100.0%) | 23,991 (100.0%) |
Monthly Housing Cost Tiers in Lowell
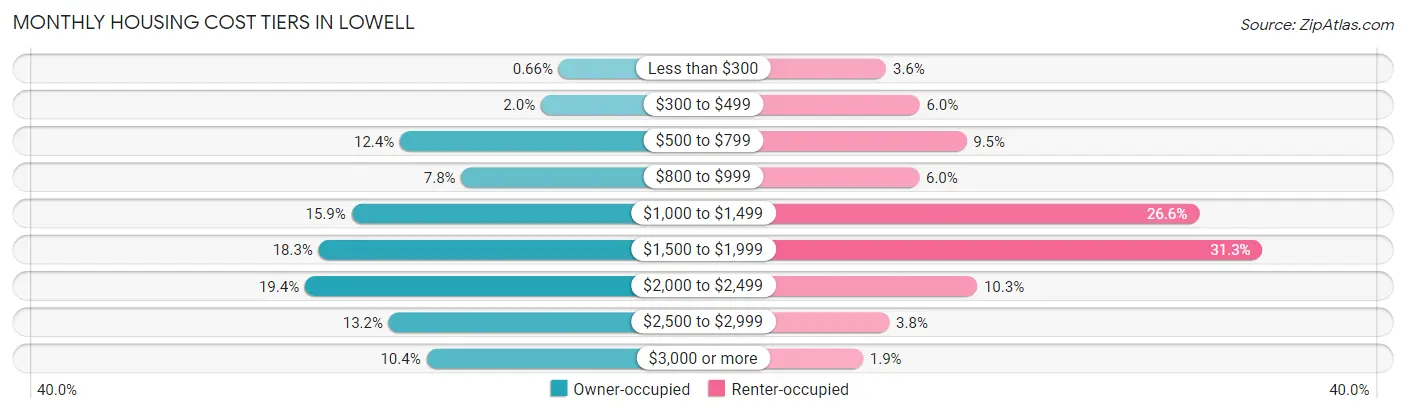
| Monthly Cost | Owner-occupied | Renter-occupied |
| Less than $300 | 121 (0.7%) | 859 (3.6%) |
| $300 to $499 | 361 (2.0%) | 1,448 (6.0%) |
| $500 to $799 | 2,267 (12.3%) | 2,276 (9.5%) |
| $800 to $999 | 1,437 (7.8%) | 1,443 (6.0%) |
| $1,000 to $1,499 | 2,921 (15.9%) | 6,389 (26.6%) |
| $1,500 to $1,999 | 3,366 (18.3%) | 7,510 (31.3%) |
| $2,000 to $2,499 | 3,551 (19.4%) | 2,466 (10.3%) |
| $2,500 to $2,999 | 2,419 (13.2%) | 913 (3.8%) |
| $3,000 or more | 1,909 (10.4%) | 448 (1.9%) |
| Total | 18,352 (100.0%) | 23,991 (100.0%) |
Physical Housing Characteristics in Lowell
Housing Structures in Lowell
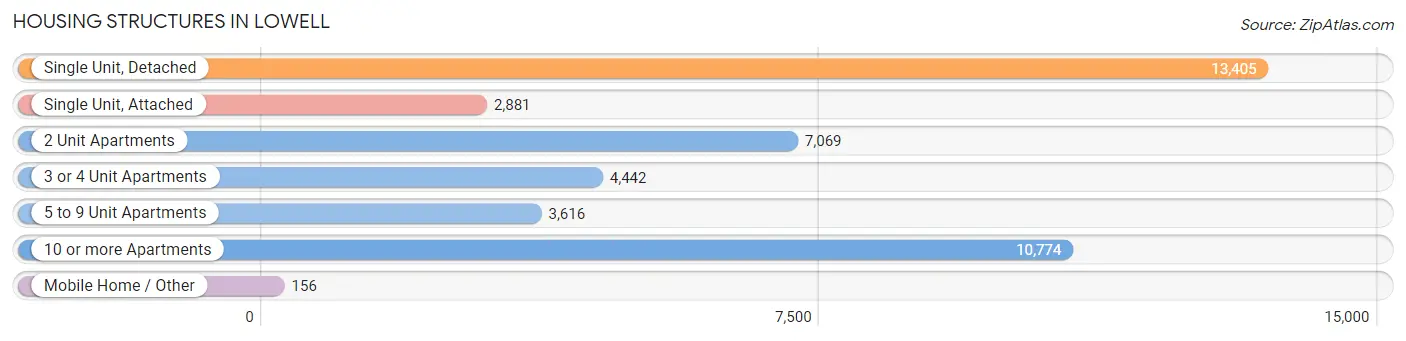
| Structure Type | # Housing Units | % Housing Units |
| Single Unit, Detached | 13,405 | 31.7% |
| Single Unit, Attached | 2,881 | 6.8% |
| 2 Unit Apartments | 7,069 | 16.7% |
| 3 or 4 Unit Apartments | 4,442 | 10.5% |
| 5 to 9 Unit Apartments | 3,616 | 8.5% |
| 10 or more Apartments | 10,774 | 25.4% |
| Mobile Home / Other | 156 | 0.4% |
| Total | 42,343 | 100.0% |
Housing Structures by Occupancy in Lowell
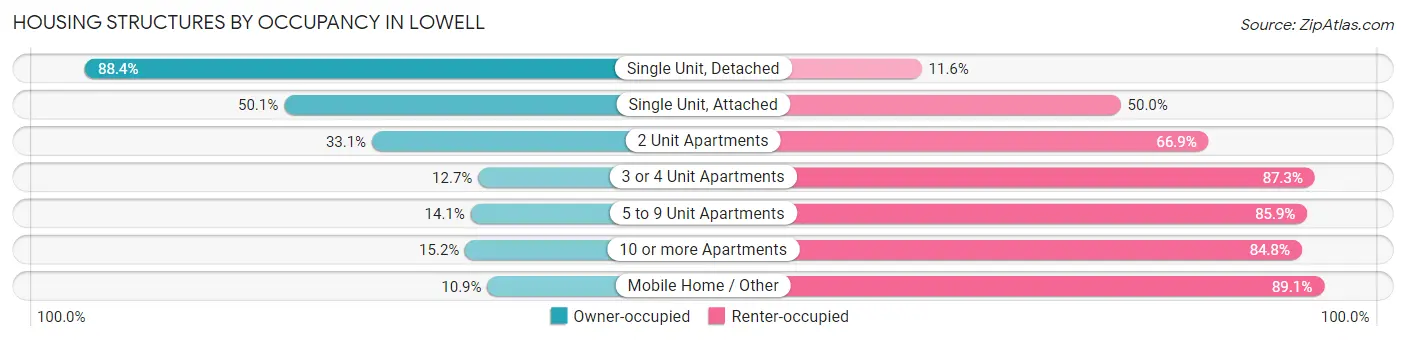
| Structure Type | Owner-occupied | Renter-occupied |
| Single Unit, Detached | 11,844 (88.4%) | 1,561 (11.6%) |
| Single Unit, Attached | 1,442 (50.0%) | 1,439 (49.9%) |
| 2 Unit Apartments | 2,341 (33.1%) | 4,728 (66.9%) |
| 3 or 4 Unit Apartments | 563 (12.7%) | 3,879 (87.3%) |
| 5 to 9 Unit Apartments | 511 (14.1%) | 3,105 (85.9%) |
| 10 or more Apartments | 1,634 (15.2%) | 9,140 (84.8%) |
| Mobile Home / Other | 17 (10.9%) | 139 (89.1%) |
| Total | 18,352 (43.3%) | 23,991 (56.7%) |
Housing Structures by Number of Rooms in Lowell
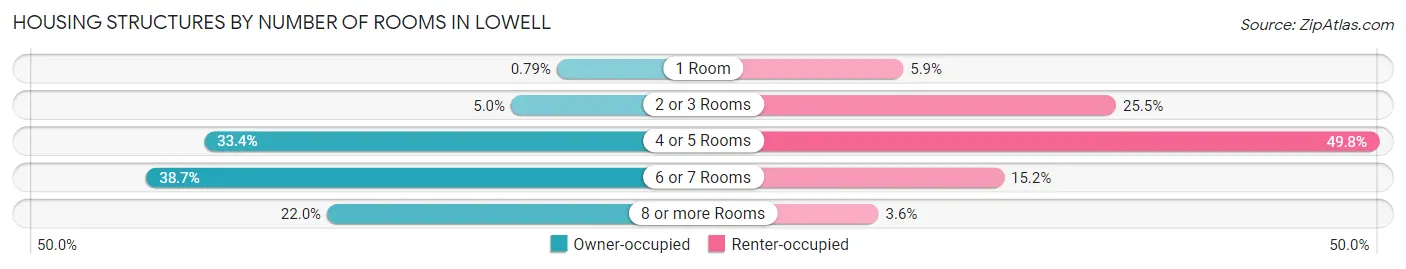
| Number of Rooms | Owner-occupied | Renter-occupied |
| 1 Room | 145 (0.8%) | 1,406 (5.9%) |
| 2 or 3 Rooms | 923 (5.0%) | 6,127 (25.5%) |
| 4 or 5 Rooms | 6,130 (33.4%) | 11,956 (49.8%) |
| 6 or 7 Rooms | 7,109 (38.7%) | 3,642 (15.2%) |
| 8 or more Rooms | 4,045 (22.0%) | 860 (3.6%) |
| Total | 18,352 (100.0%) | 23,991 (100.0%) |
Housing Structure by Heating Type in Lowell
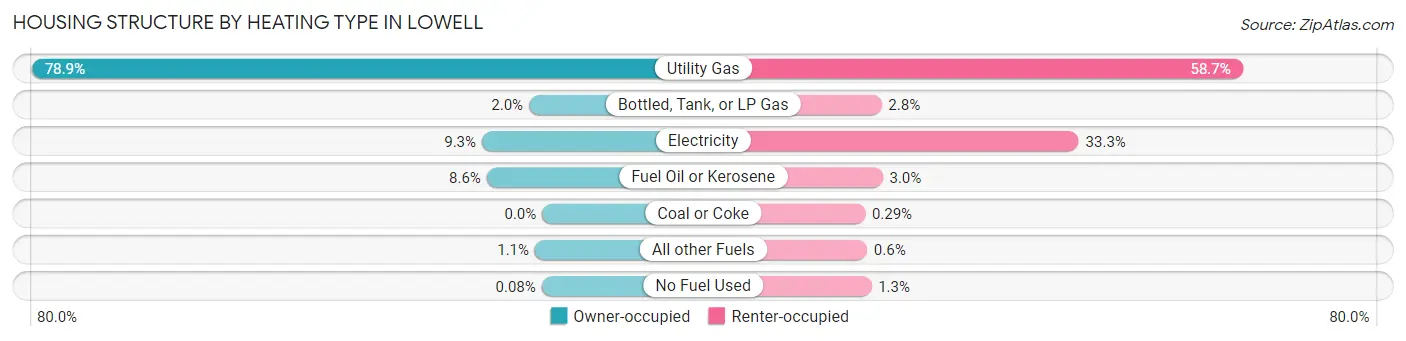
| Heating Type | Owner-occupied | Renter-occupied |
| Utility Gas | 14,478 (78.9%) | 14,074 (58.7%) |
| Bottled, Tank, or LP Gas | 372 (2.0%) | 681 (2.8%) |
| Electricity | 1,709 (9.3%) | 7,997 (33.3%) |
| Fuel Oil or Kerosene | 1,573 (8.6%) | 722 (3.0%) |
| Coal or Coke | 0 (0.0%) | 70 (0.3%) |
| All other Fuels | 205 (1.1%) | 145 (0.6%) |
| No Fuel Used | 15 (0.1%) | 302 (1.3%) |
| Total | 18,352 (100.0%) | 23,991 (100.0%) |
Household Vehicle Usage in Lowell
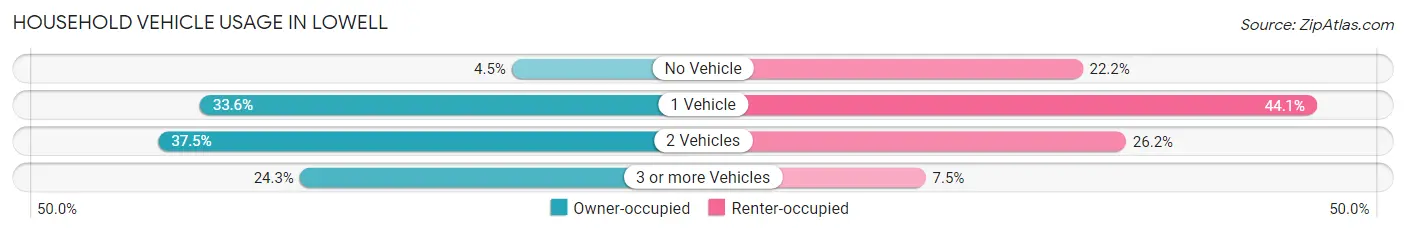
| Vehicles per Household | Owner-occupied | Renter-occupied |
| No Vehicle | 831 (4.5%) | 5,322 (22.2%) |
| 1 Vehicle | 6,174 (33.6%) | 10,569 (44.1%) |
| 2 Vehicles | 6,884 (37.5%) | 6,293 (26.2%) |
| 3 or more Vehicles | 4,463 (24.3%) | 1,807 (7.5%) |
| Total | 18,352 (100.0%) | 23,991 (100.0%) |
Real Estate & Mortgages in Lowell
Real Estate and Mortgage Overview in Lowell
| Characteristic | Without Mortgage | With Mortgage |
| Housing Units | 5,157 | 13,195 |
| Median Property Value | $367,000 | $361,500 |
| Median Household Income | $75,135 | $3,730 |
| Monthly Housing Costs | $807 | $1,902 |
| Real Estate Taxes | $4,274 | $230 |
Property Value by Mortgage Status in Lowell
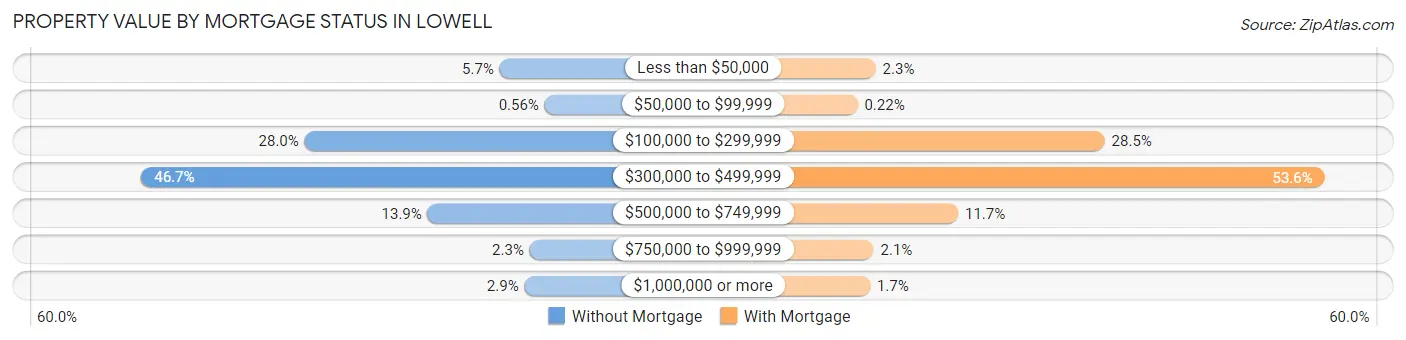
| Property Value | Without Mortgage | With Mortgage |
| Less than $50,000 | 294 (5.7%) | 303 (2.3%) |
| $50,000 to $99,999 | 29 (0.6%) | 29 (0.2%) |
| $100,000 to $299,999 | 1,444 (28.0%) | 3,756 (28.5%) |
| $300,000 to $499,999 | 2,406 (46.7%) | 7,072 (53.6%) |
| $500,000 to $749,999 | 719 (13.9%) | 1,545 (11.7%) |
| $750,000 to $999,999 | 117 (2.3%) | 272 (2.1%) |
| $1,000,000 or more | 148 (2.9%) | 218 (1.7%) |
| Total | 5,157 (100.0%) | 13,195 (100.0%) |
Household Income by Mortgage Status in Lowell
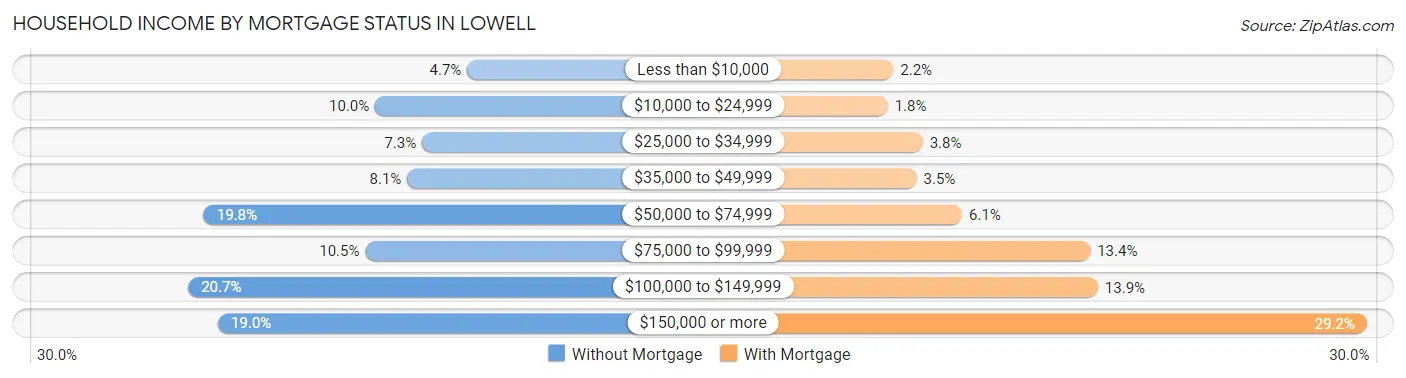
| Household Income | Without Mortgage | With Mortgage |
| Less than $10,000 | 243 (4.7%) | 285 (2.2%) |
| $10,000 to $24,999 | 514 (10.0%) | 243 (1.8%) |
| $25,000 to $34,999 | 376 (7.3%) | 507 (3.8%) |
| $35,000 to $49,999 | 420 (8.1%) | 461 (3.5%) |
| $50,000 to $74,999 | 1,019 (19.8%) | 804 (6.1%) |
| $75,000 to $99,999 | 543 (10.5%) | 1,769 (13.4%) |
| $100,000 to $149,999 | 1,065 (20.6%) | 1,827 (13.9%) |
| $150,000 or more | 977 (19.0%) | 3,854 (29.2%) |
| Total | 5,157 (100.0%) | 13,195 (100.0%) |
Property Value to Household Income Ratio in Lowell
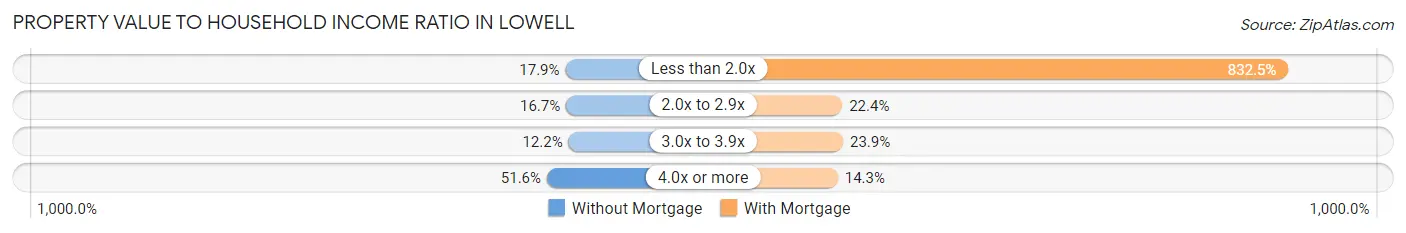
| Value-to-Income Ratio | Without Mortgage | With Mortgage |
| Less than 2.0x | 923 (17.9%) | 109,848 (832.5%) |
| 2.0x to 2.9x | 862 (16.7%) | 2,953 (22.4%) |
| 3.0x to 3.9x | 631 (12.2%) | 3,148 (23.9%) |
| 4.0x or more | 2,659 (51.6%) | 1,882 (14.3%) |
| Total | 5,157 (100.0%) | 13,195 (100.0%) |
Real Estate Taxes by Mortgage Status in Lowell
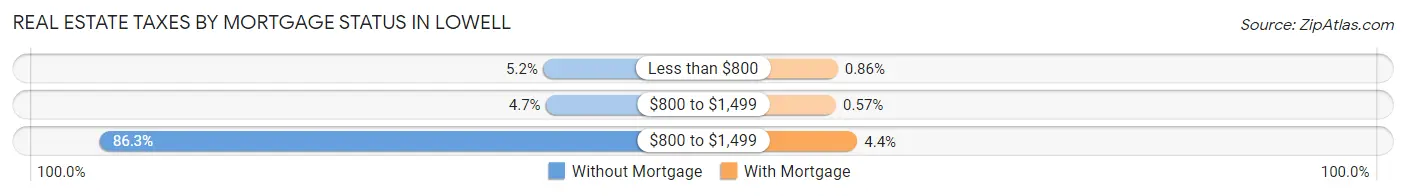
| Property Taxes | Without Mortgage | With Mortgage |
| Less than $800 | 267 (5.2%) | 114 (0.9%) |
| $800 to $1,499 | 242 (4.7%) | 75 (0.6%) |
| $800 to $1,499 | 4,448 (86.3%) | 586 (4.4%) |
| Total | 5,157 (100.0%) | 13,195 (100.0%) |
Health & Disability in Lowell
Health Insurance Coverage by Age in Lowell
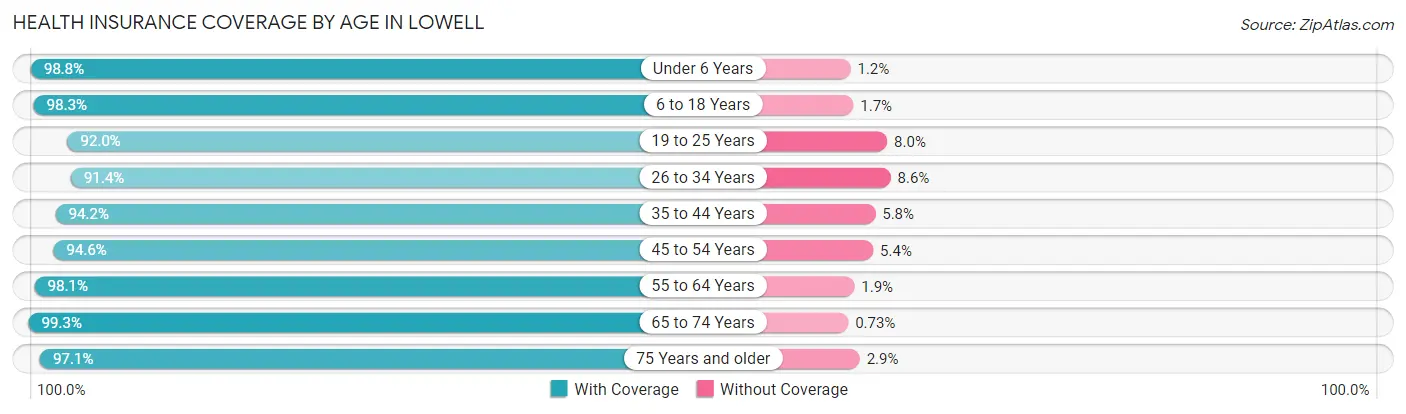
| Age Bracket | With Coverage | Without Coverage |
| Under 6 Years | 7,674 (98.8%) | 90 (1.2%) |
| 6 to 18 Years | 18,037 (98.3%) | 310 (1.7%) |
| 19 to 25 Years | 13,389 (92.0%) | 1,162 (8.0%) |
| 26 to 34 Years | 15,794 (91.4%) | 1,494 (8.6%) |
| 35 to 44 Years | 14,510 (94.2%) | 890 (5.8%) |
| 45 to 54 Years | 12,327 (94.6%) | 701 (5.4%) |
| 55 to 64 Years | 14,434 (98.1%) | 275 (1.9%) |
| 65 to 74 Years | 8,277 (99.3%) | 61 (0.7%) |
| 75 Years and older | 4,182 (97.1%) | 124 (2.9%) |
| Total | 108,624 (95.5%) | 5,107 (4.5%) |
Health Insurance Coverage by Citizenship Status in Lowell
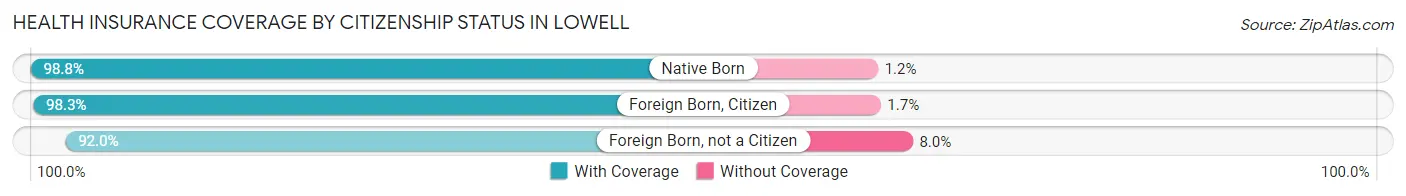
| Citizenship Status | With Coverage | Without Coverage |
| Native Born | 7,674 (98.8%) | 90 (1.2%) |
| Foreign Born, Citizen | 18,037 (98.3%) | 310 (1.7%) |
| Foreign Born, not a Citizen | 13,389 (92.0%) | 1,162 (8.0%) |
Health Insurance Coverage by Household Income in Lowell
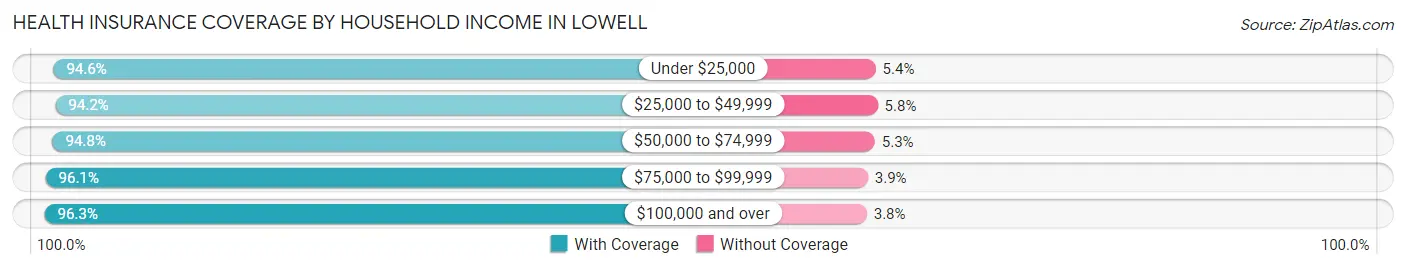
| Household Income | With Coverage | Without Coverage |
| Under $25,000 | 13,332 (94.6%) | 762 (5.4%) |
| $25,000 to $49,999 | 14,678 (94.2%) | 901 (5.8%) |
| $50,000 to $74,999 | 15,992 (94.8%) | 886 (5.2%) |
| $75,000 to $99,999 | 14,422 (96.1%) | 591 (3.9%) |
| $100,000 and over | 46,584 (96.3%) | 1,815 (3.7%) |
Public vs Private Health Insurance Coverage by Age in Lowell
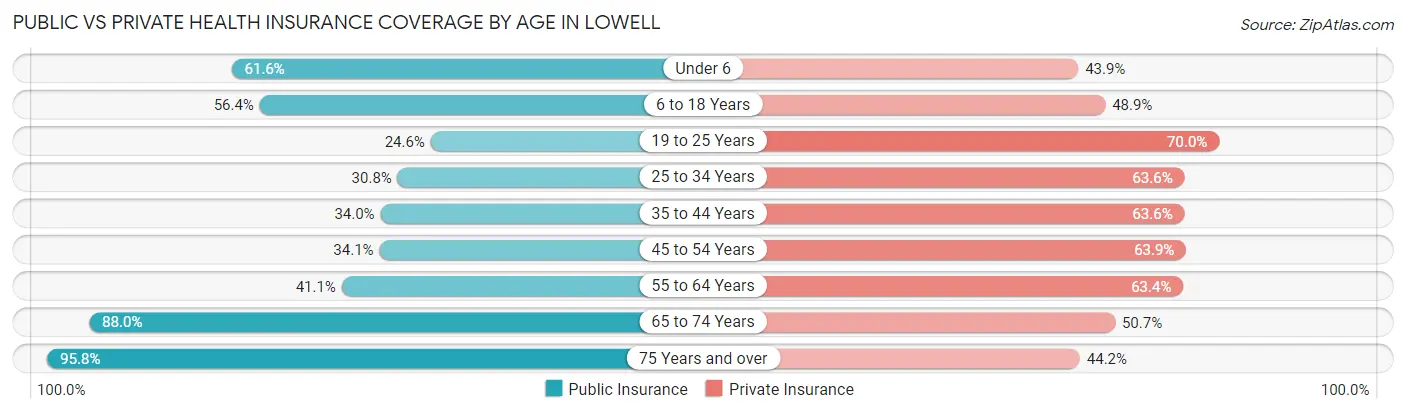
| Age Bracket | Public Insurance | Private Insurance |
| Under 6 | 4,783 (61.6%) | 3,407 (43.9%) |
| 6 to 18 Years | 10,341 (56.4%) | 8,970 (48.9%) |
| 19 to 25 Years | 3,582 (24.6%) | 10,192 (70.0%) |
| 25 to 34 Years | 5,316 (30.7%) | 10,996 (63.6%) |
| 35 to 44 Years | 5,229 (34.0%) | 9,794 (63.6%) |
| 45 to 54 Years | 4,448 (34.1%) | 8,327 (63.9%) |
| 55 to 64 Years | 6,052 (41.1%) | 9,321 (63.4%) |
| 65 to 74 Years | 7,341 (88.0%) | 4,228 (50.7%) |
| 75 Years and over | 4,126 (95.8%) | 1,903 (44.2%) |
| Total | 51,218 (45.0%) | 67,138 (59.0%) |
Disability Status by Sex by Age in Lowell
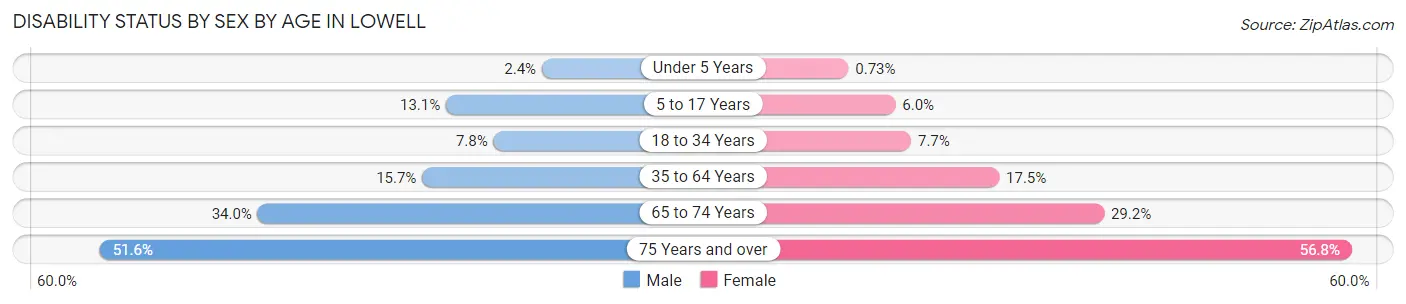
| Age Bracket | Male | Female |
| Under 5 Years | 78 (2.4%) | 23 (0.7%) |
| 5 to 17 Years | 1,132 (13.1%) | 515 (6.0%) |
| 18 to 34 Years | 1,355 (7.8%) | 1,294 (7.7%) |
| 35 to 64 Years | 3,372 (15.7%) | 3,800 (17.5%) |
| 65 to 74 Years | 1,341 (34.0%) | 1,284 (29.2%) |
| 75 Years and over | 904 (51.6%) | 1,451 (56.8%) |
Disability Class by Sex by Age in Lowell
Disability Class: Hearing Difficulty
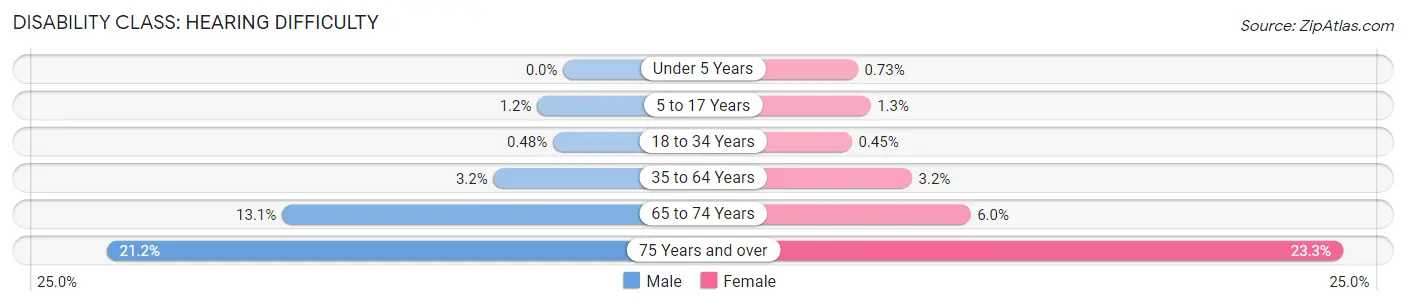
| Age Bracket | Male | Female |
| Under 5 Years | 0 (0.0%) | 23 (0.7%) |
| 5 to 17 Years | 105 (1.2%) | 114 (1.3%) |
| 18 to 34 Years | 83 (0.5%) | 76 (0.4%) |
| 35 to 64 Years | 695 (3.2%) | 703 (3.2%) |
| 65 to 74 Years | 514 (13.1%) | 262 (6.0%) |
| 75 Years and over | 371 (21.2%) | 594 (23.3%) |
Disability Class: Vision Difficulty
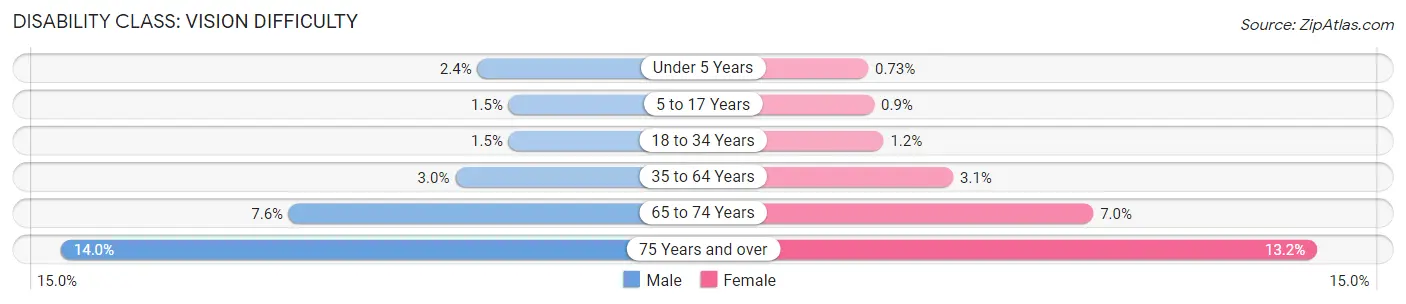
| Age Bracket | Male | Female |
| Under 5 Years | 78 (2.4%) | 23 (0.7%) |
| 5 to 17 Years | 132 (1.5%) | 78 (0.9%) |
| 18 to 34 Years | 266 (1.5%) | 195 (1.2%) |
| 35 to 64 Years | 646 (3.0%) | 673 (3.1%) |
| 65 to 74 Years | 301 (7.6%) | 308 (7.0%) |
| 75 Years and over | 245 (14.0%) | 338 (13.2%) |
Disability Class: Cognitive Difficulty
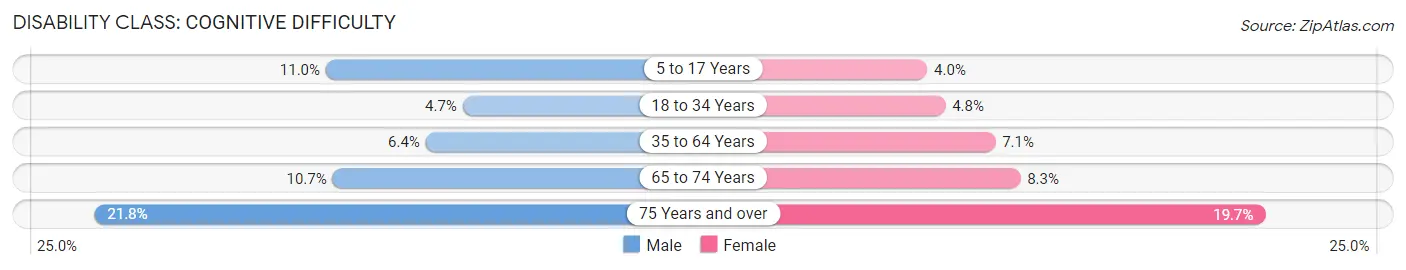
| Age Bracket | Male | Female |
| 5 to 17 Years | 955 (11.0%) | 342 (4.0%) |
| 18 to 34 Years | 814 (4.7%) | 806 (4.8%) |
| 35 to 64 Years | 1,371 (6.4%) | 1,544 (7.1%) |
| 65 to 74 Years | 422 (10.7%) | 364 (8.3%) |
| 75 Years and over | 381 (21.8%) | 502 (19.7%) |
Disability Class: Ambulatory Difficulty
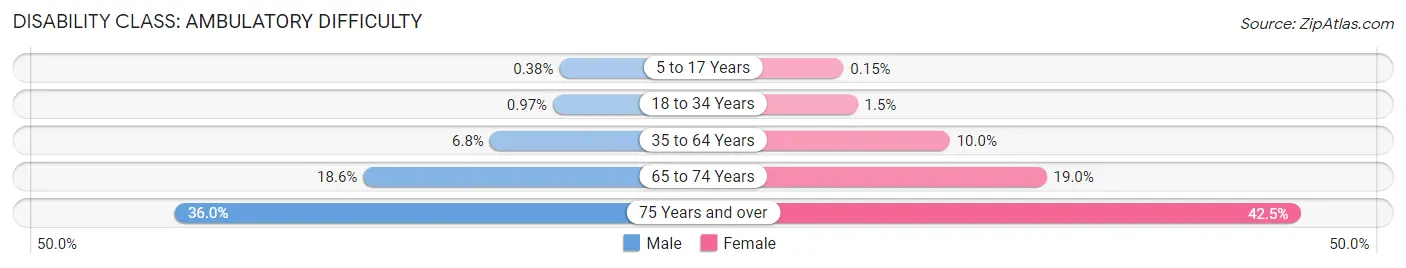
| Age Bracket | Male | Female |
| 5 to 17 Years | 33 (0.4%) | 13 (0.2%) |
| 18 to 34 Years | 169 (1.0%) | 246 (1.5%) |
| 35 to 64 Years | 1,467 (6.8%) | 2,173 (10.0%) |
| 65 to 74 Years | 732 (18.6%) | 836 (19.0%) |
| 75 Years and over | 631 (36.0%) | 1,087 (42.5%) |
Disability Class: Self-Care Difficulty
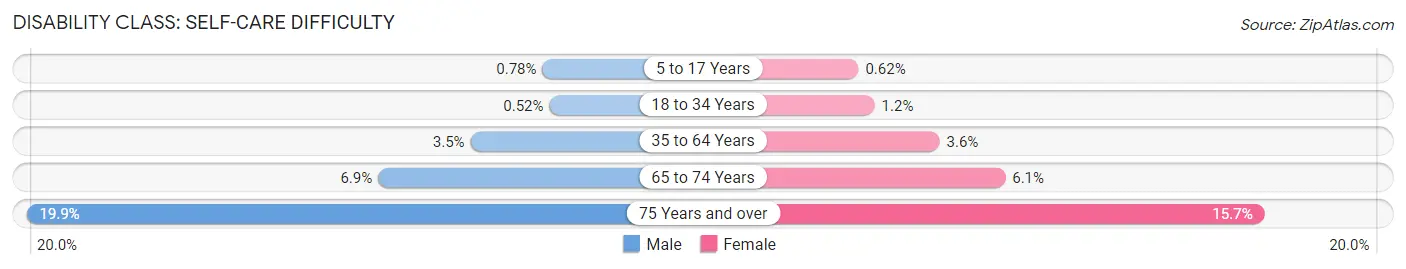
| Age Bracket | Male | Female |
| 5 to 17 Years | 68 (0.8%) | 54 (0.6%) |
| 18 to 34 Years | 91 (0.5%) | 205 (1.2%) |
| 35 to 64 Years | 740 (3.5%) | 788 (3.6%) |
| 65 to 74 Years | 271 (6.9%) | 267 (6.1%) |
| 75 Years and over | 349 (19.9%) | 401 (15.7%) |
Technology Access in Lowell
Computing Device Access in Lowell
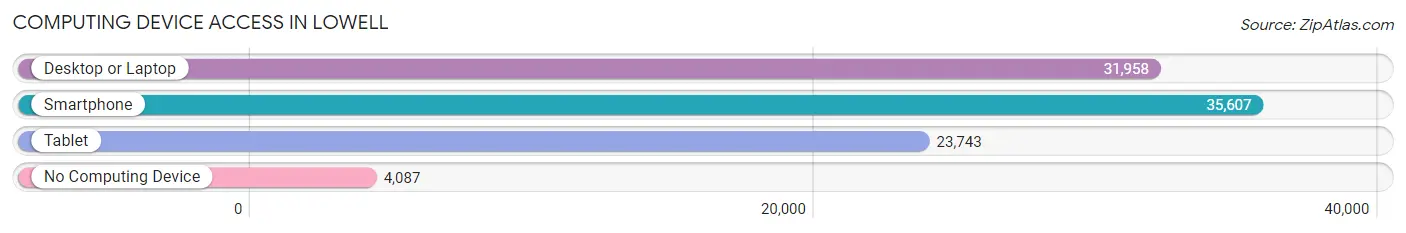
| Device Type | # Households | % Households |
| Desktop or Laptop | 31,958 | 75.5% |
| Smartphone | 35,607 | 84.1% |
| Tablet | 23,743 | 56.1% |
| No Computing Device | 4,087 | 9.7% |
| Total | 42,343 | 100.0% |
Internet Access in Lowell
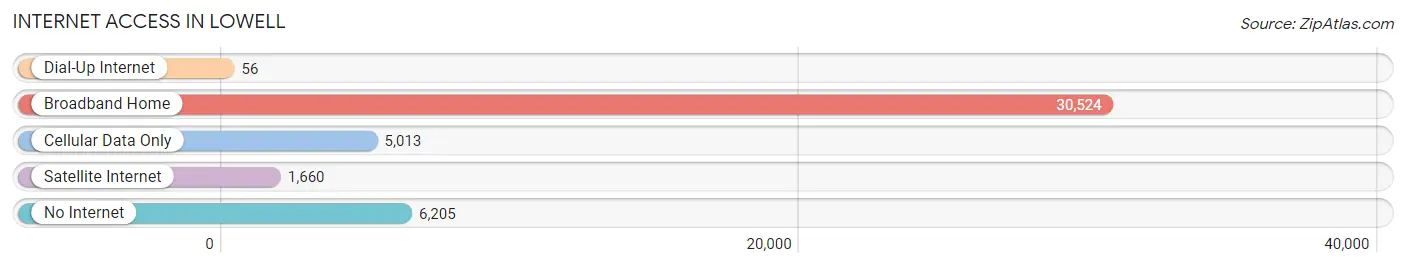
| Internet Type | # Households | % Households |
| Dial-Up Internet | 56 | 0.1% |
| Broadband Home | 30,524 | 72.1% |
| Cellular Data Only | 5,013 | 11.8% |
| Satellite Internet | 1,660 | 3.9% |
| No Internet | 6,205 | 14.6% |
| Total | 42,343 | 100.0% |
Lowell Summary
Lowell, Massachusetts is a city located in Middlesex County, in the northeastern part of the state. It is situated on the banks of the Merrimack River, about 25 miles northwest of Boston. The city is known for its rich history, diverse geography, vibrant economy, and diverse demographics.
History
Lowell was founded in 1826 as a planned manufacturing center for textiles. The city was named after Francis Cabot Lowell, a prominent Boston merchant who had visited England and brought back the plans for a power loom. The city was designed to be a model industrial city, with a grid pattern of streets and a network of canals to power the mills. The city quickly grew, and by the mid-19th century, it was the largest industrial center in the United States. The city was home to a large number of immigrants, including Irish, French-Canadians, and Greeks.
The city experienced a decline in the late 19th and early 20th centuries, as the textile industry moved south and the city’s population declined. In the mid-20th century, the city experienced a resurgence, as it became a center for high-tech manufacturing and research. The city is now home to a number of universities and colleges, as well as a thriving arts and culture scene.
Geography
Lowell is located in the Merrimack Valley region of Massachusetts, on the banks of the Merrimack River. The city is bordered by the towns of Chelmsford, Dracut, Tewksbury, Billerica, and Tyngsborough. The city is located in a hilly region, with the highest point in the city being the summit of Belvidere Hill, at an elevation of 441 feet. The city is home to a number of parks and open spaces, including the Lowell National Historical Park, which preserves the city’s industrial heritage.
Economy
Lowell’s economy is largely based on the service sector, with a number of universities, hospitals, and other institutions located in the city. The city is also home to a number of high-tech companies, including Oracle, EMC, and Kronos. The city is also home to a number of manufacturing companies, including Raytheon and General Electric. The city is also home to a number of cultural institutions, including the Lowell Memorial Auditorium, the Lowell Folk Festival, and the Lowell Spinners minor league baseball team.
Demographics
As of the 2010 census, the population of Lowell was 106,519. The city is racially and ethnically diverse, with the largest racial group being White (63.2%), followed by Asian (14.2%), Hispanic or Latino (13.3%), and African American (7.2%). The city is also home to a large number of immigrants, with the largest groups being from Cambodia (7.2%), Vietnam (4.2%), and Laos (2.2%). The median household income in the city is $45,837, and the median home value is $219,400.
Lowell is a vibrant and diverse city, with a rich history, diverse geography, vibrant economy, and diverse demographics. The city is home to a number of universities, hospitals, and other institutions, as well as a number of high-tech companies and manufacturing companies. The city is also home to a number of cultural institutions, including the Lowell Memorial Auditorium, the Lowell Folk Festival, and the Lowell Spinners minor league baseball team. The city is racially and ethnically diverse, with the largest racial group being White, followed by Asian, Hispanic or Latino, and African American. The median household income in the city is $45,837, and the median home value is $219,400.
Common Questions
What is Per Capita Income in Lowell?
Per Capita income in Lowell is $33,574.
What is the Median Family Income in Lowell?
Median Family Income in Lowell is $84,723.
What is the Median Household income in Lowell?
Median Household Income in Lowell is $73,008.
What is Income or Wage Gap in Lowell?
Income or Wage Gap in Lowell is 19.1%.
Women in Lowell earn 80.9 cents for every dollar earned by a man.
What is Family Income Deficit in Lowell?
Family Income Deficit in Lowell is $11,905.
Families that are below poverty line in Lowell earn $11,905 less on average than the poverty threshold level.
What is Inequality or Gini Index in Lowell?
Inequality or Gini Index in Lowell is 0.44.
What is the Total Population of Lowell?
Total Population of Lowell is 114,737.
What is the Total Male Population of Lowell?
Total Male Population of Lowell is 56,986.
What is the Total Female Population of Lowell?
Total Female Population of Lowell is 57,751.
What is the Ratio of Males per 100 Females in Lowell?
There are 98.68 Males per 100 Females in Lowell.
What is the Ratio of Females per 100 Males in Lowell?
There are 101.34 Females per 100 Males in Lowell.
What is the Median Population Age in Lowell?
Median Population Age in Lowell is 34.6 Years.
What is the Average Family Size in Lowell
Average Family Size in Lowell is 3.2 People.
What is the Average Household Size in Lowell
Average Household Size in Lowell is 2.6 People.
How Large is the Labor Force in Lowell?
There are 62,650 People in the Labor Forcein in Lowell.
What is the Percentage of People in the Labor Force in Lowell?
67.3% of People are in the Labor Force in Lowell.
What is the Unemployment Rate in Lowell?
Unemployment Rate in Lowell is 5.7%.