Zip Codes with the Highest Percentage of Population Employed in Computer, Engineering & Science in North Easton, MA
RELATED REPORTS & OPTIONS
Computer, Engineering & Science
North Easton
Compare Zip Codes
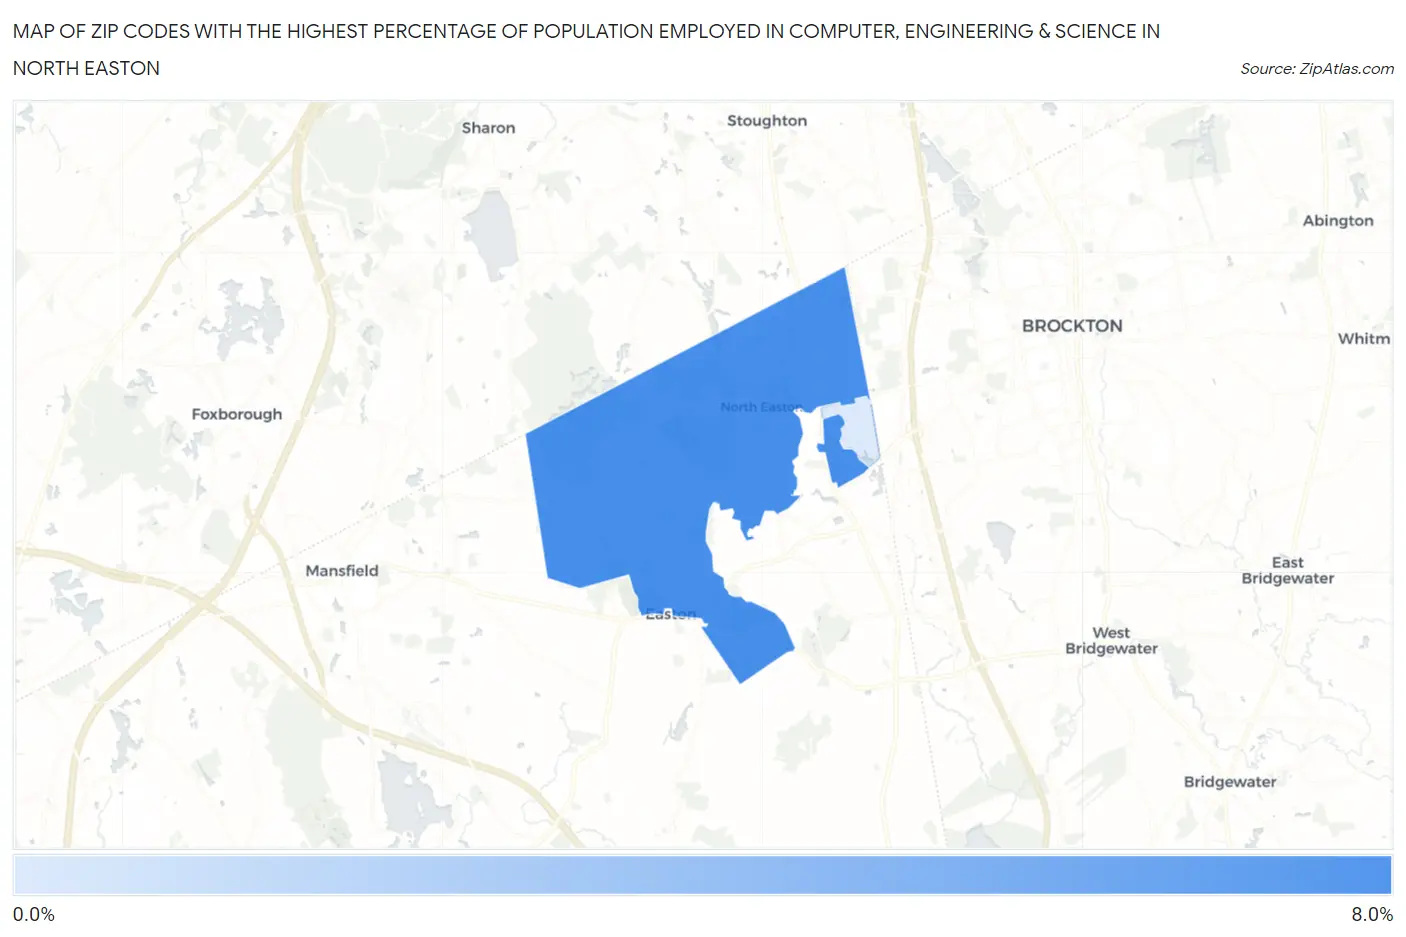
Map of Zip Codes with the Highest Percentage of Population Employed in Computer, Engineering & Science in North Easton
0.56%
7.8%
Zip Codes with the Highest Percentage of Population Employed in Computer, Engineering & Science in North Easton, MA
| Zip Code | % Employed | vs State | vs National | |
| 1. | 02356 | 7.8% | 9.8%(-2.03)#229 | 6.8%(+1.04)#5,538 |
| 2. | 02357 | 0.56% | 9.8%(-9.27)#501 | 6.8%(-6.20)#26,089 |
1
Common Questions
What are the Top Zip Codes with the Highest Percentage of Population Employed in Computer, Engineering & Science in North Easton, MA?
Top Zip Codes with the Highest Percentage of Population Employed in Computer, Engineering & Science in North Easton, MA are:
What zip code has the Highest Percentage of Population Employed in Computer, Engineering & Science in North Easton, MA?
02356 has the Highest Percentage of Population Employed in Computer, Engineering & Science in North Easton, MA with 7.8%.
What is the Percentage of Population Employed in Computer, Engineering & Science in Massachusetts?
Percentage of Population Employed in Computer, Engineering & Science in Massachusetts is 9.8%.
What is the Percentage of Population Employed in Computer, Engineering & Science in the United States?
Percentage of Population Employed in Computer, Engineering & Science in the United States is 6.8%.