Randolph Town, MA Map & Demographics
Randolph Town Map
Randolph Town Overview
$42,525
PER CAPITA INCOME
$110,905
AVG FAMILY INCOME
$94,905
AVG HOUSEHOLD INCOME
15.0%
WAGE / INCOME GAP [ % ]
85.0¢/ $1
WAGE / INCOME GAP [ $ ]
0.44
INEQUALITY / GINI INDEX
34,691
TOTAL POPULATION
17,068
MALE POPULATION
17,623
FEMALE POPULATION
96.85
MALES / 100 FEMALES
103.25
FEMALES / 100 MALES
40.3
MEDIAN AGE
3.4
AVG FAMILY SIZE
2.8
AVG HOUSEHOLD SIZE
20,013
LABOR FORCE [ PEOPLE ]
68.6%
PERCENT IN LABOR FORCE
8.3%
UNEMPLOYMENT RATE
Income in Randolph Town
Income Overview in Randolph Town
Per Capita Income in Randolph Town is $42,525, while median incomes of families and households are $110,905 and $94,905 respectively.
| Characteristic | Number | Measure |
| Per Capita Income | 34,691 | $42,525 |
| Median Family Income | 8,654 | $110,905 |
| Mean Family Income | 8,654 | $135,175 |
| Median Household Income | 12,445 | $94,905 |
| Mean Household Income | 12,445 | $117,181 |
| Income Deficit | 8,654 | $0 |
| Wage / Income Gap (%) | 34,691 | 14.96% |
| Wage / Income Gap ($) | 34,691 | 85.04¢ per $1 |
| Gini / Inequality Index | 34,691 | 0.44 |
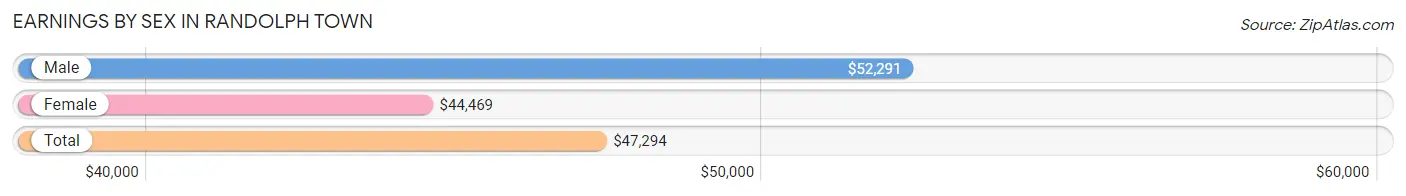
Earnings by Sex in Randolph Town
Average Earnings in Randolph Town are $47,294, $52,291 for men and $44,469 for women, a difference of 15.0%.
| Sex | Number | Average Earnings |
| Male | 10,496 (51.4%) | $52,291 |
| Female | 9,909 (48.6%) | $44,469 |
| Total | 20,405 (100.0%) | $47,294 |
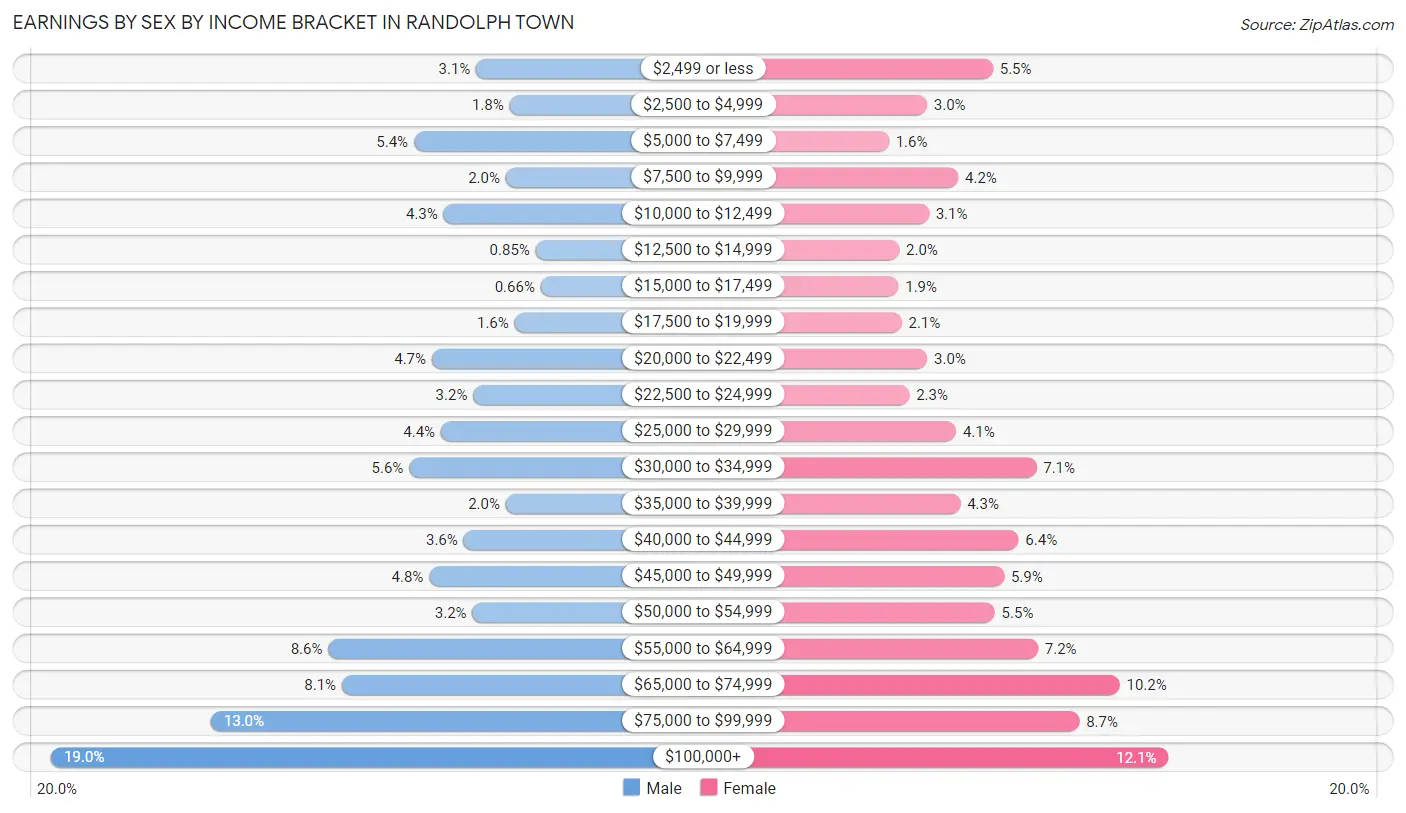
Earnings by Sex by Income Bracket in Randolph Town
The most common earnings brackets in Randolph Town are $100,000+ for men (1,995 | 19.0%) and $100,000+ for women (1,194 | 12.0%).
| Income | Male | Female |
| $2,499 or less | 323 (3.1%) | 542 (5.5%) |
| $2,500 to $4,999 | 192 (1.8%) | 297 (3.0%) |
| $5,000 to $7,499 | 568 (5.4%) | 156 (1.6%) |
| $7,500 to $9,999 | 207 (2.0%) | 413 (4.2%) |
| $10,000 to $12,499 | 451 (4.3%) | 304 (3.1%) |
| $12,500 to $14,999 | 89 (0.9%) | 194 (2.0%) |
| $15,000 to $17,499 | 69 (0.7%) | 191 (1.9%) |
| $17,500 to $19,999 | 172 (1.6%) | 203 (2.1%) |
| $20,000 to $22,499 | 497 (4.7%) | 298 (3.0%) |
| $22,500 to $24,999 | 335 (3.2%) | 232 (2.3%) |
| $25,000 to $29,999 | 462 (4.4%) | 405 (4.1%) |
| $30,000 to $34,999 | 587 (5.6%) | 704 (7.1%) |
| $35,000 to $39,999 | 207 (2.0%) | 421 (4.3%) |
| $40,000 to $44,999 | 373 (3.5%) | 637 (6.4%) |
| $45,000 to $49,999 | 508 (4.8%) | 584 (5.9%) |
| $50,000 to $54,999 | 338 (3.2%) | 549 (5.5%) |
| $55,000 to $64,999 | 905 (8.6%) | 709 (7.2%) |
| $65,000 to $74,999 | 851 (8.1%) | 1,013 (10.2%) |
| $75,000 to $99,999 | 1,367 (13.0%) | 863 (8.7%) |
| $100,000+ | 1,995 (19.0%) | 1,194 (12.0%) |
| Total | 10,496 (100.0%) | 9,909 (100.0%) |
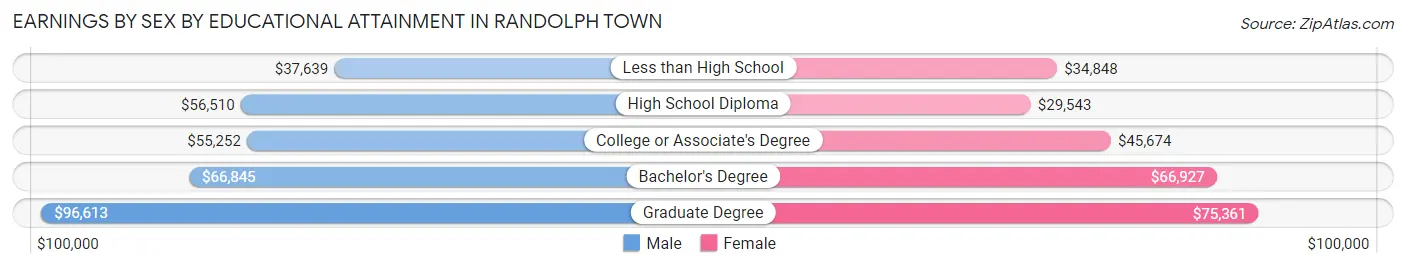
Earnings by Sex by Educational Attainment in Randolph Town
Average earnings in Randolph Town are $58,956 for men and $49,041 for women, a difference of 16.8%. Men with an educational attainment of graduate degree enjoy the highest average annual earnings of $96,613, while those with less than high school education earn the least with $37,639. Women with an educational attainment of graduate degree earn the most with the average annual earnings of $75,361, while those with high school diploma education have the smallest earnings of $29,543.
| Educational Attainment | Male Income | Female Income |
| Less than High School | $37,639 | $34,848 |
| High School Diploma | $56,510 | $29,543 |
| College or Associate's Degree | $55,252 | $45,674 |
| Bachelor's Degree | $66,845 | $66,927 |
| Graduate Degree | $96,613 | $75,361 |
| Total | $58,956 | $49,041 |
Family Income in Randolph Town
Family Income Brackets in Randolph Town
According to the Randolph Town family income data, there are 2,112 families falling into the $100,000 to $149,999 income range, which is the most common income bracket and makes up 24.4% of all families. Conversely, the $10,000 to $14,999 income bracket is the least frequent group with only 147 families (1.7%) belonging to this category.
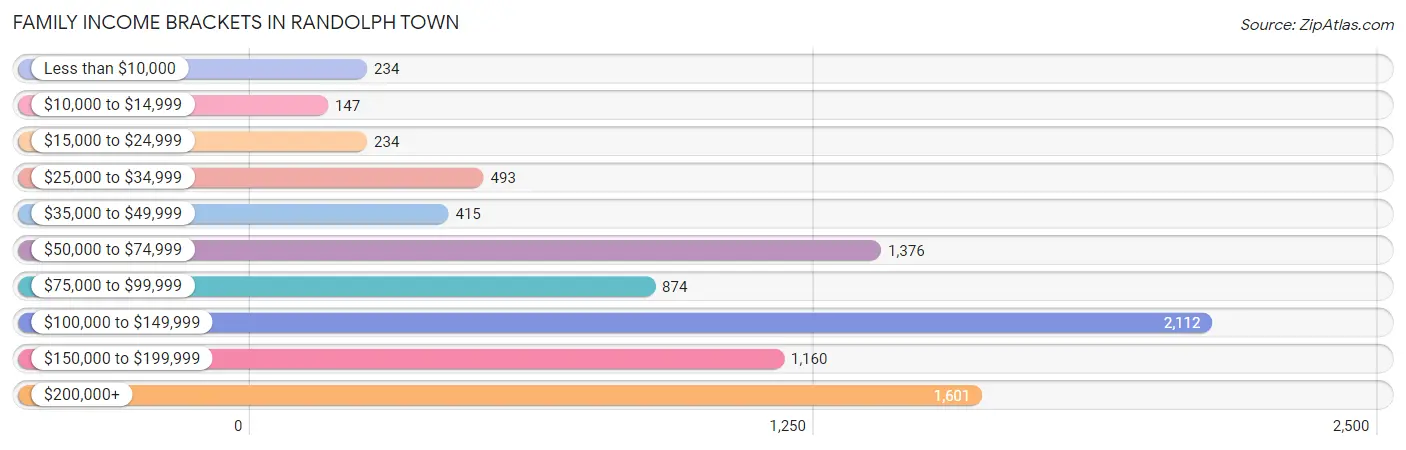
| Income Bracket | # Families | % Families |
| Less than $10,000 | 234 | 2.7% |
| $10,000 to $14,999 | 147 | 1.7% |
| $15,000 to $24,999 | 234 | 2.7% |
| $25,000 to $34,999 | 493 | 5.7% |
| $35,000 to $49,999 | 415 | 4.8% |
| $50,000 to $74,999 | 1,376 | 15.9% |
| $75,000 to $99,999 | 874 | 10.1% |
| $100,000 to $149,999 | 2,112 | 24.4% |
| $150,000 to $199,999 | 1,160 | 13.4% |
| $200,000+ | 1,601 | 18.5% |
Family Income by Famaliy Size in Randolph Town
5-person families (892 | 10.3%) account for the highest median family income in Randolph Town with $152,500 per family, while 2-person families (2,950 | 34.1%) have the highest median income of $41,176 per family member.
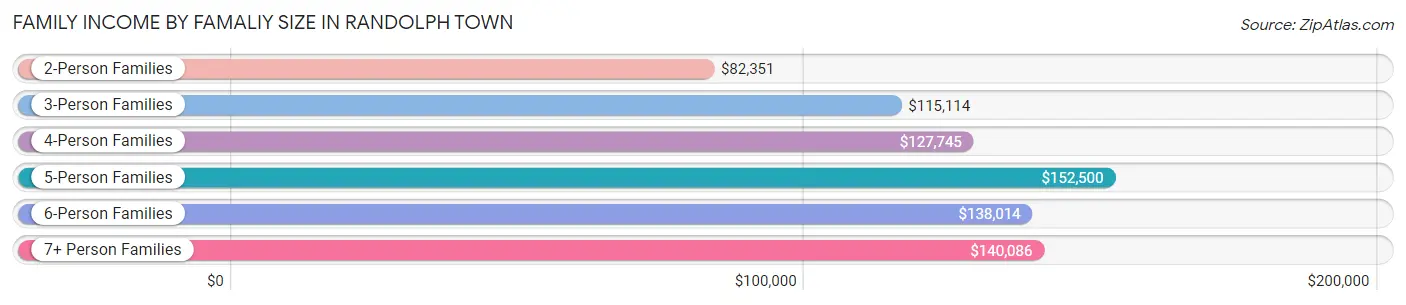
| Income Bracket | # Families | Median Income |
| 2-Person Families | 2,950 (34.1%) | $82,351 |
| 3-Person Families | 2,297 (26.5%) | $115,114 |
| 4-Person Families | 1,780 (20.6%) | $127,745 |
| 5-Person Families | 892 (10.3%) | $152,500 |
| 6-Person Families | 635 (7.3%) | $138,014 |
| 7+ Person Families | 100 (1.2%) | $140,086 |
| Total | 8,654 (100.0%) | $110,905 |
Family Income by Number of Earners in Randolph Town
The median family income in Randolph Town is $110,905, with families comprising 3+ earners (2,063) having the highest median family income of $171,959, while families with no earners (661) have the lowest median family income of $33,830, accounting for 23.8% and 7.6% of families, respectively.
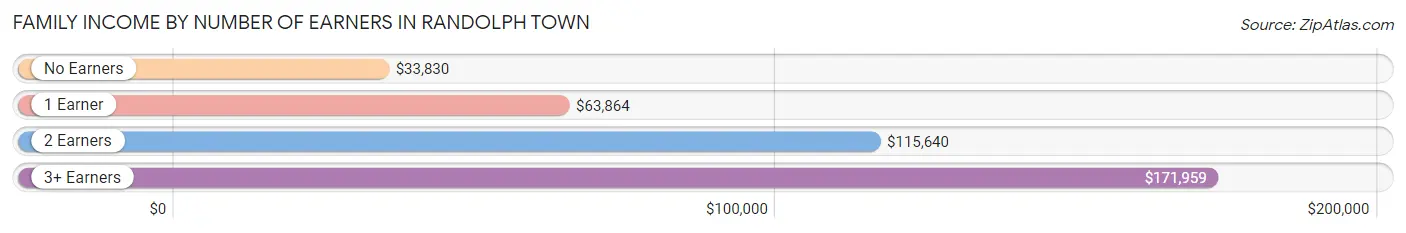
| Number of Earners | # Families | Median Income |
| No Earners | 661 (7.6%) | $33,830 |
| 1 Earner | 2,260 (26.1%) | $63,864 |
| 2 Earners | 3,670 (42.4%) | $115,640 |
| 3+ Earners | 2,063 (23.8%) | $171,959 |
| Total | 8,654 (100.0%) | $110,905 |
Household Income in Randolph Town
Household Income Brackets in Randolph Town
With 2,813 households falling in the category, the $100,000 to $149,999 income range is the most frequent in Randolph Town, accounting for 22.6% of all households. In contrast, only 436 households (3.5%) fall into the $10,000 to $14,999 income bracket, making it the least populous group.
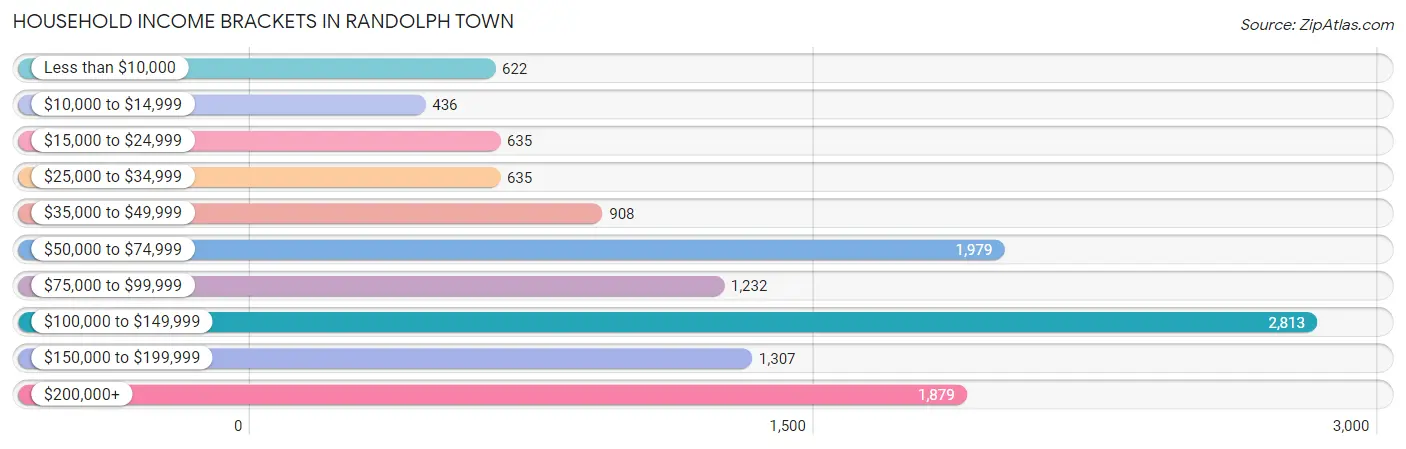
| Income Bracket | # Households | % Households |
| Less than $10,000 | 622 | 5.0% |
| $10,000 to $14,999 | 436 | 3.5% |
| $15,000 to $24,999 | 635 | 5.1% |
| $25,000 to $34,999 | 635 | 5.1% |
| $35,000 to $49,999 | 908 | 7.3% |
| $50,000 to $74,999 | 1,979 | 15.9% |
| $75,000 to $99,999 | 1,232 | 9.9% |
| $100,000 to $149,999 | 2,813 | 22.6% |
| $150,000 to $199,999 | 1,307 | 10.5% |
| $200,000+ | 1,879 | 15.1% |
Household Income by Householder Age in Randolph Town
The median household income in Randolph Town is $94,905, with the highest median household income of $115,857 found in the 45 to 64 years age bracket for the primary householder. A total of 5,498 households (44.2%) fall into this category. Meanwhile, the 15 to 24 years age bracket for the primary householder has the lowest median household income of $0, with 285 households (2.3%) in this group.
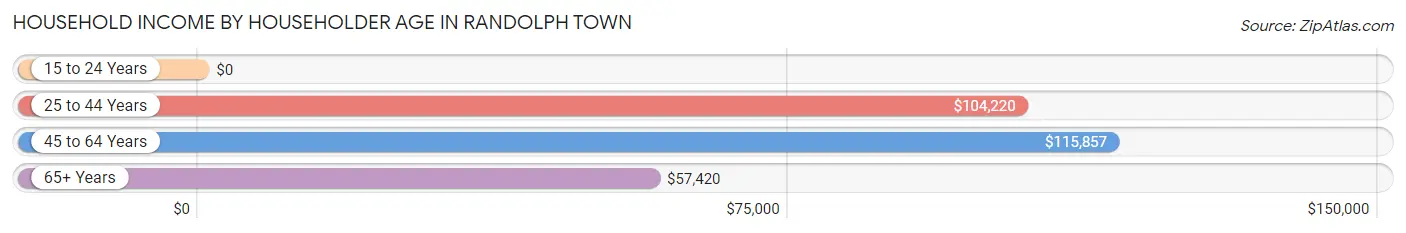
| Income Bracket | # Households | Median Income |
| 15 to 24 Years | 285 (2.3%) | $0 |
| 25 to 44 Years | 3,422 (27.5%) | $104,220 |
| 45 to 64 Years | 5,498 (44.2%) | $115,857 |
| 65+ Years | 3,240 (26.0%) | $57,420 |
| Total | 12,445 (100.0%) | $94,905 |
Poverty in Randolph Town
Income Below Poverty by Sex and Age in Randolph Town
With 9.1% poverty level for males and 9.6% for females among the residents of Randolph Town, 5 year old males and 18 to 24 year old females are the most vulnerable to poverty, with 27 males (25.5%) and 276 females (17.4%) in their respective age groups living below the poverty level.
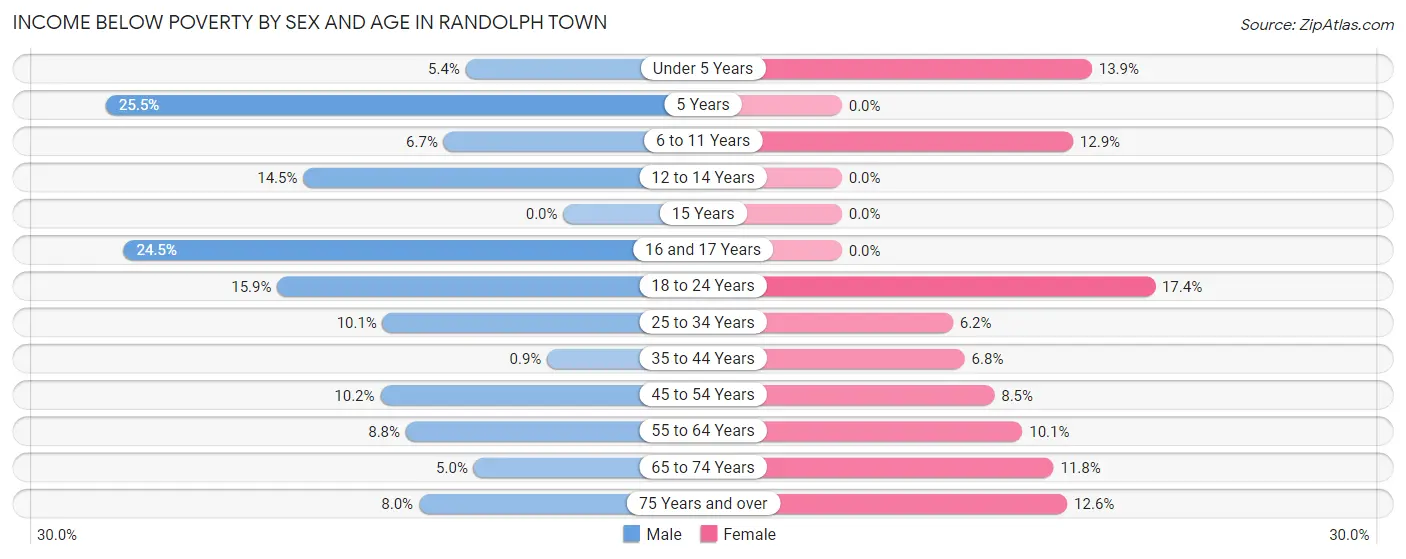
| Age Bracket | Male | Female |
| Under 5 Years | 33 (5.4%) | 108 (13.9%) |
| 5 Years | 27 (25.5%) | 0 (0.0%) |
| 6 to 11 Years | 77 (6.7%) | 142 (12.9%) |
| 12 to 14 Years | 64 (14.5%) | 0 (0.0%) |
| 15 Years | 0 (0.0%) | 0 (0.0%) |
| 16 and 17 Years | 131 (24.5%) | 0 (0.0%) |
| 18 to 24 Years | 304 (15.9%) | 276 (17.4%) |
| 25 to 34 Years | 313 (10.1%) | 125 (6.2%) |
| 35 to 44 Years | 17 (0.9%) | 164 (6.8%) |
| 45 to 54 Years | 214 (10.2%) | 213 (8.5%) |
| 55 to 64 Years | 210 (8.8%) | 250 (10.1%) |
| 65 to 74 Years | 75 (5.0%) | 221 (11.8%) |
| 75 Years and over | 69 (8.0%) | 177 (12.6%) |
| Total | 1,534 (9.1%) | 1,676 (9.6%) |
Income Above Poverty by Sex and Age in Randolph Town
According to the poverty statistics in Randolph Town, males aged 15 years and females aged 5 years are the age groups that are most secure financially, with 100.0% of males and 100.0% of females in these age groups living above the poverty line.
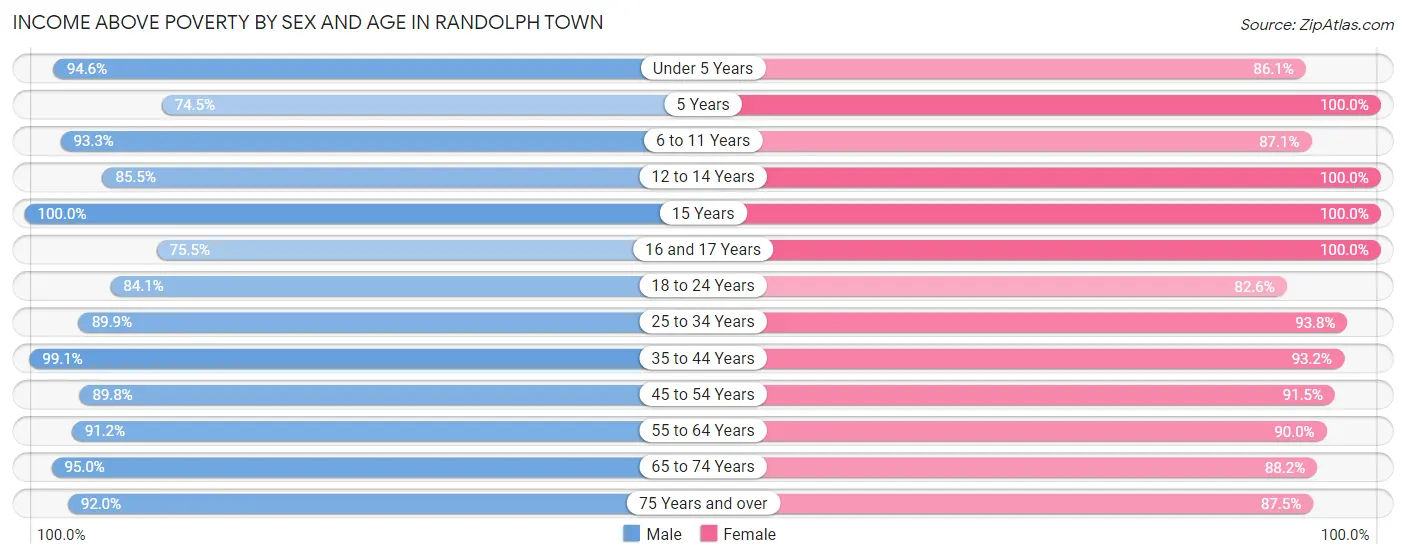
| Age Bracket | Male | Female |
| Under 5 Years | 574 (94.6%) | 668 (86.1%) |
| 5 Years | 79 (74.5%) | 183 (100.0%) |
| 6 to 11 Years | 1,080 (93.3%) | 961 (87.1%) |
| 12 to 14 Years | 378 (85.5%) | 616 (100.0%) |
| 15 Years | 300 (100.0%) | 151 (100.0%) |
| 16 and 17 Years | 404 (75.5%) | 362 (100.0%) |
| 18 to 24 Years | 1,604 (84.1%) | 1,307 (82.6%) |
| 25 to 34 Years | 2,799 (89.9%) | 1,898 (93.8%) |
| 35 to 44 Years | 1,881 (99.1%) | 2,233 (93.2%) |
| 45 to 54 Years | 1,887 (89.8%) | 2,295 (91.5%) |
| 55 to 64 Years | 2,184 (91.2%) | 2,237 (89.9%) |
| 65 to 74 Years | 1,428 (95.0%) | 1,654 (88.2%) |
| 75 Years and over | 789 (92.0%) | 1,233 (87.5%) |
| Total | 15,387 (90.9%) | 15,798 (90.4%) |
Income Below Poverty Among Married-Couple Families in Randolph Town
The poverty statistics for married-couple families in Randolph Town show that 4.6% or 247 of the total 5,326 families live below the poverty line. Families with no children have the highest poverty rate of 6.3%, comprising of 211 families. On the other hand, families with 3 or 4 children have the lowest poverty rate of 0.0%, which includes 0 families.
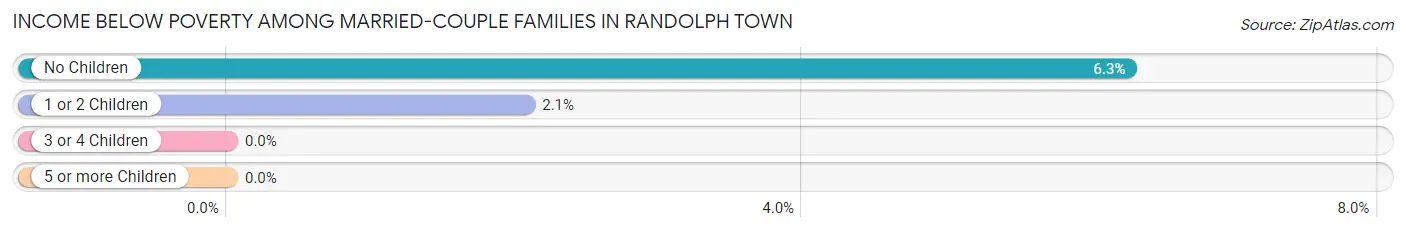
| Children | Above Poverty | Below Poverty |
| No Children | 3,162 (93.7%) | 211 (6.3%) |
| 1 or 2 Children | 1,701 (97.9%) | 36 (2.1%) |
| 3 or 4 Children | 216 (100.0%) | 0 (0.0%) |
| 5 or more Children | 0 (0.0%) | 0 (0.0%) |
| Total | 5,079 (95.4%) | 247 (4.6%) |
Income Below Poverty Among Single-Parent Households in Randolph Town
According to the poverty data in Randolph Town, 0.5% or 4 single-father households and 11.9% or 308 single-mother households are living below the poverty line. Among single-father households, those with 1 or 2 children have the highest poverty rate, with 4 households (2.0%) experiencing poverty. Likewise, among single-mother households, those with 3 or 4 children have the highest poverty rate, with 128 households (86.5%) falling below the poverty line.
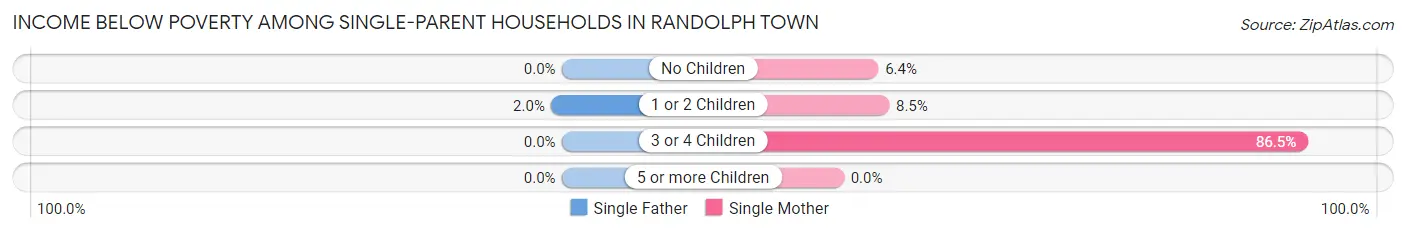
| Children | Single Father | Single Mother |
| No Children | 0 (0.0%) | 71 (6.4%) |
| 1 or 2 Children | 4 (2.0%) | 109 (8.5%) |
| 3 or 4 Children | 0 (0.0%) | 128 (86.5%) |
| 5 or more Children | 0 (0.0%) | 0 (0.0%) |
| Total | 4 (0.5%) | 308 (11.9%) |
Income Below Poverty Among Married-Couple vs Single-Parent Households in Randolph Town
The poverty data for Randolph Town shows that 247 of the married-couple family households (4.6%) and 312 of the single-parent households (9.4%) are living below the poverty level. Within the married-couple family households, those with no children have the highest poverty rate, with 211 households (6.3%) falling below the poverty line. Among the single-parent households, those with 3 or 4 children have the highest poverty rate, with 128 household (51.2%) living below poverty.
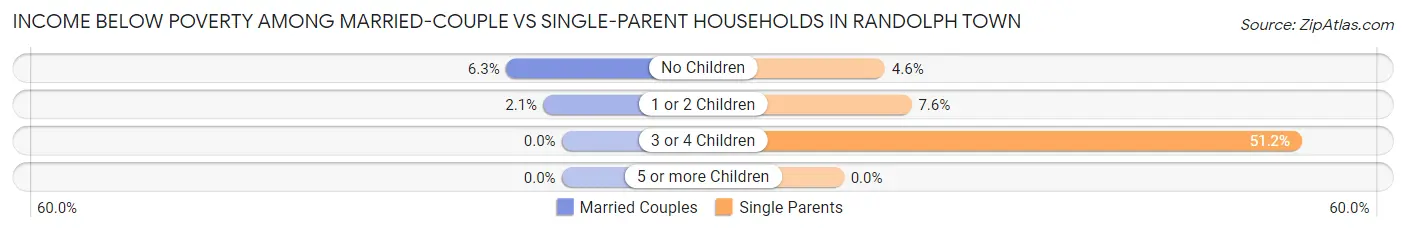
| Children | Married-Couple Families | Single-Parent Households |
| No Children | 211 (6.3%) | 71 (4.6%) |
| 1 or 2 Children | 36 (2.1%) | 113 (7.6%) |
| 3 or 4 Children | 0 (0.0%) | 128 (51.2%) |
| 5 or more Children | 0 (0.0%) | 0 (0.0%) |
| Total | 247 (4.6%) | 312 (9.4%) |
Race in Randolph Town
The most populous races in Randolph Town are Black / African American (14,094 | 40.6%), White / Caucasian (10,521 | 30.3%), and Asian (4,887 | 14.1%).
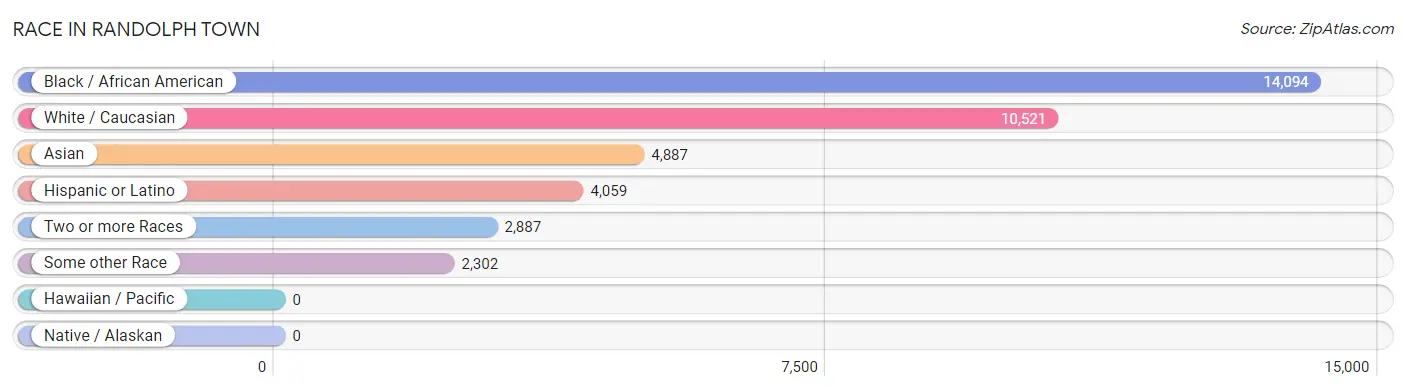
| Race | # Population | % Population |
| Asian | 4,887 | 14.1% |
| Black / African American | 14,094 | 40.6% |
| Hawaiian / Pacific | 0 | 0.0% |
| Hispanic or Latino | 4,059 | 11.7% |
| Native / Alaskan | 0 | 0.0% |
| White / Caucasian | 10,521 | 30.3% |
| Two or more Races | 2,887 | 8.3% |
| Some other Race | 2,302 | 6.6% |
| Total | 34,691 | 100.0% |
Ancestry in Randolph Town
The most populous ancestries reported in Randolph Town are Haitian (4,396 | 12.7%), Irish (3,124 | 9.0%), Sri Lankan (3,117 | 9.0%), Dominican (2,129 | 6.1%), and Italian (2,063 | 5.9%), together accounting for 42.8% of all Randolph Town residents.
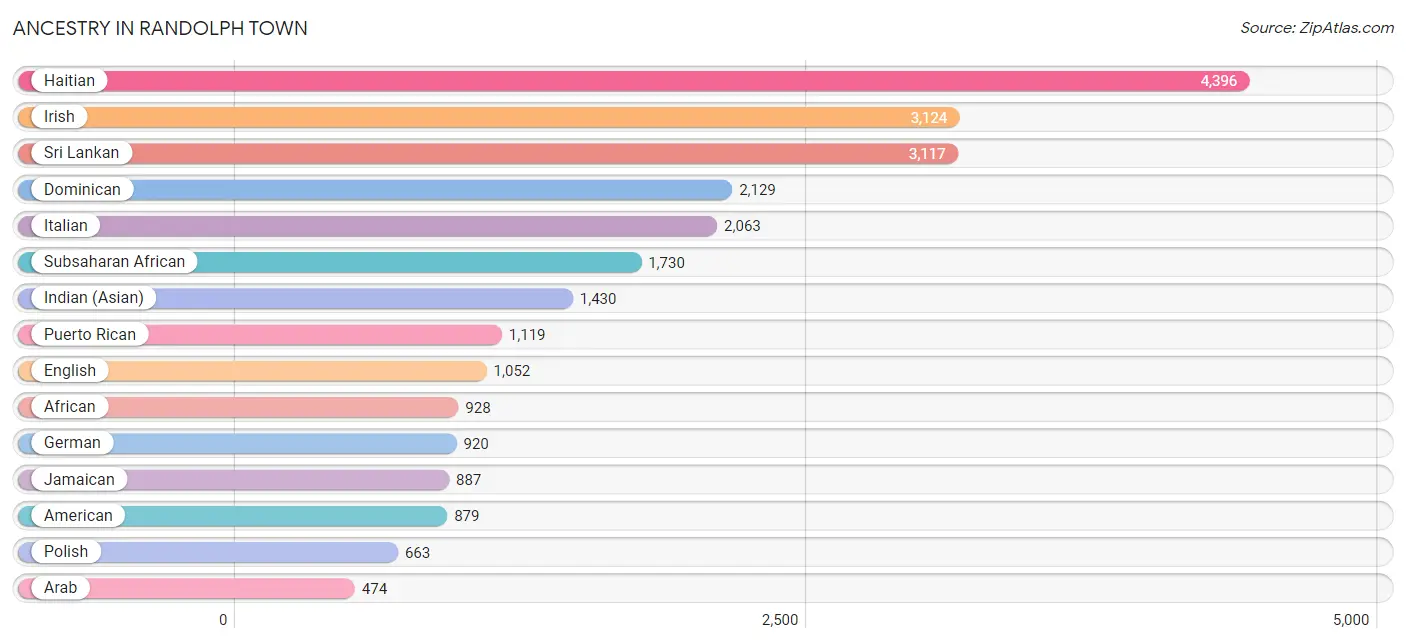
| Ancestry | # Population | % Population |
| African | 928 | 2.7% |
| Albanian | 70 | 0.2% |
| American | 879 | 2.5% |
| Arab | 474 | 1.4% |
| Austrian | 21 | 0.1% |
| Barbadian | 73 | 0.2% |
| Bhutanese | 18 | 0.1% |
| Blackfeet | 69 | 0.2% |
| Brazilian | 16 | 0.1% |
| British | 18 | 0.1% |
| British West Indian | 359 | 1.0% |
| Bulgarian | 26 | 0.1% |
| Burmese | 47 | 0.1% |
| Canadian | 141 | 0.4% |
| Cape Verdean | 462 | 1.3% |
| Celtic | 26 | 0.1% |
| Central American | 291 | 0.8% |
| Cherokee | 57 | 0.2% |
| Cree | 62 | 0.2% |
| Creek | 23 | 0.1% |
| Czech | 12 | 0.0% |
| Czechoslovakian | 13 | 0.0% |
| Danish | 13 | 0.0% |
| Dominican | 2,129 | 6.1% |
| Dutch | 51 | 0.2% |
| Eastern European | 93 | 0.3% |
| Ecuadorian | 47 | 0.1% |
| Egyptian | 64 | 0.2% |
| English | 1,052 | 3.0% |
| Ethiopian | 130 | 0.4% |
| European | 99 | 0.3% |
| Finnish | 31 | 0.1% |
| French | 176 | 0.5% |
| French Canadian | 192 | 0.5% |
| German | 920 | 2.6% |
| Ghanaian | 13 | 0.0% |
| Greek | 218 | 0.6% |
| Guatemalan | 141 | 0.4% |
| Guyanese | 64 | 0.2% |
| Haitian | 4,396 | 12.7% |
| Honduran | 118 | 0.3% |
| Hungarian | 89 | 0.3% |
| Indian (Asian) | 1,430 | 4.1% |
| Iranian | 60 | 0.2% |
| Iraqi | 37 | 0.1% |
| Irish | 3,124 | 9.0% |
| Italian | 2,063 | 5.9% |
| Jamaican | 887 | 2.6% |
| Japanese | 157 | 0.4% |
| Kenyan | 18 | 0.1% |
| Korean | 367 | 1.1% |
| Lebanese | 133 | 0.4% |
| Lithuanian | 80 | 0.2% |
| Mexican | 99 | 0.3% |
| Moroccan | 25 | 0.1% |
| Navajo | 3 | 0.0% |
| Nigerian | 145 | 0.4% |
| Pakistani | 4 | 0.0% |
| Panamanian | 23 | 0.1% |
| Peruvian | 121 | 0.4% |
| Polish | 663 | 1.9% |
| Portuguese | 134 | 0.4% |
| Puerto Rican | 1,119 | 3.2% |
| Romanian | 61 | 0.2% |
| Russian | 393 | 1.1% |
| Salvadoran | 9 | 0.0% |
| Scandinavian | 11 | 0.0% |
| Scotch-Irish | 35 | 0.1% |
| Scottish | 413 | 1.2% |
| Slavic | 8 | 0.0% |
| South American | 168 | 0.5% |
| Spaniard | 68 | 0.2% |
| Spanish | 24 | 0.1% |
| Sri Lankan | 3,117 | 9.0% |
| Subsaharan African | 1,730 | 5.0% |
| Swedish | 172 | 0.5% |
| Thai | 409 | 1.2% |
| Trinidadian and Tobagonian | 73 | 0.2% |
| U.S. Virgin Islander | 37 | 0.1% |
| Ugandan | 70 | 0.2% |
| Ukrainian | 50 | 0.1% |
| Welsh | 44 | 0.1% |
| West Indian | 164 | 0.5% | View All 83 Rows |
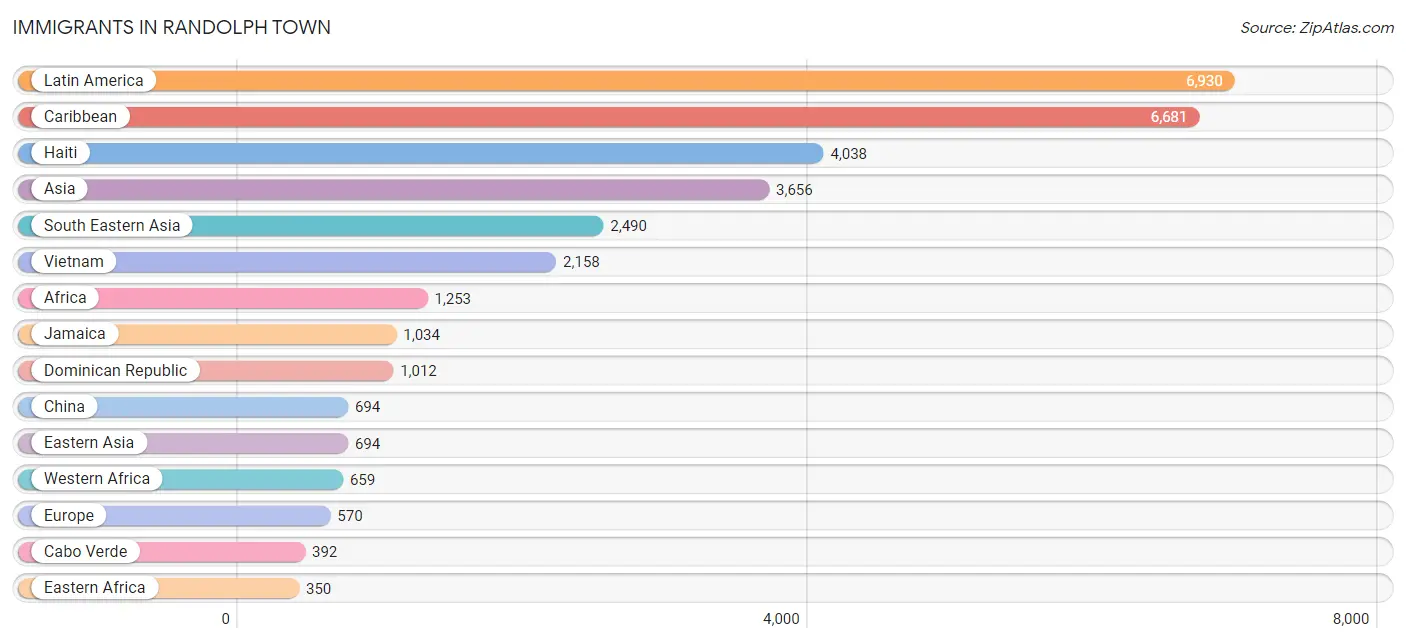
Immigrants in Randolph Town
The most numerous immigrant groups reported in Randolph Town came from Latin America (6,930 | 20.0%), Caribbean (6,681 | 19.3%), Haiti (4,038 | 11.6%), Asia (3,656 | 10.5%), and South Eastern Asia (2,490 | 7.2%), together accounting for 68.6% of all Randolph Town residents.
| Immigration Origin | # Population | % Population |
| Africa | 1,253 | 3.6% |
| Asia | 3,656 | 10.5% |
| Bangladesh | 41 | 0.1% |
| Barbados | 250 | 0.7% |
| Brazil | 99 | 0.3% |
| Bulgaria | 26 | 0.1% |
| Cabo Verde | 392 | 1.1% |
| Cambodia | 41 | 0.1% |
| Canada | 81 | 0.2% |
| Caribbean | 6,681 | 19.3% |
| Central America | 87 | 0.3% |
| China | 694 | 2.0% |
| Dominica | 94 | 0.3% |
| Dominican Republic | 1,012 | 2.9% |
| Eastern Africa | 350 | 1.0% |
| Eastern Asia | 694 | 2.0% |
| Eastern Europe | 262 | 0.8% |
| Egypt | 80 | 0.2% |
| El Salvador | 9 | 0.0% |
| England | 4 | 0.0% |
| Ethiopia | 35 | 0.1% |
| Europe | 570 | 1.6% |
| Germany | 33 | 0.1% |
| Ghana | 38 | 0.1% |
| Greece | 142 | 0.4% |
| Grenada | 67 | 0.2% |
| Guatemala | 55 | 0.2% |
| Guyana | 63 | 0.2% |
| Haiti | 4,038 | 11.6% |
| Honduras | 14 | 0.0% |
| Hong Kong | 158 | 0.5% |
| Hungary | 23 | 0.1% |
| India | 214 | 0.6% |
| Indonesia | 23 | 0.1% |
| Iran | 27 | 0.1% |
| Iraq | 69 | 0.2% |
| Ireland | 52 | 0.2% |
| Italy | 16 | 0.1% |
| Jamaica | 1,034 | 3.0% |
| Kazakhstan | 26 | 0.1% |
| Kenya | 197 | 0.6% |
| Latin America | 6,930 | 20.0% |
| Lebanon | 50 | 0.1% |
| Mexico | 9 | 0.0% |
| Middle Africa | 74 | 0.2% |
| Moldova | 27 | 0.1% |
| Morocco | 33 | 0.1% |
| Nigeria | 61 | 0.2% |
| Northern Africa | 113 | 0.3% |
| Northern Europe | 56 | 0.2% |
| Pakistan | 18 | 0.1% |
| Philippines | 264 | 0.8% |
| Poland | 186 | 0.5% |
| Portugal | 40 | 0.1% |
| Saudi Arabia | 27 | 0.1% |
| Senegal | 20 | 0.1% |
| Sierra Leone | 40 | 0.1% |
| South America | 162 | 0.5% |
| South Central Asia | 326 | 0.9% |
| South Eastern Asia | 2,490 | 7.2% |
| Southern Europe | 219 | 0.6% |
| Spain | 21 | 0.1% |
| St. Vincent and the Grenadines | 77 | 0.2% |
| Thailand | 4 | 0.0% |
| Trinidad and Tobago | 36 | 0.1% |
| Uganda | 26 | 0.1% |
| Vietnam | 2,158 | 6.2% |
| Western Africa | 659 | 1.9% |
| Western Asia | 146 | 0.4% |
| Western Europe | 33 | 0.1% | View All 70 Rows |
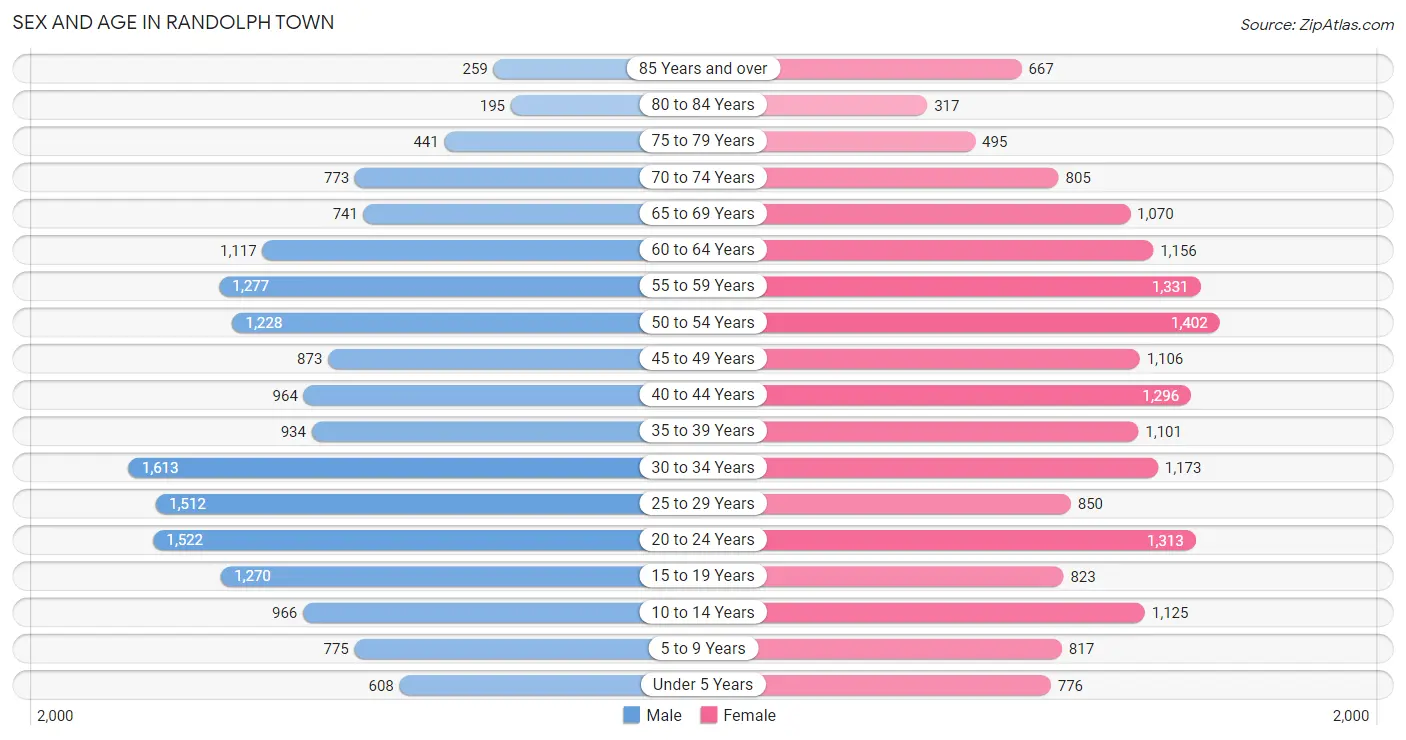
Sex and Age in Randolph Town
Sex and Age in Randolph Town
The most populous age groups in Randolph Town are 30 to 34 Years (1,613 | 9.5%) for men and 50 to 54 Years (1,402 | 8.0%) for women.
| Age Bracket | Male | Female |
| Under 5 Years | 608 (3.6%) | 776 (4.4%) |
| 5 to 9 Years | 775 (4.5%) | 817 (4.6%) |
| 10 to 14 Years | 966 (5.7%) | 1,125 (6.4%) |
| 15 to 19 Years | 1,270 (7.4%) | 823 (4.7%) |
| 20 to 24 Years | 1,522 (8.9%) | 1,313 (7.4%) |
| 25 to 29 Years | 1,512 (8.9%) | 850 (4.8%) |
| 30 to 34 Years | 1,613 (9.5%) | 1,173 (6.7%) |
| 35 to 39 Years | 934 (5.5%) | 1,101 (6.2%) |
| 40 to 44 Years | 964 (5.7%) | 1,296 (7.3%) |
| 45 to 49 Years | 873 (5.1%) | 1,106 (6.3%) |
| 50 to 54 Years | 1,228 (7.2%) | 1,402 (8.0%) |
| 55 to 59 Years | 1,277 (7.5%) | 1,331 (7.5%) |
| 60 to 64 Years | 1,117 (6.5%) | 1,156 (6.6%) |
| 65 to 69 Years | 741 (4.3%) | 1,070 (6.1%) |
| 70 to 74 Years | 773 (4.5%) | 805 (4.6%) |
| 75 to 79 Years | 441 (2.6%) | 495 (2.8%) |
| 80 to 84 Years | 195 (1.1%) | 317 (1.8%) |
| 85 Years and over | 259 (1.5%) | 667 (3.8%) |
| Total | 17,068 (100.0%) | 17,623 (100.0%) |
Families and Households in Randolph Town
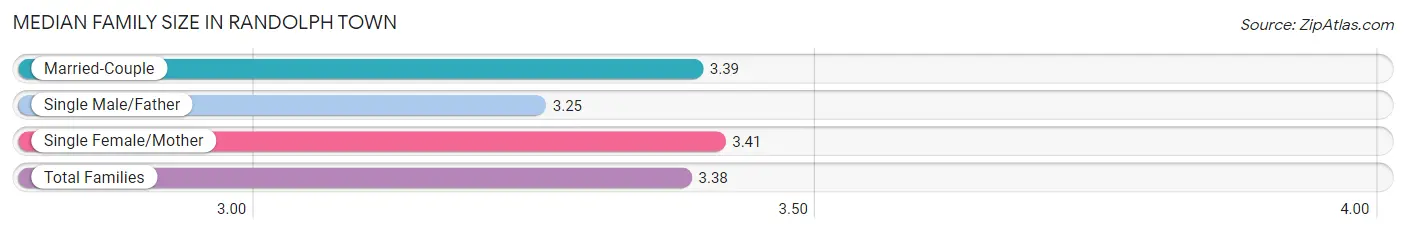
Median Family Size in Randolph Town
The median family size in Randolph Town is 3.38 persons per family, with single female/mother families (2,591 | 29.9%) accounting for the largest median family size of 3.41 persons per family. On the other hand, single male/father families (737 | 8.5%) represent the smallest median family size with 3.25 persons per family.
| Family Type | # Families | Family Size |
| Married-Couple | 5,326 (61.5%) | 3.39 |
| Single Male/Father | 737 (8.5%) | 3.25 |
| Single Female/Mother | 2,591 (29.9%) | 3.41 |
| Total Families | 8,654 (100.0%) | 3.38 |
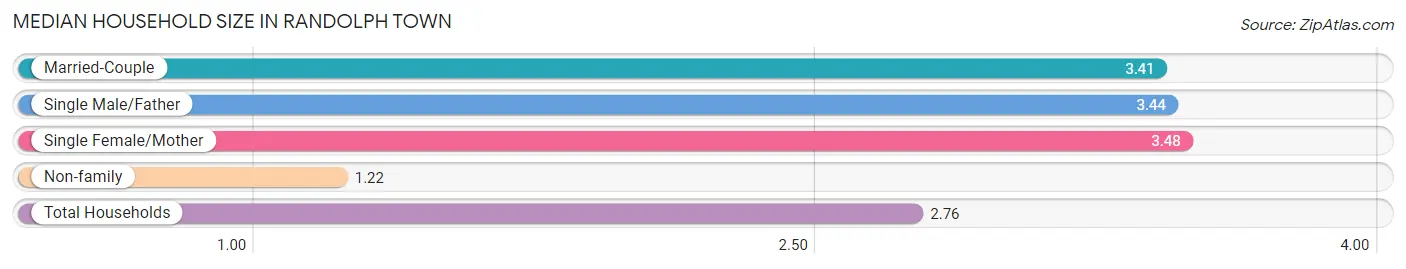
Median Household Size in Randolph Town
The median household size in Randolph Town is 2.76 persons per household, with single female/mother households (2,591 | 20.8%) accounting for the largest median household size of 3.48 persons per household. non-family households (3,791 | 30.5%) represent the smallest median household size with 1.22 persons per household.
| Household Type | # Households | Household Size |
| Married-Couple | 5,326 (42.8%) | 3.41 |
| Single Male/Father | 737 (5.9%) | 3.44 |
| Single Female/Mother | 2,591 (20.8%) | 3.48 |
| Non-family | 3,791 (30.5%) | 1.22 |
| Total Households | 12,445 (100.0%) | 2.76 |
Household Size by Marriage Status in Randolph Town
Out of a total of 12,445 households in Randolph Town, 8,654 (69.5%) are family households, while 3,791 (30.5%) are nonfamily households. The most numerous type of family households are 2-person households, comprising 2,832, and the most common type of nonfamily households are 1-person households, comprising 3,139.
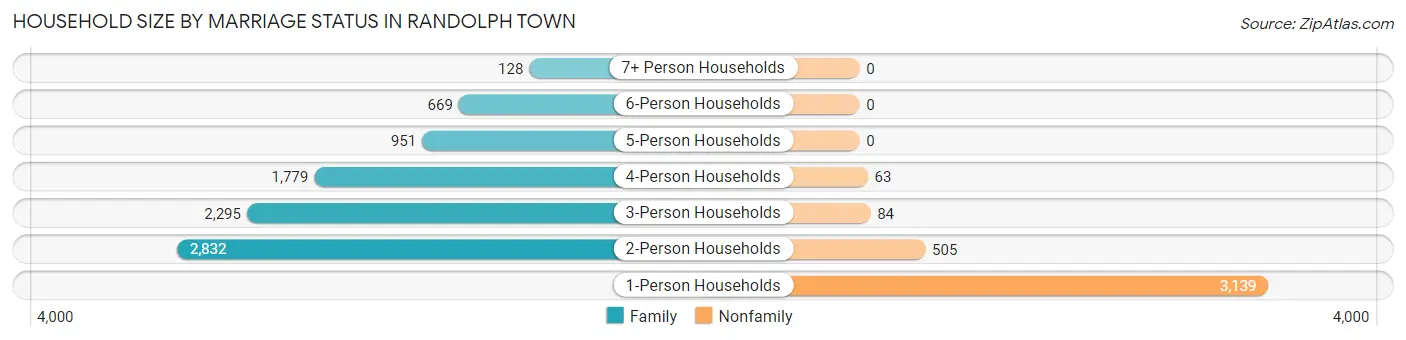
| Household Size | Family Households | Nonfamily Households |
| 1-Person Households | - | 3,139 (25.2%) |
| 2-Person Households | 2,832 (22.8%) | 505 (4.1%) |
| 3-Person Households | 2,295 (18.4%) | 84 (0.7%) |
| 4-Person Households | 1,779 (14.3%) | 63 (0.5%) |
| 5-Person Households | 951 (7.6%) | 0 (0.0%) |
| 6-Person Households | 669 (5.4%) | 0 (0.0%) |
| 7+ Person Households | 128 (1.0%) | 0 (0.0%) |
| Total | 8,654 (69.5%) | 3,791 (30.5%) |
Female Fertility in Randolph Town
Fertility by Age in Randolph Town
Average fertility rate in Randolph Town is 30.0 births per 1,000 women. Women in the age bracket of 20 to 34 years have the highest fertility rate with 49.0 births per 1,000 women. Women in the age bracket of 20 to 34 years acount for 68.8% of all women with births.
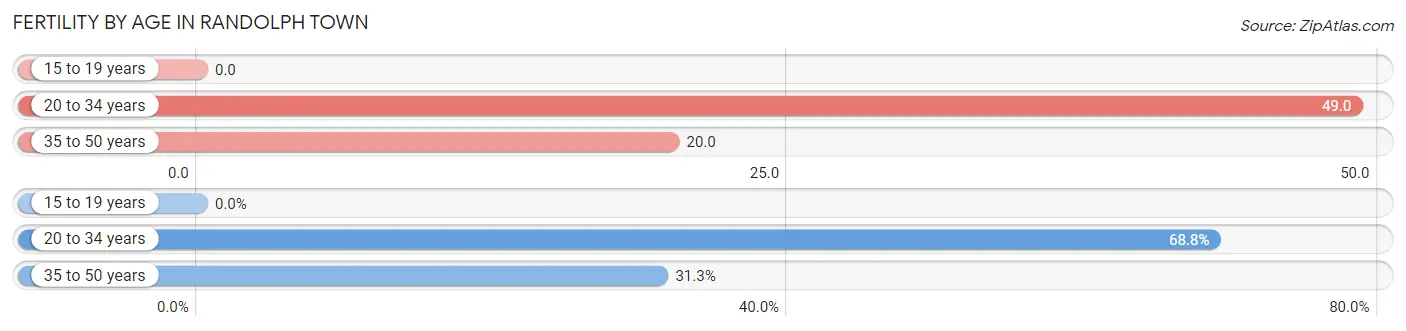
| Age Bracket | Women with Births | Births / 1,000 Women |
| 15 to 19 years | 0 (0.0%) | 0.0 |
| 20 to 34 years | 165 (68.8%) | 49.0 |
| 35 to 50 years | 75 (31.2%) | 20.0 |
| Total | 240 (100.0%) | 30.0 |
Fertility by Age by Marriage Status in Randolph Town
78.7% of women with births (240) in Randolph Town are married. The highest percentage of unmarried women with births falls into 35 to 50 years age bracket with 44.0% of them unmarried at the time of birth, while the lowest percentage of unmarried women with births belong to 20 to 34 years age bracket with 10.9% of them unmarried.
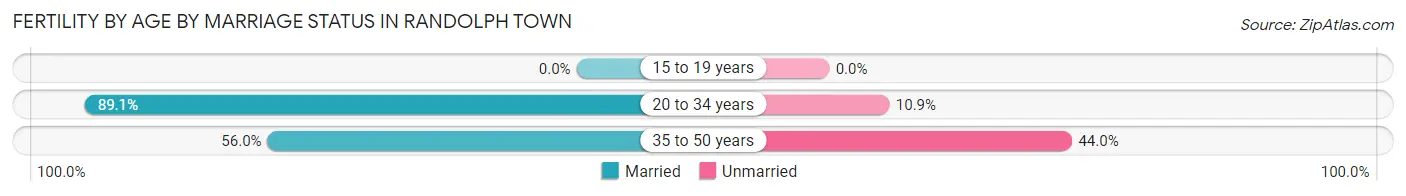
| Age Bracket | Married | Unmarried |
| 15 to 19 years | 0 (0.0%) | 0 (0.0%) |
| 20 to 34 years | 147 (89.1%) | 18 (10.9%) |
| 35 to 50 years | 42 (56.0%) | 33 (44.0%) |
| Total | 189 (78.7%) | 51 (21.2%) |
Fertility by Education in Randolph Town
Average fertility rate in Randolph Town is 30.0 births per 1,000 women. Women with the education attainment of graduate degree have the highest fertility rate of 135.0 births per 1,000 women, while women with the education attainment of less than high school have the lowest fertility at 11.0 births per 1,000 women. Women with the education attainment of graduate degree represent 46.7% of all women with births.
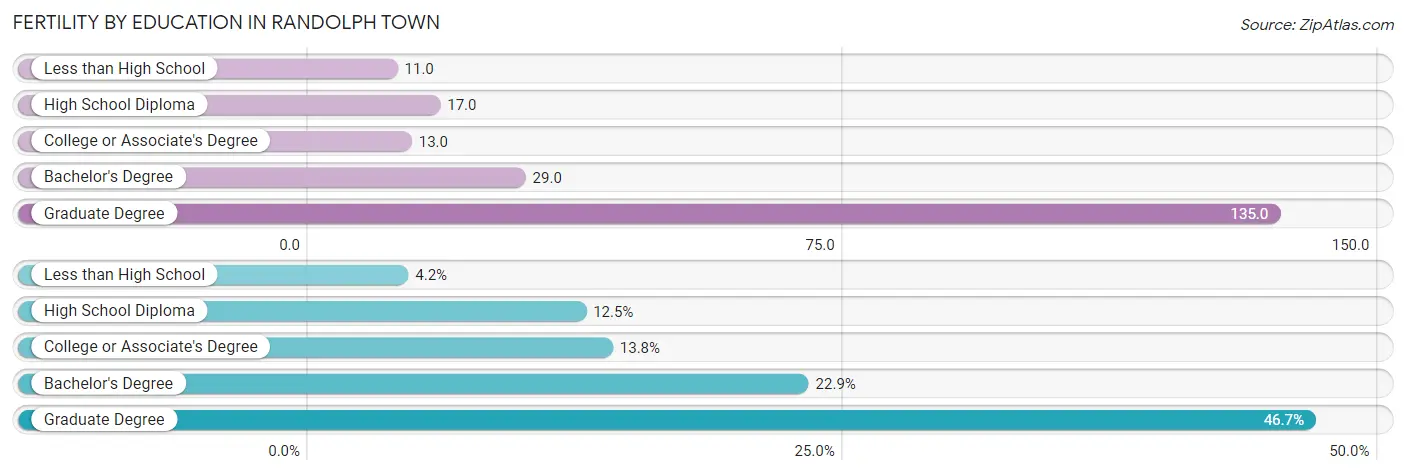
| Educational Attainment | Women with Births | Births / 1,000 Women |
| Less than High School | 10 (4.2%) | 11.0 |
| High School Diploma | 30 (12.5%) | 17.0 |
| College or Associate's Degree | 33 (13.8%) | 13.0 |
| Bachelor's Degree | 55 (22.9%) | 29.0 |
| Graduate Degree | 112 (46.7%) | 135.0 |
| Total | 240 (100.0%) | 30.0 |
Fertility by Education by Marriage Status in Randolph Town
21.2% of women with births in Randolph Town are unmarried. Women with the educational attainment of less than high school are most likely to be married with 100.0% of them married at childbirth, while women with the educational attainment of college or associate's degree are least likely to be married with 100.0% of them unmarried at childbirth.
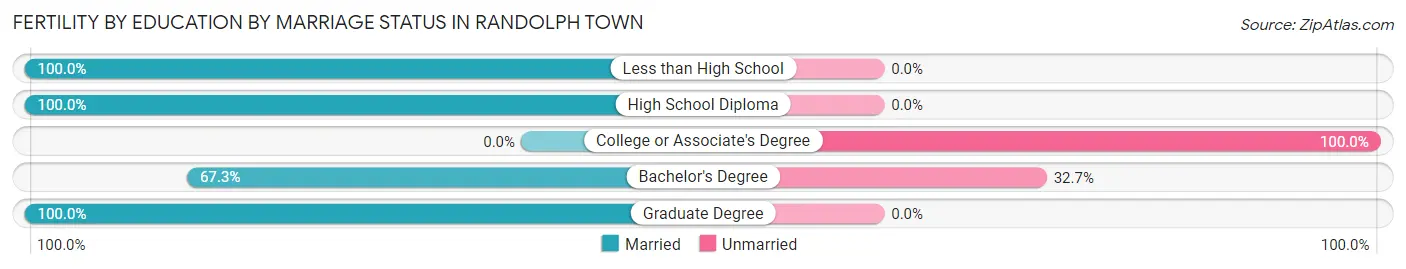
| Educational Attainment | Married | Unmarried |
| Less than High School | 10 (100.0%) | 0 (0.0%) |
| High School Diploma | 30 (100.0%) | 0 (0.0%) |
| College or Associate's Degree | 0 (0.0%) | 33 (100.0%) |
| Bachelor's Degree | 37 (67.3%) | 18 (32.7%) |
| Graduate Degree | 112 (100.0%) | 0 (0.0%) |
| Total | 189 (78.7%) | 51 (21.2%) |
Employment Characteristics in Randolph Town
Employment by Class of Employer in Randolph Town
Among the 17,762 employed individuals in Randolph Town, private company employees (11,274 | 63.5%), not-for-profit organizations (3,436 | 19.3%), and state government employees (1,022 | 5.8%) make up the most common classes of employment.
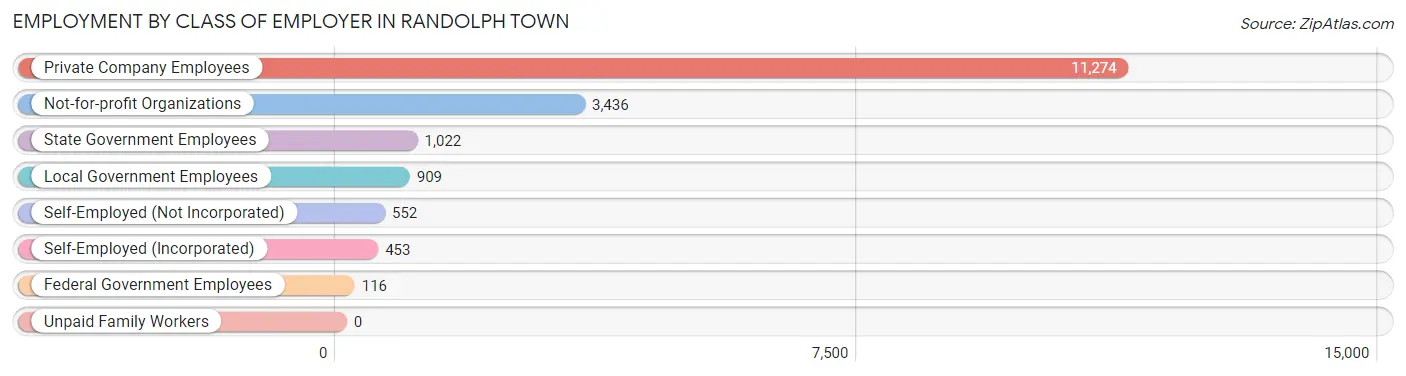
| Employer Class | # Employees | % Employees |
| Private Company Employees | 11,274 | 63.5% |
| Self-Employed (Incorporated) | 453 | 2.5% |
| Self-Employed (Not Incorporated) | 552 | 3.1% |
| Not-for-profit Organizations | 3,436 | 19.3% |
| Local Government Employees | 909 | 5.1% |
| State Government Employees | 1,022 | 5.8% |
| Federal Government Employees | 116 | 0.6% |
| Unpaid Family Workers | 0 | 0.0% |
| Total | 17,762 | 100.0% |
Employment Status by Age in Randolph Town
According to the labor force statistics for Randolph Town, out of the total population over 16 years of age (29,173), 68.6% or 20,013 individuals are in the labor force, with 8.3% or 1,661 of them unemployed. The age group with the highest labor force participation rate is 30 to 34 years, with 88.3% or 2,460 individuals in the labor force. Within the labor force, the 20 to 24 years age range has the highest percentage of unemployed individuals, with 26.0% or 574 of them being unemployed.
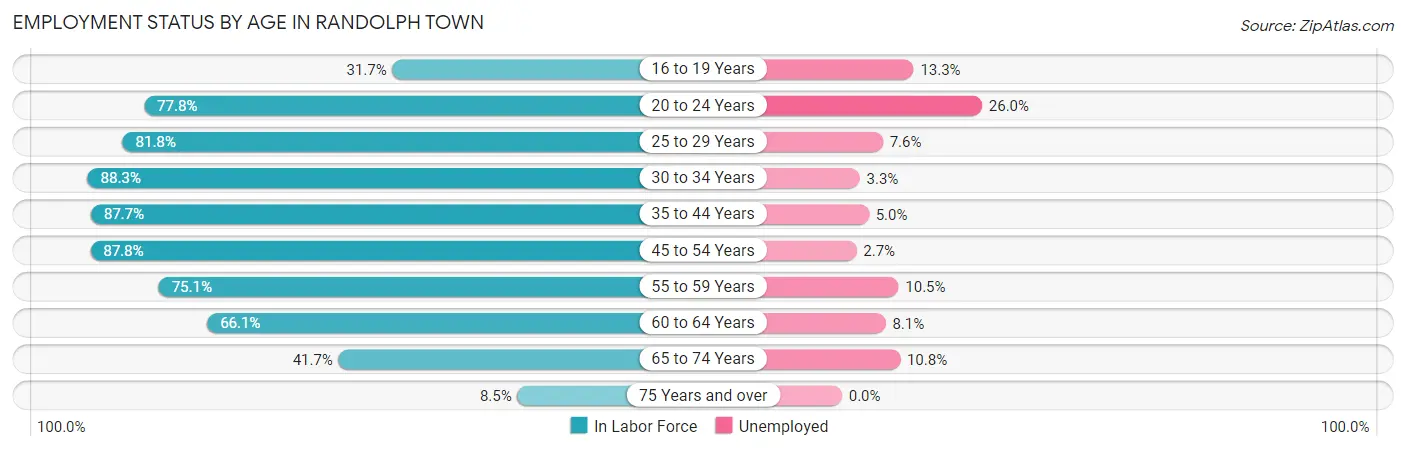
| Age Bracket | In Labor Force | Unemployed |
| 16 to 19 Years | 521 (31.7%) | 69 (13.3%) |
| 20 to 24 Years | 2,206 (77.8%) | 574 (26.0%) |
| 25 to 29 Years | 1,932 (81.8%) | 147 (7.6%) |
| 30 to 34 Years | 2,460 (88.3%) | 81 (3.3%) |
| 35 to 44 Years | 3,767 (87.7%) | 188 (5.0%) |
| 45 to 54 Years | 4,047 (87.8%) | 109 (2.7%) |
| 55 to 59 Years | 1,959 (75.1%) | 206 (10.5%) |
| 60 to 64 Years | 1,502 (66.1%) | 122 (8.1%) |
| 65 to 74 Years | 1,413 (41.7%) | 153 (10.8%) |
| 75 Years and over | 202 (8.5%) | 0 (0.0%) |
| Total | 20,013 (68.6%) | 1,661 (8.3%) |
Employment Status by Educational Attainment in Randolph Town
According to labor force statistics for Randolph Town, 82.7% of individuals (15,658) out of the total population between 25 and 64 years of age (18,933) are in the labor force, with 5.5% or 861 of them being unemployed. The group with the highest labor force participation rate are those with the educational attainment of bachelor's degree or higher, with 90.6% or 6,089 individuals in the labor force. Within the labor force, individuals with less than high school education have the highest percentage of unemployment, with 14.9% or 178 of them being unemployed.
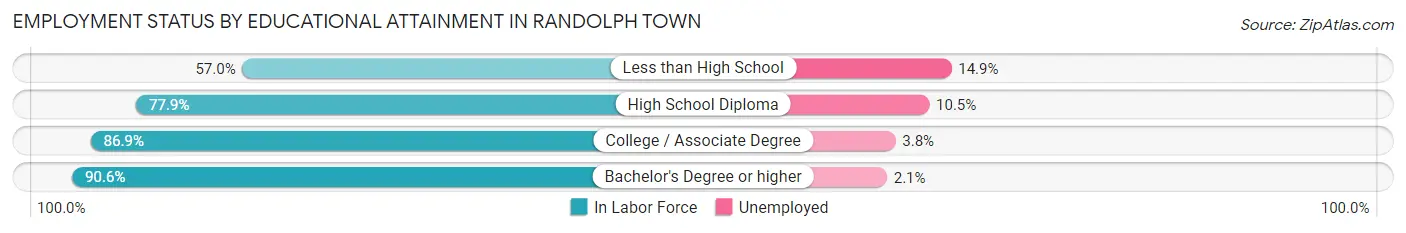
| Educational Attainment | In Labor Force | Unemployed |
| Less than High School | 1,192 (57.0%) | 312 (14.9%) |
| High School Diploma | 3,503 (77.9%) | 472 (10.5%) |
| College / Associate Degree | 4,887 (86.9%) | 214 (3.8%) |
| Bachelor's Degree or higher | 6,089 (90.6%) | 141 (2.1%) |
| Total | 15,658 (82.7%) | 1,041 (5.5%) |
Employment Occupations by Sex in Randolph Town
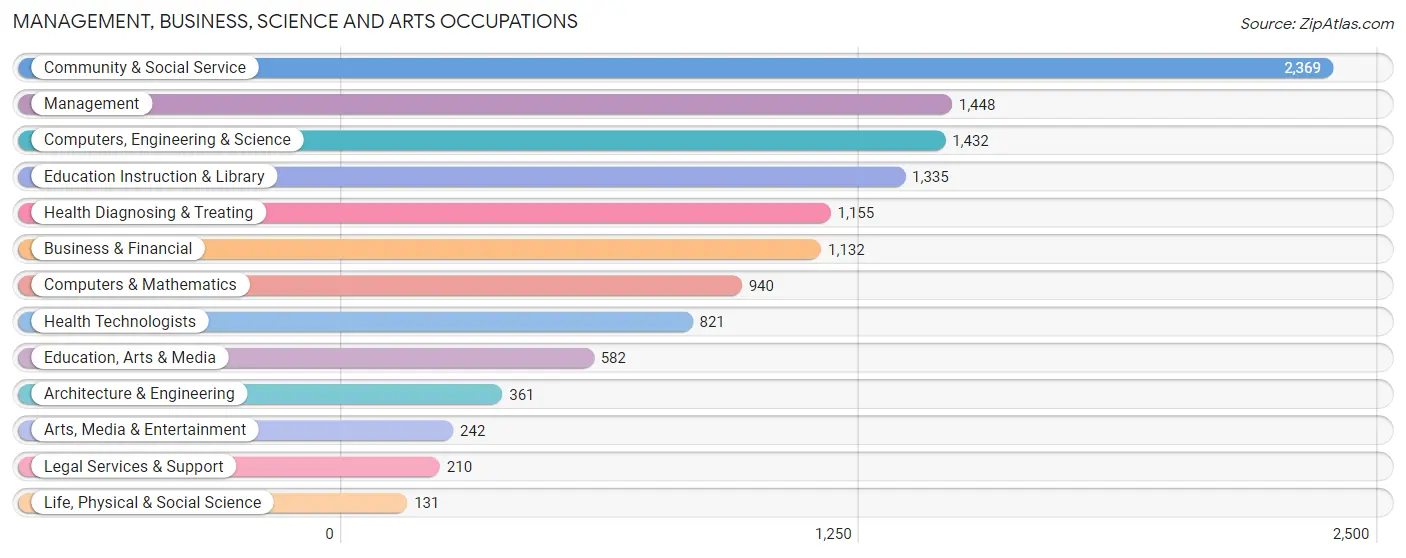
Management, Business, Science and Arts Occupations
The most common Management, Business, Science and Arts occupations in Randolph Town are Community & Social Service (2,369 | 12.9%), Management (1,448 | 7.9%), Computers, Engineering & Science (1,432 | 7.8%), Education Instruction & Library (1,335 | 7.3%), and Health Diagnosing & Treating (1,155 | 6.3%).
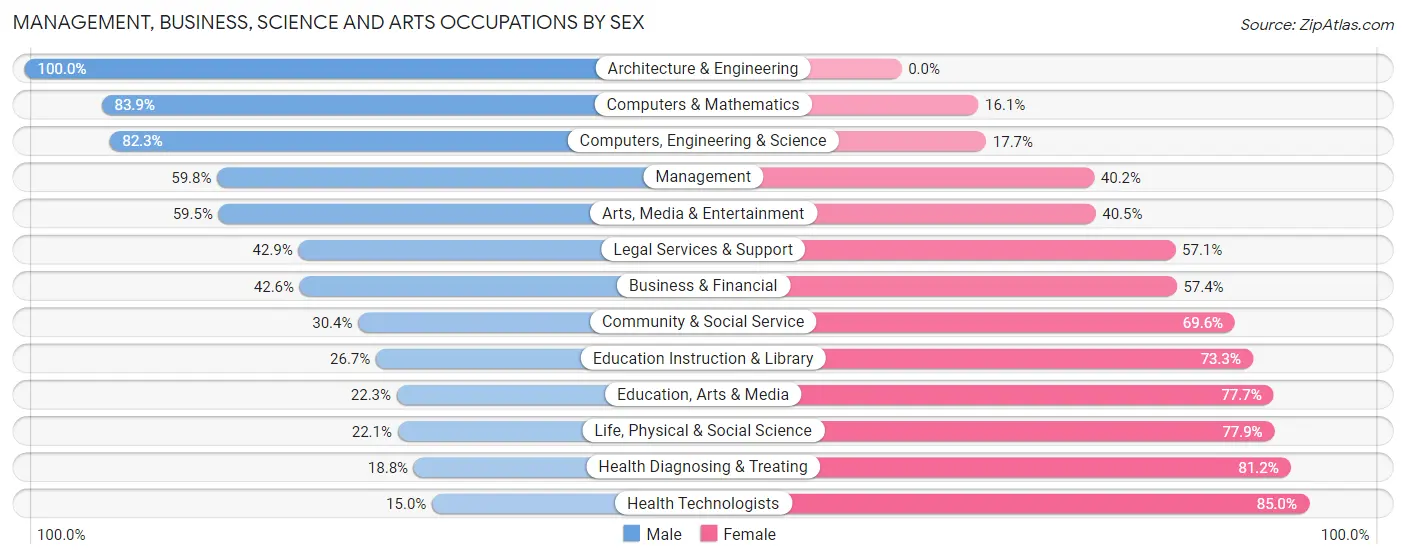
Management, Business, Science and Arts Occupations by Sex
Within the Management, Business, Science and Arts occupations in Randolph Town, the most male-oriented occupations are Architecture & Engineering (100.0%), Computers & Mathematics (83.9%), and Computers, Engineering & Science (82.3%), while the most female-oriented occupations are Health Technologists (85.0%), Health Diagnosing & Treating (81.2%), and Life, Physical & Social Science (77.9%).
| Occupation | Male | Female |
| Management | 866 (59.8%) | 582 (40.2%) |
| Business & Financial | 482 (42.6%) | 650 (57.4%) |
| Computers, Engineering & Science | 1,179 (82.3%) | 253 (17.7%) |
| Computers & Mathematics | 789 (83.9%) | 151 (16.1%) |
| Architecture & Engineering | 361 (100.0%) | 0 (0.0%) |
| Life, Physical & Social Science | 29 (22.1%) | 102 (77.9%) |
| Community & Social Service | 720 (30.4%) | 1,649 (69.6%) |
| Education, Arts & Media | 130 (22.3%) | 452 (77.7%) |
| Legal Services & Support | 90 (42.9%) | 120 (57.1%) |
| Education Instruction & Library | 356 (26.7%) | 979 (73.3%) |
| Arts, Media & Entertainment | 144 (59.5%) | 98 (40.5%) |
| Health Diagnosing & Treating | 217 (18.8%) | 938 (81.2%) |
| Health Technologists | 123 (15.0%) | 698 (85.0%) |
| Total (Category) | 3,464 (46.0%) | 4,072 (54.0%) |
| Total (Overall) | 9,394 (51.2%) | 8,935 (48.7%) |
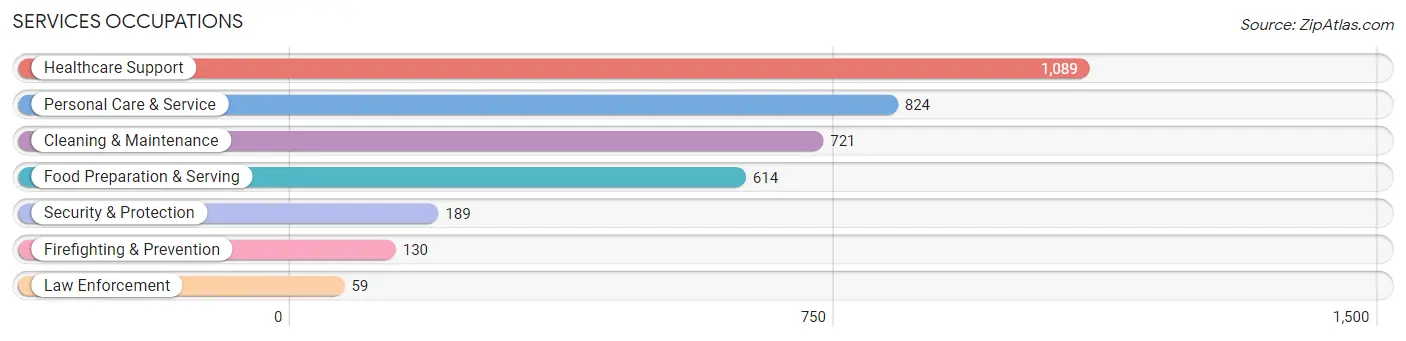
Services Occupations
The most common Services occupations in Randolph Town are Healthcare Support (1,089 | 5.9%), Personal Care & Service (824 | 4.5%), Cleaning & Maintenance (721 | 3.9%), Food Preparation & Serving (614 | 3.4%), and Security & Protection (189 | 1.0%).
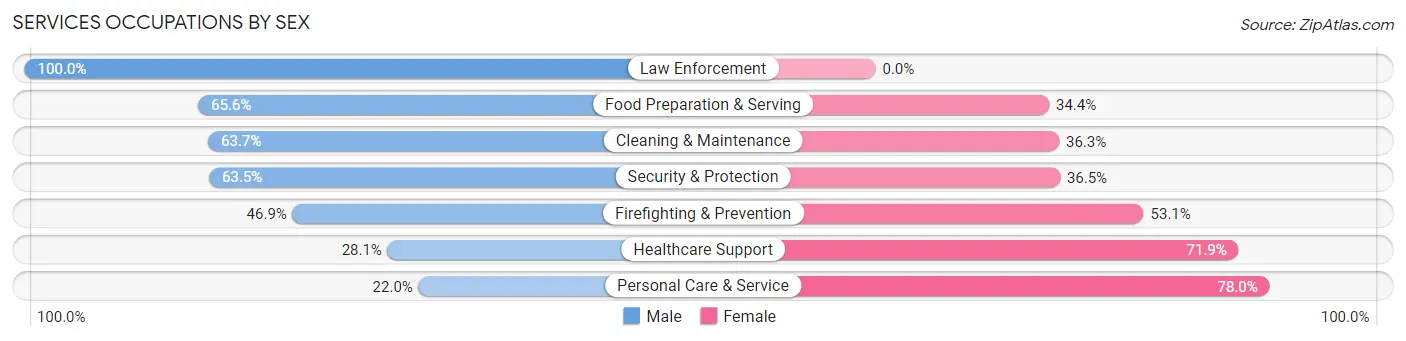
Services Occupations by Sex
Within the Services occupations in Randolph Town, the most male-oriented occupations are Law Enforcement (100.0%), Food Preparation & Serving (65.6%), and Cleaning & Maintenance (63.7%), while the most female-oriented occupations are Personal Care & Service (78.0%), Healthcare Support (71.9%), and Firefighting & Prevention (53.1%).
| Occupation | Male | Female |
| Healthcare Support | 306 (28.1%) | 783 (71.9%) |
| Security & Protection | 120 (63.5%) | 69 (36.5%) |
| Firefighting & Prevention | 61 (46.9%) | 69 (53.1%) |
| Law Enforcement | 59 (100.0%) | 0 (0.0%) |
| Food Preparation & Serving | 403 (65.6%) | 211 (34.4%) |
| Cleaning & Maintenance | 459 (63.7%) | 262 (36.3%) |
| Personal Care & Service | 181 (22.0%) | 643 (78.0%) |
| Total (Category) | 1,469 (42.7%) | 1,968 (57.3%) |
| Total (Overall) | 9,394 (51.2%) | 8,935 (48.7%) |
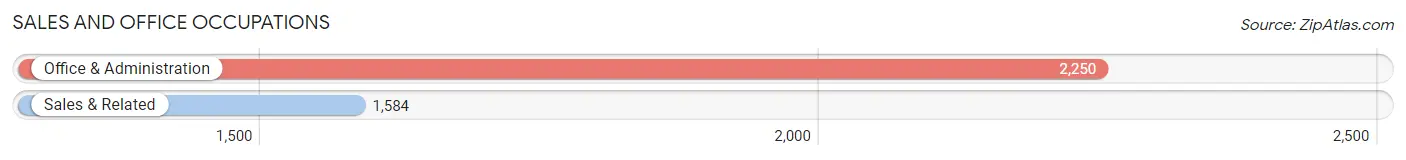
Sales and Office Occupations
The most common Sales and Office occupations in Randolph Town are Office & Administration (2,250 | 12.3%), and Sales & Related (1,584 | 8.6%).
Sales and Office Occupations by Sex
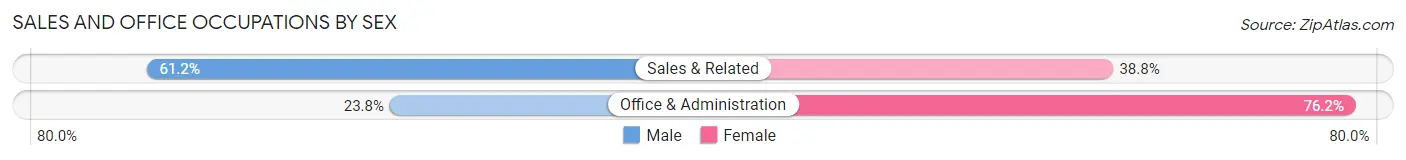
| Occupation | Male | Female |
| Sales & Related | 970 (61.2%) | 614 (38.8%) |
| Office & Administration | 536 (23.8%) | 1,714 (76.2%) |
| Total (Category) | 1,506 (39.3%) | 2,328 (60.7%) |
| Total (Overall) | 9,394 (51.2%) | 8,935 (48.7%) |
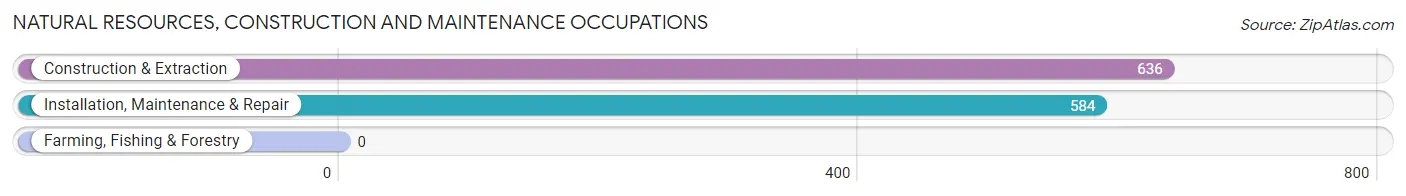
Natural Resources, Construction and Maintenance Occupations
The most common Natural Resources, Construction and Maintenance occupations in Randolph Town are Construction & Extraction (636 | 3.5%), and Installation, Maintenance & Repair (584 | 3.2%).
Natural Resources, Construction and Maintenance Occupations by Sex
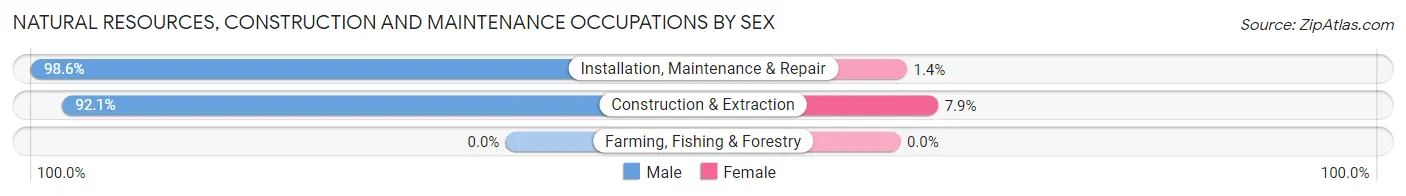
| Occupation | Male | Female |
| Farming, Fishing & Forestry | 0 (0.0%) | 0 (0.0%) |
| Construction & Extraction | 586 (92.1%) | 50 (7.9%) |
| Installation, Maintenance & Repair | 576 (98.6%) | 8 (1.4%) |
| Total (Category) | 1,162 (95.3%) | 58 (4.8%) |
| Total (Overall) | 9,394 (51.2%) | 8,935 (48.7%) |
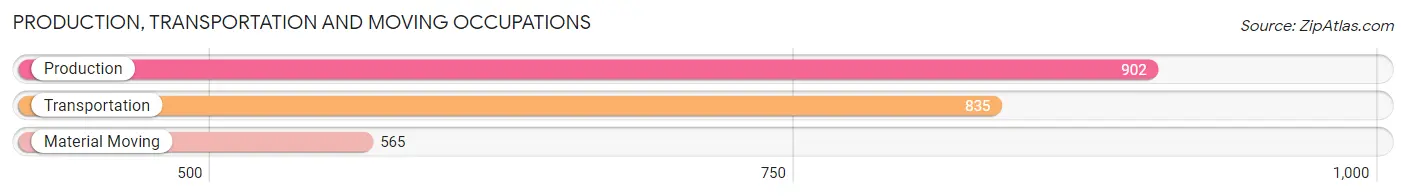
Production, Transportation and Moving Occupations
The most common Production, Transportation and Moving occupations in Randolph Town are Production (902 | 4.9%), Transportation (835 | 4.6%), and Material Moving (565 | 3.1%).
Production, Transportation and Moving Occupations by Sex
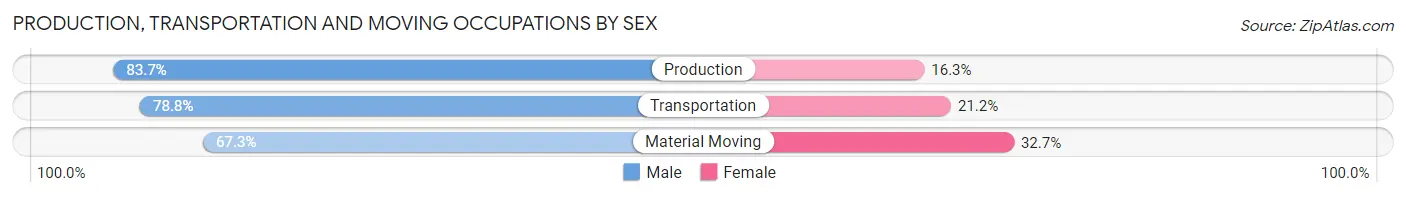
| Occupation | Male | Female |
| Production | 755 (83.7%) | 147 (16.3%) |
| Transportation | 658 (78.8%) | 177 (21.2%) |
| Material Moving | 380 (67.3%) | 185 (32.7%) |
| Total (Category) | 1,793 (77.9%) | 509 (22.1%) |
| Total (Overall) | 9,394 (51.2%) | 8,935 (48.7%) |
Employment Industries by Sex in Randolph Town
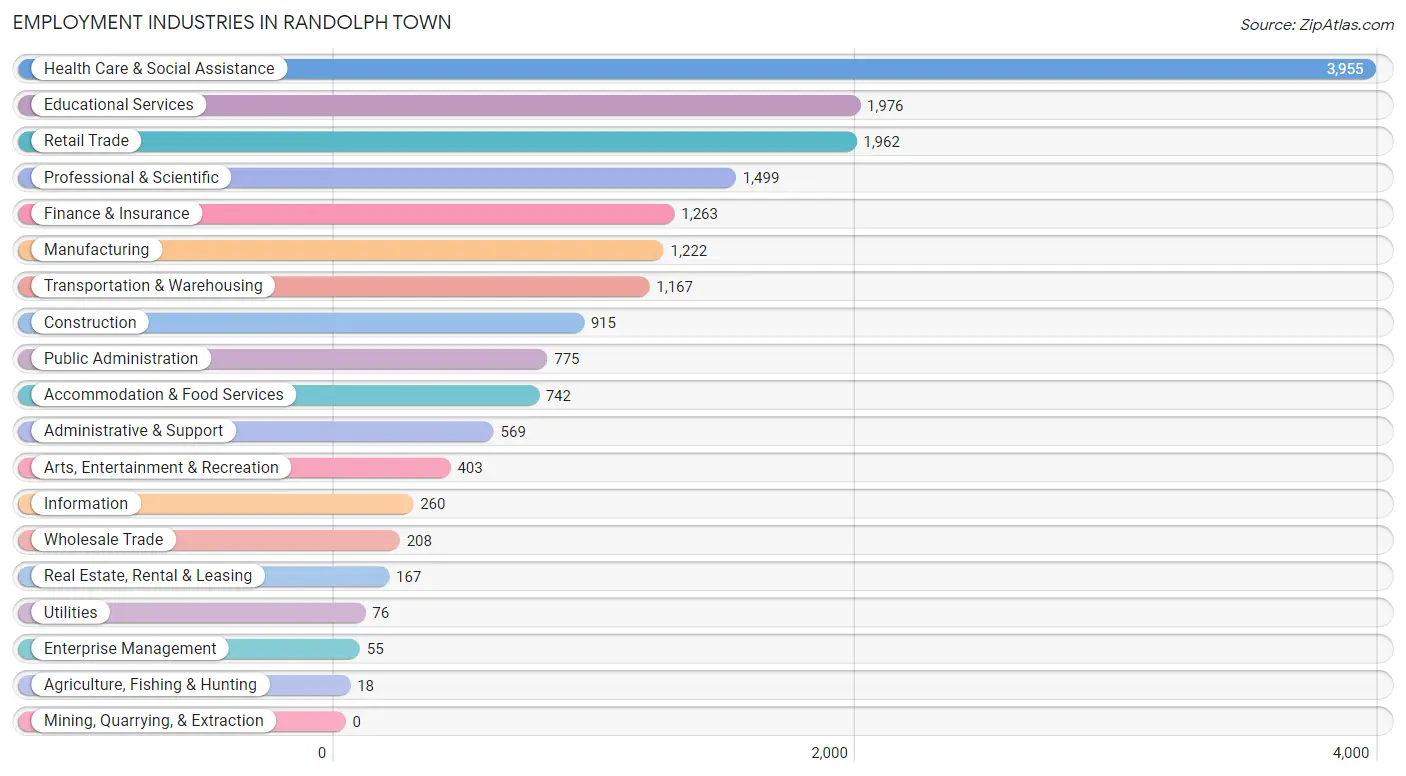
Employment Industries in Randolph Town
The major employment industries in Randolph Town include Health Care & Social Assistance (3,955 | 21.6%), Educational Services (1,976 | 10.8%), Retail Trade (1,962 | 10.7%), Professional & Scientific (1,499 | 8.2%), and Finance & Insurance (1,263 | 6.9%).
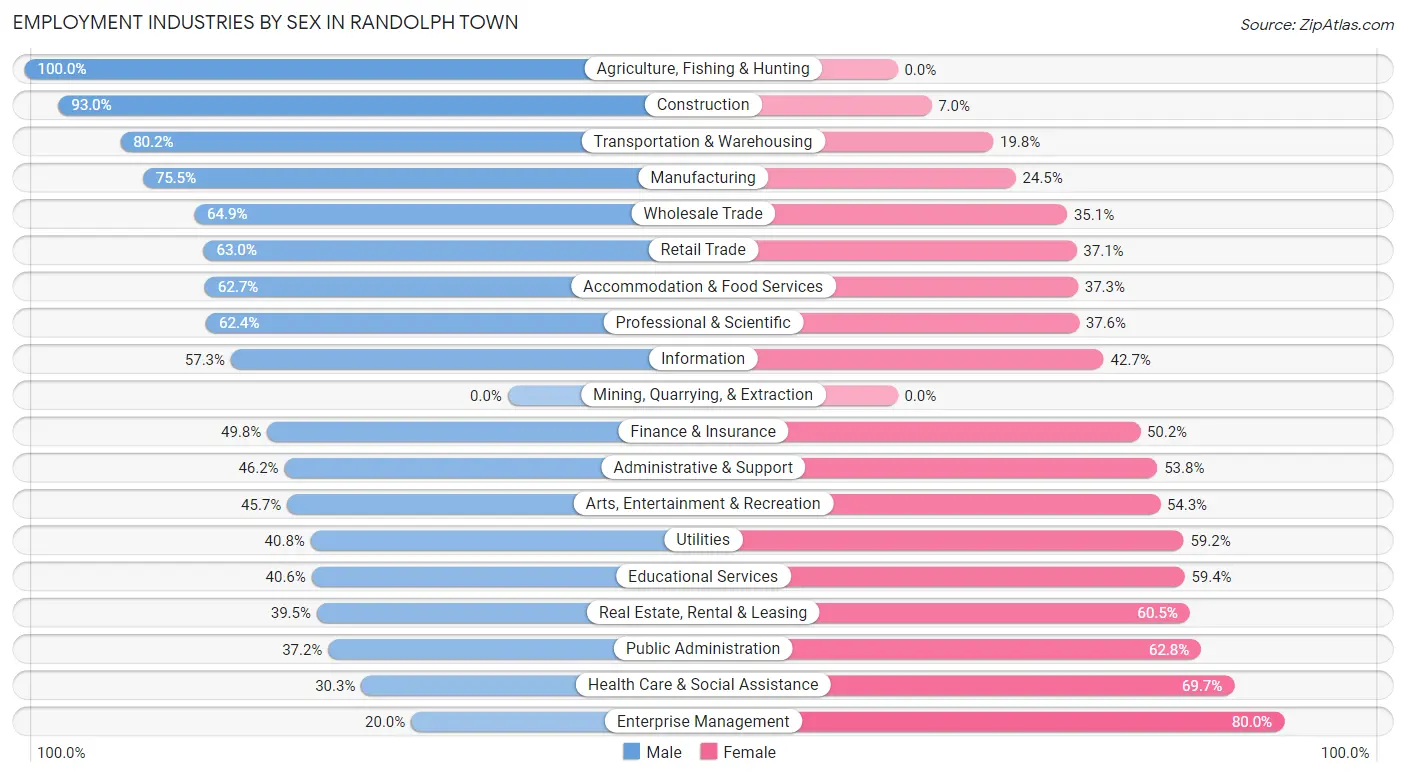
Employment Industries by Sex in Randolph Town
The Randolph Town industries that see more men than women are Agriculture, Fishing & Hunting (100.0%), Construction (93.0%), and Transportation & Warehousing (80.2%), whereas the industries that tend to have a higher number of women are Enterprise Management (80.0%), Health Care & Social Assistance (69.7%), and Public Administration (62.8%).
| Industry | Male | Female |
| Agriculture, Fishing & Hunting | 18 (100.0%) | 0 (0.0%) |
| Mining, Quarrying, & Extraction | 0 (0.0%) | 0 (0.0%) |
| Construction | 851 (93.0%) | 64 (7.0%) |
| Manufacturing | 923 (75.5%) | 299 (24.5%) |
| Wholesale Trade | 135 (64.9%) | 73 (35.1%) |
| Retail Trade | 1,235 (62.9%) | 727 (37.0%) |
| Transportation & Warehousing | 936 (80.2%) | 231 (19.8%) |
| Utilities | 31 (40.8%) | 45 (59.2%) |
| Information | 149 (57.3%) | 111 (42.7%) |
| Finance & Insurance | 629 (49.8%) | 634 (50.2%) |
| Real Estate, Rental & Leasing | 66 (39.5%) | 101 (60.5%) |
| Professional & Scientific | 936 (62.4%) | 563 (37.6%) |
| Enterprise Management | 11 (20.0%) | 44 (80.0%) |
| Administrative & Support | 263 (46.2%) | 306 (53.8%) |
| Educational Services | 802 (40.6%) | 1,174 (59.4%) |
| Health Care & Social Assistance | 1,199 (30.3%) | 2,756 (69.7%) |
| Arts, Entertainment & Recreation | 184 (45.7%) | 219 (54.3%) |
| Accommodation & Food Services | 465 (62.7%) | 277 (37.3%) |
| Public Administration | 288 (37.2%) | 487 (62.8%) |
| Total | 9,394 (51.2%) | 8,935 (48.7%) |
Education in Randolph Town
School Enrollment in Randolph Town
The most common levels of schooling among the 8,930 students in Randolph Town are college / undergraduate (2,333 | 26.1%), high school (1,944 | 21.8%), and middle school (1,643 | 18.4%).
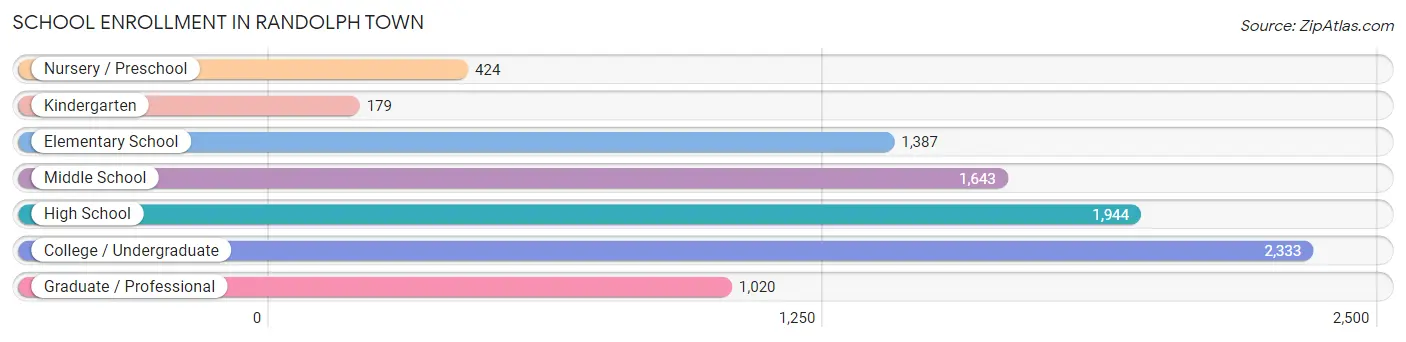
| School Level | # Students | % Students |
| Nursery / Preschool | 424 | 4.8% |
| Kindergarten | 179 | 2.0% |
| Elementary School | 1,387 | 15.5% |
| Middle School | 1,643 | 18.4% |
| High School | 1,944 | 21.8% |
| College / Undergraduate | 2,333 | 26.1% |
| Graduate / Professional | 1,020 | 11.4% |
| Total | 8,930 | 100.0% |
School Enrollment by Age by Funding Source in Randolph Town
Out of a total of 8,930 students who are enrolled in schools in Randolph Town, 3,349 (37.5%) attend a private institution, while the remaining 5,581 (62.5%) are enrolled in public schools. The age group of 25 to 34 year olds has the highest likelihood of being enrolled in private schools, with 535 (68.9% in the age bracket) enrolled. Conversely, the age group of 10 to 14 year olds has the lowest likelihood of being enrolled in a private school, with 1,752 (86.1% in the age bracket) attending a public institution.
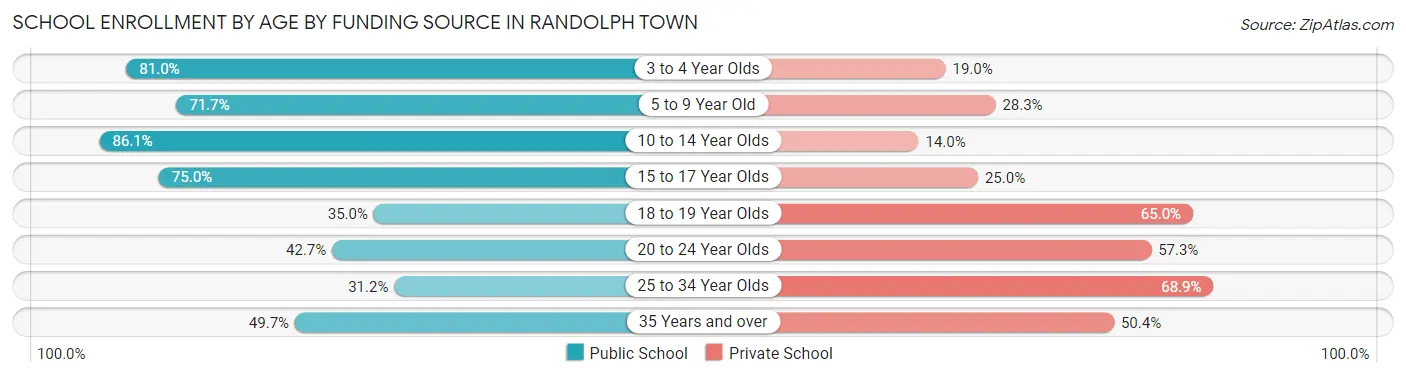
| Age Bracket | Public School | Private School |
| 3 to 4 Year Olds | 205 (81.0%) | 48 (19.0%) |
| 5 to 9 Year Old | 1,109 (71.7%) | 437 (28.3%) |
| 10 to 14 Year Olds | 1,752 (86.1%) | 284 (14.0%) |
| 15 to 17 Year Olds | 1,010 (75.0%) | 337 (25.0%) |
| 18 to 19 Year Olds | 201 (35.0%) | 374 (65.0%) |
| 20 to 24 Year Olds | 780 (42.7%) | 1,046 (57.3%) |
| 25 to 34 Year Olds | 242 (31.1%) | 535 (68.9%) |
| 35 Years and over | 283 (49.6%) | 287 (50.3%) |
| Total | 5,581 (62.5%) | 3,349 (37.5%) |
Educational Attainment by Field of Study in Randolph Town
Business (1,677 | 19.0%), psychology (881 | 10.0%), social sciences (774 | 8.8%), science & technology (719 | 8.1%), and engineering (707 | 8.0%) are the most common fields of study among 8,829 individuals in Randolph Town who have obtained a bachelor's degree or higher.
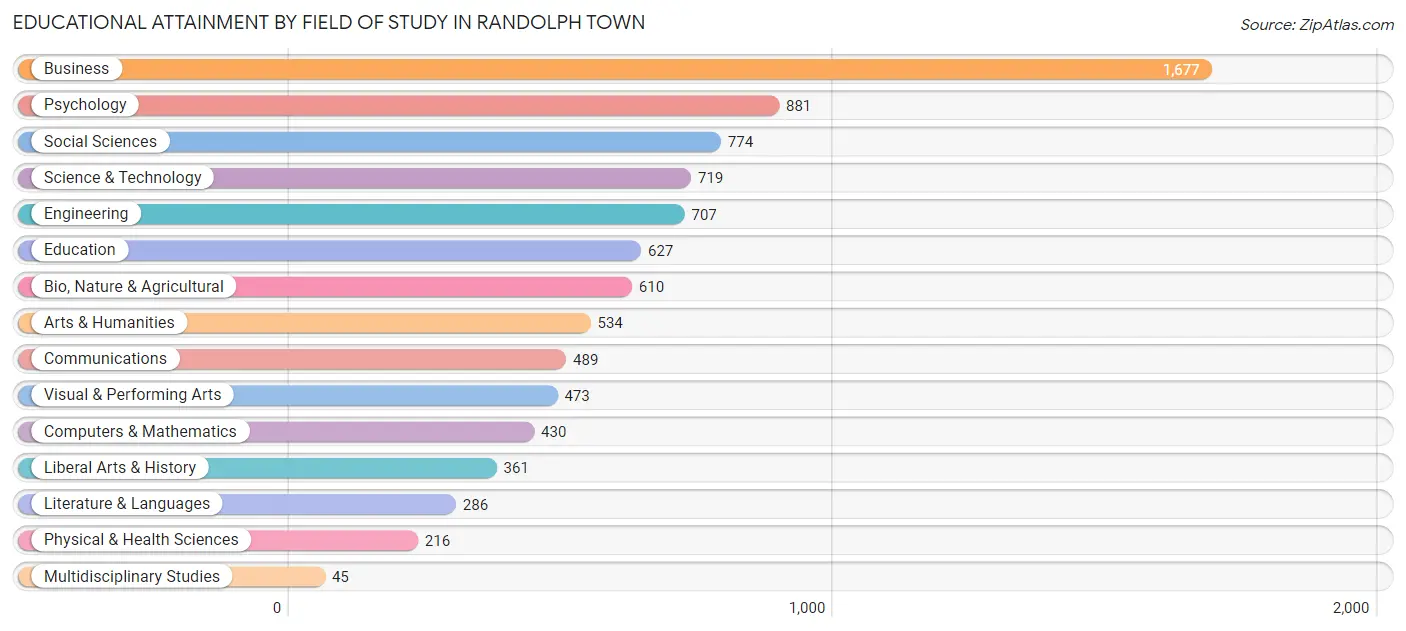
| Field of Study | # Graduates | % Graduates |
| Computers & Mathematics | 430 | 4.9% |
| Bio, Nature & Agricultural | 610 | 6.9% |
| Physical & Health Sciences | 216 | 2.5% |
| Psychology | 881 | 10.0% |
| Social Sciences | 774 | 8.8% |
| Engineering | 707 | 8.0% |
| Multidisciplinary Studies | 45 | 0.5% |
| Science & Technology | 719 | 8.1% |
| Business | 1,677 | 19.0% |
| Education | 627 | 7.1% |
| Literature & Languages | 286 | 3.2% |
| Liberal Arts & History | 361 | 4.1% |
| Visual & Performing Arts | 473 | 5.4% |
| Communications | 489 | 5.5% |
| Arts & Humanities | 534 | 6.0% |
| Total | 8,829 | 100.0% |
Transportation & Commute in Randolph Town
Vehicle Availability by Sex in Randolph Town
The most prevalent vehicle ownership categories in Randolph Town are males with 2 vehicles (3,491, accounting for 38.3%) and females with 2 vehicles (3,913, making up 40.4%).
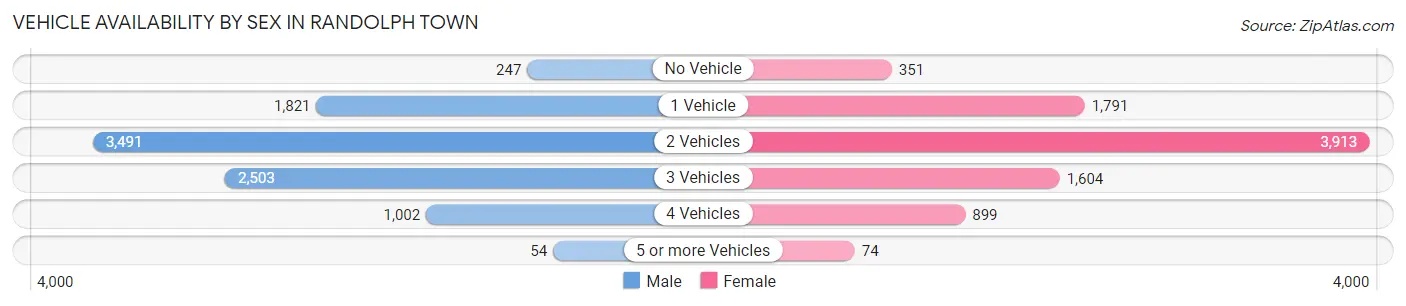
| Vehicles Available | Male | Female |
| No Vehicle | 247 (2.7%) | 351 (4.1%) |
| 1 Vehicle | 1,821 (20.0%) | 1,791 (20.7%) |
| 2 Vehicles | 3,491 (38.3%) | 3,913 (45.3%) |
| 3 Vehicles | 2,503 (27.5%) | 1,604 (18.6%) |
| 4 Vehicles | 1,002 (11.0%) | 899 (10.4%) |
| 5 or more Vehicles | 54 (0.6%) | 74 (0.9%) |
| Total | 9,118 (100.0%) | 8,632 (100.0%) |
Commute Time in Randolph Town
The most frequently occuring commute durations in Randolph Town are 45 to 59 minutes (2,908 commuters, 18.3%), 60 to 89 minutes (2,353 commuters, 14.8%), and 20 to 24 minutes (2,338 commuters, 14.7%).
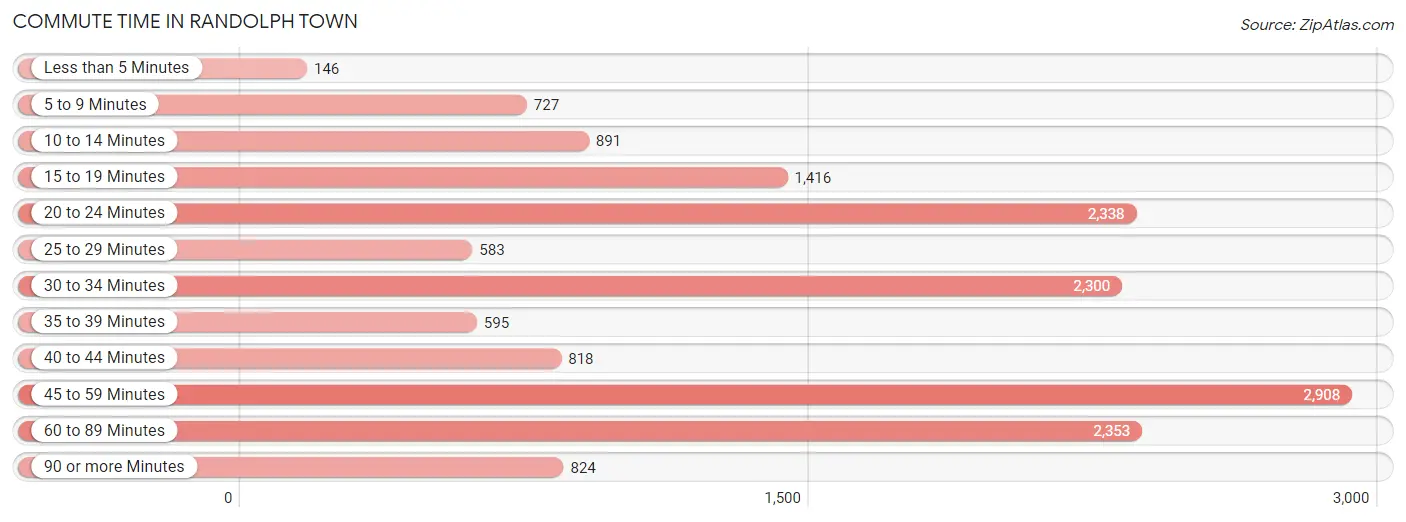
| Commute Time | # Commuters | % Commuters |
| Less than 5 Minutes | 146 | 0.9% |
| 5 to 9 Minutes | 727 | 4.6% |
| 10 to 14 Minutes | 891 | 5.6% |
| 15 to 19 Minutes | 1,416 | 8.9% |
| 20 to 24 Minutes | 2,338 | 14.7% |
| 25 to 29 Minutes | 583 | 3.7% |
| 30 to 34 Minutes | 2,300 | 14.5% |
| 35 to 39 Minutes | 595 | 3.7% |
| 40 to 44 Minutes | 818 | 5.1% |
| 45 to 59 Minutes | 2,908 | 18.3% |
| 60 to 89 Minutes | 2,353 | 14.8% |
| 90 or more Minutes | 824 | 5.2% |
Commute Time by Sex in Randolph Town
The most common commute times in Randolph Town are 45 to 59 minutes (1,432 commuters, 17.4%) for males and 45 to 59 minutes (1,476 commuters, 19.3%) for females.
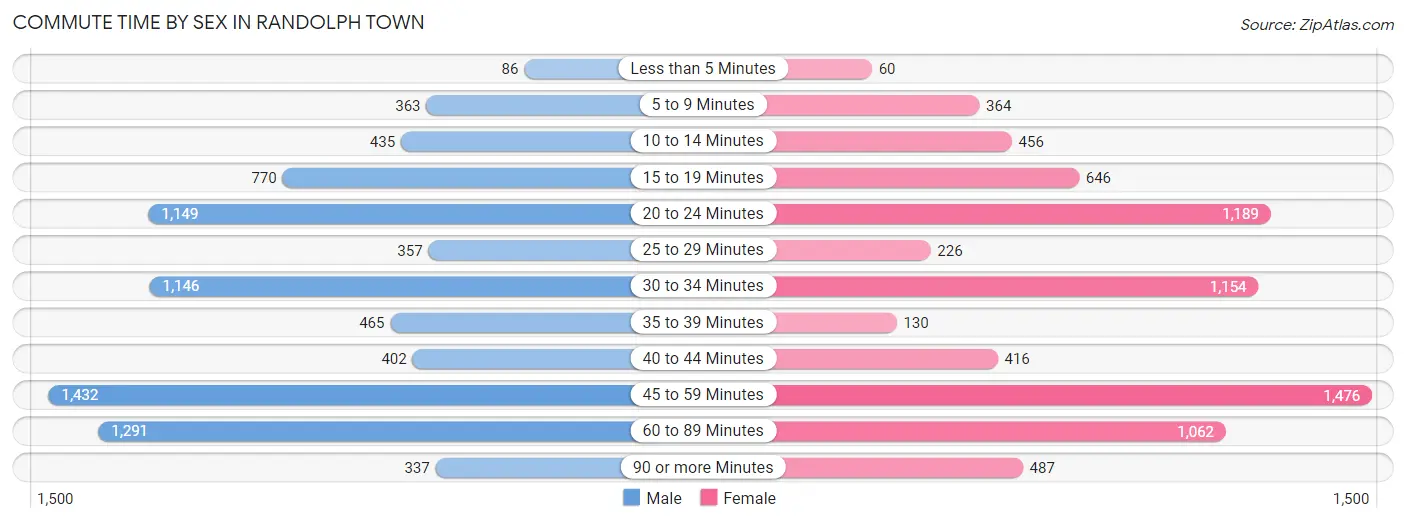
| Commute Time | Male | Female |
| Less than 5 Minutes | 86 (1.0%) | 60 (0.8%) |
| 5 to 9 Minutes | 363 (4.4%) | 364 (4.8%) |
| 10 to 14 Minutes | 435 (5.3%) | 456 (5.9%) |
| 15 to 19 Minutes | 770 (9.3%) | 646 (8.4%) |
| 20 to 24 Minutes | 1,149 (14.0%) | 1,189 (15.5%) |
| 25 to 29 Minutes | 357 (4.3%) | 226 (2.9%) |
| 30 to 34 Minutes | 1,146 (13.9%) | 1,154 (15.0%) |
| 35 to 39 Minutes | 465 (5.7%) | 130 (1.7%) |
| 40 to 44 Minutes | 402 (4.9%) | 416 (5.4%) |
| 45 to 59 Minutes | 1,432 (17.4%) | 1,476 (19.3%) |
| 60 to 89 Minutes | 1,291 (15.7%) | 1,062 (13.9%) |
| 90 or more Minutes | 337 (4.1%) | 487 (6.4%) |
Time of Departure to Work by Sex in Randolph Town
The most frequent times of departure to work in Randolph Town are 7:00 AM to 7:29 AM (885, 10.7%) for males and 6:00 AM to 6:29 AM (979, 12.8%) for females.
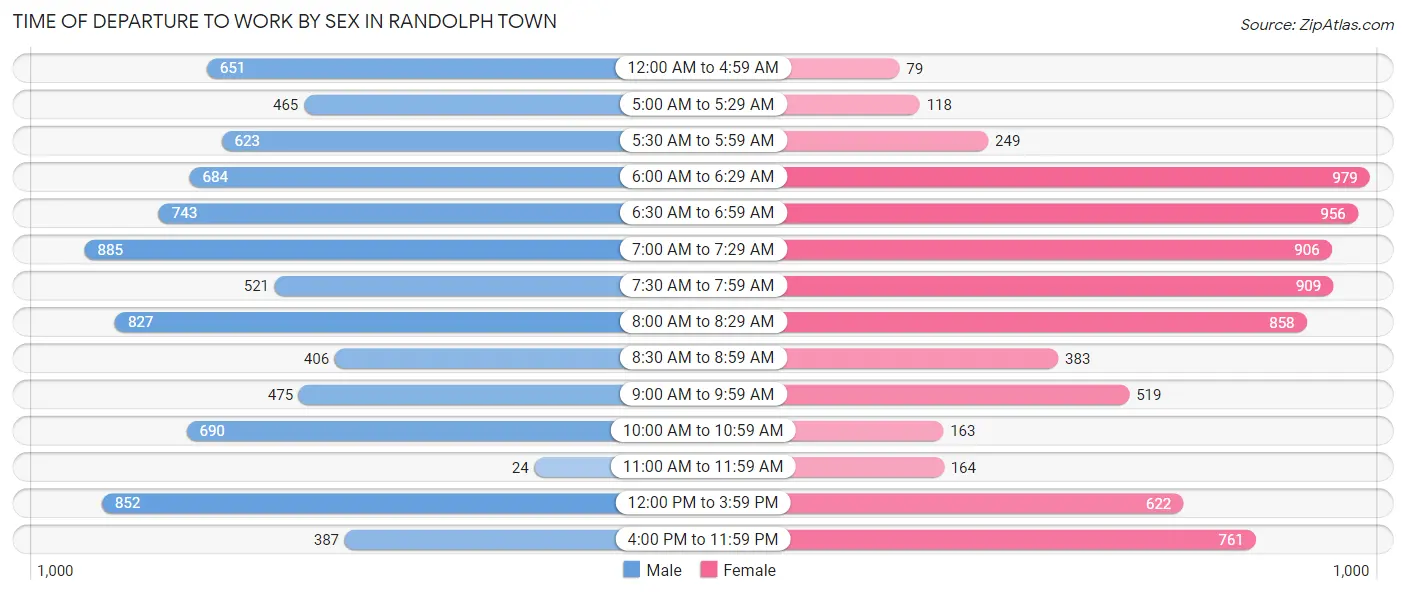
| Time of Departure | Male | Female |
| 12:00 AM to 4:59 AM | 651 (7.9%) | 79 (1.0%) |
| 5:00 AM to 5:29 AM | 465 (5.7%) | 118 (1.5%) |
| 5:30 AM to 5:59 AM | 623 (7.6%) | 249 (3.3%) |
| 6:00 AM to 6:29 AM | 684 (8.3%) | 979 (12.8%) |
| 6:30 AM to 6:59 AM | 743 (9.0%) | 956 (12.5%) |
| 7:00 AM to 7:29 AM | 885 (10.7%) | 906 (11.8%) |
| 7:30 AM to 7:59 AM | 521 (6.3%) | 909 (11.9%) |
| 8:00 AM to 8:29 AM | 827 (10.0%) | 858 (11.2%) |
| 8:30 AM to 8:59 AM | 406 (4.9%) | 383 (5.0%) |
| 9:00 AM to 9:59 AM | 475 (5.8%) | 519 (6.8%) |
| 10:00 AM to 10:59 AM | 690 (8.4%) | 163 (2.1%) |
| 11:00 AM to 11:59 AM | 24 (0.3%) | 164 (2.1%) |
| 12:00 PM to 3:59 PM | 852 (10.3%) | 622 (8.1%) |
| 4:00 PM to 11:59 PM | 387 (4.7%) | 761 (9.9%) |
| Total | 8,233 (100.0%) | 7,666 (100.0%) |
Housing Occupancy in Randolph Town
Occupancy by Ownership in Randolph Town
Of the total 12,445 dwellings in Randolph Town, owner-occupied units account for 8,588 (69.0%), while renter-occupied units make up 3,857 (31.0%).
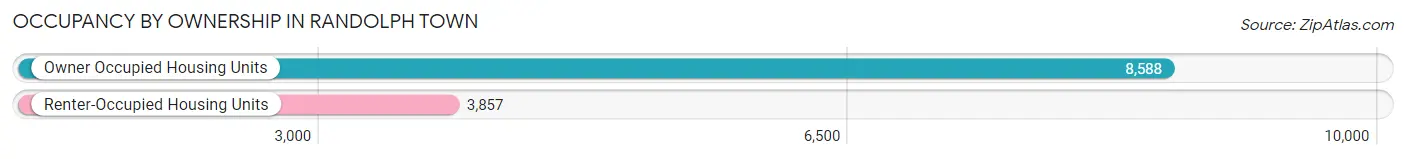
| Occupancy | # Housing Units | % Housing Units |
| Owner Occupied Housing Units | 8,588 | 69.0% |
| Renter-Occupied Housing Units | 3,857 | 31.0% |
| Total Occupied Housing Units | 12,445 | 100.0% |
Occupancy by Household Size in Randolph Town
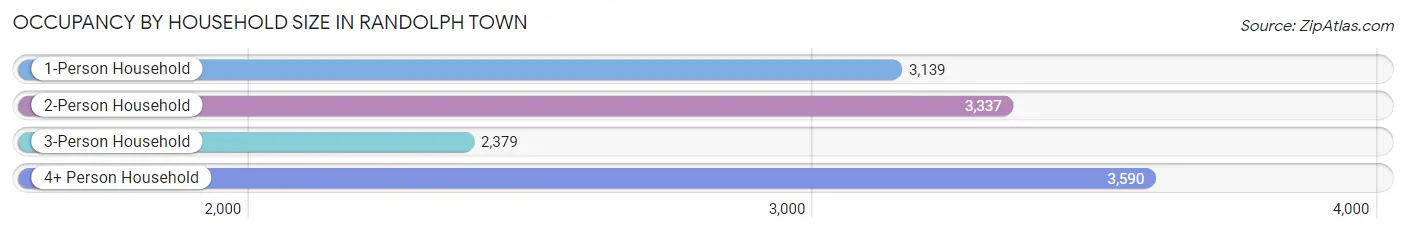
| Household Size | # Housing Units | % Housing Units |
| 1-Person Household | 3,139 | 25.2% |
| 2-Person Household | 3,337 | 26.8% |
| 3-Person Household | 2,379 | 19.1% |
| 4+ Person Household | 3,590 | 28.8% |
| Total Housing Units | 12,445 | 100.0% |
Occupancy by Ownership by Household Size in Randolph Town
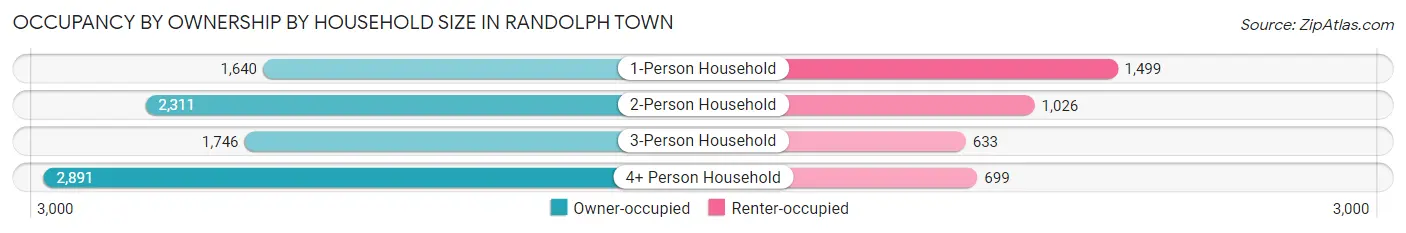
| Household Size | Owner-occupied | Renter-occupied |
| 1-Person Household | 1,640 (52.2%) | 1,499 (47.7%) |
| 2-Person Household | 2,311 (69.3%) | 1,026 (30.7%) |
| 3-Person Household | 1,746 (73.4%) | 633 (26.6%) |
| 4+ Person Household | 2,891 (80.5%) | 699 (19.5%) |
| Total Housing Units | 8,588 (69.0%) | 3,857 (31.0%) |
Occupancy by Educational Attainment in Randolph Town
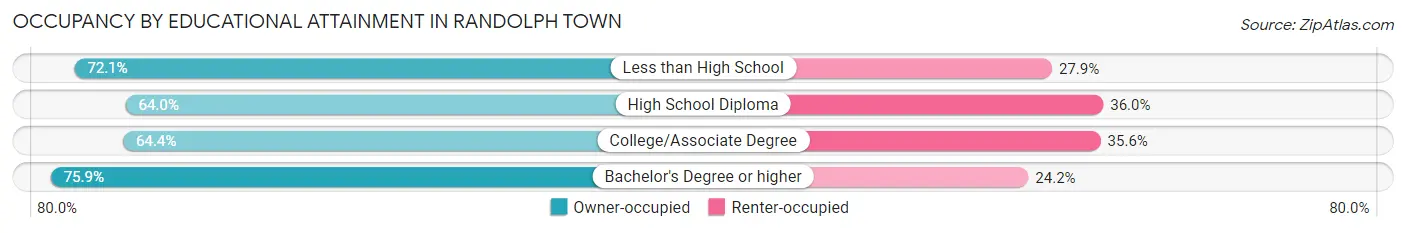
| Household Size | Owner-occupied | Renter-occupied |
| Less than High School | 801 (72.1%) | 310 (27.9%) |
| High School Diploma | 2,192 (64.0%) | 1,234 (36.0%) |
| College/Associate Degree | 2,266 (64.4%) | 1,253 (35.6%) |
| Bachelor's Degree or higher | 3,329 (75.8%) | 1,060 (24.1%) |
Occupancy by Age of Householder in Randolph Town
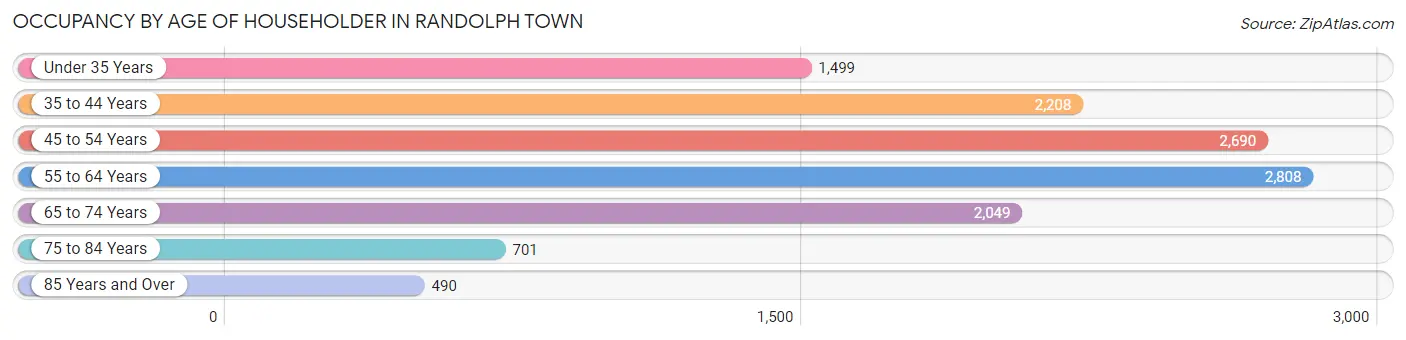
| Age Bracket | # Households | % Households |
| Under 35 Years | 1,499 | 12.0% |
| 35 to 44 Years | 2,208 | 17.7% |
| 45 to 54 Years | 2,690 | 21.6% |
| 55 to 64 Years | 2,808 | 22.6% |
| 65 to 74 Years | 2,049 | 16.5% |
| 75 to 84 Years | 701 | 5.6% |
| 85 Years and Over | 490 | 3.9% |
| Total | 12,445 | 100.0% |
Housing Finances in Randolph Town
Median Income by Occupancy in Randolph Town
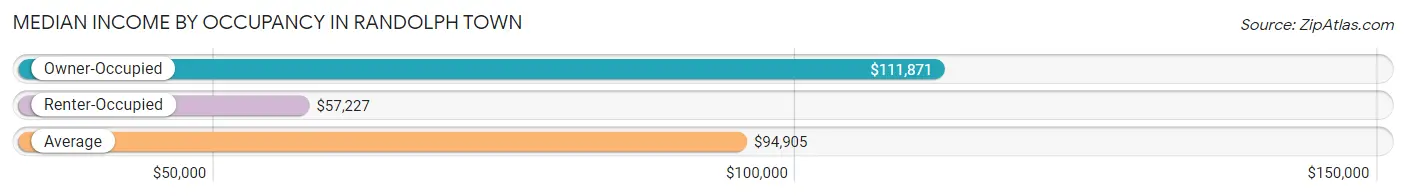
| Occupancy Type | # Households | Median Income |
| Owner-Occupied | 8,588 (69.0%) | $111,871 |
| Renter-Occupied | 3,857 (31.0%) | $57,227 |
| Average | 12,445 (100.0%) | $94,905 |
Occupancy by Householder Income Bracket in Randolph Town
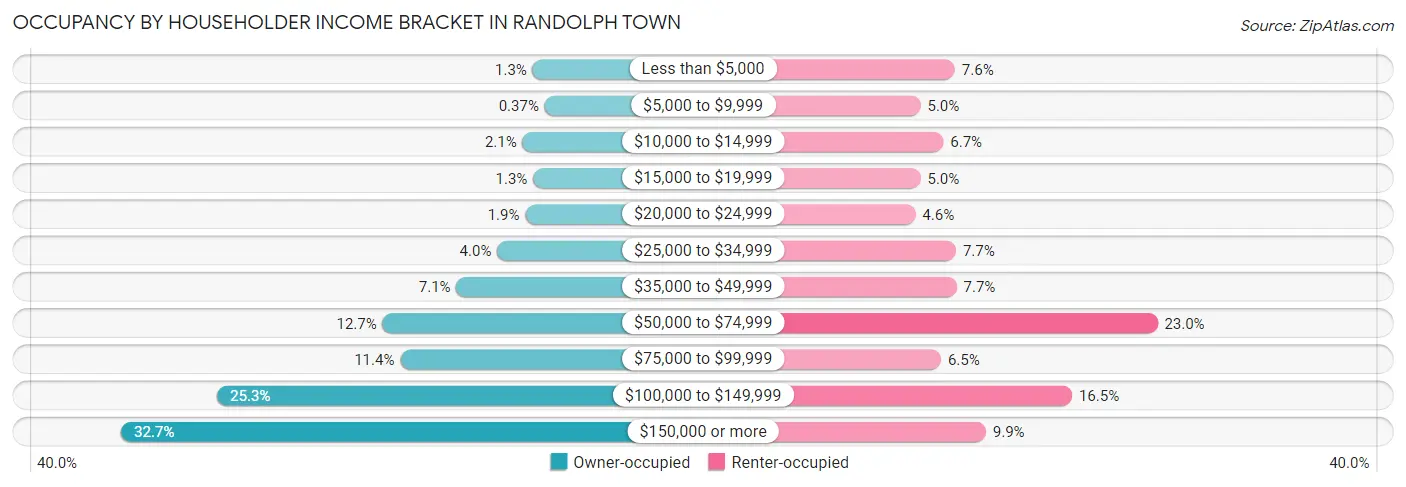
| Income Bracket | Owner-occupied | Renter-occupied |
| Less than $5,000 | 111 (1.3%) | 292 (7.6%) |
| $5,000 to $9,999 | 32 (0.4%) | 191 (5.0%) |
| $10,000 to $14,999 | 177 (2.1%) | 258 (6.7%) |
| $15,000 to $19,999 | 107 (1.3%) | 191 (5.0%) |
| $20,000 to $24,999 | 159 (1.8%) | 176 (4.6%) |
| $25,000 to $34,999 | 343 (4.0%) | 295 (7.6%) |
| $35,000 to $49,999 | 610 (7.1%) | 297 (7.7%) |
| $50,000 to $74,999 | 1,093 (12.7%) | 887 (23.0%) |
| $75,000 to $99,999 | 977 (11.4%) | 251 (6.5%) |
| $100,000 to $149,999 | 2,175 (25.3%) | 636 (16.5%) |
| $150,000 or more | 2,804 (32.7%) | 383 (9.9%) |
| Total | 8,588 (100.0%) | 3,857 (100.0%) |
Monthly Housing Cost Tiers in Randolph Town
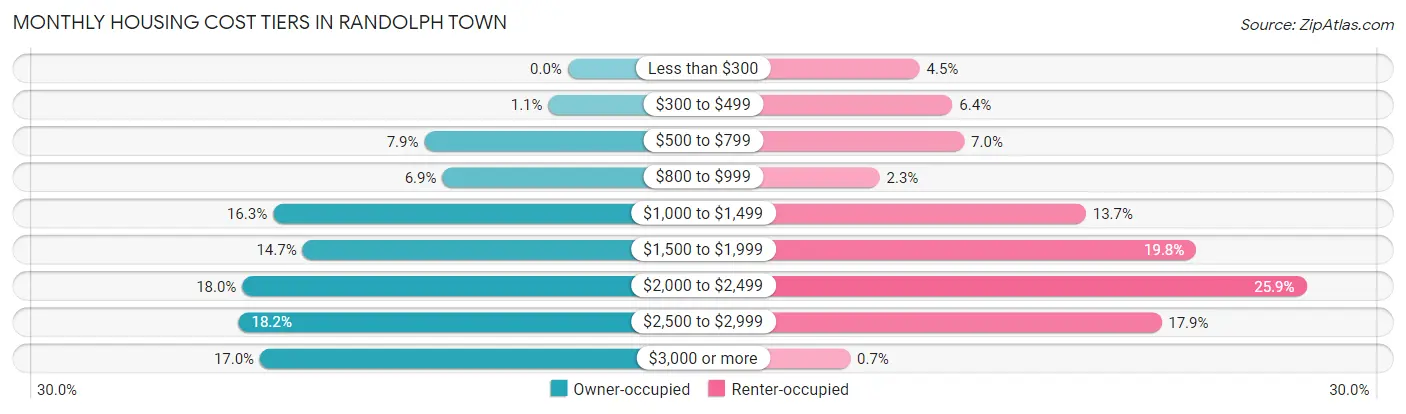
| Monthly Cost | Owner-occupied | Renter-occupied |
| Less than $300 | 0 (0.0%) | 175 (4.5%) |
| $300 to $499 | 92 (1.1%) | 245 (6.4%) |
| $500 to $799 | 680 (7.9%) | 270 (7.0%) |
| $800 to $999 | 595 (6.9%) | 90 (2.3%) |
| $1,000 to $1,499 | 1,398 (16.3%) | 529 (13.7%) |
| $1,500 to $1,999 | 1,258 (14.6%) | 764 (19.8%) |
| $2,000 to $2,499 | 1,544 (18.0%) | 999 (25.9%) |
| $2,500 to $2,999 | 1,561 (18.2%) | 690 (17.9%) |
| $3,000 or more | 1,460 (17.0%) | 27 (0.7%) |
| Total | 8,588 (100.0%) | 3,857 (100.0%) |
Physical Housing Characteristics in Randolph Town
Housing Structures in Randolph Town
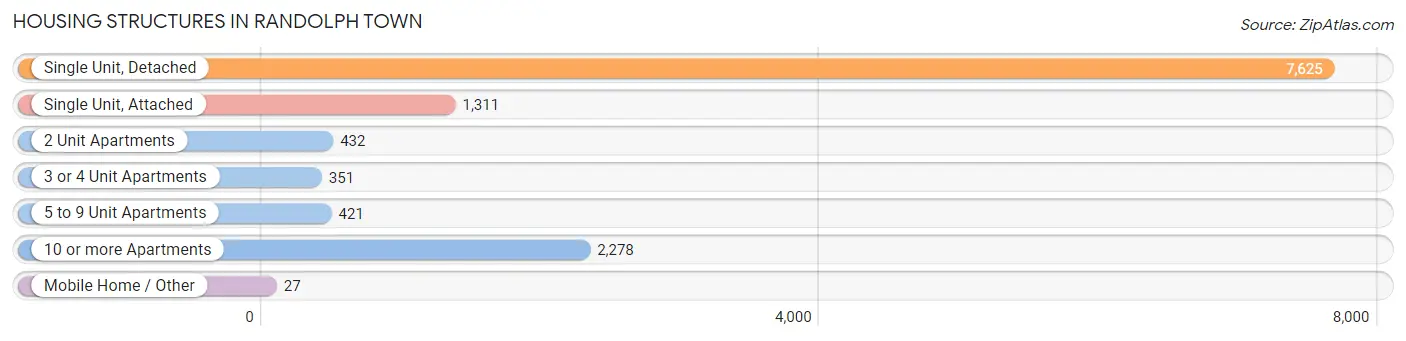
| Structure Type | # Housing Units | % Housing Units |
| Single Unit, Detached | 7,625 | 61.3% |
| Single Unit, Attached | 1,311 | 10.5% |
| 2 Unit Apartments | 432 | 3.5% |
| 3 or 4 Unit Apartments | 351 | 2.8% |
| 5 to 9 Unit Apartments | 421 | 3.4% |
| 10 or more Apartments | 2,278 | 18.3% |
| Mobile Home / Other | 27 | 0.2% |
| Total | 12,445 | 100.0% |
Housing Structures by Occupancy in Randolph Town
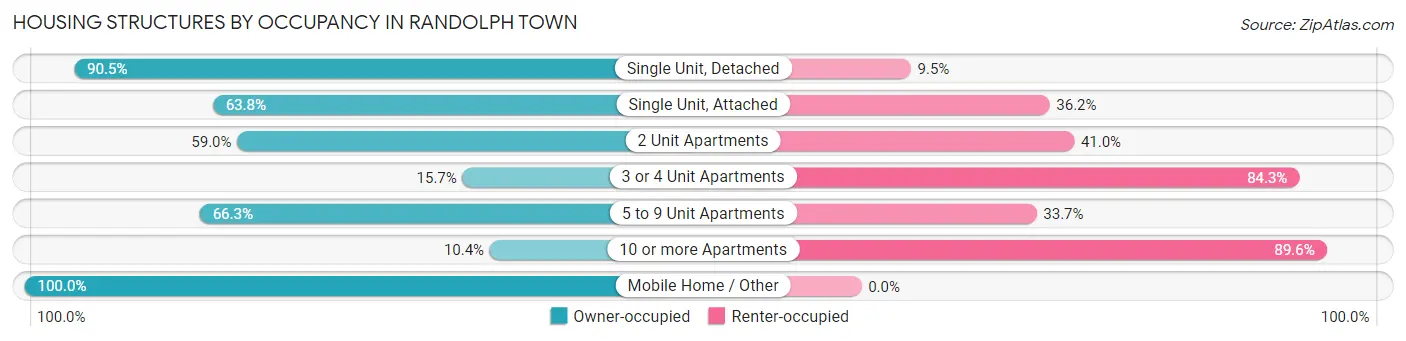
| Structure Type | Owner-occupied | Renter-occupied |
| Single Unit, Detached | 6,899 (90.5%) | 726 (9.5%) |
| Single Unit, Attached | 836 (63.8%) | 475 (36.2%) |
| 2 Unit Apartments | 255 (59.0%) | 177 (41.0%) |
| 3 or 4 Unit Apartments | 55 (15.7%) | 296 (84.3%) |
| 5 to 9 Unit Apartments | 279 (66.3%) | 142 (33.7%) |
| 10 or more Apartments | 237 (10.4%) | 2,041 (89.6%) |
| Mobile Home / Other | 27 (100.0%) | 0 (0.0%) |
| Total | 8,588 (69.0%) | 3,857 (31.0%) |
Housing Structures by Number of Rooms in Randolph Town
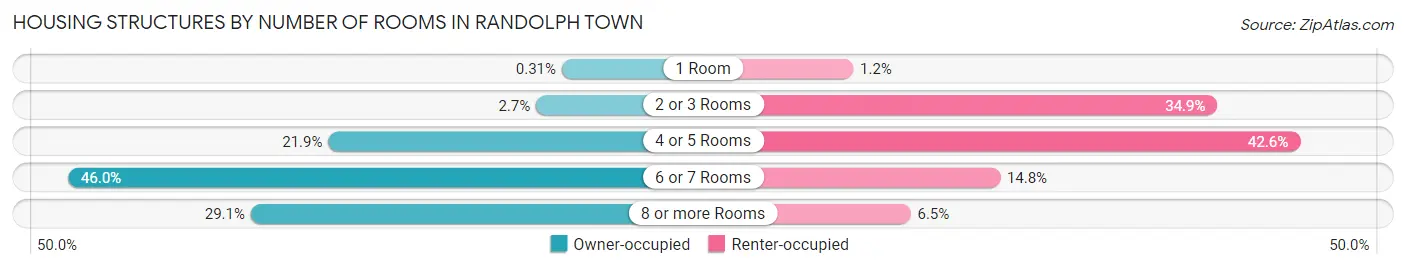
| Number of Rooms | Owner-occupied | Renter-occupied |
| 1 Room | 27 (0.3%) | 47 (1.2%) |
| 2 or 3 Rooms | 232 (2.7%) | 1,346 (34.9%) |
| 4 or 5 Rooms | 1,882 (21.9%) | 1,641 (42.5%) |
| 6 or 7 Rooms | 3,950 (46.0%) | 571 (14.8%) |
| 8 or more Rooms | 2,497 (29.1%) | 252 (6.5%) |
| Total | 8,588 (100.0%) | 3,857 (100.0%) |
Housing Structure by Heating Type in Randolph Town
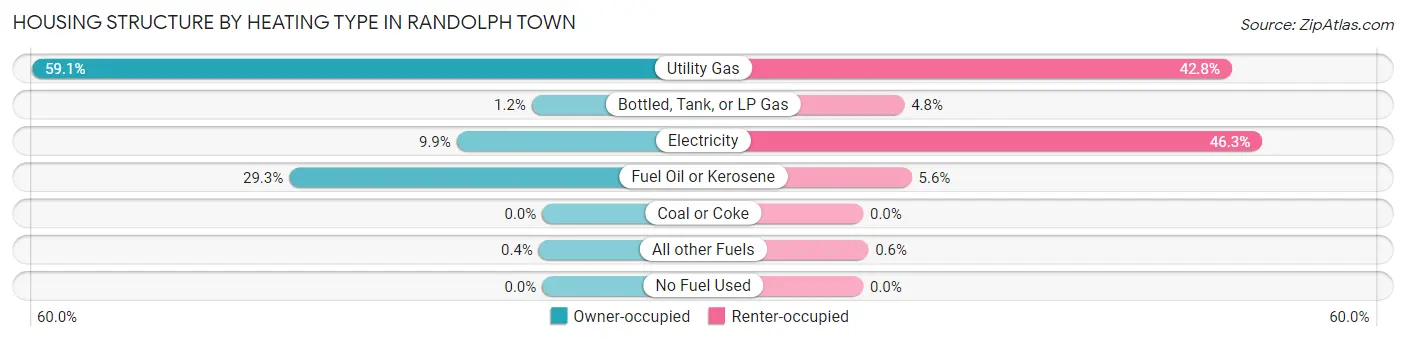
| Heating Type | Owner-occupied | Renter-occupied |
| Utility Gas | 5,079 (59.1%) | 1,649 (42.7%) |
| Bottled, Tank, or LP Gas | 104 (1.2%) | 184 (4.8%) |
| Electricity | 851 (9.9%) | 1,784 (46.3%) |
| Fuel Oil or Kerosene | 2,520 (29.3%) | 217 (5.6%) |
| Coal or Coke | 0 (0.0%) | 0 (0.0%) |
| All other Fuels | 34 (0.4%) | 23 (0.6%) |
| No Fuel Used | 0 (0.0%) | 0 (0.0%) |
| Total | 8,588 (100.0%) | 3,857 (100.0%) |
Household Vehicle Usage in Randolph Town
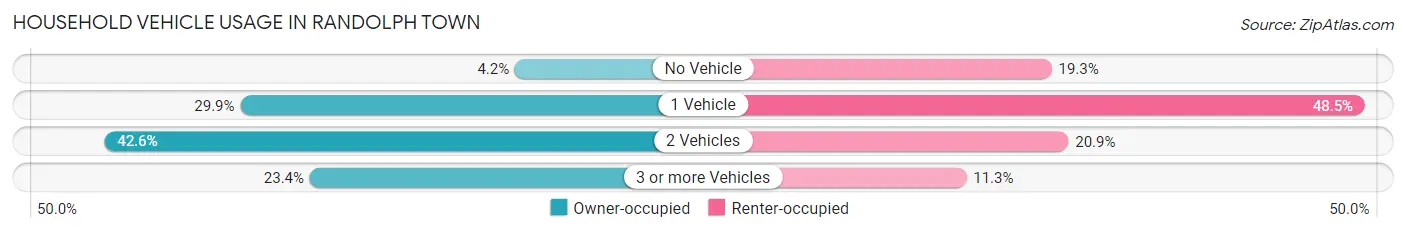
| Vehicles per Household | Owner-occupied | Renter-occupied |
| No Vehicle | 362 (4.2%) | 744 (19.3%) |
| 1 Vehicle | 2,564 (29.9%) | 1,872 (48.5%) |
| 2 Vehicles | 3,655 (42.6%) | 804 (20.8%) |
| 3 or more Vehicles | 2,007 (23.4%) | 437 (11.3%) |
| Total | 8,588 (100.0%) | 3,857 (100.0%) |
Real Estate & Mortgages in Randolph Town
Real Estate and Mortgage Overview in Randolph Town
| Characteristic | Without Mortgage | With Mortgage |
| Housing Units | 2,307 | 6,281 |
| Median Property Value | $410,500 | $434,000 |
| Median Household Income | $85,865 | $2,102 |
| Monthly Housing Costs | $955 | $1,460 |
| Real Estate Taxes | $5,157 | $78 |
Property Value by Mortgage Status in Randolph Town
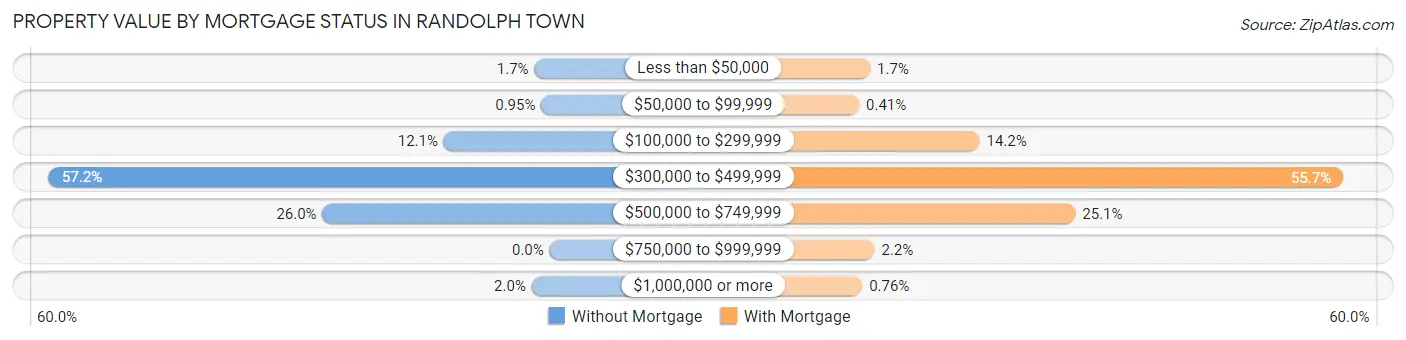
| Property Value | Without Mortgage | With Mortgage |
| Less than $50,000 | 40 (1.7%) | 104 (1.7%) |
| $50,000 to $99,999 | 22 (0.9%) | 26 (0.4%) |
| $100,000 to $299,999 | 279 (12.1%) | 890 (14.2%) |
| $300,000 to $499,999 | 1,320 (57.2%) | 3,499 (55.7%) |
| $500,000 to $749,999 | 599 (26.0%) | 1,578 (25.1%) |
| $750,000 to $999,999 | 0 (0.0%) | 136 (2.2%) |
| $1,000,000 or more | 47 (2.0%) | 48 (0.8%) |
| Total | 2,307 (100.0%) | 6,281 (100.0%) |
Household Income by Mortgage Status in Randolph Town
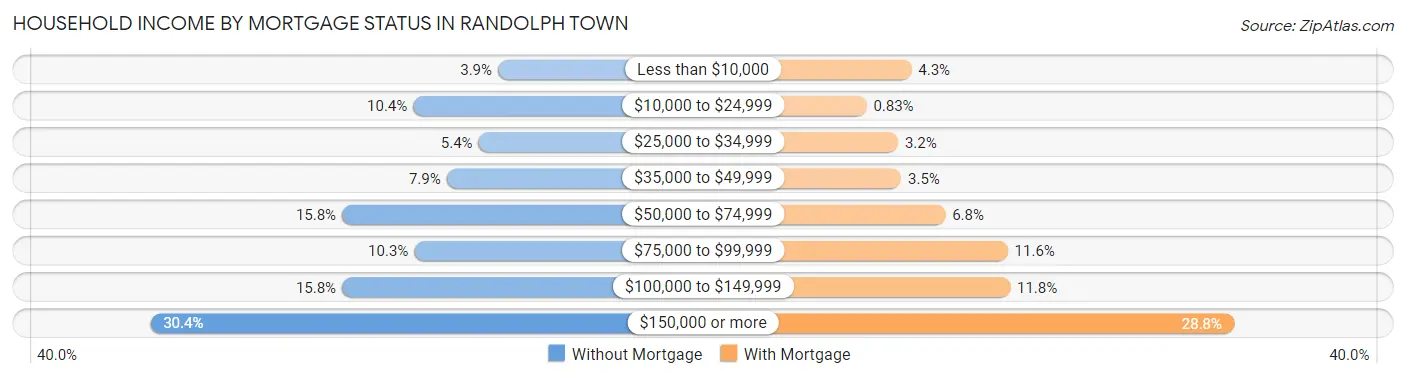
| Household Income | Without Mortgage | With Mortgage |
| Less than $10,000 | 91 (3.9%) | 267 (4.3%) |
| $10,000 to $24,999 | 240 (10.4%) | 52 (0.8%) |
| $25,000 to $34,999 | 125 (5.4%) | 203 (3.2%) |
| $35,000 to $49,999 | 181 (7.9%) | 218 (3.5%) |
| $50,000 to $74,999 | 365 (15.8%) | 429 (6.8%) |
| $75,000 to $99,999 | 238 (10.3%) | 728 (11.6%) |
| $100,000 to $149,999 | 365 (15.8%) | 739 (11.8%) |
| $150,000 or more | 702 (30.4%) | 1,810 (28.8%) |
| Total | 2,307 (100.0%) | 6,281 (100.0%) |
Property Value to Household Income Ratio in Randolph Town
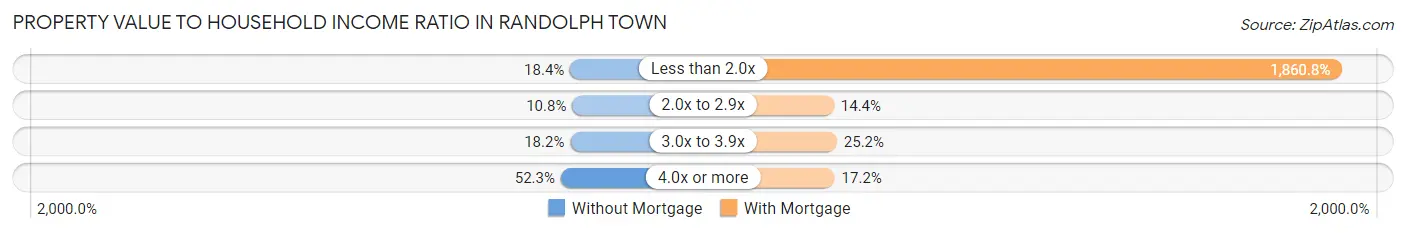
| Value-to-Income Ratio | Without Mortgage | With Mortgage |
| Less than 2.0x | 425 (18.4%) | 116,875 (1,860.8%) |
| 2.0x to 2.9x | 250 (10.8%) | 903 (14.4%) |
| 3.0x to 3.9x | 419 (18.2%) | 1,582 (25.2%) |
| 4.0x or more | 1,207 (52.3%) | 1,083 (17.2%) |
| Total | 2,307 (100.0%) | 6,281 (100.0%) |
Real Estate Taxes by Mortgage Status in Randolph Town
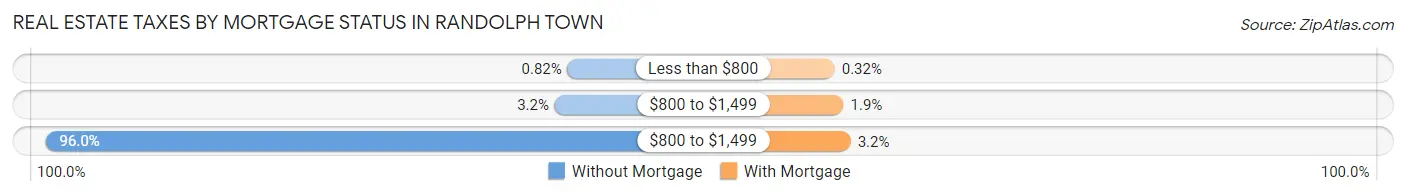
| Property Taxes | Without Mortgage | With Mortgage |
| Less than $800 | 19 (0.8%) | 20 (0.3%) |
| $800 to $1,499 | 73 (3.2%) | 121 (1.9%) |
| $800 to $1,499 | 2,215 (96.0%) | 203 (3.2%) |
| Total | 2,307 (100.0%) | 6,281 (100.0%) |
Health & Disability in Randolph Town
Health Insurance Coverage by Age in Randolph Town
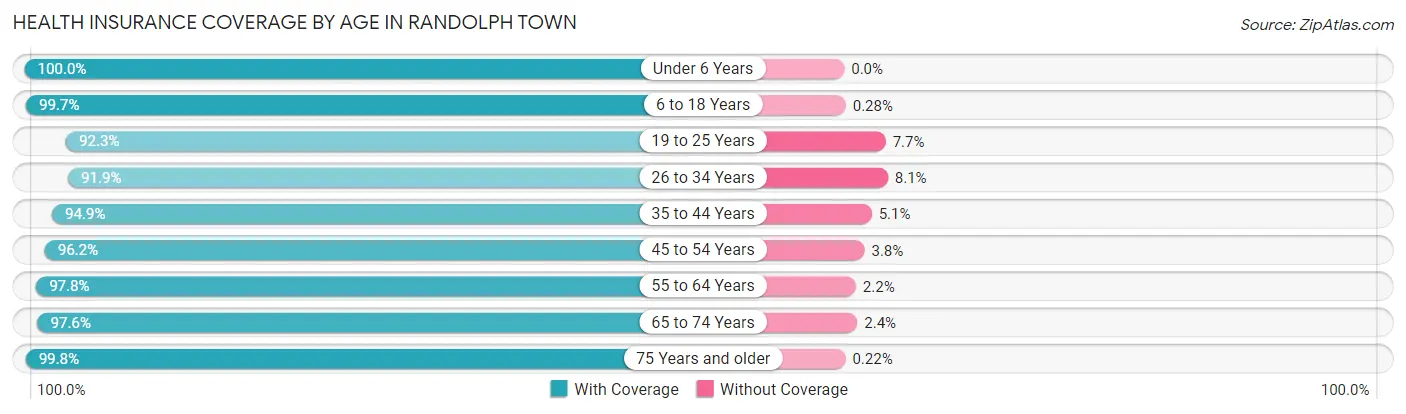
| Age Bracket | With Coverage | Without Coverage |
| Under 6 Years | 1,673 (100.0%) | 0 (0.0%) |
| 6 to 18 Years | 4,977 (99.7%) | 14 (0.3%) |
| 19 to 25 Years | 3,543 (92.3%) | 297 (7.7%) |
| 26 to 34 Years | 4,153 (91.9%) | 367 (8.1%) |
| 35 to 44 Years | 4,075 (94.9%) | 220 (5.1%) |
| 45 to 54 Years | 4,406 (96.2%) | 173 (3.8%) |
| 55 to 64 Years | 4,775 (97.8%) | 106 (2.2%) |
| 65 to 74 Years | 3,296 (97.6%) | 82 (2.4%) |
| 75 Years and older | 2,263 (99.8%) | 5 (0.2%) |
| Total | 33,161 (96.3%) | 1,264 (3.7%) |
Health Insurance Coverage by Citizenship Status in Randolph Town
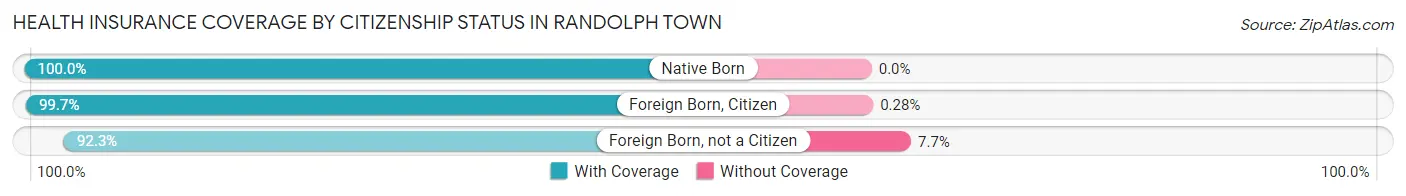
| Citizenship Status | With Coverage | Without Coverage |
| Native Born | 1,673 (100.0%) | 0 (0.0%) |
| Foreign Born, Citizen | 4,977 (99.7%) | 14 (0.3%) |
| Foreign Born, not a Citizen | 3,543 (92.3%) | 297 (7.7%) |
Health Insurance Coverage by Household Income in Randolph Town
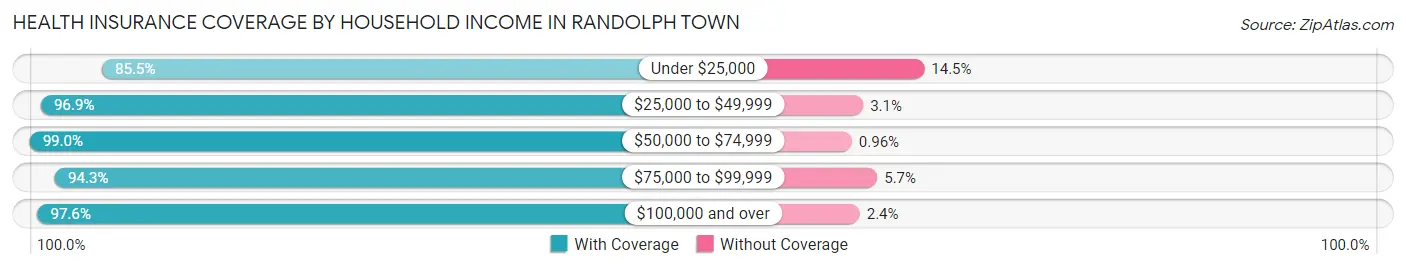
| Household Income | With Coverage | Without Coverage |
| Under $25,000 | 2,512 (85.5%) | 427 (14.5%) |
| $25,000 to $49,999 | 3,268 (96.9%) | 104 (3.1%) |
| $50,000 to $74,999 | 4,660 (99.0%) | 45 (1.0%) |
| $75,000 to $99,999 | 3,387 (94.3%) | 205 (5.7%) |
| $100,000 and over | 19,203 (97.6%) | 478 (2.4%) |
Public vs Private Health Insurance Coverage by Age in Randolph Town
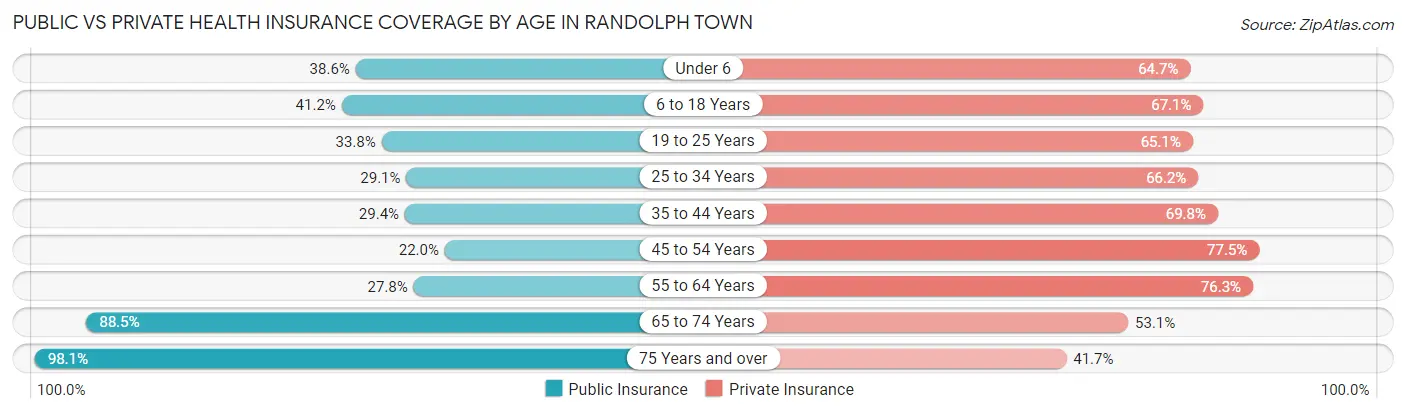
| Age Bracket | Public Insurance | Private Insurance |
| Under 6 | 645 (38.6%) | 1,082 (64.7%) |
| 6 to 18 Years | 2,054 (41.1%) | 3,349 (67.1%) |
| 19 to 25 Years | 1,296 (33.8%) | 2,501 (65.1%) |
| 25 to 34 Years | 1,317 (29.1%) | 2,990 (66.1%) |
| 35 to 44 Years | 1,263 (29.4%) | 2,997 (69.8%) |
| 45 to 54 Years | 1,008 (22.0%) | 3,547 (77.5%) |
| 55 to 64 Years | 1,357 (27.8%) | 3,724 (76.3%) |
| 65 to 74 Years | 2,991 (88.5%) | 1,795 (53.1%) |
| 75 Years and over | 2,225 (98.1%) | 945 (41.7%) |
| Total | 14,156 (41.1%) | 22,930 (66.6%) |
Disability Status by Sex by Age in Randolph Town
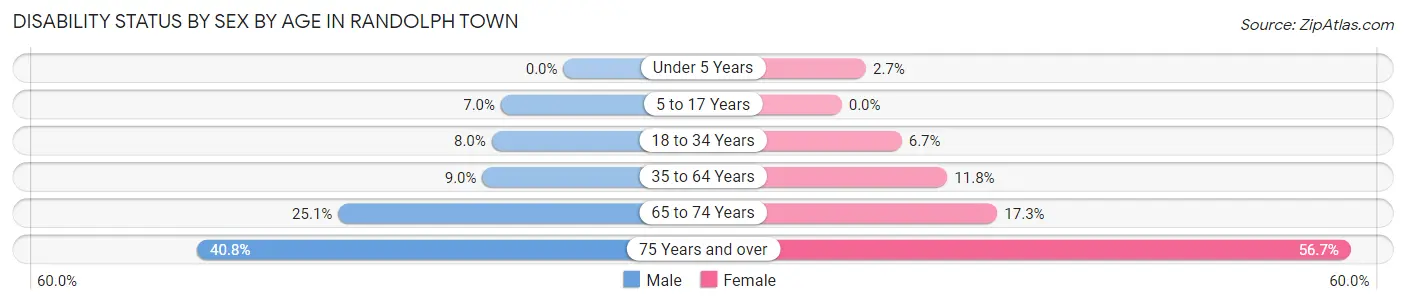
| Age Bracket | Male | Female |
| Under 5 Years | 0 (0.0%) | 21 (2.7%) |
| 5 to 17 Years | 178 (7.0%) | 0 (0.0%) |
| 18 to 34 Years | 401 (8.0%) | 241 (6.7%) |
| 35 to 64 Years | 574 (9.0%) | 869 (11.8%) |
| 65 to 74 Years | 377 (25.1%) | 325 (17.3%) |
| 75 Years and over | 350 (40.8%) | 799 (56.7%) |
Disability Class by Sex by Age in Randolph Town
Disability Class: Hearing Difficulty
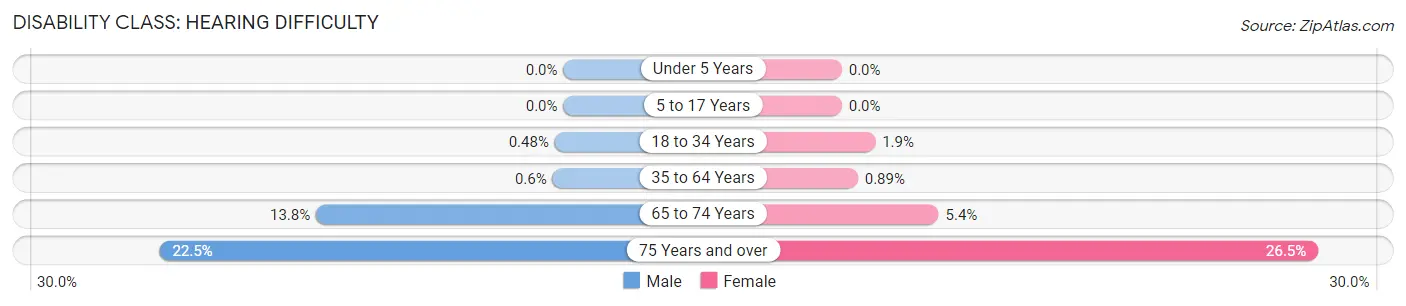
| Age Bracket | Male | Female |
| Under 5 Years | 0 (0.0%) | 0 (0.0%) |
| 5 to 17 Years | 0 (0.0%) | 0 (0.0%) |
| 18 to 34 Years | 24 (0.5%) | 67 (1.9%) |
| 35 to 64 Years | 38 (0.6%) | 66 (0.9%) |
| 65 to 74 Years | 207 (13.8%) | 101 (5.4%) |
| 75 Years and over | 193 (22.5%) | 374 (26.5%) |
Disability Class: Vision Difficulty
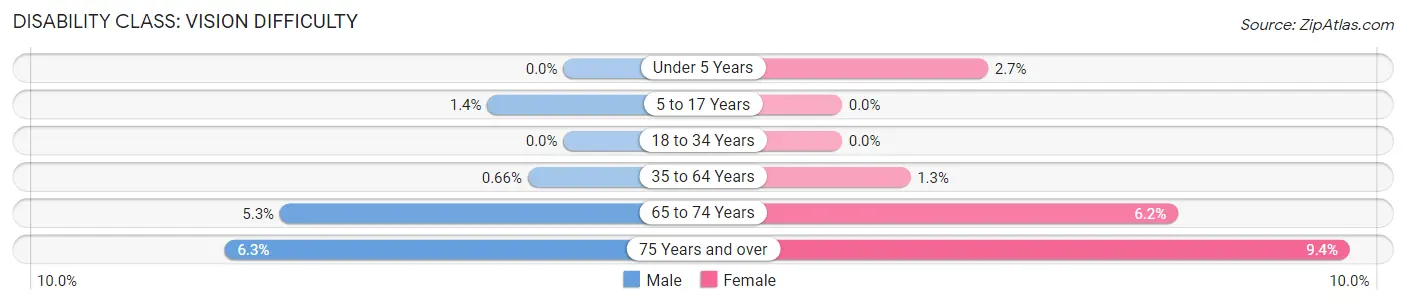
| Age Bracket | Male | Female |
| Under 5 Years | 0 (0.0%) | 21 (2.7%) |
| 5 to 17 Years | 36 (1.4%) | 0 (0.0%) |
| 18 to 34 Years | 0 (0.0%) | 0 (0.0%) |
| 35 to 64 Years | 42 (0.7%) | 94 (1.3%) |
| 65 to 74 Years | 79 (5.3%) | 117 (6.2%) |
| 75 Years and over | 54 (6.3%) | 133 (9.4%) |
Disability Class: Cognitive Difficulty
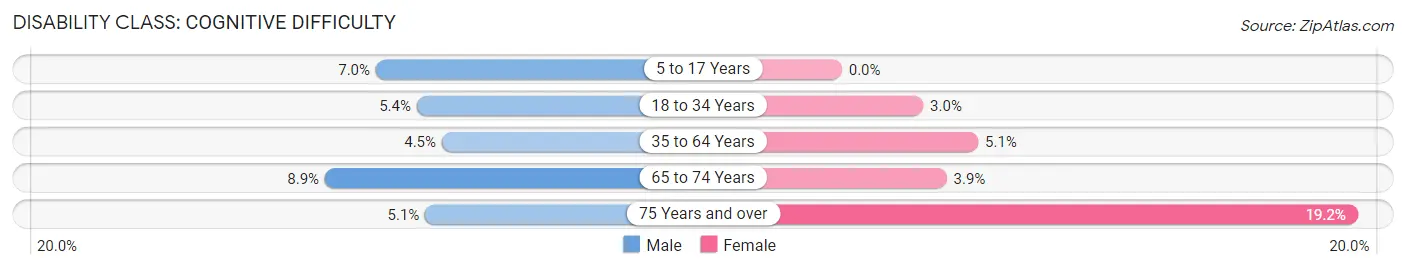
| Age Bracket | Male | Female |
| 5 to 17 Years | 178 (7.0%) | 0 (0.0%) |
| 18 to 34 Years | 273 (5.4%) | 109 (3.0%) |
| 35 to 64 Years | 287 (4.5%) | 374 (5.1%) |
| 65 to 74 Years | 133 (8.8%) | 73 (3.9%) |
| 75 Years and over | 44 (5.1%) | 270 (19.2%) |
Disability Class: Ambulatory Difficulty
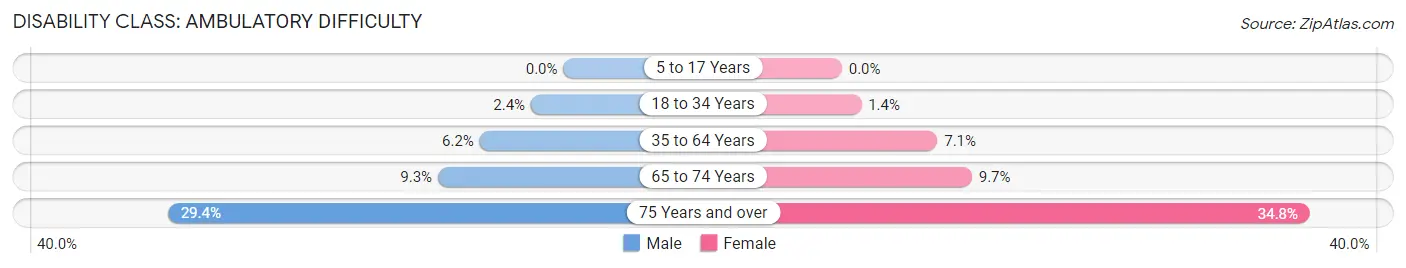
| Age Bracket | Male | Female |
| 5 to 17 Years | 0 (0.0%) | 0 (0.0%) |
| 18 to 34 Years | 121 (2.4%) | 52 (1.4%) |
| 35 to 64 Years | 395 (6.2%) | 524 (7.1%) |
| 65 to 74 Years | 140 (9.3%) | 181 (9.7%) |
| 75 Years and over | 252 (29.4%) | 490 (34.7%) |
Disability Class: Self-Care Difficulty
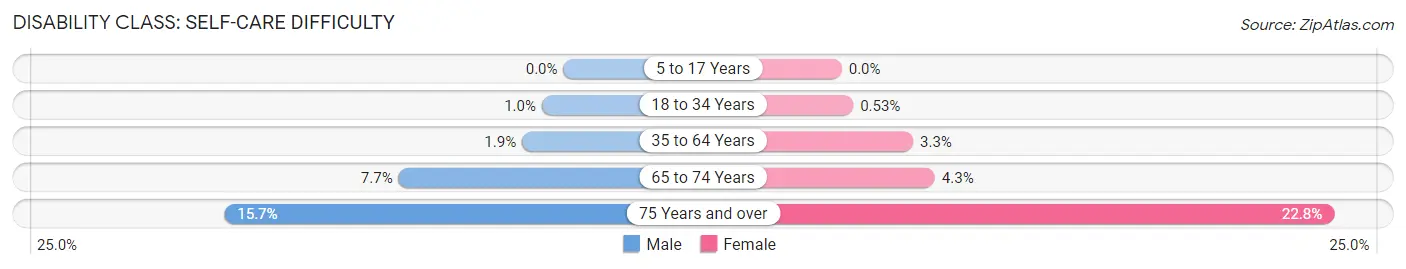
| Age Bracket | Male | Female |
| 5 to 17 Years | 0 (0.0%) | 0 (0.0%) |
| 18 to 34 Years | 50 (1.0%) | 19 (0.5%) |
| 35 to 64 Years | 122 (1.9%) | 245 (3.3%) |
| 65 to 74 Years | 115 (7.6%) | 81 (4.3%) |
| 75 Years and over | 135 (15.7%) | 322 (22.8%) |
Technology Access in Randolph Town
Computing Device Access in Randolph Town
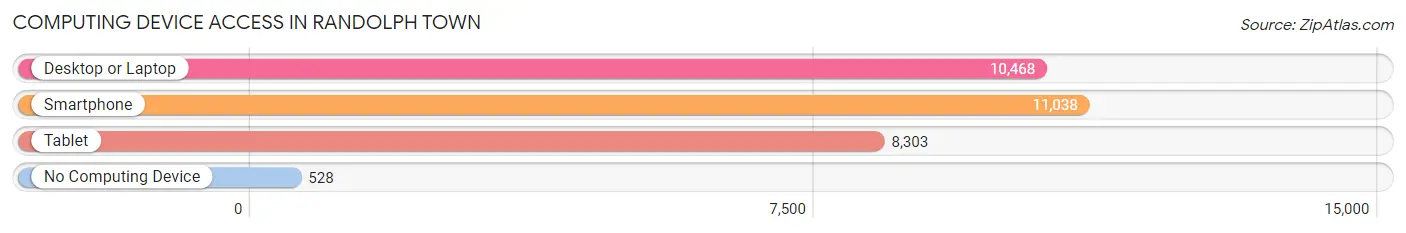
| Device Type | # Households | % Households |
| Desktop or Laptop | 10,468 | 84.1% |
| Smartphone | 11,038 | 88.7% |
| Tablet | 8,303 | 66.7% |
| No Computing Device | 528 | 4.2% |
| Total | 12,445 | 100.0% |
Internet Access in Randolph Town
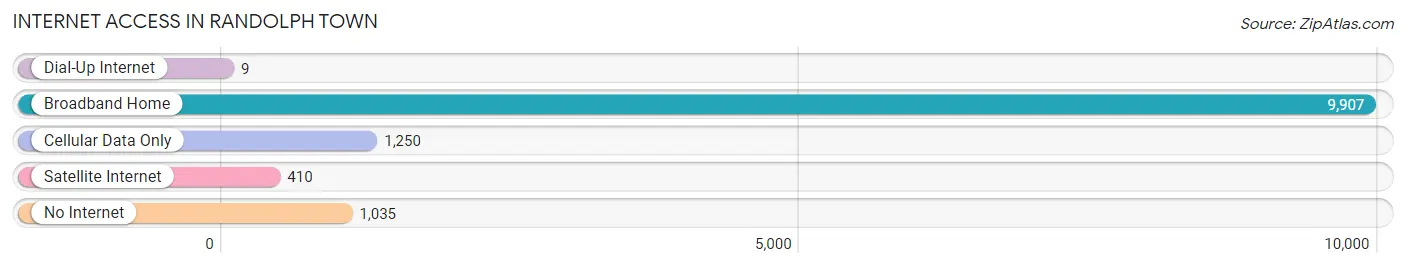
| Internet Type | # Households | % Households |
| Dial-Up Internet | 9 | 0.1% |
| Broadband Home | 9,907 | 79.6% |
| Cellular Data Only | 1,250 | 10.0% |
| Satellite Internet | 410 | 3.3% |
| No Internet | 1,035 | 8.3% |
| Total | 12,445 | 100.0% |
Randolph Town Summary
Randolph Town is a town located in Norfolk County, Massachusetts, United States. It is part of the Greater Boston metropolitan area. As of the 2010 census, the town had a population of 32,112.
Geography
Randolph Town is located in the southeastern part of Norfolk County, about 12 miles south of downtown Boston. It is bordered by the towns of Avon, Braintree, Holbrook, Milton, Quincy, and Stoughton. The town is situated on the Neponset River, which forms the boundary between Randolph and Milton. The town is also bordered by the Blue Hills Reservation, a state park that covers more than 7,000 acres.
The town has a total area of 8.7 square miles, of which 8.3 square miles is land and 0.4 square miles is water. The town is mostly flat, with some hills in the northern part of town.
History
Randolph Town was first settled in 1638 and was officially incorporated in 1793. The town was named after Peyton Randolph, the first President of the Continental Congress.
The town was originally an agricultural community, but in the 19th century, it became a center for manufacturing. The town was home to several factories, including a shoe factory, a paper mill, and a cotton mill.
In the late 19th century, the town began to develop into a residential suburb of Boston. The town was served by the Old Colony Railroad, which provided easy access to Boston.
Economy
Randolph Town has a diverse economy. The town is home to several large employers, including the Randolph Public Schools, the Randolph Fire Department, and the Randolph Police Department. The town is also home to several small businesses, including restaurants, retail stores, and professional services.
The town is also home to several industrial and manufacturing companies, including a plastics manufacturer, a printing company, and a food processing plant.
Demographics
As of the 2010 census, there were 32,112 people, 11,945 households, and 8,541 families residing in the town. The population density was 3,817.3 people per square mile. The racial makeup of the town was 79.2% White, 8.3% African American, 0.3% Native American, 5.7% Asian, 0.1% Pacific Islander, 3.2% from other races, and 3.3% from two or more races. Hispanic or Latino of any race were 8.2% of the population.
The median income for a household in the town was $68,945, and the median income for a family was $81,945. The per capita income for the town was $30,945. About 4.2% of families and 5.7% of the population were below the poverty line, including 6.7% of those under age 18 and 5.2% of those age 65 or over.
Conclusion
Randolph Town is a town located in Norfolk County, Massachusetts, United States. It is part of the Greater Boston metropolitan area. As of the 2010 census, the town had a population of 32,112. The town has a diverse economy, with several large employers, small businesses, and industrial and manufacturing companies. The town is also home to a diverse population, with a median income of $68,945 and a per capita income of $30,945. Randolph Town is a vibrant community with a rich history and a bright future.
Common Questions
What is Per Capita Income in Randolph Town?
Per Capita income in Randolph Town is $42,525.
What is the Median Family Income in Randolph Town?
Median Family Income in Randolph Town is $110,905.
What is the Median Household income in Randolph Town?
Median Household Income in Randolph Town is $94,905.
What is Income or Wage Gap in Randolph Town?
Income or Wage Gap in Randolph Town is 15.0%.
Women in Randolph Town earn 85.0 cents for every dollar earned by a man.
What is Inequality or Gini Index in Randolph Town?
Inequality or Gini Index in Randolph Town is 0.44.
What is the Total Population of Randolph Town?
Total Population of Randolph Town is 34,691.
What is the Total Male Population of Randolph Town?
Total Male Population of Randolph Town is 17,068.
What is the Total Female Population of Randolph Town?
Total Female Population of Randolph Town is 17,623.
What is the Ratio of Males per 100 Females in Randolph Town?
There are 96.85 Males per 100 Females in Randolph Town.
What is the Ratio of Females per 100 Males in Randolph Town?
There are 103.25 Females per 100 Males in Randolph Town.
What is the Median Population Age in Randolph Town?
Median Population Age in Randolph Town is 40.3 Years.
What is the Average Family Size in Randolph Town
Average Family Size in Randolph Town is 3.4 People.
What is the Average Household Size in Randolph Town
Average Household Size in Randolph Town is 2.8 People.
How Large is the Labor Force in Randolph Town?
There are 20,013 People in the Labor Forcein in Randolph Town.
What is the Percentage of People in the Labor Force in Randolph Town?
68.6% of People are in the Labor Force in Randolph Town.
What is the Unemployment Rate in Randolph Town?
Unemployment Rate in Randolph Town is 8.3%.