Northborough, MA Map & Demographics
Northborough Map
Northborough Overview
$75,980
PER CAPITA INCOME
$190,208
AVG FAMILY INCOME
$147,456
AVG HOUSEHOLD INCOME
57.3%
WAGE / INCOME GAP [ % ]
42.7¢/ $1
WAGE / INCOME GAP [ $ ]
0.46
INEQUALITY / GINI INDEX
6,677
TOTAL POPULATION
3,166
MALE POPULATION
3,511
FEMALE POPULATION
90.17
MALES / 100 FEMALES
110.90
FEMALES / 100 MALES
48.3
MEDIAN AGE
3.0
AVG FAMILY SIZE
2.5
AVG HOUSEHOLD SIZE
3,923
LABOR FORCE [ PEOPLE ]
71.1%
PERCENT IN LABOR FORCE
4.0%
UNEMPLOYMENT RATE
Northborough Zip Codes
Income in Northborough
Income Overview in Northborough
Per Capita Income in Northborough is $75,980, while median incomes of families and households are $190,208 and $147,456 respectively.
| Characteristic | Number | Measure |
| Per Capita Income | 6,677 | $75,980 |
| Median Family Income | 1,808 | $190,208 |
| Mean Family Income | 1,808 | $226,079 |
| Median Household Income | 2,582 | $147,456 |
| Mean Household Income | 2,582 | $194,997 |
| Income Deficit | 1,808 | $0 |
| Wage / Income Gap (%) | 6,677 | 57.35% |
| Wage / Income Gap ($) | 6,677 | 42.65¢ per $1 |
| Gini / Inequality Index | 6,677 | 0.46 |
Earnings by Sex in Northborough
Average Earnings in Northborough are $74,776, $112,310 for men and $47,903 for women, a difference of 57.4%.
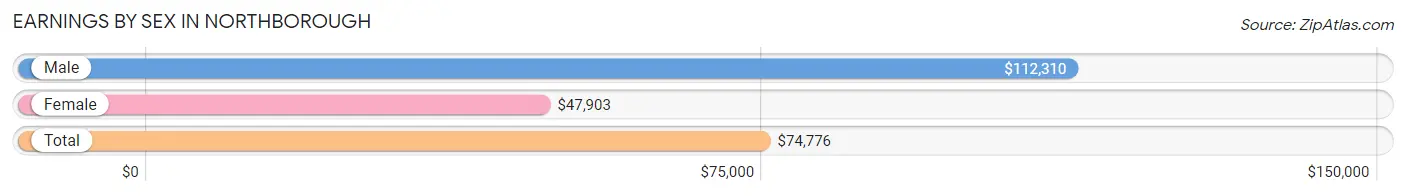
| Sex | Number | Average Earnings |
| Male | 2,032 (48.7%) | $112,310 |
| Female | 2,144 (51.3%) | $47,903 |
| Total | 4,176 (100.0%) | $74,776 |
Earnings by Sex by Income Bracket in Northborough
The most common earnings brackets in Northborough are $100,000+ for men (1,175 | 57.8%) and $100,000+ for women (484 | 22.6%).
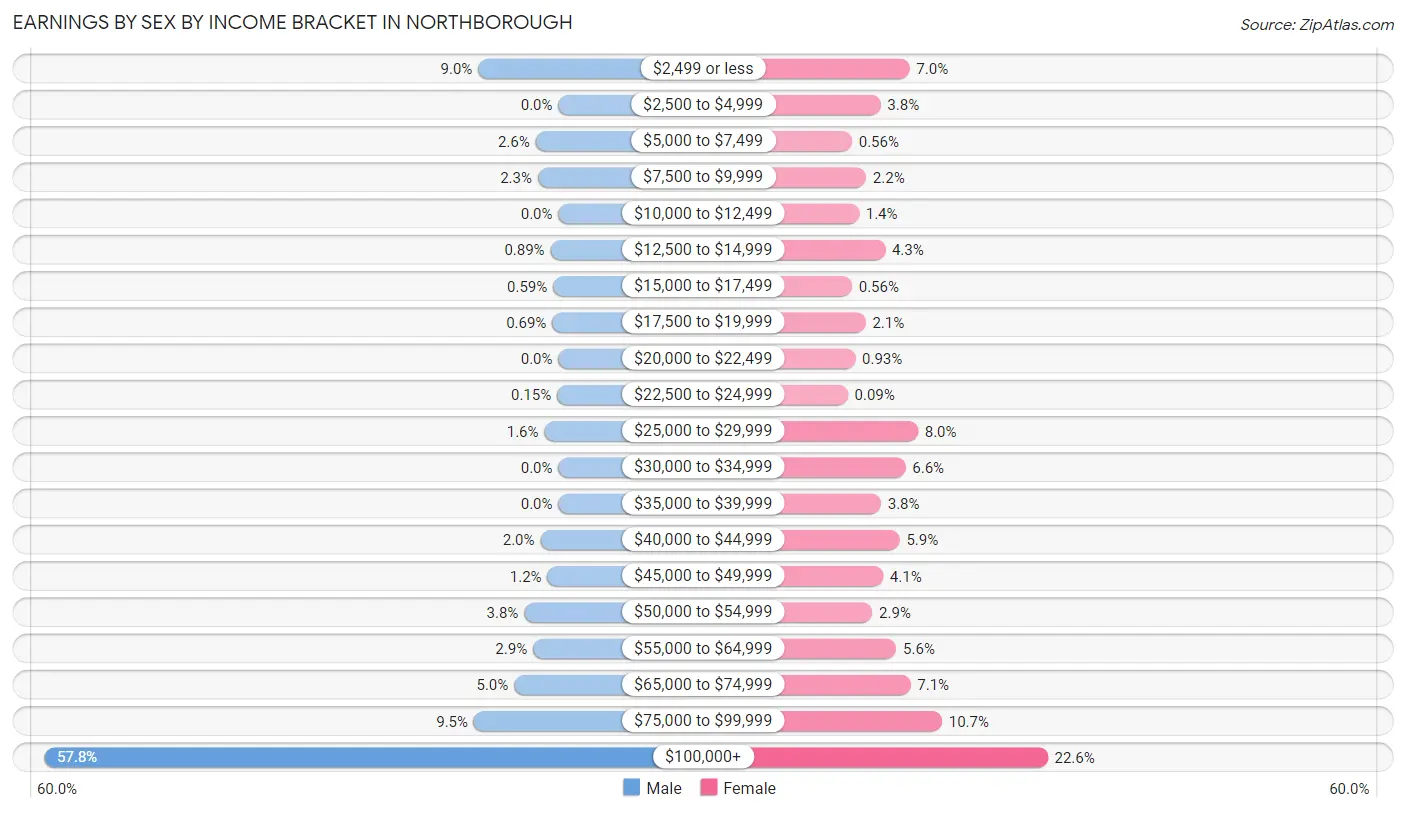
| Income | Male | Female |
| $2,499 or less | 183 (9.0%) | 151 (7.0%) |
| $2,500 to $4,999 | 0 (0.0%) | 81 (3.8%) |
| $5,000 to $7,499 | 52 (2.6%) | 12 (0.6%) |
| $7,500 to $9,999 | 47 (2.3%) | 46 (2.1%) |
| $10,000 to $12,499 | 0 (0.0%) | 29 (1.3%) |
| $12,500 to $14,999 | 18 (0.9%) | 92 (4.3%) |
| $15,000 to $17,499 | 12 (0.6%) | 12 (0.6%) |
| $17,500 to $19,999 | 14 (0.7%) | 45 (2.1%) |
| $20,000 to $22,499 | 0 (0.0%) | 20 (0.9%) |
| $22,500 to $24,999 | 3 (0.2%) | 2 (0.1%) |
| $25,000 to $29,999 | 32 (1.6%) | 171 (8.0%) |
| $30,000 to $34,999 | 0 (0.0%) | 141 (6.6%) |
| $35,000 to $39,999 | 0 (0.0%) | 82 (3.8%) |
| $40,000 to $44,999 | 41 (2.0%) | 127 (5.9%) |
| $45,000 to $49,999 | 25 (1.2%) | 87 (4.1%) |
| $50,000 to $54,999 | 78 (3.8%) | 61 (2.9%) |
| $55,000 to $64,999 | 58 (2.9%) | 119 (5.6%) |
| $65,000 to $74,999 | 101 (5.0%) | 153 (7.1%) |
| $75,000 to $99,999 | 193 (9.5%) | 229 (10.7%) |
| $100,000+ | 1,175 (57.8%) | 484 (22.6%) |
| Total | 2,032 (100.0%) | 2,144 (100.0%) |
Earnings by Sex by Educational Attainment in Northborough
Average earnings in Northborough are $124,158 for men and $56,058 for women, a difference of 54.8%. Men with an educational attainment of bachelor's degree enjoy the highest average annual earnings of $152,273, while those with college or associate's degree education earn the least with $65,000. Women with an educational attainment of graduate degree earn the most with the average annual earnings of $74,175, while those with high school diploma education have the smallest earnings of $36,310.
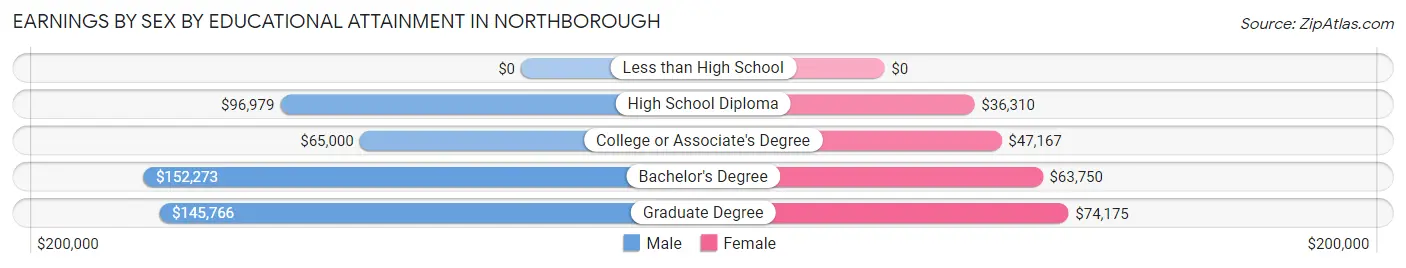
| Educational Attainment | Male Income | Female Income |
| Less than High School | - | - |
| High School Diploma | $96,979 | $36,310 |
| College or Associate's Degree | $65,000 | $47,167 |
| Bachelor's Degree | $152,273 | $63,750 |
| Graduate Degree | $145,766 | $74,175 |
| Total | $124,158 | $56,058 |
Family Income in Northborough
Family Income Brackets in Northborough
According to the Northborough family income data, there are 843 families falling into the $200,000+ income range, which is the most common income bracket and makes up 46.6% of all families.
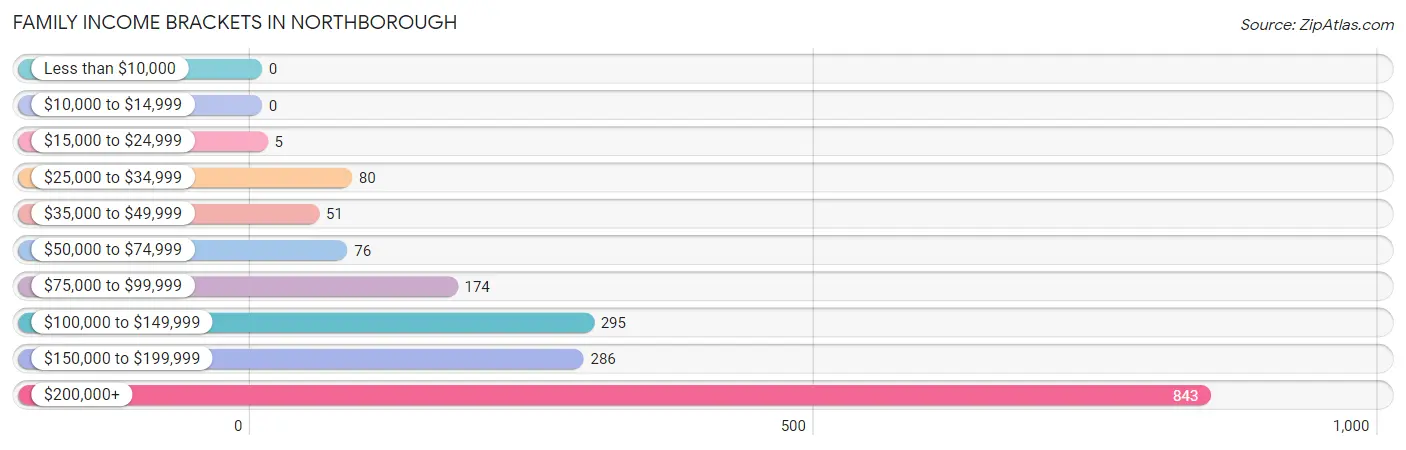
| Income Bracket | # Families | % Families |
| Less than $10,000 | 0 | 0.0% |
| $10,000 to $14,999 | 0 | 0.0% |
| $15,000 to $24,999 | 5 | 0.3% |
| $25,000 to $34,999 | 80 | 4.4% |
| $35,000 to $49,999 | 51 | 2.8% |
| $50,000 to $74,999 | 76 | 4.2% |
| $75,000 to $99,999 | 174 | 9.6% |
| $100,000 to $149,999 | 295 | 16.3% |
| $150,000 to $199,999 | 286 | 15.8% |
| $200,000+ | 843 | 46.6% |
Family Income by Famaliy Size in Northborough
4-person families (509 | 28.1%) account for the highest median family income in Northborough with $228,618 per family, while 2-person families (795 | 44.0%) have the highest median income of $80,128 per family member.
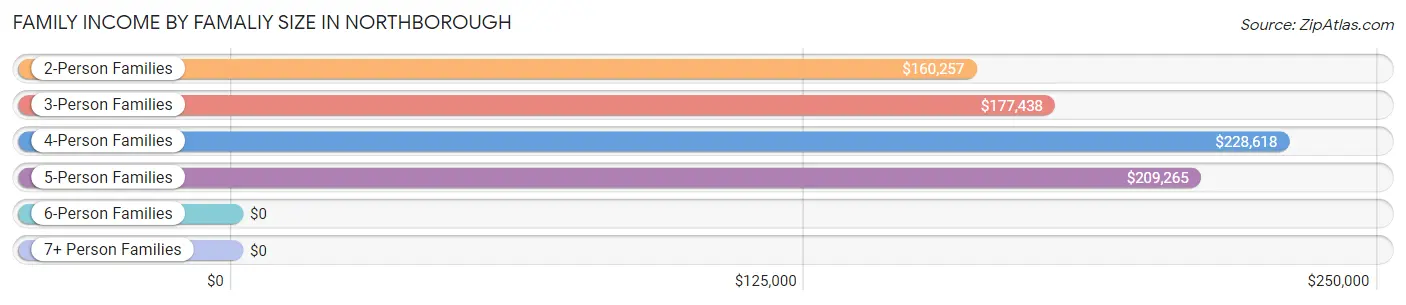
| Income Bracket | # Families | Median Income |
| 2-Person Families | 795 (44.0%) | $160,257 |
| 3-Person Families | 402 (22.2%) | $177,438 |
| 4-Person Families | 509 (28.1%) | $228,618 |
| 5-Person Families | 78 (4.3%) | $209,265 |
| 6-Person Families | 24 (1.3%) | $0 |
| 7+ Person Families | 0 (0.0%) | $0 |
| Total | 1,808 (100.0%) | $190,208 |
Family Income by Number of Earners in Northborough
The median family income in Northborough is $190,208, with families comprising 3+ earners (314) having the highest median family income of $250,001, while families with no earners (214) have the lowest median family income of $87,000, accounting for 17.4% and 11.8% of families, respectively.
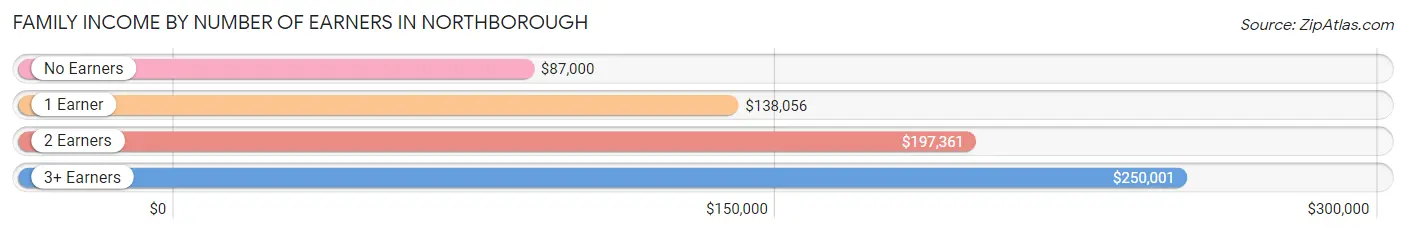
| Number of Earners | # Families | Median Income |
| No Earners | 214 (11.8%) | $87,000 |
| 1 Earner | 208 (11.5%) | $138,056 |
| 2 Earners | 1,072 (59.3%) | $197,361 |
| 3+ Earners | 314 (17.4%) | $250,001 |
| Total | 1,808 (100.0%) | $190,208 |
Household Income in Northborough
Household Income Brackets in Northborough
With 958 households falling in the category, the $200,000+ income range is the most frequent in Northborough, accounting for 37.1% of all households. In contrast, only 31 households (1.2%) fall into the less than $10,000 income bracket, making it the least populous group.
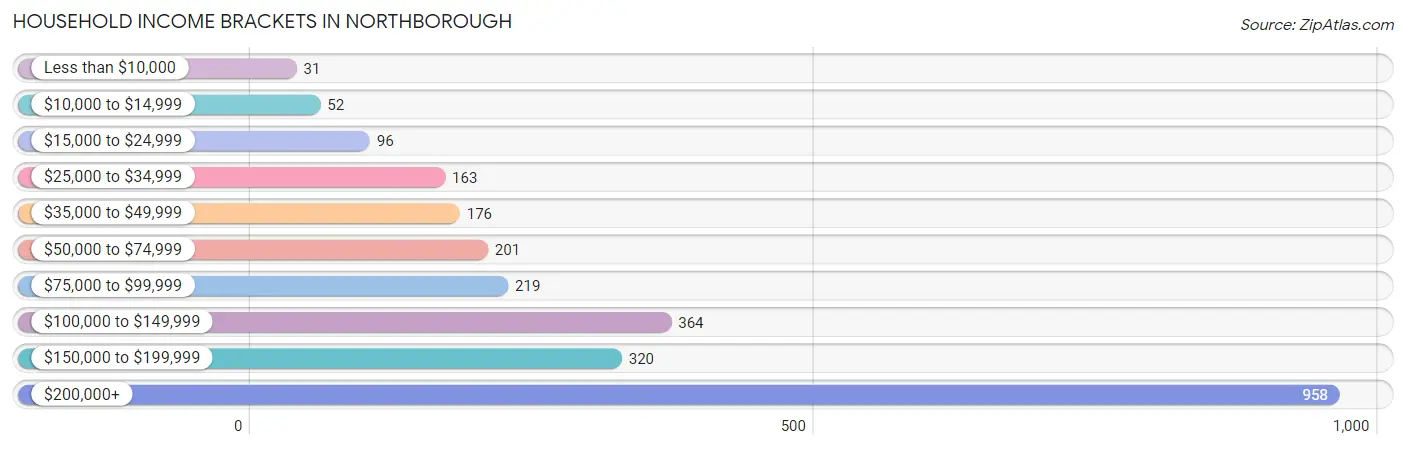
| Income Bracket | # Households | % Households |
| Less than $10,000 | 31 | 1.2% |
| $10,000 to $14,999 | 52 | 2.0% |
| $15,000 to $24,999 | 96 | 3.7% |
| $25,000 to $34,999 | 163 | 6.3% |
| $35,000 to $49,999 | 176 | 6.8% |
| $50,000 to $74,999 | 201 | 7.8% |
| $75,000 to $99,999 | 219 | 8.5% |
| $100,000 to $149,999 | 364 | 14.1% |
| $150,000 to $199,999 | 320 | 12.4% |
| $200,000+ | 958 | 37.1% |
Household Income by Householder Age in Northborough
The median household income in Northborough is $147,456, with the highest median household income of $192,083 found in the 45 to 64 years age bracket for the primary householder. A total of 1,374 households (53.2%) fall into this category. Meanwhile, the 15 to 24 years age bracket for the primary householder has the lowest median household income of $0, with 19 households (0.7%) in this group.
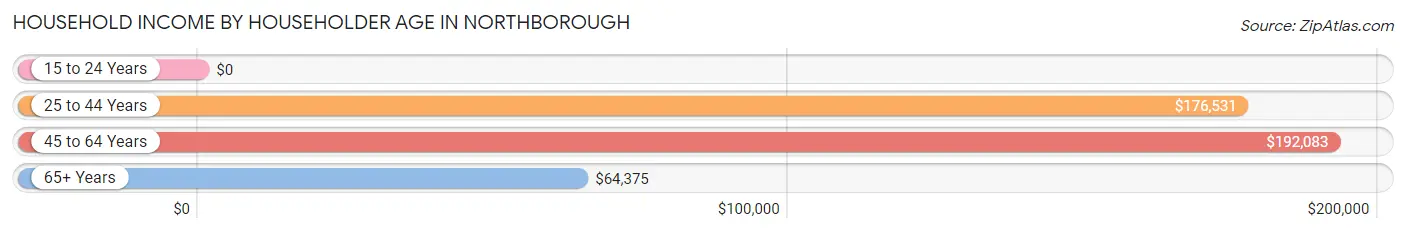
| Income Bracket | # Households | Median Income |
| 15 to 24 Years | 19 (0.7%) | $0 |
| 25 to 44 Years | 487 (18.9%) | $176,531 |
| 45 to 64 Years | 1,374 (53.2%) | $192,083 |
| 65+ Years | 702 (27.2%) | $64,375 |
| Total | 2,582 (100.0%) | $147,456 |
Poverty in Northborough
Income Below Poverty by Sex and Age in Northborough
With 0.9% poverty level for males and 3.3% for females among the residents of Northborough, 65 to 74 year old males and 65 to 74 year old females are the most vulnerable to poverty, with 8 males (2.6%) and 35 females (8.5%) in their respective age groups living below the poverty level.
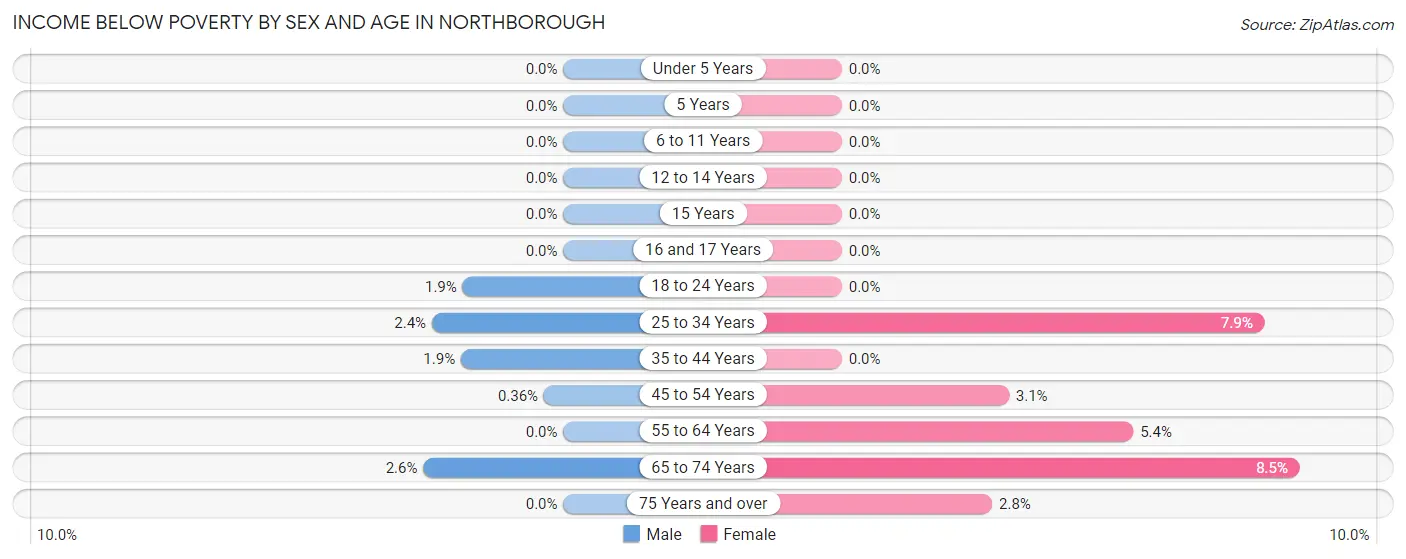
| Age Bracket | Male | Female |
| Under 5 Years | 0 (0.0%) | 0 (0.0%) |
| 5 Years | 0 (0.0%) | 0 (0.0%) |
| 6 to 11 Years | 0 (0.0%) | 0 (0.0%) |
| 12 to 14 Years | 0 (0.0%) | 0 (0.0%) |
| 15 Years | 0 (0.0%) | 0 (0.0%) |
| 16 and 17 Years | 0 (0.0%) | 0 (0.0%) |
| 18 to 24 Years | 6 (1.9%) | 0 (0.0%) |
| 25 to 34 Years | 7 (2.4%) | 19 (7.9%) |
| 35 to 44 Years | 4 (1.9%) | 0 (0.0%) |
| 45 to 54 Years | 3 (0.4%) | 26 (3.1%) |
| 55 to 64 Years | 0 (0.0%) | 27 (5.4%) |
| 65 to 74 Years | 8 (2.6%) | 35 (8.5%) |
| 75 Years and over | 0 (0.0%) | 7 (2.8%) |
| Total | 28 (0.9%) | 114 (3.3%) |
Income Above Poverty by Sex and Age in Northborough
According to the poverty statistics in Northborough, males aged under 5 years and females aged under 5 years are the age groups that are most secure financially, with 100.0% of males and 100.0% of females in these age groups living above the poverty line.
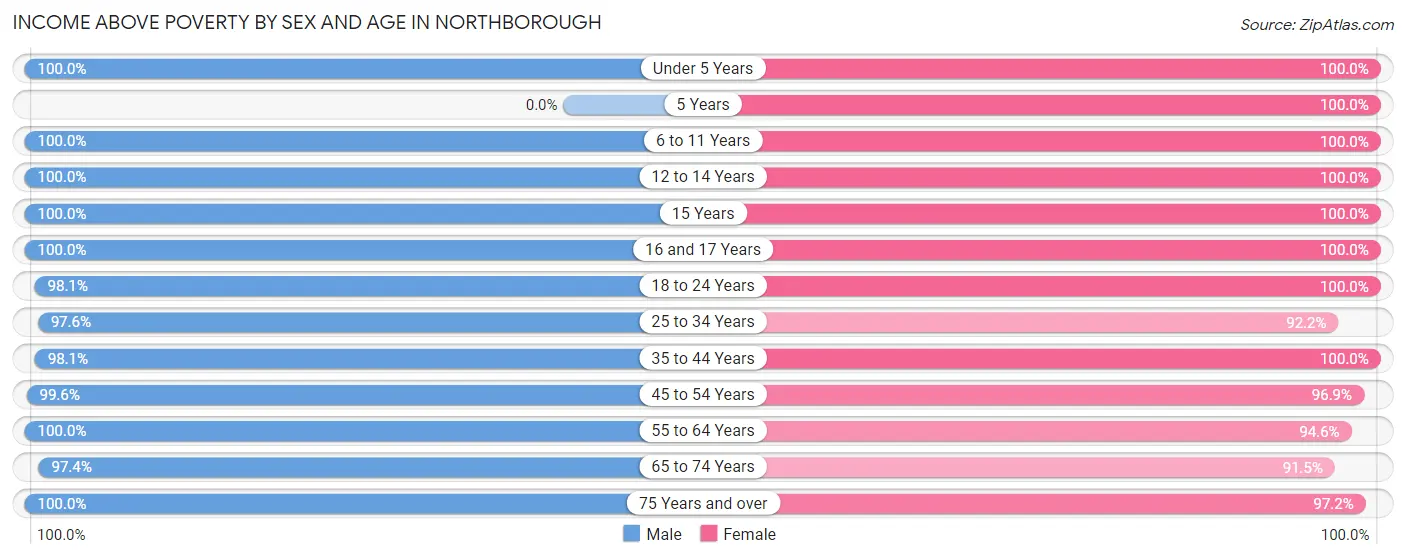
| Age Bracket | Male | Female |
| Under 5 Years | 104 (100.0%) | 135 (100.0%) |
| 5 Years | 0 (0.0%) | 60 (100.0%) |
| 6 to 11 Years | 186 (100.0%) | 256 (100.0%) |
| 12 to 14 Years | 178 (100.0%) | 55 (100.0%) |
| 15 Years | 141 (100.0%) | 45 (100.0%) |
| 16 and 17 Years | 103 (100.0%) | 80 (100.0%) |
| 18 to 24 Years | 315 (98.1%) | 200 (100.0%) |
| 25 to 34 Years | 280 (97.6%) | 223 (92.1%) |
| 35 to 44 Years | 207 (98.1%) | 347 (100.0%) |
| 45 to 54 Years | 825 (99.6%) | 813 (96.9%) |
| 55 to 64 Years | 314 (100.0%) | 472 (94.6%) |
| 65 to 74 Years | 300 (97.4%) | 377 (91.5%) |
| 75 Years and over | 136 (100.0%) | 244 (97.2%) |
| Total | 3,089 (99.1%) | 3,307 (96.7%) |
Income Below Poverty Among Married-Couple Families in Northborough
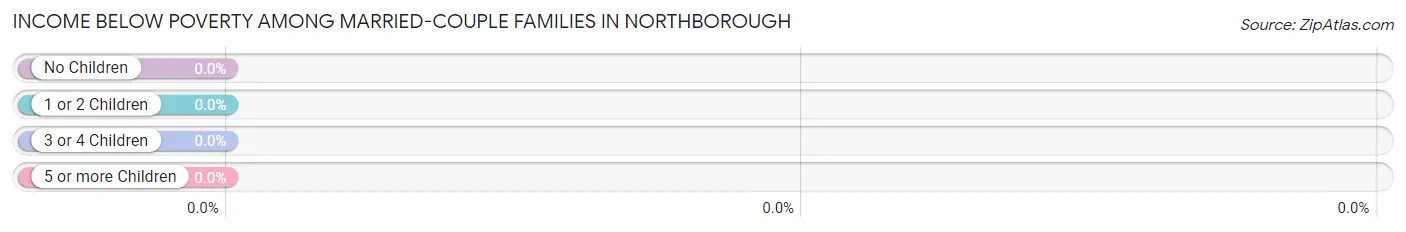
| Children | Above Poverty | Below Poverty |
| No Children | 795 (100.0%) | 0 (0.0%) |
| 1 or 2 Children | 676 (100.0%) | 0 (0.0%) |
| 3 or 4 Children | 68 (100.0%) | 0 (0.0%) |
| 5 or more Children | 0 (0.0%) | 0 (0.0%) |
| Total | 1,539 (100.0%) | 0 (0.0%) |
Income Below Poverty Among Single-Parent Households in Northborough
| Children | Single Father | Single Mother |
| No Children | 0 (0.0%) | 0 (0.0%) |
| 1 or 2 Children | 0 (0.0%) | 0 (0.0%) |
| 3 or 4 Children | 0 (0.0%) | 0 (0.0%) |
| 5 or more Children | 0 (0.0%) | 0 (0.0%) |
| Total | 0 (0.0%) | 0 (0.0%) |
Income Below Poverty Among Married-Couple vs Single-Parent Households in Northborough
| Children | Married-Couple Families | Single-Parent Households |
| No Children | 0 (0.0%) | 0 (0.0%) |
| 1 or 2 Children | 0 (0.0%) | 0 (0.0%) |
| 3 or 4 Children | 0 (0.0%) | 0 (0.0%) |
| 5 or more Children | 0 (0.0%) | 0 (0.0%) |
| Total | 0 (0.0%) | 0 (0.0%) |
Race in Northborough
The most populous races in Northborough are White / Caucasian (5,561 | 83.3%), Asian (514 | 7.7%), and Hispanic or Latino (338 | 5.1%).
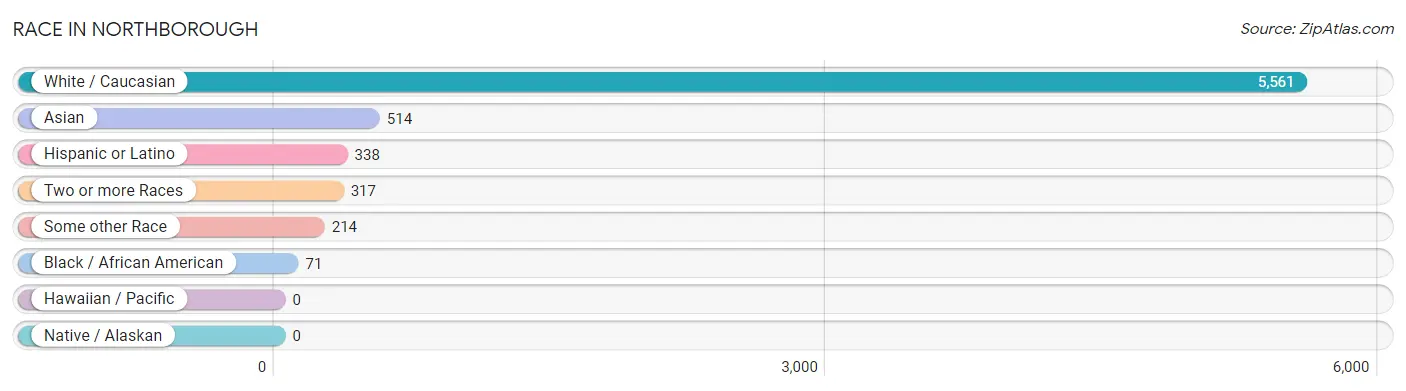
| Race | # Population | % Population |
| Asian | 514 | 7.7% |
| Black / African American | 71 | 1.1% |
| Hawaiian / Pacific | 0 | 0.0% |
| Hispanic or Latino | 338 | 5.1% |
| Native / Alaskan | 0 | 0.0% |
| White / Caucasian | 5,561 | 83.3% |
| Two or more Races | 317 | 4.8% |
| Some other Race | 214 | 3.2% |
| Total | 6,677 | 100.0% |
Ancestry in Northborough
The most populous ancestries reported in Northborough are Irish (1,566 | 23.4%), Italian (971 | 14.5%), English (597 | 8.9%), French (428 | 6.4%), and European (320 | 4.8%), together accounting for 58.1% of all Northborough residents.
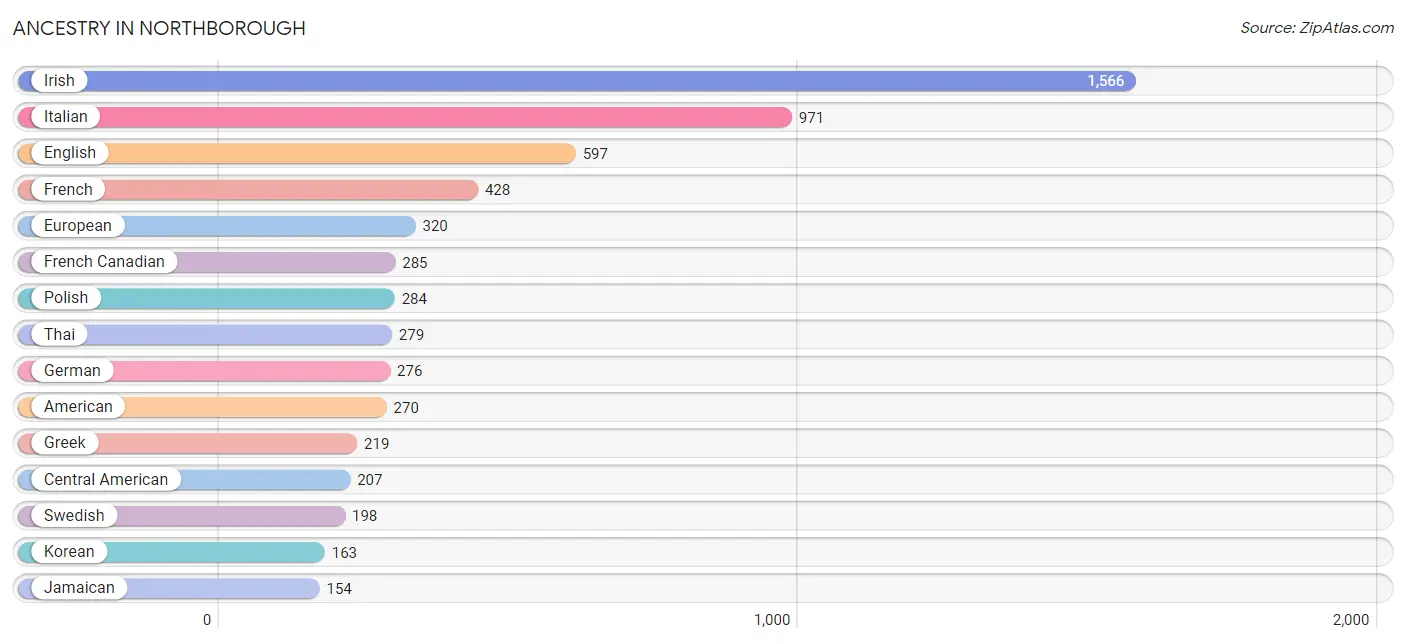
| Ancestry | # Population | % Population |
| African | 18 | 0.3% |
| Albanian | 11 | 0.2% |
| American | 270 | 4.0% |
| Arab | 80 | 1.2% |
| Armenian | 8 | 0.1% |
| Bhutanese | 20 | 0.3% |
| Brazilian | 74 | 1.1% |
| British | 9 | 0.1% |
| Burmese | 21 | 0.3% |
| Central American | 207 | 3.1% |
| Danish | 60 | 0.9% |
| Dutch | 10 | 0.2% |
| Eastern European | 63 | 0.9% |
| Egyptian | 11 | 0.2% |
| English | 597 | 8.9% |
| European | 320 | 4.8% |
| Finnish | 23 | 0.3% |
| French | 428 | 6.4% |
| French Canadian | 285 | 4.3% |
| German | 276 | 4.1% |
| Greek | 219 | 3.3% |
| Indian (Asian) | 64 | 1.0% |
| Iranian | 17 | 0.3% |
| Irish | 1,566 | 23.4% |
| Italian | 971 | 14.5% |
| Jamaican | 154 | 2.3% |
| Korean | 163 | 2.4% |
| Lebanese | 62 | 0.9% |
| Lithuanian | 98 | 1.5% |
| Mexican | 11 | 0.2% |
| Northern European | 7 | 0.1% |
| Norwegian | 72 | 1.1% |
| Palestinian | 7 | 0.1% |
| Panamanian | 154 | 2.3% |
| Polish | 284 | 4.3% |
| Portuguese | 37 | 0.5% |
| Puerto Rican | 80 | 1.2% |
| Russian | 105 | 1.6% |
| Salvadoran | 53 | 0.8% |
| Scotch-Irish | 36 | 0.5% |
| Scottish | 75 | 1.1% |
| Spaniard | 27 | 0.4% |
| Spanish | 10 | 0.2% |
| Subsaharan African | 18 | 0.3% |
| Swedish | 198 | 3.0% |
| Thai | 279 | 4.2% |
| Turkish | 29 | 0.4% |
| Ukrainian | 10 | 0.2% |
| Welsh | 37 | 0.5% | View All 49 Rows |
Immigrants in Northborough
The most numerous immigrant groups reported in Northborough came from Latin America (242 | 3.6%), Asia (238 | 3.6%), South America (227 | 3.4%), Brazil (173 | 2.6%), and South Central Asia (139 | 2.1%), together accounting for 15.3% of all Northborough residents.
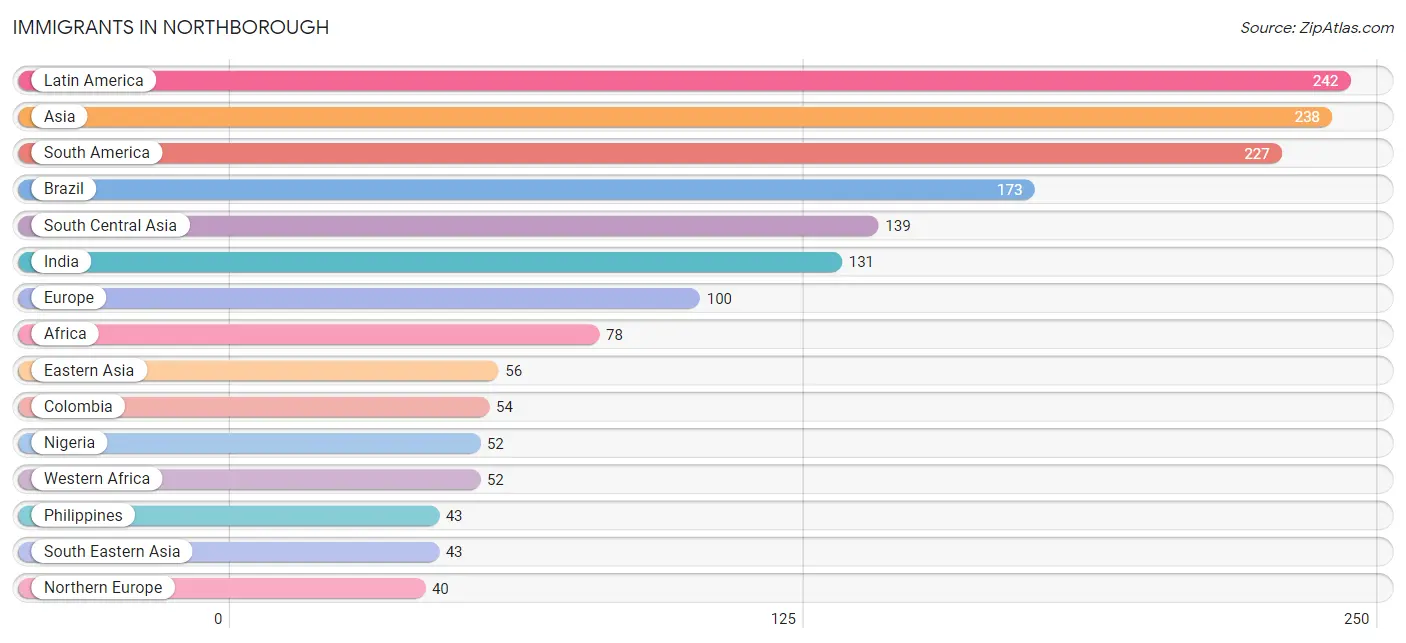
| Immigration Origin | # Population | % Population |
| Africa | 78 | 1.2% |
| Asia | 238 | 3.6% |
| Brazil | 173 | 2.6% |
| Canada | 9 | 0.1% |
| Central America | 15 | 0.2% |
| China | 35 | 0.5% |
| Colombia | 54 | 0.8% |
| Czechoslovakia | 16 | 0.2% |
| Eastern Africa | 18 | 0.3% |
| Eastern Asia | 56 | 0.8% |
| Eastern Europe | 35 | 0.5% |
| Egypt | 8 | 0.1% |
| El Salvador | 15 | 0.2% |
| Europe | 100 | 1.5% |
| Greece | 14 | 0.2% |
| Hong Kong | 13 | 0.2% |
| India | 131 | 2.0% |
| Iran | 8 | 0.1% |
| Italy | 11 | 0.2% |
| Kenya | 18 | 0.3% |
| Korea | 21 | 0.3% |
| Latin America | 242 | 3.6% |
| Nigeria | 52 | 0.8% |
| Northern Africa | 8 | 0.1% |
| Northern Europe | 40 | 0.6% |
| Philippines | 43 | 0.6% |
| Russia | 14 | 0.2% |
| South America | 227 | 3.4% |
| South Central Asia | 139 | 2.1% |
| South Eastern Asia | 43 | 0.6% |
| Southern Europe | 25 | 0.4% |
| Ukraine | 5 | 0.1% |
| Western Africa | 52 | 0.8% | View All 33 Rows |
Sex and Age in Northborough
Sex and Age in Northborough
The most populous age groups in Northborough are 50 to 54 Years (553 | 17.5%) for men and 50 to 54 Years (445 | 12.7%) for women.
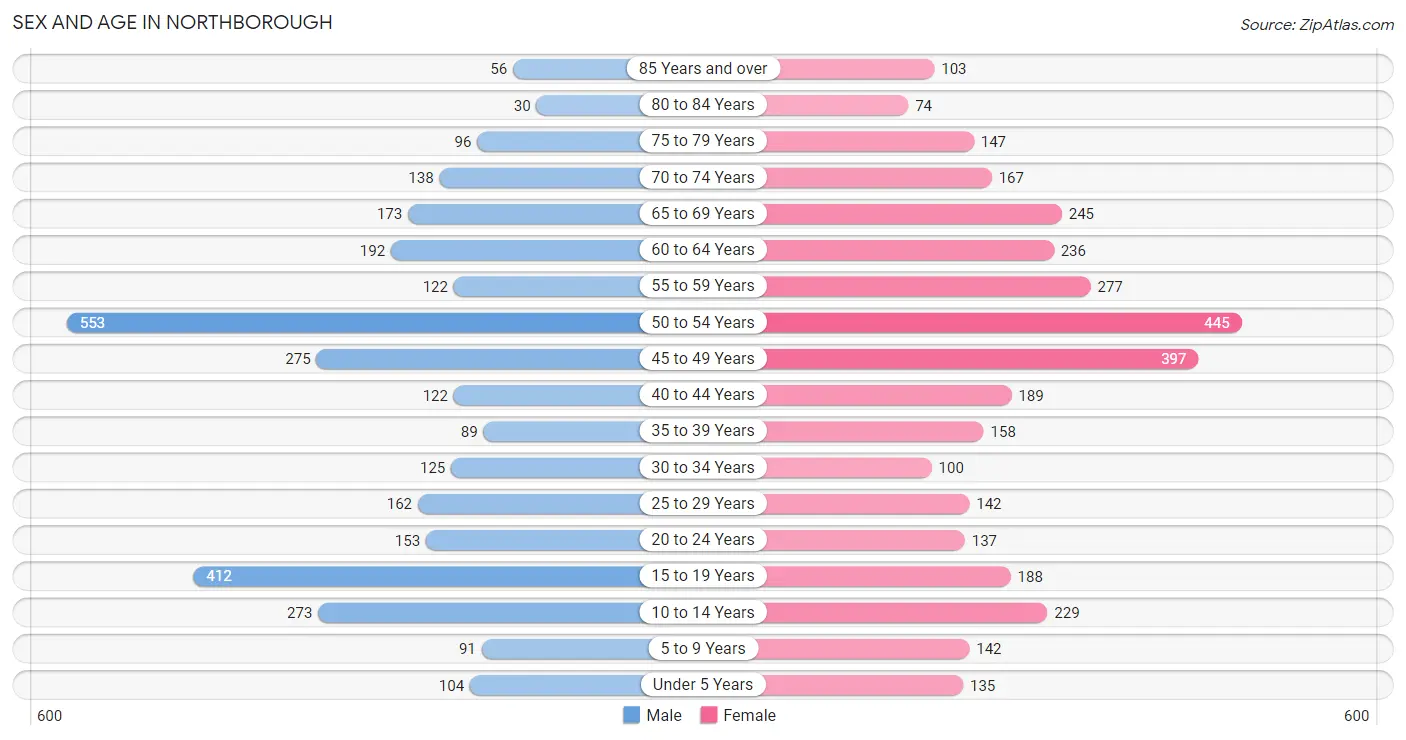
| Age Bracket | Male | Female |
| Under 5 Years | 104 (3.3%) | 135 (3.8%) |
| 5 to 9 Years | 91 (2.9%) | 142 (4.0%) |
| 10 to 14 Years | 273 (8.6%) | 229 (6.5%) |
| 15 to 19 Years | 412 (13.0%) | 188 (5.3%) |
| 20 to 24 Years | 153 (4.8%) | 137 (3.9%) |
| 25 to 29 Years | 162 (5.1%) | 142 (4.0%) |
| 30 to 34 Years | 125 (4.0%) | 100 (2.9%) |
| 35 to 39 Years | 89 (2.8%) | 158 (4.5%) |
| 40 to 44 Years | 122 (3.8%) | 189 (5.4%) |
| 45 to 49 Years | 275 (8.7%) | 397 (11.3%) |
| 50 to 54 Years | 553 (17.5%) | 445 (12.7%) |
| 55 to 59 Years | 122 (3.8%) | 277 (7.9%) |
| 60 to 64 Years | 192 (6.1%) | 236 (6.7%) |
| 65 to 69 Years | 173 (5.5%) | 245 (7.0%) |
| 70 to 74 Years | 138 (4.4%) | 167 (4.8%) |
| 75 to 79 Years | 96 (3.0%) | 147 (4.2%) |
| 80 to 84 Years | 30 (0.9%) | 74 (2.1%) |
| 85 Years and over | 56 (1.8%) | 103 (2.9%) |
| Total | 3,166 (100.0%) | 3,511 (100.0%) |
Families and Households in Northborough
Median Family Size in Northborough
The median family size in Northborough is 2.99 persons per family, with married-couple families (1,539 | 85.1%) accounting for the largest median family size of 3.06 persons per family. On the other hand, single female/mother families (232 | 12.8%) represent the smallest median family size with 2.55 persons per family.
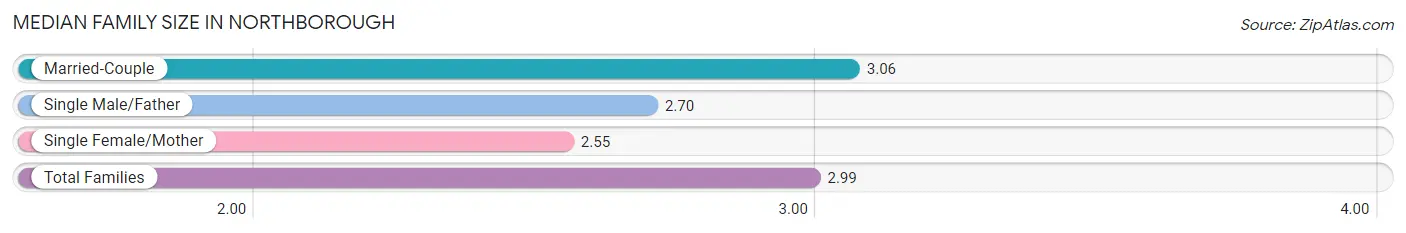
| Family Type | # Families | Family Size |
| Married-Couple | 1,539 (85.1%) | 3.06 |
| Single Male/Father | 37 (2.1%) | 2.70 |
| Single Female/Mother | 232 (12.8%) | 2.55 |
| Total Families | 1,808 (100.0%) | 2.99 |
Median Household Size in Northborough
The median household size in Northborough is 2.52 persons per household, with married-couple households (1,539 | 59.6%) accounting for the largest median household size of 3.06 persons per household. non-family households (774 | 30.0%) represent the smallest median household size with 1.40 persons per household.
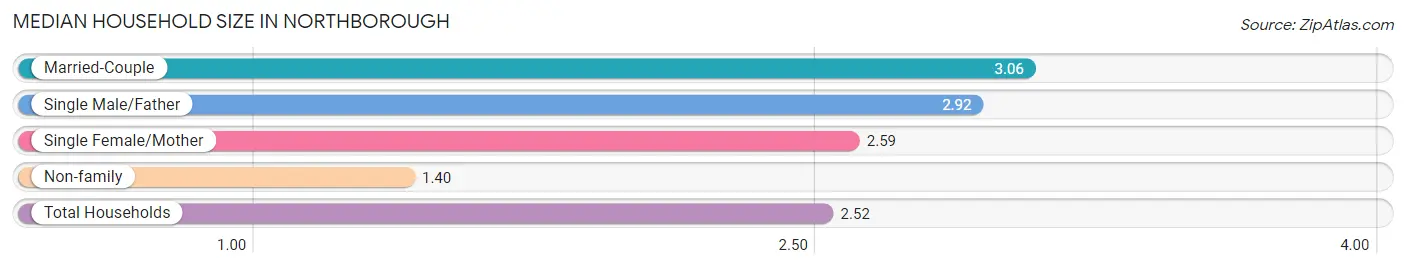
| Household Type | # Households | Household Size |
| Married-Couple | 1,539 (59.6%) | 3.06 |
| Single Male/Father | 37 (1.4%) | 2.92 |
| Single Female/Mother | 232 (9.0%) | 2.59 |
| Non-family | 774 (30.0%) | 1.40 |
| Total Households | 2,582 (100.0%) | 2.52 |
Household Size by Marriage Status in Northborough
Out of a total of 2,582 households in Northborough, 1,808 (70.0%) are family households, while 774 (30.0%) are nonfamily households. The most numerous type of family households are 2-person households, comprising 795, and the most common type of nonfamily households are 1-person households, comprising 599.
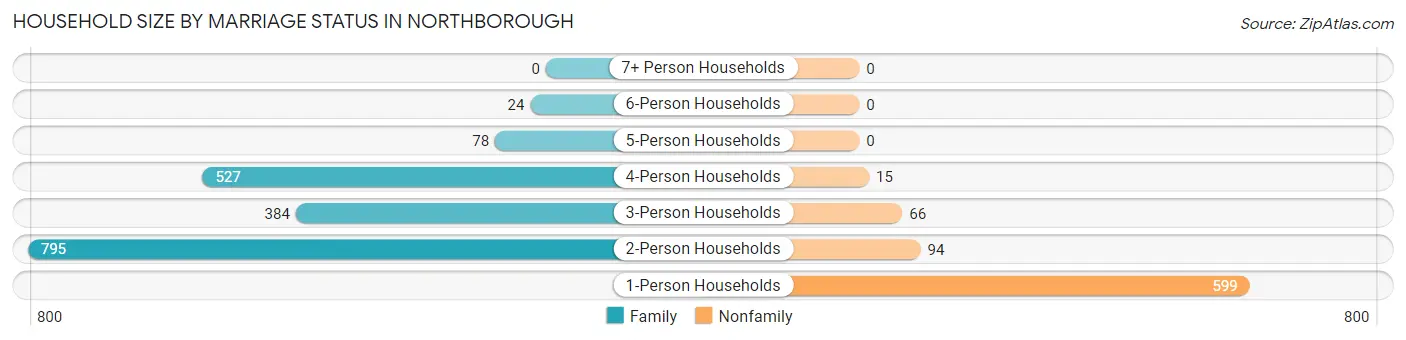
| Household Size | Family Households | Nonfamily Households |
| 1-Person Households | - | 599 (23.2%) |
| 2-Person Households | 795 (30.8%) | 94 (3.6%) |
| 3-Person Households | 384 (14.9%) | 66 (2.6%) |
| 4-Person Households | 527 (20.4%) | 15 (0.6%) |
| 5-Person Households | 78 (3.0%) | 0 (0.0%) |
| 6-Person Households | 24 (0.9%) | 0 (0.0%) |
| 7+ Person Households | 0 (0.0%) | 0 (0.0%) |
| Total | 1,808 (70.0%) | 774 (30.0%) |
Female Fertility in Northborough
Fertility by Age in Northborough
Average fertility rate in Northborough is 5.0 births per 1,000 women. Women in the age bracket of 20 to 34 years have the highest fertility rate with 18.0 births per 1,000 women. Women in the age bracket of 20 to 34 years acount for 100.0% of all women with births.
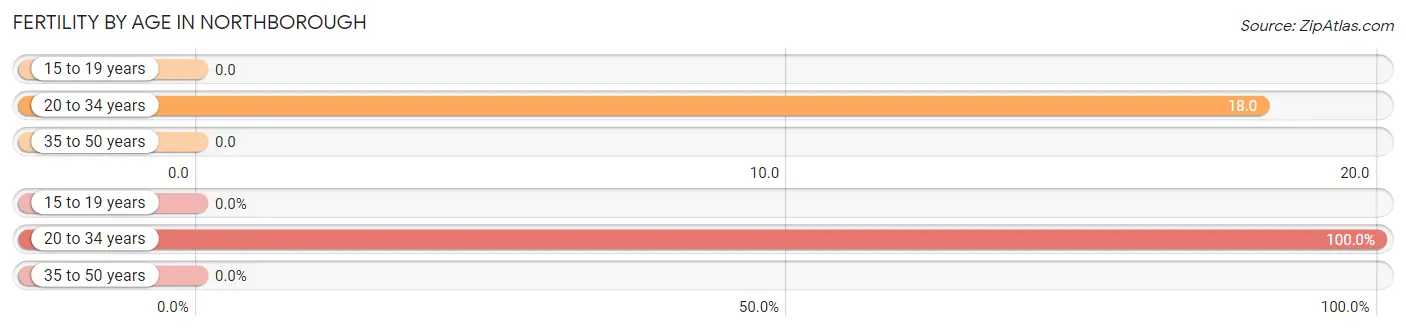
| Age Bracket | Women with Births | Births / 1,000 Women |
| 15 to 19 years | 0 (0.0%) | 0.0 |
| 20 to 34 years | 7 (100.0%) | 18.0 |
| 35 to 50 years | 0 (0.0%) | 0.0 |
| Total | 7 (100.0%) | 5.0 |
Fertility by Age by Marriage Status in Northborough
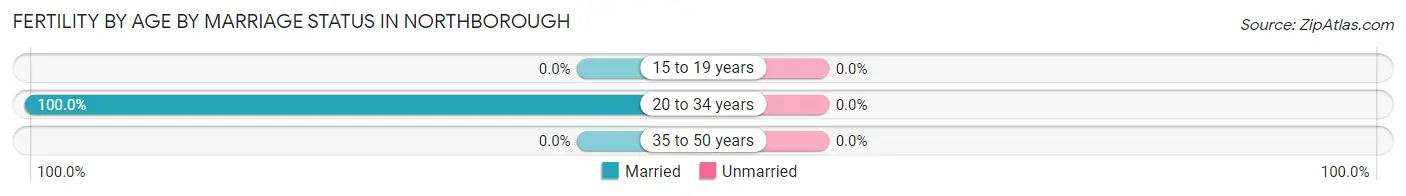
| Age Bracket | Married | Unmarried |
| 15 to 19 years | 0 (0.0%) | 0 (0.0%) |
| 20 to 34 years | 7 (100.0%) | 0 (0.0%) |
| 35 to 50 years | 0 (0.0%) | 0 (0.0%) |
| Total | 7 (100.0%) | 0 (0.0%) |
Fertility by Education in Northborough
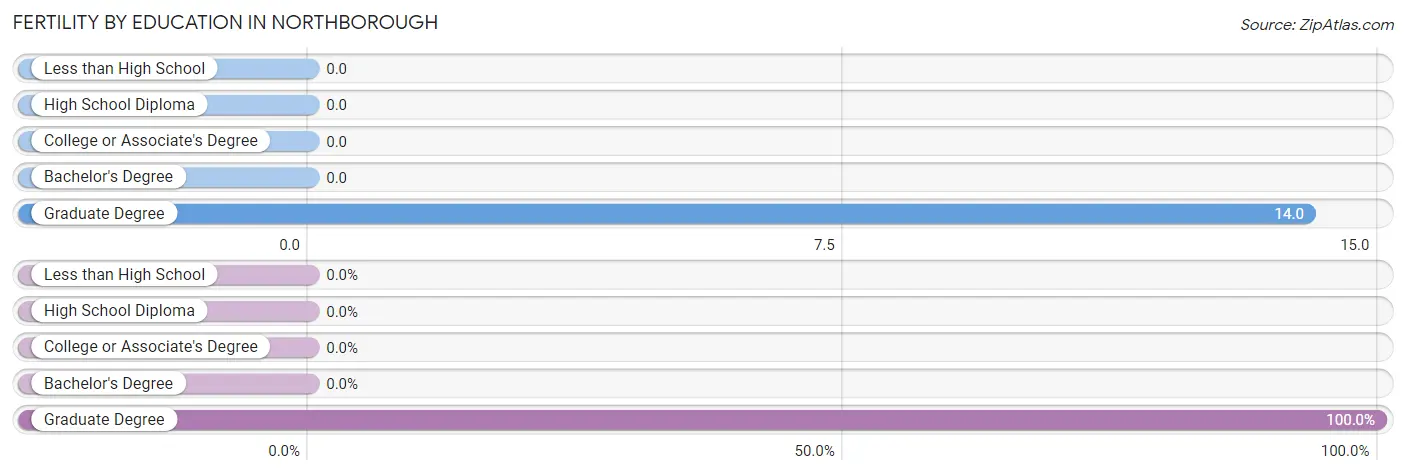
| Educational Attainment | Women with Births | Births / 1,000 Women |
| Less than High School | 0 (0.0%) | 0.0 |
| High School Diploma | 0 (0.0%) | 0.0 |
| College or Associate's Degree | 0 (0.0%) | 0.0 |
| Bachelor's Degree | 0 (0.0%) | 0.0 |
| Graduate Degree | 7 (100.0%) | 14.0 |
| Total | 7 (100.0%) | 5.0 |
Fertility by Education by Marriage Status in Northborough
| Educational Attainment | Married | Unmarried |
| Less than High School | 0 (0.0%) | 0 (0.0%) |
| High School Diploma | 0 (0.0%) | 0 (0.0%) |
| College or Associate's Degree | 0 (0.0%) | 0 (0.0%) |
| Bachelor's Degree | 0 (0.0%) | 0 (0.0%) |
| Graduate Degree | 7 (100.0%) | 0 (0.0%) |
| Total | 7 (100.0%) | 0 (0.0%) |
Employment Characteristics in Northborough
Employment by Class of Employer in Northborough
Among the 3,738 employed individuals in Northborough, private company employees (2,153 | 57.6%), local government employees (594 | 15.9%), and not-for-profit organizations (394 | 10.5%) make up the most common classes of employment.
| Employer Class | # Employees | % Employees |
| Private Company Employees | 2,153 | 57.6% |
| Self-Employed (Incorporated) | 103 | 2.8% |
| Self-Employed (Not Incorporated) | 327 | 8.7% |
| Not-for-profit Organizations | 394 | 10.5% |
| Local Government Employees | 594 | 15.9% |
| State Government Employees | 143 | 3.8% |
| Federal Government Employees | 24 | 0.6% |
| Unpaid Family Workers | 0 | 0.0% |
| Total | 3,738 | 100.0% |
Employment Status by Age in Northborough
According to the labor force statistics for Northborough, out of the total population over 16 years of age (5,517), 71.1% or 3,923 individuals are in the labor force, with 4.0% or 157 of them unemployed. The age group with the highest labor force participation rate is 25 to 29 years, with 97.7% or 297 individuals in the labor force. Within the labor force, the 65 to 74 years age range has the highest percentage of unemployed individuals, with 18.9% or 57 of them being unemployed.
| Age Bracket | In Labor Force | Unemployed |
| 16 to 19 Years | 167 (40.3%) | 12 (7.2%) |
| 20 to 24 Years | 232 (80.0%) | 41 (17.7%) |
| 25 to 29 Years | 297 (97.7%) | 10 (3.4%) |
| 30 to 34 Years | 216 (96.0%) | 2 (0.9%) |
| 35 to 44 Years | 457 (81.9%) | 0 (0.0%) |
| 45 to 54 Years | 1,550 (92.8%) | 34 (2.2%) |
| 55 to 59 Years | 317 (79.4%) | 0 (0.0%) |
| 60 to 64 Years | 331 (77.3%) | 0 (0.0%) |
| 65 to 74 Years | 301 (41.6%) | 57 (18.9%) |
| 75 Years and over | 58 (11.5%) | 0 (0.0%) |
| Total | 3,923 (71.1%) | 157 (4.0%) |
Employment Status by Educational Attainment in Northborough
According to labor force statistics for Northborough, 88.4% of individuals (3,168) out of the total population between 25 and 64 years of age (3,584) are in the labor force, with 1.5% or 48 of them being unemployed. The group with the highest labor force participation rate are those with the educational attainment of bachelor's degree or higher, with 90.1% or 2,364 individuals in the labor force. Within the labor force, individuals with high school diploma education have the highest percentage of unemployment, with 19.7% or 44 of them being unemployed.
| Educational Attainment | In Labor Force | Unemployed |
| Less than High School | 55 (88.7%) | 0 (0.0%) |
| High School Diploma | 223 (85.1%) | 52 (19.7%) |
| College / Associate Degree | 524 (82.4%) | 0 (0.0%) |
| Bachelor's Degree or higher | 2,364 (90.1%) | 3 (0.1%) |
| Total | 3,168 (88.4%) | 54 (1.5%) |
Employment Occupations by Sex in Northborough
Management, Business, Science and Arts Occupations
The most common Management, Business, Science and Arts occupations in Northborough are Management (709 | 18.8%), Community & Social Service (694 | 18.4%), Computers, Engineering & Science (395 | 10.5%), Education Instruction & Library (352 | 9.3%), and Health Diagnosing & Treating (321 | 8.5%).
Management, Business, Science and Arts Occupations by Sex
Within the Management, Business, Science and Arts occupations in Northborough, the most male-oriented occupations are Computers & Mathematics (92.4%), Computers, Engineering & Science (86.8%), and Architecture & Engineering (79.2%), while the most female-oriented occupations are Education, Arts & Media (100.0%), Legal Services & Support (100.0%), and Community & Social Service (80.8%).
| Occupation | Male | Female |
| Management | 477 (67.3%) | 232 (32.7%) |
| Business & Financial | 87 (33.1%) | 176 (66.9%) |
| Computers, Engineering & Science | 343 (86.8%) | 52 (13.2%) |
| Computers & Mathematics | 243 (92.4%) | 20 (7.6%) |
| Architecture & Engineering | 76 (79.2%) | 20 (20.8%) |
| Life, Physical & Social Science | 24 (66.7%) | 12 (33.3%) |
| Community & Social Service | 133 (19.2%) | 561 (80.8%) |
| Education, Arts & Media | 0 (0.0%) | 152 (100.0%) |
| Legal Services & Support | 0 (0.0%) | 28 (100.0%) |
| Education Instruction & Library | 93 (26.4%) | 259 (73.6%) |
| Arts, Media & Entertainment | 40 (24.7%) | 122 (75.3%) |
| Health Diagnosing & Treating | 203 (63.2%) | 118 (36.8%) |
| Health Technologists | 179 (65.6%) | 94 (34.4%) |
| Total (Category) | 1,243 (52.2%) | 1,139 (47.8%) |
| Total (Overall) | 1,822 (48.3%) | 1,947 (51.7%) |
Services Occupations
The most common Services occupations in Northborough are Personal Care & Service (185 | 4.9%), Healthcare Support (66 | 1.8%), Food Preparation & Serving (61 | 1.6%), Security & Protection (33 | 0.9%), and Cleaning & Maintenance (33 | 0.9%).
Services Occupations by Sex
Within the Services occupations in Northborough, the most male-oriented occupations are Security & Protection (100.0%), Firefighting & Prevention (100.0%), and Law Enforcement (100.0%), while the most female-oriented occupations are Healthcare Support (100.0%), Personal Care & Service (100.0%), and Cleaning & Maintenance (63.6%).
| Occupation | Male | Female |
| Healthcare Support | 0 (0.0%) | 66 (100.0%) |
| Security & Protection | 33 (100.0%) | 0 (0.0%) |
| Firefighting & Prevention | 17 (100.0%) | 0 (0.0%) |
| Law Enforcement | 16 (100.0%) | 0 (0.0%) |
| Food Preparation & Serving | 49 (80.3%) | 12 (19.7%) |
| Cleaning & Maintenance | 12 (36.4%) | 21 (63.6%) |
| Personal Care & Service | 0 (0.0%) | 185 (100.0%) |
| Total (Category) | 94 (24.9%) | 284 (75.1%) |
| Total (Overall) | 1,822 (48.3%) | 1,947 (51.7%) |
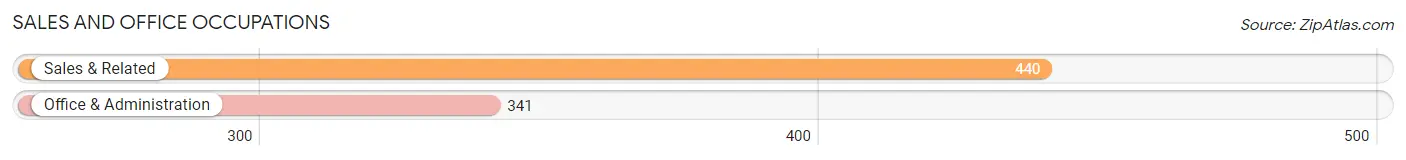
Sales and Office Occupations
The most common Sales and Office occupations in Northborough are Sales & Related (440 | 11.7%), and Office & Administration (341 | 9.0%).
Sales and Office Occupations by Sex
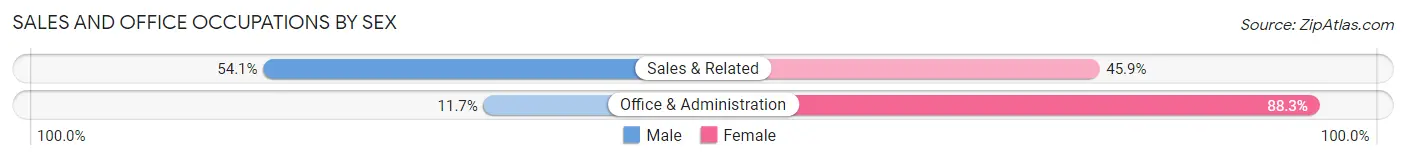
| Occupation | Male | Female |
| Sales & Related | 238 (54.1%) | 202 (45.9%) |
| Office & Administration | 40 (11.7%) | 301 (88.3%) |
| Total (Category) | 278 (35.6%) | 503 (64.4%) |
| Total (Overall) | 1,822 (48.3%) | 1,947 (51.7%) |
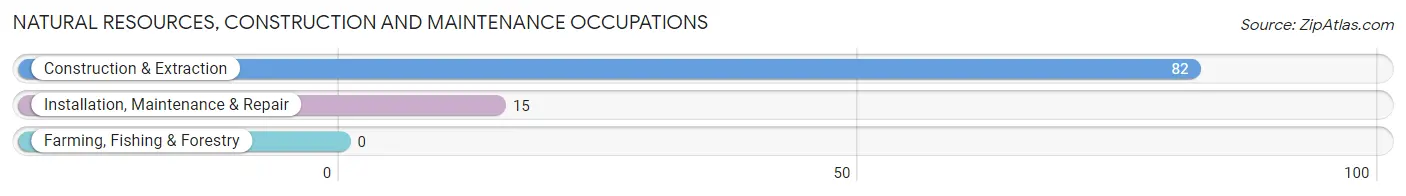
Natural Resources, Construction and Maintenance Occupations
The most common Natural Resources, Construction and Maintenance occupations in Northborough are Construction & Extraction (82 | 2.2%), and Installation, Maintenance & Repair (15 | 0.4%).
Natural Resources, Construction and Maintenance Occupations by Sex
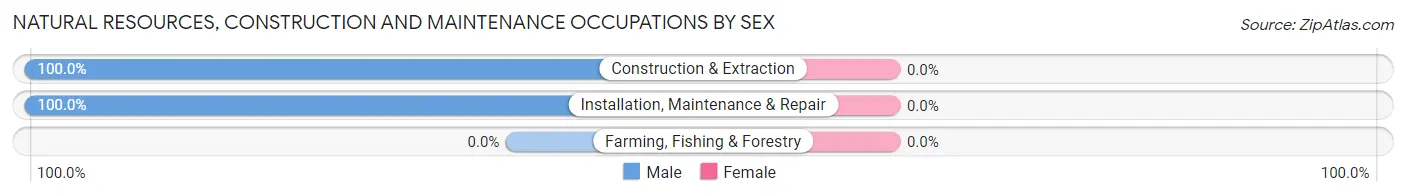
| Occupation | Male | Female |
| Farming, Fishing & Forestry | 0 (0.0%) | 0 (0.0%) |
| Construction & Extraction | 82 (100.0%) | 0 (0.0%) |
| Installation, Maintenance & Repair | 15 (100.0%) | 0 (0.0%) |
| Total (Category) | 97 (100.0%) | 0 (0.0%) |
| Total (Overall) | 1,822 (48.3%) | 1,947 (51.7%) |
Production, Transportation and Moving Occupations
The most common Production, Transportation and Moving occupations in Northborough are Production (63 | 1.7%), Material Moving (42 | 1.1%), and Transportation (26 | 0.7%).
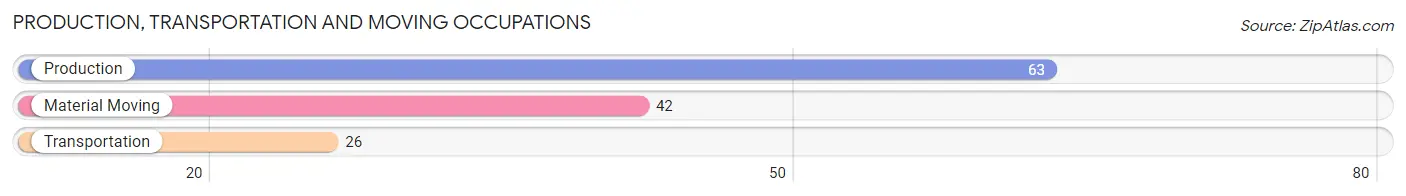
Production, Transportation and Moving Occupations by Sex
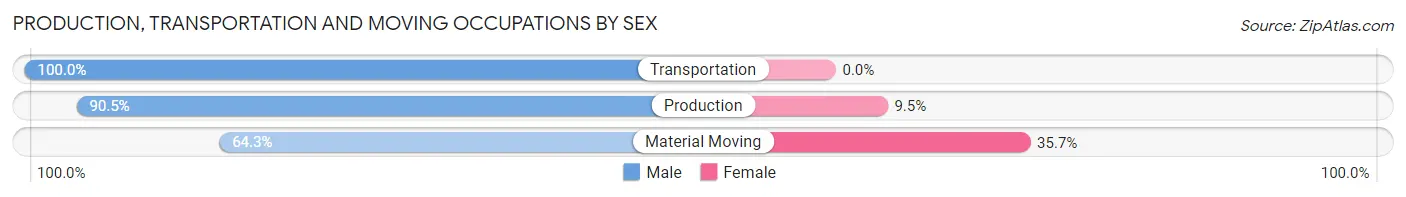
| Occupation | Male | Female |
| Production | 57 (90.5%) | 6 (9.5%) |
| Transportation | 26 (100.0%) | 0 (0.0%) |
| Material Moving | 27 (64.3%) | 15 (35.7%) |
| Total (Category) | 110 (84.0%) | 21 (16.0%) |
| Total (Overall) | 1,822 (48.3%) | 1,947 (51.7%) |
Employment Industries by Sex in Northborough
Employment Industries in Northborough
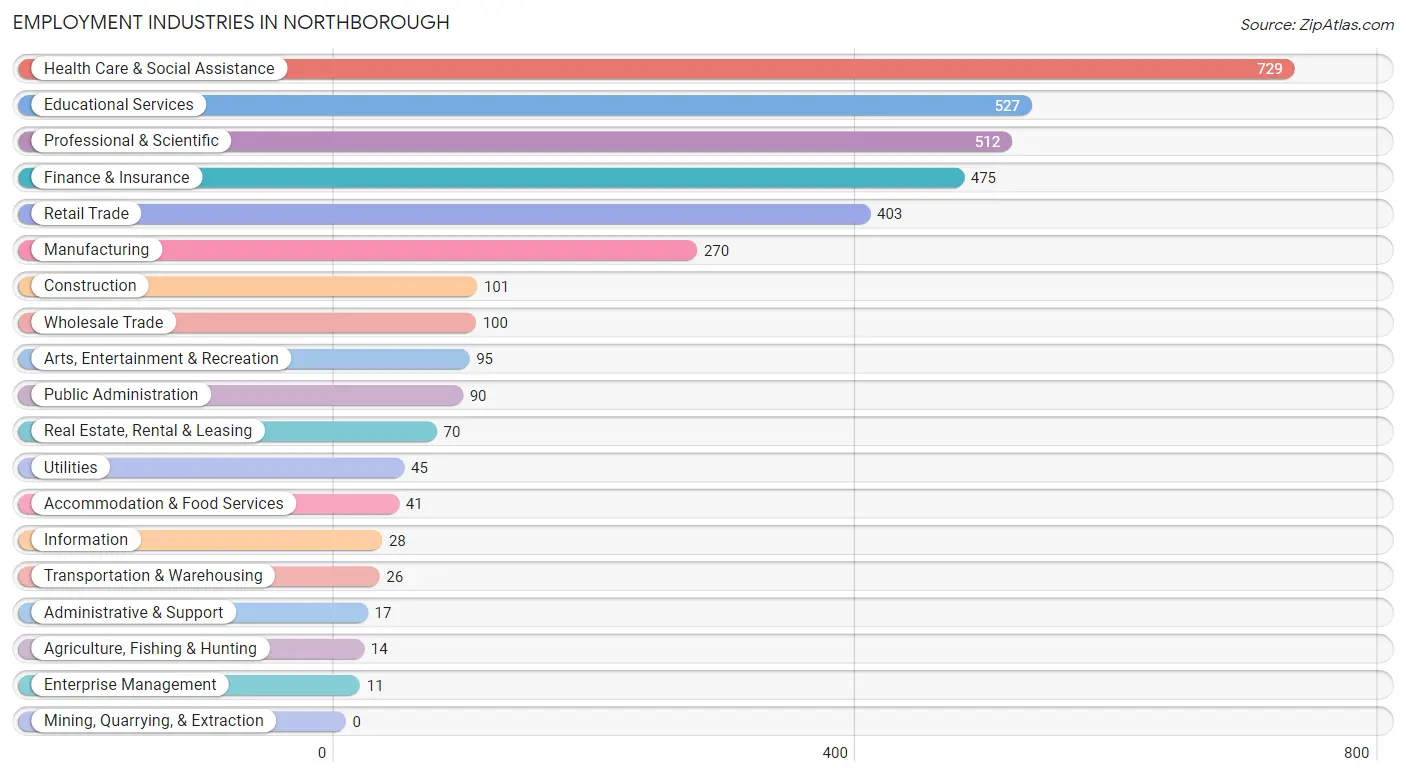
The major employment industries in Northborough include Health Care & Social Assistance (729 | 19.3%), Educational Services (527 | 14.0%), Professional & Scientific (512 | 13.6%), Finance & Insurance (475 | 12.6%), and Retail Trade (403 | 10.7%).
Employment Industries by Sex in Northborough
The Northborough industries that see more men than women are Agriculture, Fishing & Hunting (100.0%), Construction (100.0%), and Transportation & Warehousing (100.0%), whereas the industries that tend to have a higher number of women are Arts, Entertainment & Recreation (81.0%), Educational Services (74.0%), and Wholesale Trade (71.0%).
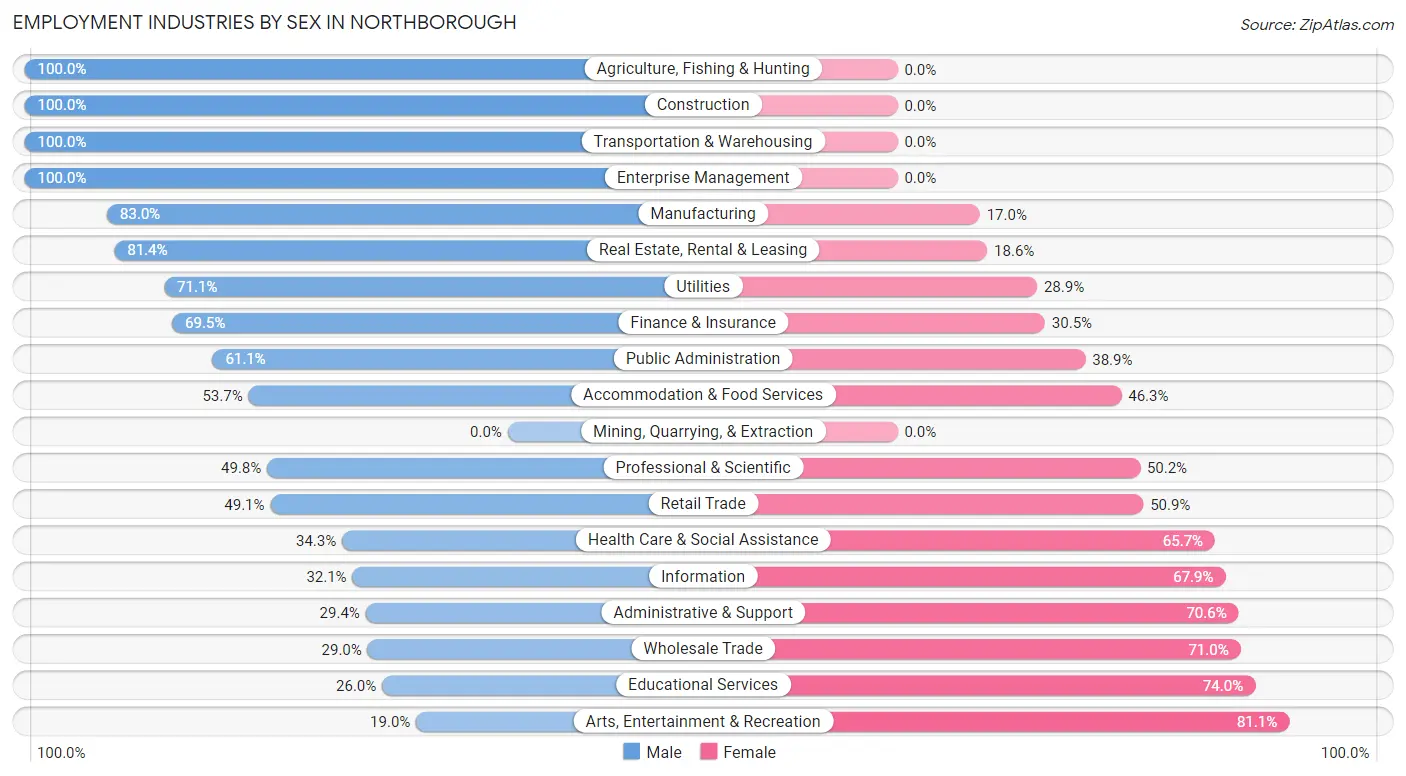
| Industry | Male | Female |
| Agriculture, Fishing & Hunting | 14 (100.0%) | 0 (0.0%) |
| Mining, Quarrying, & Extraction | 0 (0.0%) | 0 (0.0%) |
| Construction | 101 (100.0%) | 0 (0.0%) |
| Manufacturing | 224 (83.0%) | 46 (17.0%) |
| Wholesale Trade | 29 (29.0%) | 71 (71.0%) |
| Retail Trade | 198 (49.1%) | 205 (50.9%) |
| Transportation & Warehousing | 26 (100.0%) | 0 (0.0%) |
| Utilities | 32 (71.1%) | 13 (28.9%) |
| Information | 9 (32.1%) | 19 (67.9%) |
| Finance & Insurance | 330 (69.5%) | 145 (30.5%) |
| Real Estate, Rental & Leasing | 57 (81.4%) | 13 (18.6%) |
| Professional & Scientific | 255 (49.8%) | 257 (50.2%) |
| Enterprise Management | 11 (100.0%) | 0 (0.0%) |
| Administrative & Support | 5 (29.4%) | 12 (70.6%) |
| Educational Services | 137 (26.0%) | 390 (74.0%) |
| Health Care & Social Assistance | 250 (34.3%) | 479 (65.7%) |
| Arts, Entertainment & Recreation | 18 (19.0%) | 77 (81.0%) |
| Accommodation & Food Services | 22 (53.7%) | 19 (46.3%) |
| Public Administration | 55 (61.1%) | 35 (38.9%) |
| Total | 1,822 (48.3%) | 1,947 (51.7%) |
Education in Northborough
School Enrollment in Northborough
The most common levels of schooling among the 1,679 students in Northborough are middle school (467 | 27.8%), high school (426 | 25.4%), and college / undergraduate (285 | 17.0%).
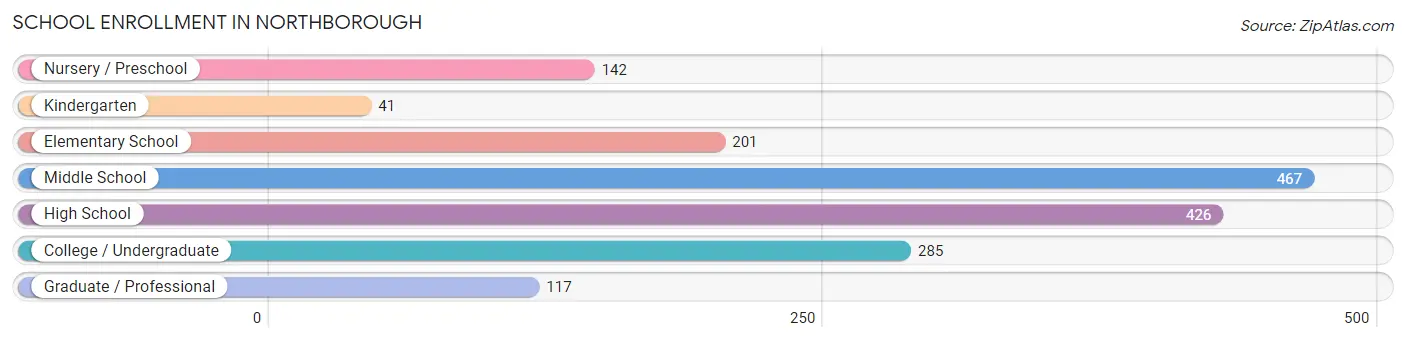
| School Level | # Students | % Students |
| Nursery / Preschool | 142 | 8.5% |
| Kindergarten | 41 | 2.4% |
| Elementary School | 201 | 12.0% |
| Middle School | 467 | 27.8% |
| High School | 426 | 25.4% |
| College / Undergraduate | 285 | 17.0% |
| Graduate / Professional | 117 | 7.0% |
| Total | 1,679 | 100.0% |
School Enrollment by Age by Funding Source in Northborough
Out of a total of 1,679 students who are enrolled in schools in Northborough, 384 (22.9%) attend a private institution, while the remaining 1,295 (77.1%) are enrolled in public schools. The age group of 35 years and over has the highest likelihood of being enrolled in private schools, with 92 (80.0% in the age bracket) enrolled. Conversely, the age group of 15 to 17 year olds has the lowest likelihood of being enrolled in a private school, with 369 (100.0% in the age bracket) attending a public institution.
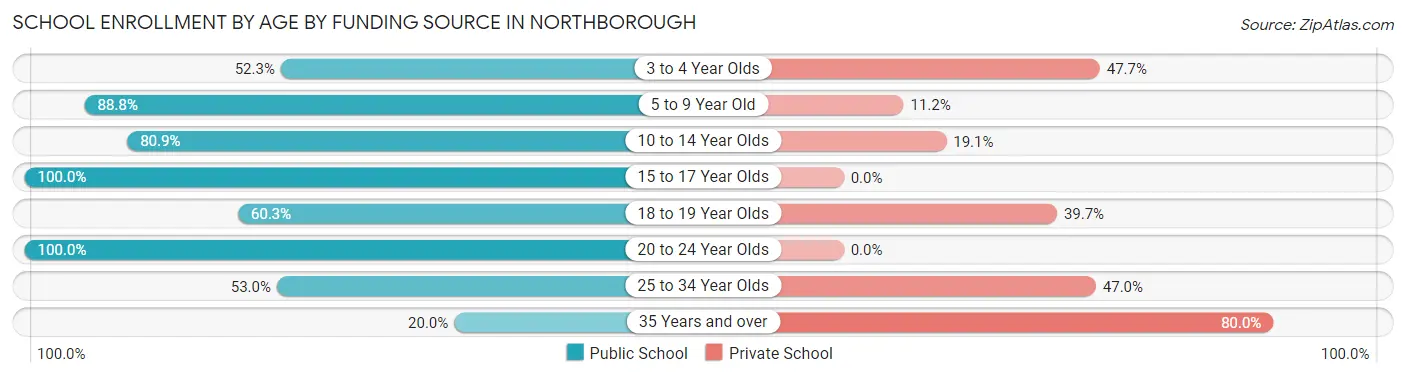
| Age Bracket | Public School | Private School |
| 3 to 4 Year Olds | 57 (52.3%) | 52 (47.7%) |
| 5 to 9 Year Old | 207 (88.8%) | 26 (11.2%) |
| 10 to 14 Year Olds | 406 (80.9%) | 96 (19.1%) |
| 15 to 17 Year Olds | 369 (100.0%) | 0 (0.0%) |
| 18 to 19 Year Olds | 132 (60.3%) | 87 (39.7%) |
| 20 to 24 Year Olds | 66 (100.0%) | 0 (0.0%) |
| 25 to 34 Year Olds | 35 (53.0%) | 31 (47.0%) |
| 35 Years and over | 23 (20.0%) | 92 (80.0%) |
| Total | 1,295 (77.1%) | 384 (22.9%) |
Educational Attainment by Field of Study in Northborough
Business (839 | 24.6%), bio, nature & agricultural (369 | 10.8%), education (342 | 10.0%), science & technology (294 | 8.6%), and arts & humanities (284 | 8.3%) are the most common fields of study among 3,415 individuals in Northborough who have obtained a bachelor's degree or higher.
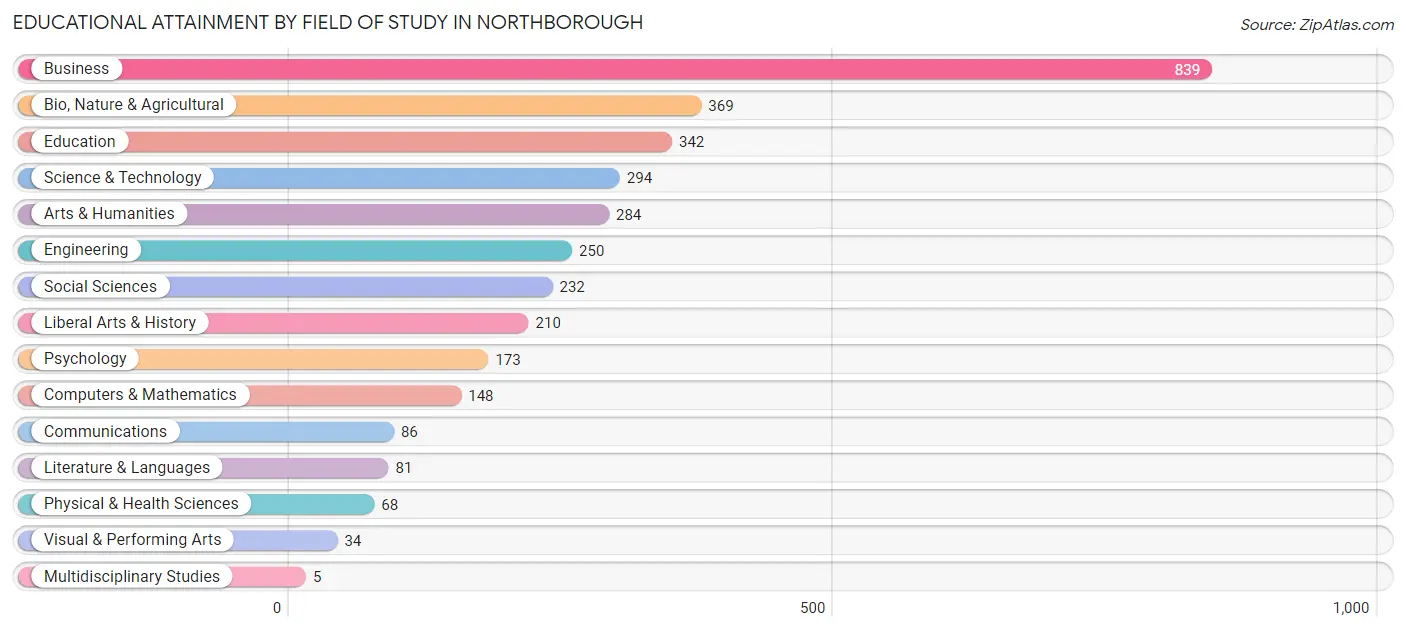
| Field of Study | # Graduates | % Graduates |
| Computers & Mathematics | 148 | 4.3% |
| Bio, Nature & Agricultural | 369 | 10.8% |
| Physical & Health Sciences | 68 | 2.0% |
| Psychology | 173 | 5.1% |
| Social Sciences | 232 | 6.8% |
| Engineering | 250 | 7.3% |
| Multidisciplinary Studies | 5 | 0.2% |
| Science & Technology | 294 | 8.6% |
| Business | 839 | 24.6% |
| Education | 342 | 10.0% |
| Literature & Languages | 81 | 2.4% |
| Liberal Arts & History | 210 | 6.1% |
| Visual & Performing Arts | 34 | 1.0% |
| Communications | 86 | 2.5% |
| Arts & Humanities | 284 | 8.3% |
| Total | 3,415 | 100.0% |
Transportation & Commute in Northborough
Vehicle Availability by Sex in Northborough
The most prevalent vehicle ownership categories in Northborough are males with 2 vehicles (764, accounting for 42.5%) and females with 2 vehicles (693, making up 39.3%).
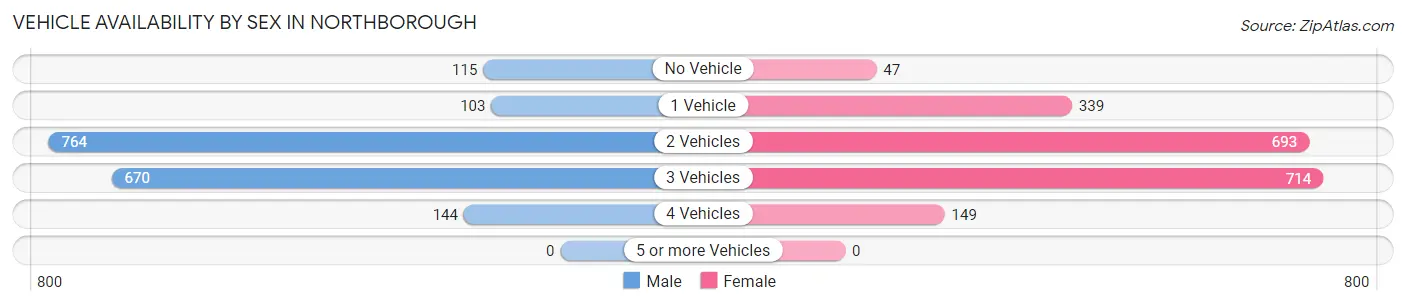
| Vehicles Available | Male | Female |
| No Vehicle | 115 (6.4%) | 47 (2.4%) |
| 1 Vehicle | 103 (5.7%) | 339 (17.5%) |
| 2 Vehicles | 764 (42.5%) | 693 (35.7%) |
| 3 Vehicles | 670 (37.3%) | 714 (36.8%) |
| 4 Vehicles | 144 (8.0%) | 149 (7.7%) |
| 5 or more Vehicles | 0 (0.0%) | 0 (0.0%) |
| Total | 1,796 (100.0%) | 1,942 (100.0%) |
Commute Time in Northborough
The most frequently occuring commute durations in Northborough are 20 to 24 minutes (523 commuters, 17.9%), 15 to 19 minutes (431 commuters, 14.7%), and 5 to 9 minutes (299 commuters, 10.2%).
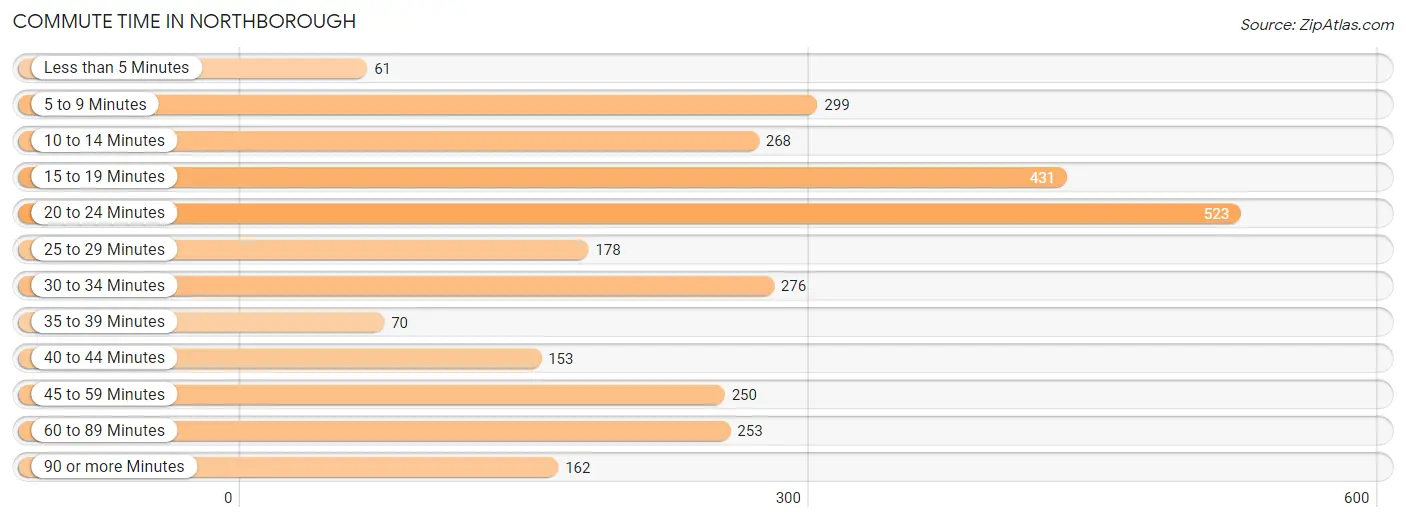
| Commute Time | # Commuters | % Commuters |
| Less than 5 Minutes | 61 | 2.1% |
| 5 to 9 Minutes | 299 | 10.2% |
| 10 to 14 Minutes | 268 | 9.2% |
| 15 to 19 Minutes | 431 | 14.7% |
| 20 to 24 Minutes | 523 | 17.9% |
| 25 to 29 Minutes | 178 | 6.1% |
| 30 to 34 Minutes | 276 | 9.4% |
| 35 to 39 Minutes | 70 | 2.4% |
| 40 to 44 Minutes | 153 | 5.2% |
| 45 to 59 Minutes | 250 | 8.6% |
| 60 to 89 Minutes | 253 | 8.6% |
| 90 or more Minutes | 162 | 5.5% |
Commute Time by Sex in Northborough
The most common commute times in Northborough are 20 to 24 minutes (343 commuters, 23.6%) for males and 30 to 34 minutes (219 commuters, 14.9%) for females.
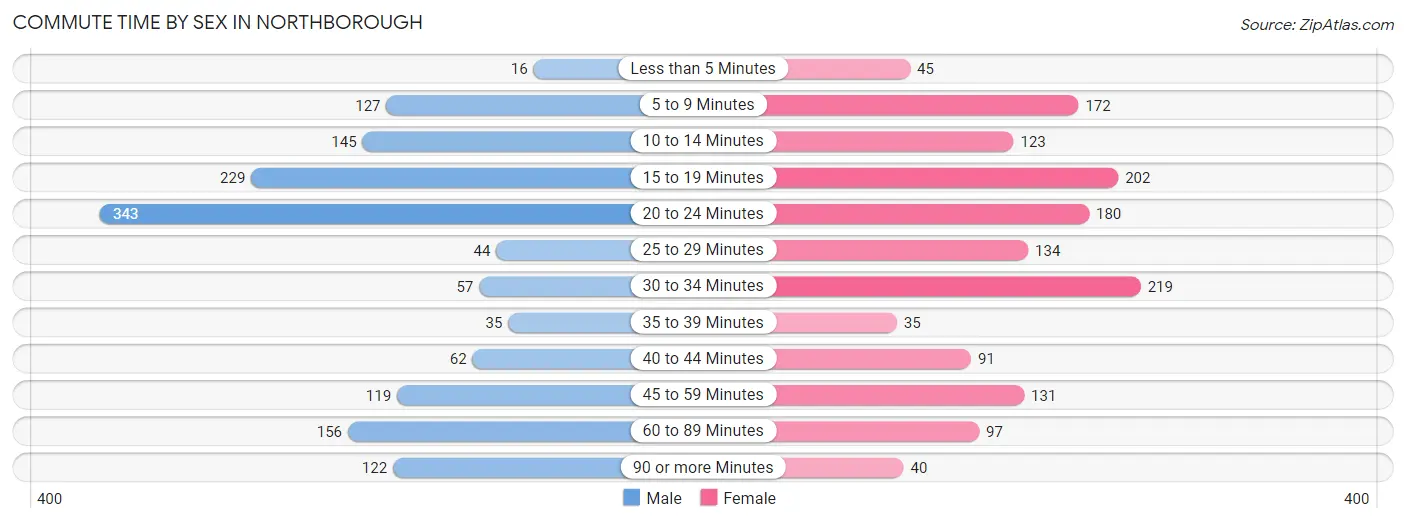
| Commute Time | Male | Female |
| Less than 5 Minutes | 16 (1.1%) | 45 (3.1%) |
| 5 to 9 Minutes | 127 (8.7%) | 172 (11.7%) |
| 10 to 14 Minutes | 145 (10.0%) | 123 (8.4%) |
| 15 to 19 Minutes | 229 (15.7%) | 202 (13.8%) |
| 20 to 24 Minutes | 343 (23.6%) | 180 (12.2%) |
| 25 to 29 Minutes | 44 (3.0%) | 134 (9.1%) |
| 30 to 34 Minutes | 57 (3.9%) | 219 (14.9%) |
| 35 to 39 Minutes | 35 (2.4%) | 35 (2.4%) |
| 40 to 44 Minutes | 62 (4.3%) | 91 (6.2%) |
| 45 to 59 Minutes | 119 (8.2%) | 131 (8.9%) |
| 60 to 89 Minutes | 156 (10.7%) | 97 (6.6%) |
| 90 or more Minutes | 122 (8.4%) | 40 (2.7%) |
Time of Departure to Work by Sex in Northborough
The most frequent times of departure to work in Northborough are 6:00 AM to 6:29 AM (292, 20.1%) for males and 7:30 AM to 7:59 AM (330, 22.5%) for females.
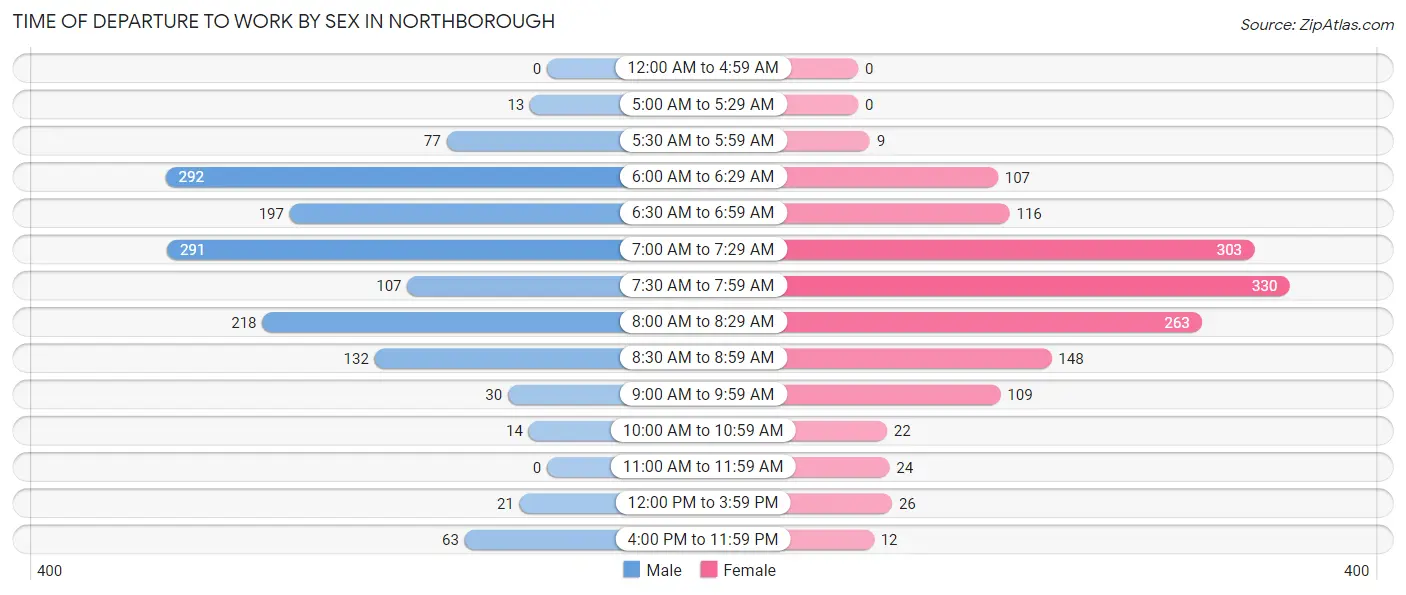
| Time of Departure | Male | Female |
| 12:00 AM to 4:59 AM | 0 (0.0%) | 0 (0.0%) |
| 5:00 AM to 5:29 AM | 13 (0.9%) | 0 (0.0%) |
| 5:30 AM to 5:59 AM | 77 (5.3%) | 9 (0.6%) |
| 6:00 AM to 6:29 AM | 292 (20.1%) | 107 (7.3%) |
| 6:30 AM to 6:59 AM | 197 (13.5%) | 116 (7.9%) |
| 7:00 AM to 7:29 AM | 291 (20.0%) | 303 (20.6%) |
| 7:30 AM to 7:59 AM | 107 (7.3%) | 330 (22.5%) |
| 8:00 AM to 8:29 AM | 218 (15.0%) | 263 (17.9%) |
| 8:30 AM to 8:59 AM | 132 (9.1%) | 148 (10.1%) |
| 9:00 AM to 9:59 AM | 30 (2.1%) | 109 (7.4%) |
| 10:00 AM to 10:59 AM | 14 (1.0%) | 22 (1.5%) |
| 11:00 AM to 11:59 AM | 0 (0.0%) | 24 (1.6%) |
| 12:00 PM to 3:59 PM | 21 (1.4%) | 26 (1.8%) |
| 4:00 PM to 11:59 PM | 63 (4.3%) | 12 (0.8%) |
| Total | 1,455 (100.0%) | 1,469 (100.0%) |
Housing Occupancy in Northborough
Occupancy by Ownership in Northborough
Of the total 2,582 dwellings in Northborough, owner-occupied units account for 2,190 (84.8%), while renter-occupied units make up 392 (15.2%).
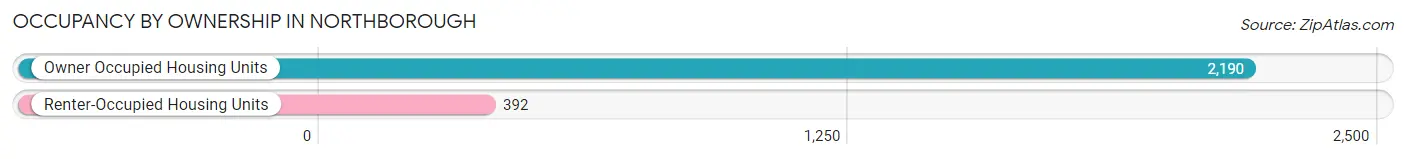
| Occupancy | # Housing Units | % Housing Units |
| Owner Occupied Housing Units | 2,190 | 84.8% |
| Renter-Occupied Housing Units | 392 | 15.2% |
| Total Occupied Housing Units | 2,582 | 100.0% |
Occupancy by Household Size in Northborough
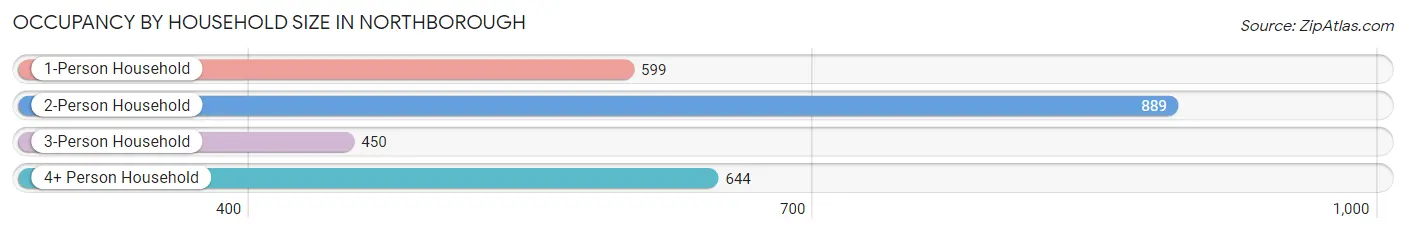
| Household Size | # Housing Units | % Housing Units |
| 1-Person Household | 599 | 23.2% |
| 2-Person Household | 889 | 34.4% |
| 3-Person Household | 450 | 17.4% |
| 4+ Person Household | 644 | 24.9% |
| Total Housing Units | 2,582 | 100.0% |
Occupancy by Ownership by Household Size in Northborough
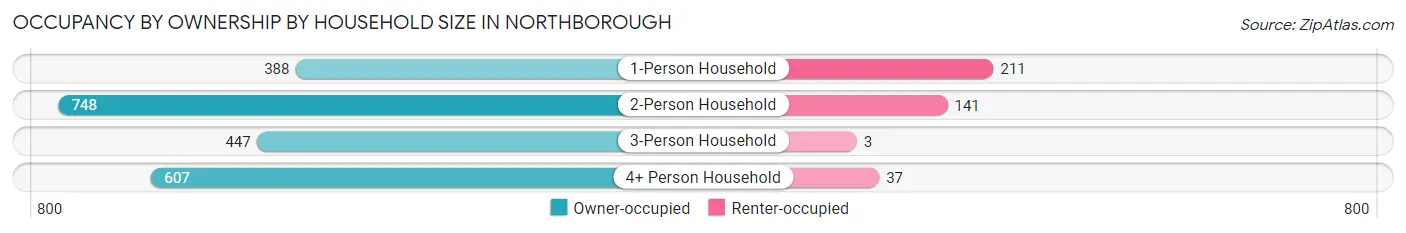
| Household Size | Owner-occupied | Renter-occupied |
| 1-Person Household | 388 (64.8%) | 211 (35.2%) |
| 2-Person Household | 748 (84.1%) | 141 (15.9%) |
| 3-Person Household | 447 (99.3%) | 3 (0.7%) |
| 4+ Person Household | 607 (94.3%) | 37 (5.8%) |
| Total Housing Units | 2,190 (84.8%) | 392 (15.2%) |
Occupancy by Educational Attainment in Northborough
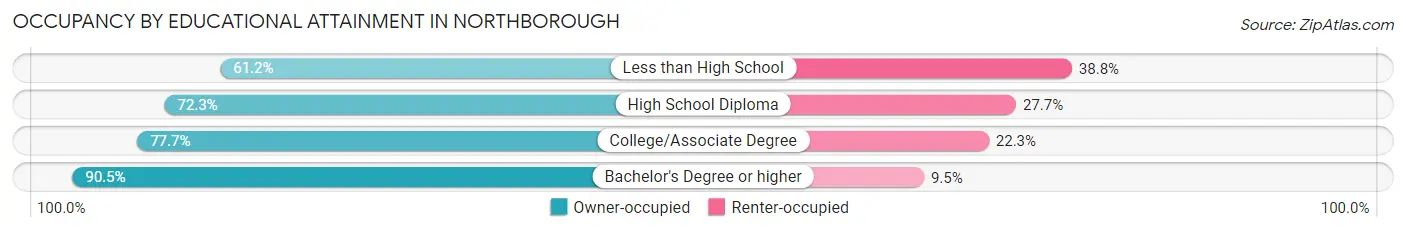
| Household Size | Owner-occupied | Renter-occupied |
| Less than High School | 41 (61.2%) | 26 (38.8%) |
| High School Diploma | 271 (72.3%) | 104 (27.7%) |
| College/Associate Degree | 358 (77.7%) | 103 (22.3%) |
| Bachelor's Degree or higher | 1,520 (90.5%) | 159 (9.5%) |
Occupancy by Age of Householder in Northborough
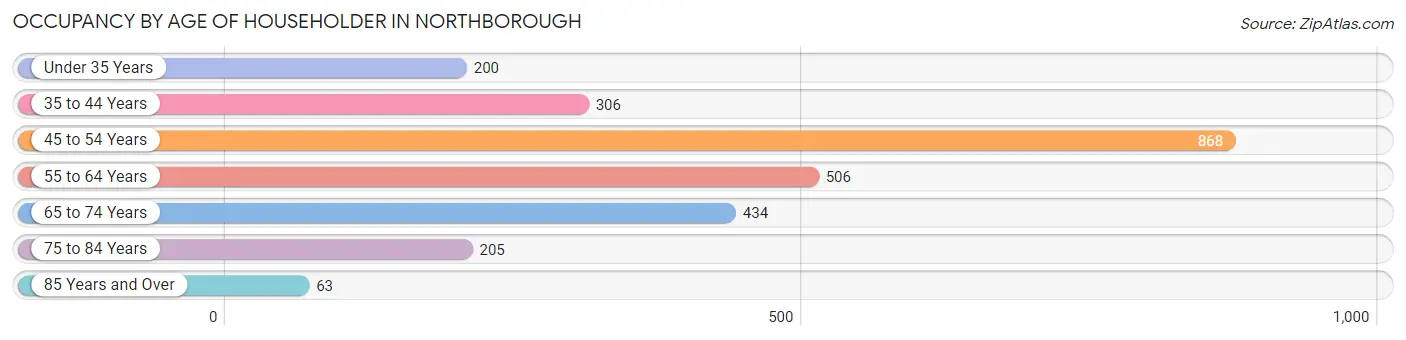
| Age Bracket | # Households | % Households |
| Under 35 Years | 200 | 7.7% |
| 35 to 44 Years | 306 | 11.8% |
| 45 to 54 Years | 868 | 33.6% |
| 55 to 64 Years | 506 | 19.6% |
| 65 to 74 Years | 434 | 16.8% |
| 75 to 84 Years | 205 | 7.9% |
| 85 Years and Over | 63 | 2.4% |
| Total | 2,582 | 100.0% |
Housing Finances in Northborough
Median Income by Occupancy in Northborough
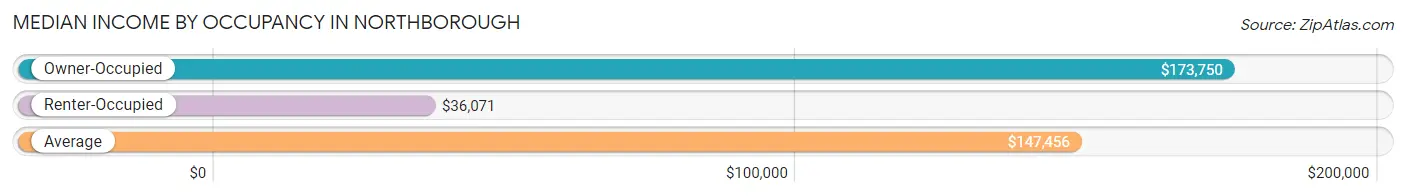
| Occupancy Type | # Households | Median Income |
| Owner-Occupied | 2,190 (84.8%) | $173,750 |
| Renter-Occupied | 392 (15.2%) | $36,071 |
| Average | 2,582 (100.0%) | $147,456 |
Occupancy by Householder Income Bracket in Northborough
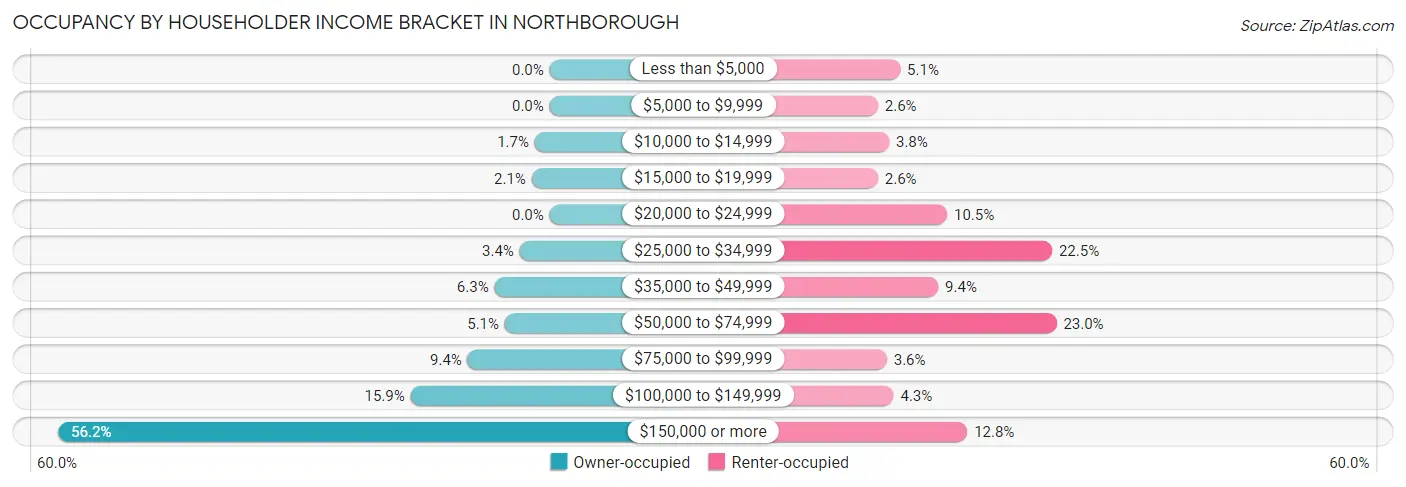
| Income Bracket | Owner-occupied | Renter-occupied |
| Less than $5,000 | 0 (0.0%) | 20 (5.1%) |
| $5,000 to $9,999 | 0 (0.0%) | 10 (2.5%) |
| $10,000 to $14,999 | 37 (1.7%) | 15 (3.8%) |
| $15,000 to $19,999 | 45 (2.1%) | 10 (2.5%) |
| $20,000 to $24,999 | 0 (0.0%) | 41 (10.5%) |
| $25,000 to $34,999 | 75 (3.4%) | 88 (22.5%) |
| $35,000 to $49,999 | 138 (6.3%) | 37 (9.4%) |
| $50,000 to $74,999 | 112 (5.1%) | 90 (23.0%) |
| $75,000 to $99,999 | 205 (9.4%) | 14 (3.6%) |
| $100,000 to $149,999 | 348 (15.9%) | 17 (4.3%) |
| $150,000 or more | 1,230 (56.2%) | 50 (12.8%) |
| Total | 2,190 (100.0%) | 392 (100.0%) |
Monthly Housing Cost Tiers in Northborough
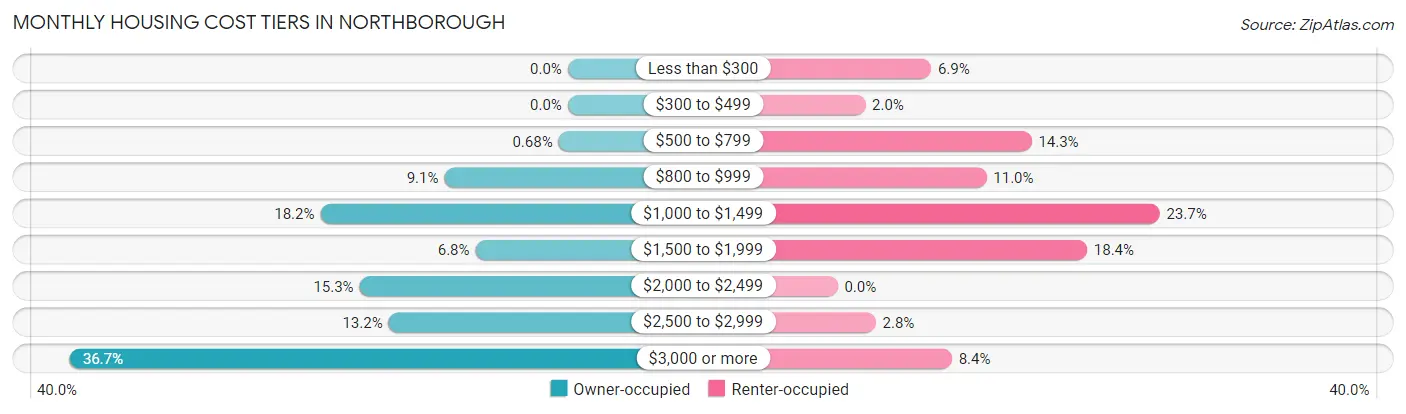
| Monthly Cost | Owner-occupied | Renter-occupied |
| Less than $300 | 0 (0.0%) | 27 (6.9%) |
| $300 to $499 | 0 (0.0%) | 8 (2.0%) |
| $500 to $799 | 15 (0.7%) | 56 (14.3%) |
| $800 to $999 | 199 (9.1%) | 43 (11.0%) |
| $1,000 to $1,499 | 399 (18.2%) | 93 (23.7%) |
| $1,500 to $1,999 | 149 (6.8%) | 72 (18.4%) |
| $2,000 to $2,499 | 336 (15.3%) | 0 (0.0%) |
| $2,500 to $2,999 | 289 (13.2%) | 11 (2.8%) |
| $3,000 or more | 803 (36.7%) | 33 (8.4%) |
| Total | 2,190 (100.0%) | 392 (100.0%) |
Physical Housing Characteristics in Northborough
Housing Structures in Northborough
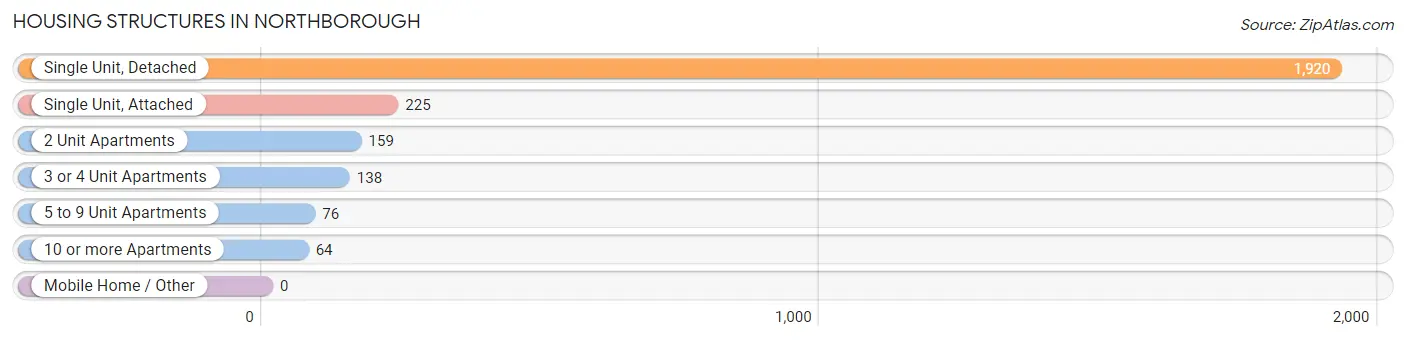
| Structure Type | # Housing Units | % Housing Units |
| Single Unit, Detached | 1,920 | 74.4% |
| Single Unit, Attached | 225 | 8.7% |
| 2 Unit Apartments | 159 | 6.2% |
| 3 or 4 Unit Apartments | 138 | 5.3% |
| 5 to 9 Unit Apartments | 76 | 2.9% |
| 10 or more Apartments | 64 | 2.5% |
| Mobile Home / Other | 0 | 0.0% |
| Total | 2,582 | 100.0% |
Housing Structures by Occupancy in Northborough
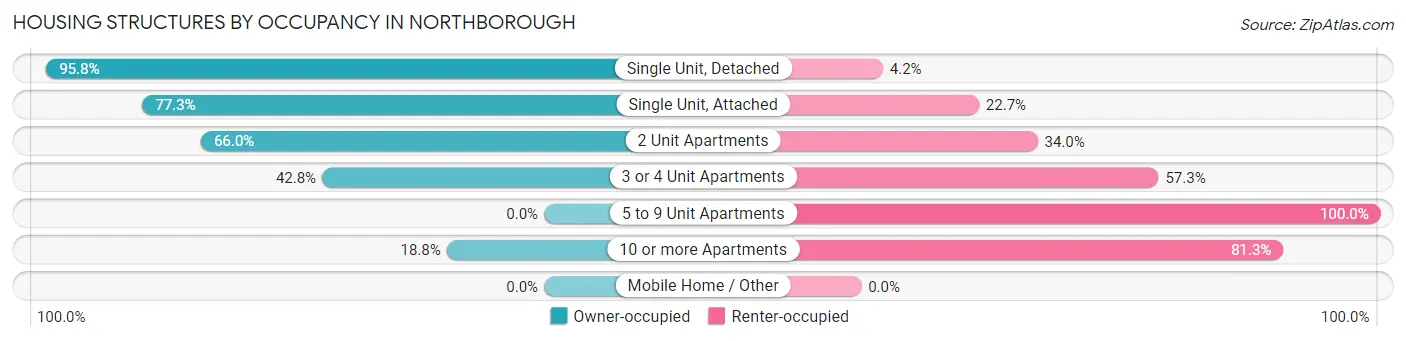
| Structure Type | Owner-occupied | Renter-occupied |
| Single Unit, Detached | 1,840 (95.8%) | 80 (4.2%) |
| Single Unit, Attached | 174 (77.3%) | 51 (22.7%) |
| 2 Unit Apartments | 105 (66.0%) | 54 (34.0%) |
| 3 or 4 Unit Apartments | 59 (42.7%) | 79 (57.3%) |
| 5 to 9 Unit Apartments | 0 (0.0%) | 76 (100.0%) |
| 10 or more Apartments | 12 (18.8%) | 52 (81.2%) |
| Mobile Home / Other | 0 (0.0%) | 0 (0.0%) |
| Total | 2,190 (84.8%) | 392 (15.2%) |
Housing Structures by Number of Rooms in Northborough
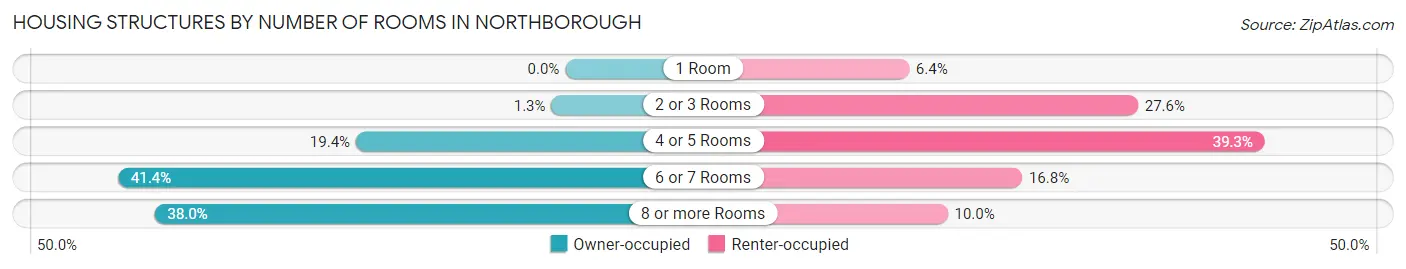
| Number of Rooms | Owner-occupied | Renter-occupied |
| 1 Room | 0 (0.0%) | 25 (6.4%) |
| 2 or 3 Rooms | 28 (1.3%) | 108 (27.6%) |
| 4 or 5 Rooms | 424 (19.4%) | 154 (39.3%) |
| 6 or 7 Rooms | 906 (41.4%) | 66 (16.8%) |
| 8 or more Rooms | 832 (38.0%) | 39 (10.0%) |
| Total | 2,190 (100.0%) | 392 (100.0%) |
Housing Structure by Heating Type in Northborough
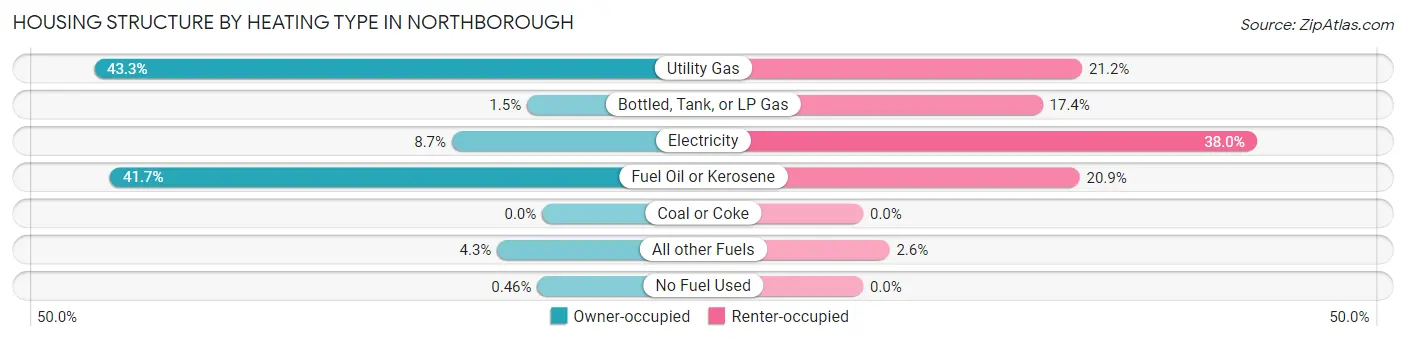
| Heating Type | Owner-occupied | Renter-occupied |
| Utility Gas | 948 (43.3%) | 83 (21.2%) |
| Bottled, Tank, or LP Gas | 32 (1.5%) | 68 (17.3%) |
| Electricity | 191 (8.7%) | 149 (38.0%) |
| Fuel Oil or Kerosene | 914 (41.7%) | 82 (20.9%) |
| Coal or Coke | 0 (0.0%) | 0 (0.0%) |
| All other Fuels | 95 (4.3%) | 10 (2.5%) |
| No Fuel Used | 10 (0.5%) | 0 (0.0%) |
| Total | 2,190 (100.0%) | 392 (100.0%) |
Household Vehicle Usage in Northborough
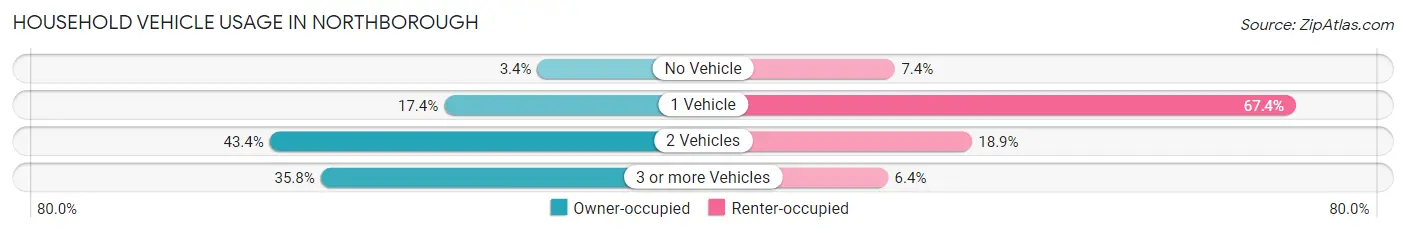
| Vehicles per Household | Owner-occupied | Renter-occupied |
| No Vehicle | 75 (3.4%) | 29 (7.4%) |
| 1 Vehicle | 380 (17.3%) | 264 (67.3%) |
| 2 Vehicles | 951 (43.4%) | 74 (18.9%) |
| 3 or more Vehicles | 784 (35.8%) | 25 (6.4%) |
| Total | 2,190 (100.0%) | 392 (100.0%) |
Real Estate & Mortgages in Northborough
Real Estate and Mortgage Overview in Northborough
| Characteristic | Without Mortgage | With Mortgage |
| Housing Units | 574 | 1,616 |
| Median Property Value | $529,500 | $490,900 |
| Median Household Income | $111,522 | $992 |
| Monthly Housing Costs | $1,084 | $803 |
| Real Estate Taxes | $6,973 | $0 |
Property Value by Mortgage Status in Northborough
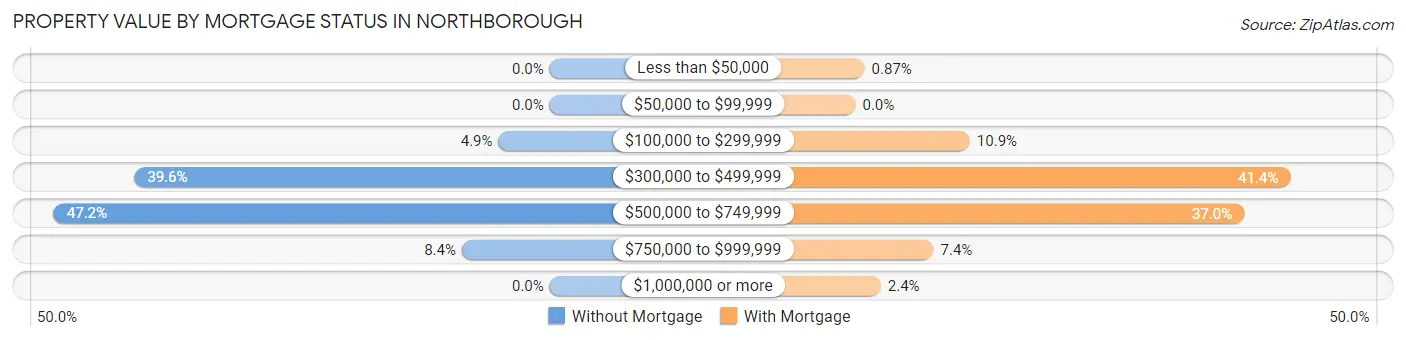
| Property Value | Without Mortgage | With Mortgage |
| Less than $50,000 | 0 (0.0%) | 14 (0.9%) |
| $50,000 to $99,999 | 0 (0.0%) | 0 (0.0%) |
| $100,000 to $299,999 | 28 (4.9%) | 176 (10.9%) |
| $300,000 to $499,999 | 227 (39.6%) | 669 (41.4%) |
| $500,000 to $749,999 | 271 (47.2%) | 598 (37.0%) |
| $750,000 to $999,999 | 48 (8.4%) | 120 (7.4%) |
| $1,000,000 or more | 0 (0.0%) | 39 (2.4%) |
| Total | 574 (100.0%) | 1,616 (100.0%) |
Household Income by Mortgage Status in Northborough
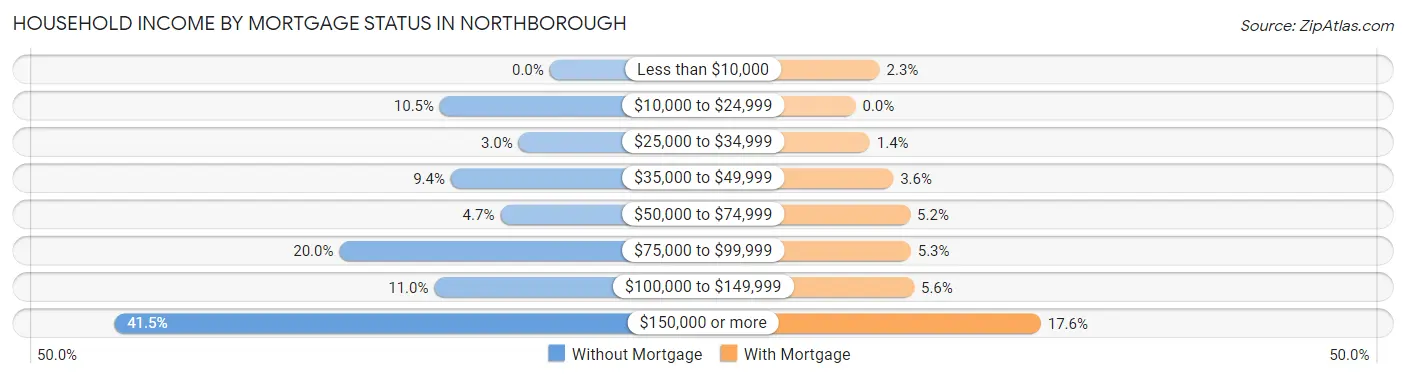
| Household Income | Without Mortgage | With Mortgage |
| Less than $10,000 | 0 (0.0%) | 37 (2.3%) |
| $10,000 to $24,999 | 60 (10.4%) | 0 (0.0%) |
| $25,000 to $34,999 | 17 (3.0%) | 22 (1.4%) |
| $35,000 to $49,999 | 54 (9.4%) | 58 (3.6%) |
| $50,000 to $74,999 | 27 (4.7%) | 84 (5.2%) |
| $75,000 to $99,999 | 115 (20.0%) | 85 (5.3%) |
| $100,000 to $149,999 | 63 (11.0%) | 90 (5.6%) |
| $150,000 or more | 238 (41.5%) | 285 (17.6%) |
| Total | 574 (100.0%) | 1,616 (100.0%) |
Property Value to Household Income Ratio in Northborough
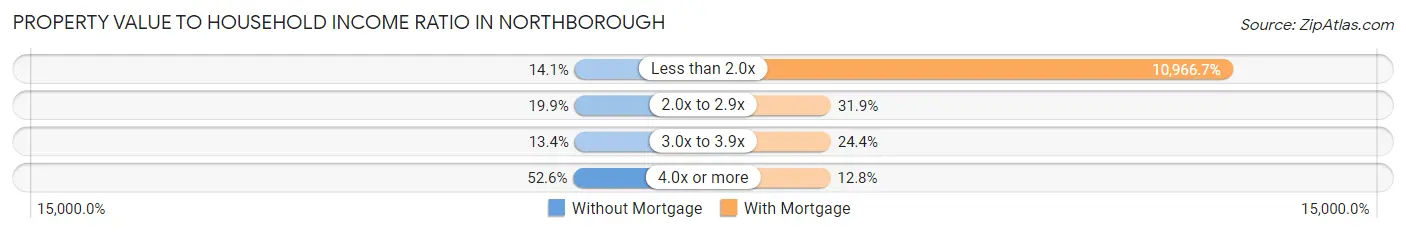
| Value-to-Income Ratio | Without Mortgage | With Mortgage |
| Less than 2.0x | 81 (14.1%) | 177,222 (10,966.7%) |
| 2.0x to 2.9x | 114 (19.9%) | 515 (31.9%) |
| 3.0x to 3.9x | 77 (13.4%) | 395 (24.4%) |
| 4.0x or more | 302 (52.6%) | 206 (12.8%) |
| Total | 574 (100.0%) | 1,616 (100.0%) |
Real Estate Taxes by Mortgage Status in Northborough
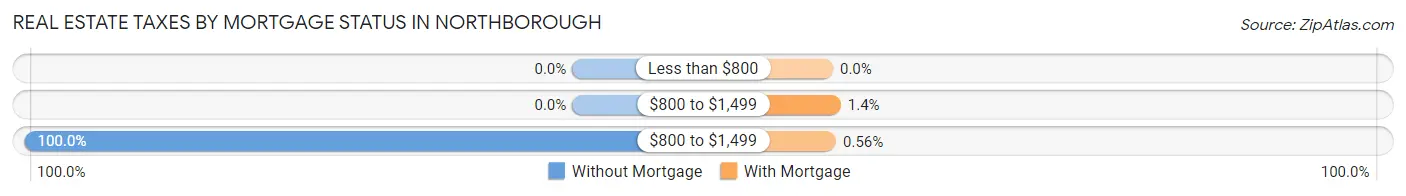
| Property Taxes | Without Mortgage | With Mortgage |
| Less than $800 | 0 (0.0%) | 0 (0.0%) |
| $800 to $1,499 | 0 (0.0%) | 23 (1.4%) |
| $800 to $1,499 | 574 (100.0%) | 9 (0.6%) |
| Total | 574 (100.0%) | 1,616 (100.0%) |
Health & Disability in Northborough
Health Insurance Coverage by Age in Northborough
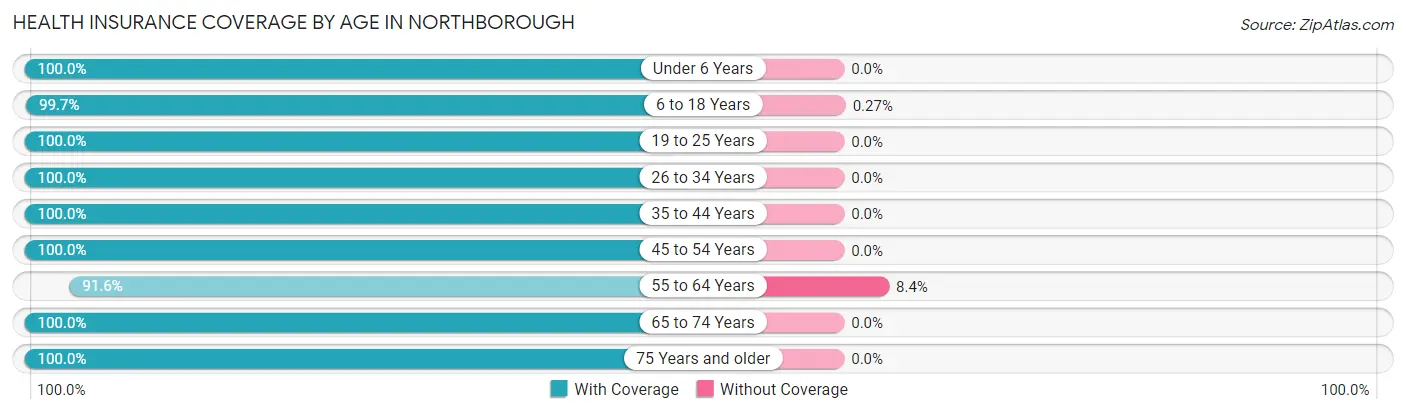
| Age Bracket | With Coverage | Without Coverage |
| Under 6 Years | 299 (100.0%) | 0 (0.0%) |
| 6 to 18 Years | 1,117 (99.7%) | 3 (0.3%) |
| 19 to 25 Years | 466 (100.0%) | 0 (0.0%) |
| 26 to 34 Years | 508 (100.0%) | 0 (0.0%) |
| 35 to 44 Years | 558 (100.0%) | 0 (0.0%) |
| 45 to 54 Years | 1,667 (100.0%) | 0 (0.0%) |
| 55 to 64 Years | 745 (91.6%) | 68 (8.4%) |
| 65 to 74 Years | 720 (100.0%) | 0 (0.0%) |
| 75 Years and older | 387 (100.0%) | 0 (0.0%) |
| Total | 6,467 (98.9%) | 71 (1.1%) |
Health Insurance Coverage by Citizenship Status in Northborough
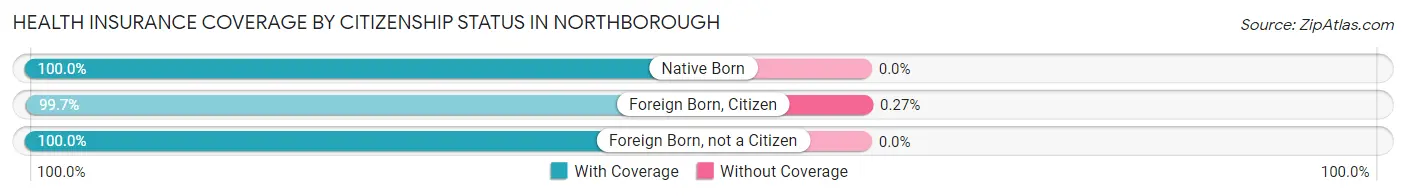
| Citizenship Status | With Coverage | Without Coverage |
| Native Born | 299 (100.0%) | 0 (0.0%) |
| Foreign Born, Citizen | 1,117 (99.7%) | 3 (0.3%) |
| Foreign Born, not a Citizen | 466 (100.0%) | 0 (0.0%) |
Health Insurance Coverage by Household Income in Northborough
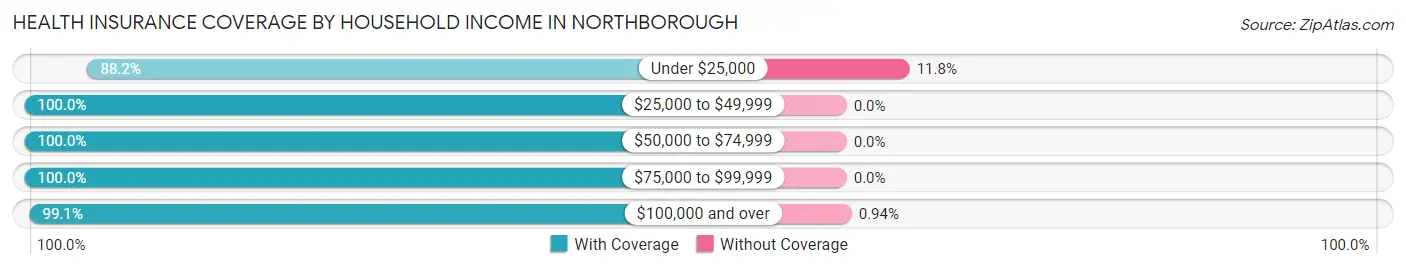
| Household Income | With Coverage | Without Coverage |
| Under $25,000 | 187 (88.2%) | 25 (11.8%) |
| $25,000 to $49,999 | 551 (100.0%) | 0 (0.0%) |
| $50,000 to $74,999 | 339 (100.0%) | 0 (0.0%) |
| $75,000 to $99,999 | 491 (100.0%) | 0 (0.0%) |
| $100,000 and over | 4,866 (99.1%) | 46 (0.9%) |
Public vs Private Health Insurance Coverage by Age in Northborough
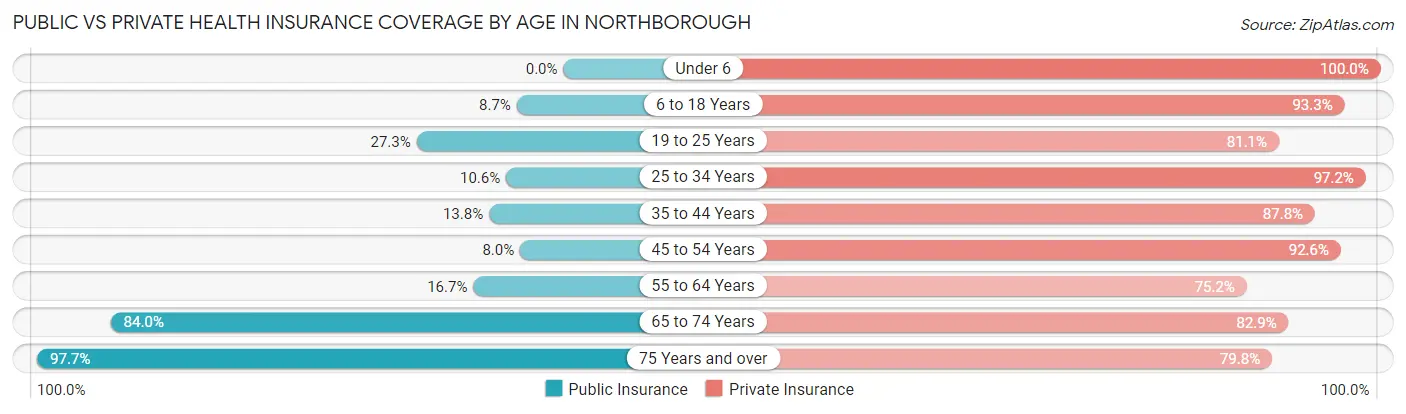
| Age Bracket | Public Insurance | Private Insurance |
| Under 6 | 0 (0.0%) | 299 (100.0%) |
| 6 to 18 Years | 97 (8.7%) | 1,045 (93.3%) |
| 19 to 25 Years | 127 (27.3%) | 378 (81.1%) |
| 25 to 34 Years | 54 (10.6%) | 494 (97.2%) |
| 35 to 44 Years | 77 (13.8%) | 490 (87.8%) |
| 45 to 54 Years | 134 (8.0%) | 1,544 (92.6%) |
| 55 to 64 Years | 136 (16.7%) | 611 (75.1%) |
| 65 to 74 Years | 605 (84.0%) | 597 (82.9%) |
| 75 Years and over | 378 (97.7%) | 309 (79.8%) |
| Total | 1,608 (24.6%) | 5,767 (88.2%) |
Disability Status by Sex by Age in Northborough
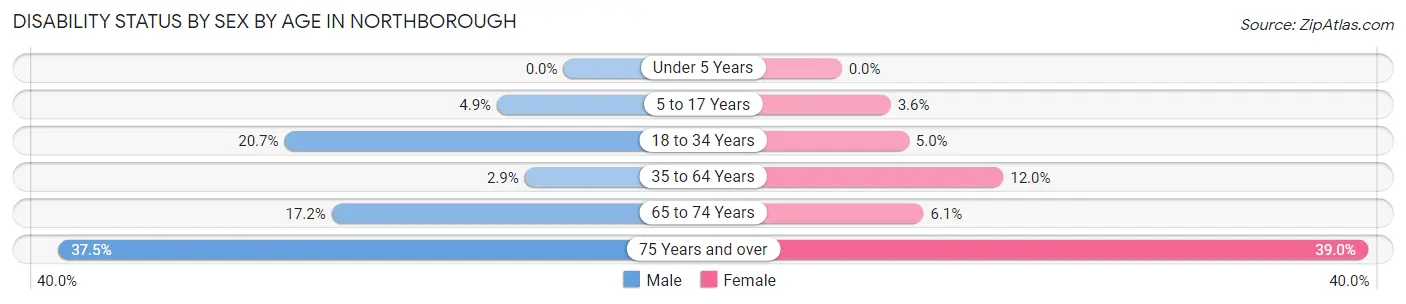
| Age Bracket | Male | Female |
| Under 5 Years | 0 (0.0%) | 0 (0.0%) |
| 5 to 17 Years | 30 (4.9%) | 18 (3.6%) |
| 18 to 34 Years | 126 (20.7%) | 22 (5.0%) |
| 35 to 64 Years | 39 (2.9%) | 202 (12.0%) |
| 65 to 74 Years | 53 (17.2%) | 25 (6.1%) |
| 75 Years and over | 51 (37.5%) | 98 (39.0%) |
Disability Class by Sex by Age in Northborough
Disability Class: Hearing Difficulty
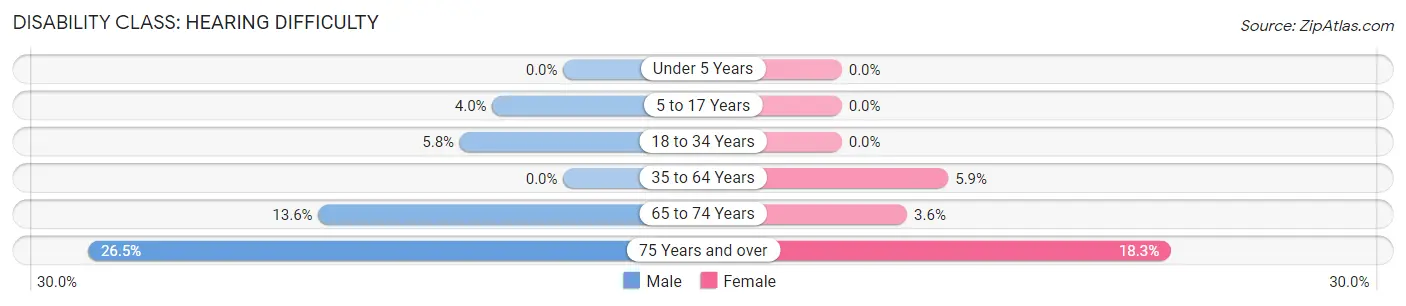
| Age Bracket | Male | Female |
| Under 5 Years | 0 (0.0%) | 0 (0.0%) |
| 5 to 17 Years | 24 (4.0%) | 0 (0.0%) |
| 18 to 34 Years | 35 (5.8%) | 0 (0.0%) |
| 35 to 64 Years | 0 (0.0%) | 100 (5.9%) |
| 65 to 74 Years | 42 (13.6%) | 15 (3.6%) |
| 75 Years and over | 36 (26.5%) | 46 (18.3%) |
Disability Class: Vision Difficulty
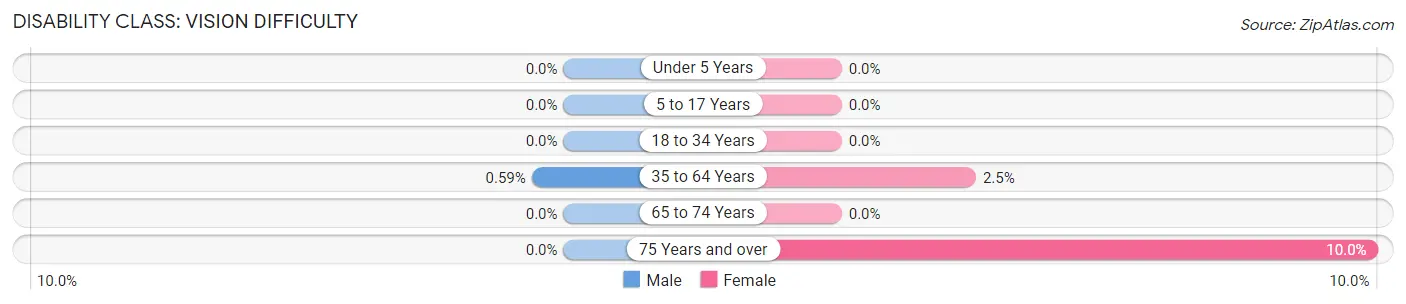
| Age Bracket | Male | Female |
| Under 5 Years | 0 (0.0%) | 0 (0.0%) |
| 5 to 17 Years | 0 (0.0%) | 0 (0.0%) |
| 18 to 34 Years | 0 (0.0%) | 0 (0.0%) |
| 35 to 64 Years | 8 (0.6%) | 42 (2.5%) |
| 65 to 74 Years | 0 (0.0%) | 0 (0.0%) |
| 75 Years and over | 0 (0.0%) | 25 (10.0%) |
Disability Class: Cognitive Difficulty
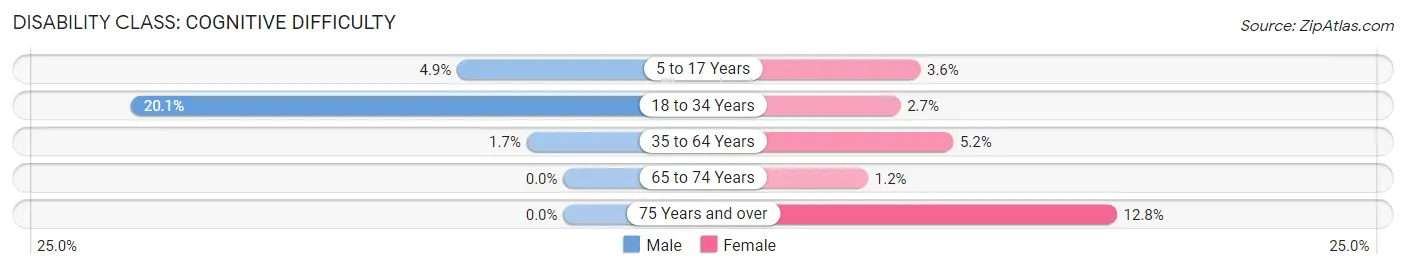
| Age Bracket | Male | Female |
| 5 to 17 Years | 30 (4.9%) | 18 (3.6%) |
| 18 to 34 Years | 122 (20.1%) | 12 (2.7%) |
| 35 to 64 Years | 23 (1.7%) | 87 (5.2%) |
| 65 to 74 Years | 0 (0.0%) | 5 (1.2%) |
| 75 Years and over | 0 (0.0%) | 32 (12.8%) |
Disability Class: Ambulatory Difficulty
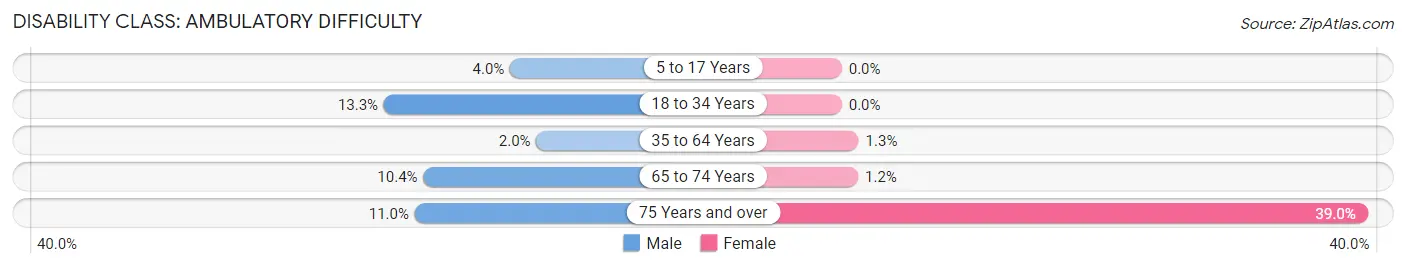
| Age Bracket | Male | Female |
| 5 to 17 Years | 24 (4.0%) | 0 (0.0%) |
| 18 to 34 Years | 81 (13.3%) | 0 (0.0%) |
| 35 to 64 Years | 27 (2.0%) | 21 (1.3%) |
| 65 to 74 Years | 32 (10.4%) | 5 (1.2%) |
| 75 Years and over | 15 (11.0%) | 98 (39.0%) |
Disability Class: Self-Care Difficulty
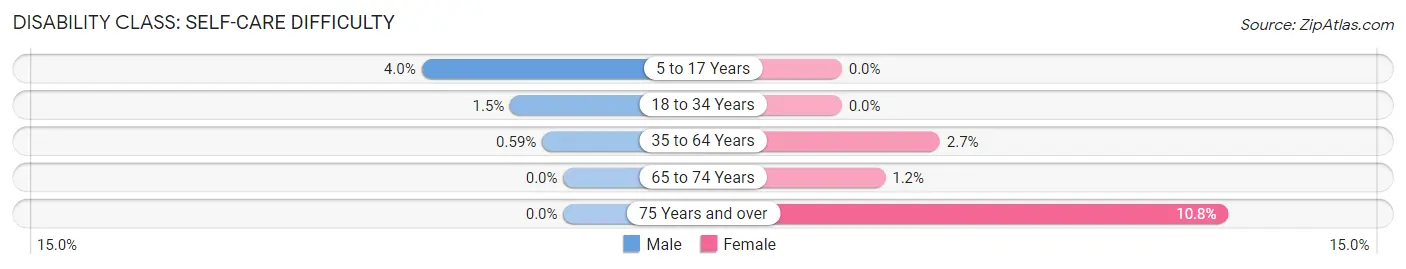
| Age Bracket | Male | Female |
| 5 to 17 Years | 24 (4.0%) | 0 (0.0%) |
| 18 to 34 Years | 9 (1.5%) | 0 (0.0%) |
| 35 to 64 Years | 8 (0.6%) | 46 (2.7%) |
| 65 to 74 Years | 0 (0.0%) | 5 (1.2%) |
| 75 Years and over | 0 (0.0%) | 27 (10.8%) |
Technology Access in Northborough
Computing Device Access in Northborough
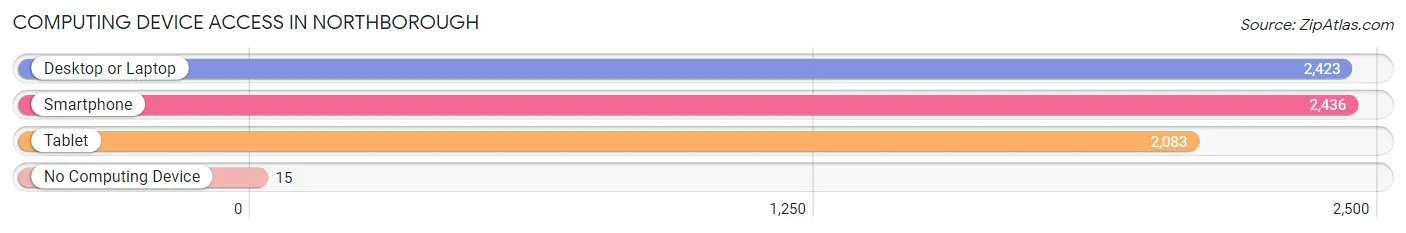
| Device Type | # Households | % Households |
| Desktop or Laptop | 2,423 | 93.8% |
| Smartphone | 2,436 | 94.4% |
| Tablet | 2,083 | 80.7% |
| No Computing Device | 15 | 0.6% |
| Total | 2,582 | 100.0% |
Internet Access in Northborough
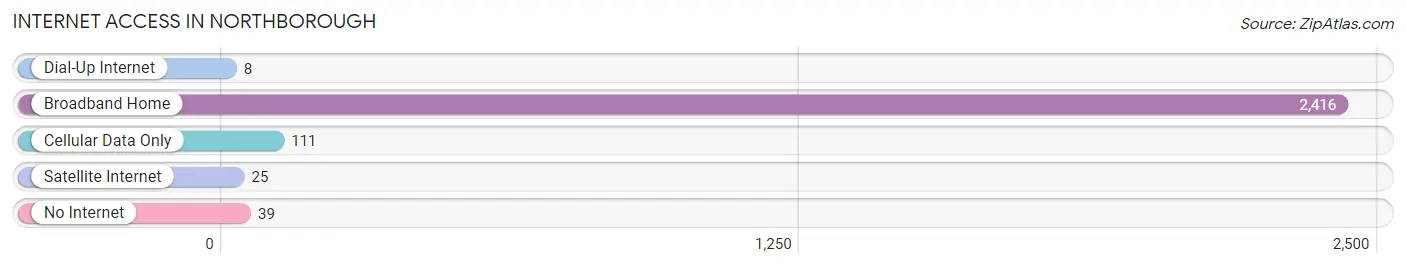
| Internet Type | # Households | % Households |
| Dial-Up Internet | 8 | 0.3% |
| Broadband Home | 2,416 | 93.6% |
| Cellular Data Only | 111 | 4.3% |
| Satellite Internet | 25 | 1.0% |
| No Internet | 39 | 1.5% |
| Total | 2,582 | 100.0% |
Northborough Summary
Northborough is a town located in Worcester County, Massachusetts, United States. It is situated approximately 25 miles west of Boston and is part of the MetroWest region. As of the 2010 census, the town had a population of 14,155.
History
Northborough was first settled in 1660 and was officially incorporated in 1766. The town was originally part of the town of Marlborough, which was divided into two separate towns in 1766. The town was named after its location in the northern part of Marlborough.
The town was primarily an agricultural community until the mid-19th century, when the railroad arrived and the town began to develop into a manufacturing center. The town was home to several factories, including the Northborough Manufacturing Company, which produced textiles, and the Northborough Iron Works, which produced iron products.
Geography
Northborough is located in central Massachusetts, approximately 25 miles west of Boston. It is bordered by the towns of Westborough to the north, Shrewsbury to the east, Southborough to the southeast, and Marlborough to the south and west.
The town is located in the Blackstone River Valley, and is drained by the Assabet River and its tributaries. The town is mostly flat, with some hills in the northern and eastern parts of town. The highest point in town is located at the intersection of Main Street and Church Street, at an elevation of 441 feet above sea level.
Economy
Northborough’s economy is largely based on manufacturing and retail. The town is home to several large companies, including the Northborough Manufacturing Company, which produces textiles, and the Northborough Iron Works, which produces iron products.
The town is also home to several retail stores, including the Northborough Shopping Center, which features a variety of stores and restaurants. The town is also home to several small businesses, including restaurants, auto repair shops, and other services.
Demographics
As of the 2010 census, there were 14,155 people, 5,093 households, and 3,717 families residing in the town. The population density was 1,093.3 people per square mile. The racial makeup of the town was 94.2% White, 1.3% African American, 0.2% Native American, 2.2% Asian, 0.1% Pacific Islander, 0.7% from other races, and 1.4% from two or more races. Hispanic or Latino of any race were 2.3% of the population.
The median income for a household in the town was $87,845, and the median income for a family was $103,945. Males had a median income of $71,945 versus $50,945 for females. The per capita income for the town was $37,945. About 2.2% of families and 3.2% of the population were below the poverty line, including 3.7% of those under age 18 and 4.2% of those age 65 or over.
Common Questions
What is Per Capita Income in Northborough?
Per Capita income in Northborough is $75,980.
What is the Median Family Income in Northborough?
Median Family Income in Northborough is $190,208.
What is the Median Household income in Northborough?
Median Household Income in Northborough is $147,456.
What is Income or Wage Gap in Northborough?
Income or Wage Gap in Northborough is 57.3%.
Women in Northborough earn 42.7 cents for every dollar earned by a man.
What is Inequality or Gini Index in Northborough?
Inequality or Gini Index in Northborough is 0.46.
What is the Total Population of Northborough?
Total Population of Northborough is 6,677.
What is the Total Male Population of Northborough?
Total Male Population of Northborough is 3,166.
What is the Total Female Population of Northborough?
Total Female Population of Northborough is 3,511.
What is the Ratio of Males per 100 Females in Northborough?
There are 90.17 Males per 100 Females in Northborough.
What is the Ratio of Females per 100 Males in Northborough?
There are 110.90 Females per 100 Males in Northborough.
What is the Median Population Age in Northborough?
Median Population Age in Northborough is 48.3 Years.
What is the Average Family Size in Northborough
Average Family Size in Northborough is 3.0 People.
What is the Average Household Size in Northborough
Average Household Size in Northborough is 2.5 People.
How Large is the Labor Force in Northborough?
There are 3,923 People in the Labor Forcein in Northborough.
What is the Percentage of People in the Labor Force in Northborough?
71.1% of People are in the Labor Force in Northborough.
What is the Unemployment Rate in Northborough?
Unemployment Rate in Northborough is 4.0%.