Mashpee Neck, MA Map & Demographics
Mashpee Neck Map
Mashpee Neck Overview
$73,051
PER CAPITA INCOME
$146,532
AVG FAMILY INCOME
$135,536
AVG HOUSEHOLD INCOME
59.3%
WAGE / INCOME GAP [ % ]
40.7¢/ $1
WAGE / INCOME GAP [ $ ]
0.51
INEQUALITY / GINI INDEX
1,270
TOTAL POPULATION
604
MALE POPULATION
666
FEMALE POPULATION
90.69
MALES / 100 FEMALES
110.26
FEMALES / 100 MALES
53.0
MEDIAN AGE
2.8
AVG FAMILY SIZE
2.6
AVG HOUSEHOLD SIZE
682
LABOR FORCE [ PEOPLE ]
56.9%
PERCENT IN LABOR FORCE
2.6%
UNEMPLOYMENT RATE
Income in Mashpee Neck
Income Overview in Mashpee Neck
Per Capita Income in Mashpee Neck is $73,051, while median incomes of families and households are $146,532 and $135,536 respectively.
| Characteristic | Number | Measure |
| Per Capita Income | 1,270 | $73,051 |
| Median Family Income | 368 | $146,532 |
| Mean Family Income | 368 | $230,551 |
| Median Household Income | 489 | $135,536 |
| Mean Household Income | 489 | $189,990 |
| Income Deficit | 368 | $0 |
| Wage / Income Gap (%) | 1,270 | 59.29% |
| Wage / Income Gap ($) | 1,270 | 40.71¢ per $1 |
| Gini / Inequality Index | 1,270 | 0.51 |
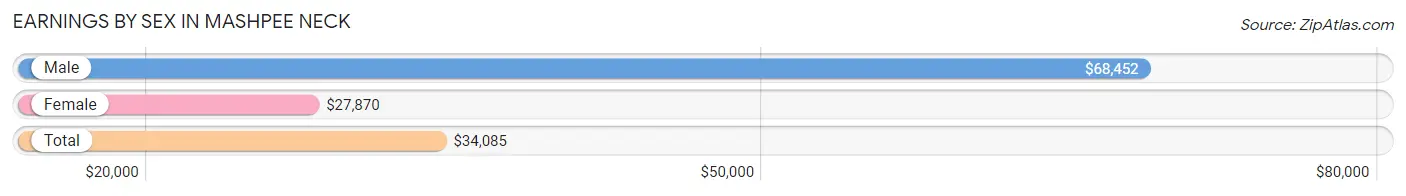
Earnings by Sex in Mashpee Neck
Average Earnings in Mashpee Neck are $34,085, $68,452 for men and $27,870 for women, a difference of 59.3%.
| Sex | Number | Average Earnings |
| Male | 358 (44.5%) | $68,452 |
| Female | 446 (55.5%) | $27,870 |
| Total | 804 (100.0%) | $34,085 |
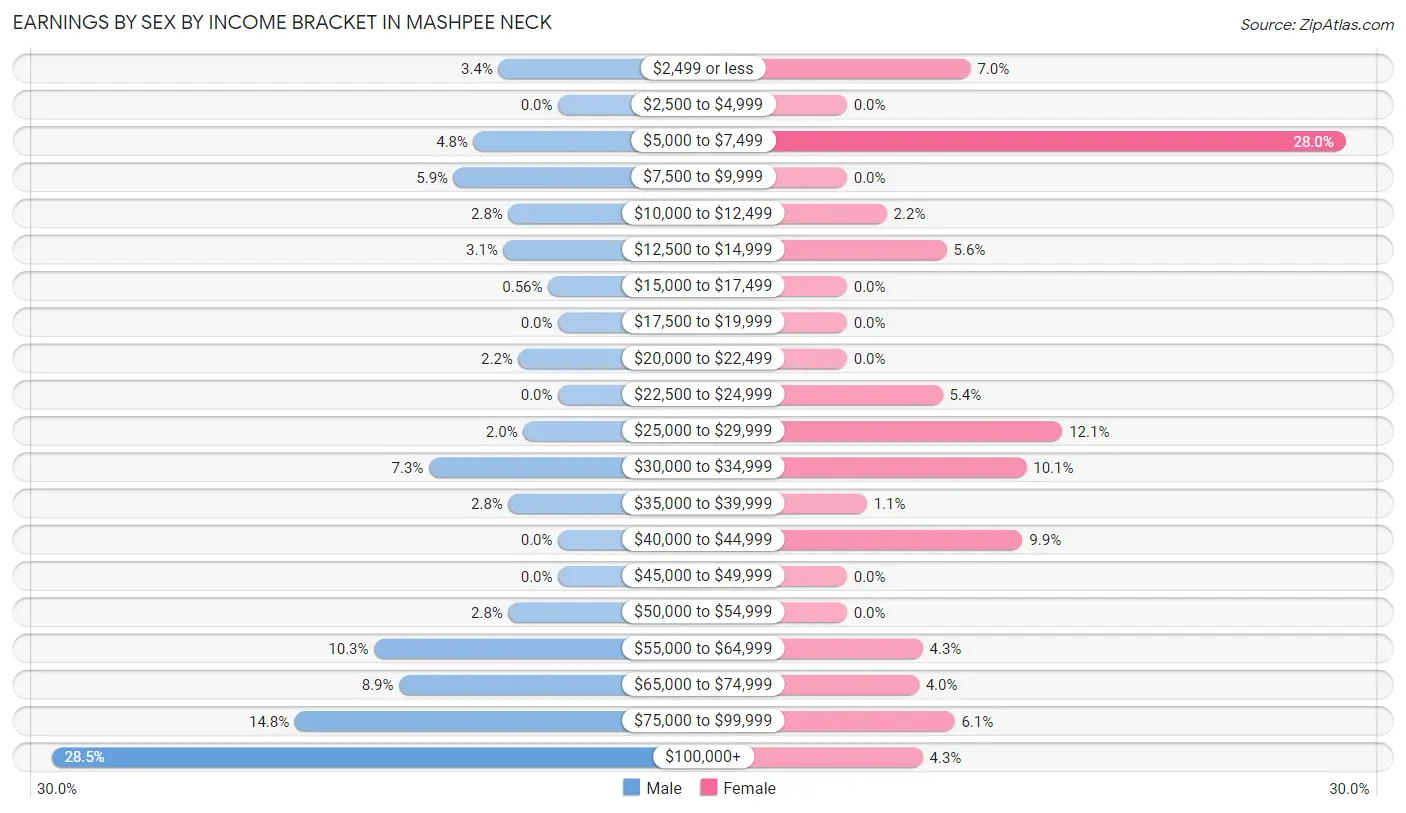
Earnings by Sex by Income Bracket in Mashpee Neck
The most common earnings brackets in Mashpee Neck are $100,000+ for men (102 | 28.5%) and $5,000 to $7,499 for women (125 | 28.0%).
| Income | Male | Female |
| $2,499 or less | 12 (3.4%) | 31 (7.0%) |
| $2,500 to $4,999 | 0 (0.0%) | 0 (0.0%) |
| $5,000 to $7,499 | 17 (4.8%) | 125 (28.0%) |
| $7,500 to $9,999 | 21 (5.9%) | 0 (0.0%) |
| $10,000 to $12,499 | 10 (2.8%) | 10 (2.2%) |
| $12,500 to $14,999 | 11 (3.1%) | 25 (5.6%) |
| $15,000 to $17,499 | 2 (0.6%) | 0 (0.0%) |
| $17,500 to $19,999 | 0 (0.0%) | 0 (0.0%) |
| $20,000 to $22,499 | 8 (2.2%) | 0 (0.0%) |
| $22,500 to $24,999 | 0 (0.0%) | 24 (5.4%) |
| $25,000 to $29,999 | 7 (2.0%) | 54 (12.1%) |
| $30,000 to $34,999 | 26 (7.3%) | 45 (10.1%) |
| $35,000 to $39,999 | 10 (2.8%) | 5 (1.1%) |
| $40,000 to $44,999 | 0 (0.0%) | 44 (9.9%) |
| $45,000 to $49,999 | 0 (0.0%) | 0 (0.0%) |
| $50,000 to $54,999 | 10 (2.8%) | 0 (0.0%) |
| $55,000 to $64,999 | 37 (10.3%) | 19 (4.3%) |
| $65,000 to $74,999 | 32 (8.9%) | 18 (4.0%) |
| $75,000 to $99,999 | 53 (14.8%) | 27 (6.0%) |
| $100,000+ | 102 (28.5%) | 19 (4.3%) |
| Total | 358 (100.0%) | 446 (100.0%) |
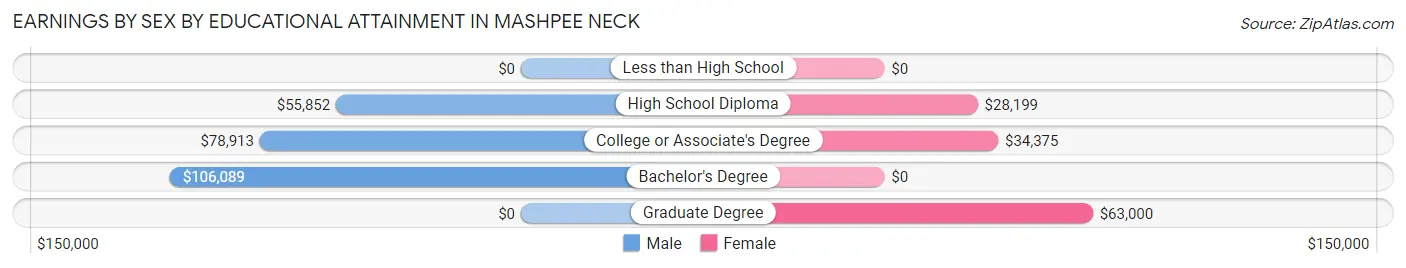
Earnings by Sex by Educational Attainment in Mashpee Neck
Average earnings in Mashpee Neck are $77,609 for men and $34,528 for women, a difference of 55.5%. Men with an educational attainment of bachelor's degree enjoy the highest average annual earnings of $106,089, while those with high school diploma education earn the least with $55,852. Women with an educational attainment of graduate degree earn the most with the average annual earnings of $63,000, while those with high school diploma education have the smallest earnings of $28,199.
| Educational Attainment | Male Income | Female Income |
| Less than High School | - | - |
| High School Diploma | $55,852 | $28,199 |
| College or Associate's Degree | $78,913 | $34,375 |
| Bachelor's Degree | $106,089 | $0 |
| Graduate Degree | - | - |
| Total | $77,609 | $34,528 |
Family Income in Mashpee Neck
Family Income Brackets in Mashpee Neck
According to the Mashpee Neck family income data, there are 161 families falling into the $100,000 to $149,999 income range, which is the most common income bracket and makes up 43.8% of all families.
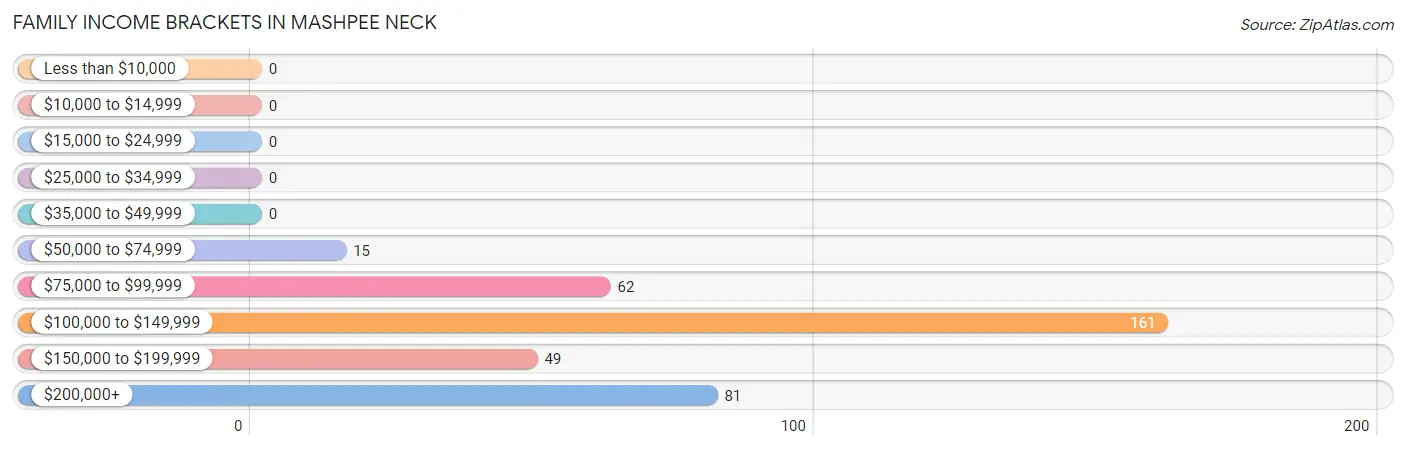
| Income Bracket | # Families | % Families |
| Less than $10,000 | 0 | 0.0% |
| $10,000 to $14,999 | 0 | 0.0% |
| $15,000 to $24,999 | 0 | 0.0% |
| $25,000 to $34,999 | 0 | 0.0% |
| $35,000 to $49,999 | 0 | 0.0% |
| $50,000 to $74,999 | 15 | 4.1% |
| $75,000 to $99,999 | 62 | 16.8% |
| $100,000 to $149,999 | 161 | 43.8% |
| $150,000 to $199,999 | 49 | 13.3% |
| $200,000+ | 81 | 22.0% |
Family Income by Famaliy Size in Mashpee Neck
4-person families (94 | 25.5%) account for the highest median family income in Mashpee Neck with $147,708 per family, while 2-person families (215 | 58.4%) have the highest median income of $64,653 per family member.
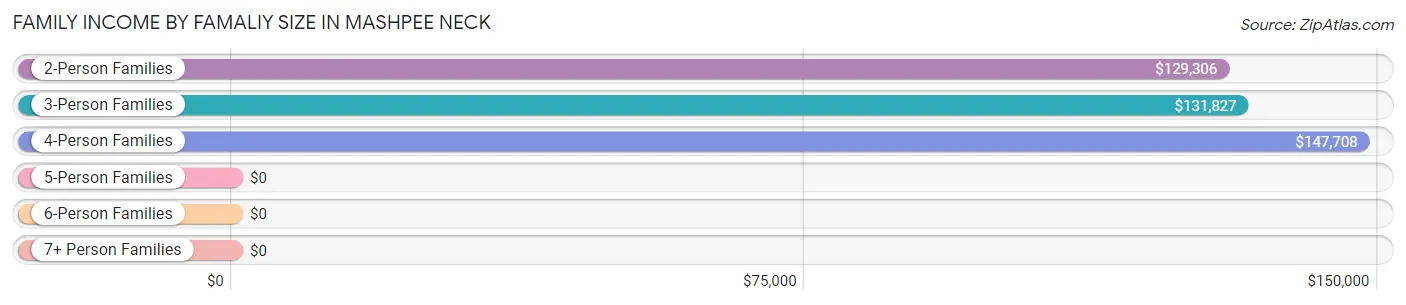
| Income Bracket | # Families | Median Income |
| 2-Person Families | 215 (58.4%) | $129,306 |
| 3-Person Families | 43 (11.7%) | $131,827 |
| 4-Person Families | 94 (25.5%) | $147,708 |
| 5-Person Families | 16 (4.3%) | $0 |
| 6-Person Families | 0 (0.0%) | $0 |
| 7+ Person Families | 0 (0.0%) | $0 |
| Total | 368 (100.0%) | $146,532 |
Family Income by Number of Earners in Mashpee Neck
The median family income in Mashpee Neck is $146,532, with families comprising no earners (66) having the highest median family income of $209,444, while families with 1 earner (105) have the lowest median family income of $114,531, accounting for 17.9% and 28.5% of families, respectively.
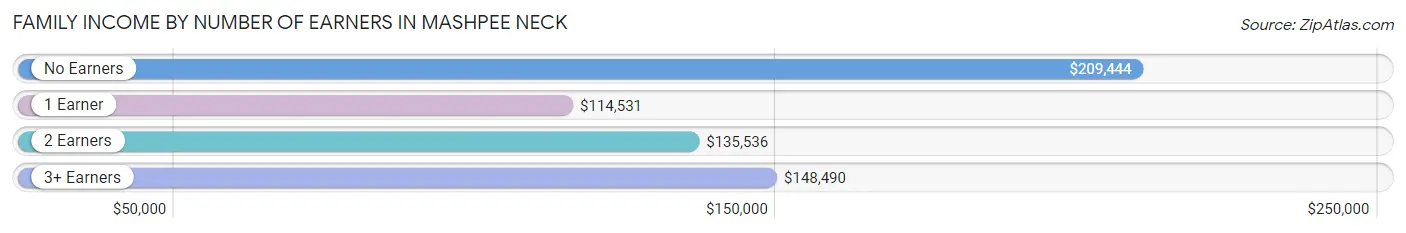
| Number of Earners | # Families | Median Income |
| No Earners | 66 (17.9%) | $209,444 |
| 1 Earner | 105 (28.5%) | $114,531 |
| 2 Earners | 90 (24.5%) | $135,536 |
| 3+ Earners | 107 (29.1%) | $148,490 |
| Total | 368 (100.0%) | $146,532 |
Household Income in Mashpee Neck
Household Income Brackets in Mashpee Neck
With 161 households falling in the category, the $100,000 to $149,999 income range is the most frequent in Mashpee Neck, accounting for 32.9% of all households.
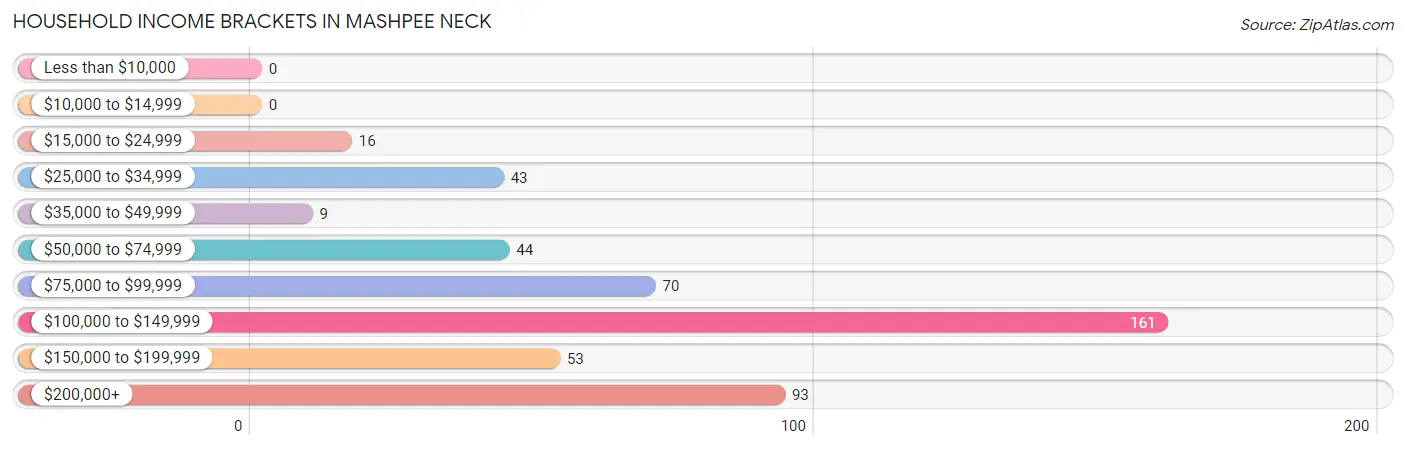
| Income Bracket | # Households | % Households |
| Less than $10,000 | 0 | 0.0% |
| $10,000 to $14,999 | 0 | 0.0% |
| $15,000 to $24,999 | 16 | 3.3% |
| $25,000 to $34,999 | 43 | 8.8% |
| $35,000 to $49,999 | 9 | 1.8% |
| $50,000 to $74,999 | 44 | 9.0% |
| $75,000 to $99,999 | 70 | 14.3% |
| $100,000 to $149,999 | 161 | 32.9% |
| $150,000 to $199,999 | 53 | 10.8% |
| $200,000+ | 93 | 19.0% |
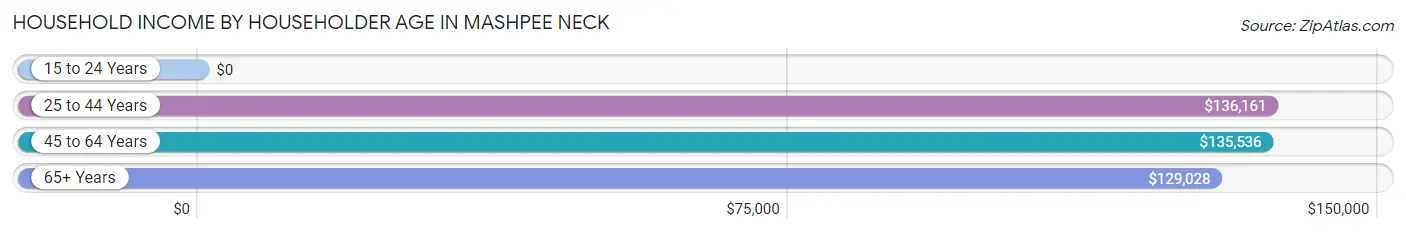
Household Income by Householder Age in Mashpee Neck
The median household income in Mashpee Neck is $135,536, with the highest median household income of $136,161 found in the 25 to 44 years age bracket for the primary householder. A total of 47 households (9.6%) fall into this category.
| Income Bracket | # Households | Median Income |
| 15 to 24 Years | 0 (0.0%) | $0 |
| 25 to 44 Years | 47 (9.6%) | $136,161 |
| 45 to 64 Years | 249 (50.9%) | $135,536 |
| 65+ Years | 193 (39.5%) | $129,028 |
| Total | 489 (100.0%) | $135,536 |
Poverty in Mashpee Neck
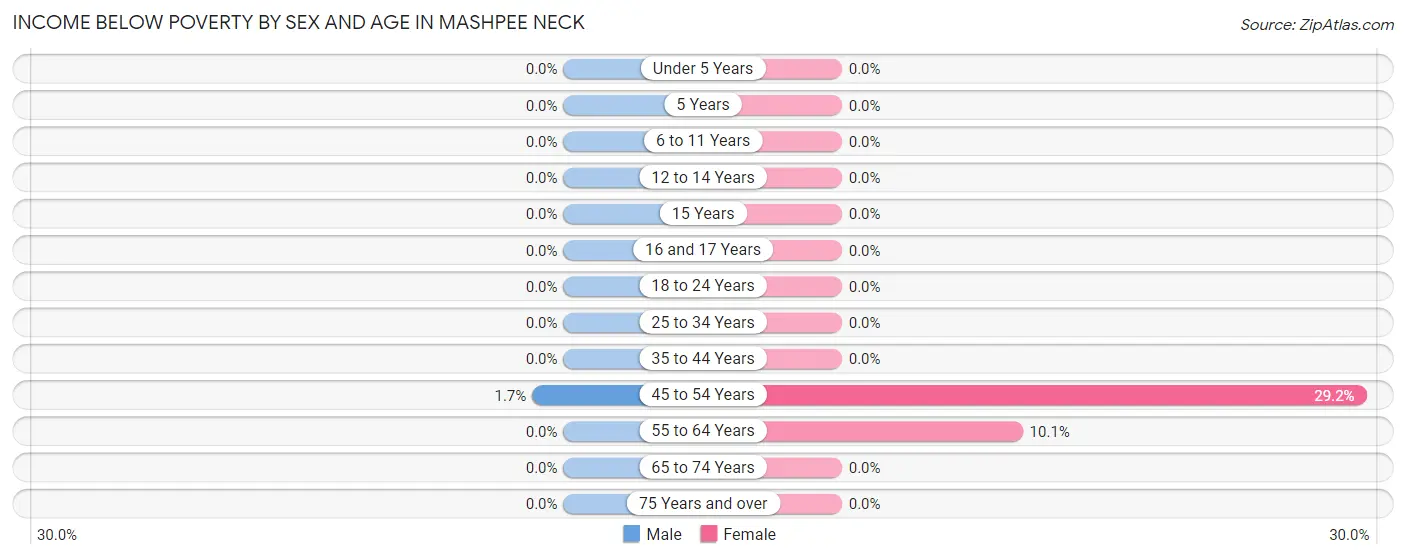
Income Below Poverty by Sex and Age in Mashpee Neck
With 0.3% poverty level for males and 6.0% for females among the residents of Mashpee Neck, 45 to 54 year old males and 45 to 54 year old females are the most vulnerable to poverty, with 2 males (1.7%) and 26 females (29.2%) in their respective age groups living below the poverty level.
| Age Bracket | Male | Female |
| Under 5 Years | 0 (0.0%) | 0 (0.0%) |
| 5 Years | 0 (0.0%) | 0 (0.0%) |
| 6 to 11 Years | 0 (0.0%) | 0 (0.0%) |
| 12 to 14 Years | 0 (0.0%) | 0 (0.0%) |
| 15 Years | 0 (0.0%) | 0 (0.0%) |
| 16 and 17 Years | 0 (0.0%) | 0 (0.0%) |
| 18 to 24 Years | 0 (0.0%) | 0 (0.0%) |
| 25 to 34 Years | 0 (0.0%) | 0 (0.0%) |
| 35 to 44 Years | 0 (0.0%) | 0 (0.0%) |
| 45 to 54 Years | 2 (1.7%) | 26 (29.2%) |
| 55 to 64 Years | 0 (0.0%) | 14 (10.1%) |
| 65 to 74 Years | 0 (0.0%) | 0 (0.0%) |
| 75 Years and over | 0 (0.0%) | 0 (0.0%) |
| Total | 2 (0.3%) | 40 (6.0%) |
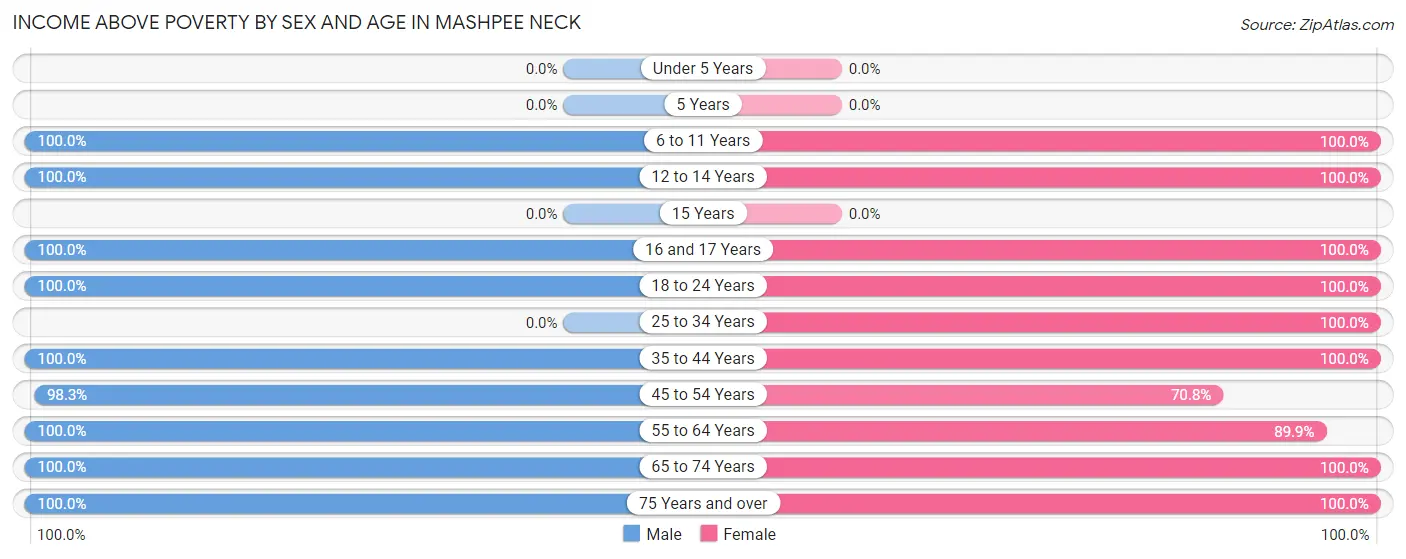
Income Above Poverty by Sex and Age in Mashpee Neck
According to the poverty statistics in Mashpee Neck, males aged 6 to 11 years and females aged 6 to 11 years are the age groups that are most secure financially, with 100.0% of males and 100.0% of females in these age groups living above the poverty line.
| Age Bracket | Male | Female |
| Under 5 Years | 0 (0.0%) | 0 (0.0%) |
| 5 Years | 0 (0.0%) | 0 (0.0%) |
| 6 to 11 Years | 17 (100.0%) | 10 (100.0%) |
| 12 to 14 Years | 32 (100.0%) | 13 (100.0%) |
| 15 Years | 0 (0.0%) | 0 (0.0%) |
| 16 and 17 Years | 12 (100.0%) | 43 (100.0%) |
| 18 to 24 Years | 58 (100.0%) | 134 (100.0%) |
| 25 to 34 Years | 0 (0.0%) | 17 (100.0%) |
| 35 to 44 Years | 30 (100.0%) | 78 (100.0%) |
| 45 to 54 Years | 113 (98.3%) | 63 (70.8%) |
| 55 to 64 Years | 145 (100.0%) | 125 (89.9%) |
| 65 to 74 Years | 128 (100.0%) | 110 (100.0%) |
| 75 Years and over | 67 (100.0%) | 33 (100.0%) |
| Total | 602 (99.7%) | 626 (94.0%) |
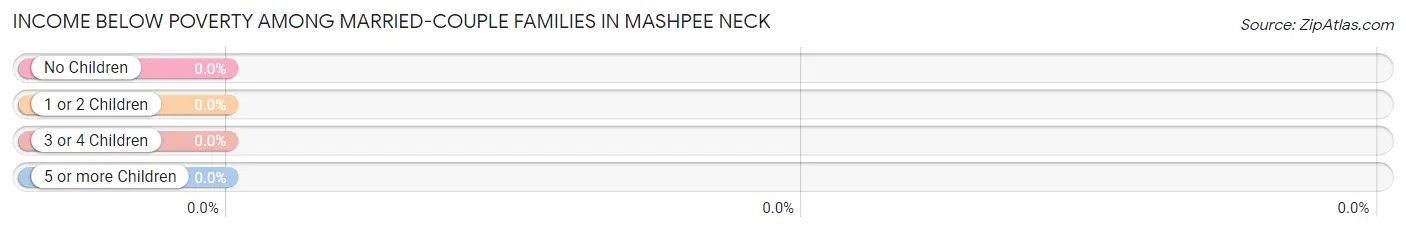
Income Below Poverty Among Married-Couple Families in Mashpee Neck
| Children | Above Poverty | Below Poverty |
| No Children | 214 (100.0%) | 0 (0.0%) |
| 1 or 2 Children | 98 (100.0%) | 0 (0.0%) |
| 3 or 4 Children | 0 (0.0%) | 0 (0.0%) |
| 5 or more Children | 0 (0.0%) | 0 (0.0%) |
| Total | 312 (100.0%) | 0 (0.0%) |
Income Below Poverty Among Single-Parent Households in Mashpee Neck
| Children | Single Father | Single Mother |
| No Children | 0 (0.0%) | 0 (0.0%) |
| 1 or 2 Children | 0 (0.0%) | 0 (0.0%) |
| 3 or 4 Children | 0 (0.0%) | 0 (0.0%) |
| 5 or more Children | 0 (0.0%) | 0 (0.0%) |
| Total | 0 (0.0%) | 0 (0.0%) |
Income Below Poverty Among Married-Couple vs Single-Parent Households in Mashpee Neck
| Children | Married-Couple Families | Single-Parent Households |
| No Children | 0 (0.0%) | 0 (0.0%) |
| 1 or 2 Children | 0 (0.0%) | 0 (0.0%) |
| 3 or 4 Children | 0 (0.0%) | 0 (0.0%) |
| 5 or more Children | 0 (0.0%) | 0 (0.0%) |
| Total | 0 (0.0%) | 0 (0.0%) |
Race in Mashpee Neck
The most populous races in Mashpee Neck are White / Caucasian (1,036 | 81.6%), Asian (98 | 7.7%), and Hispanic or Latino (62 | 4.9%).
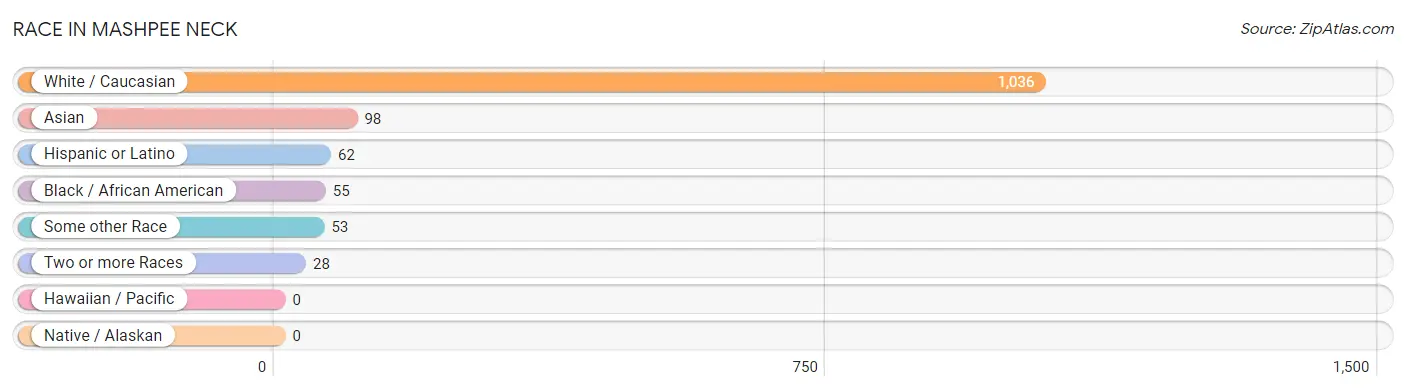
| Race | # Population | % Population |
| Asian | 98 | 7.7% |
| Black / African American | 55 | 4.3% |
| Hawaiian / Pacific | 0 | 0.0% |
| Hispanic or Latino | 62 | 4.9% |
| Native / Alaskan | 0 | 0.0% |
| White / Caucasian | 1,036 | 81.6% |
| Two or more Races | 28 | 2.2% |
| Some other Race | 53 | 4.2% |
| Total | 1,270 | 100.0% |
Ancestry in Mashpee Neck
The most populous ancestries reported in Mashpee Neck are Irish (442 | 34.8%), German (103 | 8.1%), Swedish (103 | 8.1%), French (98 | 7.7%), and Thai (98 | 7.7%), together accounting for 66.5% of all Mashpee Neck residents.
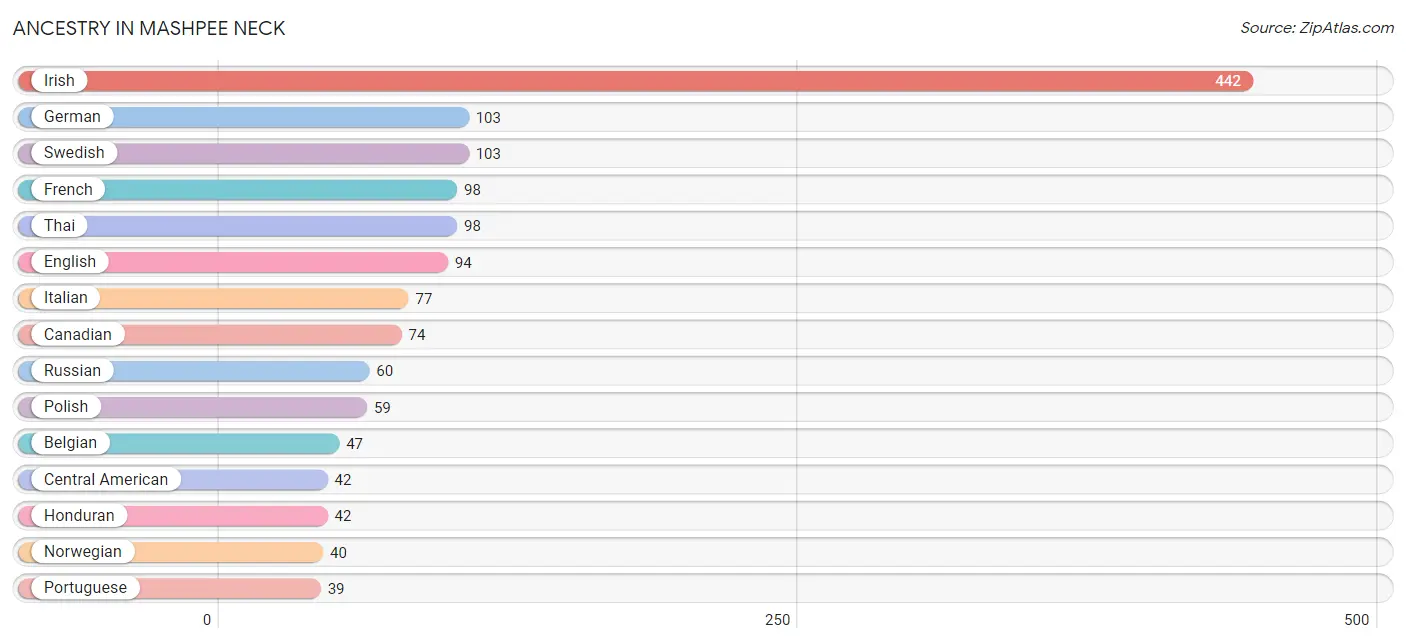
| Ancestry | # Population | % Population |
| American | 21 | 1.7% |
| Belgian | 47 | 3.7% |
| British | 7 | 0.5% |
| Canadian | 74 | 5.8% |
| Central American | 42 | 3.3% |
| Colombian | 9 | 0.7% |
| Danish | 8 | 0.6% |
| Dutch | 7 | 0.5% |
| Eastern European | 8 | 0.6% |
| English | 94 | 7.4% |
| Finnish | 14 | 1.1% |
| French | 98 | 7.7% |
| French Canadian | 23 | 1.8% |
| German | 103 | 8.1% |
| Honduran | 42 | 3.3% |
| Irish | 442 | 34.8% |
| Italian | 77 | 6.1% |
| Norwegian | 40 | 3.2% |
| Polish | 59 | 4.6% |
| Portuguese | 39 | 3.1% |
| Puerto Rican | 11 | 0.9% |
| Russian | 60 | 4.7% |
| Scotch-Irish | 10 | 0.8% |
| Scottish | 10 | 0.8% |
| South American | 9 | 0.7% |
| Swedish | 103 | 8.1% |
| Swiss | 39 | 3.1% |
| Thai | 98 | 7.7% |
| Ukrainian | 36 | 2.8% |
| Welsh | 9 | 0.7% | View All 30 Rows |
Immigrants in Mashpee Neck
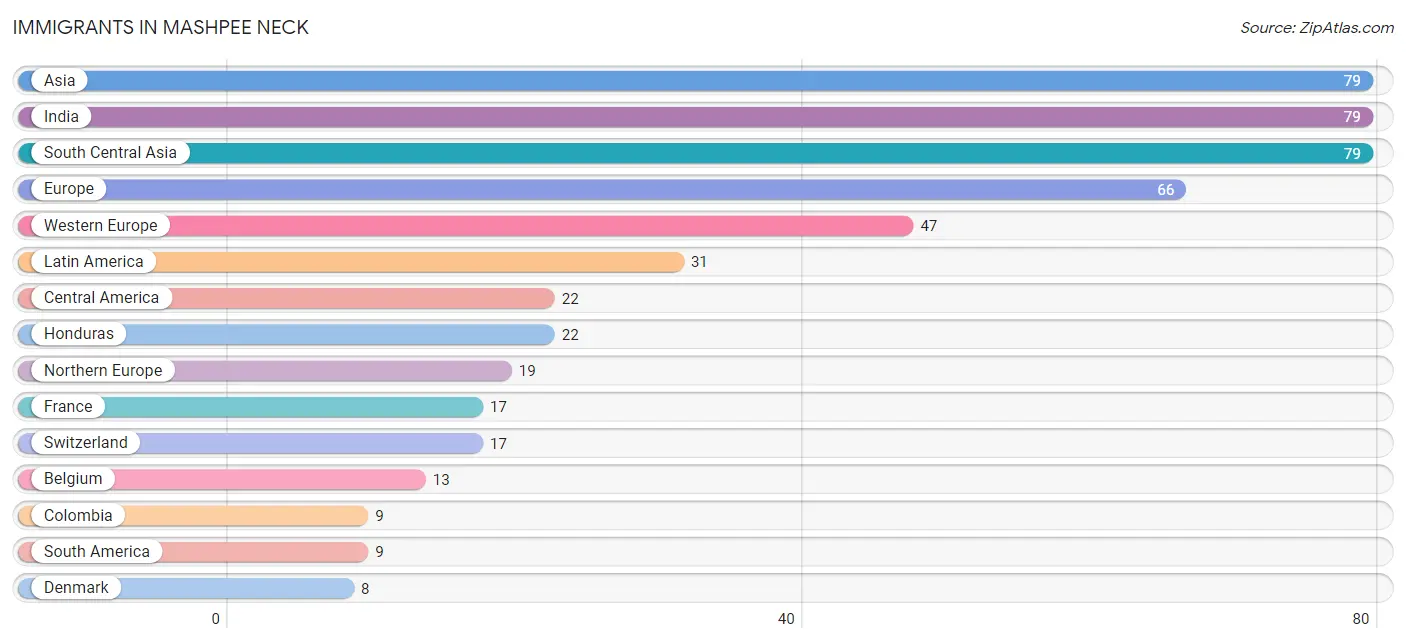
The most numerous immigrant groups reported in Mashpee Neck came from Asia (79 | 6.2%), India (79 | 6.2%), South Central Asia (79 | 6.2%), Europe (66 | 5.2%), and Western Europe (47 | 3.7%), together accounting for 27.6% of all Mashpee Neck residents.
| Immigration Origin | # Population | % Population |
| Asia | 79 | 6.2% |
| Belgium | 13 | 1.0% |
| Central America | 22 | 1.7% |
| Colombia | 9 | 0.7% |
| Denmark | 8 | 0.6% |
| England | 7 | 0.5% |
| Europe | 66 | 5.2% |
| France | 17 | 1.3% |
| Honduras | 22 | 1.7% |
| India | 79 | 6.2% |
| Latin America | 31 | 2.4% |
| Northern Europe | 19 | 1.5% |
| South America | 9 | 0.7% |
| South Central Asia | 79 | 6.2% |
| Switzerland | 17 | 1.3% |
| Western Europe | 47 | 3.7% | View All 16 Rows |
Sex and Age in Mashpee Neck
Sex and Age in Mashpee Neck
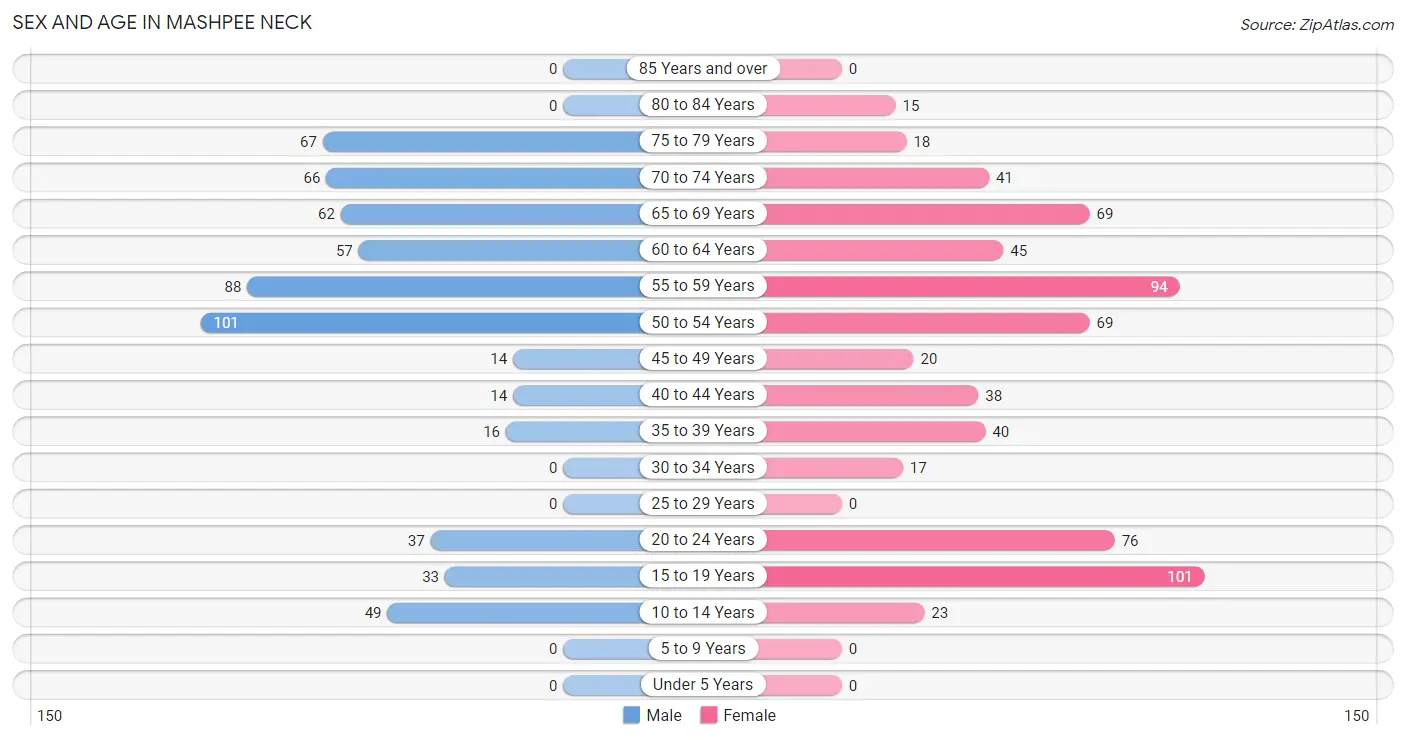
The most populous age groups in Mashpee Neck are 50 to 54 Years (101 | 16.7%) for men and 15 to 19 Years (101 | 15.2%) for women.
| Age Bracket | Male | Female |
| Under 5 Years | 0 (0.0%) | 0 (0.0%) |
| 5 to 9 Years | 0 (0.0%) | 0 (0.0%) |
| 10 to 14 Years | 49 (8.1%) | 23 (3.5%) |
| 15 to 19 Years | 33 (5.5%) | 101 (15.2%) |
| 20 to 24 Years | 37 (6.1%) | 76 (11.4%) |
| 25 to 29 Years | 0 (0.0%) | 0 (0.0%) |
| 30 to 34 Years | 0 (0.0%) | 17 (2.5%) |
| 35 to 39 Years | 16 (2.6%) | 40 (6.0%) |
| 40 to 44 Years | 14 (2.3%) | 38 (5.7%) |
| 45 to 49 Years | 14 (2.3%) | 20 (3.0%) |
| 50 to 54 Years | 101 (16.7%) | 69 (10.4%) |
| 55 to 59 Years | 88 (14.6%) | 94 (14.1%) |
| 60 to 64 Years | 57 (9.4%) | 45 (6.8%) |
| 65 to 69 Years | 62 (10.3%) | 69 (10.4%) |
| 70 to 74 Years | 66 (10.9%) | 41 (6.2%) |
| 75 to 79 Years | 67 (11.1%) | 18 (2.7%) |
| 80 to 84 Years | 0 (0.0%) | 15 (2.2%) |
| 85 Years and over | 0 (0.0%) | 0 (0.0%) |
| Total | 604 (100.0%) | 666 (100.0%) |
Families and Households in Mashpee Neck
Median Family Size in Mashpee Neck
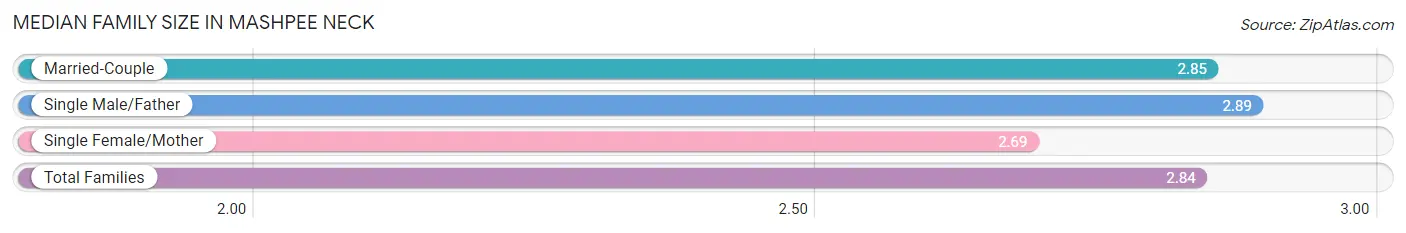
The median family size in Mashpee Neck is 2.84 persons per family, with single male/father families (27 | 7.3%) accounting for the largest median family size of 2.89 persons per family. On the other hand, single female/mother families (29 | 7.9%) represent the smallest median family size with 2.69 persons per family.
| Family Type | # Families | Family Size |
| Married-Couple | 312 (84.8%) | 2.85 |
| Single Male/Father | 27 (7.3%) | 2.89 |
| Single Female/Mother | 29 (7.9%) | 2.69 |
| Total Families | 368 (100.0%) | 2.84 |
Median Household Size in Mashpee Neck
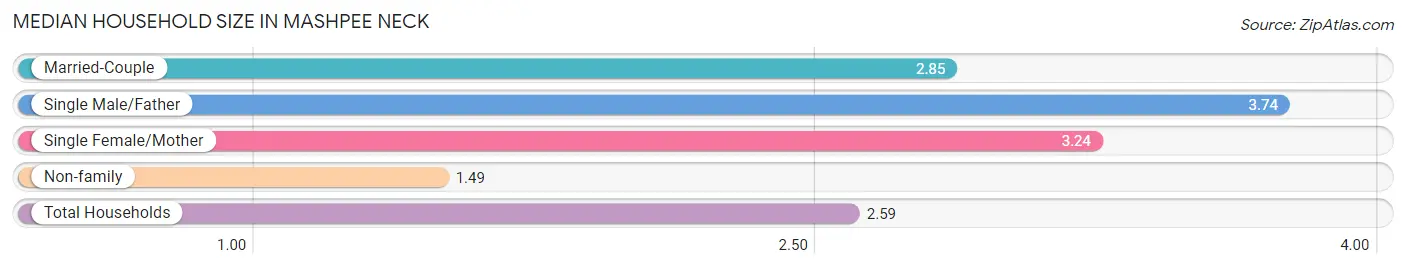
The median household size in Mashpee Neck is 2.59 persons per household, with single male/father households (27 | 5.5%) accounting for the largest median household size of 3.74 persons per household. non-family households (121 | 24.7%) represent the smallest median household size with 1.49 persons per household.
| Household Type | # Households | Household Size |
| Married-Couple | 312 (63.8%) | 2.85 |
| Single Male/Father | 27 (5.5%) | 3.74 |
| Single Female/Mother | 29 (5.9%) | 3.24 |
| Non-family | 121 (24.7%) | 1.49 |
| Total Households | 489 (100.0%) | 2.59 |
Household Size by Marriage Status in Mashpee Neck
Out of a total of 489 households in Mashpee Neck, 368 (75.3%) are family households, while 121 (24.7%) are nonfamily households. The most numerous type of family households are 2-person households, comprising 184, and the most common type of nonfamily households are 1-person households, comprising 70.
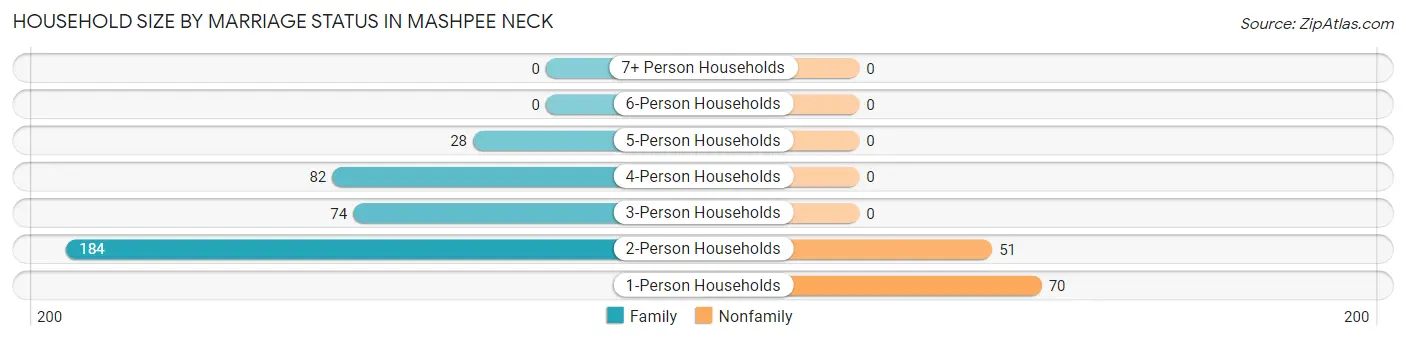
| Household Size | Family Households | Nonfamily Households |
| 1-Person Households | - | 70 (14.3%) |
| 2-Person Households | 184 (37.6%) | 51 (10.4%) |
| 3-Person Households | 74 (15.1%) | 0 (0.0%) |
| 4-Person Households | 82 (16.8%) | 0 (0.0%) |
| 5-Person Households | 28 (5.7%) | 0 (0.0%) |
| 6-Person Households | 0 (0.0%) | 0 (0.0%) |
| 7+ Person Households | 0 (0.0%) | 0 (0.0%) |
| Total | 368 (75.3%) | 121 (24.7%) |
Female Fertility in Mashpee Neck
Fertility by Age in Mashpee Neck
| Age Bracket | Women with Births | Births / 1,000 Women |
| 15 to 19 years | 0 (0.0%) | 0.0 |
| 20 to 34 years | 0 (0.0%) | 0.0 |
| 35 to 50 years | 0 (0.0%) | 0.0 |
| Total | 0 (0.0%) | 0.0 |
Fertility by Age by Marriage Status in Mashpee Neck
| Age Bracket | Married | Unmarried |
| 15 to 19 years | 0 (0.0%) | 0 (0.0%) |
| 20 to 34 years | 0 (0.0%) | 0 (0.0%) |
| 35 to 50 years | 0 (0.0%) | 0 (0.0%) |
| Total | 0 (0.0%) | 0 (0.0%) |
Fertility by Education in Mashpee Neck
| Educational Attainment | Women with Births | Births / 1,000 Women |
| Less than High School | 0 (0.0%) | 0.0 |
| High School Diploma | 0 (0.0%) | 0.0 |
| College or Associate's Degree | 0 (0.0%) | 0.0 |
| Bachelor's Degree | 0 (0.0%) | 0.0 |
| Graduate Degree | 0 (0.0%) | 0.0 |
| Total | 0 (0.0%) | 0.0 |
Fertility by Education by Marriage Status in Mashpee Neck
| Educational Attainment | Married | Unmarried |
| Less than High School | 0 (0.0%) | 0 (0.0%) |
| High School Diploma | 0 (0.0%) | 0 (0.0%) |
| College or Associate's Degree | 0 (0.0%) | 0 (0.0%) |
| Bachelor's Degree | 0 (0.0%) | 0 (0.0%) |
| Graduate Degree | 0 (0.0%) | 0 (0.0%) |
| Total | 0 (0.0%) | 0 (0.0%) |
Employment Characteristics in Mashpee Neck
Employment by Class of Employer in Mashpee Neck
Among the 664 employed individuals in Mashpee Neck, private company employees (390 | 58.7%), local government employees (109 | 16.4%), and not-for-profit organizations (95 | 14.3%) make up the most common classes of employment.
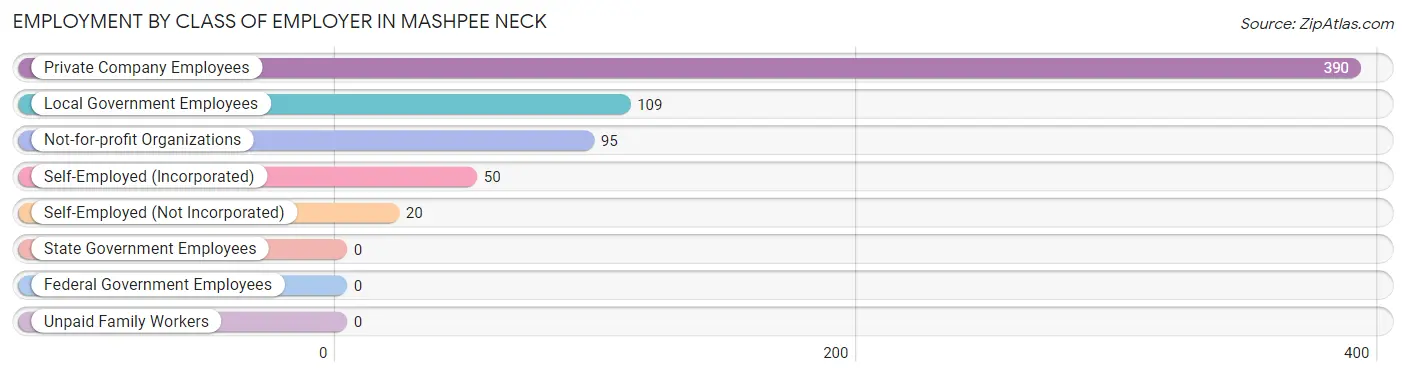
| Employer Class | # Employees | % Employees |
| Private Company Employees | 390 | 58.7% |
| Self-Employed (Incorporated) | 50 | 7.5% |
| Self-Employed (Not Incorporated) | 20 | 3.0% |
| Not-for-profit Organizations | 95 | 14.3% |
| Local Government Employees | 109 | 16.4% |
| State Government Employees | 0 | 0.0% |
| Federal Government Employees | 0 | 0.0% |
| Unpaid Family Workers | 0 | 0.0% |
| Total | 664 | 100.0% |
Employment Status by Age in Mashpee Neck
According to the labor force statistics for Mashpee Neck, out of the total population over 16 years of age (1,198), 56.9% or 682 individuals are in the labor force, with 2.6% or 18 of them unemployed. The age group with the highest labor force participation rate is 30 to 34 years, with 100.0% or 17 individuals in the labor force. Within the labor force, the 60 to 64 years age range has the highest percentage of unemployed individuals, with 12.9% or 9 of them being unemployed.
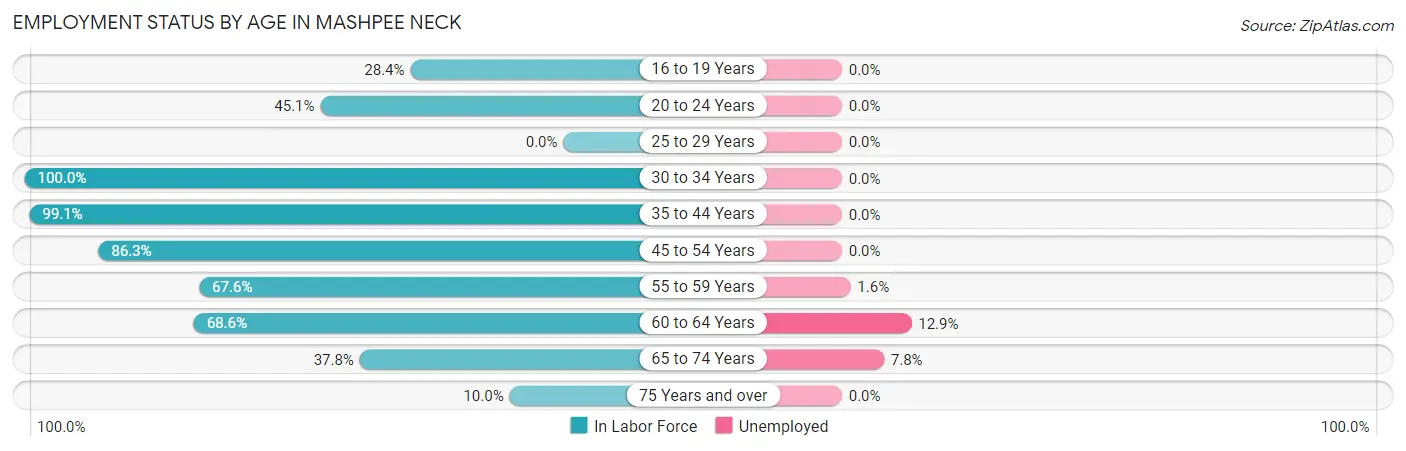
| Age Bracket | In Labor Force | Unemployed |
| 16 to 19 Years | 38 (28.4%) | 0 (0.0%) |
| 20 to 24 Years | 51 (45.1%) | 0 (0.0%) |
| 25 to 29 Years | 0 (0.0%) | 0 (0.0%) |
| 30 to 34 Years | 17 (100.0%) | 0 (0.0%) |
| 35 to 44 Years | 107 (99.1%) | 0 (0.0%) |
| 45 to 54 Years | 176 (86.3%) | 0 (0.0%) |
| 55 to 59 Years | 123 (67.6%) | 2 (1.6%) |
| 60 to 64 Years | 70 (68.6%) | 9 (12.9%) |
| 65 to 74 Years | 90 (37.8%) | 7 (7.8%) |
| 75 Years and over | 10 (10.0%) | 0 (0.0%) |
| Total | 682 (56.9%) | 18 (2.6%) |
Employment Status by Educational Attainment in Mashpee Neck
According to labor force statistics for Mashpee Neck, 80.4% of individuals (493) out of the total population between 25 and 64 years of age (613) are in the labor force, with 2.2% or 11 of them being unemployed. The group with the highest labor force participation rate are those with the educational attainment of less than high school, with 100.0% or 33 individuals in the labor force. Within the labor force, individuals with high school diploma education have the highest percentage of unemployment, with 6.8% or 9 of them being unemployed.
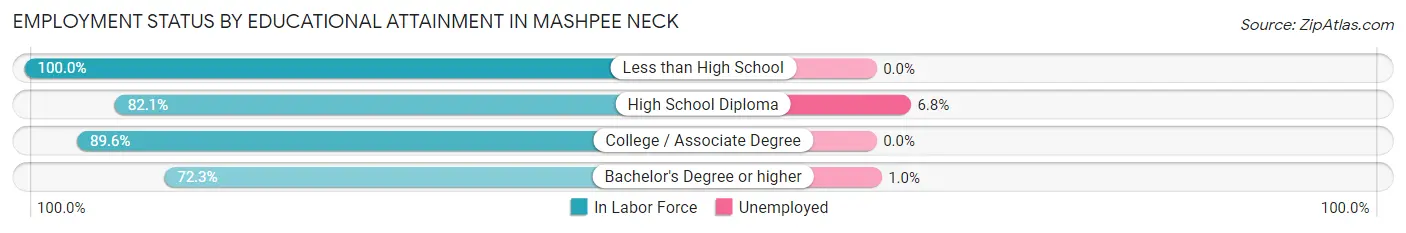
| Educational Attainment | In Labor Force | Unemployed |
| Less than High School | 33 (100.0%) | 0 (0.0%) |
| High School Diploma | 133 (82.1%) | 11 (6.8%) |
| College / Associate Degree | 129 (89.6%) | 0 (0.0%) |
| Bachelor's Degree or higher | 198 (72.3%) | 3 (1.0%) |
| Total | 493 (80.4%) | 13 (2.2%) |
Employment Occupations by Sex in Mashpee Neck
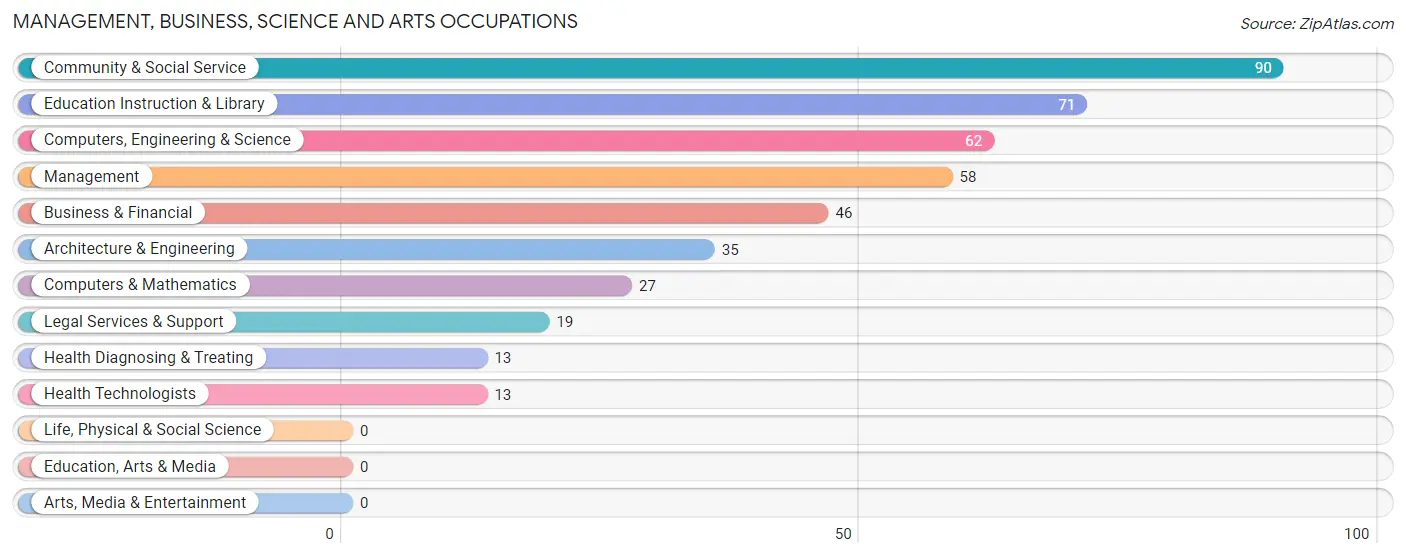
Management, Business, Science and Arts Occupations
The most common Management, Business, Science and Arts occupations in Mashpee Neck are Community & Social Service (90 | 13.6%), Education Instruction & Library (71 | 10.7%), Computers, Engineering & Science (62 | 9.3%), Management (58 | 8.7%), and Business & Financial (46 | 6.9%).
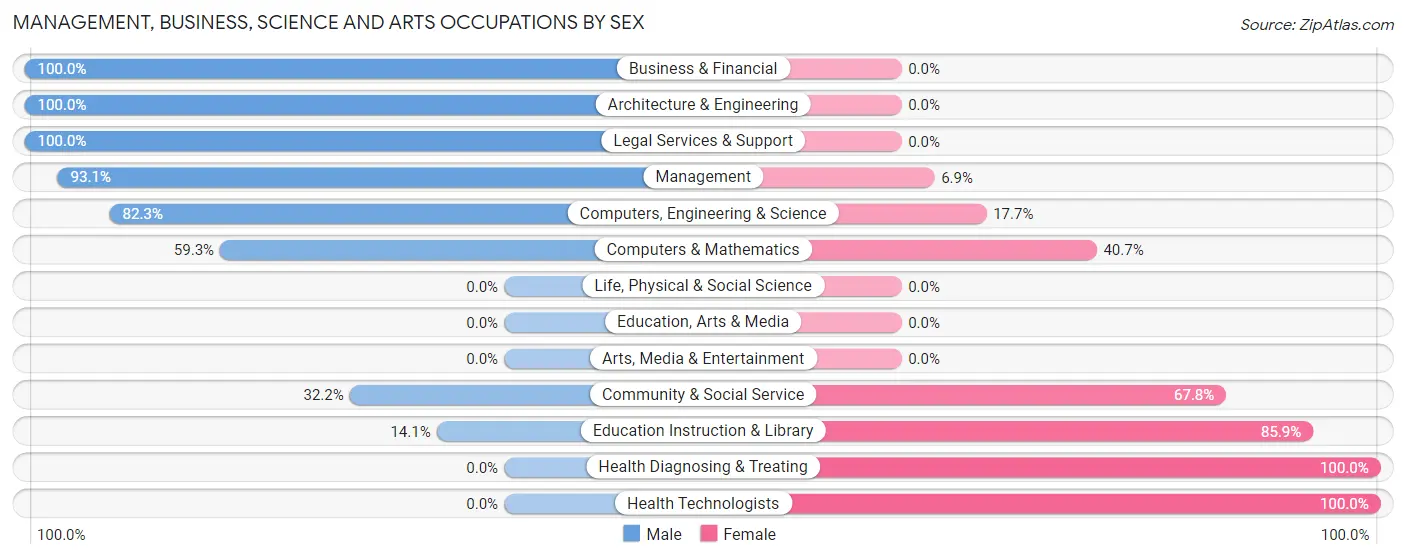
Management, Business, Science and Arts Occupations by Sex
Within the Management, Business, Science and Arts occupations in Mashpee Neck, the most male-oriented occupations are Business & Financial (100.0%), Architecture & Engineering (100.0%), and Legal Services & Support (100.0%), while the most female-oriented occupations are Health Diagnosing & Treating (100.0%), Health Technologists (100.0%), and Education Instruction & Library (85.9%).
| Occupation | Male | Female |
| Management | 54 (93.1%) | 4 (6.9%) |
| Business & Financial | 46 (100.0%) | 0 (0.0%) |
| Computers, Engineering & Science | 51 (82.3%) | 11 (17.7%) |
| Computers & Mathematics | 16 (59.3%) | 11 (40.7%) |
| Architecture & Engineering | 35 (100.0%) | 0 (0.0%) |
| Life, Physical & Social Science | 0 (0.0%) | 0 (0.0%) |
| Community & Social Service | 29 (32.2%) | 61 (67.8%) |
| Education, Arts & Media | 0 (0.0%) | 0 (0.0%) |
| Legal Services & Support | 19 (100.0%) | 0 (0.0%) |
| Education Instruction & Library | 10 (14.1%) | 61 (85.9%) |
| Arts, Media & Entertainment | 0 (0.0%) | 0 (0.0%) |
| Health Diagnosing & Treating | 0 (0.0%) | 13 (100.0%) |
| Health Technologists | 0 (0.0%) | 13 (100.0%) |
| Total (Category) | 180 (66.9%) | 89 (33.1%) |
| Total (Overall) | 322 (48.5%) | 342 (51.5%) |
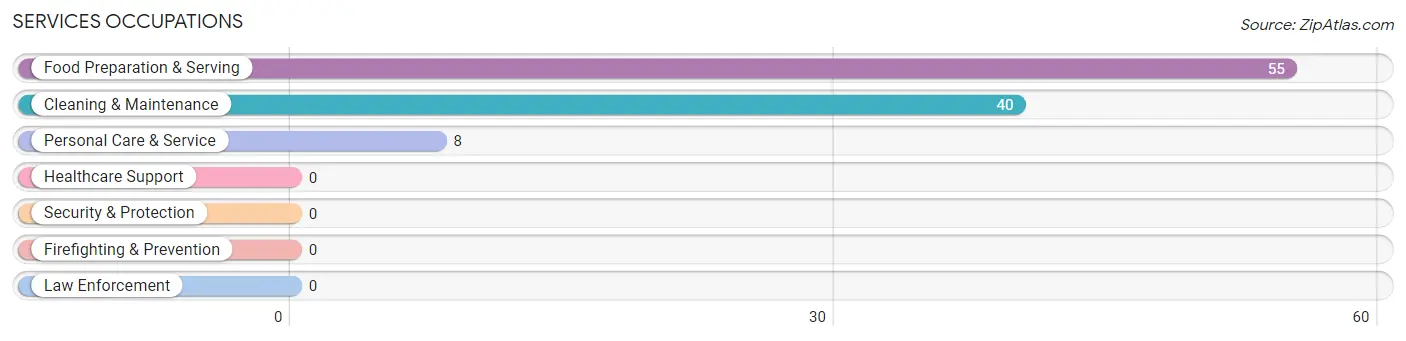
Services Occupations
The most common Services occupations in Mashpee Neck are Food Preparation & Serving (55 | 8.3%), Cleaning & Maintenance (40 | 6.0%), and Personal Care & Service (8 | 1.2%).
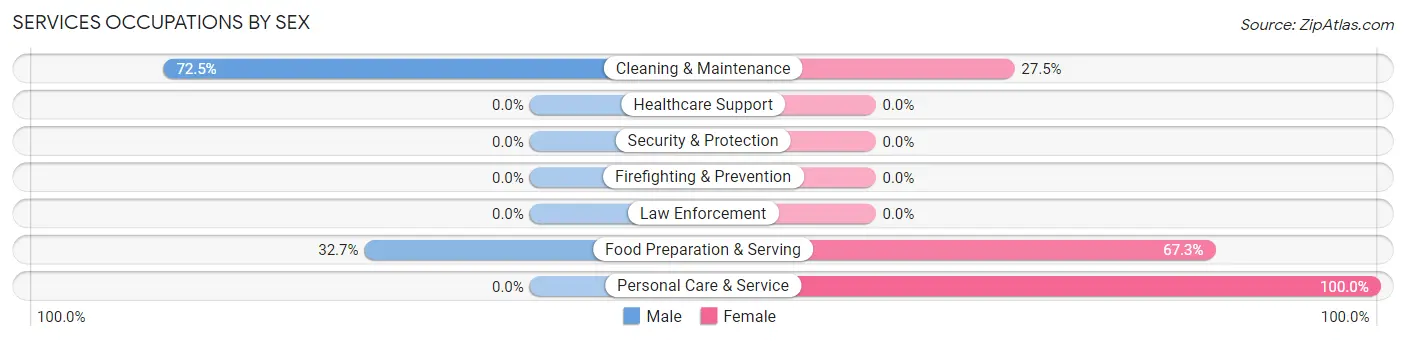
Services Occupations by Sex
Within the Services occupations in Mashpee Neck, the most male-oriented occupations are Cleaning & Maintenance (72.5%), and Food Preparation & Serving (32.7%), while the most female-oriented occupations are Personal Care & Service (100.0%), Food Preparation & Serving (67.3%), and Cleaning & Maintenance (27.5%).
| Occupation | Male | Female |
| Healthcare Support | 0 (0.0%) | 0 (0.0%) |
| Security & Protection | 0 (0.0%) | 0 (0.0%) |
| Firefighting & Prevention | 0 (0.0%) | 0 (0.0%) |
| Law Enforcement | 0 (0.0%) | 0 (0.0%) |
| Food Preparation & Serving | 18 (32.7%) | 37 (67.3%) |
| Cleaning & Maintenance | 29 (72.5%) | 11 (27.5%) |
| Personal Care & Service | 0 (0.0%) | 8 (100.0%) |
| Total (Category) | 47 (45.6%) | 56 (54.4%) |
| Total (Overall) | 322 (48.5%) | 342 (51.5%) |
Sales and Office Occupations
The most common Sales and Office occupations in Mashpee Neck are Office & Administration (144 | 21.7%), and Sales & Related (87 | 13.1%).
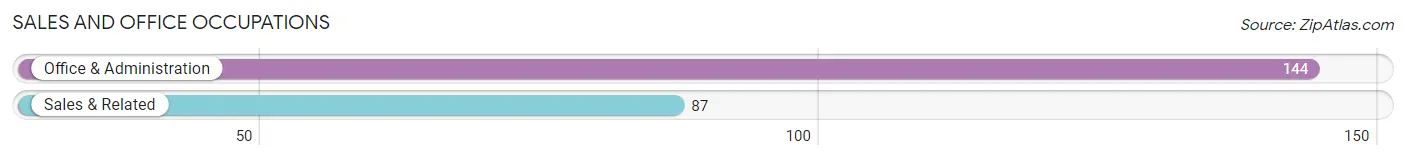
Sales and Office Occupations by Sex

| Occupation | Male | Female |
| Sales & Related | 25 (28.7%) | 62 (71.3%) |
| Office & Administration | 9 (6.2%) | 135 (93.8%) |
| Total (Category) | 34 (14.7%) | 197 (85.3%) |
| Total (Overall) | 322 (48.5%) | 342 (51.5%) |
Natural Resources, Construction and Maintenance Occupations
The most common Natural Resources, Construction and Maintenance occupations in Mashpee Neck are Installation, Maintenance & Repair (14 | 2.1%), and Construction & Extraction (4 | 0.6%).
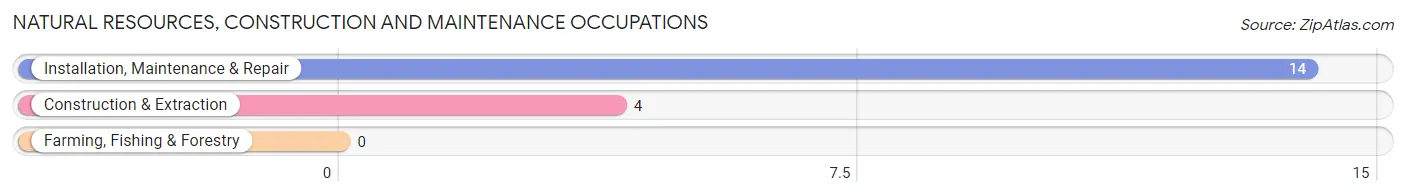
Natural Resources, Construction and Maintenance Occupations by Sex
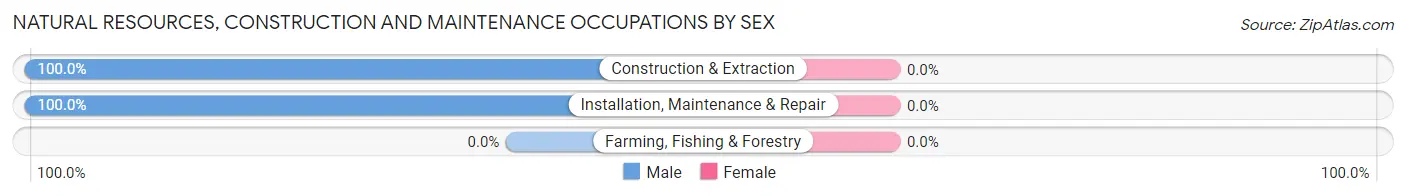
| Occupation | Male | Female |
| Farming, Fishing & Forestry | 0 (0.0%) | 0 (0.0%) |
| Construction & Extraction | 4 (100.0%) | 0 (0.0%) |
| Installation, Maintenance & Repair | 14 (100.0%) | 0 (0.0%) |
| Total (Category) | 18 (100.0%) | 0 (0.0%) |
| Total (Overall) | 322 (48.5%) | 342 (51.5%) |
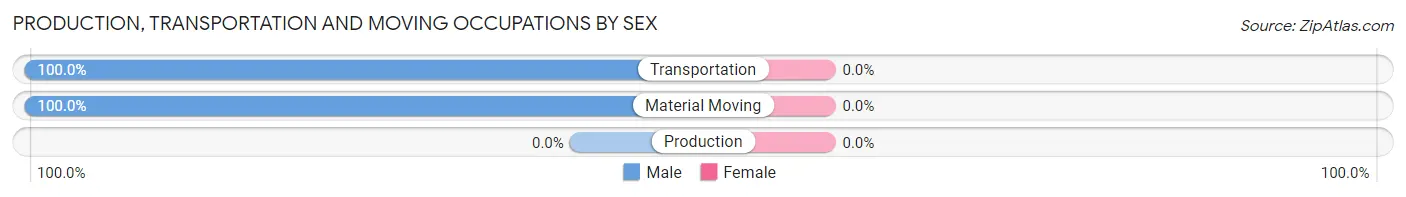
Production, Transportation and Moving Occupations
The most common Production, Transportation and Moving occupations in Mashpee Neck are Material Moving (28 | 4.2%), and Transportation (15 | 2.3%).
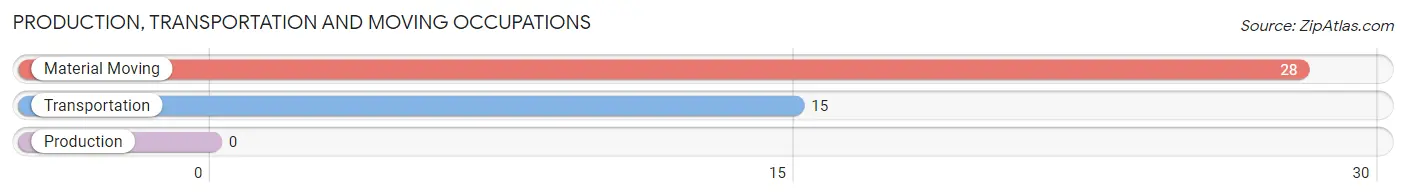
Production, Transportation and Moving Occupations by Sex
| Occupation | Male | Female |
| Production | 0 (0.0%) | 0 (0.0%) |
| Transportation | 15 (100.0%) | 0 (0.0%) |
| Material Moving | 28 (100.0%) | 0 (0.0%) |
| Total (Category) | 43 (100.0%) | 0 (0.0%) |
| Total (Overall) | 322 (48.5%) | 342 (51.5%) |
Employment Industries by Sex in Mashpee Neck
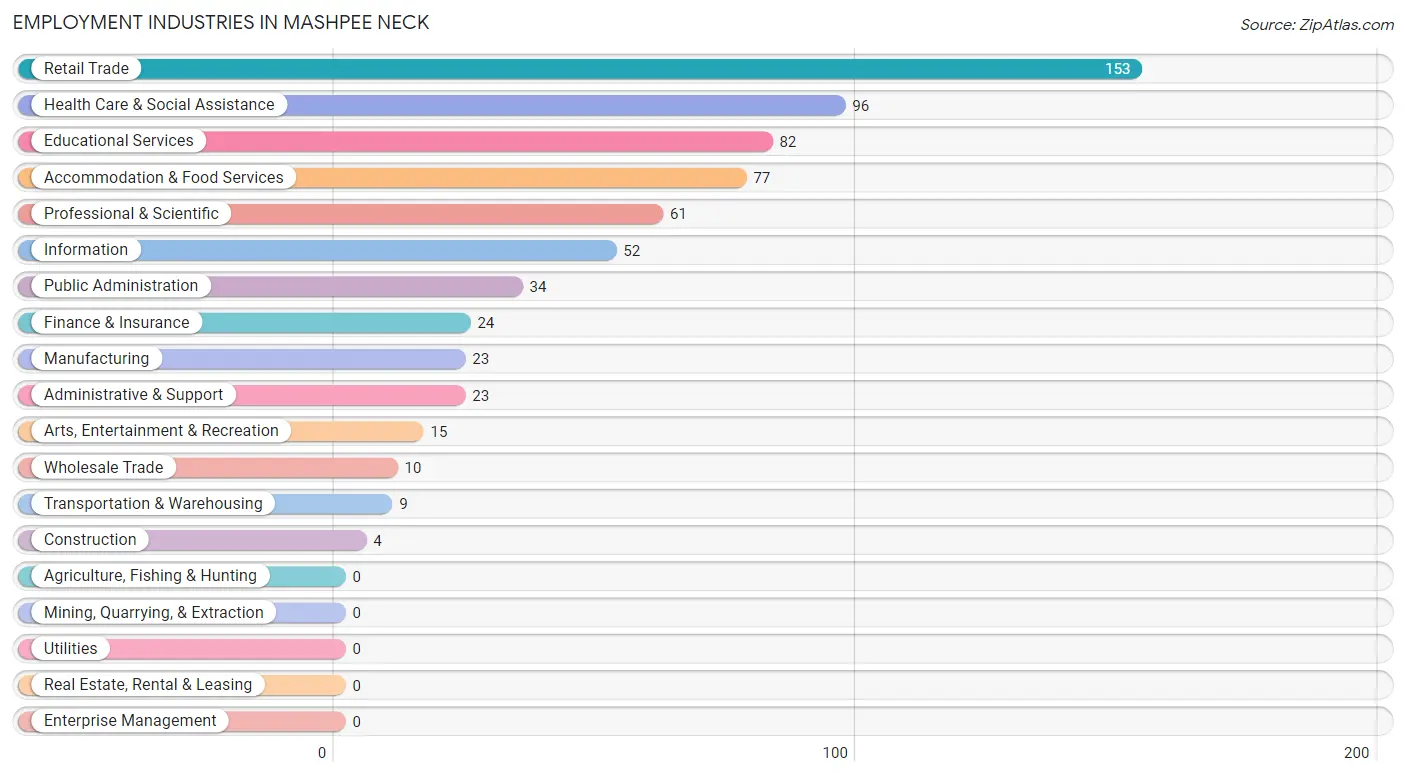
Employment Industries in Mashpee Neck
The major employment industries in Mashpee Neck include Retail Trade (153 | 23.0%), Health Care & Social Assistance (96 | 14.5%), Educational Services (82 | 12.3%), Accommodation & Food Services (77 | 11.6%), and Professional & Scientific (61 | 9.2%).
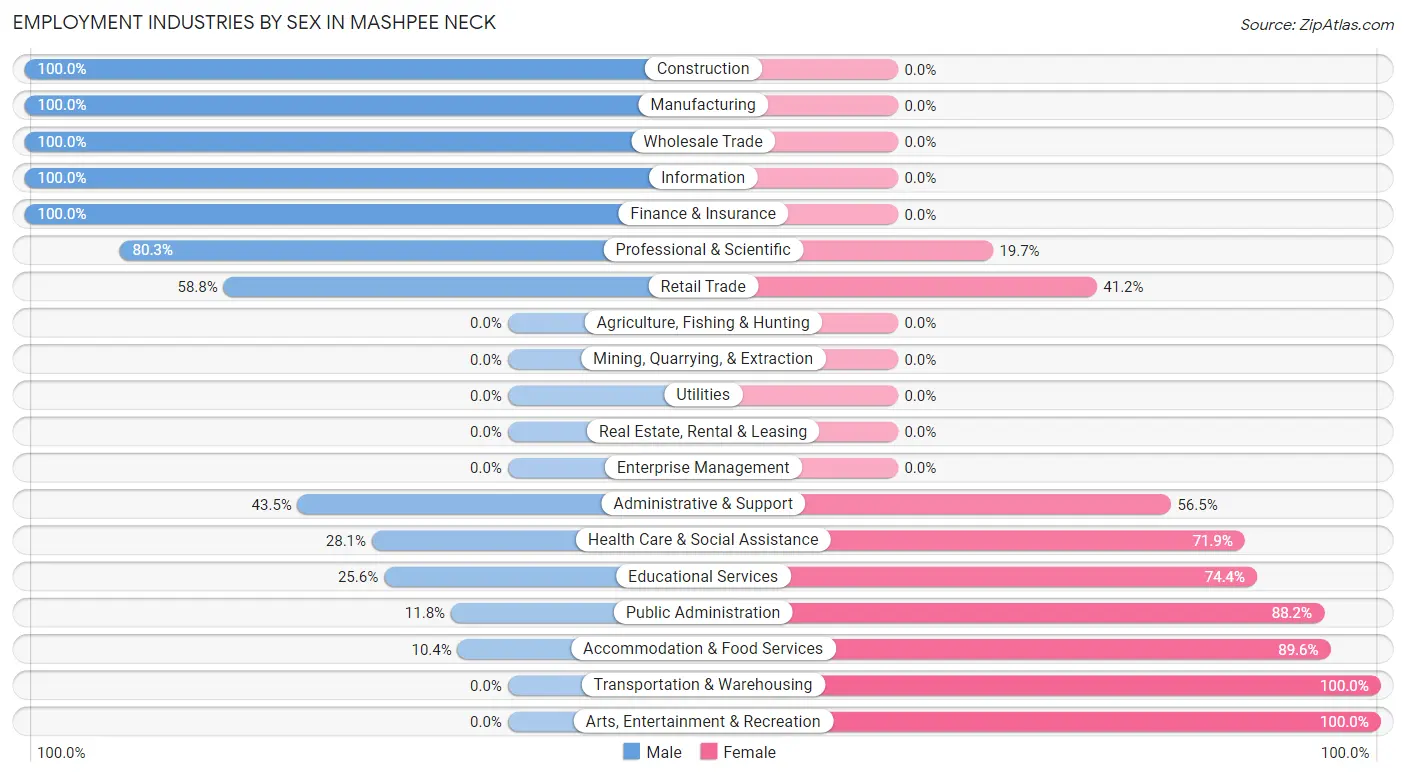
Employment Industries by Sex in Mashpee Neck
The Mashpee Neck industries that see more men than women are Construction (100.0%), Manufacturing (100.0%), and Wholesale Trade (100.0%), whereas the industries that tend to have a higher number of women are Transportation & Warehousing (100.0%), Arts, Entertainment & Recreation (100.0%), and Accommodation & Food Services (89.6%).
| Industry | Male | Female |
| Agriculture, Fishing & Hunting | 0 (0.0%) | 0 (0.0%) |
| Mining, Quarrying, & Extraction | 0 (0.0%) | 0 (0.0%) |
| Construction | 4 (100.0%) | 0 (0.0%) |
| Manufacturing | 23 (100.0%) | 0 (0.0%) |
| Wholesale Trade | 10 (100.0%) | 0 (0.0%) |
| Retail Trade | 90 (58.8%) | 63 (41.2%) |
| Transportation & Warehousing | 0 (0.0%) | 9 (100.0%) |
| Utilities | 0 (0.0%) | 0 (0.0%) |
| Information | 52 (100.0%) | 0 (0.0%) |
| Finance & Insurance | 24 (100.0%) | 0 (0.0%) |
| Real Estate, Rental & Leasing | 0 (0.0%) | 0 (0.0%) |
| Professional & Scientific | 49 (80.3%) | 12 (19.7%) |
| Enterprise Management | 0 (0.0%) | 0 (0.0%) |
| Administrative & Support | 10 (43.5%) | 13 (56.5%) |
| Educational Services | 21 (25.6%) | 61 (74.4%) |
| Health Care & Social Assistance | 27 (28.1%) | 69 (71.9%) |
| Arts, Entertainment & Recreation | 0 (0.0%) | 15 (100.0%) |
| Accommodation & Food Services | 8 (10.4%) | 69 (89.6%) |
| Public Administration | 4 (11.8%) | 30 (88.2%) |
| Total | 322 (48.5%) | 342 (51.5%) |
Education in Mashpee Neck
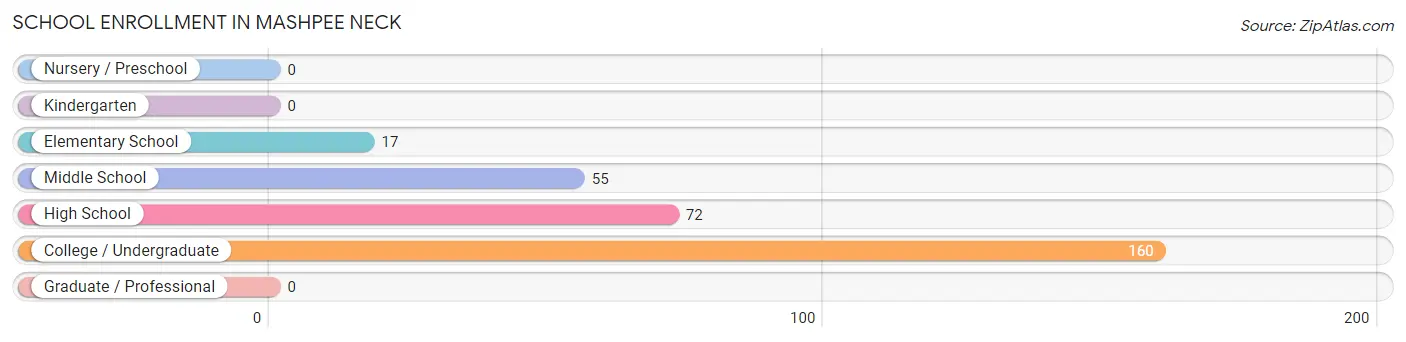
School Enrollment in Mashpee Neck
The most common levels of schooling among the 304 students in Mashpee Neck are college / undergraduate (160 | 52.6%), high school (72 | 23.7%), and middle school (55 | 18.1%).
| School Level | # Students | % Students |
| Nursery / Preschool | 0 | 0.0% |
| Kindergarten | 0 | 0.0% |
| Elementary School | 17 | 5.6% |
| Middle School | 55 | 18.1% |
| High School | 72 | 23.7% |
| College / Undergraduate | 160 | 52.6% |
| Graduate / Professional | 0 | 0.0% |
| Total | 304 | 100.0% |
School Enrollment by Age by Funding Source in Mashpee Neck
Out of a total of 304 students who are enrolled in schools in Mashpee Neck, 26 (8.6%) attend a private institution, while the remaining 278 (91.4%) are enrolled in public schools. The age group of 20 to 24 year olds has the highest likelihood of being enrolled in private schools, with 17 (23.3% in the age bracket) enrolled. Conversely, the age group of 10 to 14 year olds has the lowest likelihood of being enrolled in a private school, with 72 (100.0% in the age bracket) attending a public institution.
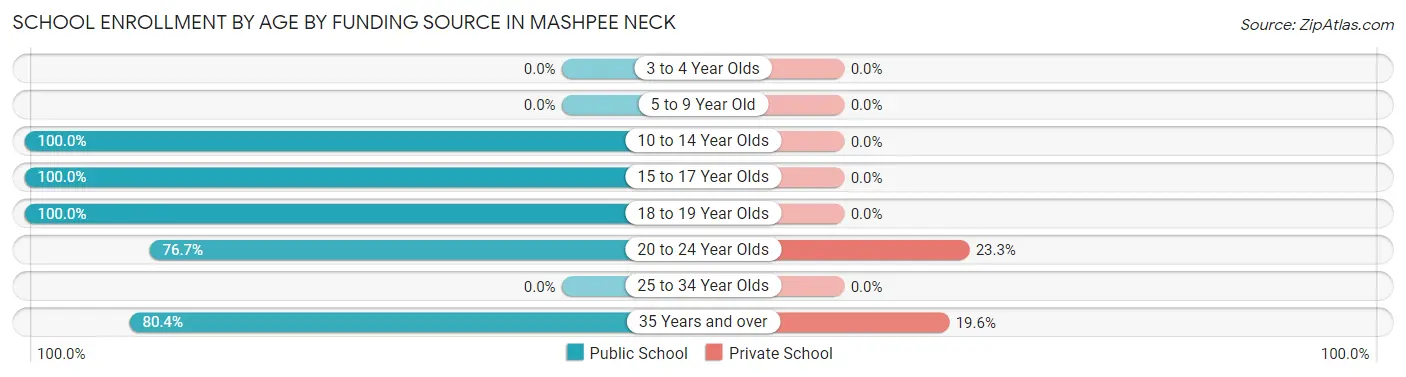
| Age Bracket | Public School | Private School |
| 3 to 4 Year Olds | 0 (0.0%) | 0 (0.0%) |
| 5 to 9 Year Old | 0 (0.0%) | 0 (0.0%) |
| 10 to 14 Year Olds | 72 (100.0%) | 0 (0.0%) |
| 15 to 17 Year Olds | 55 (100.0%) | 0 (0.0%) |
| 18 to 19 Year Olds | 58 (100.0%) | 0 (0.0%) |
| 20 to 24 Year Olds | 56 (76.7%) | 17 (23.3%) |
| 25 to 34 Year Olds | 0 (0.0%) | 0 (0.0%) |
| 35 Years and over | 37 (80.4%) | 9 (19.6%) |
| Total | 278 (91.4%) | 26 (8.6%) |
Educational Attainment by Field of Study in Mashpee Neck
Business (208 | 42.4%), psychology (60 | 12.2%), social sciences (57 | 11.6%), engineering (32 | 6.5%), and education (28 | 5.7%) are the most common fields of study among 491 individuals in Mashpee Neck who have obtained a bachelor's degree or higher.
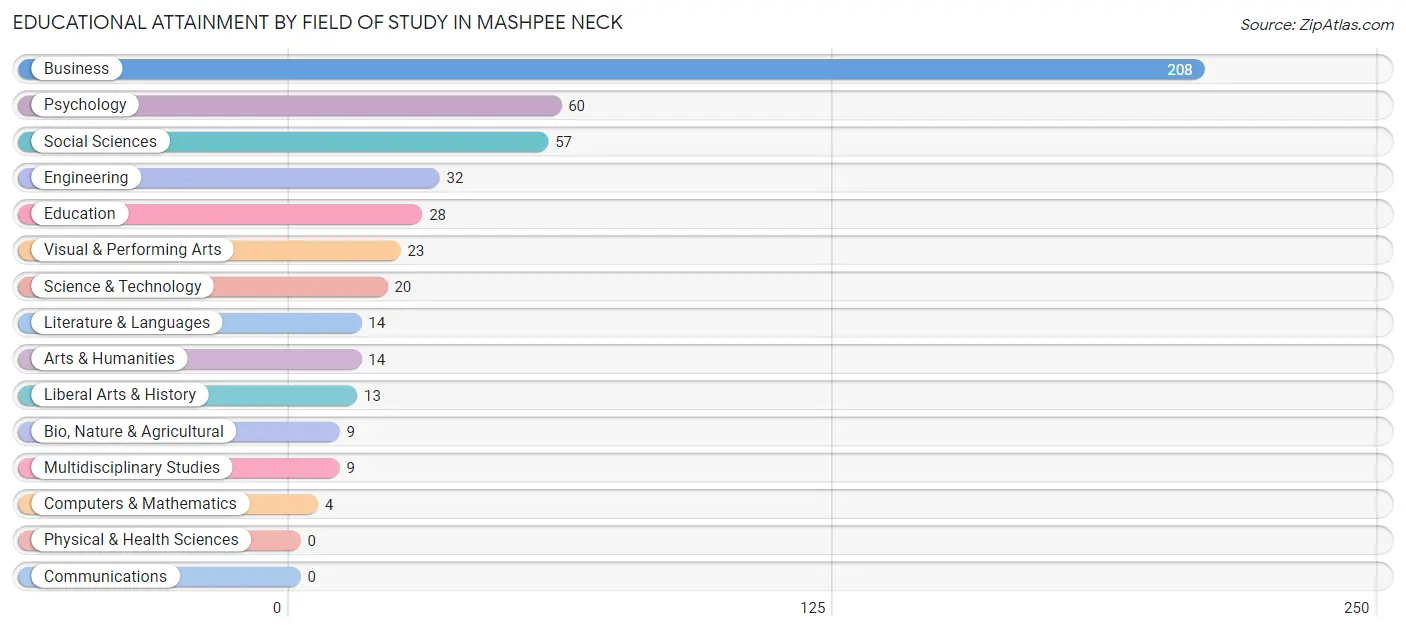
| Field of Study | # Graduates | % Graduates |
| Computers & Mathematics | 4 | 0.8% |
| Bio, Nature & Agricultural | 9 | 1.8% |
| Physical & Health Sciences | 0 | 0.0% |
| Psychology | 60 | 12.2% |
| Social Sciences | 57 | 11.6% |
| Engineering | 32 | 6.5% |
| Multidisciplinary Studies | 9 | 1.8% |
| Science & Technology | 20 | 4.1% |
| Business | 208 | 42.4% |
| Education | 28 | 5.7% |
| Literature & Languages | 14 | 2.9% |
| Liberal Arts & History | 13 | 2.6% |
| Visual & Performing Arts | 23 | 4.7% |
| Communications | 0 | 0.0% |
| Arts & Humanities | 14 | 2.9% |
| Total | 491 | 100.0% |
Transportation & Commute in Mashpee Neck
Vehicle Availability by Sex in Mashpee Neck
The most prevalent vehicle ownership categories in Mashpee Neck are males with 3 vehicles (137, accounting for 42.8%) and females with 3 vehicles (193, making up 40.1%).
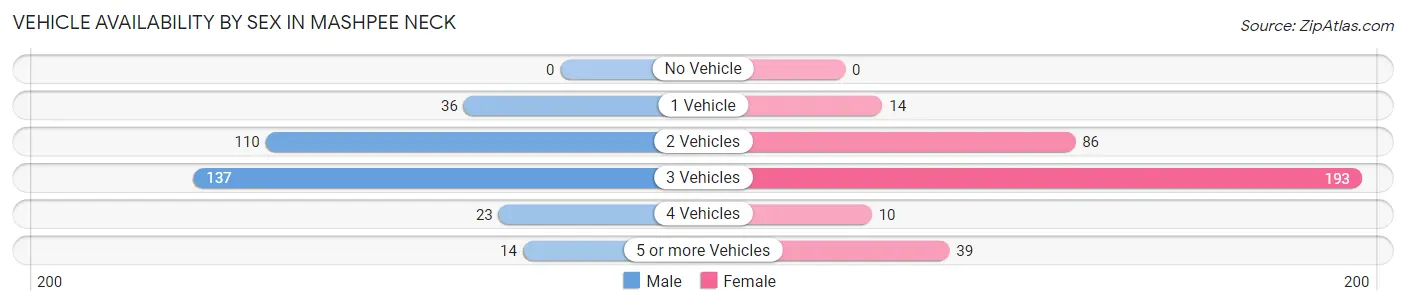
| Vehicles Available | Male | Female |
| No Vehicle | 0 (0.0%) | 0 (0.0%) |
| 1 Vehicle | 36 (11.3%) | 14 (4.1%) |
| 2 Vehicles | 110 (34.4%) | 86 (25.2%) |
| 3 Vehicles | 137 (42.8%) | 193 (56.4%) |
| 4 Vehicles | 23 (7.2%) | 10 (2.9%) |
| 5 or more Vehicles | 14 (4.4%) | 39 (11.4%) |
| Total | 320 (100.0%) | 342 (100.0%) |
Commute Time in Mashpee Neck
The most frequently occuring commute durations in Mashpee Neck are 10 to 14 minutes (169 commuters, 27.8%), 20 to 24 minutes (97 commuters, 15.9%), and 60 to 89 minutes (96 commuters, 15.8%).
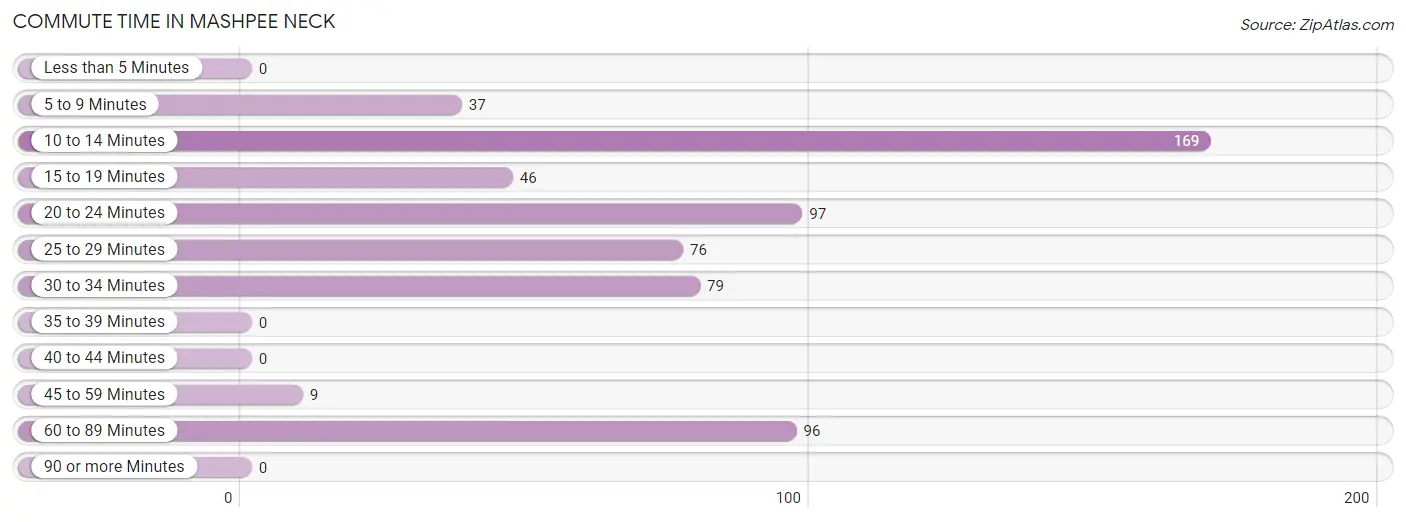
| Commute Time | # Commuters | % Commuters |
| Less than 5 Minutes | 0 | 0.0% |
| 5 to 9 Minutes | 37 | 6.1% |
| 10 to 14 Minutes | 169 | 27.8% |
| 15 to 19 Minutes | 46 | 7.5% |
| 20 to 24 Minutes | 97 | 15.9% |
| 25 to 29 Minutes | 76 | 12.5% |
| 30 to 34 Minutes | 79 | 13.0% |
| 35 to 39 Minutes | 0 | 0.0% |
| 40 to 44 Minutes | 0 | 0.0% |
| 45 to 59 Minutes | 9 | 1.5% |
| 60 to 89 Minutes | 96 | 15.8% |
| 90 or more Minutes | 0 | 0.0% |
Commute Time by Sex in Mashpee Neck
The most common commute times in Mashpee Neck are 25 to 29 minutes (58 commuters, 21.4%) for males and 10 to 14 minutes (133 commuters, 39.4%) for females.
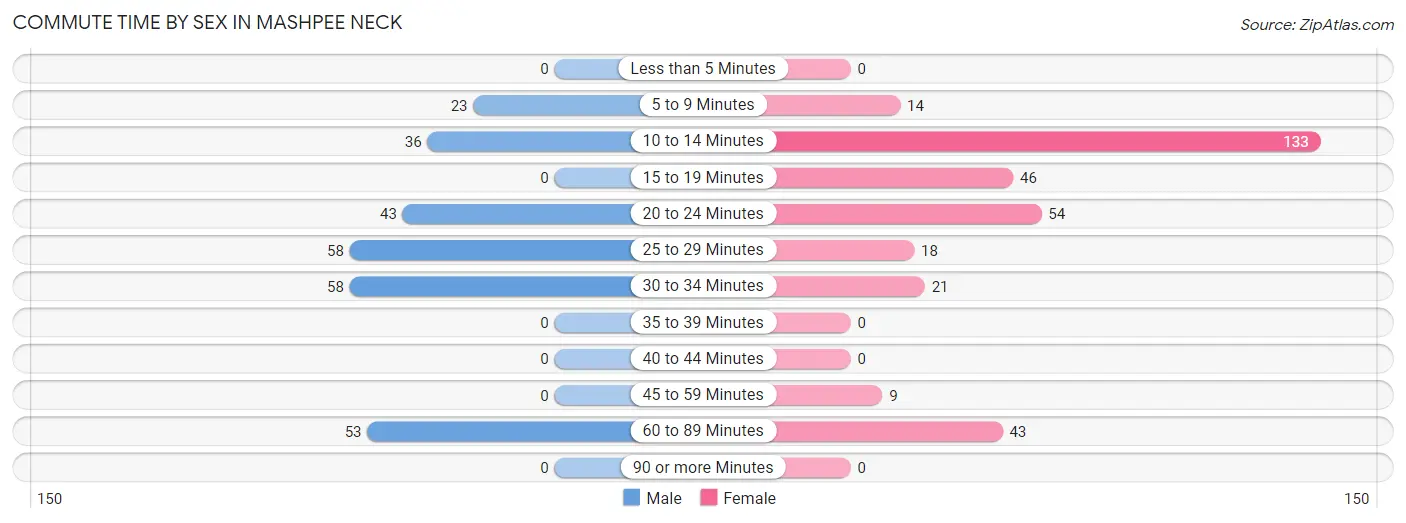
| Commute Time | Male | Female |
| Less than 5 Minutes | 0 (0.0%) | 0 (0.0%) |
| 5 to 9 Minutes | 23 (8.5%) | 14 (4.1%) |
| 10 to 14 Minutes | 36 (13.3%) | 133 (39.4%) |
| 15 to 19 Minutes | 0 (0.0%) | 46 (13.6%) |
| 20 to 24 Minutes | 43 (15.9%) | 54 (16.0%) |
| 25 to 29 Minutes | 58 (21.4%) | 18 (5.3%) |
| 30 to 34 Minutes | 58 (21.4%) | 21 (6.2%) |
| 35 to 39 Minutes | 0 (0.0%) | 0 (0.0%) |
| 40 to 44 Minutes | 0 (0.0%) | 0 (0.0%) |
| 45 to 59 Minutes | 0 (0.0%) | 9 (2.7%) |
| 60 to 89 Minutes | 53 (19.6%) | 43 (12.7%) |
| 90 or more Minutes | 0 (0.0%) | 0 (0.0%) |
Time of Departure to Work by Sex in Mashpee Neck
The most frequent times of departure to work in Mashpee Neck are 7:00 AM to 7:29 AM (49, 18.1%) for males and 9:00 AM to 9:59 AM (75, 22.2%) for females.
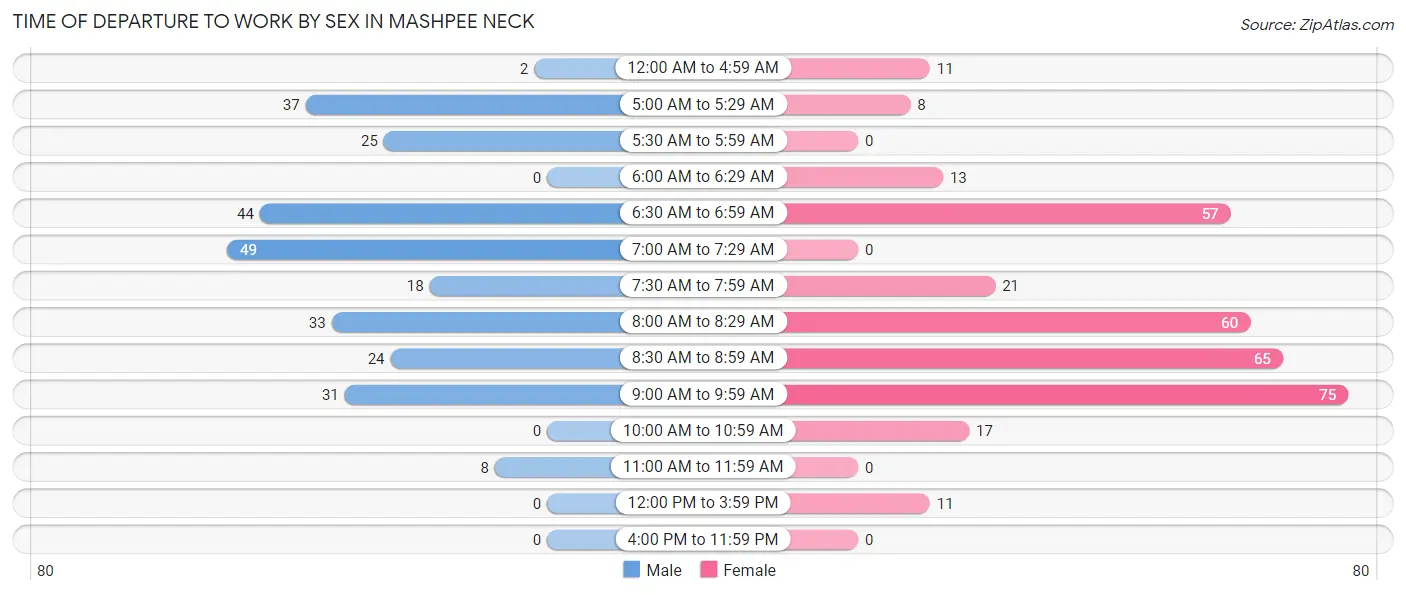
| Time of Departure | Male | Female |
| 12:00 AM to 4:59 AM | 2 (0.7%) | 11 (3.3%) |
| 5:00 AM to 5:29 AM | 37 (13.7%) | 8 (2.4%) |
| 5:30 AM to 5:59 AM | 25 (9.2%) | 0 (0.0%) |
| 6:00 AM to 6:29 AM | 0 (0.0%) | 13 (3.8%) |
| 6:30 AM to 6:59 AM | 44 (16.2%) | 57 (16.9%) |
| 7:00 AM to 7:29 AM | 49 (18.1%) | 0 (0.0%) |
| 7:30 AM to 7:59 AM | 18 (6.6%) | 21 (6.2%) |
| 8:00 AM to 8:29 AM | 33 (12.2%) | 60 (17.7%) |
| 8:30 AM to 8:59 AM | 24 (8.9%) | 65 (19.2%) |
| 9:00 AM to 9:59 AM | 31 (11.4%) | 75 (22.2%) |
| 10:00 AM to 10:59 AM | 0 (0.0%) | 17 (5.0%) |
| 11:00 AM to 11:59 AM | 8 (2.9%) | 0 (0.0%) |
| 12:00 PM to 3:59 PM | 0 (0.0%) | 11 (3.3%) |
| 4:00 PM to 11:59 PM | 0 (0.0%) | 0 (0.0%) |
| Total | 271 (100.0%) | 338 (100.0%) |
Housing Occupancy in Mashpee Neck
Occupancy by Ownership in Mashpee Neck
Of the total 489 dwellings in Mashpee Neck, owner-occupied units account for 489 (100.0%), while renter-occupied units make up 0 (0.0%).
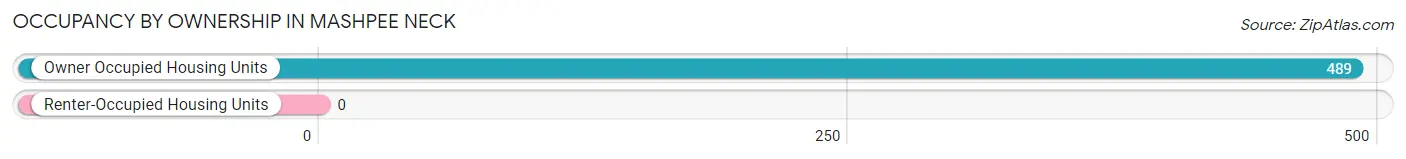
| Occupancy | # Housing Units | % Housing Units |
| Owner Occupied Housing Units | 489 | 100.0% |
| Renter-Occupied Housing Units | 0 | 0.0% |
| Total Occupied Housing Units | 489 | 100.0% |
Occupancy by Household Size in Mashpee Neck
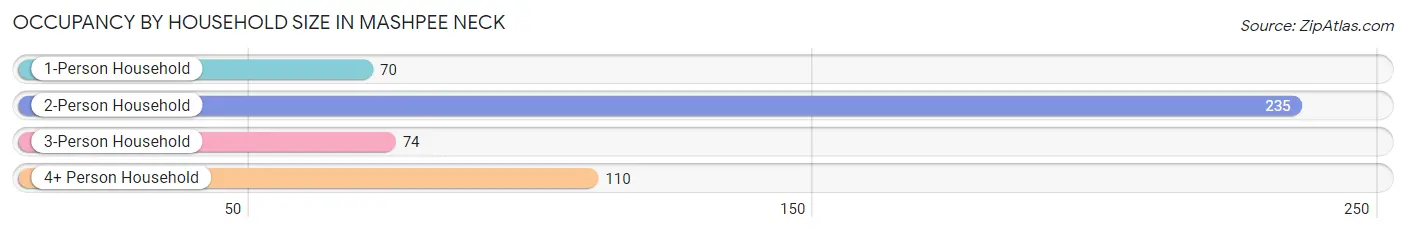
| Household Size | # Housing Units | % Housing Units |
| 1-Person Household | 70 | 14.3% |
| 2-Person Household | 235 | 48.1% |
| 3-Person Household | 74 | 15.1% |
| 4+ Person Household | 110 | 22.5% |
| Total Housing Units | 489 | 100.0% |
Occupancy by Ownership by Household Size in Mashpee Neck
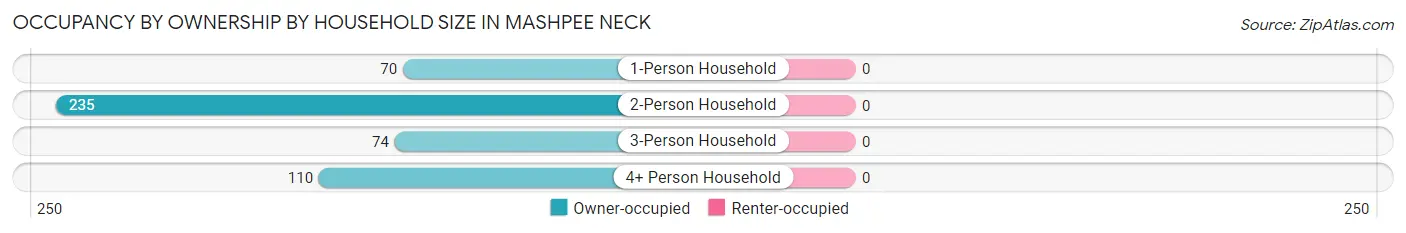
| Household Size | Owner-occupied | Renter-occupied |
| 1-Person Household | 70 (100.0%) | 0 (0.0%) |
| 2-Person Household | 235 (100.0%) | 0 (0.0%) |
| 3-Person Household | 74 (100.0%) | 0 (0.0%) |
| 4+ Person Household | 110 (100.0%) | 0 (0.0%) |
| Total Housing Units | 489 (100.0%) | 0 (0.0%) |
Occupancy by Educational Attainment in Mashpee Neck
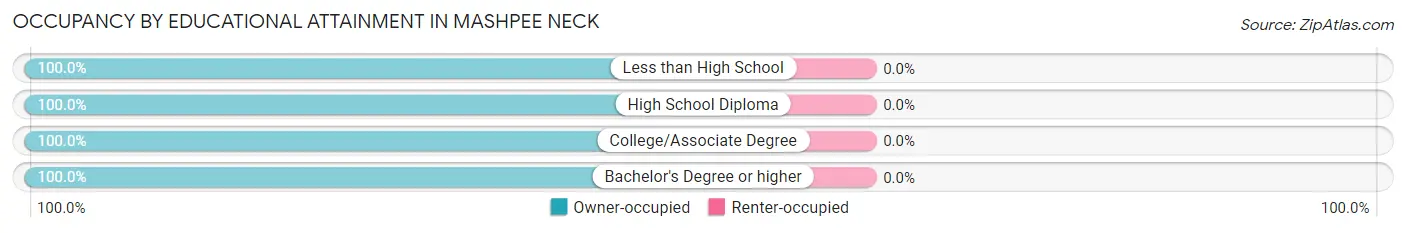
| Household Size | Owner-occupied | Renter-occupied |
| Less than High School | 24 (100.0%) | 0 (0.0%) |
| High School Diploma | 74 (100.0%) | 0 (0.0%) |
| College/Associate Degree | 129 (100.0%) | 0 (0.0%) |
| Bachelor's Degree or higher | 262 (100.0%) | 0 (0.0%) |
Occupancy by Age of Householder in Mashpee Neck
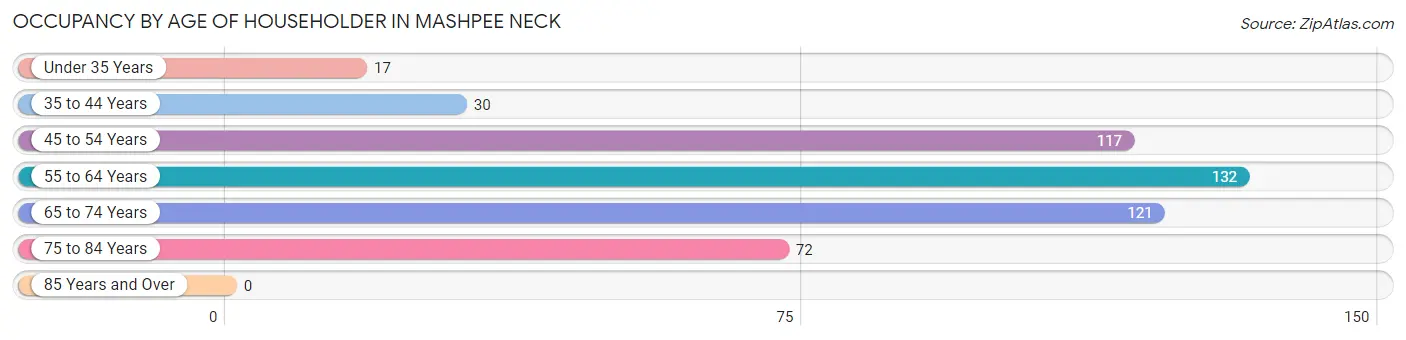
| Age Bracket | # Households | % Households |
| Under 35 Years | 17 | 3.5% |
| 35 to 44 Years | 30 | 6.1% |
| 45 to 54 Years | 117 | 23.9% |
| 55 to 64 Years | 132 | 27.0% |
| 65 to 74 Years | 121 | 24.7% |
| 75 to 84 Years | 72 | 14.7% |
| 85 Years and Over | 0 | 0.0% |
| Total | 489 | 100.0% |
Housing Finances in Mashpee Neck
Median Income by Occupancy in Mashpee Neck
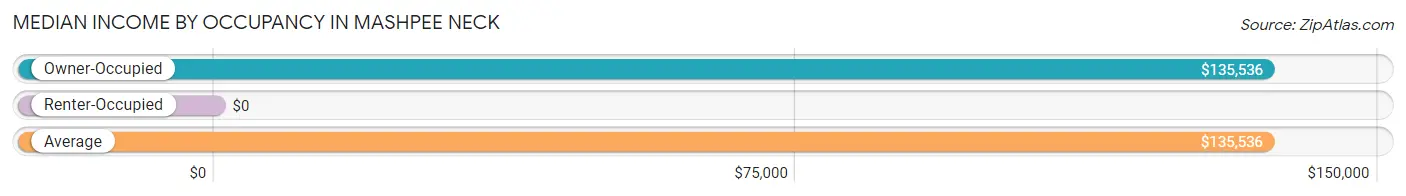
| Occupancy Type | # Households | Median Income |
| Owner-Occupied | 489 (100.0%) | $135,536 |
| Renter-Occupied | 0 (0.0%) | $0 |
| Average | 489 (100.0%) | $135,536 |
Occupancy by Householder Income Bracket in Mashpee Neck
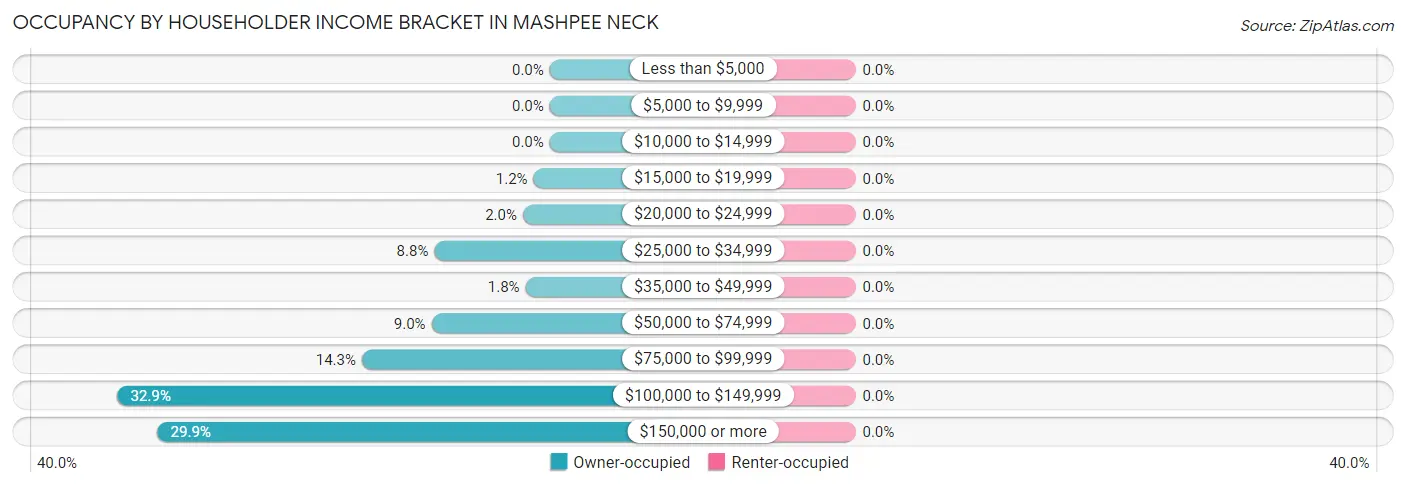
| Income Bracket | Owner-occupied | Renter-occupied |
| Less than $5,000 | 0 (0.0%) | 0 (0.0%) |
| $5,000 to $9,999 | 0 (0.0%) | 0 (0.0%) |
| $10,000 to $14,999 | 0 (0.0%) | 0 (0.0%) |
| $15,000 to $19,999 | 6 (1.2%) | 0 (0.0%) |
| $20,000 to $24,999 | 10 (2.0%) | 0 (0.0%) |
| $25,000 to $34,999 | 43 (8.8%) | 0 (0.0%) |
| $35,000 to $49,999 | 9 (1.8%) | 0 (0.0%) |
| $50,000 to $74,999 | 44 (9.0%) | 0 (0.0%) |
| $75,000 to $99,999 | 70 (14.3%) | 0 (0.0%) |
| $100,000 to $149,999 | 161 (32.9%) | 0 (0.0%) |
| $150,000 or more | 146 (29.9%) | 0 (0.0%) |
| Total | 489 (100.0%) | 0 (0.0%) |
Monthly Housing Cost Tiers in Mashpee Neck
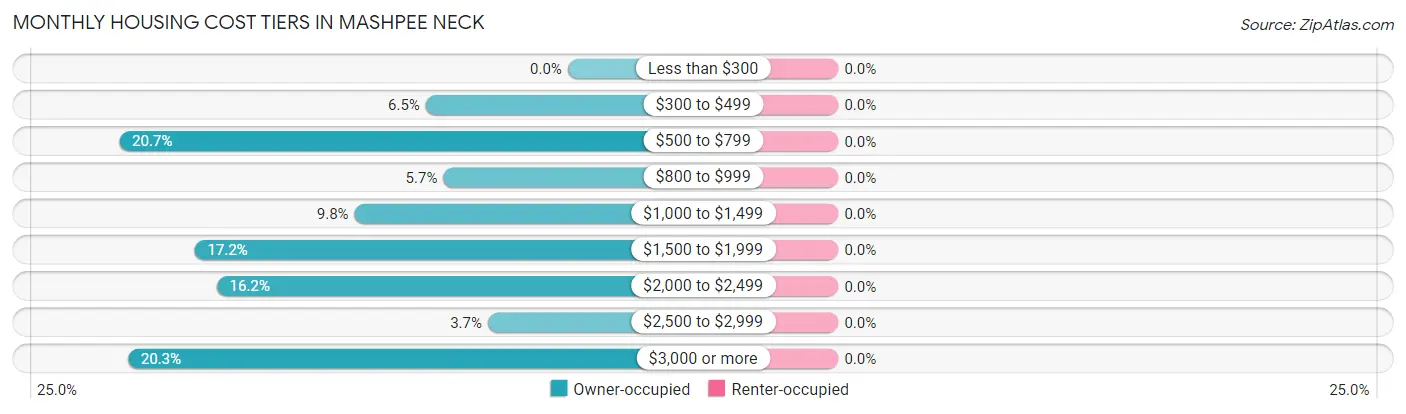
| Monthly Cost | Owner-occupied | Renter-occupied |
| Less than $300 | 0 (0.0%) | 0 (0.0%) |
| $300 to $499 | 32 (6.5%) | 0 (0.0%) |
| $500 to $799 | 101 (20.6%) | 0 (0.0%) |
| $800 to $999 | 28 (5.7%) | 0 (0.0%) |
| $1,000 to $1,499 | 48 (9.8%) | 0 (0.0%) |
| $1,500 to $1,999 | 84 (17.2%) | 0 (0.0%) |
| $2,000 to $2,499 | 79 (16.2%) | 0 (0.0%) |
| $2,500 to $2,999 | 18 (3.7%) | 0 (0.0%) |
| $3,000 or more | 99 (20.3%) | 0 (0.0%) |
| Total | 489 (100.0%) | 0 (0.0%) |
Physical Housing Characteristics in Mashpee Neck
Housing Structures in Mashpee Neck
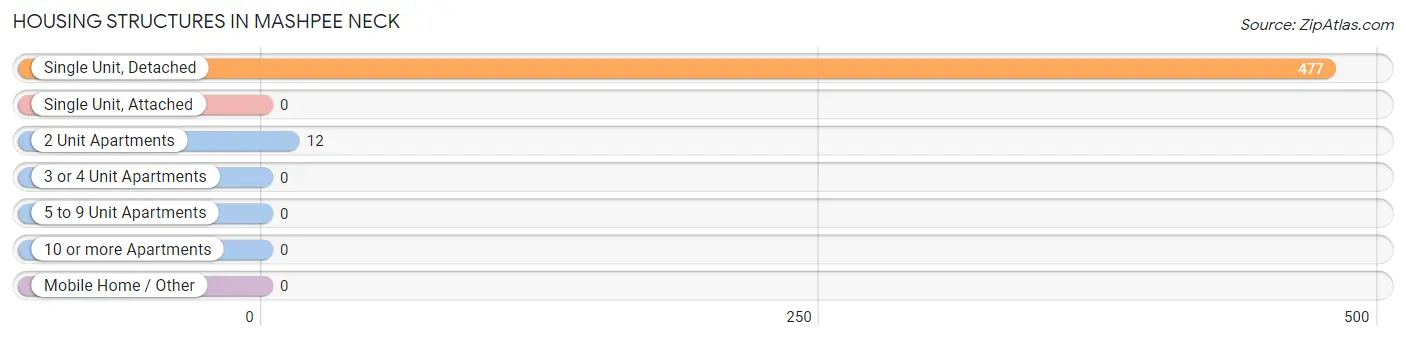
| Structure Type | # Housing Units | % Housing Units |
| Single Unit, Detached | 477 | 97.6% |
| Single Unit, Attached | 0 | 0.0% |
| 2 Unit Apartments | 12 | 2.5% |
| 3 or 4 Unit Apartments | 0 | 0.0% |
| 5 to 9 Unit Apartments | 0 | 0.0% |
| 10 or more Apartments | 0 | 0.0% |
| Mobile Home / Other | 0 | 0.0% |
| Total | 489 | 100.0% |
Housing Structures by Occupancy in Mashpee Neck
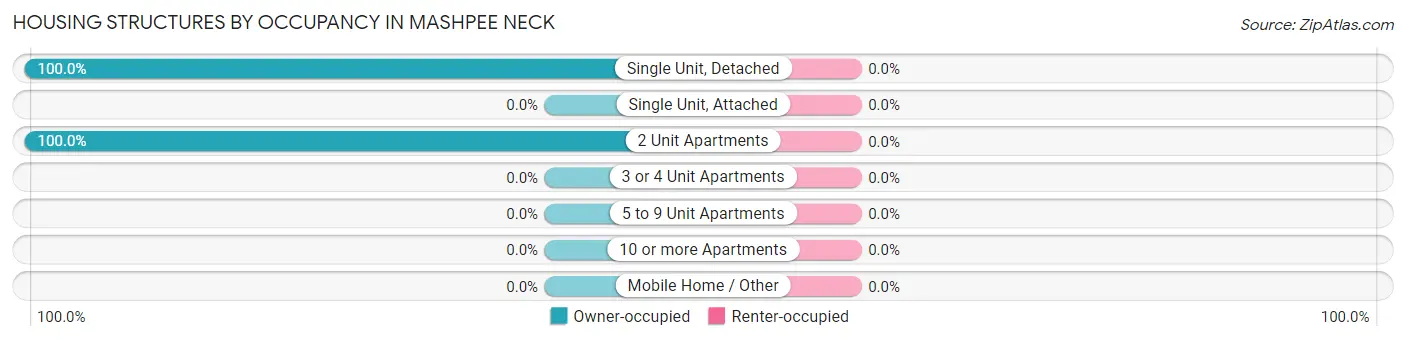
| Structure Type | Owner-occupied | Renter-occupied |
| Single Unit, Detached | 477 (100.0%) | 0 (0.0%) |
| Single Unit, Attached | 0 (0.0%) | 0 (0.0%) |
| 2 Unit Apartments | 12 (100.0%) | 0 (0.0%) |
| 3 or 4 Unit Apartments | 0 (0.0%) | 0 (0.0%) |
| 5 to 9 Unit Apartments | 0 (0.0%) | 0 (0.0%) |
| 10 or more Apartments | 0 (0.0%) | 0 (0.0%) |
| Mobile Home / Other | 0 (0.0%) | 0 (0.0%) |
| Total | 489 (100.0%) | 0 (0.0%) |
Housing Structures by Number of Rooms in Mashpee Neck
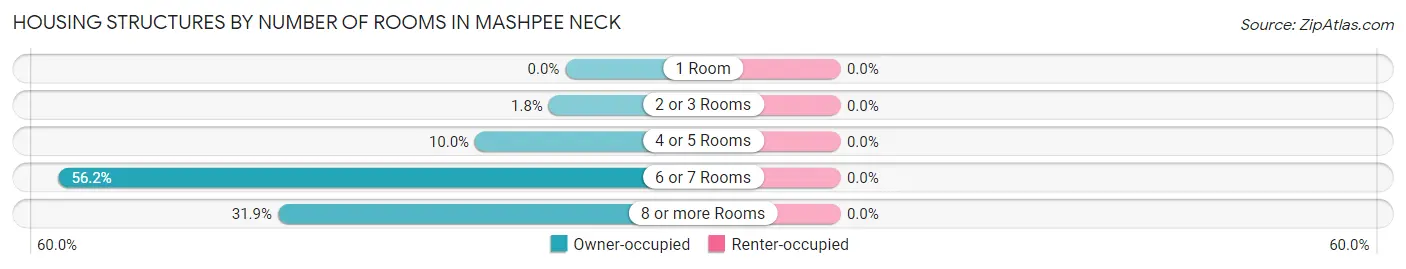
| Number of Rooms | Owner-occupied | Renter-occupied |
| 1 Room | 0 (0.0%) | 0 (0.0%) |
| 2 or 3 Rooms | 9 (1.8%) | 0 (0.0%) |
| 4 or 5 Rooms | 49 (10.0%) | 0 (0.0%) |
| 6 or 7 Rooms | 275 (56.2%) | 0 (0.0%) |
| 8 or more Rooms | 156 (31.9%) | 0 (0.0%) |
| Total | 489 (100.0%) | 0 (0.0%) |
Housing Structure by Heating Type in Mashpee Neck
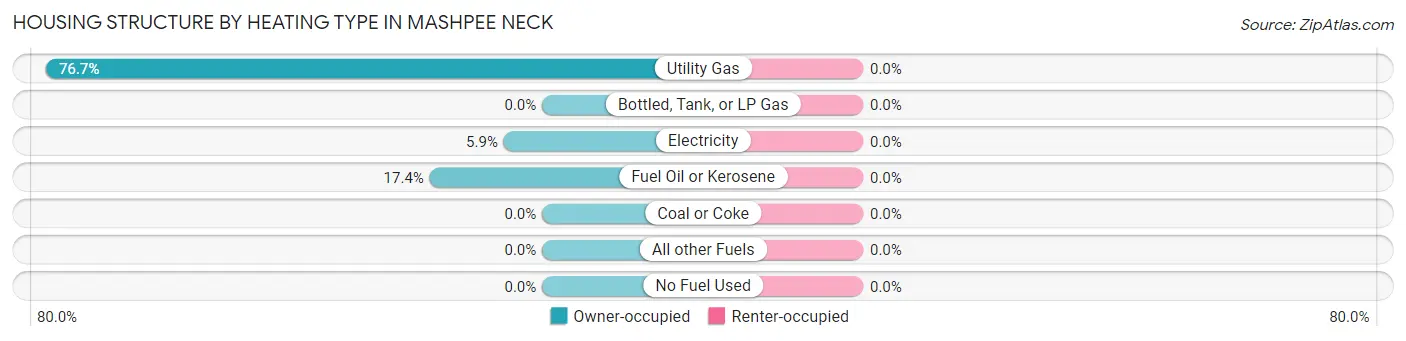
| Heating Type | Owner-occupied | Renter-occupied |
| Utility Gas | 375 (76.7%) | 0 (0.0%) |
| Bottled, Tank, or LP Gas | 0 (0.0%) | 0 (0.0%) |
| Electricity | 29 (5.9%) | 0 (0.0%) |
| Fuel Oil or Kerosene | 85 (17.4%) | 0 (0.0%) |
| Coal or Coke | 0 (0.0%) | 0 (0.0%) |
| All other Fuels | 0 (0.0%) | 0 (0.0%) |
| No Fuel Used | 0 (0.0%) | 0 (0.0%) |
| Total | 489 (100.0%) | 0 (0.0%) |
Household Vehicle Usage in Mashpee Neck
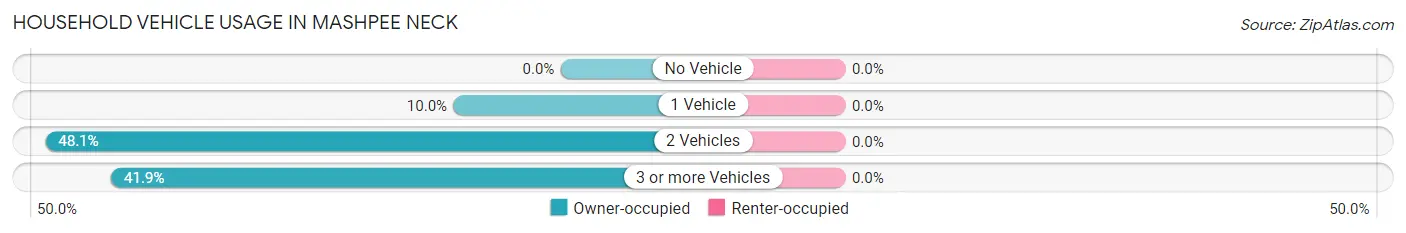
| Vehicles per Household | Owner-occupied | Renter-occupied |
| No Vehicle | 0 (0.0%) | 0 (0.0%) |
| 1 Vehicle | 49 (10.0%) | 0 (0.0%) |
| 2 Vehicles | 235 (48.1%) | 0 (0.0%) |
| 3 or more Vehicles | 205 (41.9%) | 0 (0.0%) |
| Total | 489 (100.0%) | 0 (0.0%) |
Real Estate & Mortgages in Mashpee Neck
Real Estate and Mortgage Overview in Mashpee Neck
| Characteristic | Without Mortgage | With Mortgage |
| Housing Units | 237 | 252 |
| Median Property Value | $559,200 | $509,100 |
| Median Household Income | $127,917 | $96 |
| Monthly Housing Costs | $685 | $90 |
| Real Estate Taxes | $4,561 | $0 |
Property Value by Mortgage Status in Mashpee Neck
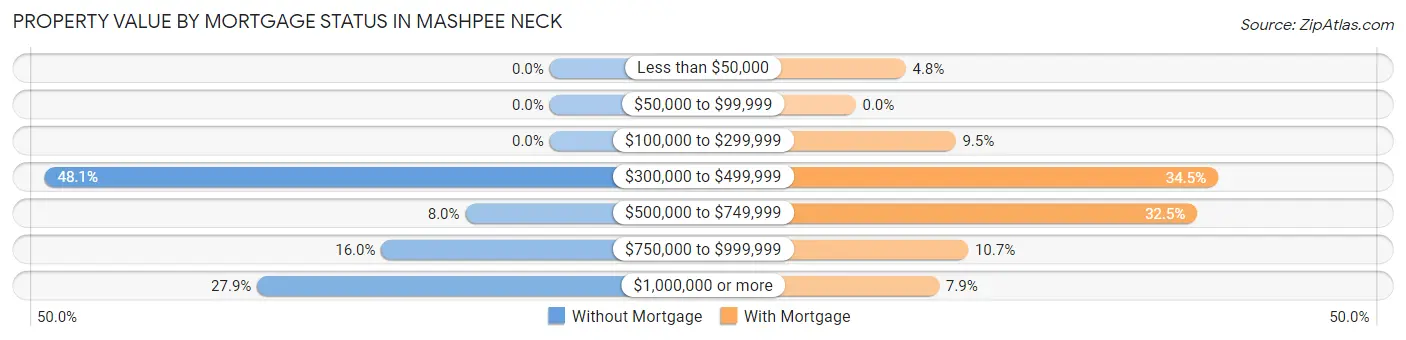
| Property Value | Without Mortgage | With Mortgage |
| Less than $50,000 | 0 (0.0%) | 12 (4.8%) |
| $50,000 to $99,999 | 0 (0.0%) | 0 (0.0%) |
| $100,000 to $299,999 | 0 (0.0%) | 24 (9.5%) |
| $300,000 to $499,999 | 114 (48.1%) | 87 (34.5%) |
| $500,000 to $749,999 | 19 (8.0%) | 82 (32.5%) |
| $750,000 to $999,999 | 38 (16.0%) | 27 (10.7%) |
| $1,000,000 or more | 66 (27.9%) | 20 (7.9%) |
| Total | 237 (100.0%) | 252 (100.0%) |
Household Income by Mortgage Status in Mashpee Neck
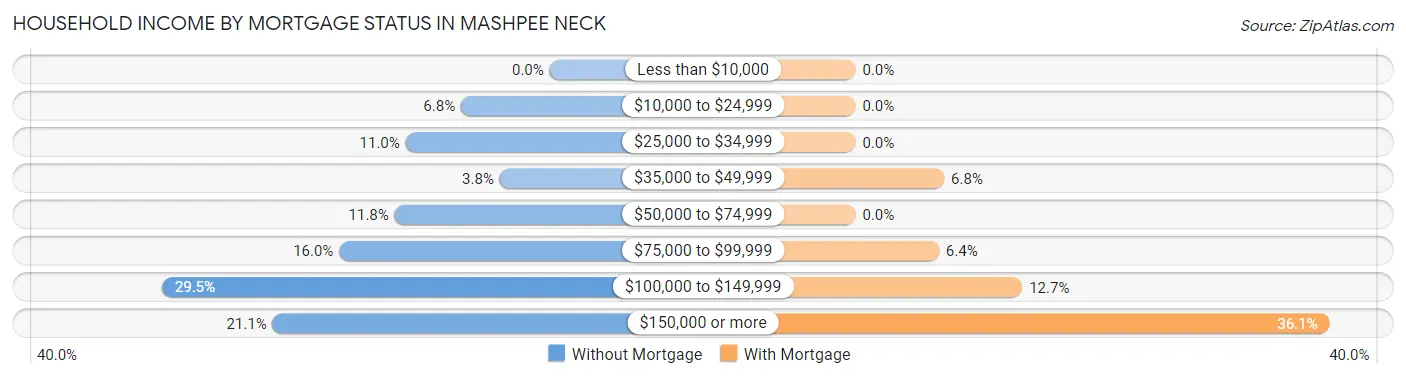
| Household Income | Without Mortgage | With Mortgage |
| Less than $10,000 | 0 (0.0%) | 0 (0.0%) |
| $10,000 to $24,999 | 16 (6.8%) | 0 (0.0%) |
| $25,000 to $34,999 | 26 (11.0%) | 0 (0.0%) |
| $35,000 to $49,999 | 9 (3.8%) | 17 (6.8%) |
| $50,000 to $74,999 | 28 (11.8%) | 0 (0.0%) |
| $75,000 to $99,999 | 38 (16.0%) | 16 (6.4%) |
| $100,000 to $149,999 | 70 (29.5%) | 32 (12.7%) |
| $150,000 or more | 50 (21.1%) | 91 (36.1%) |
| Total | 237 (100.0%) | 252 (100.0%) |
Property Value to Household Income Ratio in Mashpee Neck
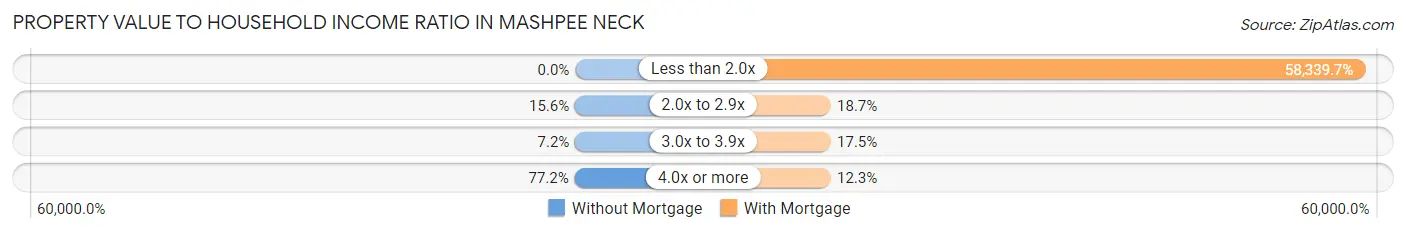
| Value-to-Income Ratio | Without Mortgage | With Mortgage |
| Less than 2.0x | 0 (0.0%) | 147,016 (58,339.7%) |
| 2.0x to 2.9x | 37 (15.6%) | 47 (18.6%) |
| 3.0x to 3.9x | 17 (7.2%) | 44 (17.5%) |
| 4.0x or more | 183 (77.2%) | 31 (12.3%) |
| Total | 237 (100.0%) | 252 (100.0%) |
Real Estate Taxes by Mortgage Status in Mashpee Neck
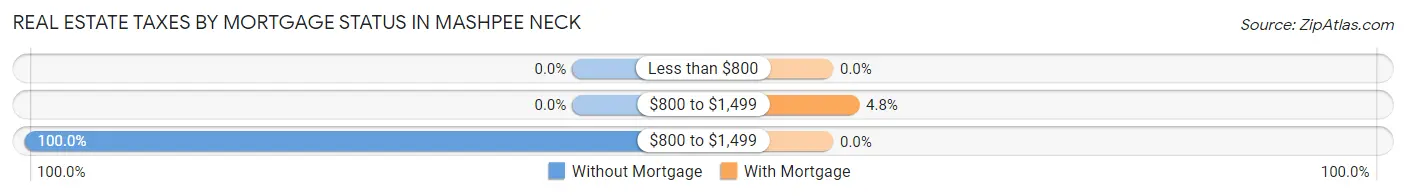
| Property Taxes | Without Mortgage | With Mortgage |
| Less than $800 | 0 (0.0%) | 0 (0.0%) |
| $800 to $1,499 | 0 (0.0%) | 12 (4.8%) |
| $800 to $1,499 | 237 (100.0%) | 0 (0.0%) |
| Total | 237 (100.0%) | 252 (100.0%) |
Health & Disability in Mashpee Neck
Health Insurance Coverage by Age in Mashpee Neck
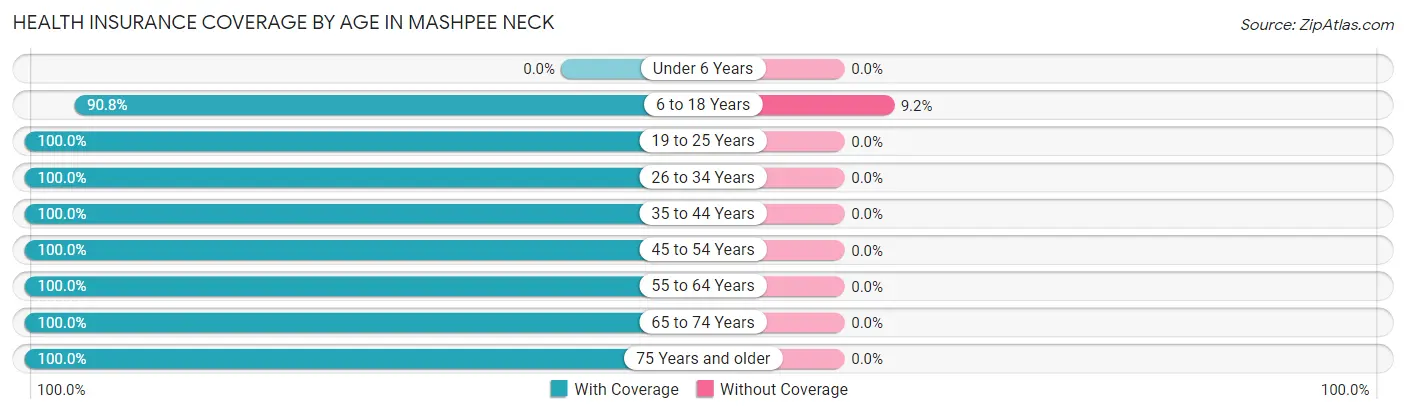
| Age Bracket | With Coverage | Without Coverage |
| Under 6 Years | 0 (0.0%) | 0 (0.0%) |
| 6 to 18 Years | 187 (90.8%) | 19 (9.2%) |
| 19 to 25 Years | 113 (100.0%) | 0 (0.0%) |
| 26 to 34 Years | 17 (100.0%) | 0 (0.0%) |
| 35 to 44 Years | 108 (100.0%) | 0 (0.0%) |
| 45 to 54 Years | 204 (100.0%) | 0 (0.0%) |
| 55 to 64 Years | 284 (100.0%) | 0 (0.0%) |
| 65 to 74 Years | 238 (100.0%) | 0 (0.0%) |
| 75 Years and older | 100 (100.0%) | 0 (0.0%) |
| Total | 1,251 (98.5%) | 19 (1.5%) |
Health Insurance Coverage by Citizenship Status in Mashpee Neck
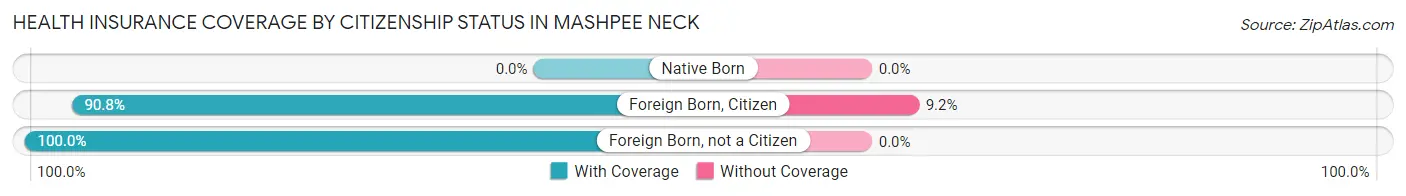
| Citizenship Status | With Coverage | Without Coverage |
| Native Born | 0 (0.0%) | 0 (0.0%) |
| Foreign Born, Citizen | 187 (90.8%) | 19 (9.2%) |
| Foreign Born, not a Citizen | 113 (100.0%) | 0 (0.0%) |
Health Insurance Coverage by Household Income in Mashpee Neck
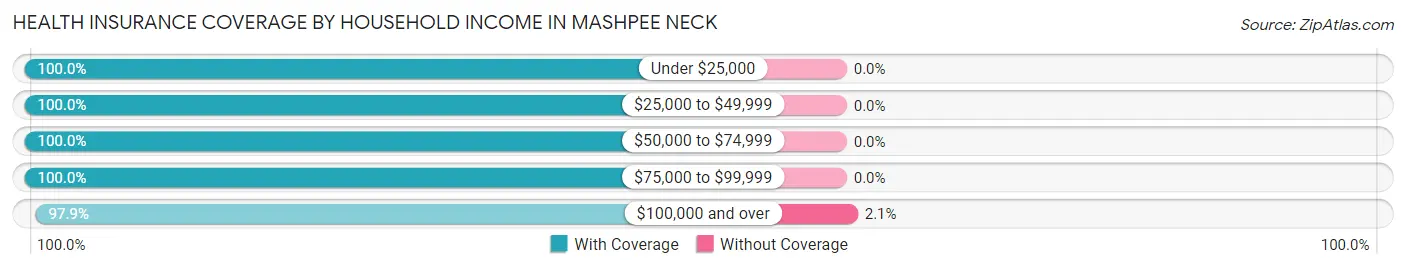
| Household Income | With Coverage | Without Coverage |
| Under $25,000 | 16 (100.0%) | 0 (0.0%) |
| $25,000 to $49,999 | 77 (100.0%) | 0 (0.0%) |
| $50,000 to $74,999 | 70 (100.0%) | 0 (0.0%) |
| $75,000 to $99,999 | 181 (100.0%) | 0 (0.0%) |
| $100,000 and over | 902 (97.9%) | 19 (2.1%) |
Public vs Private Health Insurance Coverage by Age in Mashpee Neck
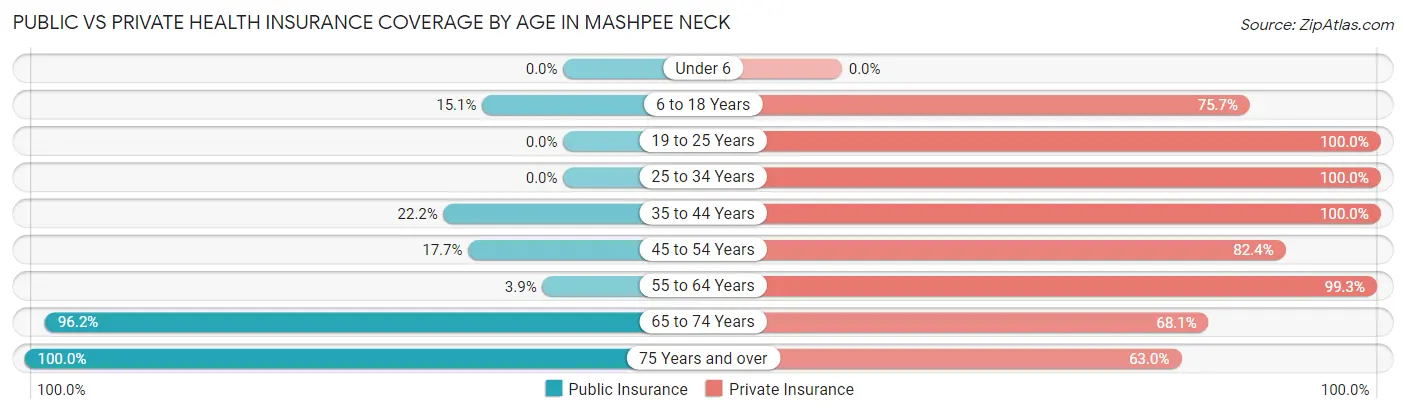
| Age Bracket | Public Insurance | Private Insurance |
| Under 6 | 0 (0.0%) | 0 (0.0%) |
| 6 to 18 Years | 31 (15.0%) | 156 (75.7%) |
| 19 to 25 Years | 0 (0.0%) | 113 (100.0%) |
| 25 to 34 Years | 0 (0.0%) | 17 (100.0%) |
| 35 to 44 Years | 24 (22.2%) | 108 (100.0%) |
| 45 to 54 Years | 36 (17.6%) | 168 (82.4%) |
| 55 to 64 Years | 11 (3.9%) | 282 (99.3%) |
| 65 to 74 Years | 229 (96.2%) | 162 (68.1%) |
| 75 Years and over | 100 (100.0%) | 63 (63.0%) |
| Total | 431 (33.9%) | 1,069 (84.2%) |
Disability Status by Sex by Age in Mashpee Neck
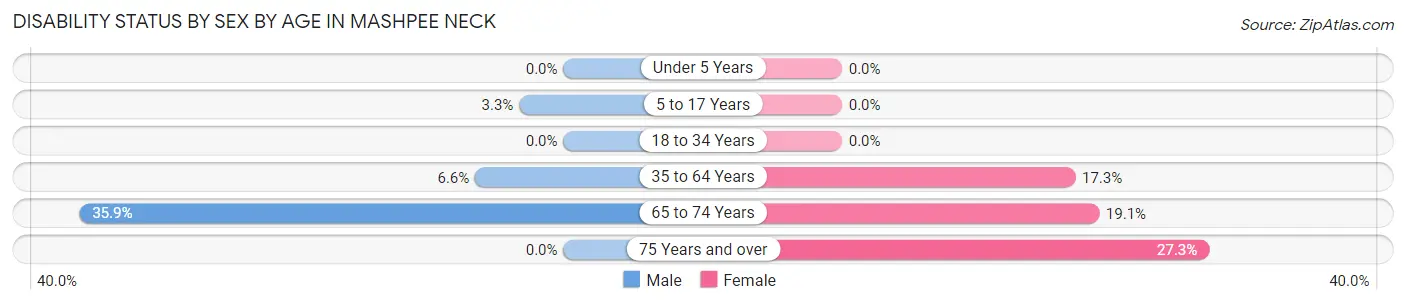
| Age Bracket | Male | Female |
| Under 5 Years | 0 (0.0%) | 0 (0.0%) |
| 5 to 17 Years | 2 (3.3%) | 0 (0.0%) |
| 18 to 34 Years | 0 (0.0%) | 0 (0.0%) |
| 35 to 64 Years | 19 (6.6%) | 53 (17.3%) |
| 65 to 74 Years | 46 (35.9%) | 21 (19.1%) |
| 75 Years and over | 0 (0.0%) | 9 (27.3%) |
Disability Class by Sex by Age in Mashpee Neck
Disability Class: Hearing Difficulty
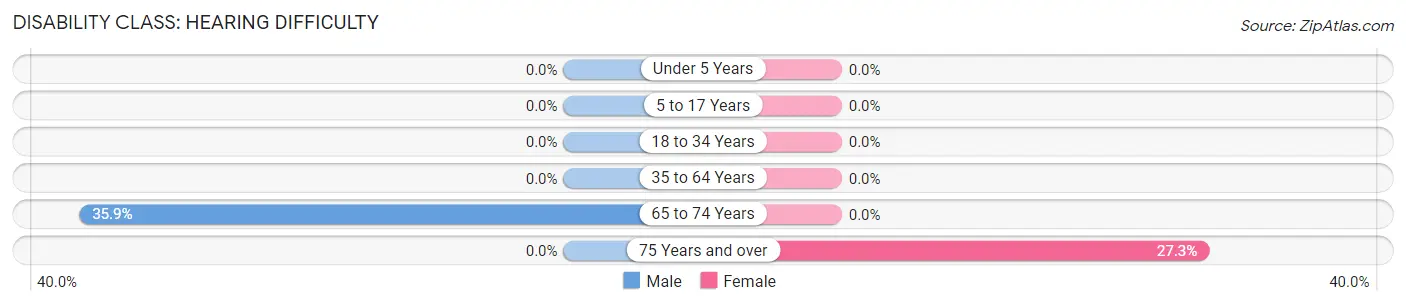
| Age Bracket | Male | Female |
| Under 5 Years | 0 (0.0%) | 0 (0.0%) |
| 5 to 17 Years | 0 (0.0%) | 0 (0.0%) |
| 18 to 34 Years | 0 (0.0%) | 0 (0.0%) |
| 35 to 64 Years | 0 (0.0%) | 0 (0.0%) |
| 65 to 74 Years | 46 (35.9%) | 0 (0.0%) |
| 75 Years and over | 0 (0.0%) | 9 (27.3%) |
Disability Class: Vision Difficulty
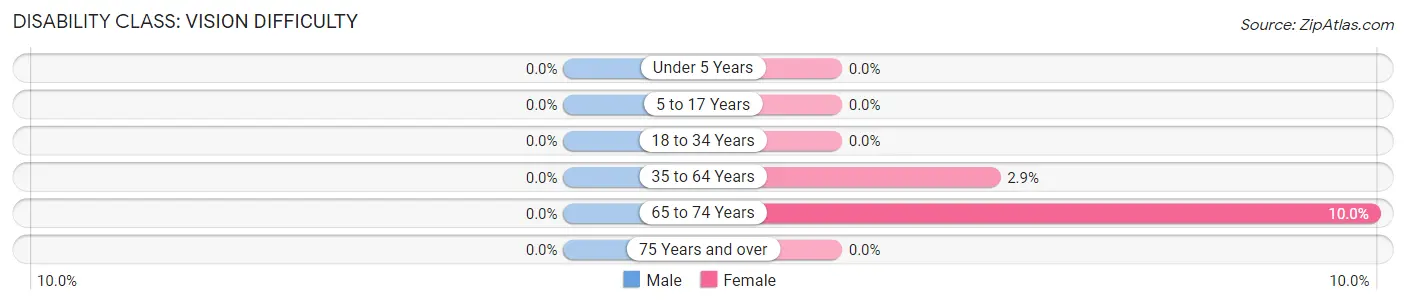
| Age Bracket | Male | Female |
| Under 5 Years | 0 (0.0%) | 0 (0.0%) |
| 5 to 17 Years | 0 (0.0%) | 0 (0.0%) |
| 18 to 34 Years | 0 (0.0%) | 0 (0.0%) |
| 35 to 64 Years | 0 (0.0%) | 9 (2.9%) |
| 65 to 74 Years | 0 (0.0%) | 11 (10.0%) |
| 75 Years and over | 0 (0.0%) | 0 (0.0%) |
Disability Class: Cognitive Difficulty
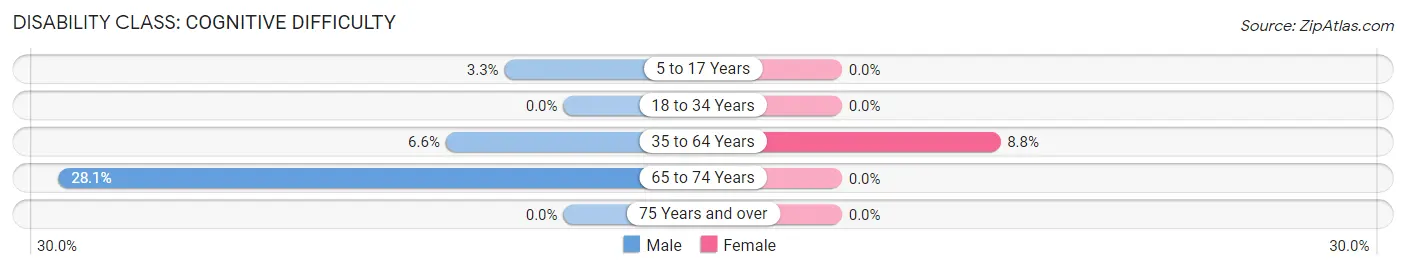
| Age Bracket | Male | Female |
| 5 to 17 Years | 2 (3.3%) | 0 (0.0%) |
| 18 to 34 Years | 0 (0.0%) | 0 (0.0%) |
| 35 to 64 Years | 19 (6.6%) | 27 (8.8%) |
| 65 to 74 Years | 36 (28.1%) | 0 (0.0%) |
| 75 Years and over | 0 (0.0%) | 0 (0.0%) |
Disability Class: Ambulatory Difficulty
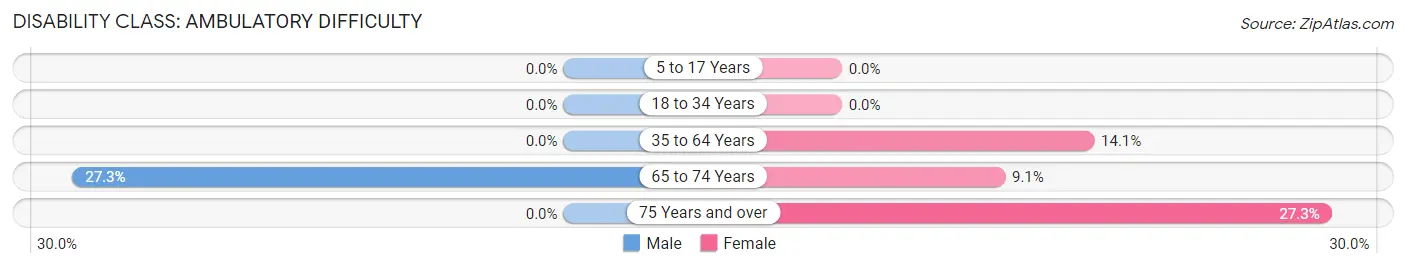
| Age Bracket | Male | Female |
| 5 to 17 Years | 0 (0.0%) | 0 (0.0%) |
| 18 to 34 Years | 0 (0.0%) | 0 (0.0%) |
| 35 to 64 Years | 0 (0.0%) | 43 (14.1%) |
| 65 to 74 Years | 35 (27.3%) | 10 (9.1%) |
| 75 Years and over | 0 (0.0%) | 9 (27.3%) |
Disability Class: Self-Care Difficulty
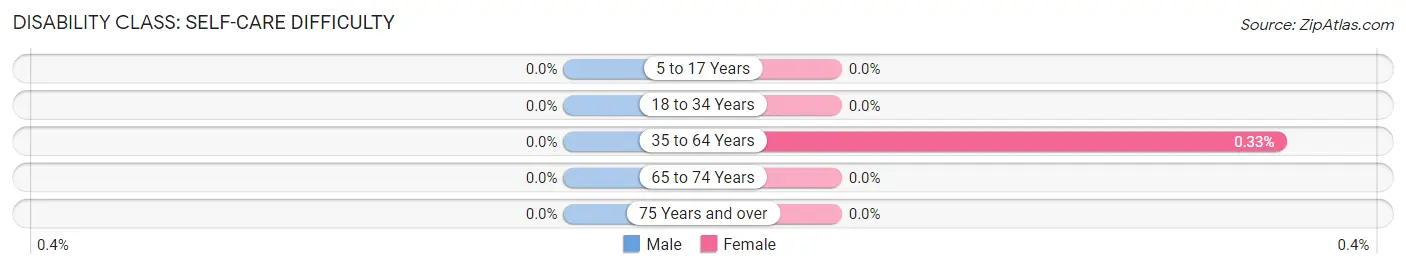
| Age Bracket | Male | Female |
| 5 to 17 Years | 0 (0.0%) | 0 (0.0%) |
| 18 to 34 Years | 0 (0.0%) | 0 (0.0%) |
| 35 to 64 Years | 0 (0.0%) | 1 (0.3%) |
| 65 to 74 Years | 0 (0.0%) | 0 (0.0%) |
| 75 Years and over | 0 (0.0%) | 0 (0.0%) |
Technology Access in Mashpee Neck
Computing Device Access in Mashpee Neck
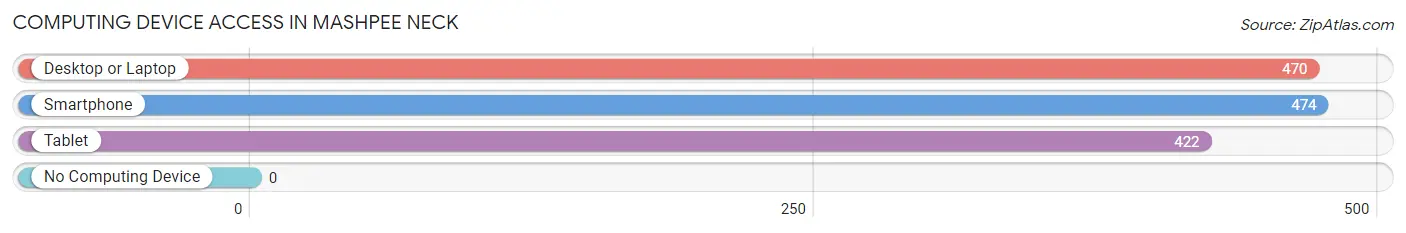
| Device Type | # Households | % Households |
| Desktop or Laptop | 470 | 96.1% |
| Smartphone | 474 | 96.9% |
| Tablet | 422 | 86.3% |
| No Computing Device | 0 | 0.0% |
| Total | 489 | 100.0% |
Internet Access in Mashpee Neck
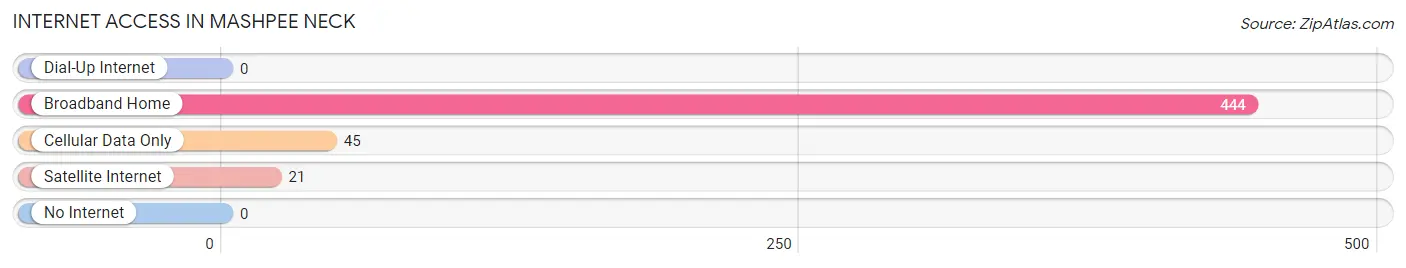
| Internet Type | # Households | % Households |
| Dial-Up Internet | 0 | 0.0% |
| Broadband Home | 444 | 90.8% |
| Cellular Data Only | 45 | 9.2% |
| Satellite Internet | 21 | 4.3% |
| No Internet | 0 | 0.0% |
| Total | 489 | 100.0% |
Mashpee Neck Summary
Mashpee Neck is a small peninsula located in the town of Mashpee, Massachusetts, on the south shore of Cape Cod. It is bordered by the towns of Falmouth and Sandwich to the north and east, respectively, and by Nantucket Sound to the south. The peninsula is home to the Mashpee Wampanoag Tribe, a federally recognized Native American tribe.
Geography
Mashpee Neck is located in southeastern Massachusetts, on the south shore of Cape Cod. It is bordered by the towns of Falmouth and Sandwich to the north and east, respectively, and by Nantucket Sound to the south. The peninsula is approximately 4.5 miles long and 1.5 miles wide, with a total area of 6.3 square miles. The highest point on the peninsula is the summit of Mashpee Hill, which rises to an elevation of 140 feet above sea level.
The peninsula is composed of a variety of habitats, including salt marshes, freshwater wetlands, woodlands, and grasslands. The Mashpee River flows through the center of the peninsula, and there are several small ponds and lakes scattered throughout the area.
History
Mashpee Neck has been inhabited by Native Americans for thousands of years. The area was originally inhabited by the Wampanoag people, who were part of the Algonquian-speaking peoples of the region. The Wampanoag people were the first to encounter the English settlers who arrived in the area in the 1620s.
In 1658, the Wampanoag people signed a treaty with the English settlers, granting them rights to the land. In 1660, the town of Mashpee was incorporated, and the Wampanoag people were granted a reservation on the peninsula. The reservation was later expanded to include the entire peninsula.
In the late 19th century, the Mashpee Wampanoag Tribe was officially recognized by the federal government as a sovereign nation. In 2007, the tribe was granted federal recognition, which allowed them to establish their own government and to pursue economic development opportunities.
Economy
Mashpee Neck is primarily a residential area, with a small commercial sector. The Mashpee Wampanoag Tribe operates a number of businesses on the peninsula, including a casino, a hotel, and a retail center. The tribe also operates a number of cultural and educational programs, as well as a museum.
The peninsula is also home to a number of small businesses, including restaurants, shops, and art galleries. The Mashpee Commons shopping center is located on the peninsula, and there are several marinas and boatyards in the area.
Demographics
As of the 2010 census, the population of Mashpee Neck was 2,845. The median age of the population was 44.7 years, and the median household income was $63,917. The population was predominantly white (90.2%), with a small percentage of Native American (3.2%) and African American (2.2%) residents.
Conclusion
Mashpee Neck is a small peninsula located in the town of Mashpee, Massachusetts, on the south shore of Cape Cod. It is home to the Mashpee Wampanoag Tribe, a federally recognized Native American tribe. The peninsula is composed of a variety of habitats, including salt marshes, freshwater wetlands, woodlands, and grasslands. The Mashpee Wampanoag Tribe operates a number of businesses on the peninsula, and there are several small businesses in the area. As of the 2010 census, the population of Mashpee Neck was 2,845, with a median age of 44.7 years and a median household income of $63,917.
Common Questions
What is Per Capita Income in Mashpee Neck?
Per Capita income in Mashpee Neck is $73,051.
What is the Median Family Income in Mashpee Neck?
Median Family Income in Mashpee Neck is $146,532.
What is the Median Household income in Mashpee Neck?
Median Household Income in Mashpee Neck is $135,536.
What is Income or Wage Gap in Mashpee Neck?
Income or Wage Gap in Mashpee Neck is 59.3%.
Women in Mashpee Neck earn 40.7 cents for every dollar earned by a man.
What is Inequality or Gini Index in Mashpee Neck?
Inequality or Gini Index in Mashpee Neck is 0.51.
What is the Total Population of Mashpee Neck?
Total Population of Mashpee Neck is 1,270.
What is the Total Male Population of Mashpee Neck?
Total Male Population of Mashpee Neck is 604.
What is the Total Female Population of Mashpee Neck?
Total Female Population of Mashpee Neck is 666.
What is the Ratio of Males per 100 Females in Mashpee Neck?
There are 90.69 Males per 100 Females in Mashpee Neck.
What is the Ratio of Females per 100 Males in Mashpee Neck?
There are 110.26 Females per 100 Males in Mashpee Neck.
What is the Median Population Age in Mashpee Neck?
Median Population Age in Mashpee Neck is 53.0 Years.
What is the Average Family Size in Mashpee Neck
Average Family Size in Mashpee Neck is 2.8 People.
What is the Average Household Size in Mashpee Neck
Average Household Size in Mashpee Neck is 2.6 People.
How Large is the Labor Force in Mashpee Neck?
There are 682 People in the Labor Forcein in Mashpee Neck.
What is the Percentage of People in the Labor Force in Mashpee Neck?
56.9% of People are in the Labor Force in Mashpee Neck.
What is the Unemployment Rate in Mashpee Neck?
Unemployment Rate in Mashpee Neck is 2.6%.