Mattapoisett Center, MA Map & Demographics
Mattapoisett Center Map
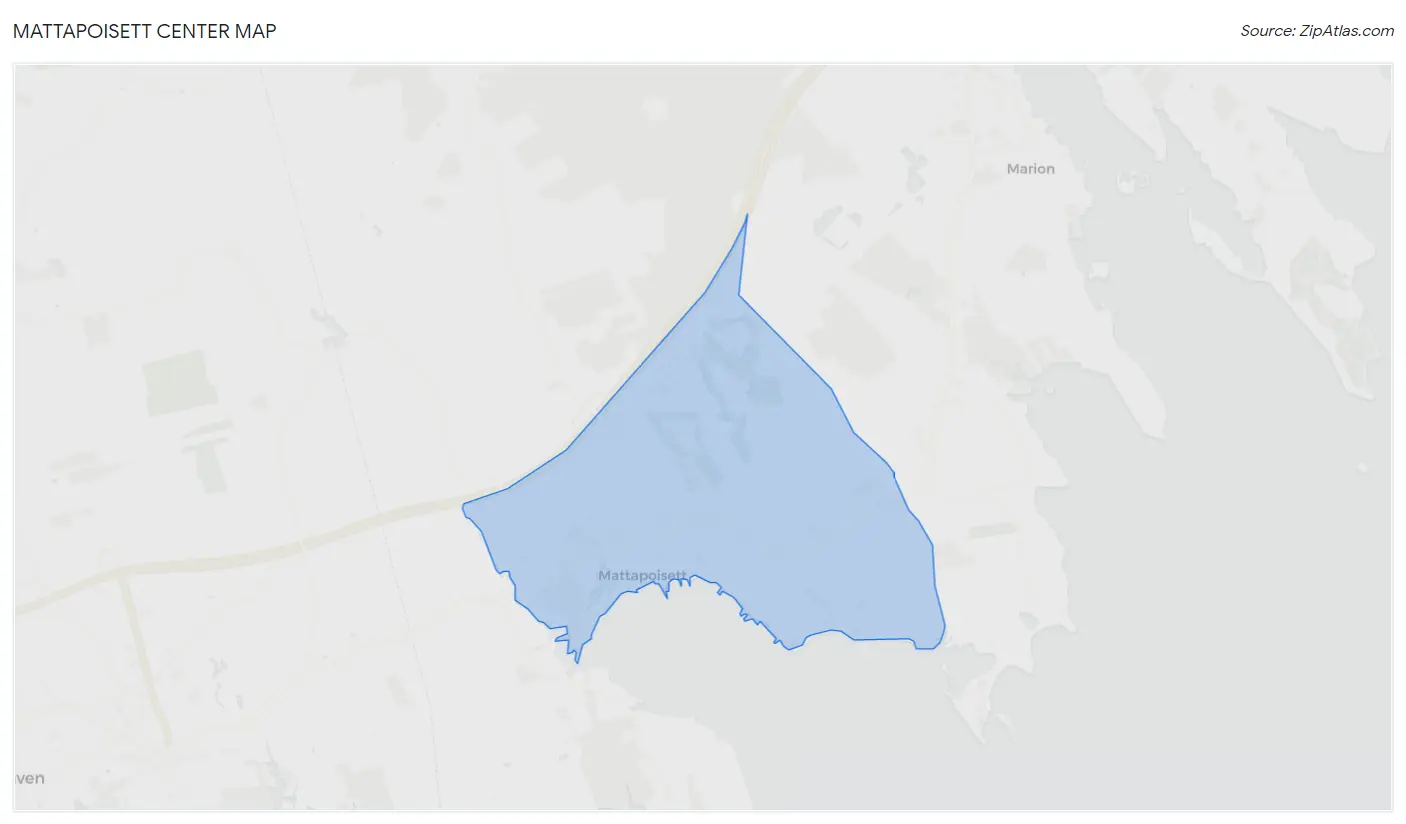
Mattapoisett Center Overview
$64,652
PER CAPITA INCOME
$135,409
AVG FAMILY INCOME
$95,986
AVG HOUSEHOLD INCOME
0.3%
WAGE / INCOME GAP [ % ]
99.7¢/ $1
WAGE / INCOME GAP [ $ ]
0.41
INEQUALITY / GINI INDEX
2,645
TOTAL POPULATION
1,469
MALE POPULATION
1,176
FEMALE POPULATION
124.91
MALES / 100 FEMALES
80.05
FEMALES / 100 MALES
55.8
MEDIAN AGE
2.8
AVG FAMILY SIZE
2.0
AVG HOUSEHOLD SIZE
1,196
LABOR FORCE [ PEOPLE ]
53.7%
PERCENT IN LABOR FORCE
3.9%
UNEMPLOYMENT RATE
Income in Mattapoisett Center
Income Overview in Mattapoisett Center
Per Capita Income in Mattapoisett Center is $64,652, while median incomes of families and households are $135,409 and $95,986 respectively.
| Characteristic | Number | Measure |
| Per Capita Income | 2,645 | $64,652 |
| Median Family Income | 761 | $135,409 |
| Mean Family Income | 761 | $149,617 |
| Median Household Income | 1,301 | $95,986 |
| Mean Household Income | 1,301 | $131,615 |
| Income Deficit | 761 | $0 |
| Wage / Income Gap (%) | 2,645 | 0.26% |
| Wage / Income Gap ($) | 2,645 | 99.74¢ per $1 |
| Gini / Inequality Index | 2,645 | 0.41 |
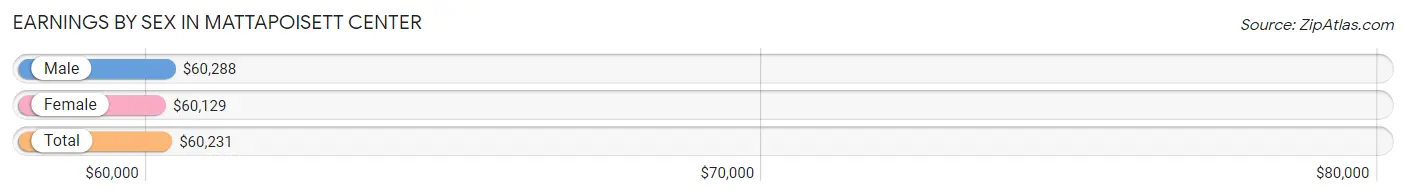
Earnings by Sex in Mattapoisett Center
Average Earnings in Mattapoisett Center are $60,231, $60,288 for men and $60,129 for women, a difference of 0.3%.
| Sex | Number | Average Earnings |
| Male | 854 (58.1%) | $60,288 |
| Female | 617 (41.9%) | $60,129 |
| Total | 1,471 (100.0%) | $60,231 |
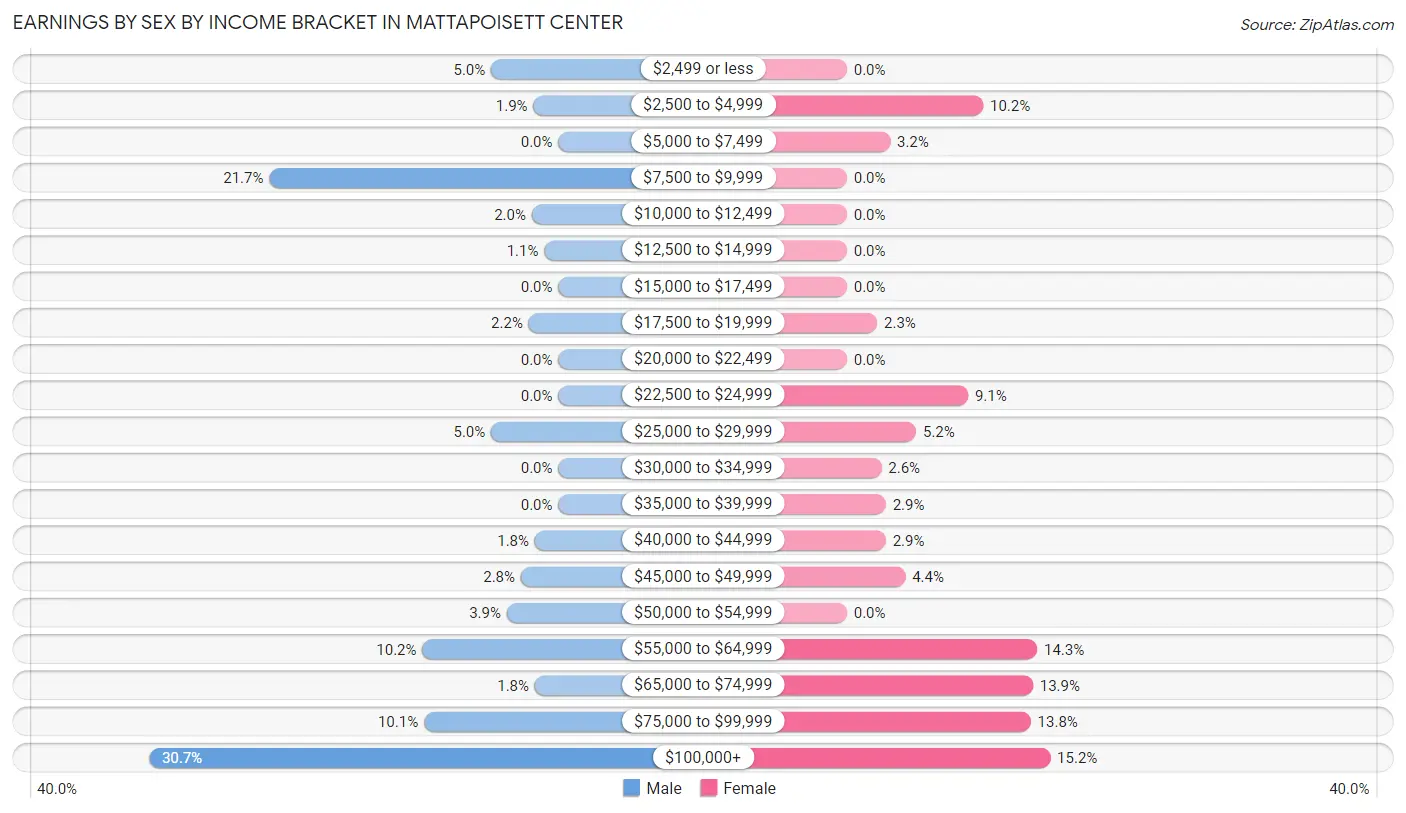
Earnings by Sex by Income Bracket in Mattapoisett Center
The most common earnings brackets in Mattapoisett Center are $100,000+ for men (262 | 30.7%) and $100,000+ for women (94 | 15.2%).
| Income | Male | Female |
| $2,499 or less | 43 (5.0%) | 0 (0.0%) |
| $2,500 to $4,999 | 16 (1.9%) | 63 (10.2%) |
| $5,000 to $7,499 | 0 (0.0%) | 20 (3.2%) |
| $7,500 to $9,999 | 185 (21.7%) | 0 (0.0%) |
| $10,000 to $12,499 | 17 (2.0%) | 0 (0.0%) |
| $12,500 to $14,999 | 9 (1.1%) | 0 (0.0%) |
| $15,000 to $17,499 | 0 (0.0%) | 0 (0.0%) |
| $17,500 to $19,999 | 19 (2.2%) | 14 (2.3%) |
| $20,000 to $22,499 | 0 (0.0%) | 0 (0.0%) |
| $22,500 to $24,999 | 0 (0.0%) | 56 (9.1%) |
| $25,000 to $29,999 | 43 (5.0%) | 32 (5.2%) |
| $30,000 to $34,999 | 0 (0.0%) | 16 (2.6%) |
| $35,000 to $39,999 | 0 (0.0%) | 18 (2.9%) |
| $40,000 to $44,999 | 15 (1.8%) | 18 (2.9%) |
| $45,000 to $49,999 | 24 (2.8%) | 27 (4.4%) |
| $50,000 to $54,999 | 33 (3.9%) | 0 (0.0%) |
| $55,000 to $64,999 | 87 (10.2%) | 88 (14.3%) |
| $65,000 to $74,999 | 15 (1.8%) | 86 (13.9%) |
| $75,000 to $99,999 | 86 (10.1%) | 85 (13.8%) |
| $100,000+ | 262 (30.7%) | 94 (15.2%) |
| Total | 854 (100.0%) | 617 (100.0%) |
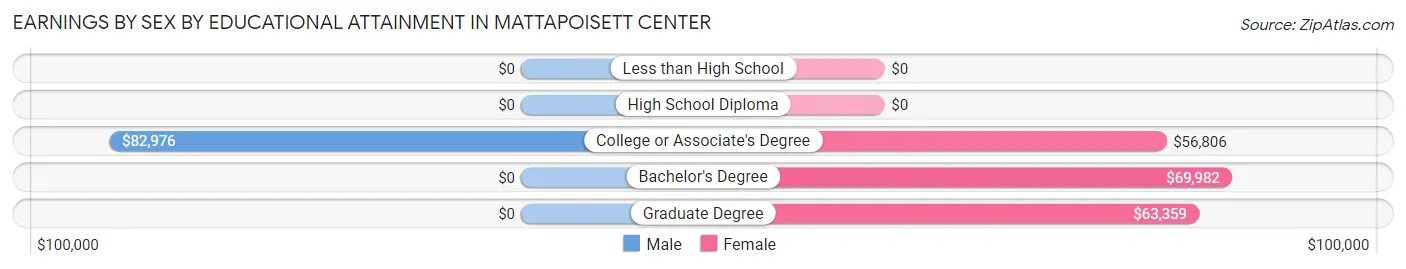
Earnings by Sex by Educational Attainment in Mattapoisett Center
Average earnings in Mattapoisett Center are $61,202 for men and $68,033 for women, a difference of 10.0%. Men with an educational attainment of college or associate's degree enjoy the highest average annual earnings of $82,976, while those with college or associate's degree education earn the least with $82,976. Women with an educational attainment of bachelor's degree earn the most with the average annual earnings of $69,982, while those with college or associate's degree education have the smallest earnings of $56,806.
| Educational Attainment | Male Income | Female Income |
| Less than High School | - | - |
| High School Diploma | - | - |
| College or Associate's Degree | $82,976 | $56,806 |
| Bachelor's Degree | - | - |
| Graduate Degree | - | - |
| Total | $61,202 | $68,033 |
Family Income in Mattapoisett Center
Family Income Brackets in Mattapoisett Center
According to the Mattapoisett Center family income data, there are 231 families falling into the $100,000 to $149,999 income range, which is the most common income bracket and makes up 30.3% of all families.
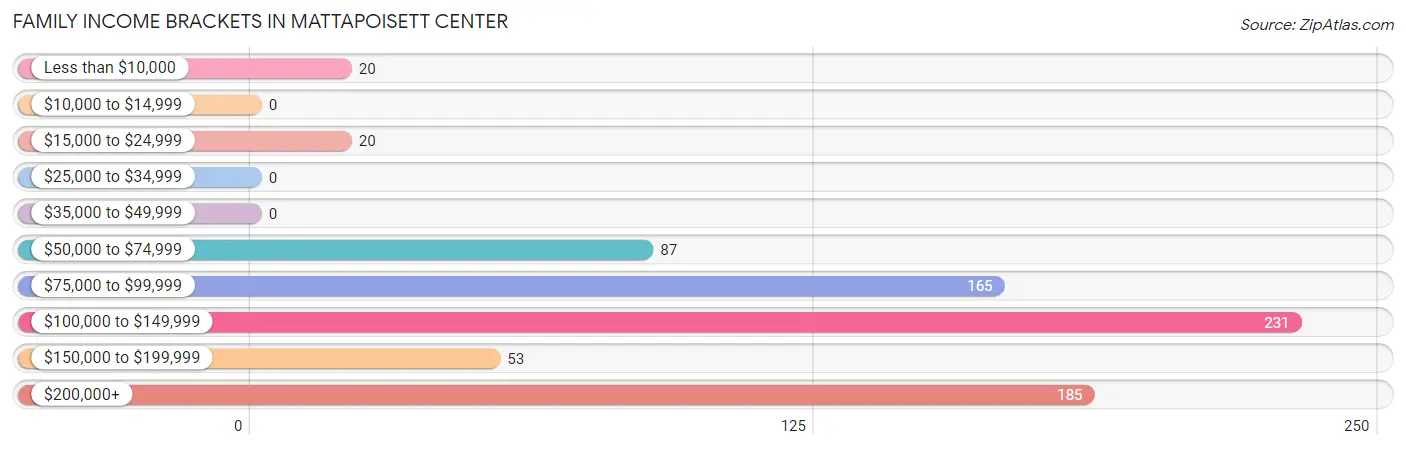
| Income Bracket | # Families | % Families |
| Less than $10,000 | 20 | 2.6% |
| $10,000 to $14,999 | 0 | 0.0% |
| $15,000 to $24,999 | 20 | 2.6% |
| $25,000 to $34,999 | 0 | 0.0% |
| $35,000 to $49,999 | 0 | 0.0% |
| $50,000 to $74,999 | 87 | 11.4% |
| $75,000 to $99,999 | 165 | 21.7% |
| $100,000 to $149,999 | 231 | 30.4% |
| $150,000 to $199,999 | 53 | 7.0% |
| $200,000+ | 185 | 24.3% |
Family Income by Famaliy Size in Mattapoisett Center
3-person families (199 | 26.2%) account for the highest median family income in Mattapoisett Center with $148,385 per family, while 2-person families (402 | 52.8%) have the highest median income of $54,188 per family member.
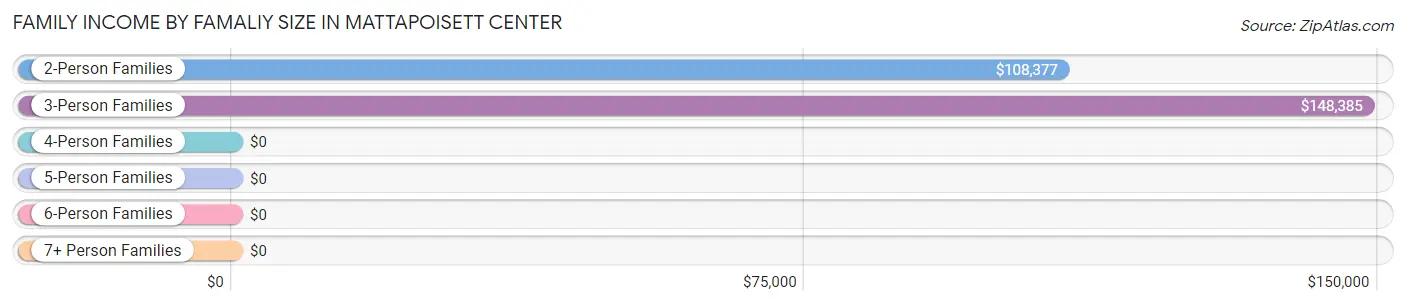
| Income Bracket | # Families | Median Income |
| 2-Person Families | 402 (52.8%) | $108,377 |
| 3-Person Families | 199 (26.2%) | $148,385 |
| 4-Person Families | 117 (15.4%) | $0 |
| 5-Person Families | 43 (5.7%) | $0 |
| 6-Person Families | 0 (0.0%) | $0 |
| 7+ Person Families | 0 (0.0%) | $0 |
| Total | 761 (100.0%) | $135,409 |
Family Income by Number of Earners in Mattapoisett Center
The median family income in Mattapoisett Center is $135,409, with families comprising 3+ earners (99) having the highest median family income of $190,563, while families with no earners (146) have the lowest median family income of $93,194, accounting for 13.0% and 19.2% of families, respectively.
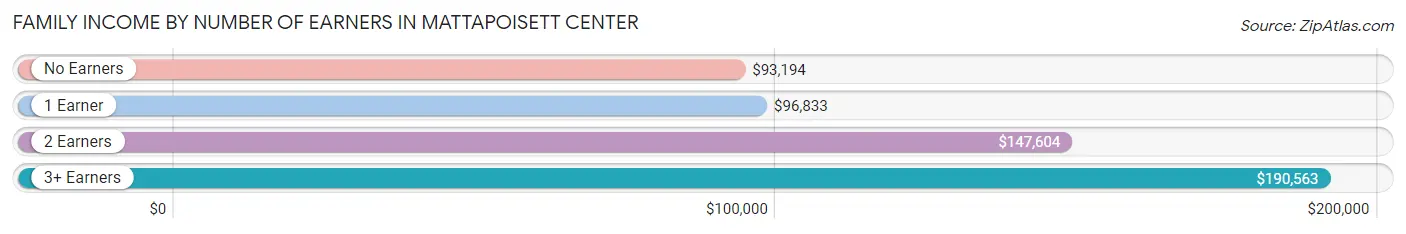
| Number of Earners | # Families | Median Income |
| No Earners | 146 (19.2%) | $93,194 |
| 1 Earner | 260 (34.2%) | $96,833 |
| 2 Earners | 256 (33.6%) | $147,604 |
| 3+ Earners | 99 (13.0%) | $190,563 |
| Total | 761 (100.0%) | $135,409 |
Household Income in Mattapoisett Center
Household Income Brackets in Mattapoisett Center
With 358 households falling in the category, the $50,000 to $74,999 income range is the most frequent in Mattapoisett Center, accounting for 27.5% of all households. In contrast, only 20 households (1.5%) fall into the less than $10,000 income bracket, making it the least populous group.
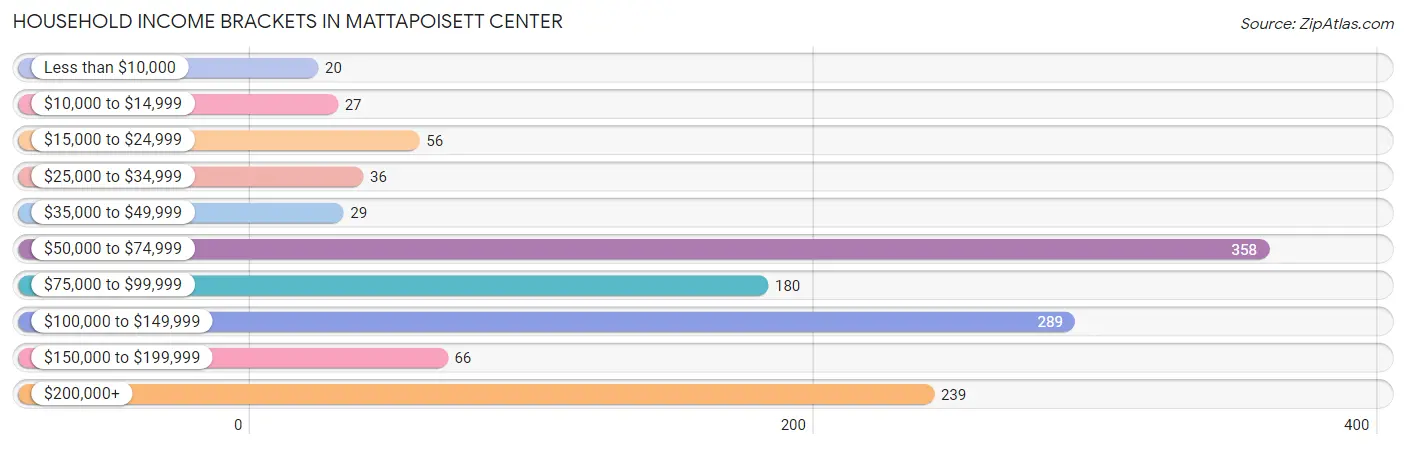
| Income Bracket | # Households | % Households |
| Less than $10,000 | 20 | 1.5% |
| $10,000 to $14,999 | 27 | 2.1% |
| $15,000 to $24,999 | 56 | 4.3% |
| $25,000 to $34,999 | 36 | 2.8% |
| $35,000 to $49,999 | 29 | 2.2% |
| $50,000 to $74,999 | 358 | 27.5% |
| $75,000 to $99,999 | 180 | 13.8% |
| $100,000 to $149,999 | 289 | 22.2% |
| $150,000 to $199,999 | 66 | 5.1% |
| $200,000+ | 239 | 18.4% |
Household Income by Householder Age in Mattapoisett Center
The median household income in Mattapoisett Center is $95,986, with the highest median household income of $149,010 found in the 45 to 64 years age bracket for the primary householder. A total of 493 households (37.9%) fall into this category. Meanwhile, the 15 to 24 years age bracket for the primary householder has the lowest median household income of $0, with 14 households (1.1%) in this group.
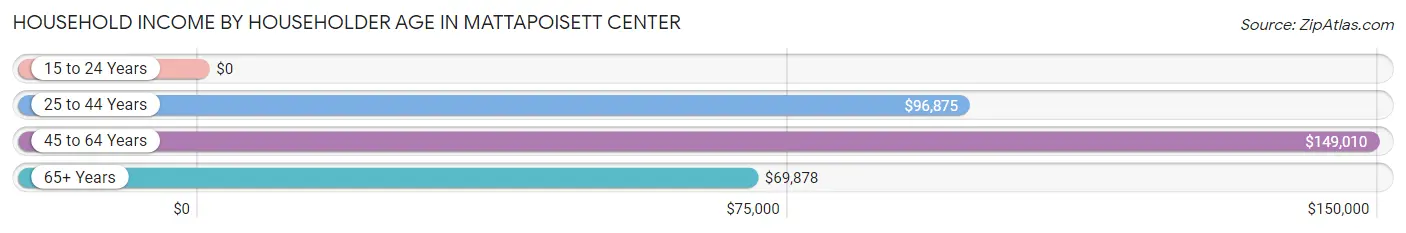
| Income Bracket | # Households | Median Income |
| 15 to 24 Years | 14 (1.1%) | $0 |
| 25 to 44 Years | 238 (18.3%) | $96,875 |
| 45 to 64 Years | 493 (37.9%) | $149,010 |
| 65+ Years | 556 (42.7%) | $69,878 |
| Total | 1,301 (100.0%) | $95,986 |
Poverty in Mattapoisett Center
Income Below Poverty by Sex and Age in Mattapoisett Center
With 4.4% poverty level for males and 5.2% for females among the residents of Mattapoisett Center, 18 to 24 year old males and 75 year old and over females are the most vulnerable to poverty, with 26 males (45.6%) and 18 females (17.8%) in their respective age groups living below the poverty level.
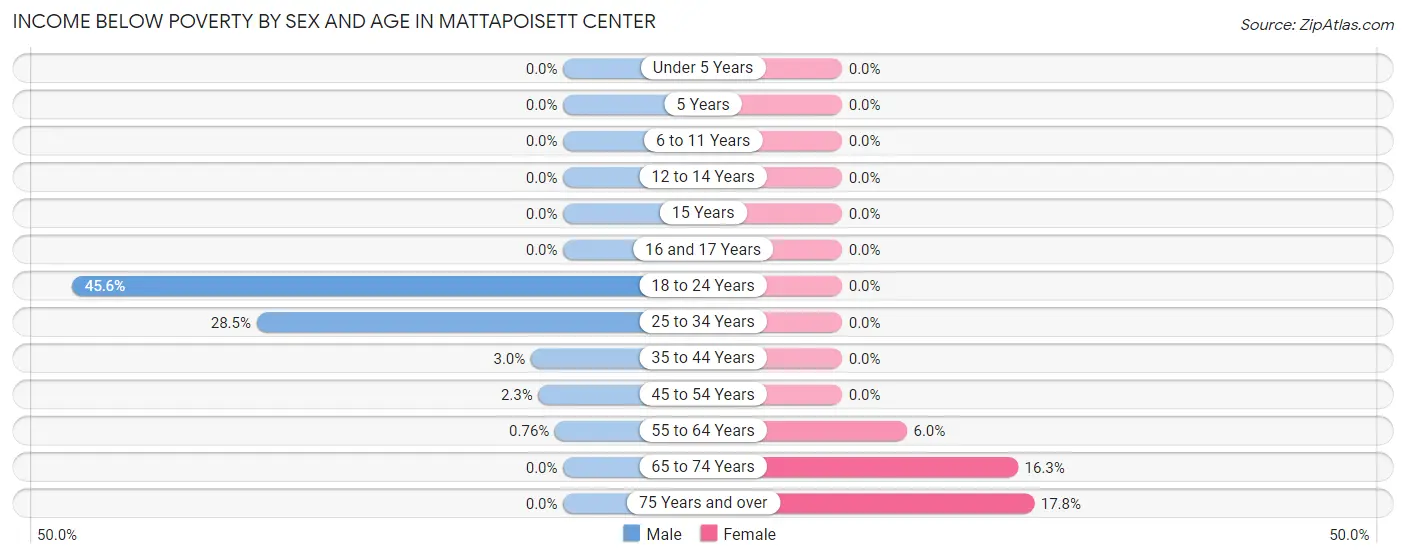
| Age Bracket | Male | Female |
| Under 5 Years | 0 (0.0%) | 0 (0.0%) |
| 5 Years | 0 (0.0%) | 0 (0.0%) |
| 6 to 11 Years | 0 (0.0%) | 0 (0.0%) |
| 12 to 14 Years | 0 (0.0%) | 0 (0.0%) |
| 15 Years | 0 (0.0%) | 0 (0.0%) |
| 16 and 17 Years | 0 (0.0%) | 0 (0.0%) |
| 18 to 24 Years | 26 (45.6%) | 0 (0.0%) |
| 25 to 34 Years | 33 (28.4%) | 0 (0.0%) |
| 35 to 44 Years | 2 (3.0%) | 0 (0.0%) |
| 45 to 54 Years | 2 (2.3%) | 0 (0.0%) |
| 55 to 64 Years | 2 (0.8%) | 20 (6.0%) |
| 65 to 74 Years | 0 (0.0%) | 23 (16.3%) |
| 75 Years and over | 0 (0.0%) | 18 (17.8%) |
| Total | 65 (4.4%) | 61 (5.2%) |
Income Above Poverty by Sex and Age in Mattapoisett Center
According to the poverty statistics in Mattapoisett Center, males aged under 5 years and females aged 12 to 14 years are the age groups that are most secure financially, with 100.0% of males and 100.0% of females in these age groups living above the poverty line.
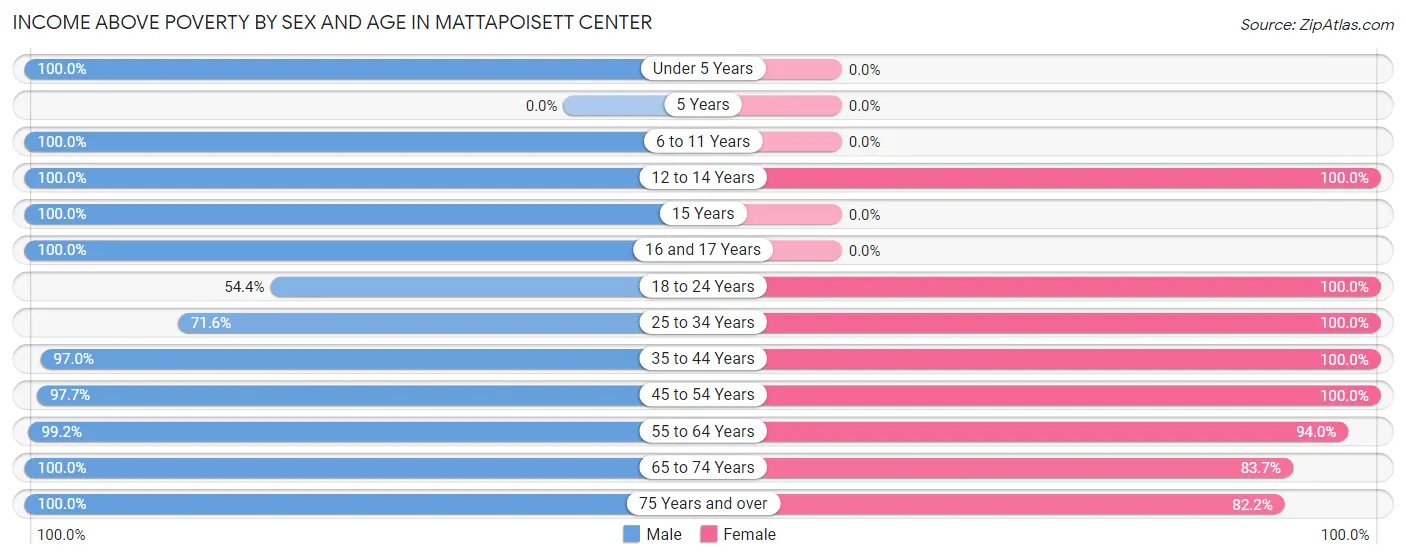
| Age Bracket | Male | Female |
| Under 5 Years | 33 (100.0%) | 0 (0.0%) |
| 5 Years | 0 (0.0%) | 0 (0.0%) |
| 6 to 11 Years | 33 (100.0%) | 0 (0.0%) |
| 12 to 14 Years | 249 (100.0%) | 74 (100.0%) |
| 15 Years | 28 (100.0%) | 0 (0.0%) |
| 16 and 17 Years | 35 (100.0%) | 0 (0.0%) |
| 18 to 24 Years | 31 (54.4%) | 146 (100.0%) |
| 25 to 34 Years | 83 (71.6%) | 118 (100.0%) |
| 35 to 44 Years | 65 (97.0%) | 102 (100.0%) |
| 45 to 54 Years | 85 (97.7%) | 161 (100.0%) |
| 55 to 64 Years | 262 (99.2%) | 313 (94.0%) |
| 65 to 74 Years | 209 (100.0%) | 118 (83.7%) |
| 75 Years and over | 291 (100.0%) | 83 (82.2%) |
| Total | 1,404 (95.6%) | 1,115 (94.8%) |
Income Below Poverty Among Married-Couple Families in Mattapoisett Center
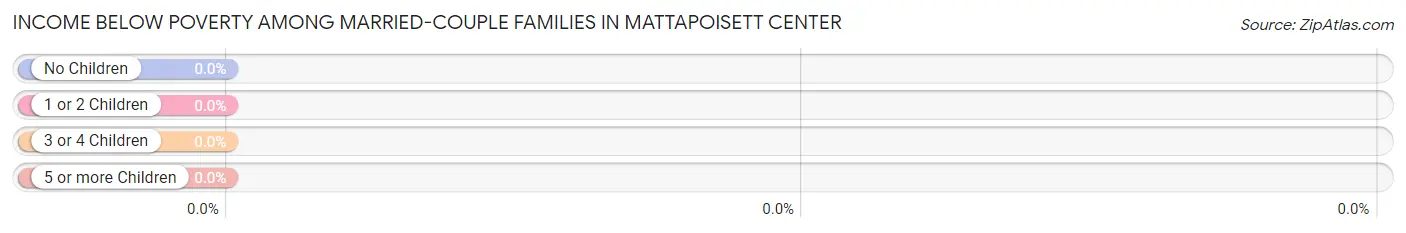
| Children | Above Poverty | Below Poverty |
| No Children | 402 (100.0%) | 0 (0.0%) |
| 1 or 2 Children | 141 (100.0%) | 0 (0.0%) |
| 3 or 4 Children | 43 (100.0%) | 0 (0.0%) |
| 5 or more Children | 0 (0.0%) | 0 (0.0%) |
| Total | 586 (100.0%) | 0 (0.0%) |
Income Below Poverty Among Single-Parent Households in Mattapoisett Center
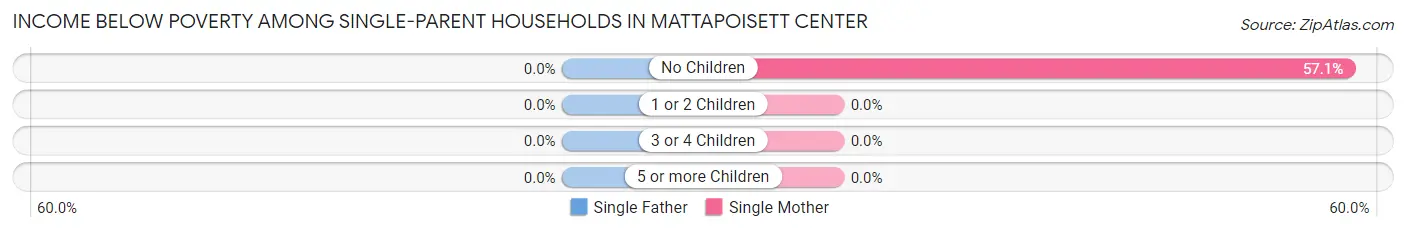
| Children | Single Father | Single Mother |
| No Children | 0 (0.0%) | 40 (57.1%) |
| 1 or 2 Children | 0 (0.0%) | 0 (0.0%) |
| 3 or 4 Children | 0 (0.0%) | 0 (0.0%) |
| 5 or more Children | 0 (0.0%) | 0 (0.0%) |
| Total | 0 (0.0%) | 40 (29.0%) |
Income Below Poverty Among Married-Couple vs Single-Parent Households in Mattapoisett Center
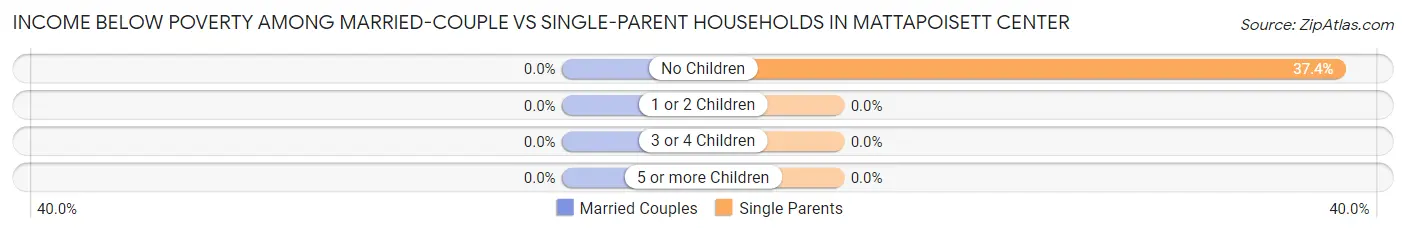
| Children | Married-Couple Families | Single-Parent Households |
| No Children | 0 (0.0%) | 40 (37.4%) |
| 1 or 2 Children | 0 (0.0%) | 0 (0.0%) |
| 3 or 4 Children | 0 (0.0%) | 0 (0.0%) |
| 5 or more Children | 0 (0.0%) | 0 (0.0%) |
| Total | 0 (0.0%) | 40 (22.9%) |
Race in Mattapoisett Center
The most populous races in Mattapoisett Center are White / Caucasian (2,272 | 85.9%), Two or more Races (262 | 9.9%), and Hispanic or Latino (47 | 1.8%).
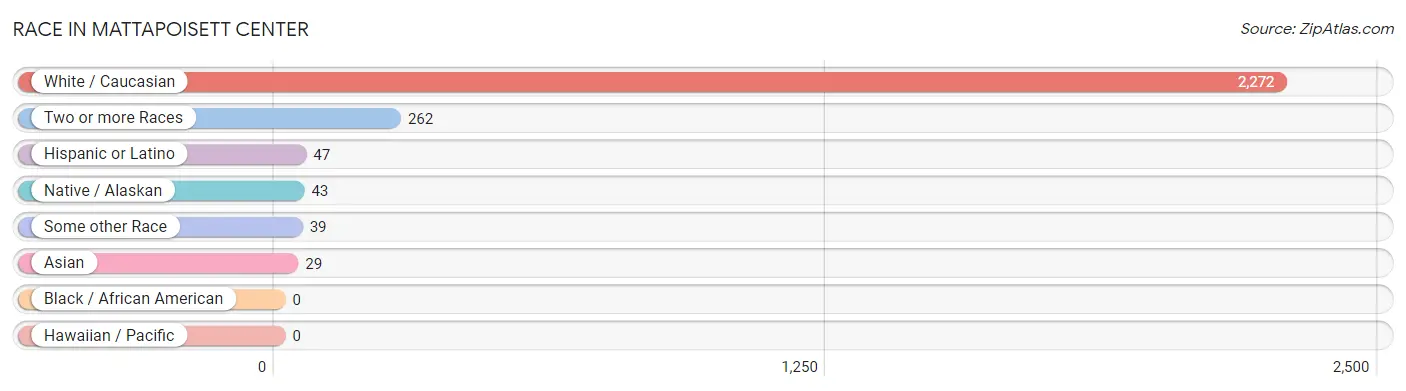
| Race | # Population | % Population |
| Asian | 29 | 1.1% |
| Black / African American | 0 | 0.0% |
| Hawaiian / Pacific | 0 | 0.0% |
| Hispanic or Latino | 47 | 1.8% |
| Native / Alaskan | 43 | 1.6% |
| White / Caucasian | 2,272 | 85.9% |
| Two or more Races | 262 | 9.9% |
| Some other Race | 39 | 1.5% |
| Total | 2,645 | 100.0% |
Ancestry in Mattapoisett Center
The most populous ancestries reported in Mattapoisett Center are Irish (954 | 36.1%), Portuguese (478 | 18.1%), English (468 | 17.7%), Polish (263 | 9.9%), and French (242 | 9.1%), together accounting for 90.9% of all Mattapoisett Center residents.
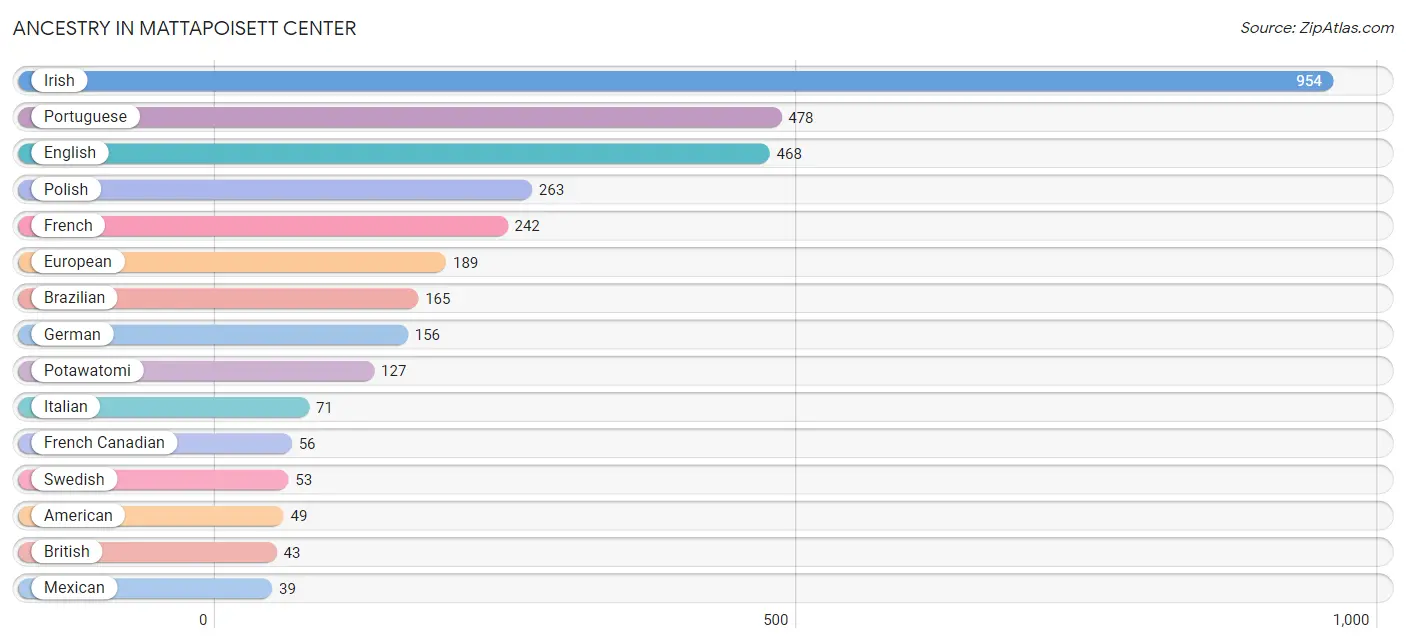
| Ancestry | # Population | % Population |
| American | 49 | 1.8% |
| Brazilian | 165 | 6.2% |
| British | 43 | 1.6% |
| Cherokee | 9 | 0.3% |
| Danish | 21 | 0.8% |
| Dominican | 1 | 0.0% |
| English | 468 | 17.7% |
| European | 189 | 7.1% |
| Filipino | 29 | 1.1% |
| French | 242 | 9.1% |
| French Canadian | 56 | 2.1% |
| German | 156 | 5.9% |
| Irish | 954 | 36.1% |
| Italian | 71 | 2.7% |
| Mexican | 39 | 1.5% |
| Polish | 263 | 9.9% |
| Portuguese | 478 | 18.1% |
| Potawatomi | 127 | 4.8% |
| Scotch-Irish | 9 | 0.3% |
| Scottish | 28 | 1.1% |
| Spaniard | 7 | 0.3% |
| Swedish | 53 | 2.0% | View All 22 Rows |
Immigrants in Mattapoisett Center
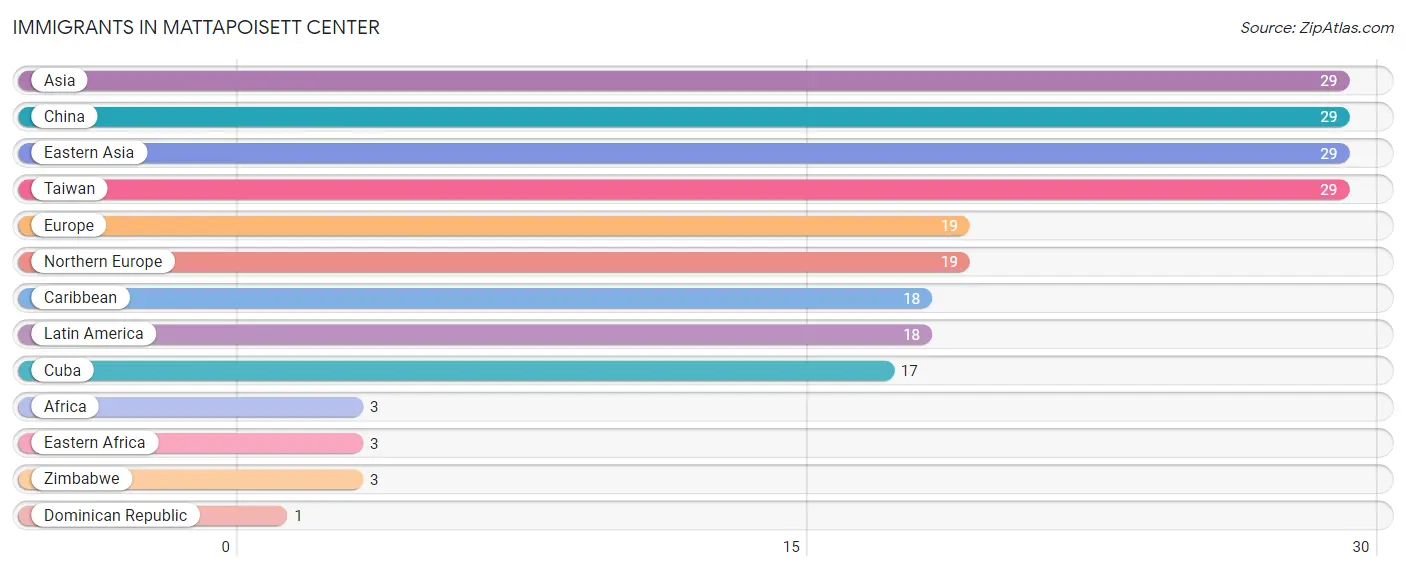
The most numerous immigrant groups reported in Mattapoisett Center came from Asia (29 | 1.1%), China (29 | 1.1%), Eastern Asia (29 | 1.1%), Taiwan (29 | 1.1%), and Europe (19 | 0.7%), together accounting for 5.1% of all Mattapoisett Center residents.
| Immigration Origin | # Population | % Population |
| Africa | 3 | 0.1% |
| Asia | 29 | 1.1% |
| Caribbean | 18 | 0.7% |
| China | 29 | 1.1% |
| Cuba | 17 | 0.6% |
| Dominican Republic | 1 | 0.0% |
| Eastern Africa | 3 | 0.1% |
| Eastern Asia | 29 | 1.1% |
| Europe | 19 | 0.7% |
| Latin America | 18 | 0.7% |
| Northern Europe | 19 | 0.7% |
| Taiwan | 29 | 1.1% |
| Zimbabwe | 3 | 0.1% | View All 13 Rows |
Sex and Age in Mattapoisett Center
Sex and Age in Mattapoisett Center
The most populous age groups in Mattapoisett Center are 10 to 14 Years (249 | 17.0%) for men and 60 to 64 Years (175 | 14.9%) for women.
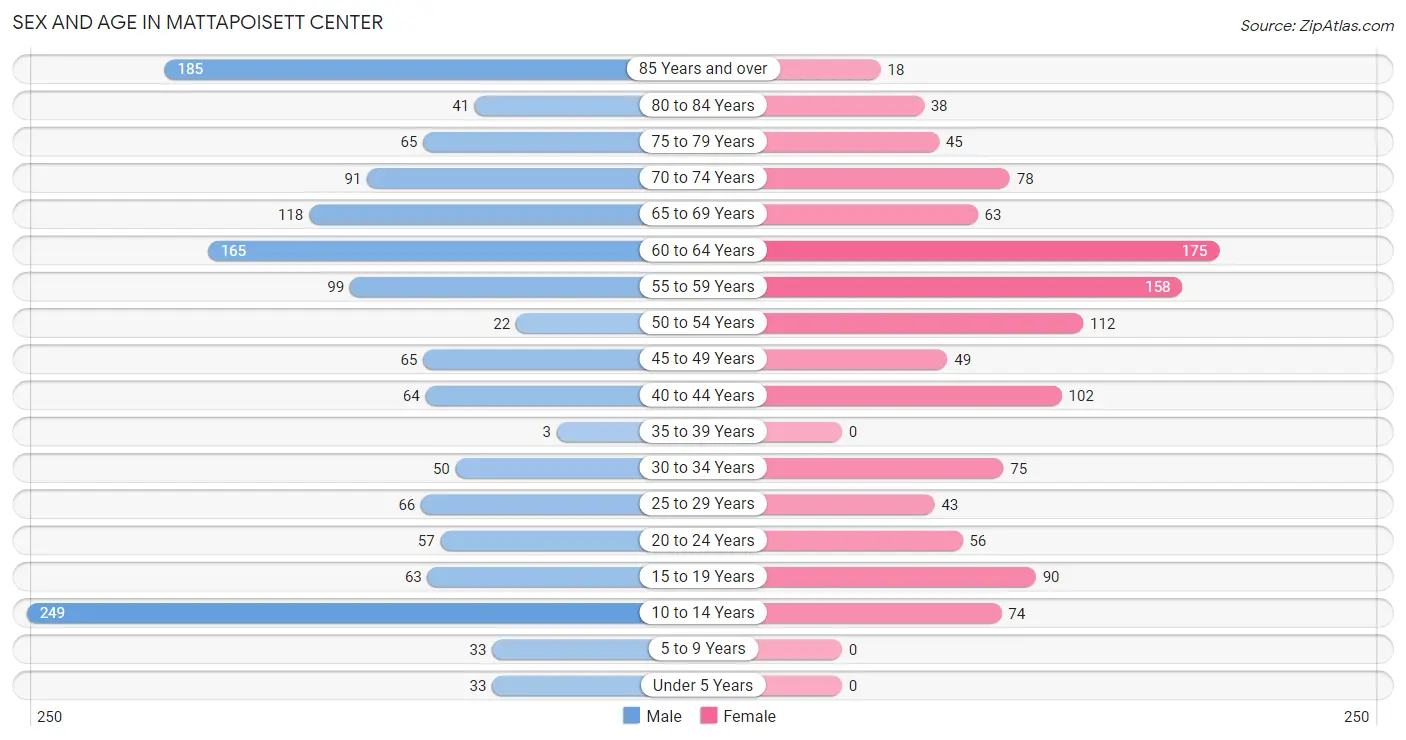
| Age Bracket | Male | Female |
| Under 5 Years | 33 (2.2%) | 0 (0.0%) |
| 5 to 9 Years | 33 (2.2%) | 0 (0.0%) |
| 10 to 14 Years | 249 (17.0%) | 74 (6.3%) |
| 15 to 19 Years | 63 (4.3%) | 90 (7.6%) |
| 20 to 24 Years | 57 (3.9%) | 56 (4.8%) |
| 25 to 29 Years | 66 (4.5%) | 43 (3.7%) |
| 30 to 34 Years | 50 (3.4%) | 75 (6.4%) |
| 35 to 39 Years | 3 (0.2%) | 0 (0.0%) |
| 40 to 44 Years | 64 (4.4%) | 102 (8.7%) |
| 45 to 49 Years | 65 (4.4%) | 49 (4.2%) |
| 50 to 54 Years | 22 (1.5%) | 112 (9.5%) |
| 55 to 59 Years | 99 (6.7%) | 158 (13.4%) |
| 60 to 64 Years | 165 (11.2%) | 175 (14.9%) |
| 65 to 69 Years | 118 (8.0%) | 63 (5.4%) |
| 70 to 74 Years | 91 (6.2%) | 78 (6.6%) |
| 75 to 79 Years | 65 (4.4%) | 45 (3.8%) |
| 80 to 84 Years | 41 (2.8%) | 38 (3.2%) |
| 85 Years and over | 185 (12.6%) | 18 (1.5%) |
| Total | 1,469 (100.0%) | 1,176 (100.0%) |
Families and Households in Mattapoisett Center
Median Family Size in Mattapoisett Center
The median family size in Mattapoisett Center is 2.75 persons per family, with single female/mother families (138 | 18.1%) accounting for the largest median family size of 2.81 persons per family. On the other hand, married-couple families (586 | 77.0%) represent the smallest median family size with 2.74 persons per family.
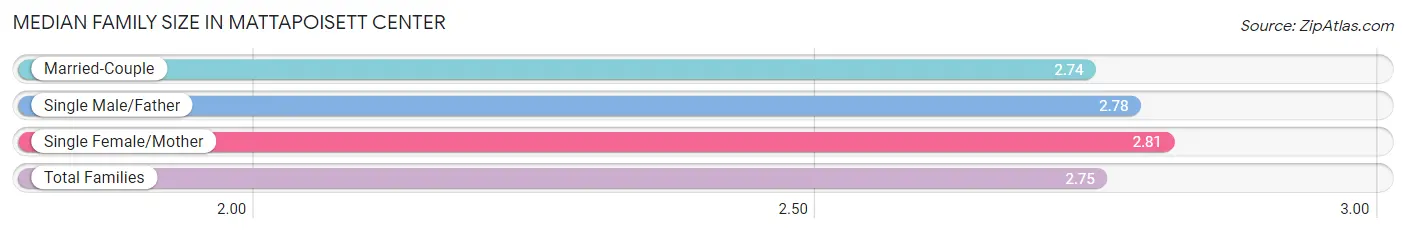
| Family Type | # Families | Family Size |
| Married-Couple | 586 (77.0%) | 2.74 |
| Single Male/Father | 37 (4.9%) | 2.78 |
| Single Female/Mother | 138 (18.1%) | 2.81 |
| Total Families | 761 (100.0%) | 2.75 |
Median Household Size in Mattapoisett Center
The median household size in Mattapoisett Center is 2.03 persons per household, with single female/mother households (138 | 10.6%) accounting for the largest median household size of 2.81 persons per household. non-family households (540 | 41.5%) represent the smallest median household size with 1.01 persons per household.
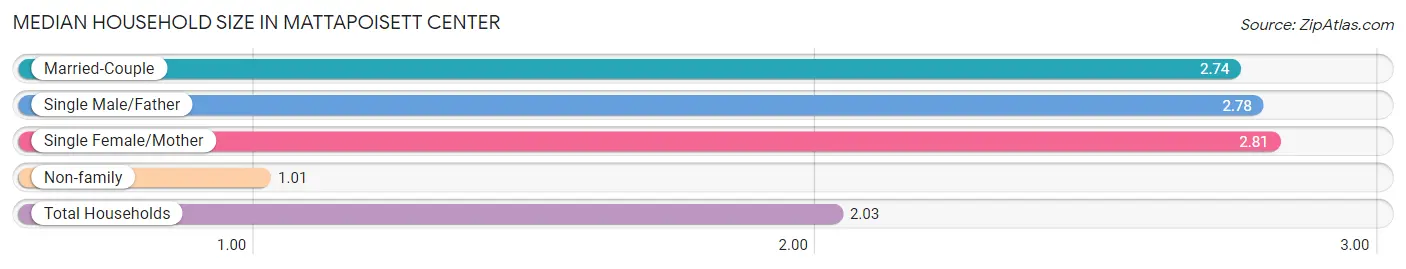
| Household Type | # Households | Household Size |
| Married-Couple | 586 (45.0%) | 2.74 |
| Single Male/Father | 37 (2.8%) | 2.78 |
| Single Female/Mother | 138 (10.6%) | 2.81 |
| Non-family | 540 (41.5%) | 1.01 |
| Total Households | 1,301 (100.0%) | 2.03 |
Household Size by Marriage Status in Mattapoisett Center
Out of a total of 1,301 households in Mattapoisett Center, 761 (58.5%) are family households, while 540 (41.5%) are nonfamily households. The most numerous type of family households are 2-person households, comprising 402, and the most common type of nonfamily households are 1-person households, comprising 519.
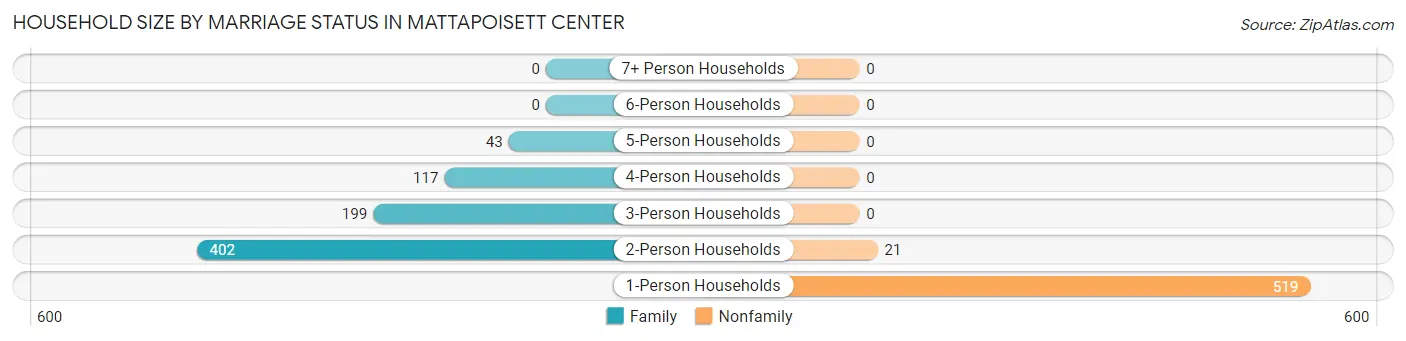
| Household Size | Family Households | Nonfamily Households |
| 1-Person Households | - | 519 (39.9%) |
| 2-Person Households | 402 (30.9%) | 21 (1.6%) |
| 3-Person Households | 199 (15.3%) | 0 (0.0%) |
| 4-Person Households | 117 (9.0%) | 0 (0.0%) |
| 5-Person Households | 43 (3.3%) | 0 (0.0%) |
| 6-Person Households | 0 (0.0%) | 0 (0.0%) |
| 7+ Person Households | 0 (0.0%) | 0 (0.0%) |
| Total | 761 (58.5%) | 540 (41.5%) |
Female Fertility in Mattapoisett Center
Fertility by Age in Mattapoisett Center
| Age Bracket | Women with Births | Births / 1,000 Women |
| 15 to 19 years | 0 (0.0%) | 0.0 |
| 20 to 34 years | 0 (0.0%) | 0.0 |
| 35 to 50 years | 0 (0.0%) | 0.0 |
| Total | 0 (0.0%) | 0.0 |
Fertility by Age by Marriage Status in Mattapoisett Center
| Age Bracket | Married | Unmarried |
| 15 to 19 years | 0 (0.0%) | 0 (0.0%) |
| 20 to 34 years | 0 (0.0%) | 0 (0.0%) |
| 35 to 50 years | 0 (0.0%) | 0 (0.0%) |
| Total | 0 (0.0%) | 0 (0.0%) |
Fertility by Education in Mattapoisett Center
| Educational Attainment | Women with Births | Births / 1,000 Women |
| Less than High School | 0 (0.0%) | 0.0 |
| High School Diploma | 0 (0.0%) | 0.0 |
| College or Associate's Degree | 0 (0.0%) | 0.0 |
| Bachelor's Degree | 0 (0.0%) | 0.0 |
| Graduate Degree | 0 (0.0%) | 0.0 |
| Total | 0 (0.0%) | 0.0 |
Fertility by Education by Marriage Status in Mattapoisett Center
| Educational Attainment | Married | Unmarried |
| Less than High School | 0 (0.0%) | 0 (0.0%) |
| High School Diploma | 0 (0.0%) | 0 (0.0%) |
| College or Associate's Degree | 0 (0.0%) | 0 (0.0%) |
| Bachelor's Degree | 0 (0.0%) | 0 (0.0%) |
| Graduate Degree | 0 (0.0%) | 0 (0.0%) |
| Total | 0 (0.0%) | 0 (0.0%) |
Employment Characteristics in Mattapoisett Center
Employment by Class of Employer in Mattapoisett Center
Among the 1,150 employed individuals in Mattapoisett Center, private company employees (737 | 64.1%), self-employed (incorporated) (179 | 15.6%), and not-for-profit organizations (89 | 7.7%) make up the most common classes of employment.
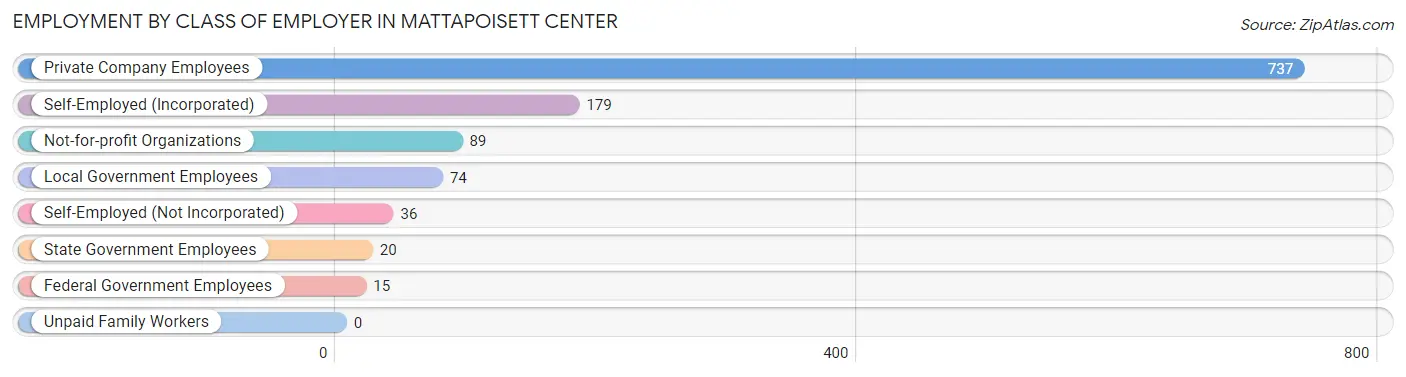
| Employer Class | # Employees | % Employees |
| Private Company Employees | 737 | 64.1% |
| Self-Employed (Incorporated) | 179 | 15.6% |
| Self-Employed (Not Incorporated) | 36 | 3.1% |
| Not-for-profit Organizations | 89 | 7.7% |
| Local Government Employees | 74 | 6.4% |
| State Government Employees | 20 | 1.7% |
| Federal Government Employees | 15 | 1.3% |
| Unpaid Family Workers | 0 | 0.0% |
| Total | 1,150 | 100.0% |
Employment Status by Age in Mattapoisett Center
According to the labor force statistics for Mattapoisett Center, out of the total population over 16 years of age (2,228), 53.7% or 1,196 individuals are in the labor force, with 3.9% or 47 of them unemployed. The age group with the highest labor force participation rate is 20 to 24 years, with 100.0% or 113 individuals in the labor force. Within the labor force, the 20 to 24 years age range has the highest percentage of unemployed individuals, with 23.0% or 26 of them being unemployed.
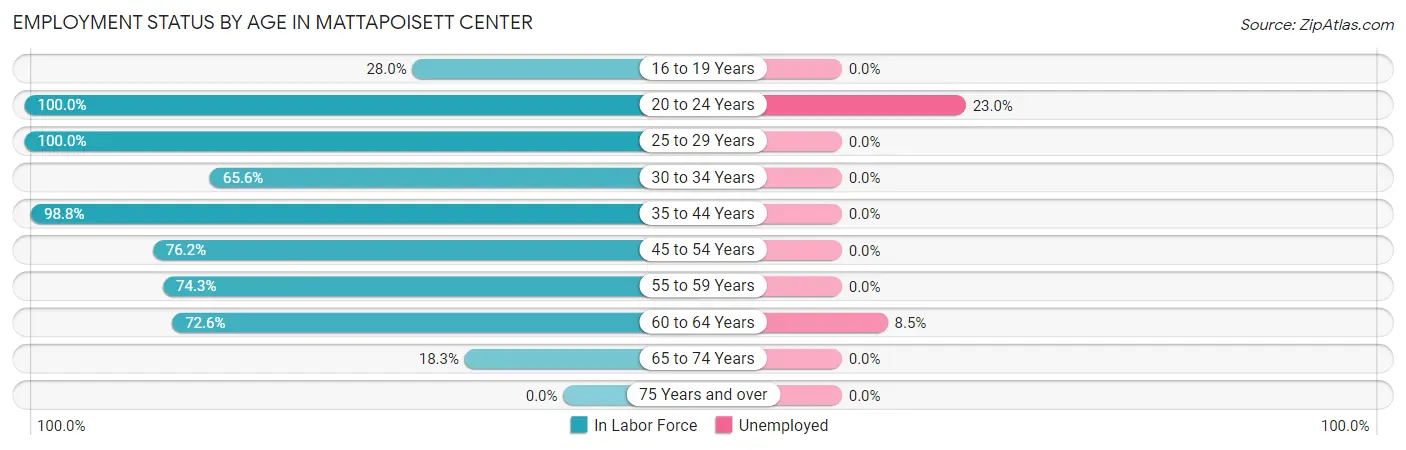
| Age Bracket | In Labor Force | Unemployed |
| 16 to 19 Years | 35 (28.0%) | 0 (0.0%) |
| 20 to 24 Years | 113 (100.0%) | 26 (23.0%) |
| 25 to 29 Years | 109 (100.0%) | 0 (0.0%) |
| 30 to 34 Years | 82 (65.6%) | 0 (0.0%) |
| 35 to 44 Years | 167 (98.8%) | 0 (0.0%) |
| 45 to 54 Years | 189 (76.2%) | 0 (0.0%) |
| 55 to 59 Years | 191 (74.3%) | 0 (0.0%) |
| 60 to 64 Years | 247 (72.6%) | 21 (8.5%) |
| 65 to 74 Years | 64 (18.3%) | 0 (0.0%) |
| 75 Years and over | 0 (0.0%) | 0 (0.0%) |
| Total | 1,196 (53.7%) | 47 (3.9%) |
Employment Status by Educational Attainment in Mattapoisett Center
According to labor force statistics for Mattapoisett Center, 78.9% of individuals (985) out of the total population between 25 and 64 years of age (1,248) are in the labor force, with 2.1% or 21 of them being unemployed. The group with the highest labor force participation rate are those with the educational attainment of less than high school, with 95.7% or 22 individuals in the labor force. Within the labor force, individuals with bachelor's degree or higher education have the highest percentage of unemployment, with 3.5% or 21 of them being unemployed.
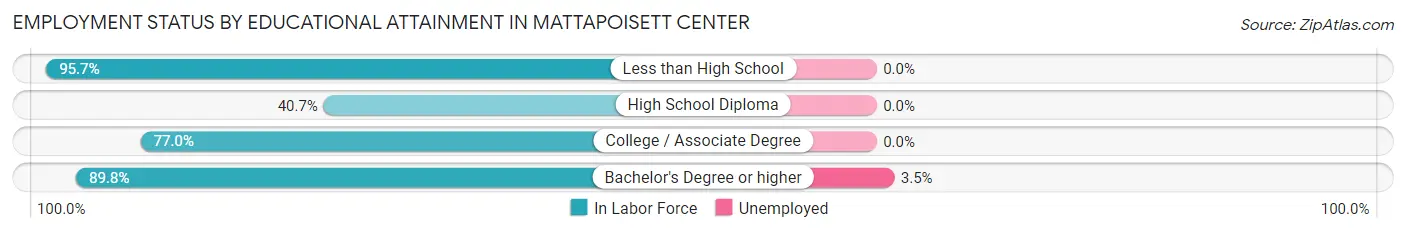
| Educational Attainment | In Labor Force | Unemployed |
| Less than High School | 22 (95.7%) | 0 (0.0%) |
| High School Diploma | 74 (40.7%) | 0 (0.0%) |
| College / Associate Degree | 284 (77.0%) | 0 (0.0%) |
| Bachelor's Degree or higher | 605 (89.8%) | 24 (3.5%) |
| Total | 985 (78.9%) | 26 (2.1%) |
Employment Occupations by Sex in Mattapoisett Center
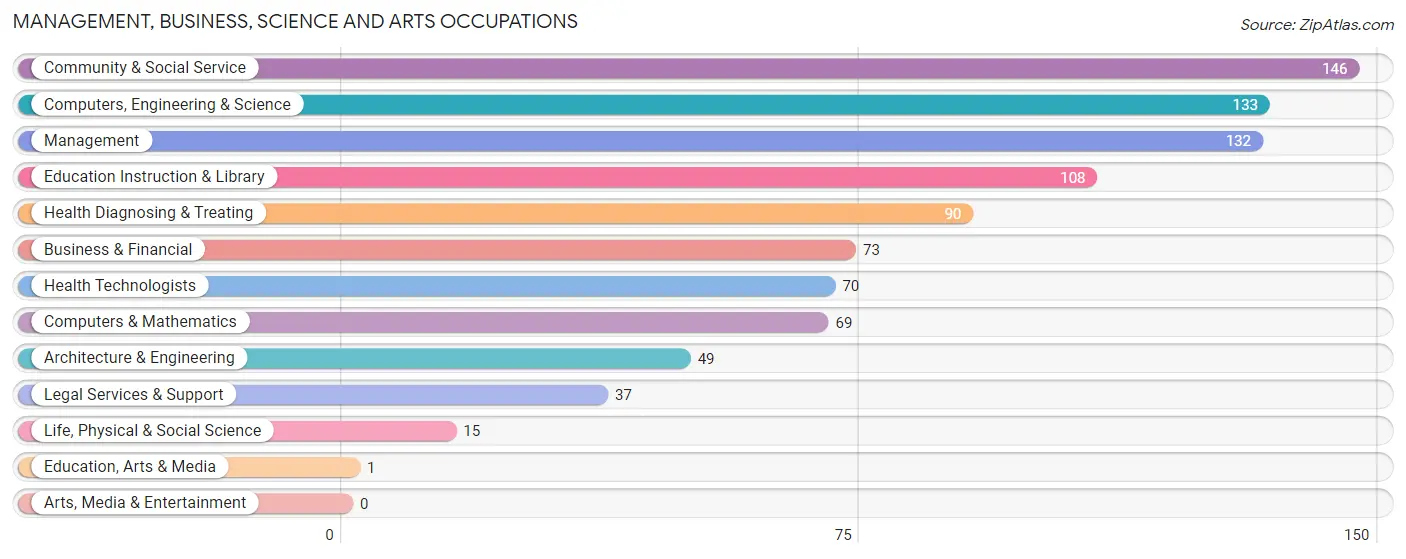
Management, Business, Science and Arts Occupations
The most common Management, Business, Science and Arts occupations in Mattapoisett Center are Community & Social Service (146 | 12.7%), Computers, Engineering & Science (133 | 11.6%), Management (132 | 11.5%), Education Instruction & Library (108 | 9.4%), and Health Diagnosing & Treating (90 | 7.8%).
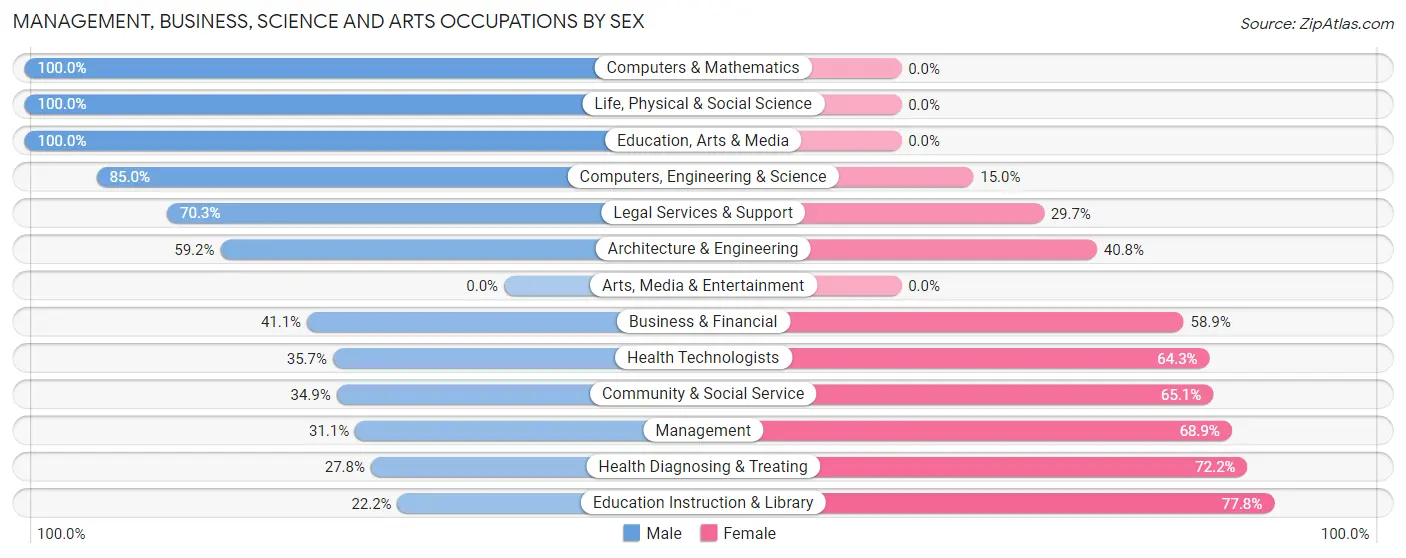
Management, Business, Science and Arts Occupations by Sex
Within the Management, Business, Science and Arts occupations in Mattapoisett Center, the most male-oriented occupations are Computers & Mathematics (100.0%), Life, Physical & Social Science (100.0%), and Education, Arts & Media (100.0%), while the most female-oriented occupations are Education Instruction & Library (77.8%), Health Diagnosing & Treating (72.2%), and Management (68.9%).
| Occupation | Male | Female |
| Management | 41 (31.1%) | 91 (68.9%) |
| Business & Financial | 30 (41.1%) | 43 (58.9%) |
| Computers, Engineering & Science | 113 (85.0%) | 20 (15.0%) |
| Computers & Mathematics | 69 (100.0%) | 0 (0.0%) |
| Architecture & Engineering | 29 (59.2%) | 20 (40.8%) |
| Life, Physical & Social Science | 15 (100.0%) | 0 (0.0%) |
| Community & Social Service | 51 (34.9%) | 95 (65.1%) |
| Education, Arts & Media | 1 (100.0%) | 0 (0.0%) |
| Legal Services & Support | 26 (70.3%) | 11 (29.7%) |
| Education Instruction & Library | 24 (22.2%) | 84 (77.8%) |
| Arts, Media & Entertainment | 0 (0.0%) | 0 (0.0%) |
| Health Diagnosing & Treating | 25 (27.8%) | 65 (72.2%) |
| Health Technologists | 25 (35.7%) | 45 (64.3%) |
| Total (Category) | 260 (45.3%) | 314 (54.7%) |
| Total (Overall) | 634 (55.1%) | 516 (44.9%) |
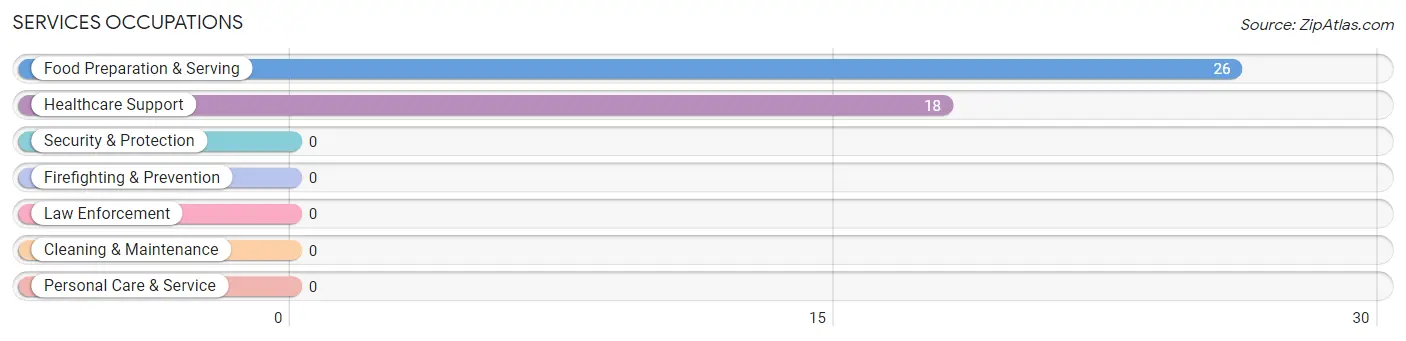
Services Occupations
The most common Services occupations in Mattapoisett Center are Food Preparation & Serving (26 | 2.3%), and Healthcare Support (18 | 1.6%).
Services Occupations by Sex
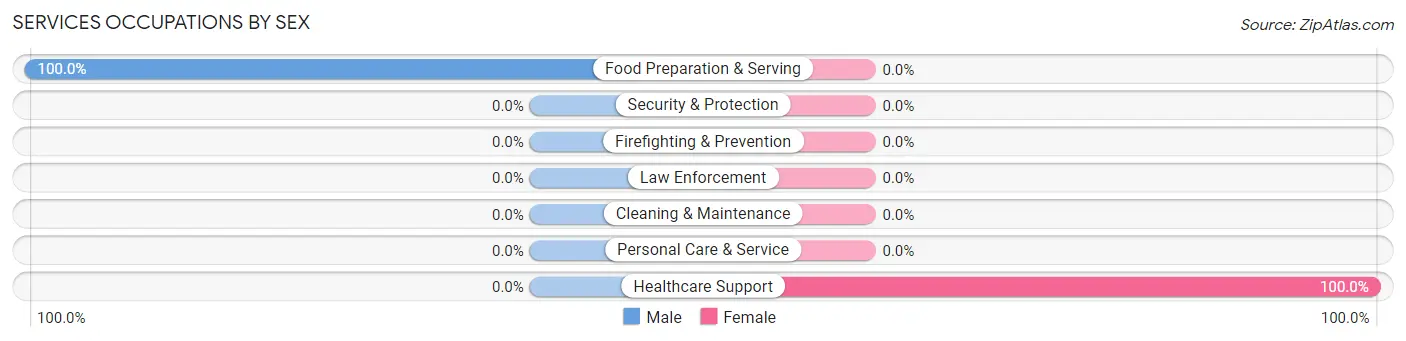
| Occupation | Male | Female |
| Healthcare Support | 0 (0.0%) | 18 (100.0%) |
| Security & Protection | 0 (0.0%) | 0 (0.0%) |
| Firefighting & Prevention | 0 (0.0%) | 0 (0.0%) |
| Law Enforcement | 0 (0.0%) | 0 (0.0%) |
| Food Preparation & Serving | 26 (100.0%) | 0 (0.0%) |
| Cleaning & Maintenance | 0 (0.0%) | 0 (0.0%) |
| Personal Care & Service | 0 (0.0%) | 0 (0.0%) |
| Total (Category) | 26 (59.1%) | 18 (40.9%) |
| Total (Overall) | 634 (55.1%) | 516 (44.9%) |
Sales and Office Occupations
The most common Sales and Office occupations in Mattapoisett Center are Sales & Related (193 | 16.8%), and Office & Administration (126 | 11.0%).
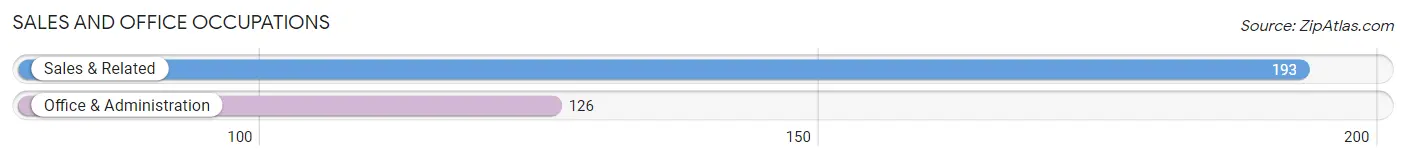
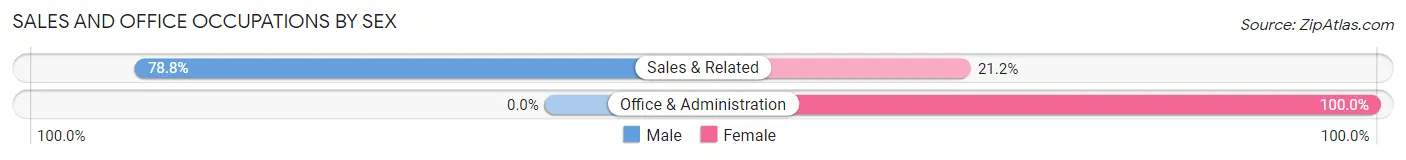
Sales and Office Occupations by Sex
| Occupation | Male | Female |
| Sales & Related | 152 (78.8%) | 41 (21.2%) |
| Office & Administration | 0 (0.0%) | 126 (100.0%) |
| Total (Category) | 152 (47.6%) | 167 (52.3%) |
| Total (Overall) | 634 (55.1%) | 516 (44.9%) |
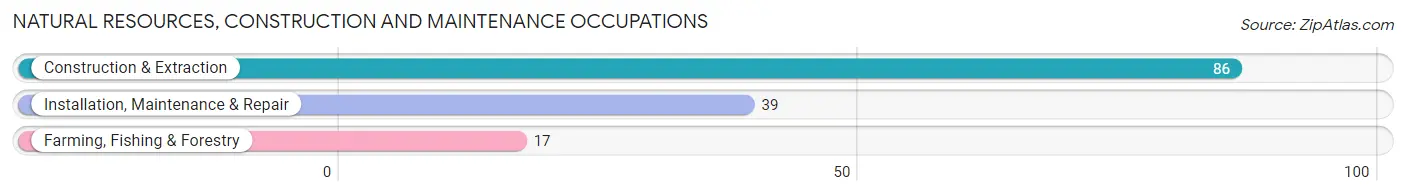
Natural Resources, Construction and Maintenance Occupations
The most common Natural Resources, Construction and Maintenance occupations in Mattapoisett Center are Construction & Extraction (86 | 7.5%), Installation, Maintenance & Repair (39 | 3.4%), and Farming, Fishing & Forestry (17 | 1.5%).
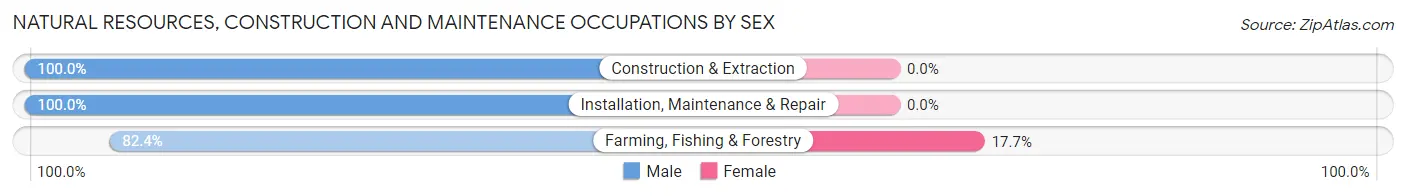
Natural Resources, Construction and Maintenance Occupations by Sex
| Occupation | Male | Female |
| Farming, Fishing & Forestry | 14 (82.4%) | 3 (17.6%) |
| Construction & Extraction | 86 (100.0%) | 0 (0.0%) |
| Installation, Maintenance & Repair | 39 (100.0%) | 0 (0.0%) |
| Total (Category) | 139 (97.9%) | 3 (2.1%) |
| Total (Overall) | 634 (55.1%) | 516 (44.9%) |
Production, Transportation and Moving Occupations
The most common Production, Transportation and Moving occupations in Mattapoisett Center are Material Moving (57 | 5.0%), and Transportation (14 | 1.2%).
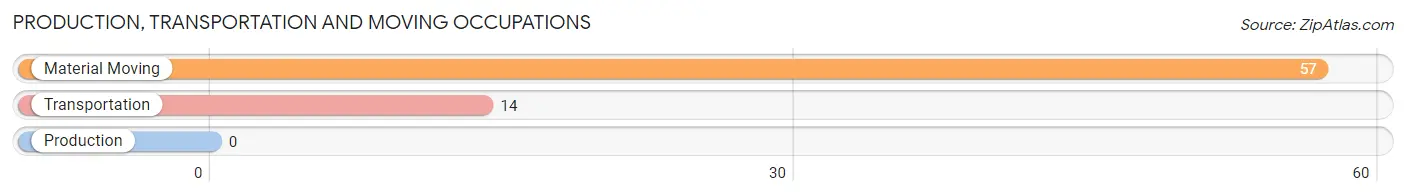
Production, Transportation and Moving Occupations by Sex
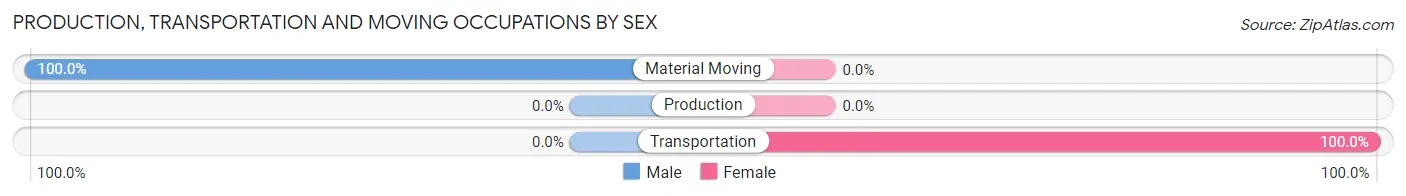
| Occupation | Male | Female |
| Production | 0 (0.0%) | 0 (0.0%) |
| Transportation | 0 (0.0%) | 14 (100.0%) |
| Material Moving | 57 (100.0%) | 0 (0.0%) |
| Total (Category) | 57 (80.3%) | 14 (19.7%) |
| Total (Overall) | 634 (55.1%) | 516 (44.9%) |
Employment Industries by Sex in Mattapoisett Center
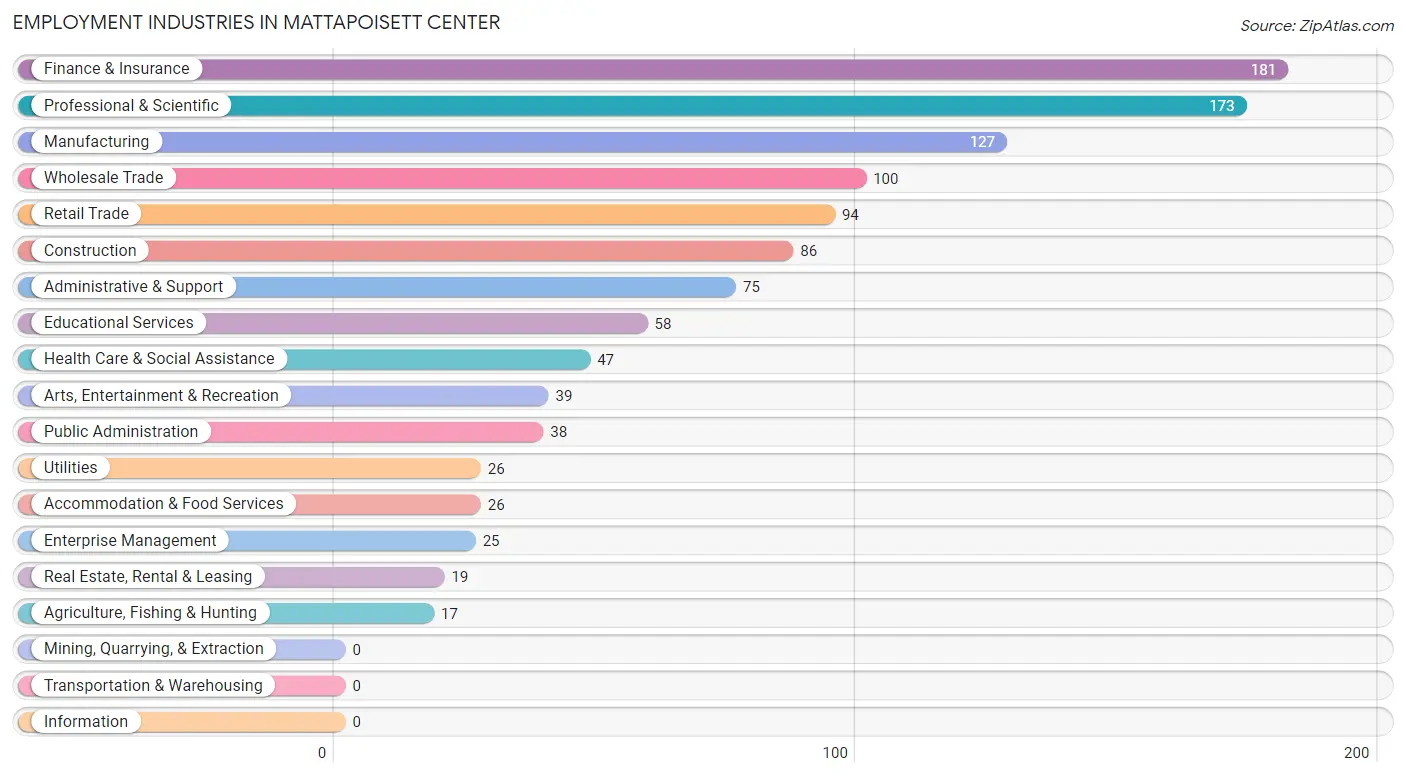
Employment Industries in Mattapoisett Center
The major employment industries in Mattapoisett Center include Finance & Insurance (181 | 15.7%), Professional & Scientific (173 | 15.0%), Manufacturing (127 | 11.0%), Wholesale Trade (100 | 8.7%), and Retail Trade (94 | 8.2%).
Employment Industries by Sex in Mattapoisett Center
The Mattapoisett Center industries that see more men than women are Construction (100.0%), Wholesale Trade (100.0%), and Utilities (100.0%), whereas the industries that tend to have a higher number of women are Health Care & Social Assistance (100.0%), Public Administration (100.0%), and Finance & Insurance (73.5%).
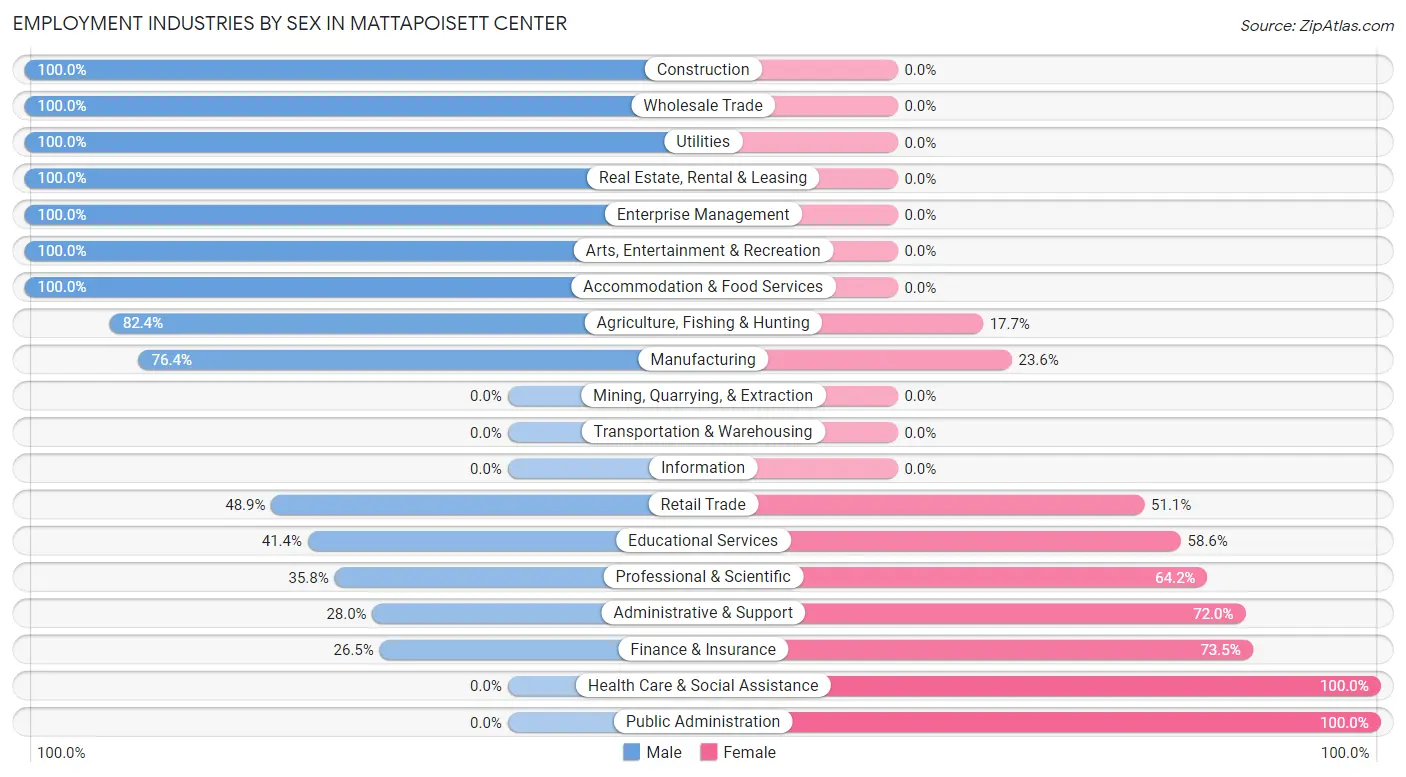
| Industry | Male | Female |
| Agriculture, Fishing & Hunting | 14 (82.4%) | 3 (17.6%) |
| Mining, Quarrying, & Extraction | 0 (0.0%) | 0 (0.0%) |
| Construction | 86 (100.0%) | 0 (0.0%) |
| Manufacturing | 97 (76.4%) | 30 (23.6%) |
| Wholesale Trade | 100 (100.0%) | 0 (0.0%) |
| Retail Trade | 46 (48.9%) | 48 (51.1%) |
| Transportation & Warehousing | 0 (0.0%) | 0 (0.0%) |
| Utilities | 26 (100.0%) | 0 (0.0%) |
| Information | 0 (0.0%) | 0 (0.0%) |
| Finance & Insurance | 48 (26.5%) | 133 (73.5%) |
| Real Estate, Rental & Leasing | 19 (100.0%) | 0 (0.0%) |
| Professional & Scientific | 62 (35.8%) | 111 (64.2%) |
| Enterprise Management | 25 (100.0%) | 0 (0.0%) |
| Administrative & Support | 21 (28.0%) | 54 (72.0%) |
| Educational Services | 24 (41.4%) | 34 (58.6%) |
| Health Care & Social Assistance | 0 (0.0%) | 47 (100.0%) |
| Arts, Entertainment & Recreation | 39 (100.0%) | 0 (0.0%) |
| Accommodation & Food Services | 26 (100.0%) | 0 (0.0%) |
| Public Administration | 0 (0.0%) | 38 (100.0%) |
| Total | 634 (55.1%) | 516 (44.9%) |
Education in Mattapoisett Center
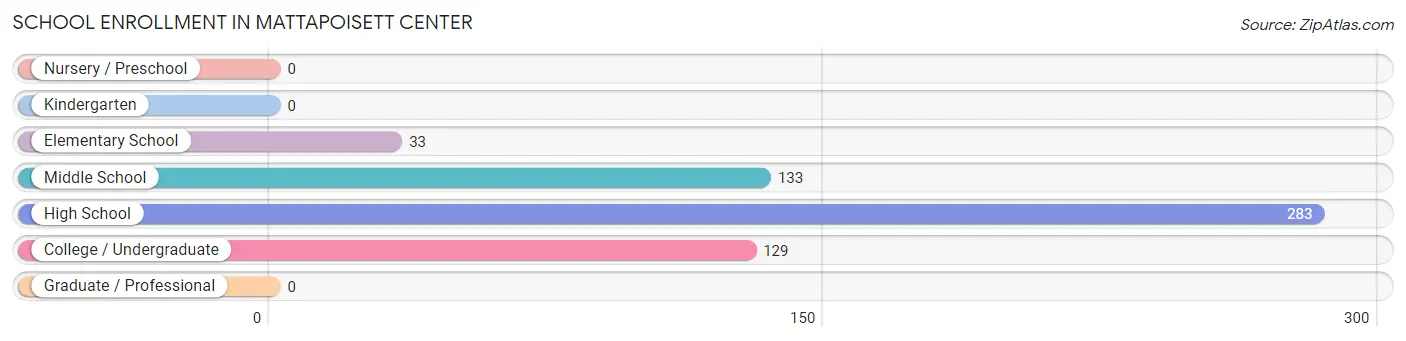
School Enrollment in Mattapoisett Center
The most common levels of schooling among the 578 students in Mattapoisett Center are high school (283 | 49.0%), middle school (133 | 23.0%), and college / undergraduate (129 | 22.3%).
| School Level | # Students | % Students |
| Nursery / Preschool | 0 | 0.0% |
| Kindergarten | 0 | 0.0% |
| Elementary School | 33 | 5.7% |
| Middle School | 133 | 23.0% |
| High School | 283 | 49.0% |
| College / Undergraduate | 129 | 22.3% |
| Graduate / Professional | 0 | 0.0% |
| Total | 578 | 100.0% |
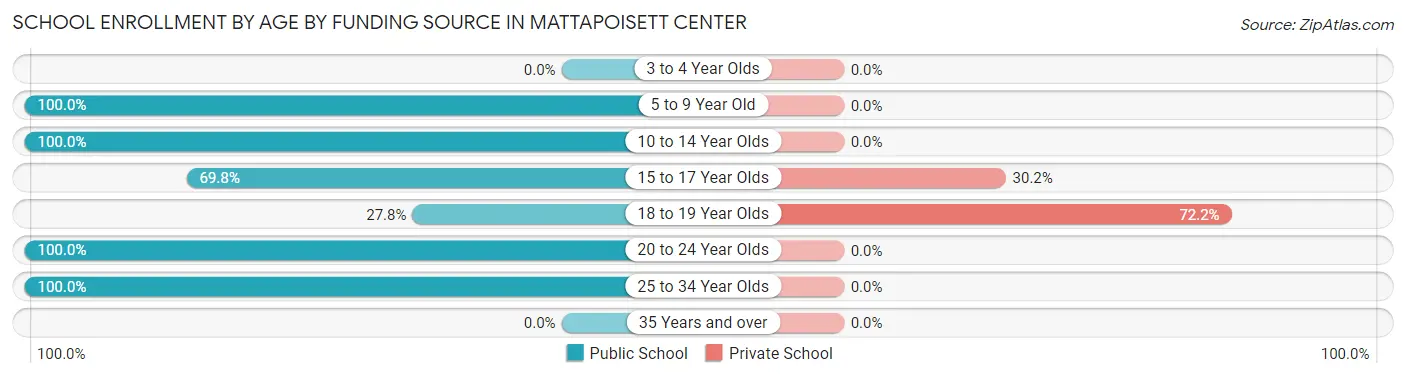
School Enrollment by Age by Funding Source in Mattapoisett Center
Out of a total of 578 students who are enrolled in schools in Mattapoisett Center, 84 (14.5%) attend a private institution, while the remaining 494 (85.5%) are enrolled in public schools. The age group of 18 to 19 year olds has the highest likelihood of being enrolled in private schools, with 65 (72.2% in the age bracket) enrolled. Conversely, the age group of 5 to 9 year old has the lowest likelihood of being enrolled in a private school, with 33 (100.0% in the age bracket) attending a public institution.
| Age Bracket | Public School | Private School |
| 3 to 4 Year Olds | 0 (0.0%) | 0 (0.0%) |
| 5 to 9 Year Old | 33 (100.0%) | 0 (0.0%) |
| 10 to 14 Year Olds | 323 (100.0%) | 0 (0.0%) |
| 15 to 17 Year Olds | 44 (69.8%) | 19 (30.2%) |
| 18 to 19 Year Olds | 25 (27.8%) | 65 (72.2%) |
| 20 to 24 Year Olds | 26 (100.0%) | 0 (0.0%) |
| 25 to 34 Year Olds | 43 (100.0%) | 0 (0.0%) |
| 35 Years and over | 0 (0.0%) | 0 (0.0%) |
| Total | 494 (85.5%) | 84 (14.5%) |
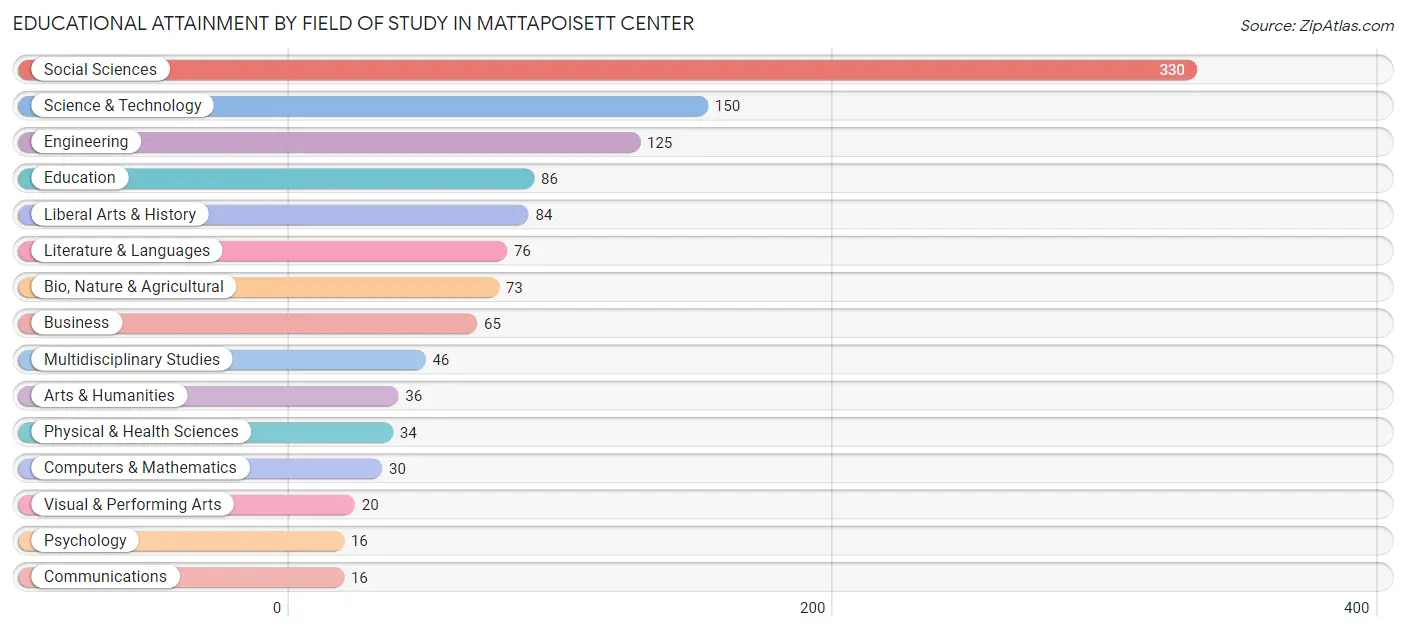
Educational Attainment by Field of Study in Mattapoisett Center
Social sciences (330 | 27.8%), science & technology (150 | 12.6%), engineering (125 | 10.5%), education (86 | 7.2%), and liberal arts & history (84 | 7.1%) are the most common fields of study among 1,187 individuals in Mattapoisett Center who have obtained a bachelor's degree or higher.
| Field of Study | # Graduates | % Graduates |
| Computers & Mathematics | 30 | 2.5% |
| Bio, Nature & Agricultural | 73 | 6.1% |
| Physical & Health Sciences | 34 | 2.9% |
| Psychology | 16 | 1.3% |
| Social Sciences | 330 | 27.8% |
| Engineering | 125 | 10.5% |
| Multidisciplinary Studies | 46 | 3.9% |
| Science & Technology | 150 | 12.6% |
| Business | 65 | 5.5% |
| Education | 86 | 7.2% |
| Literature & Languages | 76 | 6.4% |
| Liberal Arts & History | 84 | 7.1% |
| Visual & Performing Arts | 20 | 1.7% |
| Communications | 16 | 1.3% |
| Arts & Humanities | 36 | 3.0% |
| Total | 1,187 | 100.0% |
Transportation & Commute in Mattapoisett Center
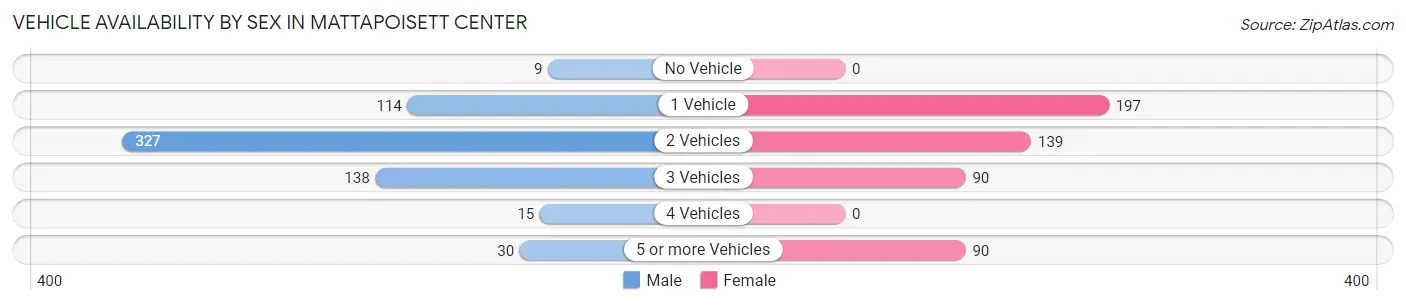
Vehicle Availability by Sex in Mattapoisett Center
The most prevalent vehicle ownership categories in Mattapoisett Center are males with 2 vehicles (327, accounting for 51.7%) and females with 2 vehicles (139, making up 63.4%).
| Vehicles Available | Male | Female |
| No Vehicle | 9 (1.4%) | 0 (0.0%) |
| 1 Vehicle | 114 (18.0%) | 197 (38.2%) |
| 2 Vehicles | 327 (51.7%) | 139 (26.9%) |
| 3 Vehicles | 138 (21.8%) | 90 (17.4%) |
| 4 Vehicles | 15 (2.4%) | 0 (0.0%) |
| 5 or more Vehicles | 30 (4.7%) | 90 (17.4%) |
| Total | 633 (100.0%) | 516 (100.0%) |
Commute Time in Mattapoisett Center
The most frequently occuring commute durations in Mattapoisett Center are 15 to 19 minutes (200 commuters, 26.3%), 60 to 89 minutes (182 commuters, 23.9%), and 45 to 59 minutes (77 commuters, 10.1%).
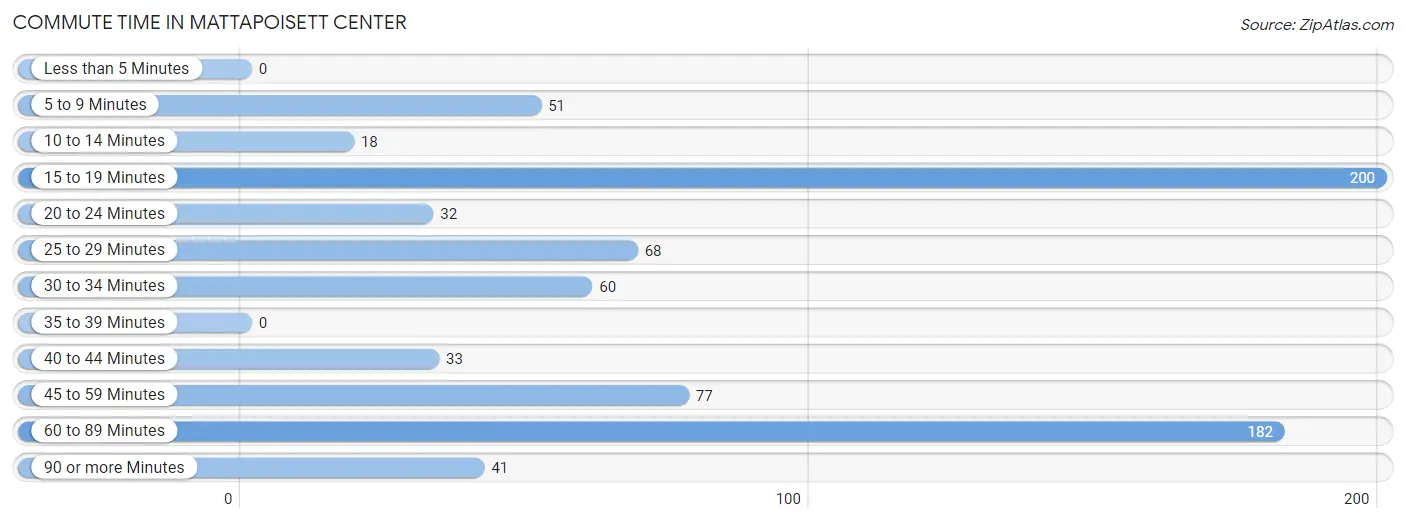
| Commute Time | # Commuters | % Commuters |
| Less than 5 Minutes | 0 | 0.0% |
| 5 to 9 Minutes | 51 | 6.7% |
| 10 to 14 Minutes | 18 | 2.4% |
| 15 to 19 Minutes | 200 | 26.3% |
| 20 to 24 Minutes | 32 | 4.2% |
| 25 to 29 Minutes | 68 | 8.9% |
| 30 to 34 Minutes | 60 | 7.9% |
| 35 to 39 Minutes | 0 | 0.0% |
| 40 to 44 Minutes | 33 | 4.3% |
| 45 to 59 Minutes | 77 | 10.1% |
| 60 to 89 Minutes | 182 | 23.9% |
| 90 or more Minutes | 41 | 5.4% |
Commute Time by Sex in Mattapoisett Center
The most common commute times in Mattapoisett Center are 60 to 89 minutes (122 commuters, 30.2%) for males and 15 to 19 minutes (93 commuters, 26.0%) for females.
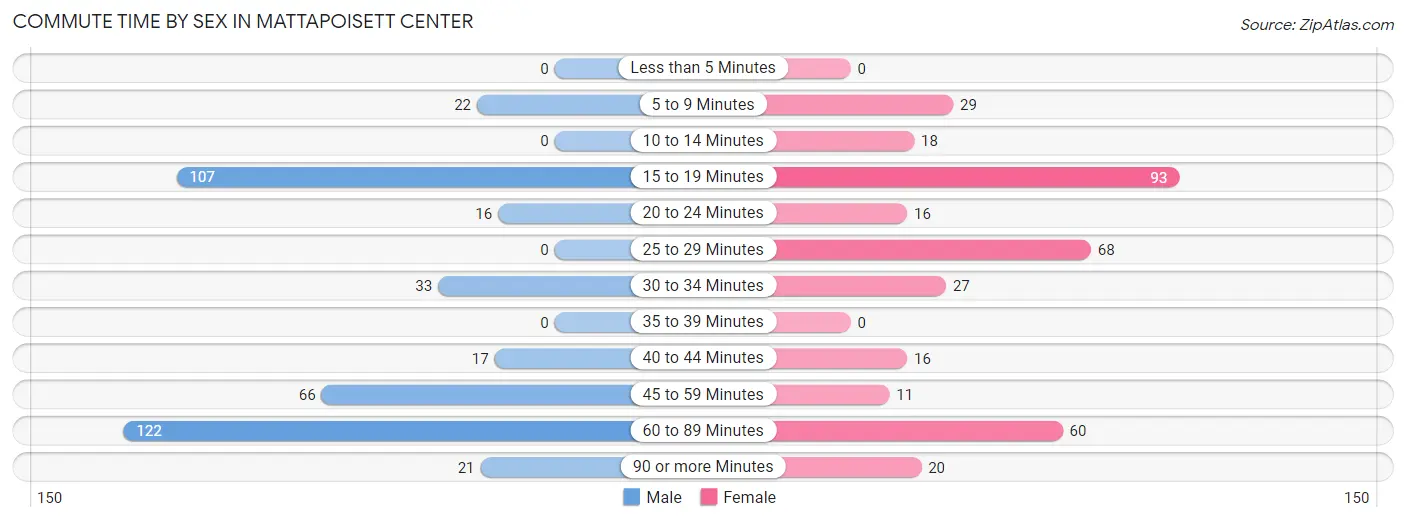
| Commute Time | Male | Female |
| Less than 5 Minutes | 0 (0.0%) | 0 (0.0%) |
| 5 to 9 Minutes | 22 (5.4%) | 29 (8.1%) |
| 10 to 14 Minutes | 0 (0.0%) | 18 (5.0%) |
| 15 to 19 Minutes | 107 (26.5%) | 93 (26.0%) |
| 20 to 24 Minutes | 16 (4.0%) | 16 (4.5%) |
| 25 to 29 Minutes | 0 (0.0%) | 68 (19.0%) |
| 30 to 34 Minutes | 33 (8.2%) | 27 (7.5%) |
| 35 to 39 Minutes | 0 (0.0%) | 0 (0.0%) |
| 40 to 44 Minutes | 17 (4.2%) | 16 (4.5%) |
| 45 to 59 Minutes | 66 (16.3%) | 11 (3.1%) |
| 60 to 89 Minutes | 122 (30.2%) | 60 (16.8%) |
| 90 or more Minutes | 21 (5.2%) | 20 (5.6%) |
Time of Departure to Work by Sex in Mattapoisett Center
The most frequent times of departure to work in Mattapoisett Center are 7:30 AM to 7:59 AM (70, 17.3%) for males and 7:00 AM to 7:29 AM (125, 34.9%) for females.
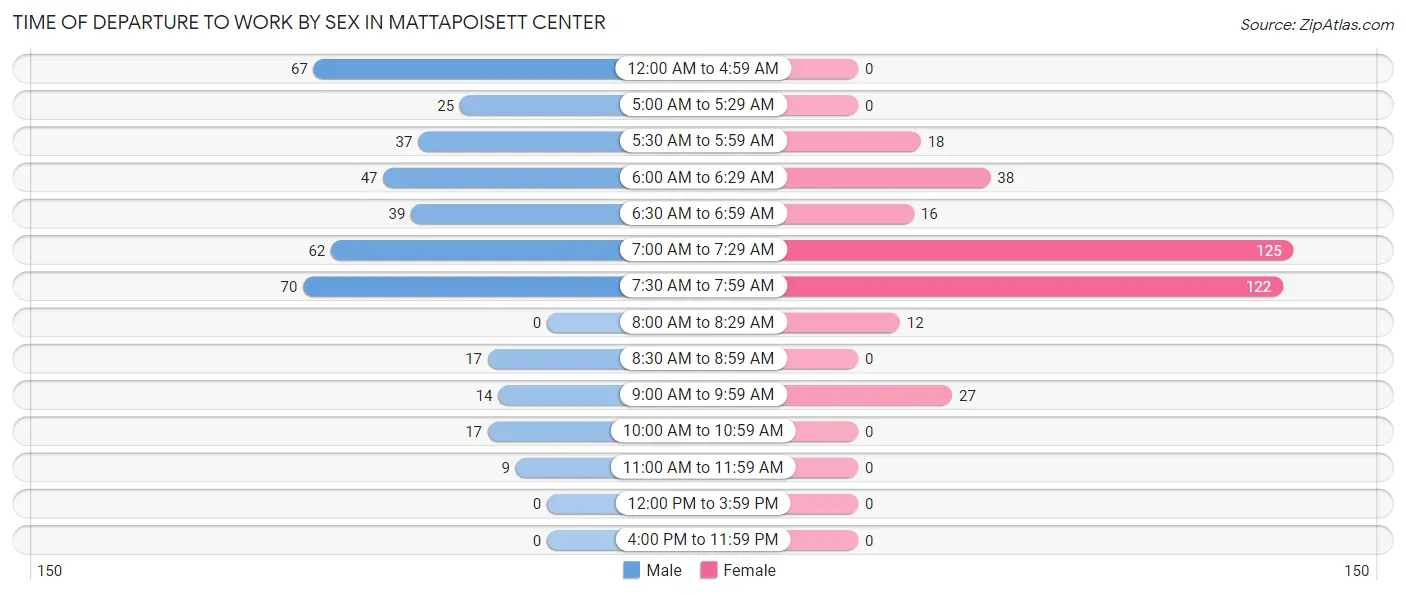
| Time of Departure | Male | Female |
| 12:00 AM to 4:59 AM | 67 (16.6%) | 0 (0.0%) |
| 5:00 AM to 5:29 AM | 25 (6.2%) | 0 (0.0%) |
| 5:30 AM to 5:59 AM | 37 (9.2%) | 18 (5.0%) |
| 6:00 AM to 6:29 AM | 47 (11.6%) | 38 (10.6%) |
| 6:30 AM to 6:59 AM | 39 (9.7%) | 16 (4.5%) |
| 7:00 AM to 7:29 AM | 62 (15.3%) | 125 (34.9%) |
| 7:30 AM to 7:59 AM | 70 (17.3%) | 122 (34.1%) |
| 8:00 AM to 8:29 AM | 0 (0.0%) | 12 (3.4%) |
| 8:30 AM to 8:59 AM | 17 (4.2%) | 0 (0.0%) |
| 9:00 AM to 9:59 AM | 14 (3.5%) | 27 (7.5%) |
| 10:00 AM to 10:59 AM | 17 (4.2%) | 0 (0.0%) |
| 11:00 AM to 11:59 AM | 9 (2.2%) | 0 (0.0%) |
| 12:00 PM to 3:59 PM | 0 (0.0%) | 0 (0.0%) |
| 4:00 PM to 11:59 PM | 0 (0.0%) | 0 (0.0%) |
| Total | 404 (100.0%) | 358 (100.0%) |
Housing Occupancy in Mattapoisett Center
Occupancy by Ownership in Mattapoisett Center
Of the total 1,301 dwellings in Mattapoisett Center, owner-occupied units account for 929 (71.4%), while renter-occupied units make up 372 (28.6%).
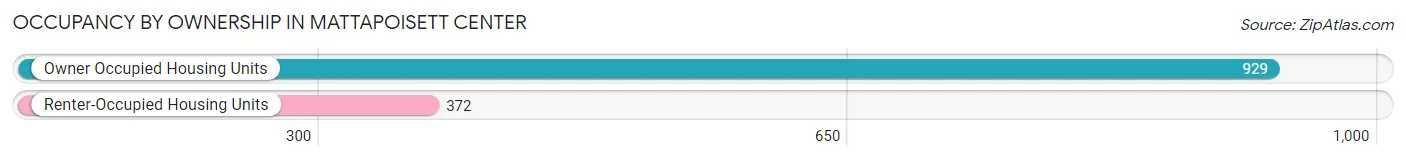
| Occupancy | # Housing Units | % Housing Units |
| Owner Occupied Housing Units | 929 | 71.4% |
| Renter-Occupied Housing Units | 372 | 28.6% |
| Total Occupied Housing Units | 1,301 | 100.0% |
Occupancy by Household Size in Mattapoisett Center
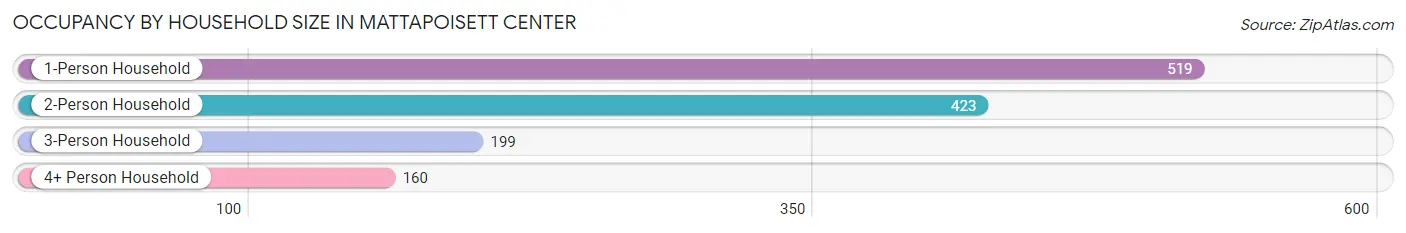
| Household Size | # Housing Units | % Housing Units |
| 1-Person Household | 519 | 39.9% |
| 2-Person Household | 423 | 32.5% |
| 3-Person Household | 199 | 15.3% |
| 4+ Person Household | 160 | 12.3% |
| Total Housing Units | 1,301 | 100.0% |
Occupancy by Ownership by Household Size in Mattapoisett Center
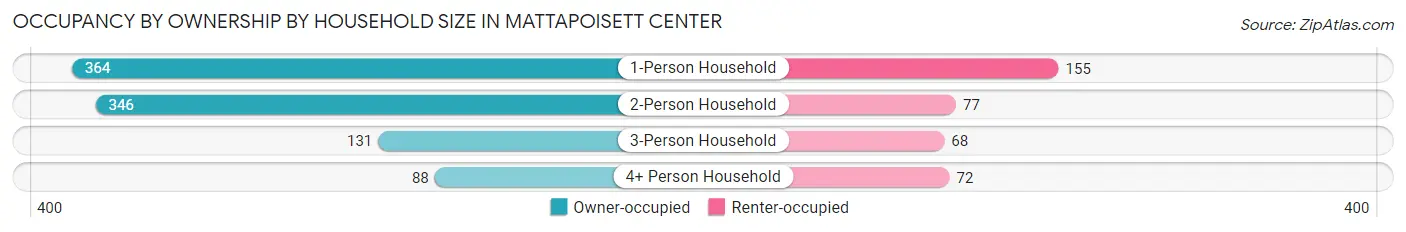
| Household Size | Owner-occupied | Renter-occupied |
| 1-Person Household | 364 (70.1%) | 155 (29.9%) |
| 2-Person Household | 346 (81.8%) | 77 (18.2%) |
| 3-Person Household | 131 (65.8%) | 68 (34.2%) |
| 4+ Person Household | 88 (55.0%) | 72 (45.0%) |
| Total Housing Units | 929 (71.4%) | 372 (28.6%) |
Occupancy by Educational Attainment in Mattapoisett Center
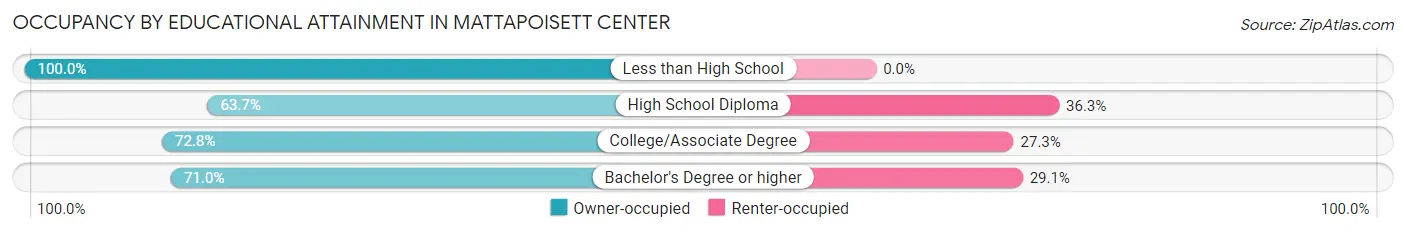
| Household Size | Owner-occupied | Renter-occupied |
| Less than High School | 23 (100.0%) | 0 (0.0%) |
| High School Diploma | 65 (63.7%) | 37 (36.3%) |
| College/Associate Degree | 267 (72.8%) | 100 (27.3%) |
| Bachelor's Degree or higher | 574 (71.0%) | 235 (29.0%) |
Occupancy by Age of Householder in Mattapoisett Center
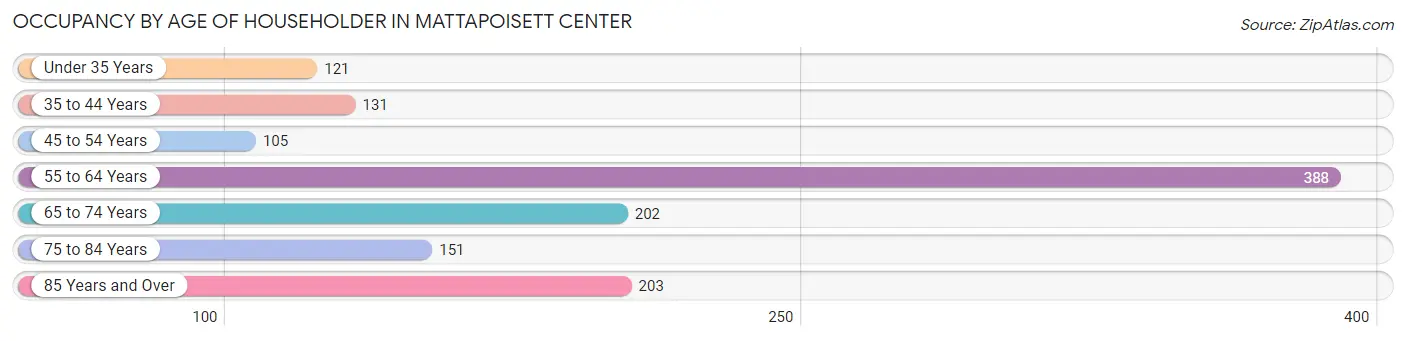
| Age Bracket | # Households | % Households |
| Under 35 Years | 121 | 9.3% |
| 35 to 44 Years | 131 | 10.1% |
| 45 to 54 Years | 105 | 8.1% |
| 55 to 64 Years | 388 | 29.8% |
| 65 to 74 Years | 202 | 15.5% |
| 75 to 84 Years | 151 | 11.6% |
| 85 Years and Over | 203 | 15.6% |
| Total | 1,301 | 100.0% |
Housing Finances in Mattapoisett Center
Median Income by Occupancy in Mattapoisett Center
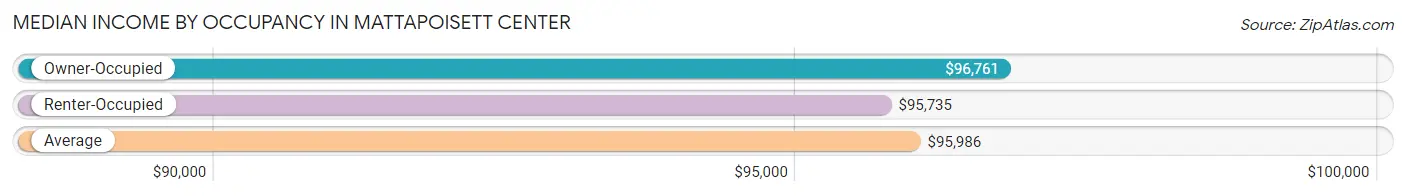
| Occupancy Type | # Households | Median Income |
| Owner-Occupied | 929 (71.4%) | $96,761 |
| Renter-Occupied | 372 (28.6%) | $95,735 |
| Average | 1,301 (100.0%) | $95,986 |
Occupancy by Householder Income Bracket in Mattapoisett Center
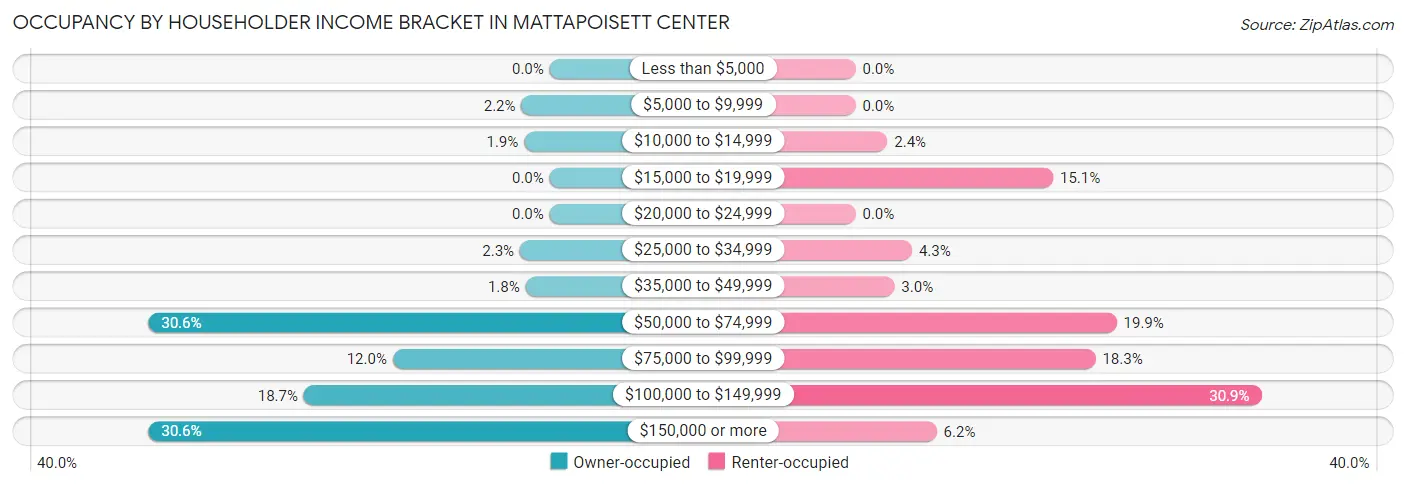
| Income Bracket | Owner-occupied | Renter-occupied |
| Less than $5,000 | 0 (0.0%) | 0 (0.0%) |
| $5,000 to $9,999 | 20 (2.1%) | 0 (0.0%) |
| $10,000 to $14,999 | 18 (1.9%) | 9 (2.4%) |
| $15,000 to $19,999 | 0 (0.0%) | 56 (15.0%) |
| $20,000 to $24,999 | 0 (0.0%) | 0 (0.0%) |
| $25,000 to $34,999 | 21 (2.3%) | 16 (4.3%) |
| $35,000 to $49,999 | 17 (1.8%) | 11 (3.0%) |
| $50,000 to $74,999 | 284 (30.6%) | 74 (19.9%) |
| $75,000 to $99,999 | 111 (11.9%) | 68 (18.3%) |
| $100,000 to $149,999 | 174 (18.7%) | 115 (30.9%) |
| $150,000 or more | 284 (30.6%) | 23 (6.2%) |
| Total | 929 (100.0%) | 372 (100.0%) |
Monthly Housing Cost Tiers in Mattapoisett Center
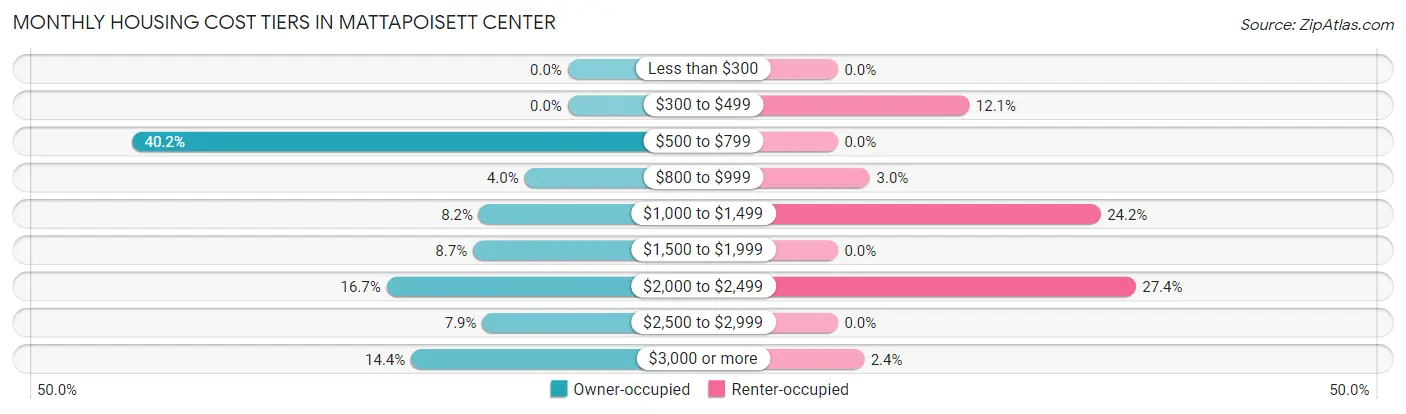
| Monthly Cost | Owner-occupied | Renter-occupied |
| Less than $300 | 0 (0.0%) | 0 (0.0%) |
| $300 to $499 | 0 (0.0%) | 45 (12.1%) |
| $500 to $799 | 373 (40.2%) | 0 (0.0%) |
| $800 to $999 | 37 (4.0%) | 11 (3.0%) |
| $1,000 to $1,499 | 76 (8.2%) | 90 (24.2%) |
| $1,500 to $1,999 | 81 (8.7%) | 0 (0.0%) |
| $2,000 to $2,499 | 155 (16.7%) | 102 (27.4%) |
| $2,500 to $2,999 | 73 (7.9%) | 0 (0.0%) |
| $3,000 or more | 134 (14.4%) | 9 (2.4%) |
| Total | 929 (100.0%) | 372 (100.0%) |
Physical Housing Characteristics in Mattapoisett Center
Housing Structures in Mattapoisett Center
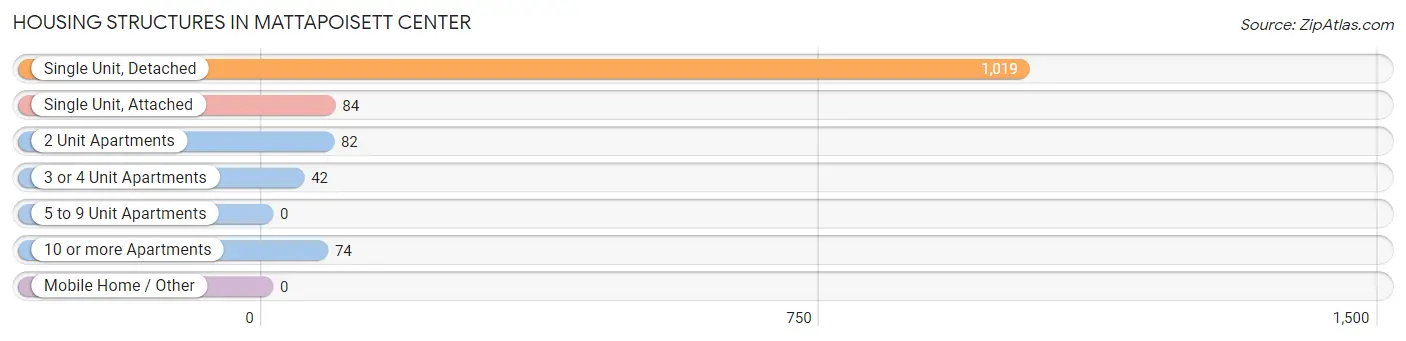
| Structure Type | # Housing Units | % Housing Units |
| Single Unit, Detached | 1,019 | 78.3% |
| Single Unit, Attached | 84 | 6.5% |
| 2 Unit Apartments | 82 | 6.3% |
| 3 or 4 Unit Apartments | 42 | 3.2% |
| 5 to 9 Unit Apartments | 0 | 0.0% |
| 10 or more Apartments | 74 | 5.7% |
| Mobile Home / Other | 0 | 0.0% |
| Total | 1,301 | 100.0% |
Housing Structures by Occupancy in Mattapoisett Center
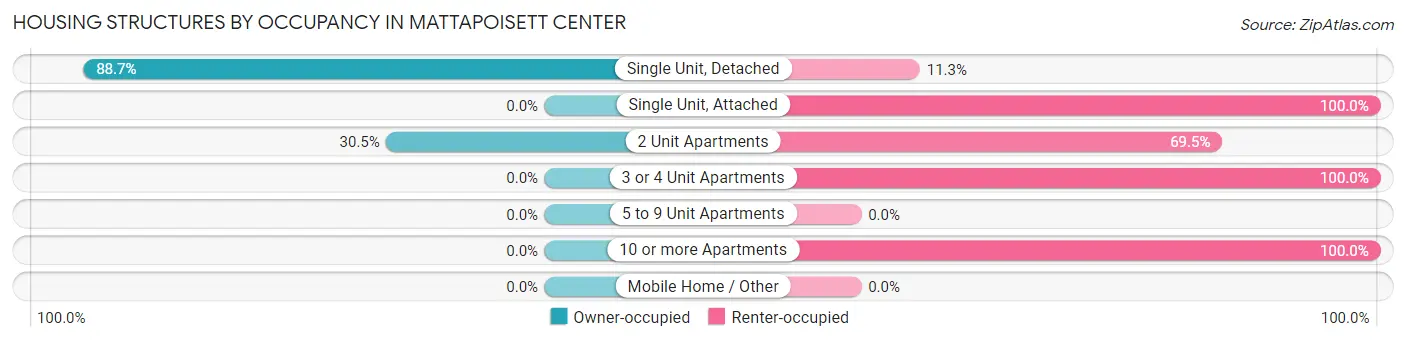
| Structure Type | Owner-occupied | Renter-occupied |
| Single Unit, Detached | 904 (88.7%) | 115 (11.3%) |
| Single Unit, Attached | 0 (0.0%) | 84 (100.0%) |
| 2 Unit Apartments | 25 (30.5%) | 57 (69.5%) |
| 3 or 4 Unit Apartments | 0 (0.0%) | 42 (100.0%) |
| 5 to 9 Unit Apartments | 0 (0.0%) | 0 (0.0%) |
| 10 or more Apartments | 0 (0.0%) | 74 (100.0%) |
| Mobile Home / Other | 0 (0.0%) | 0 (0.0%) |
| Total | 929 (71.4%) | 372 (28.6%) |
Housing Structures by Number of Rooms in Mattapoisett Center
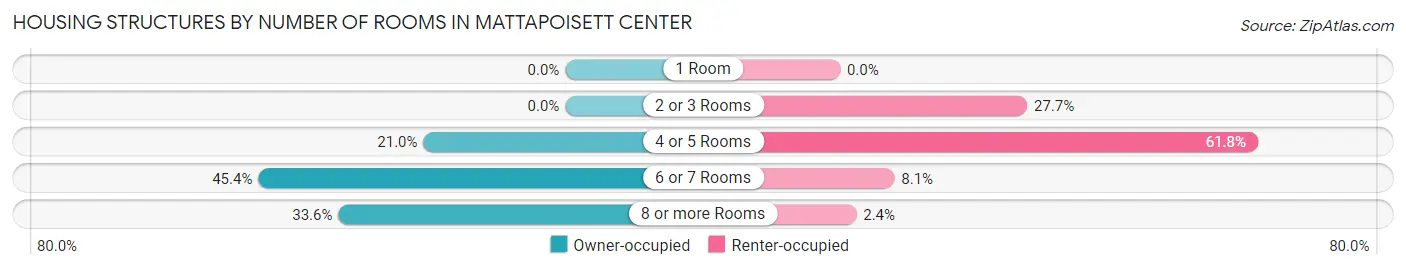
| Number of Rooms | Owner-occupied | Renter-occupied |
| 1 Room | 0 (0.0%) | 0 (0.0%) |
| 2 or 3 Rooms | 0 (0.0%) | 103 (27.7%) |
| 4 or 5 Rooms | 195 (21.0%) | 230 (61.8%) |
| 6 or 7 Rooms | 422 (45.4%) | 30 (8.1%) |
| 8 or more Rooms | 312 (33.6%) | 9 (2.4%) |
| Total | 929 (100.0%) | 372 (100.0%) |
Housing Structure by Heating Type in Mattapoisett Center
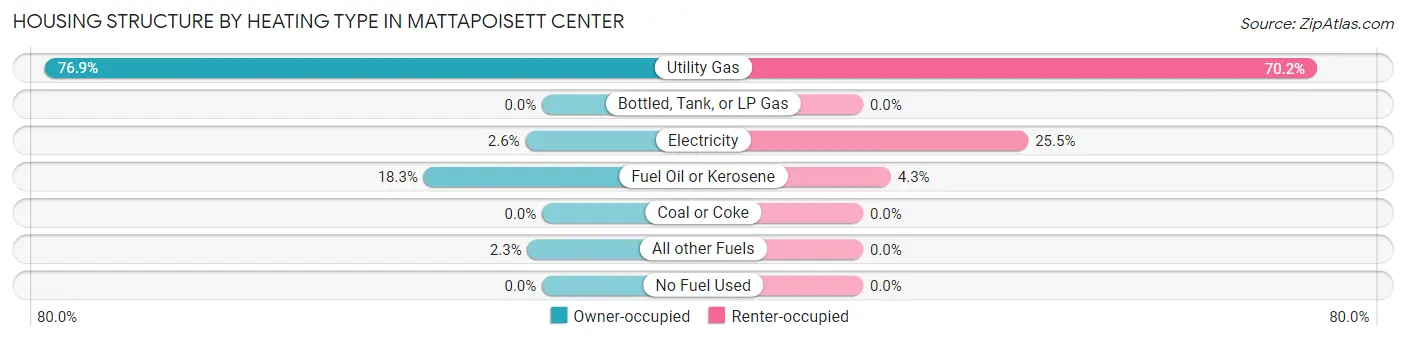
| Heating Type | Owner-occupied | Renter-occupied |
| Utility Gas | 714 (76.9%) | 261 (70.2%) |
| Bottled, Tank, or LP Gas | 0 (0.0%) | 0 (0.0%) |
| Electricity | 24 (2.6%) | 95 (25.5%) |
| Fuel Oil or Kerosene | 170 (18.3%) | 16 (4.3%) |
| Coal or Coke | 0 (0.0%) | 0 (0.0%) |
| All other Fuels | 21 (2.3%) | 0 (0.0%) |
| No Fuel Used | 0 (0.0%) | 0 (0.0%) |
| Total | 929 (100.0%) | 372 (100.0%) |
Household Vehicle Usage in Mattapoisett Center
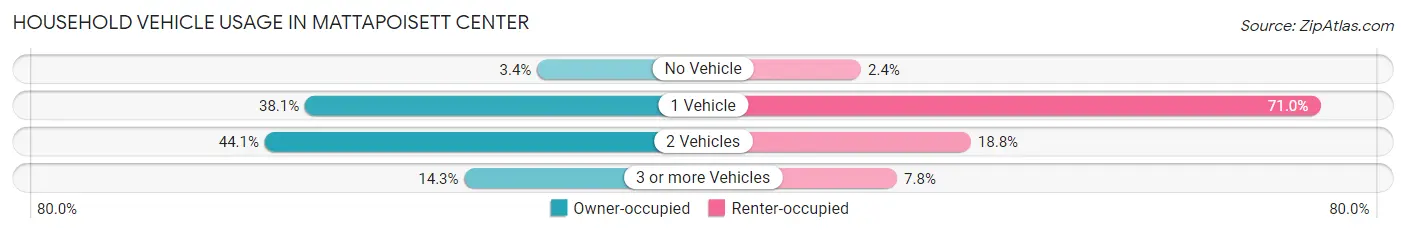
| Vehicles per Household | Owner-occupied | Renter-occupied |
| No Vehicle | 32 (3.4%) | 9 (2.4%) |
| 1 Vehicle | 354 (38.1%) | 264 (71.0%) |
| 2 Vehicles | 410 (44.1%) | 70 (18.8%) |
| 3 or more Vehicles | 133 (14.3%) | 29 (7.8%) |
| Total | 929 (100.0%) | 372 (100.0%) |
Real Estate & Mortgages in Mattapoisett Center
Real Estate and Mortgage Overview in Mattapoisett Center
| Characteristic | Without Mortgage | With Mortgage |
| Housing Units | 503 | 426 |
| Median Property Value | $605,200 | $594,500 |
| Median Household Income | $69,709 | $252 |
| Monthly Housing Costs | $758 | $134 |
| Real Estate Taxes | $5,835 | $0 |
Property Value by Mortgage Status in Mattapoisett Center
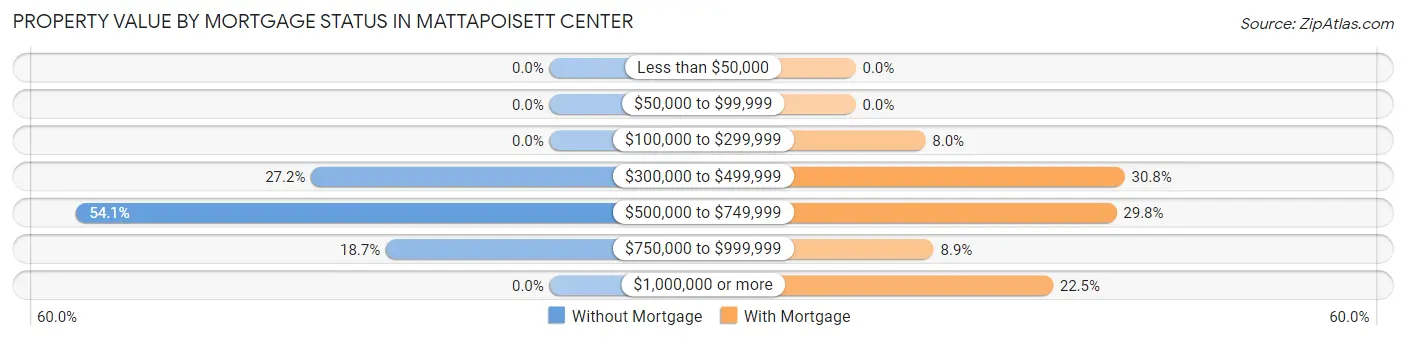
| Property Value | Without Mortgage | With Mortgage |
| Less than $50,000 | 0 (0.0%) | 0 (0.0%) |
| $50,000 to $99,999 | 0 (0.0%) | 0 (0.0%) |
| $100,000 to $299,999 | 0 (0.0%) | 34 (8.0%) |
| $300,000 to $499,999 | 137 (27.2%) | 131 (30.7%) |
| $500,000 to $749,999 | 272 (54.1%) | 127 (29.8%) |
| $750,000 to $999,999 | 94 (18.7%) | 38 (8.9%) |
| $1,000,000 or more | 0 (0.0%) | 96 (22.5%) |
| Total | 503 (100.0%) | 426 (100.0%) |
Household Income by Mortgage Status in Mattapoisett Center
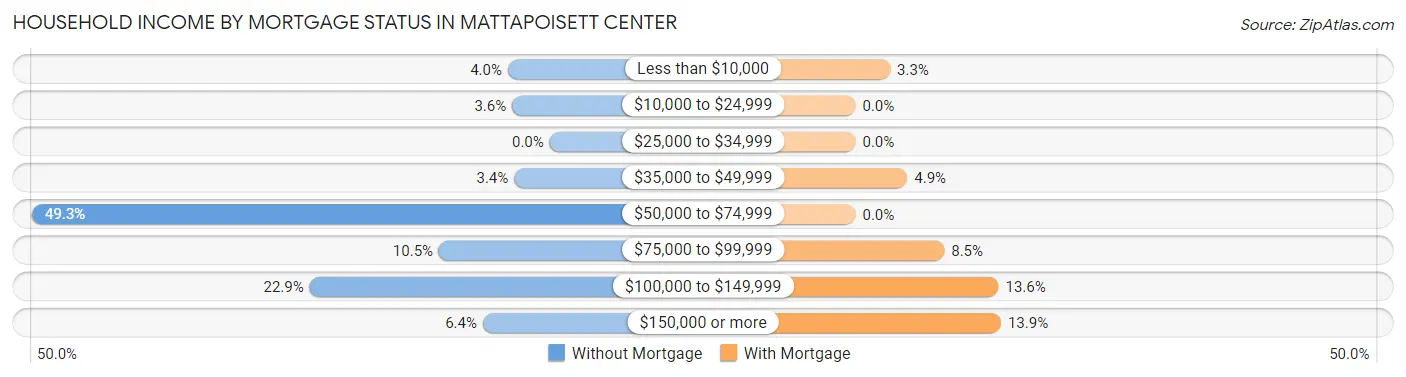
| Household Income | Without Mortgage | With Mortgage |
| Less than $10,000 | 20 (4.0%) | 14 (3.3%) |
| $10,000 to $24,999 | 18 (3.6%) | 0 (0.0%) |
| $25,000 to $34,999 | 0 (0.0%) | 0 (0.0%) |
| $35,000 to $49,999 | 17 (3.4%) | 21 (4.9%) |
| $50,000 to $74,999 | 248 (49.3%) | 0 (0.0%) |
| $75,000 to $99,999 | 53 (10.5%) | 36 (8.5%) |
| $100,000 to $149,999 | 115 (22.9%) | 58 (13.6%) |
| $150,000 or more | 32 (6.4%) | 59 (13.9%) |
| Total | 503 (100.0%) | 426 (100.0%) |
Property Value to Household Income Ratio in Mattapoisett Center
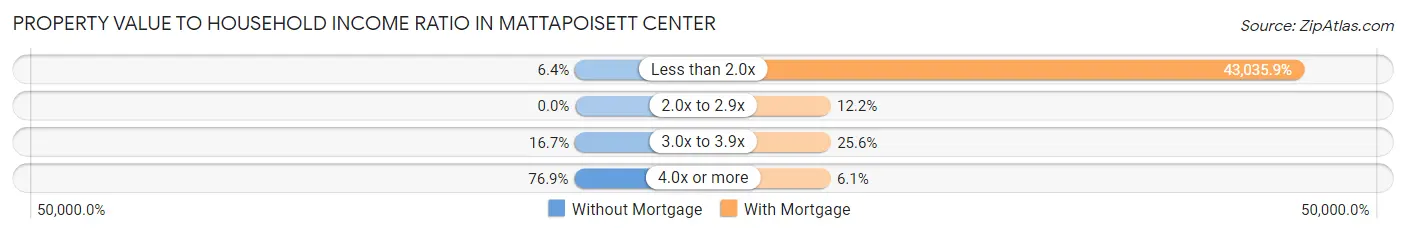
| Value-to-Income Ratio | Without Mortgage | With Mortgage |
| Less than 2.0x | 32 (6.4%) | 183,333 (43,035.9%) |
| 2.0x to 2.9x | 0 (0.0%) | 52 (12.2%) |
| 3.0x to 3.9x | 84 (16.7%) | 109 (25.6%) |
| 4.0x or more | 387 (76.9%) | 26 (6.1%) |
| Total | 503 (100.0%) | 426 (100.0%) |
Real Estate Taxes by Mortgage Status in Mattapoisett Center
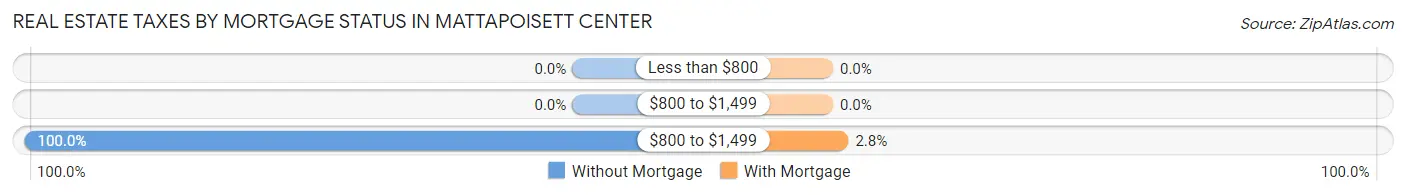
| Property Taxes | Without Mortgage | With Mortgage |
| Less than $800 | 0 (0.0%) | 0 (0.0%) |
| $800 to $1,499 | 0 (0.0%) | 0 (0.0%) |
| $800 to $1,499 | 503 (100.0%) | 12 (2.8%) |
| Total | 503 (100.0%) | 426 (100.0%) |
Health & Disability in Mattapoisett Center
Health Insurance Coverage by Age in Mattapoisett Center
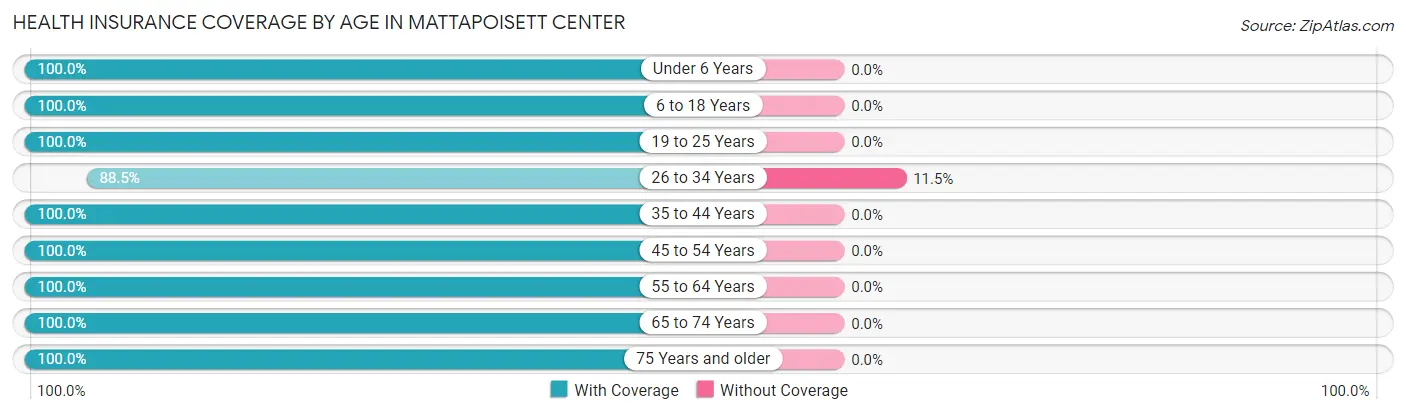
| Age Bracket | With Coverage | Without Coverage |
| Under 6 Years | 33 (100.0%) | 0 (0.0%) |
| 6 to 18 Years | 449 (100.0%) | 0 (0.0%) |
| 19 to 25 Years | 173 (100.0%) | 0 (0.0%) |
| 26 to 34 Years | 207 (88.5%) | 27 (11.5%) |
| 35 to 44 Years | 169 (100.0%) | 0 (0.0%) |
| 45 to 54 Years | 248 (100.0%) | 0 (0.0%) |
| 55 to 64 Years | 597 (100.0%) | 0 (0.0%) |
| 65 to 74 Years | 350 (100.0%) | 0 (0.0%) |
| 75 Years and older | 392 (100.0%) | 0 (0.0%) |
| Total | 2,618 (99.0%) | 27 (1.0%) |
Health Insurance Coverage by Citizenship Status in Mattapoisett Center
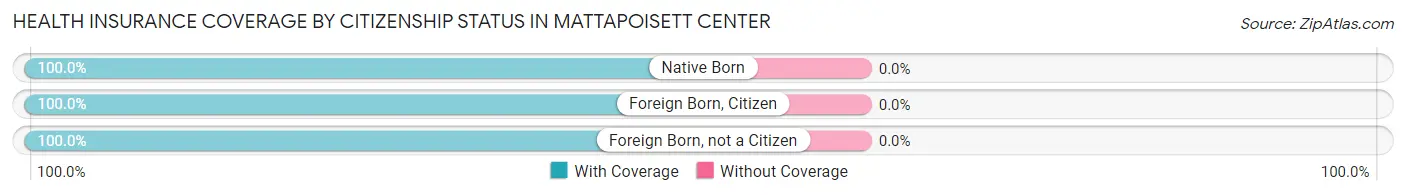
| Citizenship Status | With Coverage | Without Coverage |
| Native Born | 33 (100.0%) | 0 (0.0%) |
| Foreign Born, Citizen | 449 (100.0%) | 0 (0.0%) |
| Foreign Born, not a Citizen | 173 (100.0%) | 0 (0.0%) |
Health Insurance Coverage by Household Income in Mattapoisett Center
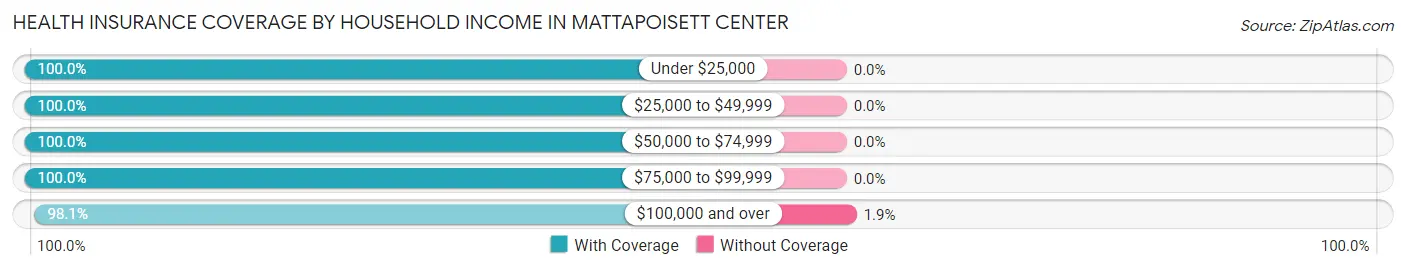
| Household Income | With Coverage | Without Coverage |
| Under $25,000 | 153 (100.0%) | 0 (0.0%) |
| $25,000 to $49,999 | 68 (100.0%) | 0 (0.0%) |
| $50,000 to $74,999 | 521 (100.0%) | 0 (0.0%) |
| $75,000 to $99,999 | 445 (100.0%) | 0 (0.0%) |
| $100,000 and over | 1,424 (98.1%) | 27 (1.9%) |
Public vs Private Health Insurance Coverage by Age in Mattapoisett Center
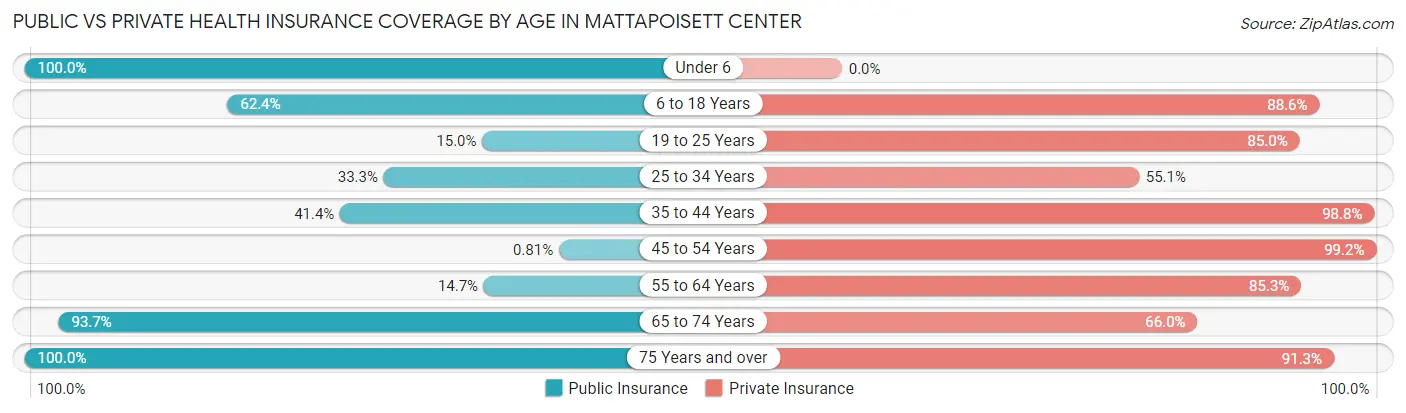
| Age Bracket | Public Insurance | Private Insurance |
| Under 6 | 33 (100.0%) | 0 (0.0%) |
| 6 to 18 Years | 280 (62.4%) | 398 (88.6%) |
| 19 to 25 Years | 26 (15.0%) | 147 (85.0%) |
| 25 to 34 Years | 78 (33.3%) | 129 (55.1%) |
| 35 to 44 Years | 70 (41.4%) | 167 (98.8%) |
| 45 to 54 Years | 2 (0.8%) | 246 (99.2%) |
| 55 to 64 Years | 88 (14.7%) | 509 (85.3%) |
| 65 to 74 Years | 328 (93.7%) | 231 (66.0%) |
| 75 Years and over | 392 (100.0%) | 358 (91.3%) |
| Total | 1,297 (49.0%) | 2,185 (82.6%) |
Disability Status by Sex by Age in Mattapoisett Center
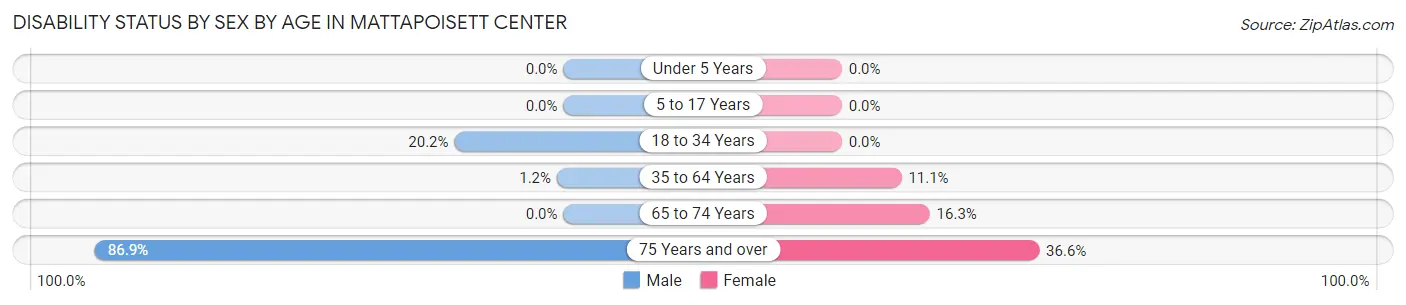
| Age Bracket | Male | Female |
| Under 5 Years | 0 (0.0%) | 0 (0.0%) |
| 5 to 17 Years | 0 (0.0%) | 0 (0.0%) |
| 18 to 34 Years | 35 (20.2%) | 0 (0.0%) |
| 35 to 64 Years | 5 (1.2%) | 66 (11.1%) |
| 65 to 74 Years | 0 (0.0%) | 23 (16.3%) |
| 75 Years and over | 253 (86.9%) | 37 (36.6%) |
Disability Class by Sex by Age in Mattapoisett Center
Disability Class: Hearing Difficulty
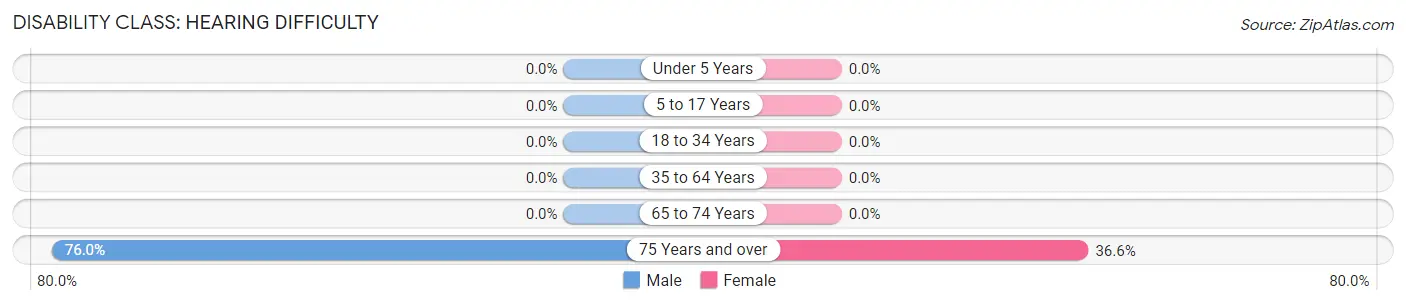
| Age Bracket | Male | Female |
| Under 5 Years | 0 (0.0%) | 0 (0.0%) |
| 5 to 17 Years | 0 (0.0%) | 0 (0.0%) |
| 18 to 34 Years | 0 (0.0%) | 0 (0.0%) |
| 35 to 64 Years | 0 (0.0%) | 0 (0.0%) |
| 65 to 74 Years | 0 (0.0%) | 0 (0.0%) |
| 75 Years and over | 221 (75.9%) | 37 (36.6%) |
Disability Class: Vision Difficulty
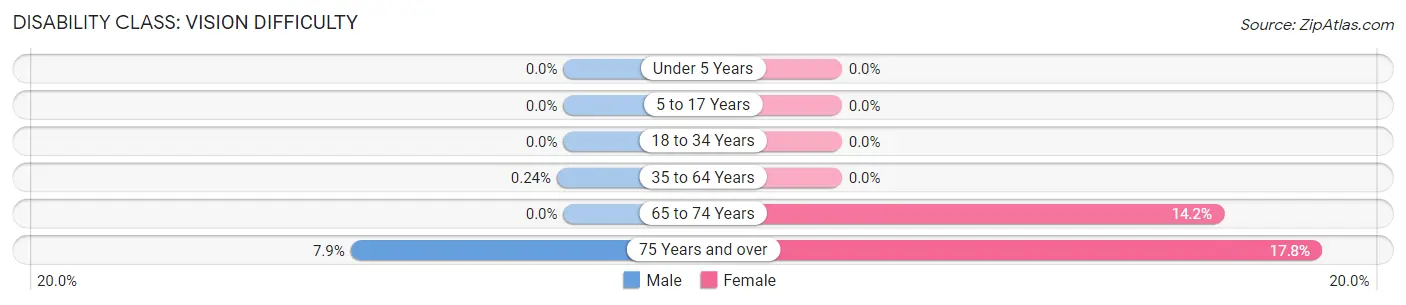
| Age Bracket | Male | Female |
| Under 5 Years | 0 (0.0%) | 0 (0.0%) |
| 5 to 17 Years | 0 (0.0%) | 0 (0.0%) |
| 18 to 34 Years | 0 (0.0%) | 0 (0.0%) |
| 35 to 64 Years | 1 (0.2%) | 0 (0.0%) |
| 65 to 74 Years | 0 (0.0%) | 20 (14.2%) |
| 75 Years and over | 23 (7.9%) | 18 (17.8%) |
Disability Class: Cognitive Difficulty
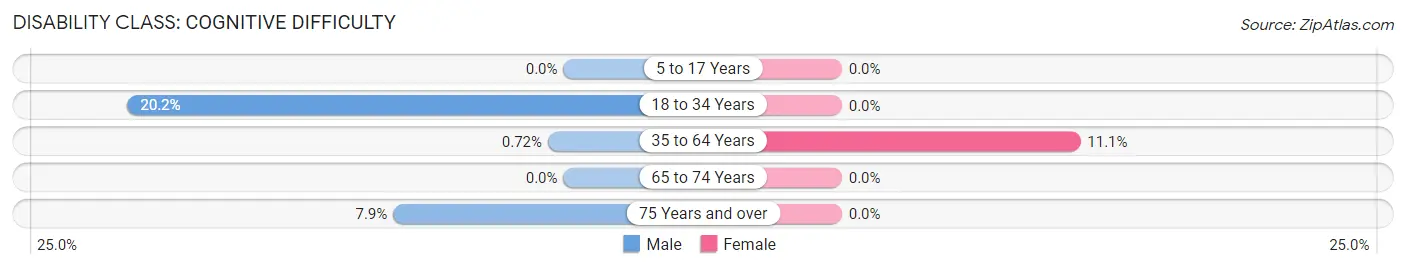
| Age Bracket | Male | Female |
| 5 to 17 Years | 0 (0.0%) | 0 (0.0%) |
| 18 to 34 Years | 35 (20.2%) | 0 (0.0%) |
| 35 to 64 Years | 3 (0.7%) | 66 (11.1%) |
| 65 to 74 Years | 0 (0.0%) | 0 (0.0%) |
| 75 Years and over | 23 (7.9%) | 0 (0.0%) |
Disability Class: Ambulatory Difficulty
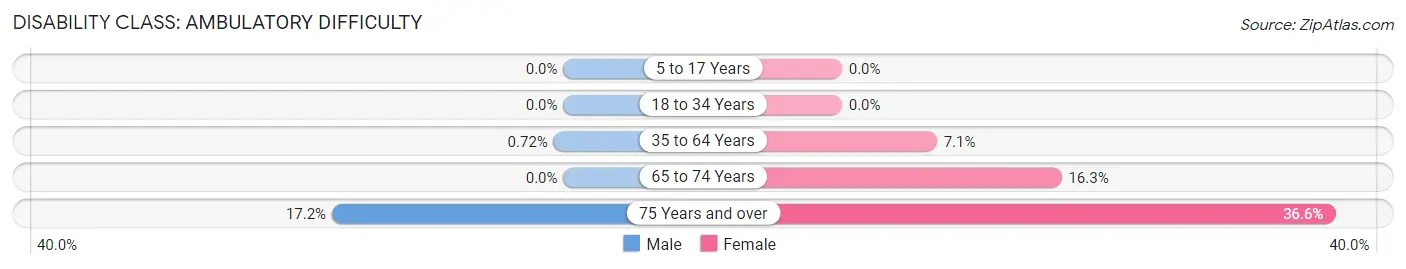
| Age Bracket | Male | Female |
| 5 to 17 Years | 0 (0.0%) | 0 (0.0%) |
| 18 to 34 Years | 0 (0.0%) | 0 (0.0%) |
| 35 to 64 Years | 3 (0.7%) | 42 (7.0%) |
| 65 to 74 Years | 0 (0.0%) | 23 (16.3%) |
| 75 Years and over | 50 (17.2%) | 37 (36.6%) |
Disability Class: Self-Care Difficulty
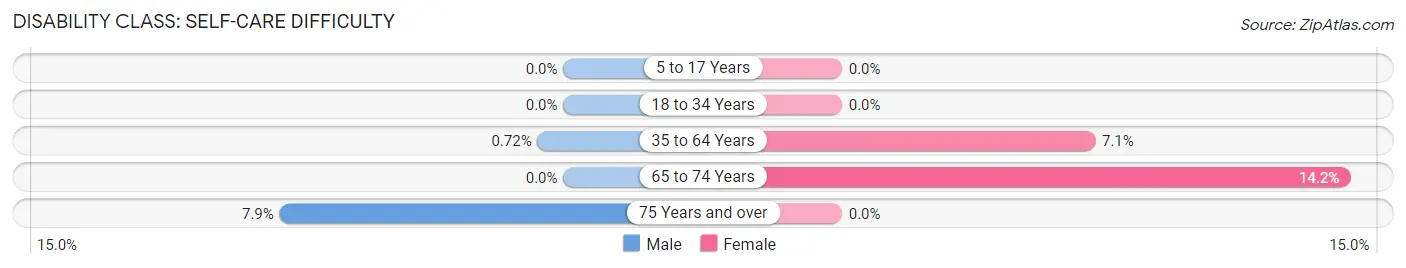
| Age Bracket | Male | Female |
| 5 to 17 Years | 0 (0.0%) | 0 (0.0%) |
| 18 to 34 Years | 0 (0.0%) | 0 (0.0%) |
| 35 to 64 Years | 3 (0.7%) | 42 (7.0%) |
| 65 to 74 Years | 0 (0.0%) | 20 (14.2%) |
| 75 Years and over | 23 (7.9%) | 0 (0.0%) |
Technology Access in Mattapoisett Center
Computing Device Access in Mattapoisett Center
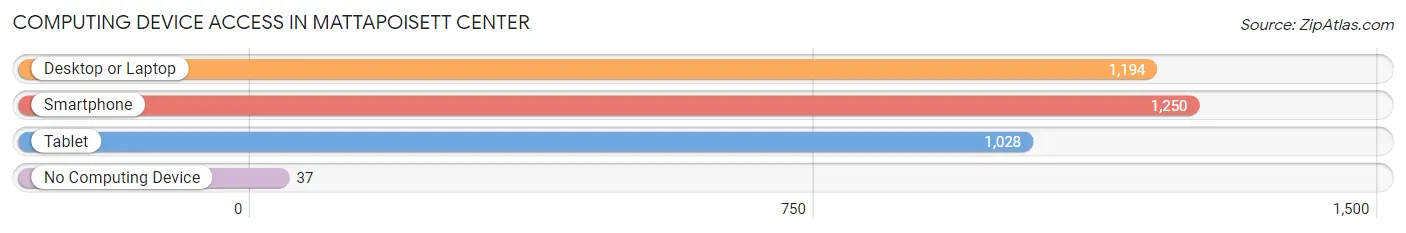
| Device Type | # Households | % Households |
| Desktop or Laptop | 1,194 | 91.8% |
| Smartphone | 1,250 | 96.1% |
| Tablet | 1,028 | 79.0% |
| No Computing Device | 37 | 2.8% |
| Total | 1,301 | 100.0% |
Internet Access in Mattapoisett Center
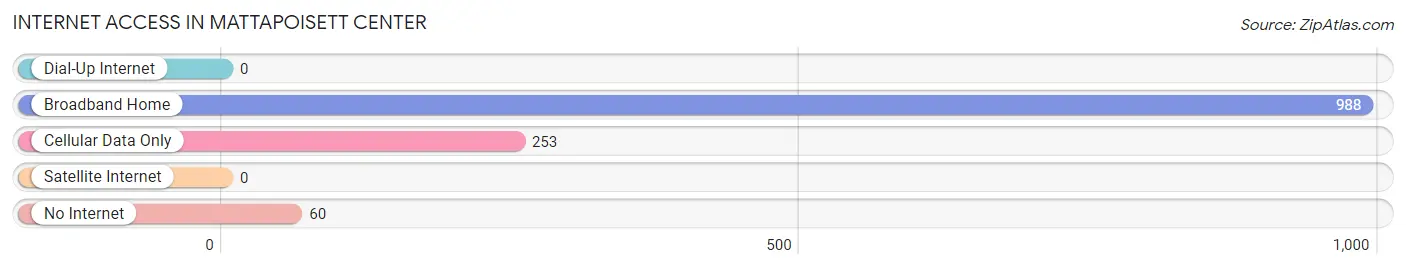
| Internet Type | # Households | % Households |
| Dial-Up Internet | 0 | 0.0% |
| Broadband Home | 988 | 75.9% |
| Cellular Data Only | 253 | 19.5% |
| Satellite Internet | 0 | 0.0% |
| No Internet | 60 | 4.6% |
| Total | 1,301 | 100.0% |
Mattapoisett Center Summary
Matapoisett Center is a small village located in Plymouth County, Massachusetts. It is situated on the western shore of Buzzards Bay, approximately 40 miles south of Boston. The village is part of the town of Mattapoisett, which was incorporated in 1857. The village is home to a population of approximately 1,500 people, and is a popular summer destination for tourists.
Geography
Matapoisett Center is located in southeastern Massachusetts, in Plymouth County. It is situated on the western shore of Buzzards Bay, approximately 40 miles south of Boston. The village is bordered by the towns of Marion to the north, Rochester to the east, and Wareham to the south. The village is located on a peninsula, with the Mattapoisett River to the east and the Sippican River to the west. The village is located at an elevation of approximately 10 feet above sea level.
The climate in Matapoisett Center is classified as humid continental, with warm summers and cold winters. The average annual temperature is approximately 50 degrees Fahrenheit, with an average high of 75 degrees in the summer and an average low of 25 degrees in the winter. The average annual precipitation is approximately 45 inches, with the majority of precipitation occurring in the spring and summer months.
Economy
The economy of Matapoisett Center is largely based on tourism and fishing. The village is a popular summer destination for tourists, who come to enjoy the beaches, fishing, and other outdoor activities. The village is also home to several marinas, which provide services to recreational boaters.
The village is also home to several small businesses, including restaurants, retail stores, and other services. The village is home to a number of art galleries, which feature the work of local artists. The village is also home to a number of antique shops, which specialize in vintage items.
Demographics
As of the 2010 census, the population of Matapoisett Center was 1,521. The racial makeup of the village was 94.3% White, 1.2% African American, 0.3% Native American, 0.7% Asian, 0.1% Pacific Islander, 1.2% from other races, and 2.3% from two or more races. Hispanic or Latino of any race were 2.3% of the population.
The median household income in Matapoisett Center was $63,750, and the median family income was $76,250. The per capita income for the village was $31,945. About 5.3% of families and 8.2% of the population were below the poverty line, including 10.2% of those under age 18 and 4.2% of those age 65 or over.
History
Matapoisett Center was first settled in 1650 by English colonists. The village was originally part of the town of Rochester, but was incorporated as its own town in 1857. The village was named after the Mattapoisett River, which was named after the Wampanoag tribe of Native Americans who lived in the area.
The village was a popular summer destination for wealthy Bostonians in the late 19th and early 20th centuries. The village was home to several large estates, including the Mattapoisett Inn, which was built in 1887. The village was also home to a number of shipbuilding yards, which produced wooden sailing vessels.
In the late 20th century, the village began to decline as a summer destination, and many of the large estates were sold off. The village has since become a popular destination for tourists, who come to enjoy the beaches, fishing, and other outdoor activities.
Common Questions
What is Per Capita Income in Mattapoisett Center?
Per Capita income in Mattapoisett Center is $64,652.
What is the Median Family Income in Mattapoisett Center?
Median Family Income in Mattapoisett Center is $135,409.
What is the Median Household income in Mattapoisett Center?
Median Household Income in Mattapoisett Center is $95,986.
What is Income or Wage Gap in Mattapoisett Center?
Income or Wage Gap in Mattapoisett Center is 0.3%.
Women in Mattapoisett Center earn 99.7 cents for every dollar earned by a man.
What is Inequality or Gini Index in Mattapoisett Center?
Inequality or Gini Index in Mattapoisett Center is 0.41.
What is the Total Population of Mattapoisett Center?
Total Population of Mattapoisett Center is 2,645.
What is the Total Male Population of Mattapoisett Center?
Total Male Population of Mattapoisett Center is 1,469.
What is the Total Female Population of Mattapoisett Center?
Total Female Population of Mattapoisett Center is 1,176.
What is the Ratio of Males per 100 Females in Mattapoisett Center?
There are 124.91 Males per 100 Females in Mattapoisett Center.
What is the Ratio of Females per 100 Males in Mattapoisett Center?
There are 80.05 Females per 100 Males in Mattapoisett Center.
What is the Median Population Age in Mattapoisett Center?
Median Population Age in Mattapoisett Center is 55.8 Years.
What is the Average Family Size in Mattapoisett Center
Average Family Size in Mattapoisett Center is 2.8 People.
What is the Average Household Size in Mattapoisett Center
Average Household Size in Mattapoisett Center is 2.0 People.
How Large is the Labor Force in Mattapoisett Center?
There are 1,196 People in the Labor Forcein in Mattapoisett Center.
What is the Percentage of People in the Labor Force in Mattapoisett Center?
53.7% of People are in the Labor Force in Mattapoisett Center.
What is the Unemployment Rate in Mattapoisett Center?
Unemployment Rate in Mattapoisett Center is 3.9%.