Ocean Grove, MA Map & Demographics
Ocean Grove Map
Ocean Grove Overview
$43,417
PER CAPITA INCOME
$110,386
AVG FAMILY INCOME
$75,208
AVG HOUSEHOLD INCOME
46.1%
WAGE / INCOME GAP [ % ]
53.9¢/ $1
WAGE / INCOME GAP [ $ ]
0.36
INEQUALITY / GINI INDEX
2,691
TOTAL POPULATION
1,157
MALE POPULATION
1,534
FEMALE POPULATION
75.42
MALES / 100 FEMALES
132.58
FEMALES / 100 MALES
49.1
MEDIAN AGE
2.8
AVG FAMILY SIZE
2.2
AVG HOUSEHOLD SIZE
1,411
LABOR FORCE [ PEOPLE ]
59.2%
PERCENT IN LABOR FORCE
7.4%
UNEMPLOYMENT RATE
Income in Ocean Grove
Income Overview in Ocean Grove
Per Capita Income in Ocean Grove is $43,417, while median incomes of families and households are $110,386 and $75,208 respectively.
| Characteristic | Number | Measure |
| Per Capita Income | 2,691 | $43,417 |
| Median Family Income | 707 | $110,386 |
| Mean Family Income | 707 | $111,616 |
| Median Household Income | 1,229 | $75,208 |
| Mean Household Income | 1,229 | $95,803 |
| Income Deficit | 707 | $0 |
| Wage / Income Gap (%) | 2,691 | 46.13% |
| Wage / Income Gap ($) | 2,691 | 53.87¢ per $1 |
| Gini / Inequality Index | 2,691 | 0.36 |
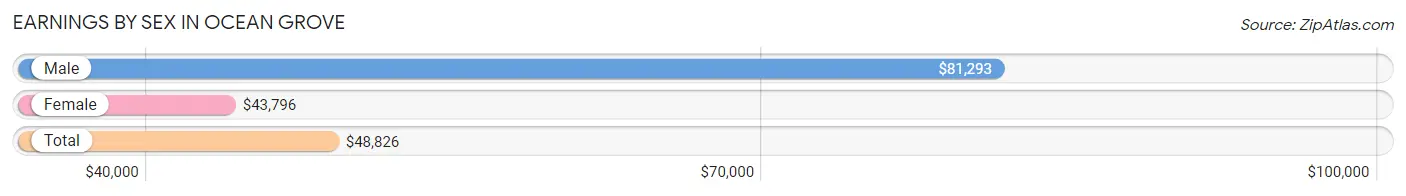
Earnings by Sex in Ocean Grove
Average Earnings in Ocean Grove are $48,826, $81,293 for men and $43,796 for women, a difference of 46.1%.
| Sex | Number | Average Earnings |
| Male | 584 (40.0%) | $81,293 |
| Female | 876 (60.0%) | $43,796 |
| Total | 1,460 (100.0%) | $48,826 |
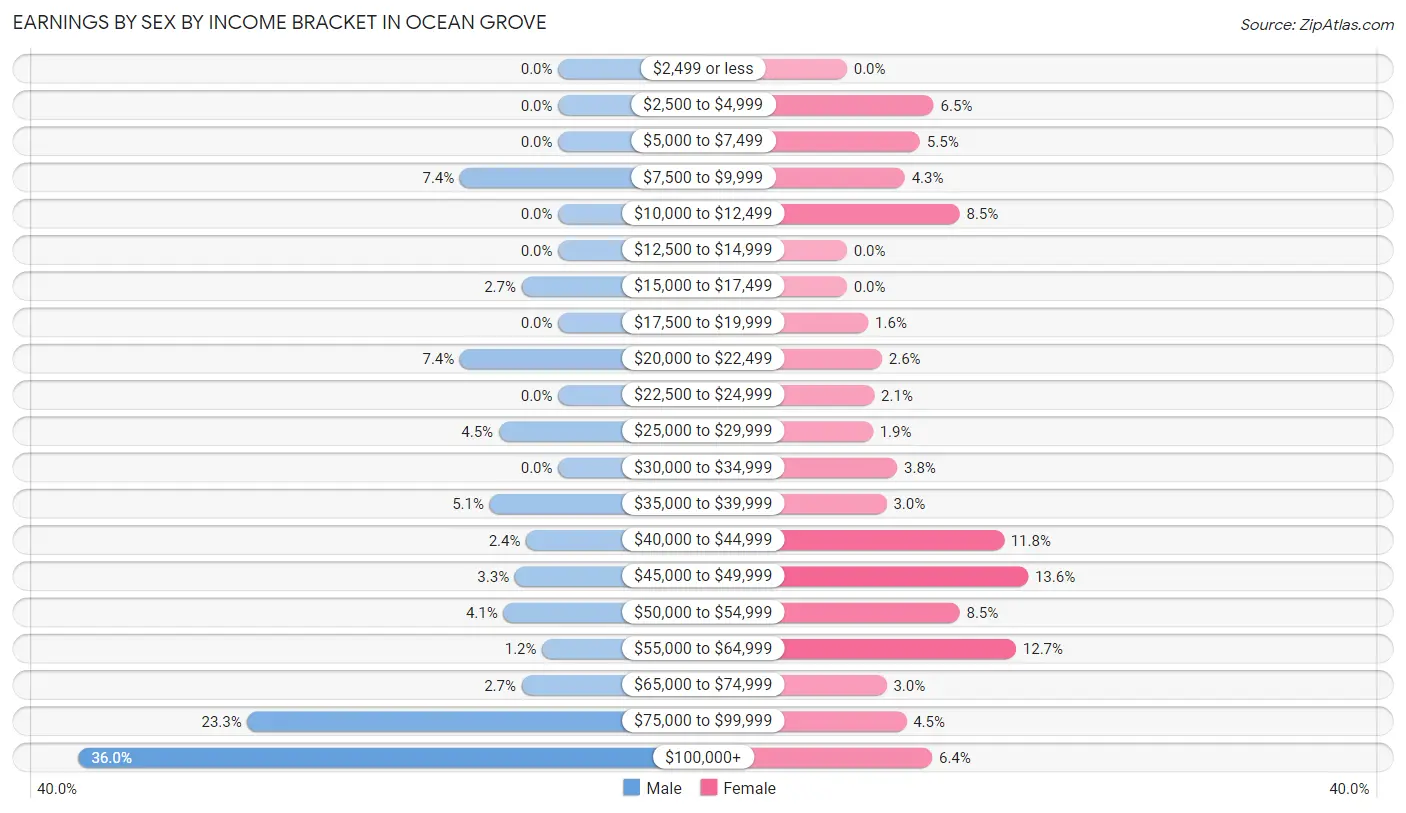
Earnings by Sex by Income Bracket in Ocean Grove
The most common earnings brackets in Ocean Grove are $100,000+ for men (210 | 36.0%) and $45,000 to $49,999 for women (119 | 13.6%).
| Income | Male | Female |
| $2,499 or less | 0 (0.0%) | 0 (0.0%) |
| $2,500 to $4,999 | 0 (0.0%) | 57 (6.5%) |
| $5,000 to $7,499 | 0 (0.0%) | 48 (5.5%) |
| $7,500 to $9,999 | 43 (7.4%) | 38 (4.3%) |
| $10,000 to $12,499 | 0 (0.0%) | 74 (8.5%) |
| $12,500 to $14,999 | 0 (0.0%) | 0 (0.0%) |
| $15,000 to $17,499 | 16 (2.7%) | 0 (0.0%) |
| $17,500 to $19,999 | 0 (0.0%) | 14 (1.6%) |
| $20,000 to $22,499 | 43 (7.4%) | 23 (2.6%) |
| $22,500 to $24,999 | 0 (0.0%) | 18 (2.1%) |
| $25,000 to $29,999 | 26 (4.4%) | 17 (1.9%) |
| $30,000 to $34,999 | 0 (0.0%) | 33 (3.8%) |
| $35,000 to $39,999 | 30 (5.1%) | 26 (3.0%) |
| $40,000 to $44,999 | 14 (2.4%) | 103 (11.8%) |
| $45,000 to $49,999 | 19 (3.3%) | 119 (13.6%) |
| $50,000 to $54,999 | 24 (4.1%) | 74 (8.5%) |
| $55,000 to $64,999 | 7 (1.2%) | 111 (12.7%) |
| $65,000 to $74,999 | 16 (2.7%) | 26 (3.0%) |
| $75,000 to $99,999 | 136 (23.3%) | 39 (4.4%) |
| $100,000+ | 210 (36.0%) | 56 (6.4%) |
| Total | 584 (100.0%) | 876 (100.0%) |
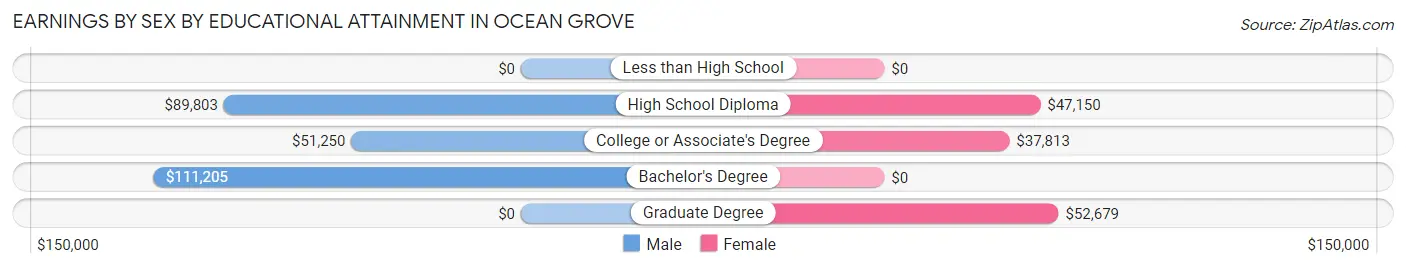
Earnings by Sex by Educational Attainment in Ocean Grove
Average earnings in Ocean Grove are $82,414 for men and $45,448 for women, a difference of 44.9%. Men with an educational attainment of bachelor's degree enjoy the highest average annual earnings of $111,205, while those with college or associate's degree education earn the least with $51,250. Women with an educational attainment of graduate degree earn the most with the average annual earnings of $52,679, while those with college or associate's degree education have the smallest earnings of $37,813.
| Educational Attainment | Male Income | Female Income |
| Less than High School | - | - |
| High School Diploma | $89,803 | $47,150 |
| College or Associate's Degree | $51,250 | $37,813 |
| Bachelor's Degree | $111,205 | $0 |
| Graduate Degree | - | - |
| Total | $82,414 | $45,448 |
Family Income in Ocean Grove
Family Income Brackets in Ocean Grove
According to the Ocean Grove family income data, there are 221 families falling into the $100,000 to $149,999 income range, which is the most common income bracket and makes up 31.3% of all families.
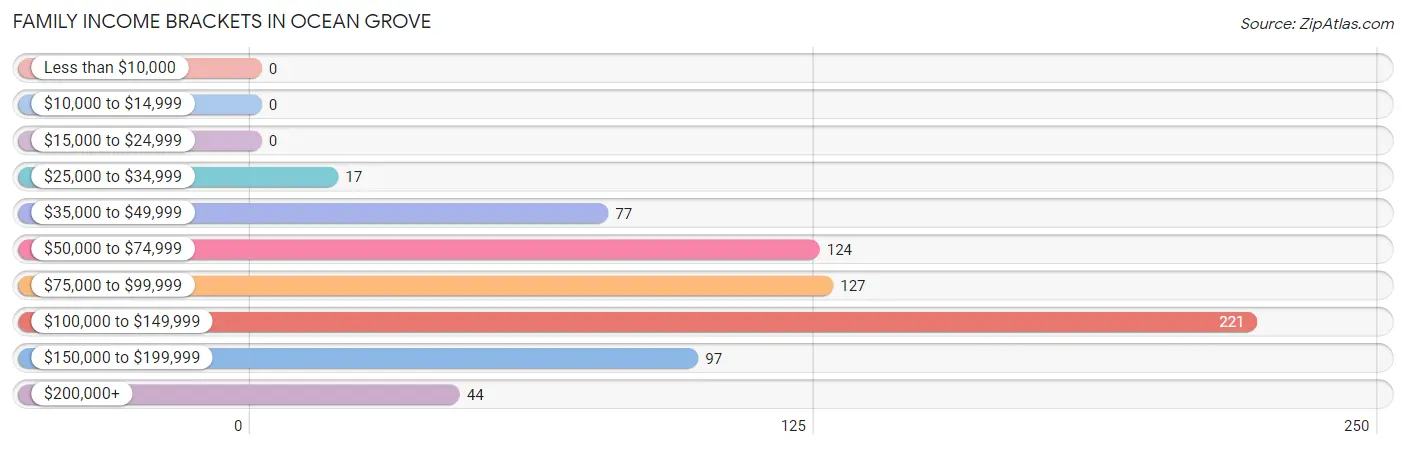
| Income Bracket | # Families | % Families |
| Less than $10,000 | 0 | 0.0% |
| $10,000 to $14,999 | 0 | 0.0% |
| $15,000 to $24,999 | 0 | 0.0% |
| $25,000 to $34,999 | 17 | 2.4% |
| $35,000 to $49,999 | 77 | 10.9% |
| $50,000 to $74,999 | 124 | 17.5% |
| $75,000 to $99,999 | 127 | 18.0% |
| $100,000 to $149,999 | 221 | 31.3% |
| $150,000 to $199,999 | 97 | 13.7% |
| $200,000+ | 44 | 6.2% |
Family Income by Famaliy Size in Ocean Grove
4-person families (146 | 20.6%) account for the highest median family income in Ocean Grove with $143,281 per family, while 2-person families (352 | 49.8%) have the highest median income of $47,500 per family member.
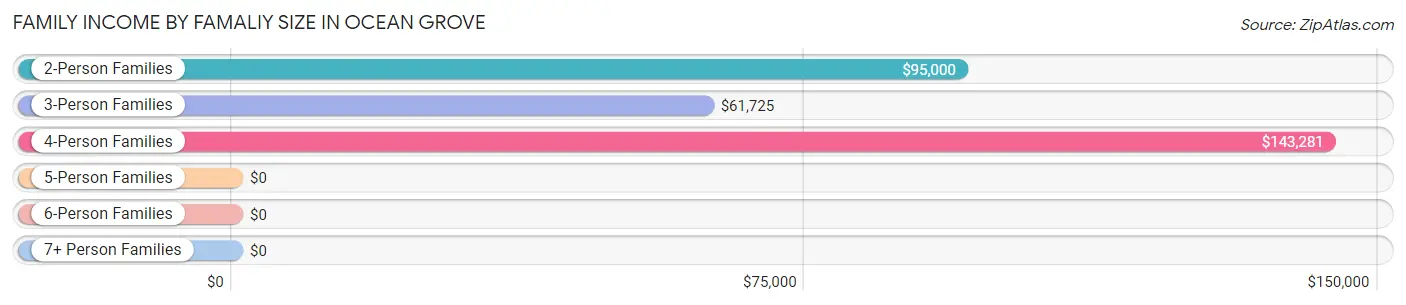
| Income Bracket | # Families | Median Income |
| 2-Person Families | 352 (49.8%) | $95,000 |
| 3-Person Families | 179 (25.3%) | $61,725 |
| 4-Person Families | 146 (20.6%) | $143,281 |
| 5-Person Families | 6 (0.9%) | $0 |
| 6-Person Families | 24 (3.4%) | $0 |
| 7+ Person Families | 0 (0.0%) | $0 |
| Total | 707 (100.0%) | $110,386 |
Family Income by Number of Earners in Ocean Grove
The median family income in Ocean Grove is $110,386, with families comprising 3+ earners (71) having the highest median family income of $161,991, while families with no earners (57) have the lowest median family income of $73,456, accounting for 10.0% and 8.1% of families, respectively.
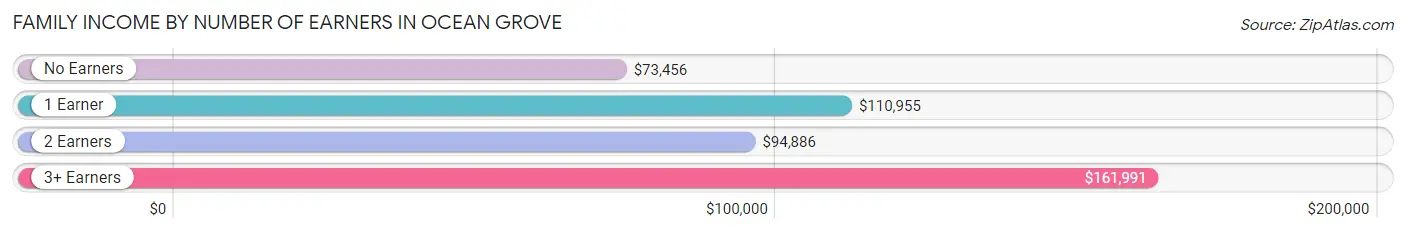
| Number of Earners | # Families | Median Income |
| No Earners | 57 (8.1%) | $73,456 |
| 1 Earner | 352 (49.8%) | $110,955 |
| 2 Earners | 227 (32.1%) | $94,886 |
| 3+ Earners | 71 (10.0%) | $161,991 |
| Total | 707 (100.0%) | $110,386 |
Household Income in Ocean Grove
Household Income Brackets in Ocean Grove
With 251 households falling in the category, the $50,000 to $74,999 income range is the most frequent in Ocean Grove, accounting for 20.4% of all households. In contrast, only 20 households (1.6%) fall into the less than $10,000 income bracket, making it the least populous group.
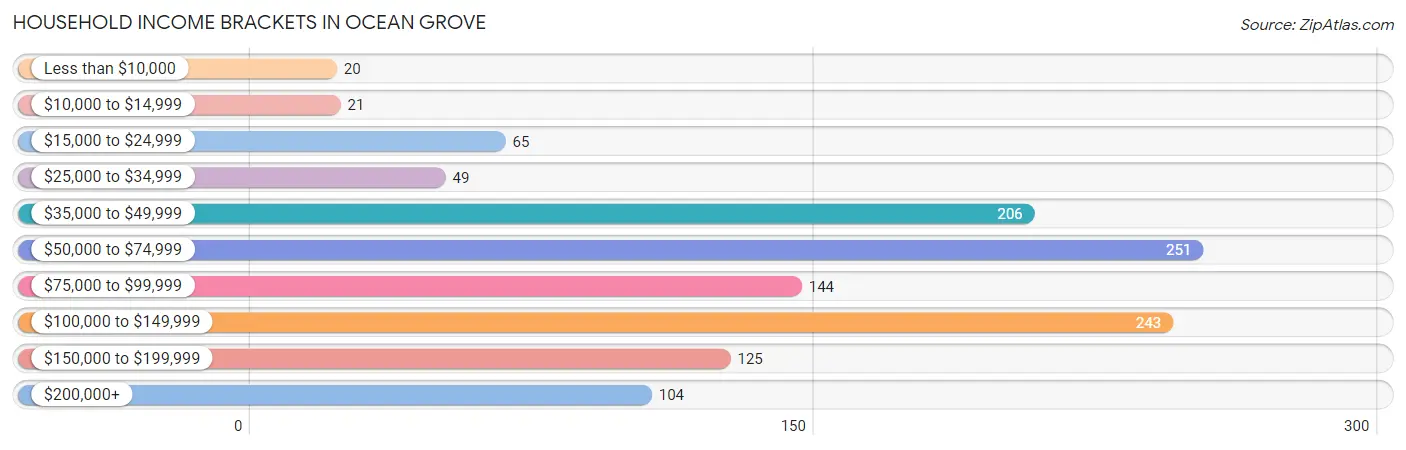
| Income Bracket | # Households | % Households |
| Less than $10,000 | 20 | 1.6% |
| $10,000 to $14,999 | 21 | 1.7% |
| $15,000 to $24,999 | 65 | 5.3% |
| $25,000 to $34,999 | 49 | 4.0% |
| $35,000 to $49,999 | 206 | 16.8% |
| $50,000 to $74,999 | 251 | 20.4% |
| $75,000 to $99,999 | 144 | 11.7% |
| $100,000 to $149,999 | 243 | 19.8% |
| $150,000 to $199,999 | 125 | 10.2% |
| $200,000+ | 104 | 8.5% |
Household Income by Householder Age in Ocean Grove
The median household income in Ocean Grove is $75,208, with the highest median household income of $110,477 found in the 25 to 44 years age bracket for the primary householder. A total of 401 households (32.6%) fall into this category.
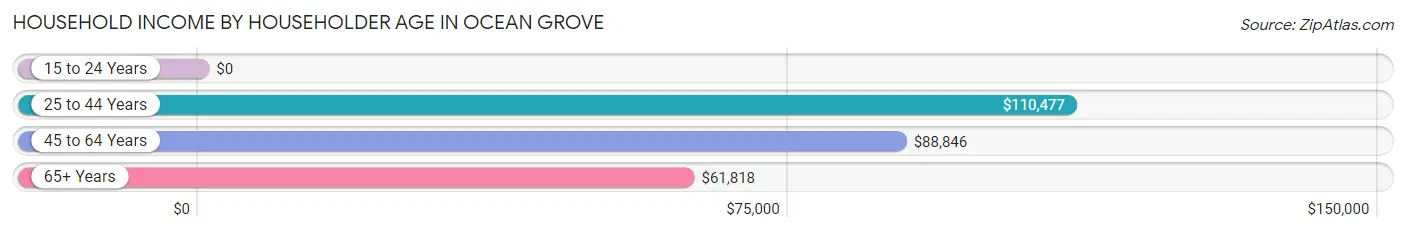
| Income Bracket | # Households | Median Income |
| 15 to 24 Years | 0 (0.0%) | $0 |
| 25 to 44 Years | 401 (32.6%) | $110,477 |
| 45 to 64 Years | 392 (31.9%) | $88,846 |
| 65+ Years | 436 (35.5%) | $61,818 |
| Total | 1,229 (100.0%) | $75,208 |
Poverty in Ocean Grove
Income Below Poverty by Sex and Age in Ocean Grove
With 5.4% poverty level for males and 4.1% for females among the residents of Ocean Grove, 45 to 54 year old males and 25 to 34 year old females are the most vulnerable to poverty, with 23 males (17.0%) and 30 females (11.6%) in their respective age groups living below the poverty level.
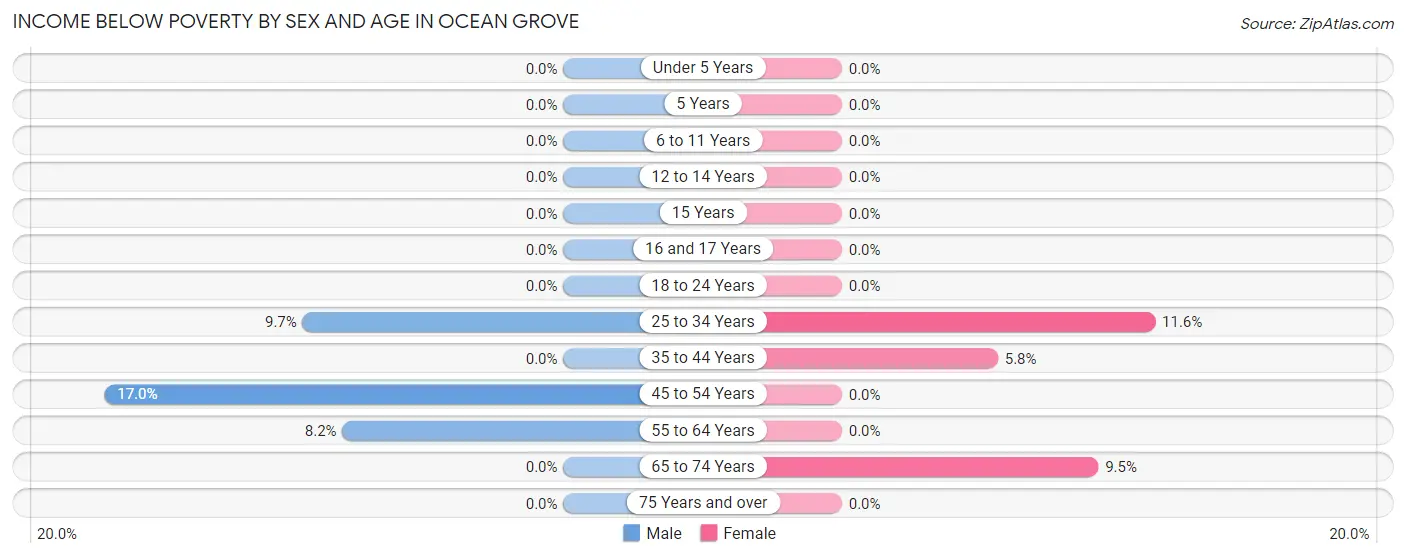
| Age Bracket | Male | Female |
| Under 5 Years | 0 (0.0%) | 0 (0.0%) |
| 5 Years | 0 (0.0%) | 0 (0.0%) |
| 6 to 11 Years | 0 (0.0%) | 0 (0.0%) |
| 12 to 14 Years | 0 (0.0%) | 0 (0.0%) |
| 15 Years | 0 (0.0%) | 0 (0.0%) |
| 16 and 17 Years | 0 (0.0%) | 0 (0.0%) |
| 18 to 24 Years | 0 (0.0%) | 0 (0.0%) |
| 25 to 34 Years | 18 (9.7%) | 30 (11.6%) |
| 35 to 44 Years | 0 (0.0%) | 11 (5.8%) |
| 45 to 54 Years | 23 (17.0%) | 0 (0.0%) |
| 55 to 64 Years | 21 (8.2%) | 0 (0.0%) |
| 65 to 74 Years | 0 (0.0%) | 20 (9.5%) |
| 75 Years and over | 0 (0.0%) | 0 (0.0%) |
| Total | 62 (5.4%) | 61 (4.1%) |
Income Above Poverty by Sex and Age in Ocean Grove
According to the poverty statistics in Ocean Grove, males aged under 5 years and females aged under 5 years are the age groups that are most secure financially, with 100.0% of males and 100.0% of females in these age groups living above the poverty line.
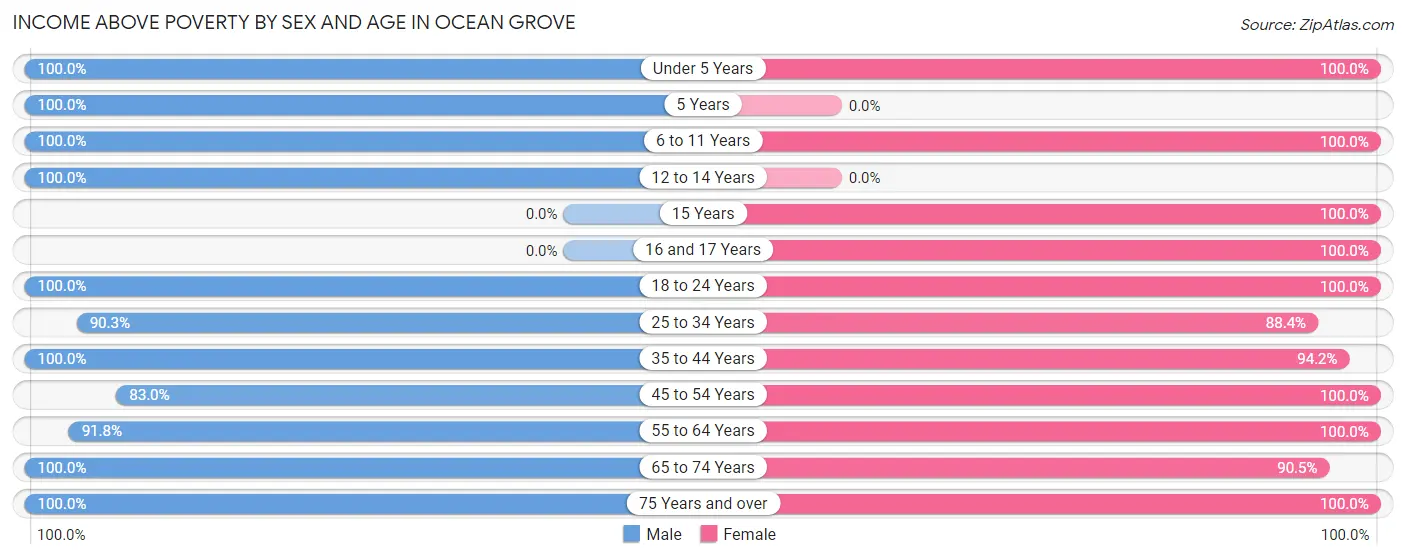
| Age Bracket | Male | Female |
| Under 5 Years | 96 (100.0%) | 46 (100.0%) |
| 5 Years | 19 (100.0%) | 0 (0.0%) |
| 6 to 11 Years | 31 (100.0%) | 51 (100.0%) |
| 12 to 14 Years | 22 (100.0%) | 0 (0.0%) |
| 15 Years | 0 (0.0%) | 14 (100.0%) |
| 16 and 17 Years | 0 (0.0%) | 22 (100.0%) |
| 18 to 24 Years | 52 (100.0%) | 68 (100.0%) |
| 25 to 34 Years | 168 (90.3%) | 228 (88.4%) |
| 35 to 44 Years | 185 (100.0%) | 179 (94.2%) |
| 45 to 54 Years | 112 (83.0%) | 189 (100.0%) |
| 55 to 64 Years | 235 (91.8%) | 261 (100.0%) |
| 65 to 74 Years | 131 (100.0%) | 190 (90.5%) |
| 75 Years and over | 44 (100.0%) | 197 (100.0%) |
| Total | 1,095 (94.6%) | 1,445 (96.0%) |
Income Below Poverty Among Married-Couple Families in Ocean Grove
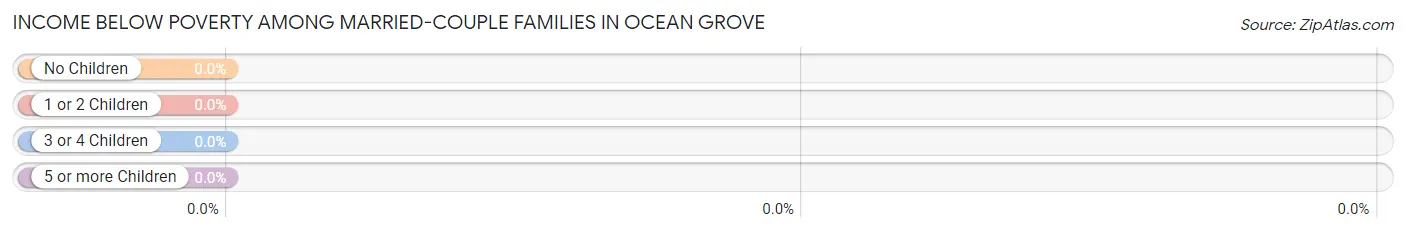
| Children | Above Poverty | Below Poverty |
| No Children | 280 (100.0%) | 0 (0.0%) |
| 1 or 2 Children | 160 (100.0%) | 0 (0.0%) |
| 3 or 4 Children | 0 (0.0%) | 0 (0.0%) |
| 5 or more Children | 0 (0.0%) | 0 (0.0%) |
| Total | 440 (100.0%) | 0 (0.0%) |
Income Below Poverty Among Single-Parent Households in Ocean Grove
| Children | Single Father | Single Mother |
| No Children | 0 (0.0%) | 0 (0.0%) |
| 1 or 2 Children | 0 (0.0%) | 0 (0.0%) |
| 3 or 4 Children | 0 (0.0%) | 0 (0.0%) |
| 5 or more Children | 0 (0.0%) | 0 (0.0%) |
| Total | 0 (0.0%) | 0 (0.0%) |
Income Below Poverty Among Married-Couple vs Single-Parent Households in Ocean Grove
| Children | Married-Couple Families | Single-Parent Households |
| No Children | 0 (0.0%) | 0 (0.0%) |
| 1 or 2 Children | 0 (0.0%) | 0 (0.0%) |
| 3 or 4 Children | 0 (0.0%) | 0 (0.0%) |
| 5 or more Children | 0 (0.0%) | 0 (0.0%) |
| Total | 0 (0.0%) | 0 (0.0%) |
Race in Ocean Grove
The most populous races in Ocean Grove are White / Caucasian (2,433 | 90.4%), Two or more Races (124 | 4.6%), and Asian (64 | 2.4%).
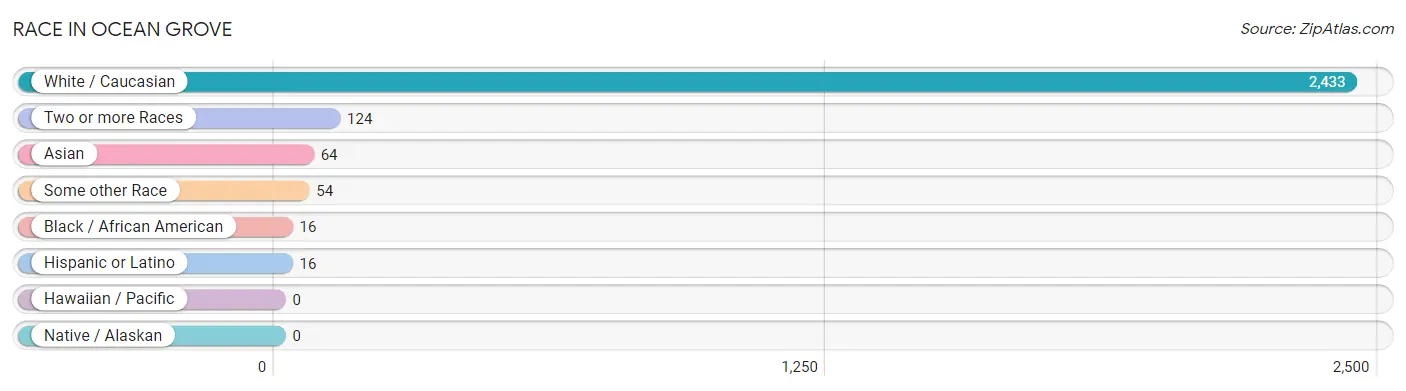
| Race | # Population | % Population |
| Asian | 64 | 2.4% |
| Black / African American | 16 | 0.6% |
| Hawaiian / Pacific | 0 | 0.0% |
| Hispanic or Latino | 16 | 0.6% |
| Native / Alaskan | 0 | 0.0% |
| White / Caucasian | 2,433 | 90.4% |
| Two or more Races | 124 | 4.6% |
| Some other Race | 54 | 2.0% |
| Total | 2,691 | 100.0% |
Ancestry in Ocean Grove
The most populous ancestries reported in Ocean Grove are French (802 | 29.8%), Portuguese (707 | 26.3%), English (459 | 17.1%), Irish (457 | 17.0%), and French Canadian (200 | 7.4%), together accounting for 97.5% of all Ocean Grove residents.
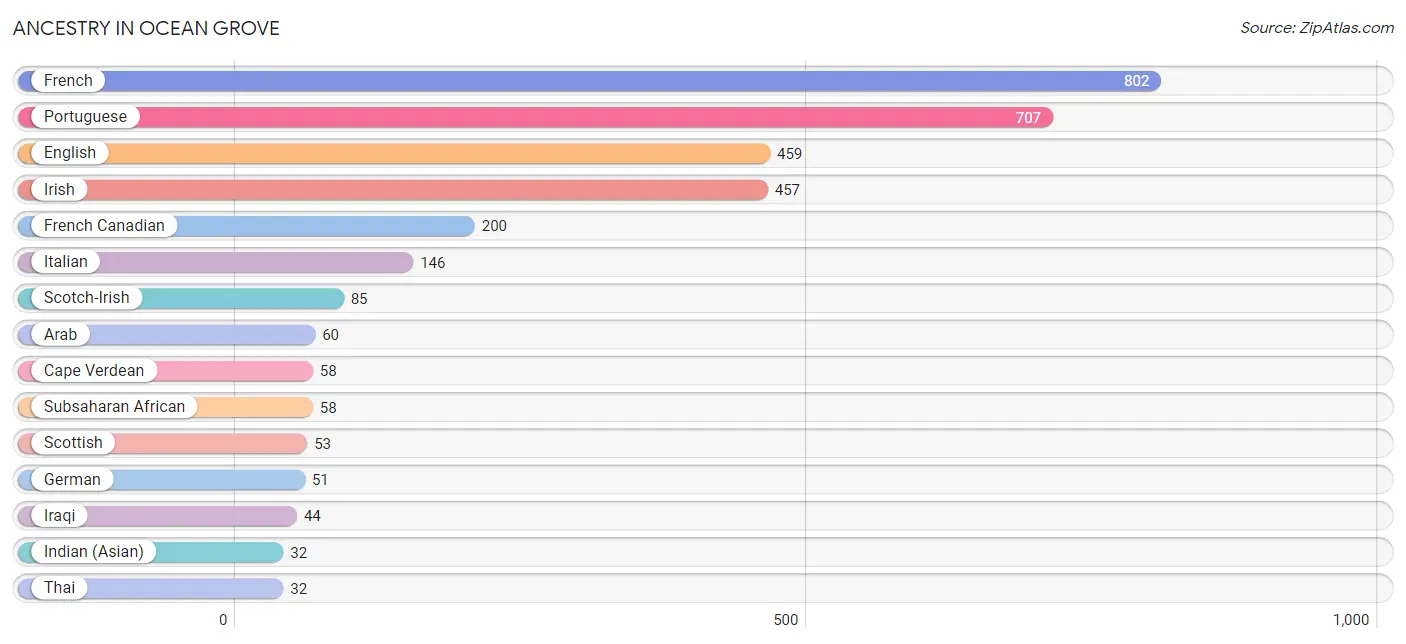
| Ancestry | # Population | % Population |
| Apache | 23 | 0.9% |
| Arab | 60 | 2.2% |
| British | 13 | 0.5% |
| Burmese | 12 | 0.4% |
| Cape Verdean | 58 | 2.2% |
| Dutch | 8 | 0.3% |
| English | 459 | 17.1% |
| French | 802 | 29.8% |
| French Canadian | 200 | 7.4% |
| German | 51 | 1.9% |
| Indian (Asian) | 32 | 1.2% |
| Iraqi | 44 | 1.6% |
| Irish | 457 | 17.0% |
| Italian | 146 | 5.4% |
| Lebanese | 16 | 0.6% |
| Portuguese | 707 | 26.3% |
| Scotch-Irish | 85 | 3.2% |
| Scottish | 53 | 2.0% |
| Subsaharan African | 58 | 2.2% |
| Thai | 32 | 1.2% | View All 20 Rows |
Immigrants in Ocean Grove
The most numerous immigrant groups reported in Ocean Grove came from Europe (83 | 3.1%), Portugal (83 | 3.1%), Southern Europe (83 | 3.1%), Asia (44 | 1.6%), and India (32 | 1.2%), together accounting for 12.1% of all Ocean Grove residents.
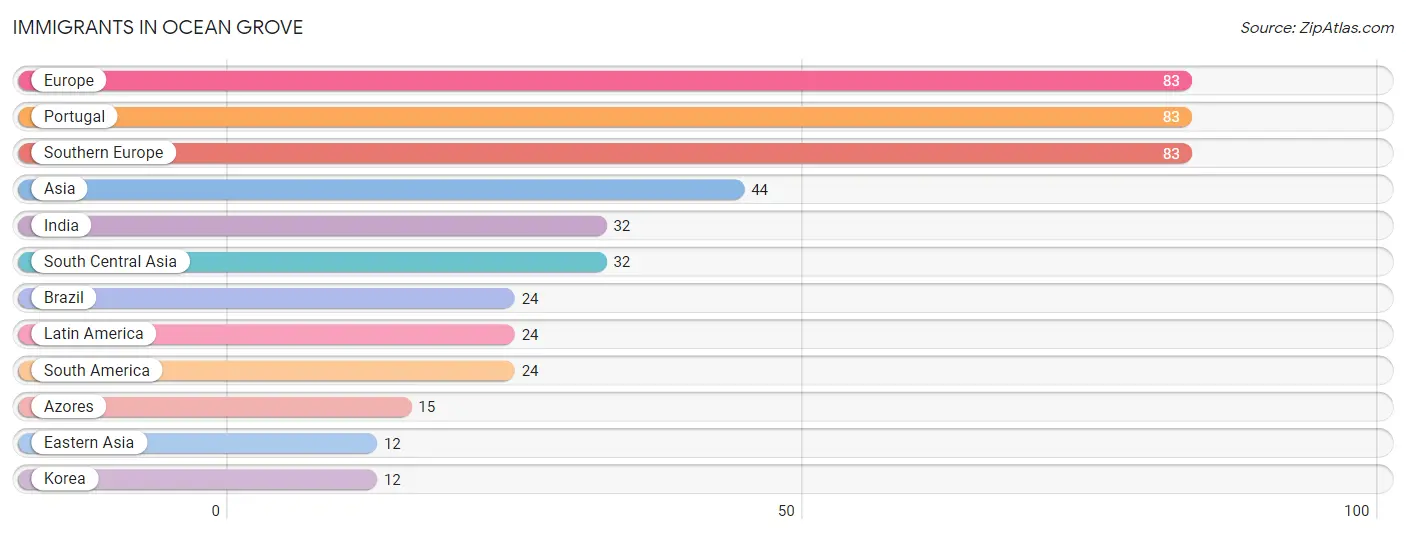
| Immigration Origin | # Population | % Population |
| Asia | 44 | 1.6% |
| Azores | 15 | 0.6% |
| Brazil | 24 | 0.9% |
| Eastern Asia | 12 | 0.4% |
| Europe | 83 | 3.1% |
| India | 32 | 1.2% |
| Korea | 12 | 0.4% |
| Latin America | 24 | 0.9% |
| Portugal | 83 | 3.1% |
| South America | 24 | 0.9% |
| South Central Asia | 32 | 1.2% |
| Southern Europe | 83 | 3.1% | View All 12 Rows |
Sex and Age in Ocean Grove
Sex and Age in Ocean Grove
The most populous age groups in Ocean Grove are 55 to 59 Years (163 | 14.1%) for men and 35 to 39 Years (190 | 12.4%) for women.
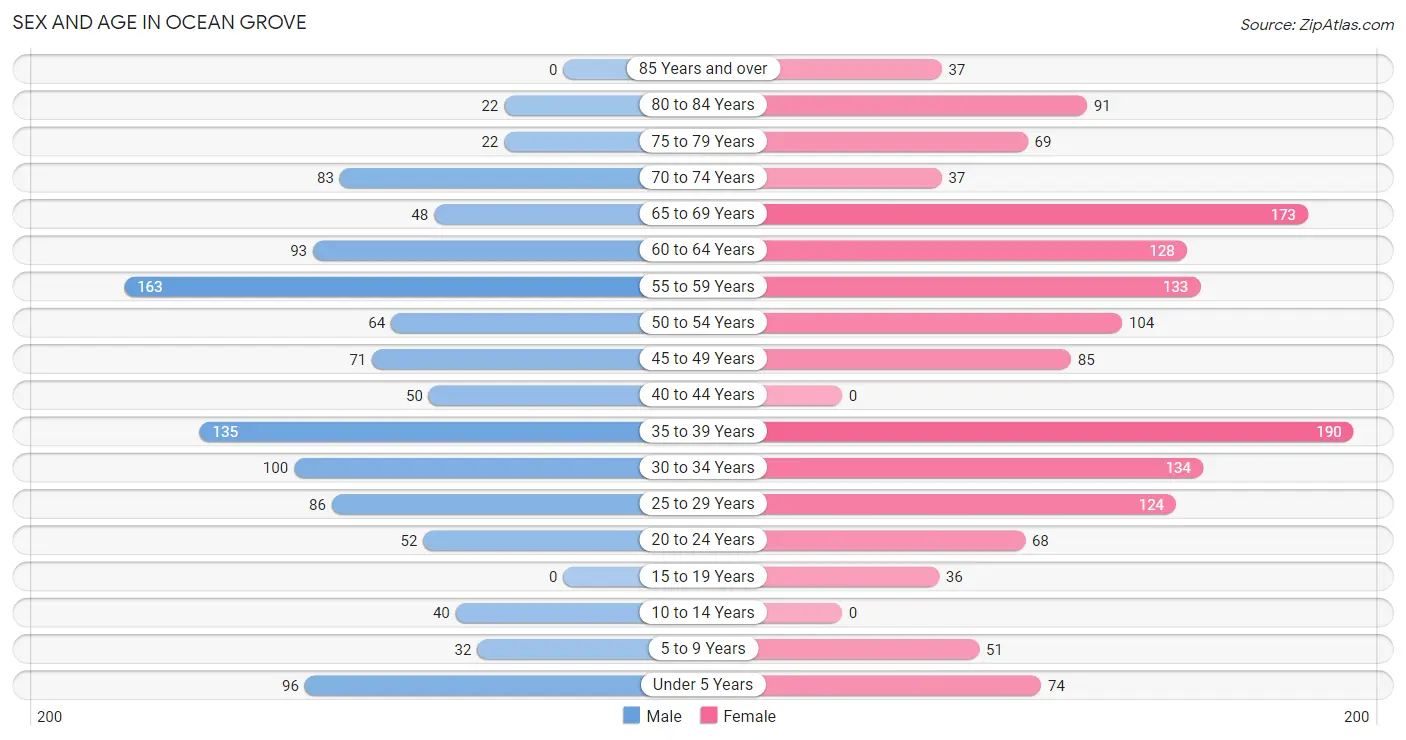
| Age Bracket | Male | Female |
| Under 5 Years | 96 (8.3%) | 74 (4.8%) |
| 5 to 9 Years | 32 (2.8%) | 51 (3.3%) |
| 10 to 14 Years | 40 (3.5%) | 0 (0.0%) |
| 15 to 19 Years | 0 (0.0%) | 36 (2.4%) |
| 20 to 24 Years | 52 (4.5%) | 68 (4.4%) |
| 25 to 29 Years | 86 (7.4%) | 124 (8.1%) |
| 30 to 34 Years | 100 (8.6%) | 134 (8.7%) |
| 35 to 39 Years | 135 (11.7%) | 190 (12.4%) |
| 40 to 44 Years | 50 (4.3%) | 0 (0.0%) |
| 45 to 49 Years | 71 (6.1%) | 85 (5.5%) |
| 50 to 54 Years | 64 (5.5%) | 104 (6.8%) |
| 55 to 59 Years | 163 (14.1%) | 133 (8.7%) |
| 60 to 64 Years | 93 (8.0%) | 128 (8.3%) |
| 65 to 69 Years | 48 (4.2%) | 173 (11.3%) |
| 70 to 74 Years | 83 (7.2%) | 37 (2.4%) |
| 75 to 79 Years | 22 (1.9%) | 69 (4.5%) |
| 80 to 84 Years | 22 (1.9%) | 91 (5.9%) |
| 85 Years and over | 0 (0.0%) | 37 (2.4%) |
| Total | 1,157 (100.0%) | 1,534 (100.0%) |
Families and Households in Ocean Grove
Median Family Size in Ocean Grove
The median family size in Ocean Grove is 2.78 persons per family, with married-couple families (440 | 62.2%) accounting for the largest median family size of 2.95 persons per family. On the other hand, single male/father families (36 | 5.1%) represent the smallest median family size with 2.00 persons per family.
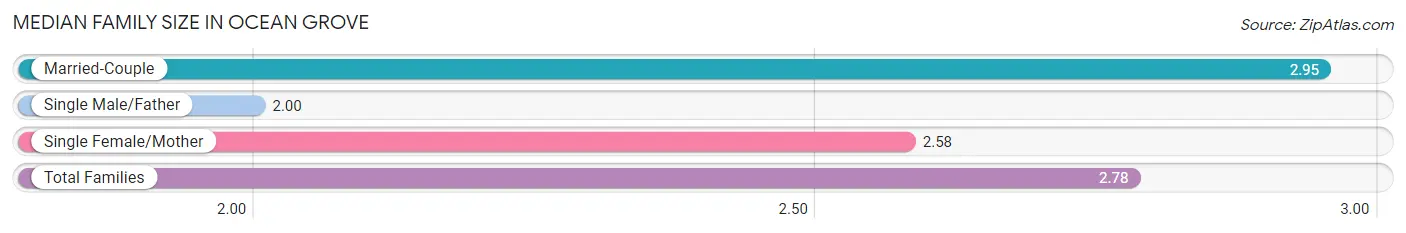
| Family Type | # Families | Family Size |
| Married-Couple | 440 (62.2%) | 2.95 |
| Single Male/Father | 36 (5.1%) | 2.00 |
| Single Female/Mother | 231 (32.7%) | 2.58 |
| Total Families | 707 (100.0%) | 2.78 |
Median Household Size in Ocean Grove
The median household size in Ocean Grove is 2.19 persons per household, with married-couple households (440 | 35.8%) accounting for the largest median household size of 3 persons per household. non-family households (522 | 42.5%) represent the smallest median household size with 1.24 persons per household.
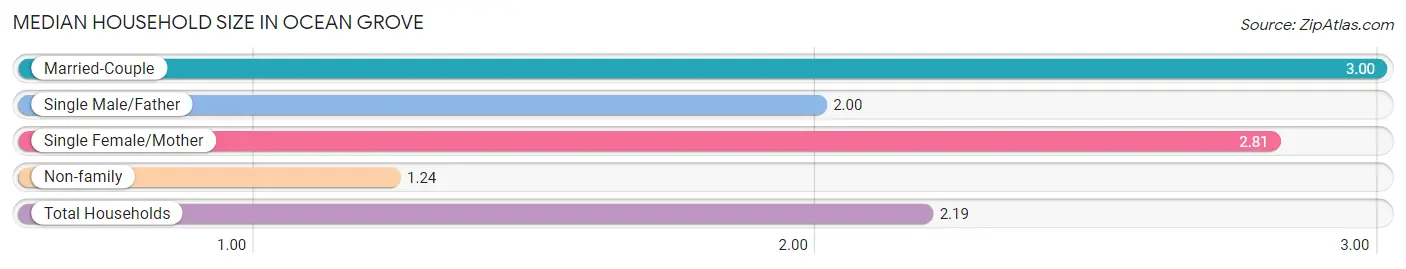
| Household Type | # Households | Household Size |
| Married-Couple | 440 (35.8%) | 3.00 |
| Single Male/Father | 36 (2.9%) | 2.00 |
| Single Female/Mother | 231 (18.8%) | 2.81 |
| Non-family | 522 (42.5%) | 1.24 |
| Total Households | 1,229 (100.0%) | 2.19 |
Household Size by Marriage Status in Ocean Grove
Out of a total of 1,229 households in Ocean Grove, 707 (57.5%) are family households, while 522 (42.5%) are nonfamily households. The most numerous type of family households are 2-person households, comprising 317, and the most common type of nonfamily households are 1-person households, comprising 414.
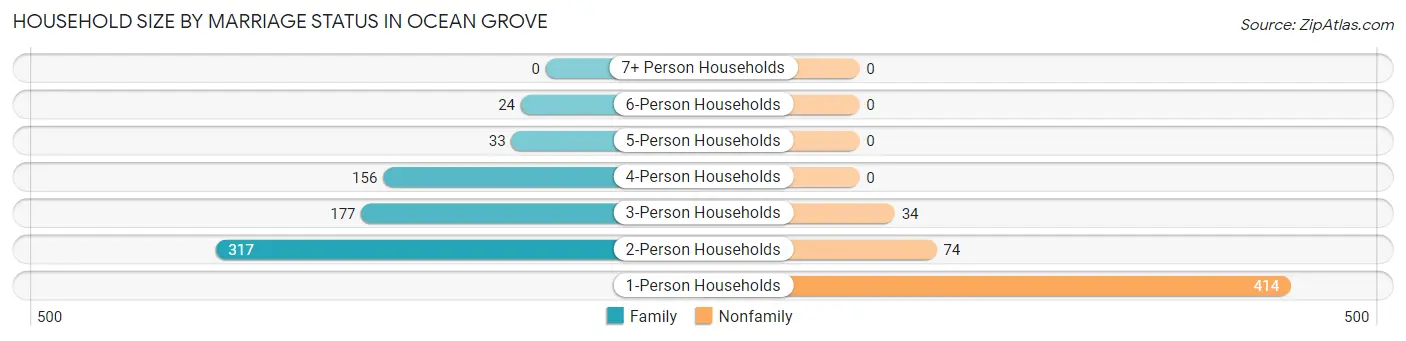
| Household Size | Family Households | Nonfamily Households |
| 1-Person Households | - | 414 (33.7%) |
| 2-Person Households | 317 (25.8%) | 74 (6.0%) |
| 3-Person Households | 177 (14.4%) | 34 (2.8%) |
| 4-Person Households | 156 (12.7%) | 0 (0.0%) |
| 5-Person Households | 33 (2.7%) | 0 (0.0%) |
| 6-Person Households | 24 (1.9%) | 0 (0.0%) |
| 7+ Person Households | 0 (0.0%) | 0 (0.0%) |
| Total | 707 (57.5%) | 522 (42.5%) |
Female Fertility in Ocean Grove
Fertility by Age in Ocean Grove
Average fertility rate in Ocean Grove is 63.0 births per 1,000 women. Women in the age bracket of 35 to 50 years have the highest fertility rate with 116.0 births per 1,000 women. Women in the age bracket of 35 to 50 years acount for 80.0% of all women with births.
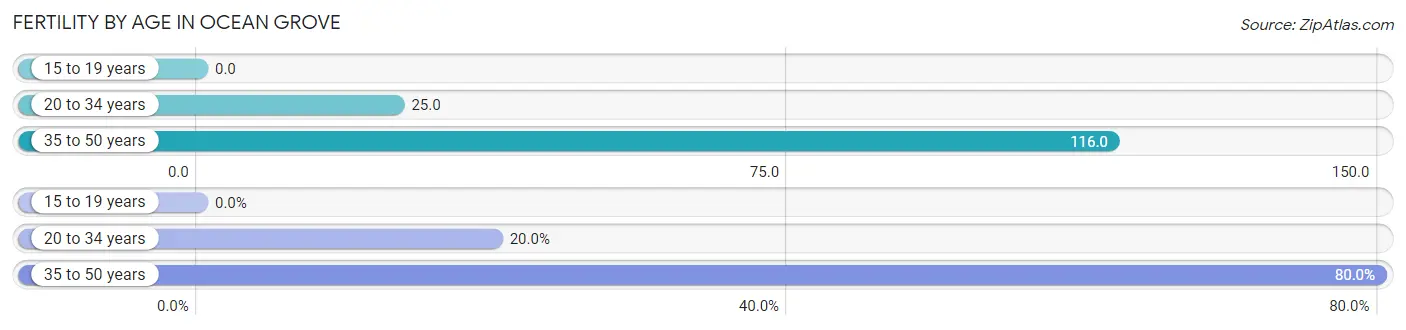
| Age Bracket | Women with Births | Births / 1,000 Women |
| 15 to 19 years | 0 (0.0%) | 0.0 |
| 20 to 34 years | 8 (20.0%) | 25.0 |
| 35 to 50 years | 32 (80.0%) | 116.0 |
| Total | 40 (100.0%) | 63.0 |
Fertility by Age by Marriage Status in Ocean Grove
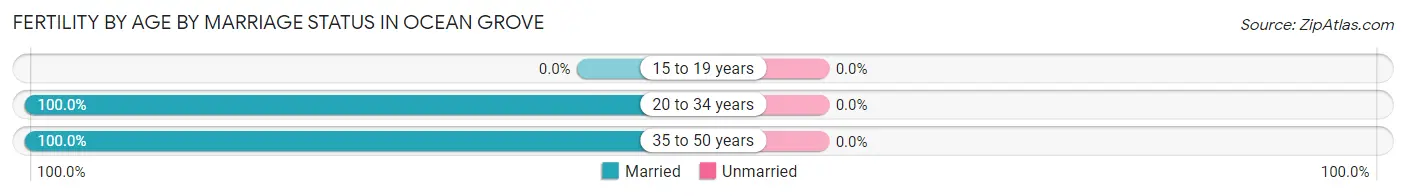
| Age Bracket | Married | Unmarried |
| 15 to 19 years | 0 (0.0%) | 0 (0.0%) |
| 20 to 34 years | 8 (100.0%) | 0 (0.0%) |
| 35 to 50 years | 32 (100.0%) | 0 (0.0%) |
| Total | 40 (100.0%) | 0 (0.0%) |
Fertility by Education in Ocean Grove
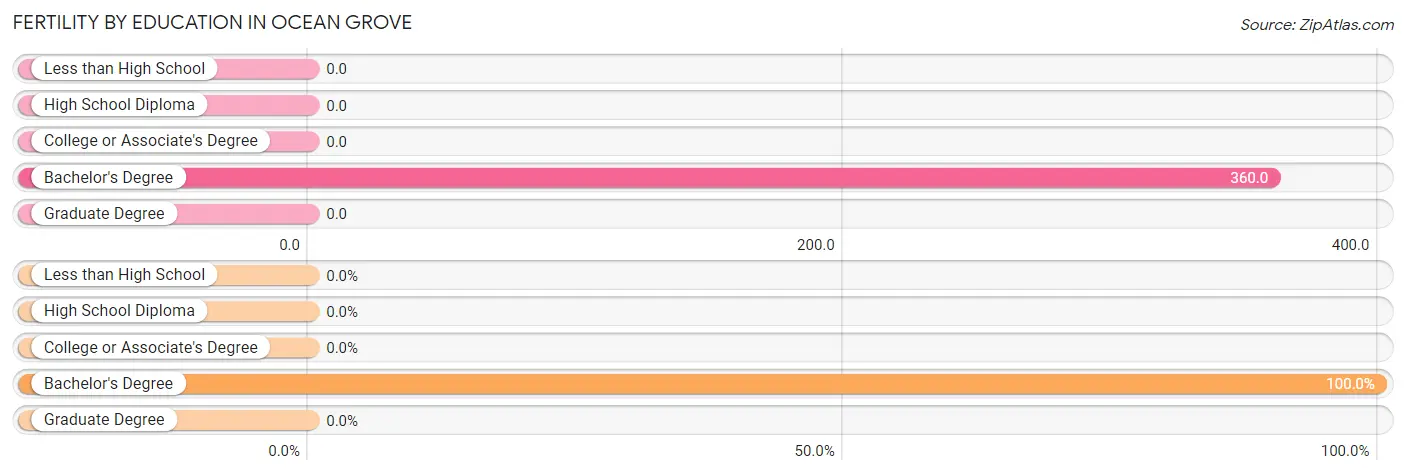
| Educational Attainment | Women with Births | Births / 1,000 Women |
| Less than High School | 0 (0.0%) | 0.0 |
| High School Diploma | 0 (0.0%) | 0.0 |
| College or Associate's Degree | 0 (0.0%) | 0.0 |
| Bachelor's Degree | 40 (100.0%) | 360.0 |
| Graduate Degree | 0 (0.0%) | 0.0 |
| Total | 40 (100.0%) | 63.0 |
Fertility by Education by Marriage Status in Ocean Grove
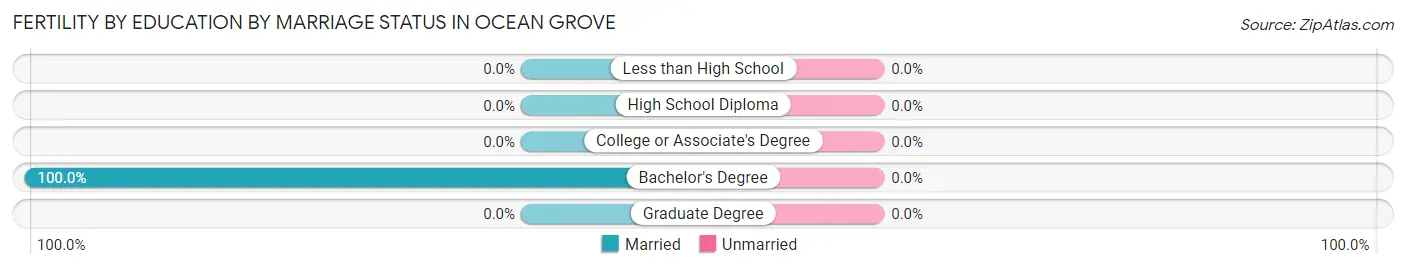
| Educational Attainment | Married | Unmarried |
| Less than High School | 0 (0.0%) | 0 (0.0%) |
| High School Diploma | 0 (0.0%) | 0 (0.0%) |
| College or Associate's Degree | 0 (0.0%) | 0 (0.0%) |
| Bachelor's Degree | 40 (100.0%) | 0 (0.0%) |
| Graduate Degree | 0 (0.0%) | 0 (0.0%) |
| Total | 40 (100.0%) | 0 (0.0%) |
Employment Characteristics in Ocean Grove
Employment by Class of Employer in Ocean Grove
Among the 1,293 employed individuals in Ocean Grove, private company employees (1,071 | 82.8%), not-for-profit organizations (162 | 12.5%), and local government employees (27 | 2.1%) make up the most common classes of employment.
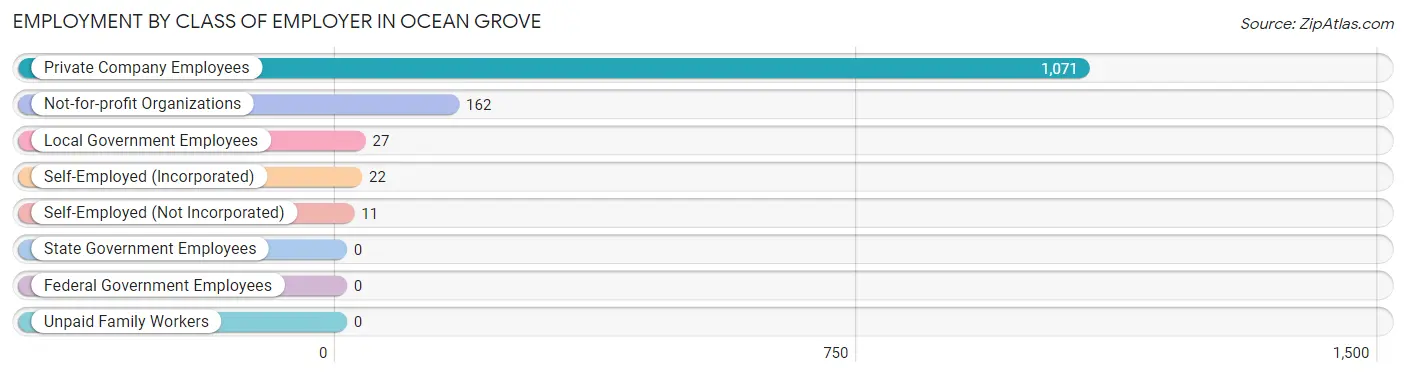
| Employer Class | # Employees | % Employees |
| Private Company Employees | 1,071 | 82.8% |
| Self-Employed (Incorporated) | 22 | 1.7% |
| Self-Employed (Not Incorporated) | 11 | 0.9% |
| Not-for-profit Organizations | 162 | 12.5% |
| Local Government Employees | 27 | 2.1% |
| State Government Employees | 0 | 0.0% |
| Federal Government Employees | 0 | 0.0% |
| Unpaid Family Workers | 0 | 0.0% |
| Total | 1,293 | 100.0% |
Employment Status by Age in Ocean Grove
According to the labor force statistics for Ocean Grove, out of the total population over 16 years of age (2,384), 59.2% or 1,411 individuals are in the labor force, with 7.4% or 104 of them unemployed. The age group with the highest labor force participation rate is 30 to 34 years, with 86.3% or 202 individuals in the labor force. Within the labor force, the 25 to 29 years age range has the highest percentage of unemployed individuals, with 16.5% or 18 of them being unemployed.
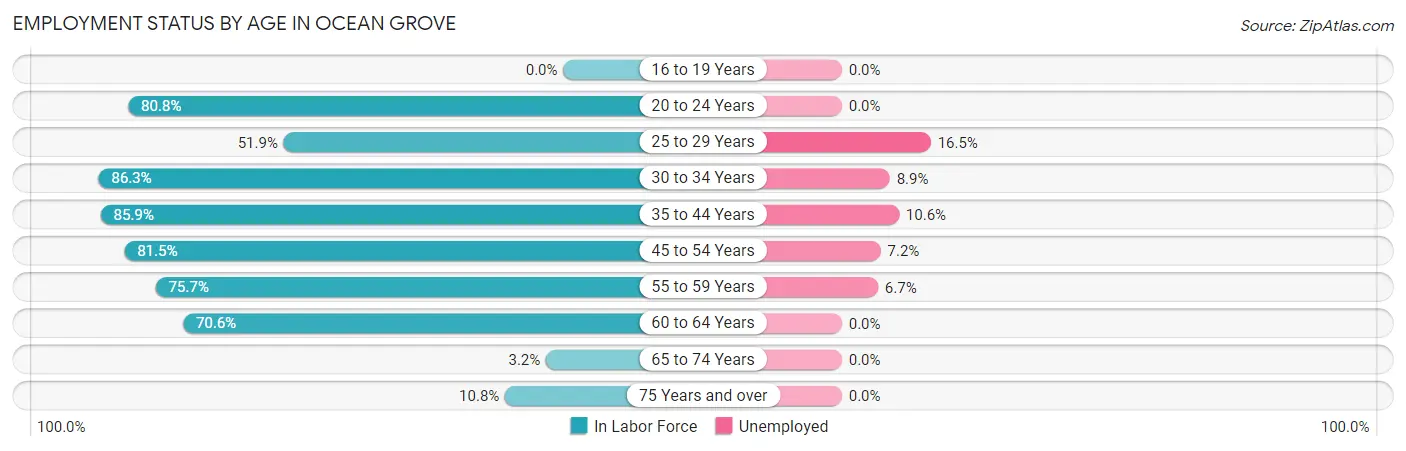
| Age Bracket | In Labor Force | Unemployed |
| 16 to 19 Years | 0 (0.0%) | 0 (0.0%) |
| 20 to 24 Years | 97 (80.8%) | 0 (0.0%) |
| 25 to 29 Years | 109 (51.9%) | 18 (16.5%) |
| 30 to 34 Years | 202 (86.3%) | 18 (8.9%) |
| 35 to 44 Years | 322 (85.9%) | 34 (10.6%) |
| 45 to 54 Years | 264 (81.5%) | 19 (7.2%) |
| 55 to 59 Years | 224 (75.7%) | 15 (6.7%) |
| 60 to 64 Years | 156 (70.6%) | 0 (0.0%) |
| 65 to 74 Years | 11 (3.2%) | 0 (0.0%) |
| 75 Years and over | 26 (10.8%) | 0 (0.0%) |
| Total | 1,411 (59.2%) | 104 (7.4%) |
Employment Status by Educational Attainment in Ocean Grove
According to labor force statistics for Ocean Grove, 76.9% of individuals (1,277) out of the total population between 25 and 64 years of age (1,660) are in the labor force, with 8.1% or 103 of them being unemployed. The group with the highest labor force participation rate are those with the educational attainment of high school diploma, with 83.7% or 431 individuals in the labor force. Within the labor force, individuals with less than high school education have the highest percentage of unemployment, with 56.3% or 18 of them being unemployed.
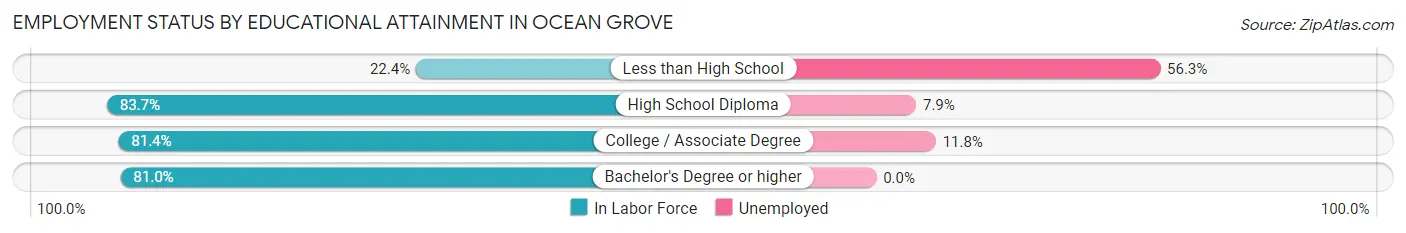
| Educational Attainment | In Labor Force | Unemployed |
| Less than High School | 32 (22.4%) | 81 (56.3%) |
| High School Diploma | 431 (83.7%) | 41 (7.9%) |
| College / Associate Degree | 442 (81.4%) | 64 (11.8%) |
| Bachelor's Degree or higher | 372 (81.0%) | 0 (0.0%) |
| Total | 1,277 (76.9%) | 134 (8.1%) |
Employment Occupations by Sex in Ocean Grove
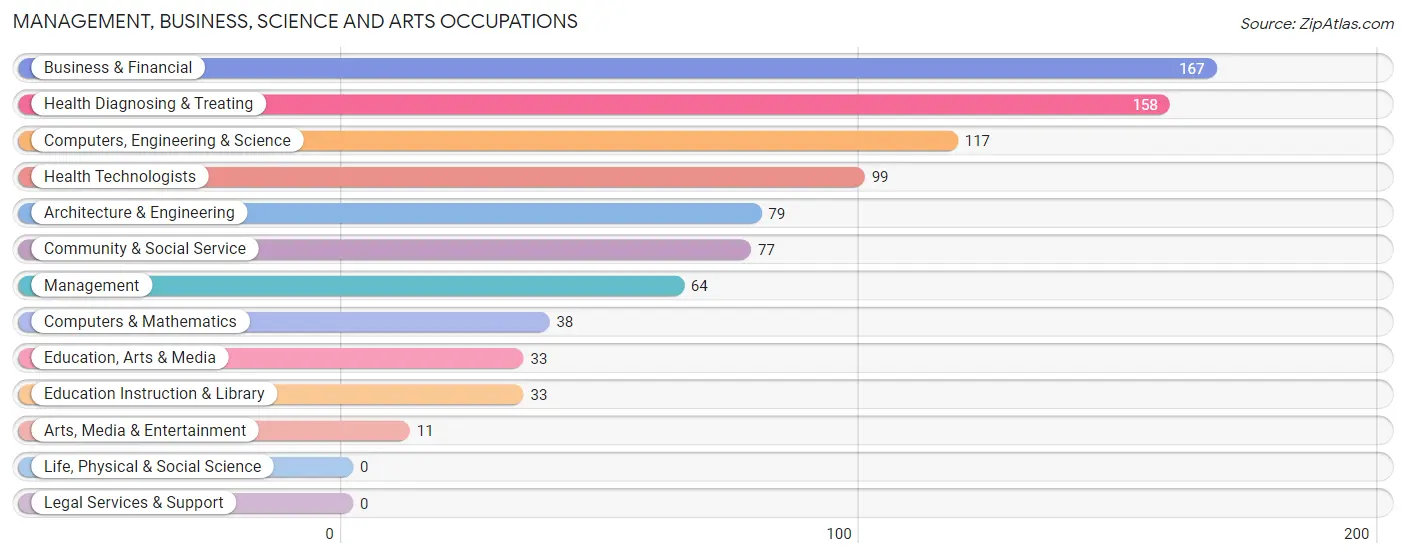
Management, Business, Science and Arts Occupations
The most common Management, Business, Science and Arts occupations in Ocean Grove are Business & Financial (167 | 12.8%), Health Diagnosing & Treating (158 | 12.1%), Computers, Engineering & Science (117 | 8.9%), Health Technologists (99 | 7.6%), and Architecture & Engineering (79 | 6.0%).
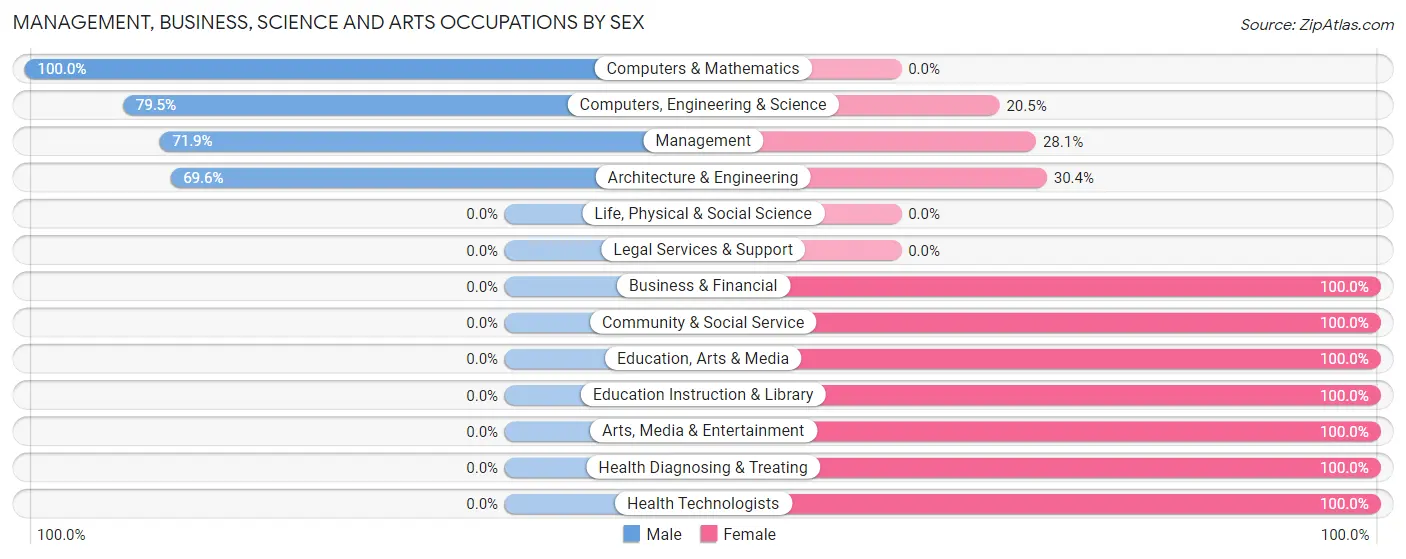
Management, Business, Science and Arts Occupations by Sex
Within the Management, Business, Science and Arts occupations in Ocean Grove, the most male-oriented occupations are Computers & Mathematics (100.0%), Computers, Engineering & Science (79.5%), and Management (71.9%), while the most female-oriented occupations are Business & Financial (100.0%), Community & Social Service (100.0%), and Education, Arts & Media (100.0%).
| Occupation | Male | Female |
| Management | 46 (71.9%) | 18 (28.1%) |
| Business & Financial | 0 (0.0%) | 167 (100.0%) |
| Computers, Engineering & Science | 93 (79.5%) | 24 (20.5%) |
| Computers & Mathematics | 38 (100.0%) | 0 (0.0%) |
| Architecture & Engineering | 55 (69.6%) | 24 (30.4%) |
| Life, Physical & Social Science | 0 (0.0%) | 0 (0.0%) |
| Community & Social Service | 0 (0.0%) | 77 (100.0%) |
| Education, Arts & Media | 0 (0.0%) | 33 (100.0%) |
| Legal Services & Support | 0 (0.0%) | 0 (0.0%) |
| Education Instruction & Library | 0 (0.0%) | 33 (100.0%) |
| Arts, Media & Entertainment | 0 (0.0%) | 11 (100.0%) |
| Health Diagnosing & Treating | 0 (0.0%) | 158 (100.0%) |
| Health Technologists | 0 (0.0%) | 99 (100.0%) |
| Total (Category) | 139 (23.8%) | 444 (76.2%) |
| Total (Overall) | 515 (39.4%) | 792 (60.6%) |
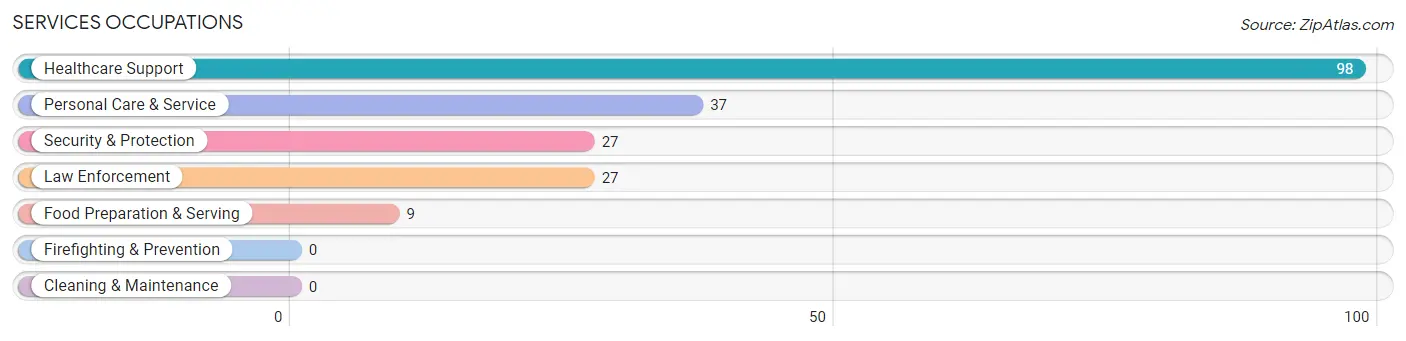
Services Occupations
The most common Services occupations in Ocean Grove are Healthcare Support (98 | 7.5%), Personal Care & Service (37 | 2.8%), Security & Protection (27 | 2.1%), Law Enforcement (27 | 2.1%), and Food Preparation & Serving (9 | 0.7%).
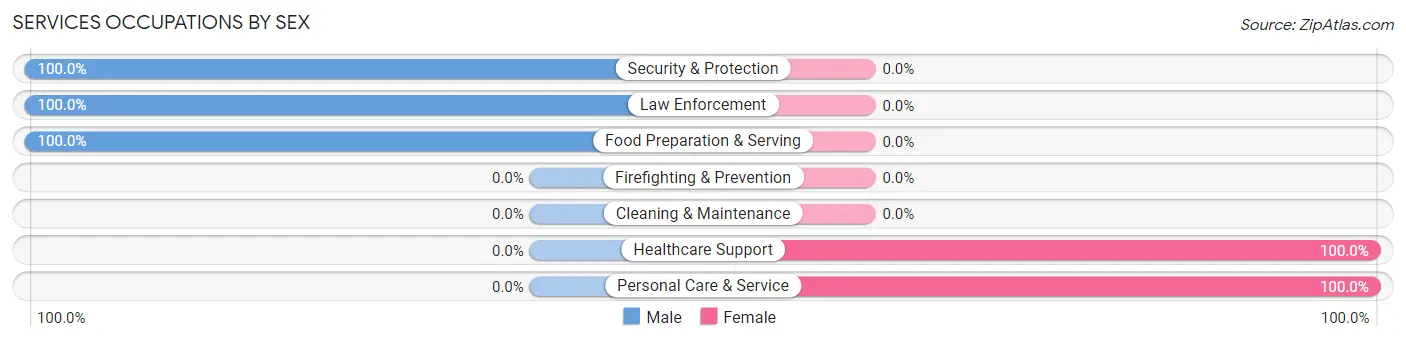
Services Occupations by Sex
Within the Services occupations in Ocean Grove, the most male-oriented occupations are Security & Protection (100.0%), Law Enforcement (100.0%), and Food Preparation & Serving (100.0%), while the most female-oriented occupations are Healthcare Support (100.0%), and Personal Care & Service (100.0%).
| Occupation | Male | Female |
| Healthcare Support | 0 (0.0%) | 98 (100.0%) |
| Security & Protection | 27 (100.0%) | 0 (0.0%) |
| Firefighting & Prevention | 0 (0.0%) | 0 (0.0%) |
| Law Enforcement | 27 (100.0%) | 0 (0.0%) |
| Food Preparation & Serving | 9 (100.0%) | 0 (0.0%) |
| Cleaning & Maintenance | 0 (0.0%) | 0 (0.0%) |
| Personal Care & Service | 0 (0.0%) | 37 (100.0%) |
| Total (Category) | 36 (21.0%) | 135 (78.9%) |
| Total (Overall) | 515 (39.4%) | 792 (60.6%) |
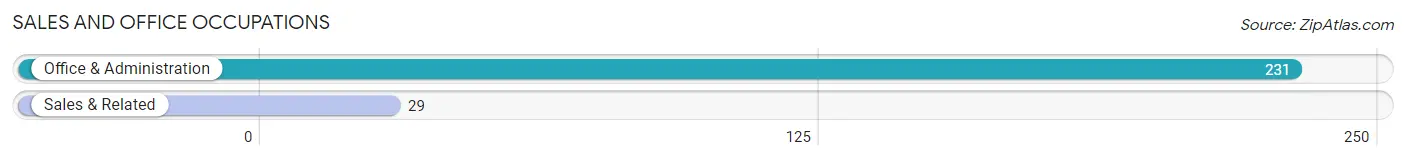
Sales and Office Occupations
The most common Sales and Office occupations in Ocean Grove are Office & Administration (231 | 17.7%), and Sales & Related (29 | 2.2%).
Sales and Office Occupations by Sex
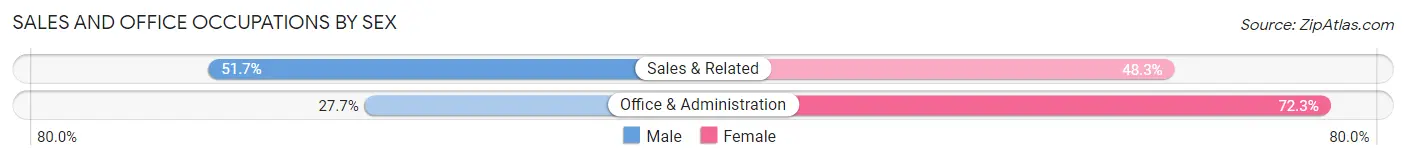
| Occupation | Male | Female |
| Sales & Related | 15 (51.7%) | 14 (48.3%) |
| Office & Administration | 64 (27.7%) | 167 (72.3%) |
| Total (Category) | 79 (30.4%) | 181 (69.6%) |
| Total (Overall) | 515 (39.4%) | 792 (60.6%) |
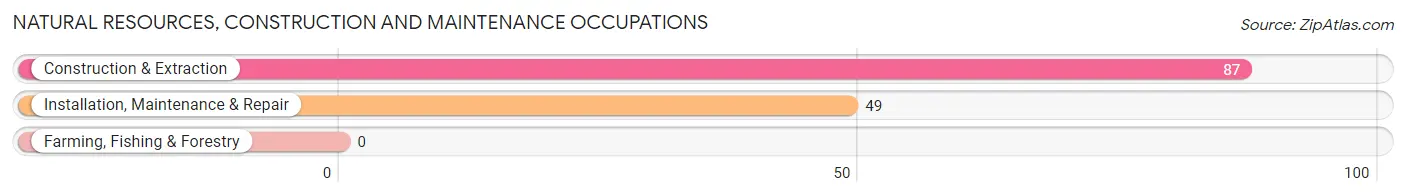
Natural Resources, Construction and Maintenance Occupations
The most common Natural Resources, Construction and Maintenance occupations in Ocean Grove are Construction & Extraction (87 | 6.7%), and Installation, Maintenance & Repair (49 | 3.7%).
Natural Resources, Construction and Maintenance Occupations by Sex
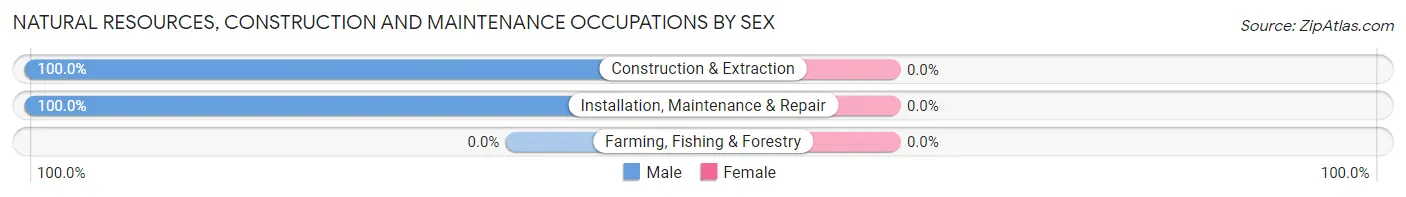
| Occupation | Male | Female |
| Farming, Fishing & Forestry | 0 (0.0%) | 0 (0.0%) |
| Construction & Extraction | 87 (100.0%) | 0 (0.0%) |
| Installation, Maintenance & Repair | 49 (100.0%) | 0 (0.0%) |
| Total (Category) | 136 (100.0%) | 0 (0.0%) |
| Total (Overall) | 515 (39.4%) | 792 (60.6%) |
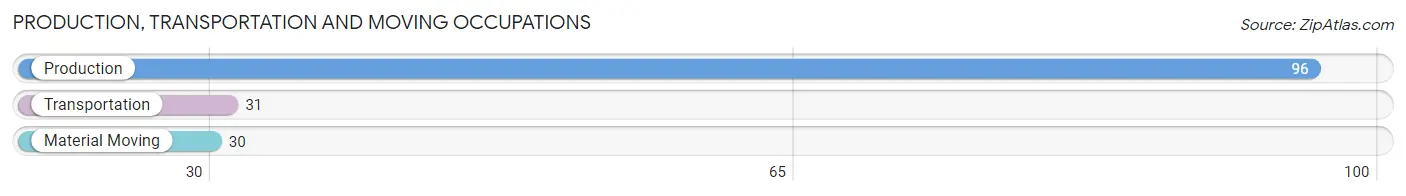
Production, Transportation and Moving Occupations
The most common Production, Transportation and Moving occupations in Ocean Grove are Production (96 | 7.3%), Transportation (31 | 2.4%), and Material Moving (30 | 2.3%).
Production, Transportation and Moving Occupations by Sex
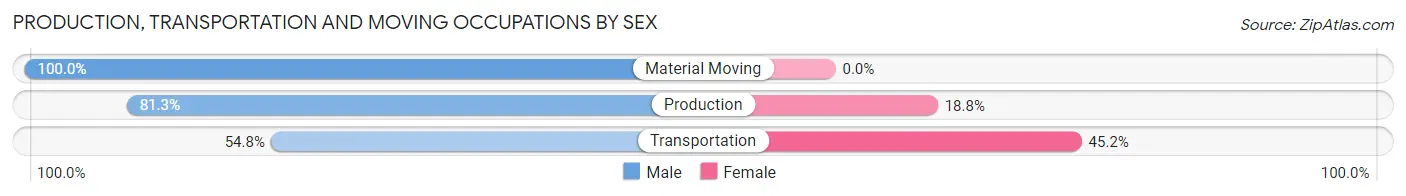
| Occupation | Male | Female |
| Production | 78 (81.2%) | 18 (18.8%) |
| Transportation | 17 (54.8%) | 14 (45.2%) |
| Material Moving | 30 (100.0%) | 0 (0.0%) |
| Total (Category) | 125 (79.6%) | 32 (20.4%) |
| Total (Overall) | 515 (39.4%) | 792 (60.6%) |
Employment Industries by Sex in Ocean Grove
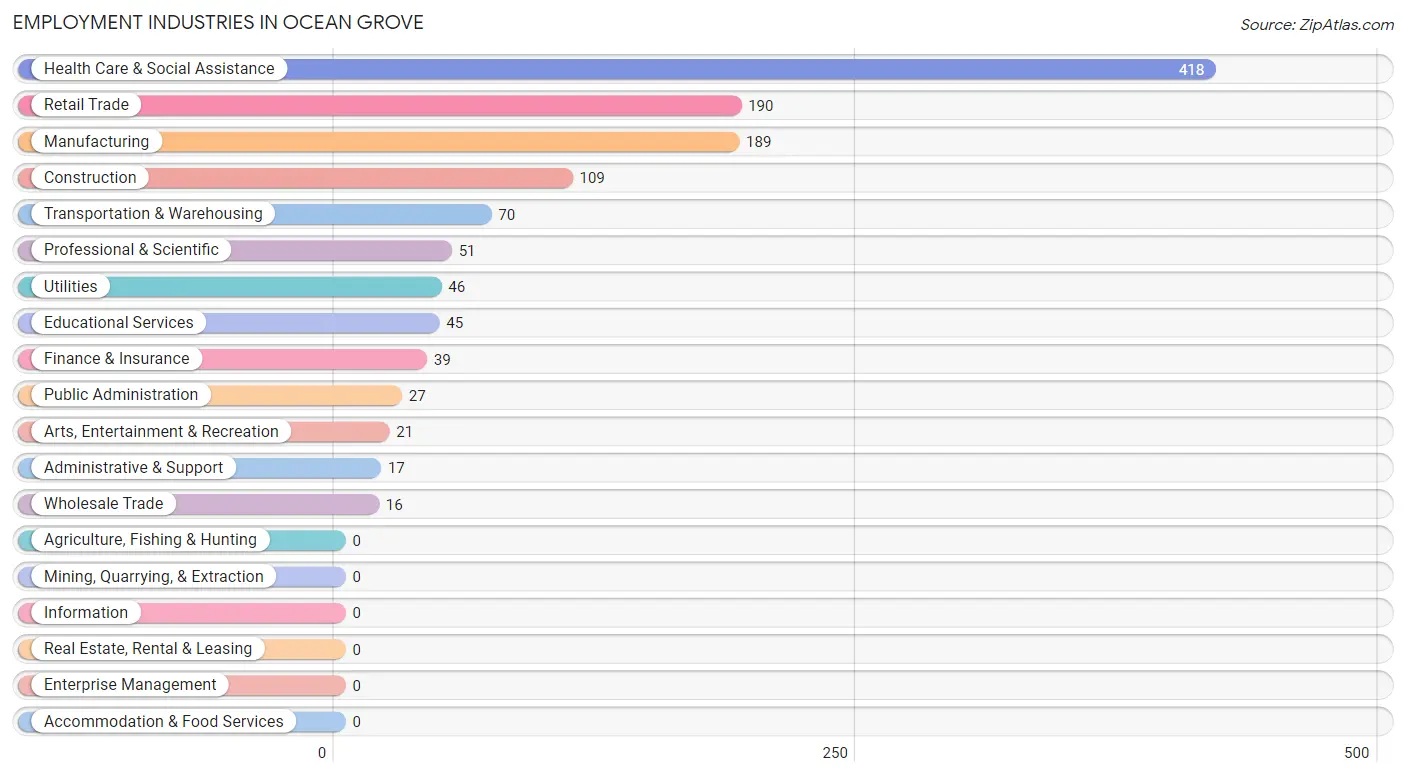
Employment Industries in Ocean Grove
The major employment industries in Ocean Grove include Health Care & Social Assistance (418 | 32.0%), Retail Trade (190 | 14.5%), Manufacturing (189 | 14.5%), Construction (109 | 8.3%), and Transportation & Warehousing (70 | 5.4%).
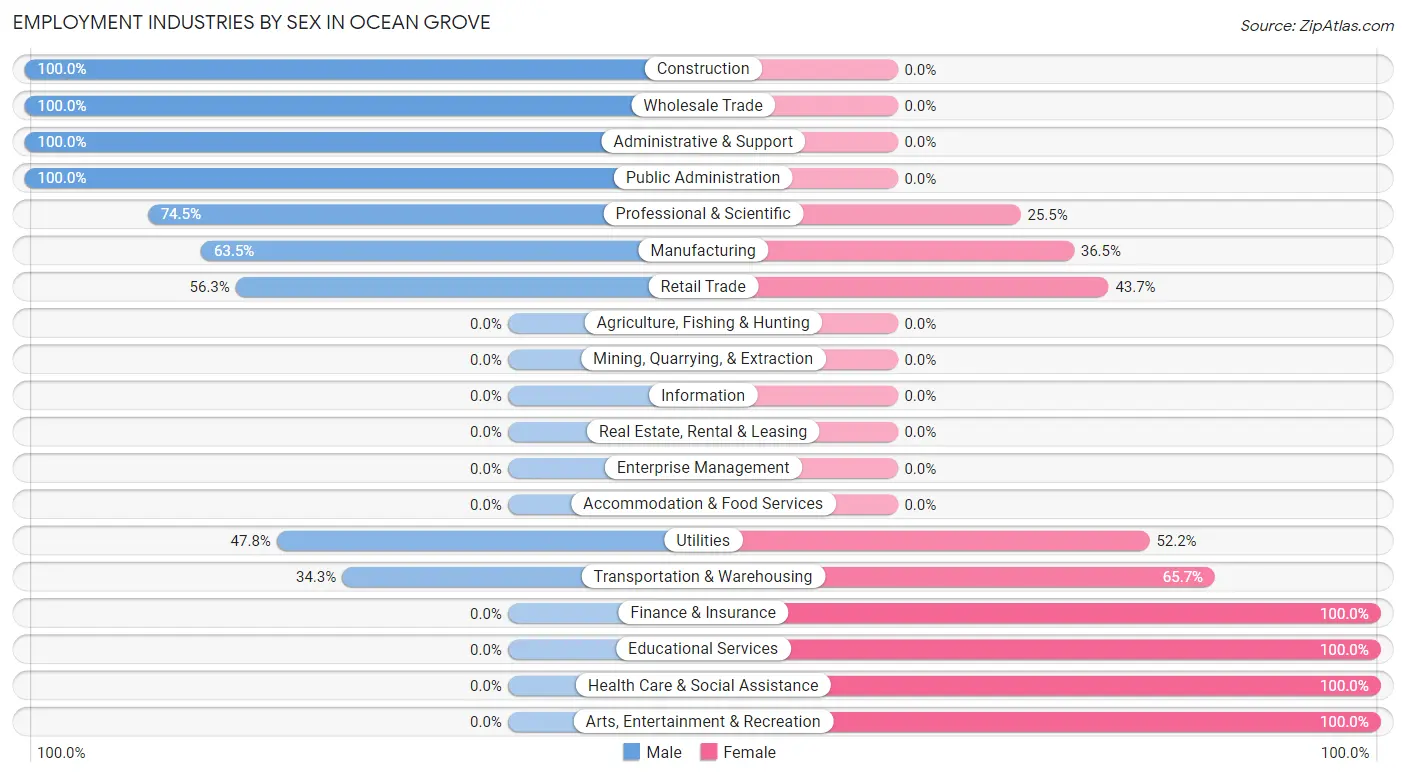
Employment Industries by Sex in Ocean Grove
The Ocean Grove industries that see more men than women are Construction (100.0%), Wholesale Trade (100.0%), and Administrative & Support (100.0%), whereas the industries that tend to have a higher number of women are Finance & Insurance (100.0%), Educational Services (100.0%), and Health Care & Social Assistance (100.0%).
| Industry | Male | Female |
| Agriculture, Fishing & Hunting | 0 (0.0%) | 0 (0.0%) |
| Mining, Quarrying, & Extraction | 0 (0.0%) | 0 (0.0%) |
| Construction | 109 (100.0%) | 0 (0.0%) |
| Manufacturing | 120 (63.5%) | 69 (36.5%) |
| Wholesale Trade | 16 (100.0%) | 0 (0.0%) |
| Retail Trade | 107 (56.3%) | 83 (43.7%) |
| Transportation & Warehousing | 24 (34.3%) | 46 (65.7%) |
| Utilities | 22 (47.8%) | 24 (52.2%) |
| Information | 0 (0.0%) | 0 (0.0%) |
| Finance & Insurance | 0 (0.0%) | 39 (100.0%) |
| Real Estate, Rental & Leasing | 0 (0.0%) | 0 (0.0%) |
| Professional & Scientific | 38 (74.5%) | 13 (25.5%) |
| Enterprise Management | 0 (0.0%) | 0 (0.0%) |
| Administrative & Support | 17 (100.0%) | 0 (0.0%) |
| Educational Services | 0 (0.0%) | 45 (100.0%) |
| Health Care & Social Assistance | 0 (0.0%) | 418 (100.0%) |
| Arts, Entertainment & Recreation | 0 (0.0%) | 21 (100.0%) |
| Accommodation & Food Services | 0 (0.0%) | 0 (0.0%) |
| Public Administration | 27 (100.0%) | 0 (0.0%) |
| Total | 515 (39.4%) | 792 (60.6%) |
Education in Ocean Grove
School Enrollment in Ocean Grove
The most common levels of schooling among the 296 students in Ocean Grove are elementary school (83 | 28.0%), nursery / preschool (74 | 25.0%), and high school (50 | 16.9%).
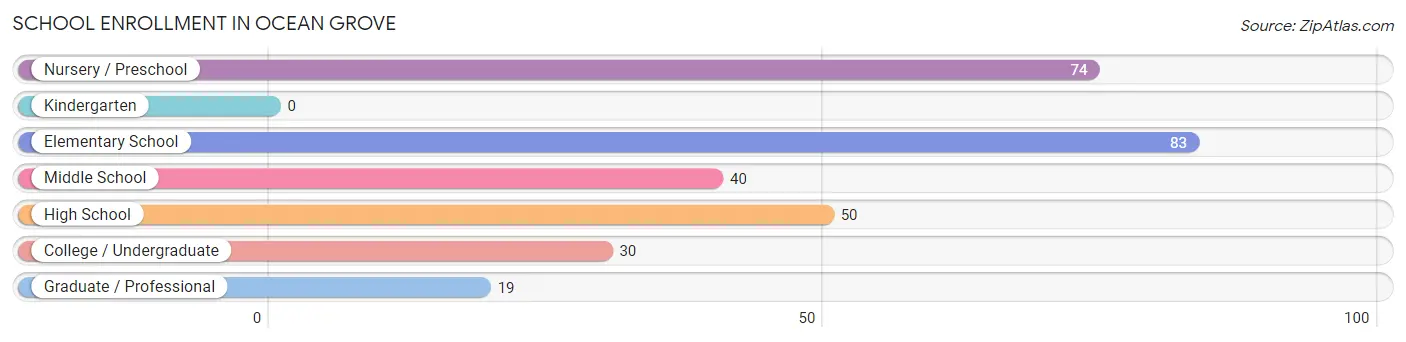
| School Level | # Students | % Students |
| Nursery / Preschool | 74 | 25.0% |
| Kindergarten | 0 | 0.0% |
| Elementary School | 83 | 28.0% |
| Middle School | 40 | 13.5% |
| High School | 50 | 16.9% |
| College / Undergraduate | 30 | 10.1% |
| Graduate / Professional | 19 | 6.4% |
| Total | 296 | 100.0% |
School Enrollment by Age by Funding Source in Ocean Grove
Out of a total of 296 students who are enrolled in schools in Ocean Grove, 39 (13.2%) attend a private institution, while the remaining 257 (86.8%) are enrolled in public schools. The age group of 35 years and over has the highest likelihood of being enrolled in private schools, with 11 (44.0% in the age bracket) enrolled. Conversely, the age group of 5 to 9 year old has the lowest likelihood of being enrolled in a private school, with 83 (100.0% in the age bracket) attending a public institution.
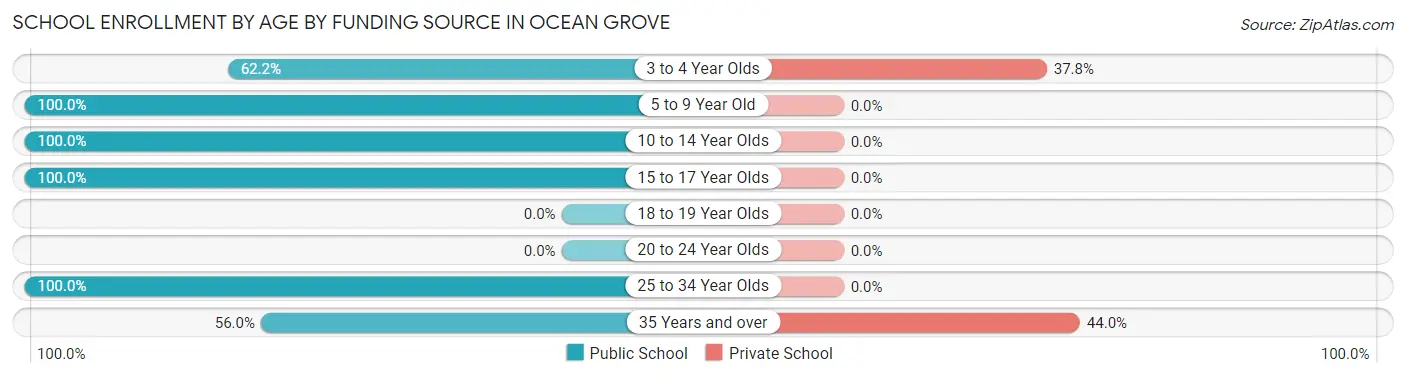
| Age Bracket | Public School | Private School |
| 3 to 4 Year Olds | 46 (62.2%) | 28 (37.8%) |
| 5 to 9 Year Old | 83 (100.0%) | 0 (0.0%) |
| 10 to 14 Year Olds | 40 (100.0%) | 0 (0.0%) |
| 15 to 17 Year Olds | 36 (100.0%) | 0 (0.0%) |
| 18 to 19 Year Olds | 0 (0.0%) | 0 (0.0%) |
| 20 to 24 Year Olds | 0 (0.0%) | 0 (0.0%) |
| 25 to 34 Year Olds | 38 (100.0%) | 0 (0.0%) |
| 35 Years and over | 14 (56.0%) | 11 (44.0%) |
| Total | 257 (86.8%) | 39 (13.2%) |
Educational Attainment by Field of Study in Ocean Grove
Engineering (140 | 20.5%), science & technology (104 | 15.2%), social sciences (103 | 15.1%), psychology (86 | 12.6%), and computers & mathematics (48 | 7.0%) are the most common fields of study among 682 individuals in Ocean Grove who have obtained a bachelor's degree or higher.
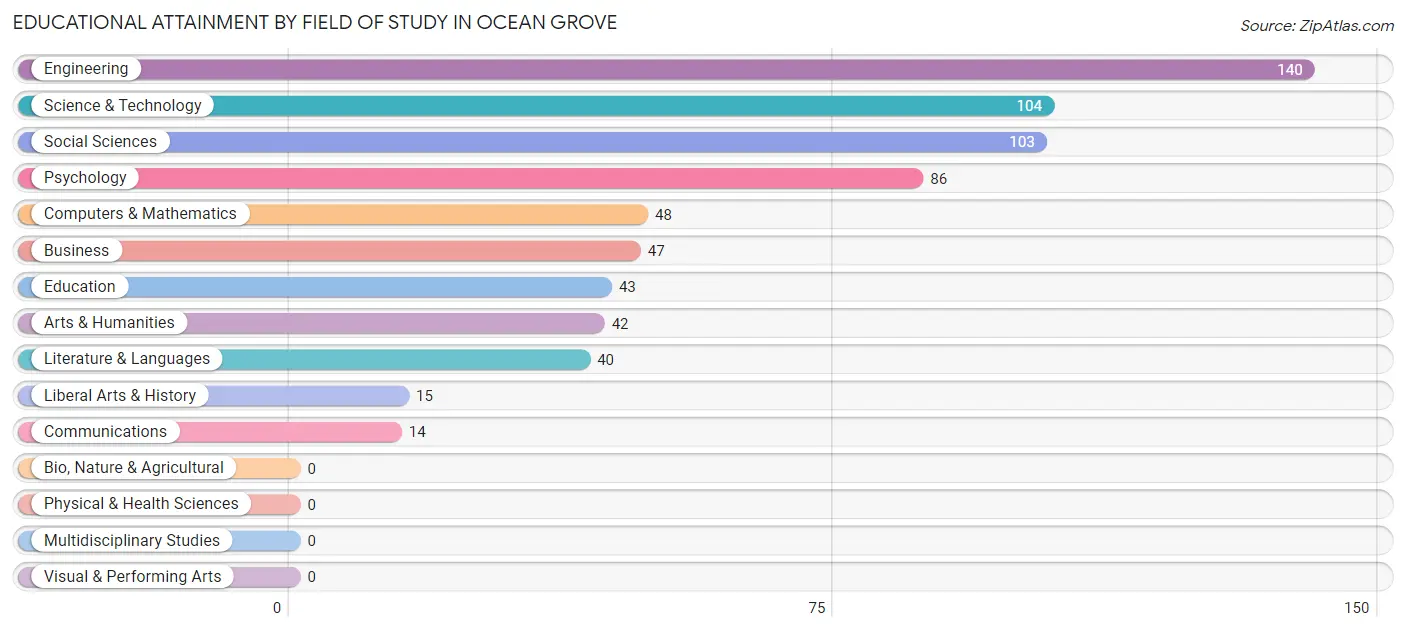
| Field of Study | # Graduates | % Graduates |
| Computers & Mathematics | 48 | 7.0% |
| Bio, Nature & Agricultural | 0 | 0.0% |
| Physical & Health Sciences | 0 | 0.0% |
| Psychology | 86 | 12.6% |
| Social Sciences | 103 | 15.1% |
| Engineering | 140 | 20.5% |
| Multidisciplinary Studies | 0 | 0.0% |
| Science & Technology | 104 | 15.2% |
| Business | 47 | 6.9% |
| Education | 43 | 6.3% |
| Literature & Languages | 40 | 5.9% |
| Liberal Arts & History | 15 | 2.2% |
| Visual & Performing Arts | 0 | 0.0% |
| Communications | 14 | 2.1% |
| Arts & Humanities | 42 | 6.2% |
| Total | 682 | 100.0% |
Transportation & Commute in Ocean Grove
Vehicle Availability by Sex in Ocean Grove
The most prevalent vehicle ownership categories in Ocean Grove are males with 2 vehicles (247, accounting for 48.0%) and females with 2 vehicles (311, making up 31.8%).
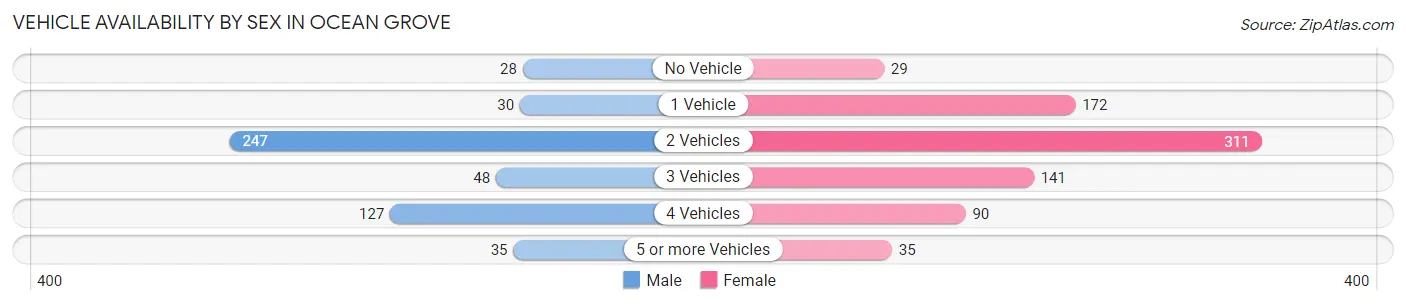
| Vehicles Available | Male | Female |
| No Vehicle | 28 (5.4%) | 29 (3.7%) |
| 1 Vehicle | 30 (5.8%) | 172 (22.1%) |
| 2 Vehicles | 247 (48.0%) | 311 (40.0%) |
| 3 Vehicles | 48 (9.3%) | 141 (18.1%) |
| 4 Vehicles | 127 (24.7%) | 90 (11.6%) |
| 5 or more Vehicles | 35 (6.8%) | 35 (4.5%) |
| Total | 515 (100.0%) | 778 (100.0%) |
Commute Time in Ocean Grove
The most frequently occuring commute durations in Ocean Grove are 30 to 34 minutes (347 commuters, 31.0%), 10 to 14 minutes (191 commuters, 17.1%), and 20 to 24 minutes (173 commuters, 15.5%).
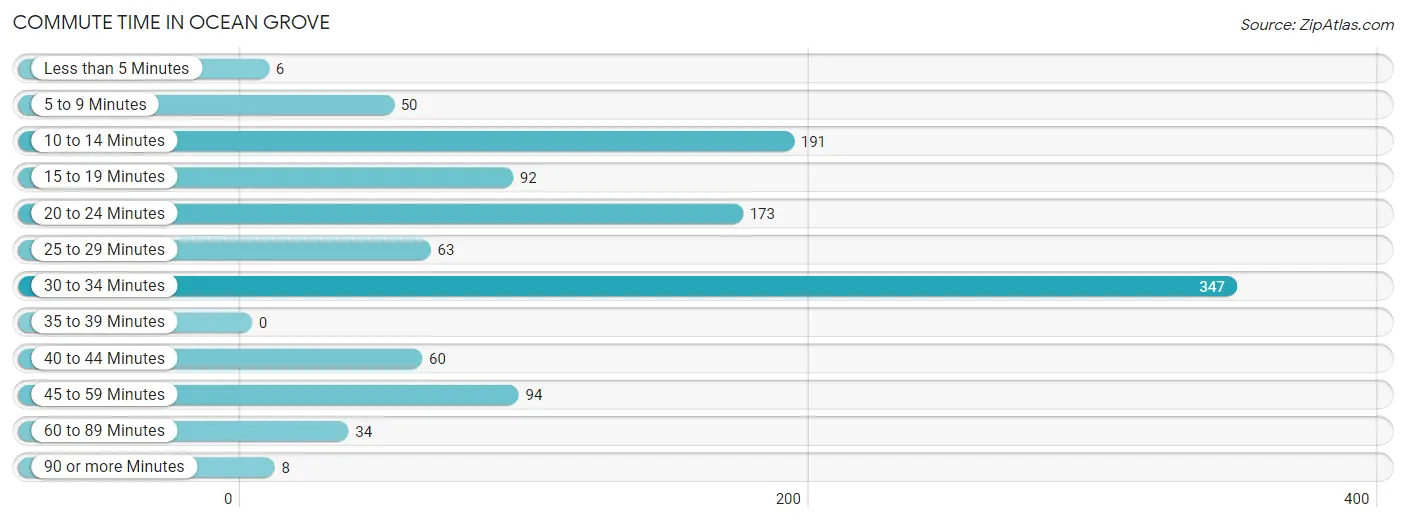
| Commute Time | # Commuters | % Commuters |
| Less than 5 Minutes | 6 | 0.5% |
| 5 to 9 Minutes | 50 | 4.5% |
| 10 to 14 Minutes | 191 | 17.1% |
| 15 to 19 Minutes | 92 | 8.2% |
| 20 to 24 Minutes | 173 | 15.5% |
| 25 to 29 Minutes | 63 | 5.6% |
| 30 to 34 Minutes | 347 | 31.0% |
| 35 to 39 Minutes | 0 | 0.0% |
| 40 to 44 Minutes | 60 | 5.4% |
| 45 to 59 Minutes | 94 | 8.4% |
| 60 to 89 Minutes | 34 | 3.0% |
| 90 or more Minutes | 8 | 0.7% |
Commute Time by Sex in Ocean Grove
The most common commute times in Ocean Grove are 30 to 34 minutes (163 commuters, 33.6%) for males and 30 to 34 minutes (184 commuters, 29.1%) for females.
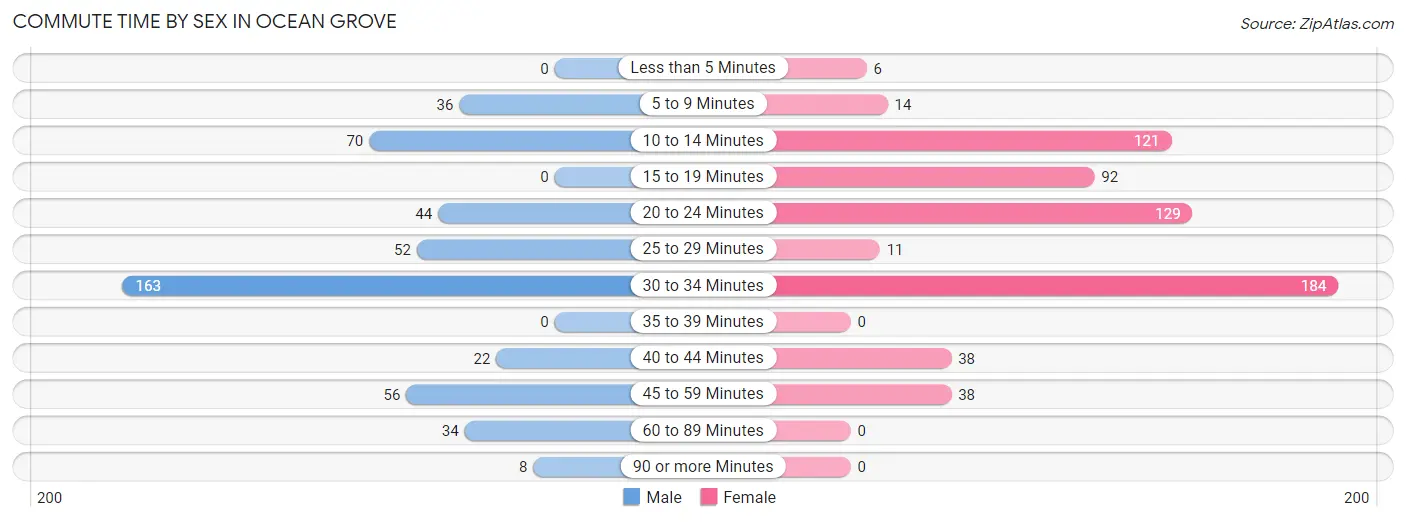
| Commute Time | Male | Female |
| Less than 5 Minutes | 0 (0.0%) | 6 (0.9%) |
| 5 to 9 Minutes | 36 (7.4%) | 14 (2.2%) |
| 10 to 14 Minutes | 70 (14.4%) | 121 (19.1%) |
| 15 to 19 Minutes | 0 (0.0%) | 92 (14.5%) |
| 20 to 24 Minutes | 44 (9.1%) | 129 (20.4%) |
| 25 to 29 Minutes | 52 (10.7%) | 11 (1.7%) |
| 30 to 34 Minutes | 163 (33.6%) | 184 (29.1%) |
| 35 to 39 Minutes | 0 (0.0%) | 0 (0.0%) |
| 40 to 44 Minutes | 22 (4.5%) | 38 (6.0%) |
| 45 to 59 Minutes | 56 (11.6%) | 38 (6.0%) |
| 60 to 89 Minutes | 34 (7.0%) | 0 (0.0%) |
| 90 or more Minutes | 8 (1.7%) | 0 (0.0%) |
Time of Departure to Work by Sex in Ocean Grove
The most frequent times of departure to work in Ocean Grove are 12:00 AM to 4:59 AM (129, 26.6%) for males and 4:00 PM to 11:59 PM (122, 19.3%) for females.
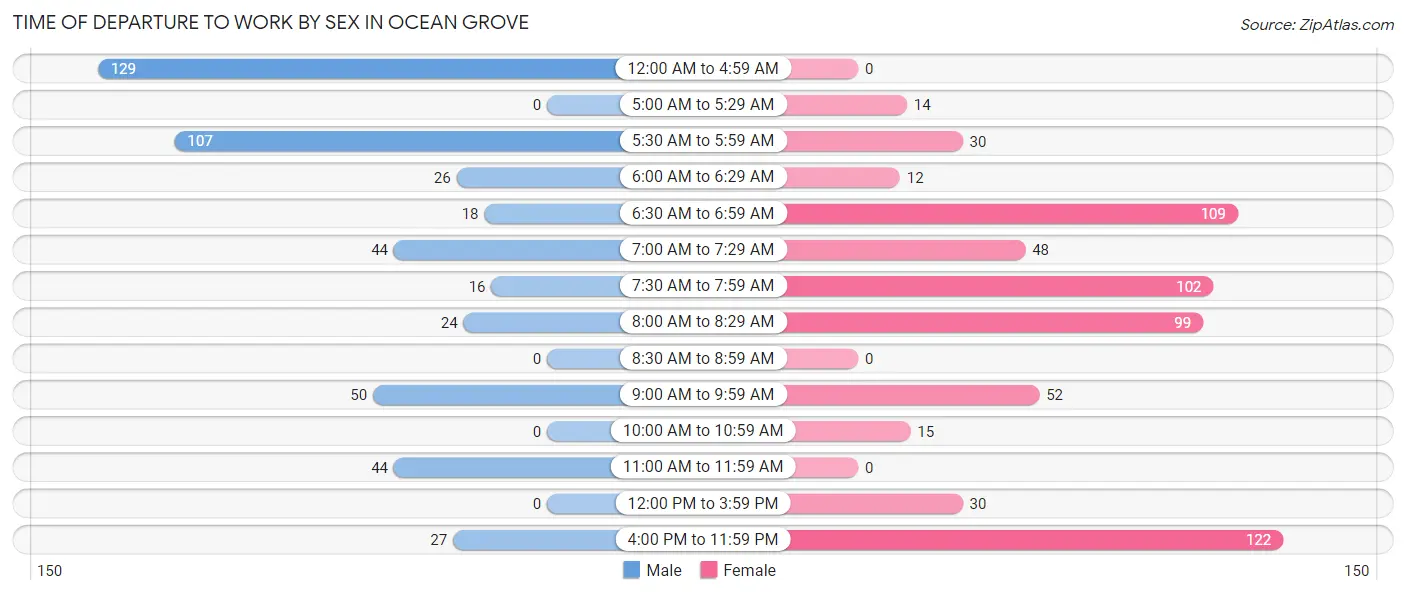
| Time of Departure | Male | Female |
| 12:00 AM to 4:59 AM | 129 (26.6%) | 0 (0.0%) |
| 5:00 AM to 5:29 AM | 0 (0.0%) | 14 (2.2%) |
| 5:30 AM to 5:59 AM | 107 (22.1%) | 30 (4.7%) |
| 6:00 AM to 6:29 AM | 26 (5.4%) | 12 (1.9%) |
| 6:30 AM to 6:59 AM | 18 (3.7%) | 109 (17.2%) |
| 7:00 AM to 7:29 AM | 44 (9.1%) | 48 (7.6%) |
| 7:30 AM to 7:59 AM | 16 (3.3%) | 102 (16.1%) |
| 8:00 AM to 8:29 AM | 24 (5.0%) | 99 (15.6%) |
| 8:30 AM to 8:59 AM | 0 (0.0%) | 0 (0.0%) |
| 9:00 AM to 9:59 AM | 50 (10.3%) | 52 (8.2%) |
| 10:00 AM to 10:59 AM | 0 (0.0%) | 15 (2.4%) |
| 11:00 AM to 11:59 AM | 44 (9.1%) | 0 (0.0%) |
| 12:00 PM to 3:59 PM | 0 (0.0%) | 30 (4.7%) |
| 4:00 PM to 11:59 PM | 27 (5.6%) | 122 (19.3%) |
| Total | 485 (100.0%) | 633 (100.0%) |
Housing Occupancy in Ocean Grove
Occupancy by Ownership in Ocean Grove
Of the total 1,229 dwellings in Ocean Grove, owner-occupied units account for 988 (80.4%), while renter-occupied units make up 241 (19.6%).
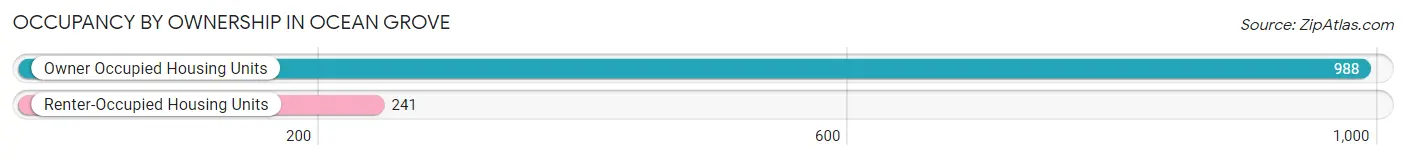
| Occupancy | # Housing Units | % Housing Units |
| Owner Occupied Housing Units | 988 | 80.4% |
| Renter-Occupied Housing Units | 241 | 19.6% |
| Total Occupied Housing Units | 1,229 | 100.0% |
Occupancy by Household Size in Ocean Grove
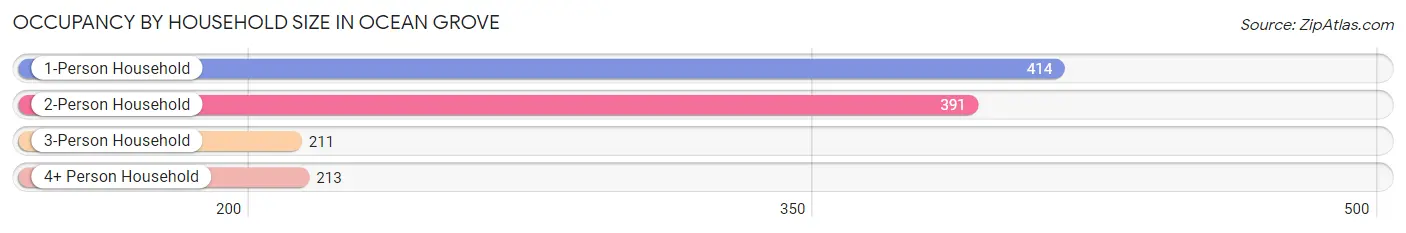
| Household Size | # Housing Units | % Housing Units |
| 1-Person Household | 414 | 33.7% |
| 2-Person Household | 391 | 31.8% |
| 3-Person Household | 211 | 17.2% |
| 4+ Person Household | 213 | 17.3% |
| Total Housing Units | 1,229 | 100.0% |
Occupancy by Ownership by Household Size in Ocean Grove
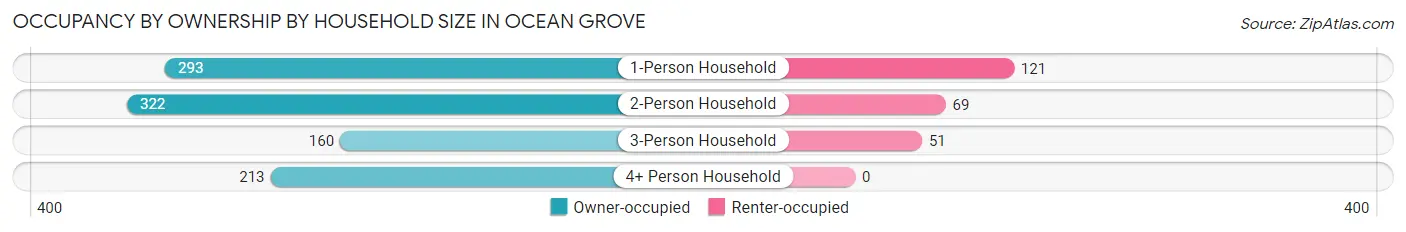
| Household Size | Owner-occupied | Renter-occupied |
| 1-Person Household | 293 (70.8%) | 121 (29.2%) |
| 2-Person Household | 322 (82.4%) | 69 (17.6%) |
| 3-Person Household | 160 (75.8%) | 51 (24.2%) |
| 4+ Person Household | 213 (100.0%) | 0 (0.0%) |
| Total Housing Units | 988 (80.4%) | 241 (19.6%) |
Occupancy by Educational Attainment in Ocean Grove
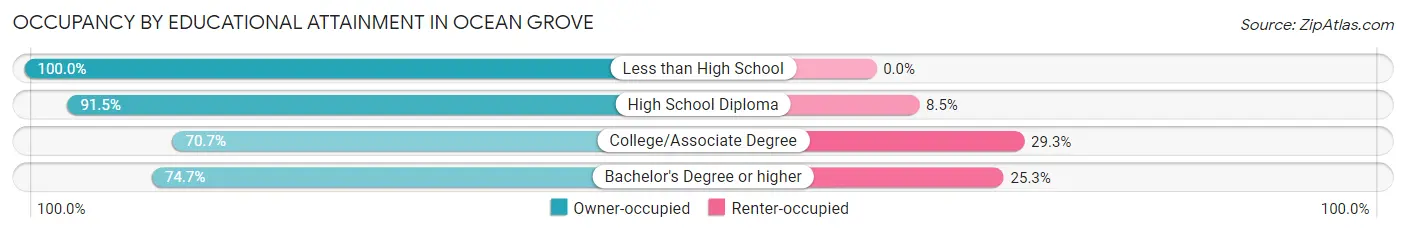
| Household Size | Owner-occupied | Renter-occupied |
| Less than High School | 77 (100.0%) | 0 (0.0%) |
| High School Diploma | 344 (91.5%) | 32 (8.5%) |
| College/Associate Degree | 224 (70.7%) | 93 (29.3%) |
| Bachelor's Degree or higher | 343 (74.7%) | 116 (25.3%) |
Occupancy by Age of Householder in Ocean Grove
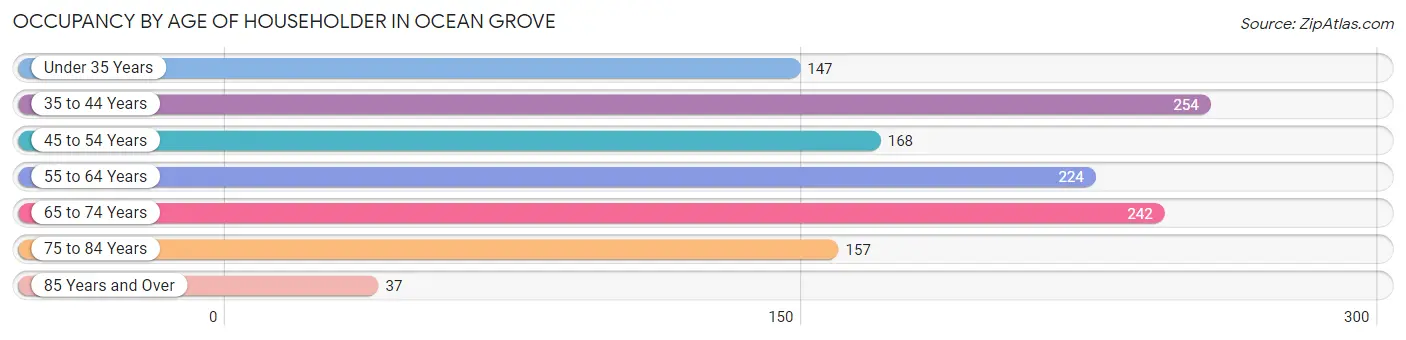
| Age Bracket | # Households | % Households |
| Under 35 Years | 147 | 12.0% |
| 35 to 44 Years | 254 | 20.7% |
| 45 to 54 Years | 168 | 13.7% |
| 55 to 64 Years | 224 | 18.2% |
| 65 to 74 Years | 242 | 19.7% |
| 75 to 84 Years | 157 | 12.8% |
| 85 Years and Over | 37 | 3.0% |
| Total | 1,229 | 100.0% |
Housing Finances in Ocean Grove
Median Income by Occupancy in Ocean Grove
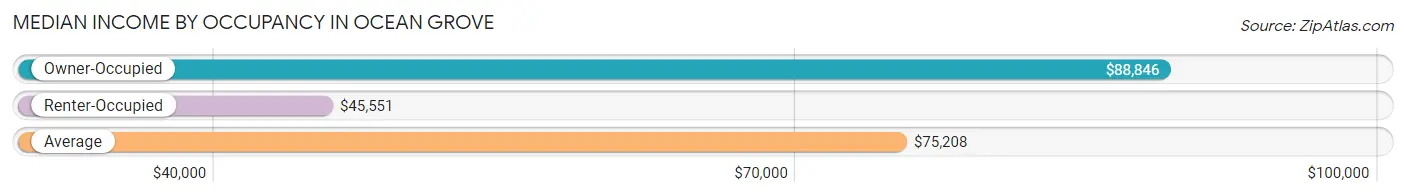
| Occupancy Type | # Households | Median Income |
| Owner-Occupied | 988 (80.4%) | $88,846 |
| Renter-Occupied | 241 (19.6%) | $45,551 |
| Average | 1,229 (100.0%) | $75,208 |
Occupancy by Householder Income Bracket in Ocean Grove
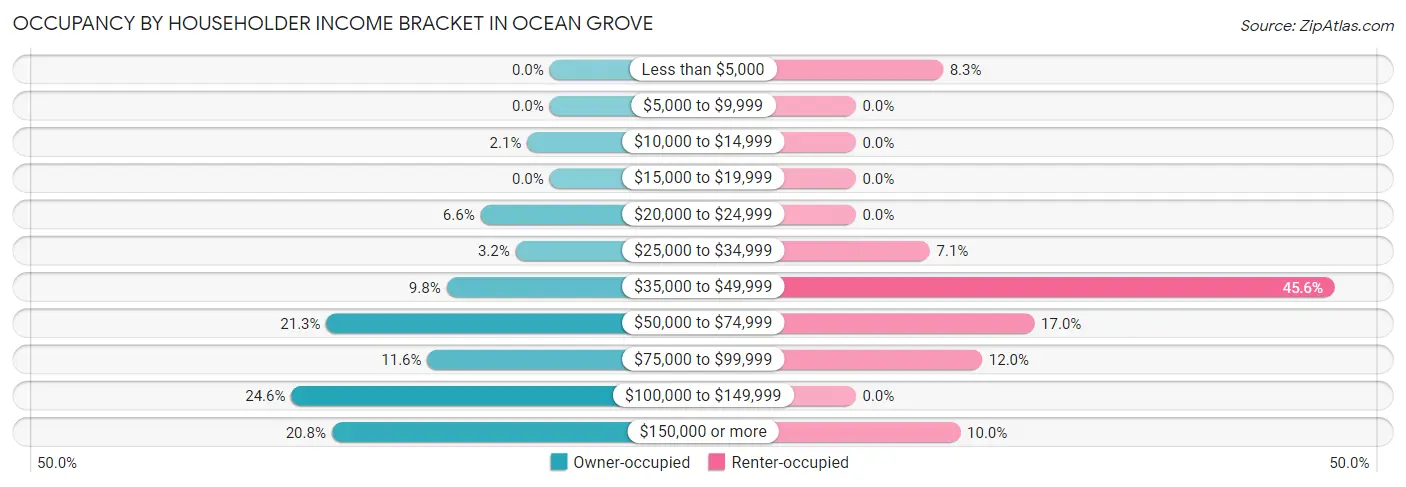
| Income Bracket | Owner-occupied | Renter-occupied |
| Less than $5,000 | 0 (0.0%) | 20 (8.3%) |
| $5,000 to $9,999 | 0 (0.0%) | 0 (0.0%) |
| $10,000 to $14,999 | 21 (2.1%) | 0 (0.0%) |
| $15,000 to $19,999 | 0 (0.0%) | 0 (0.0%) |
| $20,000 to $24,999 | 65 (6.6%) | 0 (0.0%) |
| $25,000 to $34,999 | 32 (3.2%) | 17 (7.0%) |
| $35,000 to $49,999 | 97 (9.8%) | 110 (45.6%) |
| $50,000 to $74,999 | 210 (21.3%) | 41 (17.0%) |
| $75,000 to $99,999 | 115 (11.6%) | 29 (12.0%) |
| $100,000 to $149,999 | 243 (24.6%) | 0 (0.0%) |
| $150,000 or more | 205 (20.7%) | 24 (10.0%) |
| Total | 988 (100.0%) | 241 (100.0%) |
Monthly Housing Cost Tiers in Ocean Grove
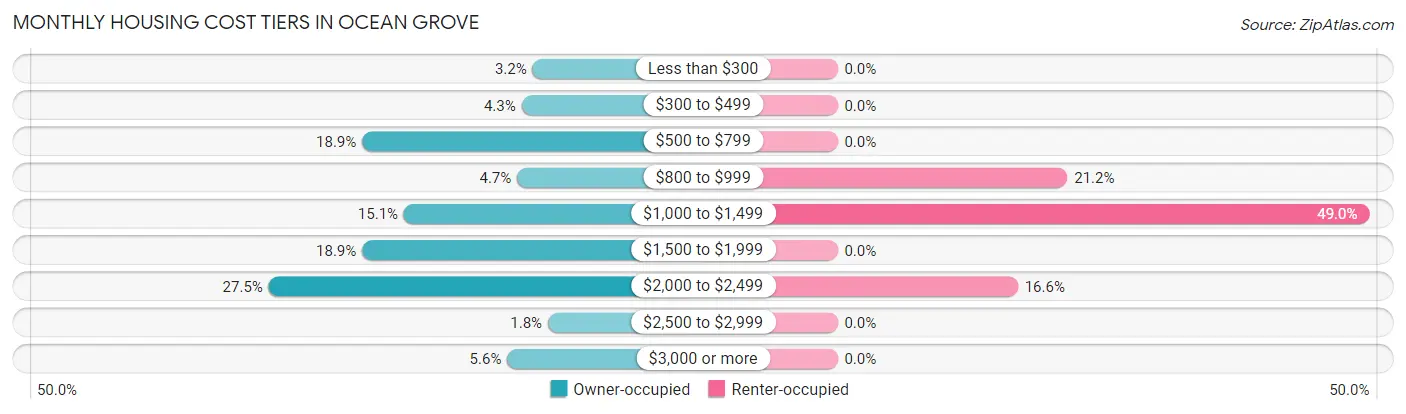
| Monthly Cost | Owner-occupied | Renter-occupied |
| Less than $300 | 32 (3.2%) | 0 (0.0%) |
| $300 to $499 | 42 (4.3%) | 0 (0.0%) |
| $500 to $799 | 187 (18.9%) | 0 (0.0%) |
| $800 to $999 | 46 (4.7%) | 51 (21.2%) |
| $1,000 to $1,499 | 149 (15.1%) | 118 (49.0%) |
| $1,500 to $1,999 | 187 (18.9%) | 0 (0.0%) |
| $2,000 to $2,499 | 272 (27.5%) | 40 (16.6%) |
| $2,500 to $2,999 | 18 (1.8%) | 0 (0.0%) |
| $3,000 or more | 55 (5.6%) | 0 (0.0%) |
| Total | 988 (100.0%) | 241 (100.0%) |
Physical Housing Characteristics in Ocean Grove
Housing Structures in Ocean Grove
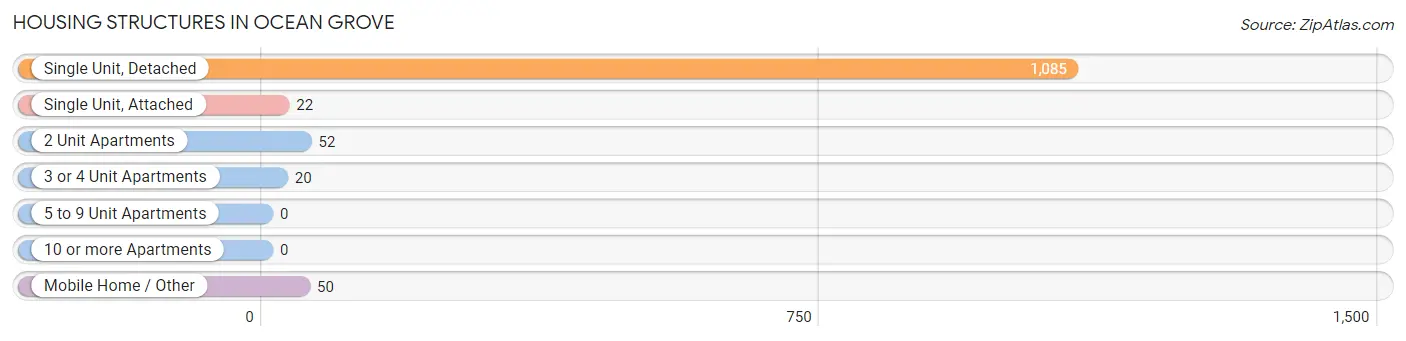
| Structure Type | # Housing Units | % Housing Units |
| Single Unit, Detached | 1,085 | 88.3% |
| Single Unit, Attached | 22 | 1.8% |
| 2 Unit Apartments | 52 | 4.2% |
| 3 or 4 Unit Apartments | 20 | 1.6% |
| 5 to 9 Unit Apartments | 0 | 0.0% |
| 10 or more Apartments | 0 | 0.0% |
| Mobile Home / Other | 50 | 4.1% |
| Total | 1,229 | 100.0% |
Housing Structures by Occupancy in Ocean Grove
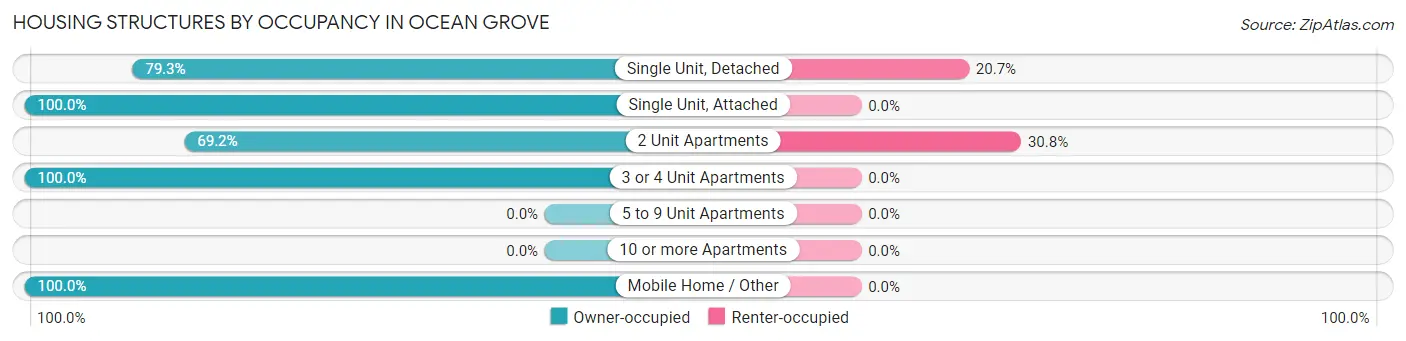
| Structure Type | Owner-occupied | Renter-occupied |
| Single Unit, Detached | 860 (79.3%) | 225 (20.7%) |
| Single Unit, Attached | 22 (100.0%) | 0 (0.0%) |
| 2 Unit Apartments | 36 (69.2%) | 16 (30.8%) |
| 3 or 4 Unit Apartments | 20 (100.0%) | 0 (0.0%) |
| 5 to 9 Unit Apartments | 0 (0.0%) | 0 (0.0%) |
| 10 or more Apartments | 0 (0.0%) | 0 (0.0%) |
| Mobile Home / Other | 50 (100.0%) | 0 (0.0%) |
| Total | 988 (80.4%) | 241 (19.6%) |
Housing Structures by Number of Rooms in Ocean Grove
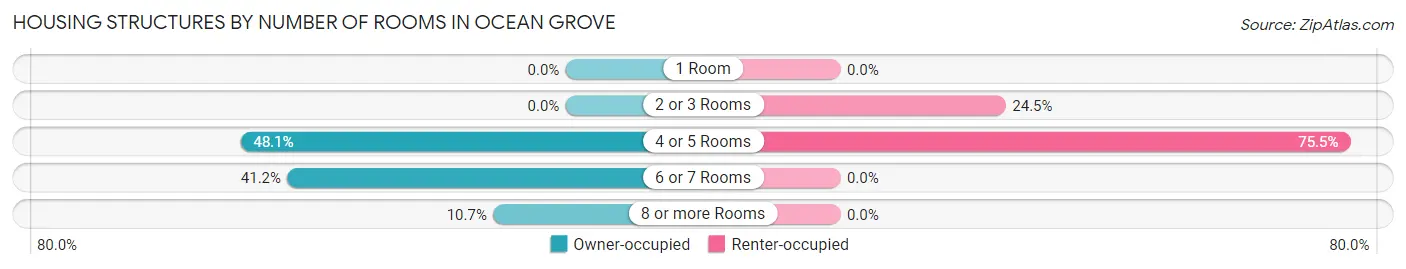
| Number of Rooms | Owner-occupied | Renter-occupied |
| 1 Room | 0 (0.0%) | 0 (0.0%) |
| 2 or 3 Rooms | 0 (0.0%) | 59 (24.5%) |
| 4 or 5 Rooms | 475 (48.1%) | 182 (75.5%) |
| 6 or 7 Rooms | 407 (41.2%) | 0 (0.0%) |
| 8 or more Rooms | 106 (10.7%) | 0 (0.0%) |
| Total | 988 (100.0%) | 241 (100.0%) |
Housing Structure by Heating Type in Ocean Grove
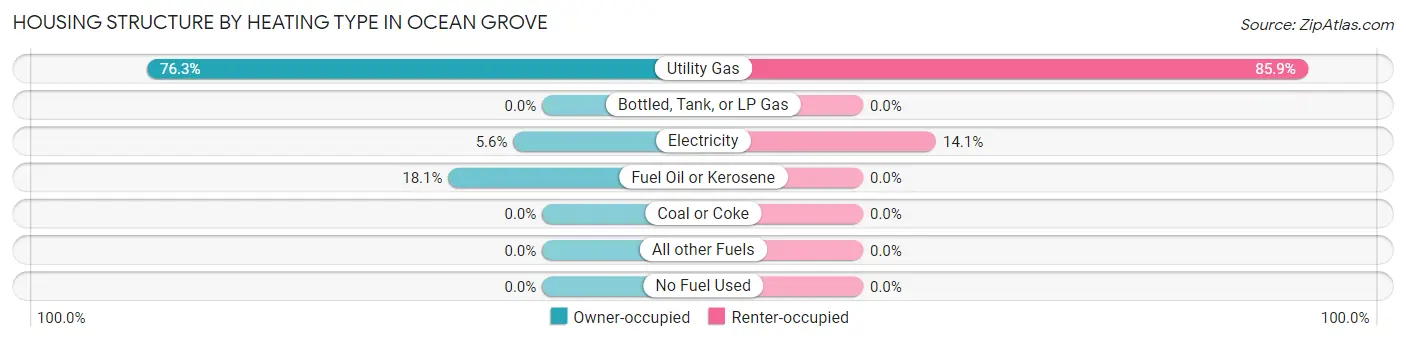
| Heating Type | Owner-occupied | Renter-occupied |
| Utility Gas | 754 (76.3%) | 207 (85.9%) |
| Bottled, Tank, or LP Gas | 0 (0.0%) | 0 (0.0%) |
| Electricity | 55 (5.6%) | 34 (14.1%) |
| Fuel Oil or Kerosene | 179 (18.1%) | 0 (0.0%) |
| Coal or Coke | 0 (0.0%) | 0 (0.0%) |
| All other Fuels | 0 (0.0%) | 0 (0.0%) |
| No Fuel Used | 0 (0.0%) | 0 (0.0%) |
| Total | 988 (100.0%) | 241 (100.0%) |
Household Vehicle Usage in Ocean Grove
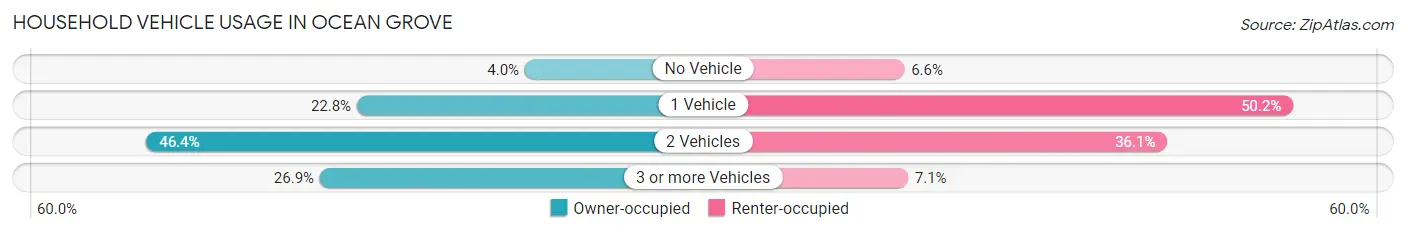
| Vehicles per Household | Owner-occupied | Renter-occupied |
| No Vehicle | 39 (4.0%) | 16 (6.6%) |
| 1 Vehicle | 225 (22.8%) | 121 (50.2%) |
| 2 Vehicles | 458 (46.4%) | 87 (36.1%) |
| 3 or more Vehicles | 266 (26.9%) | 17 (7.0%) |
| Total | 988 (100.0%) | 241 (100.0%) |
Real Estate & Mortgages in Ocean Grove
Real Estate and Mortgage Overview in Ocean Grove
| Characteristic | Without Mortgage | With Mortgage |
| Housing Units | 359 | 629 |
| Median Property Value | $294,200 | $297,700 |
| Median Household Income | $72,411 | $152 |
| Monthly Housing Costs | $639 | $55 |
| Real Estate Taxes | $3,444 | $0 |
Property Value by Mortgage Status in Ocean Grove
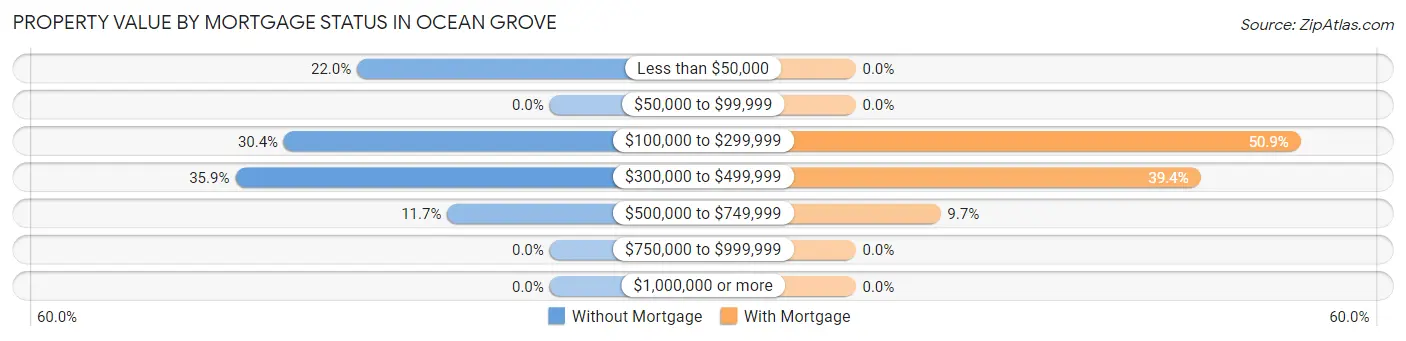
| Property Value | Without Mortgage | With Mortgage |
| Less than $50,000 | 79 (22.0%) | 0 (0.0%) |
| $50,000 to $99,999 | 0 (0.0%) | 0 (0.0%) |
| $100,000 to $299,999 | 109 (30.4%) | 320 (50.9%) |
| $300,000 to $499,999 | 129 (35.9%) | 248 (39.4%) |
| $500,000 to $749,999 | 42 (11.7%) | 61 (9.7%) |
| $750,000 to $999,999 | 0 (0.0%) | 0 (0.0%) |
| $1,000,000 or more | 0 (0.0%) | 0 (0.0%) |
| Total | 359 (100.0%) | 629 (100.0%) |
Household Income by Mortgage Status in Ocean Grove
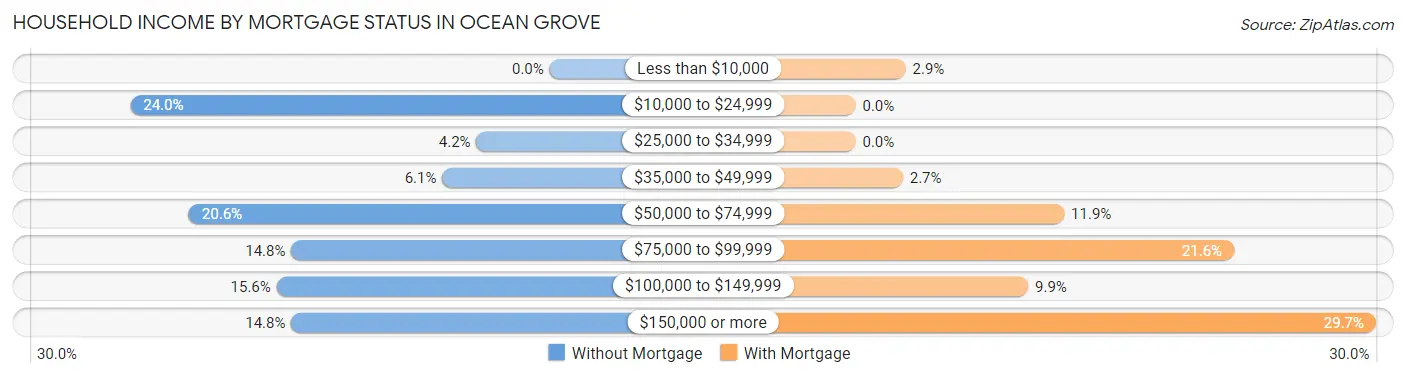
| Household Income | Without Mortgage | With Mortgage |
| Less than $10,000 | 0 (0.0%) | 18 (2.9%) |
| $10,000 to $24,999 | 86 (24.0%) | 0 (0.0%) |
| $25,000 to $34,999 | 15 (4.2%) | 0 (0.0%) |
| $35,000 to $49,999 | 22 (6.1%) | 17 (2.7%) |
| $50,000 to $74,999 | 74 (20.6%) | 75 (11.9%) |
| $75,000 to $99,999 | 53 (14.8%) | 136 (21.6%) |
| $100,000 to $149,999 | 56 (15.6%) | 62 (9.9%) |
| $150,000 or more | 53 (14.8%) | 187 (29.7%) |
| Total | 359 (100.0%) | 629 (100.0%) |
Property Value to Household Income Ratio in Ocean Grove
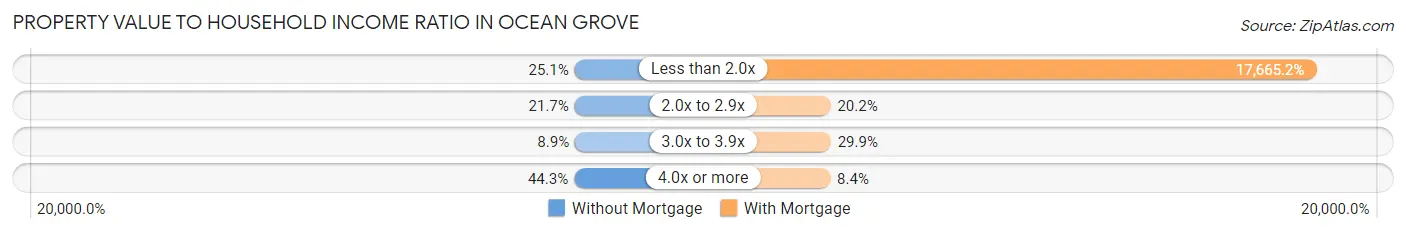
| Value-to-Income Ratio | Without Mortgage | With Mortgage |
| Less than 2.0x | 90 (25.1%) | 111,114 (17,665.2%) |
| 2.0x to 2.9x | 78 (21.7%) | 127 (20.2%) |
| 3.0x to 3.9x | 32 (8.9%) | 188 (29.9%) |
| 4.0x or more | 159 (44.3%) | 53 (8.4%) |
| Total | 359 (100.0%) | 629 (100.0%) |
Real Estate Taxes by Mortgage Status in Ocean Grove
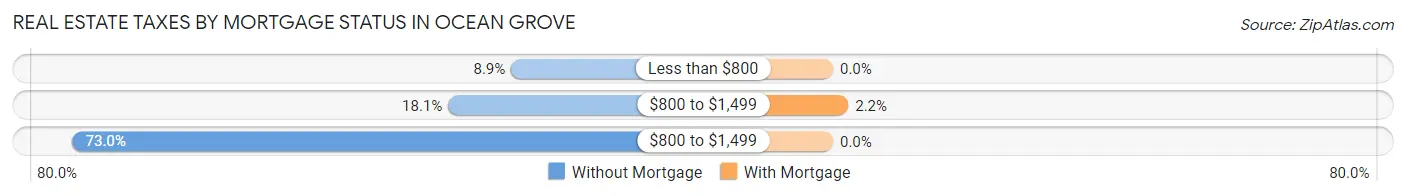
| Property Taxes | Without Mortgage | With Mortgage |
| Less than $800 | 32 (8.9%) | 0 (0.0%) |
| $800 to $1,499 | 65 (18.1%) | 14 (2.2%) |
| $800 to $1,499 | 262 (73.0%) | 0 (0.0%) |
| Total | 359 (100.0%) | 629 (100.0%) |
Health & Disability in Ocean Grove
Health Insurance Coverage by Age in Ocean Grove
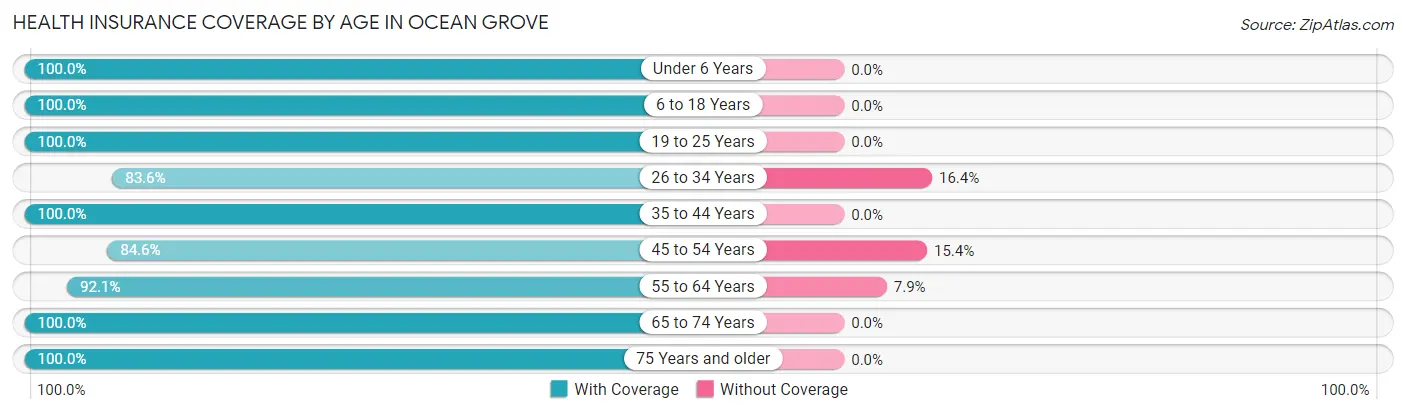
| Age Bracket | With Coverage | Without Coverage |
| Under 6 Years | 189 (100.0%) | 0 (0.0%) |
| 6 to 18 Years | 140 (100.0%) | 0 (0.0%) |
| 19 to 25 Years | 136 (100.0%) | 0 (0.0%) |
| 26 to 34 Years | 358 (83.6%) | 70 (16.4%) |
| 35 to 44 Years | 375 (100.0%) | 0 (0.0%) |
| 45 to 54 Years | 274 (84.6%) | 50 (15.4%) |
| 55 to 64 Years | 476 (92.1%) | 41 (7.9%) |
| 65 to 74 Years | 341 (100.0%) | 0 (0.0%) |
| 75 Years and older | 241 (100.0%) | 0 (0.0%) |
| Total | 2,530 (94.0%) | 161 (6.0%) |
Health Insurance Coverage by Citizenship Status in Ocean Grove
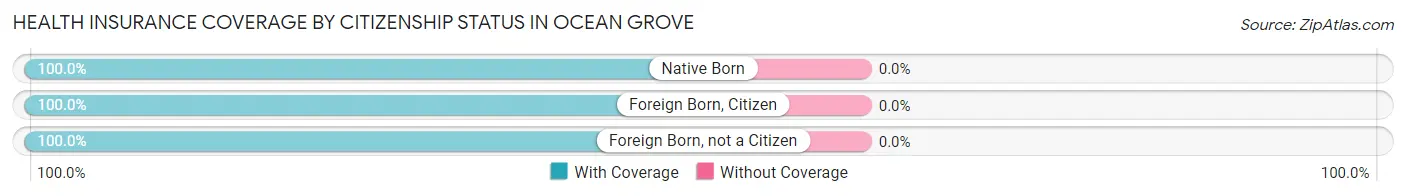
| Citizenship Status | With Coverage | Without Coverage |
| Native Born | 189 (100.0%) | 0 (0.0%) |
| Foreign Born, Citizen | 140 (100.0%) | 0 (0.0%) |
| Foreign Born, not a Citizen | 136 (100.0%) | 0 (0.0%) |
Health Insurance Coverage by Household Income in Ocean Grove
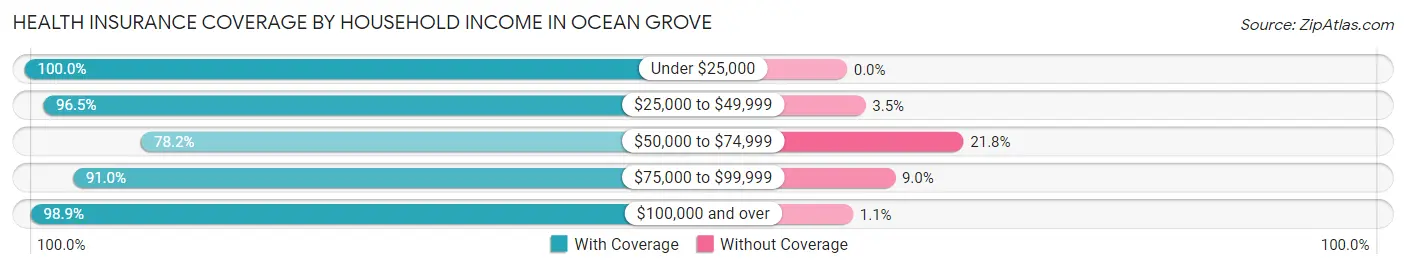
| Household Income | With Coverage | Without Coverage |
| Under $25,000 | 106 (100.0%) | 0 (0.0%) |
| $25,000 to $49,999 | 500 (96.5%) | 18 (3.5%) |
| $50,000 to $74,999 | 365 (78.2%) | 102 (21.8%) |
| $75,000 to $99,999 | 262 (91.0%) | 26 (9.0%) |
| $100,000 and over | 1,297 (98.9%) | 15 (1.1%) |
Public vs Private Health Insurance Coverage by Age in Ocean Grove
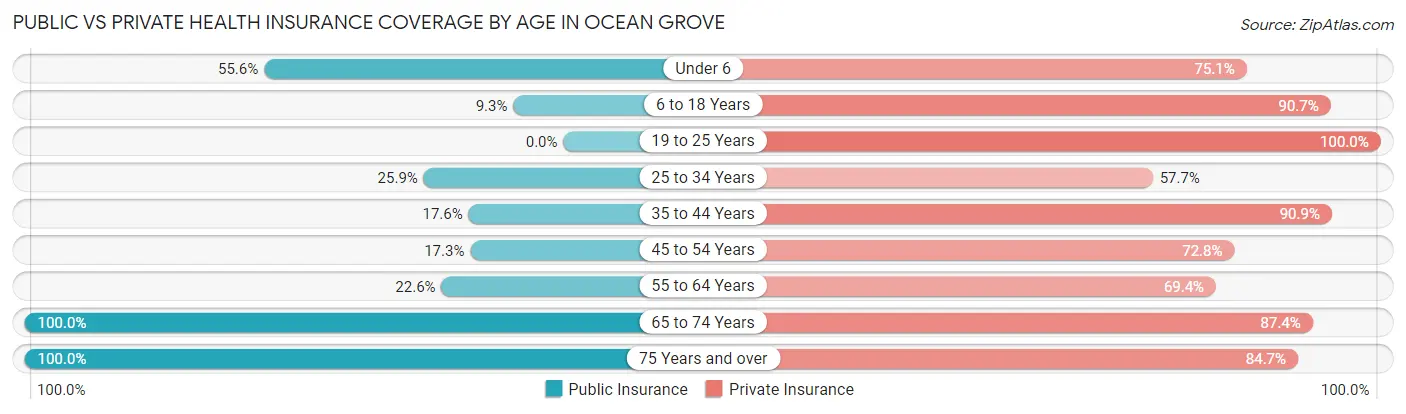
| Age Bracket | Public Insurance | Private Insurance |
| Under 6 | 105 (55.6%) | 142 (75.1%) |
| 6 to 18 Years | 13 (9.3%) | 127 (90.7%) |
| 19 to 25 Years | 0 (0.0%) | 136 (100.0%) |
| 25 to 34 Years | 111 (25.9%) | 247 (57.7%) |
| 35 to 44 Years | 66 (17.6%) | 341 (90.9%) |
| 45 to 54 Years | 56 (17.3%) | 236 (72.8%) |
| 55 to 64 Years | 117 (22.6%) | 359 (69.4%) |
| 65 to 74 Years | 341 (100.0%) | 298 (87.4%) |
| 75 Years and over | 241 (100.0%) | 204 (84.7%) |
| Total | 1,050 (39.0%) | 2,090 (77.7%) |
Disability Status by Sex by Age in Ocean Grove
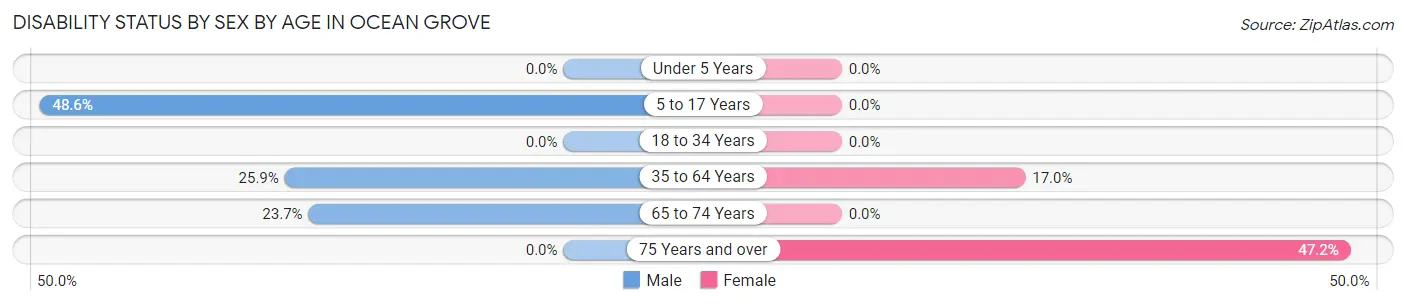
| Age Bracket | Male | Female |
| Under 5 Years | 0 (0.0%) | 0 (0.0%) |
| 5 to 17 Years | 35 (48.6%) | 0 (0.0%) |
| 18 to 34 Years | 0 (0.0%) | 0 (0.0%) |
| 35 to 64 Years | 149 (25.9%) | 109 (17.0%) |
| 65 to 74 Years | 31 (23.7%) | 0 (0.0%) |
| 75 Years and over | 0 (0.0%) | 93 (47.2%) |
Disability Class by Sex by Age in Ocean Grove
Disability Class: Hearing Difficulty
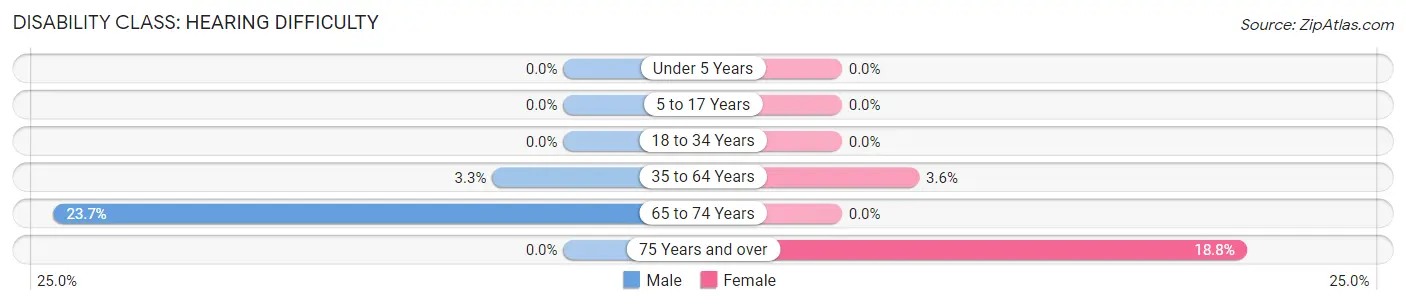
| Age Bracket | Male | Female |
| Under 5 Years | 0 (0.0%) | 0 (0.0%) |
| 5 to 17 Years | 0 (0.0%) | 0 (0.0%) |
| 18 to 34 Years | 0 (0.0%) | 0 (0.0%) |
| 35 to 64 Years | 19 (3.3%) | 23 (3.6%) |
| 65 to 74 Years | 31 (23.7%) | 0 (0.0%) |
| 75 Years and over | 0 (0.0%) | 37 (18.8%) |
Disability Class: Vision Difficulty
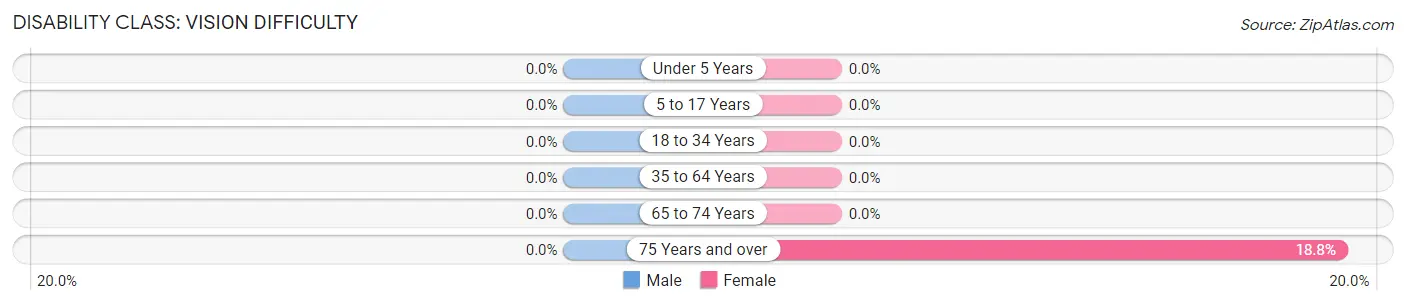
| Age Bracket | Male | Female |
| Under 5 Years | 0 (0.0%) | 0 (0.0%) |
| 5 to 17 Years | 0 (0.0%) | 0 (0.0%) |
| 18 to 34 Years | 0 (0.0%) | 0 (0.0%) |
| 35 to 64 Years | 0 (0.0%) | 0 (0.0%) |
| 65 to 74 Years | 0 (0.0%) | 0 (0.0%) |
| 75 Years and over | 0 (0.0%) | 37 (18.8%) |
Disability Class: Cognitive Difficulty
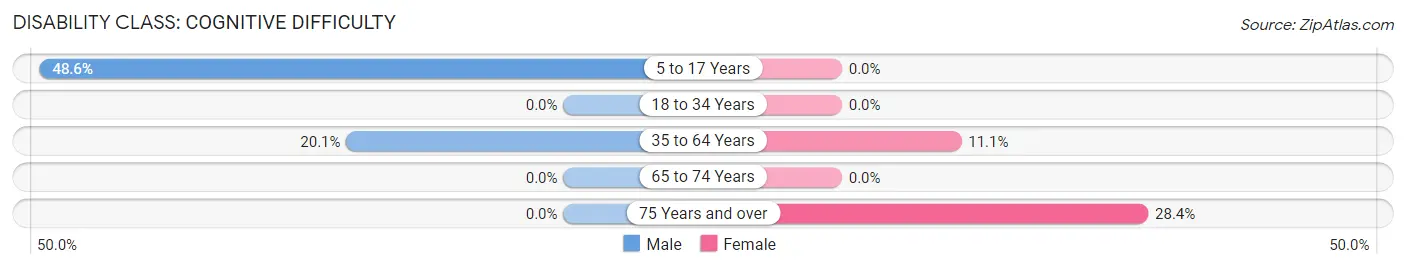
| Age Bracket | Male | Female |
| 5 to 17 Years | 35 (48.6%) | 0 (0.0%) |
| 18 to 34 Years | 0 (0.0%) | 0 (0.0%) |
| 35 to 64 Years | 116 (20.1%) | 71 (11.1%) |
| 65 to 74 Years | 0 (0.0%) | 0 (0.0%) |
| 75 Years and over | 0 (0.0%) | 56 (28.4%) |
Disability Class: Ambulatory Difficulty
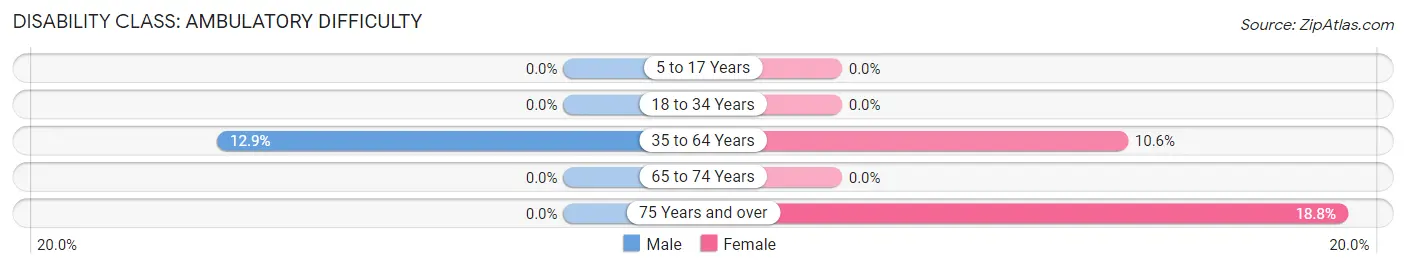
| Age Bracket | Male | Female |
| 5 to 17 Years | 0 (0.0%) | 0 (0.0%) |
| 18 to 34 Years | 0 (0.0%) | 0 (0.0%) |
| 35 to 64 Years | 74 (12.9%) | 68 (10.6%) |
| 65 to 74 Years | 0 (0.0%) | 0 (0.0%) |
| 75 Years and over | 0 (0.0%) | 37 (18.8%) |
Disability Class: Self-Care Difficulty
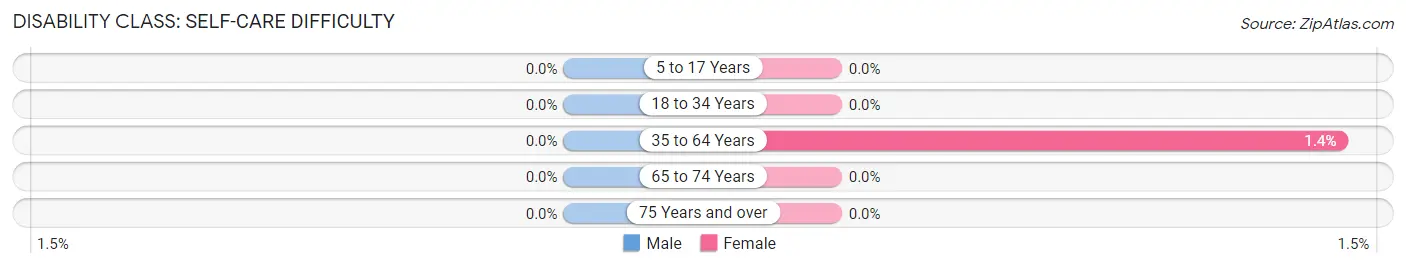
| Age Bracket | Male | Female |
| 5 to 17 Years | 0 (0.0%) | 0 (0.0%) |
| 18 to 34 Years | 0 (0.0%) | 0 (0.0%) |
| 35 to 64 Years | 0 (0.0%) | 9 (1.4%) |
| 65 to 74 Years | 0 (0.0%) | 0 (0.0%) |
| 75 Years and over | 0 (0.0%) | 0 (0.0%) |
Technology Access in Ocean Grove
Computing Device Access in Ocean Grove
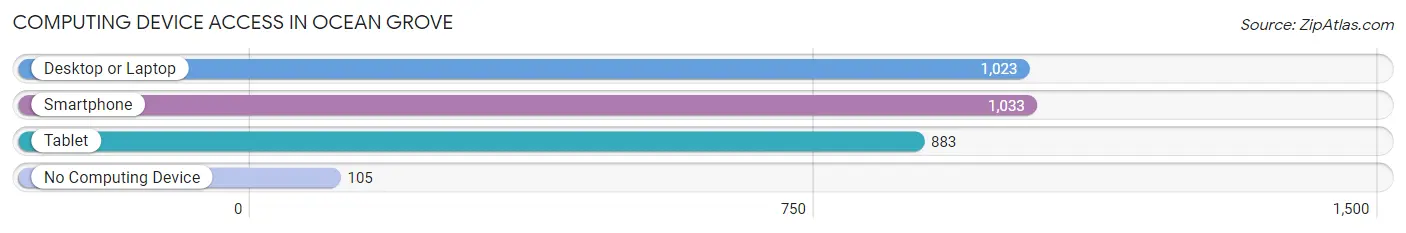
| Device Type | # Households | % Households |
| Desktop or Laptop | 1,023 | 83.2% |
| Smartphone | 1,033 | 84.1% |
| Tablet | 883 | 71.9% |
| No Computing Device | 105 | 8.5% |
| Total | 1,229 | 100.0% |
Internet Access in Ocean Grove
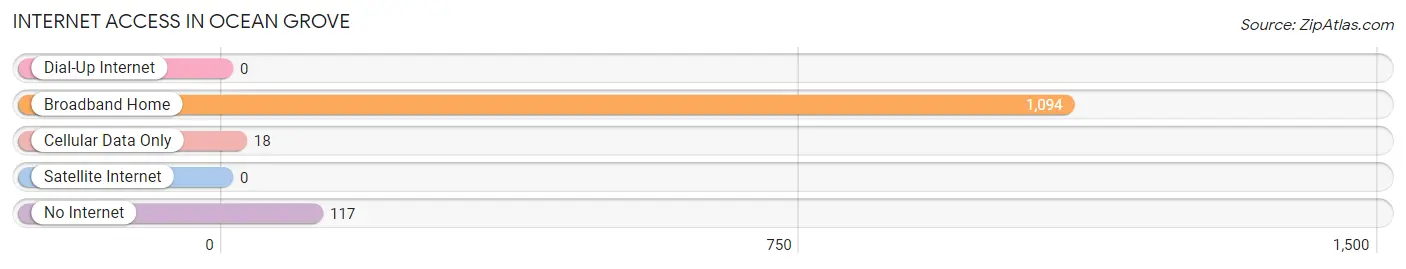
| Internet Type | # Households | % Households |
| Dial-Up Internet | 0 | 0.0% |
| Broadband Home | 1,094 | 89.0% |
| Cellular Data Only | 18 | 1.5% |
| Satellite Internet | 0 | 0.0% |
| No Internet | 117 | 9.5% |
| Total | 1,229 | 100.0% |
Ocean Grove Summary
Geography
Ocean Grove is a small coastal town located in Barnstable County, Massachusetts. It is situated on the south shore of Cape Cod, approximately 25 miles south of the city of Boston. The town is bordered by the towns of Sandwich to the north, Mashpee to the east, and Falmouth to the south. The town covers an area of approximately 4.5 square miles and is home to a population of just over 1,000 people.
The town is situated on a peninsula that juts out into the Atlantic Ocean. The town is surrounded by water on three sides, with the Atlantic Ocean to the east, Nantucket Sound to the south, and Cape Cod Bay to the west. The town is home to several beaches, including Ocean Grove Beach, which is located on the eastern side of the peninsula.
The town is mostly flat, with the highest point being just over 50 feet above sea level. The town is home to several ponds, including Long Pond, which is located in the center of the town. The town is also home to several creeks, including the Herring River, which flows through the town and empties into Nantucket Sound.
History
The area that is now Ocean Grove was originally inhabited by the Wampanoag people. The first European settlers arrived in the area in the 1620s, and the town was officially incorporated in 1639. The town was originally known as “The Grove”, and was renamed Ocean Grove in 1845.
The town was a popular summer destination for wealthy Bostonians in the late 19th and early 20th centuries. The town was home to several grand hotels, including the Ocean Grove Hotel, which was built in 1875 and was one of the largest hotels in the area.
The town was also home to several amusement parks, including the Ocean Grove Amusement Park, which opened in 1895 and was one of the first amusement parks in the United States. The park was home to several rides, including a roller coaster, a carousel, and a ferris wheel.
The town was also home to several movie theaters, including the Ocean Grove Theater, which opened in 1915 and was one of the first movie theaters in the area. The theater was home to several silent films, including the classic “The Great Train Robbery”.
Economy
The economy of Ocean Grove is largely based on tourism. The town is home to several hotels, restaurants, and shops, which cater to the large number of tourists that visit the town each year. The town is also home to several marinas, which provide services to boaters and fishermen.
The town is also home to several businesses, including a boatyard, a seafood processing plant, and a lobster hatchery. The town is also home to several art galleries, which showcase the work of local artists.
Demographics
As of the 2010 census, the population of Ocean Grove was 1,072. The population is predominantly white (94.3%), with small percentages of African American (2.2%), Asian (1.2%), and Hispanic (1.2%) residents. The median household income is $63,750, and the median home value is $521,000.
Conclusion
Ocean Grove is a small coastal town located in Barnstable County, Massachusetts. It is situated on the south shore of Cape Cod, approximately 25 miles south of the city of Boston. The town is bordered by the towns of Sandwich to the north, Mashpee to the east, and Falmouth to the south. The town covers an area of approximately 4.5 square miles and is home to a population of just over 1,000 people. The town is mostly flat, with the highest point being just over 50 feet above sea level. The town is home to several beaches, ponds, and creeks, and is a popular summer destination for tourists. The economy of Ocean Grove is largely based on tourism, and the population is predominantly white.
Common Questions
What is Per Capita Income in Ocean Grove?
Per Capita income in Ocean Grove is $43,417.
What is the Median Family Income in Ocean Grove?
Median Family Income in Ocean Grove is $110,386.
What is the Median Household income in Ocean Grove?
Median Household Income in Ocean Grove is $75,208.
What is Income or Wage Gap in Ocean Grove?
Income or Wage Gap in Ocean Grove is 46.1%.
Women in Ocean Grove earn 53.9 cents for every dollar earned by a man.
What is Inequality or Gini Index in Ocean Grove?
Inequality or Gini Index in Ocean Grove is 0.36.
What is the Total Population of Ocean Grove?
Total Population of Ocean Grove is 2,691.
What is the Total Male Population of Ocean Grove?
Total Male Population of Ocean Grove is 1,157.
What is the Total Female Population of Ocean Grove?
Total Female Population of Ocean Grove is 1,534.
What is the Ratio of Males per 100 Females in Ocean Grove?
There are 75.42 Males per 100 Females in Ocean Grove.
What is the Ratio of Females per 100 Males in Ocean Grove?
There are 132.58 Females per 100 Males in Ocean Grove.
What is the Median Population Age in Ocean Grove?
Median Population Age in Ocean Grove is 49.1 Years.
What is the Average Family Size in Ocean Grove
Average Family Size in Ocean Grove is 2.8 People.
What is the Average Household Size in Ocean Grove
Average Household Size in Ocean Grove is 2.2 People.
How Large is the Labor Force in Ocean Grove?
There are 1,411 People in the Labor Forcein in Ocean Grove.
What is the Percentage of People in the Labor Force in Ocean Grove?
59.2% of People are in the Labor Force in Ocean Grove.
What is the Unemployment Rate in Ocean Grove?
Unemployment Rate in Ocean Grove is 7.4%.