East Pepperell, MA Map & Demographics
East Pepperell Map
East Pepperell Overview
$45,357
PER CAPITA INCOME
$126,627
AVG FAMILY INCOME
$109,265
AVG HOUSEHOLD INCOME
44.6%
WAGE / INCOME GAP [ % ]
55.4¢/ $1
WAGE / INCOME GAP [ $ ]
0.37
INEQUALITY / GINI INDEX
1,999
TOTAL POPULATION
903
MALE POPULATION
1,096
FEMALE POPULATION
82.39
MALES / 100 FEMALES
121.37
FEMALES / 100 MALES
41.4
MEDIAN AGE
3.1
AVG FAMILY SIZE
2.5
AVG HOUSEHOLD SIZE
1,127
LABOR FORCE [ PEOPLE ]
66.7%
PERCENT IN LABOR FORCE
4.5%
UNEMPLOYMENT RATE
Income in East Pepperell
Income Overview in East Pepperell
Per Capita Income in East Pepperell is $45,357, while median incomes of families and households are $126,627 and $109,265 respectively.
| Characteristic | Number | Measure |
| Per Capita Income | 1,999 | $45,357 |
| Median Family Income | 527 | $126,627 |
| Mean Family Income | 527 | $132,255 |
| Median Household Income | 794 | $109,265 |
| Mean Household Income | 794 | $113,919 |
| Income Deficit | 527 | $0 |
| Wage / Income Gap (%) | 1,999 | 44.57% |
| Wage / Income Gap ($) | 1,999 | 55.43¢ per $1 |
| Gini / Inequality Index | 1,999 | 0.37 |
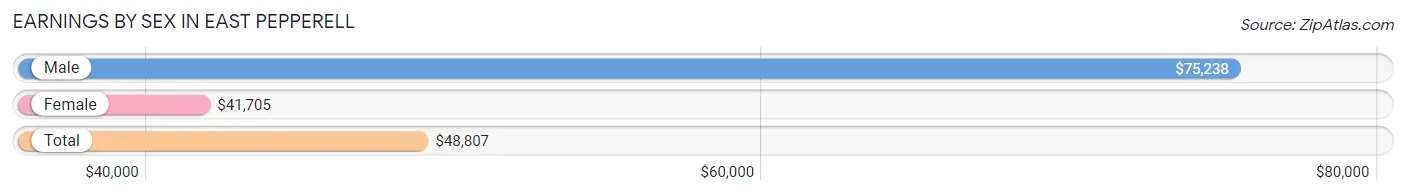
Earnings by Sex in East Pepperell
Average Earnings in East Pepperell are $48,807, $75,238 for men and $41,705 for women, a difference of 44.6%.
| Sex | Number | Average Earnings |
| Male | 582 (46.6%) | $75,238 |
| Female | 667 (53.4%) | $41,705 |
| Total | 1,249 (100.0%) | $48,807 |
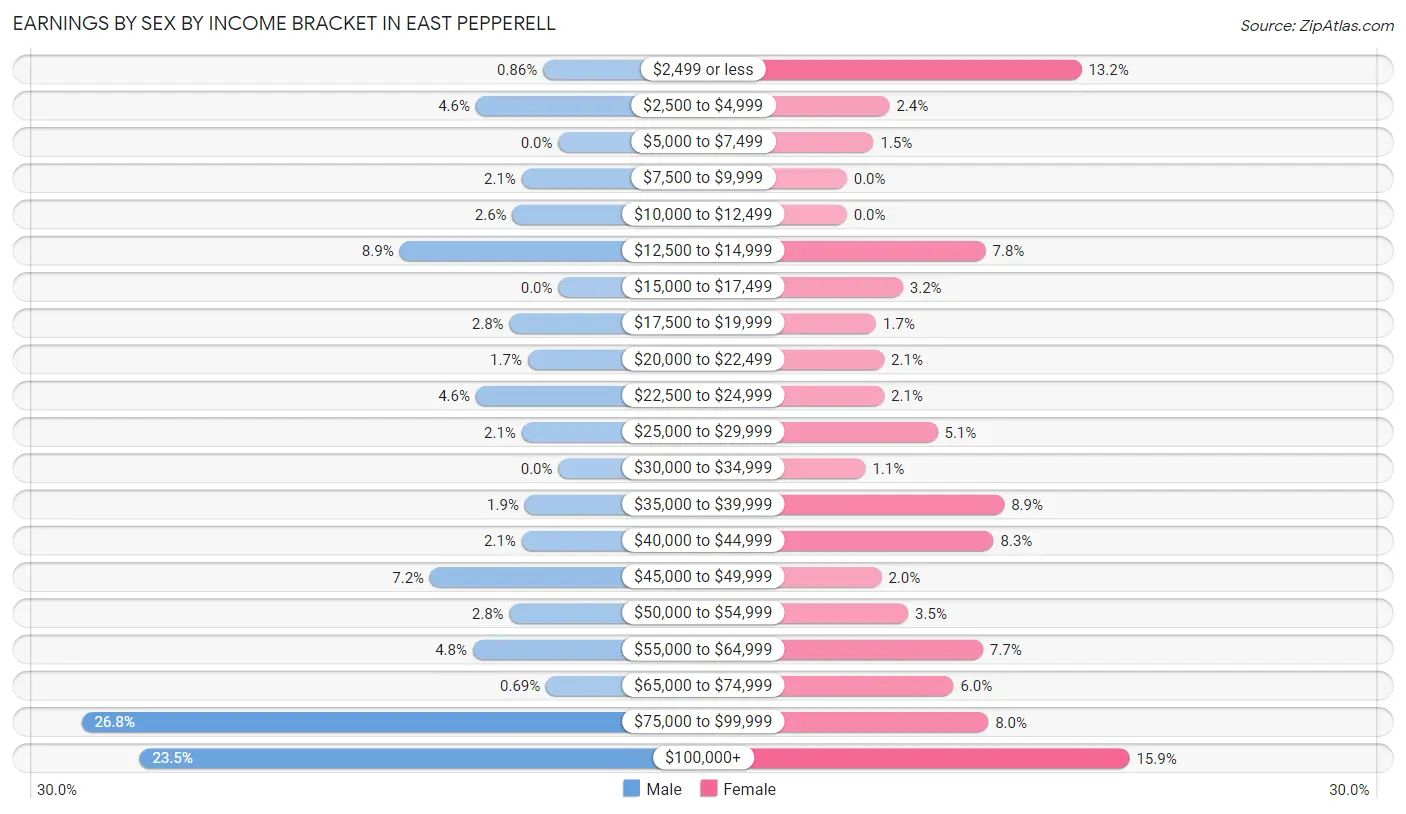
Earnings by Sex by Income Bracket in East Pepperell
The most common earnings brackets in East Pepperell are $75,000 to $99,999 for men (156 | 26.8%) and $100,000+ for women (106 | 15.9%).
| Income | Male | Female |
| $2,499 or less | 5 (0.9%) | 88 (13.2%) |
| $2,500 to $4,999 | 27 (4.6%) | 16 (2.4%) |
| $5,000 to $7,499 | 0 (0.0%) | 10 (1.5%) |
| $7,500 to $9,999 | 12 (2.1%) | 0 (0.0%) |
| $10,000 to $12,499 | 15 (2.6%) | 0 (0.0%) |
| $12,500 to $14,999 | 52 (8.9%) | 52 (7.8%) |
| $15,000 to $17,499 | 0 (0.0%) | 21 (3.2%) |
| $17,500 to $19,999 | 16 (2.8%) | 11 (1.7%) |
| $20,000 to $22,499 | 10 (1.7%) | 14 (2.1%) |
| $22,500 to $24,999 | 27 (4.6%) | 14 (2.1%) |
| $25,000 to $29,999 | 12 (2.1%) | 34 (5.1%) |
| $30,000 to $34,999 | 0 (0.0%) | 7 (1.1%) |
| $35,000 to $39,999 | 11 (1.9%) | 59 (8.8%) |
| $40,000 to $44,999 | 12 (2.1%) | 55 (8.3%) |
| $45,000 to $49,999 | 42 (7.2%) | 13 (1.9%) |
| $50,000 to $54,999 | 16 (2.8%) | 23 (3.5%) |
| $55,000 to $64,999 | 28 (4.8%) | 51 (7.6%) |
| $65,000 to $74,999 | 4 (0.7%) | 40 (6.0%) |
| $75,000 to $99,999 | 156 (26.8%) | 53 (8.0%) |
| $100,000+ | 137 (23.5%) | 106 (15.9%) |
| Total | 582 (100.0%) | 667 (100.0%) |
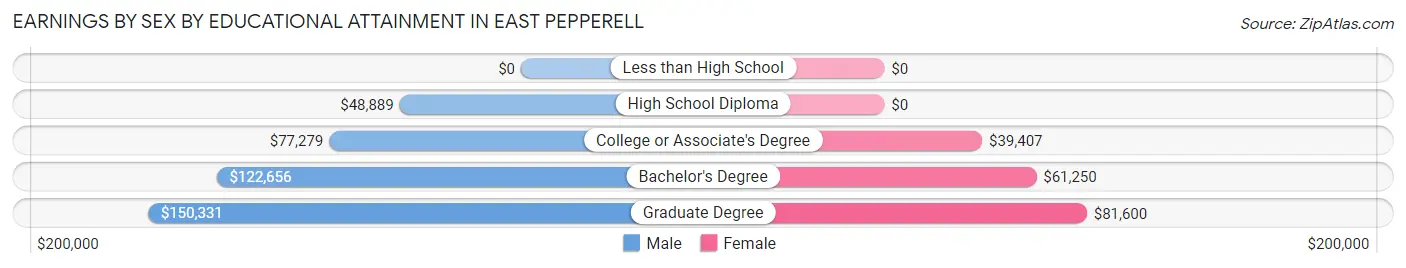
Earnings by Sex by Educational Attainment in East Pepperell
Average earnings in East Pepperell are $79,141 for men and $48,558 for women, a difference of 38.6%. Men with an educational attainment of graduate degree enjoy the highest average annual earnings of $150,331, while those with high school diploma education earn the least with $48,889. Women with an educational attainment of graduate degree earn the most with the average annual earnings of $81,600, while those with college or associate's degree education have the smallest earnings of $39,407.
| Educational Attainment | Male Income | Female Income |
| Less than High School | - | - |
| High School Diploma | $48,889 | $0 |
| College or Associate's Degree | $77,279 | $39,407 |
| Bachelor's Degree | $122,656 | $61,250 |
| Graduate Degree | $150,331 | $81,600 |
| Total | $79,141 | $48,558 |
Family Income in East Pepperell
Family Income Brackets in East Pepperell
According to the East Pepperell family income data, there are 161 families falling into the $100,000 to $149,999 income range, which is the most common income bracket and makes up 30.5% of all families.
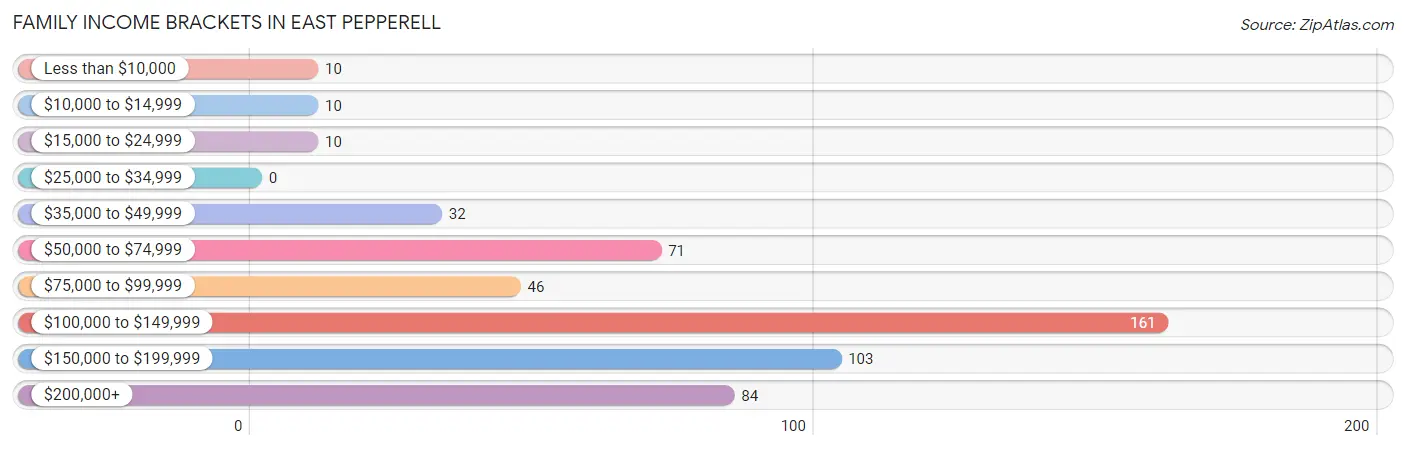
| Income Bracket | # Families | % Families |
| Less than $10,000 | 10 | 1.9% |
| $10,000 to $14,999 | 10 | 1.9% |
| $15,000 to $24,999 | 10 | 1.9% |
| $25,000 to $34,999 | 0 | 0.0% |
| $35,000 to $49,999 | 32 | 6.1% |
| $50,000 to $74,999 | 71 | 13.5% |
| $75,000 to $99,999 | 46 | 8.7% |
| $100,000 to $149,999 | 161 | 30.6% |
| $150,000 to $199,999 | 103 | 19.5% |
| $200,000+ | 84 | 15.9% |
Family Income by Famaliy Size in East Pepperell
4-person families (126 | 23.9%) account for the highest median family income in East Pepperell with $158,438 per family, while 2-person families (227 | 43.1%) have the highest median income of $62,771 per family member.
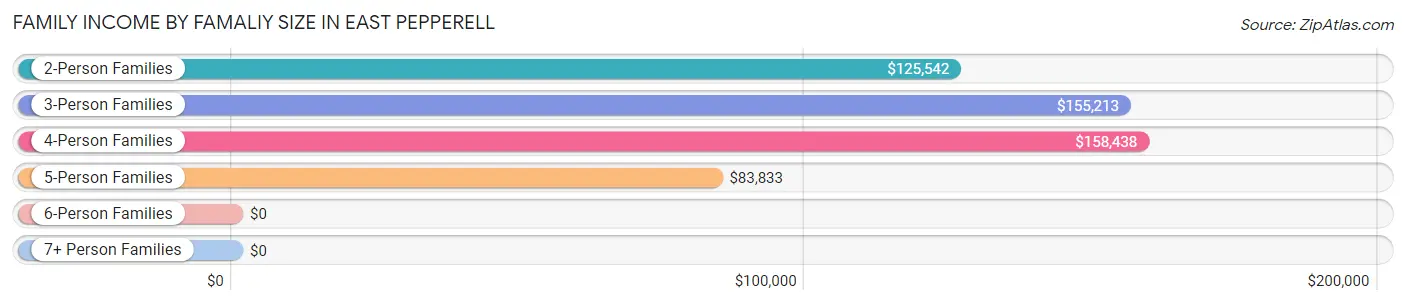
| Income Bracket | # Families | Median Income |
| 2-Person Families | 227 (43.1%) | $125,542 |
| 3-Person Families | 109 (20.7%) | $155,213 |
| 4-Person Families | 126 (23.9%) | $158,438 |
| 5-Person Families | 58 (11.0%) | $83,833 |
| 6-Person Families | 7 (1.3%) | $0 |
| 7+ Person Families | 0 (0.0%) | $0 |
| Total | 527 (100.0%) | $126,627 |
Family Income by Number of Earners in East Pepperell
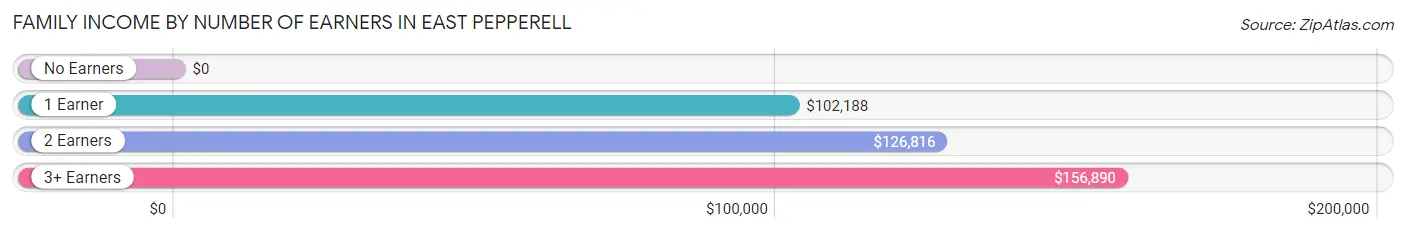
| Number of Earners | # Families | Median Income |
| No Earners | 50 (9.5%) | $0 |
| 1 Earner | 94 (17.8%) | $102,188 |
| 2 Earners | 257 (48.8%) | $126,816 |
| 3+ Earners | 126 (23.9%) | $156,890 |
| Total | 527 (100.0%) | $126,627 |
Household Income in East Pepperell
Household Income Brackets in East Pepperell
With 187 households falling in the category, the $100,000 to $149,999 income range is the most frequent in East Pepperell, accounting for 23.5% of all households.
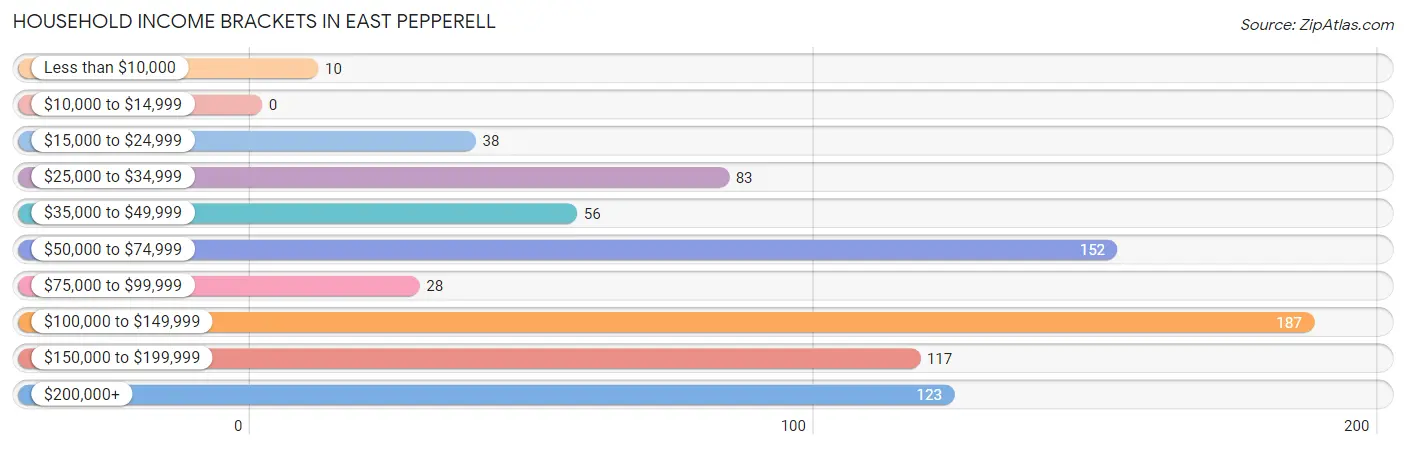
| Income Bracket | # Households | % Households |
| Less than $10,000 | 10 | 1.3% |
| $10,000 to $14,999 | 0 | 0.0% |
| $15,000 to $24,999 | 38 | 4.8% |
| $25,000 to $34,999 | 83 | 10.5% |
| $35,000 to $49,999 | 56 | 7.1% |
| $50,000 to $74,999 | 152 | 19.1% |
| $75,000 to $99,999 | 28 | 3.5% |
| $100,000 to $149,999 | 187 | 23.6% |
| $150,000 to $199,999 | 117 | 14.7% |
| $200,000+ | 123 | 15.5% |
Household Income by Householder Age in East Pepperell
The median household income in East Pepperell is $109,265, with the highest median household income of $136,042 found in the 45 to 64 years age bracket for the primary householder. A total of 313 households (39.4%) fall into this category. Meanwhile, the 15 to 24 years age bracket for the primary householder has the lowest median household income of $0, with 10 households (1.3%) in this group.
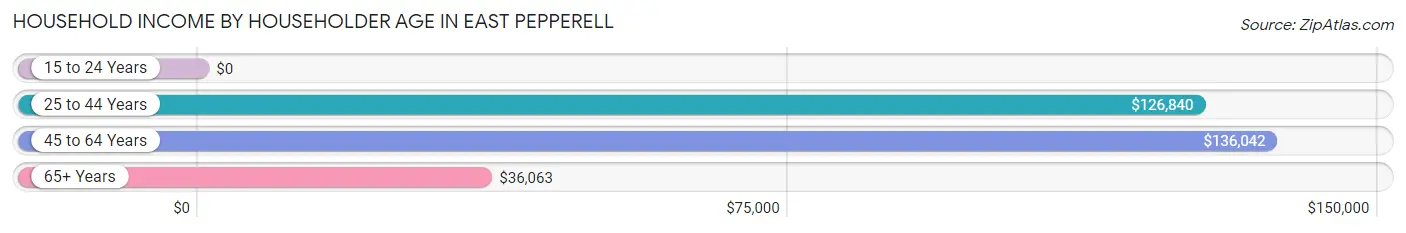
| Income Bracket | # Households | Median Income |
| 15 to 24 Years | 10 (1.3%) | $0 |
| 25 to 44 Years | 232 (29.2%) | $126,840 |
| 45 to 64 Years | 313 (39.4%) | $136,042 |
| 65+ Years | 239 (30.1%) | $36,063 |
| Total | 794 (100.0%) | $109,265 |
Poverty in East Pepperell
Income Below Poverty by Sex and Age in East Pepperell
With 2.7% poverty level for males and 1.8% for females among the residents of East Pepperell, 75 year old and over males and 18 to 24 year old females are the most vulnerable to poverty, with 9 males (14.1%) and 10 females (9.3%) in their respective age groups living below the poverty level.
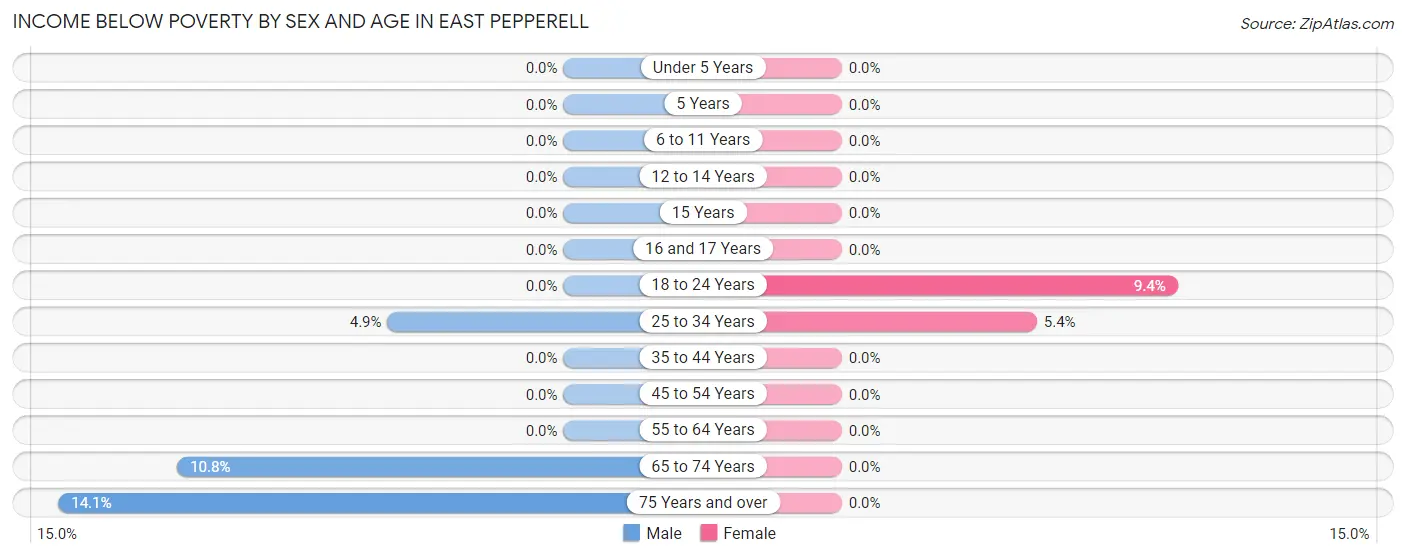
| Age Bracket | Male | Female |
| Under 5 Years | 0 (0.0%) | 0 (0.0%) |
| 5 Years | 0 (0.0%) | 0 (0.0%) |
| 6 to 11 Years | 0 (0.0%) | 0 (0.0%) |
| 12 to 14 Years | 0 (0.0%) | 0 (0.0%) |
| 15 Years | 0 (0.0%) | 0 (0.0%) |
| 16 and 17 Years | 0 (0.0%) | 0 (0.0%) |
| 18 to 24 Years | 0 (0.0%) | 10 (9.3%) |
| 25 to 34 Years | 5 (4.9%) | 10 (5.4%) |
| 35 to 44 Years | 0 (0.0%) | 0 (0.0%) |
| 45 to 54 Years | 0 (0.0%) | 0 (0.0%) |
| 55 to 64 Years | 0 (0.0%) | 0 (0.0%) |
| 65 to 74 Years | 10 (10.7%) | 0 (0.0%) |
| 75 Years and over | 9 (14.1%) | 0 (0.0%) |
| Total | 24 (2.7%) | 20 (1.8%) |
Income Above Poverty by Sex and Age in East Pepperell
According to the poverty statistics in East Pepperell, males aged under 5 years and females aged under 5 years are the age groups that are most secure financially, with 100.0% of males and 100.0% of females in these age groups living above the poverty line.
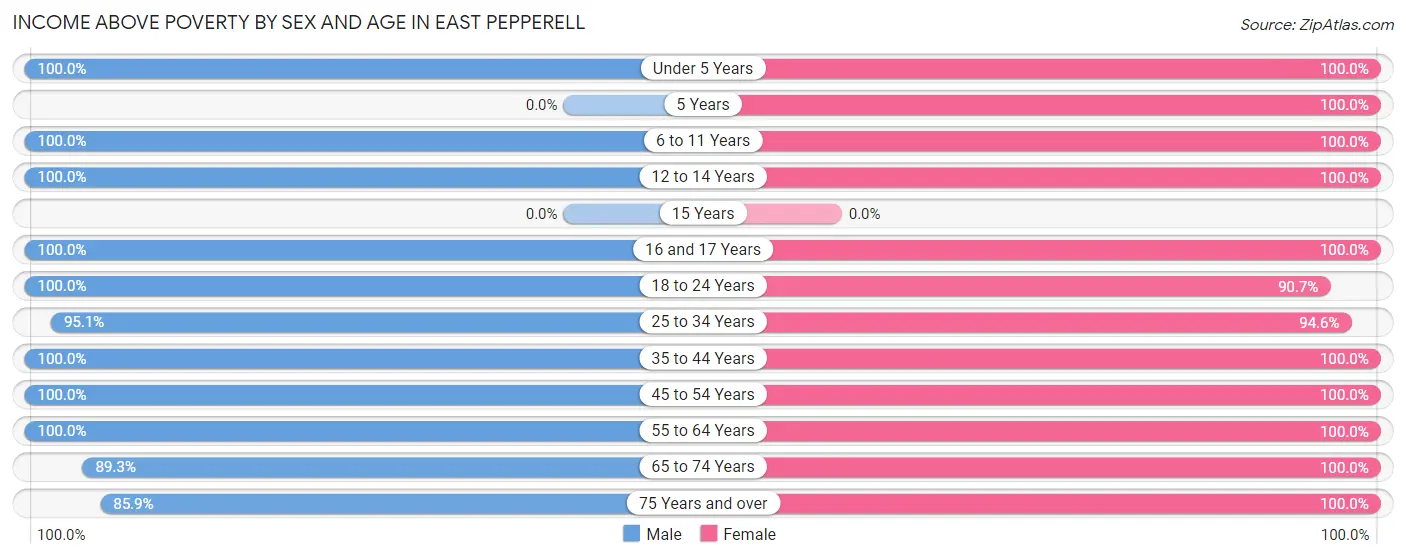
| Age Bracket | Male | Female |
| Under 5 Years | 86 (100.0%) | 21 (100.0%) |
| 5 Years | 0 (0.0%) | 17 (100.0%) |
| 6 to 11 Years | 55 (100.0%) | 71 (100.0%) |
| 12 to 14 Years | 21 (100.0%) | 39 (100.0%) |
| 15 Years | 0 (0.0%) | 0 (0.0%) |
| 16 and 17 Years | 27 (100.0%) | 20 (100.0%) |
| 18 to 24 Years | 54 (100.0%) | 97 (90.6%) |
| 25 to 34 Years | 97 (95.1%) | 174 (94.6%) |
| 35 to 44 Years | 158 (100.0%) | 135 (100.0%) |
| 45 to 54 Years | 75 (100.0%) | 151 (100.0%) |
| 55 to 64 Years | 168 (100.0%) | 164 (100.0%) |
| 65 to 74 Years | 83 (89.2%) | 155 (100.0%) |
| 75 Years and over | 55 (85.9%) | 32 (100.0%) |
| Total | 879 (97.3%) | 1,076 (98.2%) |
Income Below Poverty Among Married-Couple Families in East Pepperell
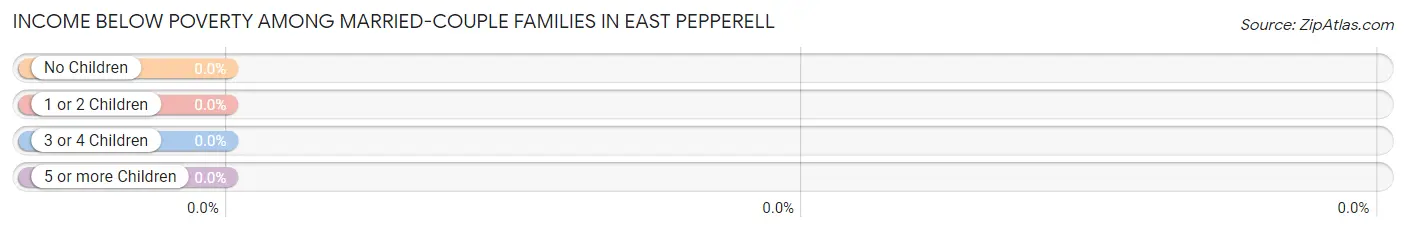
| Children | Above Poverty | Below Poverty |
| No Children | 236 (100.0%) | 0 (0.0%) |
| 1 or 2 Children | 138 (100.0%) | 0 (0.0%) |
| 3 or 4 Children | 24 (100.0%) | 0 (0.0%) |
| 5 or more Children | 0 (0.0%) | 0 (0.0%) |
| Total | 398 (100.0%) | 0 (0.0%) |
Income Below Poverty Among Single-Parent Households in East Pepperell
According to the poverty data in East Pepperell, 32.3% or 10 single-father households and 10.2% or 10 single-mother households are living below the poverty line. Among single-father households, those with no children have the highest poverty rate, with 10 households (50.0%) experiencing poverty. Likewise, among single-mother households, those with no children have the highest poverty rate, with 10 households (19.6%) falling below the poverty line.
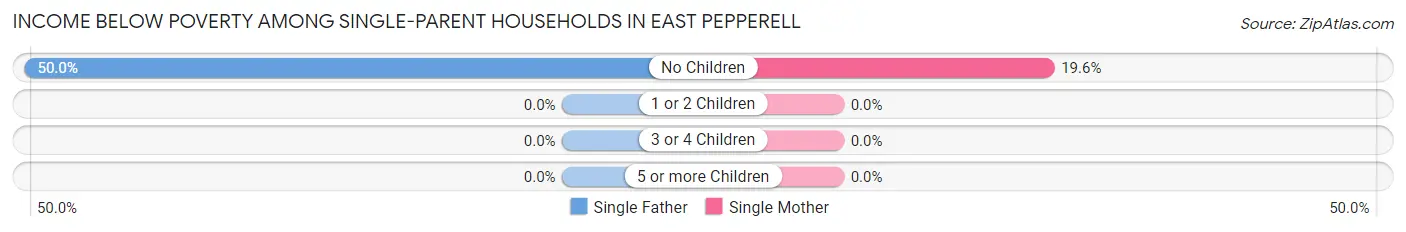
| Children | Single Father | Single Mother |
| No Children | 10 (50.0%) | 10 (19.6%) |
| 1 or 2 Children | 0 (0.0%) | 0 (0.0%) |
| 3 or 4 Children | 0 (0.0%) | 0 (0.0%) |
| 5 or more Children | 0 (0.0%) | 0 (0.0%) |
| Total | 10 (32.3%) | 10 (10.2%) |
Income Below Poverty Among Married-Couple vs Single-Parent Households in East Pepperell
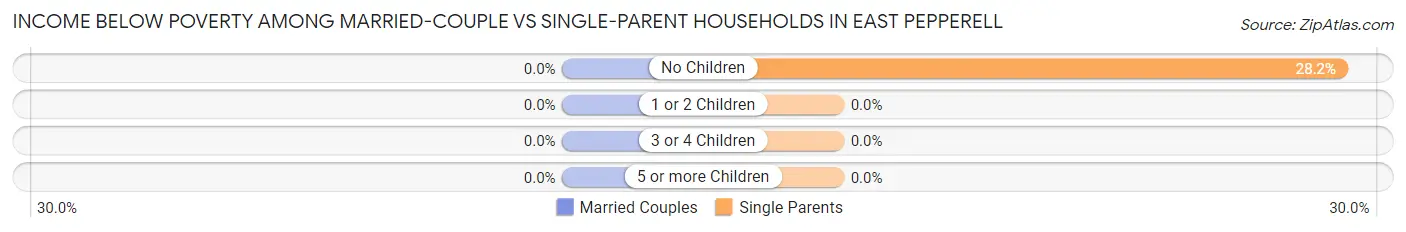
| Children | Married-Couple Families | Single-Parent Households |
| No Children | 0 (0.0%) | 20 (28.2%) |
| 1 or 2 Children | 0 (0.0%) | 0 (0.0%) |
| 3 or 4 Children | 0 (0.0%) | 0 (0.0%) |
| 5 or more Children | 0 (0.0%) | 0 (0.0%) |
| Total | 0 (0.0%) | 20 (15.5%) |
Race in East Pepperell
The most populous races in East Pepperell are White / Caucasian (1,856 | 92.8%), Asian (69 | 3.5%), and Hispanic or Latino (51 | 2.5%).
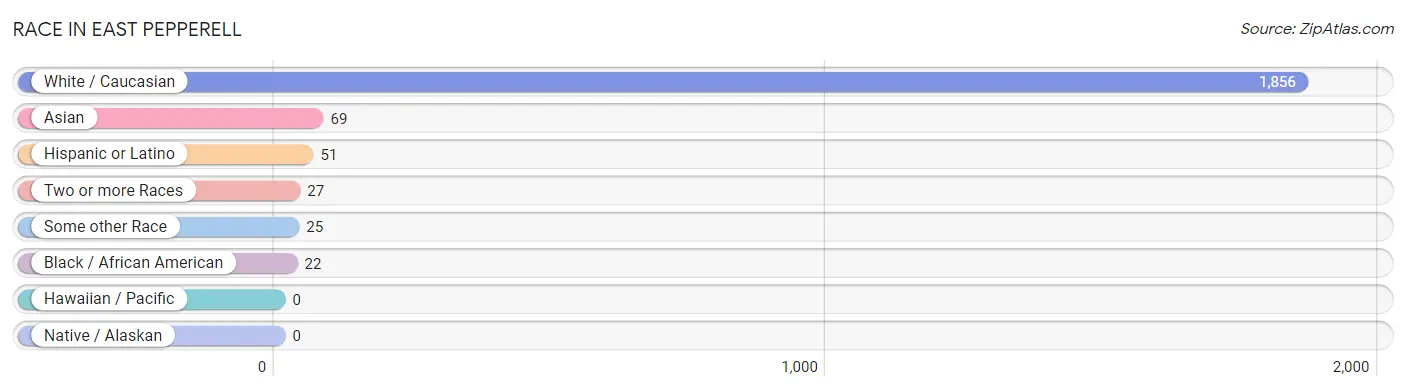
| Race | # Population | % Population |
| Asian | 69 | 3.5% |
| Black / African American | 22 | 1.1% |
| Hawaiian / Pacific | 0 | 0.0% |
| Hispanic or Latino | 51 | 2.5% |
| Native / Alaskan | 0 | 0.0% |
| White / Caucasian | 1,856 | 92.8% |
| Two or more Races | 27 | 1.3% |
| Some other Race | 25 | 1.3% |
| Total | 1,999 | 100.0% |
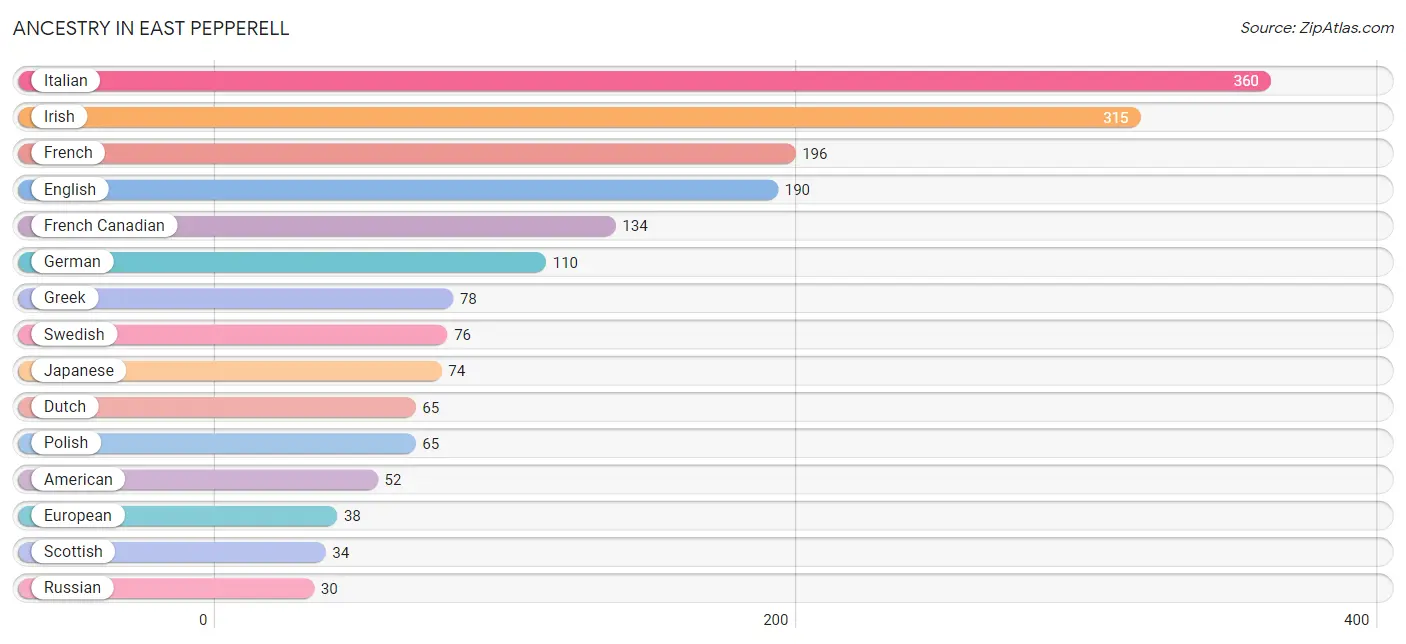
Ancestry in East Pepperell
The most populous ancestries reported in East Pepperell are Italian (360 | 18.0%), Irish (315 | 15.8%), French (196 | 9.8%), English (190 | 9.5%), and French Canadian (134 | 6.7%), together accounting for 59.8% of all East Pepperell residents.
| Ancestry | # Population | % Population |
| American | 52 | 2.6% |
| Armenian | 11 | 0.5% |
| Austrian | 10 | 0.5% |
| Bolivian | 25 | 1.3% |
| Canadian | 10 | 0.5% |
| Dutch | 65 | 3.3% |
| English | 190 | 9.5% |
| European | 38 | 1.9% |
| French | 196 | 9.8% |
| French Canadian | 134 | 6.7% |
| German | 110 | 5.5% |
| Greek | 78 | 3.9% |
| Irish | 315 | 15.8% |
| Italian | 360 | 18.0% |
| Japanese | 74 | 3.7% |
| Lithuanian | 10 | 0.5% |
| Mexican | 26 | 1.3% |
| Norwegian | 17 | 0.9% |
| Polish | 65 | 3.3% |
| Portuguese | 8 | 0.4% |
| Russian | 30 | 1.5% |
| Scotch-Irish | 21 | 1.1% |
| Scottish | 34 | 1.7% |
| South American | 25 | 1.3% |
| Swedish | 76 | 3.8% |
| U.S. Virgin Islander | 22 | 1.1% |
| Welsh | 21 | 1.1% | View All 27 Rows |
Immigrants in East Pepperell
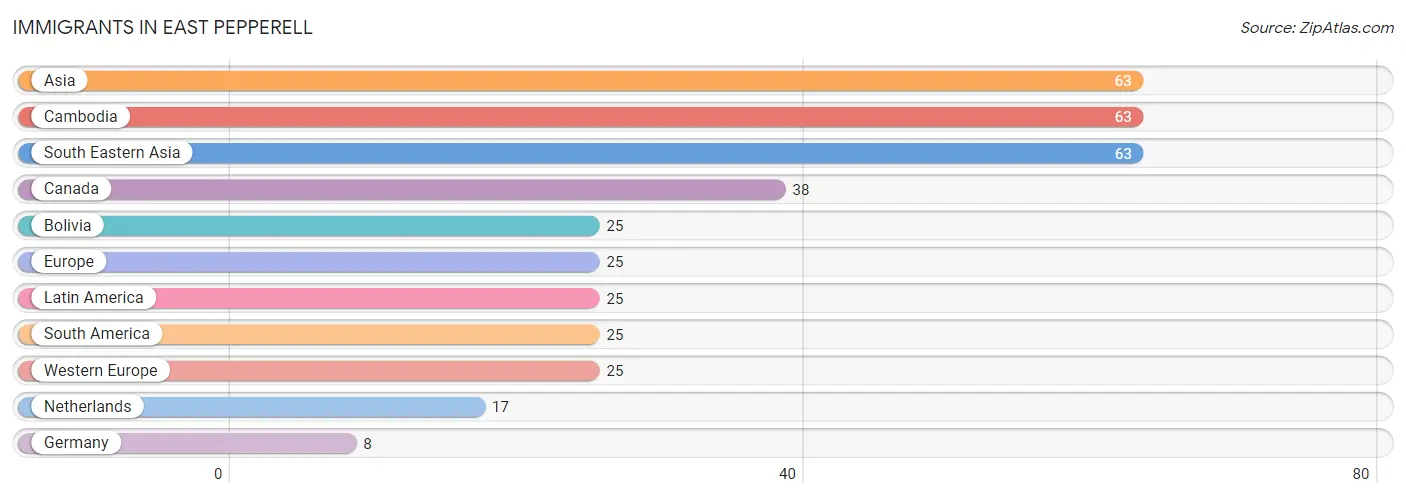
The most numerous immigrant groups reported in East Pepperell came from Asia (63 | 3.2%), Cambodia (63 | 3.2%), South Eastern Asia (63 | 3.2%), Canada (38 | 1.9%), and Bolivia (25 | 1.3%), together accounting for 12.6% of all East Pepperell residents.
| Immigration Origin | # Population | % Population |
| Asia | 63 | 3.2% |
| Bolivia | 25 | 1.3% |
| Cambodia | 63 | 3.2% |
| Canada | 38 | 1.9% |
| Europe | 25 | 1.3% |
| Germany | 8 | 0.4% |
| Latin America | 25 | 1.3% |
| Netherlands | 17 | 0.9% |
| South America | 25 | 1.3% |
| South Eastern Asia | 63 | 3.2% |
| Western Europe | 25 | 1.3% | View All 11 Rows |
Sex and Age in East Pepperell
Sex and Age in East Pepperell
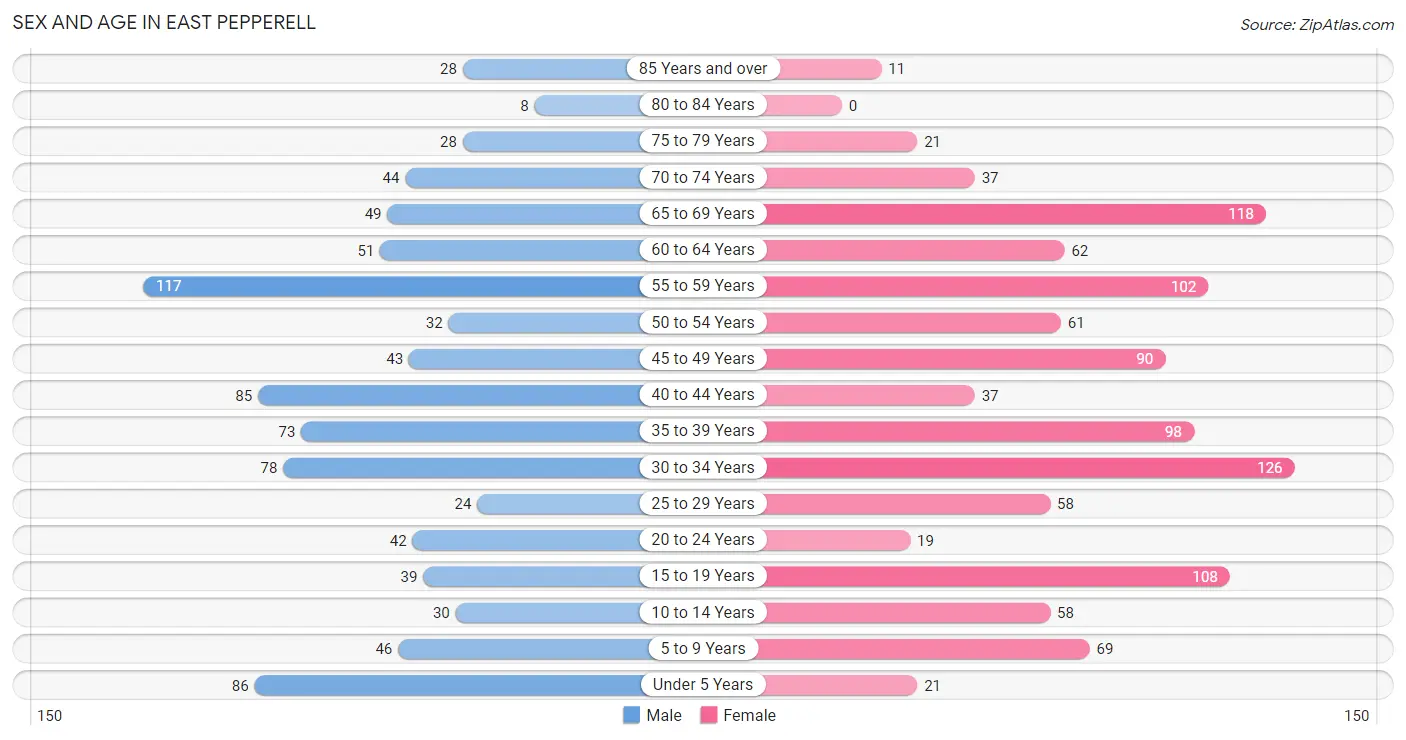
The most populous age groups in East Pepperell are 55 to 59 Years (117 | 13.0%) for men and 30 to 34 Years (126 | 11.5%) for women.
| Age Bracket | Male | Female |
| Under 5 Years | 86 (9.5%) | 21 (1.9%) |
| 5 to 9 Years | 46 (5.1%) | 69 (6.3%) |
| 10 to 14 Years | 30 (3.3%) | 58 (5.3%) |
| 15 to 19 Years | 39 (4.3%) | 108 (9.9%) |
| 20 to 24 Years | 42 (4.6%) | 19 (1.7%) |
| 25 to 29 Years | 24 (2.7%) | 58 (5.3%) |
| 30 to 34 Years | 78 (8.6%) | 126 (11.5%) |
| 35 to 39 Years | 73 (8.1%) | 98 (8.9%) |
| 40 to 44 Years | 85 (9.4%) | 37 (3.4%) |
| 45 to 49 Years | 43 (4.8%) | 90 (8.2%) |
| 50 to 54 Years | 32 (3.5%) | 61 (5.6%) |
| 55 to 59 Years | 117 (13.0%) | 102 (9.3%) |
| 60 to 64 Years | 51 (5.7%) | 62 (5.7%) |
| 65 to 69 Years | 49 (5.4%) | 118 (10.8%) |
| 70 to 74 Years | 44 (4.9%) | 37 (3.4%) |
| 75 to 79 Years | 28 (3.1%) | 21 (1.9%) |
| 80 to 84 Years | 8 (0.9%) | 0 (0.0%) |
| 85 Years and over | 28 (3.1%) | 11 (1.0%) |
| Total | 903 (100.0%) | 1,096 (100.0%) |
Families and Households in East Pepperell
Median Family Size in East Pepperell
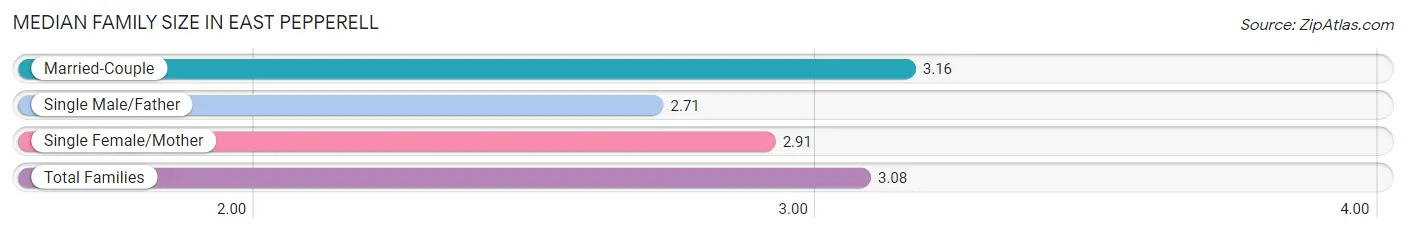
The median family size in East Pepperell is 3.08 persons per family, with married-couple families (398 | 75.5%) accounting for the largest median family size of 3.16 persons per family. On the other hand, single male/father families (31 | 5.9%) represent the smallest median family size with 2.71 persons per family.
| Family Type | # Families | Family Size |
| Married-Couple | 398 (75.5%) | 3.16 |
| Single Male/Father | 31 (5.9%) | 2.71 |
| Single Female/Mother | 98 (18.6%) | 2.91 |
| Total Families | 527 (100.0%) | 3.08 |
Median Household Size in East Pepperell
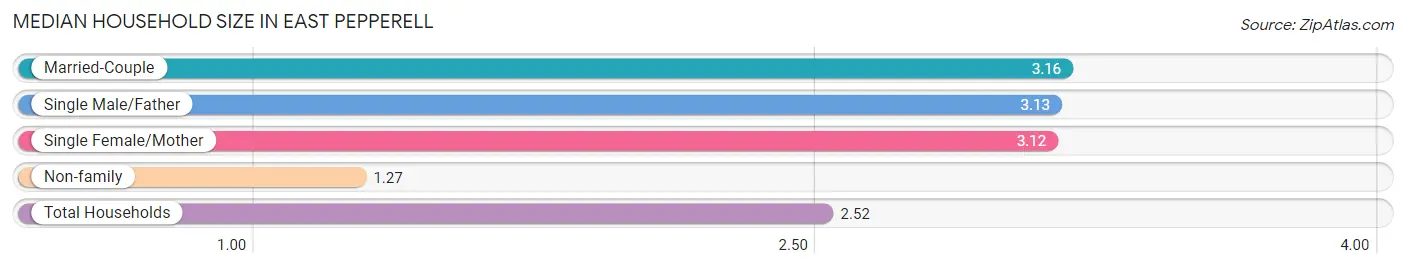
The median household size in East Pepperell is 2.52 persons per household, with married-couple households (398 | 50.1%) accounting for the largest median household size of 3.16 persons per household. non-family households (267 | 33.6%) represent the smallest median household size with 1.27 persons per household.
| Household Type | # Households | Household Size |
| Married-Couple | 398 (50.1%) | 3.16 |
| Single Male/Father | 31 (3.9%) | 3.13 |
| Single Female/Mother | 98 (12.3%) | 3.12 |
| Non-family | 267 (33.6%) | 1.27 |
| Total Households | 794 (100.0%) | 2.52 |
Household Size by Marriage Status in East Pepperell
Out of a total of 794 households in East Pepperell, 527 (66.4%) are family households, while 267 (33.6%) are nonfamily households. The most numerous type of family households are 2-person households, comprising 217, and the most common type of nonfamily households are 1-person households, comprising 200.
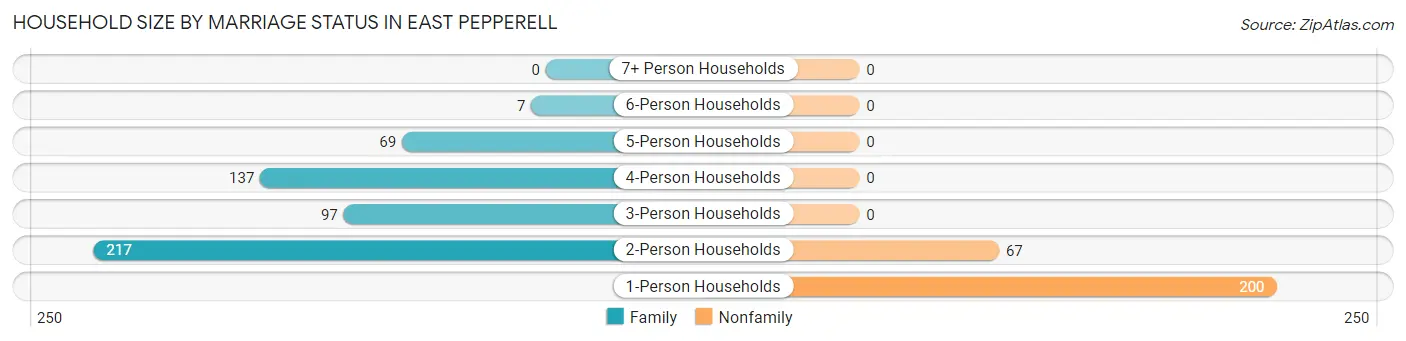
| Household Size | Family Households | Nonfamily Households |
| 1-Person Households | - | 200 (25.2%) |
| 2-Person Households | 217 (27.3%) | 67 (8.4%) |
| 3-Person Households | 97 (12.2%) | 0 (0.0%) |
| 4-Person Households | 137 (17.2%) | 0 (0.0%) |
| 5-Person Households | 69 (8.7%) | 0 (0.0%) |
| 6-Person Households | 7 (0.9%) | 0 (0.0%) |
| 7+ Person Households | 0 (0.0%) | 0 (0.0%) |
| Total | 527 (66.4%) | 267 (33.6%) |
Female Fertility in East Pepperell
Fertility by Age in East Pepperell
Average fertility rate in East Pepperell is 64.0 births per 1,000 women. Women in the age bracket of 20 to 34 years have the highest fertility rate with 84.0 births per 1,000 women. Women in the age bracket of 35 to 50 years acount for 51.4% of all women with births.
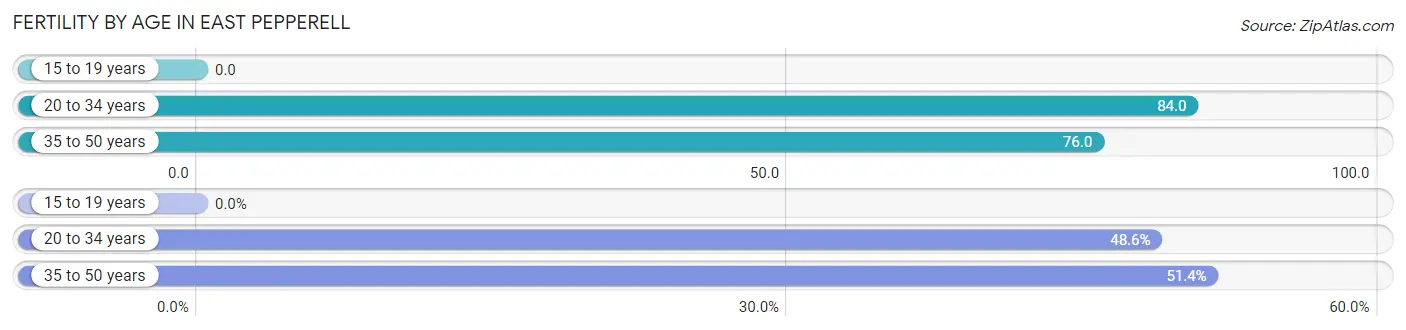
| Age Bracket | Women with Births | Births / 1,000 Women |
| 15 to 19 years | 0 (0.0%) | 0.0 |
| 20 to 34 years | 17 (48.6%) | 84.0 |
| 35 to 50 years | 18 (51.4%) | 76.0 |
| Total | 35 (100.0%) | 64.0 |
Fertility by Age by Marriage Status in East Pepperell
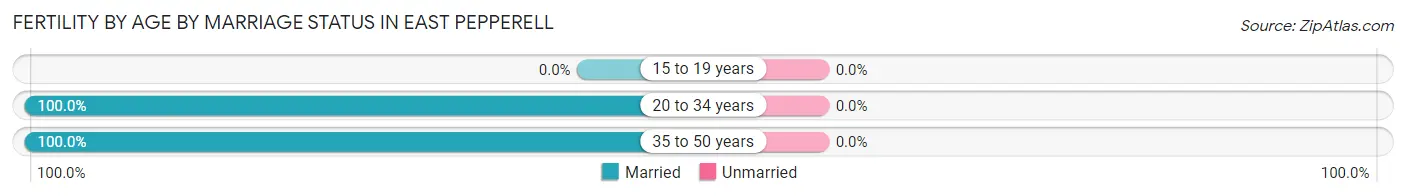
| Age Bracket | Married | Unmarried |
| 15 to 19 years | 0 (0.0%) | 0 (0.0%) |
| 20 to 34 years | 17 (100.0%) | 0 (0.0%) |
| 35 to 50 years | 18 (100.0%) | 0 (0.0%) |
| Total | 35 (100.0%) | 0 (0.0%) |
Fertility by Education in East Pepperell
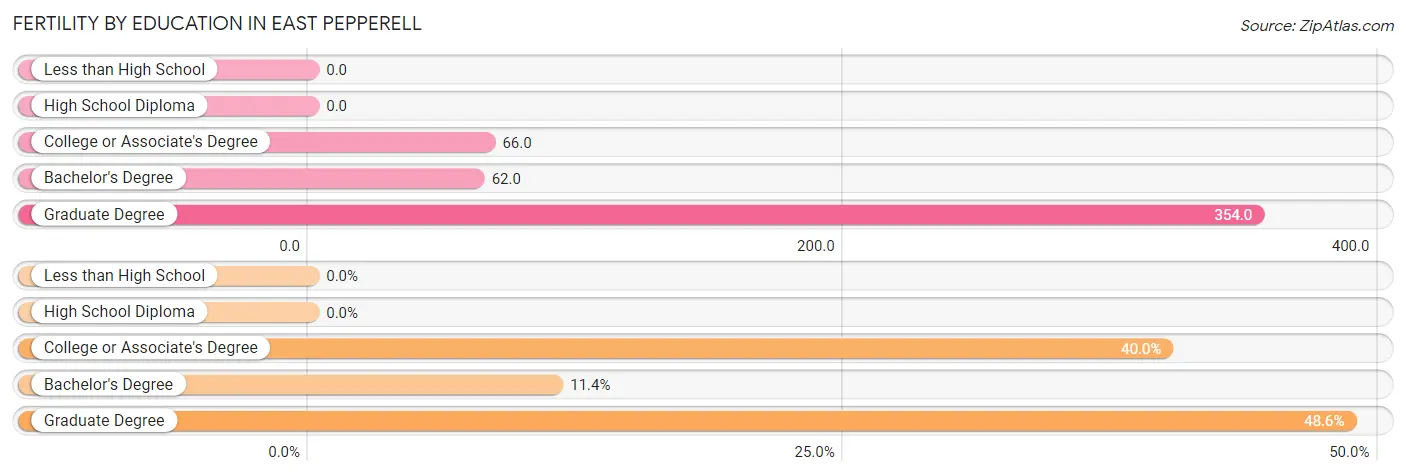
| Educational Attainment | Women with Births | Births / 1,000 Women |
| Less than High School | 0 (0.0%) | 0.0 |
| High School Diploma | 0 (0.0%) | 0.0 |
| College or Associate's Degree | 14 (40.0%) | 66.0 |
| Bachelor's Degree | 4 (11.4%) | 62.0 |
| Graduate Degree | 17 (48.6%) | 354.0 |
| Total | 35 (100.0%) | 64.0 |
Fertility by Education by Marriage Status in East Pepperell
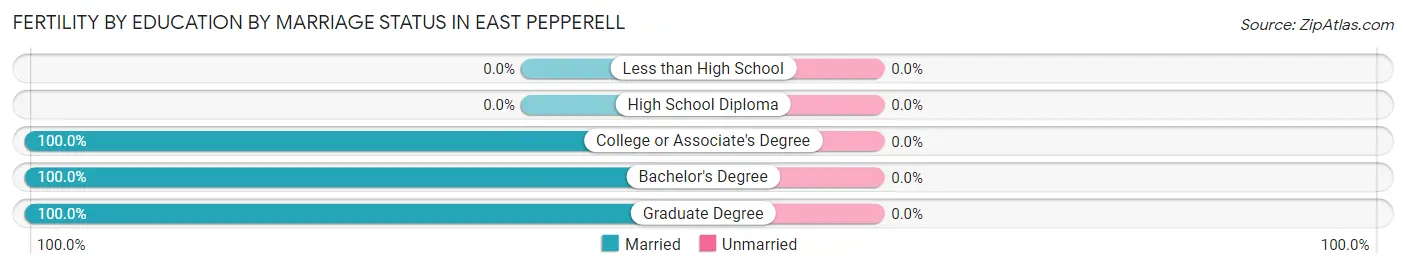
| Educational Attainment | Married | Unmarried |
| Less than High School | 0 (0.0%) | 0 (0.0%) |
| High School Diploma | 0 (0.0%) | 0 (0.0%) |
| College or Associate's Degree | 14 (100.0%) | 0 (0.0%) |
| Bachelor's Degree | 4 (100.0%) | 0 (0.0%) |
| Graduate Degree | 17 (100.0%) | 0 (0.0%) |
| Total | 35 (100.0%) | 0 (0.0%) |
Employment Characteristics in East Pepperell
Employment by Class of Employer in East Pepperell
Among the 1,041 employed individuals in East Pepperell, private company employees (672 | 64.5%), local government employees (109 | 10.5%), and self-employed (not incorporated) (80 | 7.7%) make up the most common classes of employment.
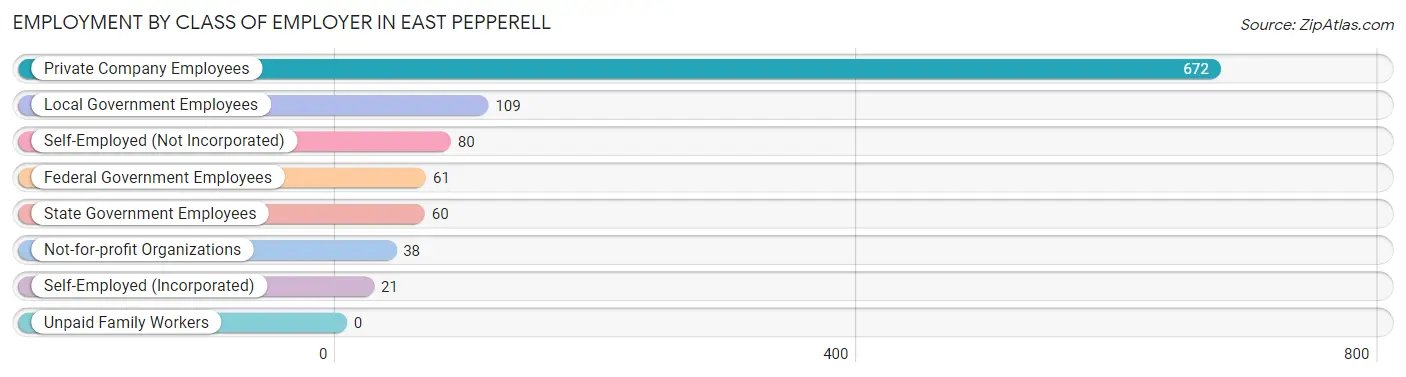
| Employer Class | # Employees | % Employees |
| Private Company Employees | 672 | 64.5% |
| Self-Employed (Incorporated) | 21 | 2.0% |
| Self-Employed (Not Incorporated) | 80 | 7.7% |
| Not-for-profit Organizations | 38 | 3.6% |
| Local Government Employees | 109 | 10.5% |
| State Government Employees | 60 | 5.8% |
| Federal Government Employees | 61 | 5.9% |
| Unpaid Family Workers | 0 | 0.0% |
| Total | 1,041 | 100.0% |
Employment Status by Age in East Pepperell
According to the labor force statistics for East Pepperell, out of the total population over 16 years of age (1,689), 66.7% or 1,127 individuals are in the labor force, with 4.5% or 51 of them unemployed. The age group with the highest labor force participation rate is 55 to 59 years, with 97.3% or 213 individuals in the labor force. Within the labor force, the 20 to 24 years age range has the highest percentage of unemployed individuals, with 52.6% or 10 of them being unemployed.
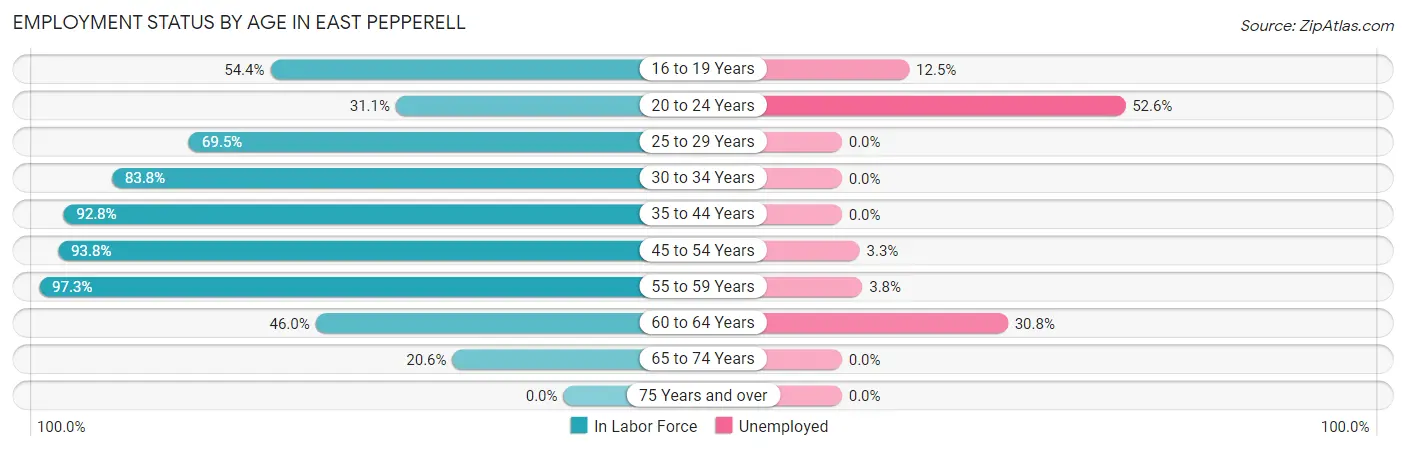
| Age Bracket | In Labor Force | Unemployed |
| 16 to 19 Years | 80 (54.4%) | 10 (12.5%) |
| 20 to 24 Years | 19 (31.1%) | 10 (52.6%) |
| 25 to 29 Years | 57 (69.5%) | 0 (0.0%) |
| 30 to 34 Years | 171 (83.8%) | 0 (0.0%) |
| 35 to 44 Years | 272 (92.8%) | 0 (0.0%) |
| 45 to 54 Years | 212 (93.8%) | 7 (3.3%) |
| 55 to 59 Years | 213 (97.3%) | 8 (3.8%) |
| 60 to 64 Years | 52 (46.0%) | 16 (30.8%) |
| 65 to 74 Years | 51 (20.6%) | 0 (0.0%) |
| 75 Years and over | 0 (0.0%) | 0 (0.0%) |
| Total | 1,127 (66.7%) | 51 (4.5%) |
Employment Status by Educational Attainment in East Pepperell
According to labor force statistics for East Pepperell, 85.9% of individuals (977) out of the total population between 25 and 64 years of age (1,137) are in the labor force, with 3.2% or 31 of them being unemployed. The group with the highest labor force participation rate are those with the educational attainment of bachelor's degree or higher, with 97.3% or 321 individuals in the labor force. Within the labor force, individuals with bachelor's degree or higher education have the highest percentage of unemployment, with 7.5% or 24 of them being unemployed.
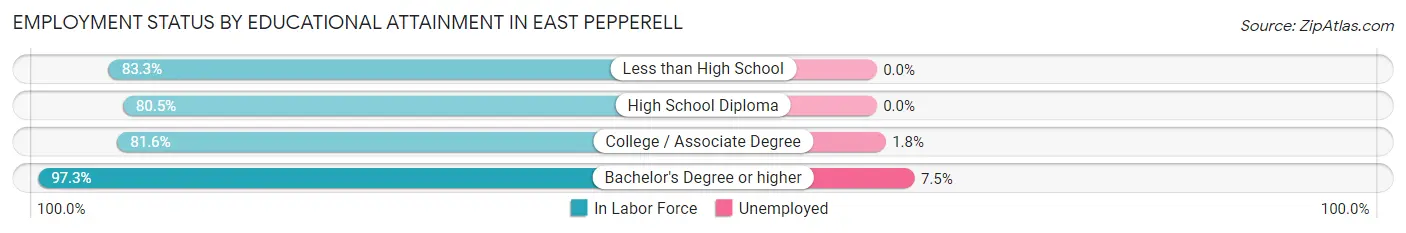
| Educational Attainment | In Labor Force | Unemployed |
| Less than High School | 30 (83.3%) | 0 (0.0%) |
| High School Diploma | 239 (80.5%) | 0 (0.0%) |
| College / Associate Degree | 387 (81.6%) | 9 (1.8%) |
| Bachelor's Degree or higher | 321 (97.3%) | 25 (7.5%) |
| Total | 977 (85.9%) | 36 (3.2%) |
Employment Occupations by Sex in East Pepperell
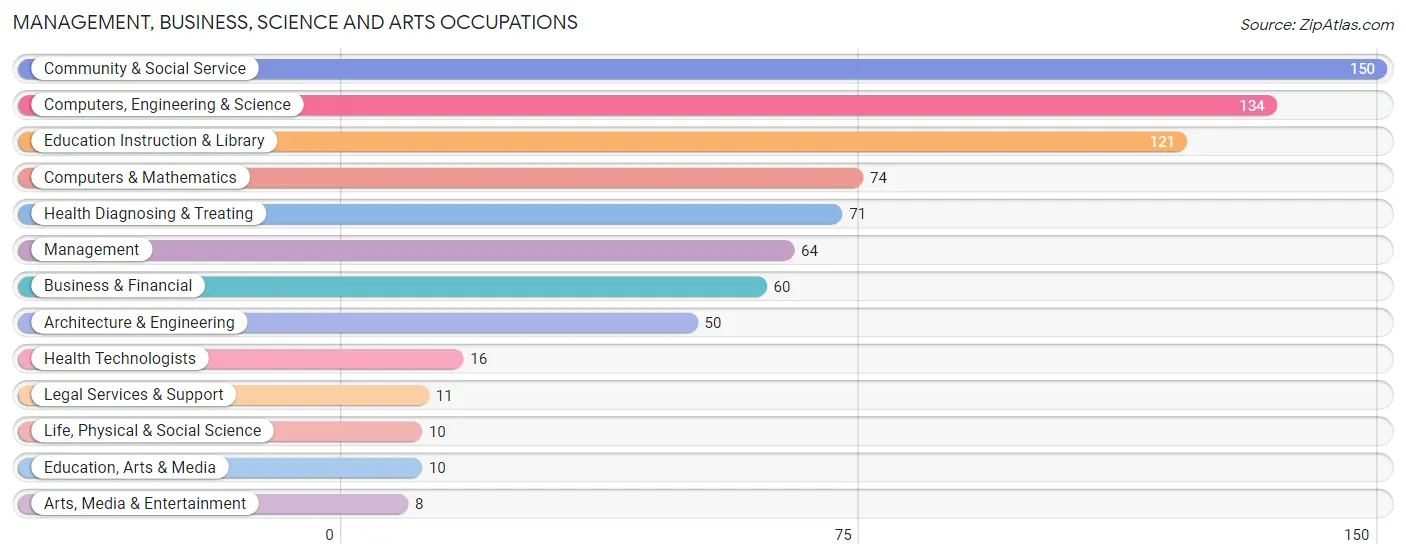
Management, Business, Science and Arts Occupations
The most common Management, Business, Science and Arts occupations in East Pepperell are Community & Social Service (150 | 13.9%), Computers, Engineering & Science (134 | 12.4%), Education Instruction & Library (121 | 11.3%), Computers & Mathematics (74 | 6.9%), and Health Diagnosing & Treating (71 | 6.6%).
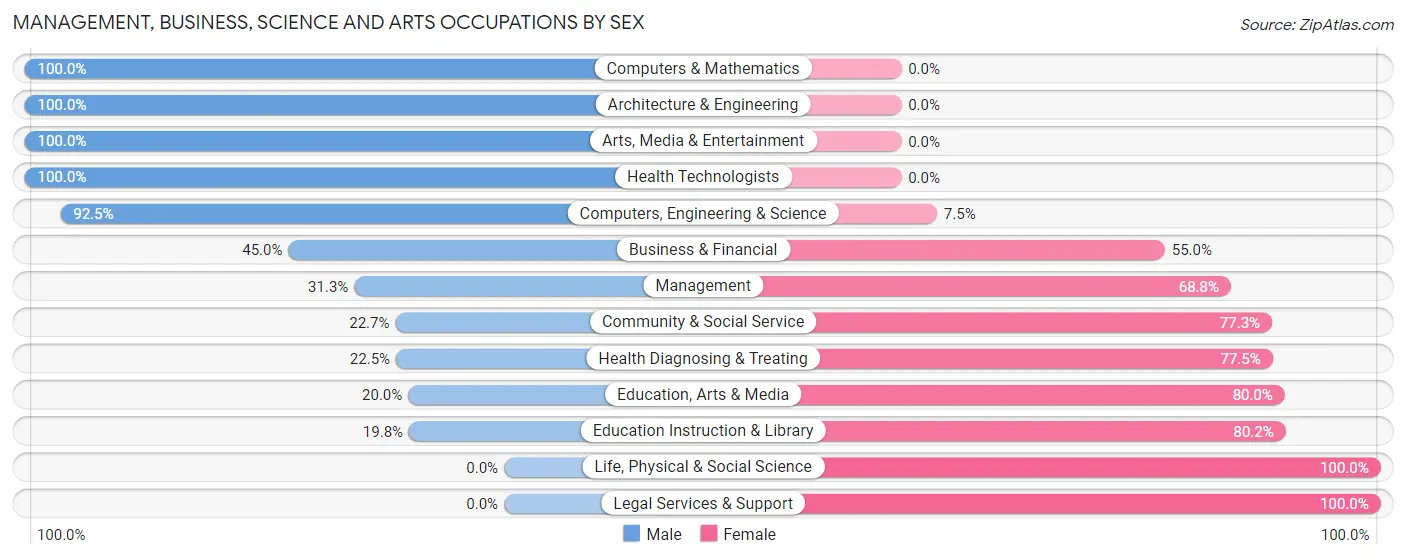
Management, Business, Science and Arts Occupations by Sex
Within the Management, Business, Science and Arts occupations in East Pepperell, the most male-oriented occupations are Computers & Mathematics (100.0%), Architecture & Engineering (100.0%), and Arts, Media & Entertainment (100.0%), while the most female-oriented occupations are Life, Physical & Social Science (100.0%), Legal Services & Support (100.0%), and Education Instruction & Library (80.2%).
| Occupation | Male | Female |
| Management | 20 (31.2%) | 44 (68.8%) |
| Business & Financial | 27 (45.0%) | 33 (55.0%) |
| Computers, Engineering & Science | 124 (92.5%) | 10 (7.5%) |
| Computers & Mathematics | 74 (100.0%) | 0 (0.0%) |
| Architecture & Engineering | 50 (100.0%) | 0 (0.0%) |
| Life, Physical & Social Science | 0 (0.0%) | 10 (100.0%) |
| Community & Social Service | 34 (22.7%) | 116 (77.3%) |
| Education, Arts & Media | 2 (20.0%) | 8 (80.0%) |
| Legal Services & Support | 0 (0.0%) | 11 (100.0%) |
| Education Instruction & Library | 24 (19.8%) | 97 (80.2%) |
| Arts, Media & Entertainment | 8 (100.0%) | 0 (0.0%) |
| Health Diagnosing & Treating | 16 (22.5%) | 55 (77.5%) |
| Health Technologists | 16 (100.0%) | 0 (0.0%) |
| Total (Category) | 221 (46.1%) | 258 (53.9%) |
| Total (Overall) | 464 (43.1%) | 612 (56.9%) |
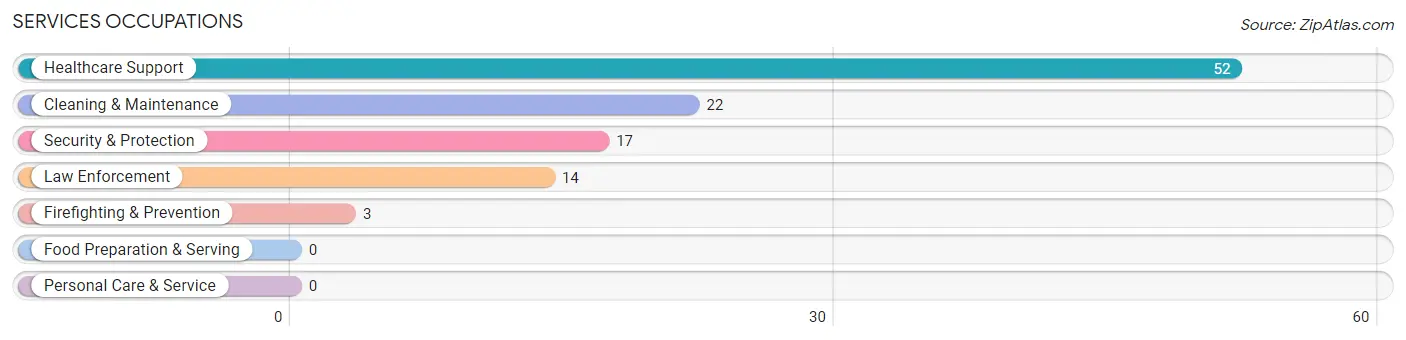
Services Occupations
The most common Services occupations in East Pepperell are Healthcare Support (52 | 4.8%), Cleaning & Maintenance (22 | 2.0%), Security & Protection (17 | 1.6%), Law Enforcement (14 | 1.3%), and Firefighting & Prevention (3 | 0.3%).
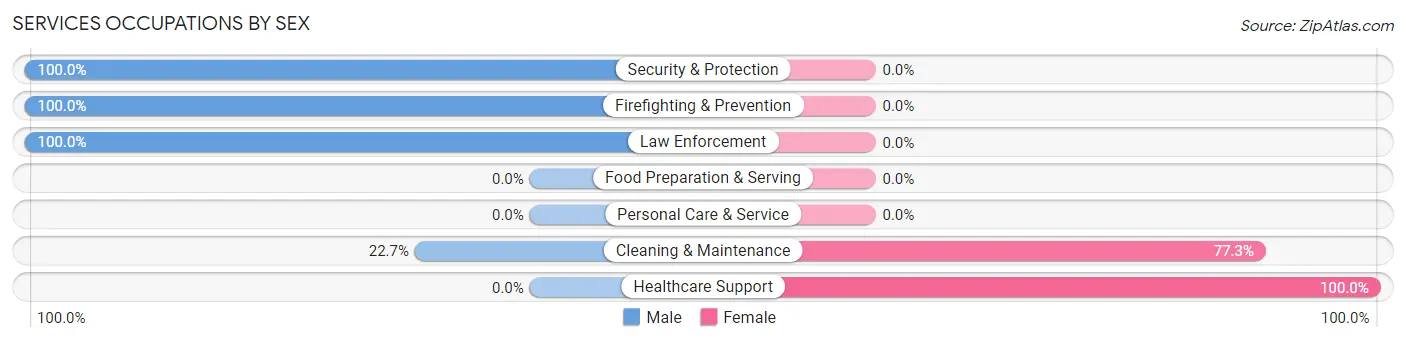
Services Occupations by Sex
Within the Services occupations in East Pepperell, the most male-oriented occupations are Security & Protection (100.0%), Firefighting & Prevention (100.0%), and Law Enforcement (100.0%), while the most female-oriented occupations are Healthcare Support (100.0%), and Cleaning & Maintenance (77.3%).
| Occupation | Male | Female |
| Healthcare Support | 0 (0.0%) | 52 (100.0%) |
| Security & Protection | 17 (100.0%) | 0 (0.0%) |
| Firefighting & Prevention | 3 (100.0%) | 0 (0.0%) |
| Law Enforcement | 14 (100.0%) | 0 (0.0%) |
| Food Preparation & Serving | 0 (0.0%) | 0 (0.0%) |
| Cleaning & Maintenance | 5 (22.7%) | 17 (77.3%) |
| Personal Care & Service | 0 (0.0%) | 0 (0.0%) |
| Total (Category) | 22 (24.2%) | 69 (75.8%) |
| Total (Overall) | 464 (43.1%) | 612 (56.9%) |
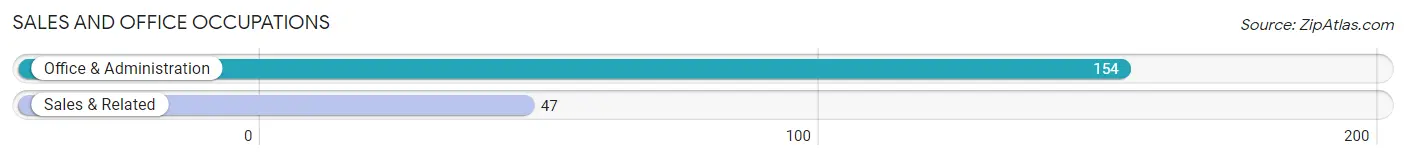
Sales and Office Occupations
The most common Sales and Office occupations in East Pepperell are Office & Administration (154 | 14.3%), and Sales & Related (47 | 4.4%).
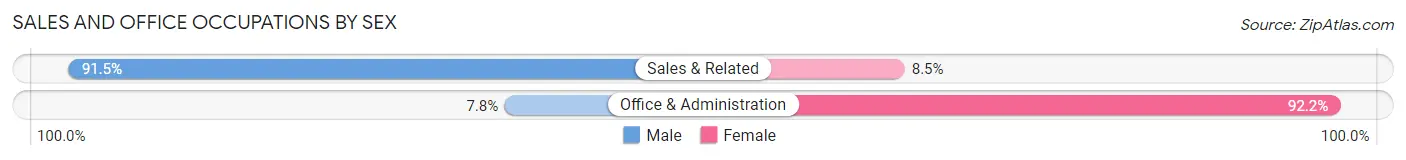
Sales and Office Occupations by Sex
| Occupation | Male | Female |
| Sales & Related | 43 (91.5%) | 4 (8.5%) |
| Office & Administration | 12 (7.8%) | 142 (92.2%) |
| Total (Category) | 55 (27.4%) | 146 (72.6%) |
| Total (Overall) | 464 (43.1%) | 612 (56.9%) |
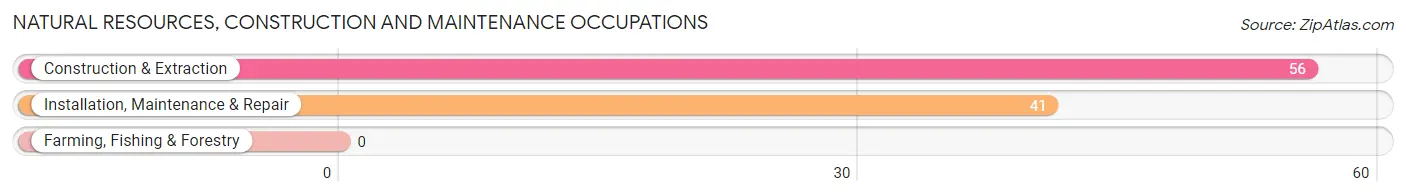
Natural Resources, Construction and Maintenance Occupations
The most common Natural Resources, Construction and Maintenance occupations in East Pepperell are Construction & Extraction (56 | 5.2%), and Installation, Maintenance & Repair (41 | 3.8%).
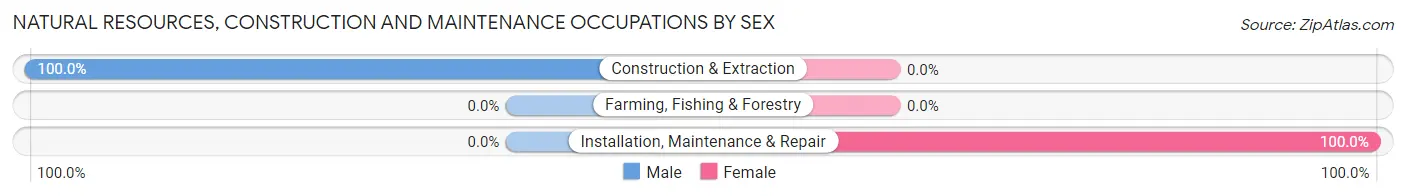
Natural Resources, Construction and Maintenance Occupations by Sex
| Occupation | Male | Female |
| Farming, Fishing & Forestry | 0 (0.0%) | 0 (0.0%) |
| Construction & Extraction | 56 (100.0%) | 0 (0.0%) |
| Installation, Maintenance & Repair | 0 (0.0%) | 41 (100.0%) |
| Total (Category) | 56 (57.7%) | 41 (42.3%) |
| Total (Overall) | 464 (43.1%) | 612 (56.9%) |
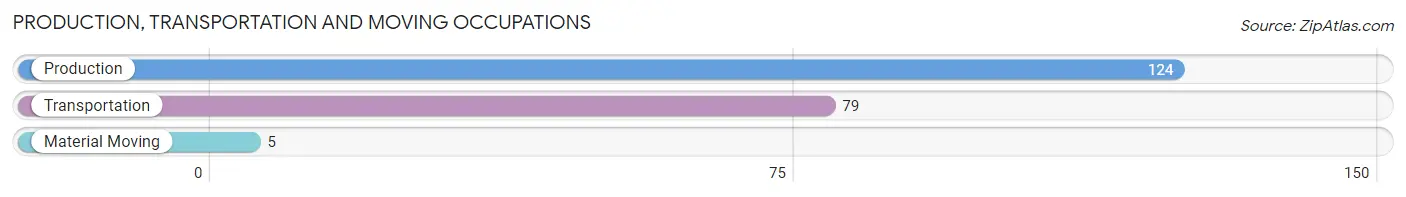
Production, Transportation and Moving Occupations
The most common Production, Transportation and Moving occupations in East Pepperell are Production (124 | 11.5%), Transportation (79 | 7.3%), and Material Moving (5 | 0.5%).
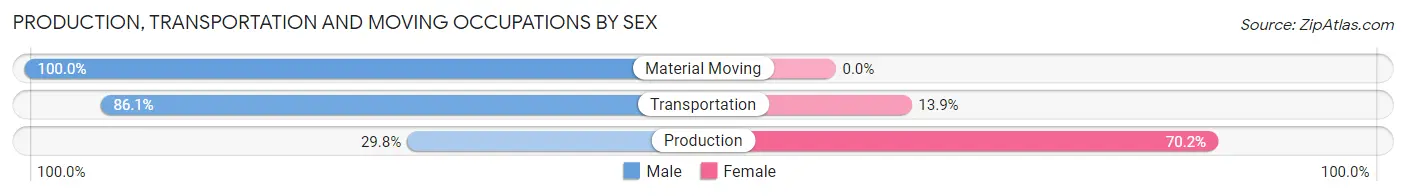
Production, Transportation and Moving Occupations by Sex
| Occupation | Male | Female |
| Production | 37 (29.8%) | 87 (70.2%) |
| Transportation | 68 (86.1%) | 11 (13.9%) |
| Material Moving | 5 (100.0%) | 0 (0.0%) |
| Total (Category) | 110 (52.9%) | 98 (47.1%) |
| Total (Overall) | 464 (43.1%) | 612 (56.9%) |
Employment Industries by Sex in East Pepperell
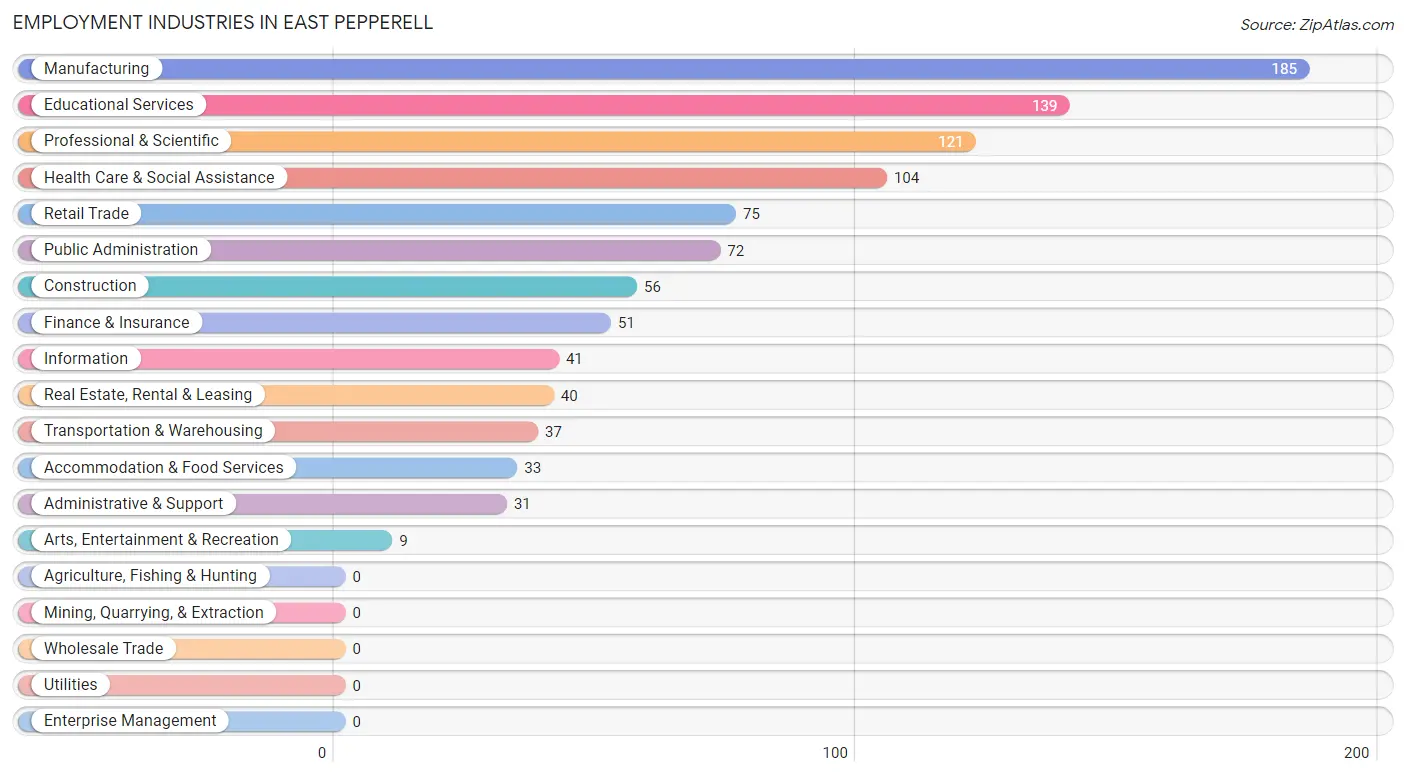
Employment Industries in East Pepperell
The major employment industries in East Pepperell include Manufacturing (185 | 17.2%), Educational Services (139 | 12.9%), Professional & Scientific (121 | 11.3%), Health Care & Social Assistance (104 | 9.7%), and Retail Trade (75 | 7.0%).
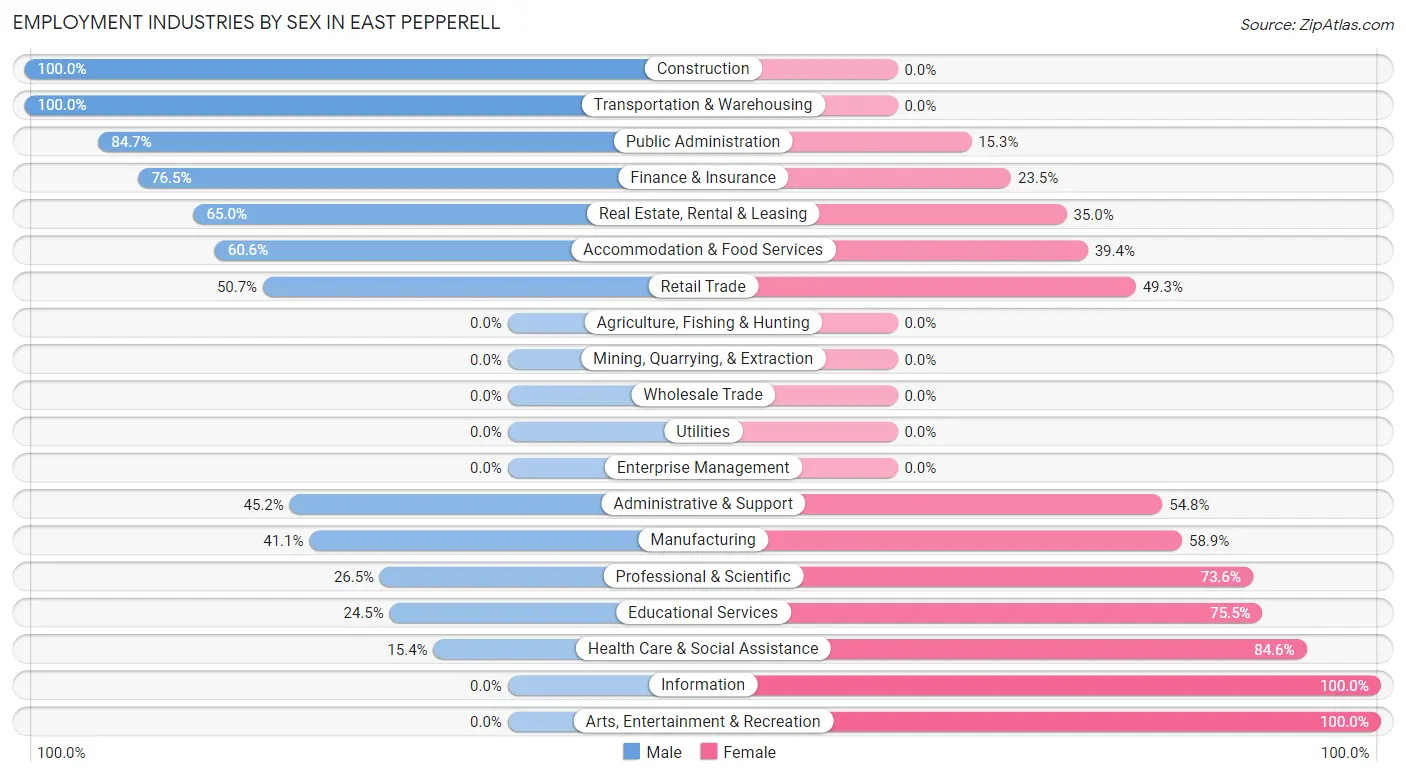
Employment Industries by Sex in East Pepperell
The East Pepperell industries that see more men than women are Construction (100.0%), Transportation & Warehousing (100.0%), and Public Administration (84.7%), whereas the industries that tend to have a higher number of women are Information (100.0%), Arts, Entertainment & Recreation (100.0%), and Health Care & Social Assistance (84.6%).
| Industry | Male | Female |
| Agriculture, Fishing & Hunting | 0 (0.0%) | 0 (0.0%) |
| Mining, Quarrying, & Extraction | 0 (0.0%) | 0 (0.0%) |
| Construction | 56 (100.0%) | 0 (0.0%) |
| Manufacturing | 76 (41.1%) | 109 (58.9%) |
| Wholesale Trade | 0 (0.0%) | 0 (0.0%) |
| Retail Trade | 38 (50.7%) | 37 (49.3%) |
| Transportation & Warehousing | 37 (100.0%) | 0 (0.0%) |
| Utilities | 0 (0.0%) | 0 (0.0%) |
| Information | 0 (0.0%) | 41 (100.0%) |
| Finance & Insurance | 39 (76.5%) | 12 (23.5%) |
| Real Estate, Rental & Leasing | 26 (65.0%) | 14 (35.0%) |
| Professional & Scientific | 32 (26.5%) | 89 (73.6%) |
| Enterprise Management | 0 (0.0%) | 0 (0.0%) |
| Administrative & Support | 14 (45.2%) | 17 (54.8%) |
| Educational Services | 34 (24.5%) | 105 (75.5%) |
| Health Care & Social Assistance | 16 (15.4%) | 88 (84.6%) |
| Arts, Entertainment & Recreation | 0 (0.0%) | 9 (100.0%) |
| Accommodation & Food Services | 20 (60.6%) | 13 (39.4%) |
| Public Administration | 61 (84.7%) | 11 (15.3%) |
| Total | 464 (43.1%) | 612 (56.9%) |
Education in East Pepperell
School Enrollment in East Pepperell
The most common levels of schooling among the 405 students in East Pepperell are elementary school (91 | 22.5%), high school (88 | 21.7%), and college / undergraduate (76 | 18.8%).
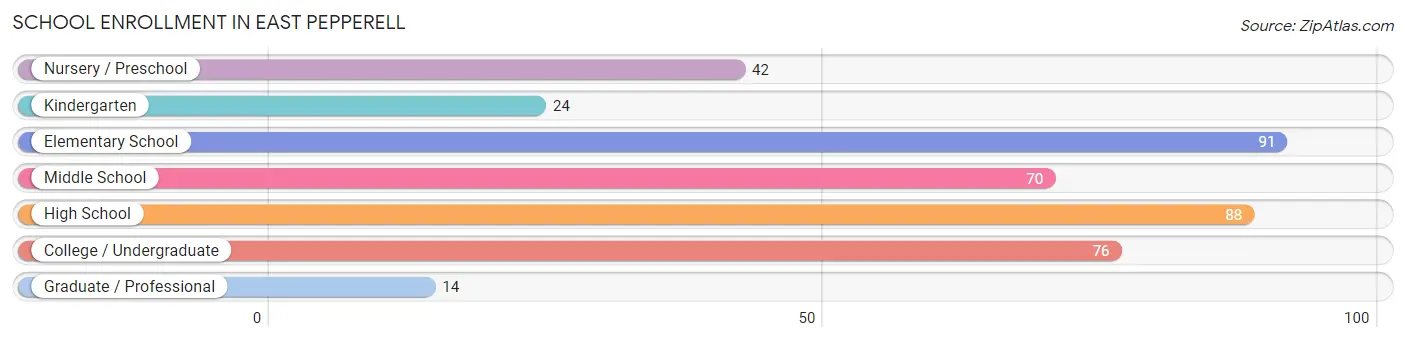
| School Level | # Students | % Students |
| Nursery / Preschool | 42 | 10.4% |
| Kindergarten | 24 | 5.9% |
| Elementary School | 91 | 22.5% |
| Middle School | 70 | 17.3% |
| High School | 88 | 21.7% |
| College / Undergraduate | 76 | 18.8% |
| Graduate / Professional | 14 | 3.5% |
| Total | 405 | 100.0% |
School Enrollment by Age by Funding Source in East Pepperell
Out of a total of 405 students who are enrolled in schools in East Pepperell, 98 (24.2%) attend a private institution, while the remaining 307 (75.8%) are enrolled in public schools. The age group of 3 to 4 year olds has the highest likelihood of being enrolled in private schools, with 42 (100.0% in the age bracket) enrolled. Conversely, the age group of 5 to 9 year old has the lowest likelihood of being enrolled in a private school, with 115 (100.0% in the age bracket) attending a public institution.
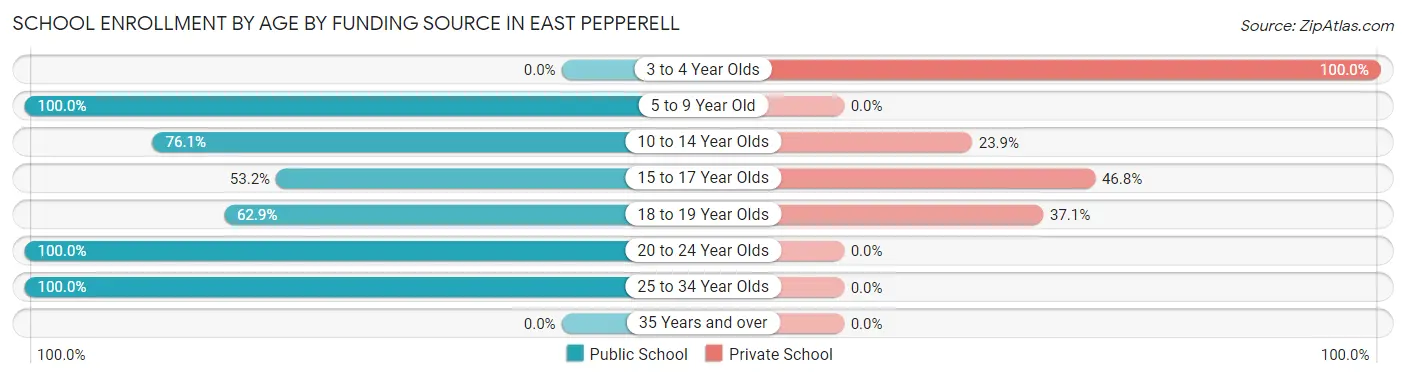
| Age Bracket | Public School | Private School |
| 3 to 4 Year Olds | 0 (0.0%) | 42 (100.0%) |
| 5 to 9 Year Old | 115 (100.0%) | 0 (0.0%) |
| 10 to 14 Year Olds | 67 (76.1%) | 21 (23.9%) |
| 15 to 17 Year Olds | 25 (53.2%) | 22 (46.8%) |
| 18 to 19 Year Olds | 22 (62.9%) | 13 (37.1%) |
| 20 to 24 Year Olds | 51 (100.0%) | 0 (0.0%) |
| 25 to 34 Year Olds | 27 (100.0%) | 0 (0.0%) |
| 35 Years and over | 0 (0.0%) | 0 (0.0%) |
| Total | 307 (75.8%) | 98 (24.2%) |
Educational Attainment by Field of Study in East Pepperell
Education (105 | 23.3%), engineering (75 | 16.6%), arts & humanities (62 | 13.8%), science & technology (48 | 10.6%), and physical & health sciences (38 | 8.4%) are the most common fields of study among 451 individuals in East Pepperell who have obtained a bachelor's degree or higher.
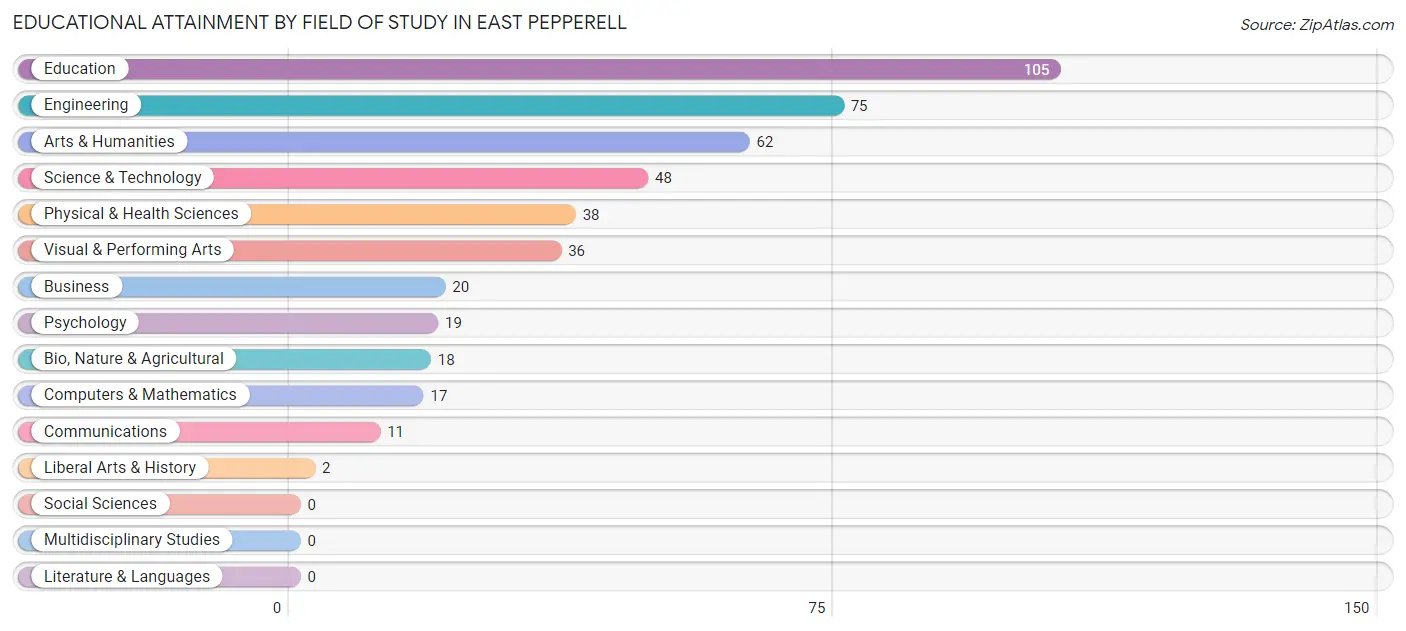
| Field of Study | # Graduates | % Graduates |
| Computers & Mathematics | 17 | 3.8% |
| Bio, Nature & Agricultural | 18 | 4.0% |
| Physical & Health Sciences | 38 | 8.4% |
| Psychology | 19 | 4.2% |
| Social Sciences | 0 | 0.0% |
| Engineering | 75 | 16.6% |
| Multidisciplinary Studies | 0 | 0.0% |
| Science & Technology | 48 | 10.6% |
| Business | 20 | 4.4% |
| Education | 105 | 23.3% |
| Literature & Languages | 0 | 0.0% |
| Liberal Arts & History | 2 | 0.4% |
| Visual & Performing Arts | 36 | 8.0% |
| Communications | 11 | 2.4% |
| Arts & Humanities | 62 | 13.8% |
| Total | 451 | 100.0% |
Transportation & Commute in East Pepperell
Vehicle Availability by Sex in East Pepperell
The most prevalent vehicle ownership categories in East Pepperell are males with 2 vehicles (251, accounting for 55.5%) and females with 2 vehicles (253, making up 42.8%).
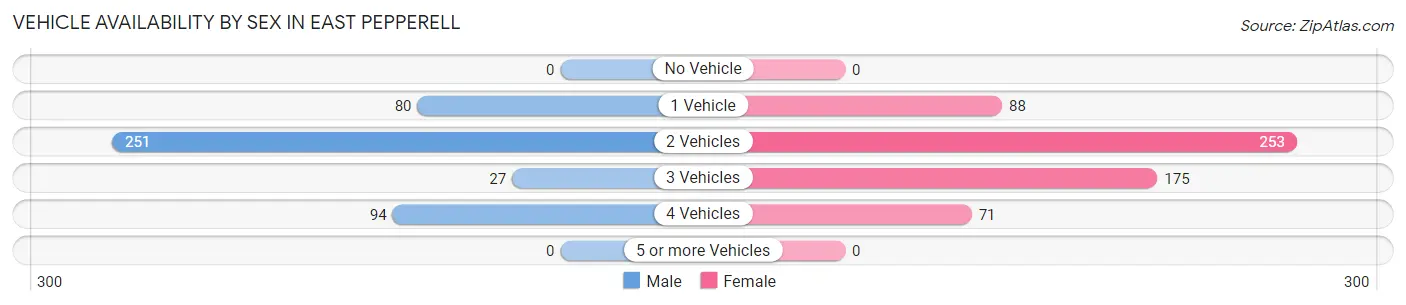
| Vehicles Available | Male | Female |
| No Vehicle | 0 (0.0%) | 0 (0.0%) |
| 1 Vehicle | 80 (17.7%) | 88 (15.0%) |
| 2 Vehicles | 251 (55.5%) | 253 (43.1%) |
| 3 Vehicles | 27 (6.0%) | 175 (29.8%) |
| 4 Vehicles | 94 (20.8%) | 71 (12.1%) |
| 5 or more Vehicles | 0 (0.0%) | 0 (0.0%) |
| Total | 452 (100.0%) | 587 (100.0%) |
Commute Time in East Pepperell
The most frequently occuring commute durations in East Pepperell are 45 to 59 minutes (243 commuters, 26.2%), 30 to 34 minutes (179 commuters, 19.3%), and 25 to 29 minutes (140 commuters, 15.1%).
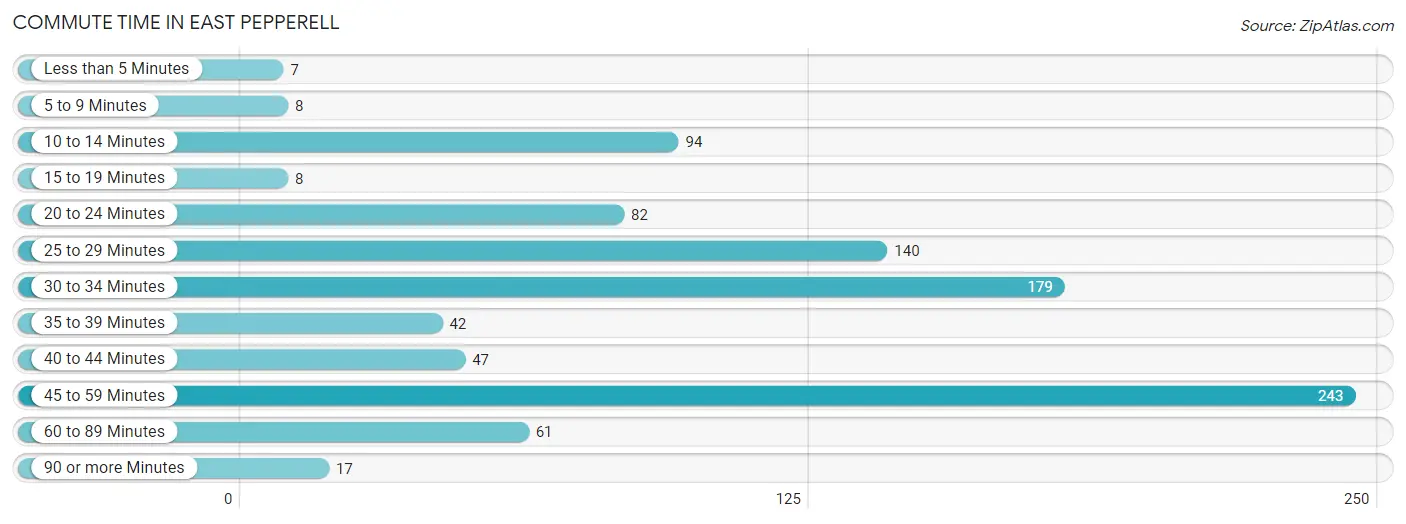
| Commute Time | # Commuters | % Commuters |
| Less than 5 Minutes | 7 | 0.7% |
| 5 to 9 Minutes | 8 | 0.9% |
| 10 to 14 Minutes | 94 | 10.1% |
| 15 to 19 Minutes | 8 | 0.9% |
| 20 to 24 Minutes | 82 | 8.8% |
| 25 to 29 Minutes | 140 | 15.1% |
| 30 to 34 Minutes | 179 | 19.3% |
| 35 to 39 Minutes | 42 | 4.5% |
| 40 to 44 Minutes | 47 | 5.1% |
| 45 to 59 Minutes | 243 | 26.2% |
| 60 to 89 Minutes | 61 | 6.6% |
| 90 or more Minutes | 17 | 1.8% |
Commute Time by Sex in East Pepperell
The most common commute times in East Pepperell are 45 to 59 minutes (141 commuters, 35.2%) for males and 30 to 34 minutes (144 commuters, 27.3%) for females.
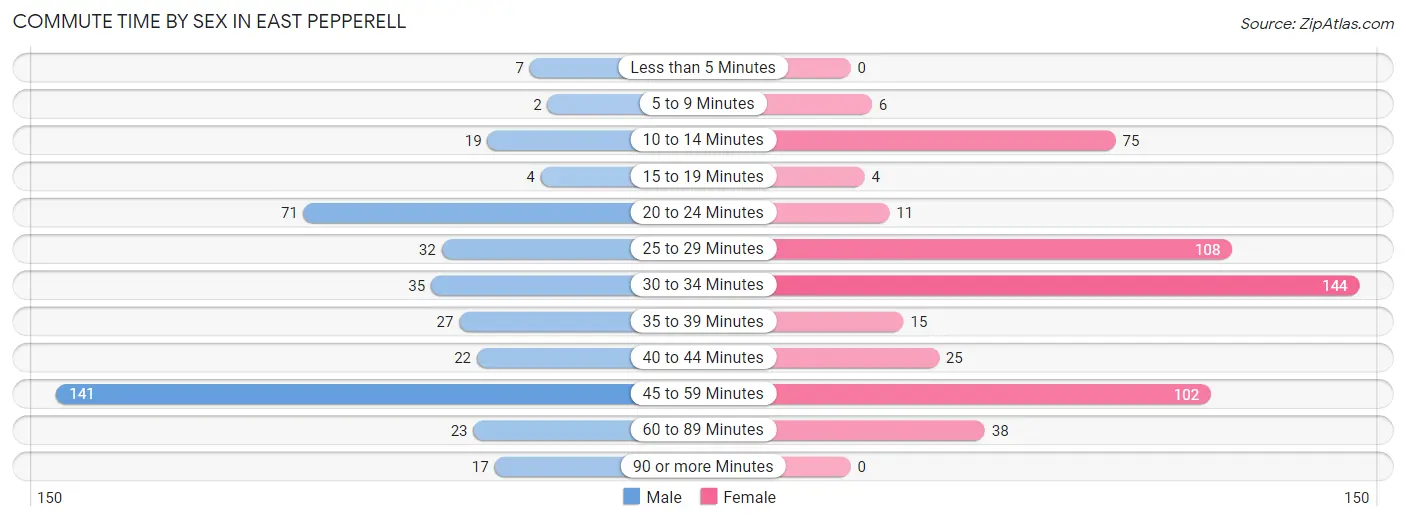
| Commute Time | Male | Female |
| Less than 5 Minutes | 7 (1.8%) | 0 (0.0%) |
| 5 to 9 Minutes | 2 (0.5%) | 6 (1.1%) |
| 10 to 14 Minutes | 19 (4.8%) | 75 (14.2%) |
| 15 to 19 Minutes | 4 (1.0%) | 4 (0.8%) |
| 20 to 24 Minutes | 71 (17.7%) | 11 (2.1%) |
| 25 to 29 Minutes | 32 (8.0%) | 108 (20.4%) |
| 30 to 34 Minutes | 35 (8.7%) | 144 (27.3%) |
| 35 to 39 Minutes | 27 (6.8%) | 15 (2.8%) |
| 40 to 44 Minutes | 22 (5.5%) | 25 (4.7%) |
| 45 to 59 Minutes | 141 (35.2%) | 102 (19.3%) |
| 60 to 89 Minutes | 23 (5.8%) | 38 (7.2%) |
| 90 or more Minutes | 17 (4.3%) | 0 (0.0%) |
Time of Departure to Work by Sex in East Pepperell
The most frequent times of departure to work in East Pepperell are 5:30 AM to 5:59 AM (88, 22.0%) for males and 6:30 AM to 6:59 AM (162, 30.7%) for females.
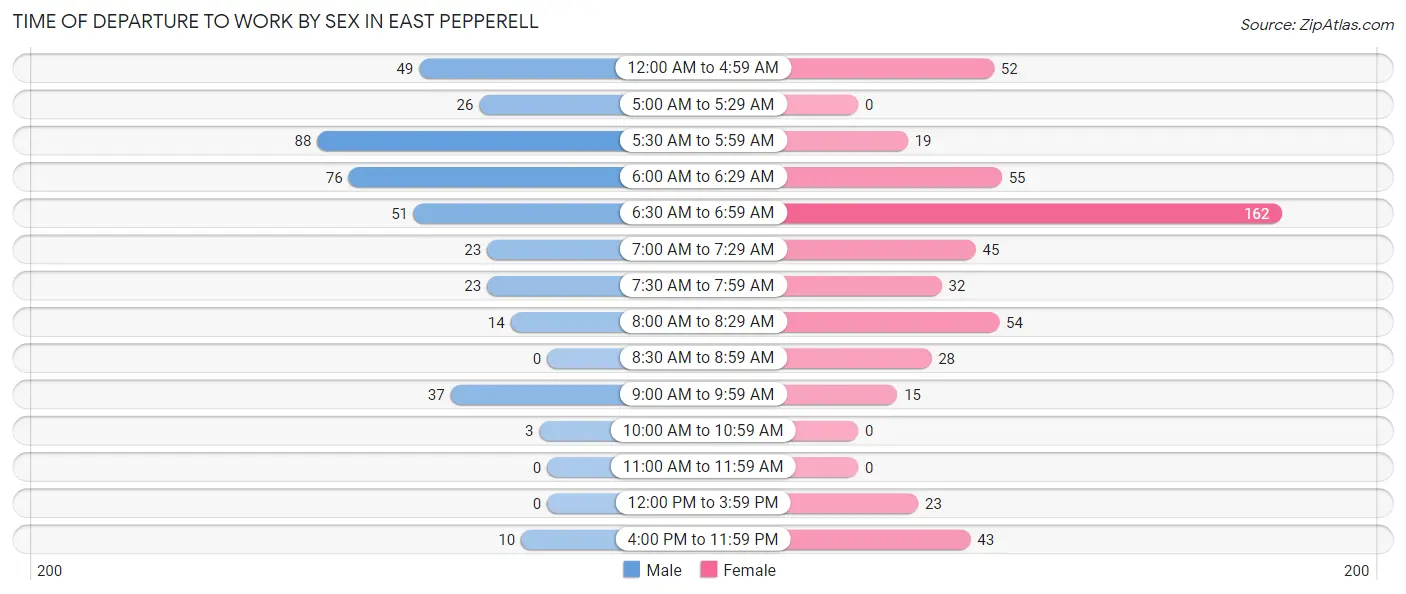
| Time of Departure | Male | Female |
| 12:00 AM to 4:59 AM | 49 (12.2%) | 52 (9.9%) |
| 5:00 AM to 5:29 AM | 26 (6.5%) | 0 (0.0%) |
| 5:30 AM to 5:59 AM | 88 (22.0%) | 19 (3.6%) |
| 6:00 AM to 6:29 AM | 76 (19.0%) | 55 (10.4%) |
| 6:30 AM to 6:59 AM | 51 (12.8%) | 162 (30.7%) |
| 7:00 AM to 7:29 AM | 23 (5.8%) | 45 (8.5%) |
| 7:30 AM to 7:59 AM | 23 (5.8%) | 32 (6.1%) |
| 8:00 AM to 8:29 AM | 14 (3.5%) | 54 (10.2%) |
| 8:30 AM to 8:59 AM | 0 (0.0%) | 28 (5.3%) |
| 9:00 AM to 9:59 AM | 37 (9.2%) | 15 (2.8%) |
| 10:00 AM to 10:59 AM | 3 (0.7%) | 0 (0.0%) |
| 11:00 AM to 11:59 AM | 0 (0.0%) | 0 (0.0%) |
| 12:00 PM to 3:59 PM | 0 (0.0%) | 23 (4.4%) |
| 4:00 PM to 11:59 PM | 10 (2.5%) | 43 (8.1%) |
| Total | 400 (100.0%) | 528 (100.0%) |
Housing Occupancy in East Pepperell
Occupancy by Ownership in East Pepperell
Of the total 794 dwellings in East Pepperell, owner-occupied units account for 685 (86.3%), while renter-occupied units make up 109 (13.7%).
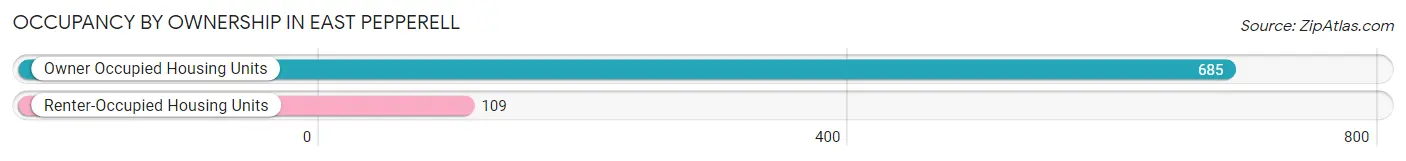
| Occupancy | # Housing Units | % Housing Units |
| Owner Occupied Housing Units | 685 | 86.3% |
| Renter-Occupied Housing Units | 109 | 13.7% |
| Total Occupied Housing Units | 794 | 100.0% |
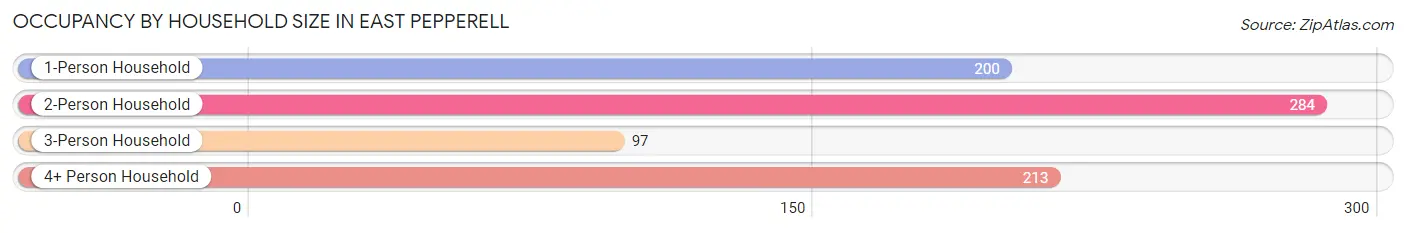
Occupancy by Household Size in East Pepperell
| Household Size | # Housing Units | % Housing Units |
| 1-Person Household | 200 | 25.2% |
| 2-Person Household | 284 | 35.8% |
| 3-Person Household | 97 | 12.2% |
| 4+ Person Household | 213 | 26.8% |
| Total Housing Units | 794 | 100.0% |
Occupancy by Ownership by Household Size in East Pepperell
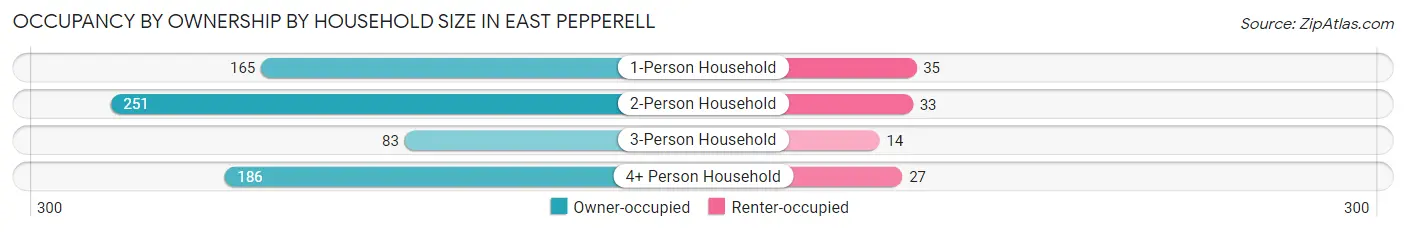
| Household Size | Owner-occupied | Renter-occupied |
| 1-Person Household | 165 (82.5%) | 35 (17.5%) |
| 2-Person Household | 251 (88.4%) | 33 (11.6%) |
| 3-Person Household | 83 (85.6%) | 14 (14.4%) |
| 4+ Person Household | 186 (87.3%) | 27 (12.7%) |
| Total Housing Units | 685 (86.3%) | 109 (13.7%) |
Occupancy by Educational Attainment in East Pepperell
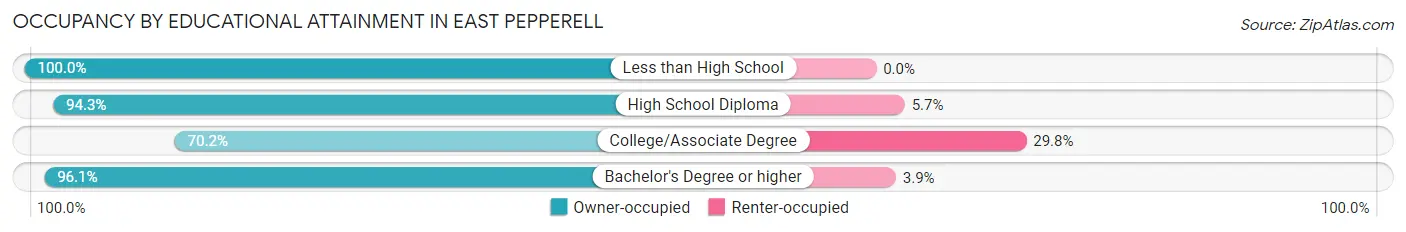
| Household Size | Owner-occupied | Renter-occupied |
| Less than High School | 11 (100.0%) | 0 (0.0%) |
| High School Diploma | 200 (94.3%) | 12 (5.7%) |
| College/Associate Degree | 203 (70.2%) | 86 (29.8%) |
| Bachelor's Degree or higher | 271 (96.1%) | 11 (3.9%) |
Occupancy by Age of Householder in East Pepperell
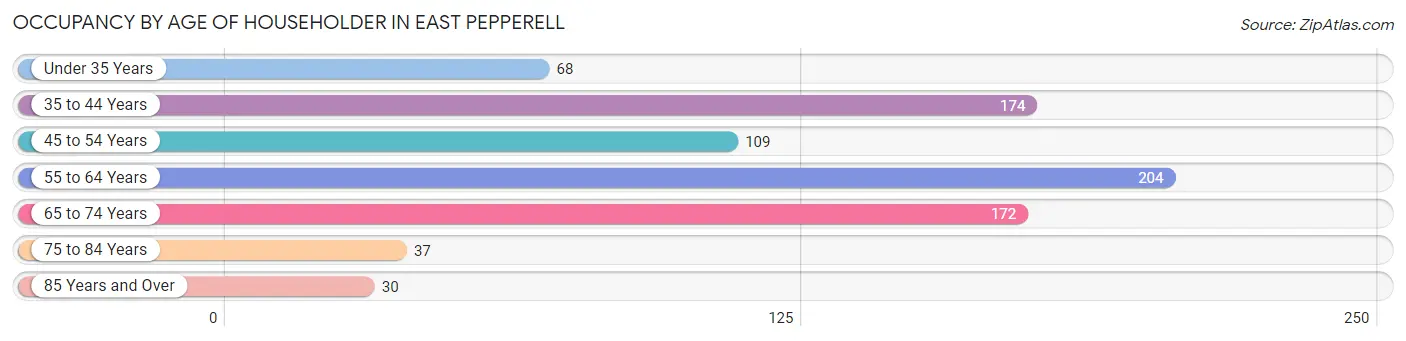
| Age Bracket | # Households | % Households |
| Under 35 Years | 68 | 8.6% |
| 35 to 44 Years | 174 | 21.9% |
| 45 to 54 Years | 109 | 13.7% |
| 55 to 64 Years | 204 | 25.7% |
| 65 to 74 Years | 172 | 21.7% |
| 75 to 84 Years | 37 | 4.7% |
| 85 Years and Over | 30 | 3.8% |
| Total | 794 | 100.0% |
Housing Finances in East Pepperell
Median Income by Occupancy in East Pepperell
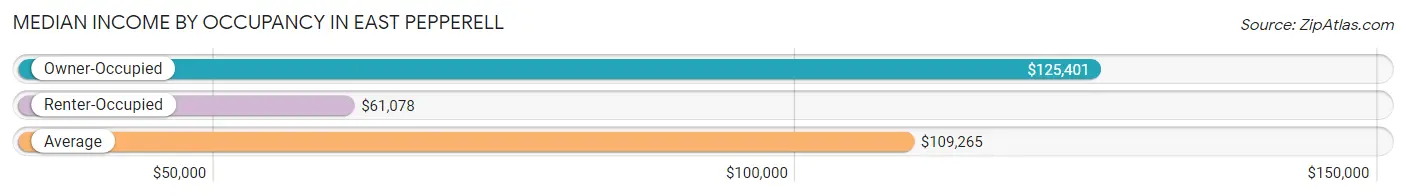
| Occupancy Type | # Households | Median Income |
| Owner-Occupied | 685 (86.3%) | $125,401 |
| Renter-Occupied | 109 (13.7%) | $61,078 |
| Average | 794 (100.0%) | $109,265 |
Occupancy by Householder Income Bracket in East Pepperell
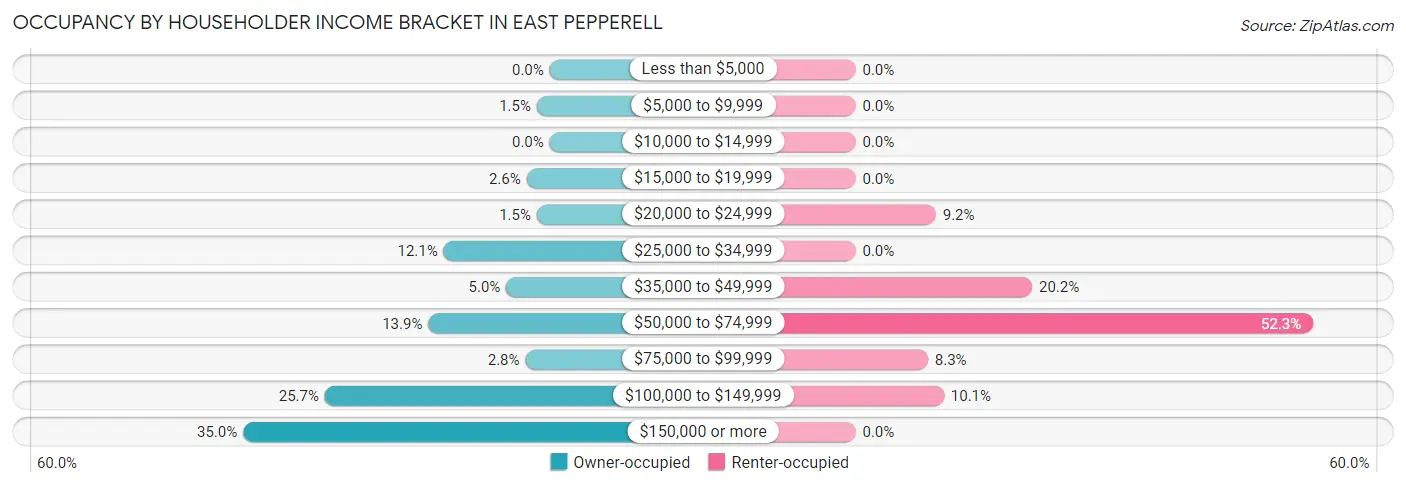
| Income Bracket | Owner-occupied | Renter-occupied |
| Less than $5,000 | 0 (0.0%) | 0 (0.0%) |
| $5,000 to $9,999 | 10 (1.5%) | 0 (0.0%) |
| $10,000 to $14,999 | 0 (0.0%) | 0 (0.0%) |
| $15,000 to $19,999 | 18 (2.6%) | 0 (0.0%) |
| $20,000 to $24,999 | 10 (1.5%) | 10 (9.2%) |
| $25,000 to $34,999 | 83 (12.1%) | 0 (0.0%) |
| $35,000 to $49,999 | 34 (5.0%) | 22 (20.2%) |
| $50,000 to $74,999 | 95 (13.9%) | 57 (52.3%) |
| $75,000 to $99,999 | 19 (2.8%) | 9 (8.3%) |
| $100,000 to $149,999 | 176 (25.7%) | 11 (10.1%) |
| $150,000 or more | 240 (35.0%) | 0 (0.0%) |
| Total | 685 (100.0%) | 109 (100.0%) |
Monthly Housing Cost Tiers in East Pepperell
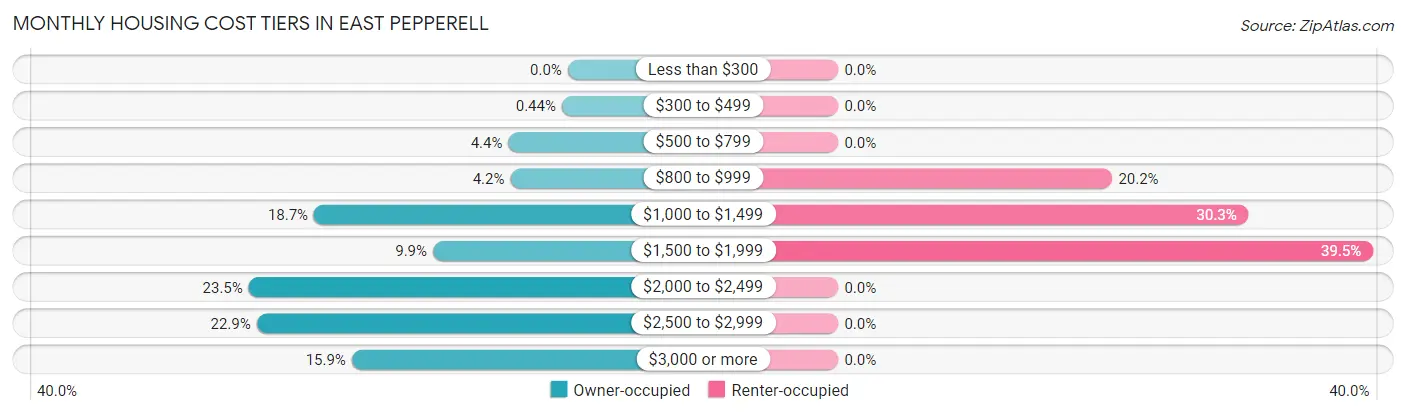
| Monthly Cost | Owner-occupied | Renter-occupied |
| Less than $300 | 0 (0.0%) | 0 (0.0%) |
| $300 to $499 | 3 (0.4%) | 0 (0.0%) |
| $500 to $799 | 30 (4.4%) | 0 (0.0%) |
| $800 to $999 | 29 (4.2%) | 22 (20.2%) |
| $1,000 to $1,499 | 128 (18.7%) | 33 (30.3%) |
| $1,500 to $1,999 | 68 (9.9%) | 43 (39.5%) |
| $2,000 to $2,499 | 161 (23.5%) | 0 (0.0%) |
| $2,500 to $2,999 | 157 (22.9%) | 0 (0.0%) |
| $3,000 or more | 109 (15.9%) | 0 (0.0%) |
| Total | 685 (100.0%) | 109 (100.0%) |
Physical Housing Characteristics in East Pepperell
Housing Structures in East Pepperell
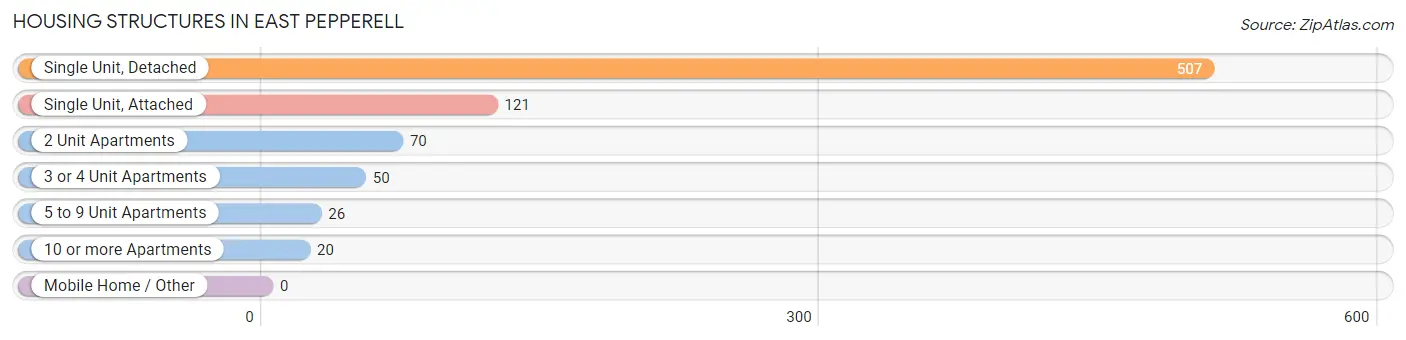
| Structure Type | # Housing Units | % Housing Units |
| Single Unit, Detached | 507 | 63.8% |
| Single Unit, Attached | 121 | 15.2% |
| 2 Unit Apartments | 70 | 8.8% |
| 3 or 4 Unit Apartments | 50 | 6.3% |
| 5 to 9 Unit Apartments | 26 | 3.3% |
| 10 or more Apartments | 20 | 2.5% |
| Mobile Home / Other | 0 | 0.0% |
| Total | 794 | 100.0% |
Housing Structures by Occupancy in East Pepperell
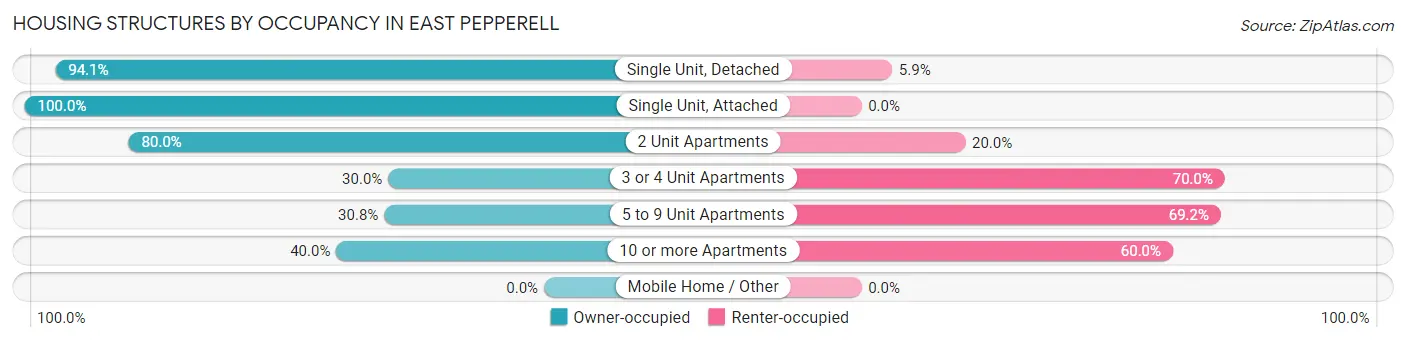
| Structure Type | Owner-occupied | Renter-occupied |
| Single Unit, Detached | 477 (94.1%) | 30 (5.9%) |
| Single Unit, Attached | 121 (100.0%) | 0 (0.0%) |
| 2 Unit Apartments | 56 (80.0%) | 14 (20.0%) |
| 3 or 4 Unit Apartments | 15 (30.0%) | 35 (70.0%) |
| 5 to 9 Unit Apartments | 8 (30.8%) | 18 (69.2%) |
| 10 or more Apartments | 8 (40.0%) | 12 (60.0%) |
| Mobile Home / Other | 0 (0.0%) | 0 (0.0%) |
| Total | 685 (86.3%) | 109 (13.7%) |
Housing Structures by Number of Rooms in East Pepperell
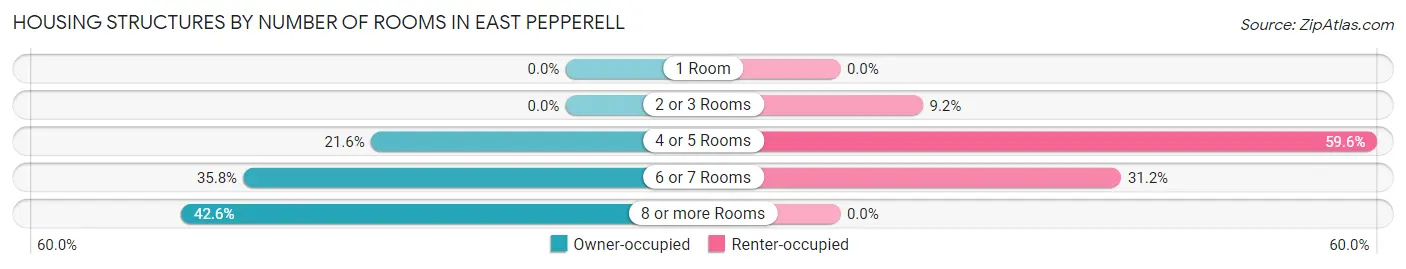
| Number of Rooms | Owner-occupied | Renter-occupied |
| 1 Room | 0 (0.0%) | 0 (0.0%) |
| 2 or 3 Rooms | 0 (0.0%) | 10 (9.2%) |
| 4 or 5 Rooms | 148 (21.6%) | 65 (59.6%) |
| 6 or 7 Rooms | 245 (35.8%) | 34 (31.2%) |
| 8 or more Rooms | 292 (42.6%) | 0 (0.0%) |
| Total | 685 (100.0%) | 109 (100.0%) |
Housing Structure by Heating Type in East Pepperell
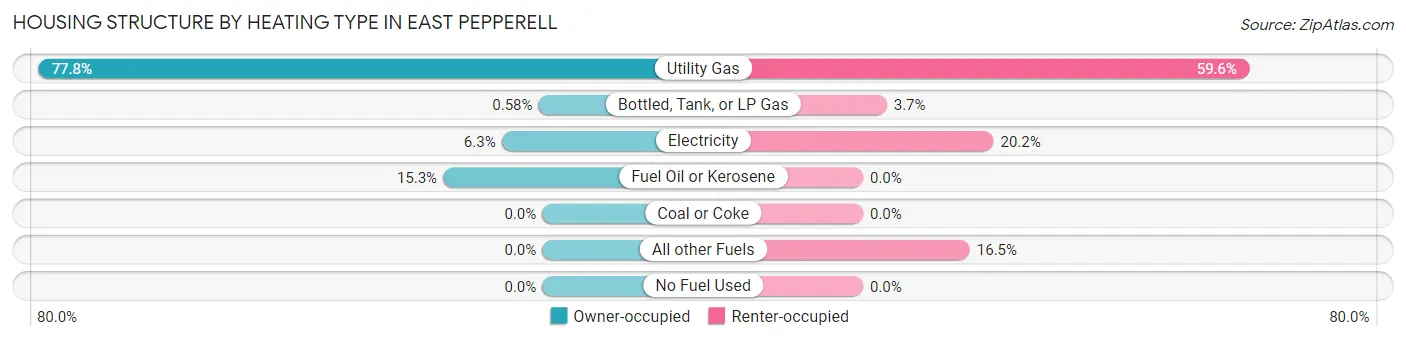
| Heating Type | Owner-occupied | Renter-occupied |
| Utility Gas | 533 (77.8%) | 65 (59.6%) |
| Bottled, Tank, or LP Gas | 4 (0.6%) | 4 (3.7%) |
| Electricity | 43 (6.3%) | 22 (20.2%) |
| Fuel Oil or Kerosene | 105 (15.3%) | 0 (0.0%) |
| Coal or Coke | 0 (0.0%) | 0 (0.0%) |
| All other Fuels | 0 (0.0%) | 18 (16.5%) |
| No Fuel Used | 0 (0.0%) | 0 (0.0%) |
| Total | 685 (100.0%) | 109 (100.0%) |
Household Vehicle Usage in East Pepperell
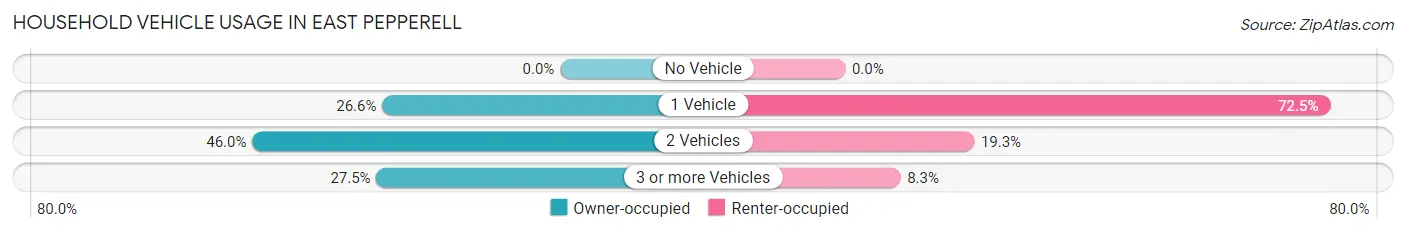
| Vehicles per Household | Owner-occupied | Renter-occupied |
| No Vehicle | 0 (0.0%) | 0 (0.0%) |
| 1 Vehicle | 182 (26.6%) | 79 (72.5%) |
| 2 Vehicles | 315 (46.0%) | 21 (19.3%) |
| 3 or more Vehicles | 188 (27.5%) | 9 (8.3%) |
| Total | 685 (100.0%) | 109 (100.0%) |
Real Estate & Mortgages in East Pepperell
Real Estate and Mortgage Overview in East Pepperell
| Characteristic | Without Mortgage | With Mortgage |
| Housing Units | 156 | 529 |
| Median Property Value | $375,700 | $400,600 |
| Median Household Income | $26,818 | $229 |
| Monthly Housing Costs | $1,175 | $62 |
| Real Estate Taxes | $5,523 | $0 |
Property Value by Mortgage Status in East Pepperell
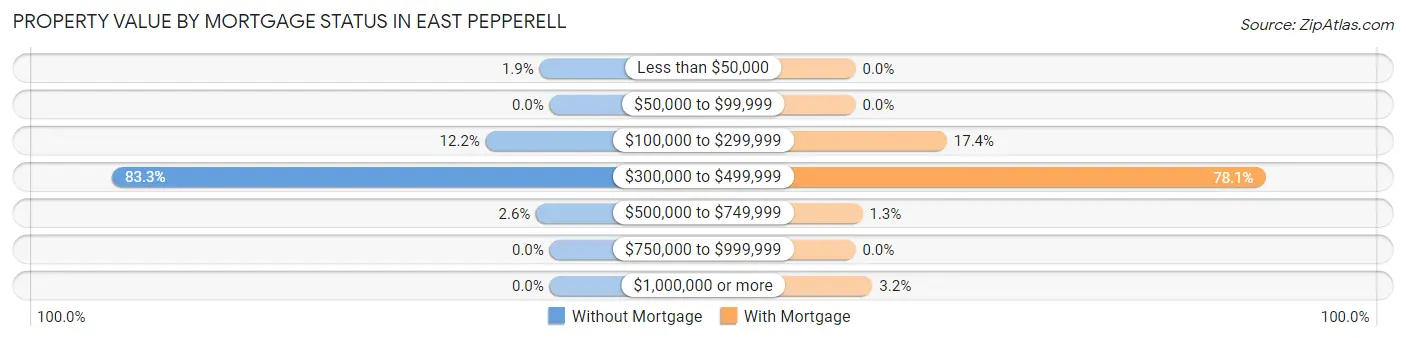
| Property Value | Without Mortgage | With Mortgage |
| Less than $50,000 | 3 (1.9%) | 0 (0.0%) |
| $50,000 to $99,999 | 0 (0.0%) | 0 (0.0%) |
| $100,000 to $299,999 | 19 (12.2%) | 92 (17.4%) |
| $300,000 to $499,999 | 130 (83.3%) | 413 (78.1%) |
| $500,000 to $749,999 | 4 (2.6%) | 7 (1.3%) |
| $750,000 to $999,999 | 0 (0.0%) | 0 (0.0%) |
| $1,000,000 or more | 0 (0.0%) | 17 (3.2%) |
| Total | 156 (100.0%) | 529 (100.0%) |
Household Income by Mortgage Status in East Pepperell
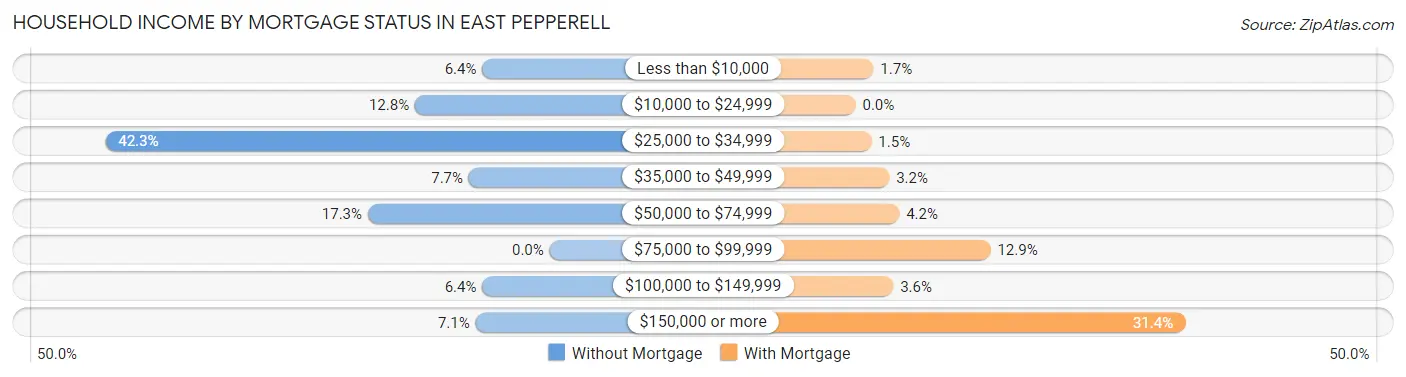
| Household Income | Without Mortgage | With Mortgage |
| Less than $10,000 | 10 (6.4%) | 9 (1.7%) |
| $10,000 to $24,999 | 20 (12.8%) | 0 (0.0%) |
| $25,000 to $34,999 | 66 (42.3%) | 8 (1.5%) |
| $35,000 to $49,999 | 12 (7.7%) | 17 (3.2%) |
| $50,000 to $74,999 | 27 (17.3%) | 22 (4.2%) |
| $75,000 to $99,999 | 0 (0.0%) | 68 (12.9%) |
| $100,000 to $149,999 | 10 (6.4%) | 19 (3.6%) |
| $150,000 or more | 11 (7.0%) | 166 (31.4%) |
| Total | 156 (100.0%) | 529 (100.0%) |
Property Value to Household Income Ratio in East Pepperell
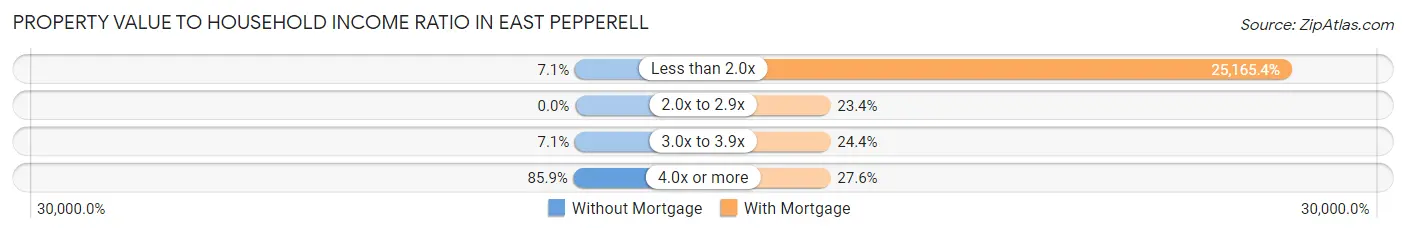
| Value-to-Income Ratio | Without Mortgage | With Mortgage |
| Less than 2.0x | 11 (7.0%) | 133,125 (25,165.4%) |
| 2.0x to 2.9x | 0 (0.0%) | 124 (23.4%) |
| 3.0x to 3.9x | 11 (7.0%) | 129 (24.4%) |
| 4.0x or more | 134 (85.9%) | 146 (27.6%) |
| Total | 156 (100.0%) | 529 (100.0%) |
Real Estate Taxes by Mortgage Status in East Pepperell
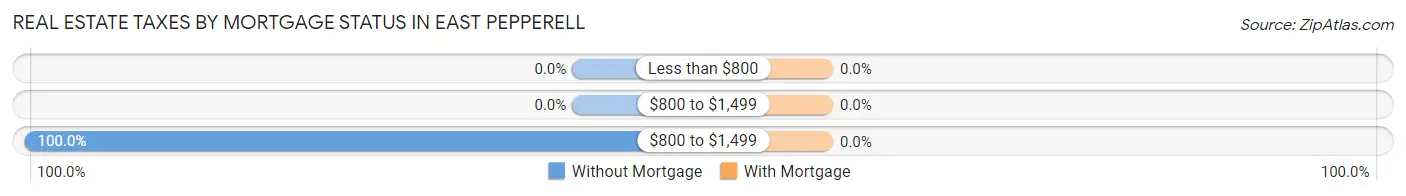
| Property Taxes | Without Mortgage | With Mortgage |
| Less than $800 | 0 (0.0%) | 0 (0.0%) |
| $800 to $1,499 | 0 (0.0%) | 0 (0.0%) |
| $800 to $1,499 | 156 (100.0%) | 0 (0.0%) |
| Total | 156 (100.0%) | 529 (100.0%) |
Health & Disability in East Pepperell
Health Insurance Coverage by Age in East Pepperell
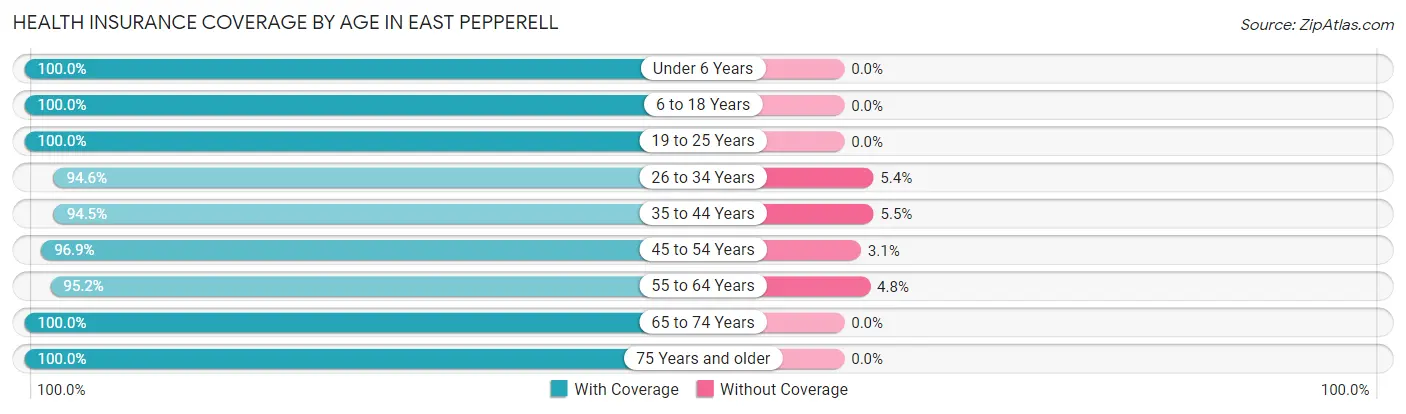
| Age Bracket | With Coverage | Without Coverage |
| Under 6 Years | 124 (100.0%) | 0 (0.0%) |
| 6 to 18 Years | 256 (100.0%) | 0 (0.0%) |
| 19 to 25 Years | 148 (100.0%) | 0 (0.0%) |
| 26 to 34 Years | 261 (94.6%) | 15 (5.4%) |
| 35 to 44 Years | 277 (94.5%) | 16 (5.5%) |
| 45 to 54 Years | 219 (96.9%) | 7 (3.1%) |
| 55 to 64 Years | 316 (95.2%) | 16 (4.8%) |
| 65 to 74 Years | 248 (100.0%) | 0 (0.0%) |
| 75 Years and older | 96 (100.0%) | 0 (0.0%) |
| Total | 1,945 (97.3%) | 54 (2.7%) |
Health Insurance Coverage by Citizenship Status in East Pepperell
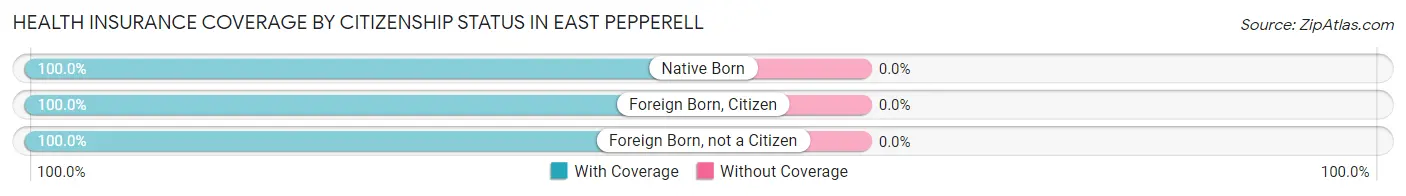
| Citizenship Status | With Coverage | Without Coverage |
| Native Born | 124 (100.0%) | 0 (0.0%) |
| Foreign Born, Citizen | 256 (100.0%) | 0 (0.0%) |
| Foreign Born, not a Citizen | 148 (100.0%) | 0 (0.0%) |
Health Insurance Coverage by Household Income in East Pepperell
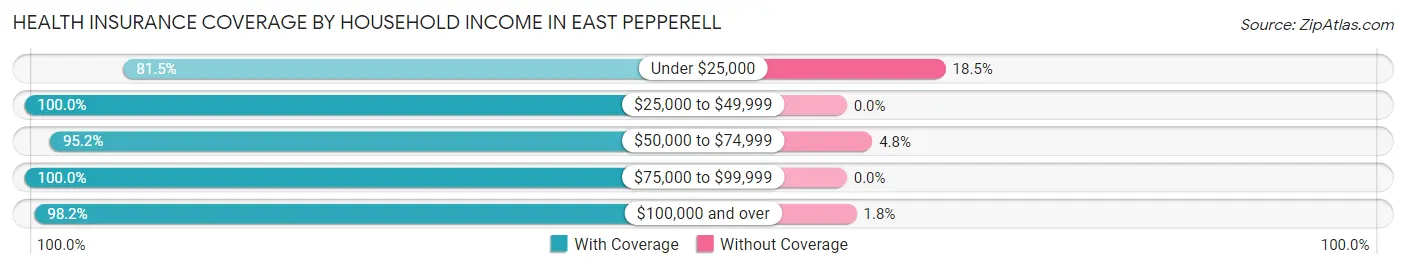
| Household Income | With Coverage | Without Coverage |
| Under $25,000 | 66 (81.5%) | 15 (18.5%) |
| $25,000 to $49,999 | 196 (100.0%) | 0 (0.0%) |
| $50,000 to $74,999 | 320 (95.2%) | 16 (4.8%) |
| $75,000 to $99,999 | 131 (100.0%) | 0 (0.0%) |
| $100,000 and over | 1,230 (98.2%) | 23 (1.8%) |
Public vs Private Health Insurance Coverage by Age in East Pepperell
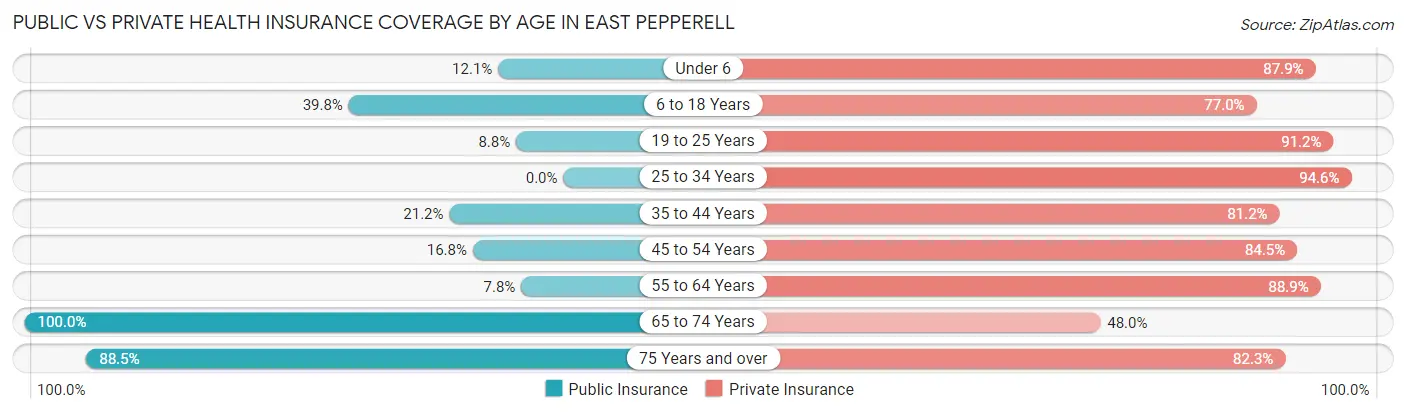
| Age Bracket | Public Insurance | Private Insurance |
| Under 6 | 15 (12.1%) | 109 (87.9%) |
| 6 to 18 Years | 102 (39.8%) | 197 (76.9%) |
| 19 to 25 Years | 13 (8.8%) | 135 (91.2%) |
| 25 to 34 Years | 0 (0.0%) | 261 (94.6%) |
| 35 to 44 Years | 62 (21.2%) | 238 (81.2%) |
| 45 to 54 Years | 38 (16.8%) | 191 (84.5%) |
| 55 to 64 Years | 26 (7.8%) | 295 (88.9%) |
| 65 to 74 Years | 248 (100.0%) | 119 (48.0%) |
| 75 Years and over | 85 (88.5%) | 79 (82.3%) |
| Total | 589 (29.5%) | 1,624 (81.2%) |
Disability Status by Sex by Age in East Pepperell
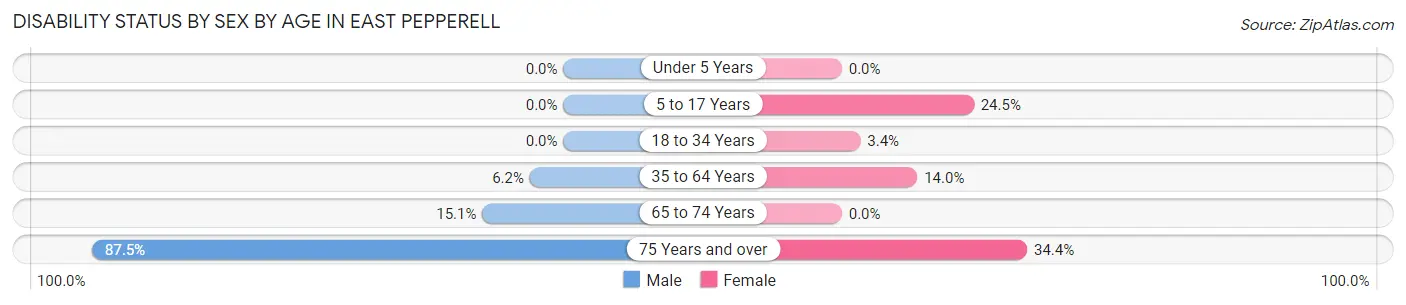
| Age Bracket | Male | Female |
| Under 5 Years | 0 (0.0%) | 0 (0.0%) |
| 5 to 17 Years | 0 (0.0%) | 36 (24.5%) |
| 18 to 34 Years | 0 (0.0%) | 10 (3.4%) |
| 35 to 64 Years | 25 (6.2%) | 63 (14.0%) |
| 65 to 74 Years | 14 (15.0%) | 0 (0.0%) |
| 75 Years and over | 56 (87.5%) | 11 (34.4%) |
Disability Class by Sex by Age in East Pepperell
Disability Class: Hearing Difficulty
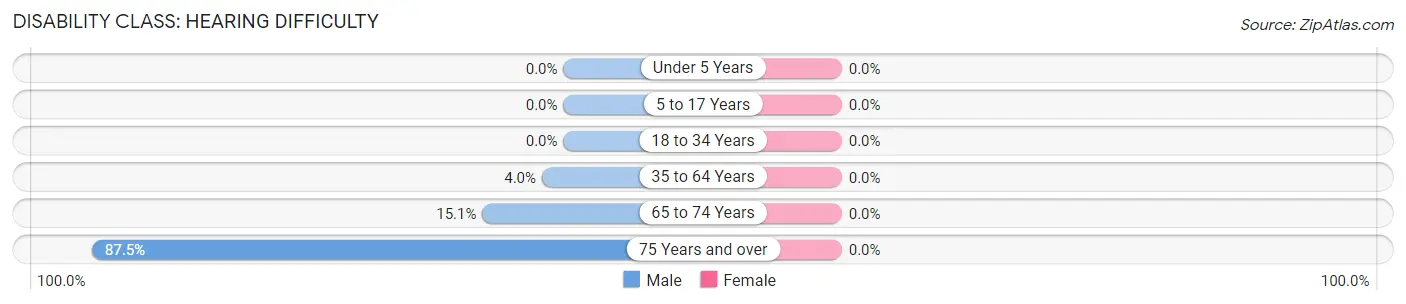
| Age Bracket | Male | Female |
| Under 5 Years | 0 (0.0%) | 0 (0.0%) |
| 5 to 17 Years | 0 (0.0%) | 0 (0.0%) |
| 18 to 34 Years | 0 (0.0%) | 0 (0.0%) |
| 35 to 64 Years | 16 (4.0%) | 0 (0.0%) |
| 65 to 74 Years | 14 (15.0%) | 0 (0.0%) |
| 75 Years and over | 56 (87.5%) | 0 (0.0%) |
Disability Class: Vision Difficulty
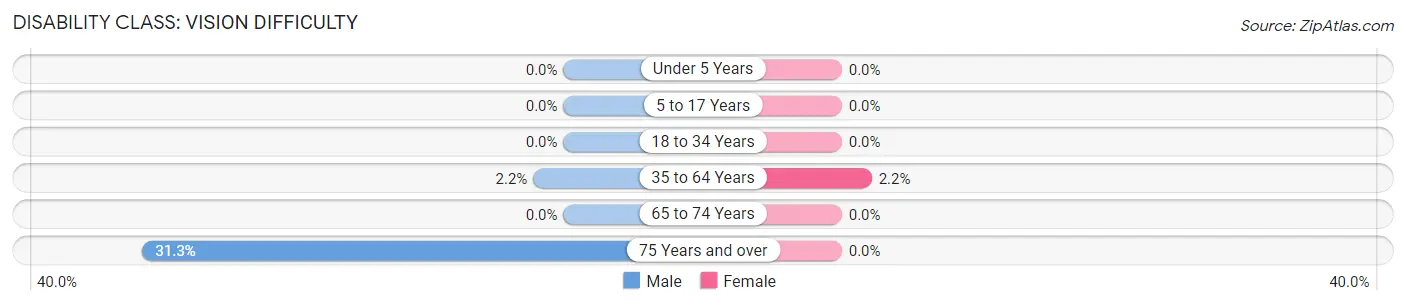
| Age Bracket | Male | Female |
| Under 5 Years | 0 (0.0%) | 0 (0.0%) |
| 5 to 17 Years | 0 (0.0%) | 0 (0.0%) |
| 18 to 34 Years | 0 (0.0%) | 0 (0.0%) |
| 35 to 64 Years | 9 (2.2%) | 10 (2.2%) |
| 65 to 74 Years | 0 (0.0%) | 0 (0.0%) |
| 75 Years and over | 20 (31.2%) | 0 (0.0%) |
Disability Class: Cognitive Difficulty
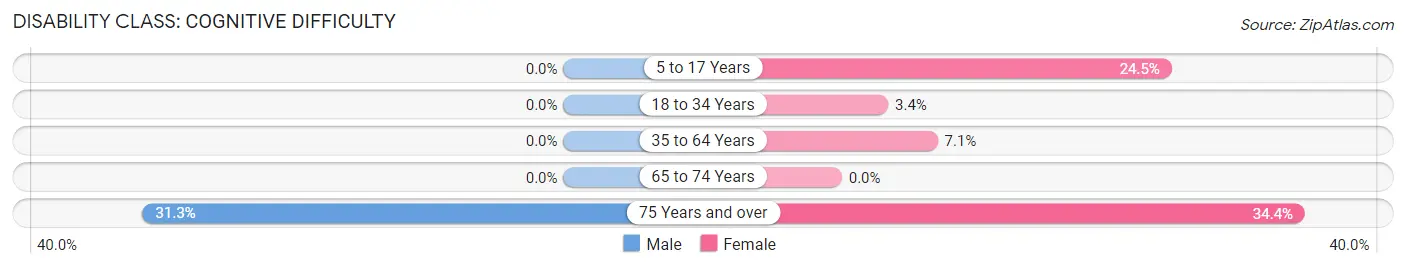
| Age Bracket | Male | Female |
| 5 to 17 Years | 0 (0.0%) | 36 (24.5%) |
| 18 to 34 Years | 0 (0.0%) | 10 (3.4%) |
| 35 to 64 Years | 0 (0.0%) | 32 (7.1%) |
| 65 to 74 Years | 0 (0.0%) | 0 (0.0%) |
| 75 Years and over | 20 (31.2%) | 11 (34.4%) |
Disability Class: Ambulatory Difficulty
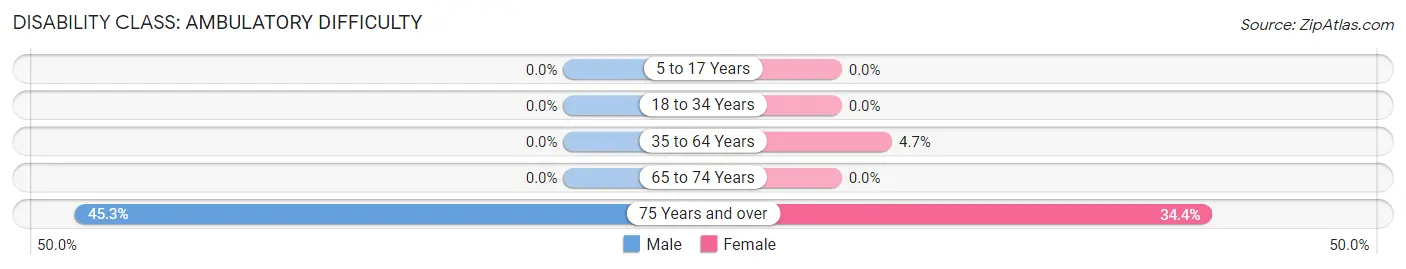
| Age Bracket | Male | Female |
| 5 to 17 Years | 0 (0.0%) | 0 (0.0%) |
| 18 to 34 Years | 0 (0.0%) | 0 (0.0%) |
| 35 to 64 Years | 0 (0.0%) | 21 (4.7%) |
| 65 to 74 Years | 0 (0.0%) | 0 (0.0%) |
| 75 Years and over | 29 (45.3%) | 11 (34.4%) |
Disability Class: Self-Care Difficulty
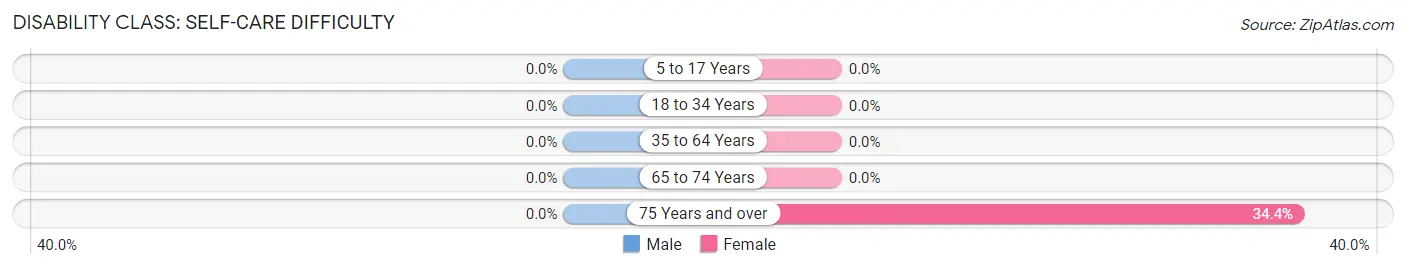
| Age Bracket | Male | Female |
| 5 to 17 Years | 0 (0.0%) | 0 (0.0%) |
| 18 to 34 Years | 0 (0.0%) | 0 (0.0%) |
| 35 to 64 Years | 0 (0.0%) | 0 (0.0%) |
| 65 to 74 Years | 0 (0.0%) | 0 (0.0%) |
| 75 Years and over | 0 (0.0%) | 11 (34.4%) |
Technology Access in East Pepperell
Computing Device Access in East Pepperell
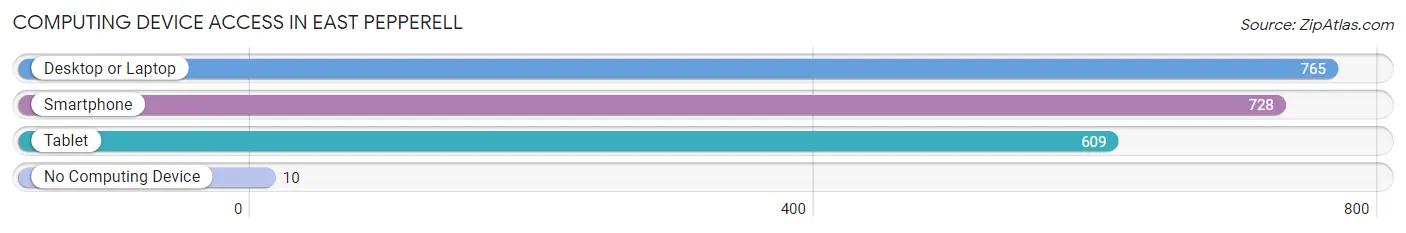
| Device Type | # Households | % Households |
| Desktop or Laptop | 765 | 96.4% |
| Smartphone | 728 | 91.7% |
| Tablet | 609 | 76.7% |
| No Computing Device | 10 | 1.3% |
| Total | 794 | 100.0% |
Internet Access in East Pepperell
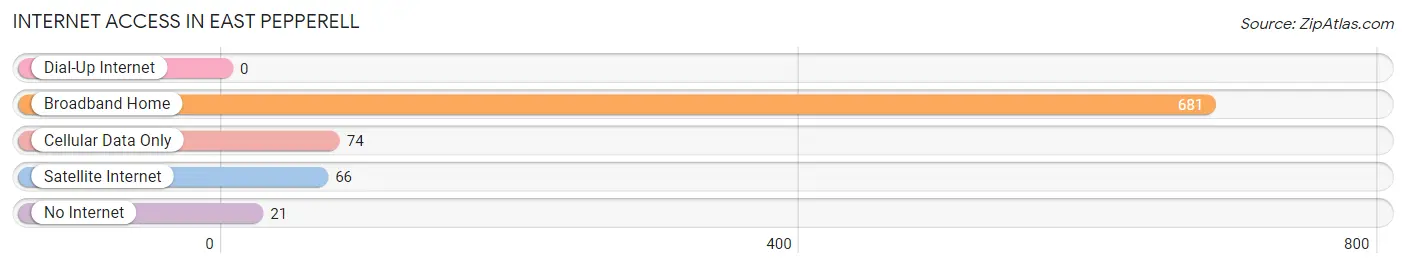
| Internet Type | # Households | % Households |
| Dial-Up Internet | 0 | 0.0% |
| Broadband Home | 681 | 85.8% |
| Cellular Data Only | 74 | 9.3% |
| Satellite Internet | 66 | 8.3% |
| No Internet | 21 | 2.6% |
| Total | 794 | 100.0% |
East Pepperell Summary
East Pepperell is a small town located in the northeastern part of Massachusetts, in Middlesex County. It is bordered by the towns of Groton, Townsend, and Dunstable. The town has a population of approximately 4,000 people, and is located about 25 miles northwest of Boston.
History
East Pepperell was first settled in 1720 by a group of settlers from Groton, Massachusetts. The town was originally known as "Groton East Parish" and was incorporated in 1753. The town was named after the Pepperell family, who were prominent landowners in the area.
The town was primarily an agricultural community until the mid-19th century, when the railroad was built through the town. This allowed for the development of industry in the area, and the town became known for its shoe and textile factories. The town also had a thriving lumber industry, and was home to several sawmills.
Geography
East Pepperell is located in northeastern Massachusetts, in Middlesex County. It is bordered by the towns of Groton, Townsend, and Dunstable. The town is located about 25 miles northwest of Boston.
The town is located in the Merrimack Valley region of Massachusetts, and is situated on the Nashua River. The town is mostly rural, with a few small villages scattered throughout. The town is mostly flat, with some rolling hills in the northern part of town.
Economy
East Pepperell is a primarily residential community, with a few small businesses located in the town. The town is home to several small manufacturing companies, including a plastics manufacturer and a machine shop. The town also has a few retail stores, including a grocery store and a hardware store.
The town is also home to a few small farms, which produce a variety of fruits and vegetables. The town is also home to a few wineries, which produce a variety of wines.
Demographics
As of the 2010 census, the population of East Pepperell was 4,000 people. The town is predominantly white, with a small percentage of African Americans, Hispanics, and Asians. The median household income in the town is $68,000, and the median home value is $310,000.
The town is served by the Nashoba Valley Technical High School, which serves students from the towns of Groton, Townsend, and Dunstable. The town also has a public library, which is located in the center of town.
East Pepperell is a small, rural town with a rich history and a strong sense of community. The town is home to a variety of businesses, and is a great place to live and work. The town is also home to a variety of recreational activities, including hiking, fishing, and camping.
Common Questions
What is Per Capita Income in East Pepperell?
Per Capita income in East Pepperell is $45,357.
What is the Median Family Income in East Pepperell?
Median Family Income in East Pepperell is $126,627.
What is the Median Household income in East Pepperell?
Median Household Income in East Pepperell is $109,265.
What is Income or Wage Gap in East Pepperell?
Income or Wage Gap in East Pepperell is 44.6%.
Women in East Pepperell earn 55.4 cents for every dollar earned by a man.
What is Inequality or Gini Index in East Pepperell?
Inequality or Gini Index in East Pepperell is 0.37.
What is the Total Population of East Pepperell?
Total Population of East Pepperell is 1,999.
What is the Total Male Population of East Pepperell?
Total Male Population of East Pepperell is 903.
What is the Total Female Population of East Pepperell?
Total Female Population of East Pepperell is 1,096.
What is the Ratio of Males per 100 Females in East Pepperell?
There are 82.39 Males per 100 Females in East Pepperell.
What is the Ratio of Females per 100 Males in East Pepperell?
There are 121.37 Females per 100 Males in East Pepperell.
What is the Median Population Age in East Pepperell?
Median Population Age in East Pepperell is 41.4 Years.
What is the Average Family Size in East Pepperell
Average Family Size in East Pepperell is 3.1 People.
What is the Average Household Size in East Pepperell
Average Household Size in East Pepperell is 2.5 People.
How Large is the Labor Force in East Pepperell?
There are 1,127 People in the Labor Forcein in East Pepperell.
What is the Percentage of People in the Labor Force in East Pepperell?
66.7% of People are in the Labor Force in East Pepperell.
What is the Unemployment Rate in East Pepperell?
Unemployment Rate in East Pepperell is 4.5%.