Roselle, IL Map & Demographics
Roselle Map
Roselle Overview
$49,099
PER CAPITA INCOME
$124,936
AVG FAMILY INCOME
$104,167
AVG HOUSEHOLD INCOME
35.5%
WAGE / INCOME GAP [ % ]
64.5¢/ $1
WAGE / INCOME GAP [ $ ]
0.40
INEQUALITY / GINI INDEX
22,846
TOTAL POPULATION
10,970
MALE POPULATION
11,876
FEMALE POPULATION
92.37
MALES / 100 FEMALES
108.26
FEMALES / 100 MALES
42.2
MEDIAN AGE
3.1
AVG FAMILY SIZE
2.6
AVG HOUSEHOLD SIZE
13,341
LABOR FORCE [ PEOPLE ]
70.5%
PERCENT IN LABOR FORCE
7.3%
UNEMPLOYMENT RATE
Roselle Zip Codes
Income in Roselle
Income Overview in Roselle
Per Capita Income in Roselle is $49,099, while median incomes of families and households are $124,936 and $104,167 respectively.
| Characteristic | Number | Measure |
| Per Capita Income | 22,846 | $49,099 |
| Median Family Income | 6,213 | $124,936 |
| Mean Family Income | 6,213 | $142,570 |
| Median Household Income | 8,668 | $104,167 |
| Mean Household Income | 8,668 | $127,343 |
| Income Deficit | 6,213 | $0 |
| Wage / Income Gap (%) | 22,846 | 35.52% |
| Wage / Income Gap ($) | 22,846 | 64.48¢ per $1 |
| Gini / Inequality Index | 22,846 | 0.40 |
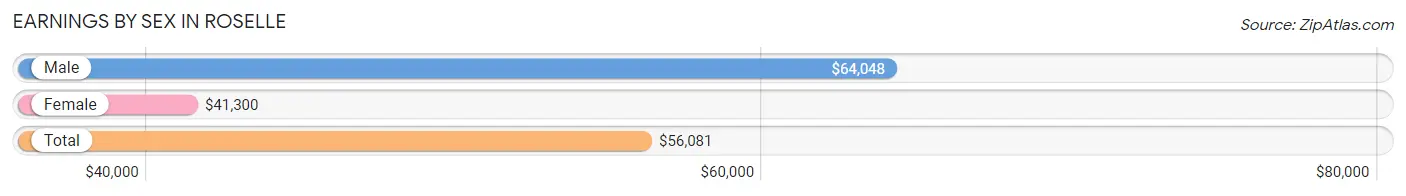
Earnings by Sex in Roselle
Average Earnings in Roselle are $56,081, $64,048 for men and $41,300 for women, a difference of 35.5%.
| Sex | Number | Average Earnings |
| Male | 7,336 (53.2%) | $64,048 |
| Female | 6,459 (46.8%) | $41,300 |
| Total | 13,795 (100.0%) | $56,081 |
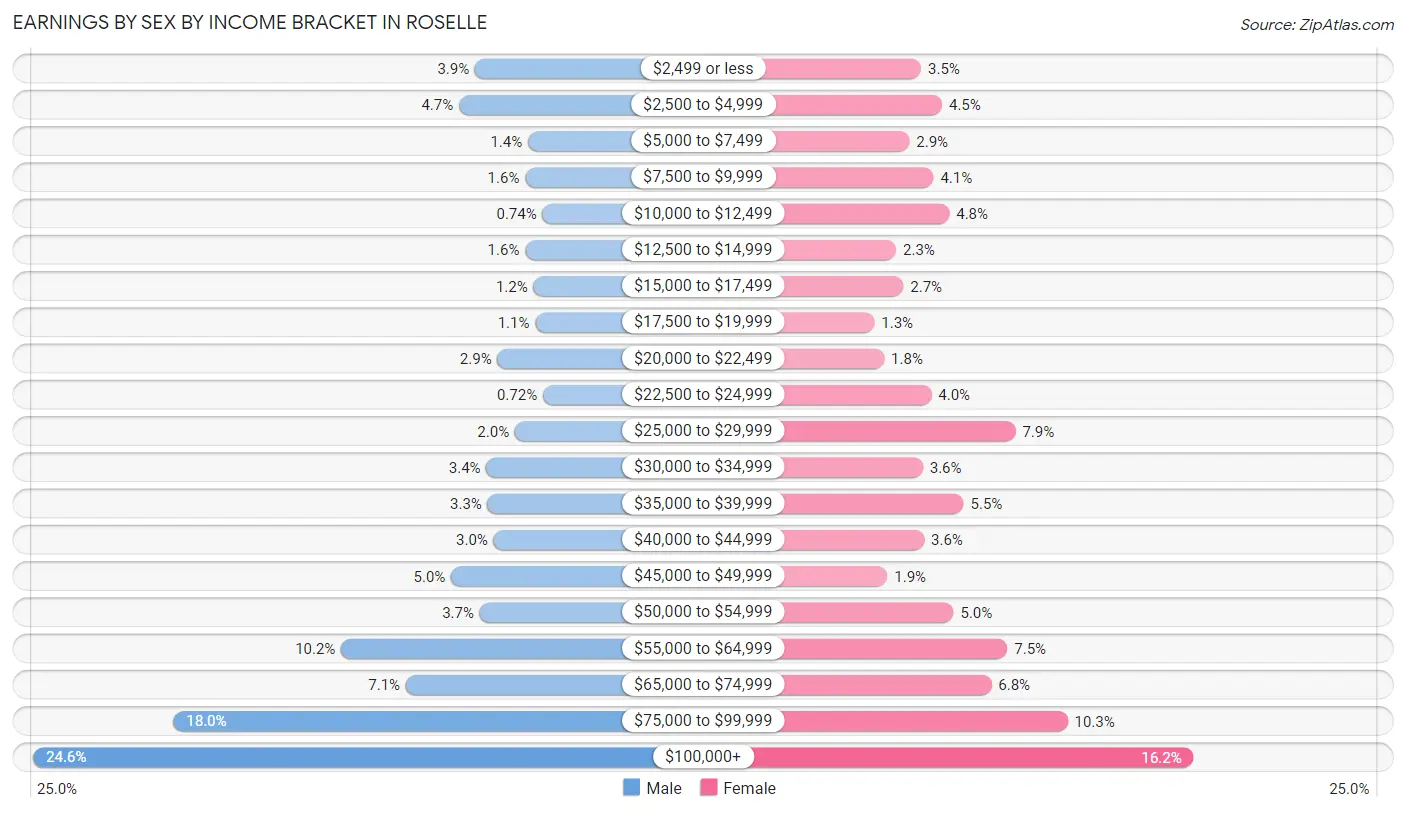
Earnings by Sex by Income Bracket in Roselle
The most common earnings brackets in Roselle are $100,000+ for men (1,805 | 24.6%) and $100,000+ for women (1,049 | 16.2%).
| Income | Male | Female |
| $2,499 or less | 286 (3.9%) | 225 (3.5%) |
| $2,500 to $4,999 | 341 (4.6%) | 288 (4.5%) |
| $5,000 to $7,499 | 104 (1.4%) | 189 (2.9%) |
| $7,500 to $9,999 | 114 (1.5%) | 262 (4.1%) |
| $10,000 to $12,499 | 54 (0.7%) | 310 (4.8%) |
| $12,500 to $14,999 | 114 (1.5%) | 149 (2.3%) |
| $15,000 to $17,499 | 85 (1.2%) | 171 (2.6%) |
| $17,500 to $19,999 | 79 (1.1%) | 83 (1.3%) |
| $20,000 to $22,499 | 209 (2.9%) | 113 (1.8%) |
| $22,500 to $24,999 | 53 (0.7%) | 256 (4.0%) |
| $25,000 to $29,999 | 149 (2.0%) | 510 (7.9%) |
| $30,000 to $34,999 | 247 (3.4%) | 230 (3.6%) |
| $35,000 to $39,999 | 243 (3.3%) | 353 (5.5%) |
| $40,000 to $44,999 | 222 (3.0%) | 234 (3.6%) |
| $45,000 to $49,999 | 368 (5.0%) | 123 (1.9%) |
| $50,000 to $54,999 | 270 (3.7%) | 323 (5.0%) |
| $55,000 to $64,999 | 746 (10.2%) | 486 (7.5%) |
| $65,000 to $74,999 | 524 (7.1%) | 437 (6.8%) |
| $75,000 to $99,999 | 1,323 (18.0%) | 668 (10.3%) |
| $100,000+ | 1,805 (24.6%) | 1,049 (16.2%) |
| Total | 7,336 (100.0%) | 6,459 (100.0%) |
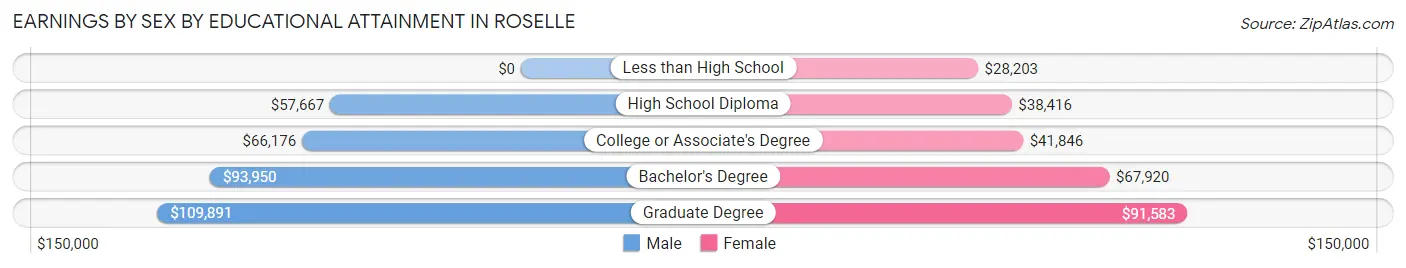
Earnings by Sex by Educational Attainment in Roselle
Average earnings in Roselle are $71,893 for men and $53,400 for women, a difference of 25.7%. Men with an educational attainment of graduate degree enjoy the highest average annual earnings of $109,891, while those with high school diploma education earn the least with $57,667. Women with an educational attainment of graduate degree earn the most with the average annual earnings of $91,583, while those with less than high school education have the smallest earnings of $28,203.
| Educational Attainment | Male Income | Female Income |
| Less than High School | - | - |
| High School Diploma | $57,667 | $38,416 |
| College or Associate's Degree | $66,176 | $41,846 |
| Bachelor's Degree | $93,950 | $67,920 |
| Graduate Degree | $109,891 | $91,583 |
| Total | $71,893 | $53,400 |
Family Income in Roselle
Family Income Brackets in Roselle
According to the Roselle family income data, there are 1,485 families falling into the $100,000 to $149,999 income range, which is the most common income bracket and makes up 23.9% of all families.
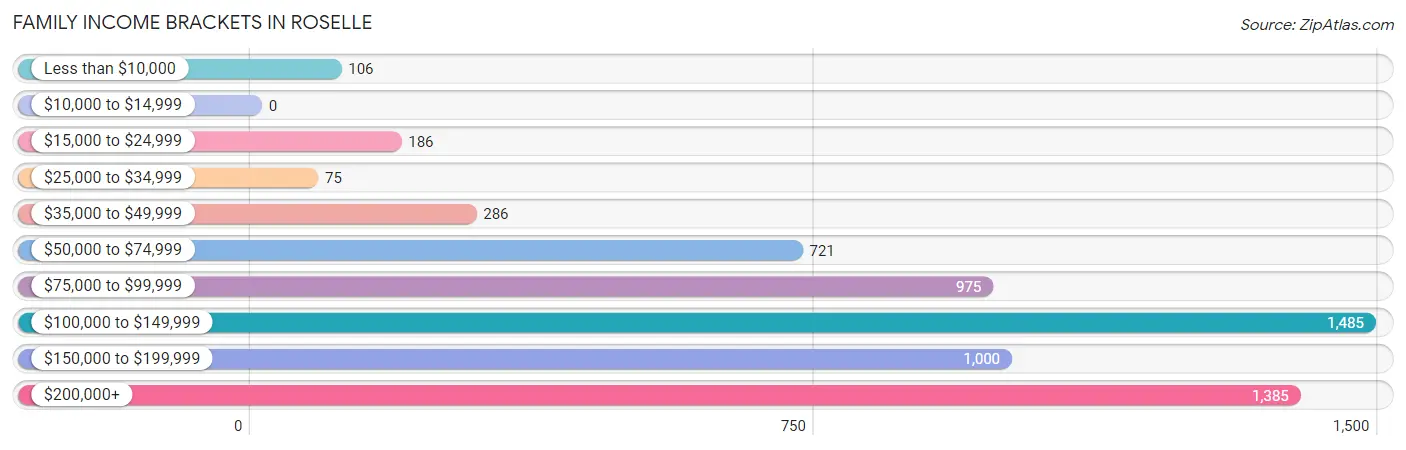
| Income Bracket | # Families | % Families |
| Less than $10,000 | 106 | 1.7% |
| $10,000 to $14,999 | 0 | 0.0% |
| $15,000 to $24,999 | 186 | 3.0% |
| $25,000 to $34,999 | 75 | 1.2% |
| $35,000 to $49,999 | 286 | 4.6% |
| $50,000 to $74,999 | 721 | 11.6% |
| $75,000 to $99,999 | 975 | 15.7% |
| $100,000 to $149,999 | 1,485 | 23.9% |
| $150,000 to $199,999 | 1,000 | 16.1% |
| $200,000+ | 1,385 | 22.3% |
Family Income by Famaliy Size in Roselle
6-person families (112 | 1.8%) account for the highest median family income in Roselle with $219,571 per family, while 2-person families (2,605 | 41.9%) have the highest median income of $45,651 per family member.
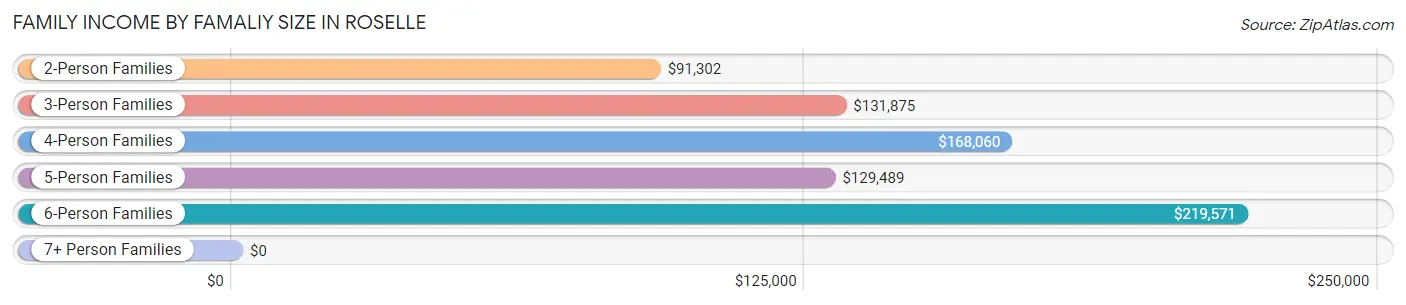
| Income Bracket | # Families | Median Income |
| 2-Person Families | 2,605 (41.9%) | $91,302 |
| 3-Person Families | 1,517 (24.4%) | $131,875 |
| 4-Person Families | 1,463 (23.5%) | $168,060 |
| 5-Person Families | 477 (7.7%) | $129,489 |
| 6-Person Families | 112 (1.8%) | $219,571 |
| 7+ Person Families | 39 (0.6%) | $0 |
| Total | 6,213 (100.0%) | $124,936 |
Family Income by Number of Earners in Roselle
The median family income in Roselle is $124,936, with families comprising 3+ earners (1,238) having the highest median family income of $176,250, while families with no earners (827) have the lowest median family income of $67,176, accounting for 19.9% and 13.3% of families, respectively.
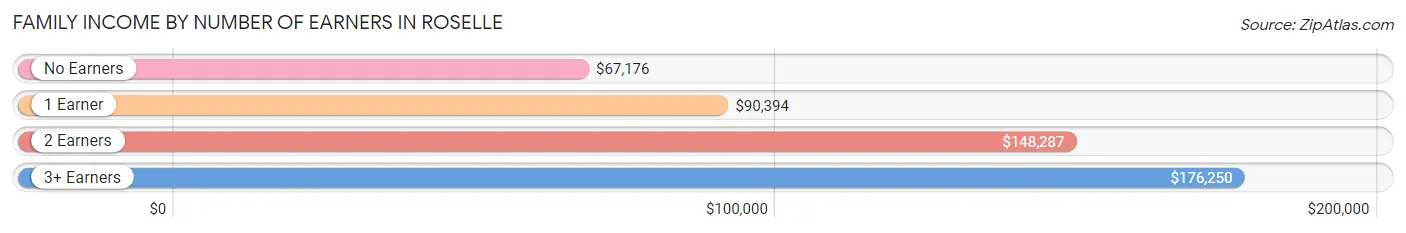
| Number of Earners | # Families | Median Income |
| No Earners | 827 (13.3%) | $67,176 |
| 1 Earner | 1,449 (23.3%) | $90,394 |
| 2 Earners | 2,699 (43.4%) | $148,287 |
| 3+ Earners | 1,238 (19.9%) | $176,250 |
| Total | 6,213 (100.0%) | $124,936 |
Household Income in Roselle
Household Income Brackets in Roselle
With 1,864 households falling in the category, the $100,000 to $149,999 income range is the most frequent in Roselle, accounting for 21.5% of all households. In contrast, only 147 households (1.7%) fall into the $10,000 to $14,999 income bracket, making it the least populous group.
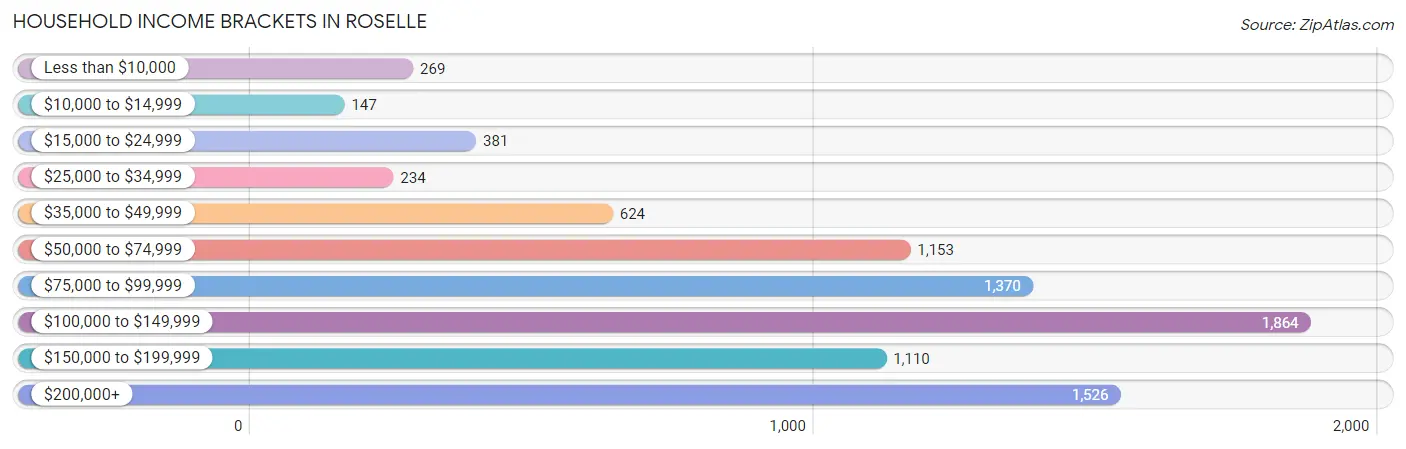
| Income Bracket | # Households | % Households |
| Less than $10,000 | 269 | 3.1% |
| $10,000 to $14,999 | 147 | 1.7% |
| $15,000 to $24,999 | 381 | 4.4% |
| $25,000 to $34,999 | 234 | 2.7% |
| $35,000 to $49,999 | 624 | 7.2% |
| $50,000 to $74,999 | 1,153 | 13.3% |
| $75,000 to $99,999 | 1,370 | 15.8% |
| $100,000 to $149,999 | 1,864 | 21.5% |
| $150,000 to $199,999 | 1,110 | 12.8% |
| $200,000+ | 1,526 | 17.6% |
Household Income by Householder Age in Roselle
The median household income in Roselle is $104,167, with the highest median household income of $121,182 found in the 25 to 44 years age bracket for the primary householder. A total of 2,665 households (30.7%) fall into this category. Meanwhile, the 15 to 24 years age bracket for the primary householder has the lowest median household income of $44,858, with 137 households (1.6%) in this group.
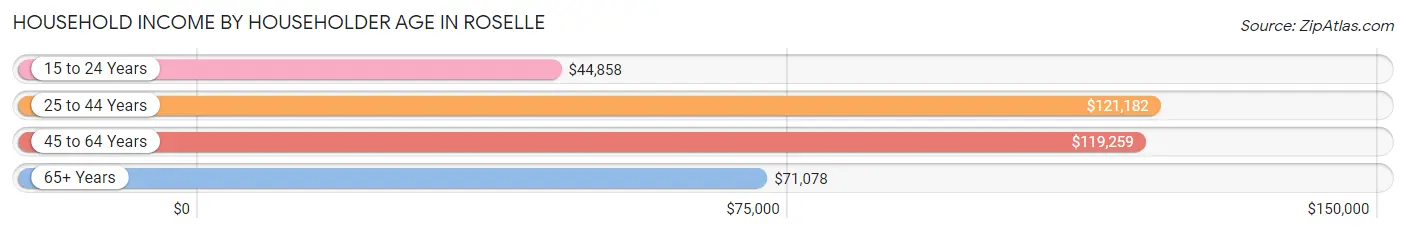
| Income Bracket | # Households | Median Income |
| 15 to 24 Years | 137 (1.6%) | $44,858 |
| 25 to 44 Years | 2,665 (30.7%) | $121,182 |
| 45 to 64 Years | 3,742 (43.2%) | $119,259 |
| 65+ Years | 2,124 (24.5%) | $71,078 |
| Total | 8,668 (100.0%) | $104,167 |
Poverty in Roselle
Income Below Poverty by Sex and Age in Roselle
With 2.7% poverty level for males and 3.7% for females among the residents of Roselle, 75 year old and over males and 55 to 64 year old females are the most vulnerable to poverty, with 82 males (9.8%) and 164 females (9.1%) in their respective age groups living below the poverty level.
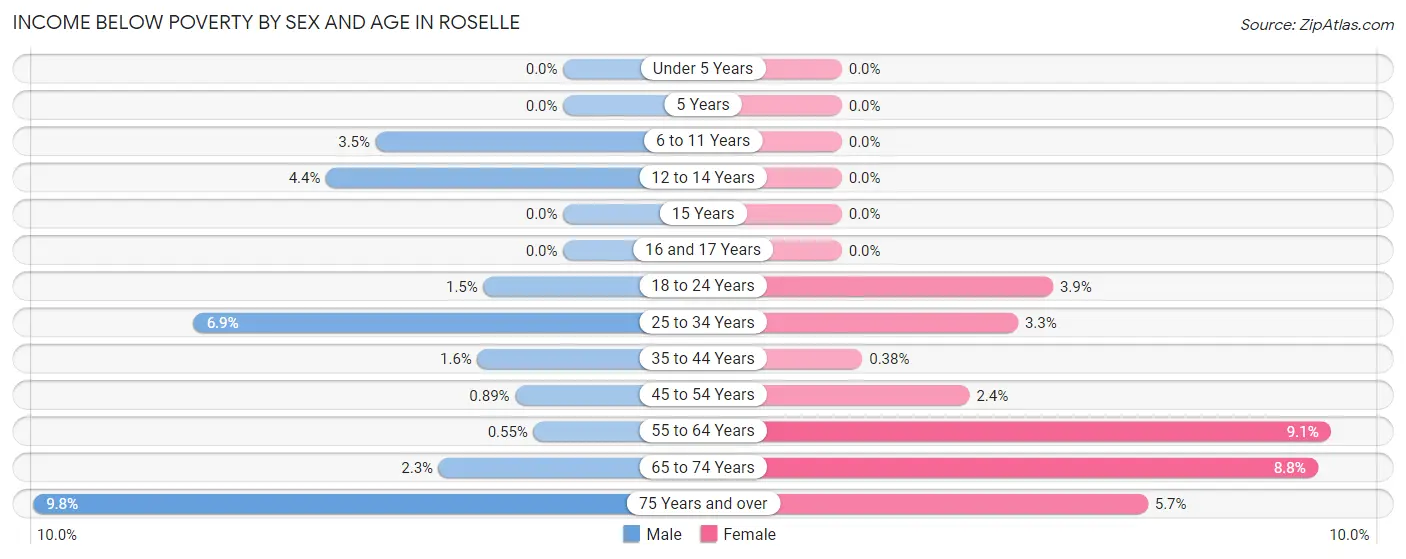
| Age Bracket | Male | Female |
| Under 5 Years | 0 (0.0%) | 0 (0.0%) |
| 5 Years | 0 (0.0%) | 0 (0.0%) |
| 6 to 11 Years | 22 (3.5%) | 0 (0.0%) |
| 12 to 14 Years | 16 (4.4%) | 0 (0.0%) |
| 15 Years | 0 (0.0%) | 0 (0.0%) |
| 16 and 17 Years | 0 (0.0%) | 0 (0.0%) |
| 18 to 24 Years | 13 (1.5%) | 43 (3.9%) |
| 25 to 34 Years | 86 (6.9%) | 40 (3.3%) |
| 35 to 44 Years | 29 (1.6%) | 6 (0.4%) |
| 45 to 54 Years | 15 (0.9%) | 41 (2.4%) |
| 55 to 64 Years | 8 (0.5%) | 164 (9.1%) |
| 65 to 74 Years | 21 (2.3%) | 90 (8.8%) |
| 75 Years and over | 82 (9.8%) | 58 (5.7%) |
| Total | 292 (2.7%) | 442 (3.7%) |
Income Above Poverty by Sex and Age in Roselle
According to the poverty statistics in Roselle, males aged under 5 years and females aged under 5 years are the age groups that are most secure financially, with 100.0% of males and 100.0% of females in these age groups living above the poverty line.
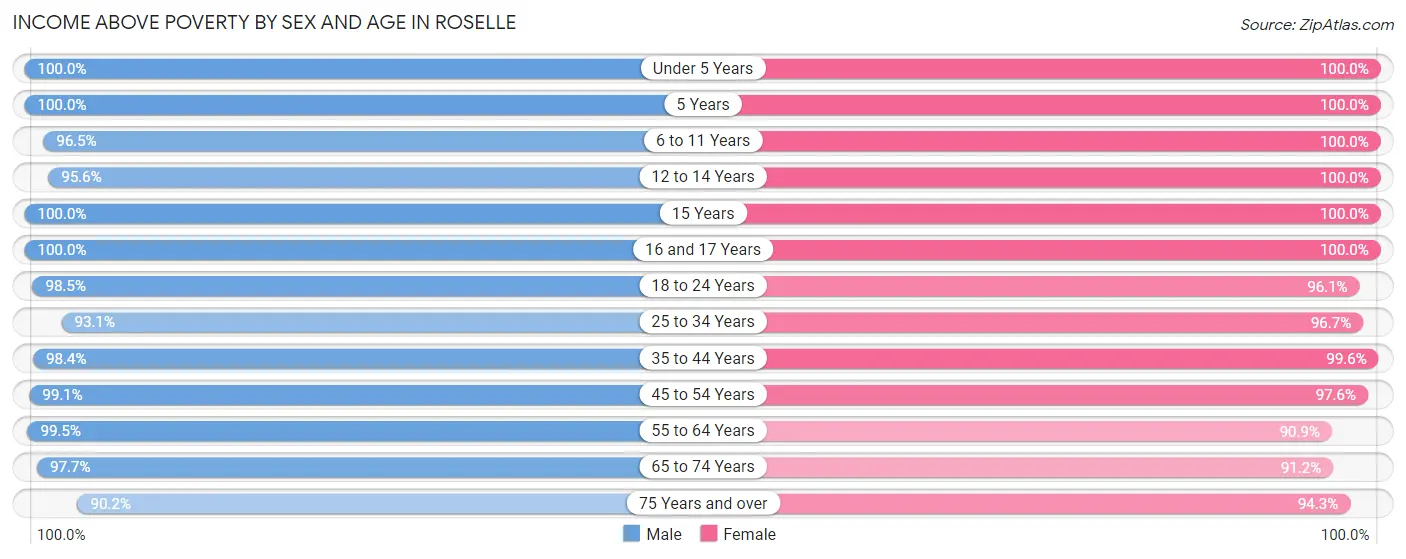
| Age Bracket | Male | Female |
| Under 5 Years | 323 (100.0%) | 549 (100.0%) |
| 5 Years | 77 (100.0%) | 185 (100.0%) |
| 6 to 11 Years | 611 (96.5%) | 1,035 (100.0%) |
| 12 to 14 Years | 348 (95.6%) | 252 (100.0%) |
| 15 Years | 375 (100.0%) | 115 (100.0%) |
| 16 and 17 Years | 335 (100.0%) | 209 (100.0%) |
| 18 to 24 Years | 865 (98.5%) | 1,054 (96.1%) |
| 25 to 34 Years | 1,168 (93.1%) | 1,185 (96.7%) |
| 35 to 44 Years | 1,793 (98.4%) | 1,562 (99.6%) |
| 45 to 54 Years | 1,662 (99.1%) | 1,689 (97.6%) |
| 55 to 64 Years | 1,455 (99.5%) | 1,645 (90.9%) |
| 65 to 74 Years | 890 (97.7%) | 929 (91.2%) |
| 75 Years and over | 751 (90.2%) | 963 (94.3%) |
| Total | 10,653 (97.3%) | 11,372 (96.3%) |
Income Below Poverty Among Married-Couple Families in Roselle
The poverty statistics for married-couple families in Roselle show that 1.5% or 81 of the total 5,278 families live below the poverty line. Families with no children have the highest poverty rate of 2.1%, comprising of 66 families. On the other hand, families with 3 or 4 children have the lowest poverty rate of 0.0%, which includes 0 families.
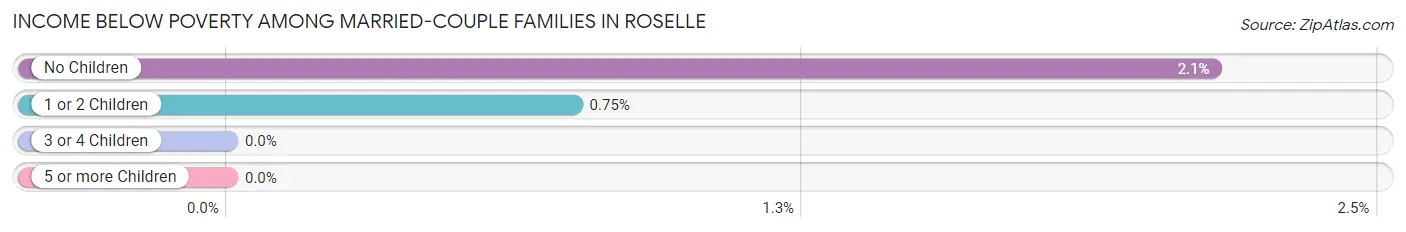
| Children | Above Poverty | Below Poverty |
| No Children | 3,025 (97.9%) | 66 (2.1%) |
| 1 or 2 Children | 1,990 (99.3%) | 15 (0.7%) |
| 3 or 4 Children | 182 (100.0%) | 0 (0.0%) |
| 5 or more Children | 0 (0.0%) | 0 (0.0%) |
| Total | 5,197 (98.5%) | 81 (1.5%) |
Income Below Poverty Among Single-Parent Households in Roselle
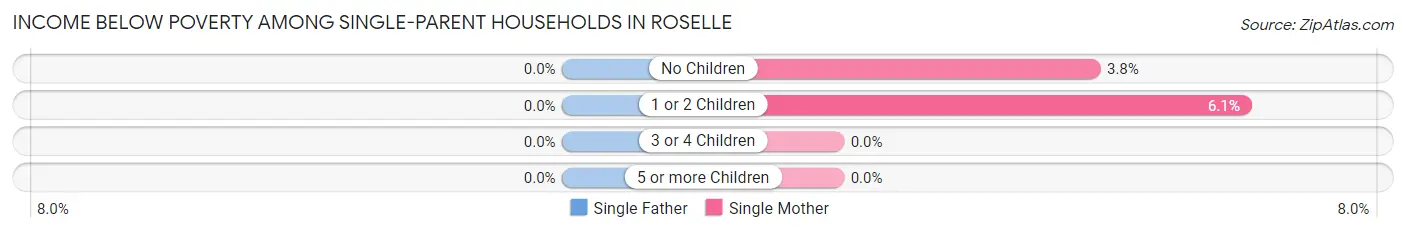
| Children | Single Father | Single Mother |
| No Children | 0 (0.0%) | 13 (3.8%) |
| 1 or 2 Children | 0 (0.0%) | 22 (6.1%) |
| 3 or 4 Children | 0 (0.0%) | 0 (0.0%) |
| 5 or more Children | 0 (0.0%) | 0 (0.0%) |
| Total | 0 (0.0%) | 35 (5.0%) |
Income Below Poverty Among Married-Couple vs Single-Parent Households in Roselle
The poverty data for Roselle shows that 81 of the married-couple family households (1.5%) and 35 of the single-parent households (3.7%) are living below the poverty level. Within the married-couple family households, those with no children have the highest poverty rate, with 66 households (2.1%) falling below the poverty line. Among the single-parent households, those with 1 or 2 children have the highest poverty rate, with 22 household (5.3%) living below poverty.
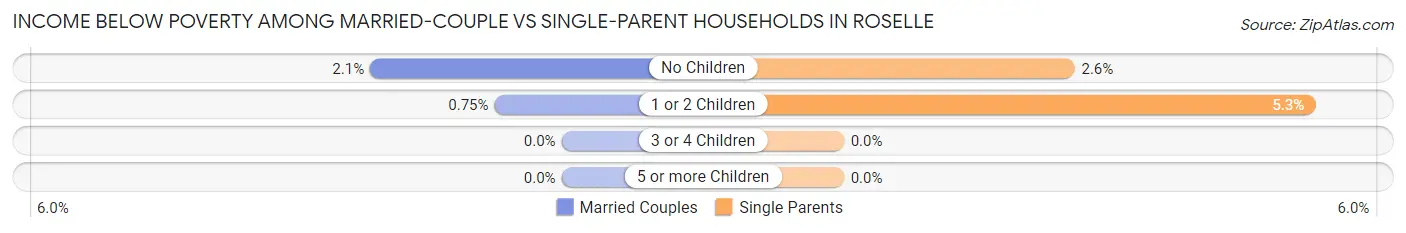
| Children | Married-Couple Families | Single-Parent Households |
| No Children | 66 (2.1%) | 13 (2.6%) |
| 1 or 2 Children | 15 (0.7%) | 22 (5.3%) |
| 3 or 4 Children | 0 (0.0%) | 0 (0.0%) |
| 5 or more Children | 0 (0.0%) | 0 (0.0%) |
| Total | 81 (1.5%) | 35 (3.7%) |
Race in Roselle
The most populous races in Roselle are White / Caucasian (18,390 | 80.5%), Asian (2,314 | 10.1%), and Hispanic or Latino (2,115 | 9.3%).
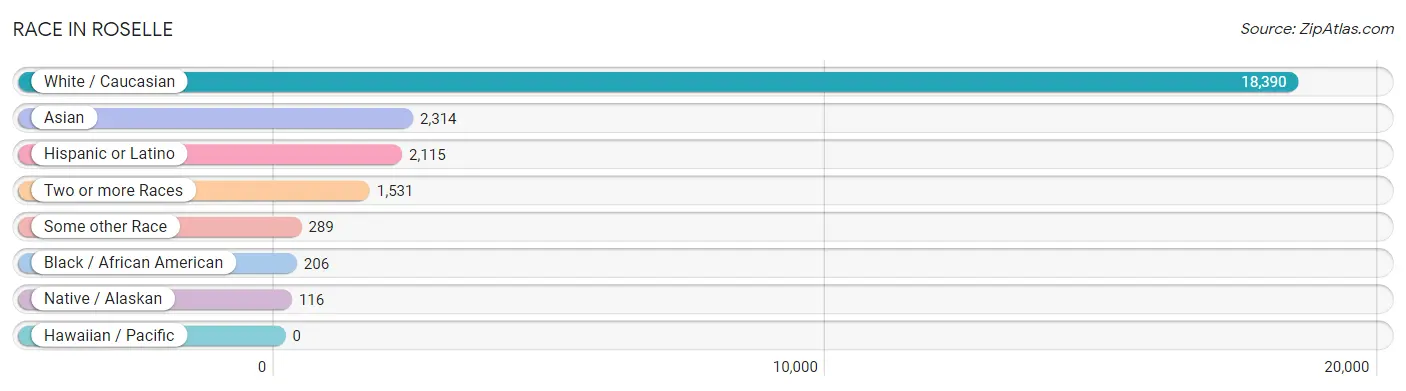
| Race | # Population | % Population |
| Asian | 2,314 | 10.1% |
| Black / African American | 206 | 0.9% |
| Hawaiian / Pacific | 0 | 0.0% |
| Hispanic or Latino | 2,115 | 9.3% |
| Native / Alaskan | 116 | 0.5% |
| White / Caucasian | 18,390 | 80.5% |
| Two or more Races | 1,531 | 6.7% |
| Some other Race | 289 | 1.3% |
| Total | 22,846 | 100.0% |
Ancestry in Roselle
The most populous ancestries reported in Roselle are Polish (5,626 | 24.6%), German (3,783 | 16.6%), Italian (3,588 | 15.7%), Irish (2,869 | 12.6%), and Mexican (1,627 | 7.1%), together accounting for 76.6% of all Roselle residents.
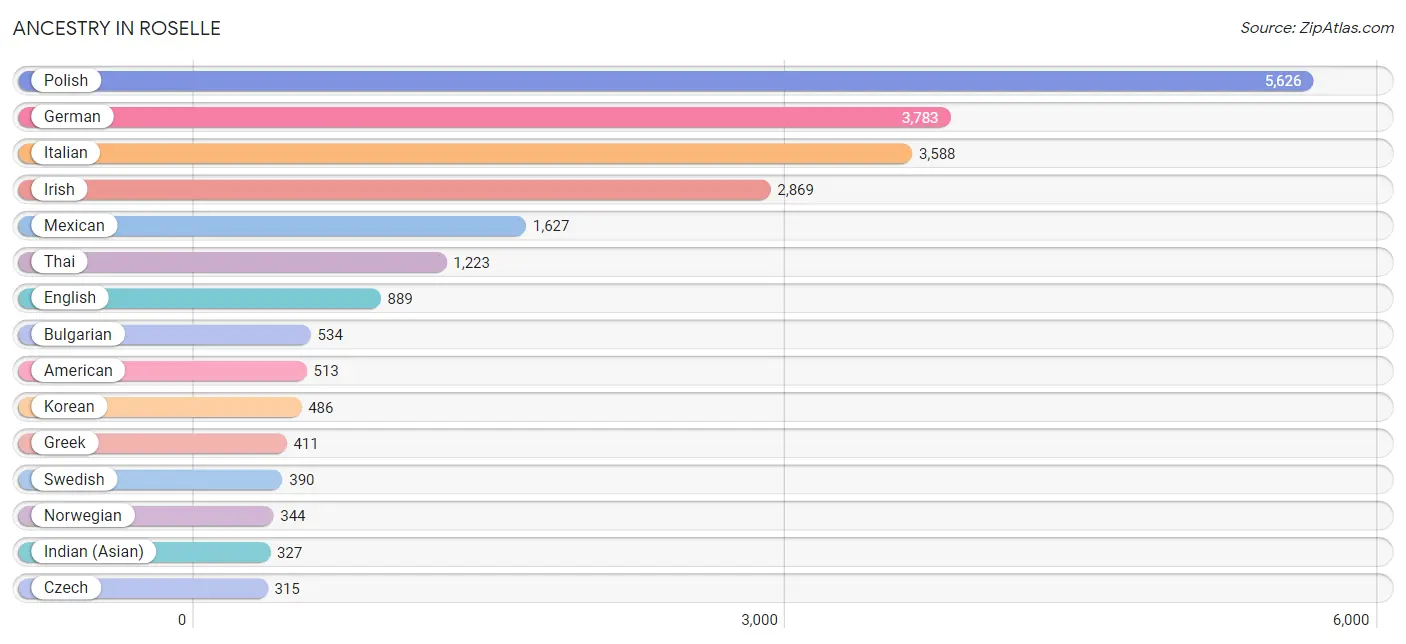
| Ancestry | # Population | % Population |
| Albanian | 39 | 0.2% |
| American | 513 | 2.2% |
| Arab | 63 | 0.3% |
| Armenian | 107 | 0.5% |
| Assyrian / Chaldean / Syriac | 299 | 1.3% |
| Austrian | 122 | 0.5% |
| Barbadian | 21 | 0.1% |
| Belgian | 76 | 0.3% |
| Bhutanese | 64 | 0.3% |
| British | 61 | 0.3% |
| Bulgarian | 534 | 2.3% |
| Burmese | 68 | 0.3% |
| Cambodian | 49 | 0.2% |
| Canadian | 113 | 0.5% |
| Central American | 107 | 0.5% |
| Cherokee | 123 | 0.5% |
| Colombian | 72 | 0.3% |
| Croatian | 76 | 0.3% |
| Cuban | 38 | 0.2% |
| Czech | 315 | 1.4% |
| Czechoslovakian | 60 | 0.3% |
| Danish | 54 | 0.2% |
| Dominican | 11 | 0.1% |
| Dutch | 291 | 1.3% |
| Eastern European | 30 | 0.1% |
| Ecuadorian | 8 | 0.0% |
| English | 889 | 3.9% |
| European | 93 | 0.4% |
| Filipino | 11 | 0.1% |
| Finnish | 69 | 0.3% |
| French | 309 | 1.3% |
| French Canadian | 10 | 0.0% |
| German | 3,783 | 16.6% |
| Greek | 411 | 1.8% |
| Guatemalan | 107 | 0.5% |
| Hungarian | 95 | 0.4% |
| Indian (Asian) | 327 | 1.4% |
| Iranian | 26 | 0.1% |
| Irish | 2,869 | 12.6% |
| Italian | 3,588 | 15.7% |
| Japanese | 20 | 0.1% |
| Korean | 486 | 2.1% |
| Lebanese | 31 | 0.1% |
| Lithuanian | 114 | 0.5% |
| Luxembourger | 13 | 0.1% |
| Malaysian | 84 | 0.4% |
| Mexican | 1,627 | 7.1% |
| Mexican American Indian | 38 | 0.2% |
| Nigerian | 17 | 0.1% |
| Norwegian | 344 | 1.5% |
| Pakistani | 78 | 0.3% |
| Polish | 5,626 | 24.6% |
| Portuguese | 14 | 0.1% |
| Potawatomi | 6 | 0.0% |
| Puerto Rican | 125 | 0.5% |
| Romanian | 80 | 0.4% |
| Russian | 241 | 1.1% |
| Scandinavian | 98 | 0.4% |
| Scotch-Irish | 100 | 0.4% |
| Scottish | 208 | 0.9% |
| Serbian | 30 | 0.1% |
| Slovak | 65 | 0.3% |
| Slovene | 21 | 0.1% |
| South African | 29 | 0.1% |
| South American | 121 | 0.5% |
| Spaniard | 36 | 0.2% |
| Spanish | 43 | 0.2% |
| Subsaharan African | 46 | 0.2% |
| Swedish | 390 | 1.7% |
| Syrian | 11 | 0.1% |
| Thai | 1,223 | 5.3% |
| Turkish | 19 | 0.1% |
| Ukrainian | 200 | 0.9% |
| Vietnamese | 60 | 0.3% |
| Welsh | 95 | 0.4% |
| Yugoslavian | 12 | 0.1% | View All 76 Rows |
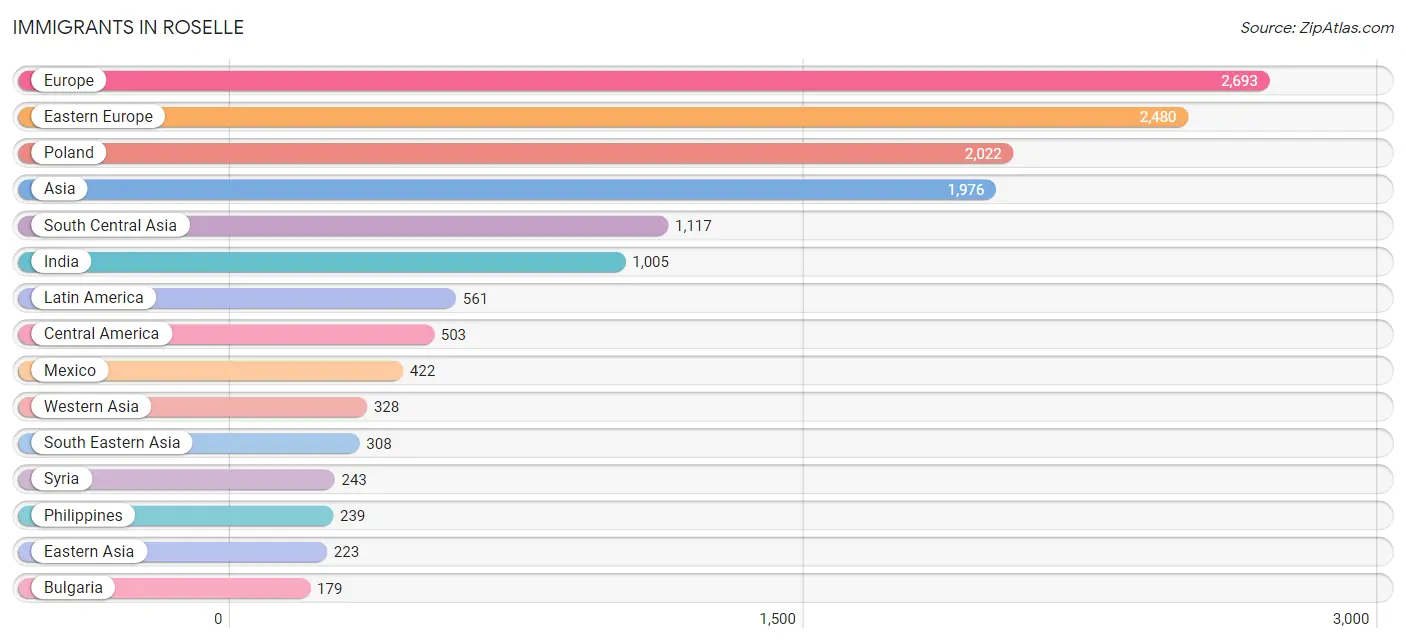
Immigrants in Roselle
The most numerous immigrant groups reported in Roselle came from Europe (2,693 | 11.8%), Eastern Europe (2,480 | 10.9%), Poland (2,022 | 8.8%), Asia (1,976 | 8.6%), and South Central Asia (1,117 | 4.9%), together accounting for 45.0% of all Roselle residents.
| Immigration Origin | # Population | % Population |
| Africa | 87 | 0.4% |
| Albania | 29 | 0.1% |
| Asia | 1,976 | 8.6% |
| Bangladesh | 33 | 0.1% |
| Barbados | 21 | 0.1% |
| Bulgaria | 179 | 0.8% |
| Cambodia | 20 | 0.1% |
| Caribbean | 21 | 0.1% |
| Central America | 503 | 2.2% |
| China | 153 | 0.7% |
| Colombia | 15 | 0.1% |
| Czechoslovakia | 18 | 0.1% |
| Eastern Africa | 25 | 0.1% |
| Eastern Asia | 223 | 1.0% |
| Eastern Europe | 2,480 | 10.9% |
| Ecuador | 22 | 0.1% |
| El Salvador | 21 | 0.1% |
| Europe | 2,693 | 11.8% |
| Germany | 16 | 0.1% |
| Greece | 5 | 0.0% |
| Guatemala | 60 | 0.3% |
| Hong Kong | 46 | 0.2% |
| Hungary | 27 | 0.1% |
| India | 1,005 | 4.4% |
| Iran | 26 | 0.1% |
| Iraq | 79 | 0.4% |
| Ireland | 15 | 0.1% |
| Italy | 81 | 0.4% |
| Japan | 11 | 0.1% |
| Kenya | 13 | 0.1% |
| Korea | 35 | 0.2% |
| Laos | 7 | 0.0% |
| Latin America | 561 | 2.5% |
| Lithuania | 16 | 0.1% |
| Mexico | 422 | 1.8% |
| Nigeria | 17 | 0.1% |
| Northern Africa | 8 | 0.0% |
| Northern Europe | 35 | 0.2% |
| Pakistan | 53 | 0.2% |
| Philippines | 239 | 1.1% |
| Poland | 2,022 | 8.8% |
| Romania | 42 | 0.2% |
| Russia | 40 | 0.2% |
| Scotland | 9 | 0.0% |
| South Africa | 15 | 0.1% |
| South America | 37 | 0.2% |
| South Central Asia | 1,117 | 4.9% |
| South Eastern Asia | 308 | 1.3% |
| Southern Europe | 86 | 0.4% |
| Switzerland | 53 | 0.2% |
| Syria | 243 | 1.1% |
| Taiwan | 59 | 0.3% |
| Thailand | 42 | 0.2% |
| Uganda | 6 | 0.0% |
| Ukraine | 107 | 0.5% |
| Western Africa | 17 | 0.1% |
| Western Asia | 328 | 1.4% |
| Western Europe | 69 | 0.3% | View All 58 Rows |
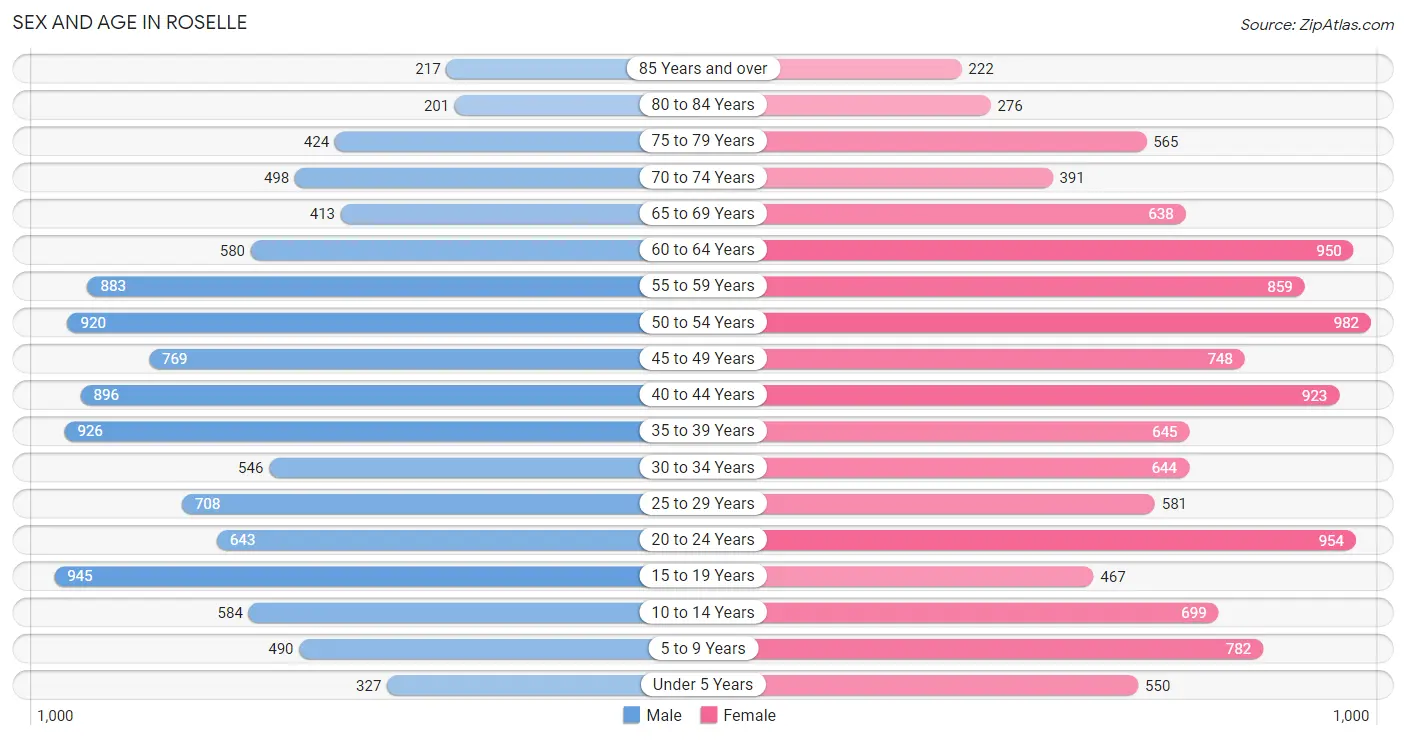
Sex and Age in Roselle
Sex and Age in Roselle
The most populous age groups in Roselle are 15 to 19 Years (945 | 8.6%) for men and 50 to 54 Years (982 | 8.3%) for women.
| Age Bracket | Male | Female |
| Under 5 Years | 327 (3.0%) | 550 (4.6%) |
| 5 to 9 Years | 490 (4.5%) | 782 (6.6%) |
| 10 to 14 Years | 584 (5.3%) | 699 (5.9%) |
| 15 to 19 Years | 945 (8.6%) | 467 (3.9%) |
| 20 to 24 Years | 643 (5.9%) | 954 (8.0%) |
| 25 to 29 Years | 708 (6.5%) | 581 (4.9%) |
| 30 to 34 Years | 546 (5.0%) | 644 (5.4%) |
| 35 to 39 Years | 926 (8.4%) | 645 (5.4%) |
| 40 to 44 Years | 896 (8.2%) | 923 (7.8%) |
| 45 to 49 Years | 769 (7.0%) | 748 (6.3%) |
| 50 to 54 Years | 920 (8.4%) | 982 (8.3%) |
| 55 to 59 Years | 883 (8.1%) | 859 (7.2%) |
| 60 to 64 Years | 580 (5.3%) | 950 (8.0%) |
| 65 to 69 Years | 413 (3.8%) | 638 (5.4%) |
| 70 to 74 Years | 498 (4.5%) | 391 (3.3%) |
| 75 to 79 Years | 424 (3.9%) | 565 (4.8%) |
| 80 to 84 Years | 201 (1.8%) | 276 (2.3%) |
| 85 Years and over | 217 (2.0%) | 222 (1.9%) |
| Total | 10,970 (100.0%) | 11,876 (100.0%) |
Families and Households in Roselle
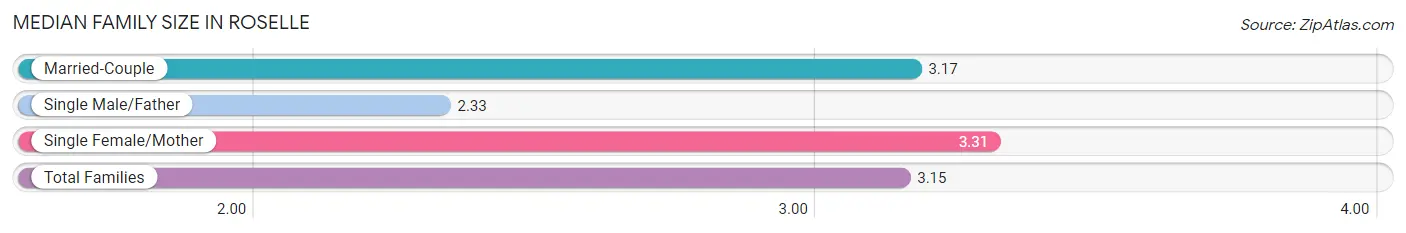
Median Family Size in Roselle
The median family size in Roselle is 3.15 persons per family, with single female/mother families (702 | 11.3%) accounting for the largest median family size of 3.31 persons per family. On the other hand, single male/father families (233 | 3.7%) represent the smallest median family size with 2.33 persons per family.
| Family Type | # Families | Family Size |
| Married-Couple | 5,278 (85.0%) | 3.17 |
| Single Male/Father | 233 (3.7%) | 2.33 |
| Single Female/Mother | 702 (11.3%) | 3.31 |
| Total Families | 6,213 (100.0%) | 3.15 |
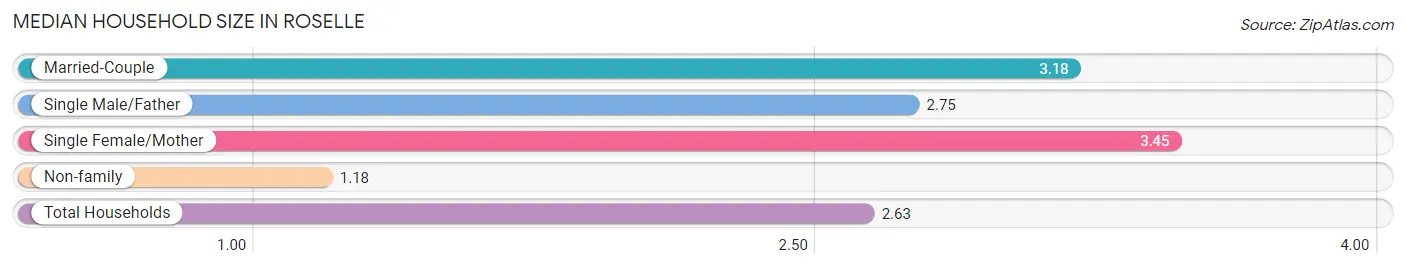
Median Household Size in Roselle
The median household size in Roselle is 2.63 persons per household, with single female/mother households (702 | 8.1%) accounting for the largest median household size of 3.45 persons per household. non-family households (2,455 | 28.3%) represent the smallest median household size with 1.18 persons per household.
| Household Type | # Households | Household Size |
| Married-Couple | 5,278 (60.9%) | 3.18 |
| Single Male/Father | 233 (2.7%) | 2.75 |
| Single Female/Mother | 702 (8.1%) | 3.45 |
| Non-family | 2,455 (28.3%) | 1.18 |
| Total Households | 8,668 (100.0%) | 2.63 |
Household Size by Marriage Status in Roselle
Out of a total of 8,668 households in Roselle, 6,213 (71.7%) are family households, while 2,455 (28.3%) are nonfamily households. The most numerous type of family households are 2-person households, comprising 2,471, and the most common type of nonfamily households are 1-person households, comprising 2,068.
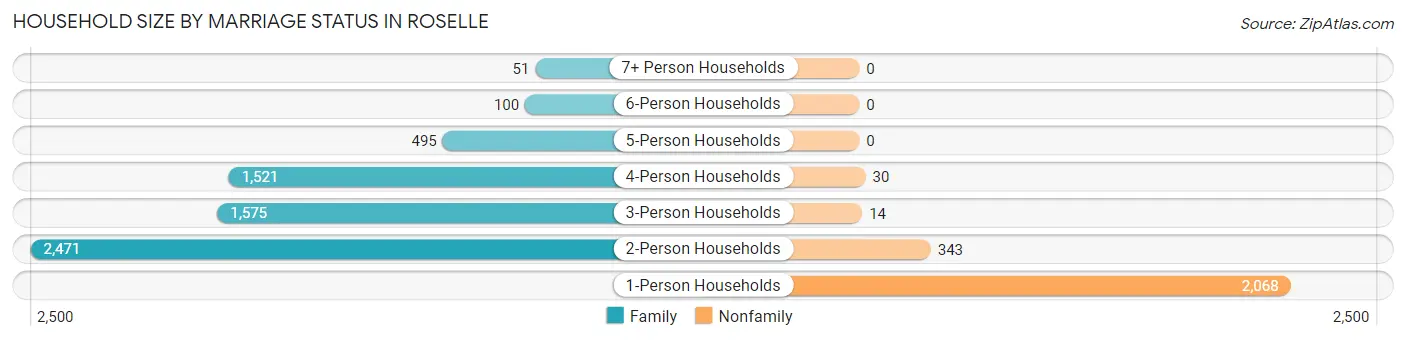
| Household Size | Family Households | Nonfamily Households |
| 1-Person Households | - | 2,068 (23.9%) |
| 2-Person Households | 2,471 (28.5%) | 343 (4.0%) |
| 3-Person Households | 1,575 (18.2%) | 14 (0.2%) |
| 4-Person Households | 1,521 (17.5%) | 30 (0.4%) |
| 5-Person Households | 495 (5.7%) | 0 (0.0%) |
| 6-Person Households | 100 (1.1%) | 0 (0.0%) |
| 7+ Person Households | 51 (0.6%) | 0 (0.0%) |
| Total | 6,213 (71.7%) | 2,455 (28.3%) |
Female Fertility in Roselle
Fertility by Age in Roselle
Average fertility rate in Roselle is 14.0 births per 1,000 women. Women in the age bracket of 20 to 34 years have the highest fertility rate with 19.0 births per 1,000 women. Women in the age bracket of 20 to 34 years acount for 58.3% of all women with births.
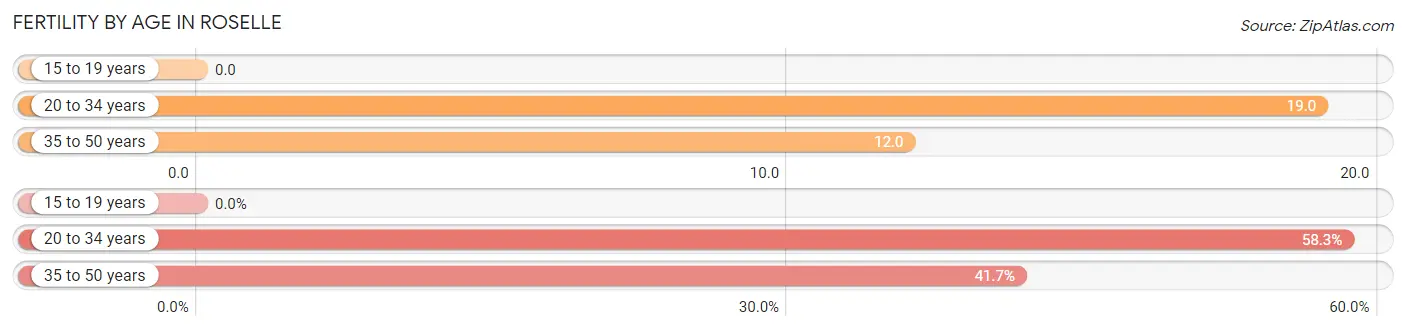
| Age Bracket | Women with Births | Births / 1,000 Women |
| 15 to 19 years | 0 (0.0%) | 0.0 |
| 20 to 34 years | 42 (58.3%) | 19.0 |
| 35 to 50 years | 30 (41.7%) | 12.0 |
| Total | 72 (100.0%) | 14.0 |
Fertility by Age by Marriage Status in Roselle
80.6% of women with births (72) in Roselle are married. The highest percentage of unmarried women with births falls into 20 to 34 years age bracket with 33.3% of them unmarried at the time of birth, while the lowest percentage of unmarried women with births belong to 35 to 50 years age bracket with 0.0% of them unmarried.
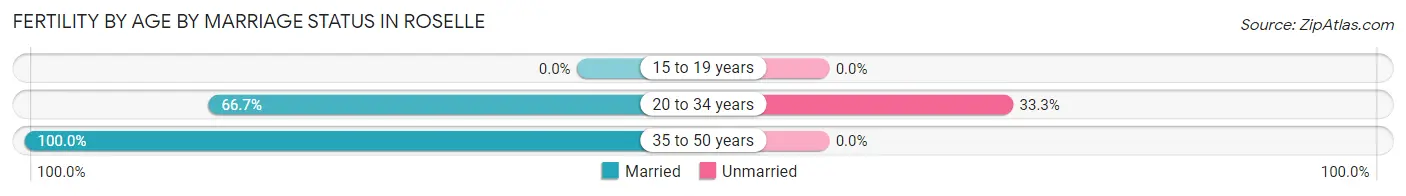
| Age Bracket | Married | Unmarried |
| 15 to 19 years | 0 (0.0%) | 0 (0.0%) |
| 20 to 34 years | 28 (66.7%) | 14 (33.3%) |
| 35 to 50 years | 30 (100.0%) | 0 (0.0%) |
| Total | 58 (80.6%) | 14 (19.4%) |
Fertility by Education in Roselle
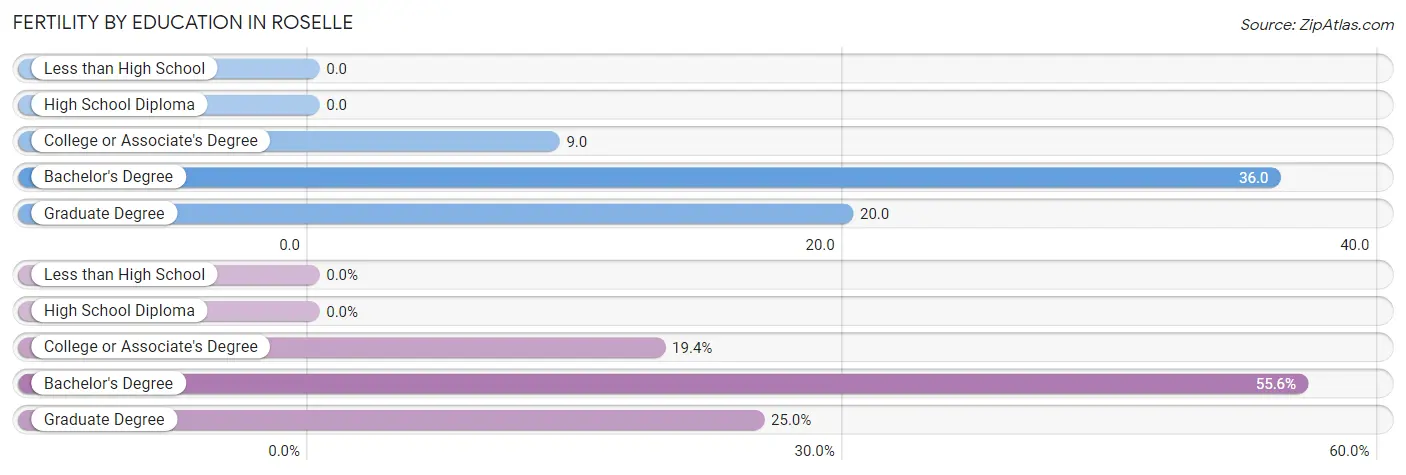
| Educational Attainment | Women with Births | Births / 1,000 Women |
| Less than High School | 0 (0.0%) | 0.0 |
| High School Diploma | 0 (0.0%) | 0.0 |
| College or Associate's Degree | 14 (19.4%) | 9.0 |
| Bachelor's Degree | 40 (55.6%) | 36.0 |
| Graduate Degree | 18 (25.0%) | 20.0 |
| Total | 72 (100.0%) | 14.0 |
Fertility by Education by Marriage Status in Roselle
19.4% of women with births in Roselle are unmarried. Women with the educational attainment of bachelor's degree are most likely to be married with 100.0% of them married at childbirth, while women with the educational attainment of college or associate's degree are least likely to be married with 100.0% of them unmarried at childbirth.
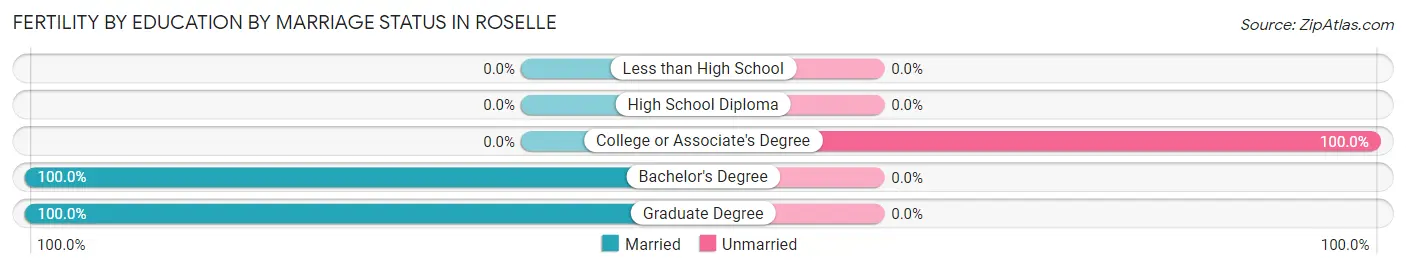
| Educational Attainment | Married | Unmarried |
| Less than High School | 0 (0.0%) | 0 (0.0%) |
| High School Diploma | 0 (0.0%) | 0 (0.0%) |
| College or Associate's Degree | 0 (0.0%) | 14 (100.0%) |
| Bachelor's Degree | 40 (100.0%) | 0 (0.0%) |
| Graduate Degree | 18 (100.0%) | 0 (0.0%) |
| Total | 58 (80.6%) | 14 (19.4%) |
Employment Characteristics in Roselle
Employment by Class of Employer in Roselle
Among the 12,203 employed individuals in Roselle, private company employees (9,259 | 75.9%), local government employees (845 | 6.9%), and not-for-profit organizations (752 | 6.2%) make up the most common classes of employment.
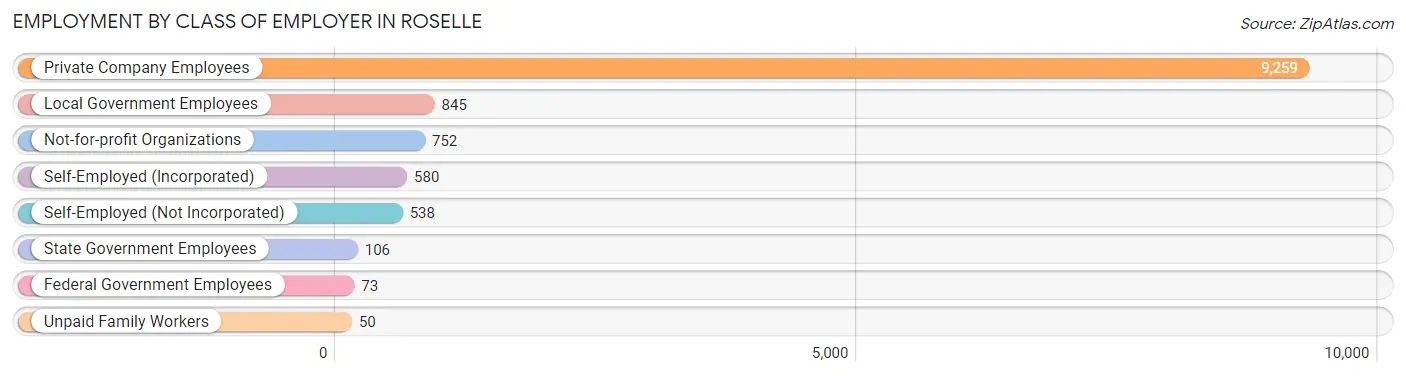
| Employer Class | # Employees | % Employees |
| Private Company Employees | 9,259 | 75.9% |
| Self-Employed (Incorporated) | 580 | 4.8% |
| Self-Employed (Not Incorporated) | 538 | 4.4% |
| Not-for-profit Organizations | 752 | 6.2% |
| Local Government Employees | 845 | 6.9% |
| State Government Employees | 106 | 0.9% |
| Federal Government Employees | 73 | 0.6% |
| Unpaid Family Workers | 50 | 0.4% |
| Total | 12,203 | 100.0% |
Employment Status by Age in Roselle
According to the labor force statistics for Roselle, out of the total population over 16 years of age (18,924), 70.5% or 13,341 individuals are in the labor force, with 7.3% or 974 of them unemployed. The age group with the highest labor force participation rate is 25 to 29 years, with 94.6% or 1,219 individuals in the labor force. Within the labor force, the 75 years and over age range has the highest percentage of unemployed individuals, with 41.4% or 63 of them being unemployed.
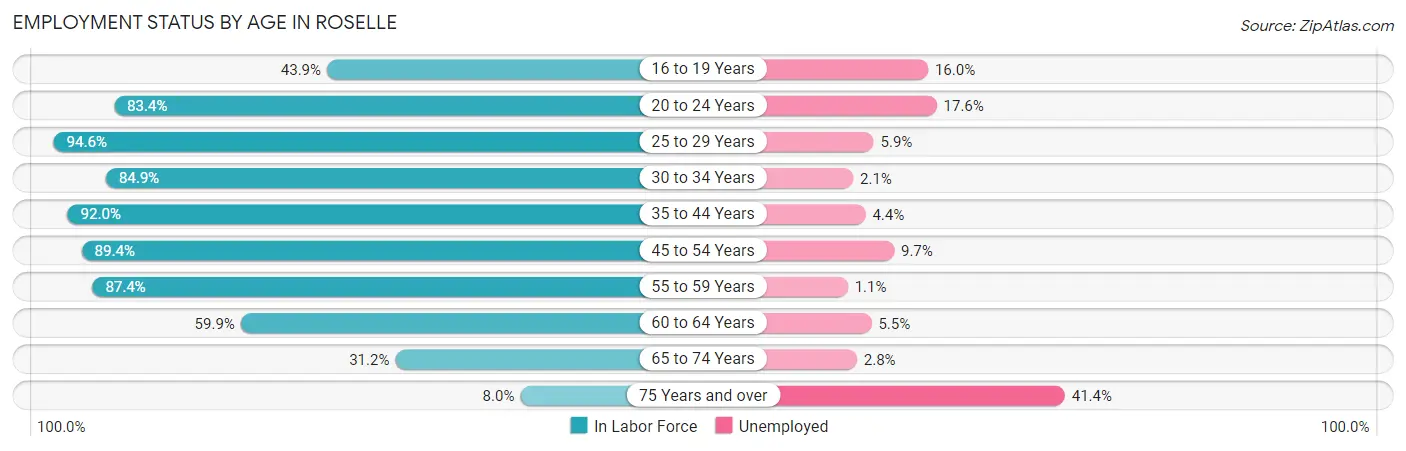
| Age Bracket | In Labor Force | Unemployed |
| 16 to 19 Years | 405 (43.9%) | 65 (16.0%) |
| 20 to 24 Years | 1,332 (83.4%) | 234 (17.6%) |
| 25 to 29 Years | 1,219 (94.6%) | 72 (5.9%) |
| 30 to 34 Years | 1,010 (84.9%) | 21 (2.1%) |
| 35 to 44 Years | 3,119 (92.0%) | 137 (4.4%) |
| 45 to 54 Years | 3,057 (89.4%) | 297 (9.7%) |
| 55 to 59 Years | 1,523 (87.4%) | 17 (1.1%) |
| 60 to 64 Years | 916 (59.9%) | 50 (5.5%) |
| 65 to 74 Years | 605 (31.2%) | 17 (2.8%) |
| 75 Years and over | 152 (8.0%) | 63 (41.4%) |
| Total | 13,341 (70.5%) | 974 (7.3%) |
Employment Status by Educational Attainment in Roselle
According to labor force statistics for Roselle, 86.3% of individuals (10,839) out of the total population between 25 and 64 years of age (12,560) are in the labor force, with 5.5% or 596 of them being unemployed. The group with the highest labor force participation rate are those with the educational attainment of bachelor's degree or higher, with 93.6% or 5,002 individuals in the labor force. Within the labor force, individuals with less than high school education have the highest percentage of unemployment, with 10.7% or 48 of them being unemployed.
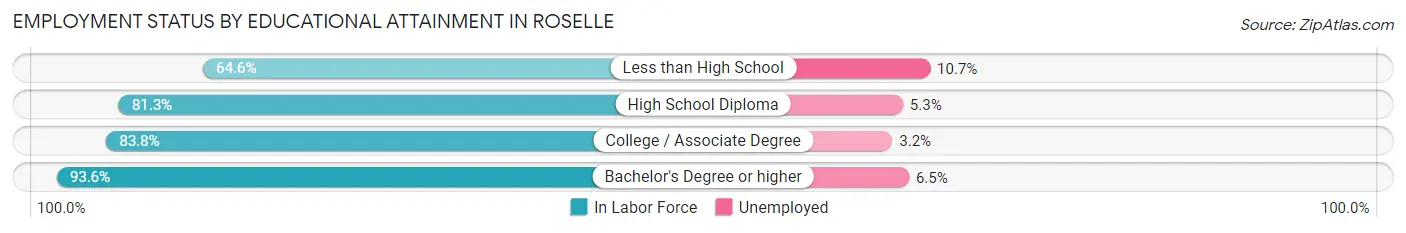
| Educational Attainment | In Labor Force | Unemployed |
| Less than High School | 449 (64.6%) | 74 (10.7%) |
| High School Diploma | 2,276 (81.3%) | 148 (5.3%) |
| College / Associate Degree | 3,118 (83.8%) | 119 (3.2%) |
| Bachelor's Degree or higher | 5,002 (93.6%) | 347 (6.5%) |
| Total | 10,839 (86.3%) | 691 (5.5%) |
Employment Occupations by Sex in Roselle
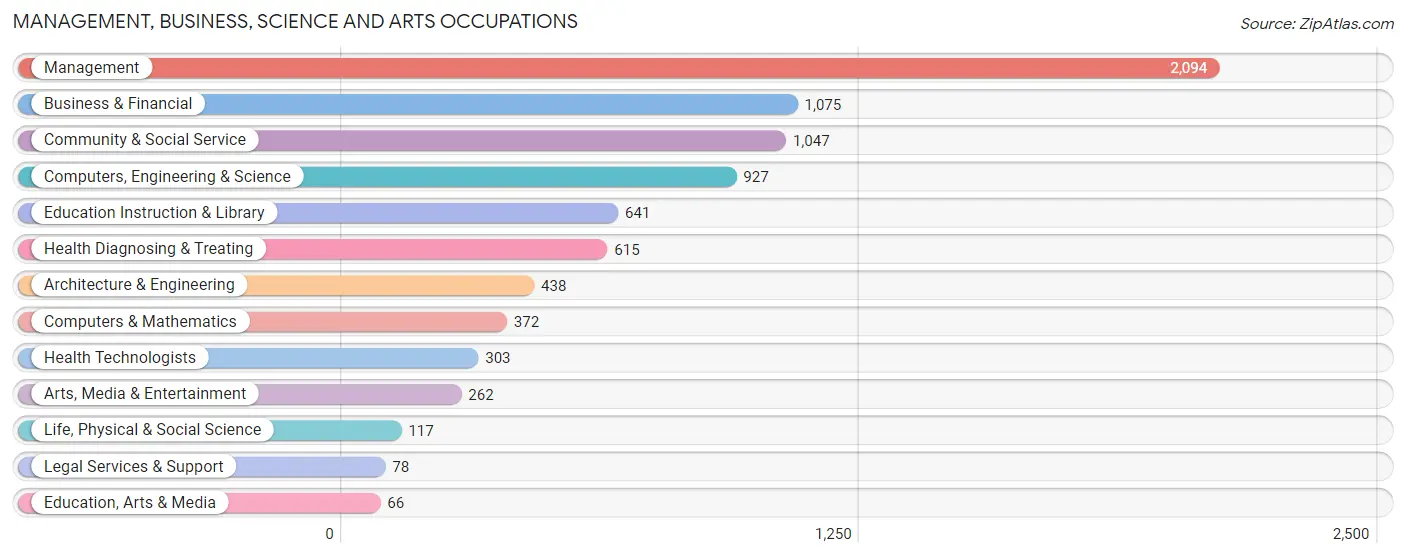
Management, Business, Science and Arts Occupations
The most common Management, Business, Science and Arts occupations in Roselle are Management (2,094 | 16.9%), Business & Financial (1,075 | 8.7%), Community & Social Service (1,047 | 8.5%), Computers, Engineering & Science (927 | 7.5%), and Education Instruction & Library (641 | 5.2%).
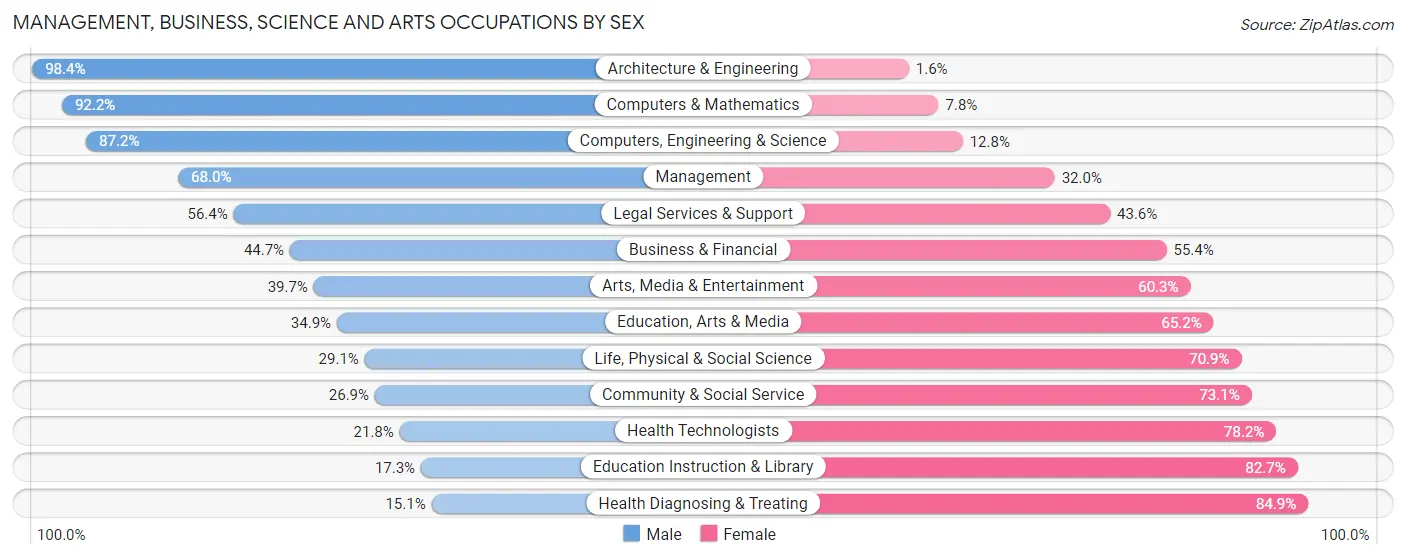
Management, Business, Science and Arts Occupations by Sex
Within the Management, Business, Science and Arts occupations in Roselle, the most male-oriented occupations are Architecture & Engineering (98.4%), Computers & Mathematics (92.2%), and Computers, Engineering & Science (87.2%), while the most female-oriented occupations are Health Diagnosing & Treating (84.9%), Education Instruction & Library (82.7%), and Health Technologists (78.2%).
| Occupation | Male | Female |
| Management | 1,423 (68.0%) | 671 (32.0%) |
| Business & Financial | 480 (44.7%) | 595 (55.3%) |
| Computers, Engineering & Science | 808 (87.2%) | 119 (12.8%) |
| Computers & Mathematics | 343 (92.2%) | 29 (7.8%) |
| Architecture & Engineering | 431 (98.4%) | 7 (1.6%) |
| Life, Physical & Social Science | 34 (29.1%) | 83 (70.9%) |
| Community & Social Service | 282 (26.9%) | 765 (73.1%) |
| Education, Arts & Media | 23 (34.8%) | 43 (65.1%) |
| Legal Services & Support | 44 (56.4%) | 34 (43.6%) |
| Education Instruction & Library | 111 (17.3%) | 530 (82.7%) |
| Arts, Media & Entertainment | 104 (39.7%) | 158 (60.3%) |
| Health Diagnosing & Treating | 93 (15.1%) | 522 (84.9%) |
| Health Technologists | 66 (21.8%) | 237 (78.2%) |
| Total (Category) | 3,086 (53.6%) | 2,672 (46.4%) |
| Total (Overall) | 6,664 (53.9%) | 5,699 (46.1%) |
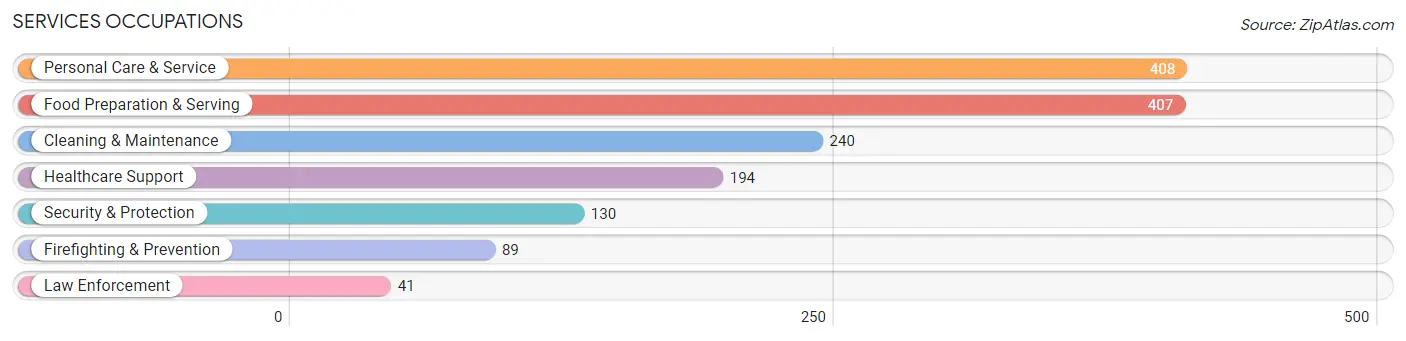
Services Occupations
The most common Services occupations in Roselle are Personal Care & Service (408 | 3.3%), Food Preparation & Serving (407 | 3.3%), Cleaning & Maintenance (240 | 1.9%), Healthcare Support (194 | 1.6%), and Security & Protection (130 | 1.1%).
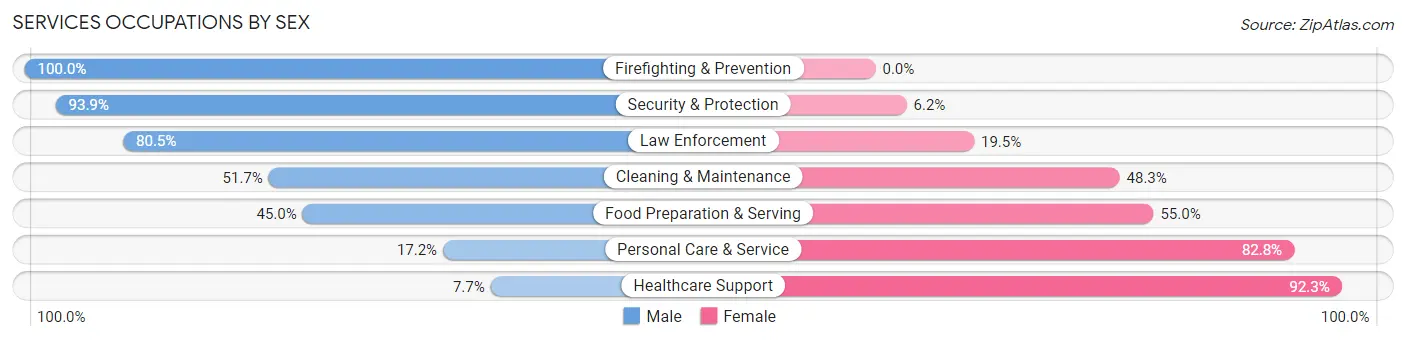
Services Occupations by Sex
Within the Services occupations in Roselle, the most male-oriented occupations are Firefighting & Prevention (100.0%), Security & Protection (93.9%), and Law Enforcement (80.5%), while the most female-oriented occupations are Healthcare Support (92.3%), Personal Care & Service (82.8%), and Food Preparation & Serving (55.0%).
| Occupation | Male | Female |
| Healthcare Support | 15 (7.7%) | 179 (92.3%) |
| Security & Protection | 122 (93.9%) | 8 (6.1%) |
| Firefighting & Prevention | 89 (100.0%) | 0 (0.0%) |
| Law Enforcement | 33 (80.5%) | 8 (19.5%) |
| Food Preparation & Serving | 183 (45.0%) | 224 (55.0%) |
| Cleaning & Maintenance | 124 (51.7%) | 116 (48.3%) |
| Personal Care & Service | 70 (17.2%) | 338 (82.8%) |
| Total (Category) | 514 (37.3%) | 865 (62.7%) |
| Total (Overall) | 6,664 (53.9%) | 5,699 (46.1%) |
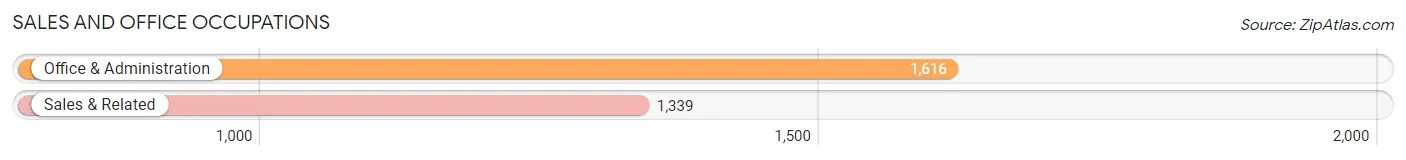
Sales and Office Occupations
The most common Sales and Office occupations in Roselle are Office & Administration (1,616 | 13.1%), and Sales & Related (1,339 | 10.8%).
Sales and Office Occupations by Sex
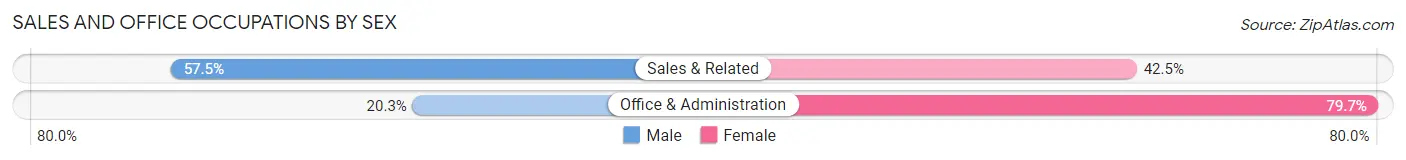
| Occupation | Male | Female |
| Sales & Related | 770 (57.5%) | 569 (42.5%) |
| Office & Administration | 328 (20.3%) | 1,288 (79.7%) |
| Total (Category) | 1,098 (37.2%) | 1,857 (62.8%) |
| Total (Overall) | 6,664 (53.9%) | 5,699 (46.1%) |
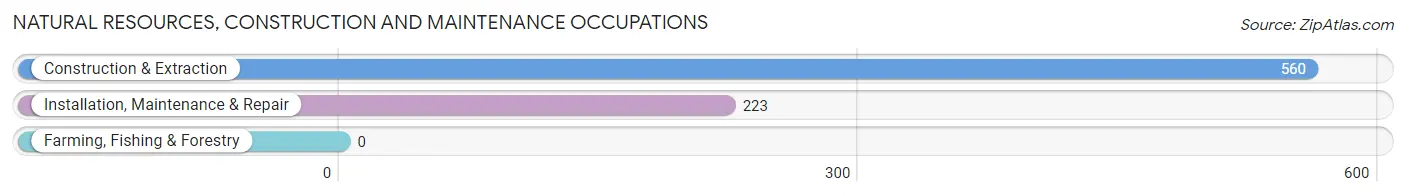
Natural Resources, Construction and Maintenance Occupations
The most common Natural Resources, Construction and Maintenance occupations in Roselle are Construction & Extraction (560 | 4.5%), and Installation, Maintenance & Repair (223 | 1.8%).
Natural Resources, Construction and Maintenance Occupations by Sex
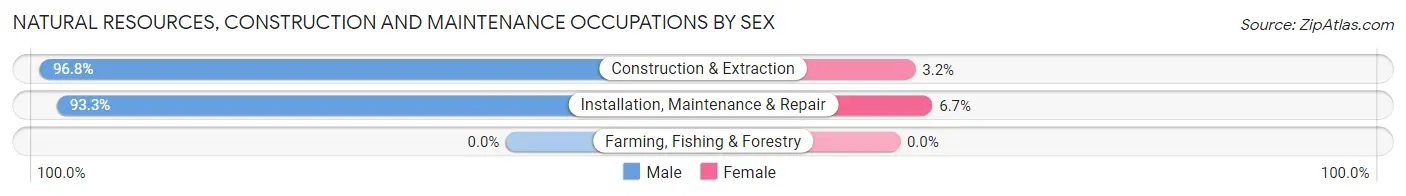
| Occupation | Male | Female |
| Farming, Fishing & Forestry | 0 (0.0%) | 0 (0.0%) |
| Construction & Extraction | 542 (96.8%) | 18 (3.2%) |
| Installation, Maintenance & Repair | 208 (93.3%) | 15 (6.7%) |
| Total (Category) | 750 (95.8%) | 33 (4.2%) |
| Total (Overall) | 6,664 (53.9%) | 5,699 (46.1%) |
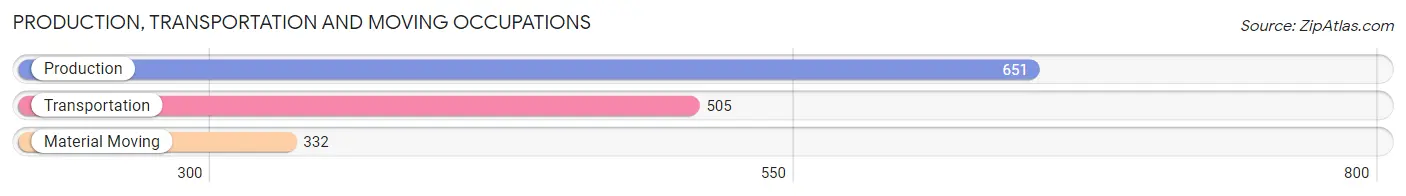
Production, Transportation and Moving Occupations
The most common Production, Transportation and Moving occupations in Roselle are Production (651 | 5.3%), Transportation (505 | 4.1%), and Material Moving (332 | 2.7%).
Production, Transportation and Moving Occupations by Sex
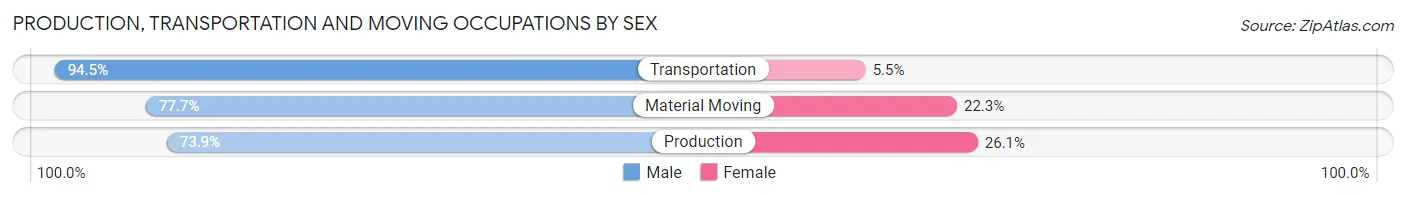
| Occupation | Male | Female |
| Production | 481 (73.9%) | 170 (26.1%) |
| Transportation | 477 (94.5%) | 28 (5.5%) |
| Material Moving | 258 (77.7%) | 74 (22.3%) |
| Total (Category) | 1,216 (81.7%) | 272 (18.3%) |
| Total (Overall) | 6,664 (53.9%) | 5,699 (46.1%) |
Employment Industries by Sex in Roselle
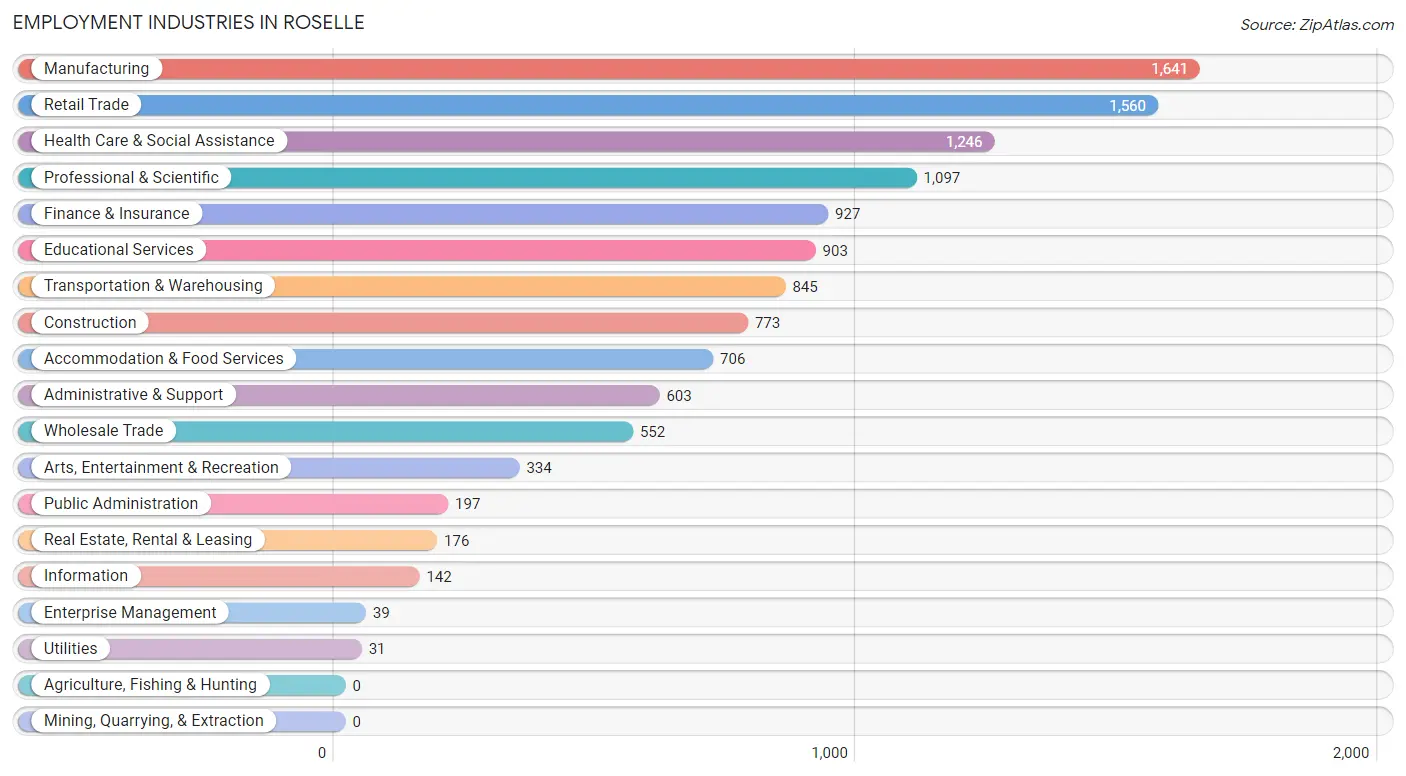
Employment Industries in Roselle
The major employment industries in Roselle include Manufacturing (1,641 | 13.3%), Retail Trade (1,560 | 12.6%), Health Care & Social Assistance (1,246 | 10.1%), Professional & Scientific (1,097 | 8.9%), and Finance & Insurance (927 | 7.5%).
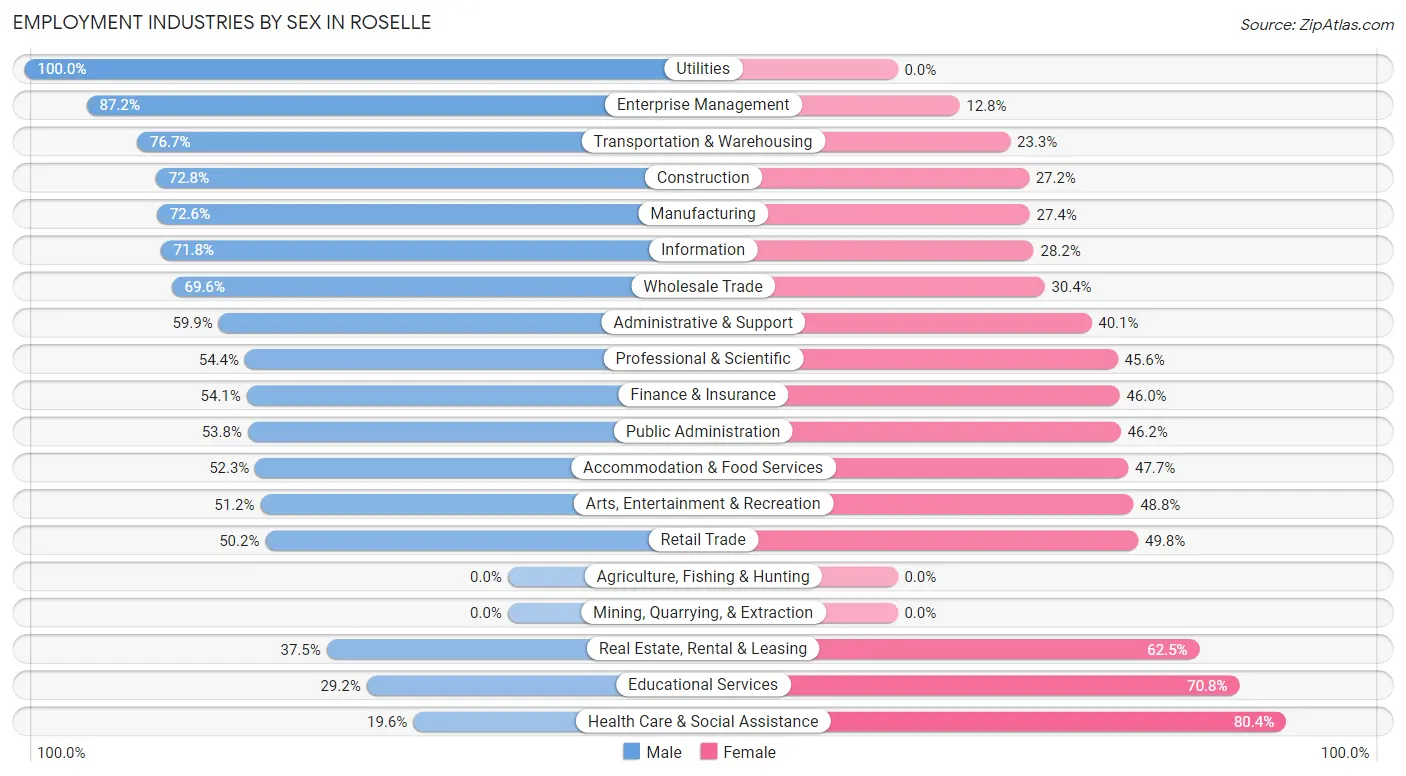
Employment Industries by Sex in Roselle
The Roselle industries that see more men than women are Utilities (100.0%), Enterprise Management (87.2%), and Transportation & Warehousing (76.7%), whereas the industries that tend to have a higher number of women are Health Care & Social Assistance (80.4%), Educational Services (70.8%), and Real Estate, Rental & Leasing (62.5%).
| Industry | Male | Female |
| Agriculture, Fishing & Hunting | 0 (0.0%) | 0 (0.0%) |
| Mining, Quarrying, & Extraction | 0 (0.0%) | 0 (0.0%) |
| Construction | 563 (72.8%) | 210 (27.2%) |
| Manufacturing | 1,192 (72.6%) | 449 (27.4%) |
| Wholesale Trade | 384 (69.6%) | 168 (30.4%) |
| Retail Trade | 783 (50.2%) | 777 (49.8%) |
| Transportation & Warehousing | 648 (76.7%) | 197 (23.3%) |
| Utilities | 31 (100.0%) | 0 (0.0%) |
| Information | 102 (71.8%) | 40 (28.2%) |
| Finance & Insurance | 501 (54.0%) | 426 (46.0%) |
| Real Estate, Rental & Leasing | 66 (37.5%) | 110 (62.5%) |
| Professional & Scientific | 597 (54.4%) | 500 (45.6%) |
| Enterprise Management | 34 (87.2%) | 5 (12.8%) |
| Administrative & Support | 361 (59.9%) | 242 (40.1%) |
| Educational Services | 264 (29.2%) | 639 (70.8%) |
| Health Care & Social Assistance | 244 (19.6%) | 1,002 (80.4%) |
| Arts, Entertainment & Recreation | 171 (51.2%) | 163 (48.8%) |
| Accommodation & Food Services | 369 (52.3%) | 337 (47.7%) |
| Public Administration | 106 (53.8%) | 91 (46.2%) |
| Total | 6,664 (53.9%) | 5,699 (46.1%) |
Education in Roselle
School Enrollment in Roselle
The most common levels of schooling among the 5,288 students in Roselle are high school (1,250 | 23.6%), college / undergraduate (1,223 | 23.1%), and elementary school (1,073 | 20.3%).
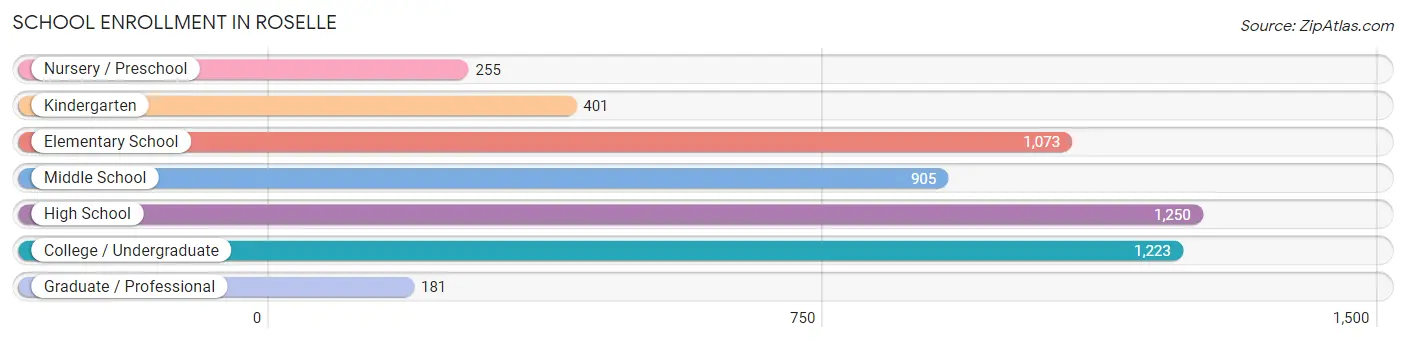
| School Level | # Students | % Students |
| Nursery / Preschool | 255 | 4.8% |
| Kindergarten | 401 | 7.6% |
| Elementary School | 1,073 | 20.3% |
| Middle School | 905 | 17.1% |
| High School | 1,250 | 23.6% |
| College / Undergraduate | 1,223 | 23.1% |
| Graduate / Professional | 181 | 3.4% |
| Total | 5,288 | 100.0% |
School Enrollment by Age by Funding Source in Roselle
Out of a total of 5,288 students who are enrolled in schools in Roselle, 798 (15.1%) attend a private institution, while the remaining 4,490 (84.9%) are enrolled in public schools. The age group of 3 to 4 year olds has the highest likelihood of being enrolled in private schools, with 71 (40.3% in the age bracket) enrolled. Conversely, the age group of 15 to 17 year olds has the lowest likelihood of being enrolled in a private school, with 964 (96.8% in the age bracket) attending a public institution.
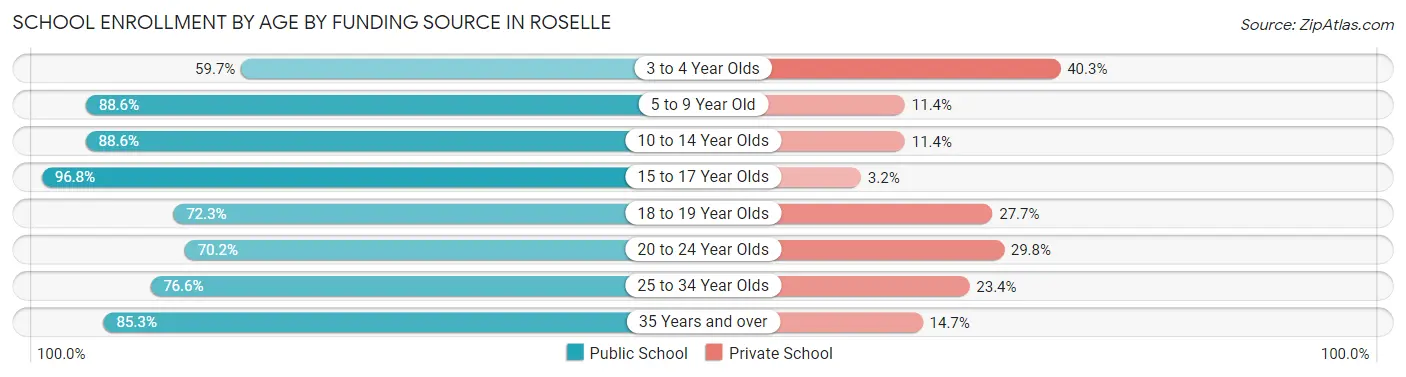
| Age Bracket | Public School | Private School |
| 3 to 4 Year Olds | 105 (59.7%) | 71 (40.3%) |
| 5 to 9 Year Old | 1,119 (88.6%) | 144 (11.4%) |
| 10 to 14 Year Olds | 1,137 (88.6%) | 146 (11.4%) |
| 15 to 17 Year Olds | 964 (96.8%) | 32 (3.2%) |
| 18 to 19 Year Olds | 235 (72.3%) | 90 (27.7%) |
| 20 to 24 Year Olds | 501 (70.2%) | 213 (29.8%) |
| 25 to 34 Year Olds | 193 (76.6%) | 59 (23.4%) |
| 35 Years and over | 238 (85.3%) | 41 (14.7%) |
| Total | 4,490 (84.9%) | 798 (15.1%) |
Educational Attainment by Field of Study in Roselle
Business (1,795 | 25.8%), science & technology (780 | 11.2%), engineering (746 | 10.7%), education (691 | 10.0%), and social sciences (554 | 8.0%) are the most common fields of study among 6,947 individuals in Roselle who have obtained a bachelor's degree or higher.
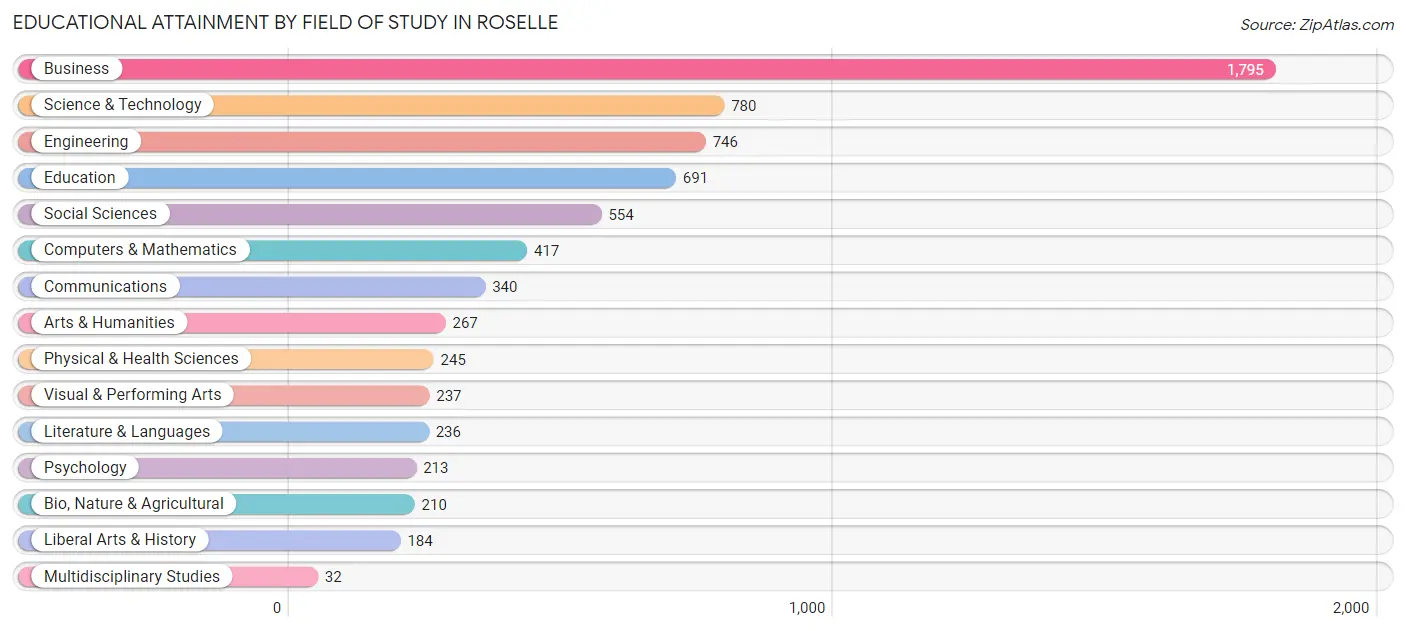
| Field of Study | # Graduates | % Graduates |
| Computers & Mathematics | 417 | 6.0% |
| Bio, Nature & Agricultural | 210 | 3.0% |
| Physical & Health Sciences | 245 | 3.5% |
| Psychology | 213 | 3.1% |
| Social Sciences | 554 | 8.0% |
| Engineering | 746 | 10.7% |
| Multidisciplinary Studies | 32 | 0.5% |
| Science & Technology | 780 | 11.2% |
| Business | 1,795 | 25.8% |
| Education | 691 | 10.0% |
| Literature & Languages | 236 | 3.4% |
| Liberal Arts & History | 184 | 2.6% |
| Visual & Performing Arts | 237 | 3.4% |
| Communications | 340 | 4.9% |
| Arts & Humanities | 267 | 3.8% |
| Total | 6,947 | 100.0% |
Transportation & Commute in Roselle
Vehicle Availability by Sex in Roselle
The most prevalent vehicle ownership categories in Roselle are males with 2 vehicles (2,948, accounting for 44.6%) and females with 2 vehicles (2,355, making up 52.8%).
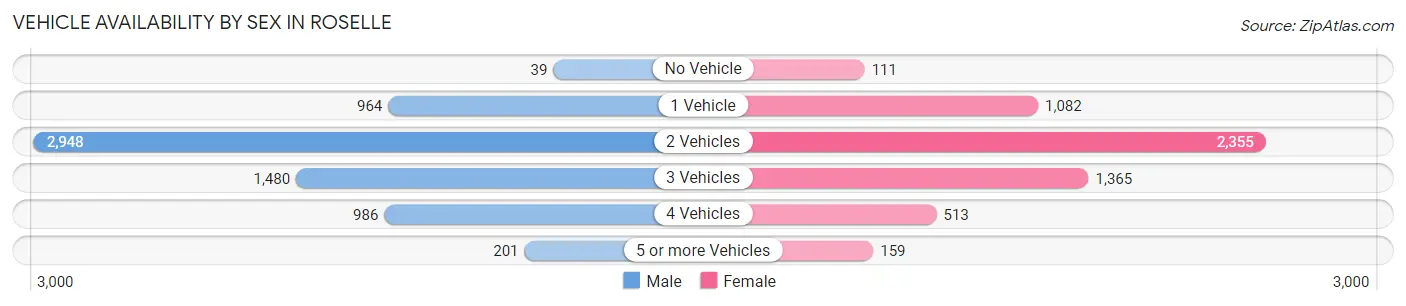
| Vehicles Available | Male | Female |
| No Vehicle | 39 (0.6%) | 111 (2.0%) |
| 1 Vehicle | 964 (14.6%) | 1,082 (19.4%) |
| 2 Vehicles | 2,948 (44.6%) | 2,355 (42.2%) |
| 3 Vehicles | 1,480 (22.4%) | 1,365 (24.4%) |
| 4 Vehicles | 986 (14.9%) | 513 (9.2%) |
| 5 or more Vehicles | 201 (3.0%) | 159 (2.9%) |
| Total | 6,618 (100.0%) | 5,585 (100.0%) |
Commute Time in Roselle
The most frequently occuring commute durations in Roselle are 30 to 34 minutes (1,587 commuters, 15.2%), 20 to 24 minutes (1,555 commuters, 14.9%), and 15 to 19 minutes (1,276 commuters, 12.2%).
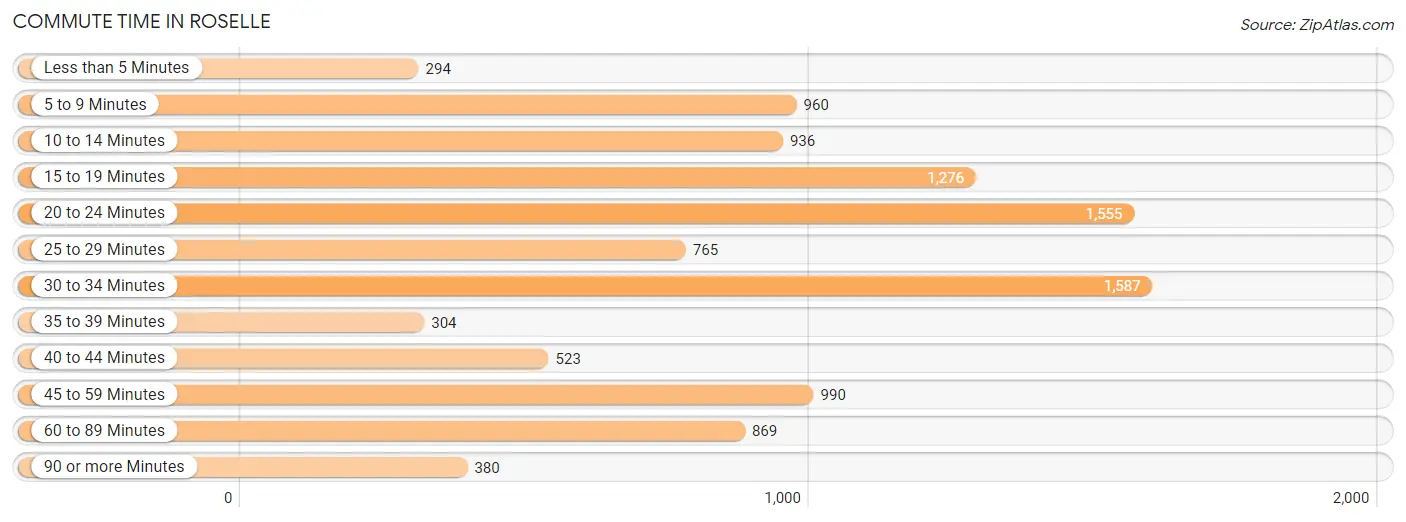
| Commute Time | # Commuters | % Commuters |
| Less than 5 Minutes | 294 | 2.8% |
| 5 to 9 Minutes | 960 | 9.2% |
| 10 to 14 Minutes | 936 | 9.0% |
| 15 to 19 Minutes | 1,276 | 12.2% |
| 20 to 24 Minutes | 1,555 | 14.9% |
| 25 to 29 Minutes | 765 | 7.3% |
| 30 to 34 Minutes | 1,587 | 15.2% |
| 35 to 39 Minutes | 304 | 2.9% |
| 40 to 44 Minutes | 523 | 5.0% |
| 45 to 59 Minutes | 990 | 9.5% |
| 60 to 89 Minutes | 869 | 8.3% |
| 90 or more Minutes | 380 | 3.6% |
Commute Time by Sex in Roselle
The most common commute times in Roselle are 30 to 34 minutes (939 commuters, 16.4%) for males and 20 to 24 minutes (725 commuters, 15.4%) for females.
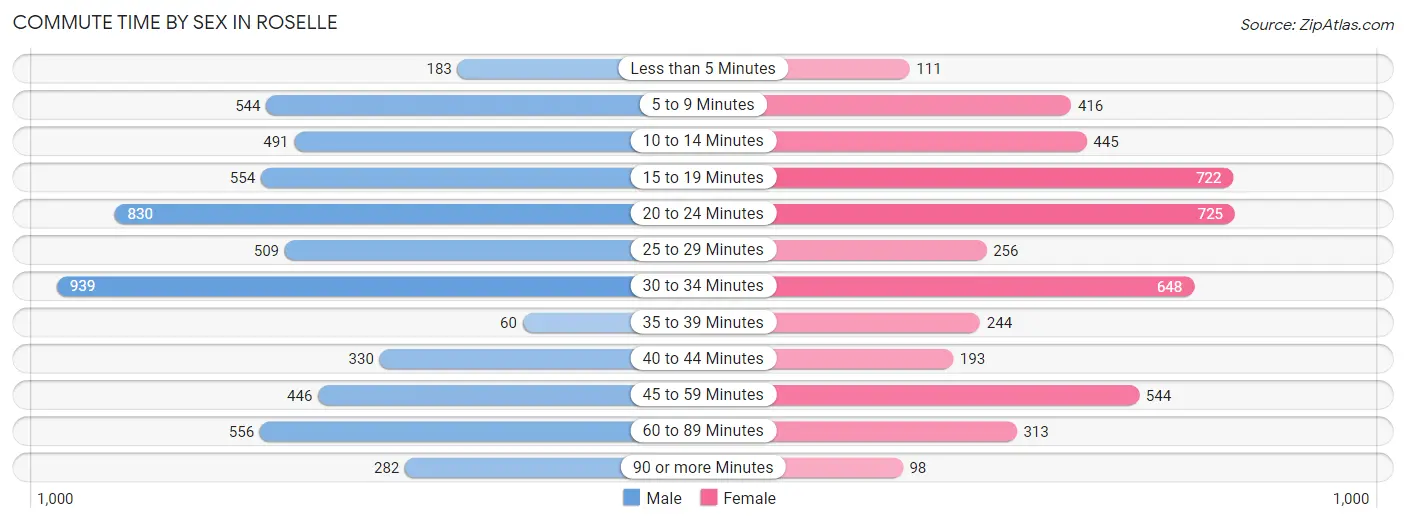
| Commute Time | Male | Female |
| Less than 5 Minutes | 183 (3.2%) | 111 (2.4%) |
| 5 to 9 Minutes | 544 (9.5%) | 416 (8.8%) |
| 10 to 14 Minutes | 491 (8.6%) | 445 (9.4%) |
| 15 to 19 Minutes | 554 (9.7%) | 722 (15.3%) |
| 20 to 24 Minutes | 830 (14.5%) | 725 (15.4%) |
| 25 to 29 Minutes | 509 (8.9%) | 256 (5.4%) |
| 30 to 34 Minutes | 939 (16.4%) | 648 (13.7%) |
| 35 to 39 Minutes | 60 (1.1%) | 244 (5.2%) |
| 40 to 44 Minutes | 330 (5.8%) | 193 (4.1%) |
| 45 to 59 Minutes | 446 (7.8%) | 544 (11.5%) |
| 60 to 89 Minutes | 556 (9.7%) | 313 (6.6%) |
| 90 or more Minutes | 282 (4.9%) | 98 (2.1%) |
Time of Departure to Work by Sex in Roselle
The most frequent times of departure to work in Roselle are 7:00 AM to 7:29 AM (914, 16.0%) for males and 7:00 AM to 7:29 AM (784, 16.6%) for females.
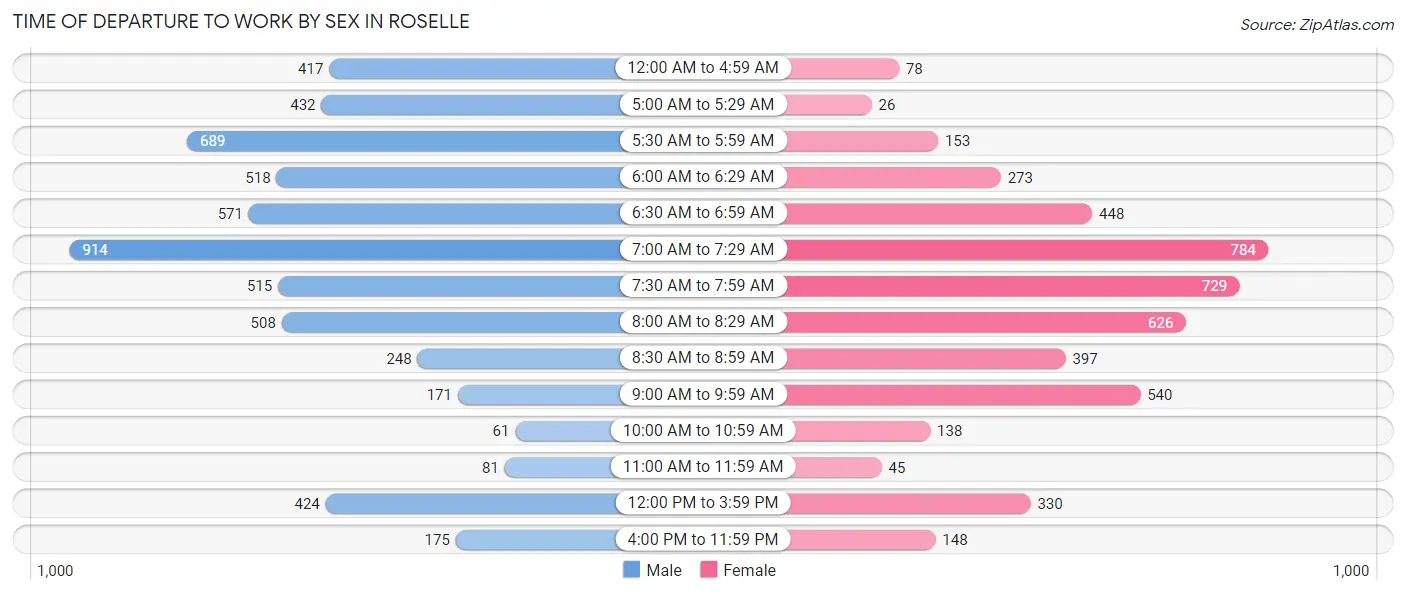
| Time of Departure | Male | Female |
| 12:00 AM to 4:59 AM | 417 (7.3%) | 78 (1.7%) |
| 5:00 AM to 5:29 AM | 432 (7.5%) | 26 (0.5%) |
| 5:30 AM to 5:59 AM | 689 (12.0%) | 153 (3.2%) |
| 6:00 AM to 6:29 AM | 518 (9.0%) | 273 (5.8%) |
| 6:30 AM to 6:59 AM | 571 (10.0%) | 448 (9.5%) |
| 7:00 AM to 7:29 AM | 914 (16.0%) | 784 (16.6%) |
| 7:30 AM to 7:59 AM | 515 (9.0%) | 729 (15.5%) |
| 8:00 AM to 8:29 AM | 508 (8.9%) | 626 (13.3%) |
| 8:30 AM to 8:59 AM | 248 (4.3%) | 397 (8.4%) |
| 9:00 AM to 9:59 AM | 171 (3.0%) | 540 (11.5%) |
| 10:00 AM to 10:59 AM | 61 (1.1%) | 138 (2.9%) |
| 11:00 AM to 11:59 AM | 81 (1.4%) | 45 (0.9%) |
| 12:00 PM to 3:59 PM | 424 (7.4%) | 330 (7.0%) |
| 4:00 PM to 11:59 PM | 175 (3.1%) | 148 (3.1%) |
| Total | 5,724 (100.0%) | 4,715 (100.0%) |
Housing Occupancy in Roselle
Occupancy by Ownership in Roselle
Of the total 8,668 dwellings in Roselle, owner-occupied units account for 6,763 (78.0%), while renter-occupied units make up 1,905 (22.0%).
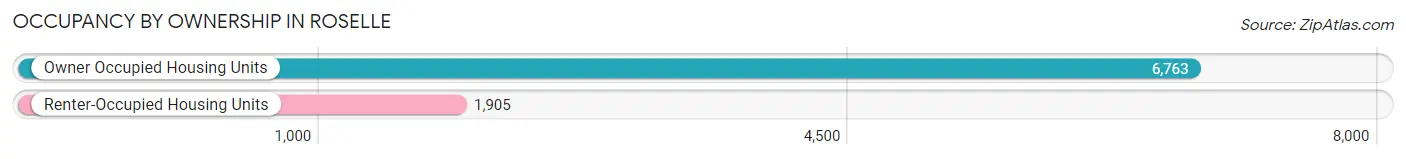
| Occupancy | # Housing Units | % Housing Units |
| Owner Occupied Housing Units | 6,763 | 78.0% |
| Renter-Occupied Housing Units | 1,905 | 22.0% |
| Total Occupied Housing Units | 8,668 | 100.0% |
Occupancy by Household Size in Roselle
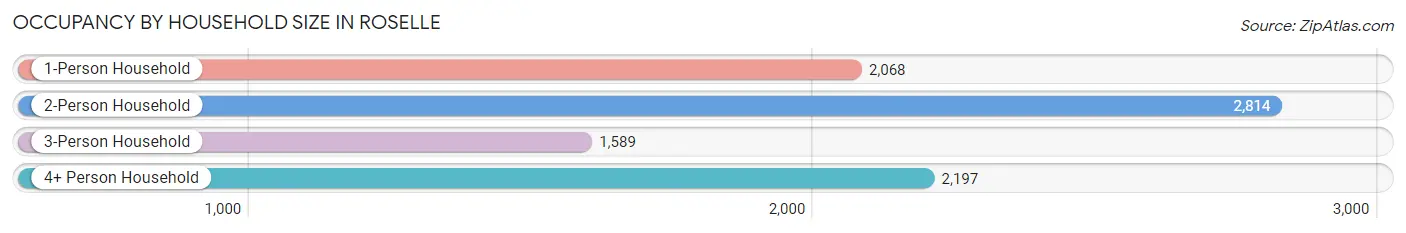
| Household Size | # Housing Units | % Housing Units |
| 1-Person Household | 2,068 | 23.9% |
| 2-Person Household | 2,814 | 32.5% |
| 3-Person Household | 1,589 | 18.3% |
| 4+ Person Household | 2,197 | 25.4% |
| Total Housing Units | 8,668 | 100.0% |
Occupancy by Ownership by Household Size in Roselle
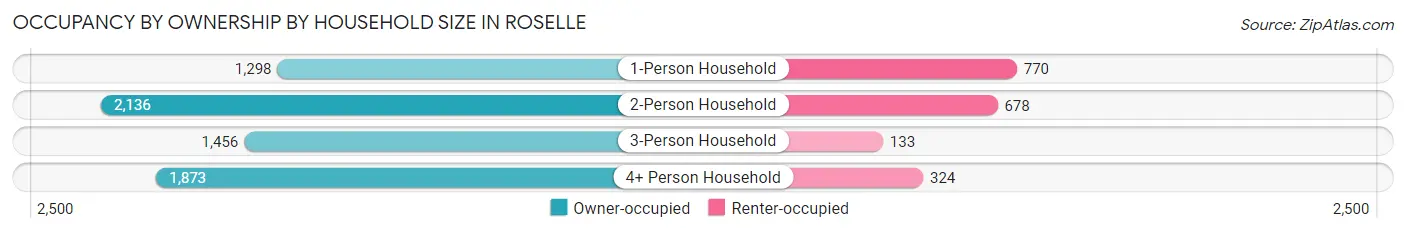
| Household Size | Owner-occupied | Renter-occupied |
| 1-Person Household | 1,298 (62.8%) | 770 (37.2%) |
| 2-Person Household | 2,136 (75.9%) | 678 (24.1%) |
| 3-Person Household | 1,456 (91.6%) | 133 (8.4%) |
| 4+ Person Household | 1,873 (85.3%) | 324 (14.7%) |
| Total Housing Units | 6,763 (78.0%) | 1,905 (22.0%) |
Occupancy by Educational Attainment in Roselle
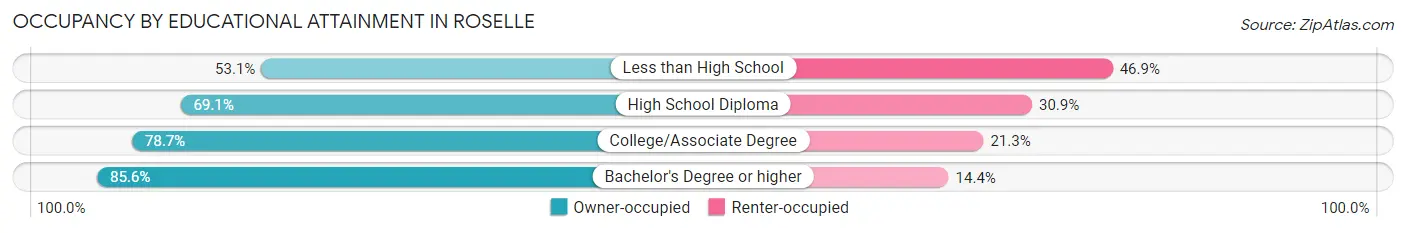
| Household Size | Owner-occupied | Renter-occupied |
| Less than High School | 274 (53.1%) | 242 (46.9%) |
| High School Diploma | 1,285 (69.1%) | 575 (30.9%) |
| College/Associate Degree | 2,094 (78.7%) | 566 (21.3%) |
| Bachelor's Degree or higher | 3,110 (85.6%) | 522 (14.4%) |
Occupancy by Age of Householder in Roselle
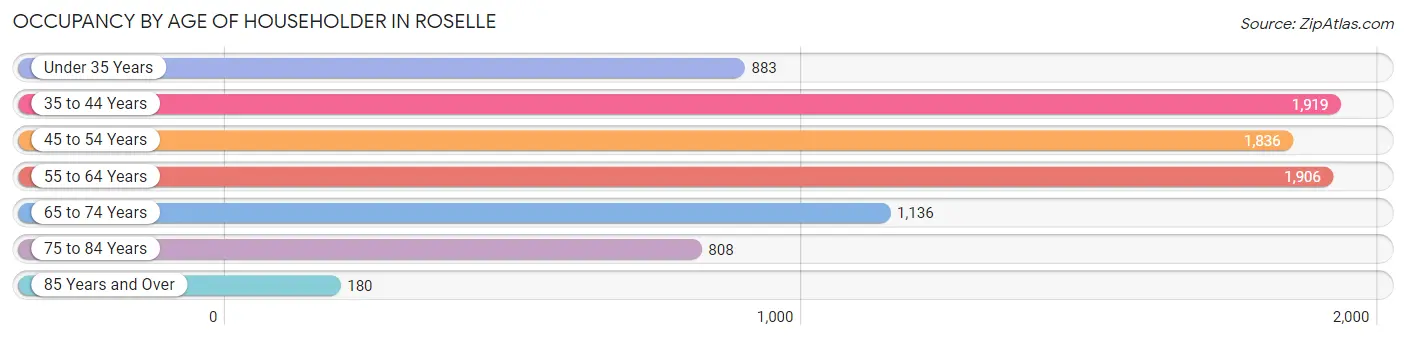
| Age Bracket | # Households | % Households |
| Under 35 Years | 883 | 10.2% |
| 35 to 44 Years | 1,919 | 22.1% |
| 45 to 54 Years | 1,836 | 21.2% |
| 55 to 64 Years | 1,906 | 22.0% |
| 65 to 74 Years | 1,136 | 13.1% |
| 75 to 84 Years | 808 | 9.3% |
| 85 Years and Over | 180 | 2.1% |
| Total | 8,668 | 100.0% |
Housing Finances in Roselle
Median Income by Occupancy in Roselle
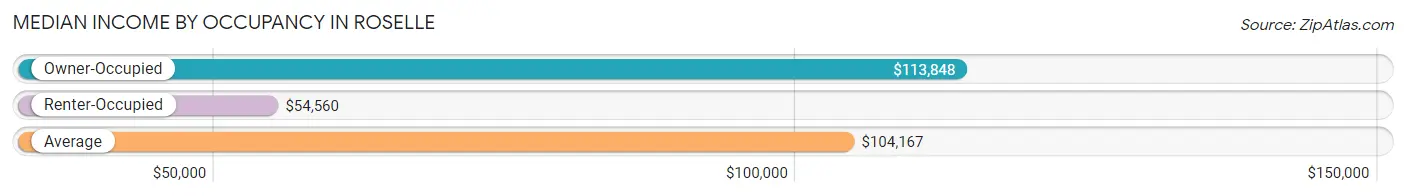
| Occupancy Type | # Households | Median Income |
| Owner-Occupied | 6,763 (78.0%) | $113,848 |
| Renter-Occupied | 1,905 (22.0%) | $54,560 |
| Average | 8,668 (100.0%) | $104,167 |
Occupancy by Householder Income Bracket in Roselle
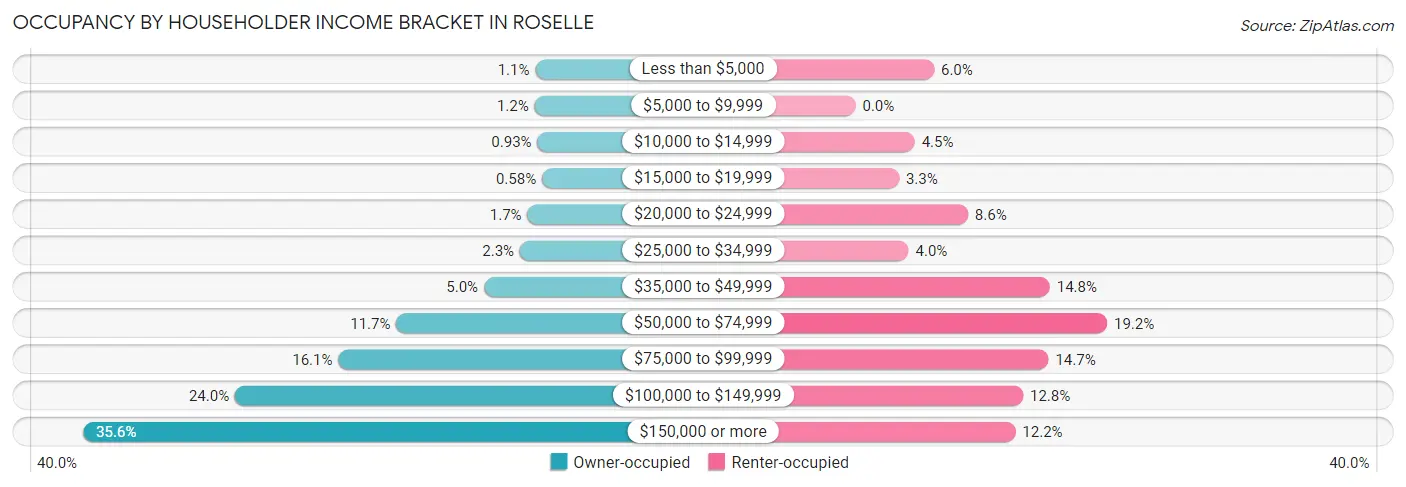
| Income Bracket | Owner-occupied | Renter-occupied |
| Less than $5,000 | 74 (1.1%) | 114 (6.0%) |
| $5,000 to $9,999 | 78 (1.1%) | 0 (0.0%) |
| $10,000 to $14,999 | 63 (0.9%) | 86 (4.5%) |
| $15,000 to $19,999 | 39 (0.6%) | 63 (3.3%) |
| $20,000 to $24,999 | 114 (1.7%) | 163 (8.6%) |
| $25,000 to $34,999 | 153 (2.3%) | 77 (4.0%) |
| $35,000 to $49,999 | 338 (5.0%) | 282 (14.8%) |
| $50,000 to $74,999 | 790 (11.7%) | 365 (19.2%) |
| $75,000 to $99,999 | 1,089 (16.1%) | 280 (14.7%) |
| $100,000 to $149,999 | 1,621 (24.0%) | 243 (12.8%) |
| $150,000 or more | 2,404 (35.5%) | 232 (12.2%) |
| Total | 6,763 (100.0%) | 1,905 (100.0%) |
Monthly Housing Cost Tiers in Roselle
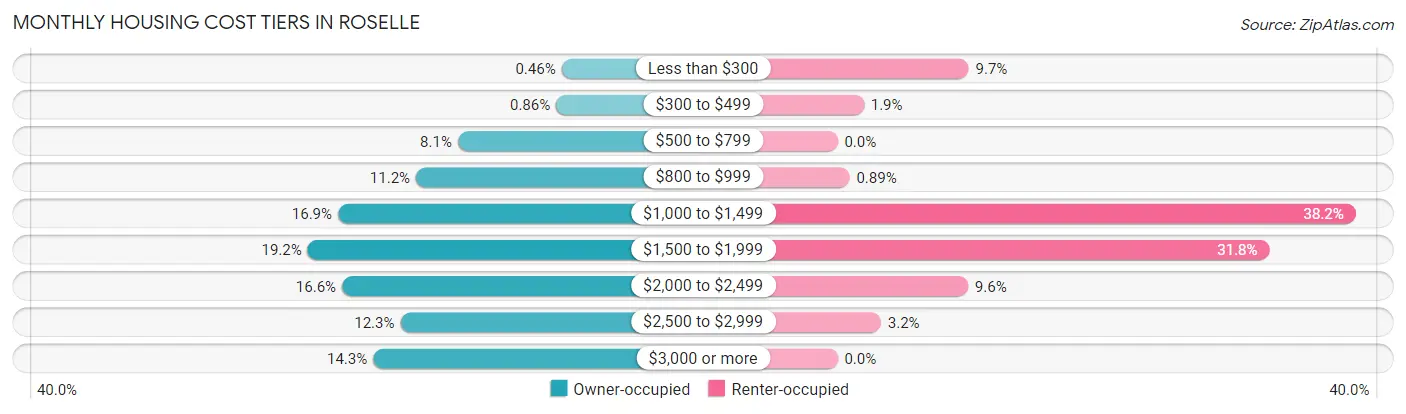
| Monthly Cost | Owner-occupied | Renter-occupied |
| Less than $300 | 31 (0.5%) | 184 (9.7%) |
| $300 to $499 | 58 (0.9%) | 37 (1.9%) |
| $500 to $799 | 548 (8.1%) | 0 (0.0%) |
| $800 to $999 | 756 (11.2%) | 17 (0.9%) |
| $1,000 to $1,499 | 1,145 (16.9%) | 727 (38.2%) |
| $1,500 to $1,999 | 1,296 (19.2%) | 606 (31.8%) |
| $2,000 to $2,499 | 1,125 (16.6%) | 183 (9.6%) |
| $2,500 to $2,999 | 834 (12.3%) | 61 (3.2%) |
| $3,000 or more | 970 (14.3%) | 0 (0.0%) |
| Total | 6,763 (100.0%) | 1,905 (100.0%) |
Physical Housing Characteristics in Roselle
Housing Structures in Roselle
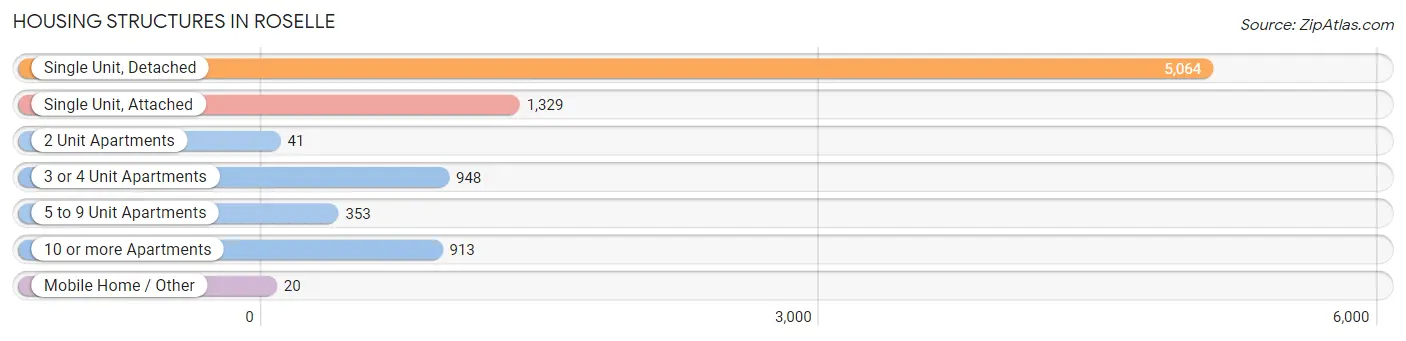
| Structure Type | # Housing Units | % Housing Units |
| Single Unit, Detached | 5,064 | 58.4% |
| Single Unit, Attached | 1,329 | 15.3% |
| 2 Unit Apartments | 41 | 0.5% |
| 3 or 4 Unit Apartments | 948 | 10.9% |
| 5 to 9 Unit Apartments | 353 | 4.1% |
| 10 or more Apartments | 913 | 10.5% |
| Mobile Home / Other | 20 | 0.2% |
| Total | 8,668 | 100.0% |
Housing Structures by Occupancy in Roselle
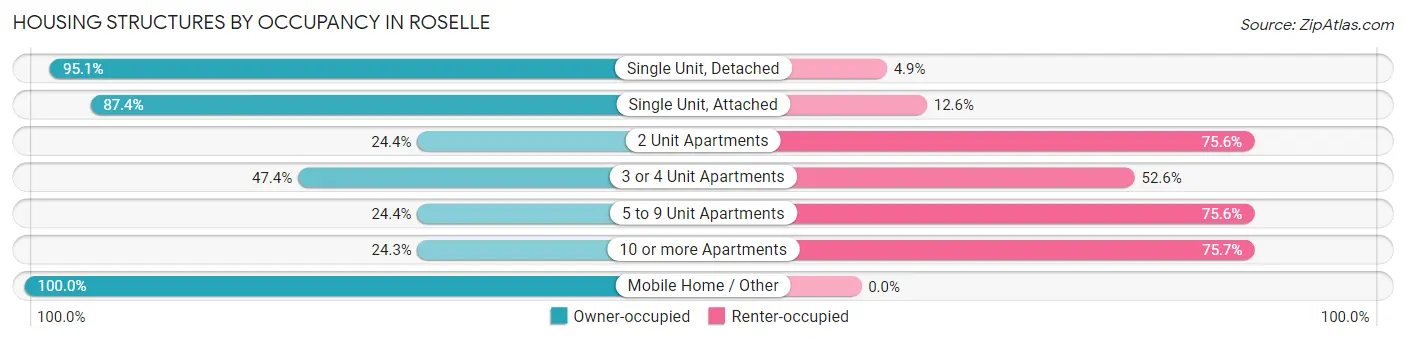
| Structure Type | Owner-occupied | Renter-occupied |
| Single Unit, Detached | 4,815 (95.1%) | 249 (4.9%) |
| Single Unit, Attached | 1,161 (87.4%) | 168 (12.6%) |
| 2 Unit Apartments | 10 (24.4%) | 31 (75.6%) |
| 3 or 4 Unit Apartments | 449 (47.4%) | 499 (52.6%) |
| 5 to 9 Unit Apartments | 86 (24.4%) | 267 (75.6%) |
| 10 or more Apartments | 222 (24.3%) | 691 (75.7%) |
| Mobile Home / Other | 20 (100.0%) | 0 (0.0%) |
| Total | 6,763 (78.0%) | 1,905 (22.0%) |
Housing Structures by Number of Rooms in Roselle
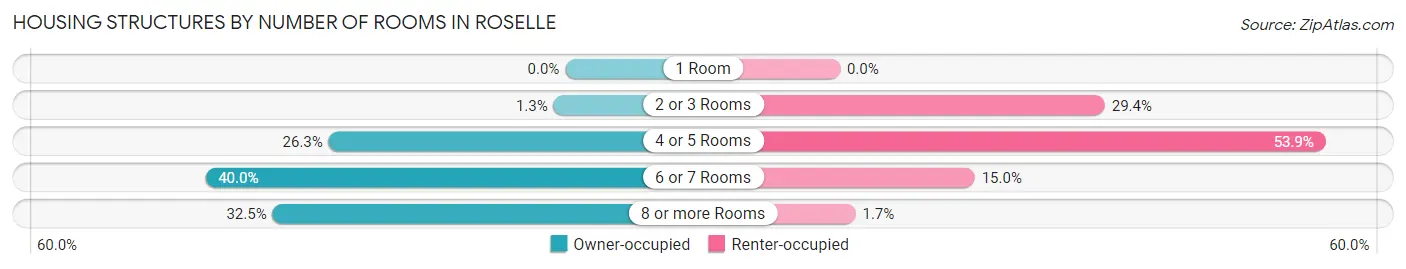
| Number of Rooms | Owner-occupied | Renter-occupied |
| 1 Room | 0 (0.0%) | 0 (0.0%) |
| 2 or 3 Rooms | 88 (1.3%) | 560 (29.4%) |
| 4 or 5 Rooms | 1,776 (26.3%) | 1,027 (53.9%) |
| 6 or 7 Rooms | 2,702 (40.0%) | 285 (15.0%) |
| 8 or more Rooms | 2,197 (32.5%) | 33 (1.7%) |
| Total | 6,763 (100.0%) | 1,905 (100.0%) |
Housing Structure by Heating Type in Roselle
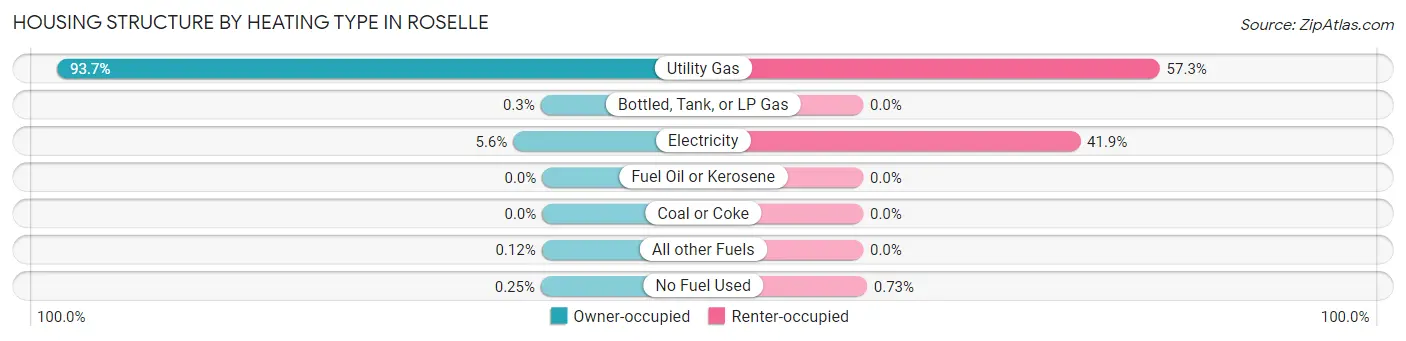
| Heating Type | Owner-occupied | Renter-occupied |
| Utility Gas | 6,339 (93.7%) | 1,092 (57.3%) |
| Bottled, Tank, or LP Gas | 20 (0.3%) | 0 (0.0%) |
| Electricity | 379 (5.6%) | 799 (41.9%) |
| Fuel Oil or Kerosene | 0 (0.0%) | 0 (0.0%) |
| Coal or Coke | 0 (0.0%) | 0 (0.0%) |
| All other Fuels | 8 (0.1%) | 0 (0.0%) |
| No Fuel Used | 17 (0.3%) | 14 (0.7%) |
| Total | 6,763 (100.0%) | 1,905 (100.0%) |
Household Vehicle Usage in Roselle
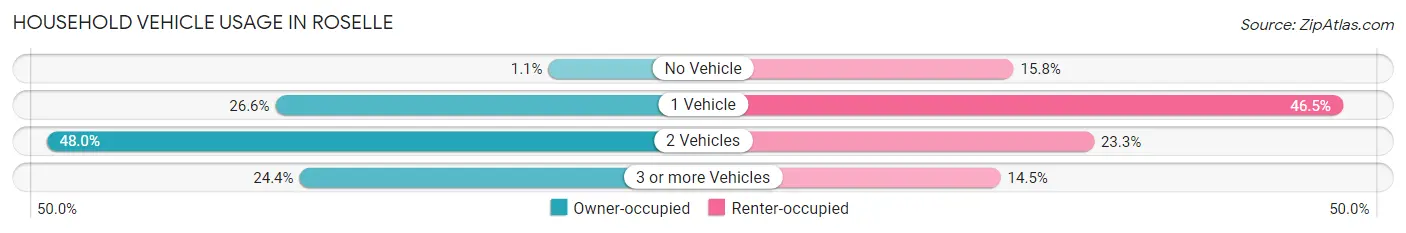
| Vehicles per Household | Owner-occupied | Renter-occupied |
| No Vehicle | 75 (1.1%) | 300 (15.8%) |
| 1 Vehicle | 1,798 (26.6%) | 885 (46.5%) |
| 2 Vehicles | 3,243 (47.9%) | 443 (23.3%) |
| 3 or more Vehicles | 1,647 (24.3%) | 277 (14.5%) |
| Total | 6,763 (100.0%) | 1,905 (100.0%) |
Real Estate & Mortgages in Roselle
Real Estate and Mortgage Overview in Roselle
| Characteristic | Without Mortgage | With Mortgage |
| Housing Units | 1,880 | 4,883 |
| Median Property Value | $292,900 | $305,700 |
| Median Household Income | $89,789 | $1,886 |
| Monthly Housing Costs | $920 | $967 |
| Real Estate Taxes | $6,894 | $75 |
Property Value by Mortgage Status in Roselle
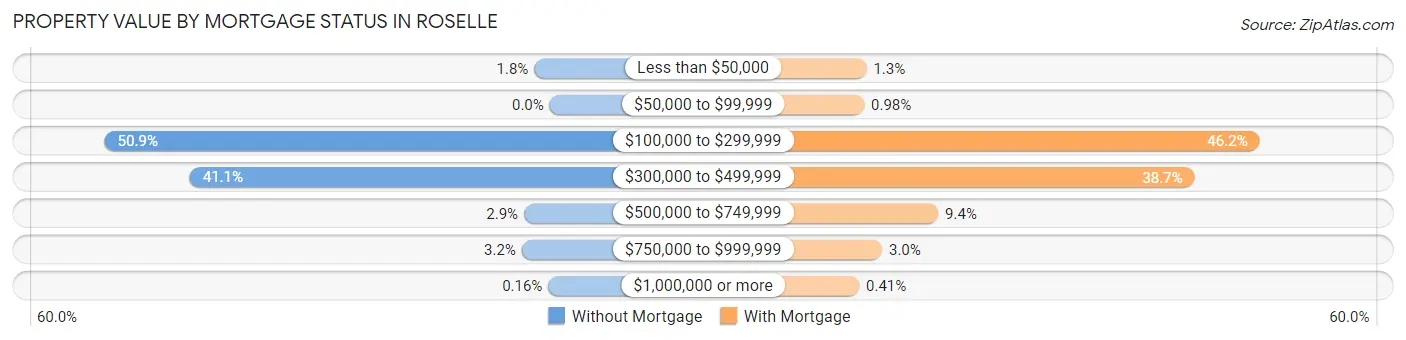
| Property Value | Without Mortgage | With Mortgage |
| Less than $50,000 | 33 (1.8%) | 61 (1.3%) |
| $50,000 to $99,999 | 0 (0.0%) | 48 (1.0%) |
| $100,000 to $299,999 | 956 (50.8%) | 2,254 (46.2%) |
| $300,000 to $499,999 | 773 (41.1%) | 1,891 (38.7%) |
| $500,000 to $749,999 | 55 (2.9%) | 461 (9.4%) |
| $750,000 to $999,999 | 60 (3.2%) | 148 (3.0%) |
| $1,000,000 or more | 3 (0.2%) | 20 (0.4%) |
| Total | 1,880 (100.0%) | 4,883 (100.0%) |
Household Income by Mortgage Status in Roselle
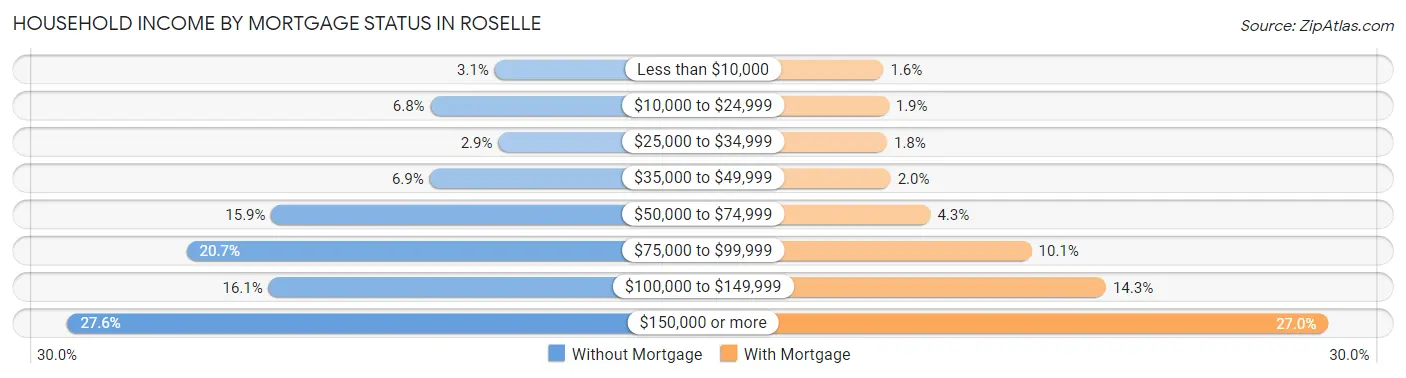
| Household Income | Without Mortgage | With Mortgage |
| Less than $10,000 | 59 (3.1%) | 78 (1.6%) |
| $10,000 to $24,999 | 128 (6.8%) | 93 (1.9%) |
| $25,000 to $34,999 | 55 (2.9%) | 88 (1.8%) |
| $35,000 to $49,999 | 129 (6.9%) | 98 (2.0%) |
| $50,000 to $74,999 | 299 (15.9%) | 209 (4.3%) |
| $75,000 to $99,999 | 390 (20.7%) | 491 (10.1%) |
| $100,000 to $149,999 | 302 (16.1%) | 699 (14.3%) |
| $150,000 or more | 518 (27.6%) | 1,319 (27.0%) |
| Total | 1,880 (100.0%) | 4,883 (100.0%) |
Property Value to Household Income Ratio in Roselle
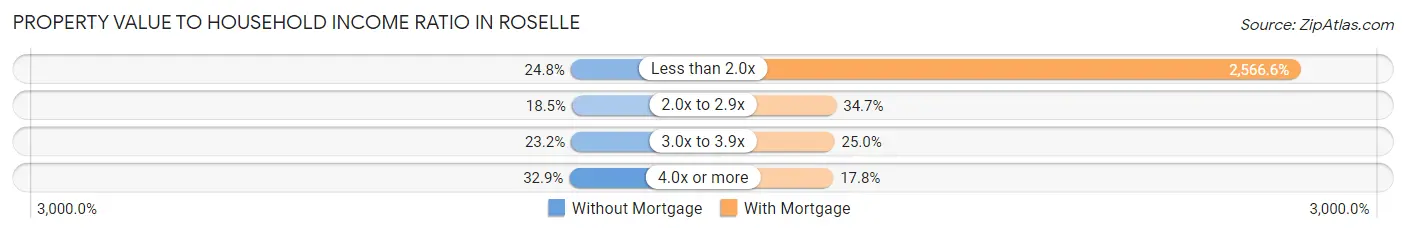
| Value-to-Income Ratio | Without Mortgage | With Mortgage |
| Less than 2.0x | 467 (24.8%) | 125,327 (2,566.6%) |
| 2.0x to 2.9x | 348 (18.5%) | 1,694 (34.7%) |
| 3.0x to 3.9x | 436 (23.2%) | 1,221 (25.0%) |
| 4.0x or more | 619 (32.9%) | 870 (17.8%) |
| Total | 1,880 (100.0%) | 4,883 (100.0%) |
Real Estate Taxes by Mortgage Status in Roselle
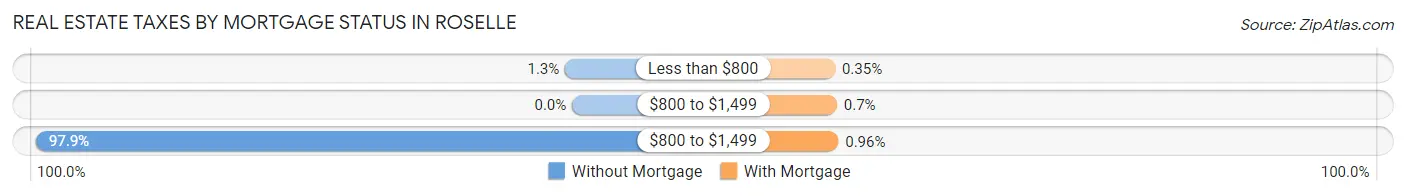
| Property Taxes | Without Mortgage | With Mortgage |
| Less than $800 | 24 (1.3%) | 17 (0.4%) |
| $800 to $1,499 | 0 (0.0%) | 34 (0.7%) |
| $800 to $1,499 | 1,841 (97.9%) | 47 (1.0%) |
| Total | 1,880 (100.0%) | 4,883 (100.0%) |
Health & Disability in Roselle
Health Insurance Coverage by Age in Roselle
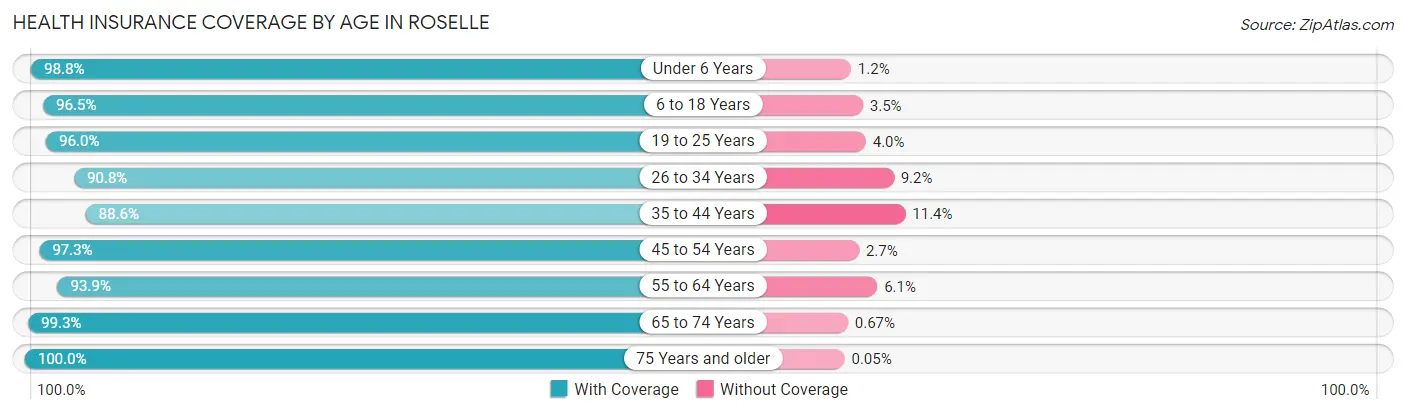
| Age Bracket | With Coverage | Without Coverage |
| Under 6 Years | 1,125 (98.8%) | 14 (1.2%) |
| 6 to 18 Years | 3,404 (96.5%) | 122 (3.5%) |
| 19 to 25 Years | 1,965 (96.0%) | 82 (4.0%) |
| 26 to 34 Years | 2,001 (90.8%) | 203 (9.2%) |
| 35 to 44 Years | 3,004 (88.6%) | 386 (11.4%) |
| 45 to 54 Years | 3,314 (97.3%) | 93 (2.7%) |
| 55 to 64 Years | 3,071 (93.9%) | 201 (6.1%) |
| 65 to 74 Years | 1,917 (99.3%) | 13 (0.7%) |
| 75 Years and older | 1,853 (100.0%) | 1 (0.1%) |
| Total | 21,654 (95.1%) | 1,115 (4.9%) |
Health Insurance Coverage by Citizenship Status in Roselle
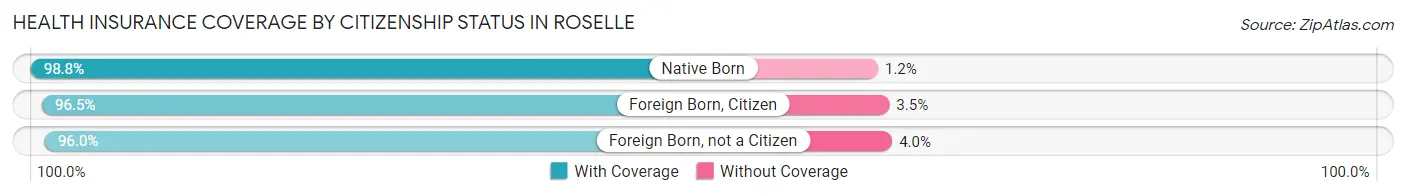
| Citizenship Status | With Coverage | Without Coverage |
| Native Born | 1,125 (98.8%) | 14 (1.2%) |
| Foreign Born, Citizen | 3,404 (96.5%) | 122 (3.5%) |
| Foreign Born, not a Citizen | 1,965 (96.0%) | 82 (4.0%) |
Health Insurance Coverage by Household Income in Roselle
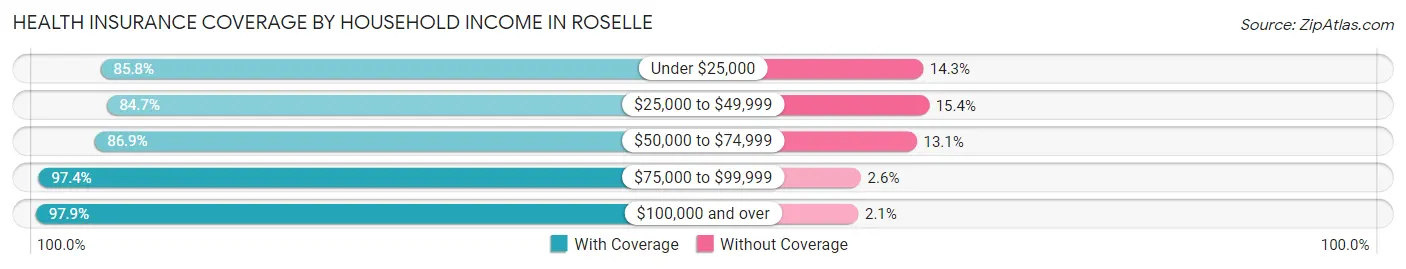
| Household Income | With Coverage | Without Coverage |
| Under $25,000 | 975 (85.8%) | 162 (14.2%) |
| $25,000 to $49,999 | 1,318 (84.7%) | 239 (15.3%) |
| $50,000 to $74,999 | 2,176 (86.9%) | 327 (13.1%) |
| $75,000 to $99,999 | 3,113 (97.4%) | 83 (2.6%) |
| $100,000 and over | 14,066 (97.9%) | 303 (2.1%) |
Public vs Private Health Insurance Coverage by Age in Roselle
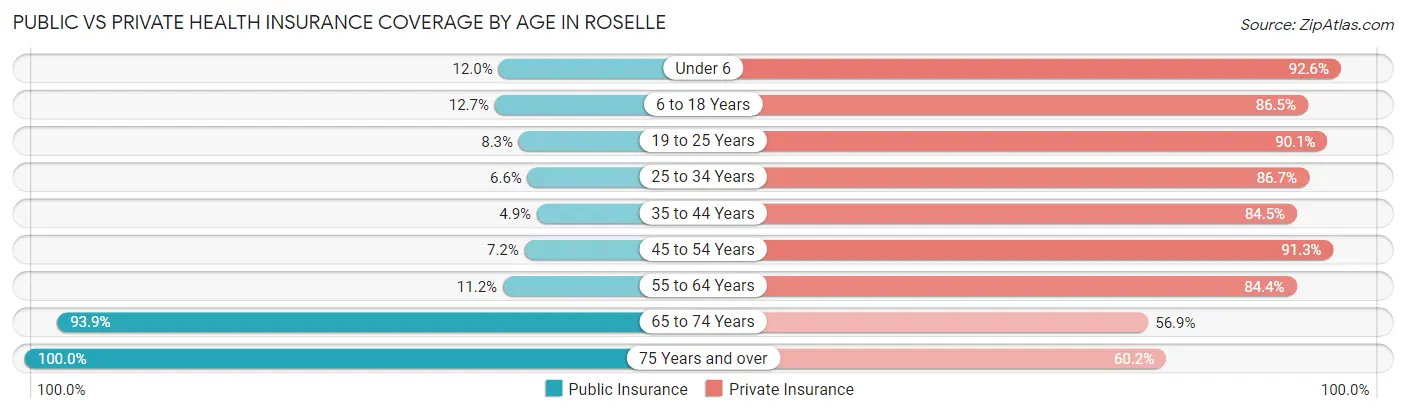
| Age Bracket | Public Insurance | Private Insurance |
| Under 6 | 137 (12.0%) | 1,055 (92.6%) |
| 6 to 18 Years | 449 (12.7%) | 3,050 (86.5%) |
| 19 to 25 Years | 169 (8.3%) | 1,845 (90.1%) |
| 25 to 34 Years | 146 (6.6%) | 1,910 (86.7%) |
| 35 to 44 Years | 166 (4.9%) | 2,864 (84.5%) |
| 45 to 54 Years | 245 (7.2%) | 3,109 (91.2%) |
| 55 to 64 Years | 367 (11.2%) | 2,761 (84.4%) |
| 65 to 74 Years | 1,813 (93.9%) | 1,098 (56.9%) |
| 75 Years and over | 1,853 (100.0%) | 1,116 (60.2%) |
| Total | 5,345 (23.5%) | 18,808 (82.6%) |
Disability Status by Sex by Age in Roselle
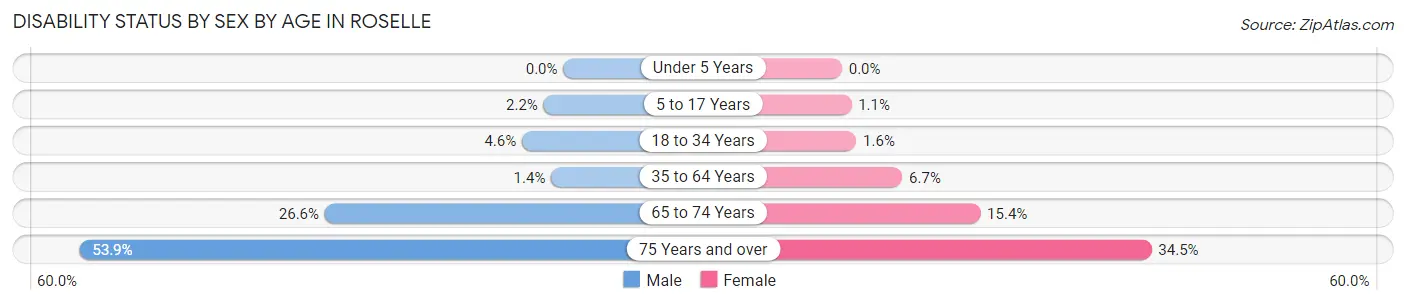
| Age Bracket | Male | Female |
| Under 5 Years | 0 (0.0%) | 0 (0.0%) |
| 5 to 17 Years | 39 (2.2%) | 19 (1.1%) |
| 18 to 34 Years | 98 (4.6%) | 37 (1.6%) |
| 35 to 64 Years | 67 (1.3%) | 343 (6.7%) |
| 65 to 74 Years | 242 (26.6%) | 157 (15.4%) |
| 75 Years and over | 449 (53.9%) | 352 (34.5%) |
Disability Class by Sex by Age in Roselle
Disability Class: Hearing Difficulty
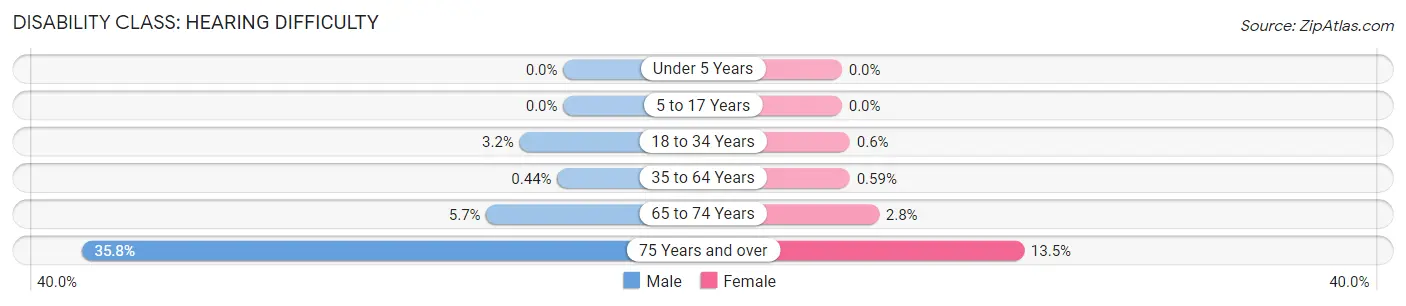
| Age Bracket | Male | Female |
| Under 5 Years | 0 (0.0%) | 0 (0.0%) |
| 5 to 17 Years | 0 (0.0%) | 0 (0.0%) |
| 18 to 34 Years | 69 (3.2%) | 14 (0.6%) |
| 35 to 64 Years | 22 (0.4%) | 30 (0.6%) |
| 65 to 74 Years | 52 (5.7%) | 28 (2.8%) |
| 75 Years and over | 298 (35.8%) | 138 (13.5%) |
Disability Class: Vision Difficulty
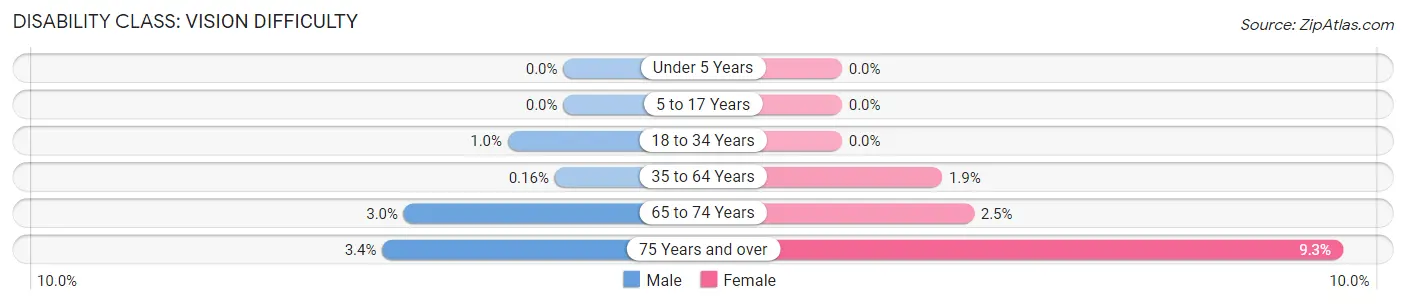
| Age Bracket | Male | Female |
| Under 5 Years | 0 (0.0%) | 0 (0.0%) |
| 5 to 17 Years | 0 (0.0%) | 0 (0.0%) |
| 18 to 34 Years | 22 (1.0%) | 0 (0.0%) |
| 35 to 64 Years | 8 (0.2%) | 95 (1.9%) |
| 65 to 74 Years | 27 (3.0%) | 25 (2.5%) |
| 75 Years and over | 28 (3.4%) | 95 (9.3%) |
Disability Class: Cognitive Difficulty
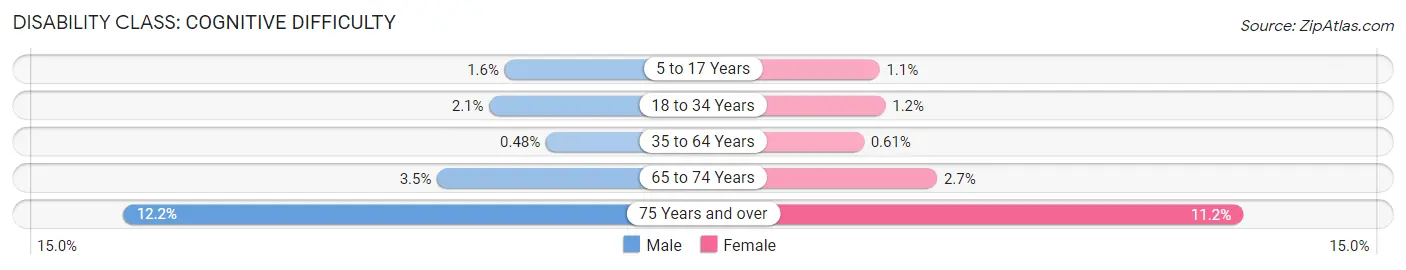
| Age Bracket | Male | Female |
| 5 to 17 Years | 29 (1.6%) | 19 (1.1%) |
| 18 to 34 Years | 44 (2.1%) | 28 (1.2%) |
| 35 to 64 Years | 24 (0.5%) | 31 (0.6%) |
| 65 to 74 Years | 32 (3.5%) | 27 (2.6%) |
| 75 Years and over | 102 (12.2%) | 114 (11.2%) |
Disability Class: Ambulatory Difficulty
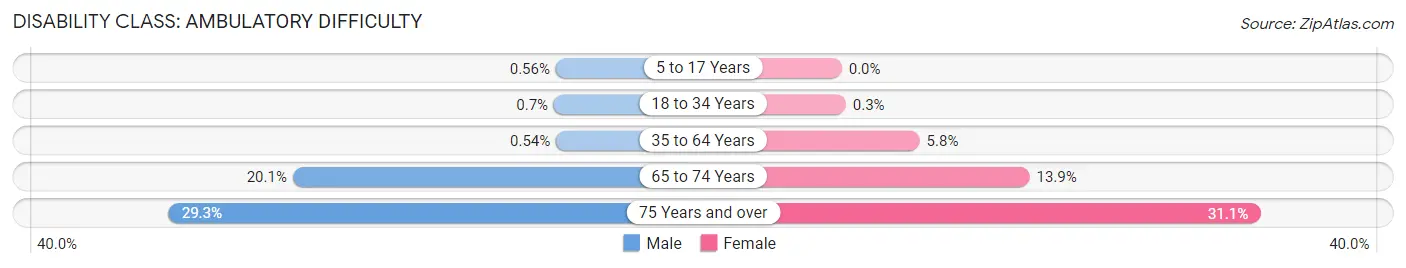
| Age Bracket | Male | Female |
| 5 to 17 Years | 10 (0.6%) | 0 (0.0%) |
| 18 to 34 Years | 15 (0.7%) | 7 (0.3%) |
| 35 to 64 Years | 27 (0.5%) | 295 (5.8%) |
| 65 to 74 Years | 183 (20.1%) | 142 (13.9%) |
| 75 Years and over | 244 (29.3%) | 317 (31.0%) |
Disability Class: Self-Care Difficulty
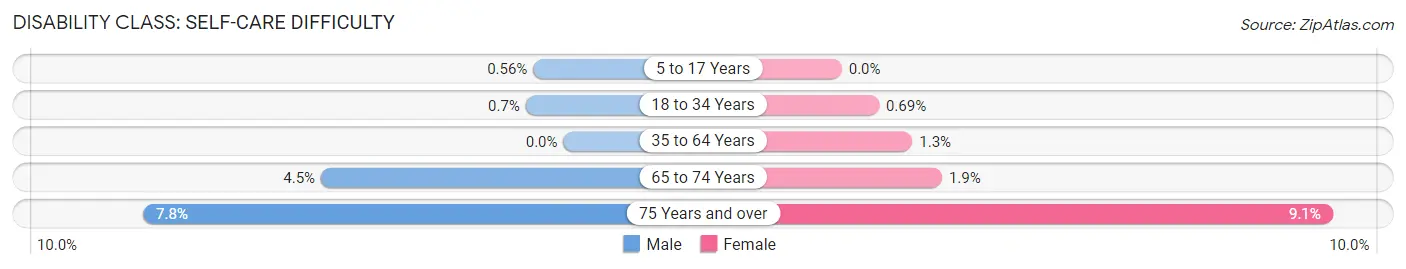
| Age Bracket | Male | Female |
| 5 to 17 Years | 10 (0.6%) | 0 (0.0%) |
| 18 to 34 Years | 15 (0.7%) | 16 (0.7%) |
| 35 to 64 Years | 0 (0.0%) | 67 (1.3%) |
| 65 to 74 Years | 41 (4.5%) | 19 (1.9%) |
| 75 Years and over | 65 (7.8%) | 93 (9.1%) |
Technology Access in Roselle
Computing Device Access in Roselle
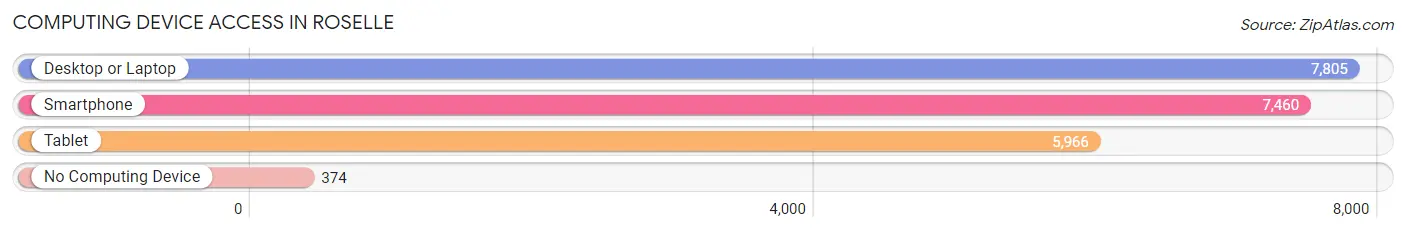
| Device Type | # Households | % Households |
| Desktop or Laptop | 7,805 | 90.0% |
| Smartphone | 7,460 | 86.1% |
| Tablet | 5,966 | 68.8% |
| No Computing Device | 374 | 4.3% |
| Total | 8,668 | 100.0% |
Internet Access in Roselle
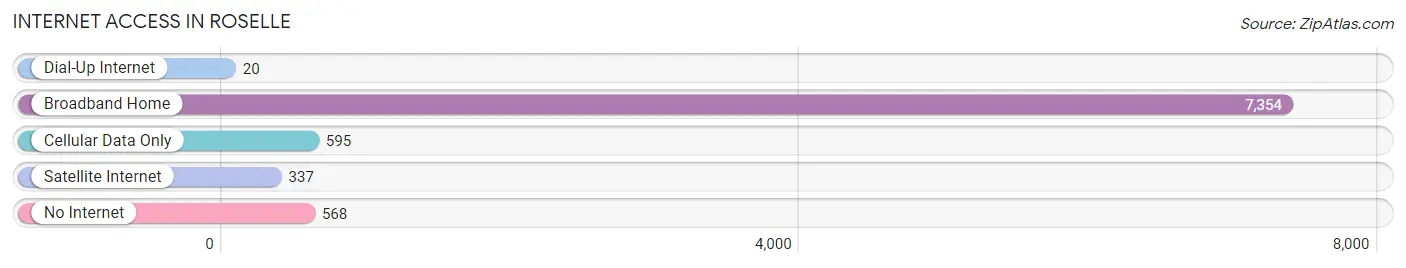
| Internet Type | # Households | % Households |
| Dial-Up Internet | 20 | 0.2% |
| Broadband Home | 7,354 | 84.8% |
| Cellular Data Only | 595 | 6.9% |
| Satellite Internet | 337 | 3.9% |
| No Internet | 568 | 6.6% |
| Total | 8,668 | 100.0% |
Roselle Summary
Roselle, Illinois is a village located in DuPage County, approximately 25 miles northwest of Chicago. The village is part of the Chicago metropolitan area and is home to a population of 22,763 people as of the 2010 census. Roselle is a diverse community with a rich history, unique geography, and a vibrant economy.
History
The area that is now Roselle was first settled in the 1830s by German and Irish immigrants. The village was originally known as Bloomingdale, and was incorporated in 1922. The name was changed to Roselle in 1924, after the wife of the village's first mayor, Rosella.
In the 1950s, Roselle experienced a period of rapid growth and development. The village was home to a number of new businesses, including a shopping center, a movie theater, and a bowling alley. The population of the village grew from 1,500 in 1950 to over 10,000 by 1960.
Geography
Roselle is located in DuPage County, approximately 25 miles northwest of Chicago. The village is bordered by Bloomingdale to the north, Schaumburg to the east, and Addison to the south. The village is situated on the banks of the Salt Creek, which flows through the village and into the Des Plaines River.
The village is divided into four distinct neighborhoods: Roselle, Bloomingdale, Schaumburg, and Addison. Each neighborhood has its own unique character and charm. Roselle is a residential neighborhood with a mix of single-family homes and apartment buildings. Bloomingdale is a commercial district with a variety of shops and restaurants. Schaumburg is a suburban neighborhood with a mix of single-family homes and townhomes. Addison is a residential neighborhood with a mix of single-family homes and apartment buildings.
Economy
Roselle is home to a diverse economy. The village is home to a number of large employers, including the Roselle Park District, the Roselle Public Library, and the Roselle Fire Department. The village is also home to a number of small businesses, including restaurants, retail stores, and professional services.
The village is also home to a number of industrial and manufacturing businesses. The village is home to a number of warehouses and distribution centers, as well as a number of manufacturing plants.
Demographics
As of the 2010 census, the population of Roselle was 22,763. The population is diverse, with a mix of races and ethnicities. The largest racial group is White (63.3%), followed by Hispanic (17.2%), African American (10.2%), Asian (5.2%), and other (4.1%).
The median household income in Roselle is $63,945, and the median home value is $219,400. The village has a high rate of homeownership, with 73.3% of residents owning their homes.
Roselle is a vibrant and diverse community with a rich history, unique geography, and a vibrant economy. The village is home to a number of large employers, small businesses, and industrial and manufacturing businesses. The village is also home to a diverse population, with a mix of races and ethnicities. Roselle is a great place to live, work, and play.
Common Questions
What is Per Capita Income in Roselle?
Per Capita income in Roselle is $49,099.
What is the Median Family Income in Roselle?
Median Family Income in Roselle is $124,936.
What is the Median Household income in Roselle?
Median Household Income in Roselle is $104,167.
What is Income or Wage Gap in Roselle?
Income or Wage Gap in Roselle is 35.5%.
Women in Roselle earn 64.5 cents for every dollar earned by a man.
What is Inequality or Gini Index in Roselle?
Inequality or Gini Index in Roselle is 0.40.
What is the Total Population of Roselle?
Total Population of Roselle is 22,846.
What is the Total Male Population of Roselle?
Total Male Population of Roselle is 10,970.
What is the Total Female Population of Roselle?
Total Female Population of Roselle is 11,876.
What is the Ratio of Males per 100 Females in Roselle?
There are 92.37 Males per 100 Females in Roselle.
What is the Ratio of Females per 100 Males in Roselle?
There are 108.26 Females per 100 Males in Roselle.
What is the Median Population Age in Roselle?
Median Population Age in Roselle is 42.2 Years.
What is the Average Family Size in Roselle
Average Family Size in Roselle is 3.1 People.
What is the Average Household Size in Roselle
Average Household Size in Roselle is 2.6 People.
How Large is the Labor Force in Roselle?
There are 13,341 People in the Labor Forcein in Roselle.
What is the Percentage of People in the Labor Force in Roselle?
70.5% of People are in the Labor Force in Roselle.
What is the Unemployment Rate in Roselle?
Unemployment Rate in Roselle is 7.3%.