Lake In The Hills, IL Map & Demographics
Lake In The Hills Map
Lake In The Hills Overview
$42,778
PER CAPITA INCOME
$127,795
AVG FAMILY INCOME
$110,988
AVG HOUSEHOLD INCOME
33.2%
WAGE / INCOME GAP [ % ]
66.8¢/ $1
WAGE / INCOME GAP [ $ ]
0.34
INEQUALITY / GINI INDEX
28,958
TOTAL POPULATION
14,355
MALE POPULATION
14,603
FEMALE POPULATION
98.30
MALES / 100 FEMALES
101.73
FEMALES / 100 MALES
35.9
MEDIAN AGE
3.4
AVG FAMILY SIZE
2.9
AVG HOUSEHOLD SIZE
16,749
LABOR FORCE [ PEOPLE ]
75.1%
PERCENT IN LABOR FORCE
5.6%
UNEMPLOYMENT RATE
Lake In The Hills Zip Codes
Income in Lake In The Hills
Income Overview in Lake In The Hills
Per Capita Income in Lake In The Hills is $42,778, while median incomes of families and households are $127,795 and $110,988 respectively.
| Characteristic | Number | Measure |
| Per Capita Income | 28,958 | $42,778 |
| Median Family Income | 7,722 | $127,795 |
| Mean Family Income | 7,722 | $139,013 |
| Median Household Income | 9,878 | $110,988 |
| Mean Household Income | 9,878 | $125,630 |
| Income Deficit | 7,722 | $0 |
| Wage / Income Gap (%) | 28,958 | 33.17% |
| Wage / Income Gap ($) | 28,958 | 66.83¢ per $1 |
| Gini / Inequality Index | 28,958 | 0.34 |
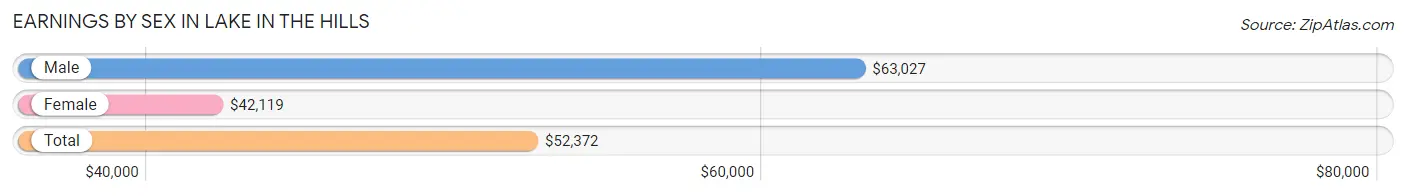
Earnings by Sex in Lake In The Hills
Average Earnings in Lake In The Hills are $52,372, $63,027 for men and $42,119 for women, a difference of 33.2%.
| Sex | Number | Average Earnings |
| Male | 8,981 (52.1%) | $63,027 |
| Female | 8,246 (47.9%) | $42,119 |
| Total | 17,227 (100.0%) | $52,372 |
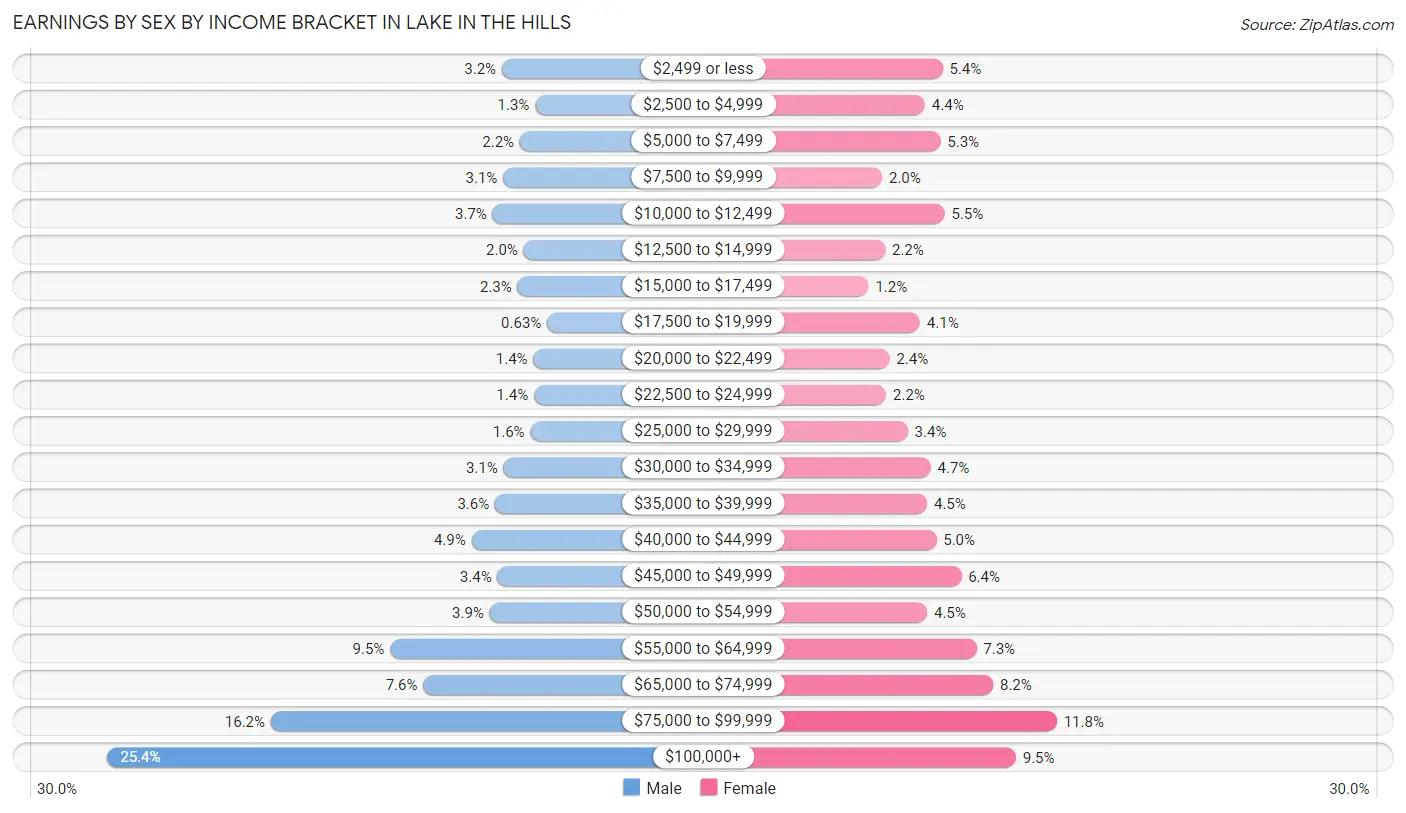
Earnings by Sex by Income Bracket in Lake In The Hills
The most common earnings brackets in Lake In The Hills are $100,000+ for men (2,277 | 25.4%) and $75,000 to $99,999 for women (973 | 11.8%).
| Income | Male | Female |
| $2,499 or less | 285 (3.2%) | 444 (5.4%) |
| $2,500 to $4,999 | 117 (1.3%) | 362 (4.4%) |
| $5,000 to $7,499 | 194 (2.2%) | 434 (5.3%) |
| $7,500 to $9,999 | 278 (3.1%) | 163 (2.0%) |
| $10,000 to $12,499 | 331 (3.7%) | 453 (5.5%) |
| $12,500 to $14,999 | 175 (1.9%) | 177 (2.1%) |
| $15,000 to $17,499 | 206 (2.3%) | 101 (1.2%) |
| $17,500 to $19,999 | 57 (0.6%) | 339 (4.1%) |
| $20,000 to $22,499 | 126 (1.4%) | 198 (2.4%) |
| $22,500 to $24,999 | 123 (1.4%) | 182 (2.2%) |
| $25,000 to $29,999 | 141 (1.6%) | 282 (3.4%) |
| $30,000 to $34,999 | 277 (3.1%) | 388 (4.7%) |
| $35,000 to $39,999 | 320 (3.6%) | 372 (4.5%) |
| $40,000 to $44,999 | 438 (4.9%) | 415 (5.0%) |
| $45,000 to $49,999 | 307 (3.4%) | 530 (6.4%) |
| $50,000 to $54,999 | 347 (3.9%) | 372 (4.5%) |
| $55,000 to $64,999 | 849 (9.5%) | 600 (7.3%) |
| $65,000 to $74,999 | 682 (7.6%) | 678 (8.2%) |
| $75,000 to $99,999 | 1,451 (16.2%) | 973 (11.8%) |
| $100,000+ | 2,277 (25.4%) | 783 (9.5%) |
| Total | 8,981 (100.0%) | 8,246 (100.0%) |
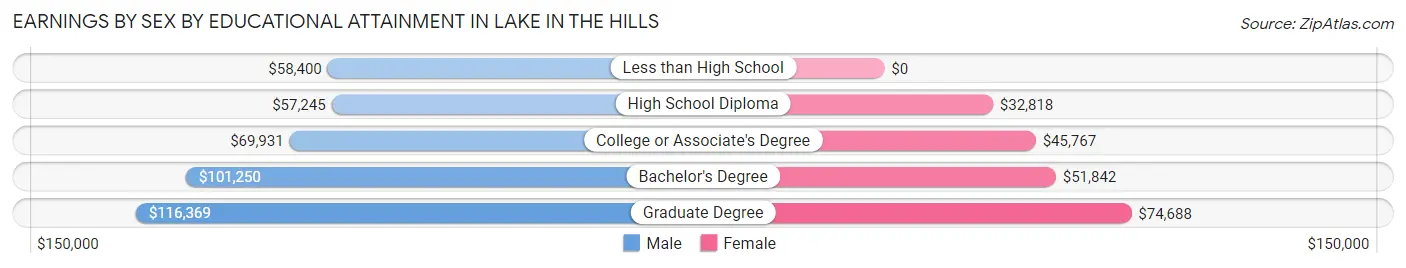
Earnings by Sex by Educational Attainment in Lake In The Hills
Average earnings in Lake In The Hills are $72,109 for men and $50,486 for women, a difference of 30.0%. Men with an educational attainment of graduate degree enjoy the highest average annual earnings of $116,369, while those with high school diploma education earn the least with $57,245. Women with an educational attainment of graduate degree earn the most with the average annual earnings of $74,688, while those with high school diploma education have the smallest earnings of $32,818.
| Educational Attainment | Male Income | Female Income |
| Less than High School | $58,400 | $0 |
| High School Diploma | $57,245 | $32,818 |
| College or Associate's Degree | $69,931 | $45,767 |
| Bachelor's Degree | $101,250 | $51,842 |
| Graduate Degree | $116,369 | $74,688 |
| Total | $72,109 | $50,486 |
Family Income in Lake In The Hills
Family Income Brackets in Lake In The Hills
According to the Lake In The Hills family income data, there are 1,992 families falling into the $100,000 to $149,999 income range, which is the most common income bracket and makes up 25.8% of all families. Conversely, the less than $10,000 income bracket is the least frequent group with only 31 families (0.4%) belonging to this category.
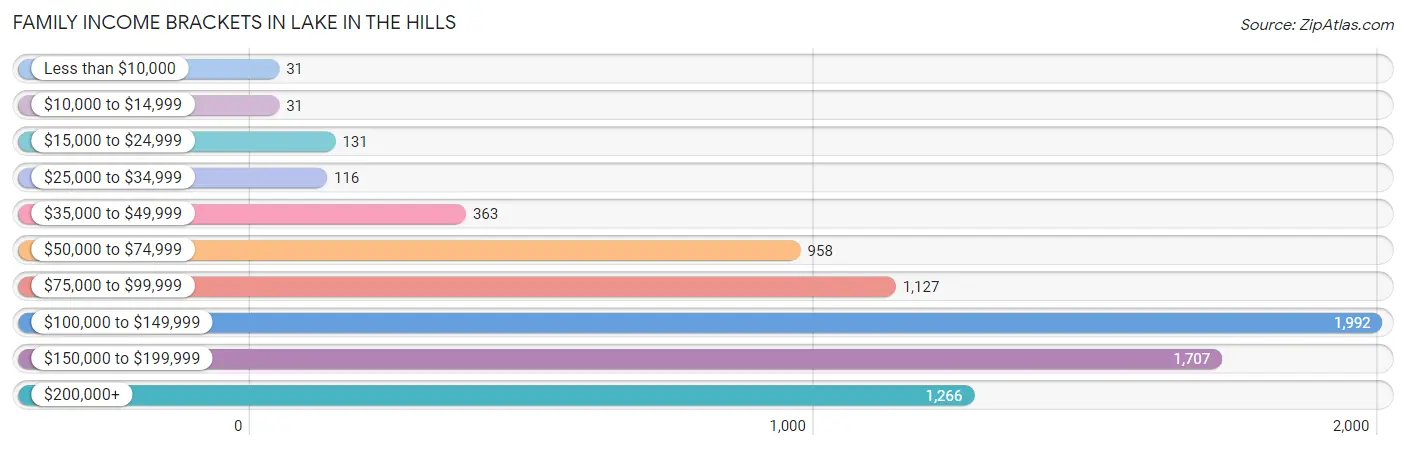
| Income Bracket | # Families | % Families |
| Less than $10,000 | 31 | 0.4% |
| $10,000 to $14,999 | 31 | 0.4% |
| $15,000 to $24,999 | 131 | 1.7% |
| $25,000 to $34,999 | 116 | 1.5% |
| $35,000 to $49,999 | 363 | 4.7% |
| $50,000 to $74,999 | 958 | 12.4% |
| $75,000 to $99,999 | 1,127 | 14.6% |
| $100,000 to $149,999 | 1,992 | 25.8% |
| $150,000 to $199,999 | 1,707 | 22.1% |
| $200,000+ | 1,266 | 16.4% |
Family Income by Famaliy Size in Lake In The Hills
6-person families (156 | 2.0%) account for the highest median family income in Lake In The Hills with $163,000 per family, while 2-person families (2,513 | 32.5%) have the highest median income of $53,856 per family member.
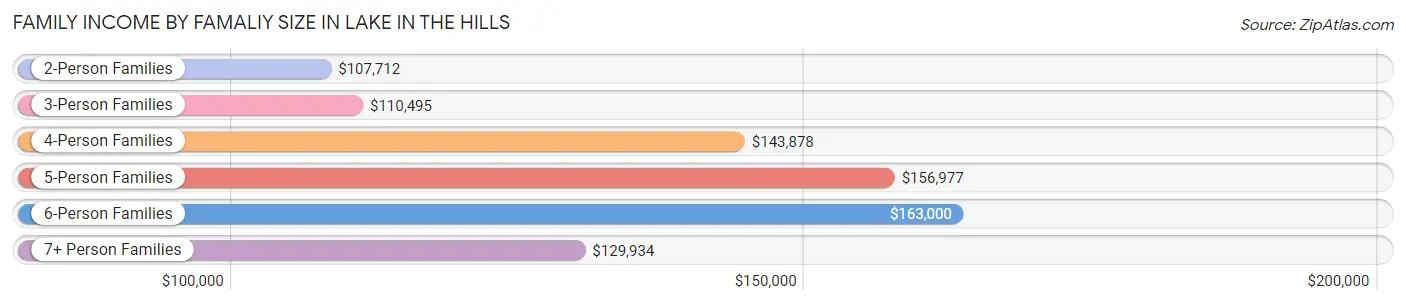
| Income Bracket | # Families | Median Income |
| 2-Person Families | 2,513 (32.5%) | $107,712 |
| 3-Person Families | 1,729 (22.4%) | $110,495 |
| 4-Person Families | 2,095 (27.1%) | $143,878 |
| 5-Person Families | 1,060 (13.7%) | $156,977 |
| 6-Person Families | 156 (2.0%) | $163,000 |
| 7+ Person Families | 169 (2.2%) | $129,934 |
| Total | 7,722 (100.0%) | $127,795 |
Family Income by Number of Earners in Lake In The Hills
The median family income in Lake In The Hills is $127,795, with families comprising 3+ earners (1,624) having the highest median family income of $165,933, while families with 1 earner (1,875) have the lowest median family income of $87,472, accounting for 21.0% and 24.3% of families, respectively.
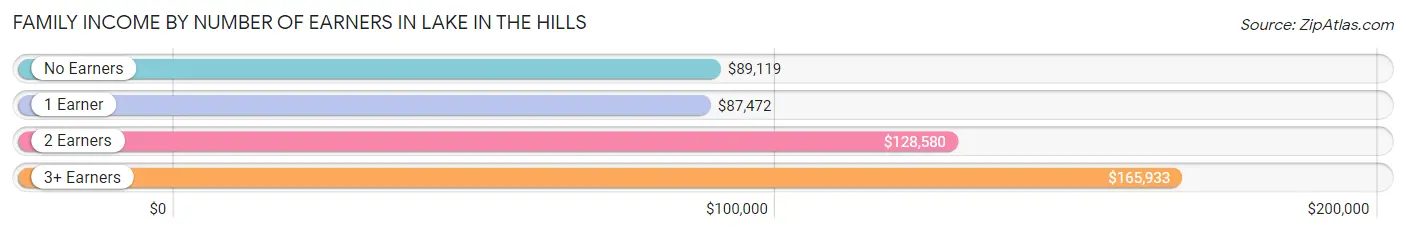
| Number of Earners | # Families | Median Income |
| No Earners | 439 (5.7%) | $89,119 |
| 1 Earner | 1,875 (24.3%) | $87,472 |
| 2 Earners | 3,784 (49.0%) | $128,580 |
| 3+ Earners | 1,624 (21.0%) | $165,933 |
| Total | 7,722 (100.0%) | $127,795 |
Household Income in Lake In The Hills
Household Income Brackets in Lake In The Hills
With 2,341 households falling in the category, the $100,000 to $149,999 income range is the most frequent in Lake In The Hills, accounting for 23.7% of all households. In contrast, only 69 households (0.7%) fall into the $10,000 to $14,999 income bracket, making it the least populous group.
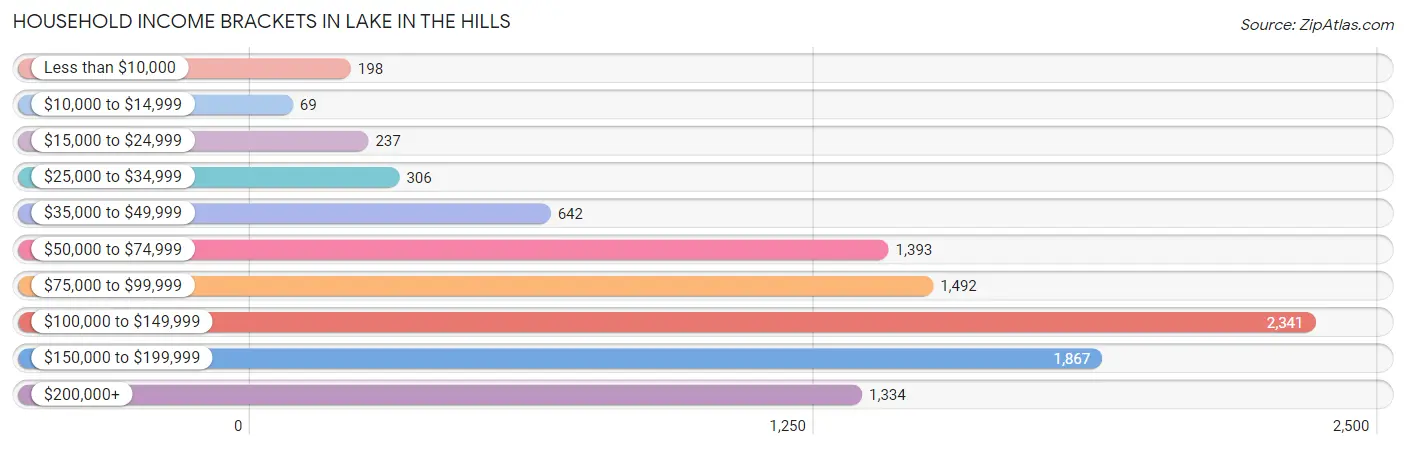
| Income Bracket | # Households | % Households |
| Less than $10,000 | 198 | 2.0% |
| $10,000 to $14,999 | 69 | 0.7% |
| $15,000 to $24,999 | 237 | 2.4% |
| $25,000 to $34,999 | 306 | 3.1% |
| $35,000 to $49,999 | 642 | 6.5% |
| $50,000 to $74,999 | 1,393 | 14.1% |
| $75,000 to $99,999 | 1,492 | 15.1% |
| $100,000 to $149,999 | 2,341 | 23.7% |
| $150,000 to $199,999 | 1,867 | 18.9% |
| $200,000+ | 1,334 | 13.5% |
Household Income by Householder Age in Lake In The Hills
The median household income in Lake In The Hills is $110,988, with the highest median household income of $126,205 found in the 45 to 64 years age bracket for the primary householder. A total of 4,471 households (45.3%) fall into this category. Meanwhile, the 65+ years age bracket for the primary householder has the lowest median household income of $69,150, with 1,570 households (15.9%) in this group.
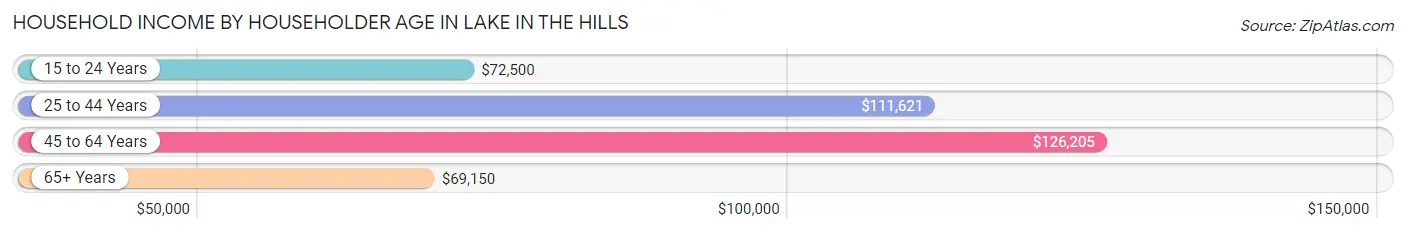
| Income Bracket | # Households | Median Income |
| 15 to 24 Years | 192 (1.9%) | $72,500 |
| 25 to 44 Years | 3,645 (36.9%) | $111,621 |
| 45 to 64 Years | 4,471 (45.3%) | $126,205 |
| 65+ Years | 1,570 (15.9%) | $69,150 |
| Total | 9,878 (100.0%) | $110,988 |
Poverty in Lake In The Hills
Income Below Poverty by Sex and Age in Lake In The Hills
With 3.4% poverty level for males and 3.9% for females among the residents of Lake In The Hills, 5 year old males and 75 year old and over females are the most vulnerable to poverty, with 29 males (14.6%) and 66 females (11.0%) in their respective age groups living below the poverty level.
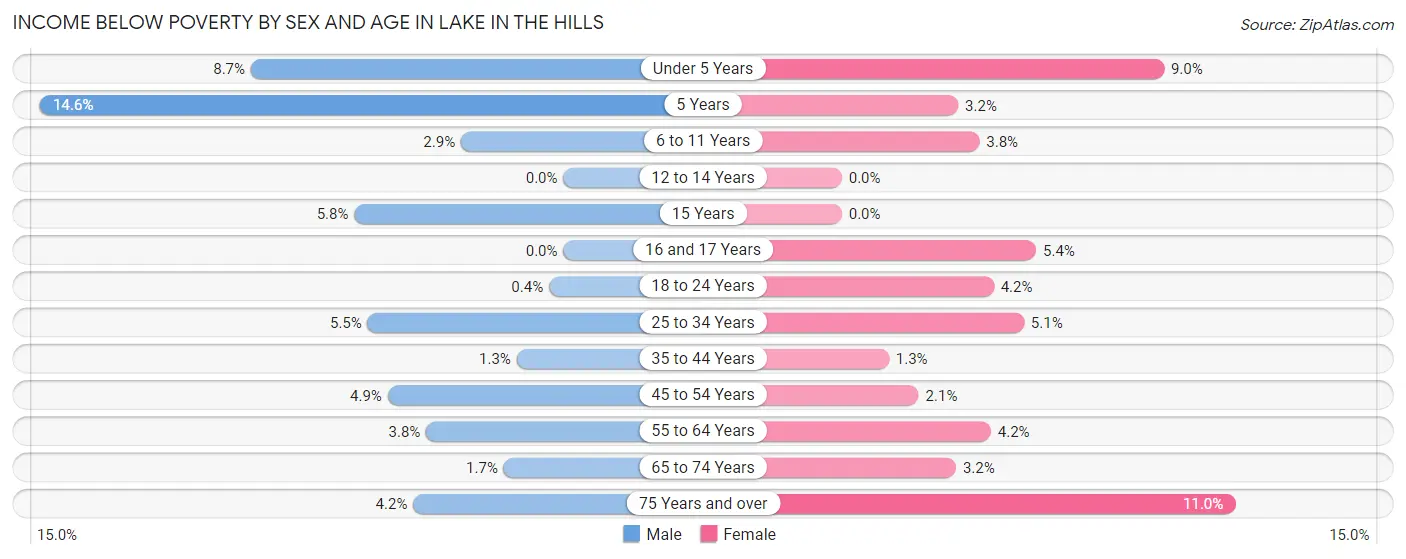
| Age Bracket | Male | Female |
| Under 5 Years | 84 (8.7%) | 84 (9.0%) |
| 5 Years | 29 (14.6%) | 7 (3.2%) |
| 6 to 11 Years | 37 (2.9%) | 49 (3.8%) |
| 12 to 14 Years | 0 (0.0%) | 0 (0.0%) |
| 15 Years | 11 (5.8%) | 0 (0.0%) |
| 16 and 17 Years | 0 (0.0%) | 38 (5.4%) |
| 18 to 24 Years | 6 (0.4%) | 60 (4.2%) |
| 25 to 34 Years | 91 (5.4%) | 83 (5.1%) |
| 35 to 44 Years | 28 (1.3%) | 27 (1.3%) |
| 45 to 54 Years | 109 (4.9%) | 49 (2.1%) |
| 55 to 64 Years | 63 (3.8%) | 73 (4.2%) |
| 65 to 74 Years | 12 (1.7%) | 30 (3.2%) |
| 75 Years and over | 20 (4.2%) | 66 (11.0%) |
| Total | 490 (3.4%) | 566 (3.9%) |
Income Above Poverty by Sex and Age in Lake In The Hills
According to the poverty statistics in Lake In The Hills, males aged 12 to 14 years and females aged 12 to 14 years are the age groups that are most secure financially, with 100.0% of males and 100.0% of females in these age groups living above the poverty line.
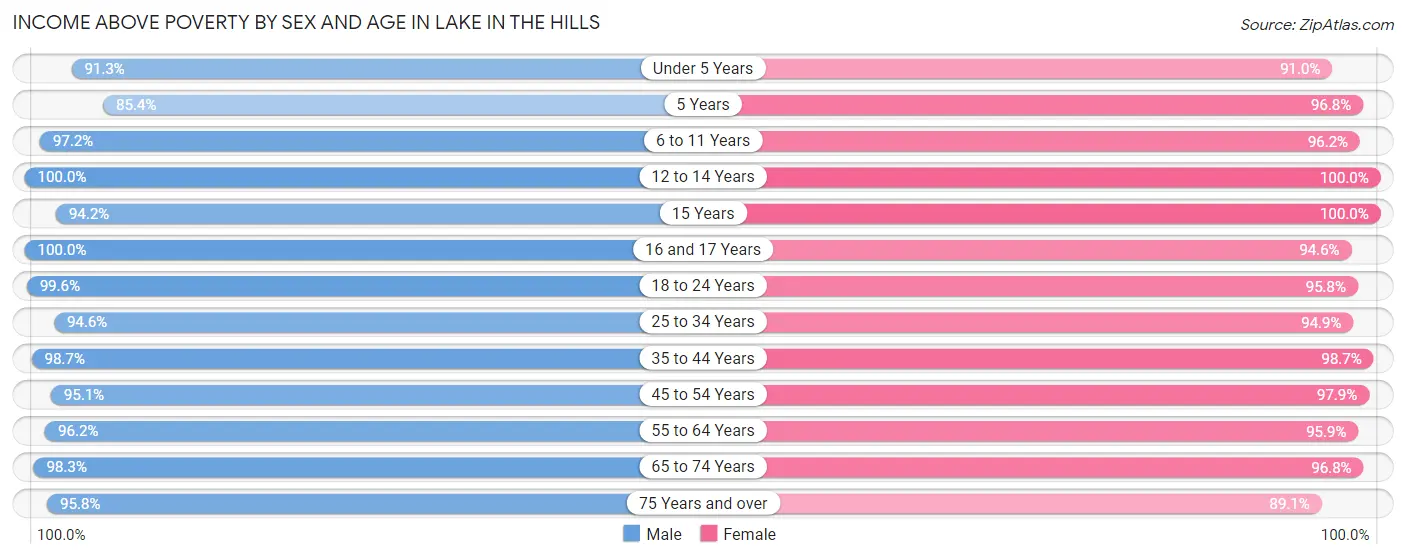
| Age Bracket | Male | Female |
| Under 5 Years | 881 (91.3%) | 852 (91.0%) |
| 5 Years | 170 (85.4%) | 209 (96.8%) |
| 6 to 11 Years | 1,263 (97.2%) | 1,232 (96.2%) |
| 12 to 14 Years | 781 (100.0%) | 578 (100.0%) |
| 15 Years | 178 (94.2%) | 154 (100.0%) |
| 16 and 17 Years | 497 (100.0%) | 665 (94.6%) |
| 18 to 24 Years | 1,483 (99.6%) | 1,360 (95.8%) |
| 25 to 34 Years | 1,579 (94.6%) | 1,554 (94.9%) |
| 35 to 44 Years | 2,120 (98.7%) | 2,039 (98.7%) |
| 45 to 54 Years | 2,119 (95.1%) | 2,241 (97.9%) |
| 55 to 64 Years | 1,585 (96.2%) | 1,688 (95.9%) |
| 65 to 74 Years | 709 (98.3%) | 912 (96.8%) |
| 75 Years and over | 459 (95.8%) | 537 (89.0%) |
| Total | 13,824 (96.6%) | 14,021 (96.1%) |
Income Below Poverty Among Married-Couple Families in Lake In The Hills
The poverty statistics for married-couple families in Lake In The Hills show that 0.9% or 56 of the total 6,153 families live below the poverty line. Families with 5 or more children have the highest poverty rate of 11.5%, comprising of 7 families. On the other hand, families with 3 or 4 children have the lowest poverty rate of 0.0%, which includes 0 families.
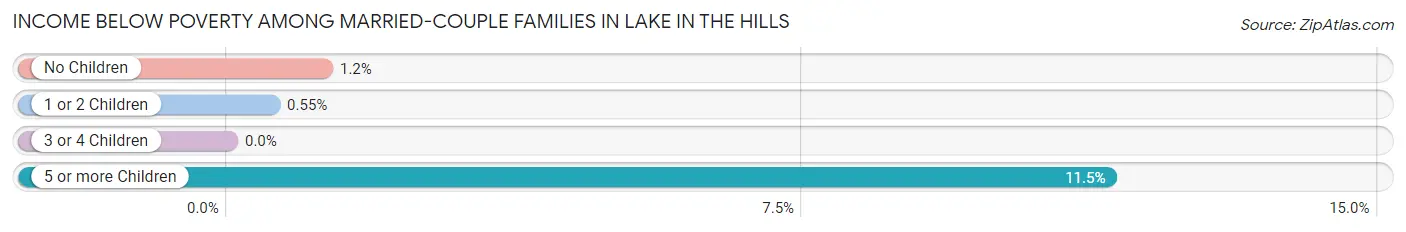
| Children | Above Poverty | Below Poverty |
| No Children | 2,698 (98.8%) | 34 (1.2%) |
| 1 or 2 Children | 2,709 (99.5%) | 15 (0.5%) |
| 3 or 4 Children | 636 (100.0%) | 0 (0.0%) |
| 5 or more Children | 54 (88.5%) | 7 (11.5%) |
| Total | 6,097 (99.1%) | 56 (0.9%) |
Income Below Poverty Among Single-Parent Households in Lake In The Hills
According to the poverty data in Lake In The Hills, 6.9% or 40 single-father households and 6.4% or 63 single-mother households are living below the poverty line. Among single-father households, those with 1 or 2 children have the highest poverty rate, with 31 households (7.5%) experiencing poverty. Likewise, among single-mother households, those with 3 or 4 children have the highest poverty rate, with 33 households (40.7%) falling below the poverty line.
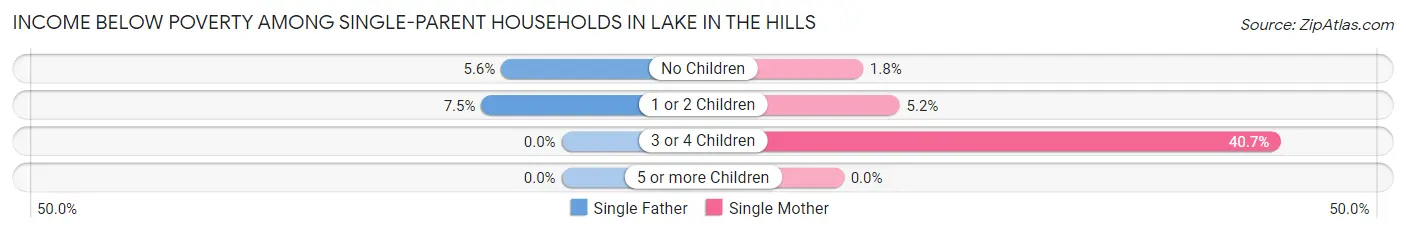
| Children | Single Father | Single Mother |
| No Children | 9 (5.6%) | 9 (1.8%) |
| 1 or 2 Children | 31 (7.5%) | 21 (5.2%) |
| 3 or 4 Children | 0 (0.0%) | 33 (40.7%) |
| 5 or more Children | 0 (0.0%) | 0 (0.0%) |
| Total | 40 (6.9%) | 63 (6.4%) |
Income Below Poverty Among Married-Couple vs Single-Parent Households in Lake In The Hills
The poverty data for Lake In The Hills shows that 56 of the married-couple family households (0.9%) and 103 of the single-parent households (6.6%) are living below the poverty level. Within the married-couple family households, those with 5 or more children have the highest poverty rate, with 7 households (11.5%) falling below the poverty line. Among the single-parent households, those with 3 or 4 children have the highest poverty rate, with 33 household (40.7%) living below poverty.
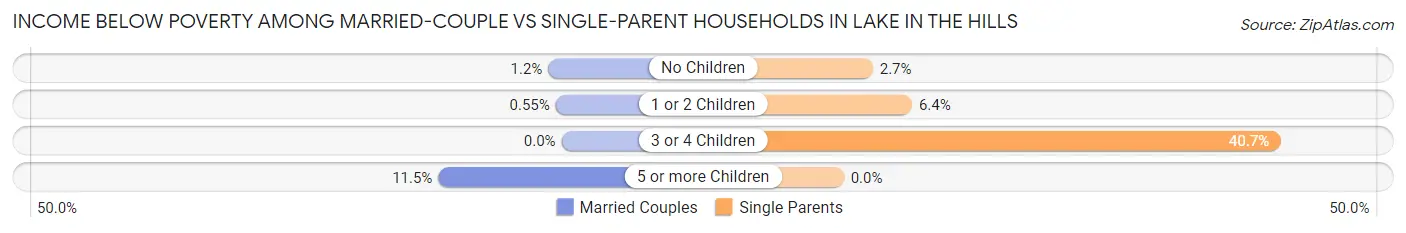
| Children | Married-Couple Families | Single-Parent Households |
| No Children | 34 (1.2%) | 18 (2.7%) |
| 1 or 2 Children | 15 (0.5%) | 52 (6.4%) |
| 3 or 4 Children | 0 (0.0%) | 33 (40.7%) |
| 5 or more Children | 7 (11.5%) | 0 (0.0%) |
| Total | 56 (0.9%) | 103 (6.6%) |
Race in Lake In The Hills
The most populous races in Lake In The Hills are White / Caucasian (22,763 | 78.6%), Hispanic or Latino (4,529 | 15.6%), and Two or more Races (2,603 | 9.0%).
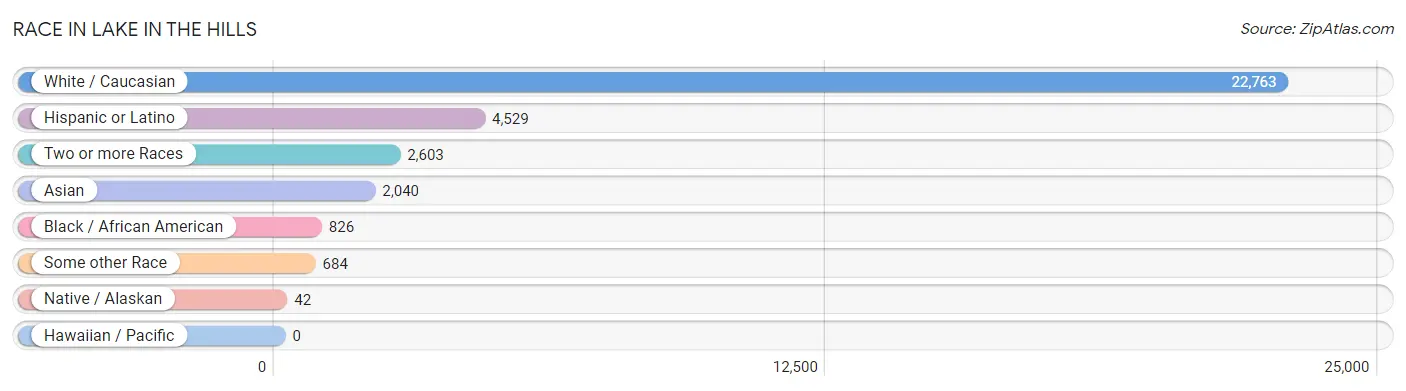
| Race | # Population | % Population |
| Asian | 2,040 | 7.0% |
| Black / African American | 826 | 2.9% |
| Hawaiian / Pacific | 0 | 0.0% |
| Hispanic or Latino | 4,529 | 15.6% |
| Native / Alaskan | 42 | 0.2% |
| White / Caucasian | 22,763 | 78.6% |
| Two or more Races | 2,603 | 9.0% |
| Some other Race | 684 | 2.4% |
| Total | 28,958 | 100.0% |
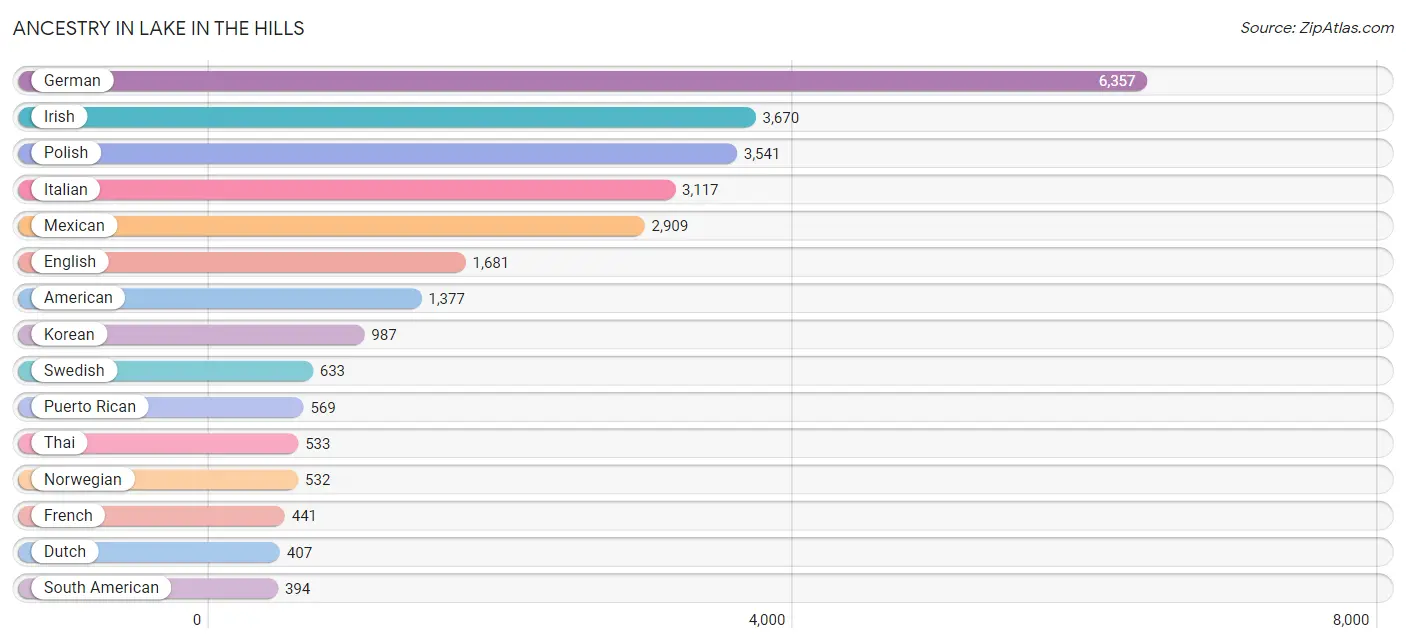
Ancestry in Lake In The Hills
The most populous ancestries reported in Lake In The Hills are German (6,357 | 22.0%), Irish (3,670 | 12.7%), Polish (3,541 | 12.2%), Italian (3,117 | 10.8%), and Mexican (2,909 | 10.1%), together accounting for 67.7% of all Lake In The Hills residents.
| Ancestry | # Population | % Population |
| African | 44 | 0.2% |
| Albanian | 44 | 0.2% |
| American | 1,377 | 4.8% |
| Arab | 190 | 0.7% |
| Argentinean | 22 | 0.1% |
| Armenian | 12 | 0.0% |
| Assyrian / Chaldean / Syriac | 50 | 0.2% |
| Austrian | 193 | 0.7% |
| Belgian | 42 | 0.2% |
| Belizean | 30 | 0.1% |
| Bhutanese | 232 | 0.8% |
| Brazilian | 13 | 0.0% |
| British | 164 | 0.6% |
| Bulgarian | 77 | 0.3% |
| Burmese | 270 | 0.9% |
| Canadian | 37 | 0.1% |
| Central American | 242 | 0.8% |
| Chilean | 61 | 0.2% |
| Chippewa | 7 | 0.0% |
| Colombian | 121 | 0.4% |
| Costa Rican | 26 | 0.1% |
| Croatian | 11 | 0.0% |
| Cuban | 222 | 0.8% |
| Czech | 269 | 0.9% |
| Czechoslovakian | 43 | 0.2% |
| Danish | 107 | 0.4% |
| Dutch | 407 | 1.4% |
| Eastern European | 18 | 0.1% |
| English | 1,681 | 5.8% |
| European | 282 | 1.0% |
| Finnish | 82 | 0.3% |
| French | 441 | 1.5% |
| French Canadian | 17 | 0.1% |
| German | 6,357 | 22.0% |
| Ghanaian | 23 | 0.1% |
| Greek | 299 | 1.0% |
| Guatemalan | 78 | 0.3% |
| Hungarian | 79 | 0.3% |
| Indian (Asian) | 255 | 0.9% |
| Indonesian | 101 | 0.4% |
| Irish | 3,670 | 12.7% |
| Israeli | 34 | 0.1% |
| Italian | 3,117 | 10.8% |
| Korean | 987 | 3.4% |
| Lebanese | 50 | 0.2% |
| Lithuanian | 360 | 1.2% |
| Luxembourger | 7 | 0.0% |
| Mexican | 2,909 | 10.1% |
| Mexican American Indian | 39 | 0.1% |
| Navajo | 15 | 0.1% |
| Nicaraguan | 14 | 0.1% |
| Northern European | 24 | 0.1% |
| Norwegian | 532 | 1.8% |
| Pakistani | 46 | 0.2% |
| Palestinian | 120 | 0.4% |
| Panamanian | 29 | 0.1% |
| Peruvian | 190 | 0.7% |
| Polish | 3,541 | 12.2% |
| Puerto Rican | 569 | 2.0% |
| Romanian | 133 | 0.5% |
| Russian | 142 | 0.5% |
| Salvadoran | 95 | 0.3% |
| Scandinavian | 100 | 0.4% |
| Scotch-Irish | 180 | 0.6% |
| Scottish | 197 | 0.7% |
| Serbian | 67 | 0.2% |
| Slavic | 104 | 0.4% |
| Slovak | 5 | 0.0% |
| Slovene | 43 | 0.2% |
| South African | 11 | 0.0% |
| South American | 394 | 1.4% |
| Spaniard | 37 | 0.1% |
| Sri Lankan | 203 | 0.7% |
| Subsaharan African | 55 | 0.2% |
| Swedish | 633 | 2.2% |
| Swiss | 118 | 0.4% |
| Thai | 533 | 1.8% |
| Turkish | 35 | 0.1% |
| Ukrainian | 189 | 0.6% |
| Welsh | 87 | 0.3% |
| Yugoslavian | 98 | 0.3% | View All 81 Rows |
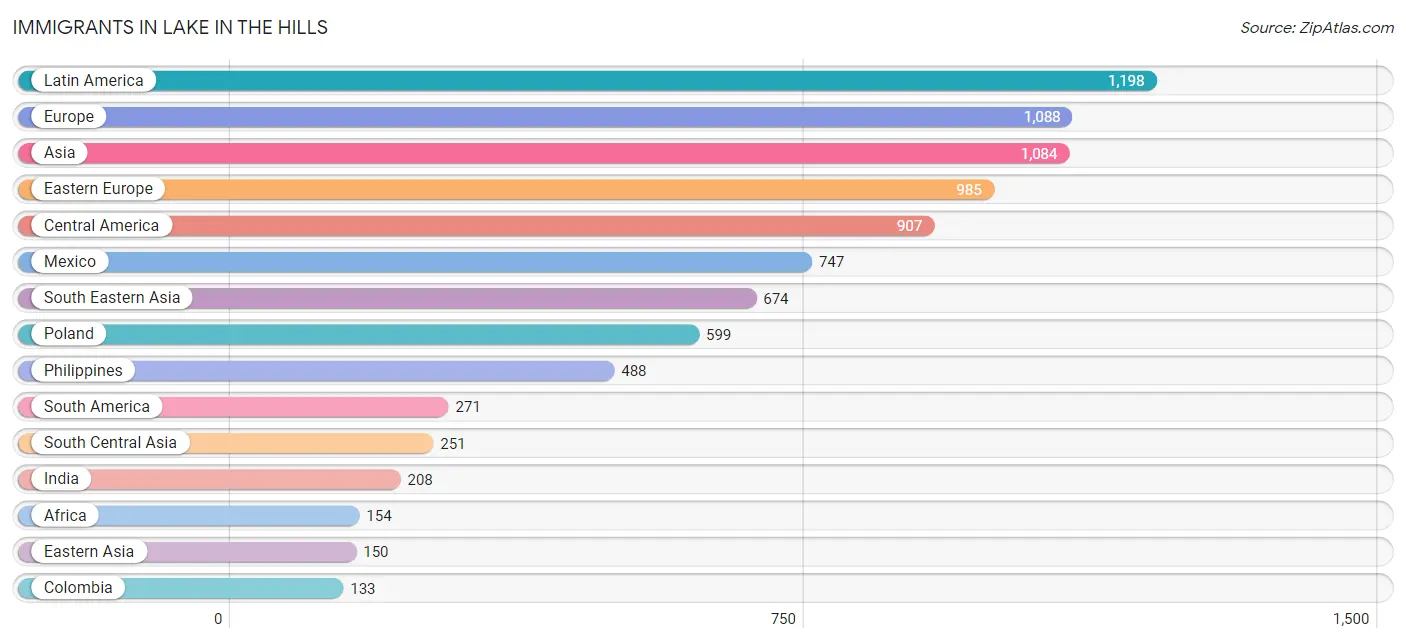
Immigrants in Lake In The Hills
The most numerous immigrant groups reported in Lake In The Hills came from Latin America (1,198 | 4.1%), Europe (1,088 | 3.8%), Asia (1,084 | 3.7%), Eastern Europe (985 | 3.4%), and Central America (907 | 3.1%), together accounting for 18.2% of all Lake In The Hills residents.
| Immigration Origin | # Population | % Population |
| Africa | 154 | 0.5% |
| Asia | 1,084 | 3.7% |
| Belize | 30 | 0.1% |
| Bosnia and Herzegovina | 86 | 0.3% |
| Brazil | 13 | 0.0% |
| Bulgaria | 77 | 0.3% |
| Canada | 54 | 0.2% |
| Caribbean | 20 | 0.1% |
| Central America | 907 | 3.1% |
| Chile | 23 | 0.1% |
| China | 76 | 0.3% |
| Colombia | 133 | 0.5% |
| Cuba | 7 | 0.0% |
| Eastern Africa | 62 | 0.2% |
| Eastern Asia | 150 | 0.5% |
| Eastern Europe | 985 | 3.4% |
| El Salvador | 64 | 0.2% |
| Europe | 1,088 | 3.8% |
| Germany | 45 | 0.2% |
| Ghana | 68 | 0.2% |
| Guatemala | 39 | 0.1% |
| India | 208 | 0.7% |
| Italy | 40 | 0.1% |
| Japan | 11 | 0.0% |
| Korea | 63 | 0.2% |
| Latin America | 1,198 | 4.1% |
| Mexico | 747 | 2.6% |
| Nicaragua | 14 | 0.1% |
| North Macedonia | 15 | 0.1% |
| Northern Europe | 18 | 0.1% |
| Pakistan | 43 | 0.2% |
| Panama | 13 | 0.0% |
| Peru | 102 | 0.4% |
| Philippines | 488 | 1.7% |
| Poland | 599 | 2.1% |
| Romania | 66 | 0.2% |
| Saudi Arabia | 4 | 0.0% |
| Scotland | 9 | 0.0% |
| South Africa | 24 | 0.1% |
| South America | 271 | 0.9% |
| South Central Asia | 251 | 0.9% |
| South Eastern Asia | 674 | 2.3% |
| Southern Europe | 40 | 0.1% |
| Thailand | 22 | 0.1% |
| Trinidad and Tobago | 13 | 0.0% |
| Ukraine | 132 | 0.5% |
| Vietnam | 110 | 0.4% |
| Western Africa | 68 | 0.2% |
| Western Asia | 9 | 0.0% |
| Western Europe | 45 | 0.2% | View All 50 Rows |
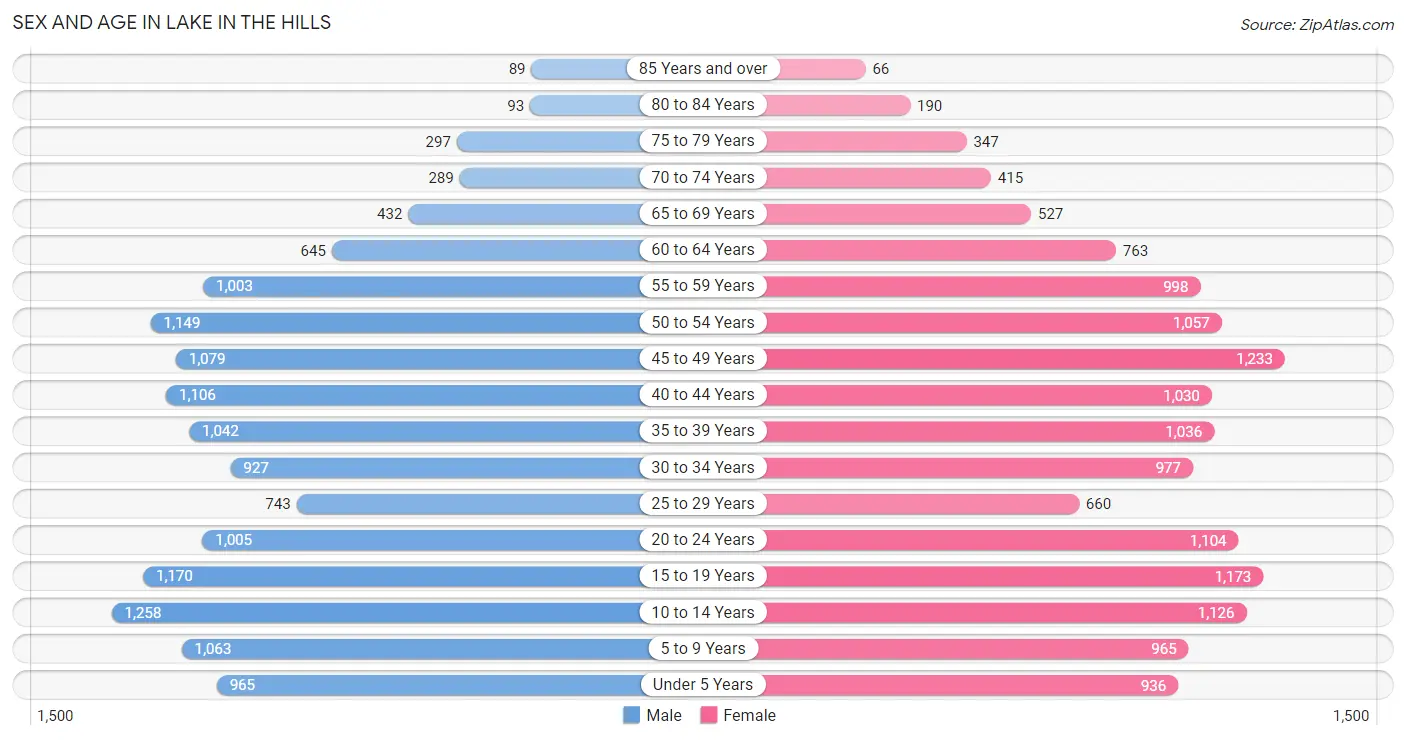
Sex and Age in Lake In The Hills
Sex and Age in Lake In The Hills
The most populous age groups in Lake In The Hills are 10 to 14 Years (1,258 | 8.8%) for men and 45 to 49 Years (1,233 | 8.4%) for women.
| Age Bracket | Male | Female |
| Under 5 Years | 965 (6.7%) | 936 (6.4%) |
| 5 to 9 Years | 1,063 (7.4%) | 965 (6.6%) |
| 10 to 14 Years | 1,258 (8.8%) | 1,126 (7.7%) |
| 15 to 19 Years | 1,170 (8.2%) | 1,173 (8.0%) |
| 20 to 24 Years | 1,005 (7.0%) | 1,104 (7.6%) |
| 25 to 29 Years | 743 (5.2%) | 660 (4.5%) |
| 30 to 34 Years | 927 (6.5%) | 977 (6.7%) |
| 35 to 39 Years | 1,042 (7.3%) | 1,036 (7.1%) |
| 40 to 44 Years | 1,106 (7.7%) | 1,030 (7.0%) |
| 45 to 49 Years | 1,079 (7.5%) | 1,233 (8.4%) |
| 50 to 54 Years | 1,149 (8.0%) | 1,057 (7.2%) |
| 55 to 59 Years | 1,003 (7.0%) | 998 (6.8%) |
| 60 to 64 Years | 645 (4.5%) | 763 (5.2%) |
| 65 to 69 Years | 432 (3.0%) | 527 (3.6%) |
| 70 to 74 Years | 289 (2.0%) | 415 (2.8%) |
| 75 to 79 Years | 297 (2.1%) | 347 (2.4%) |
| 80 to 84 Years | 93 (0.6%) | 190 (1.3%) |
| 85 Years and over | 89 (0.6%) | 66 (0.4%) |
| Total | 14,355 (100.0%) | 14,603 (100.0%) |
Families and Households in Lake In The Hills
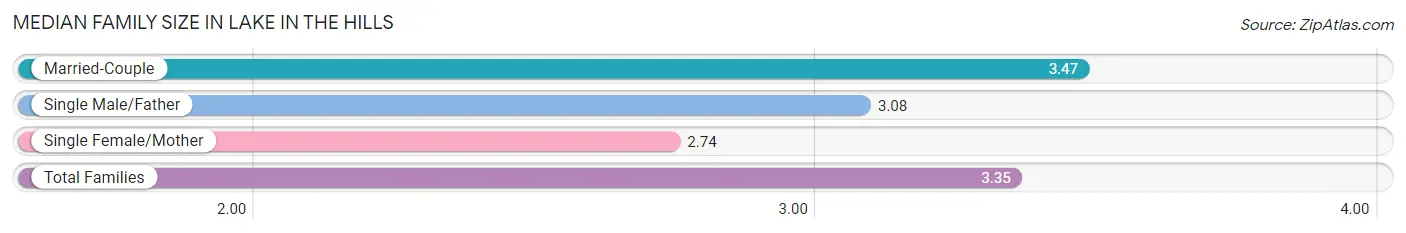
Median Family Size in Lake In The Hills
The median family size in Lake In The Hills is 3.35 persons per family, with married-couple families (6,153 | 79.7%) accounting for the largest median family size of 3.47 persons per family. On the other hand, single female/mother families (987 | 12.8%) represent the smallest median family size with 2.74 persons per family.
| Family Type | # Families | Family Size |
| Married-Couple | 6,153 (79.7%) | 3.47 |
| Single Male/Father | 582 (7.5%) | 3.08 |
| Single Female/Mother | 987 (12.8%) | 2.74 |
| Total Families | 7,722 (100.0%) | 3.35 |
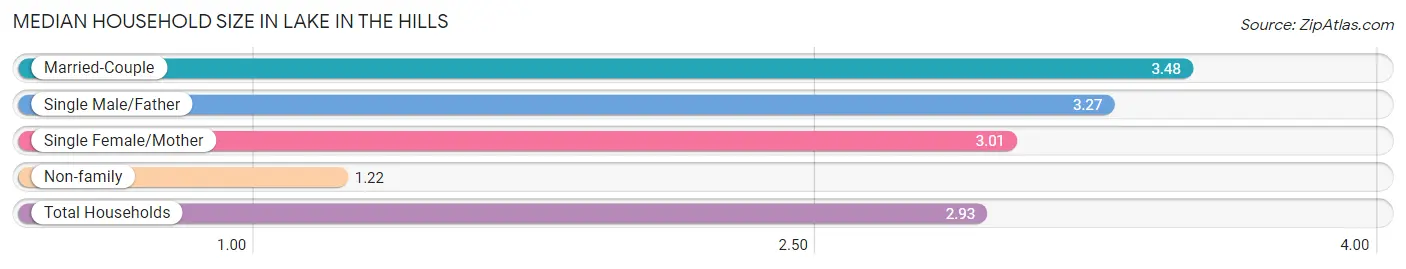
Median Household Size in Lake In The Hills
The median household size in Lake In The Hills is 2.93 persons per household, with married-couple households (6,153 | 62.3%) accounting for the largest median household size of 3.48 persons per household. non-family households (2,156 | 21.8%) represent the smallest median household size with 1.22 persons per household.
| Household Type | # Households | Household Size |
| Married-Couple | 6,153 (62.3%) | 3.48 |
| Single Male/Father | 582 (5.9%) | 3.27 |
| Single Female/Mother | 987 (10.0%) | 3.01 |
| Non-family | 2,156 (21.8%) | 1.22 |
| Total Households | 9,878 (100.0%) | 2.93 |
Household Size by Marriage Status in Lake In The Hills
Out of a total of 9,878 households in Lake In The Hills, 7,722 (78.2%) are family households, while 2,156 (21.8%) are nonfamily households. The most numerous type of family households are 2-person households, comprising 2,232, and the most common type of nonfamily households are 1-person households, comprising 1,727.
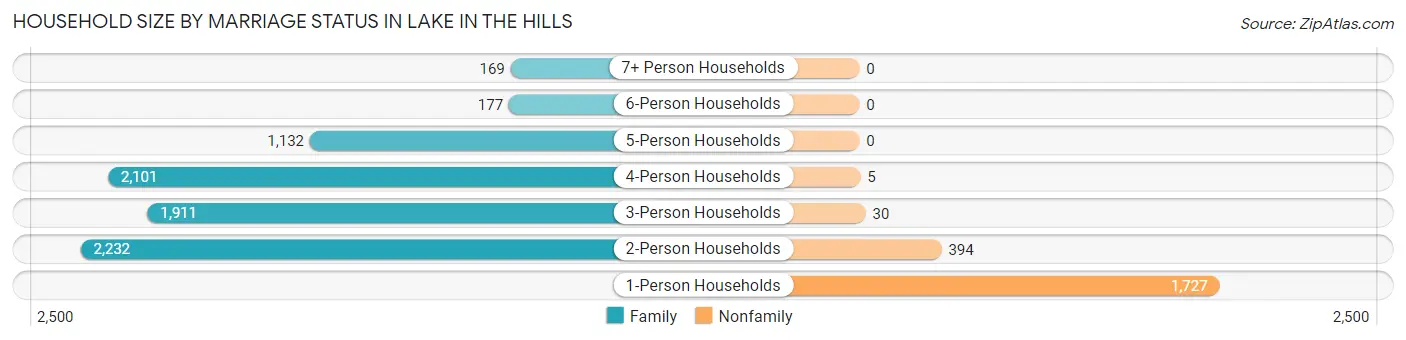
| Household Size | Family Households | Nonfamily Households |
| 1-Person Households | - | 1,727 (17.5%) |
| 2-Person Households | 2,232 (22.6%) | 394 (4.0%) |
| 3-Person Households | 1,911 (19.4%) | 30 (0.3%) |
| 4-Person Households | 2,101 (21.3%) | 5 (0.1%) |
| 5-Person Households | 1,132 (11.5%) | 0 (0.0%) |
| 6-Person Households | 177 (1.8%) | 0 (0.0%) |
| 7+ Person Households | 169 (1.7%) | 0 (0.0%) |
| Total | 7,722 (78.2%) | 2,156 (21.8%) |
Female Fertility in Lake In The Hills
Fertility by Age in Lake In The Hills
Average fertility rate in Lake In The Hills is 75.0 births per 1,000 women. Women in the age bracket of 20 to 34 years have the highest fertility rate with 139.0 births per 1,000 women. Women in the age bracket of 20 to 34 years acount for 68.3% of all women with births.
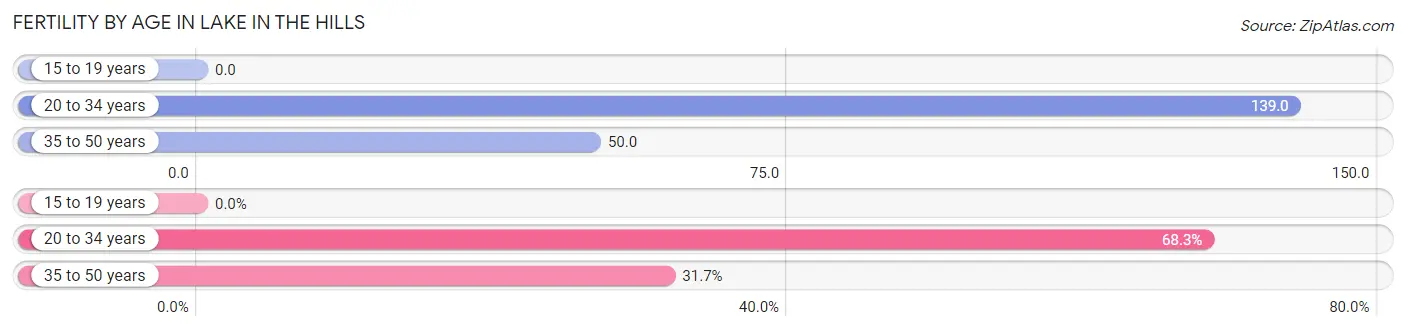
| Age Bracket | Women with Births | Births / 1,000 Women |
| 15 to 19 years | 0 (0.0%) | 0.0 |
| 20 to 34 years | 381 (68.3%) | 139.0 |
| 35 to 50 years | 177 (31.7%) | 50.0 |
| Total | 558 (100.0%) | 75.0 |
Fertility by Age by Marriage Status in Lake In The Hills
76.0% of women with births (558) in Lake In The Hills are married. The highest percentage of unmarried women with births falls into 20 to 34 years age bracket with 30.4% of them unmarried at the time of birth, while the lowest percentage of unmarried women with births belong to 35 to 50 years age bracket with 10.2% of them unmarried.
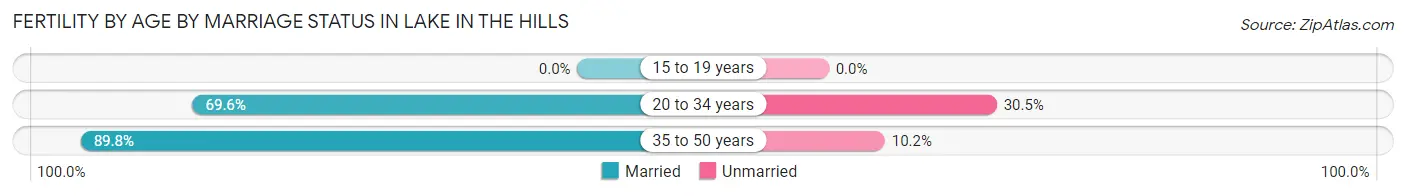
| Age Bracket | Married | Unmarried |
| 15 to 19 years | 0 (0.0%) | 0 (0.0%) |
| 20 to 34 years | 265 (69.6%) | 116 (30.4%) |
| 35 to 50 years | 159 (89.8%) | 18 (10.2%) |
| Total | 424 (76.0%) | 134 (24.0%) |
Fertility by Education in Lake In The Hills
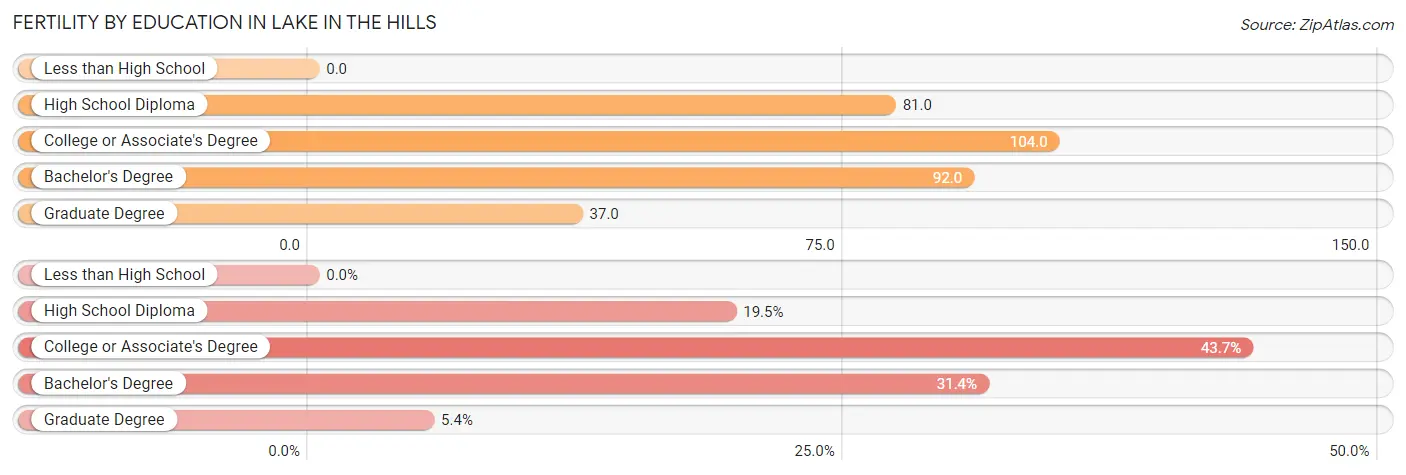
| Educational Attainment | Women with Births | Births / 1,000 Women |
| Less than High School | 0 (0.0%) | 0.0 |
| High School Diploma | 109 (19.5%) | 81.0 |
| College or Associate's Degree | 244 (43.7%) | 104.0 |
| Bachelor's Degree | 175 (31.4%) | 92.0 |
| Graduate Degree | 30 (5.4%) | 37.0 |
| Total | 558 (100.0%) | 75.0 |
Fertility by Education by Marriage Status in Lake In The Hills
24.0% of women with births in Lake In The Hills are unmarried. Women with the educational attainment of graduate degree are most likely to be married with 100.0% of them married at childbirth, while women with the educational attainment of high school diploma are least likely to be married with 41.3% of them unmarried at childbirth.
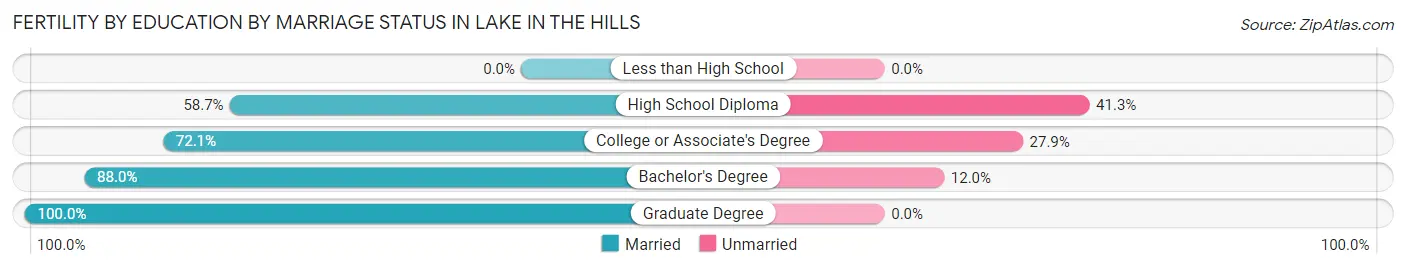
| Educational Attainment | Married | Unmarried |
| Less than High School | 0 (0.0%) | 0 (0.0%) |
| High School Diploma | 64 (58.7%) | 45 (41.3%) |
| College or Associate's Degree | 176 (72.1%) | 68 (27.9%) |
| Bachelor's Degree | 154 (88.0%) | 21 (12.0%) |
| Graduate Degree | 30 (100.0%) | 0 (0.0%) |
| Total | 424 (76.0%) | 134 (24.0%) |
Employment Characteristics in Lake In The Hills
Employment by Class of Employer in Lake In The Hills
Among the 15,572 employed individuals in Lake In The Hills, private company employees (11,913 | 76.5%), local government employees (1,109 | 7.1%), and not-for-profit organizations (800 | 5.1%) make up the most common classes of employment.
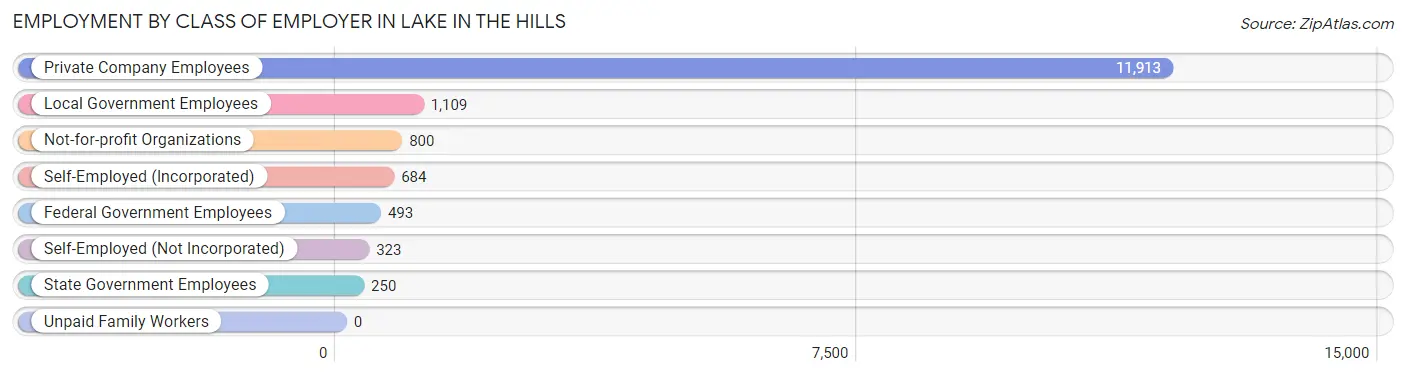
| Employer Class | # Employees | % Employees |
| Private Company Employees | 11,913 | 76.5% |
| Self-Employed (Incorporated) | 684 | 4.4% |
| Self-Employed (Not Incorporated) | 323 | 2.1% |
| Not-for-profit Organizations | 800 | 5.1% |
| Local Government Employees | 1,109 | 7.1% |
| State Government Employees | 250 | 1.6% |
| Federal Government Employees | 493 | 3.2% |
| Unpaid Family Workers | 0 | 0.0% |
| Total | 15,572 | 100.0% |
Employment Status by Age in Lake In The Hills
According to the labor force statistics for Lake In The Hills, out of the total population over 16 years of age (22,302), 75.1% or 16,749 individuals are in the labor force, with 5.6% or 938 of them unemployed. The age group with the highest labor force participation rate is 35 to 44 years, with 92.1% or 3,881 individuals in the labor force. Within the labor force, the 20 to 24 years age range has the highest percentage of unemployed individuals, with 8.0% or 149 of them being unemployed.
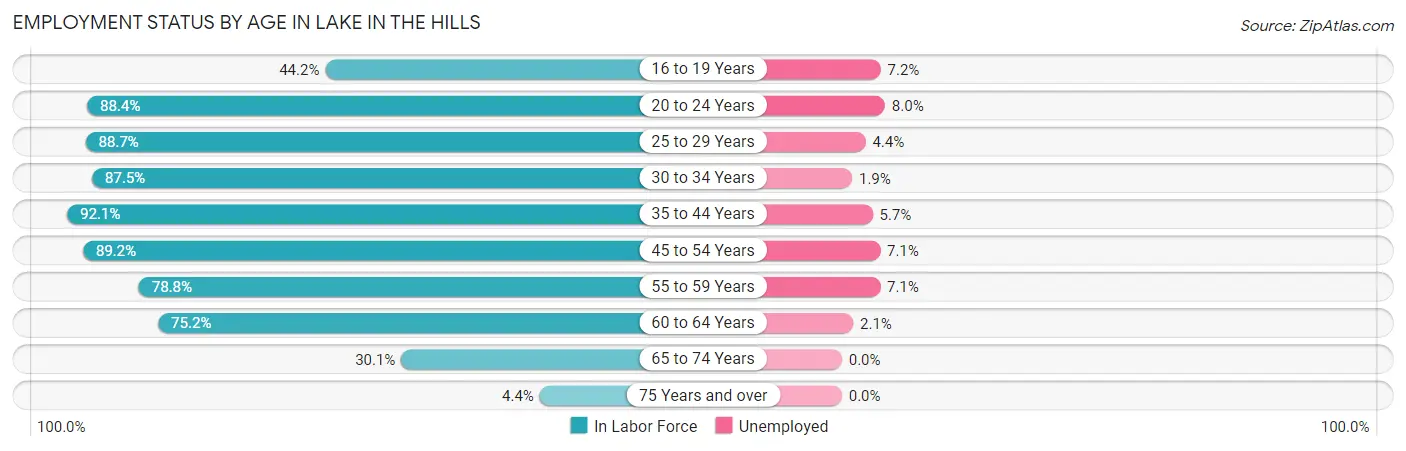
| Age Bracket | In Labor Force | Unemployed |
| 16 to 19 Years | 884 (44.2%) | 64 (7.2%) |
| 20 to 24 Years | 1,864 (88.4%) | 149 (8.0%) |
| 25 to 29 Years | 1,244 (88.7%) | 55 (4.4%) |
| 30 to 34 Years | 1,666 (87.5%) | 32 (1.9%) |
| 35 to 44 Years | 3,881 (92.1%) | 221 (5.7%) |
| 45 to 54 Years | 4,030 (89.2%) | 286 (7.1%) |
| 55 to 59 Years | 1,577 (78.8%) | 112 (7.1%) |
| 60 to 64 Years | 1,059 (75.2%) | 22 (2.1%) |
| 65 to 74 Years | 501 (30.1%) | 0 (0.0%) |
| 75 Years and over | 48 (4.4%) | 0 (0.0%) |
| Total | 16,749 (75.1%) | 938 (5.6%) |
Employment Status by Educational Attainment in Lake In The Hills
According to labor force statistics for Lake In The Hills, 87.1% of individuals (13,455) out of the total population between 25 and 64 years of age (15,448) are in the labor force, with 5.4% or 727 of them being unemployed. The group with the highest labor force participation rate are those with the educational attainment of bachelor's degree or higher, with 91.5% or 5,646 individuals in the labor force. Within the labor force, individuals with high school diploma education have the highest percentage of unemployment, with 6.4% or 190 of them being unemployed.
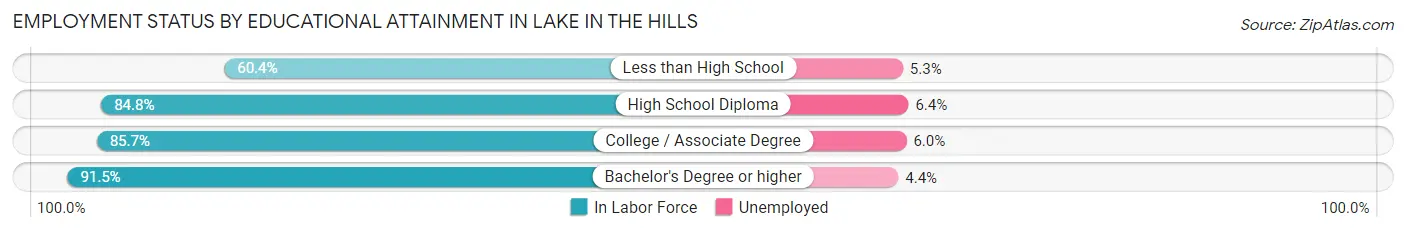
| Educational Attainment | In Labor Force | Unemployed |
| Less than High School | 262 (60.4%) | 23 (5.3%) |
| High School Diploma | 2,965 (84.8%) | 224 (6.4%) |
| College / Associate Degree | 4,582 (85.7%) | 321 (6.0%) |
| Bachelor's Degree or higher | 5,646 (91.5%) | 272 (4.4%) |
| Total | 13,455 (87.1%) | 834 (5.4%) |
Employment Occupations by Sex in Lake In The Hills
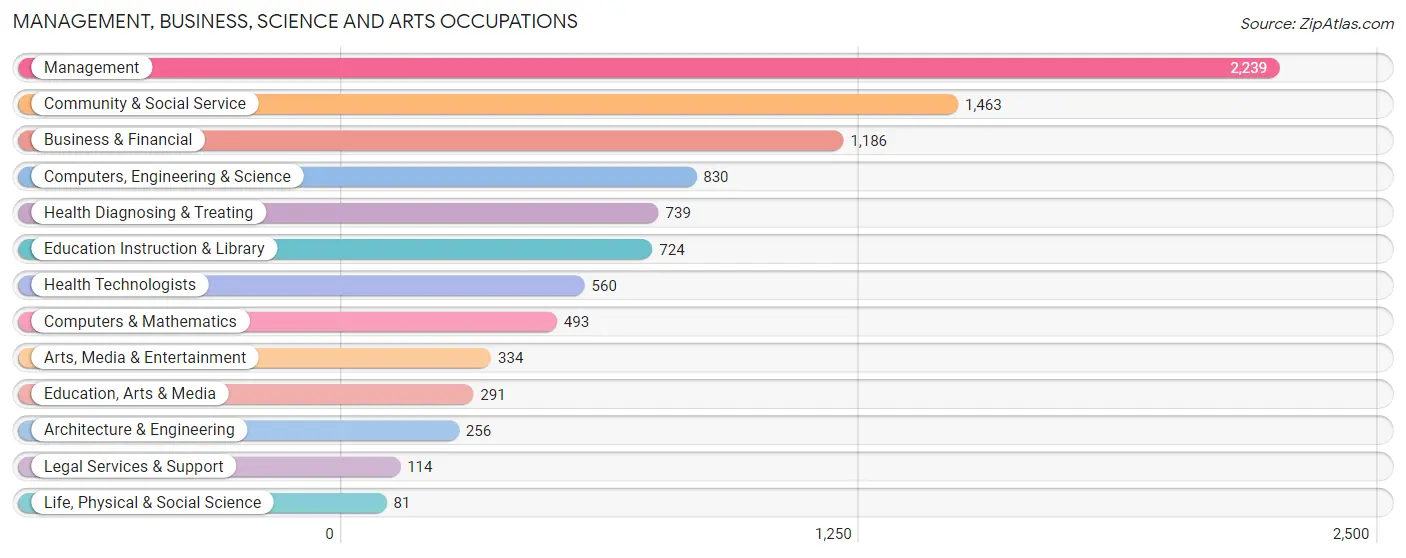
Management, Business, Science and Arts Occupations
The most common Management, Business, Science and Arts occupations in Lake In The Hills are Management (2,239 | 14.2%), Community & Social Service (1,463 | 9.3%), Business & Financial (1,186 | 7.5%), Computers, Engineering & Science (830 | 5.3%), and Health Diagnosing & Treating (739 | 4.7%).
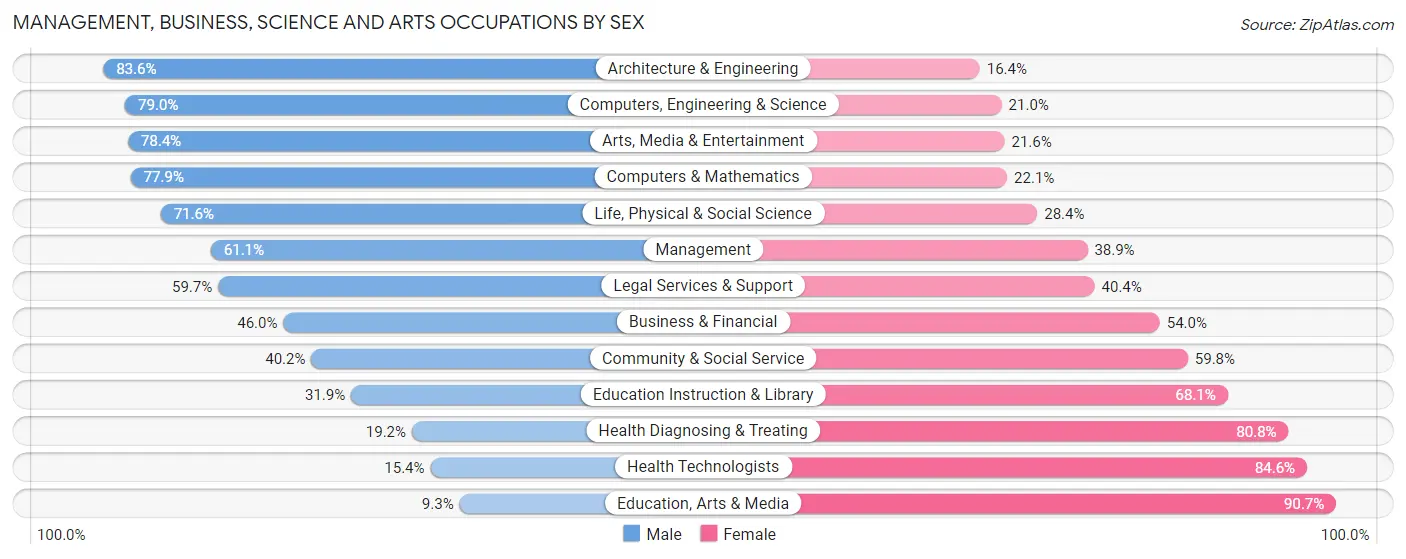
Management, Business, Science and Arts Occupations by Sex
Within the Management, Business, Science and Arts occupations in Lake In The Hills, the most male-oriented occupations are Architecture & Engineering (83.6%), Computers, Engineering & Science (79.0%), and Arts, Media & Entertainment (78.4%), while the most female-oriented occupations are Education, Arts & Media (90.7%), Health Technologists (84.6%), and Health Diagnosing & Treating (80.8%).
| Occupation | Male | Female |
| Management | 1,369 (61.1%) | 870 (38.9%) |
| Business & Financial | 546 (46.0%) | 640 (54.0%) |
| Computers, Engineering & Science | 656 (79.0%) | 174 (21.0%) |
| Computers & Mathematics | 384 (77.9%) | 109 (22.1%) |
| Architecture & Engineering | 214 (83.6%) | 42 (16.4%) |
| Life, Physical & Social Science | 58 (71.6%) | 23 (28.4%) |
| Community & Social Service | 588 (40.2%) | 875 (59.8%) |
| Education, Arts & Media | 27 (9.3%) | 264 (90.7%) |
| Legal Services & Support | 68 (59.7%) | 46 (40.4%) |
| Education Instruction & Library | 231 (31.9%) | 493 (68.1%) |
| Arts, Media & Entertainment | 262 (78.4%) | 72 (21.6%) |
| Health Diagnosing & Treating | 142 (19.2%) | 597 (80.8%) |
| Health Technologists | 86 (15.4%) | 474 (84.6%) |
| Total (Category) | 3,301 (51.1%) | 3,156 (48.9%) |
| Total (Overall) | 8,428 (53.4%) | 7,343 (46.6%) |
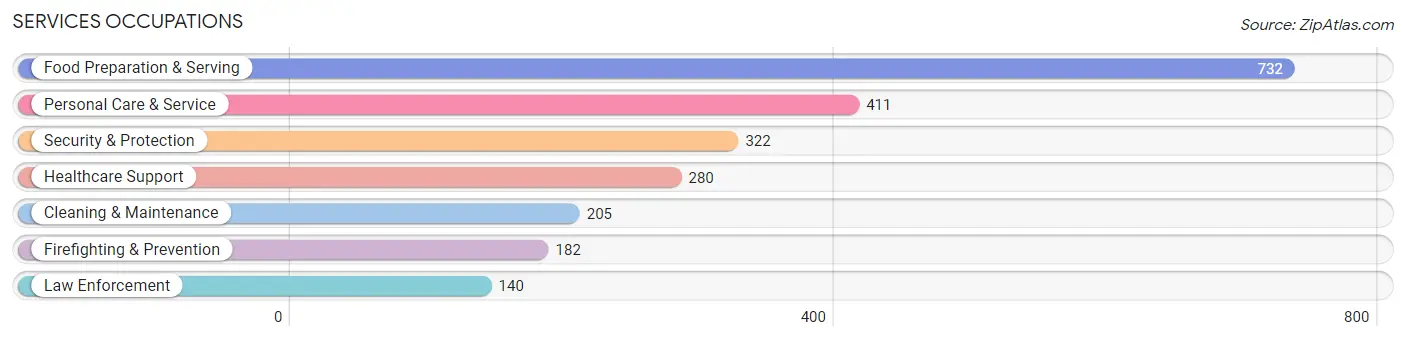
Services Occupations
The most common Services occupations in Lake In The Hills are Food Preparation & Serving (732 | 4.6%), Personal Care & Service (411 | 2.6%), Security & Protection (322 | 2.0%), Healthcare Support (280 | 1.8%), and Cleaning & Maintenance (205 | 1.3%).
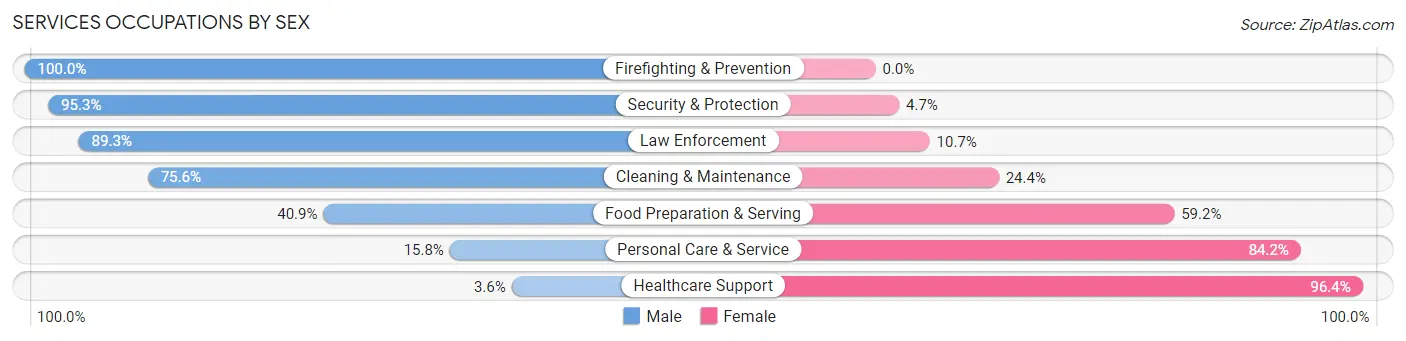
Services Occupations by Sex
Within the Services occupations in Lake In The Hills, the most male-oriented occupations are Firefighting & Prevention (100.0%), Security & Protection (95.3%), and Law Enforcement (89.3%), while the most female-oriented occupations are Healthcare Support (96.4%), Personal Care & Service (84.2%), and Food Preparation & Serving (59.2%).
| Occupation | Male | Female |
| Healthcare Support | 10 (3.6%) | 270 (96.4%) |
| Security & Protection | 307 (95.3%) | 15 (4.7%) |
| Firefighting & Prevention | 182 (100.0%) | 0 (0.0%) |
| Law Enforcement | 125 (89.3%) | 15 (10.7%) |
| Food Preparation & Serving | 299 (40.8%) | 433 (59.2%) |
| Cleaning & Maintenance | 155 (75.6%) | 50 (24.4%) |
| Personal Care & Service | 65 (15.8%) | 346 (84.2%) |
| Total (Category) | 836 (42.9%) | 1,114 (57.1%) |
| Total (Overall) | 8,428 (53.4%) | 7,343 (46.6%) |
Sales and Office Occupations
The most common Sales and Office occupations in Lake In The Hills are Office & Administration (1,891 | 12.0%), and Sales & Related (1,822 | 11.6%).
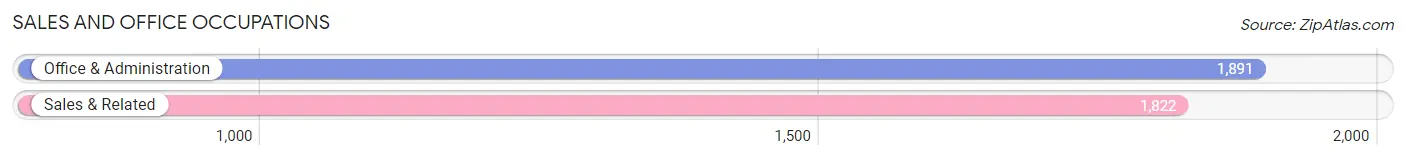
Sales and Office Occupations by Sex
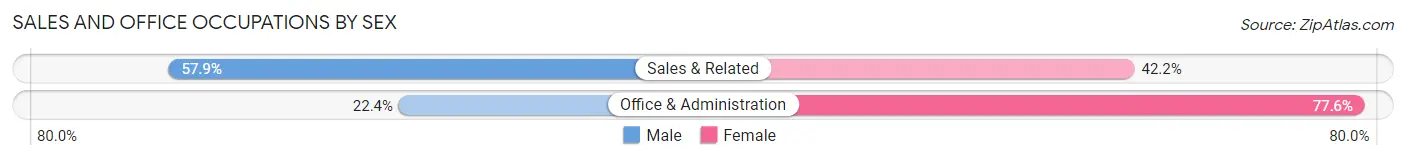
| Occupation | Male | Female |
| Sales & Related | 1,054 (57.9%) | 768 (42.1%) |
| Office & Administration | 424 (22.4%) | 1,467 (77.6%) |
| Total (Category) | 1,478 (39.8%) | 2,235 (60.2%) |
| Total (Overall) | 8,428 (53.4%) | 7,343 (46.6%) |
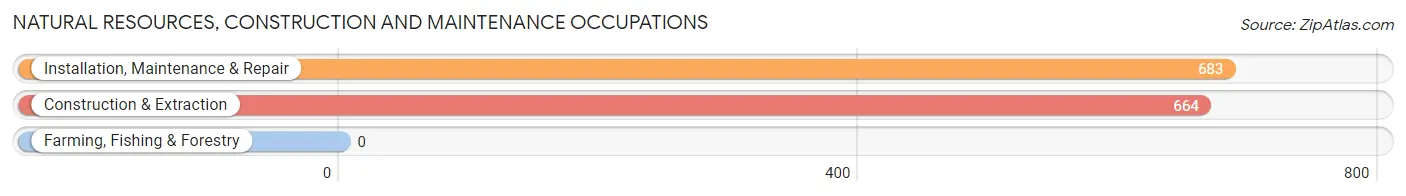
Natural Resources, Construction and Maintenance Occupations
The most common Natural Resources, Construction and Maintenance occupations in Lake In The Hills are Installation, Maintenance & Repair (683 | 4.3%), and Construction & Extraction (664 | 4.2%).
Natural Resources, Construction and Maintenance Occupations by Sex
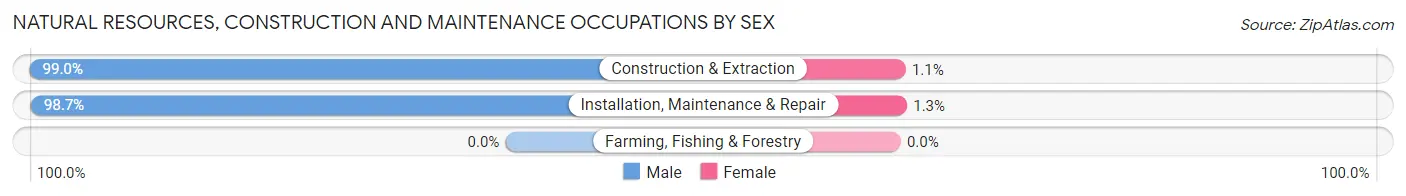
| Occupation | Male | Female |
| Farming, Fishing & Forestry | 0 (0.0%) | 0 (0.0%) |
| Construction & Extraction | 657 (99.0%) | 7 (1.1%) |
| Installation, Maintenance & Repair | 674 (98.7%) | 9 (1.3%) |
| Total (Category) | 1,331 (98.8%) | 16 (1.2%) |
| Total (Overall) | 8,428 (53.4%) | 7,343 (46.6%) |
Production, Transportation and Moving Occupations
The most common Production, Transportation and Moving occupations in Lake In The Hills are Production (1,006 | 6.4%), Material Moving (654 | 4.2%), and Transportation (644 | 4.1%).
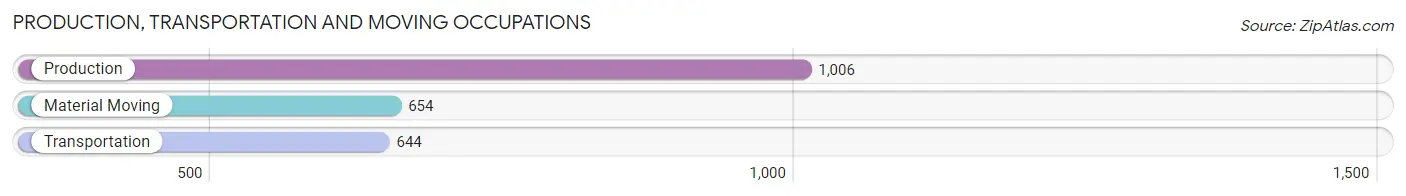
Production, Transportation and Moving Occupations by Sex
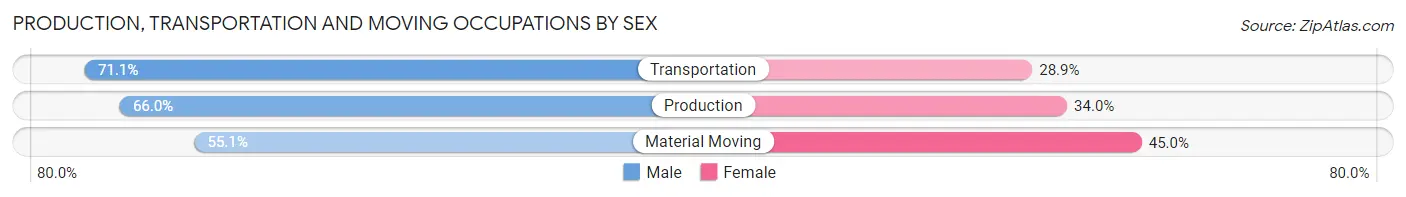
| Occupation | Male | Female |
| Production | 664 (66.0%) | 342 (34.0%) |
| Transportation | 458 (71.1%) | 186 (28.9%) |
| Material Moving | 360 (55.0%) | 294 (45.0%) |
| Total (Category) | 1,482 (64.3%) | 822 (35.7%) |
| Total (Overall) | 8,428 (53.4%) | 7,343 (46.6%) |
Employment Industries by Sex in Lake In The Hills
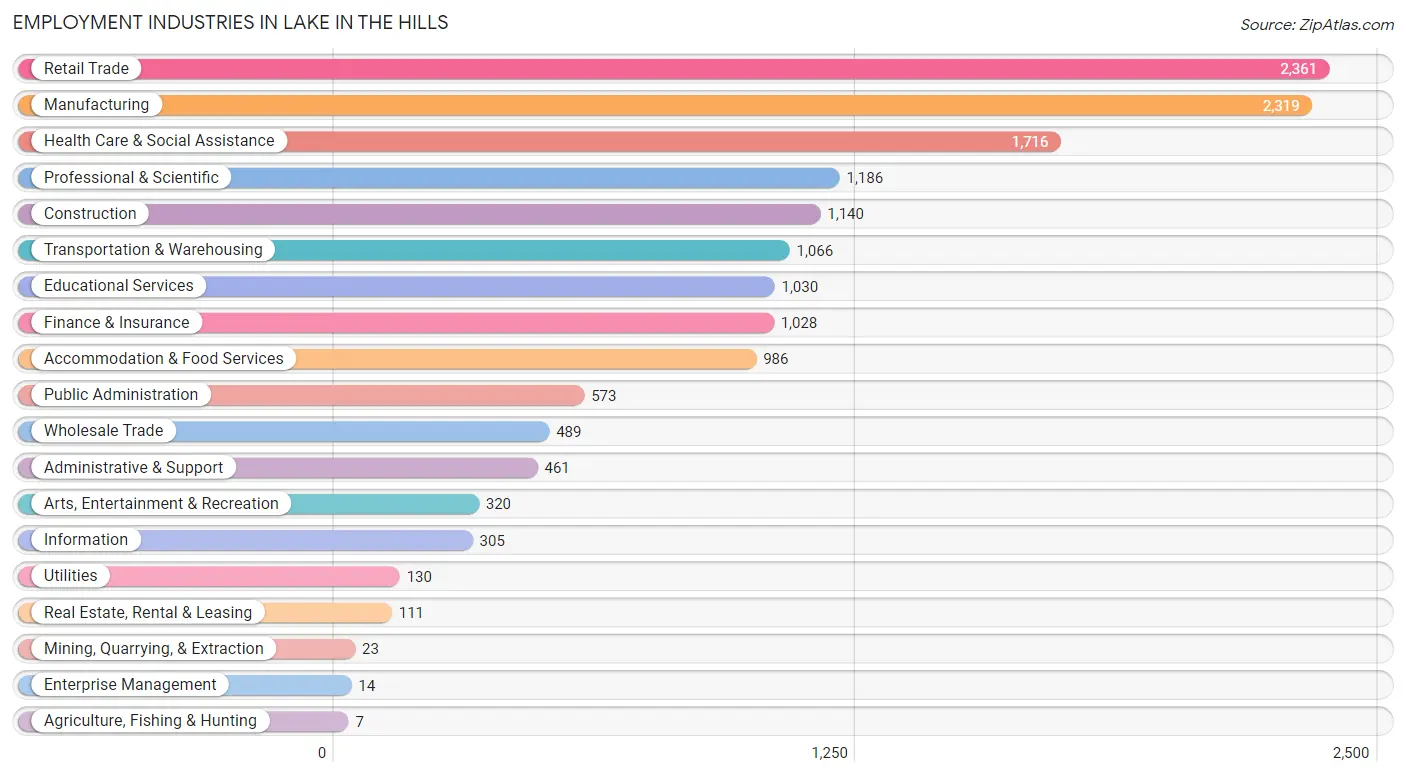
Employment Industries in Lake In The Hills
The major employment industries in Lake In The Hills include Retail Trade (2,361 | 15.0%), Manufacturing (2,319 | 14.7%), Health Care & Social Assistance (1,716 | 10.9%), Professional & Scientific (1,186 | 7.5%), and Construction (1,140 | 7.2%).
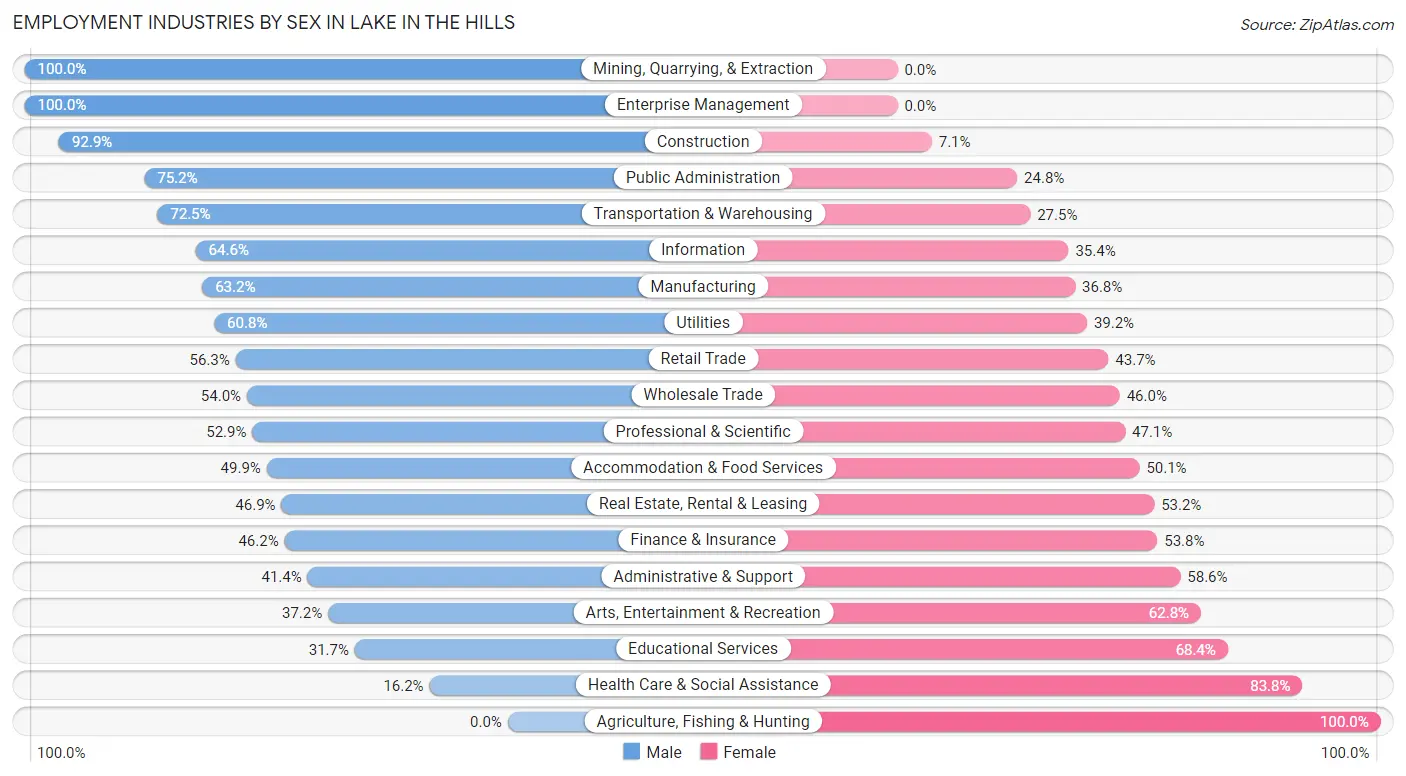
Employment Industries by Sex in Lake In The Hills
The Lake In The Hills industries that see more men than women are Mining, Quarrying, & Extraction (100.0%), Enterprise Management (100.0%), and Construction (92.9%), whereas the industries that tend to have a higher number of women are Agriculture, Fishing & Hunting (100.0%), Health Care & Social Assistance (83.8%), and Educational Services (68.3%).
| Industry | Male | Female |
| Agriculture, Fishing & Hunting | 0 (0.0%) | 7 (100.0%) |
| Mining, Quarrying, & Extraction | 23 (100.0%) | 0 (0.0%) |
| Construction | 1,059 (92.9%) | 81 (7.1%) |
| Manufacturing | 1,466 (63.2%) | 853 (36.8%) |
| Wholesale Trade | 264 (54.0%) | 225 (46.0%) |
| Retail Trade | 1,330 (56.3%) | 1,031 (43.7%) |
| Transportation & Warehousing | 773 (72.5%) | 293 (27.5%) |
| Utilities | 79 (60.8%) | 51 (39.2%) |
| Information | 197 (64.6%) | 108 (35.4%) |
| Finance & Insurance | 475 (46.2%) | 553 (53.8%) |
| Real Estate, Rental & Leasing | 52 (46.9%) | 59 (53.1%) |
| Professional & Scientific | 627 (52.9%) | 559 (47.1%) |
| Enterprise Management | 14 (100.0%) | 0 (0.0%) |
| Administrative & Support | 191 (41.4%) | 270 (58.6%) |
| Educational Services | 326 (31.7%) | 704 (68.3%) |
| Health Care & Social Assistance | 278 (16.2%) | 1,438 (83.8%) |
| Arts, Entertainment & Recreation | 119 (37.2%) | 201 (62.8%) |
| Accommodation & Food Services | 492 (49.9%) | 494 (50.1%) |
| Public Administration | 431 (75.2%) | 142 (24.8%) |
| Total | 8,428 (53.4%) | 7,343 (46.6%) |
Education in Lake In The Hills
School Enrollment in Lake In The Hills
The most common levels of schooling among the 7,969 students in Lake In The Hills are high school (2,012 | 25.3%), middle school (1,730 | 21.7%), and elementary school (1,680 | 21.1%).
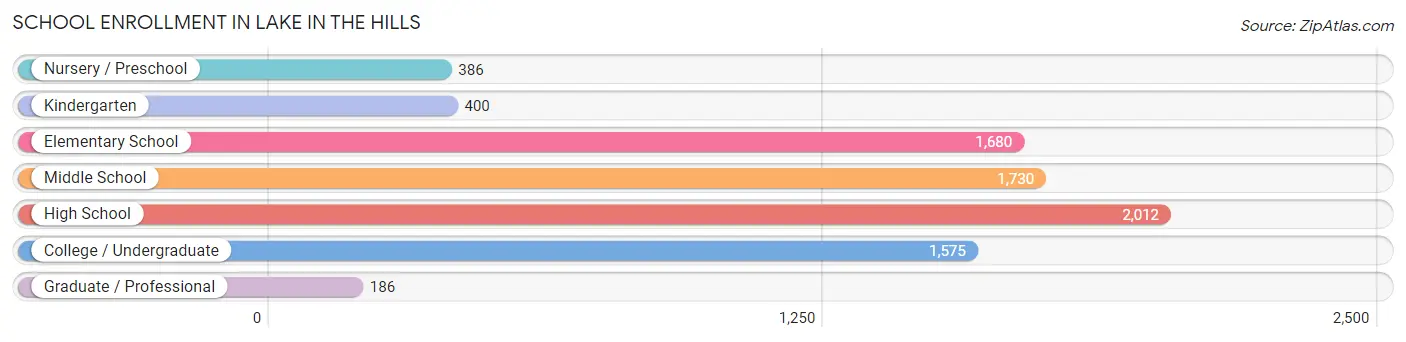
| School Level | # Students | % Students |
| Nursery / Preschool | 386 | 4.8% |
| Kindergarten | 400 | 5.0% |
| Elementary School | 1,680 | 21.1% |
| Middle School | 1,730 | 21.7% |
| High School | 2,012 | 25.3% |
| College / Undergraduate | 1,575 | 19.8% |
| Graduate / Professional | 186 | 2.3% |
| Total | 7,969 | 100.0% |
School Enrollment by Age by Funding Source in Lake In The Hills
Out of a total of 7,969 students who are enrolled in schools in Lake In The Hills, 908 (11.4%) attend a private institution, while the remaining 7,061 (88.6%) are enrolled in public schools. The age group of 3 to 4 year olds has the highest likelihood of being enrolled in private schools, with 94 (33.8% in the age bracket) enrolled. Conversely, the age group of 15 to 17 year olds has the lowest likelihood of being enrolled in a private school, with 1,416 (95.6% in the age bracket) attending a public institution.
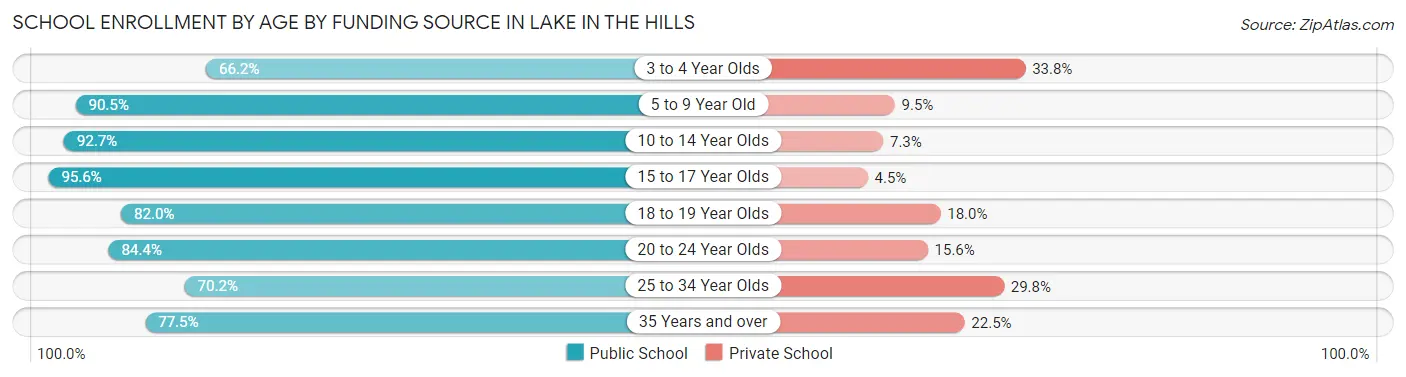
| Age Bracket | Public School | Private School |
| 3 to 4 Year Olds | 184 (66.2%) | 94 (33.8%) |
| 5 to 9 Year Old | 1,689 (90.5%) | 177 (9.5%) |
| 10 to 14 Year Olds | 2,149 (92.7%) | 170 (7.3%) |
| 15 to 17 Year Olds | 1,416 (95.6%) | 66 (4.4%) |
| 18 to 19 Year Olds | 465 (82.0%) | 102 (18.0%) |
| 20 to 24 Year Olds | 691 (84.4%) | 128 (15.6%) |
| 25 to 34 Year Olds | 273 (70.2%) | 116 (29.8%) |
| 35 Years and over | 193 (77.5%) | 56 (22.5%) |
| Total | 7,061 (88.6%) | 908 (11.4%) |
Educational Attainment by Field of Study in Lake In The Hills
Business (1,738 | 23.3%), science & technology (798 | 10.7%), education (650 | 8.7%), arts & humanities (607 | 8.2%), and computers & mathematics (586 | 7.9%) are the most common fields of study among 7,446 individuals in Lake In The Hills who have obtained a bachelor's degree or higher.
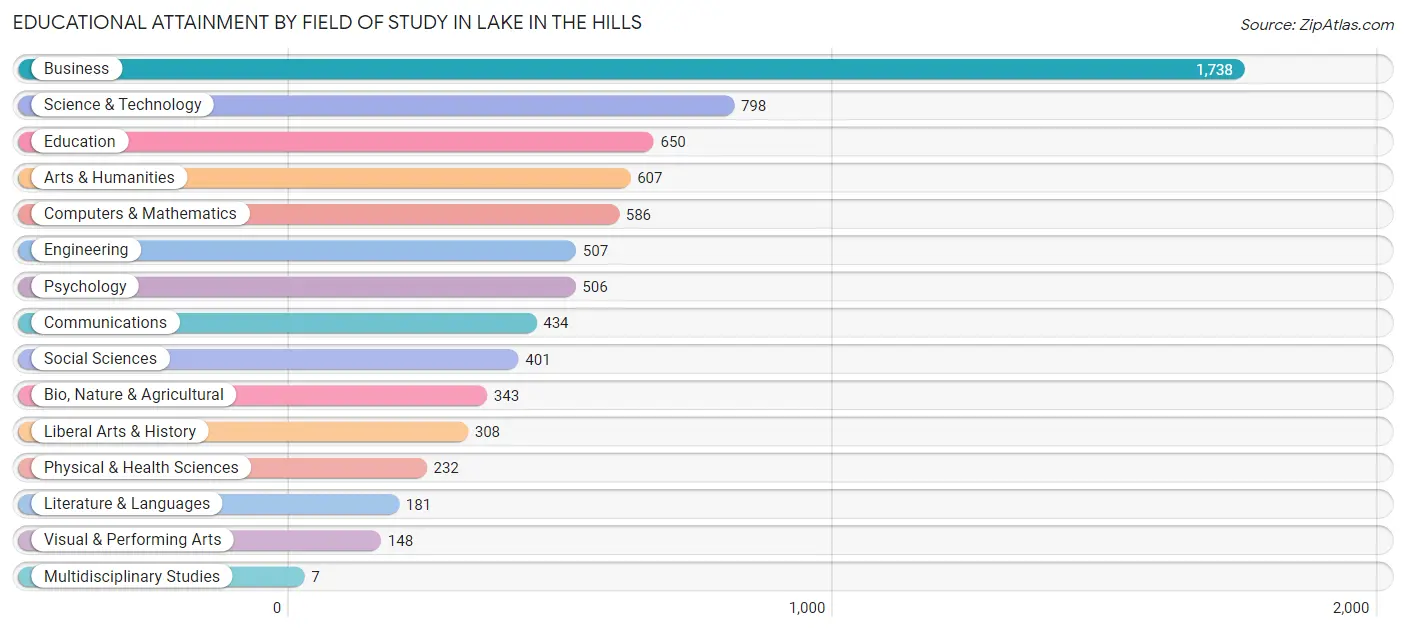
| Field of Study | # Graduates | % Graduates |
| Computers & Mathematics | 586 | 7.9% |
| Bio, Nature & Agricultural | 343 | 4.6% |
| Physical & Health Sciences | 232 | 3.1% |
| Psychology | 506 | 6.8% |
| Social Sciences | 401 | 5.4% |
| Engineering | 507 | 6.8% |
| Multidisciplinary Studies | 7 | 0.1% |
| Science & Technology | 798 | 10.7% |
| Business | 1,738 | 23.3% |
| Education | 650 | 8.7% |
| Literature & Languages | 181 | 2.4% |
| Liberal Arts & History | 308 | 4.1% |
| Visual & Performing Arts | 148 | 2.0% |
| Communications | 434 | 5.8% |
| Arts & Humanities | 607 | 8.2% |
| Total | 7,446 | 100.0% |
Transportation & Commute in Lake In The Hills
Vehicle Availability by Sex in Lake In The Hills
The most prevalent vehicle ownership categories in Lake In The Hills are males with 2 vehicles (4,246, accounting for 51.2%) and females with 2 vehicles (3,496, making up 58.3%).
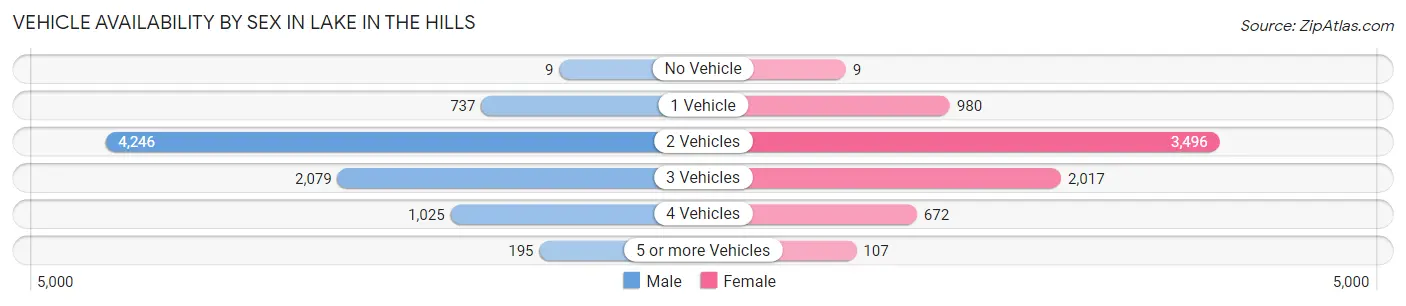
| Vehicles Available | Male | Female |
| No Vehicle | 9 (0.1%) | 9 (0.1%) |
| 1 Vehicle | 737 (8.9%) | 980 (13.5%) |
| 2 Vehicles | 4,246 (51.2%) | 3,496 (48.0%) |
| 3 Vehicles | 2,079 (25.1%) | 2,017 (27.7%) |
| 4 Vehicles | 1,025 (12.4%) | 672 (9.2%) |
| 5 or more Vehicles | 195 (2.4%) | 107 (1.5%) |
| Total | 8,291 (100.0%) | 7,281 (100.0%) |
Commute Time in Lake In The Hills
The most frequently occuring commute durations in Lake In The Hills are 45 to 59 minutes (2,143 commuters, 15.7%), 60 to 89 minutes (1,869 commuters, 13.7%), and 10 to 14 minutes (1,626 commuters, 11.9%).
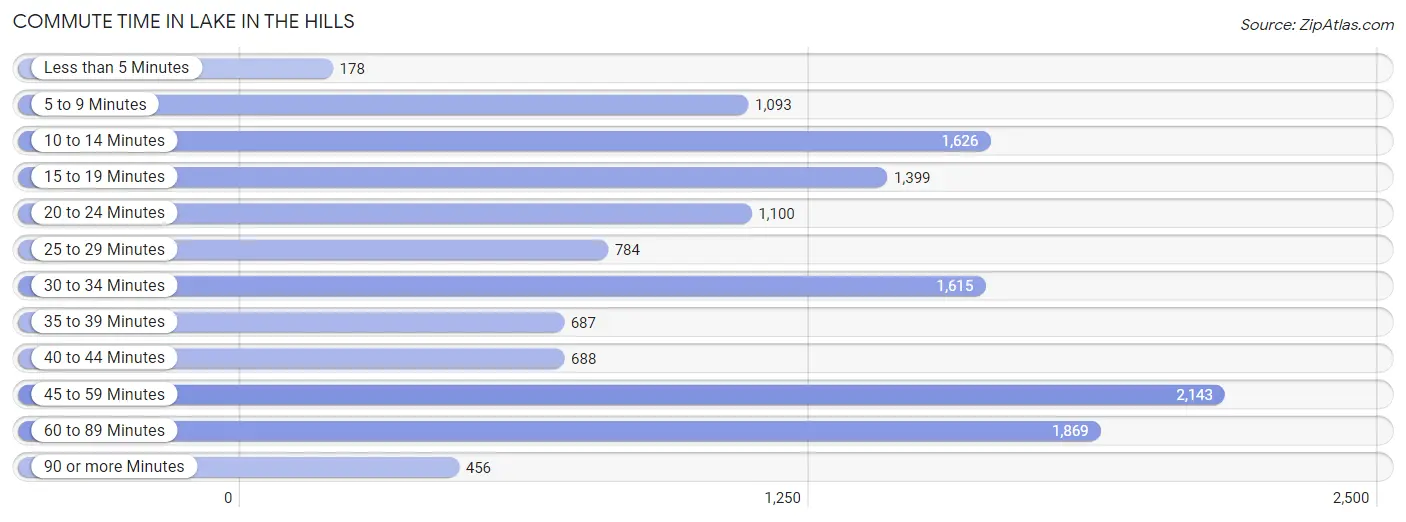
| Commute Time | # Commuters | % Commuters |
| Less than 5 Minutes | 178 | 1.3% |
| 5 to 9 Minutes | 1,093 | 8.0% |
| 10 to 14 Minutes | 1,626 | 11.9% |
| 15 to 19 Minutes | 1,399 | 10.3% |
| 20 to 24 Minutes | 1,100 | 8.1% |
| 25 to 29 Minutes | 784 | 5.8% |
| 30 to 34 Minutes | 1,615 | 11.8% |
| 35 to 39 Minutes | 687 | 5.0% |
| 40 to 44 Minutes | 688 | 5.0% |
| 45 to 59 Minutes | 2,143 | 15.7% |
| 60 to 89 Minutes | 1,869 | 13.7% |
| 90 or more Minutes | 456 | 3.3% |
Commute Time by Sex in Lake In The Hills
The most common commute times in Lake In The Hills are 45 to 59 minutes (1,350 commuters, 18.1%) for males and 10 to 14 minutes (869 commuters, 14.1%) for females.
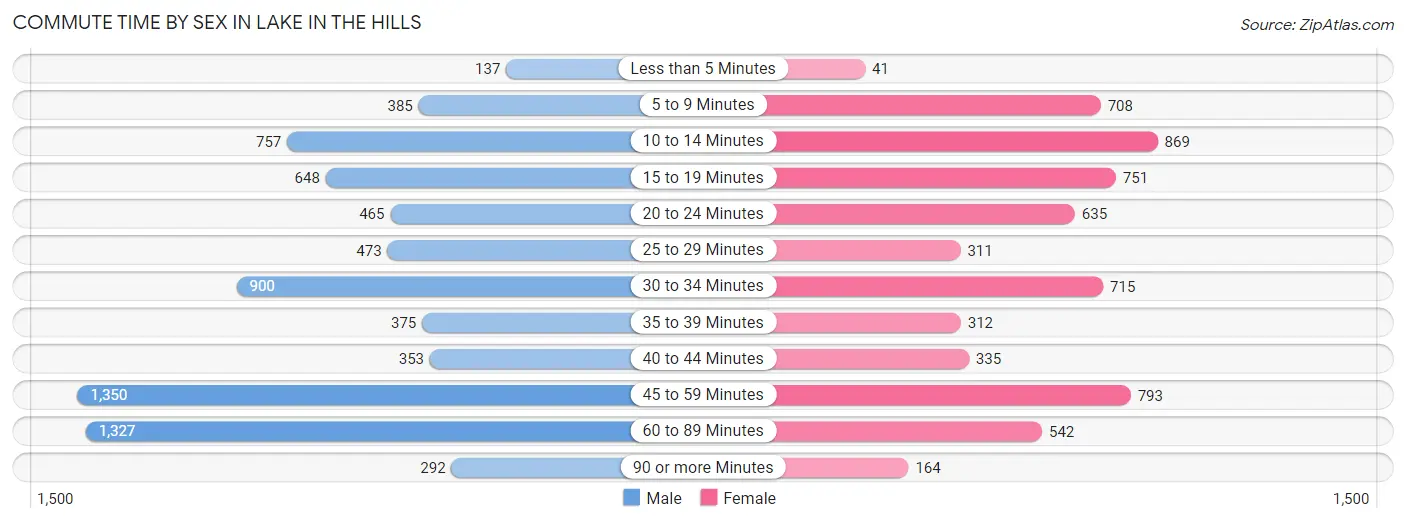
| Commute Time | Male | Female |
| Less than 5 Minutes | 137 (1.8%) | 41 (0.7%) |
| 5 to 9 Minutes | 385 (5.2%) | 708 (11.5%) |
| 10 to 14 Minutes | 757 (10.1%) | 869 (14.1%) |
| 15 to 19 Minutes | 648 (8.7%) | 751 (12.2%) |
| 20 to 24 Minutes | 465 (6.2%) | 635 (10.3%) |
| 25 to 29 Minutes | 473 (6.3%) | 311 (5.0%) |
| 30 to 34 Minutes | 900 (12.1%) | 715 (11.6%) |
| 35 to 39 Minutes | 375 (5.0%) | 312 (5.1%) |
| 40 to 44 Minutes | 353 (4.7%) | 335 (5.4%) |
| 45 to 59 Minutes | 1,350 (18.1%) | 793 (12.8%) |
| 60 to 89 Minutes | 1,327 (17.8%) | 542 (8.8%) |
| 90 or more Minutes | 292 (3.9%) | 164 (2.7%) |
Time of Departure to Work by Sex in Lake In The Hills
The most frequent times of departure to work in Lake In The Hills are 7:00 AM to 7:29 AM (983, 13.2%) for males and 7:30 AM to 7:59 AM (812, 13.2%) for females.
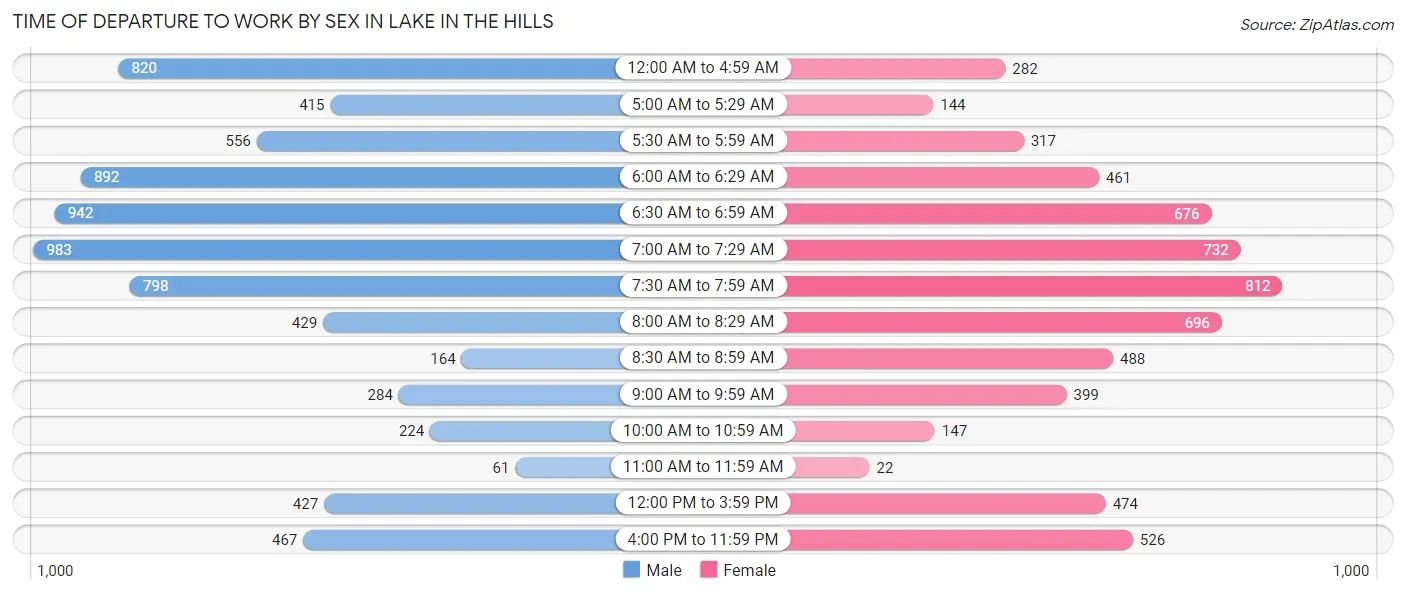
| Time of Departure | Male | Female |
| 12:00 AM to 4:59 AM | 820 (11.0%) | 282 (4.6%) |
| 5:00 AM to 5:29 AM | 415 (5.6%) | 144 (2.3%) |
| 5:30 AM to 5:59 AM | 556 (7.4%) | 317 (5.1%) |
| 6:00 AM to 6:29 AM | 892 (11.9%) | 461 (7.5%) |
| 6:30 AM to 6:59 AM | 942 (12.6%) | 676 (11.0%) |
| 7:00 AM to 7:29 AM | 983 (13.2%) | 732 (11.8%) |
| 7:30 AM to 7:59 AM | 798 (10.7%) | 812 (13.2%) |
| 8:00 AM to 8:29 AM | 429 (5.8%) | 696 (11.3%) |
| 8:30 AM to 8:59 AM | 164 (2.2%) | 488 (7.9%) |
| 9:00 AM to 9:59 AM | 284 (3.8%) | 399 (6.5%) |
| 10:00 AM to 10:59 AM | 224 (3.0%) | 147 (2.4%) |
| 11:00 AM to 11:59 AM | 61 (0.8%) | 22 (0.4%) |
| 12:00 PM to 3:59 PM | 427 (5.7%) | 474 (7.7%) |
| 4:00 PM to 11:59 PM | 467 (6.3%) | 526 (8.5%) |
| Total | 7,462 (100.0%) | 6,176 (100.0%) |
Housing Occupancy in Lake In The Hills
Occupancy by Ownership in Lake In The Hills
Of the total 9,878 dwellings in Lake In The Hills, owner-occupied units account for 8,501 (86.1%), while renter-occupied units make up 1,377 (13.9%).
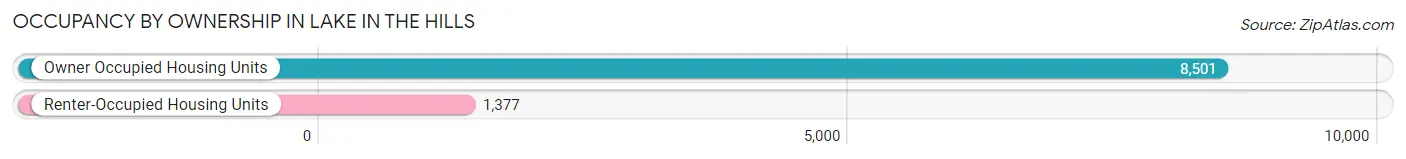
| Occupancy | # Housing Units | % Housing Units |
| Owner Occupied Housing Units | 8,501 | 86.1% |
| Renter-Occupied Housing Units | 1,377 | 13.9% |
| Total Occupied Housing Units | 9,878 | 100.0% |
Occupancy by Household Size in Lake In The Hills
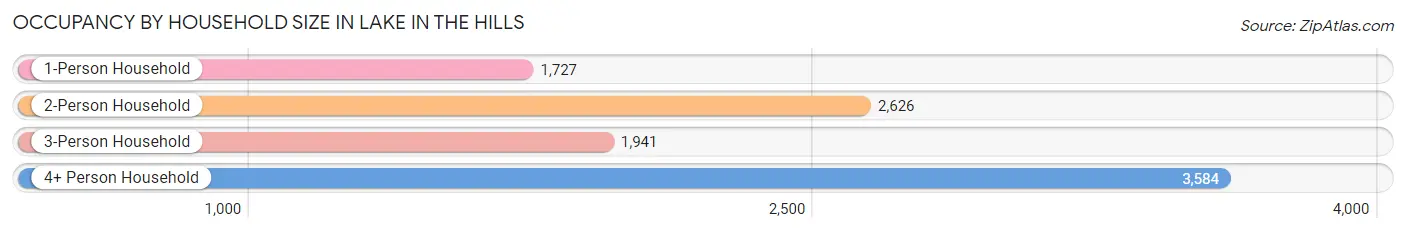
| Household Size | # Housing Units | % Housing Units |
| 1-Person Household | 1,727 | 17.5% |
| 2-Person Household | 2,626 | 26.6% |
| 3-Person Household | 1,941 | 19.7% |
| 4+ Person Household | 3,584 | 36.3% |
| Total Housing Units | 9,878 | 100.0% |
Occupancy by Ownership by Household Size in Lake In The Hills
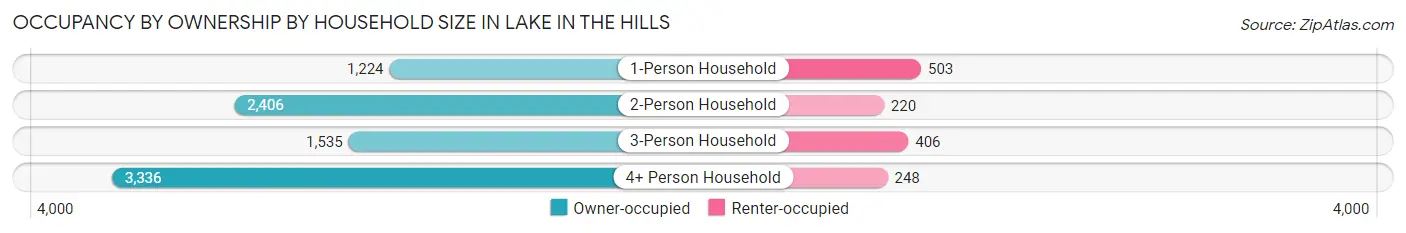
| Household Size | Owner-occupied | Renter-occupied |
| 1-Person Household | 1,224 (70.9%) | 503 (29.1%) |
| 2-Person Household | 2,406 (91.6%) | 220 (8.4%) |
| 3-Person Household | 1,535 (79.1%) | 406 (20.9%) |
| 4+ Person Household | 3,336 (93.1%) | 248 (6.9%) |
| Total Housing Units | 8,501 (86.1%) | 1,377 (13.9%) |
Occupancy by Educational Attainment in Lake In The Hills
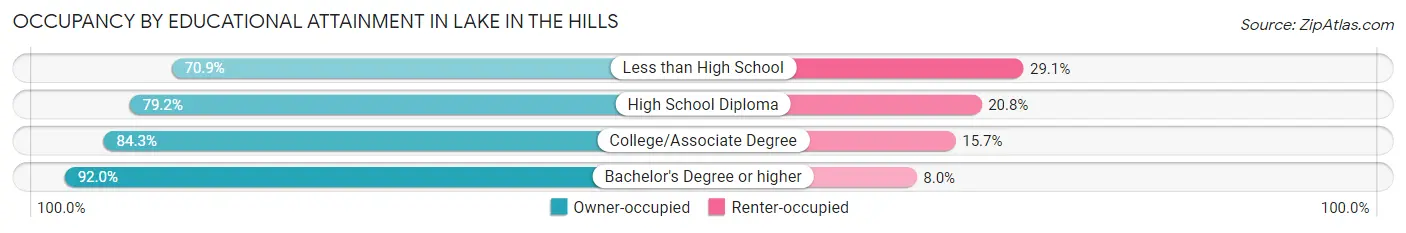
| Household Size | Owner-occupied | Renter-occupied |
| Less than High School | 258 (70.9%) | 106 (29.1%) |
| High School Diploma | 1,567 (79.2%) | 412 (20.8%) |
| College/Associate Degree | 2,835 (84.3%) | 527 (15.7%) |
| Bachelor's Degree or higher | 3,841 (92.0%) | 332 (8.0%) |
Occupancy by Age of Householder in Lake In The Hills
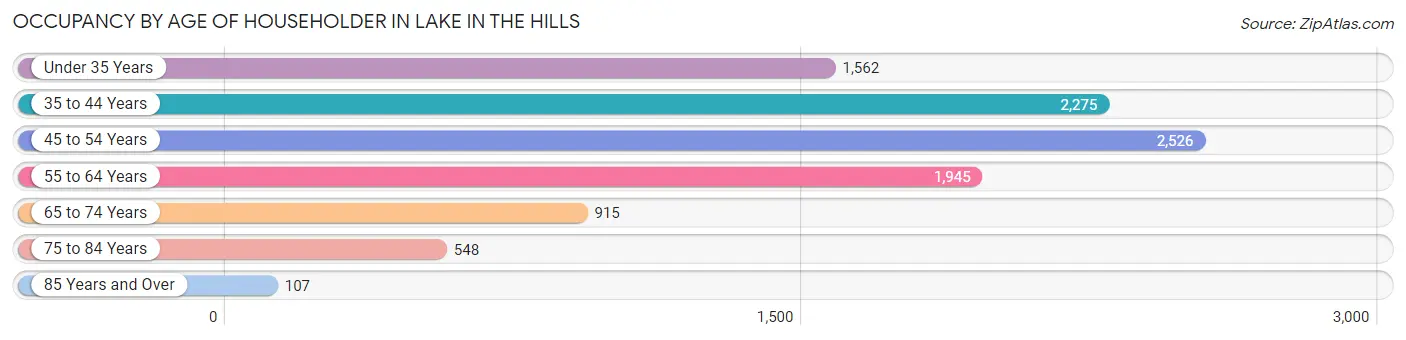
| Age Bracket | # Households | % Households |
| Under 35 Years | 1,562 | 15.8% |
| 35 to 44 Years | 2,275 | 23.0% |
| 45 to 54 Years | 2,526 | 25.6% |
| 55 to 64 Years | 1,945 | 19.7% |
| 65 to 74 Years | 915 | 9.3% |
| 75 to 84 Years | 548 | 5.6% |
| 85 Years and Over | 107 | 1.1% |
| Total | 9,878 | 100.0% |
Housing Finances in Lake In The Hills
Median Income by Occupancy in Lake In The Hills
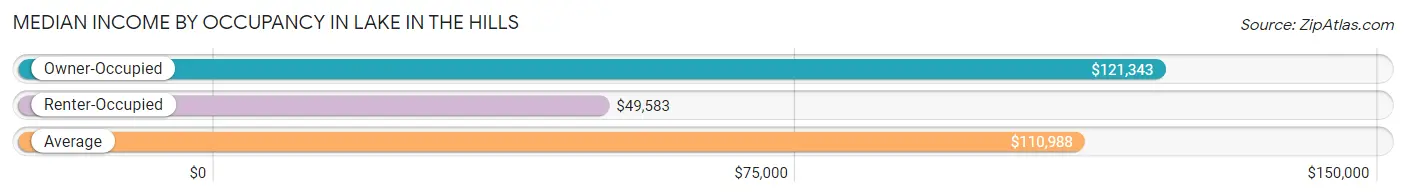
| Occupancy Type | # Households | Median Income |
| Owner-Occupied | 8,501 (86.1%) | $121,343 |
| Renter-Occupied | 1,377 (13.9%) | $49,583 |
| Average | 9,878 (100.0%) | $110,988 |
Occupancy by Householder Income Bracket in Lake In The Hills
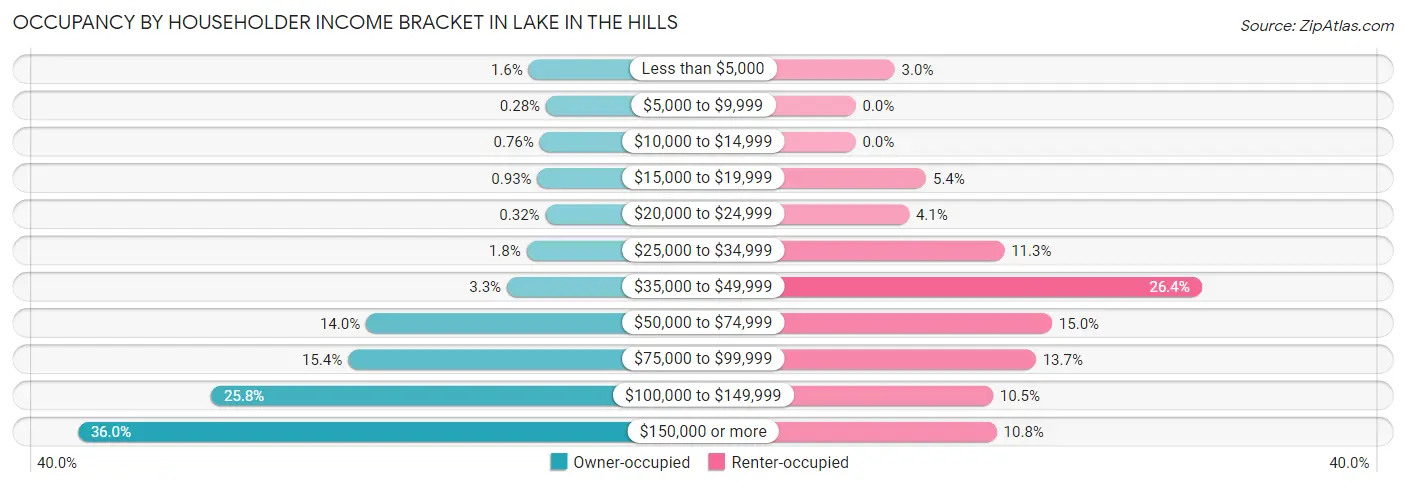
| Income Bracket | Owner-occupied | Renter-occupied |
| Less than $5,000 | 136 (1.6%) | 41 (3.0%) |
| $5,000 to $9,999 | 24 (0.3%) | 0 (0.0%) |
| $10,000 to $14,999 | 65 (0.8%) | 0 (0.0%) |
| $15,000 to $19,999 | 79 (0.9%) | 74 (5.4%) |
| $20,000 to $24,999 | 27 (0.3%) | 56 (4.1%) |
| $25,000 to $34,999 | 150 (1.8%) | 156 (11.3%) |
| $35,000 to $49,999 | 276 (3.3%) | 363 (26.4%) |
| $50,000 to $74,999 | 1,189 (14.0%) | 206 (15.0%) |
| $75,000 to $99,999 | 1,306 (15.4%) | 189 (13.7%) |
| $100,000 to $149,999 | 2,193 (25.8%) | 144 (10.5%) |
| $150,000 or more | 3,056 (35.9%) | 148 (10.7%) |
| Total | 8,501 (100.0%) | 1,377 (100.0%) |
Monthly Housing Cost Tiers in Lake In The Hills
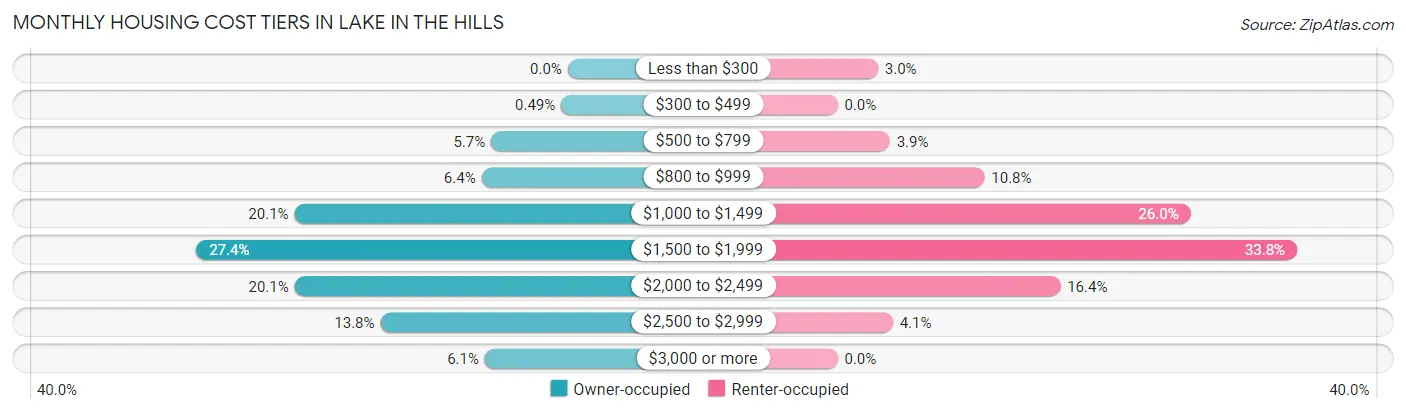
| Monthly Cost | Owner-occupied | Renter-occupied |
| Less than $300 | 0 (0.0%) | 41 (3.0%) |
| $300 to $499 | 42 (0.5%) | 0 (0.0%) |
| $500 to $799 | 480 (5.7%) | 53 (3.8%) |
| $800 to $999 | 540 (6.4%) | 149 (10.8%) |
| $1,000 to $1,499 | 1,711 (20.1%) | 358 (26.0%) |
| $1,500 to $1,999 | 2,326 (27.4%) | 466 (33.8%) |
| $2,000 to $2,499 | 1,710 (20.1%) | 226 (16.4%) |
| $2,500 to $2,999 | 1,173 (13.8%) | 56 (4.1%) |
| $3,000 or more | 519 (6.1%) | 0 (0.0%) |
| Total | 8,501 (100.0%) | 1,377 (100.0%) |
Physical Housing Characteristics in Lake In The Hills
Housing Structures in Lake In The Hills
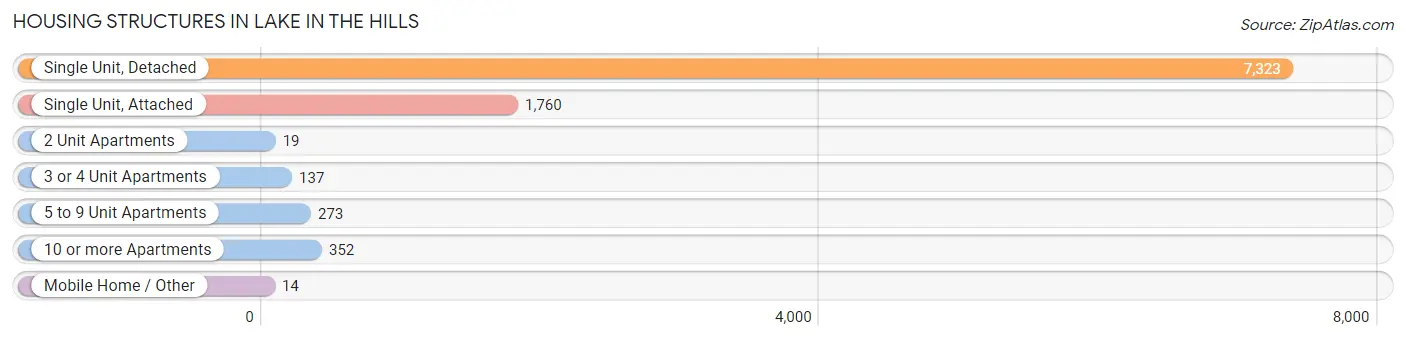
| Structure Type | # Housing Units | % Housing Units |
| Single Unit, Detached | 7,323 | 74.1% |
| Single Unit, Attached | 1,760 | 17.8% |
| 2 Unit Apartments | 19 | 0.2% |
| 3 or 4 Unit Apartments | 137 | 1.4% |
| 5 to 9 Unit Apartments | 273 | 2.8% |
| 10 or more Apartments | 352 | 3.6% |
| Mobile Home / Other | 14 | 0.1% |
| Total | 9,878 | 100.0% |
Housing Structures by Occupancy in Lake In The Hills
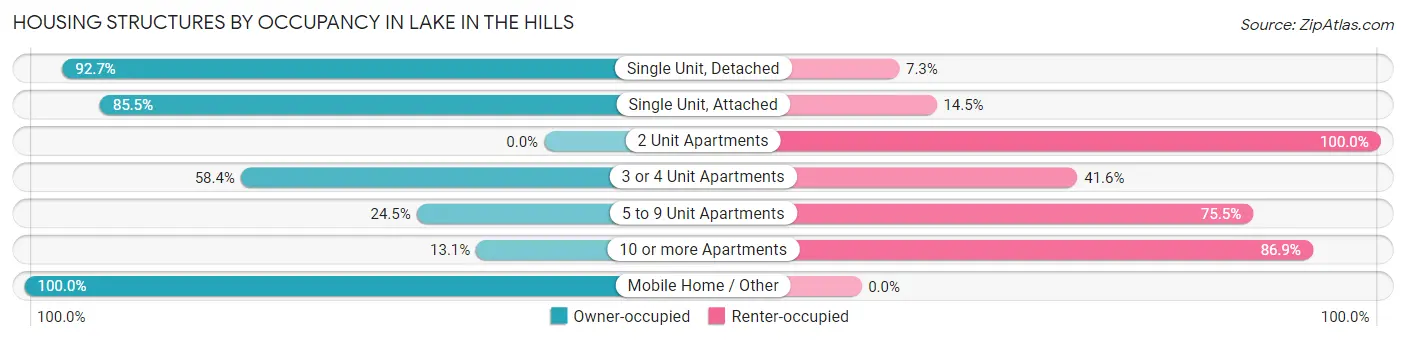
| Structure Type | Owner-occupied | Renter-occupied |
| Single Unit, Detached | 6,789 (92.7%) | 534 (7.3%) |
| Single Unit, Attached | 1,505 (85.5%) | 255 (14.5%) |
| 2 Unit Apartments | 0 (0.0%) | 19 (100.0%) |
| 3 or 4 Unit Apartments | 80 (58.4%) | 57 (41.6%) |
| 5 to 9 Unit Apartments | 67 (24.5%) | 206 (75.5%) |
| 10 or more Apartments | 46 (13.1%) | 306 (86.9%) |
| Mobile Home / Other | 14 (100.0%) | 0 (0.0%) |
| Total | 8,501 (86.1%) | 1,377 (13.9%) |
Housing Structures by Number of Rooms in Lake In The Hills
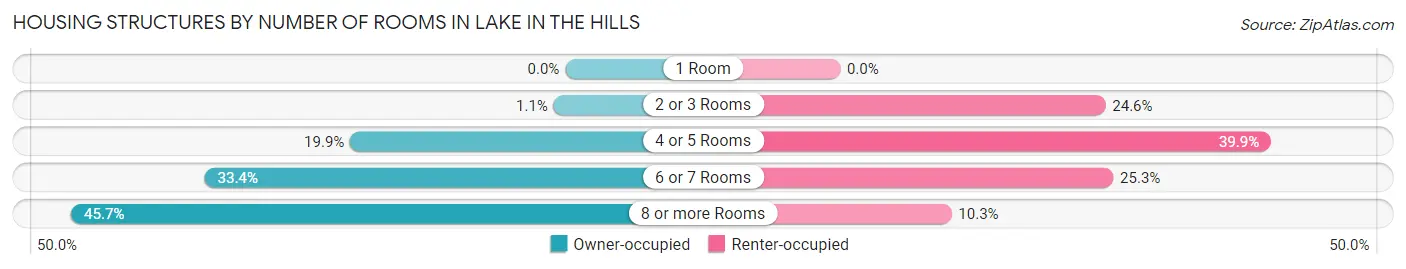
| Number of Rooms | Owner-occupied | Renter-occupied |
| 1 Room | 0 (0.0%) | 0 (0.0%) |
| 2 or 3 Rooms | 91 (1.1%) | 338 (24.5%) |
| 4 or 5 Rooms | 1,691 (19.9%) | 549 (39.9%) |
| 6 or 7 Rooms | 2,835 (33.4%) | 348 (25.3%) |
| 8 or more Rooms | 3,884 (45.7%) | 142 (10.3%) |
| Total | 8,501 (100.0%) | 1,377 (100.0%) |
Housing Structure by Heating Type in Lake In The Hills
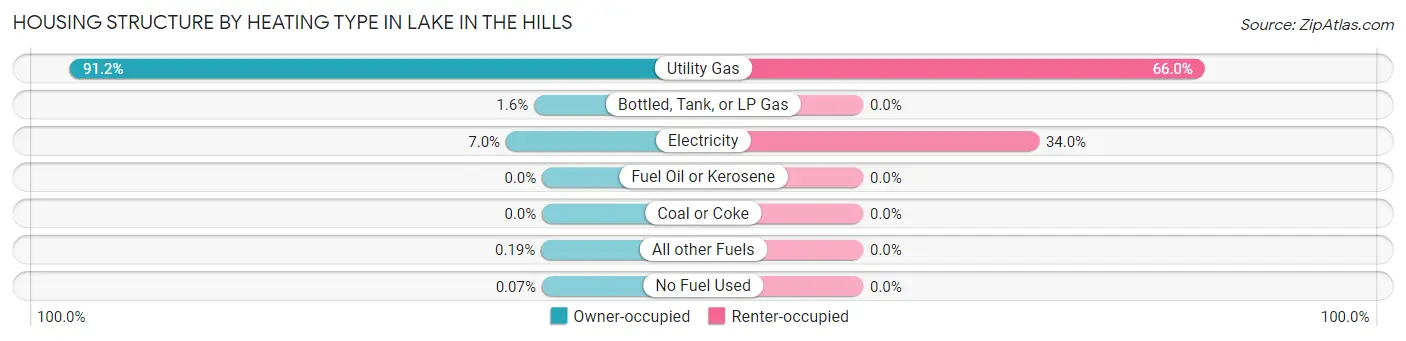
| Heating Type | Owner-occupied | Renter-occupied |
| Utility Gas | 7,753 (91.2%) | 909 (66.0%) |
| Bottled, Tank, or LP Gas | 132 (1.5%) | 0 (0.0%) |
| Electricity | 594 (7.0%) | 468 (34.0%) |
| Fuel Oil or Kerosene | 0 (0.0%) | 0 (0.0%) |
| Coal or Coke | 0 (0.0%) | 0 (0.0%) |
| All other Fuels | 16 (0.2%) | 0 (0.0%) |
| No Fuel Used | 6 (0.1%) | 0 (0.0%) |
| Total | 8,501 (100.0%) | 1,377 (100.0%) |
Household Vehicle Usage in Lake In The Hills
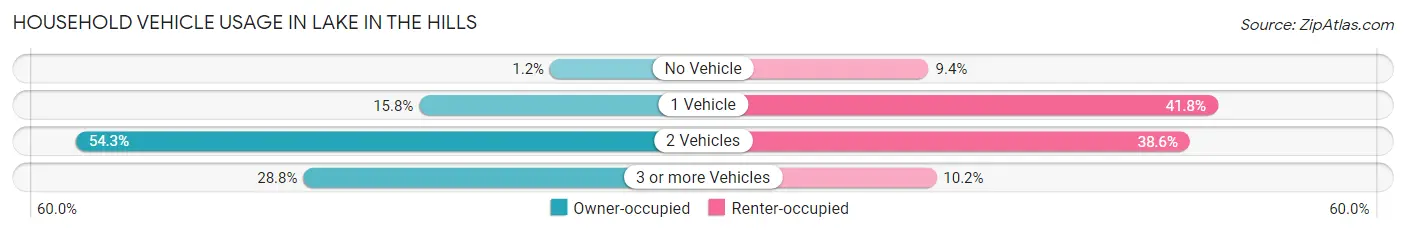
| Vehicles per Household | Owner-occupied | Renter-occupied |
| No Vehicle | 98 (1.1%) | 129 (9.4%) |
| 1 Vehicle | 1,343 (15.8%) | 575 (41.8%) |
| 2 Vehicles | 4,613 (54.3%) | 532 (38.6%) |
| 3 or more Vehicles | 2,447 (28.8%) | 141 (10.2%) |
| Total | 8,501 (100.0%) | 1,377 (100.0%) |
Real Estate & Mortgages in Lake In The Hills
Real Estate and Mortgage Overview in Lake In The Hills
| Characteristic | Without Mortgage | With Mortgage |
| Housing Units | 1,785 | 6,716 |
| Median Property Value | $286,500 | $277,800 |
| Median Household Income | $116,019 | $2,397 |
| Monthly Housing Costs | $968 | $519 |
| Real Estate Taxes | $7,383 | $38 |
Property Value by Mortgage Status in Lake In The Hills
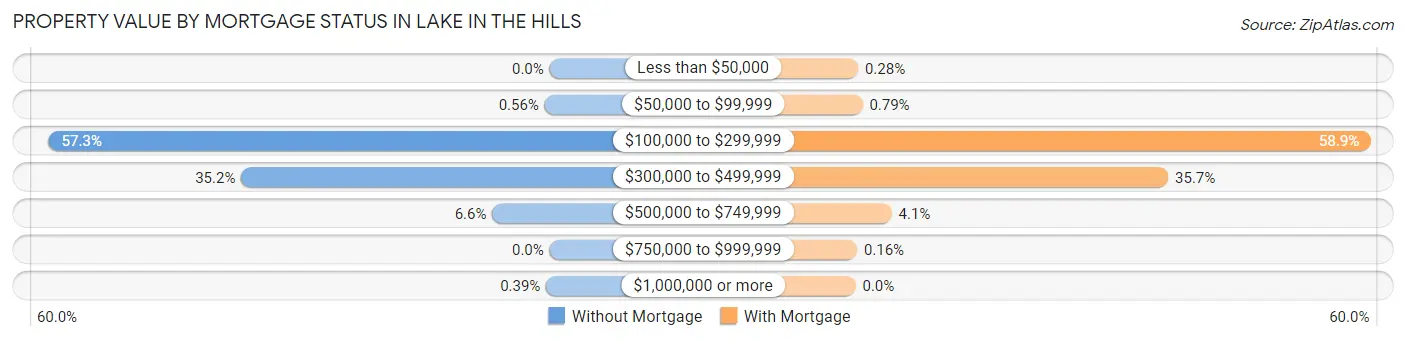
| Property Value | Without Mortgage | With Mortgage |
| Less than $50,000 | 0 (0.0%) | 19 (0.3%) |
| $50,000 to $99,999 | 10 (0.6%) | 53 (0.8%) |
| $100,000 to $299,999 | 1,022 (57.3%) | 3,957 (58.9%) |
| $300,000 to $499,999 | 629 (35.2%) | 2,399 (35.7%) |
| $500,000 to $749,999 | 117 (6.6%) | 277 (4.1%) |
| $750,000 to $999,999 | 0 (0.0%) | 11 (0.2%) |
| $1,000,000 or more | 7 (0.4%) | 0 (0.0%) |
| Total | 1,785 (100.0%) | 6,716 (100.0%) |
Household Income by Mortgage Status in Lake In The Hills
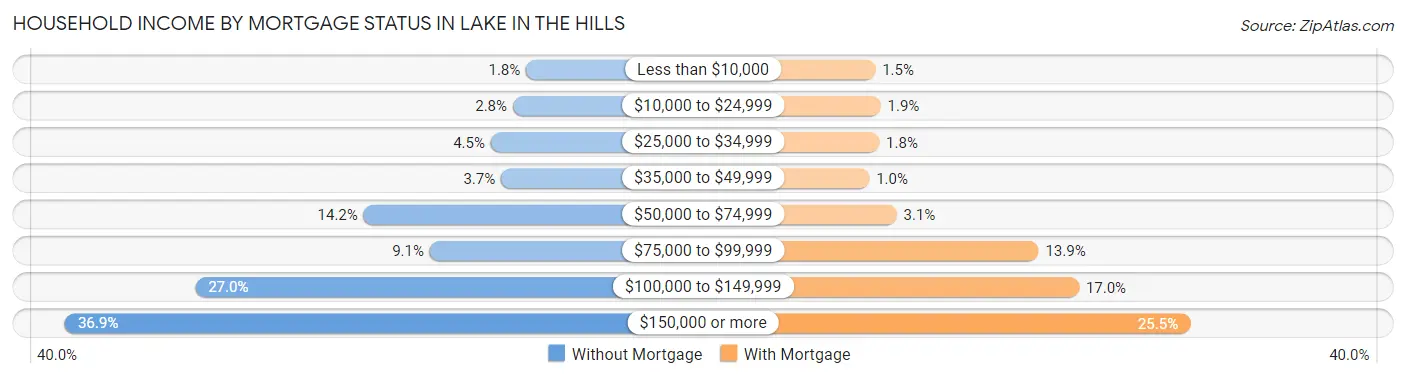
| Household Income | Without Mortgage | With Mortgage |
| Less than $10,000 | 32 (1.8%) | 101 (1.5%) |
| $10,000 to $24,999 | 50 (2.8%) | 128 (1.9%) |
| $25,000 to $34,999 | 80 (4.5%) | 121 (1.8%) |
| $35,000 to $49,999 | 66 (3.7%) | 70 (1.0%) |
| $50,000 to $74,999 | 253 (14.2%) | 210 (3.1%) |
| $75,000 to $99,999 | 163 (9.1%) | 936 (13.9%) |
| $100,000 to $149,999 | 482 (27.0%) | 1,143 (17.0%) |
| $150,000 or more | 659 (36.9%) | 1,711 (25.5%) |
| Total | 1,785 (100.0%) | 6,716 (100.0%) |
Property Value to Household Income Ratio in Lake In The Hills
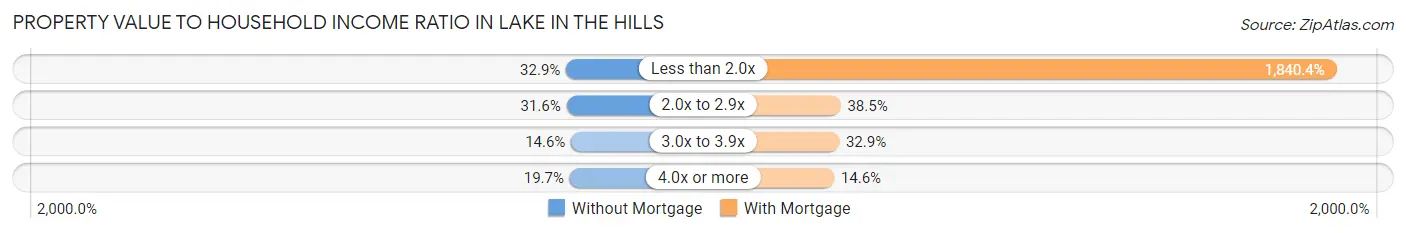
| Value-to-Income Ratio | Without Mortgage | With Mortgage |
| Less than 2.0x | 588 (32.9%) | 123,600 (1,840.4%) |
| 2.0x to 2.9x | 564 (31.6%) | 2,582 (38.5%) |
| 3.0x to 3.9x | 261 (14.6%) | 2,207 (32.9%) |
| 4.0x or more | 352 (19.7%) | 983 (14.6%) |
| Total | 1,785 (100.0%) | 6,716 (100.0%) |
Real Estate Taxes by Mortgage Status in Lake In The Hills
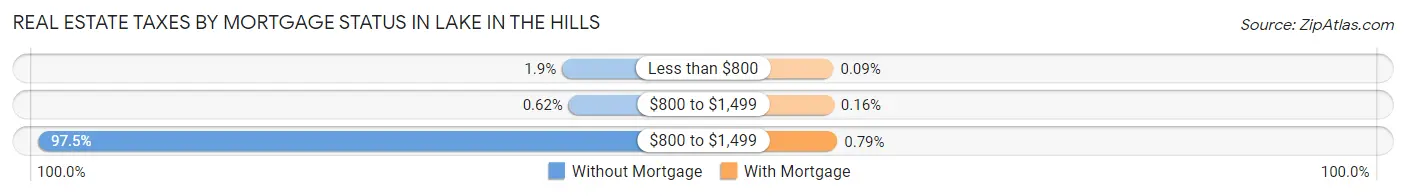
| Property Taxes | Without Mortgage | With Mortgage |
| Less than $800 | 33 (1.8%) | 6 (0.1%) |
| $800 to $1,499 | 11 (0.6%) | 11 (0.2%) |
| $800 to $1,499 | 1,741 (97.5%) | 53 (0.8%) |
| Total | 1,785 (100.0%) | 6,716 (100.0%) |
Health & Disability in Lake In The Hills
Health Insurance Coverage by Age in Lake In The Hills
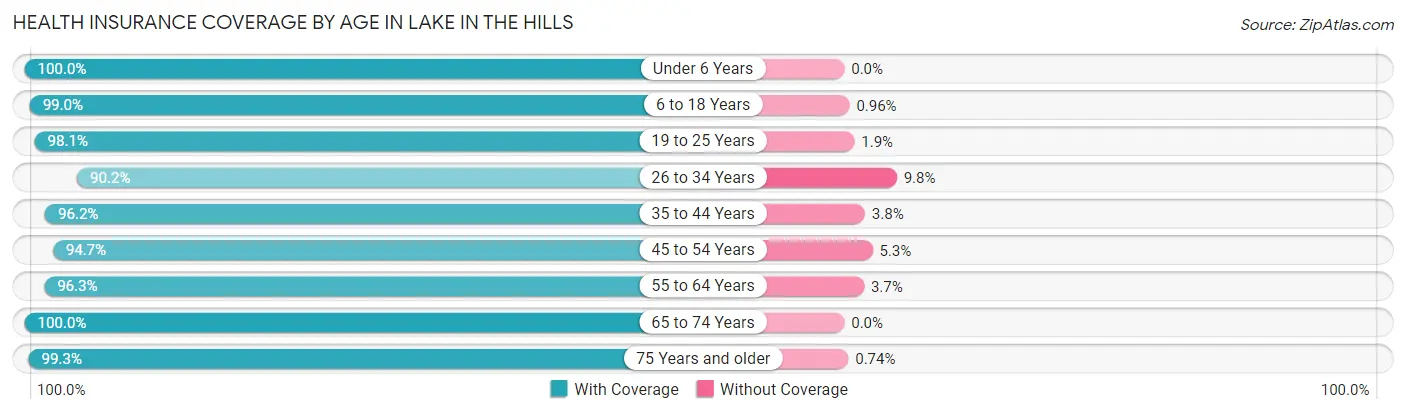
| Age Bracket | With Coverage | Without Coverage |
| Under 6 Years | 2,316 (100.0%) | 0 (0.0%) |
| 6 to 18 Years | 5,858 (99.0%) | 57 (1.0%) |
| 19 to 25 Years | 2,769 (98.1%) | 53 (1.9%) |
| 26 to 34 Years | 2,684 (90.2%) | 291 (9.8%) |
| 35 to 44 Years | 4,052 (96.2%) | 162 (3.8%) |
| 45 to 54 Years | 4,280 (94.7%) | 238 (5.3%) |
| 55 to 64 Years | 3,284 (96.3%) | 125 (3.7%) |
| 65 to 74 Years | 1,663 (100.0%) | 0 (0.0%) |
| 75 Years and older | 1,074 (99.3%) | 8 (0.7%) |
| Total | 27,980 (96.8%) | 934 (3.2%) |
Health Insurance Coverage by Citizenship Status in Lake In The Hills
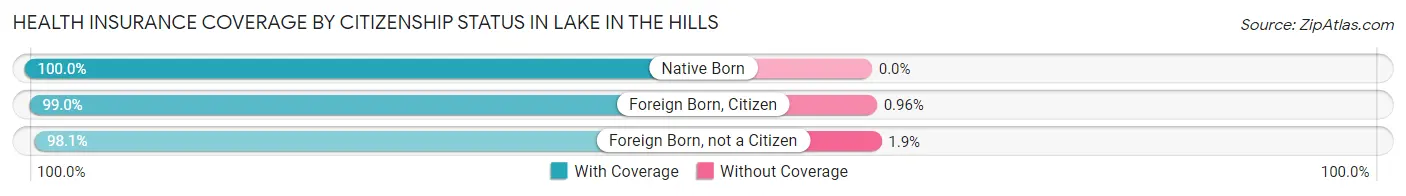
| Citizenship Status | With Coverage | Without Coverage |
| Native Born | 2,316 (100.0%) | 0 (0.0%) |
| Foreign Born, Citizen | 5,858 (99.0%) | 57 (1.0%) |
| Foreign Born, not a Citizen | 2,769 (98.1%) | 53 (1.9%) |
Health Insurance Coverage by Household Income in Lake In The Hills
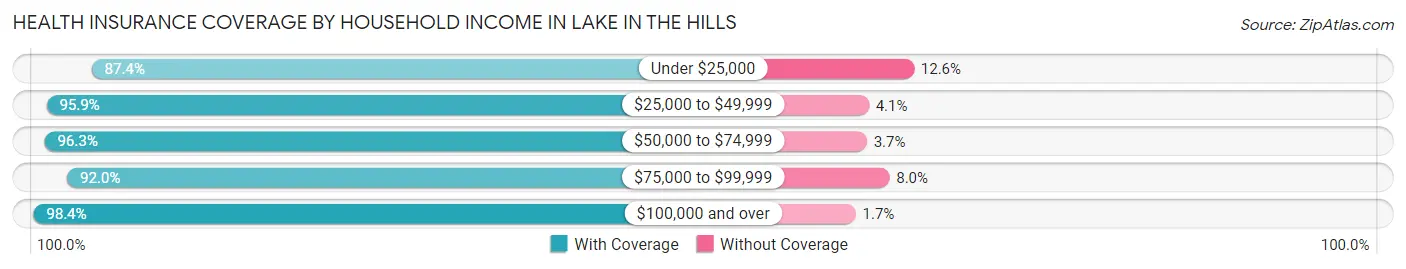
| Household Income | With Coverage | Without Coverage |
| Under $25,000 | 578 (87.4%) | 83 (12.6%) |
| $25,000 to $49,999 | 2,175 (95.9%) | 93 (4.1%) |
| $50,000 to $74,999 | 3,098 (96.3%) | 120 (3.7%) |
| $75,000 to $99,999 | 3,818 (92.0%) | 330 (8.0%) |
| $100,000 and over | 18,311 (98.4%) | 308 (1.7%) |
Public vs Private Health Insurance Coverage by Age in Lake In The Hills
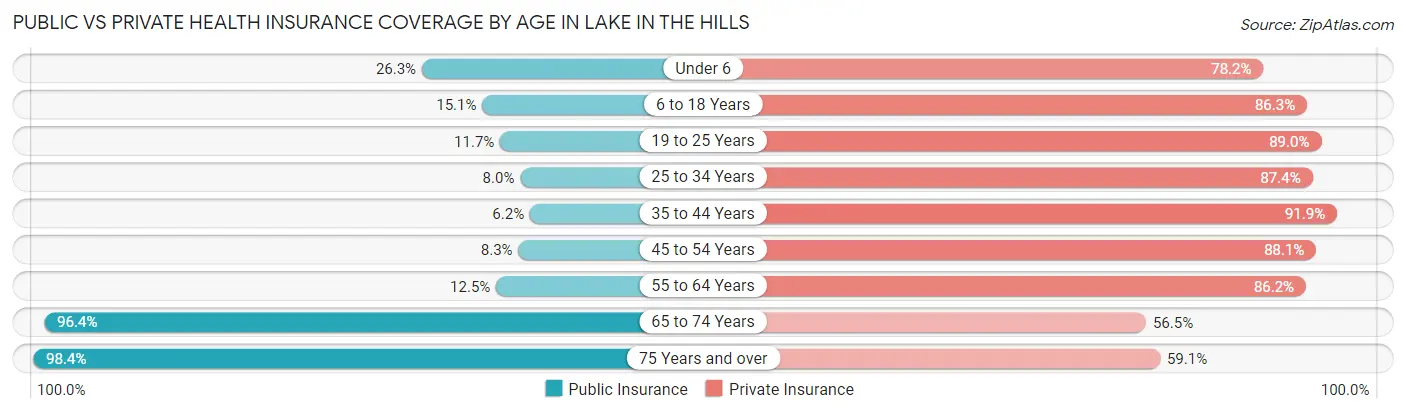
| Age Bracket | Public Insurance | Private Insurance |
| Under 6 | 608 (26.3%) | 1,812 (78.2%) |
| 6 to 18 Years | 890 (15.0%) | 5,107 (86.3%) |
| 19 to 25 Years | 331 (11.7%) | 2,511 (89.0%) |
| 25 to 34 Years | 238 (8.0%) | 2,599 (87.4%) |
| 35 to 44 Years | 261 (6.2%) | 3,873 (91.9%) |
| 45 to 54 Years | 377 (8.3%) | 3,978 (88.0%) |
| 55 to 64 Years | 425 (12.5%) | 2,937 (86.2%) |
| 65 to 74 Years | 1,603 (96.4%) | 939 (56.5%) |
| 75 Years and over | 1,065 (98.4%) | 639 (59.1%) |
| Total | 5,798 (20.1%) | 24,395 (84.4%) |
Disability Status by Sex by Age in Lake In The Hills
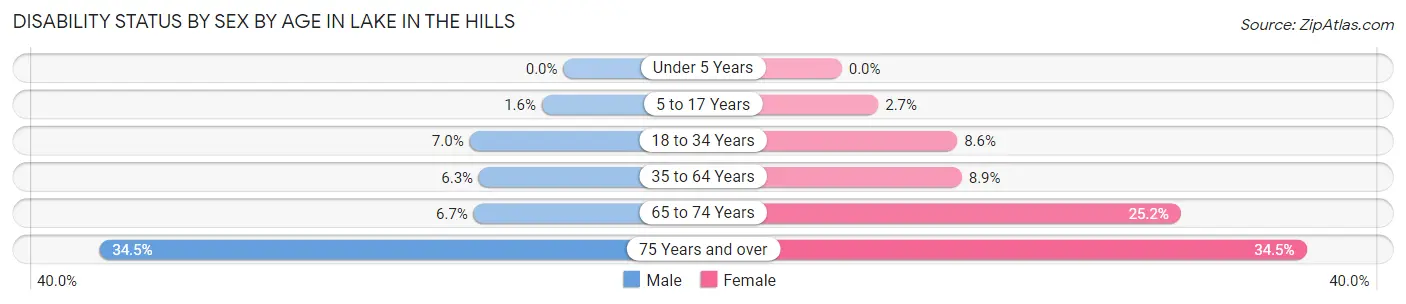
| Age Bracket | Male | Female |
| Under 5 Years | 0 (0.0%) | 0 (0.0%) |
| 5 to 17 Years | 48 (1.6%) | 80 (2.7%) |
| 18 to 34 Years | 217 (7.0%) | 262 (8.6%) |
| 35 to 64 Years | 378 (6.3%) | 545 (8.9%) |
| 65 to 74 Years | 48 (6.7%) | 237 (25.2%) |
| 75 Years and over | 165 (34.4%) | 208 (34.5%) |
Disability Class by Sex by Age in Lake In The Hills
Disability Class: Hearing Difficulty
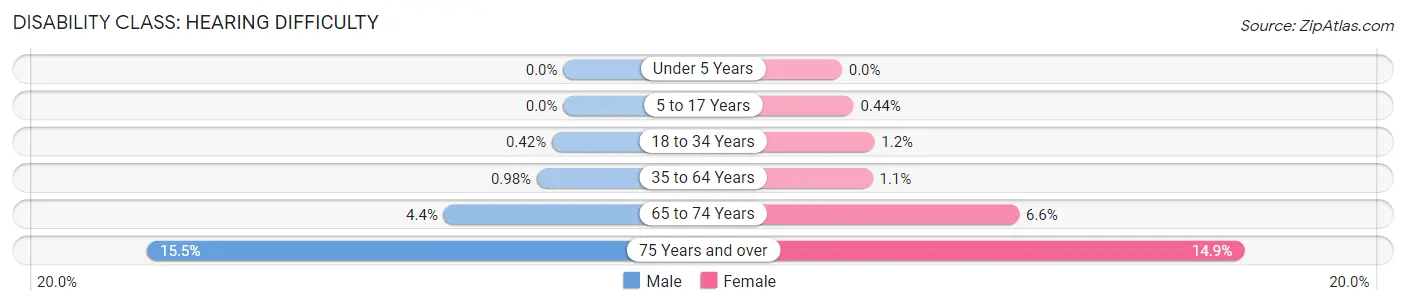
| Age Bracket | Male | Female |
| Under 5 Years | 0 (0.0%) | 0 (0.0%) |
| 5 to 17 Years | 0 (0.0%) | 13 (0.4%) |
| 18 to 34 Years | 13 (0.4%) | 37 (1.2%) |
| 35 to 64 Years | 59 (1.0%) | 70 (1.1%) |
| 65 to 74 Years | 32 (4.4%) | 62 (6.6%) |
| 75 Years and over | 74 (15.4%) | 90 (14.9%) |
Disability Class: Vision Difficulty
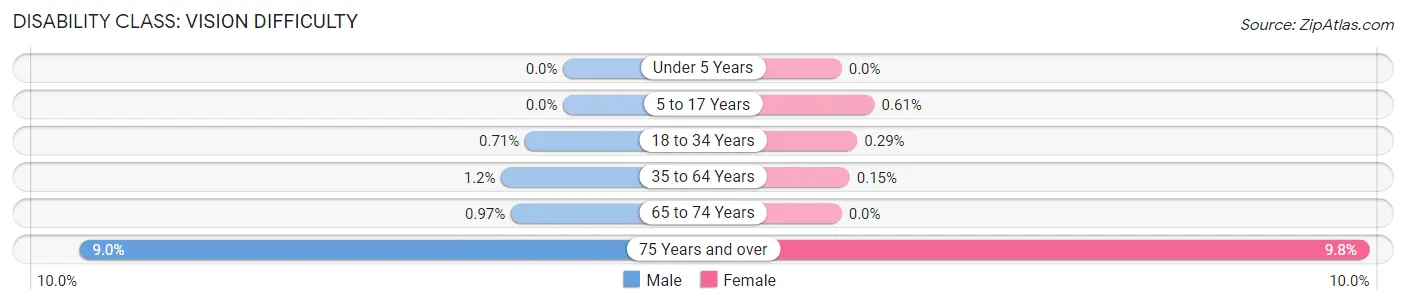
| Age Bracket | Male | Female |
| Under 5 Years | 0 (0.0%) | 0 (0.0%) |
| 5 to 17 Years | 0 (0.0%) | 18 (0.6%) |
| 18 to 34 Years | 22 (0.7%) | 9 (0.3%) |
| 35 to 64 Years | 69 (1.1%) | 9 (0.2%) |
| 65 to 74 Years | 7 (1.0%) | 0 (0.0%) |
| 75 Years and over | 43 (9.0%) | 59 (9.8%) |
Disability Class: Cognitive Difficulty
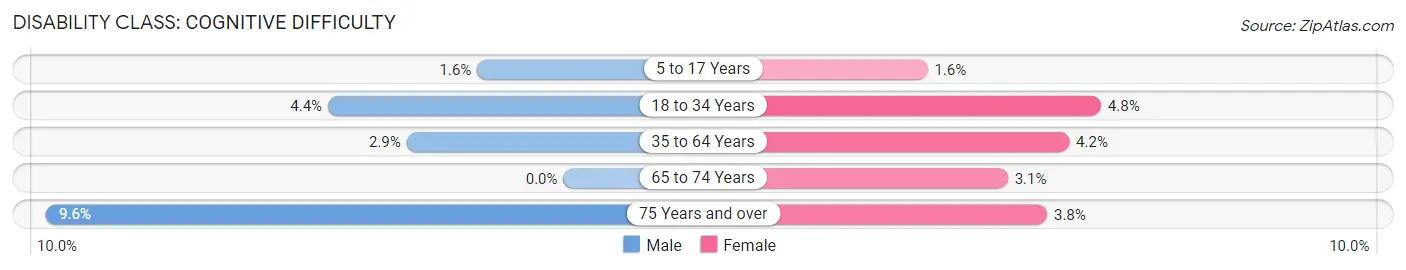
| Age Bracket | Male | Female |
| 5 to 17 Years | 48 (1.6%) | 47 (1.6%) |
| 18 to 34 Years | 136 (4.4%) | 147 (4.8%) |
| 35 to 64 Years | 175 (2.9%) | 258 (4.2%) |
| 65 to 74 Years | 0 (0.0%) | 29 (3.1%) |
| 75 Years and over | 46 (9.6%) | 23 (3.8%) |
Disability Class: Ambulatory Difficulty
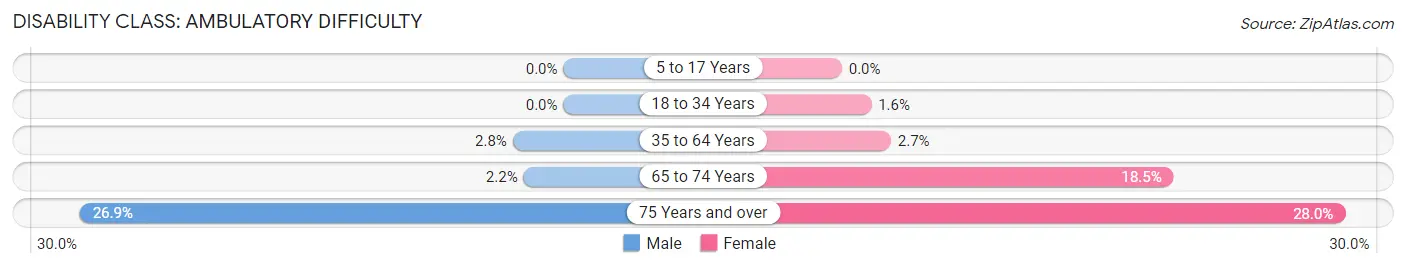
| Age Bracket | Male | Female |
| 5 to 17 Years | 0 (0.0%) | 0 (0.0%) |
| 18 to 34 Years | 0 (0.0%) | 50 (1.6%) |
| 35 to 64 Years | 170 (2.8%) | 167 (2.7%) |
| 65 to 74 Years | 16 (2.2%) | 174 (18.5%) |
| 75 Years and over | 129 (26.9%) | 169 (28.0%) |
Disability Class: Self-Care Difficulty
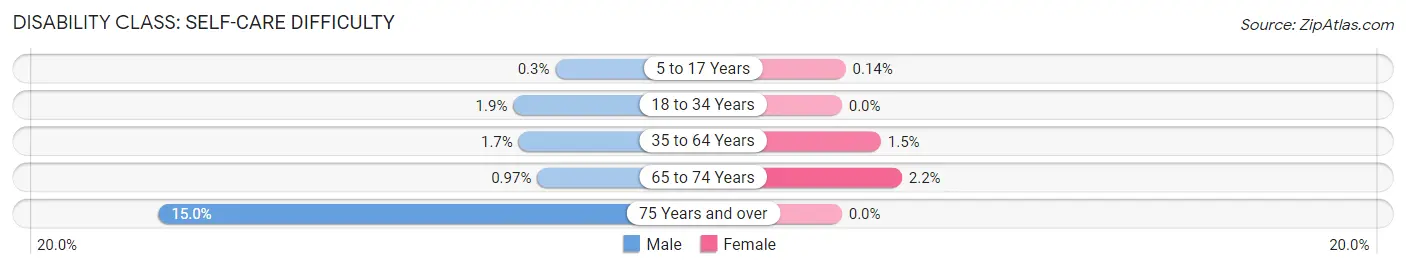
| Age Bracket | Male | Female |
| 5 to 17 Years | 9 (0.3%) | 4 (0.1%) |
| 18 to 34 Years | 58 (1.9%) | 0 (0.0%) |
| 35 to 64 Years | 100 (1.7%) | 89 (1.5%) |
| 65 to 74 Years | 7 (1.0%) | 21 (2.2%) |
| 75 Years and over | 72 (15.0%) | 0 (0.0%) |
Technology Access in Lake In The Hills
Computing Device Access in Lake In The Hills
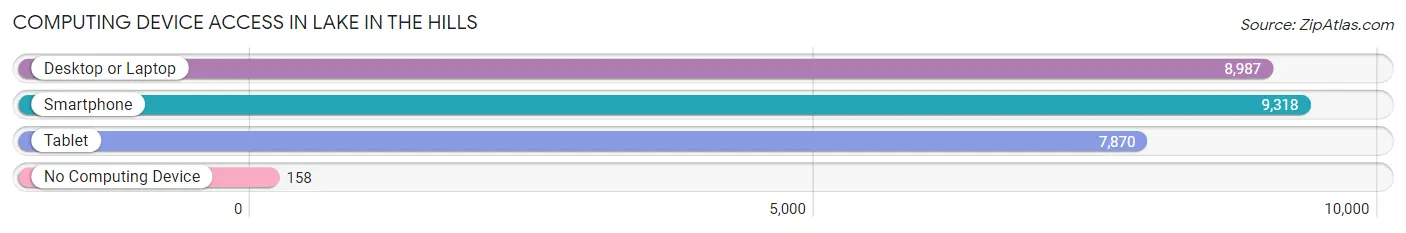
| Device Type | # Households | % Households |
| Desktop or Laptop | 8,987 | 91.0% |
| Smartphone | 9,318 | 94.3% |
| Tablet | 7,870 | 79.7% |
| No Computing Device | 158 | 1.6% |
| Total | 9,878 | 100.0% |
Internet Access in Lake In The Hills
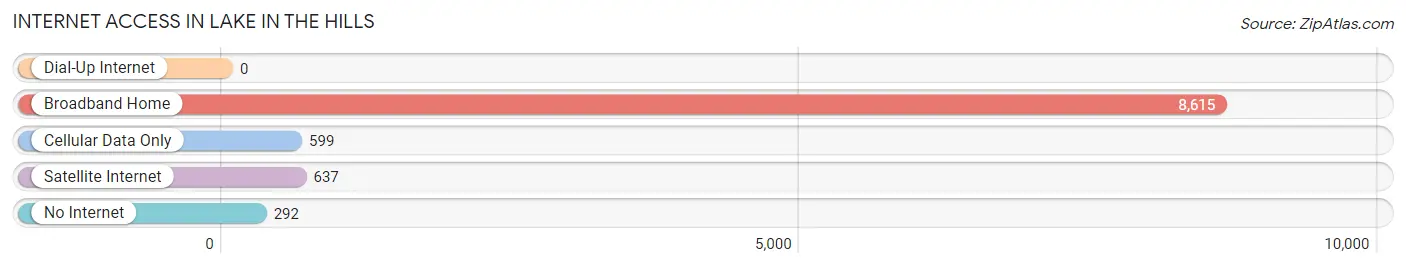
| Internet Type | # Households | % Households |
| Dial-Up Internet | 0 | 0.0% |
| Broadband Home | 8,615 | 87.2% |
| Cellular Data Only | 599 | 6.1% |
| Satellite Internet | 637 | 6.5% |
| No Internet | 292 | 3.0% |
| Total | 9,878 | 100.0% |
Lake In The Hills Summary
Lake in the Hills is a village located in McHenry County, Illinois, United States. The population was 28,965 at the 2010 census, up from 19,000 in 2000. The village is located in the northwest corner of the county, approximately 40 miles northwest of Chicago.
History
The area that is now Lake in the Hills was first settled in the early 1800s by German and Irish immigrants. The first settlers were mostly farmers, and the area was known as the “Garden of the Fox” due to its fertile soil. The area was officially incorporated as a village in 1952.
The village was named after a small lake that was located in the area. The lake was originally known as “Lake in the Hills”, but was later renamed “Lake Algonquin”. The lake was eventually drained and filled in, and is now the site of a residential development.
Geography
Lake in the Hills is located at 42°13′N 88°17′W (42.2179, -88.2845). According to the 2010 census, the village has a total area of 8.9 square miles (23.1 km2), of which 8.8 square miles (22.8 km2) is land and 0.1 square miles (0.3 km2) (1.17%) is water.
The village is located in the northwest corner of McHenry County, approximately 40 miles northwest of Chicago. It is bordered by Algonquin to the east, Crystal Lake to the south, and Huntley to the west.
Economy
The economy of Lake in the Hills is largely based on retail and services. The village is home to several large retail stores, including Walmart, Target, and Kohl’s. There are also several restaurants, banks, and other businesses located in the village.
The village is also home to several industrial and manufacturing businesses, including a large printing company and a plastics manufacturer.
Demographics
As of the 2010 census, there were 28,965 people, 10,845 households, and 7,845 families residing in the village. The population density was 3,269.2 people per square mile (1,261.2/km2). There were 11,541 housing units at an average density of 1,307.2 per square mile (503.7/km2).
The racial makeup of the village was 87.2% White, 3.2% African American, 0.3% Native American, 4.7% Asian, 0.1% Pacific Islander, 2.3% from other races, and 2.3% from two or more races. Hispanic or Latino of any race were 8.2% of the population.
The median income for a household in the village was $76,845, and the median income for a family was $90,945. Males had a median income of $60,945 versus $41,945 for females. The per capita income for the village was $31,945. About 2.7% of families and 3.7% of the population were below the poverty line, including 4.2% of those under age 18 and 4.2% of those age 65 or over.
Lake in the Hills is a growing village with a diverse population and a strong economy. The village is home to several large retail stores, industrial and manufacturing businesses, and other businesses. The village is also home to several parks and recreational areas, making it a great place to live and work.
Common Questions
What is Per Capita Income in Lake In The Hills?
Per Capita income in Lake In The Hills is $42,778.
What is the Median Family Income in Lake In The Hills?
Median Family Income in Lake In The Hills is $127,795.
What is the Median Household income in Lake In The Hills?
Median Household Income in Lake In The Hills is $110,988.
What is Income or Wage Gap in Lake In The Hills?
Income or Wage Gap in Lake In The Hills is 33.2%.
Women in Lake In The Hills earn 66.8 cents for every dollar earned by a man.
What is Inequality or Gini Index in Lake In The Hills?
Inequality or Gini Index in Lake In The Hills is 0.34.
What is the Total Population of Lake In The Hills?
Total Population of Lake In The Hills is 28,958.
What is the Total Male Population of Lake In The Hills?
Total Male Population of Lake In The Hills is 14,355.
What is the Total Female Population of Lake In The Hills?
Total Female Population of Lake In The Hills is 14,603.
What is the Ratio of Males per 100 Females in Lake In The Hills?
There are 98.30 Males per 100 Females in Lake In The Hills.
What is the Ratio of Females per 100 Males in Lake In The Hills?
There are 101.73 Females per 100 Males in Lake In The Hills.
What is the Median Population Age in Lake In The Hills?
Median Population Age in Lake In The Hills is 35.9 Years.
What is the Average Family Size in Lake In The Hills
Average Family Size in Lake In The Hills is 3.4 People.
What is the Average Household Size in Lake In The Hills
Average Household Size in Lake In The Hills is 2.9 People.
How Large is the Labor Force in Lake In The Hills?
There are 16,749 People in the Labor Forcein in Lake In The Hills.
What is the Percentage of People in the Labor Force in Lake In The Hills?
75.1% of People are in the Labor Force in Lake In The Hills.
What is the Unemployment Rate in Lake In The Hills?
Unemployment Rate in Lake In The Hills is 5.6%.