Skokie, IL Map & Demographics
Skokie Map
Skokie Overview
$43,338
PER CAPITA INCOME
$113,320
AVG FAMILY INCOME
$91,892
AVG HOUSEHOLD INCOME
18.7%
WAGE / INCOME GAP [ % ]
81.3¢/ $1
WAGE / INCOME GAP [ $ ]
$11,369
FAMILY INCOME DEFICIT
0.44
INEQUALITY / GINI INDEX
67,076
TOTAL POPULATION
33,327
MALE POPULATION
33,749
FEMALE POPULATION
98.75
MALES / 100 FEMALES
101.27
FEMALES / 100 MALES
43.0
MEDIAN AGE
3.3
AVG FAMILY SIZE
2.8
AVG HOUSEHOLD SIZE
33,515
LABOR FORCE [ PEOPLE ]
62.3%
PERCENT IN LABOR FORCE
5.4%
UNEMPLOYMENT RATE
Income in Skokie
Income Overview in Skokie
Per Capita Income in Skokie is $43,338, while median incomes of families and households are $113,320 and $91,892 respectively.
| Characteristic | Number | Measure |
| Per Capita Income | 67,076 | $43,338 |
| Median Family Income | 17,502 | $113,320 |
| Mean Family Income | 17,502 | $137,676 |
| Median Household Income | 24,049 | $91,892 |
| Mean Household Income | 24,049 | $119,395 |
| Income Deficit | 17,502 | $11,369 |
| Wage / Income Gap (%) | 67,076 | 18.73% |
| Wage / Income Gap ($) | 67,076 | 81.27¢ per $1 |
| Gini / Inequality Index | 67,076 | 0.44 |
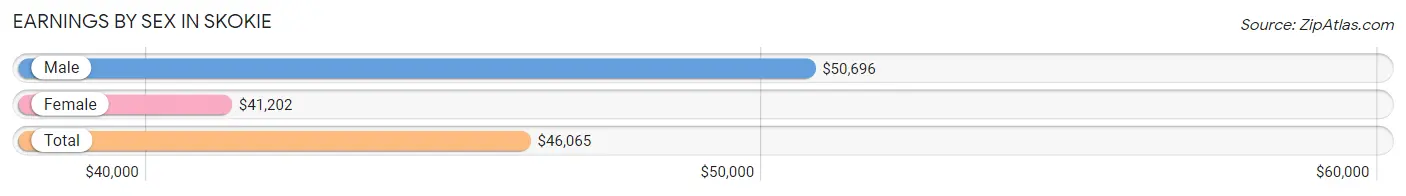
Earnings by Sex in Skokie
Average Earnings in Skokie are $46,065, $50,696 for men and $41,202 for women, a difference of 18.7%.
| Sex | Number | Average Earnings |
| Male | 17,869 (51.4%) | $50,696 |
| Female | 16,923 (48.6%) | $41,202 |
| Total | 34,792 (100.0%) | $46,065 |
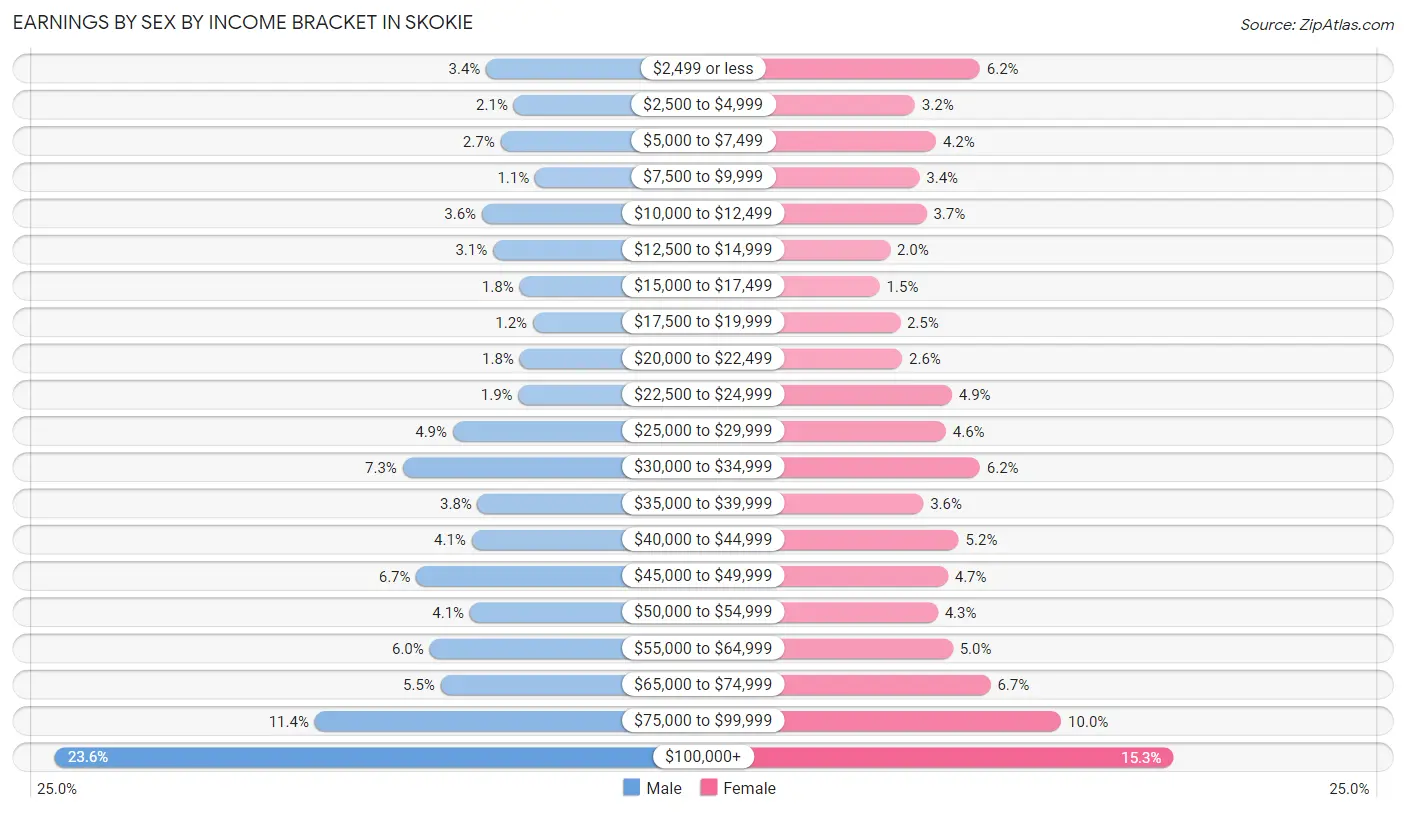
Earnings by Sex by Income Bracket in Skokie
The most common earnings brackets in Skokie are $100,000+ for men (4,213 | 23.6%) and $100,000+ for women (2,588 | 15.3%).
| Income | Male | Female |
| $2,499 or less | 604 (3.4%) | 1,054 (6.2%) |
| $2,500 to $4,999 | 373 (2.1%) | 539 (3.2%) |
| $5,000 to $7,499 | 484 (2.7%) | 708 (4.2%) |
| $7,500 to $9,999 | 194 (1.1%) | 575 (3.4%) |
| $10,000 to $12,499 | 640 (3.6%) | 631 (3.7%) |
| $12,500 to $14,999 | 547 (3.1%) | 341 (2.0%) |
| $15,000 to $17,499 | 325 (1.8%) | 260 (1.5%) |
| $17,500 to $19,999 | 213 (1.2%) | 422 (2.5%) |
| $20,000 to $22,499 | 324 (1.8%) | 439 (2.6%) |
| $22,500 to $24,999 | 335 (1.9%) | 832 (4.9%) |
| $25,000 to $29,999 | 883 (4.9%) | 786 (4.6%) |
| $30,000 to $34,999 | 1,303 (7.3%) | 1,055 (6.2%) |
| $35,000 to $39,999 | 676 (3.8%) | 606 (3.6%) |
| $40,000 to $44,999 | 725 (4.1%) | 887 (5.2%) |
| $45,000 to $49,999 | 1,189 (6.7%) | 801 (4.7%) |
| $50,000 to $54,999 | 740 (4.1%) | 721 (4.3%) |
| $55,000 to $64,999 | 1,078 (6.0%) | 840 (5.0%) |
| $65,000 to $74,999 | 985 (5.5%) | 1,139 (6.7%) |
| $75,000 to $99,999 | 2,038 (11.4%) | 1,699 (10.0%) |
| $100,000+ | 4,213 (23.6%) | 2,588 (15.3%) |
| Total | 17,869 (100.0%) | 16,923 (100.0%) |
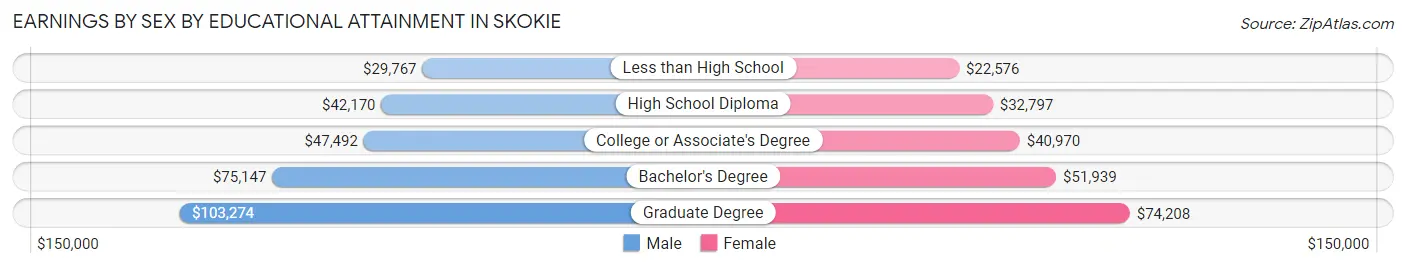
Earnings by Sex by Educational Attainment in Skokie
Average earnings in Skokie are $57,231 for men and $45,552 for women, a difference of 20.4%. Men with an educational attainment of graduate degree enjoy the highest average annual earnings of $103,274, while those with less than high school education earn the least with $29,767. Women with an educational attainment of graduate degree earn the most with the average annual earnings of $74,208, while those with less than high school education have the smallest earnings of $22,576.
| Educational Attainment | Male Income | Female Income |
| Less than High School | $29,767 | $22,576 |
| High School Diploma | $42,170 | $32,797 |
| College or Associate's Degree | $47,492 | $40,970 |
| Bachelor's Degree | $75,147 | $51,939 |
| Graduate Degree | $103,274 | $74,208 |
| Total | $57,231 | $45,552 |
Family Income in Skokie
Family Income Brackets in Skokie
According to the Skokie family income data, there are 3,623 families falling into the $100,000 to $149,999 income range, which is the most common income bracket and makes up 20.7% of all families. Conversely, the $10,000 to $14,999 income bracket is the least frequent group with only 245 families (1.4%) belonging to this category.
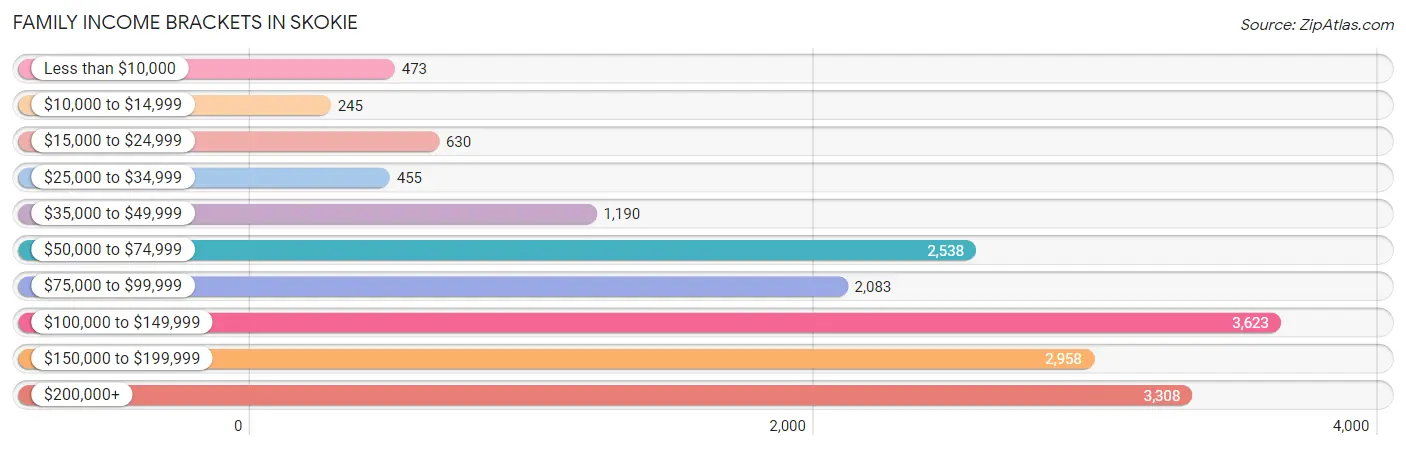
| Income Bracket | # Families | % Families |
| Less than $10,000 | 473 | 2.7% |
| $10,000 to $14,999 | 245 | 1.4% |
| $15,000 to $24,999 | 630 | 3.6% |
| $25,000 to $34,999 | 455 | 2.6% |
| $35,000 to $49,999 | 1,190 | 6.8% |
| $50,000 to $74,999 | 2,538 | 14.5% |
| $75,000 to $99,999 | 2,083 | 11.9% |
| $100,000 to $149,999 | 3,623 | 20.7% |
| $150,000 to $199,999 | 2,958 | 16.9% |
| $200,000+ | 3,308 | 18.9% |
Family Income by Famaliy Size in Skokie
7+ person families (322 | 1.8%) account for the highest median family income in Skokie with $188,571 per family, while 2-person families (6,729 | 38.5%) have the highest median income of $48,024 per family member.
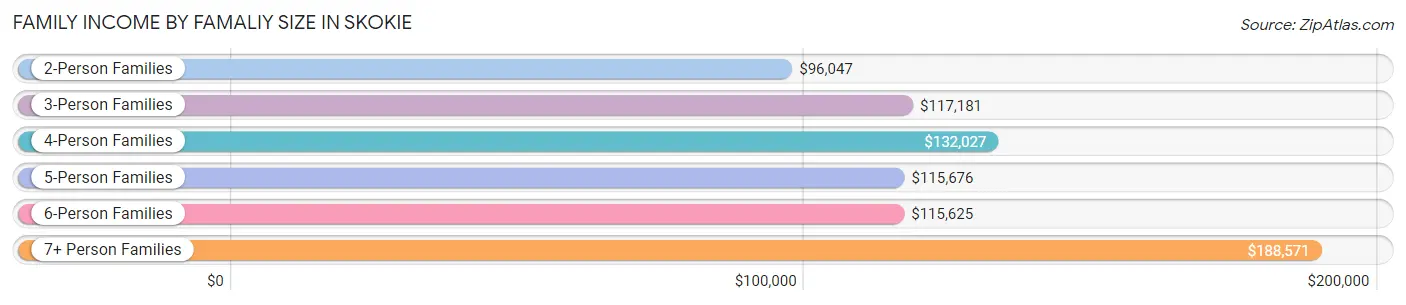
| Income Bracket | # Families | Median Income |
| 2-Person Families | 6,729 (38.5%) | $96,047 |
| 3-Person Families | 4,341 (24.8%) | $117,181 |
| 4-Person Families | 3,261 (18.6%) | $132,027 |
| 5-Person Families | 2,092 (11.9%) | $115,676 |
| 6-Person Families | 757 (4.3%) | $115,625 |
| 7+ Person Families | 322 (1.8%) | $188,571 |
| Total | 17,502 (100.0%) | $113,320 |
Family Income by Number of Earners in Skokie
The median family income in Skokie is $113,320, with families comprising 2 earners (7,202) having the highest median family income of $144,762, while families with no earners (2,041) have the lowest median family income of $59,403, accounting for 41.1% and 11.7% of families, respectively.
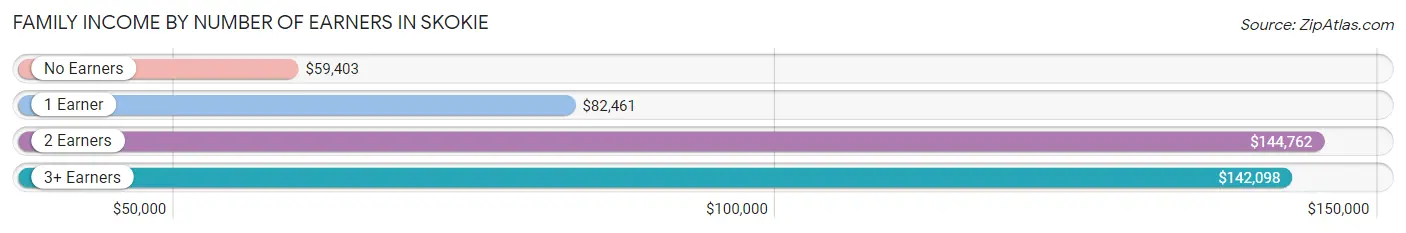
| Number of Earners | # Families | Median Income |
| No Earners | 2,041 (11.7%) | $59,403 |
| 1 Earner | 5,297 (30.3%) | $82,461 |
| 2 Earners | 7,202 (41.1%) | $144,762 |
| 3+ Earners | 2,962 (16.9%) | $142,098 |
| Total | 17,502 (100.0%) | $113,320 |
Household Income in Skokie
Household Income Brackets in Skokie
With 4,305 households falling in the category, the $100,000 to $149,999 income range is the most frequent in Skokie, accounting for 17.9% of all households. In contrast, only 721 households (3.0%) fall into the $10,000 to $14,999 income bracket, making it the least populous group.
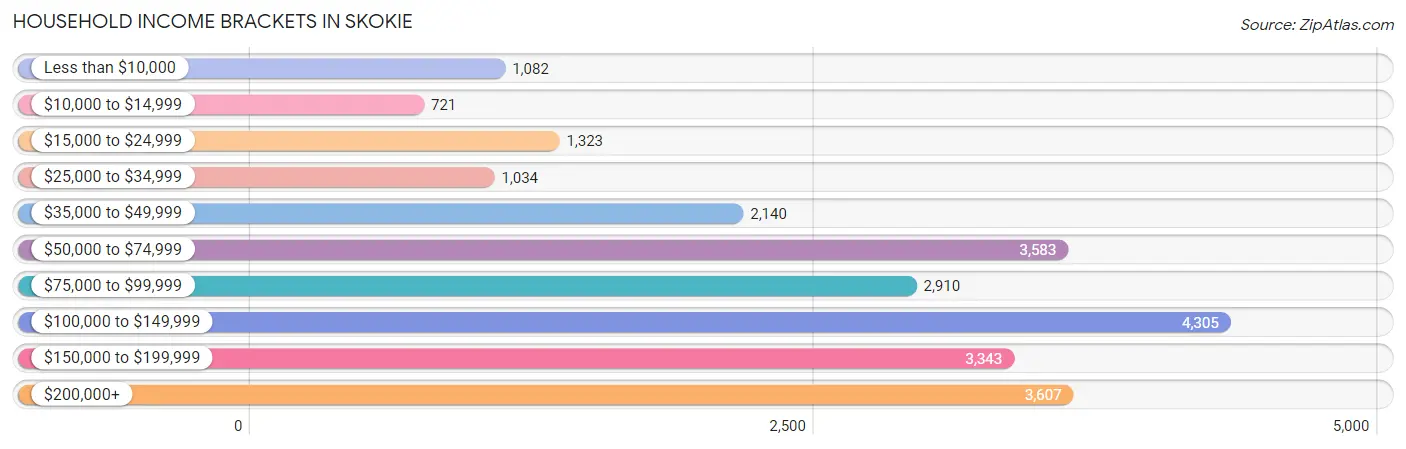
| Income Bracket | # Households | % Households |
| Less than $10,000 | 1,082 | 4.5% |
| $10,000 to $14,999 | 721 | 3.0% |
| $15,000 to $24,999 | 1,323 | 5.5% |
| $25,000 to $34,999 | 1,034 | 4.3% |
| $35,000 to $49,999 | 2,140 | 8.9% |
| $50,000 to $74,999 | 3,583 | 14.9% |
| $75,000 to $99,999 | 2,910 | 12.1% |
| $100,000 to $149,999 | 4,305 | 17.9% |
| $150,000 to $199,999 | 3,343 | 13.9% |
| $200,000+ | 3,607 | 15.0% |
Household Income by Householder Age in Skokie
The median household income in Skokie is $91,892, with the highest median household income of $117,992 found in the 15 to 24 years age bracket for the primary householder. A total of 133 households (0.5%) fall into this category. Meanwhile, the 65+ years age bracket for the primary householder has the lowest median household income of $68,337, with 8,158 households (33.9%) in this group.
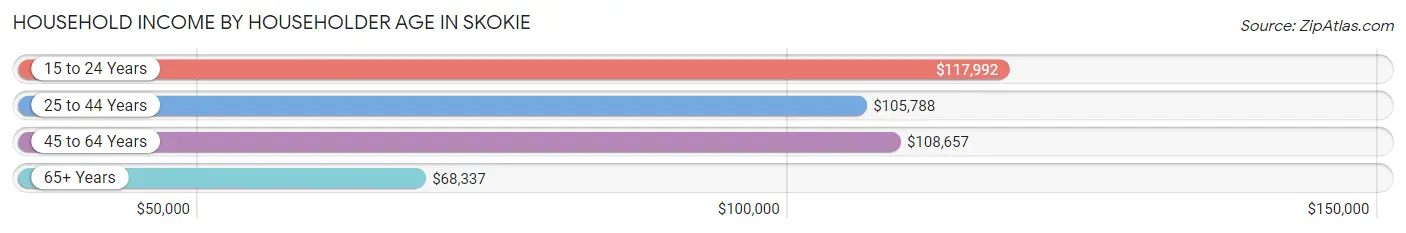
| Income Bracket | # Households | Median Income |
| 15 to 24 Years | 133 (0.5%) | $117,992 |
| 25 to 44 Years | 5,860 (24.4%) | $105,788 |
| 45 to 64 Years | 9,898 (41.2%) | $108,657 |
| 65+ Years | 8,158 (33.9%) | $68,337 |
| Total | 24,049 (100.0%) | $91,892 |
Poverty in Skokie
Income Below Poverty by Sex and Age in Skokie
With 8.6% poverty level for males and 8.7% for females among the residents of Skokie, 15 year old males and 15 year old females are the most vulnerable to poverty, with 185 males (28.9%) and 85 females (23.5%) in their respective age groups living below the poverty level.
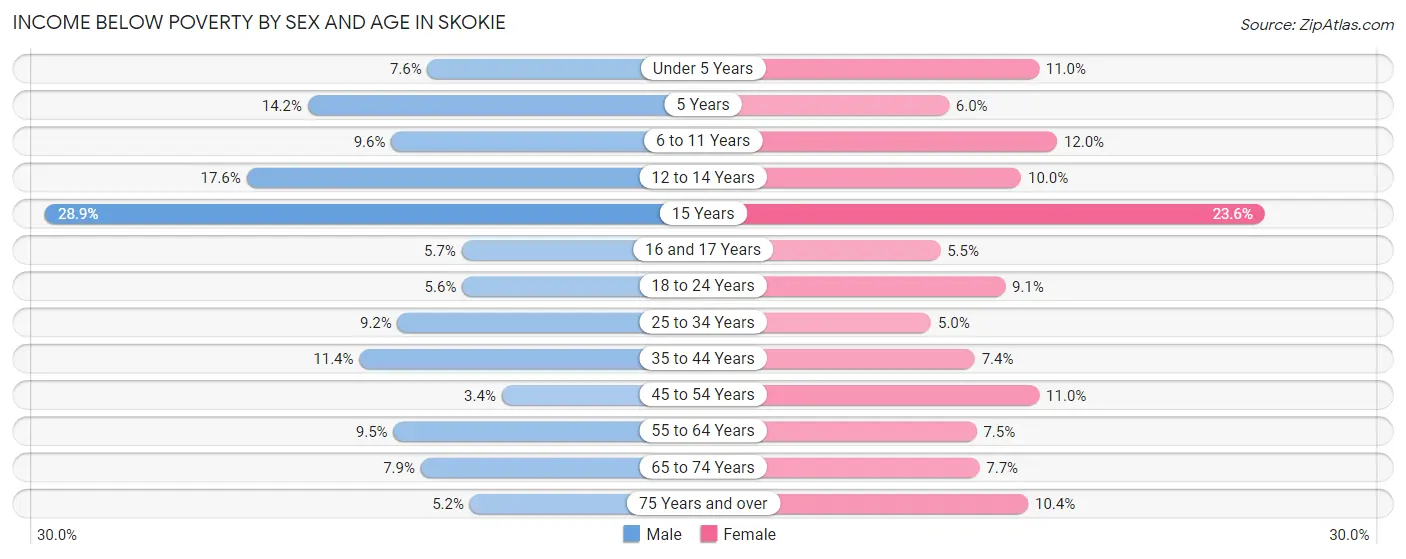
| Age Bracket | Male | Female |
| Under 5 Years | 183 (7.6%) | 149 (11.0%) |
| 5 Years | 38 (14.2%) | 39 (6.0%) |
| 6 to 11 Years | 251 (9.6%) | 280 (12.0%) |
| 12 to 14 Years | 230 (17.6%) | 127 (10.0%) |
| 15 Years | 185 (28.9%) | 85 (23.5%) |
| 16 and 17 Years | 57 (5.7%) | 53 (5.5%) |
| 18 to 24 Years | 142 (5.6%) | 207 (9.1%) |
| 25 to 34 Years | 315 (9.2%) | 155 (5.0%) |
| 35 to 44 Years | 450 (11.4%) | 329 (7.4%) |
| 45 to 54 Years | 151 (3.4%) | 535 (11.0%) |
| 55 to 64 Years | 426 (9.5%) | 329 (7.5%) |
| 65 to 74 Years | 318 (7.9%) | 365 (7.7%) |
| 75 Years and over | 101 (5.2%) | 275 (10.4%) |
| Total | 2,847 (8.6%) | 2,928 (8.7%) |
Income Above Poverty by Sex and Age in Skokie
According to the poverty statistics in Skokie, males aged 45 to 54 years and females aged 25 to 34 years are the age groups that are most secure financially, with 96.6% of males and 95.0% of females in these age groups living above the poverty line.
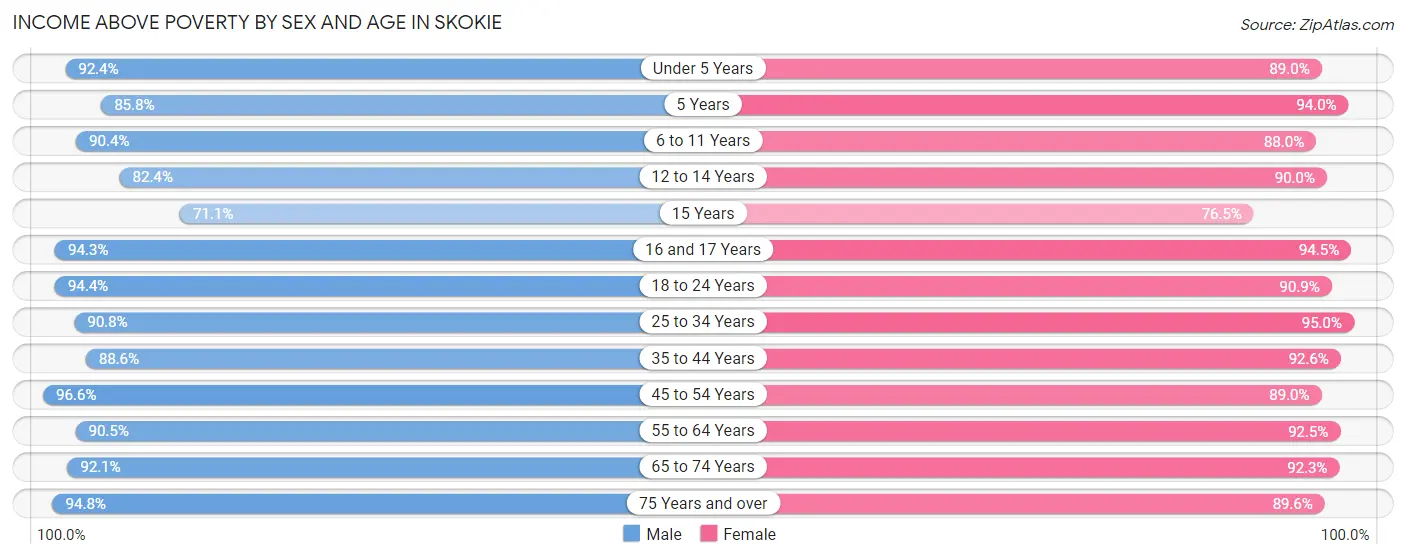
| Age Bracket | Male | Female |
| Under 5 Years | 2,239 (92.4%) | 1,209 (89.0%) |
| 5 Years | 229 (85.8%) | 615 (94.0%) |
| 6 to 11 Years | 2,369 (90.4%) | 2,057 (88.0%) |
| 12 to 14 Years | 1,074 (82.4%) | 1,146 (90.0%) |
| 15 Years | 456 (71.1%) | 276 (76.4%) |
| 16 and 17 Years | 950 (94.3%) | 914 (94.5%) |
| 18 to 24 Years | 2,379 (94.4%) | 2,071 (90.9%) |
| 25 to 34 Years | 3,098 (90.8%) | 2,965 (95.0%) |
| 35 to 44 Years | 3,511 (88.6%) | 4,114 (92.6%) |
| 45 to 54 Years | 4,247 (96.6%) | 4,334 (89.0%) |
| 55 to 64 Years | 4,075 (90.5%) | 4,059 (92.5%) |
| 65 to 74 Years | 3,687 (92.1%) | 4,403 (92.3%) |
| 75 Years and over | 1,836 (94.8%) | 2,378 (89.6%) |
| Total | 30,150 (91.4%) | 30,541 (91.2%) |
Income Below Poverty Among Married-Couple Families in Skokie
The poverty statistics for married-couple families in Skokie show that 5.7% or 759 of the total 13,413 families live below the poverty line. Families with 5 or more children have the highest poverty rate of 25.4%, comprising of 15 families. On the other hand, families with no children have the lowest poverty rate of 3.8%, which includes 291 families.
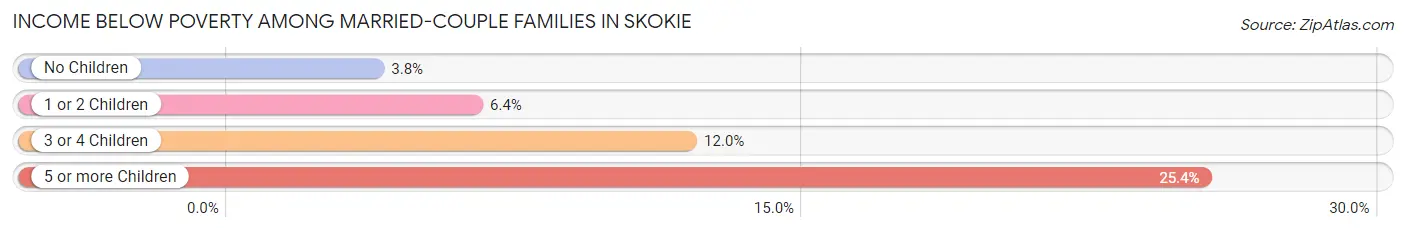
| Children | Above Poverty | Below Poverty |
| No Children | 7,325 (96.2%) | 291 (3.8%) |
| 1 or 2 Children | 3,935 (93.6%) | 269 (6.4%) |
| 3 or 4 Children | 1,350 (88.0%) | 184 (12.0%) |
| 5 or more Children | 44 (74.6%) | 15 (25.4%) |
| Total | 12,654 (94.3%) | 759 (5.7%) |
Income Below Poverty Among Single-Parent Households in Skokie
According to the poverty data in Skokie, 2.7% or 41 single-father households and 16.6% or 428 single-mother households are living below the poverty line. Among single-father households, those with no children have the highest poverty rate, with 41 households (4.3%) experiencing poverty. Likewise, among single-mother households, those with 3 or 4 children have the highest poverty rate, with 87 households (52.4%) falling below the poverty line.
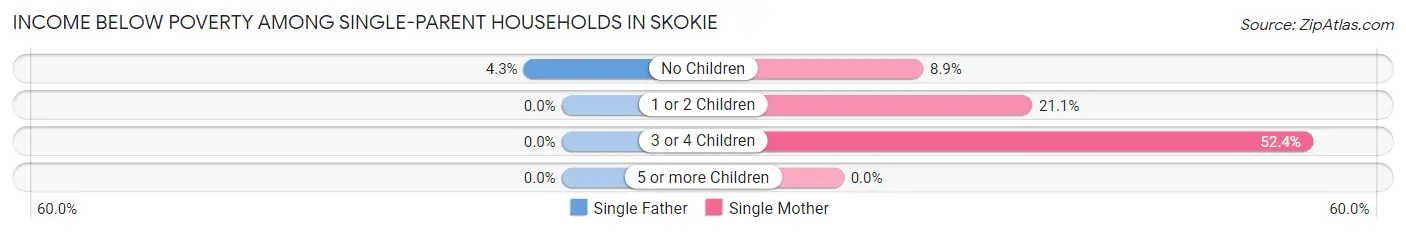
| Children | Single Father | Single Mother |
| No Children | 41 (4.3%) | 115 (8.9%) |
| 1 or 2 Children | 0 (0.0%) | 226 (21.1%) |
| 3 or 4 Children | 0 (0.0%) | 87 (52.4%) |
| 5 or more Children | 0 (0.0%) | 0 (0.0%) |
| Total | 41 (2.7%) | 428 (16.6%) |
Income Below Poverty Among Married-Couple vs Single-Parent Households in Skokie
The poverty data for Skokie shows that 759 of the married-couple family households (5.7%) and 469 of the single-parent households (11.5%) are living below the poverty level. Within the married-couple family households, those with 5 or more children have the highest poverty rate, with 15 households (25.4%) falling below the poverty line. Among the single-parent households, those with 3 or 4 children have the highest poverty rate, with 87 household (44.6%) living below poverty.
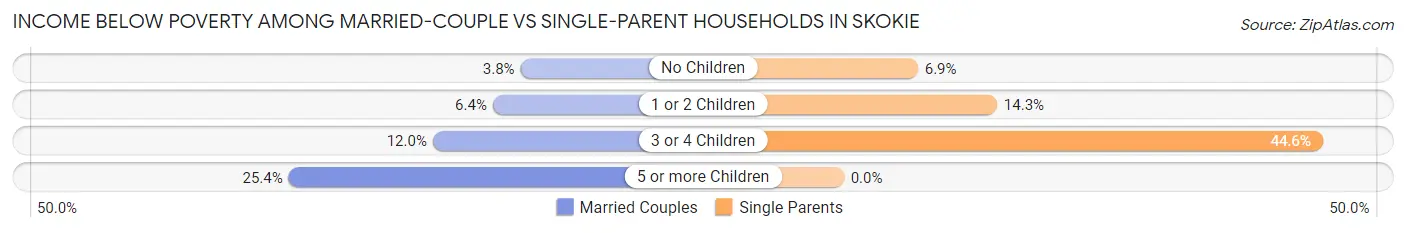
| Children | Married-Couple Families | Single-Parent Households |
| No Children | 291 (3.8%) | 156 (6.9%) |
| 1 or 2 Children | 269 (6.4%) | 226 (14.3%) |
| 3 or 4 Children | 184 (12.0%) | 87 (44.6%) |
| 5 or more Children | 15 (25.4%) | 0 (0.0%) |
| Total | 759 (5.7%) | 469 (11.5%) |
Race in Skokie
The most populous races in Skokie are White / Caucasian (35,470 | 52.9%), Asian (17,630 | 26.3%), and Hispanic or Latino (7,413 | 11.1%).
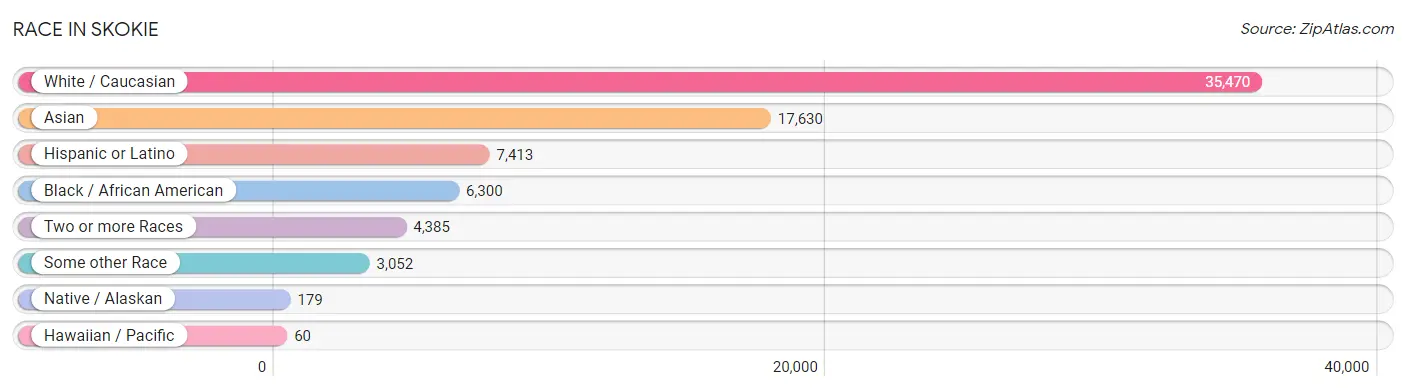
| Race | # Population | % Population |
| Asian | 17,630 | 26.3% |
| Black / African American | 6,300 | 9.4% |
| Hawaiian / Pacific | 60 | 0.1% |
| Hispanic or Latino | 7,413 | 11.1% |
| Native / Alaskan | 179 | 0.3% |
| White / Caucasian | 35,470 | 52.9% |
| Two or more Races | 4,385 | 6.5% |
| Some other Race | 3,052 | 4.5% |
| Total | 67,076 | 100.0% |
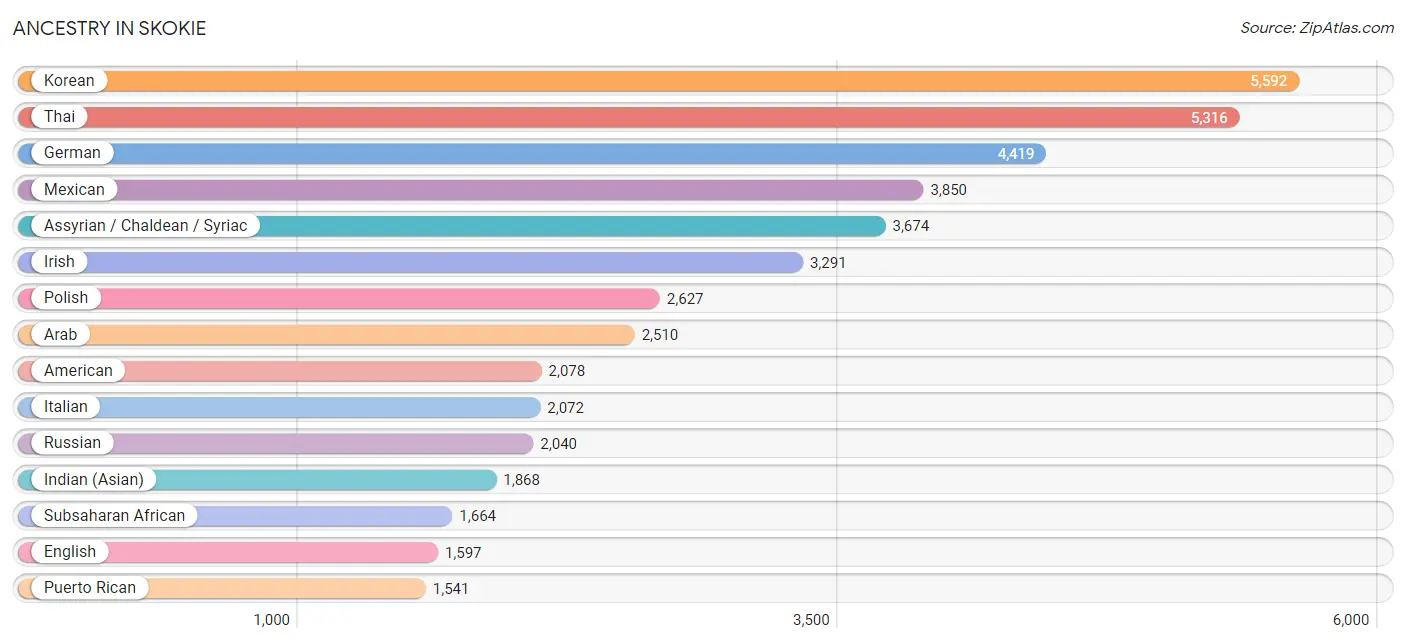
Ancestry in Skokie
The most populous ancestries reported in Skokie are Korean (5,592 | 8.3%), Thai (5,316 | 7.9%), German (4,419 | 6.6%), Mexican (3,850 | 5.7%), and Assyrian / Chaldean / Syriac (3,674 | 5.5%), together accounting for 34.1% of all Skokie residents.
| Ancestry | # Population | % Population |
| Afghan | 57 | 0.1% |
| African | 92 | 0.1% |
| Albanian | 228 | 0.3% |
| American | 2,078 | 3.1% |
| Arab | 2,510 | 3.7% |
| Argentinean | 44 | 0.1% |
| Armenian | 128 | 0.2% |
| Assyrian / Chaldean / Syriac | 3,674 | 5.5% |
| Austrian | 72 | 0.1% |
| Barbadian | 6 | 0.0% |
| Belgian | 60 | 0.1% |
| Belizean | 559 | 0.8% |
| Bhutanese | 607 | 0.9% |
| Blackfeet | 9 | 0.0% |
| Bolivian | 27 | 0.0% |
| Brazilian | 10 | 0.0% |
| British | 83 | 0.1% |
| British West Indian | 10 | 0.0% |
| Bulgarian | 296 | 0.4% |
| Burmese | 1,282 | 1.9% |
| Cambodian | 213 | 0.3% |
| Canadian | 67 | 0.1% |
| Central American | 491 | 0.7% |
| Central American Indian | 142 | 0.2% |
| Cherokee | 39 | 0.1% |
| Chilean | 138 | 0.2% |
| Colombian | 121 | 0.2% |
| Costa Rican | 35 | 0.1% |
| Creek | 53 | 0.1% |
| Croatian | 208 | 0.3% |
| Cuban | 464 | 0.7% |
| Czech | 235 | 0.4% |
| Czechoslovakian | 45 | 0.1% |
| Danish | 176 | 0.3% |
| Dominican | 52 | 0.1% |
| Dutch | 244 | 0.4% |
| Eastern European | 1,034 | 1.5% |
| Ecuadorian | 87 | 0.1% |
| Egyptian | 21 | 0.0% |
| English | 1,597 | 2.4% |
| Ethiopian | 157 | 0.2% |
| European | 624 | 0.9% |
| Filipino | 83 | 0.1% |
| Finnish | 69 | 0.1% |
| French | 438 | 0.6% |
| French Canadian | 140 | 0.2% |
| German | 4,419 | 6.6% |
| Ghanaian | 17 | 0.0% |
| Greek | 759 | 1.1% |
| Guamanian / Chamorro | 15 | 0.0% |
| Guatemalan | 270 | 0.4% |
| Guyanese | 37 | 0.1% |
| Haitian | 252 | 0.4% |
| Honduran | 31 | 0.1% |
| Hungarian | 343 | 0.5% |
| Indian (Asian) | 1,868 | 2.8% |
| Iranian | 130 | 0.2% |
| Iraqi | 1,096 | 1.6% |
| Irish | 3,291 | 4.9% |
| Iroquois | 32 | 0.1% |
| Israeli | 217 | 0.3% |
| Italian | 2,072 | 3.1% |
| Jamaican | 808 | 1.2% |
| Japanese | 157 | 0.2% |
| Jordanian | 16 | 0.0% |
| Korean | 5,592 | 8.3% |
| Laotian | 73 | 0.1% |
| Latvian | 66 | 0.1% |
| Lebanese | 135 | 0.2% |
| Lithuanian | 518 | 0.8% |
| Luxembourger | 144 | 0.2% |
| Macedonian | 31 | 0.1% |
| Malaysian | 31 | 0.1% |
| Mexican | 3,850 | 5.7% |
| Mexican American Indian | 208 | 0.3% |
| Mongolian | 8 | 0.0% |
| Moroccan | 81 | 0.1% |
| Native Hawaiian | 38 | 0.1% |
| Nigerian | 867 | 1.3% |
| Northern European | 38 | 0.1% |
| Norwegian | 268 | 0.4% |
| Pakistani | 571 | 0.9% |
| Palestinian | 129 | 0.2% |
| Peruvian | 257 | 0.4% |
| Polish | 2,627 | 3.9% |
| Portuguese | 49 | 0.1% |
| Puerto Rican | 1,541 | 2.3% |
| Romanian | 815 | 1.2% |
| Russian | 2,040 | 3.0% |
| Salvadoran | 155 | 0.2% |
| Scandinavian | 53 | 0.1% |
| Scotch-Irish | 117 | 0.2% |
| Scottish | 467 | 0.7% |
| Serbian | 247 | 0.4% |
| Sioux | 5 | 0.0% |
| Slavic | 8 | 0.0% |
| Slovak | 37 | 0.1% |
| Slovene | 13 | 0.0% |
| Somali | 290 | 0.4% |
| South American | 697 | 1.0% |
| South American Indian | 34 | 0.1% |
| Spaniard | 128 | 0.2% |
| Spanish | 22 | 0.0% |
| Sri Lankan | 1,047 | 1.6% |
| Subsaharan African | 1,664 | 2.5% |
| Sudanese | 13 | 0.0% |
| Swedish | 1,044 | 1.6% |
| Swiss | 51 | 0.1% |
| Syrian | 231 | 0.3% |
| Thai | 5,316 | 7.9% |
| Turkish | 65 | 0.1% |
| Ukrainian | 406 | 0.6% |
| Venezuelan | 23 | 0.0% |
| Vietnamese | 269 | 0.4% |
| Welsh | 258 | 0.4% |
| West Indian | 37 | 0.1% |
| Yugoslavian | 451 | 0.7% | View All 117 Rows |
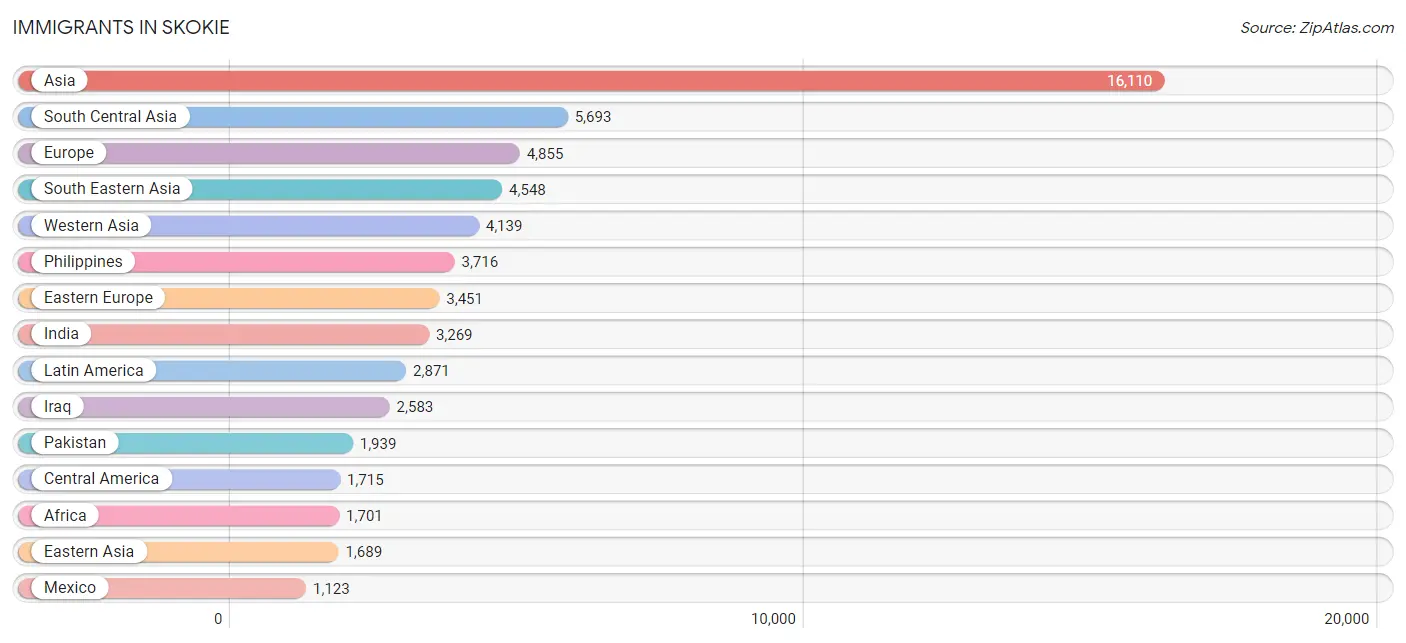
Immigrants in Skokie
The most numerous immigrant groups reported in Skokie came from Asia (16,110 | 24.0%), South Central Asia (5,693 | 8.5%), Europe (4,855 | 7.2%), South Eastern Asia (4,548 | 6.8%), and Western Asia (4,139 | 6.2%), together accounting for 52.7% of all Skokie residents.
| Immigration Origin | # Population | % Population |
| Afghanistan | 57 | 0.1% |
| Africa | 1,701 | 2.5% |
| Albania | 25 | 0.0% |
| Asia | 16,110 | 24.0% |
| Australia | 9 | 0.0% |
| Austria | 18 | 0.0% |
| Bangladesh | 275 | 0.4% |
| Belarus | 388 | 0.6% |
| Belgium | 7 | 0.0% |
| Belize | 287 | 0.4% |
| Bolivia | 27 | 0.0% |
| Bosnia and Herzegovina | 493 | 0.7% |
| Brazil | 42 | 0.1% |
| Bulgaria | 268 | 0.4% |
| Cambodia | 97 | 0.1% |
| Cameroon | 101 | 0.2% |
| Canada | 155 | 0.2% |
| Caribbean | 812 | 1.2% |
| Central America | 1,715 | 2.6% |
| Chile | 8 | 0.0% |
| China | 714 | 1.1% |
| Colombia | 44 | 0.1% |
| Congo | 21 | 0.0% |
| Costa Rica | 63 | 0.1% |
| Croatia | 96 | 0.1% |
| Cuba | 202 | 0.3% |
| Czechoslovakia | 26 | 0.0% |
| Denmark | 29 | 0.0% |
| Eastern Africa | 680 | 1.0% |
| Eastern Asia | 1,689 | 2.5% |
| Eastern Europe | 3,451 | 5.1% |
| Egypt | 13 | 0.0% |
| El Salvador | 94 | 0.1% |
| England | 214 | 0.3% |
| Eritrea | 28 | 0.0% |
| Ethiopia | 120 | 0.2% |
| Europe | 4,855 | 7.2% |
| France | 51 | 0.1% |
| Germany | 253 | 0.4% |
| Ghana | 39 | 0.1% |
| Greece | 233 | 0.4% |
| Guatemala | 108 | 0.2% |
| Guyana | 37 | 0.1% |
| Haiti | 172 | 0.3% |
| Honduras | 24 | 0.0% |
| Hong Kong | 102 | 0.2% |
| India | 3,269 | 4.9% |
| Indonesia | 41 | 0.1% |
| Iran | 149 | 0.2% |
| Iraq | 2,583 | 3.8% |
| Ireland | 65 | 0.1% |
| Israel | 294 | 0.4% |
| Italy | 113 | 0.2% |
| Jamaica | 425 | 0.6% |
| Japan | 121 | 0.2% |
| Jordan | 34 | 0.1% |
| Kazakhstan | 4 | 0.0% |
| Kenya | 35 | 0.1% |
| Korea | 724 | 1.1% |
| Laos | 11 | 0.0% |
| Latin America | 2,871 | 4.3% |
| Latvia | 25 | 0.0% |
| Lebanon | 249 | 0.4% |
| Lithuania | 68 | 0.1% |
| Malaysia | 25 | 0.0% |
| Mexico | 1,123 | 1.7% |
| Middle Africa | 288 | 0.4% |
| Moldova | 48 | 0.1% |
| Morocco | 45 | 0.1% |
| Nigeria | 510 | 0.8% |
| Northern Africa | 58 | 0.1% |
| Northern Europe | 474 | 0.7% |
| Oceania | 9 | 0.0% |
| Pakistan | 1,939 | 2.9% |
| Panama | 16 | 0.0% |
| Peru | 163 | 0.2% |
| Philippines | 3,716 | 5.5% |
| Poland | 350 | 0.5% |
| Romania | 592 | 0.9% |
| Russia | 176 | 0.3% |
| Saudi Arabia | 21 | 0.0% |
| Scotland | 29 | 0.0% |
| Serbia | 164 | 0.2% |
| Somalia | 162 | 0.2% |
| South America | 344 | 0.5% |
| South Central Asia | 5,693 | 8.5% |
| South Eastern Asia | 4,548 | 6.8% |
| Southern Europe | 346 | 0.5% |
| Sweden | 47 | 0.1% |
| Syria | 914 | 1.4% |
| Taiwan | 106 | 0.2% |
| Thailand | 79 | 0.1% |
| Turkey | 37 | 0.1% |
| Uganda | 10 | 0.0% |
| Ukraine | 278 | 0.4% |
| Venezuela | 23 | 0.0% |
| Vietnam | 566 | 0.8% |
| Western Africa | 568 | 0.9% |
| Western Asia | 4,139 | 6.2% |
| Western Europe | 329 | 0.5% |
| Zaire | 166 | 0.3% |
| Zimbabwe | 26 | 0.0% | View All 102 Rows |
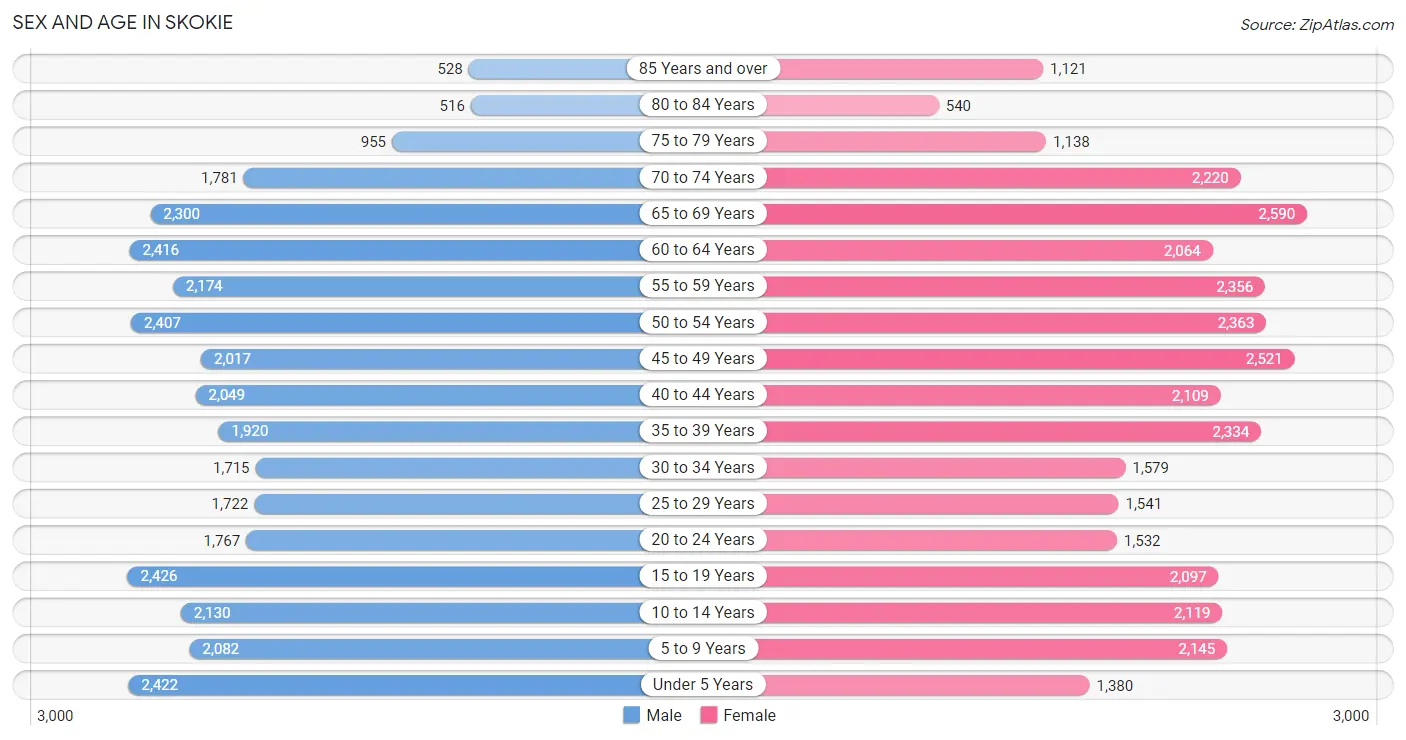
Sex and Age in Skokie
Sex and Age in Skokie
The most populous age groups in Skokie are 15 to 19 Years (2,426 | 7.3%) for men and 65 to 69 Years (2,590 | 7.7%) for women.
| Age Bracket | Male | Female |
| Under 5 Years | 2,422 (7.3%) | 1,380 (4.1%) |
| 5 to 9 Years | 2,082 (6.2%) | 2,145 (6.4%) |
| 10 to 14 Years | 2,130 (6.4%) | 2,119 (6.3%) |
| 15 to 19 Years | 2,426 (7.3%) | 2,097 (6.2%) |
| 20 to 24 Years | 1,767 (5.3%) | 1,532 (4.5%) |
| 25 to 29 Years | 1,722 (5.2%) | 1,541 (4.6%) |
| 30 to 34 Years | 1,715 (5.1%) | 1,579 (4.7%) |
| 35 to 39 Years | 1,920 (5.8%) | 2,334 (6.9%) |
| 40 to 44 Years | 2,049 (6.1%) | 2,109 (6.2%) |
| 45 to 49 Years | 2,017 (6.0%) | 2,521 (7.5%) |
| 50 to 54 Years | 2,407 (7.2%) | 2,363 (7.0%) |
| 55 to 59 Years | 2,174 (6.5%) | 2,356 (7.0%) |
| 60 to 64 Years | 2,416 (7.2%) | 2,064 (6.1%) |
| 65 to 69 Years | 2,300 (6.9%) | 2,590 (7.7%) |
| 70 to 74 Years | 1,781 (5.3%) | 2,220 (6.6%) |
| 75 to 79 Years | 955 (2.9%) | 1,138 (3.4%) |
| 80 to 84 Years | 516 (1.5%) | 540 (1.6%) |
| 85 Years and over | 528 (1.6%) | 1,121 (3.3%) |
| Total | 33,327 (100.0%) | 33,749 (100.0%) |
Families and Households in Skokie
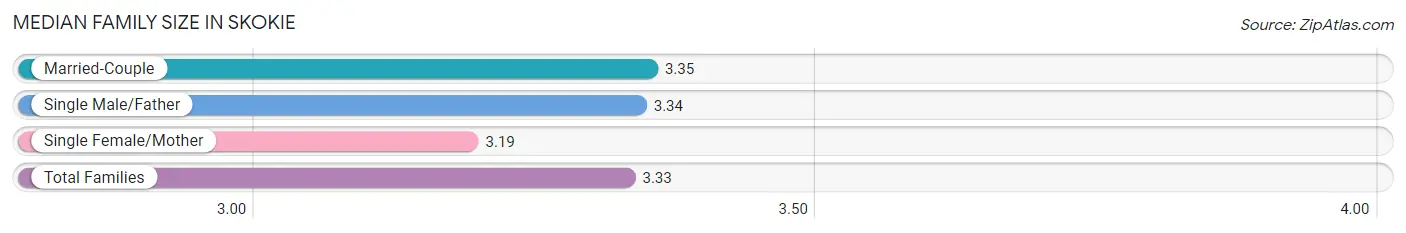
Median Family Size in Skokie
The median family size in Skokie is 3.33 persons per family, with married-couple families (13,413 | 76.6%) accounting for the largest median family size of 3.35 persons per family. On the other hand, single female/mother families (2,584 | 14.8%) represent the smallest median family size with 3.19 persons per family.
| Family Type | # Families | Family Size |
| Married-Couple | 13,413 (76.6%) | 3.35 |
| Single Male/Father | 1,505 (8.6%) | 3.34 |
| Single Female/Mother | 2,584 (14.8%) | 3.19 |
| Total Families | 17,502 (100.0%) | 3.33 |
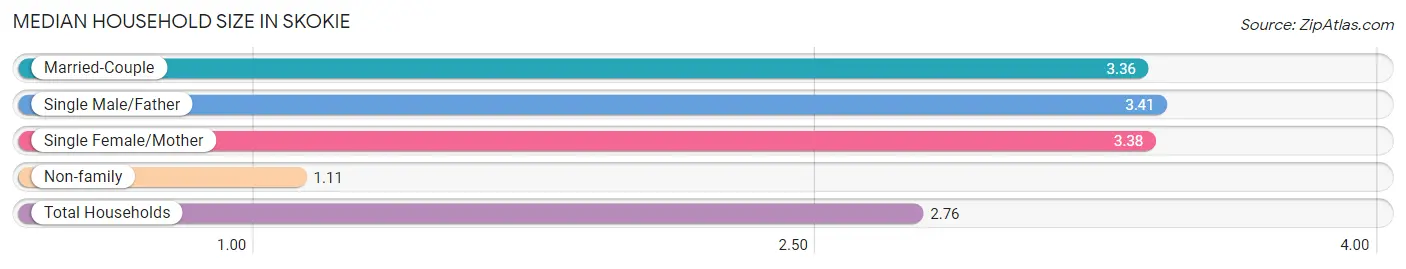
Median Household Size in Skokie
The median household size in Skokie is 2.76 persons per household, with single male/father households (1,505 | 6.3%) accounting for the largest median household size of 3.41 persons per household. non-family households (6,547 | 27.2%) represent the smallest median household size with 1.11 persons per household.
| Household Type | # Households | Household Size |
| Married-Couple | 13,413 (55.8%) | 3.36 |
| Single Male/Father | 1,505 (6.3%) | 3.41 |
| Single Female/Mother | 2,584 (10.7%) | 3.38 |
| Non-family | 6,547 (27.2%) | 1.11 |
| Total Households | 24,049 (100.0%) | 2.76 |
Household Size by Marriage Status in Skokie
Out of a total of 24,049 households in Skokie, 17,502 (72.8%) are family households, while 6,547 (27.2%) are nonfamily households. The most numerous type of family households are 2-person households, comprising 6,520, and the most common type of nonfamily households are 1-person households, comprising 5,885.
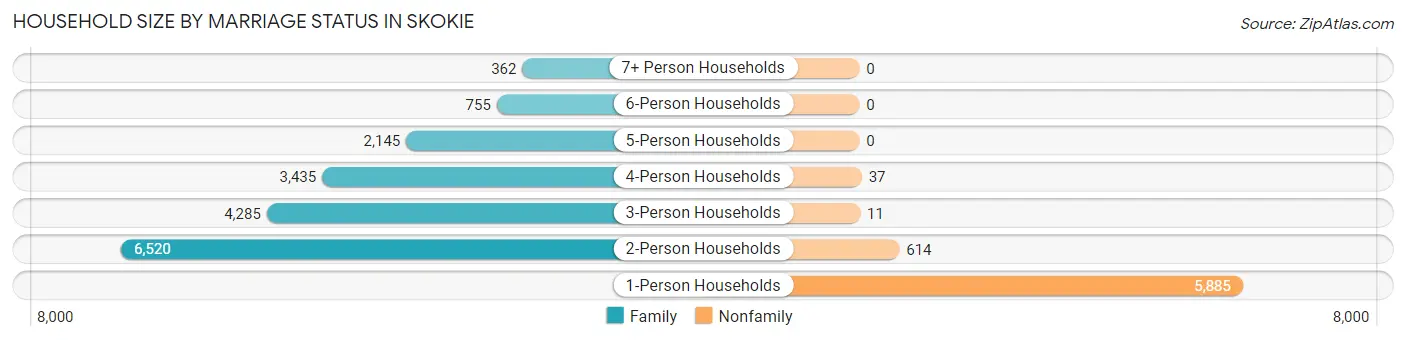
| Household Size | Family Households | Nonfamily Households |
| 1-Person Households | - | 5,885 (24.5%) |
| 2-Person Households | 6,520 (27.1%) | 614 (2.5%) |
| 3-Person Households | 4,285 (17.8%) | 11 (0.1%) |
| 4-Person Households | 3,435 (14.3%) | 37 (0.2%) |
| 5-Person Households | 2,145 (8.9%) | 0 (0.0%) |
| 6-Person Households | 755 (3.1%) | 0 (0.0%) |
| 7+ Person Households | 362 (1.5%) | 0 (0.0%) |
| Total | 17,502 (72.8%) | 6,547 (27.2%) |
Female Fertility in Skokie
Fertility by Age in Skokie
Average fertility rate in Skokie is 49.0 births per 1,000 women. Women in the age bracket of 20 to 34 years have the highest fertility rate with 58.0 births per 1,000 women. Women in the age bracket of 35 to 50 years acount for 60.8% of all women with births.
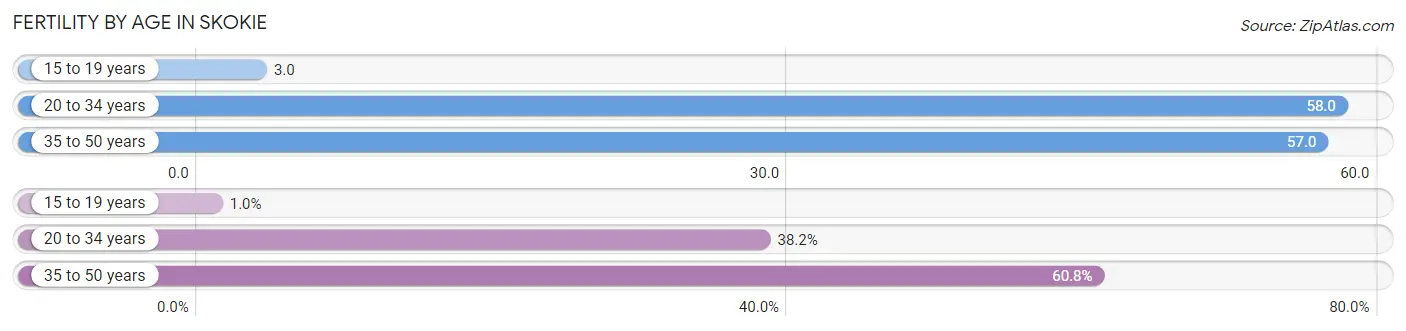
| Age Bracket | Women with Births | Births / 1,000 Women |
| 15 to 19 years | 7 (1.0%) | 3.0 |
| 20 to 34 years | 268 (38.2%) | 58.0 |
| 35 to 50 years | 427 (60.8%) | 57.0 |
| Total | 702 (100.0%) | 49.0 |
Fertility by Age by Marriage Status in Skokie
94.7% of women with births (702) in Skokie are married. The highest percentage of unmarried women with births falls into 15 to 19 years age bracket with 100.0% of them unmarried at the time of birth, while the lowest percentage of unmarried women with births belong to 20 to 34 years age bracket with 2.6% of them unmarried.
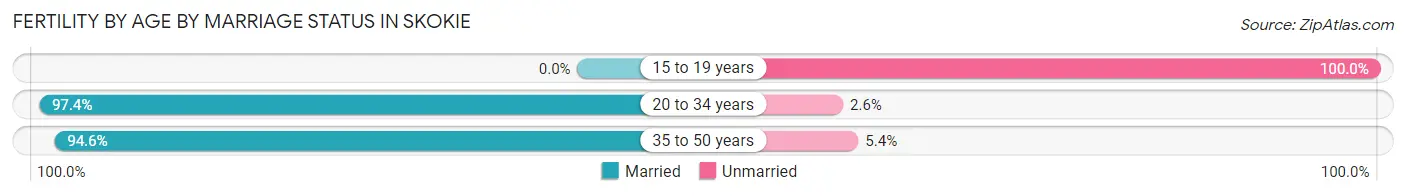
| Age Bracket | Married | Unmarried |
| 15 to 19 years | 0 (0.0%) | 7 (100.0%) |
| 20 to 34 years | 261 (97.4%) | 7 (2.6%) |
| 35 to 50 years | 404 (94.6%) | 23 (5.4%) |
| Total | 665 (94.7%) | 37 (5.3%) |
Fertility by Education in Skokie
Average fertility rate in Skokie is 49.0 births per 1,000 women. Women with the education attainment of graduate degree have the highest fertility rate of 88.0 births per 1,000 women, while women with the education attainment of less than high school have the lowest fertility at 3.0 births per 1,000 women. Women with the education attainment of graduate degree represent 34.1% of all women with births.
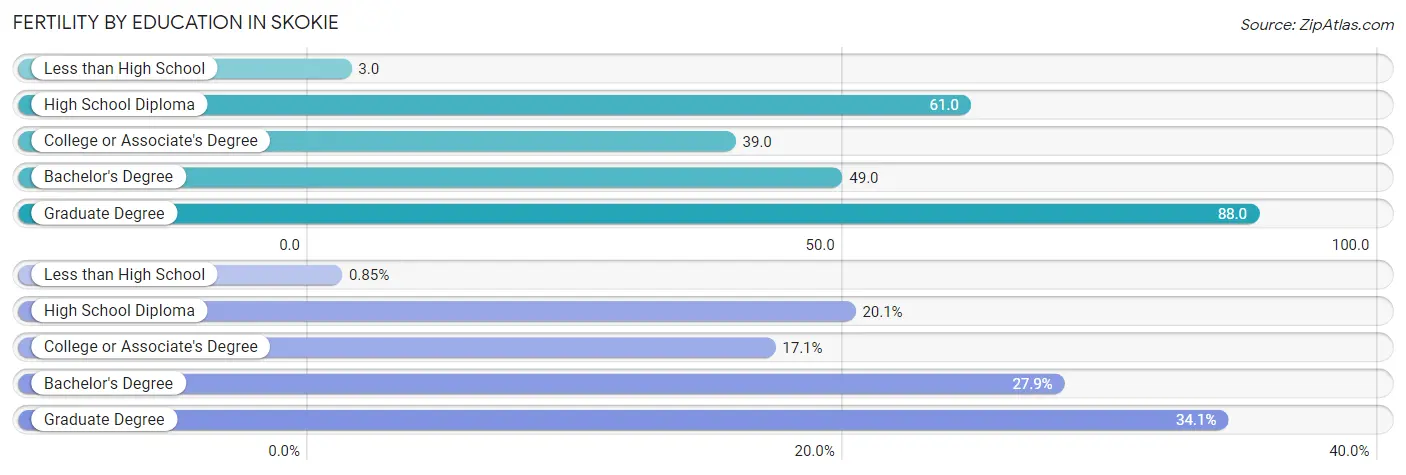
| Educational Attainment | Women with Births | Births / 1,000 Women |
| Less than High School | 6 (0.9%) | 3.0 |
| High School Diploma | 141 (20.1%) | 61.0 |
| College or Associate's Degree | 120 (17.1%) | 39.0 |
| Bachelor's Degree | 196 (27.9%) | 49.0 |
| Graduate Degree | 239 (34.1%) | 88.0 |
| Total | 702 (100.0%) | 49.0 |
Fertility by Education by Marriage Status in Skokie
5.3% of women with births in Skokie are unmarried. Women with the educational attainment of less than high school are most likely to be married with 100.0% of them married at childbirth, while women with the educational attainment of college or associate's degree are least likely to be married with 11.7% of them unmarried at childbirth.
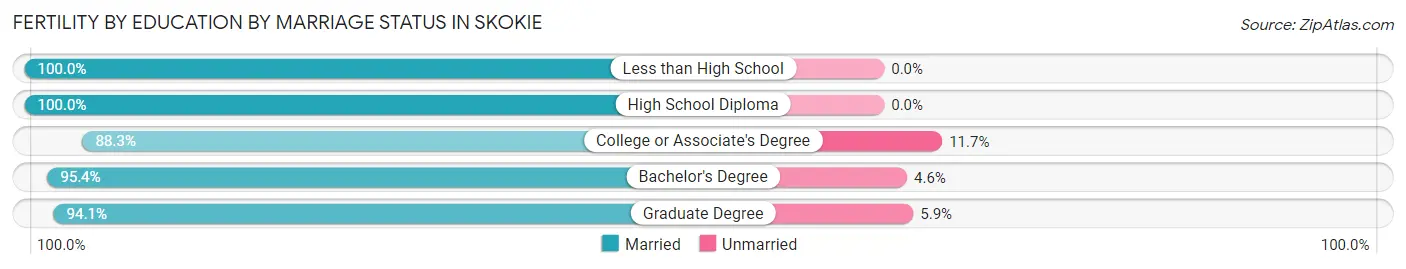
| Educational Attainment | Married | Unmarried |
| Less than High School | 6 (100.0%) | 0 (0.0%) |
| High School Diploma | 141 (100.0%) | 0 (0.0%) |
| College or Associate's Degree | 106 (88.3%) | 14 (11.7%) |
| Bachelor's Degree | 187 (95.4%) | 9 (4.6%) |
| Graduate Degree | 225 (94.1%) | 14 (5.9%) |
| Total | 665 (94.7%) | 37 (5.3%) |
Employment Characteristics in Skokie
Employment by Class of Employer in Skokie
Among the 30,911 employed individuals in Skokie, private company employees (19,946 | 64.5%), not-for-profit organizations (4,482 | 14.5%), and self-employed (incorporated) (1,857 | 6.0%) make up the most common classes of employment.
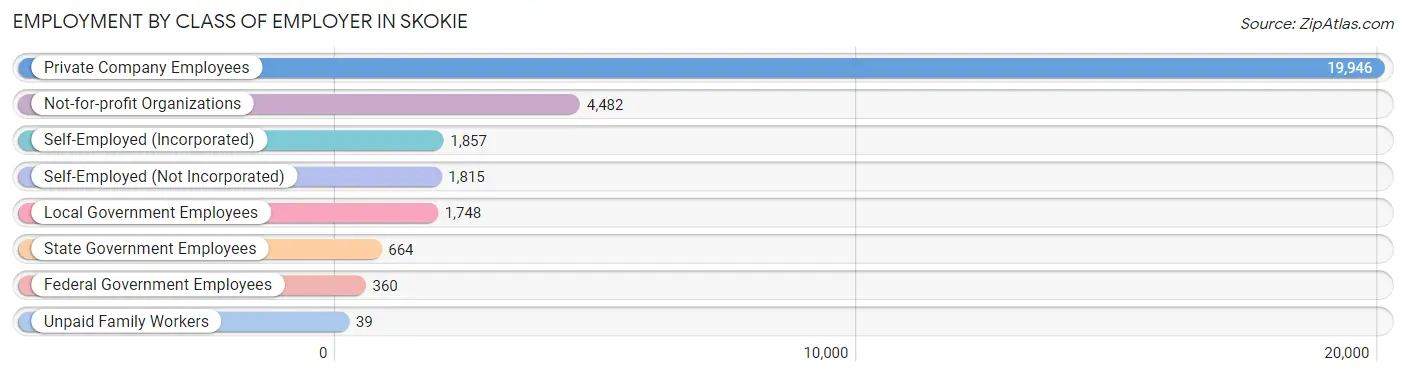
| Employer Class | # Employees | % Employees |
| Private Company Employees | 19,946 | 64.5% |
| Self-Employed (Incorporated) | 1,857 | 6.0% |
| Self-Employed (Not Incorporated) | 1,815 | 5.9% |
| Not-for-profit Organizations | 4,482 | 14.5% |
| Local Government Employees | 1,748 | 5.7% |
| State Government Employees | 664 | 2.1% |
| Federal Government Employees | 360 | 1.2% |
| Unpaid Family Workers | 39 | 0.1% |
| Total | 30,911 | 100.0% |
Employment Status by Age in Skokie
According to the labor force statistics for Skokie, out of the total population over 16 years of age (53,796), 62.3% or 33,515 individuals are in the labor force, with 5.4% or 1,810 of them unemployed. The age group with the highest labor force participation rate is 45 to 54 years, with 86.1% or 8,014 individuals in the labor force. Within the labor force, the 16 to 19 years age range has the highest percentage of unemployed individuals, with 19.9% or 194 of them being unemployed.
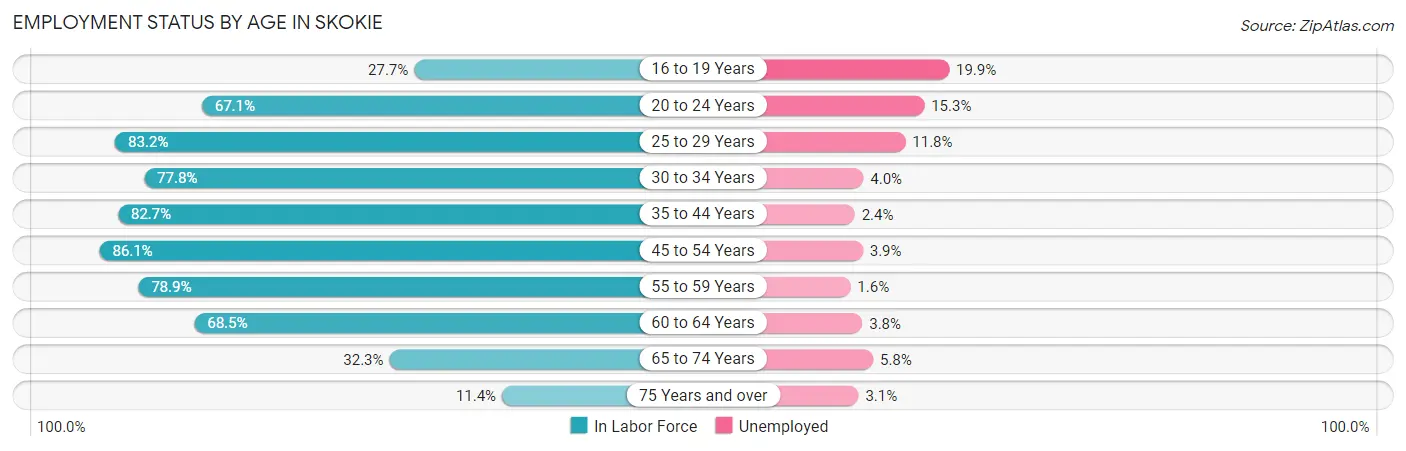
| Age Bracket | In Labor Force | Unemployed |
| 16 to 19 Years | 975 (27.7%) | 194 (19.9%) |
| 20 to 24 Years | 2,214 (67.1%) | 339 (15.3%) |
| 25 to 29 Years | 2,715 (83.2%) | 320 (11.8%) |
| 30 to 34 Years | 2,563 (77.8%) | 103 (4.0%) |
| 35 to 44 Years | 6,957 (82.7%) | 167 (2.4%) |
| 45 to 54 Years | 8,014 (86.1%) | 313 (3.9%) |
| 55 to 59 Years | 3,574 (78.9%) | 57 (1.6%) |
| 60 to 64 Years | 3,069 (68.5%) | 117 (3.8%) |
| 65 to 74 Years | 2,872 (32.3%) | 167 (5.8%) |
| 75 Years and over | 547 (11.4%) | 17 (3.1%) |
| Total | 33,515 (62.3%) | 1,810 (5.4%) |
Employment Status by Educational Attainment in Skokie
According to labor force statistics for Skokie, 80.8% of individuals (26,896) out of the total population between 25 and 64 years of age (33,287) are in the labor force, with 4.0% or 1,076 of them being unemployed. The group with the highest labor force participation rate are those with the educational attainment of bachelor's degree or higher, with 86.5% or 14,796 individuals in the labor force. Within the labor force, individuals with high school diploma education have the highest percentage of unemployment, with 7.3% or 339 of them being unemployed.
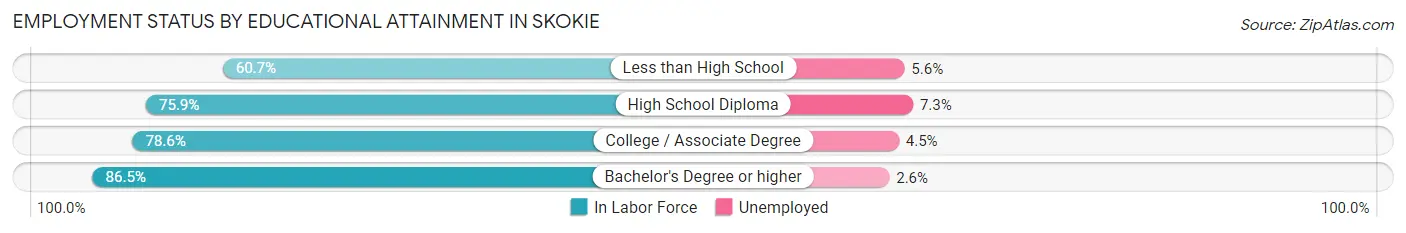
| Educational Attainment | In Labor Force | Unemployed |
| Less than High School | 1,565 (60.7%) | 144 (5.6%) |
| High School Diploma | 4,640 (75.9%) | 446 (7.3%) |
| College / Associate Degree | 5,887 (78.6%) | 337 (4.5%) |
| Bachelor's Degree or higher | 14,796 (86.5%) | 445 (2.6%) |
| Total | 26,896 (80.8%) | 1,331 (4.0%) |
Employment Occupations by Sex in Skokie
Management, Business, Science and Arts Occupations
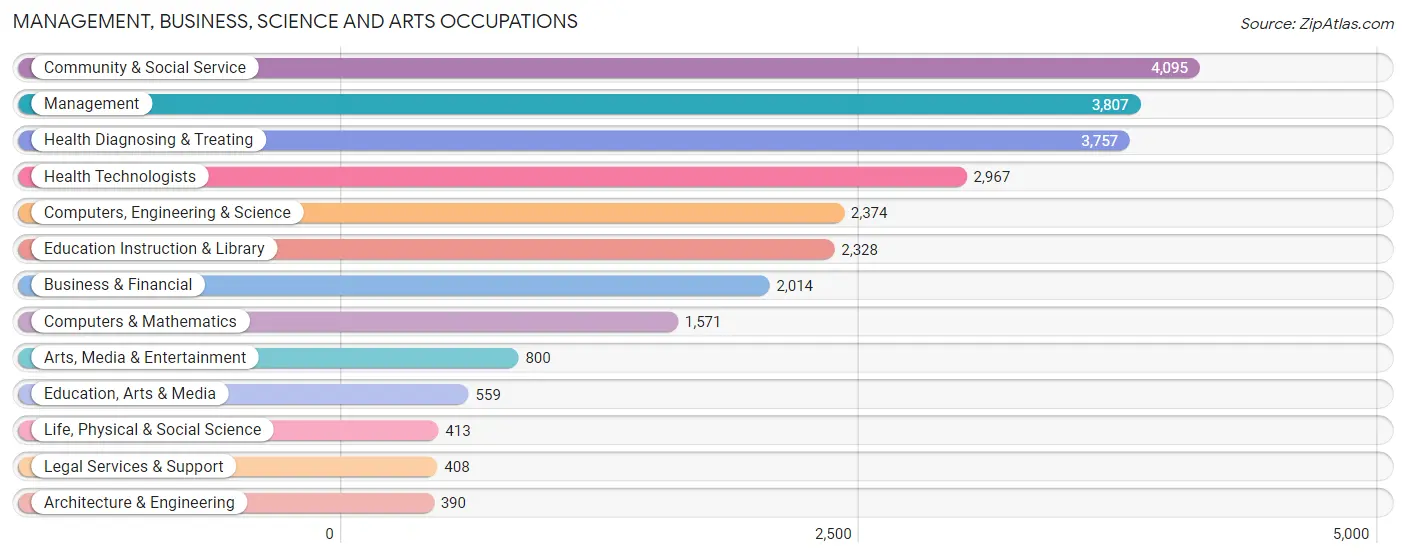
The most common Management, Business, Science and Arts occupations in Skokie are Community & Social Service (4,095 | 12.9%), Management (3,807 | 12.0%), Health Diagnosing & Treating (3,757 | 11.9%), Health Technologists (2,967 | 9.4%), and Computers, Engineering & Science (2,374 | 7.5%).
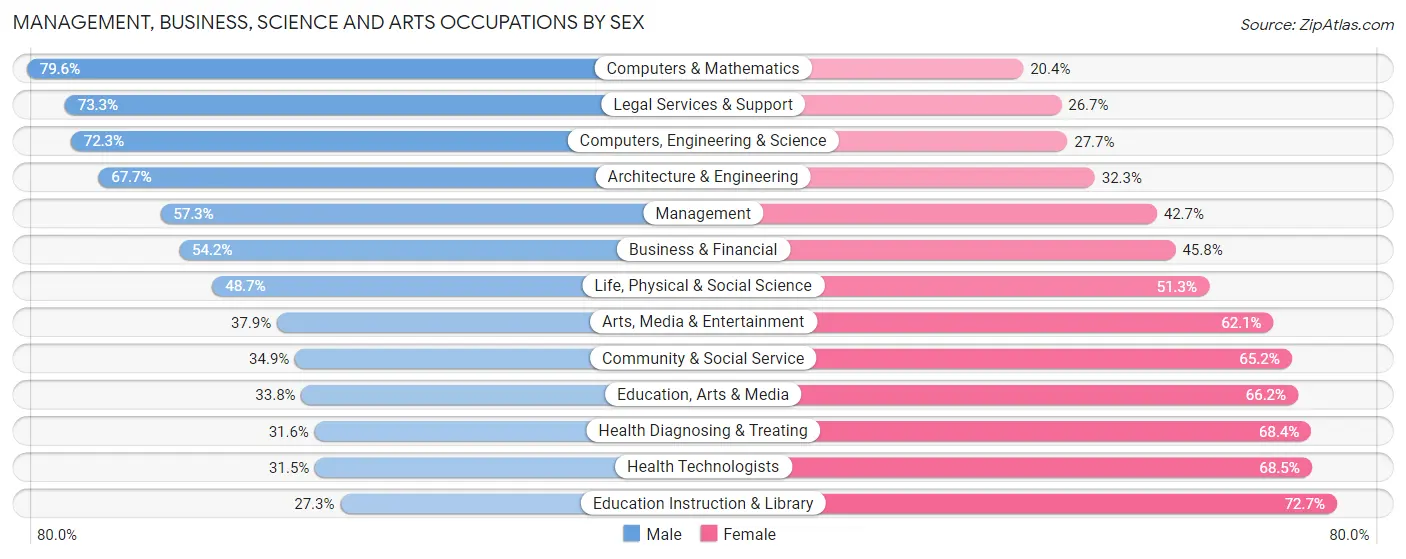
Management, Business, Science and Arts Occupations by Sex
Within the Management, Business, Science and Arts occupations in Skokie, the most male-oriented occupations are Computers & Mathematics (79.6%), Legal Services & Support (73.3%), and Computers, Engineering & Science (72.3%), while the most female-oriented occupations are Education Instruction & Library (72.7%), Health Technologists (68.5%), and Health Diagnosing & Treating (68.4%).
| Occupation | Male | Female |
| Management | 2,183 (57.3%) | 1,624 (42.7%) |
| Business & Financial | 1,092 (54.2%) | 922 (45.8%) |
| Computers, Engineering & Science | 1,716 (72.3%) | 658 (27.7%) |
| Computers & Mathematics | 1,251 (79.6%) | 320 (20.4%) |
| Architecture & Engineering | 264 (67.7%) | 126 (32.3%) |
| Life, Physical & Social Science | 201 (48.7%) | 212 (51.3%) |
| Community & Social Service | 1,427 (34.8%) | 2,668 (65.1%) |
| Education, Arts & Media | 189 (33.8%) | 370 (66.2%) |
| Legal Services & Support | 299 (73.3%) | 109 (26.7%) |
| Education Instruction & Library | 636 (27.3%) | 1,692 (72.7%) |
| Arts, Media & Entertainment | 303 (37.9%) | 497 (62.1%) |
| Health Diagnosing & Treating | 1,187 (31.6%) | 2,570 (68.4%) |
| Health Technologists | 935 (31.5%) | 2,032 (68.5%) |
| Total (Category) | 7,605 (47.4%) | 8,442 (52.6%) |
| Total (Overall) | 16,471 (52.0%) | 15,209 (48.0%) |
Services Occupations
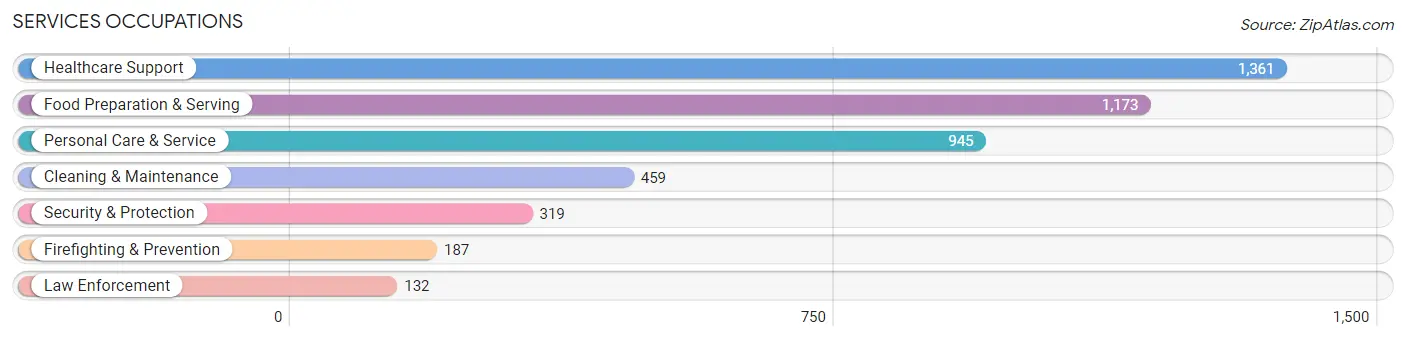
The most common Services occupations in Skokie are Healthcare Support (1,361 | 4.3%), Food Preparation & Serving (1,173 | 3.7%), Personal Care & Service (945 | 3.0%), Cleaning & Maintenance (459 | 1.5%), and Security & Protection (319 | 1.0%).
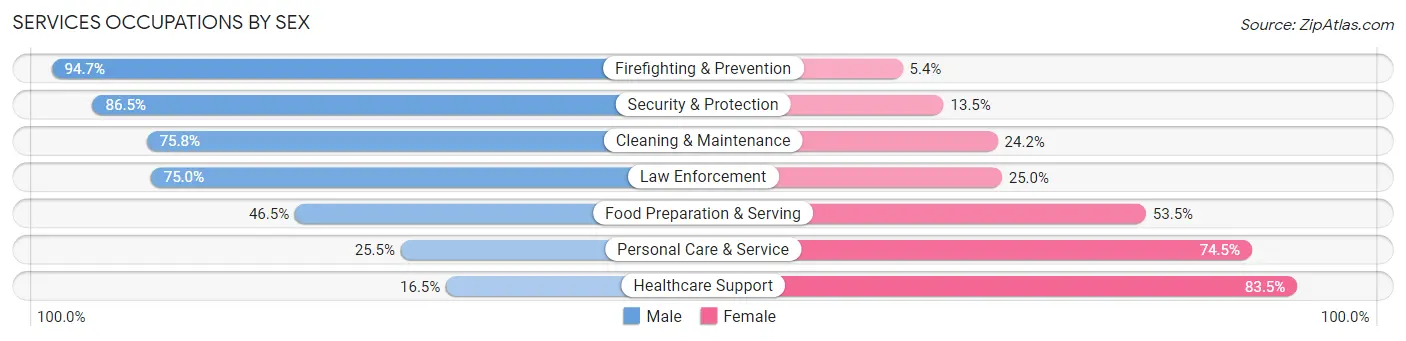
Services Occupations by Sex
Within the Services occupations in Skokie, the most male-oriented occupations are Firefighting & Prevention (94.7%), Security & Protection (86.5%), and Cleaning & Maintenance (75.8%), while the most female-oriented occupations are Healthcare Support (83.5%), Personal Care & Service (74.5%), and Food Preparation & Serving (53.5%).
| Occupation | Male | Female |
| Healthcare Support | 225 (16.5%) | 1,136 (83.5%) |
| Security & Protection | 276 (86.5%) | 43 (13.5%) |
| Firefighting & Prevention | 177 (94.7%) | 10 (5.3%) |
| Law Enforcement | 99 (75.0%) | 33 (25.0%) |
| Food Preparation & Serving | 545 (46.5%) | 628 (53.5%) |
| Cleaning & Maintenance | 348 (75.8%) | 111 (24.2%) |
| Personal Care & Service | 241 (25.5%) | 704 (74.5%) |
| Total (Category) | 1,635 (38.4%) | 2,622 (61.6%) |
| Total (Overall) | 16,471 (52.0%) | 15,209 (48.0%) |
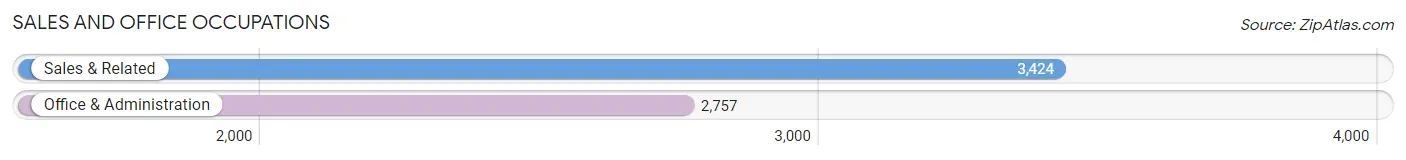
Sales and Office Occupations
The most common Sales and Office occupations in Skokie are Sales & Related (3,424 | 10.8%), and Office & Administration (2,757 | 8.7%).
Sales and Office Occupations by Sex
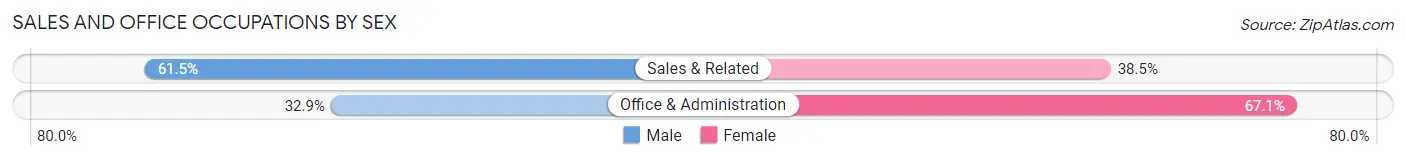
| Occupation | Male | Female |
| Sales & Related | 2,106 (61.5%) | 1,318 (38.5%) |
| Office & Administration | 907 (32.9%) | 1,850 (67.1%) |
| Total (Category) | 3,013 (48.7%) | 3,168 (51.2%) |
| Total (Overall) | 16,471 (52.0%) | 15,209 (48.0%) |
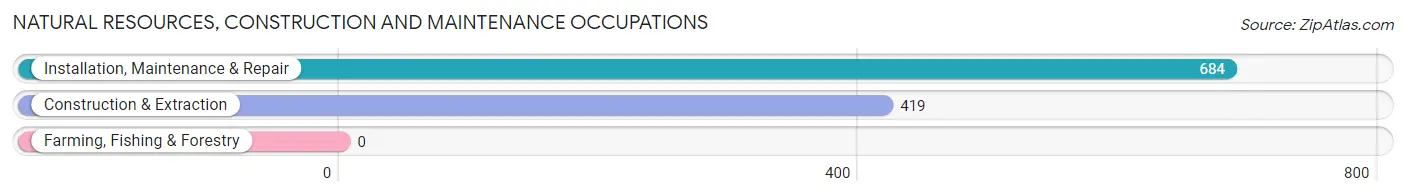
Natural Resources, Construction and Maintenance Occupations
The most common Natural Resources, Construction and Maintenance occupations in Skokie are Installation, Maintenance & Repair (684 | 2.2%), and Construction & Extraction (419 | 1.3%).
Natural Resources, Construction and Maintenance Occupations by Sex
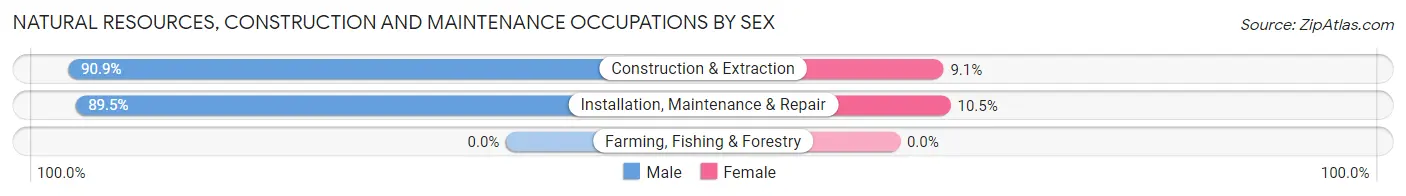
| Occupation | Male | Female |
| Farming, Fishing & Forestry | 0 (0.0%) | 0 (0.0%) |
| Construction & Extraction | 381 (90.9%) | 38 (9.1%) |
| Installation, Maintenance & Repair | 612 (89.5%) | 72 (10.5%) |
| Total (Category) | 993 (90.0%) | 110 (10.0%) |
| Total (Overall) | 16,471 (52.0%) | 15,209 (48.0%) |
Production, Transportation and Moving Occupations
The most common Production, Transportation and Moving occupations in Skokie are Transportation (1,609 | 5.1%), Production (1,560 | 4.9%), and Material Moving (923 | 2.9%).
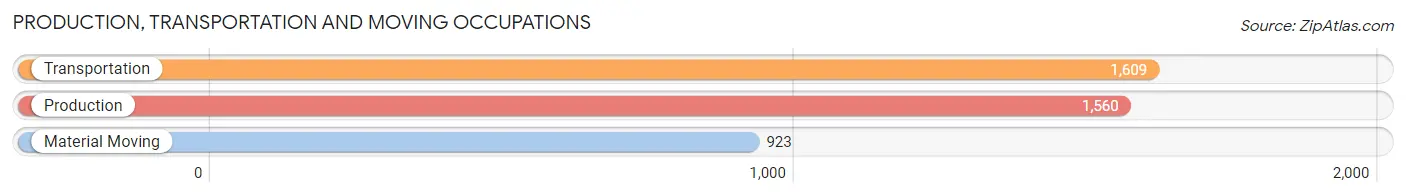
Production, Transportation and Moving Occupations by Sex
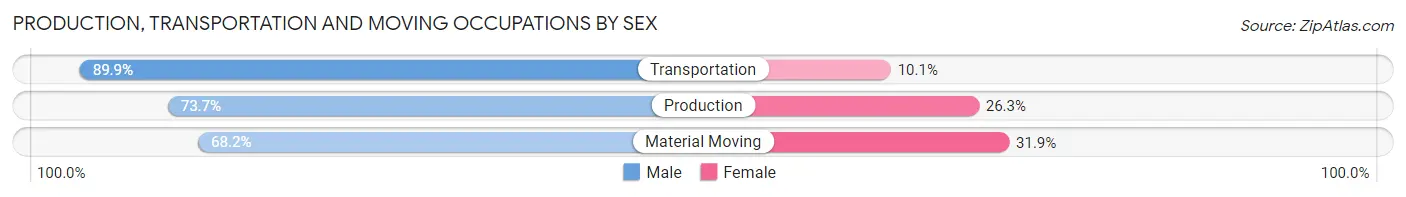
| Occupation | Male | Female |
| Production | 1,150 (73.7%) | 410 (26.3%) |
| Transportation | 1,446 (89.9%) | 163 (10.1%) |
| Material Moving | 629 (68.1%) | 294 (31.9%) |
| Total (Category) | 3,225 (78.8%) | 867 (21.2%) |
| Total (Overall) | 16,471 (52.0%) | 15,209 (48.0%) |
Employment Industries by Sex in Skokie
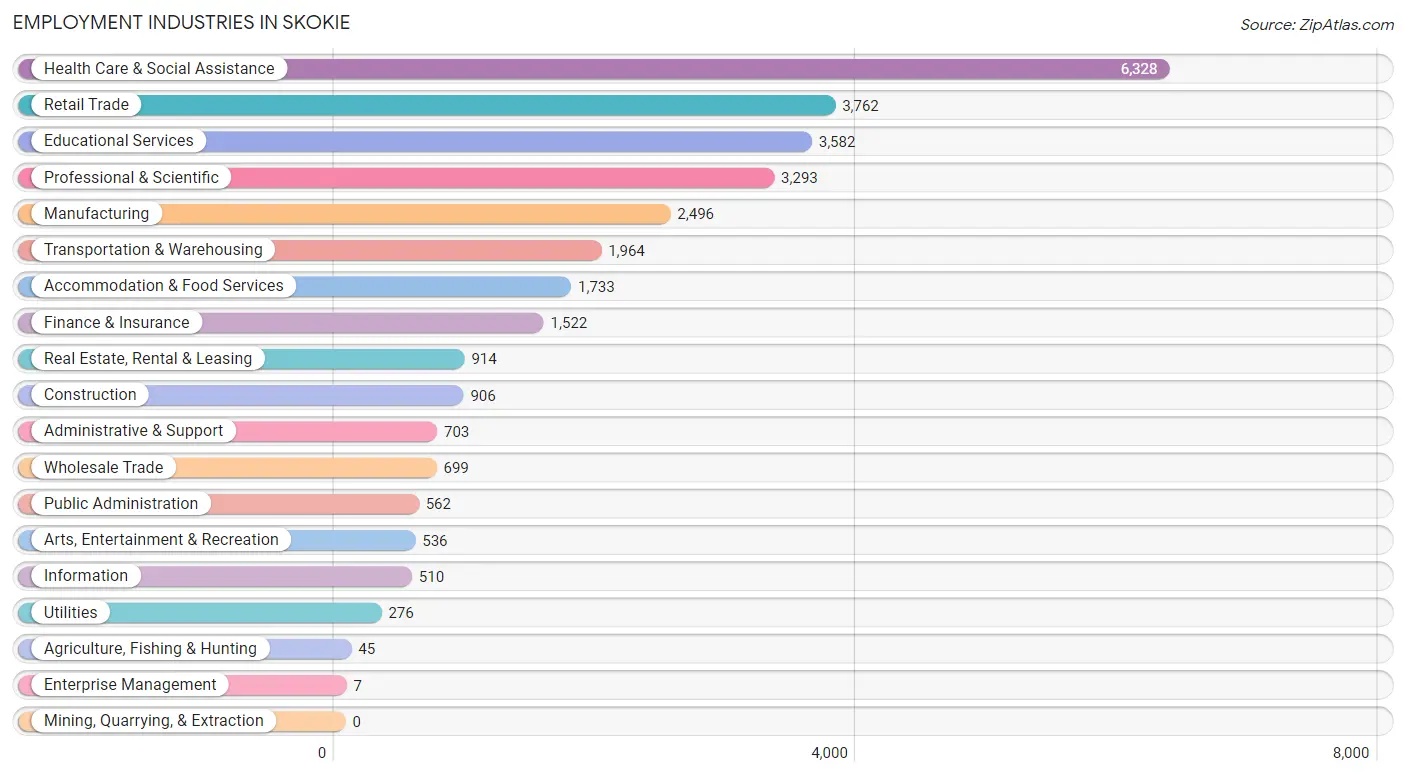
Employment Industries in Skokie
The major employment industries in Skokie include Health Care & Social Assistance (6,328 | 20.0%), Retail Trade (3,762 | 11.9%), Educational Services (3,582 | 11.3%), Professional & Scientific (3,293 | 10.4%), and Manufacturing (2,496 | 7.9%).
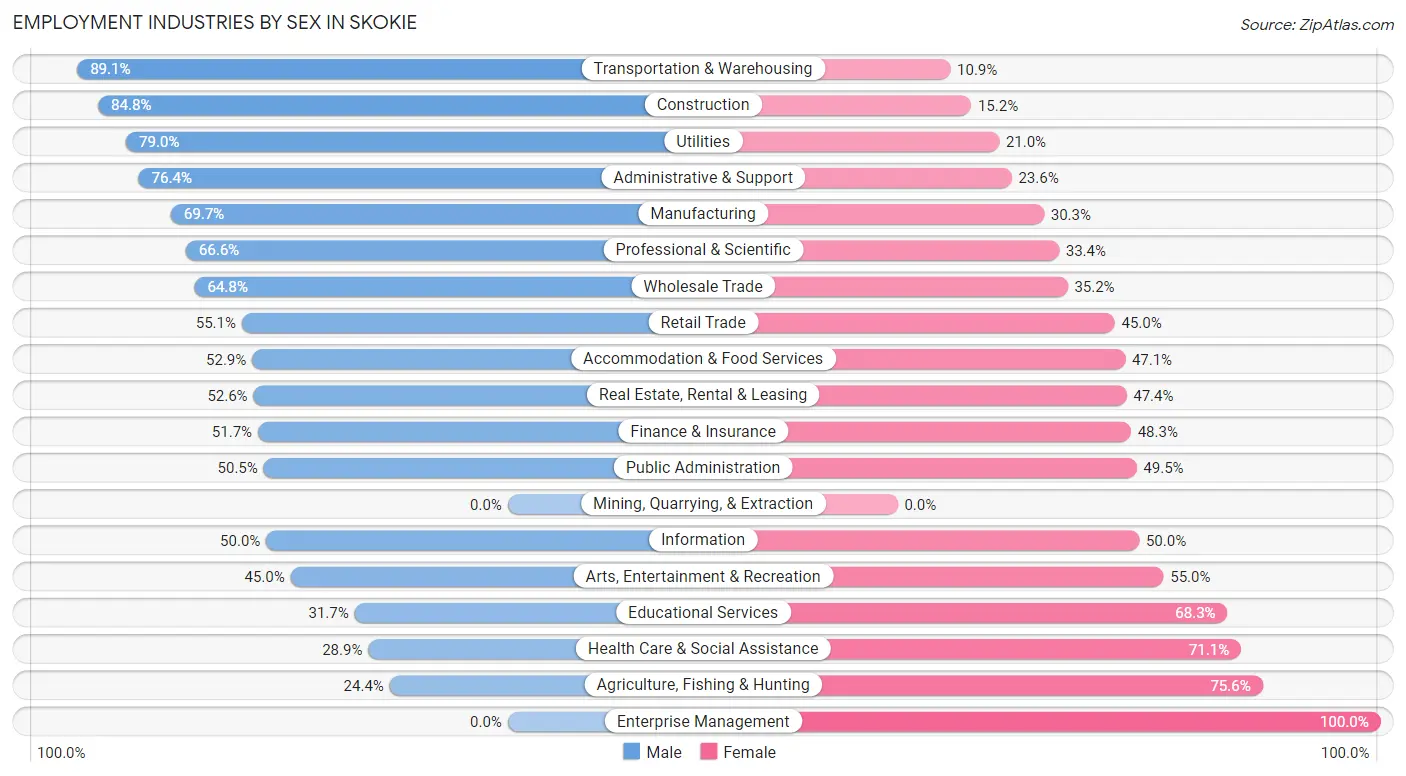
Employment Industries by Sex in Skokie
The Skokie industries that see more men than women are Transportation & Warehousing (89.1%), Construction (84.8%), and Utilities (79.0%), whereas the industries that tend to have a higher number of women are Enterprise Management (100.0%), Agriculture, Fishing & Hunting (75.6%), and Health Care & Social Assistance (71.1%).
| Industry | Male | Female |
| Agriculture, Fishing & Hunting | 11 (24.4%) | 34 (75.6%) |
| Mining, Quarrying, & Extraction | 0 (0.0%) | 0 (0.0%) |
| Construction | 768 (84.8%) | 138 (15.2%) |
| Manufacturing | 1,740 (69.7%) | 756 (30.3%) |
| Wholesale Trade | 453 (64.8%) | 246 (35.2%) |
| Retail Trade | 2,071 (55.0%) | 1,691 (45.0%) |
| Transportation & Warehousing | 1,750 (89.1%) | 214 (10.9%) |
| Utilities | 218 (79.0%) | 58 (21.0%) |
| Information | 255 (50.0%) | 255 (50.0%) |
| Finance & Insurance | 787 (51.7%) | 735 (48.3%) |
| Real Estate, Rental & Leasing | 481 (52.6%) | 433 (47.4%) |
| Professional & Scientific | 2,193 (66.6%) | 1,100 (33.4%) |
| Enterprise Management | 0 (0.0%) | 7 (100.0%) |
| Administrative & Support | 537 (76.4%) | 166 (23.6%) |
| Educational Services | 1,136 (31.7%) | 2,446 (68.3%) |
| Health Care & Social Assistance | 1,827 (28.9%) | 4,501 (71.1%) |
| Arts, Entertainment & Recreation | 241 (45.0%) | 295 (55.0%) |
| Accommodation & Food Services | 917 (52.9%) | 816 (47.1%) |
| Public Administration | 284 (50.5%) | 278 (49.5%) |
| Total | 16,471 (52.0%) | 15,209 (48.0%) |
Education in Skokie
School Enrollment in Skokie
The most common levels of schooling among the 16,979 students in Skokie are high school (3,824 | 22.5%), middle school (3,354 | 19.8%), and college / undergraduate (3,296 | 19.4%).
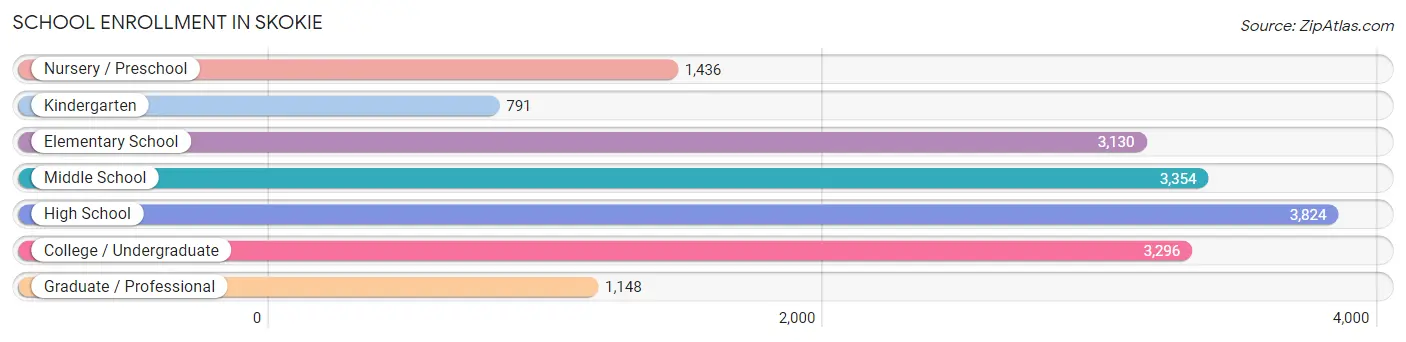
| School Level | # Students | % Students |
| Nursery / Preschool | 1,436 | 8.5% |
| Kindergarten | 791 | 4.7% |
| Elementary School | 3,130 | 18.4% |
| Middle School | 3,354 | 19.8% |
| High School | 3,824 | 22.5% |
| College / Undergraduate | 3,296 | 19.4% |
| Graduate / Professional | 1,148 | 6.8% |
| Total | 16,979 | 100.0% |
School Enrollment by Age by Funding Source in Skokie
Out of a total of 16,979 students who are enrolled in schools in Skokie, 4,330 (25.5%) attend a private institution, while the remaining 12,649 (74.5%) are enrolled in public schools. The age group of 3 to 4 year olds has the highest likelihood of being enrolled in private schools, with 958 (75.2% in the age bracket) enrolled. Conversely, the age group of 15 to 17 year olds has the lowest likelihood of being enrolled in a private school, with 2,534 (86.6% in the age bracket) attending a public institution.
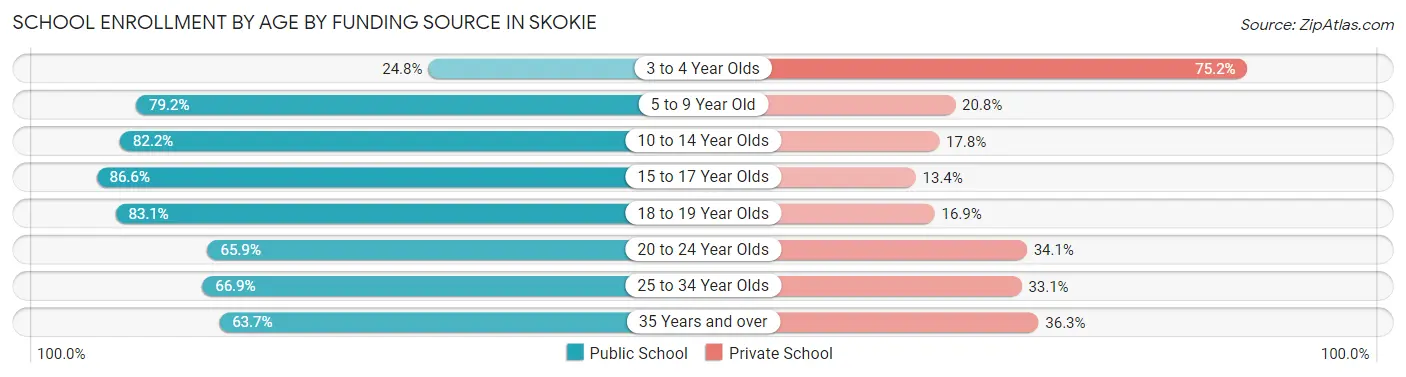
| Age Bracket | Public School | Private School |
| 3 to 4 Year Olds | 316 (24.8%) | 958 (75.2%) |
| 5 to 9 Year Old | 3,027 (79.2%) | 793 (20.8%) |
| 10 to 14 Year Olds | 3,250 (82.2%) | 702 (17.8%) |
| 15 to 17 Year Olds | 2,534 (86.6%) | 392 (13.4%) |
| 18 to 19 Year Olds | 1,070 (83.1%) | 218 (16.9%) |
| 20 to 24 Year Olds | 1,050 (65.9%) | 543 (34.1%) |
| 25 to 34 Year Olds | 911 (66.9%) | 451 (33.1%) |
| 35 Years and over | 487 (63.7%) | 277 (36.3%) |
| Total | 12,649 (74.5%) | 4,330 (25.5%) |
Educational Attainment by Field of Study in Skokie
Business (4,091 | 15.7%), science & technology (3,508 | 13.5%), education (2,489 | 9.6%), social sciences (2,403 | 9.2%), and engineering (1,863 | 7.2%) are the most common fields of study among 25,991 individuals in Skokie who have obtained a bachelor's degree or higher.
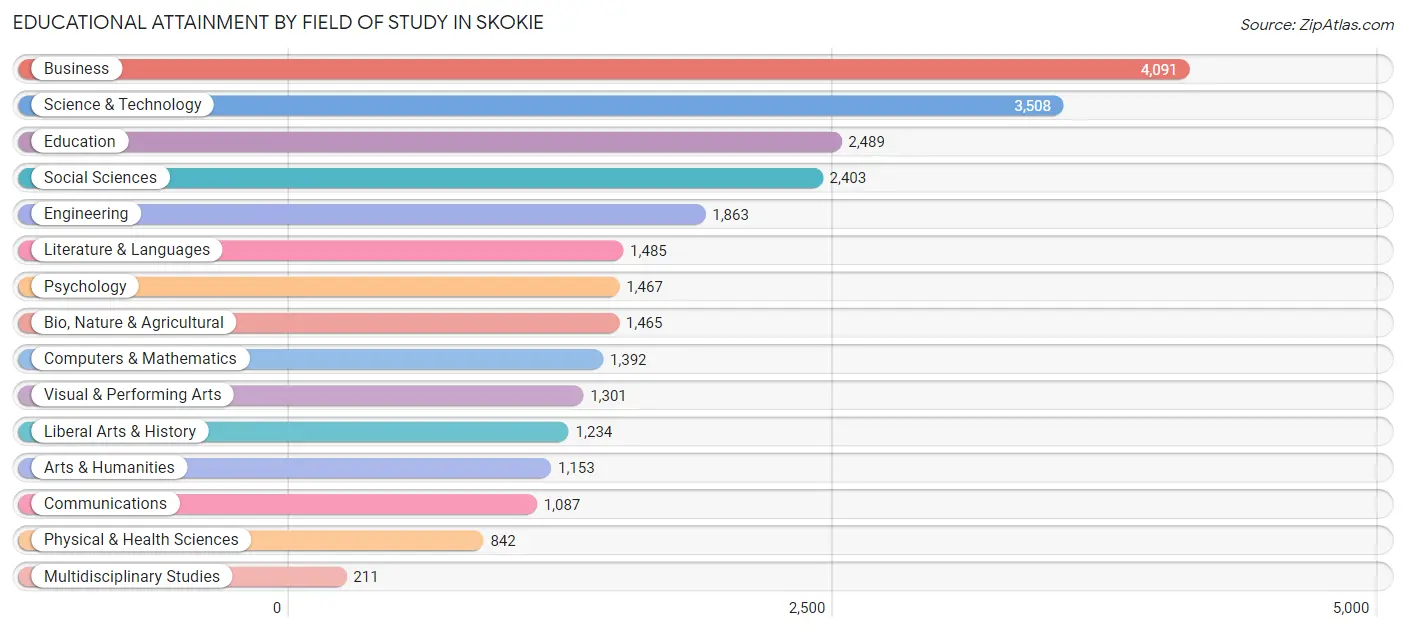
| Field of Study | # Graduates | % Graduates |
| Computers & Mathematics | 1,392 | 5.4% |
| Bio, Nature & Agricultural | 1,465 | 5.6% |
| Physical & Health Sciences | 842 | 3.2% |
| Psychology | 1,467 | 5.6% |
| Social Sciences | 2,403 | 9.2% |
| Engineering | 1,863 | 7.2% |
| Multidisciplinary Studies | 211 | 0.8% |
| Science & Technology | 3,508 | 13.5% |
| Business | 4,091 | 15.7% |
| Education | 2,489 | 9.6% |
| Literature & Languages | 1,485 | 5.7% |
| Liberal Arts & History | 1,234 | 4.8% |
| Visual & Performing Arts | 1,301 | 5.0% |
| Communications | 1,087 | 4.2% |
| Arts & Humanities | 1,153 | 4.4% |
| Total | 25,991 | 100.0% |
Transportation & Commute in Skokie
Vehicle Availability by Sex in Skokie
The most prevalent vehicle ownership categories in Skokie are males with 2 vehicles (7,162, accounting for 44.6%) and females with 2 vehicles (6,227, making up 48.4%).
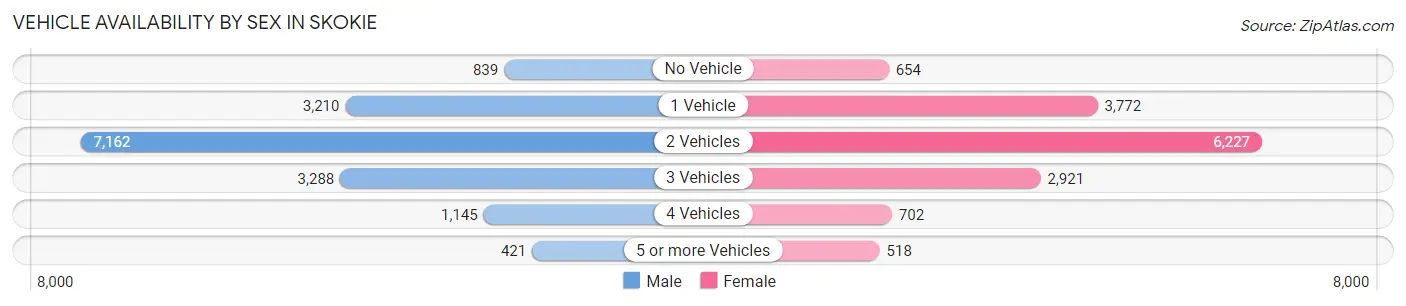
| Vehicles Available | Male | Female |
| No Vehicle | 839 (5.2%) | 654 (4.4%) |
| 1 Vehicle | 3,210 (20.0%) | 3,772 (25.5%) |
| 2 Vehicles | 7,162 (44.6%) | 6,227 (42.1%) |
| 3 Vehicles | 3,288 (20.5%) | 2,921 (19.7%) |
| 4 Vehicles | 1,145 (7.1%) | 702 (4.8%) |
| 5 or more Vehicles | 421 (2.6%) | 518 (3.5%) |
| Total | 16,065 (100.0%) | 14,794 (100.0%) |
Commute Time in Skokie
The most frequently occuring commute durations in Skokie are 30 to 34 minutes (4,313 commuters, 16.2%), 10 to 14 minutes (3,794 commuters, 14.3%), and 15 to 19 minutes (3,687 commuters, 13.9%).
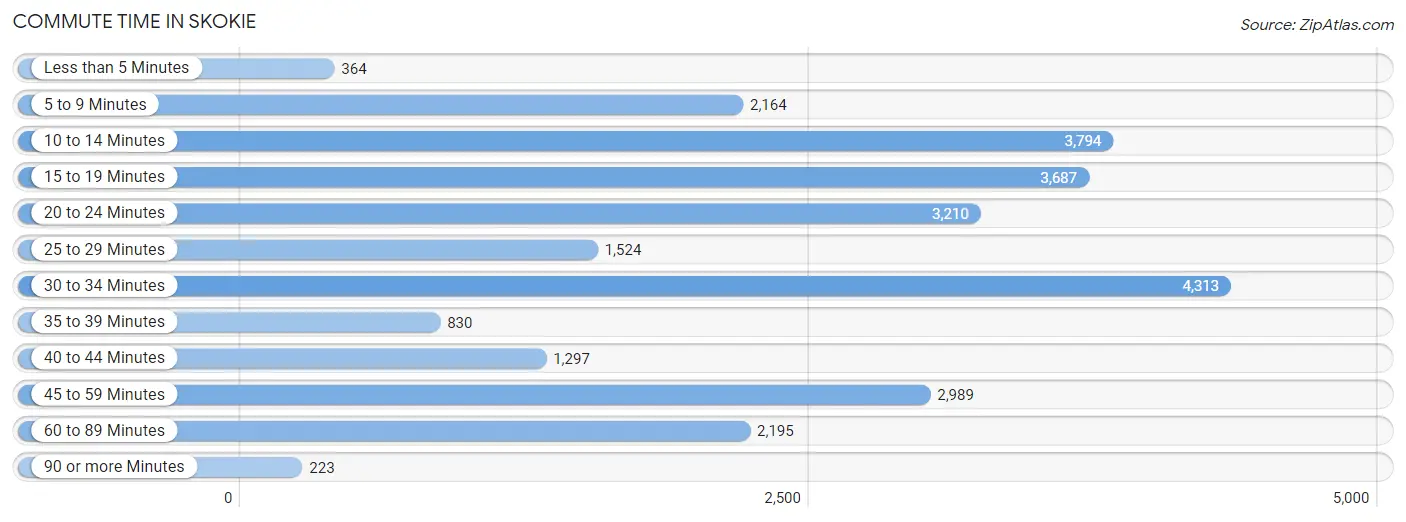
| Commute Time | # Commuters | % Commuters |
| Less than 5 Minutes | 364 | 1.4% |
| 5 to 9 Minutes | 2,164 | 8.1% |
| 10 to 14 Minutes | 3,794 | 14.3% |
| 15 to 19 Minutes | 3,687 | 13.9% |
| 20 to 24 Minutes | 3,210 | 12.1% |
| 25 to 29 Minutes | 1,524 | 5.7% |
| 30 to 34 Minutes | 4,313 | 16.2% |
| 35 to 39 Minutes | 830 | 3.1% |
| 40 to 44 Minutes | 1,297 | 4.9% |
| 45 to 59 Minutes | 2,989 | 11.2% |
| 60 to 89 Minutes | 2,195 | 8.3% |
| 90 or more Minutes | 223 | 0.8% |
Commute Time by Sex in Skokie
The most common commute times in Skokie are 30 to 34 minutes (2,471 commuters, 17.9%) for males and 10 to 14 minutes (2,202 commuters, 17.2%) for females.
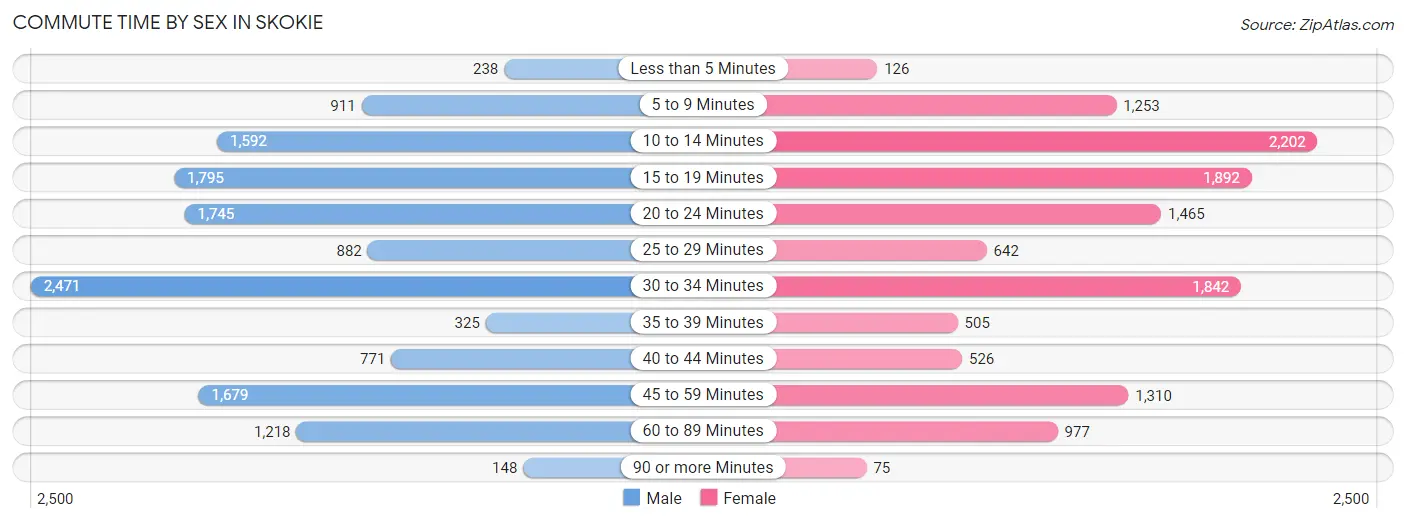
| Commute Time | Male | Female |
| Less than 5 Minutes | 238 (1.7%) | 126 (1.0%) |
| 5 to 9 Minutes | 911 (6.6%) | 1,253 (9.8%) |
| 10 to 14 Minutes | 1,592 (11.6%) | 2,202 (17.2%) |
| 15 to 19 Minutes | 1,795 (13.0%) | 1,892 (14.8%) |
| 20 to 24 Minutes | 1,745 (12.7%) | 1,465 (11.4%) |
| 25 to 29 Minutes | 882 (6.4%) | 642 (5.0%) |
| 30 to 34 Minutes | 2,471 (17.9%) | 1,842 (14.4%) |
| 35 to 39 Minutes | 325 (2.4%) | 505 (3.9%) |
| 40 to 44 Minutes | 771 (5.6%) | 526 (4.1%) |
| 45 to 59 Minutes | 1,679 (12.2%) | 1,310 (10.2%) |
| 60 to 89 Minutes | 1,218 (8.8%) | 977 (7.6%) |
| 90 or more Minutes | 148 (1.1%) | 75 (0.6%) |
Time of Departure to Work by Sex in Skokie
The most frequent times of departure to work in Skokie are 8:00 AM to 8:29 AM (2,021, 14.7%) for males and 7:00 AM to 7:29 AM (1,971, 15.4%) for females.
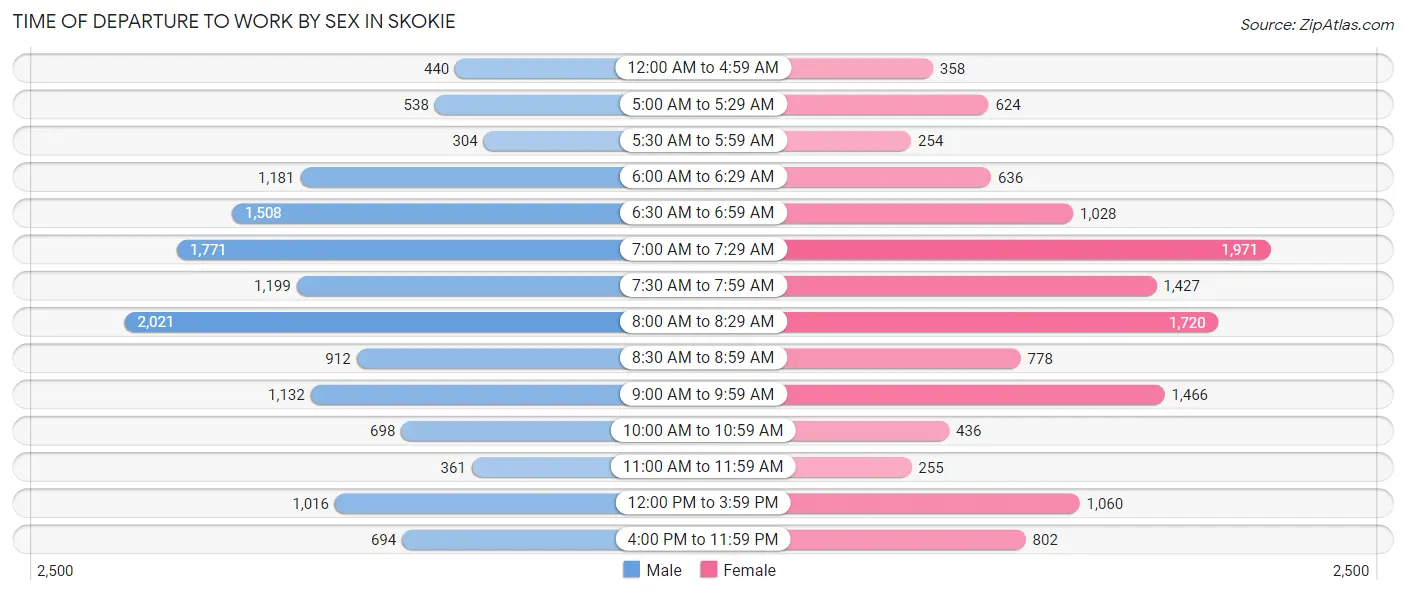
| Time of Departure | Male | Female |
| 12:00 AM to 4:59 AM | 440 (3.2%) | 358 (2.8%) |
| 5:00 AM to 5:29 AM | 538 (3.9%) | 624 (4.9%) |
| 5:30 AM to 5:59 AM | 304 (2.2%) | 254 (2.0%) |
| 6:00 AM to 6:29 AM | 1,181 (8.6%) | 636 (5.0%) |
| 6:30 AM to 6:59 AM | 1,508 (11.0%) | 1,028 (8.0%) |
| 7:00 AM to 7:29 AM | 1,771 (12.9%) | 1,971 (15.4%) |
| 7:30 AM to 7:59 AM | 1,199 (8.7%) | 1,427 (11.1%) |
| 8:00 AM to 8:29 AM | 2,021 (14.7%) | 1,720 (13.4%) |
| 8:30 AM to 8:59 AM | 912 (6.6%) | 778 (6.1%) |
| 9:00 AM to 9:59 AM | 1,132 (8.2%) | 1,466 (11.4%) |
| 10:00 AM to 10:59 AM | 698 (5.1%) | 436 (3.4%) |
| 11:00 AM to 11:59 AM | 361 (2.6%) | 255 (2.0%) |
| 12:00 PM to 3:59 PM | 1,016 (7.4%) | 1,060 (8.3%) |
| 4:00 PM to 11:59 PM | 694 (5.0%) | 802 (6.3%) |
| Total | 13,775 (100.0%) | 12,815 (100.0%) |
Housing Occupancy in Skokie
Occupancy by Ownership in Skokie
Of the total 24,049 dwellings in Skokie, owner-occupied units account for 17,945 (74.6%), while renter-occupied units make up 6,104 (25.4%).
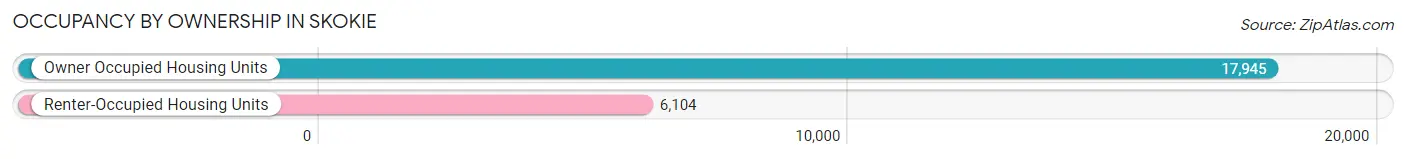
| Occupancy | # Housing Units | % Housing Units |
| Owner Occupied Housing Units | 17,945 | 74.6% |
| Renter-Occupied Housing Units | 6,104 | 25.4% |
| Total Occupied Housing Units | 24,049 | 100.0% |
Occupancy by Household Size in Skokie
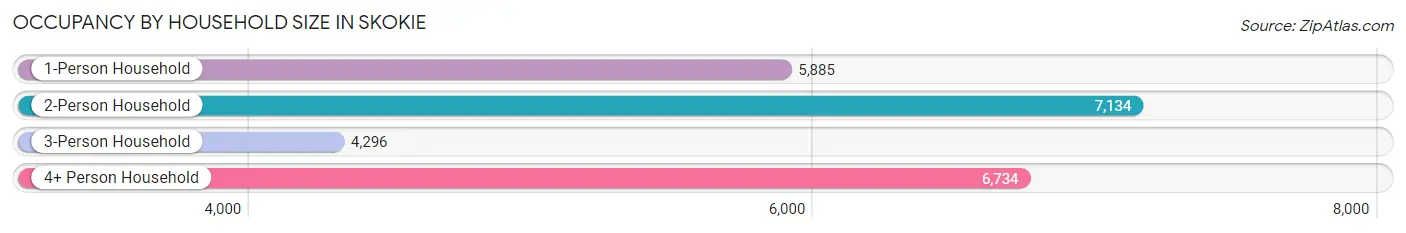
| Household Size | # Housing Units | % Housing Units |
| 1-Person Household | 5,885 | 24.5% |
| 2-Person Household | 7,134 | 29.7% |
| 3-Person Household | 4,296 | 17.9% |
| 4+ Person Household | 6,734 | 28.0% |
| Total Housing Units | 24,049 | 100.0% |
Occupancy by Ownership by Household Size in Skokie
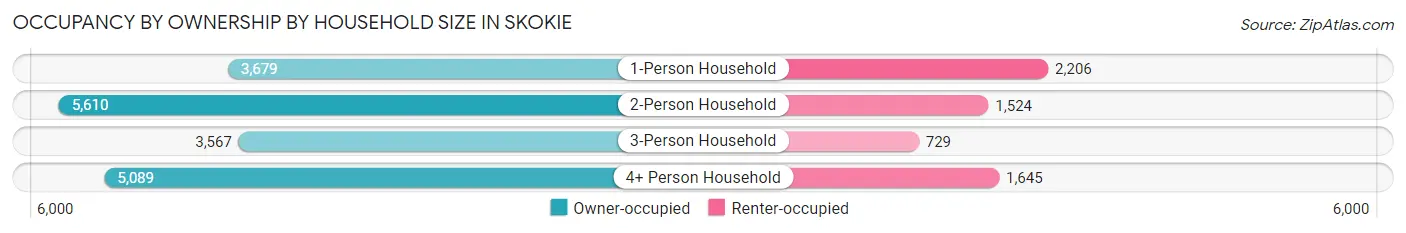
| Household Size | Owner-occupied | Renter-occupied |
| 1-Person Household | 3,679 (62.5%) | 2,206 (37.5%) |
| 2-Person Household | 5,610 (78.6%) | 1,524 (21.4%) |
| 3-Person Household | 3,567 (83.0%) | 729 (17.0%) |
| 4+ Person Household | 5,089 (75.6%) | 1,645 (24.4%) |
| Total Housing Units | 17,945 (74.6%) | 6,104 (25.4%) |
Occupancy by Educational Attainment in Skokie
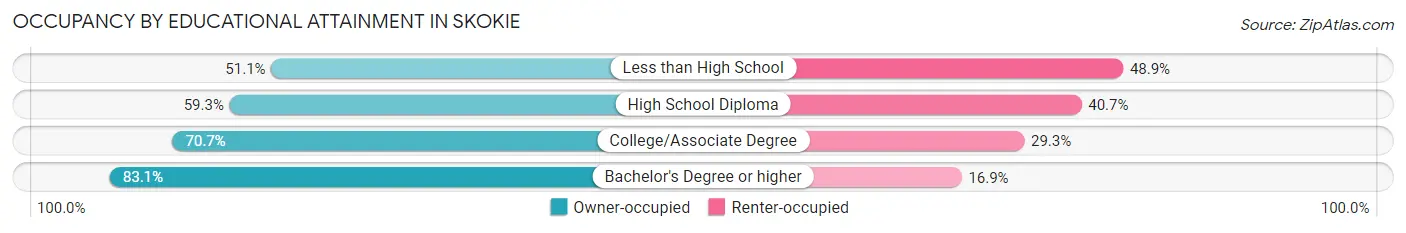
| Household Size | Owner-occupied | Renter-occupied |
| Less than High School | 743 (51.1%) | 712 (48.9%) |
| High School Diploma | 2,261 (59.3%) | 1,550 (40.7%) |
| College/Associate Degree | 3,790 (70.7%) | 1,572 (29.3%) |
| Bachelor's Degree or higher | 11,151 (83.1%) | 2,270 (16.9%) |
Occupancy by Age of Householder in Skokie
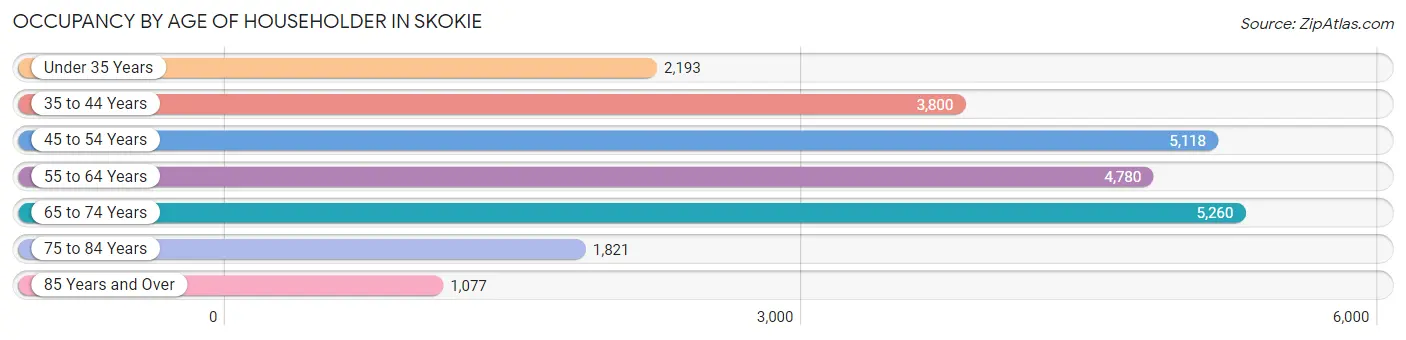
| Age Bracket | # Households | % Households |
| Under 35 Years | 2,193 | 9.1% |
| 35 to 44 Years | 3,800 | 15.8% |
| 45 to 54 Years | 5,118 | 21.3% |
| 55 to 64 Years | 4,780 | 19.9% |
| 65 to 74 Years | 5,260 | 21.9% |
| 75 to 84 Years | 1,821 | 7.6% |
| 85 Years and Over | 1,077 | 4.5% |
| Total | 24,049 | 100.0% |
Housing Finances in Skokie
Median Income by Occupancy in Skokie
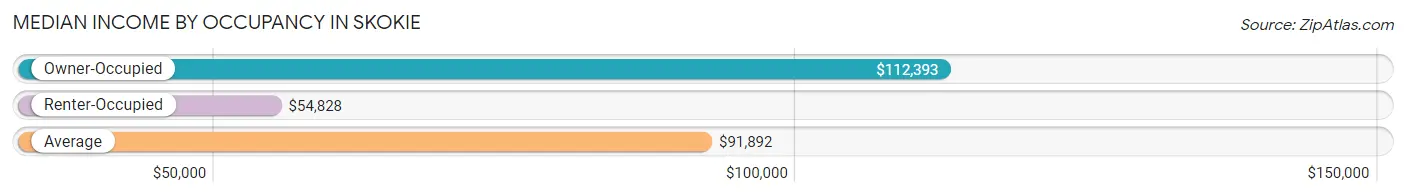
| Occupancy Type | # Households | Median Income |
| Owner-Occupied | 17,945 (74.6%) | $112,393 |
| Renter-Occupied | 6,104 (25.4%) | $54,828 |
| Average | 24,049 (100.0%) | $91,892 |
Occupancy by Householder Income Bracket in Skokie
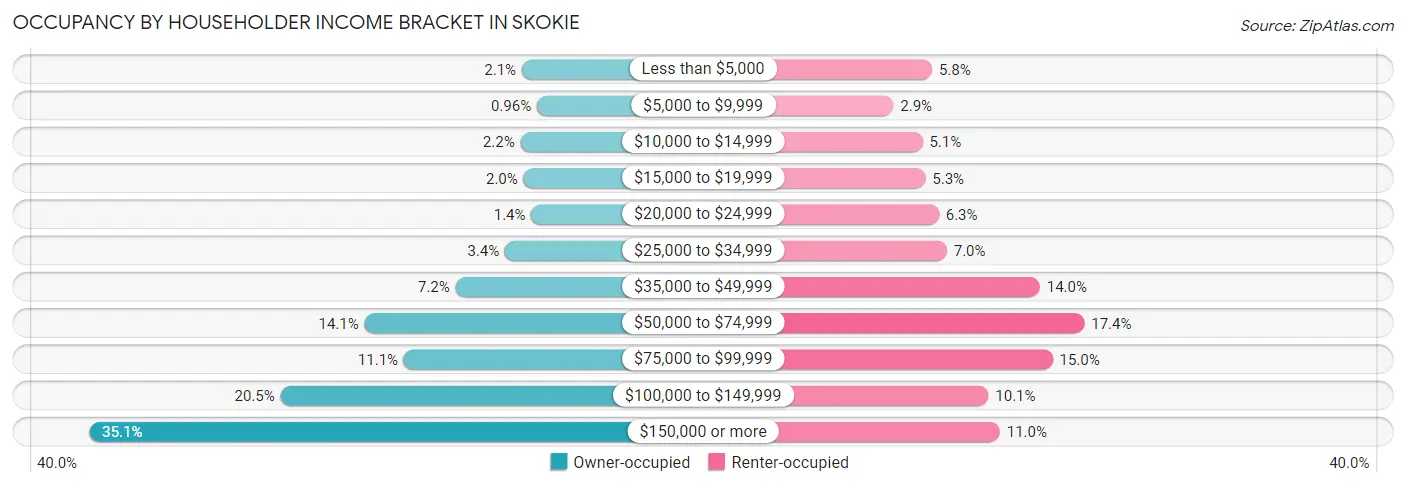
| Income Bracket | Owner-occupied | Renter-occupied |
| Less than $5,000 | 378 (2.1%) | 355 (5.8%) |
| $5,000 to $9,999 | 172 (1.0%) | 176 (2.9%) |
| $10,000 to $14,999 | 399 (2.2%) | 311 (5.1%) |
| $15,000 to $19,999 | 355 (2.0%) | 325 (5.3%) |
| $20,000 to $24,999 | 250 (1.4%) | 387 (6.3%) |
| $25,000 to $34,999 | 608 (3.4%) | 424 (7.0%) |
| $35,000 to $49,999 | 1,285 (7.2%) | 857 (14.0%) |
| $50,000 to $74,999 | 2,531 (14.1%) | 1,064 (17.4%) |
| $75,000 to $99,999 | 1,992 (11.1%) | 916 (15.0%) |
| $100,000 to $149,999 | 3,679 (20.5%) | 618 (10.1%) |
| $150,000 or more | 6,296 (35.1%) | 671 (11.0%) |
| Total | 17,945 (100.0%) | 6,104 (100.0%) |
Monthly Housing Cost Tiers in Skokie
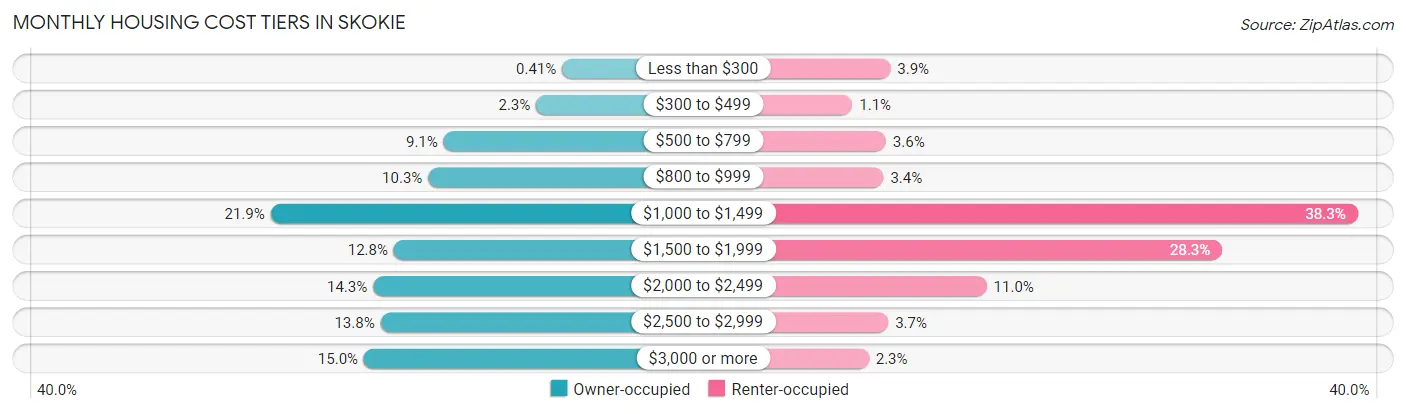
| Monthly Cost | Owner-occupied | Renter-occupied |
| Less than $300 | 74 (0.4%) | 238 (3.9%) |
| $300 to $499 | 419 (2.3%) | 67 (1.1%) |
| $500 to $799 | 1,640 (9.1%) | 218 (3.6%) |
| $800 to $999 | 1,844 (10.3%) | 207 (3.4%) |
| $1,000 to $1,499 | 3,928 (21.9%) | 2,338 (38.3%) |
| $1,500 to $1,999 | 2,299 (12.8%) | 1,729 (28.3%) |
| $2,000 to $2,499 | 2,573 (14.3%) | 671 (11.0%) |
| $2,500 to $2,999 | 2,474 (13.8%) | 228 (3.7%) |
| $3,000 or more | 2,694 (15.0%) | 141 (2.3%) |
| Total | 17,945 (100.0%) | 6,104 (100.0%) |
Physical Housing Characteristics in Skokie
Housing Structures in Skokie
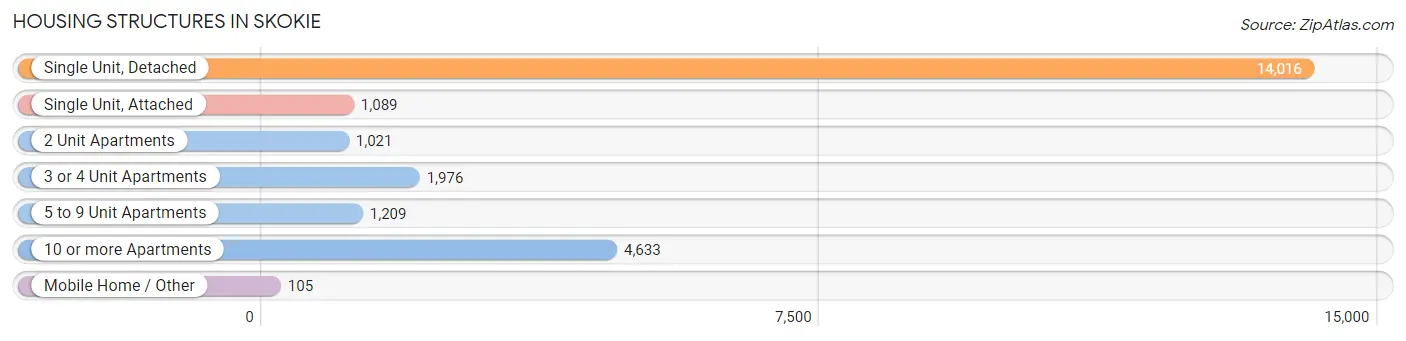
| Structure Type | # Housing Units | % Housing Units |
| Single Unit, Detached | 14,016 | 58.3% |
| Single Unit, Attached | 1,089 | 4.5% |
| 2 Unit Apartments | 1,021 | 4.3% |
| 3 or 4 Unit Apartments | 1,976 | 8.2% |
| 5 to 9 Unit Apartments | 1,209 | 5.0% |
| 10 or more Apartments | 4,633 | 19.3% |
| Mobile Home / Other | 105 | 0.4% |
| Total | 24,049 | 100.0% |
Housing Structures by Occupancy in Skokie
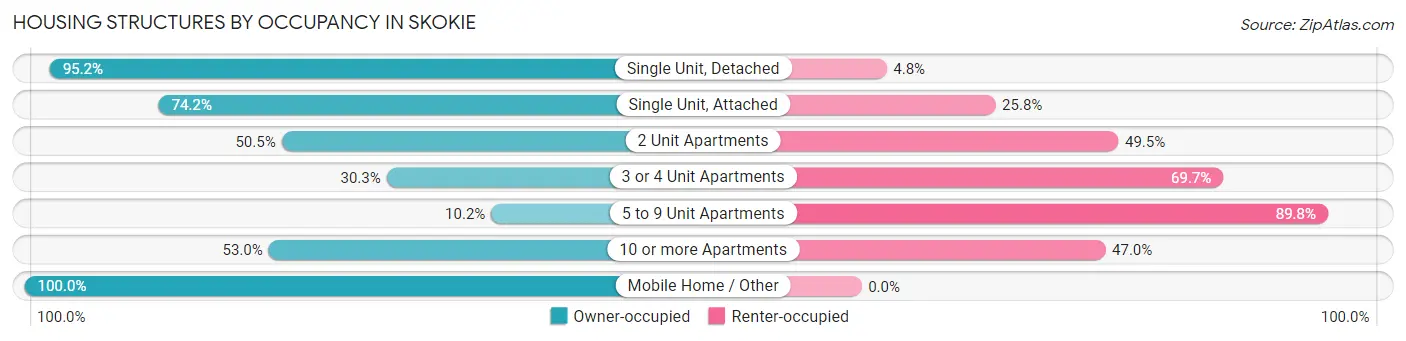
| Structure Type | Owner-occupied | Renter-occupied |
| Single Unit, Detached | 13,337 (95.2%) | 679 (4.8%) |
| Single Unit, Attached | 808 (74.2%) | 281 (25.8%) |
| 2 Unit Apartments | 516 (50.5%) | 505 (49.5%) |
| 3 or 4 Unit Apartments | 599 (30.3%) | 1,377 (69.7%) |
| 5 to 9 Unit Apartments | 123 (10.2%) | 1,086 (89.8%) |
| 10 or more Apartments | 2,457 (53.0%) | 2,176 (47.0%) |
| Mobile Home / Other | 105 (100.0%) | 0 (0.0%) |
| Total | 17,945 (74.6%) | 6,104 (25.4%) |
Housing Structures by Number of Rooms in Skokie
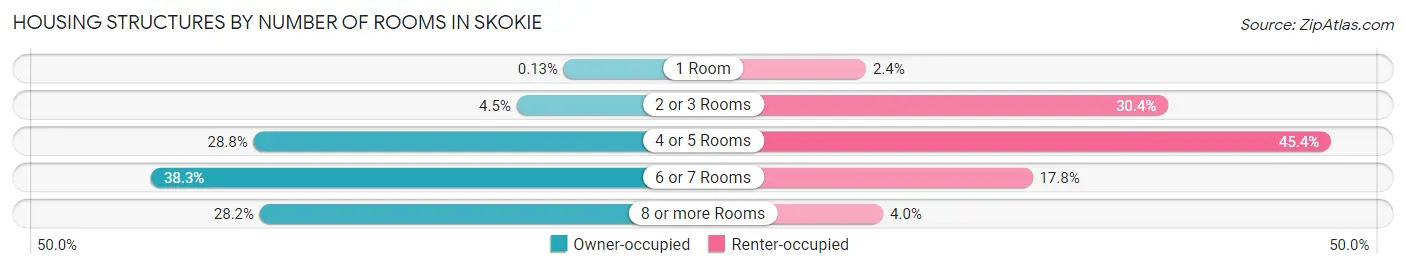
| Number of Rooms | Owner-occupied | Renter-occupied |
| 1 Room | 24 (0.1%) | 147 (2.4%) |
| 2 or 3 Rooms | 806 (4.5%) | 1,853 (30.4%) |
| 4 or 5 Rooms | 5,172 (28.8%) | 2,773 (45.4%) |
| 6 or 7 Rooms | 6,875 (38.3%) | 1,087 (17.8%) |
| 8 or more Rooms | 5,068 (28.2%) | 244 (4.0%) |
| Total | 17,945 (100.0%) | 6,104 (100.0%) |
Housing Structure by Heating Type in Skokie
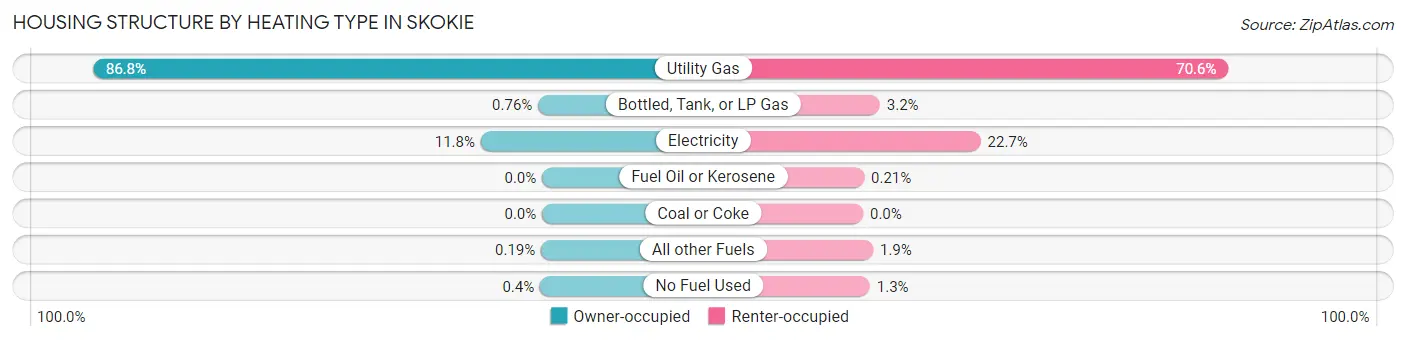
| Heating Type | Owner-occupied | Renter-occupied |
| Utility Gas | 15,579 (86.8%) | 4,308 (70.6%) |
| Bottled, Tank, or LP Gas | 136 (0.8%) | 198 (3.2%) |
| Electricity | 2,125 (11.8%) | 1,387 (22.7%) |
| Fuel Oil or Kerosene | 0 (0.0%) | 13 (0.2%) |
| Coal or Coke | 0 (0.0%) | 0 (0.0%) |
| All other Fuels | 34 (0.2%) | 118 (1.9%) |
| No Fuel Used | 71 (0.4%) | 80 (1.3%) |
| Total | 17,945 (100.0%) | 6,104 (100.0%) |
Household Vehicle Usage in Skokie
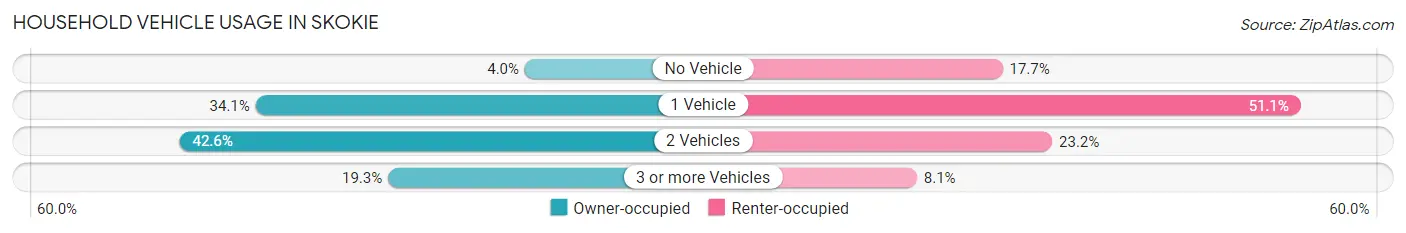
| Vehicles per Household | Owner-occupied | Renter-occupied |
| No Vehicle | 710 (4.0%) | 1,078 (17.7%) |
| 1 Vehicle | 6,122 (34.1%) | 3,117 (51.1%) |
| 2 Vehicles | 7,651 (42.6%) | 1,417 (23.2%) |
| 3 or more Vehicles | 3,462 (19.3%) | 492 (8.1%) |
| Total | 17,945 (100.0%) | 6,104 (100.0%) |
Real Estate & Mortgages in Skokie
Real Estate and Mortgage Overview in Skokie
| Characteristic | Without Mortgage | With Mortgage |
| Housing Units | 7,185 | 10,760 |
| Median Property Value | $342,100 | $375,400 |
| Median Household Income | $82,399 | $4,467 |
| Monthly Housing Costs | $1,000 | $2,606 |
| Real Estate Taxes | $7,550 | $86 |
Property Value by Mortgage Status in Skokie
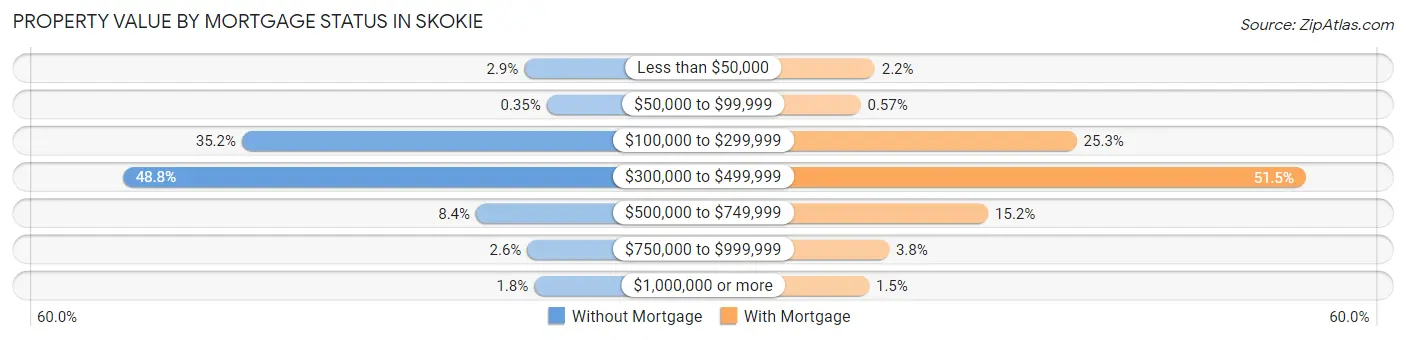
| Property Value | Without Mortgage | With Mortgage |
| Less than $50,000 | 209 (2.9%) | 237 (2.2%) |
| $50,000 to $99,999 | 25 (0.4%) | 61 (0.6%) |
| $100,000 to $299,999 | 2,528 (35.2%) | 2,719 (25.3%) |
| $300,000 to $499,999 | 3,505 (48.8%) | 5,536 (51.4%) |
| $500,000 to $749,999 | 606 (8.4%) | 1,630 (15.1%) |
| $750,000 to $999,999 | 184 (2.6%) | 411 (3.8%) |
| $1,000,000 or more | 128 (1.8%) | 166 (1.5%) |
| Total | 7,185 (100.0%) | 10,760 (100.0%) |
Household Income by Mortgage Status in Skokie
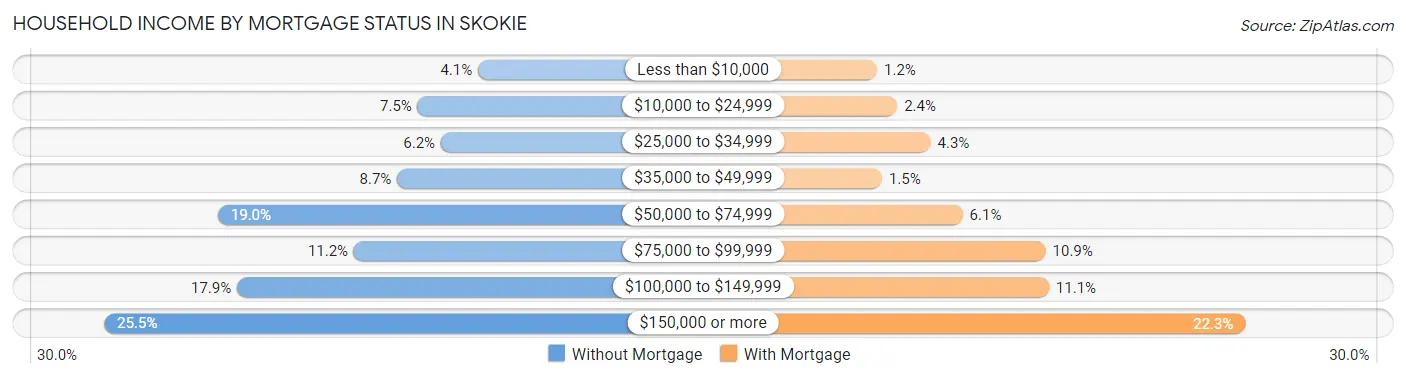
| Household Income | Without Mortgage | With Mortgage |
| Less than $10,000 | 294 (4.1%) | 132 (1.2%) |
| $10,000 to $24,999 | 542 (7.5%) | 256 (2.4%) |
| $25,000 to $34,999 | 446 (6.2%) | 462 (4.3%) |
| $35,000 to $49,999 | 626 (8.7%) | 162 (1.5%) |
| $50,000 to $74,999 | 1,362 (19.0%) | 659 (6.1%) |
| $75,000 to $99,999 | 803 (11.2%) | 1,169 (10.9%) |
| $100,000 to $149,999 | 1,283 (17.9%) | 1,189 (11.1%) |
| $150,000 or more | 1,829 (25.5%) | 2,396 (22.3%) |
| Total | 7,185 (100.0%) | 10,760 (100.0%) |
Property Value to Household Income Ratio in Skokie
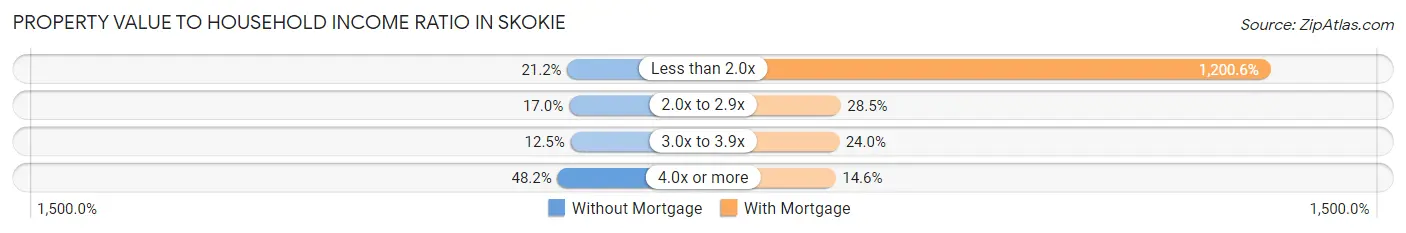
| Value-to-Income Ratio | Without Mortgage | With Mortgage |
| Less than 2.0x | 1,523 (21.2%) | 129,186 (1,200.6%) |
| 2.0x to 2.9x | 1,221 (17.0%) | 3,070 (28.5%) |
| 3.0x to 3.9x | 900 (12.5%) | 2,583 (24.0%) |
| 4.0x or more | 3,462 (48.2%) | 1,571 (14.6%) |
| Total | 7,185 (100.0%) | 10,760 (100.0%) |
Real Estate Taxes by Mortgage Status in Skokie
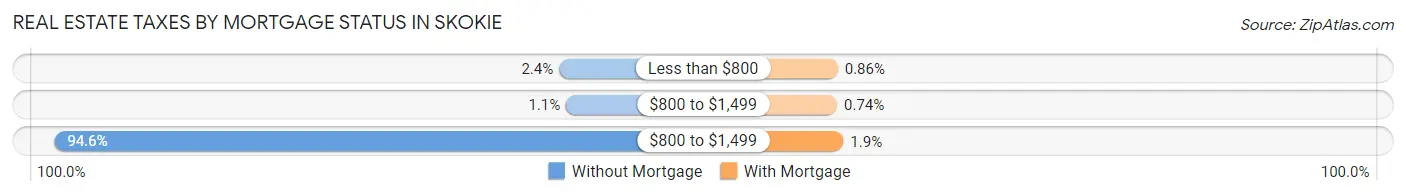
| Property Taxes | Without Mortgage | With Mortgage |
| Less than $800 | 172 (2.4%) | 93 (0.9%) |
| $800 to $1,499 | 79 (1.1%) | 80 (0.7%) |
| $800 to $1,499 | 6,795 (94.6%) | 203 (1.9%) |
| Total | 7,185 (100.0%) | 10,760 (100.0%) |
Health & Disability in Skokie
Health Insurance Coverage by Age in Skokie
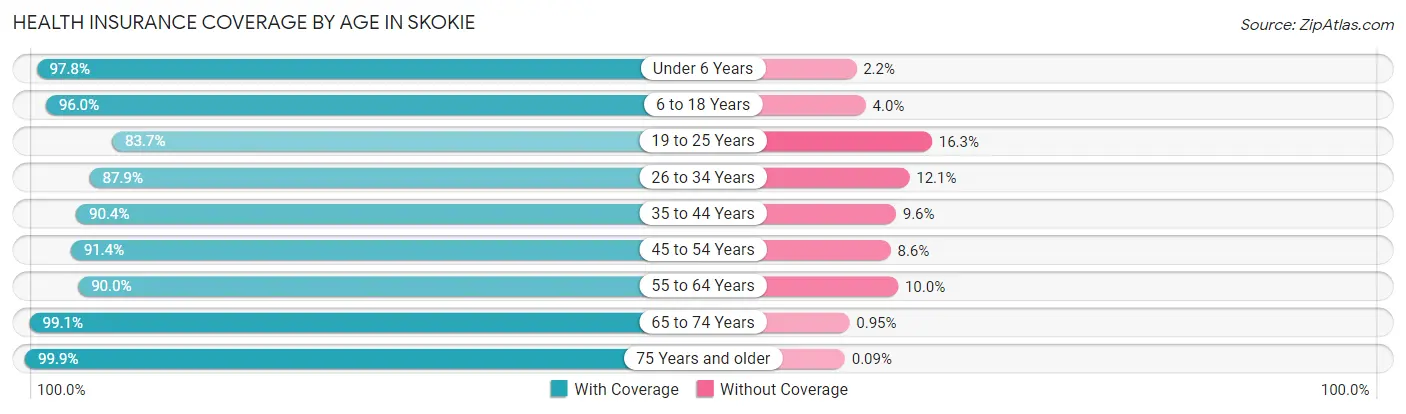
| Age Bracket | With Coverage | Without Coverage |
| Under 6 Years | 4,618 (97.8%) | 105 (2.2%) |
| 6 to 18 Years | 10,721 (96.0%) | 443 (4.0%) |
| 19 to 25 Years | 4,065 (83.7%) | 793 (16.3%) |
| 26 to 34 Years | 5,150 (87.9%) | 710 (12.1%) |
| 35 to 44 Years | 7,597 (90.4%) | 807 (9.6%) |
| 45 to 54 Years | 8,468 (91.4%) | 799 (8.6%) |
| 55 to 64 Years | 7,999 (90.0%) | 890 (10.0%) |
| 65 to 74 Years | 8,690 (99.1%) | 83 (0.9%) |
| 75 Years and older | 4,586 (99.9%) | 4 (0.1%) |
| Total | 61,894 (93.0%) | 4,634 (7.0%) |
Health Insurance Coverage by Citizenship Status in Skokie
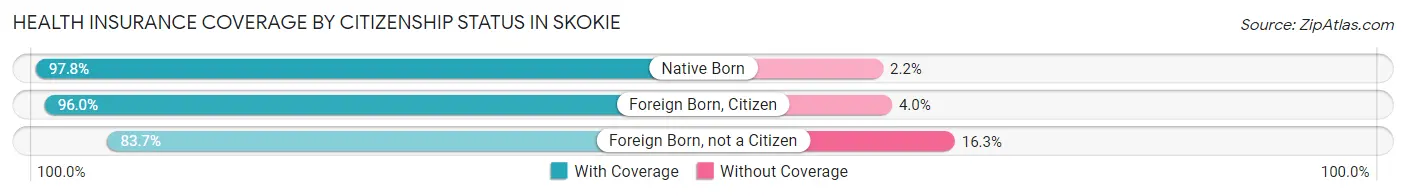
| Citizenship Status | With Coverage | Without Coverage |
| Native Born | 4,618 (97.8%) | 105 (2.2%) |
| Foreign Born, Citizen | 10,721 (96.0%) | 443 (4.0%) |
| Foreign Born, not a Citizen | 4,065 (83.7%) | 793 (16.3%) |
Health Insurance Coverage by Household Income in Skokie
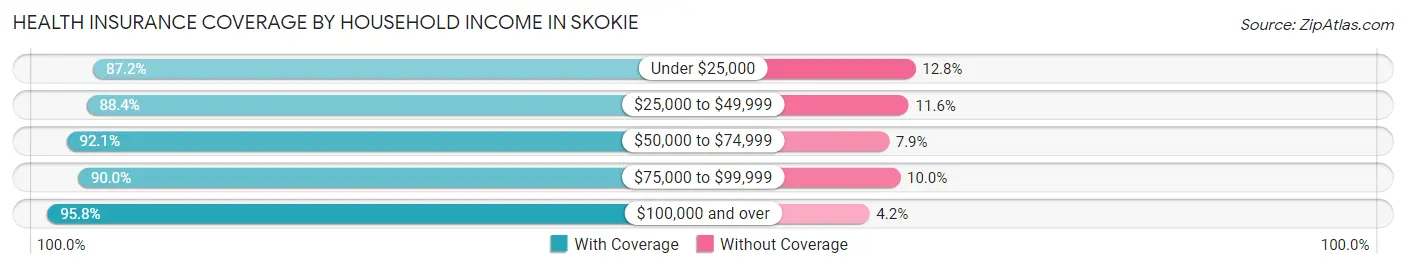
| Household Income | With Coverage | Without Coverage |
| Under $25,000 | 5,028 (87.2%) | 741 (12.8%) |
| $25,000 to $49,999 | 5,864 (88.4%) | 769 (11.6%) |
| $50,000 to $74,999 | 8,319 (92.1%) | 711 (7.9%) |
| $75,000 to $99,999 | 7,244 (90.0%) | 802 (10.0%) |
| $100,000 and over | 35,203 (95.8%) | 1,557 (4.2%) |
Public vs Private Health Insurance Coverage by Age in Skokie
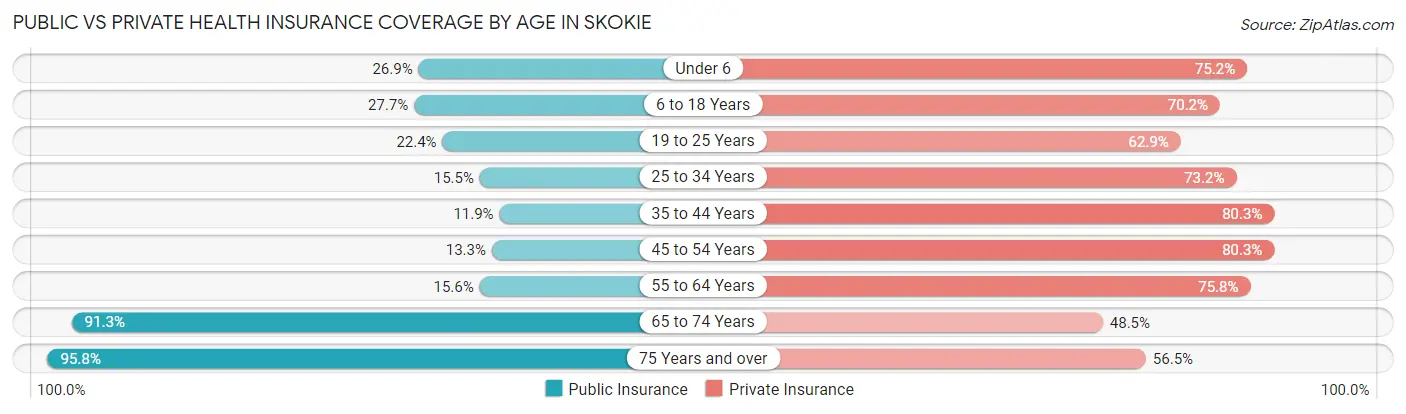
| Age Bracket | Public Insurance | Private Insurance |
| Under 6 | 1,270 (26.9%) | 3,552 (75.2%) |
| 6 to 18 Years | 3,092 (27.7%) | 7,834 (70.2%) |
| 19 to 25 Years | 1,090 (22.4%) | 3,055 (62.9%) |
| 25 to 34 Years | 909 (15.5%) | 4,290 (73.2%) |
| 35 to 44 Years | 997 (11.9%) | 6,745 (80.3%) |
| 45 to 54 Years | 1,231 (13.3%) | 7,437 (80.2%) |
| 55 to 64 Years | 1,382 (15.5%) | 6,739 (75.8%) |
| 65 to 74 Years | 8,006 (91.3%) | 4,251 (48.5%) |
| 75 Years and over | 4,395 (95.8%) | 2,591 (56.5%) |
| Total | 22,372 (33.6%) | 46,494 (69.9%) |
Disability Status by Sex by Age in Skokie
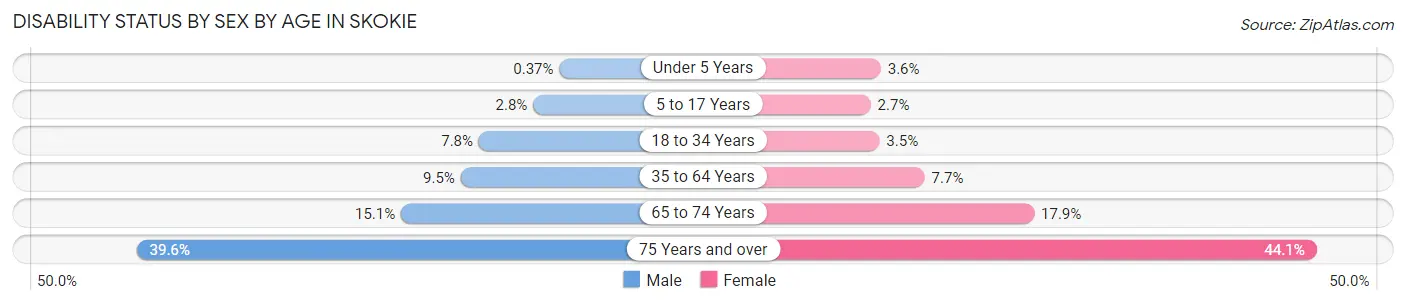
| Age Bracket | Male | Female |
| Under 5 Years | 9 (0.4%) | 50 (3.6%) |
| 5 to 17 Years | 164 (2.8%) | 150 (2.7%) |
| 18 to 34 Years | 465 (7.8%) | 189 (3.5%) |
| 35 to 64 Years | 1,225 (9.5%) | 1,053 (7.7%) |
| 65 to 74 Years | 603 (15.1%) | 851 (17.8%) |
| 75 Years and over | 767 (39.6%) | 1,169 (44.1%) |
Disability Class by Sex by Age in Skokie
Disability Class: Hearing Difficulty
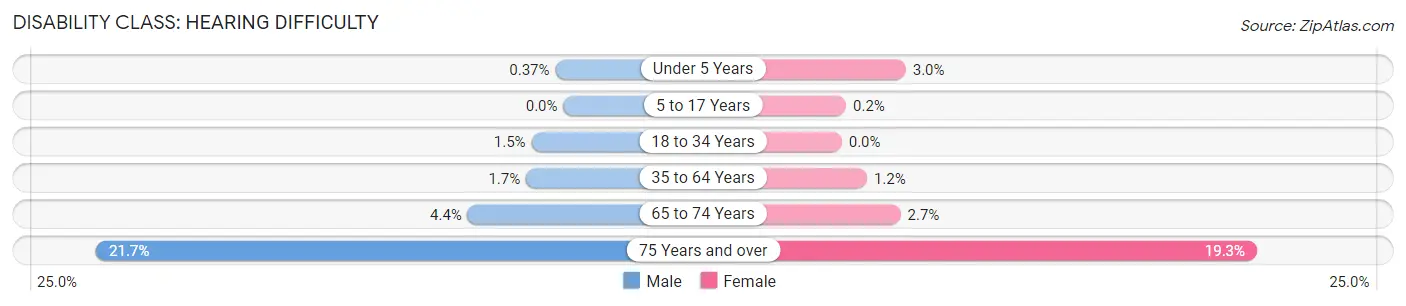
| Age Bracket | Male | Female |
| Under 5 Years | 9 (0.4%) | 41 (3.0%) |
| 5 to 17 Years | 0 (0.0%) | 11 (0.2%) |
| 18 to 34 Years | 88 (1.5%) | 0 (0.0%) |
| 35 to 64 Years | 222 (1.7%) | 160 (1.2%) |
| 65 to 74 Years | 178 (4.4%) | 130 (2.7%) |
| 75 Years and over | 420 (21.7%) | 511 (19.3%) |
Disability Class: Vision Difficulty
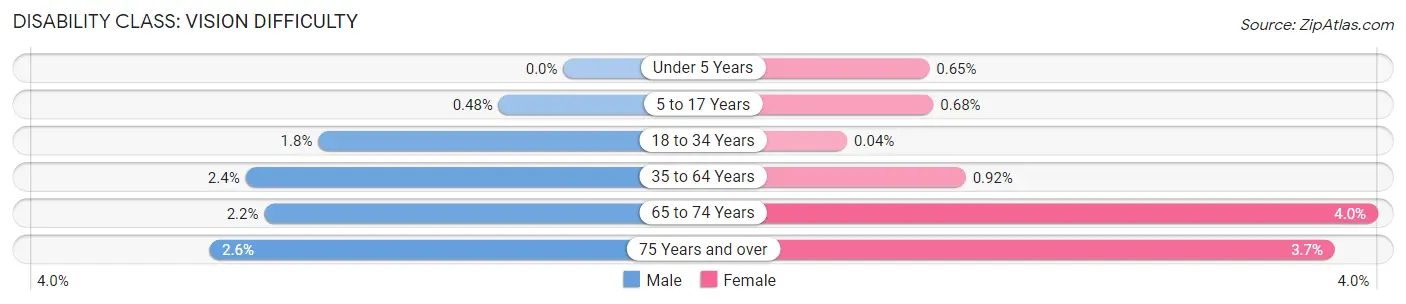
| Age Bracket | Male | Female |
| Under 5 Years | 0 (0.0%) | 9 (0.6%) |
| 5 to 17 Years | 28 (0.5%) | 38 (0.7%) |
| 18 to 34 Years | 108 (1.8%) | 2 (0.0%) |
| 35 to 64 Years | 304 (2.4%) | 126 (0.9%) |
| 65 to 74 Years | 89 (2.2%) | 190 (4.0%) |
| 75 Years and over | 51 (2.6%) | 97 (3.7%) |
Disability Class: Cognitive Difficulty
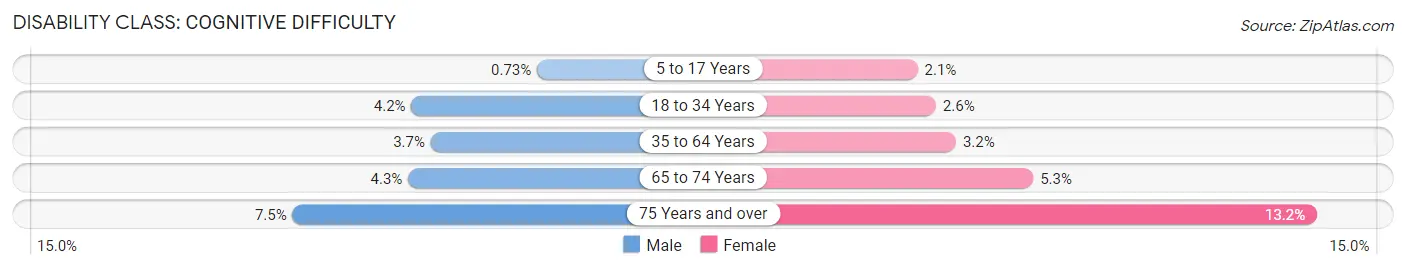
| Age Bracket | Male | Female |
| 5 to 17 Years | 43 (0.7%) | 118 (2.1%) |
| 18 to 34 Years | 251 (4.2%) | 142 (2.6%) |
| 35 to 64 Years | 474 (3.7%) | 435 (3.2%) |
| 65 to 74 Years | 173 (4.3%) | 254 (5.3%) |
| 75 Years and over | 146 (7.5%) | 351 (13.2%) |
Disability Class: Ambulatory Difficulty
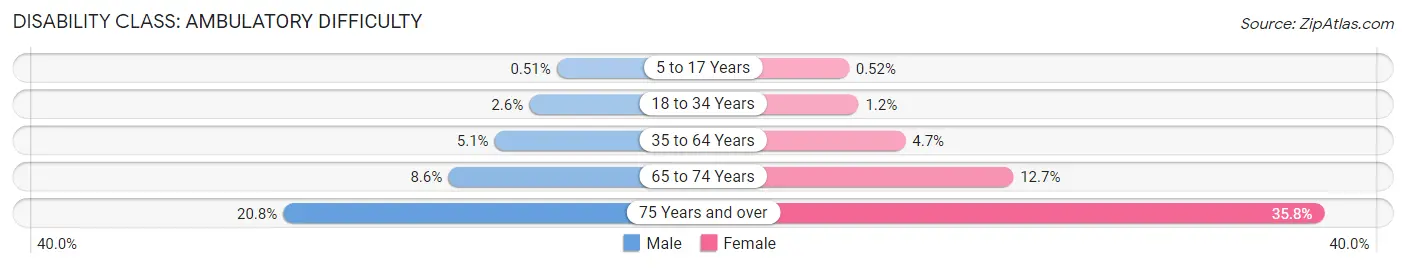
| Age Bracket | Male | Female |
| 5 to 17 Years | 30 (0.5%) | 29 (0.5%) |
| 18 to 34 Years | 151 (2.5%) | 67 (1.2%) |
| 35 to 64 Years | 659 (5.1%) | 647 (4.7%) |
| 65 to 74 Years | 343 (8.6%) | 607 (12.7%) |
| 75 Years and over | 403 (20.8%) | 950 (35.8%) |
Disability Class: Self-Care Difficulty
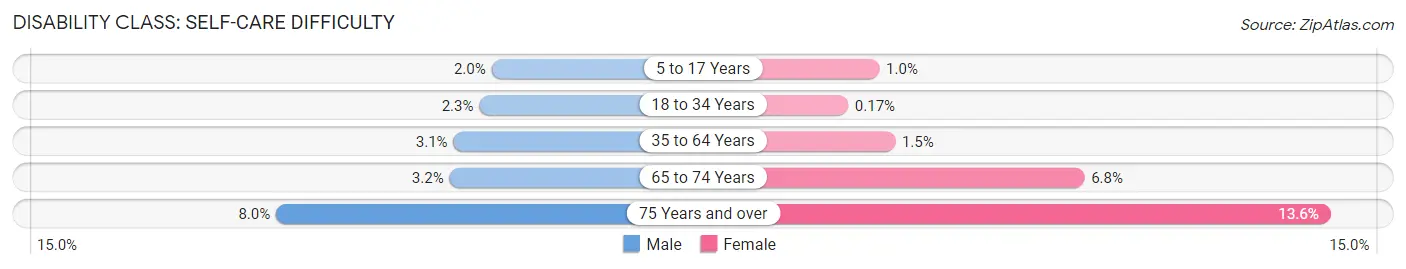
| Age Bracket | Male | Female |
| 5 to 17 Years | 117 (2.0%) | 58 (1.0%) |
| 18 to 34 Years | 139 (2.3%) | 9 (0.2%) |
| 35 to 64 Years | 394 (3.1%) | 203 (1.5%) |
| 65 to 74 Years | 127 (3.2%) | 322 (6.8%) |
| 75 Years and over | 155 (8.0%) | 361 (13.6%) |
Technology Access in Skokie
Computing Device Access in Skokie
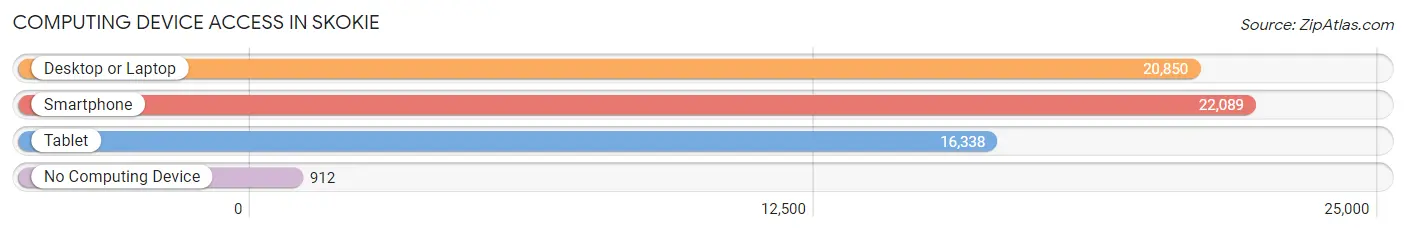
| Device Type | # Households | % Households |
| Desktop or Laptop | 20,850 | 86.7% |
| Smartphone | 22,089 | 91.8% |
| Tablet | 16,338 | 67.9% |
| No Computing Device | 912 | 3.8% |
| Total | 24,049 | 100.0% |
Internet Access in Skokie
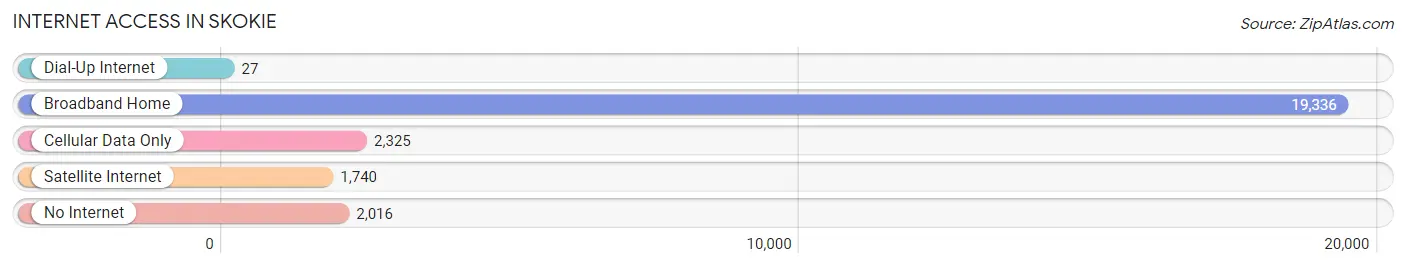
| Internet Type | # Households | % Households |
| Dial-Up Internet | 27 | 0.1% |
| Broadband Home | 19,336 | 80.4% |
| Cellular Data Only | 2,325 | 9.7% |
| Satellite Internet | 1,740 | 7.2% |
| No Internet | 2,016 | 8.4% |
| Total | 24,049 | 100.0% |
Skokie Summary
Skokie, Illinois is a village located in Cook County, Illinois, United States. It is a suburb of Chicago, located approximately 15 miles north of the city. As of the 2010 census, the village had a population of 64,784. Skokie is one of the most diverse communities in the United States, with a population that is nearly evenly split between white, African American, Asian, and Hispanic residents.
History
Skokie was originally inhabited by the Potawatomi Native American tribe. The first European settlers arrived in the area in the 1830s, and the village was officially incorporated in 1888. The village was named after the Potawatomi word for “marsh” or “swamp”.
In the early 20th century, Skokie was a rural farming community. The village experienced a population boom in the 1950s and 1960s, as many people moved to the area from Chicago. This influx of people led to the development of many new neighborhoods and businesses.
Geography
Skokie is located in northeastern Illinois, approximately 15 miles north of Chicago. It is bordered by Evanston to the east, Niles to the south, Morton Grove to the west, and Lincolnwood to the north. The village covers an area of 8.5 square miles, and is located at an elevation of 645 feet above sea level.
The village is located on the Des Plaines River, which flows through the center of the village. The river is a major source of recreation for the village, and is home to a variety of wildlife.
Economy
Skokie’s economy is largely based on retail and services. The village is home to a variety of shopping centers, restaurants, and other businesses. The village is also home to a number of corporate headquarters, including the corporate headquarters of the American Academy of Pediatrics.
Skokie is also home to a number of industrial and manufacturing businesses. The village is home to a number of factories, including a factory that produces plastic products.
Demographics
As of the 2010 census, the village had a population of 64,784. The population is nearly evenly split between white, African American, Asian, and Hispanic residents. The median household income is $60,945, and the median home value is $269,400.
Skokie is a highly educated community, with nearly 70% of residents having a bachelor’s degree or higher. The village is also home to a number of religious institutions, including churches, synagogues, and mosques.
Skokie is a vibrant and diverse community, with a variety of cultural and recreational activities. The village is home to a number of parks, museums, and other attractions. The village also hosts a number of annual festivals and events, including the Skokie Festival of Cultures and the Skokie Arts Festival.
Common Questions
What is Per Capita Income in Skokie?
Per Capita income in Skokie is $43,338.
What is the Median Family Income in Skokie?
Median Family Income in Skokie is $113,320.
What is the Median Household income in Skokie?
Median Household Income in Skokie is $91,892.
What is Income or Wage Gap in Skokie?
Income or Wage Gap in Skokie is 18.7%.
Women in Skokie earn 81.3 cents for every dollar earned by a man.
What is Family Income Deficit in Skokie?
Family Income Deficit in Skokie is $11,369.
Families that are below poverty line in Skokie earn $11,369 less on average than the poverty threshold level.
What is Inequality or Gini Index in Skokie?
Inequality or Gini Index in Skokie is 0.44.
What is the Total Population of Skokie?
Total Population of Skokie is 67,076.
What is the Total Male Population of Skokie?
Total Male Population of Skokie is 33,327.
What is the Total Female Population of Skokie?
Total Female Population of Skokie is 33,749.
What is the Ratio of Males per 100 Females in Skokie?
There are 98.75 Males per 100 Females in Skokie.
What is the Ratio of Females per 100 Males in Skokie?
There are 101.27 Females per 100 Males in Skokie.
What is the Median Population Age in Skokie?
Median Population Age in Skokie is 43.0 Years.
What is the Average Family Size in Skokie
Average Family Size in Skokie is 3.3 People.
What is the Average Household Size in Skokie
Average Household Size in Skokie is 2.8 People.
How Large is the Labor Force in Skokie?
There are 33,515 People in the Labor Forcein in Skokie.
What is the Percentage of People in the Labor Force in Skokie?
62.3% of People are in the Labor Force in Skokie.
What is the Unemployment Rate in Skokie?
Unemployment Rate in Skokie is 5.4%.