West Dundee, IL Map & Demographics
West Dundee Map
West Dundee Overview
$48,831
PER CAPITA INCOME
$119,543
AVG FAMILY INCOME
$99,653
AVG HOUSEHOLD INCOME
6.2%
WAGE / INCOME GAP [ % ]
93.8¢/ $1
WAGE / INCOME GAP [ $ ]
0.39
INEQUALITY / GINI INDEX
7,845
TOTAL POPULATION
4,127
MALE POPULATION
3,718
FEMALE POPULATION
111.00
MALES / 100 FEMALES
90.09
FEMALES / 100 MALES
34.8
MEDIAN AGE
3.0
AVG FAMILY SIZE
2.5
AVG HOUSEHOLD SIZE
4,827
LABOR FORCE [ PEOPLE ]
75.8%
PERCENT IN LABOR FORCE
4.3%
UNEMPLOYMENT RATE
Income in West Dundee
Income Overview in West Dundee
Per Capita Income in West Dundee is $48,831, while median incomes of families and households are $119,543 and $99,653 respectively.
| Characteristic | Number | Measure |
| Per Capita Income | 7,845 | $48,831 |
| Median Family Income | 2,044 | $119,543 |
| Mean Family Income | 2,044 | $146,909 |
| Median Household Income | 3,142 | $99,653 |
| Mean Household Income | 3,142 | $122,099 |
| Income Deficit | 2,044 | $0 |
| Wage / Income Gap (%) | 7,845 | 6.18% |
| Wage / Income Gap ($) | 7,845 | 93.82¢ per $1 |
| Gini / Inequality Index | 7,845 | 0.39 |
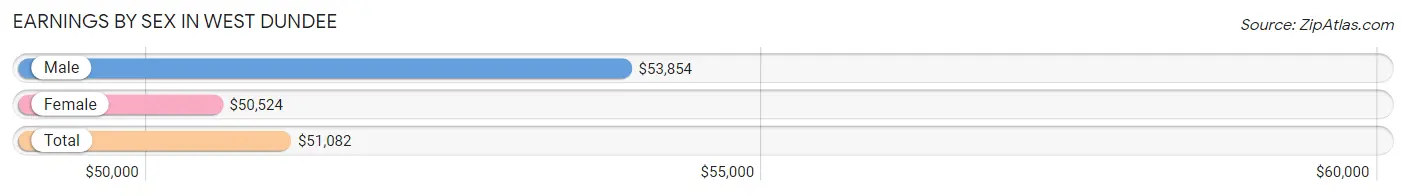
Earnings by Sex in West Dundee
Average Earnings in West Dundee are $51,082, $53,854 for men and $50,524 for women, a difference of 6.2%.
| Sex | Number | Average Earnings |
| Male | 2,653 (54.7%) | $53,854 |
| Female | 2,197 (45.3%) | $50,524 |
| Total | 4,850 (100.0%) | $51,082 |
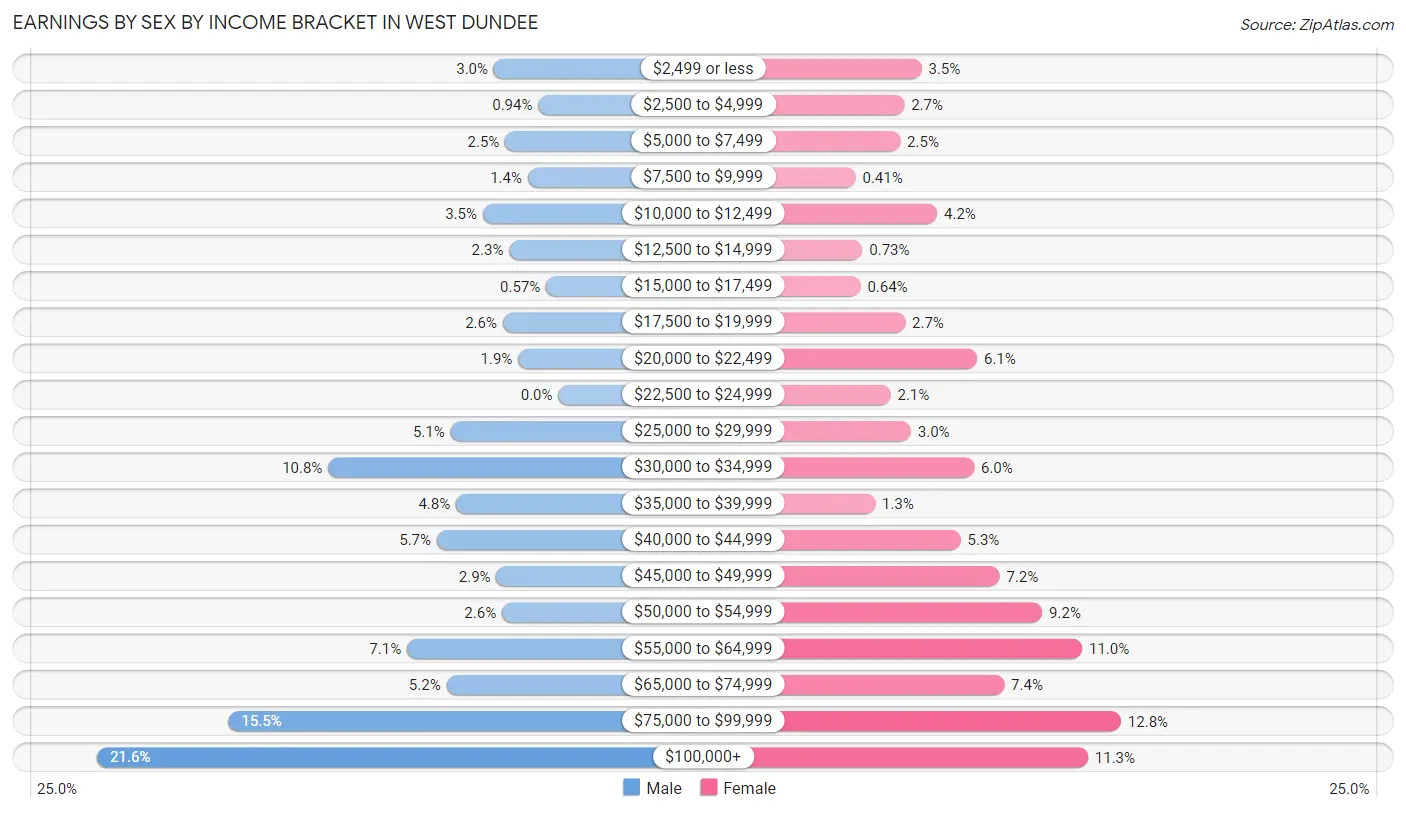
Earnings by Sex by Income Bracket in West Dundee
The most common earnings brackets in West Dundee are $100,000+ for men (573 | 21.6%) and $75,000 to $99,999 for women (282 | 12.8%).
| Income | Male | Female |
| $2,499 or less | 80 (3.0%) | 77 (3.5%) |
| $2,500 to $4,999 | 25 (0.9%) | 59 (2.7%) |
| $5,000 to $7,499 | 66 (2.5%) | 55 (2.5%) |
| $7,500 to $9,999 | 38 (1.4%) | 9 (0.4%) |
| $10,000 to $12,499 | 94 (3.5%) | 93 (4.2%) |
| $12,500 to $14,999 | 61 (2.3%) | 16 (0.7%) |
| $15,000 to $17,499 | 15 (0.6%) | 14 (0.6%) |
| $17,500 to $19,999 | 69 (2.6%) | 60 (2.7%) |
| $20,000 to $22,499 | 50 (1.9%) | 134 (6.1%) |
| $22,500 to $24,999 | 0 (0.0%) | 45 (2.1%) |
| $25,000 to $29,999 | 134 (5.1%) | 66 (3.0%) |
| $30,000 to $34,999 | 286 (10.8%) | 131 (6.0%) |
| $35,000 to $39,999 | 127 (4.8%) | 29 (1.3%) |
| $40,000 to $44,999 | 151 (5.7%) | 117 (5.3%) |
| $45,000 to $49,999 | 77 (2.9%) | 157 (7.1%) |
| $50,000 to $54,999 | 70 (2.6%) | 201 (9.1%) |
| $55,000 to $64,999 | 188 (7.1%) | 242 (11.0%) |
| $65,000 to $74,999 | 139 (5.2%) | 162 (7.4%) |
| $75,000 to $99,999 | 410 (15.4%) | 282 (12.8%) |
| $100,000+ | 573 (21.6%) | 248 (11.3%) |
| Total | 2,653 (100.0%) | 2,197 (100.0%) |
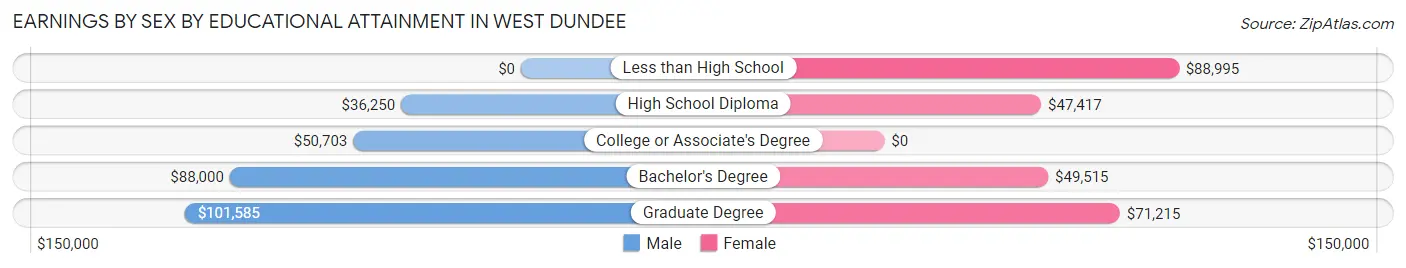
Earnings by Sex by Educational Attainment in West Dundee
Average earnings in West Dundee are $70,652 for men and $52,778 for women, a difference of 25.3%. Men with an educational attainment of graduate degree enjoy the highest average annual earnings of $101,585, while those with high school diploma education earn the least with $36,250. Women with an educational attainment of less than high school earn the most with the average annual earnings of $88,995, while those with high school diploma education have the smallest earnings of $47,417.
| Educational Attainment | Male Income | Female Income |
| Less than High School | - | - |
| High School Diploma | $36,250 | $47,417 |
| College or Associate's Degree | $50,703 | $0 |
| Bachelor's Degree | $88,000 | $49,515 |
| Graduate Degree | $101,585 | $71,215 |
| Total | $70,652 | $52,778 |
Family Income in West Dundee
Family Income Brackets in West Dundee
According to the West Dundee family income data, there are 625 families falling into the $100,000 to $149,999 income range, which is the most common income bracket and makes up 30.6% of all families. Conversely, the $10,000 to $14,999 income bracket is the least frequent group with only 6 families (0.3%) belonging to this category.
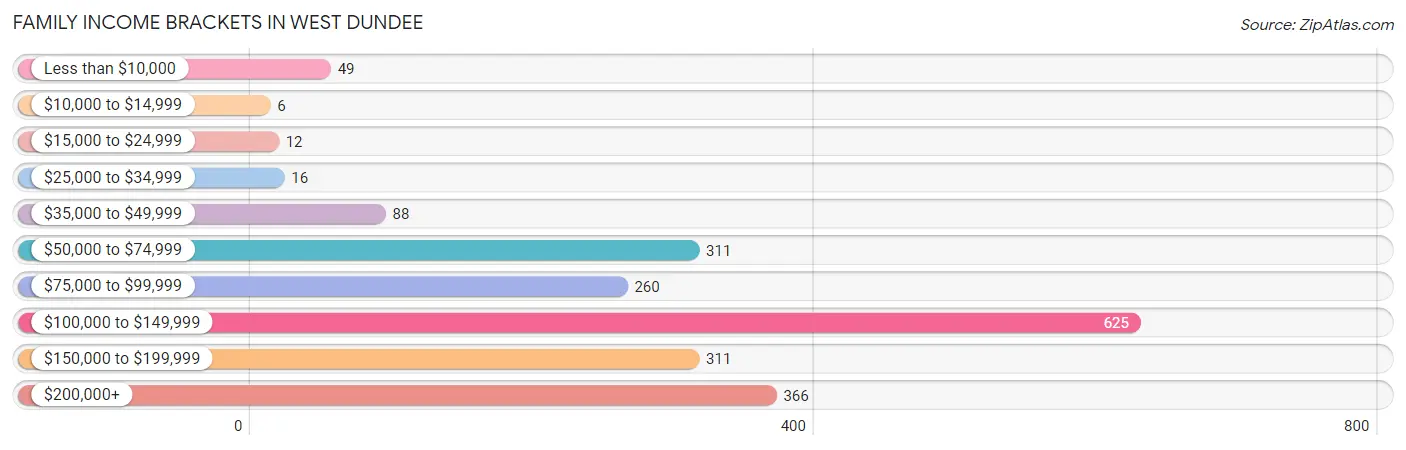
| Income Bracket | # Families | % Families |
| Less than $10,000 | 49 | 2.4% |
| $10,000 to $14,999 | 6 | 0.3% |
| $15,000 to $24,999 | 12 | 0.6% |
| $25,000 to $34,999 | 16 | 0.8% |
| $35,000 to $49,999 | 88 | 4.3% |
| $50,000 to $74,999 | 311 | 15.2% |
| $75,000 to $99,999 | 260 | 12.7% |
| $100,000 to $149,999 | 625 | 30.6% |
| $150,000 to $199,999 | 311 | 15.2% |
| $200,000+ | 366 | 17.9% |
Family Income by Famaliy Size in West Dundee
5-person families (202 | 9.9%) account for the highest median family income in West Dundee with $239,333 per family, while 2-person families (1,056 | 51.7%) have the highest median income of $50,916 per family member.
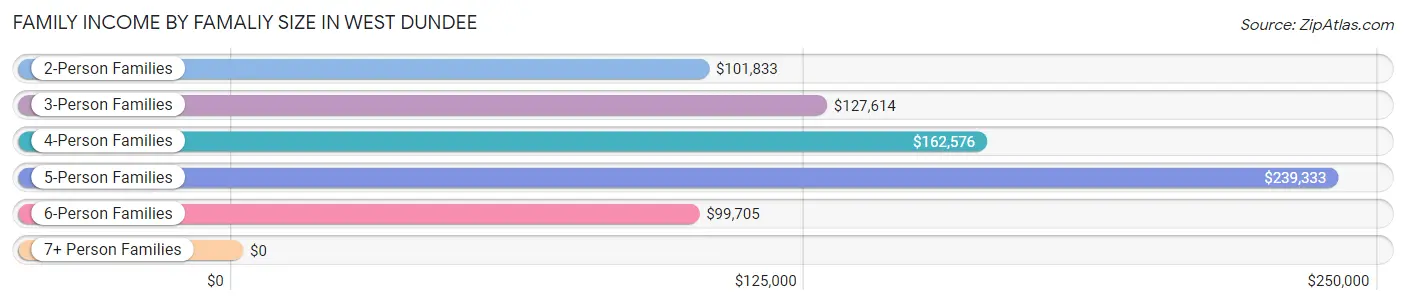
| Income Bracket | # Families | Median Income |
| 2-Person Families | 1,056 (51.7%) | $101,833 |
| 3-Person Families | 336 (16.4%) | $127,614 |
| 4-Person Families | 323 (15.8%) | $162,576 |
| 5-Person Families | 202 (9.9%) | $239,333 |
| 6-Person Families | 127 (6.2%) | $99,705 |
| 7+ Person Families | 0 (0.0%) | $0 |
| Total | 2,044 (100.0%) | $119,543 |
Family Income by Number of Earners in West Dundee
The median family income in West Dundee is $119,543, with families comprising 3+ earners (275) having the highest median family income of $187,458, while families with no earners (203) have the lowest median family income of $58,456, accounting for 13.5% and 9.9% of families, respectively.
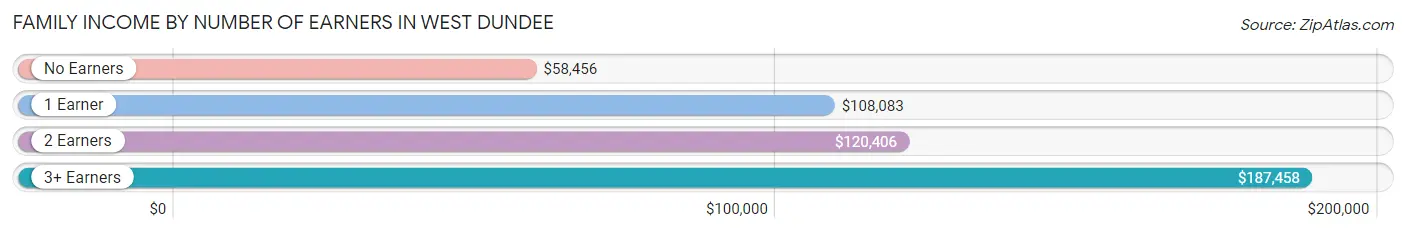
| Number of Earners | # Families | Median Income |
| No Earners | 203 (9.9%) | $58,456 |
| 1 Earner | 625 (30.6%) | $108,083 |
| 2 Earners | 941 (46.0%) | $120,406 |
| 3+ Earners | 275 (13.5%) | $187,458 |
| Total | 2,044 (100.0%) | $119,543 |
Household Income in West Dundee
Household Income Brackets in West Dundee
With 798 households falling in the category, the $100,000 to $149,999 income range is the most frequent in West Dundee, accounting for 25.4% of all households. In contrast, only 16 households (0.5%) fall into the less than $10,000 income bracket, making it the least populous group.
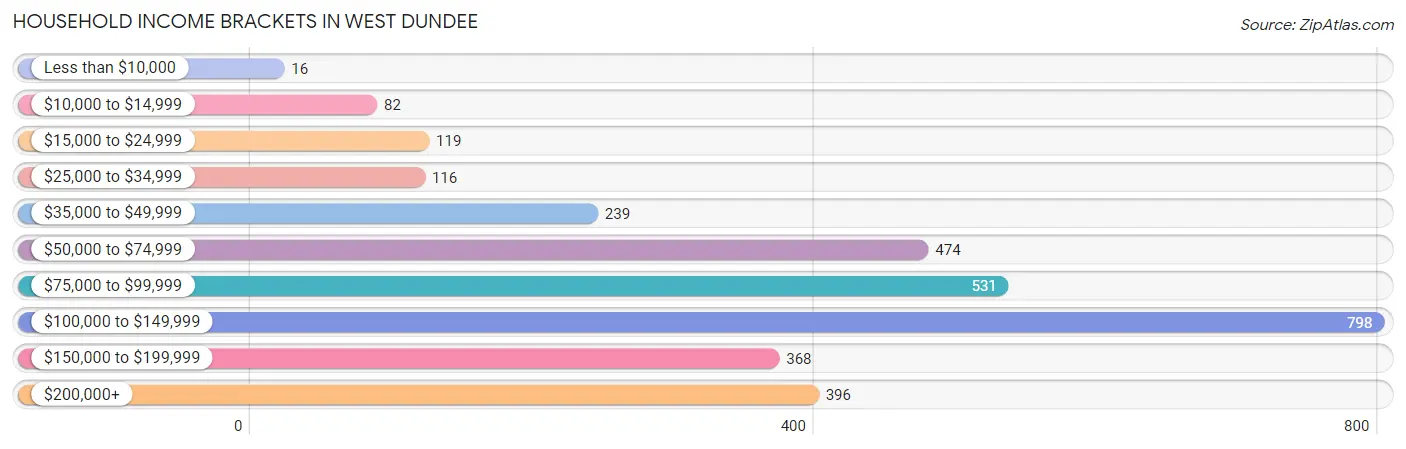
| Income Bracket | # Households | % Households |
| Less than $10,000 | 16 | 0.5% |
| $10,000 to $14,999 | 82 | 2.6% |
| $15,000 to $24,999 | 119 | 3.8% |
| $25,000 to $34,999 | 116 | 3.7% |
| $35,000 to $49,999 | 239 | 7.6% |
| $50,000 to $74,999 | 474 | 15.1% |
| $75,000 to $99,999 | 531 | 16.9% |
| $100,000 to $149,999 | 798 | 25.4% |
| $150,000 to $199,999 | 368 | 11.7% |
| $200,000+ | 396 | 12.6% |
Household Income by Householder Age in West Dundee
The median household income in West Dundee is $99,653, with the highest median household income of $119,080 found in the 45 to 64 years age bracket for the primary householder. A total of 1,305 households (41.5%) fall into this category. Meanwhile, the 15 to 24 years age bracket for the primary householder has the lowest median household income of $37,093, with 132 households (4.2%) in this group.
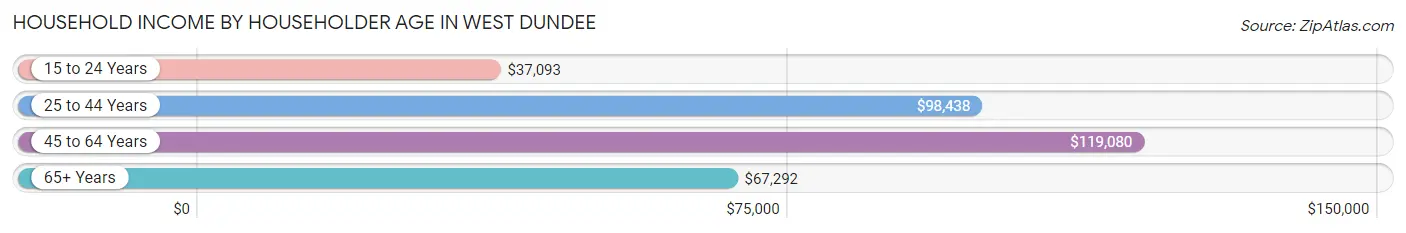
| Income Bracket | # Households | Median Income |
| 15 to 24 Years | 132 (4.2%) | $37,093 |
| 25 to 44 Years | 1,168 (37.2%) | $98,438 |
| 45 to 64 Years | 1,305 (41.5%) | $119,080 |
| 65+ Years | 537 (17.1%) | $67,292 |
| Total | 3,142 (100.0%) | $99,653 |
Poverty in West Dundee
Income Below Poverty by Sex and Age in West Dundee
With 3.7% poverty level for males and 6.3% for females among the residents of West Dundee, 12 to 14 year old males and 18 to 24 year old females are the most vulnerable to poverty, with 25 males (13.5%) and 60 females (22.8%) in their respective age groups living below the poverty level.
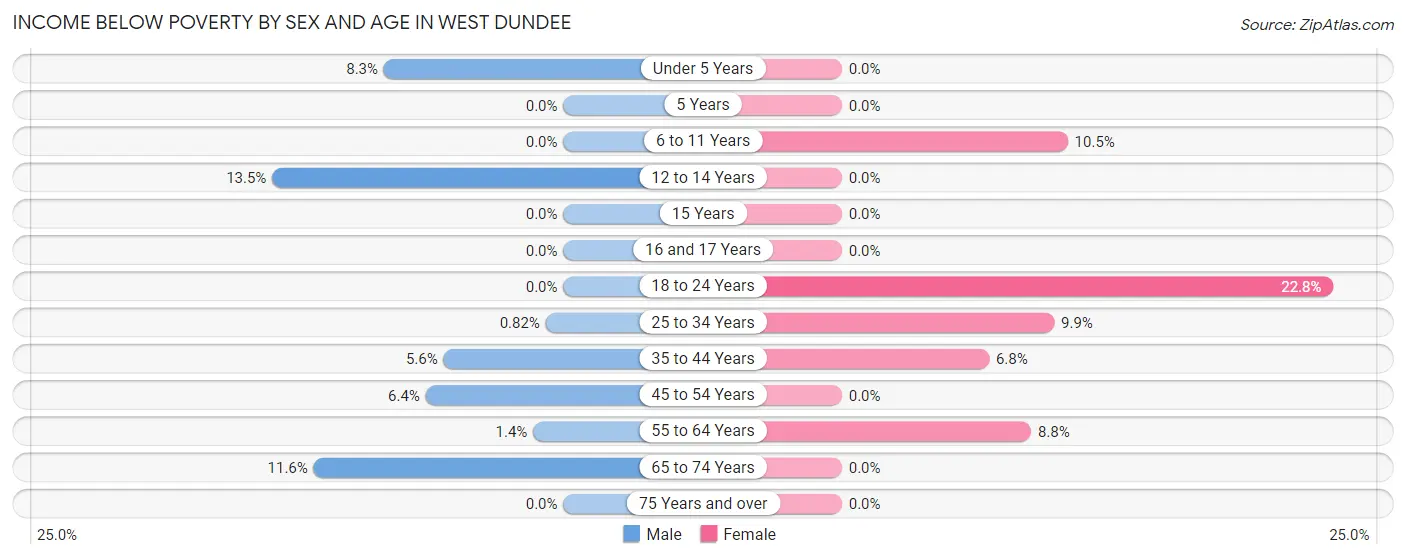
| Age Bracket | Male | Female |
| Under 5 Years | 25 (8.3%) | 0 (0.0%) |
| 5 Years | 0 (0.0%) | 0 (0.0%) |
| 6 to 11 Years | 0 (0.0%) | 26 (10.5%) |
| 12 to 14 Years | 25 (13.5%) | 0 (0.0%) |
| 15 Years | 0 (0.0%) | 0 (0.0%) |
| 16 and 17 Years | 0 (0.0%) | 0 (0.0%) |
| 18 to 24 Years | 0 (0.0%) | 60 (22.8%) |
| 25 to 34 Years | 6 (0.8%) | 81 (9.9%) |
| 35 to 44 Years | 24 (5.6%) | 22 (6.8%) |
| 45 to 54 Years | 40 (6.4%) | 0 (0.0%) |
| 55 to 64 Years | 6 (1.4%) | 43 (8.8%) |
| 65 to 74 Years | 27 (11.6%) | 0 (0.0%) |
| 75 Years and over | 0 (0.0%) | 0 (0.0%) |
| Total | 153 (3.7%) | 232 (6.3%) |
Income Above Poverty by Sex and Age in West Dundee
According to the poverty statistics in West Dundee, males aged 5 years and females aged under 5 years are the age groups that are most secure financially, with 100.0% of males and 100.0% of females in these age groups living above the poverty line.
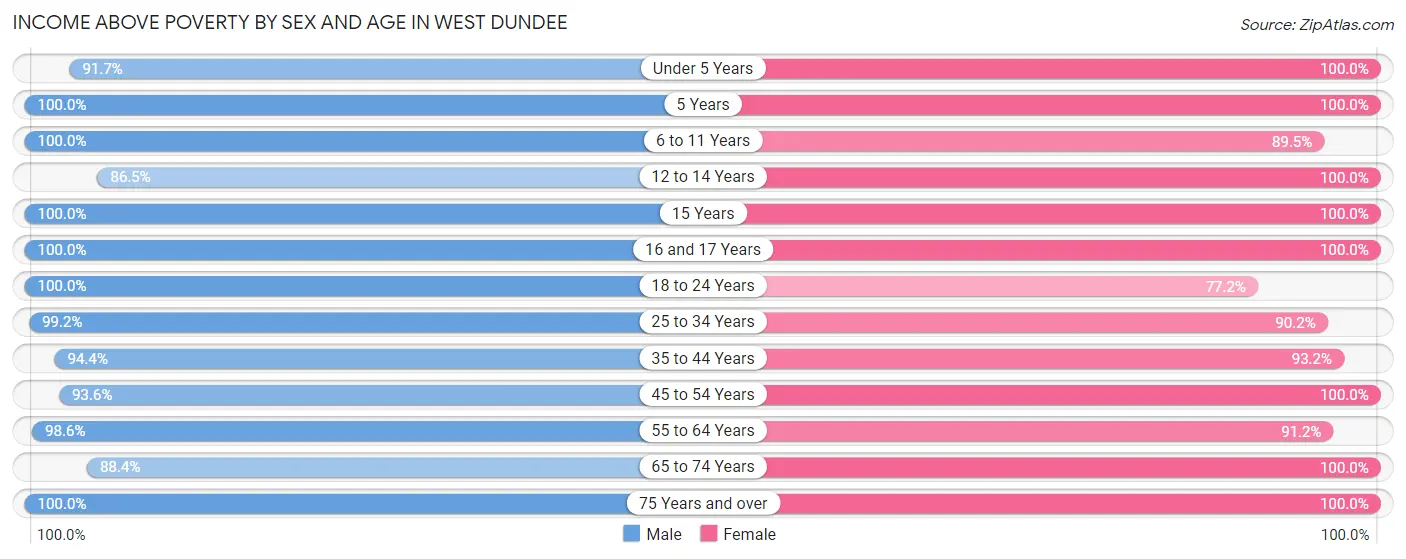
| Age Bracket | Male | Female |
| Under 5 Years | 275 (91.7%) | 187 (100.0%) |
| 5 Years | 43 (100.0%) | 47 (100.0%) |
| 6 to 11 Years | 208 (100.0%) | 222 (89.5%) |
| 12 to 14 Years | 160 (86.5%) | 127 (100.0%) |
| 15 Years | 101 (100.0%) | 17 (100.0%) |
| 16 and 17 Years | 107 (100.0%) | 62 (100.0%) |
| 18 to 24 Years | 520 (100.0%) | 203 (77.2%) |
| 25 to 34 Years | 723 (99.2%) | 741 (90.1%) |
| 35 to 44 Years | 408 (94.4%) | 300 (93.2%) |
| 45 to 54 Years | 586 (93.6%) | 705 (100.0%) |
| 55 to 64 Years | 423 (98.6%) | 447 (91.2%) |
| 65 to 74 Years | 206 (88.4%) | 279 (100.0%) |
| 75 Years and over | 214 (100.0%) | 135 (100.0%) |
| Total | 3,974 (96.3%) | 3,472 (93.7%) |
Income Below Poverty Among Married-Couple Families in West Dundee
The poverty statistics for married-couple families in West Dundee show that 0.8% or 12 of the total 1,500 families live below the poverty line. Families with no children have the highest poverty rate of 1.5%, comprising of 12 families. On the other hand, families with 1 or 2 children have the lowest poverty rate of 0.0%, which includes 0 families.
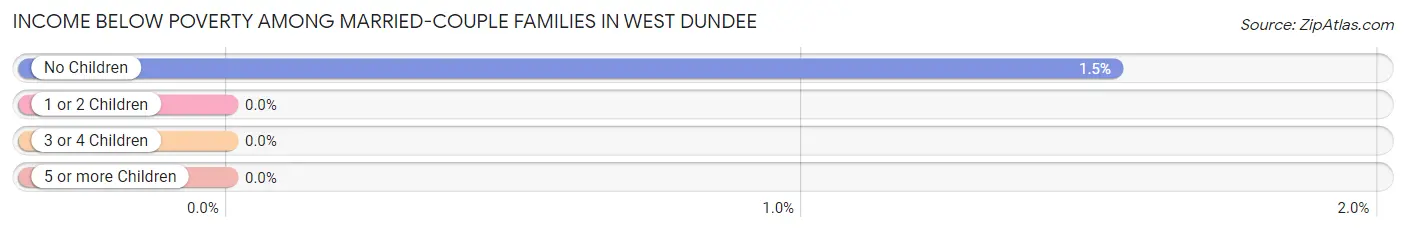
| Children | Above Poverty | Below Poverty |
| No Children | 767 (98.5%) | 12 (1.5%) |
| 1 or 2 Children | 530 (100.0%) | 0 (0.0%) |
| 3 or 4 Children | 191 (100.0%) | 0 (0.0%) |
| 5 or more Children | 0 (0.0%) | 0 (0.0%) |
| Total | 1,488 (99.2%) | 12 (0.8%) |
Income Below Poverty Among Single-Parent Households in West Dundee
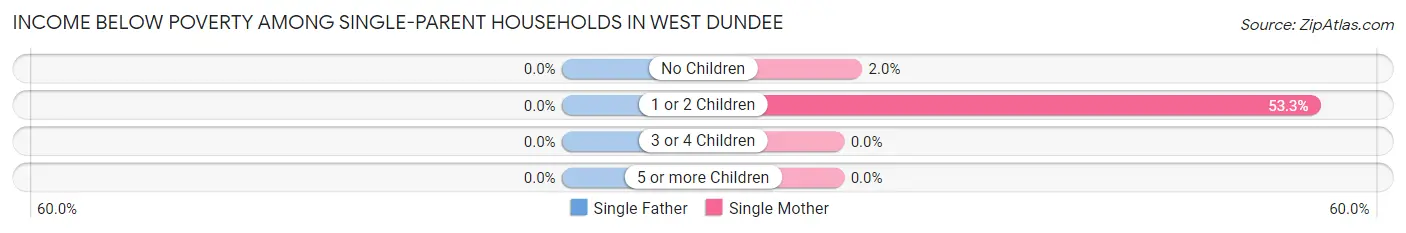
| Children | Single Father | Single Mother |
| No Children | 0 (0.0%) | 6 (2.0%) |
| 1 or 2 Children | 0 (0.0%) | 49 (53.3%) |
| 3 or 4 Children | 0 (0.0%) | 0 (0.0%) |
| 5 or more Children | 0 (0.0%) | 0 (0.0%) |
| Total | 0 (0.0%) | 55 (14.1%) |
Income Below Poverty Among Married-Couple vs Single-Parent Households in West Dundee
The poverty data for West Dundee shows that 12 of the married-couple family households (0.8%) and 55 of the single-parent households (10.1%) are living below the poverty level. Within the married-couple family households, those with no children have the highest poverty rate, with 12 households (1.5%) falling below the poverty line. Among the single-parent households, those with 1 or 2 children have the highest poverty rate, with 49 household (34.5%) living below poverty.
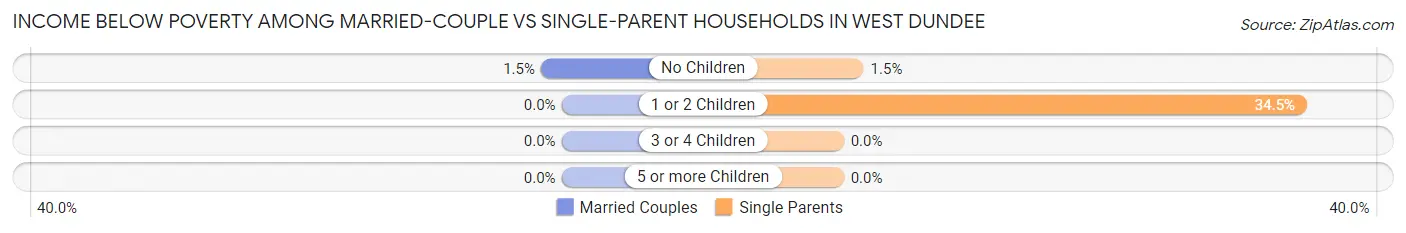
| Children | Married-Couple Families | Single-Parent Households |
| No Children | 12 (1.5%) | 6 (1.5%) |
| 1 or 2 Children | 0 (0.0%) | 49 (34.5%) |
| 3 or 4 Children | 0 (0.0%) | 0 (0.0%) |
| 5 or more Children | 0 (0.0%) | 0 (0.0%) |
| Total | 12 (0.8%) | 55 (10.1%) |
Race in West Dundee
The most populous races in West Dundee are White / Caucasian (6,464 | 82.4%), Hispanic or Latino (781 | 10.0%), and Asian (577 | 7.4%).
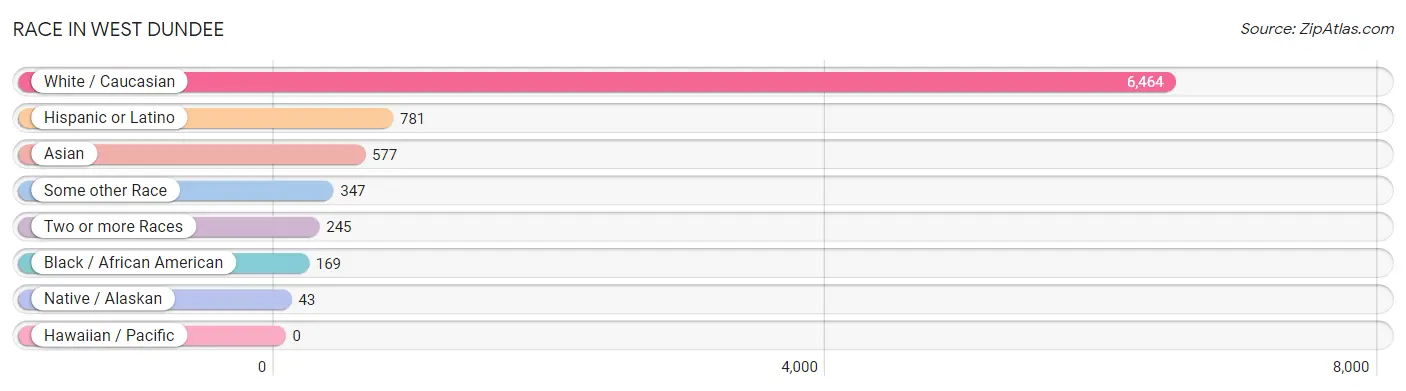
| Race | # Population | % Population |
| Asian | 577 | 7.4% |
| Black / African American | 169 | 2.1% |
| Hawaiian / Pacific | 0 | 0.0% |
| Hispanic or Latino | 781 | 10.0% |
| Native / Alaskan | 43 | 0.5% |
| White / Caucasian | 6,464 | 82.4% |
| Two or more Races | 245 | 3.1% |
| Some other Race | 347 | 4.4% |
| Total | 7,845 | 100.0% |
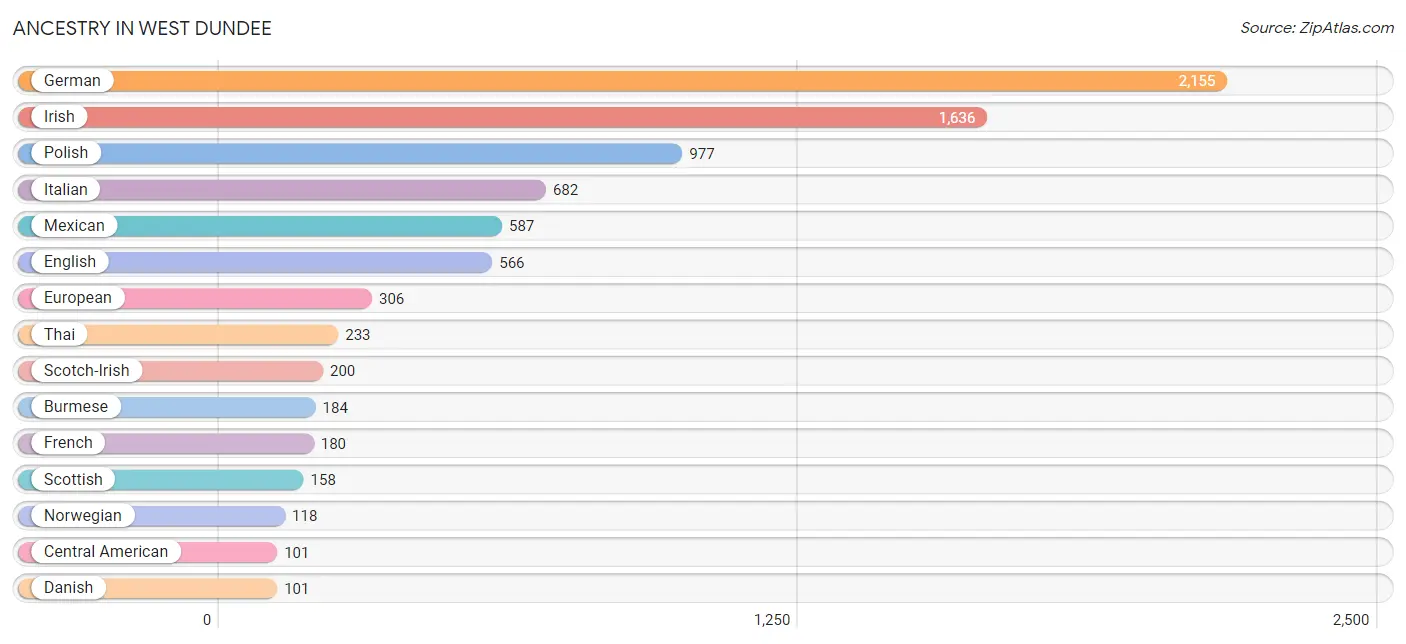
Ancestry in West Dundee
The most populous ancestries reported in West Dundee are German (2,155 | 27.5%), Irish (1,636 | 20.8%), Polish (977 | 12.4%), Italian (682 | 8.7%), and Mexican (587 | 7.5%), together accounting for 76.9% of all West Dundee residents.
| Ancestry | # Population | % Population |
| American | 72 | 0.9% |
| Arab | 13 | 0.2% |
| Austrian | 31 | 0.4% |
| Belgian | 48 | 0.6% |
| Bhutanese | 15 | 0.2% |
| British | 57 | 0.7% |
| Burmese | 184 | 2.4% |
| Canadian | 37 | 0.5% |
| Central American | 101 | 1.3% |
| Colombian | 6 | 0.1% |
| Czech | 35 | 0.4% |
| Czechoslovakian | 29 | 0.4% |
| Danish | 101 | 1.3% |
| Dutch | 54 | 0.7% |
| Eastern European | 38 | 0.5% |
| English | 566 | 7.2% |
| European | 306 | 3.9% |
| Filipino | 25 | 0.3% |
| Finnish | 26 | 0.3% |
| French | 180 | 2.3% |
| French Canadian | 97 | 1.2% |
| German | 2,155 | 27.5% |
| Greek | 71 | 0.9% |
| Guatemalan | 16 | 0.2% |
| Hungarian | 23 | 0.3% |
| Irish | 1,636 | 20.8% |
| Italian | 682 | 8.7% |
| Korean | 81 | 1.0% |
| Lebanese | 13 | 0.2% |
| Lithuanian | 8 | 0.1% |
| Luxembourger | 72 | 0.9% |
| Mexican | 587 | 7.5% |
| Nicaraguan | 13 | 0.2% |
| Norwegian | 118 | 1.5% |
| Pakistani | 71 | 0.9% |
| Pennsylvania German | 7 | 0.1% |
| Polish | 977 | 12.4% |
| Portuguese | 14 | 0.2% |
| Puerto Rican | 76 | 1.0% |
| Russian | 25 | 0.3% |
| Salvadoran | 72 | 0.9% |
| Scotch-Irish | 200 | 2.5% |
| Scottish | 158 | 2.0% |
| South American | 6 | 0.1% |
| Spanish | 11 | 0.1% |
| Swedish | 66 | 0.8% |
| Thai | 233 | 3.0% |
| Ukrainian | 32 | 0.4% |
| Yugoslavian | 12 | 0.2% | View All 49 Rows |
Immigrants in West Dundee
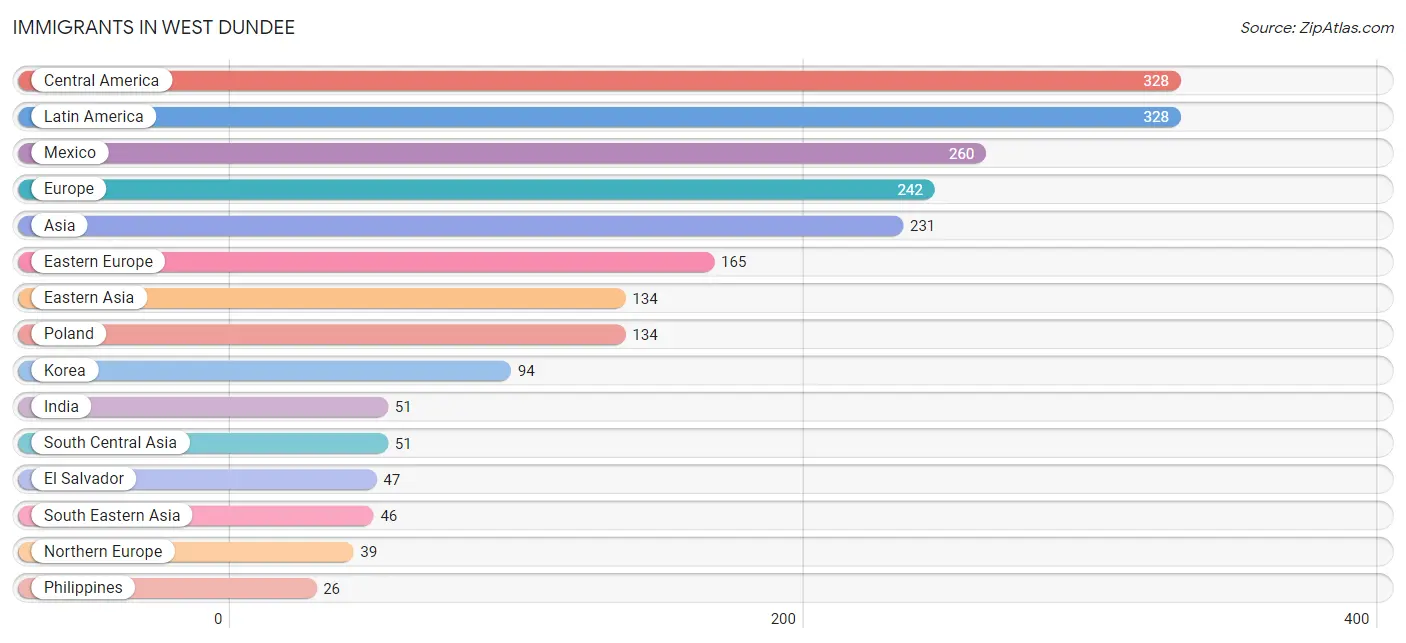
The most numerous immigrant groups reported in West Dundee came from Central America (328 | 4.2%), Latin America (328 | 4.2%), Mexico (260 | 3.3%), Europe (242 | 3.1%), and Asia (231 | 2.9%), together accounting for 17.7% of all West Dundee residents.
| Immigration Origin | # Population | % Population |
| Asia | 231 | 2.9% |
| Austria | 10 | 0.1% |
| Canada | 17 | 0.2% |
| Central America | 328 | 4.2% |
| China | 25 | 0.3% |
| Eastern Asia | 134 | 1.7% |
| Eastern Europe | 165 | 2.1% |
| El Salvador | 47 | 0.6% |
| England | 6 | 0.1% |
| Europe | 242 | 3.1% |
| Germany | 7 | 0.1% |
| Guatemala | 8 | 0.1% |
| India | 51 | 0.6% |
| Ireland | 17 | 0.2% |
| Italy | 10 | 0.1% |
| Japan | 15 | 0.2% |
| Korea | 94 | 1.2% |
| Latin America | 328 | 4.2% |
| Lithuania | 8 | 0.1% |
| Mexico | 260 | 3.3% |
| Nicaragua | 13 | 0.2% |
| Northern Europe | 39 | 0.5% |
| Philippines | 26 | 0.3% |
| Poland | 134 | 1.7% |
| Russia | 14 | 0.2% |
| South Central Asia | 51 | 0.6% |
| South Eastern Asia | 46 | 0.6% |
| Southern Europe | 21 | 0.3% |
| Spain | 11 | 0.1% |
| Taiwan | 25 | 0.3% |
| Thailand | 20 | 0.3% |
| Western Europe | 17 | 0.2% | View All 32 Rows |
Sex and Age in West Dundee
Sex and Age in West Dundee
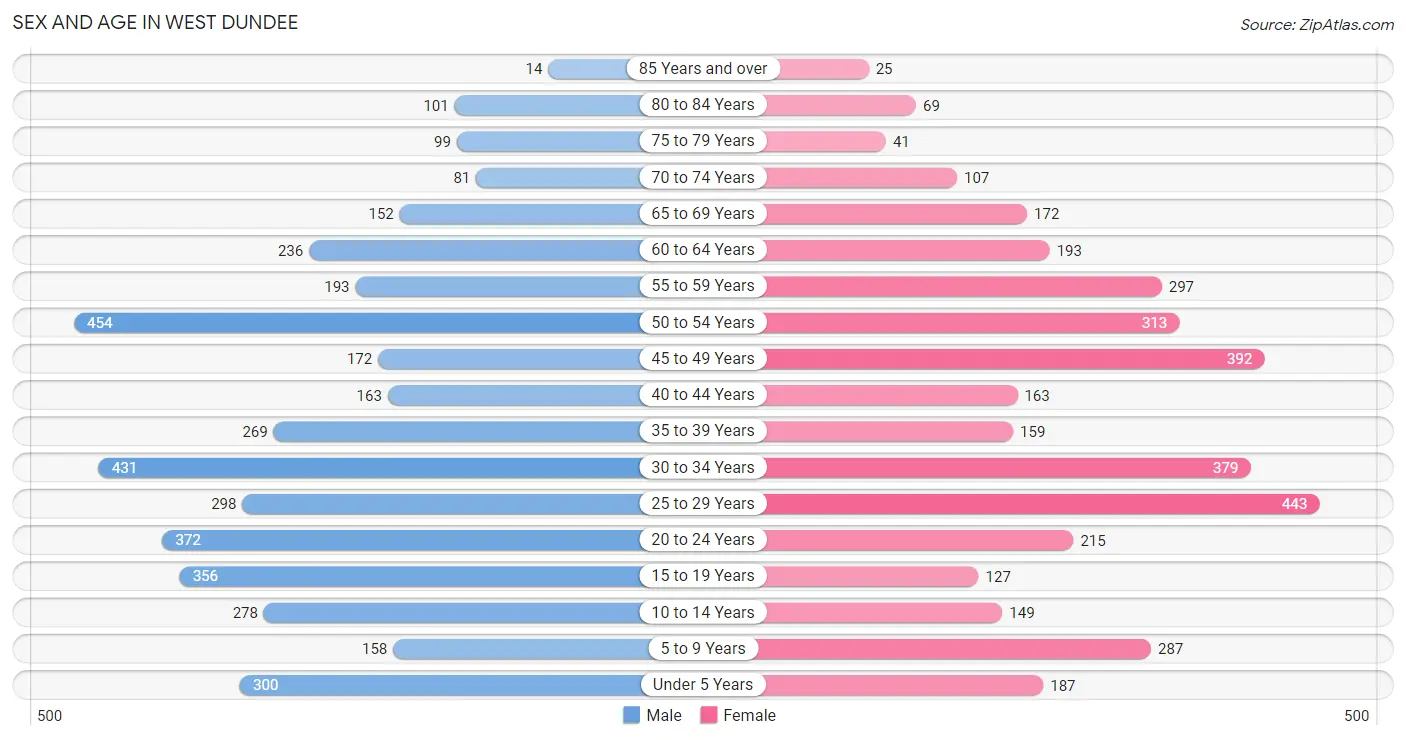
The most populous age groups in West Dundee are 50 to 54 Years (454 | 11.0%) for men and 25 to 29 Years (443 | 11.9%) for women.
| Age Bracket | Male | Female |
| Under 5 Years | 300 (7.3%) | 187 (5.0%) |
| 5 to 9 Years | 158 (3.8%) | 287 (7.7%) |
| 10 to 14 Years | 278 (6.7%) | 149 (4.0%) |
| 15 to 19 Years | 356 (8.6%) | 127 (3.4%) |
| 20 to 24 Years | 372 (9.0%) | 215 (5.8%) |
| 25 to 29 Years | 298 (7.2%) | 443 (11.9%) |
| 30 to 34 Years | 431 (10.4%) | 379 (10.2%) |
| 35 to 39 Years | 269 (6.5%) | 159 (4.3%) |
| 40 to 44 Years | 163 (4.0%) | 163 (4.4%) |
| 45 to 49 Years | 172 (4.2%) | 392 (10.5%) |
| 50 to 54 Years | 454 (11.0%) | 313 (8.4%) |
| 55 to 59 Years | 193 (4.7%) | 297 (8.0%) |
| 60 to 64 Years | 236 (5.7%) | 193 (5.2%) |
| 65 to 69 Years | 152 (3.7%) | 172 (4.6%) |
| 70 to 74 Years | 81 (2.0%) | 107 (2.9%) |
| 75 to 79 Years | 99 (2.4%) | 41 (1.1%) |
| 80 to 84 Years | 101 (2.5%) | 69 (1.9%) |
| 85 Years and over | 14 (0.3%) | 25 (0.7%) |
| Total | 4,127 (100.0%) | 3,718 (100.0%) |
Families and Households in West Dundee
Median Family Size in West Dundee
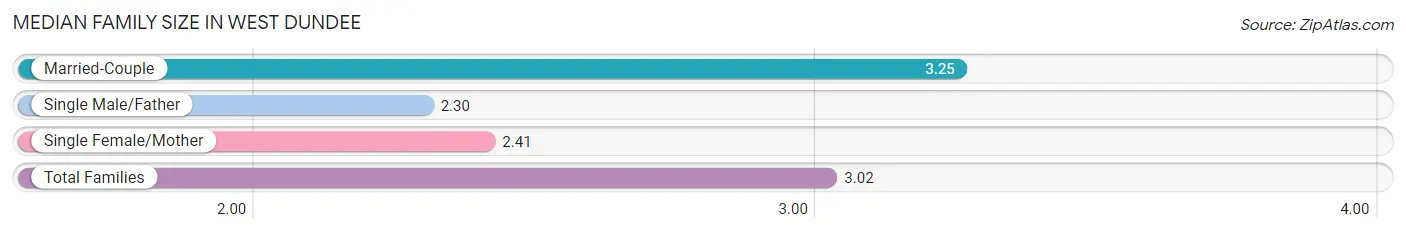
The median family size in West Dundee is 3.02 persons per family, with married-couple families (1,500 | 73.4%) accounting for the largest median family size of 3.25 persons per family. On the other hand, single male/father families (154 | 7.5%) represent the smallest median family size with 2.30 persons per family.
| Family Type | # Families | Family Size |
| Married-Couple | 1,500 (73.4%) | 3.25 |
| Single Male/Father | 154 (7.5%) | 2.30 |
| Single Female/Mother | 390 (19.1%) | 2.41 |
| Total Families | 2,044 (100.0%) | 3.02 |
Median Household Size in West Dundee
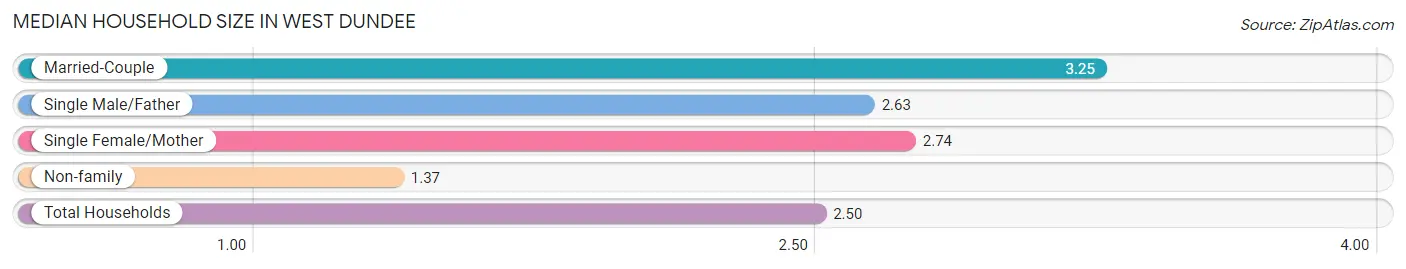
The median household size in West Dundee is 2.50 persons per household, with married-couple households (1,500 | 47.7%) accounting for the largest median household size of 3.25 persons per household. non-family households (1,098 | 34.9%) represent the smallest median household size with 1.37 persons per household.
| Household Type | # Households | Household Size |
| Married-Couple | 1,500 (47.7%) | 3.25 |
| Single Male/Father | 154 (4.9%) | 2.63 |
| Single Female/Mother | 390 (12.4%) | 2.74 |
| Non-family | 1,098 (34.9%) | 1.37 |
| Total Households | 3,142 (100.0%) | 2.50 |
Household Size by Marriage Status in West Dundee
Out of a total of 3,142 households in West Dundee, 2,044 (65.0%) are family households, while 1,098 (34.9%) are nonfamily households. The most numerous type of family households are 2-person households, comprising 913, and the most common type of nonfamily households are 1-person households, comprising 725.
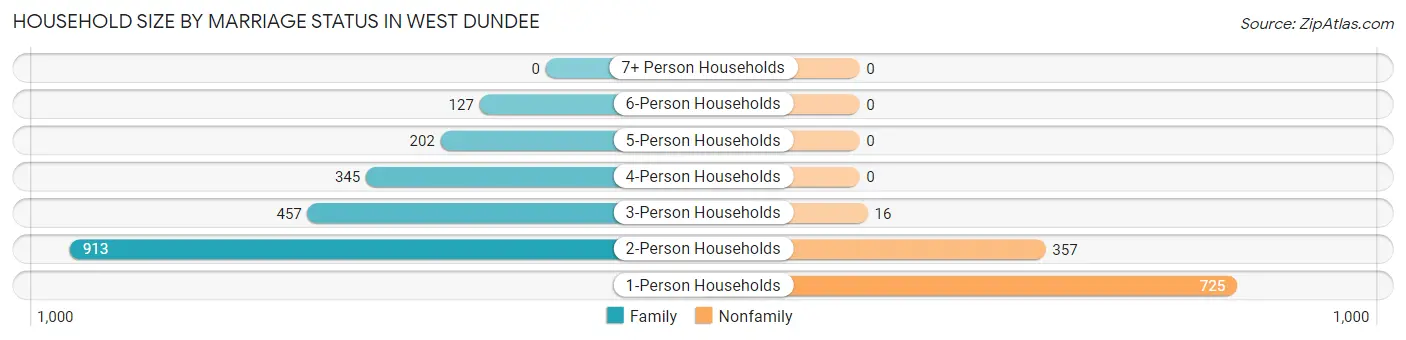
| Household Size | Family Households | Nonfamily Households |
| 1-Person Households | - | 725 (23.1%) |
| 2-Person Households | 913 (29.1%) | 357 (11.4%) |
| 3-Person Households | 457 (14.5%) | 16 (0.5%) |
| 4-Person Households | 345 (11.0%) | 0 (0.0%) |
| 5-Person Households | 202 (6.4%) | 0 (0.0%) |
| 6-Person Households | 127 (4.0%) | 0 (0.0%) |
| 7+ Person Households | 0 (0.0%) | 0 (0.0%) |
| Total | 2,044 (65.0%) | 1,098 (34.9%) |
Female Fertility in West Dundee
Fertility by Age in West Dundee
Average fertility rate in West Dundee is 21.0 births per 1,000 women. Women in the age bracket of 20 to 34 years have the highest fertility rate with 34.0 births per 1,000 women. Women in the age bracket of 20 to 34 years acount for 81.4% of all women with births.
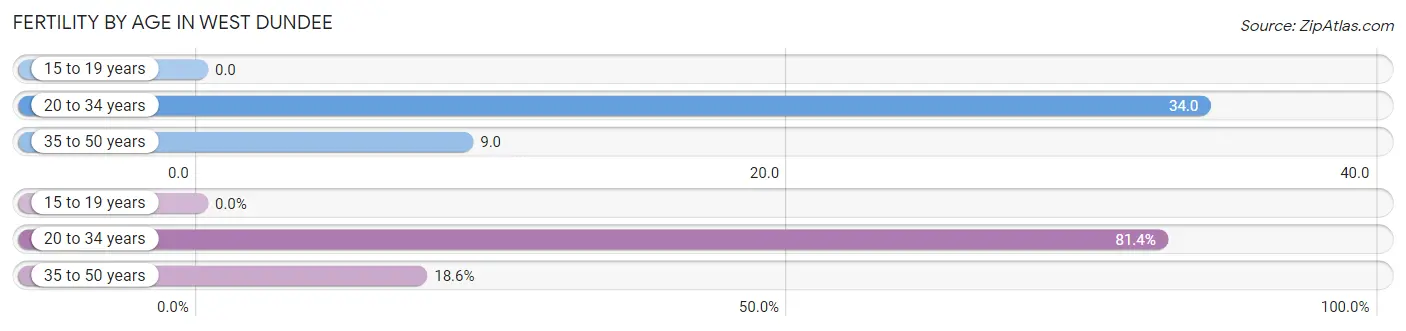
| Age Bracket | Women with Births | Births / 1,000 Women |
| 15 to 19 years | 0 (0.0%) | 0.0 |
| 20 to 34 years | 35 (81.4%) | 34.0 |
| 35 to 50 years | 8 (18.6%) | 9.0 |
| Total | 43 (100.0%) | 21.0 |
Fertility by Age by Marriage Status in West Dundee
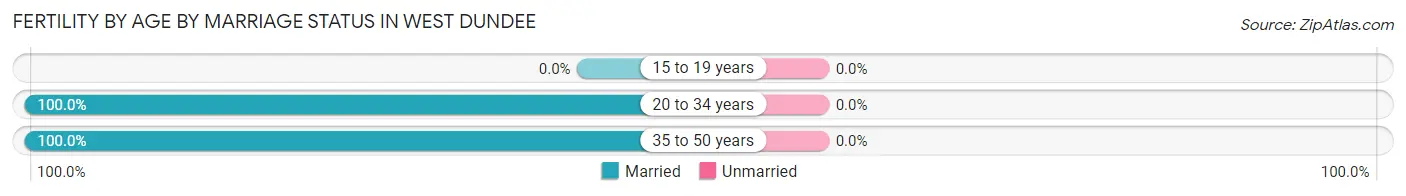
| Age Bracket | Married | Unmarried |
| 15 to 19 years | 0 (0.0%) | 0 (0.0%) |
| 20 to 34 years | 35 (100.0%) | 0 (0.0%) |
| 35 to 50 years | 8 (100.0%) | 0 (0.0%) |
| Total | 43 (100.0%) | 0 (0.0%) |
Fertility by Education in West Dundee
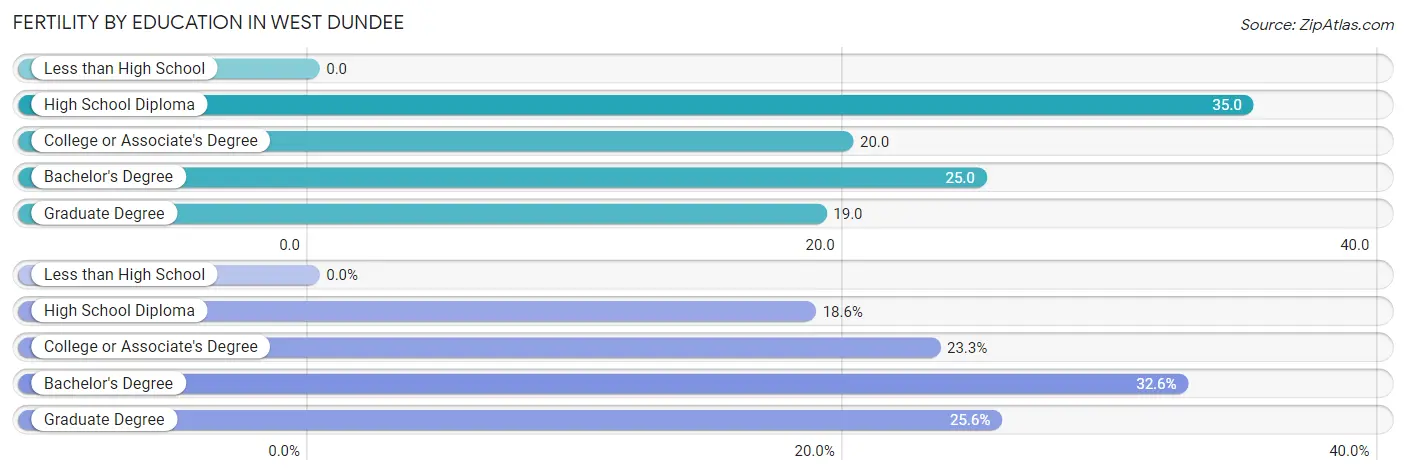
| Educational Attainment | Women with Births | Births / 1,000 Women |
| Less than High School | 0 (0.0%) | 0.0 |
| High School Diploma | 8 (18.6%) | 35.0 |
| College or Associate's Degree | 10 (23.3%) | 20.0 |
| Bachelor's Degree | 14 (32.6%) | 25.0 |
| Graduate Degree | 11 (25.6%) | 19.0 |
| Total | 43 (100.0%) | 21.0 |
Fertility by Education by Marriage Status in West Dundee
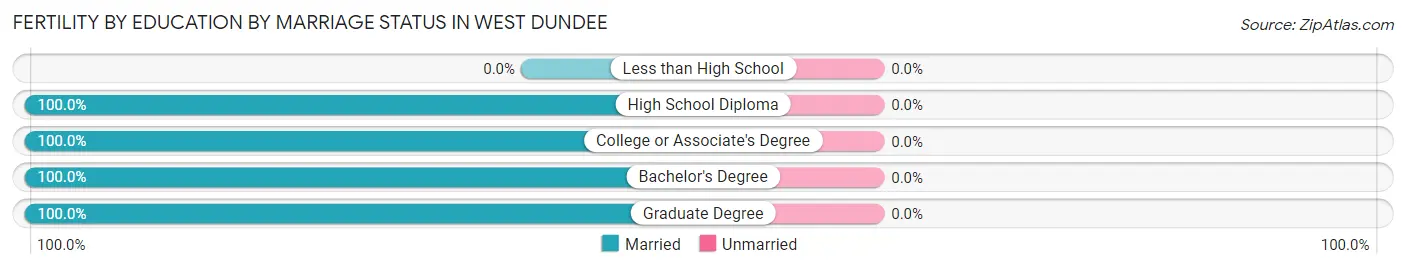
| Educational Attainment | Married | Unmarried |
| Less than High School | 0 (0.0%) | 0 (0.0%) |
| High School Diploma | 8 (100.0%) | 0 (0.0%) |
| College or Associate's Degree | 10 (100.0%) | 0 (0.0%) |
| Bachelor's Degree | 14 (100.0%) | 0 (0.0%) |
| Graduate Degree | 11 (100.0%) | 0 (0.0%) |
| Total | 43 (100.0%) | 0 (0.0%) |
Employment Characteristics in West Dundee
Employment by Class of Employer in West Dundee
Among the 4,586 employed individuals in West Dundee, private company employees (3,205 | 69.9%), local government employees (645 | 14.1%), and not-for-profit organizations (313 | 6.8%) make up the most common classes of employment.
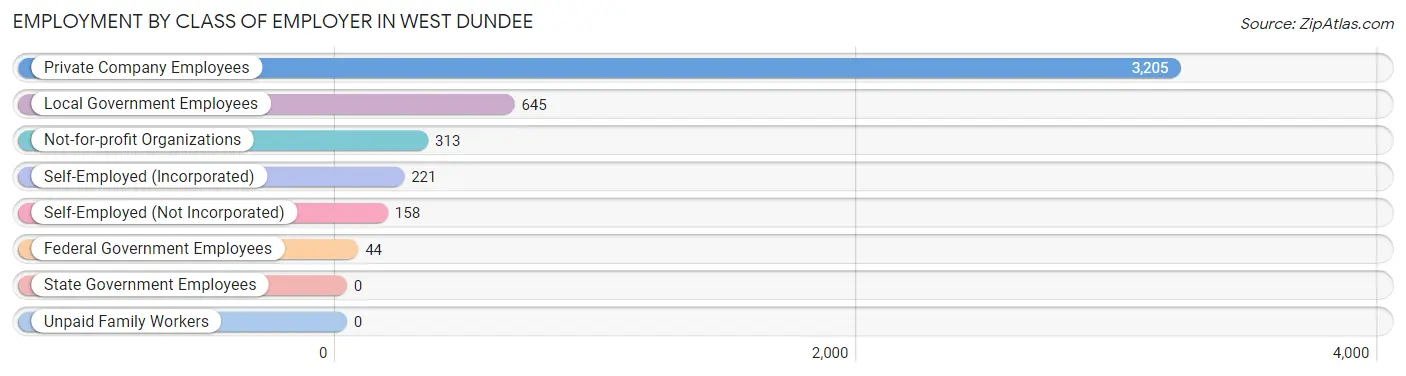
| Employer Class | # Employees | % Employees |
| Private Company Employees | 3,205 | 69.9% |
| Self-Employed (Incorporated) | 221 | 4.8% |
| Self-Employed (Not Incorporated) | 158 | 3.5% |
| Not-for-profit Organizations | 313 | 6.8% |
| Local Government Employees | 645 | 14.1% |
| State Government Employees | 0 | 0.0% |
| Federal Government Employees | 44 | 1.0% |
| Unpaid Family Workers | 0 | 0.0% |
| Total | 4,586 | 100.0% |
Employment Status by Age in West Dundee
According to the labor force statistics for West Dundee, out of the total population over 16 years of age (6,368), 75.8% or 4,827 individuals are in the labor force, with 4.3% or 208 of them unemployed. The age group with the highest labor force participation rate is 45 to 54 years, with 91.2% or 1,214 individuals in the labor force. Within the labor force, the 65 to 74 years age range has the highest percentage of unemployed individuals, with 9.1% or 15 of them being unemployed.
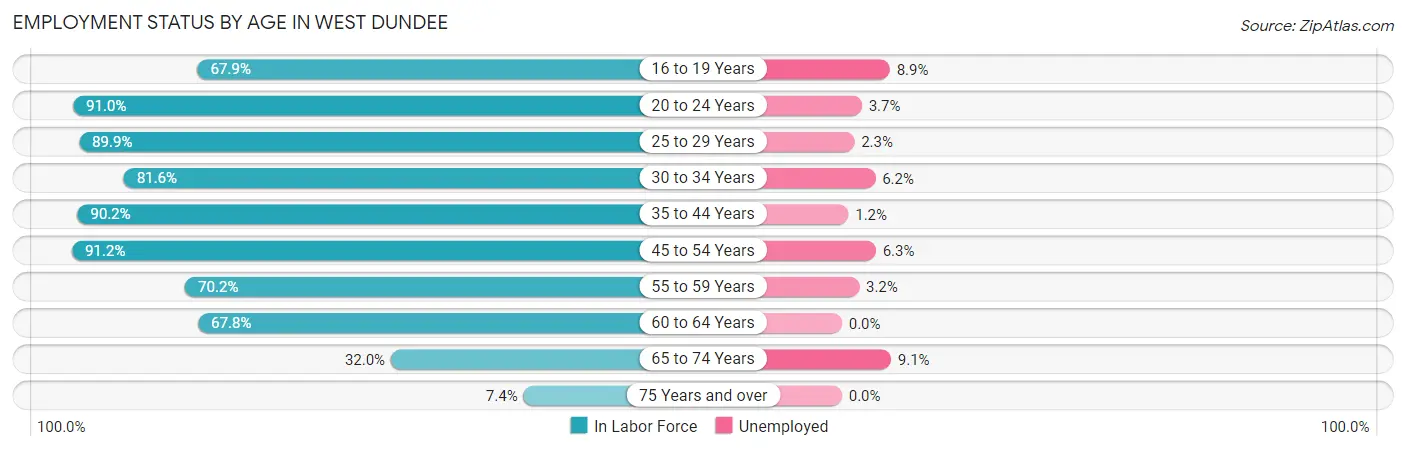
| Age Bracket | In Labor Force | Unemployed |
| 16 to 19 Years | 248 (67.9%) | 22 (8.9%) |
| 20 to 24 Years | 534 (91.0%) | 20 (3.7%) |
| 25 to 29 Years | 666 (89.9%) | 15 (2.3%) |
| 30 to 34 Years | 661 (81.6%) | 41 (6.2%) |
| 35 to 44 Years | 680 (90.2%) | 8 (1.2%) |
| 45 to 54 Years | 1,214 (91.2%) | 76 (6.3%) |
| 55 to 59 Years | 344 (70.2%) | 11 (3.2%) |
| 60 to 64 Years | 291 (67.8%) | 0 (0.0%) |
| 65 to 74 Years | 164 (32.0%) | 15 (9.1%) |
| 75 Years and over | 26 (7.4%) | 0 (0.0%) |
| Total | 4,827 (75.8%) | 208 (4.3%) |
Employment Status by Educational Attainment in West Dundee
According to labor force statistics for West Dundee, 84.7% of individuals (3,858) out of the total population between 25 and 64 years of age (4,555) are in the labor force, with 3.9% or 150 of them being unemployed. The group with the highest labor force participation rate are those with the educational attainment of bachelor's degree or higher, with 87.7% or 2,014 individuals in the labor force. Within the labor force, individuals with high school diploma education have the highest percentage of unemployment, with 9.8% or 51 of them being unemployed.
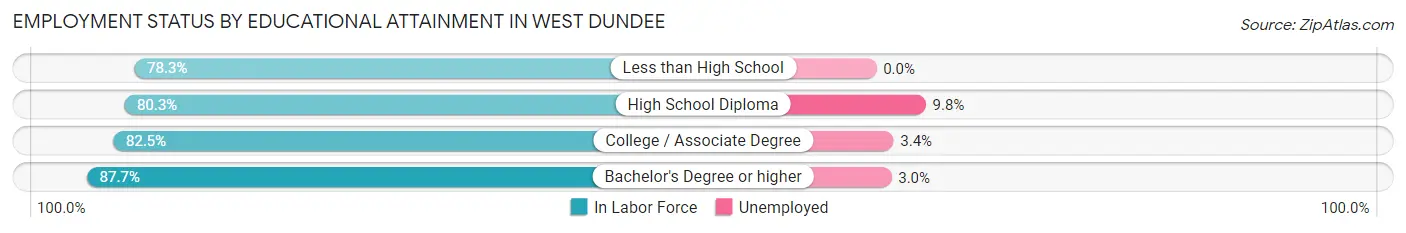
| Educational Attainment | In Labor Force | Unemployed |
| Less than High School | 126 (78.3%) | 0 (0.0%) |
| High School Diploma | 522 (80.3%) | 64 (9.8%) |
| College / Associate Degree | 1,195 (82.5%) | 49 (3.4%) |
| Bachelor's Degree or higher | 2,014 (87.7%) | 69 (3.0%) |
| Total | 3,858 (84.7%) | 178 (3.9%) |
Employment Occupations by Sex in West Dundee
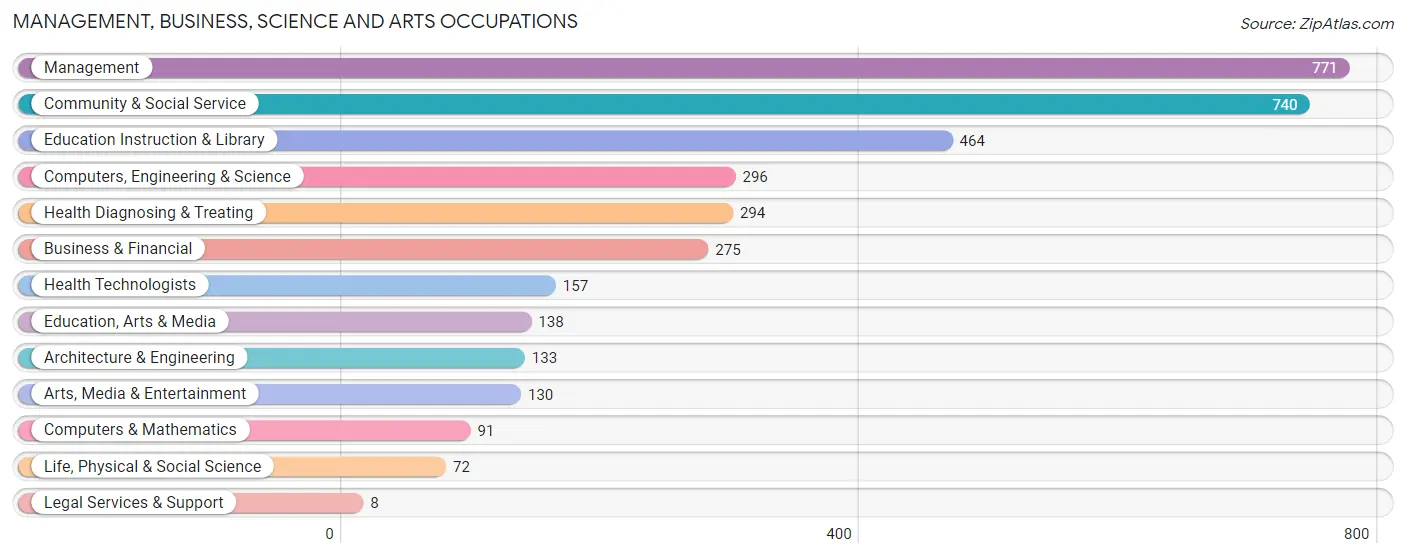
Management, Business, Science and Arts Occupations
The most common Management, Business, Science and Arts occupations in West Dundee are Management (771 | 16.8%), Community & Social Service (740 | 16.1%), Education Instruction & Library (464 | 10.1%), Computers, Engineering & Science (296 | 6.4%), and Health Diagnosing & Treating (294 | 6.4%).
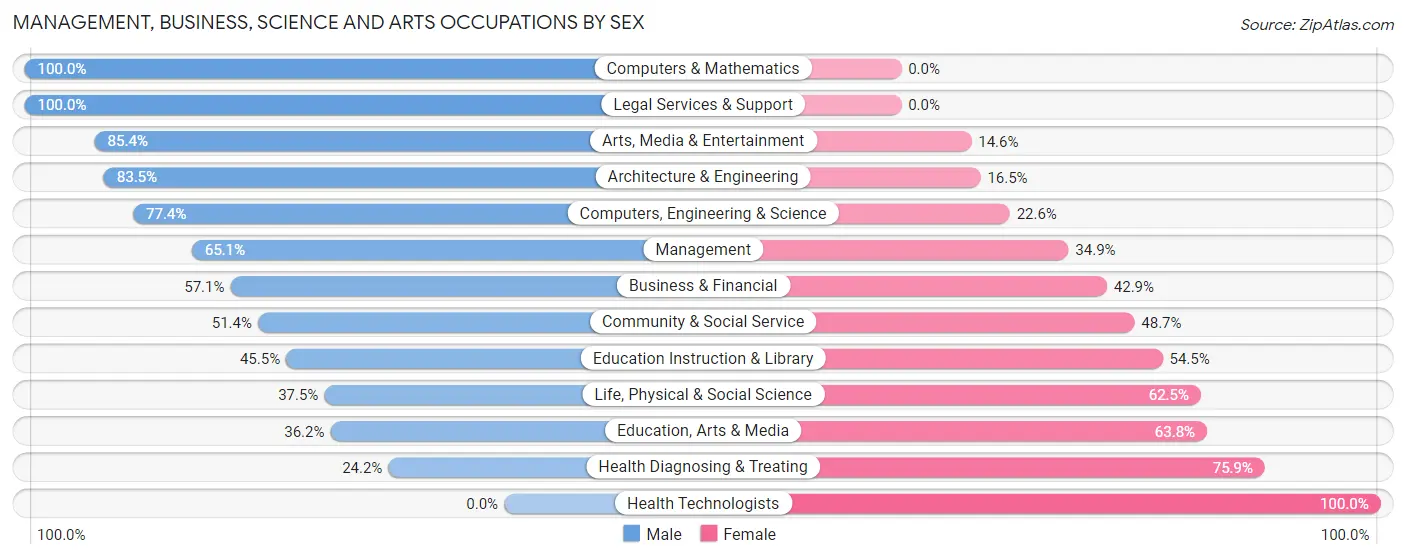
Management, Business, Science and Arts Occupations by Sex
Within the Management, Business, Science and Arts occupations in West Dundee, the most male-oriented occupations are Computers & Mathematics (100.0%), Legal Services & Support (100.0%), and Arts, Media & Entertainment (85.4%), while the most female-oriented occupations are Health Technologists (100.0%), Health Diagnosing & Treating (75.8%), and Education, Arts & Media (63.8%).
| Occupation | Male | Female |
| Management | 502 (65.1%) | 269 (34.9%) |
| Business & Financial | 157 (57.1%) | 118 (42.9%) |
| Computers, Engineering & Science | 229 (77.4%) | 67 (22.6%) |
| Computers & Mathematics | 91 (100.0%) | 0 (0.0%) |
| Architecture & Engineering | 111 (83.5%) | 22 (16.5%) |
| Life, Physical & Social Science | 27 (37.5%) | 45 (62.5%) |
| Community & Social Service | 380 (51.3%) | 360 (48.6%) |
| Education, Arts & Media | 50 (36.2%) | 88 (63.8%) |
| Legal Services & Support | 8 (100.0%) | 0 (0.0%) |
| Education Instruction & Library | 211 (45.5%) | 253 (54.5%) |
| Arts, Media & Entertainment | 111 (85.4%) | 19 (14.6%) |
| Health Diagnosing & Treating | 71 (24.1%) | 223 (75.8%) |
| Health Technologists | 0 (0.0%) | 157 (100.0%) |
| Total (Category) | 1,339 (56.4%) | 1,037 (43.6%) |
| Total (Overall) | 2,488 (54.1%) | 2,110 (45.9%) |
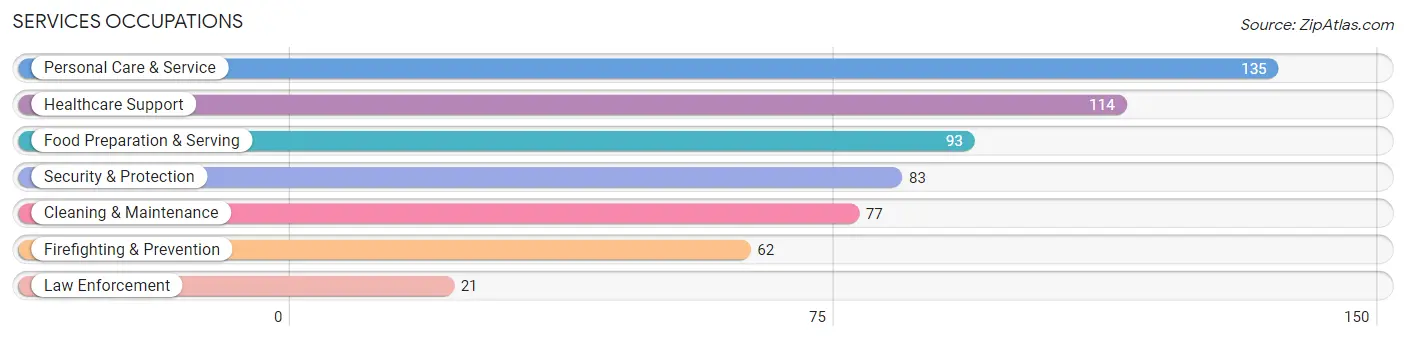
Services Occupations
The most common Services occupations in West Dundee are Personal Care & Service (135 | 2.9%), Healthcare Support (114 | 2.5%), Food Preparation & Serving (93 | 2.0%), Security & Protection (83 | 1.8%), and Cleaning & Maintenance (77 | 1.7%).
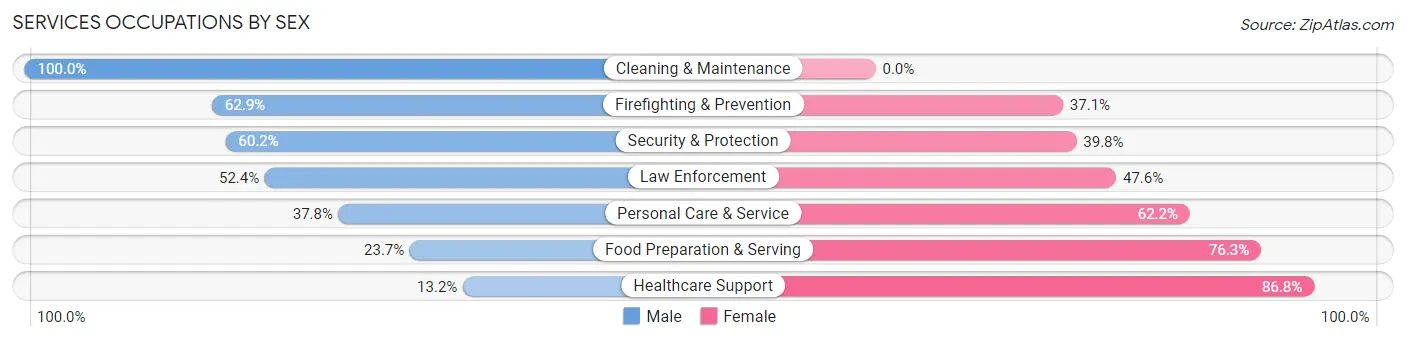
Services Occupations by Sex
Within the Services occupations in West Dundee, the most male-oriented occupations are Cleaning & Maintenance (100.0%), Firefighting & Prevention (62.9%), and Security & Protection (60.2%), while the most female-oriented occupations are Healthcare Support (86.8%), Food Preparation & Serving (76.3%), and Personal Care & Service (62.2%).
| Occupation | Male | Female |
| Healthcare Support | 15 (13.2%) | 99 (86.8%) |
| Security & Protection | 50 (60.2%) | 33 (39.8%) |
| Firefighting & Prevention | 39 (62.9%) | 23 (37.1%) |
| Law Enforcement | 11 (52.4%) | 10 (47.6%) |
| Food Preparation & Serving | 22 (23.7%) | 71 (76.3%) |
| Cleaning & Maintenance | 77 (100.0%) | 0 (0.0%) |
| Personal Care & Service | 51 (37.8%) | 84 (62.2%) |
| Total (Category) | 215 (42.8%) | 287 (57.2%) |
| Total (Overall) | 2,488 (54.1%) | 2,110 (45.9%) |
Sales and Office Occupations
The most common Sales and Office occupations in West Dundee are Sales & Related (582 | 12.7%), and Office & Administration (544 | 11.8%).

Sales and Office Occupations by Sex

| Occupation | Male | Female |
| Sales & Related | 289 (49.7%) | 293 (50.3%) |
| Office & Administration | 99 (18.2%) | 445 (81.8%) |
| Total (Category) | 388 (34.5%) | 738 (65.5%) |
| Total (Overall) | 2,488 (54.1%) | 2,110 (45.9%) |
Natural Resources, Construction and Maintenance Occupations
The most common Natural Resources, Construction and Maintenance occupations in West Dundee are Construction & Extraction (193 | 4.2%), and Installation, Maintenance & Repair (57 | 1.2%).
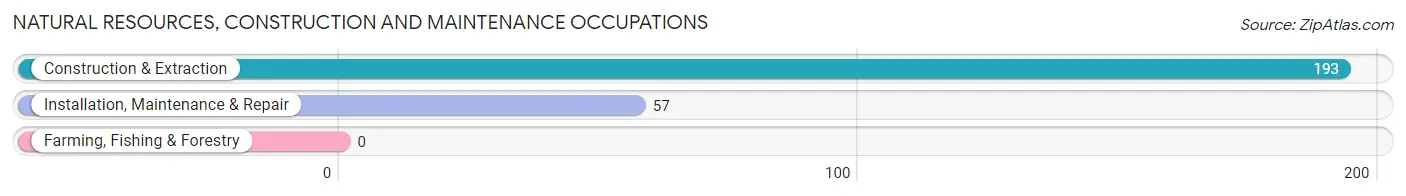
Natural Resources, Construction and Maintenance Occupations by Sex
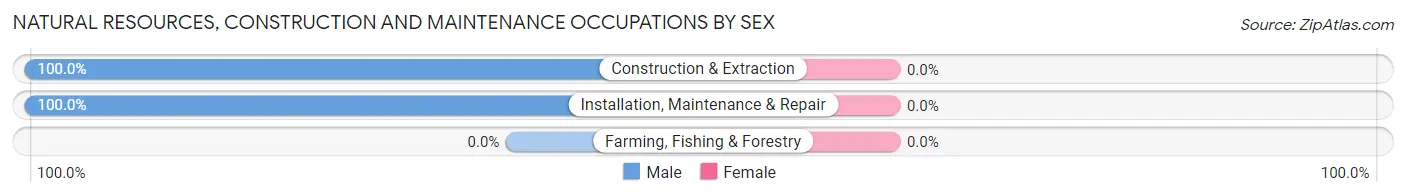
| Occupation | Male | Female |
| Farming, Fishing & Forestry | 0 (0.0%) | 0 (0.0%) |
| Construction & Extraction | 193 (100.0%) | 0 (0.0%) |
| Installation, Maintenance & Repair | 57 (100.0%) | 0 (0.0%) |
| Total (Category) | 250 (100.0%) | 0 (0.0%) |
| Total (Overall) | 2,488 (54.1%) | 2,110 (45.9%) |
Production, Transportation and Moving Occupations
The most common Production, Transportation and Moving occupations in West Dundee are Production (145 | 3.2%), Transportation (106 | 2.3%), and Material Moving (93 | 2.0%).
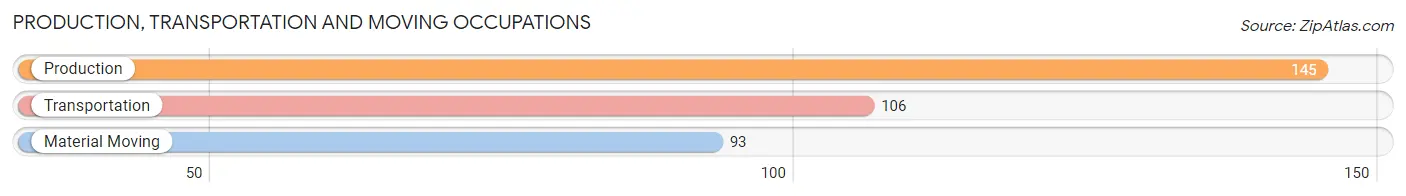
Production, Transportation and Moving Occupations by Sex
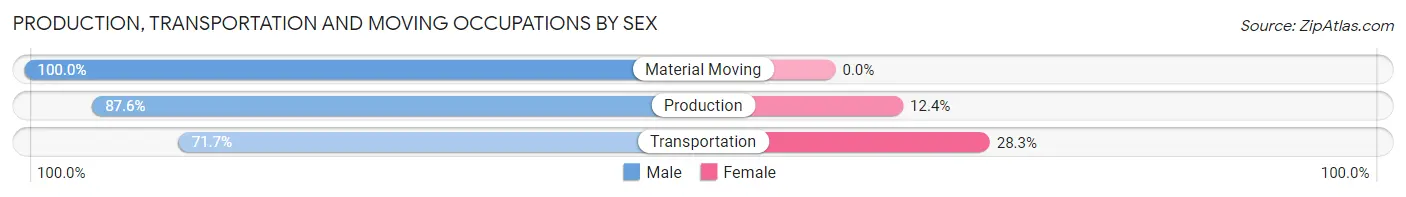
| Occupation | Male | Female |
| Production | 127 (87.6%) | 18 (12.4%) |
| Transportation | 76 (71.7%) | 30 (28.3%) |
| Material Moving | 93 (100.0%) | 0 (0.0%) |
| Total (Category) | 296 (86.1%) | 48 (14.0%) |
| Total (Overall) | 2,488 (54.1%) | 2,110 (45.9%) |
Employment Industries by Sex in West Dundee
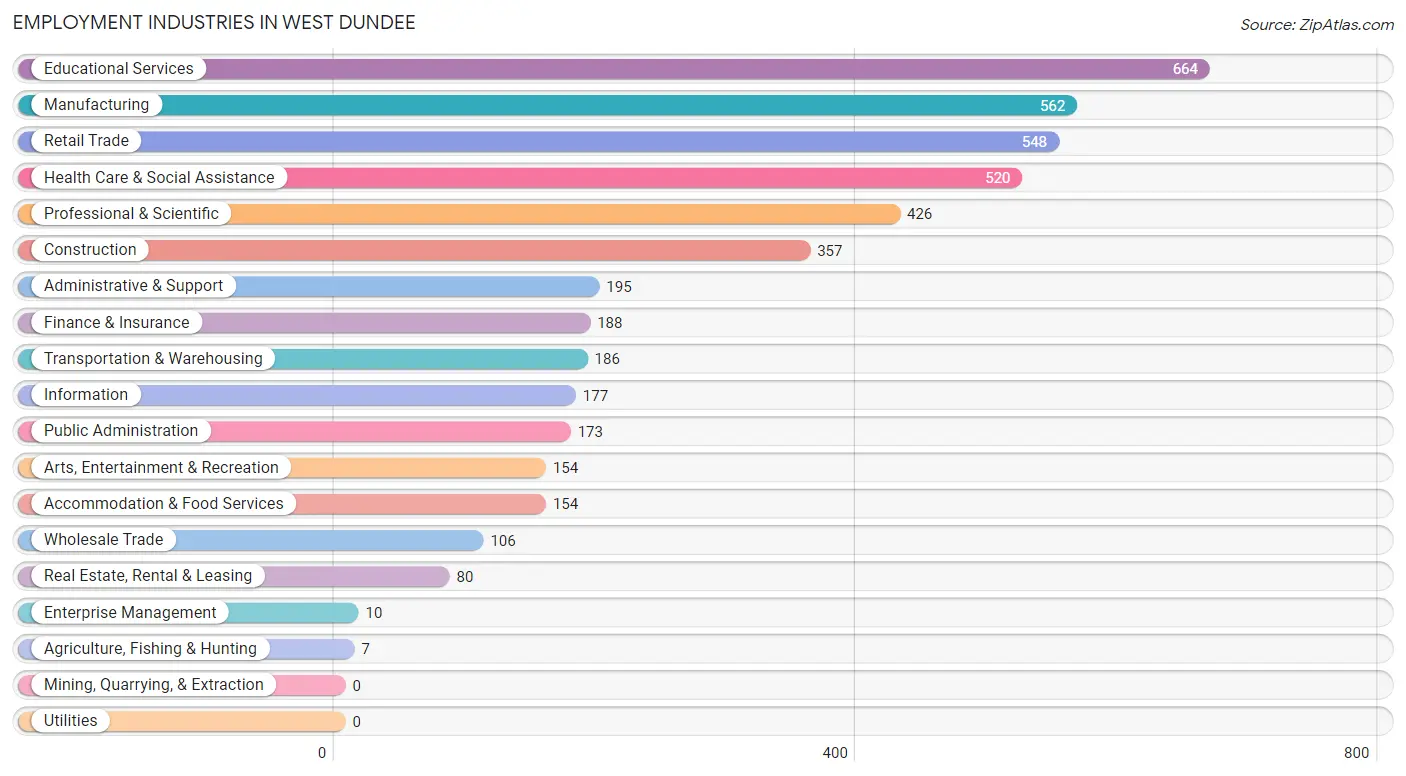
Employment Industries in West Dundee
The major employment industries in West Dundee include Educational Services (664 | 14.4%), Manufacturing (562 | 12.2%), Retail Trade (548 | 11.9%), Health Care & Social Assistance (520 | 11.3%), and Professional & Scientific (426 | 9.3%).
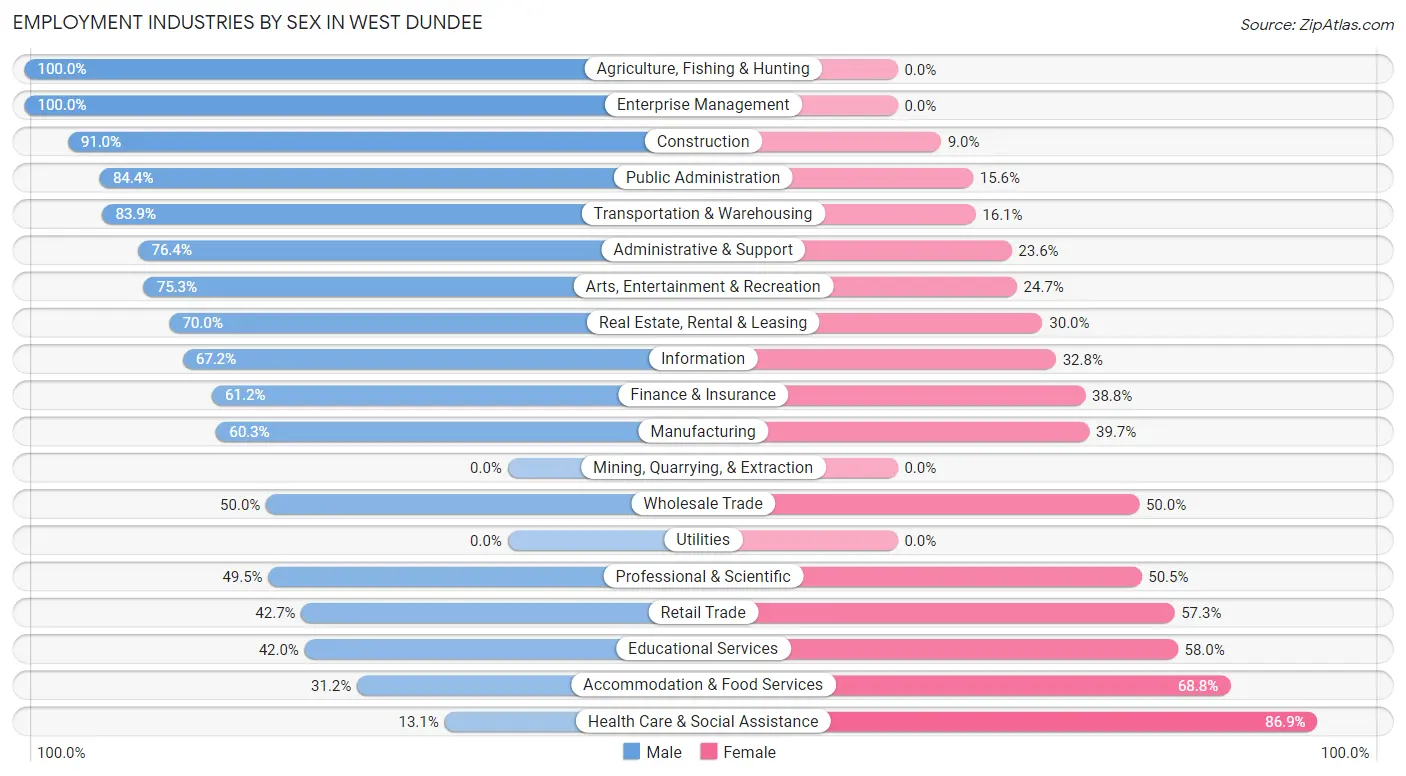
Employment Industries by Sex in West Dundee
The West Dundee industries that see more men than women are Agriculture, Fishing & Hunting (100.0%), Enterprise Management (100.0%), and Construction (91.0%), whereas the industries that tend to have a higher number of women are Health Care & Social Assistance (86.9%), Accommodation & Food Services (68.8%), and Educational Services (58.0%).
| Industry | Male | Female |
| Agriculture, Fishing & Hunting | 7 (100.0%) | 0 (0.0%) |
| Mining, Quarrying, & Extraction | 0 (0.0%) | 0 (0.0%) |
| Construction | 325 (91.0%) | 32 (9.0%) |
| Manufacturing | 339 (60.3%) | 223 (39.7%) |
| Wholesale Trade | 53 (50.0%) | 53 (50.0%) |
| Retail Trade | 234 (42.7%) | 314 (57.3%) |
| Transportation & Warehousing | 156 (83.9%) | 30 (16.1%) |
| Utilities | 0 (0.0%) | 0 (0.0%) |
| Information | 119 (67.2%) | 58 (32.8%) |
| Finance & Insurance | 115 (61.2%) | 73 (38.8%) |
| Real Estate, Rental & Leasing | 56 (70.0%) | 24 (30.0%) |
| Professional & Scientific | 211 (49.5%) | 215 (50.5%) |
| Enterprise Management | 10 (100.0%) | 0 (0.0%) |
| Administrative & Support | 149 (76.4%) | 46 (23.6%) |
| Educational Services | 279 (42.0%) | 385 (58.0%) |
| Health Care & Social Assistance | 68 (13.1%) | 452 (86.9%) |
| Arts, Entertainment & Recreation | 116 (75.3%) | 38 (24.7%) |
| Accommodation & Food Services | 48 (31.2%) | 106 (68.8%) |
| Public Administration | 146 (84.4%) | 27 (15.6%) |
| Total | 2,488 (54.1%) | 2,110 (45.9%) |
Education in West Dundee
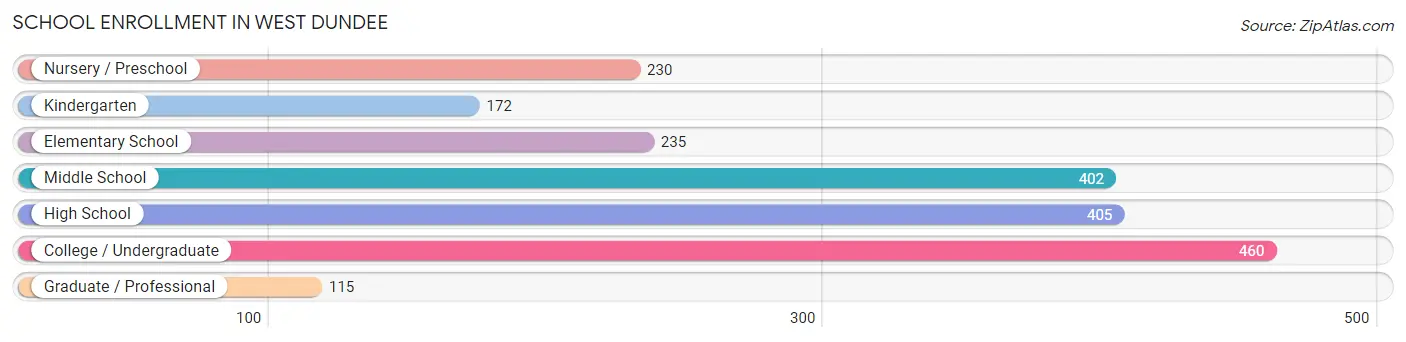
School Enrollment in West Dundee
The most common levels of schooling among the 2,019 students in West Dundee are college / undergraduate (460 | 22.8%), high school (405 | 20.1%), and middle school (402 | 19.9%).
| School Level | # Students | % Students |
| Nursery / Preschool | 230 | 11.4% |
| Kindergarten | 172 | 8.5% |
| Elementary School | 235 | 11.6% |
| Middle School | 402 | 19.9% |
| High School | 405 | 20.1% |
| College / Undergraduate | 460 | 22.8% |
| Graduate / Professional | 115 | 5.7% |
| Total | 2,019 | 100.0% |
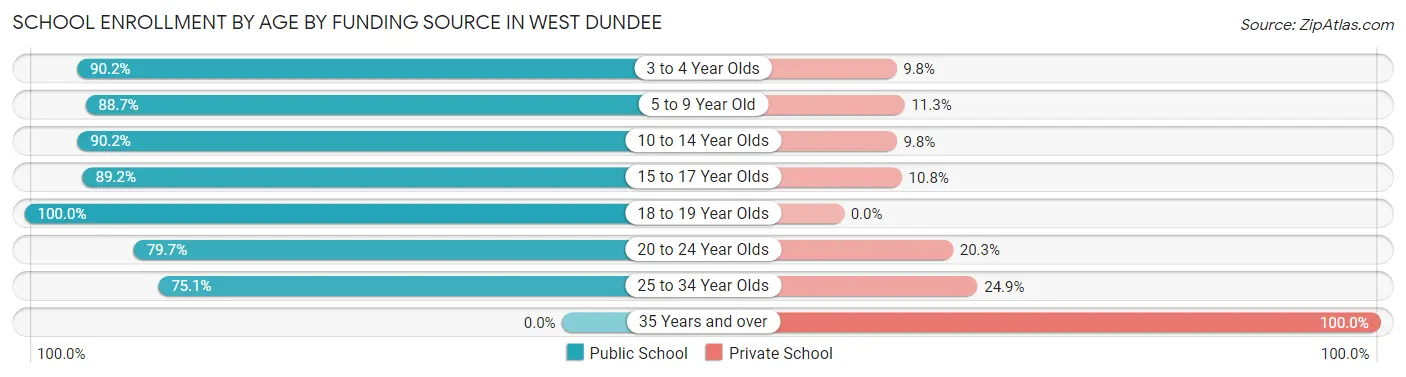
School Enrollment by Age by Funding Source in West Dundee
Out of a total of 2,019 students who are enrolled in schools in West Dundee, 297 (14.7%) attend a private institution, while the remaining 1,722 (85.3%) are enrolled in public schools. The age group of 35 years and over has the highest likelihood of being enrolled in private schools, with 40 (100.0% in the age bracket) enrolled. Conversely, the age group of 18 to 19 year olds has the lowest likelihood of being enrolled in a private school, with 121 (100.0% in the age bracket) attending a public institution.
| Age Bracket | Public School | Private School |
| 3 to 4 Year Olds | 184 (90.2%) | 20 (9.8%) |
| 5 to 9 Year Old | 368 (88.7%) | 47 (11.3%) |
| 10 to 14 Year Olds | 385 (90.2%) | 42 (9.8%) |
| 15 to 17 Year Olds | 256 (89.2%) | 31 (10.8%) |
| 18 to 19 Year Olds | 121 (100.0%) | 0 (0.0%) |
| 20 to 24 Year Olds | 239 (79.7%) | 61 (20.3%) |
| 25 to 34 Year Olds | 169 (75.1%) | 56 (24.9%) |
| 35 Years and over | 0 (0.0%) | 40 (100.0%) |
| Total | 1,722 (85.3%) | 297 (14.7%) |
Educational Attainment by Field of Study in West Dundee
Education (580 | 20.6%), business (503 | 17.9%), arts & humanities (273 | 9.7%), science & technology (268 | 9.5%), and engineering (211 | 7.5%) are the most common fields of study among 2,813 individuals in West Dundee who have obtained a bachelor's degree or higher.
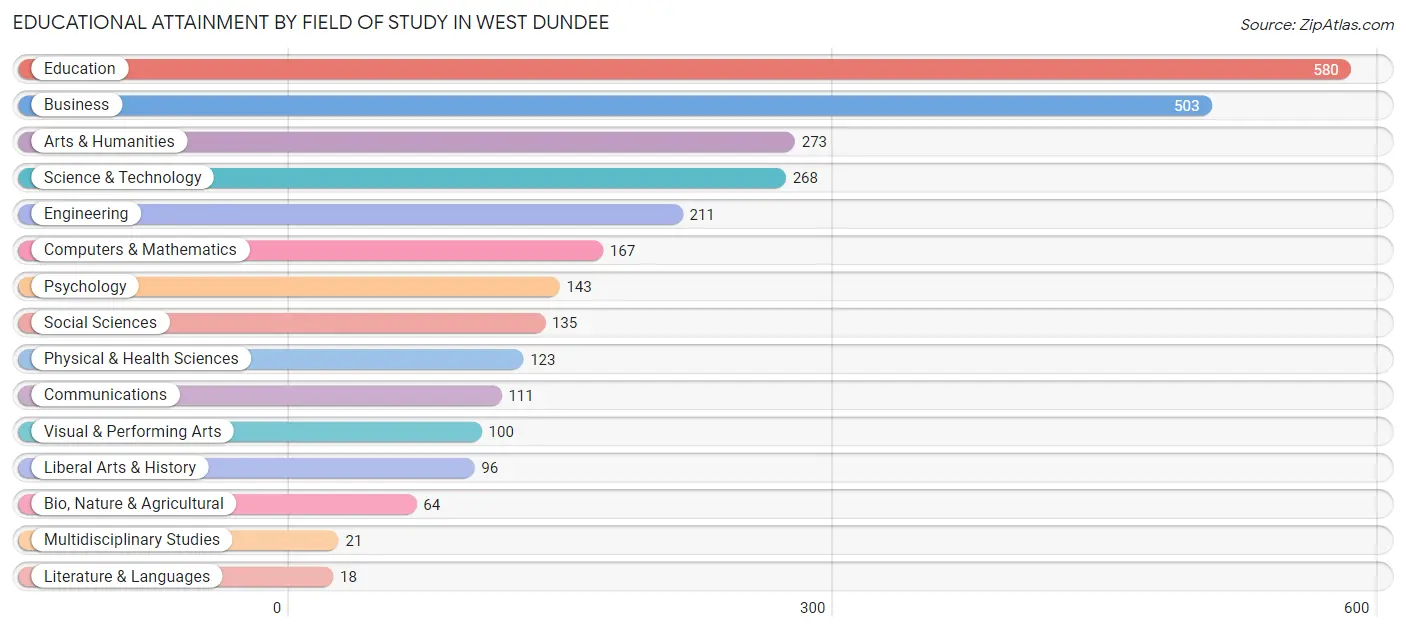
| Field of Study | # Graduates | % Graduates |
| Computers & Mathematics | 167 | 5.9% |
| Bio, Nature & Agricultural | 64 | 2.3% |
| Physical & Health Sciences | 123 | 4.4% |
| Psychology | 143 | 5.1% |
| Social Sciences | 135 | 4.8% |
| Engineering | 211 | 7.5% |
| Multidisciplinary Studies | 21 | 0.7% |
| Science & Technology | 268 | 9.5% |
| Business | 503 | 17.9% |
| Education | 580 | 20.6% |
| Literature & Languages | 18 | 0.6% |
| Liberal Arts & History | 96 | 3.4% |
| Visual & Performing Arts | 100 | 3.5% |
| Communications | 111 | 4.0% |
| Arts & Humanities | 273 | 9.7% |
| Total | 2,813 | 100.0% |
Transportation & Commute in West Dundee
Vehicle Availability by Sex in West Dundee
The most prevalent vehicle ownership categories in West Dundee are males with 2 vehicles (1,262, accounting for 51.0%) and females with 2 vehicles (1,147, making up 59.8%).
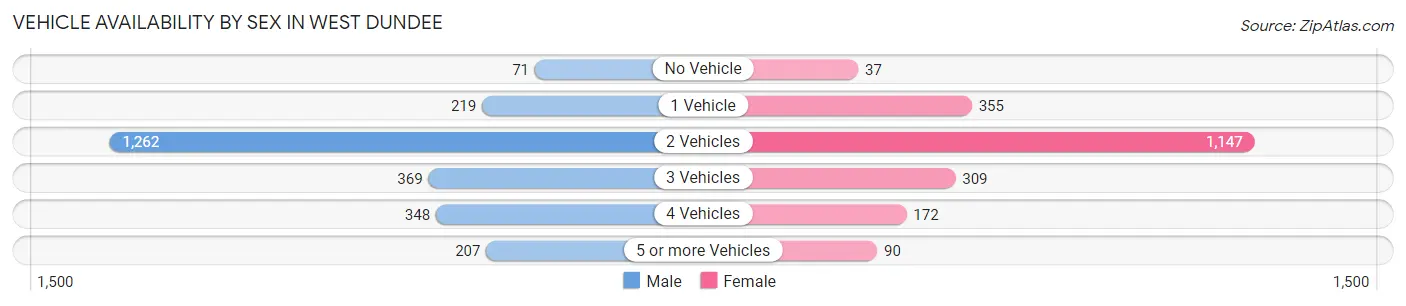
| Vehicles Available | Male | Female |
| No Vehicle | 71 (2.9%) | 37 (1.8%) |
| 1 Vehicle | 219 (8.8%) | 355 (16.8%) |
| 2 Vehicles | 1,262 (51.0%) | 1,147 (54.4%) |
| 3 Vehicles | 369 (14.9%) | 309 (14.6%) |
| 4 Vehicles | 348 (14.1%) | 172 (8.2%) |
| 5 or more Vehicles | 207 (8.4%) | 90 (4.3%) |
| Total | 2,476 (100.0%) | 2,110 (100.0%) |
Commute Time in West Dundee
The most frequently occuring commute durations in West Dundee are 20 to 24 minutes (593 commuters, 15.8%), 45 to 59 minutes (525 commuters, 14.0%), and 15 to 19 minutes (474 commuters, 12.6%).
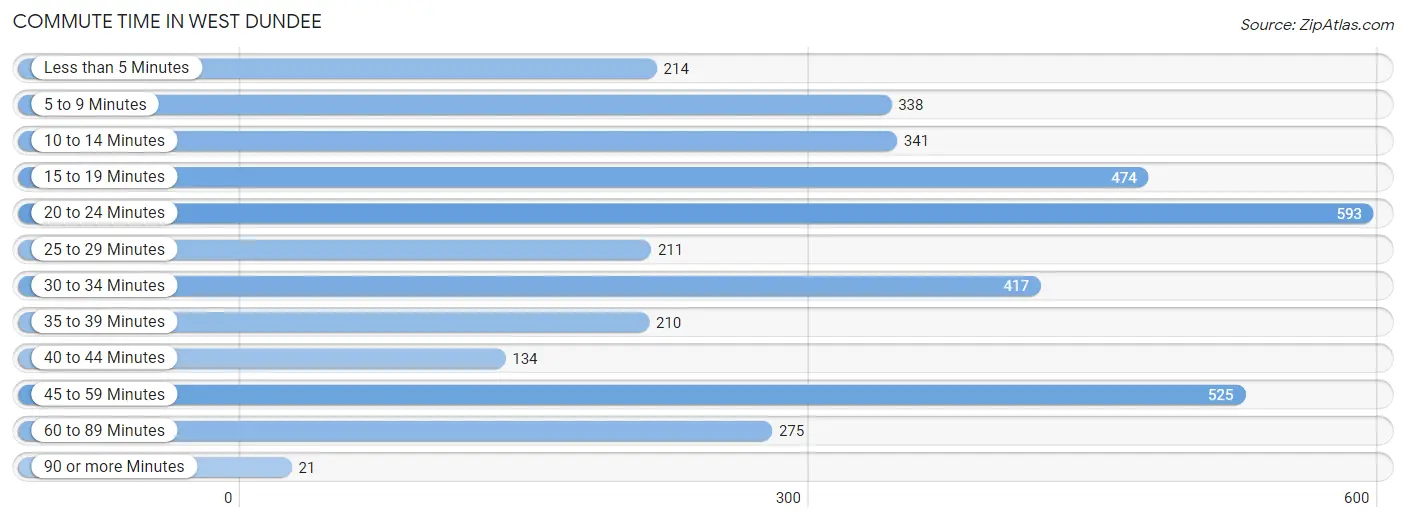
| Commute Time | # Commuters | % Commuters |
| Less than 5 Minutes | 214 | 5.7% |
| 5 to 9 Minutes | 338 | 9.0% |
| 10 to 14 Minutes | 341 | 9.1% |
| 15 to 19 Minutes | 474 | 12.6% |
| 20 to 24 Minutes | 593 | 15.8% |
| 25 to 29 Minutes | 211 | 5.6% |
| 30 to 34 Minutes | 417 | 11.1% |
| 35 to 39 Minutes | 210 | 5.6% |
| 40 to 44 Minutes | 134 | 3.6% |
| 45 to 59 Minutes | 525 | 14.0% |
| 60 to 89 Minutes | 275 | 7.3% |
| 90 or more Minutes | 21 | 0.6% |
Commute Time by Sex in West Dundee
The most common commute times in West Dundee are 45 to 59 minutes (353 commuters, 16.9%) for males and 20 to 24 minutes (407 commuters, 24.5%) for females.
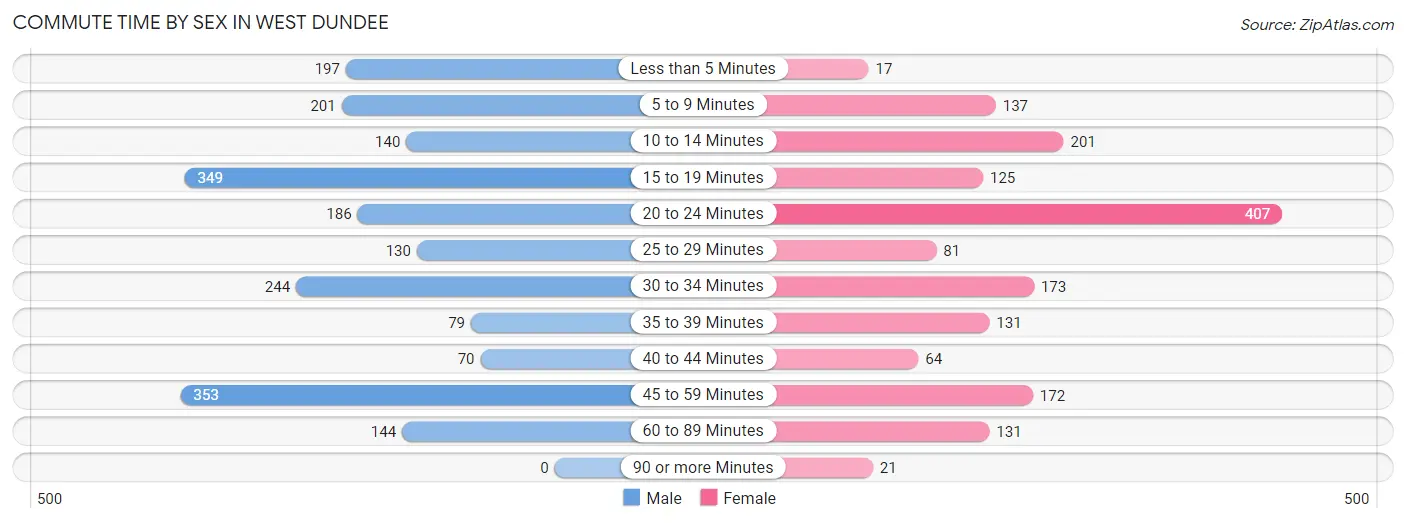
| Commute Time | Male | Female |
| Less than 5 Minutes | 197 (9.4%) | 17 (1.0%) |
| 5 to 9 Minutes | 201 (9.6%) | 137 (8.3%) |
| 10 to 14 Minutes | 140 (6.7%) | 201 (12.1%) |
| 15 to 19 Minutes | 349 (16.7%) | 125 (7.5%) |
| 20 to 24 Minutes | 186 (8.9%) | 407 (24.5%) |
| 25 to 29 Minutes | 130 (6.2%) | 81 (4.9%) |
| 30 to 34 Minutes | 244 (11.7%) | 173 (10.4%) |
| 35 to 39 Minutes | 79 (3.8%) | 131 (7.9%) |
| 40 to 44 Minutes | 70 (3.3%) | 64 (3.9%) |
| 45 to 59 Minutes | 353 (16.9%) | 172 (10.4%) |
| 60 to 89 Minutes | 144 (6.9%) | 131 (7.9%) |
| 90 or more Minutes | 0 (0.0%) | 21 (1.3%) |
Time of Departure to Work by Sex in West Dundee
The most frequent times of departure to work in West Dundee are 7:30 AM to 7:59 AM (348, 16.6%) for males and 8:00 AM to 8:29 AM (246, 14.8%) for females.
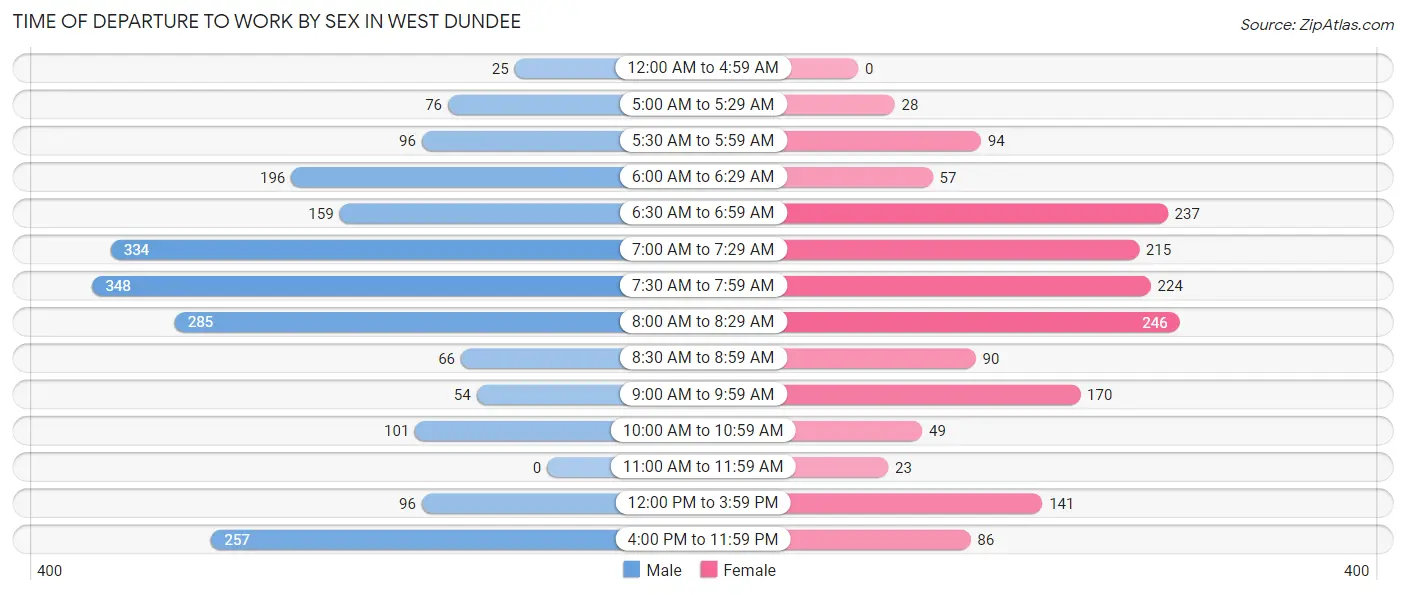
| Time of Departure | Male | Female |
| 12:00 AM to 4:59 AM | 25 (1.2%) | 0 (0.0%) |
| 5:00 AM to 5:29 AM | 76 (3.6%) | 28 (1.7%) |
| 5:30 AM to 5:59 AM | 96 (4.6%) | 94 (5.7%) |
| 6:00 AM to 6:29 AM | 196 (9.4%) | 57 (3.4%) |
| 6:30 AM to 6:59 AM | 159 (7.6%) | 237 (14.3%) |
| 7:00 AM to 7:29 AM | 334 (16.0%) | 215 (13.0%) |
| 7:30 AM to 7:59 AM | 348 (16.6%) | 224 (13.5%) |
| 8:00 AM to 8:29 AM | 285 (13.6%) | 246 (14.8%) |
| 8:30 AM to 8:59 AM | 66 (3.2%) | 90 (5.4%) |
| 9:00 AM to 9:59 AM | 54 (2.6%) | 170 (10.2%) |
| 10:00 AM to 10:59 AM | 101 (4.8%) | 49 (2.9%) |
| 11:00 AM to 11:59 AM | 0 (0.0%) | 23 (1.4%) |
| 12:00 PM to 3:59 PM | 96 (4.6%) | 141 (8.5%) |
| 4:00 PM to 11:59 PM | 257 (12.3%) | 86 (5.2%) |
| Total | 2,093 (100.0%) | 1,660 (100.0%) |
Housing Occupancy in West Dundee
Occupancy by Ownership in West Dundee
Of the total 3,142 dwellings in West Dundee, owner-occupied units account for 1,728 (55.0%), while renter-occupied units make up 1,414 (45.0%).
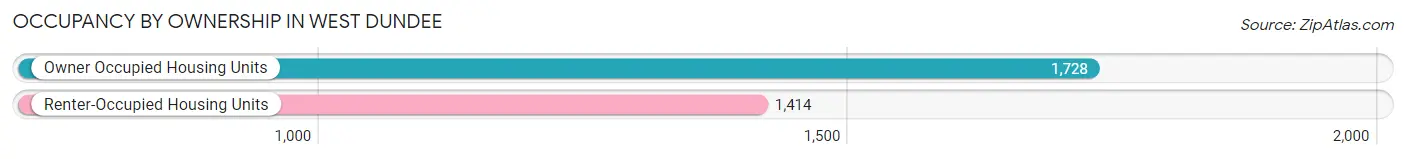
| Occupancy | # Housing Units | % Housing Units |
| Owner Occupied Housing Units | 1,728 | 55.0% |
| Renter-Occupied Housing Units | 1,414 | 45.0% |
| Total Occupied Housing Units | 3,142 | 100.0% |
Occupancy by Household Size in West Dundee
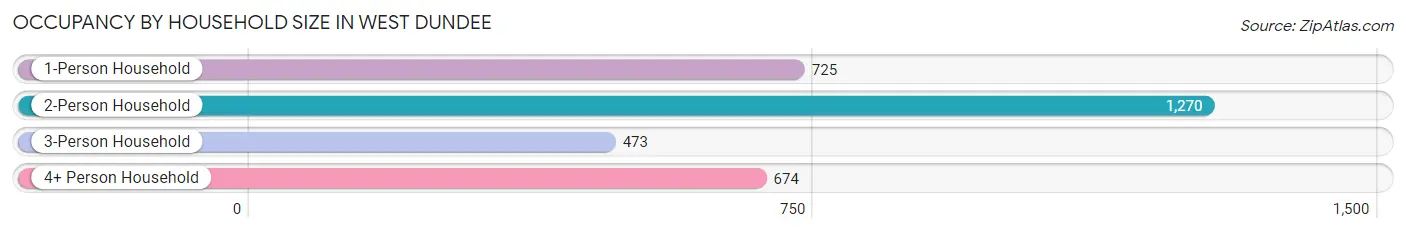
| Household Size | # Housing Units | % Housing Units |
| 1-Person Household | 725 | 23.1% |
| 2-Person Household | 1,270 | 40.4% |
| 3-Person Household | 473 | 15.0% |
| 4+ Person Household | 674 | 21.4% |
| Total Housing Units | 3,142 | 100.0% |
Occupancy by Ownership by Household Size in West Dundee
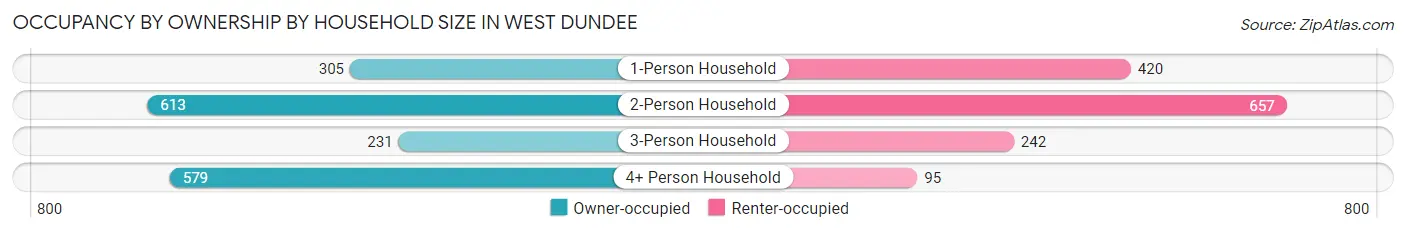
| Household Size | Owner-occupied | Renter-occupied |
| 1-Person Household | 305 (42.1%) | 420 (57.9%) |
| 2-Person Household | 613 (48.3%) | 657 (51.7%) |
| 3-Person Household | 231 (48.8%) | 242 (51.2%) |
| 4+ Person Household | 579 (85.9%) | 95 (14.1%) |
| Total Housing Units | 1,728 (55.0%) | 1,414 (45.0%) |
Occupancy by Educational Attainment in West Dundee
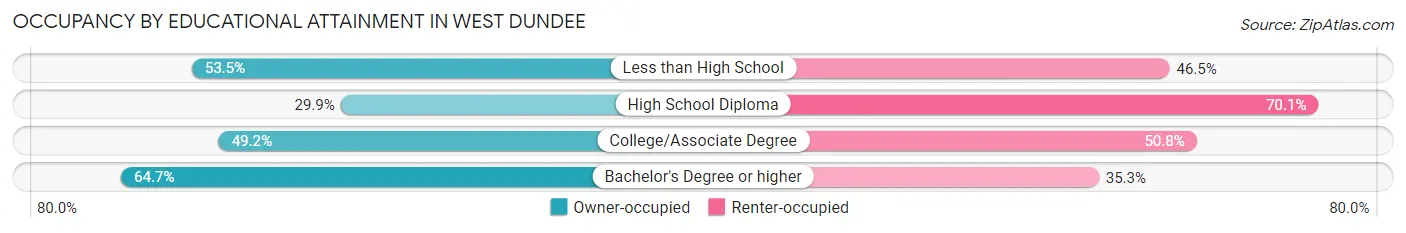
| Household Size | Owner-occupied | Renter-occupied |
| Less than High School | 77 (53.5%) | 67 (46.5%) |
| High School Diploma | 107 (29.9%) | 251 (70.1%) |
| College/Associate Degree | 520 (49.2%) | 537 (50.8%) |
| Bachelor's Degree or higher | 1,024 (64.7%) | 559 (35.3%) |
Occupancy by Age of Householder in West Dundee
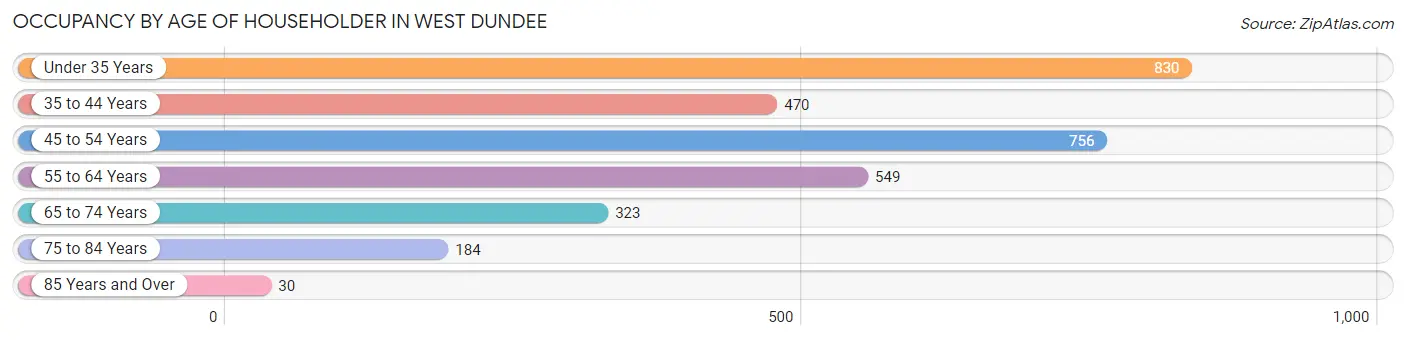
| Age Bracket | # Households | % Households |
| Under 35 Years | 830 | 26.4% |
| 35 to 44 Years | 470 | 15.0% |
| 45 to 54 Years | 756 | 24.1% |
| 55 to 64 Years | 549 | 17.5% |
| 65 to 74 Years | 323 | 10.3% |
| 75 to 84 Years | 184 | 5.9% |
| 85 Years and Over | 30 | 0.9% |
| Total | 3,142 | 100.0% |
Housing Finances in West Dundee
Median Income by Occupancy in West Dundee
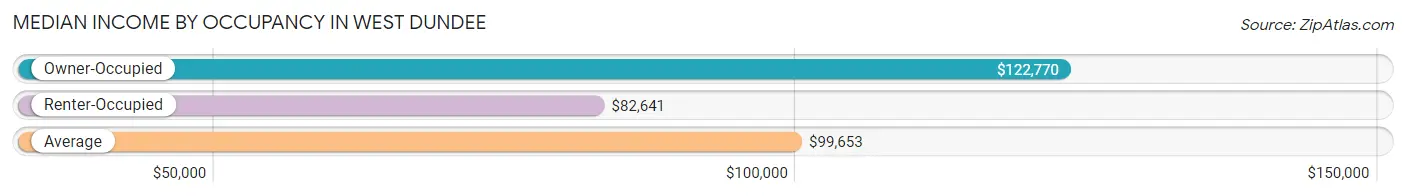
| Occupancy Type | # Households | Median Income |
| Owner-Occupied | 1,728 (55.0%) | $122,770 |
| Renter-Occupied | 1,414 (45.0%) | $82,641 |
| Average | 3,142 (100.0%) | $99,653 |
Occupancy by Householder Income Bracket in West Dundee
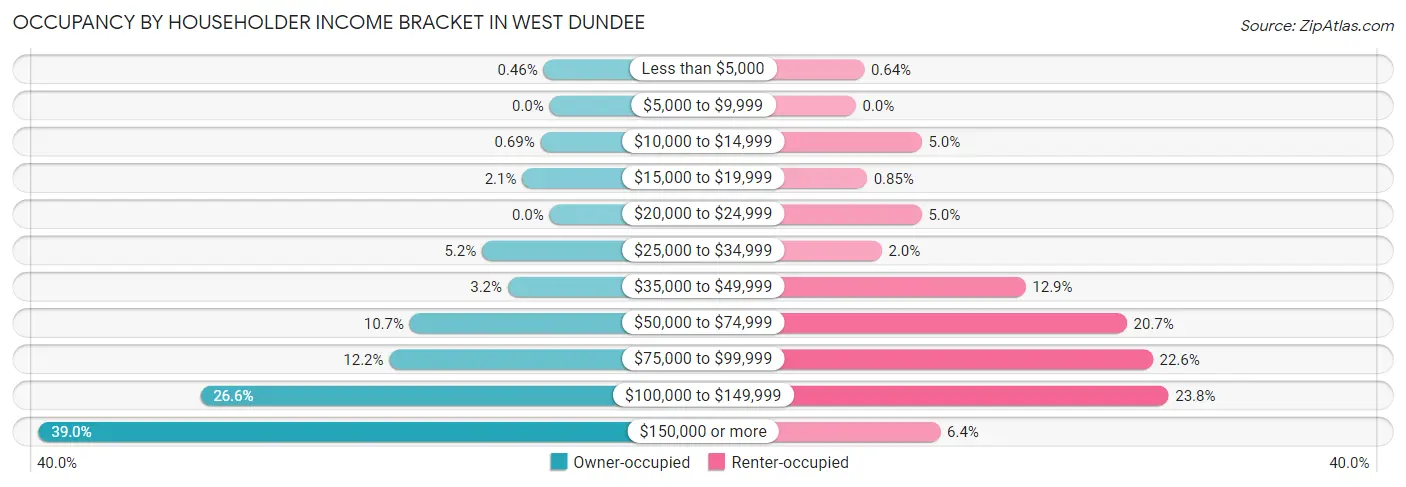
| Income Bracket | Owner-occupied | Renter-occupied |
| Less than $5,000 | 8 (0.5%) | 9 (0.6%) |
| $5,000 to $9,999 | 0 (0.0%) | 0 (0.0%) |
| $10,000 to $14,999 | 12 (0.7%) | 71 (5.0%) |
| $15,000 to $19,999 | 36 (2.1%) | 12 (0.9%) |
| $20,000 to $24,999 | 0 (0.0%) | 71 (5.0%) |
| $25,000 to $34,999 | 89 (5.1%) | 28 (2.0%) |
| $35,000 to $49,999 | 55 (3.2%) | 183 (12.9%) |
| $50,000 to $74,999 | 184 (10.6%) | 292 (20.6%) |
| $75,000 to $99,999 | 211 (12.2%) | 320 (22.6%) |
| $100,000 to $149,999 | 460 (26.6%) | 337 (23.8%) |
| $150,000 or more | 673 (39.0%) | 91 (6.4%) |
| Total | 1,728 (100.0%) | 1,414 (100.0%) |
Monthly Housing Cost Tiers in West Dundee
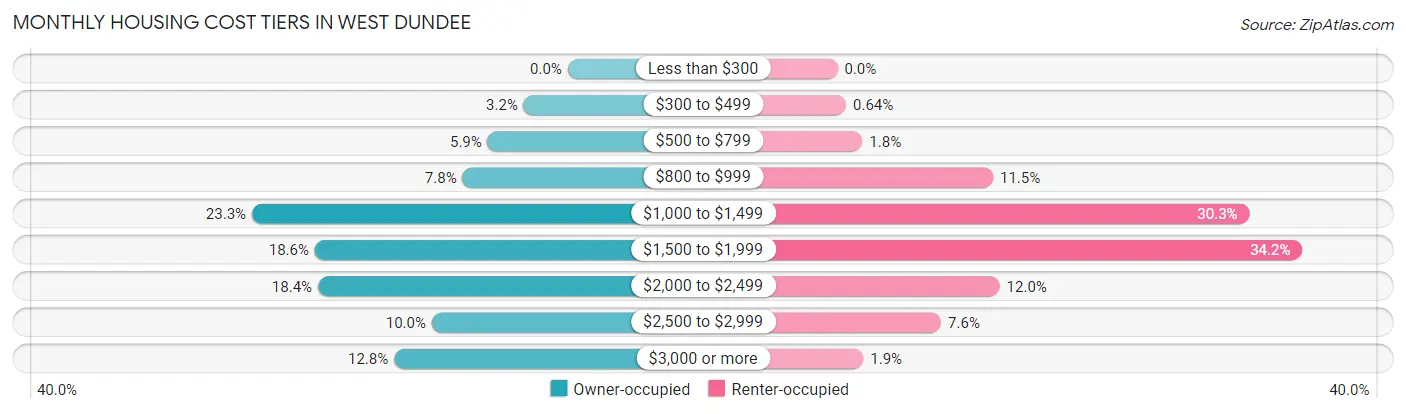
| Monthly Cost | Owner-occupied | Renter-occupied |
| Less than $300 | 0 (0.0%) | 0 (0.0%) |
| $300 to $499 | 56 (3.2%) | 9 (0.6%) |
| $500 to $799 | 102 (5.9%) | 26 (1.8%) |
| $800 to $999 | 134 (7.7%) | 162 (11.5%) |
| $1,000 to $1,499 | 402 (23.3%) | 429 (30.3%) |
| $1,500 to $1,999 | 322 (18.6%) | 484 (34.2%) |
| $2,000 to $2,499 | 318 (18.4%) | 169 (11.9%) |
| $2,500 to $2,999 | 173 (10.0%) | 108 (7.6%) |
| $3,000 or more | 221 (12.8%) | 27 (1.9%) |
| Total | 1,728 (100.0%) | 1,414 (100.0%) |
Physical Housing Characteristics in West Dundee
Housing Structures in West Dundee
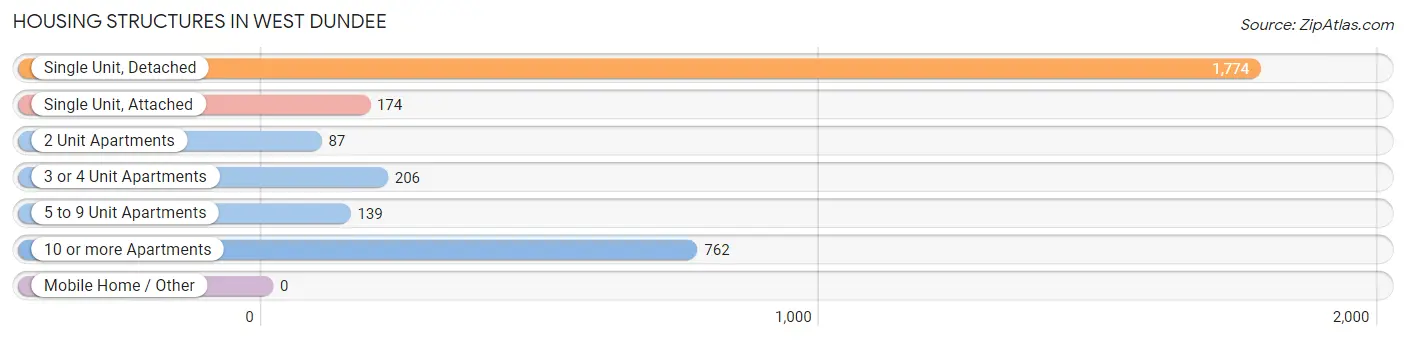
| Structure Type | # Housing Units | % Housing Units |
| Single Unit, Detached | 1,774 | 56.5% |
| Single Unit, Attached | 174 | 5.5% |
| 2 Unit Apartments | 87 | 2.8% |
| 3 or 4 Unit Apartments | 206 | 6.6% |
| 5 to 9 Unit Apartments | 139 | 4.4% |
| 10 or more Apartments | 762 | 24.2% |
| Mobile Home / Other | 0 | 0.0% |
| Total | 3,142 | 100.0% |
Housing Structures by Occupancy in West Dundee
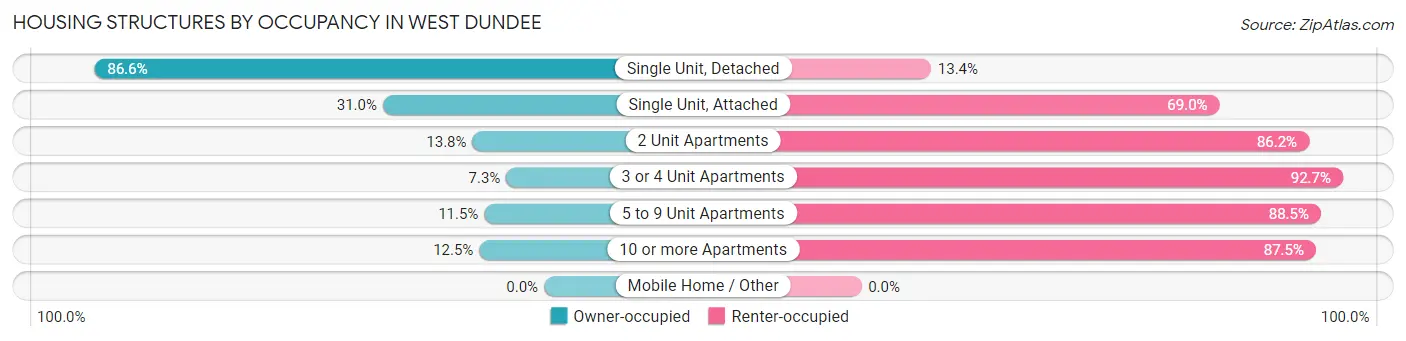
| Structure Type | Owner-occupied | Renter-occupied |
| Single Unit, Detached | 1,536 (86.6%) | 238 (13.4%) |
| Single Unit, Attached | 54 (31.0%) | 120 (69.0%) |
| 2 Unit Apartments | 12 (13.8%) | 75 (86.2%) |
| 3 or 4 Unit Apartments | 15 (7.3%) | 191 (92.7%) |
| 5 to 9 Unit Apartments | 16 (11.5%) | 123 (88.5%) |
| 10 or more Apartments | 95 (12.5%) | 667 (87.5%) |
| Mobile Home / Other | 0 (0.0%) | 0 (0.0%) |
| Total | 1,728 (55.0%) | 1,414 (45.0%) |
Housing Structures by Number of Rooms in West Dundee
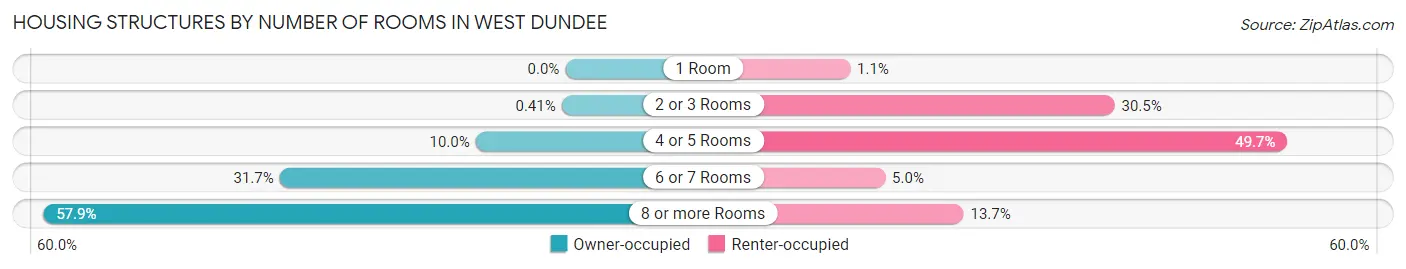
| Number of Rooms | Owner-occupied | Renter-occupied |
| 1 Room | 0 (0.0%) | 16 (1.1%) |
| 2 or 3 Rooms | 7 (0.4%) | 431 (30.5%) |
| 4 or 5 Rooms | 172 (10.0%) | 702 (49.6%) |
| 6 or 7 Rooms | 548 (31.7%) | 71 (5.0%) |
| 8 or more Rooms | 1,001 (57.9%) | 194 (13.7%) |
| Total | 1,728 (100.0%) | 1,414 (100.0%) |
Housing Structure by Heating Type in West Dundee
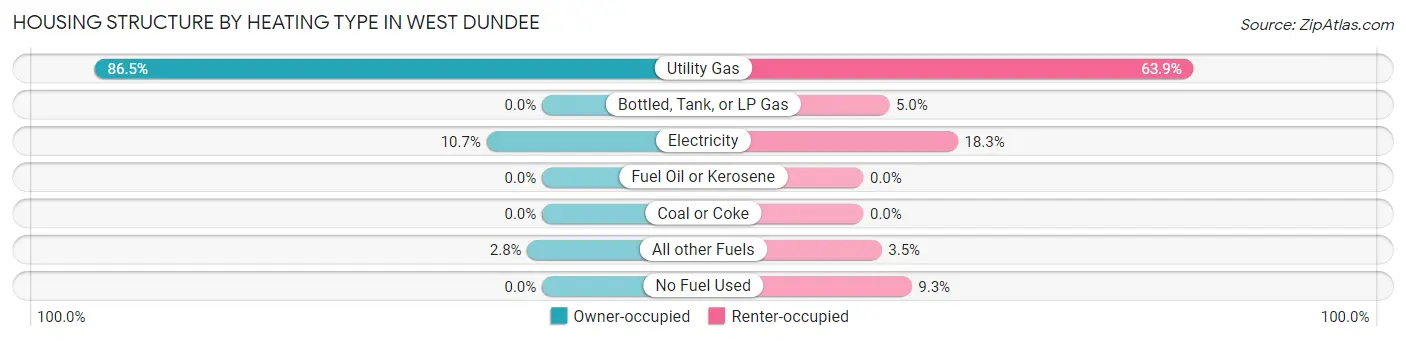
| Heating Type | Owner-occupied | Renter-occupied |
| Utility Gas | 1,494 (86.5%) | 903 (63.9%) |
| Bottled, Tank, or LP Gas | 0 (0.0%) | 71 (5.0%) |
| Electricity | 185 (10.7%) | 258 (18.2%) |
| Fuel Oil or Kerosene | 0 (0.0%) | 0 (0.0%) |
| Coal or Coke | 0 (0.0%) | 0 (0.0%) |
| All other Fuels | 49 (2.8%) | 50 (3.5%) |
| No Fuel Used | 0 (0.0%) | 132 (9.3%) |
| Total | 1,728 (100.0%) | 1,414 (100.0%) |
Household Vehicle Usage in West Dundee
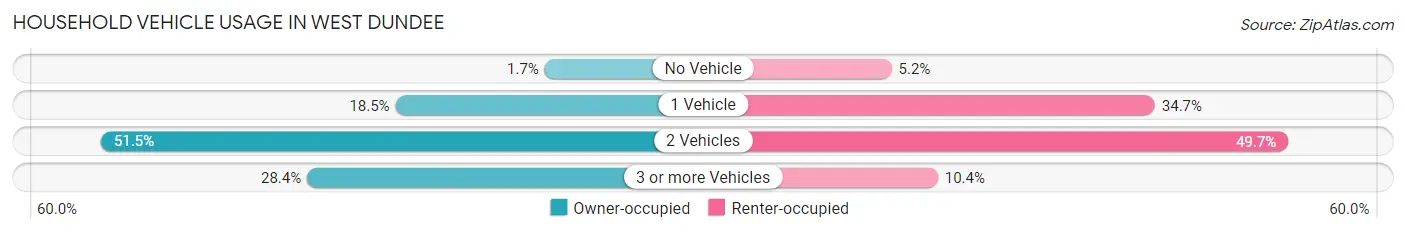
| Vehicles per Household | Owner-occupied | Renter-occupied |
| No Vehicle | 30 (1.7%) | 74 (5.2%) |
| 1 Vehicle | 319 (18.5%) | 491 (34.7%) |
| 2 Vehicles | 889 (51.4%) | 702 (49.6%) |
| 3 or more Vehicles | 490 (28.4%) | 147 (10.4%) |
| Total | 1,728 (100.0%) | 1,414 (100.0%) |
Real Estate & Mortgages in West Dundee
Real Estate and Mortgage Overview in West Dundee
| Characteristic | Without Mortgage | With Mortgage |
| Housing Units | 603 | 1,125 |
| Median Property Value | $325,400 | $335,800 |
| Median Household Income | $115,888 | $526 |
| Monthly Housing Costs | $1,036 | $221 |
| Real Estate Taxes | $8,095 | $0 |
Property Value by Mortgage Status in West Dundee
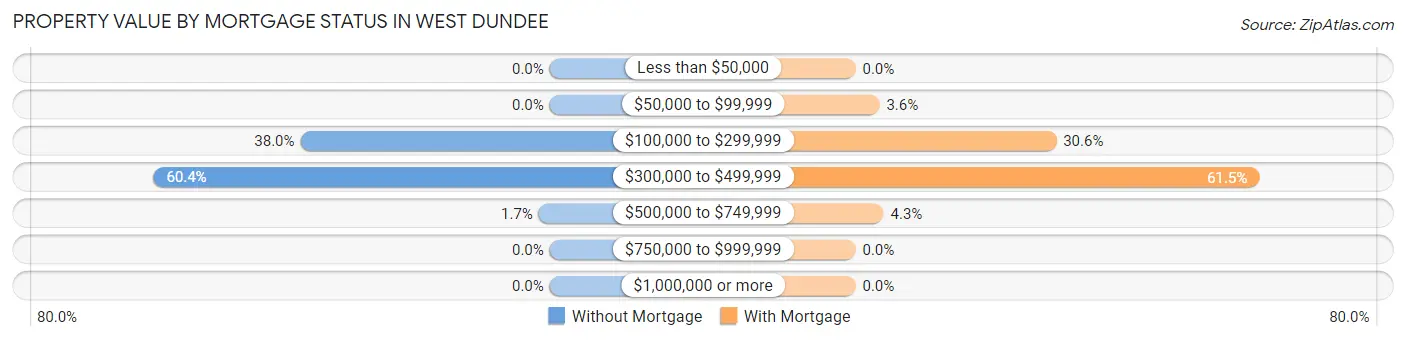
| Property Value | Without Mortgage | With Mortgage |
| Less than $50,000 | 0 (0.0%) | 0 (0.0%) |
| $50,000 to $99,999 | 0 (0.0%) | 41 (3.6%) |
| $100,000 to $299,999 | 229 (38.0%) | 344 (30.6%) |
| $300,000 to $499,999 | 364 (60.4%) | 692 (61.5%) |
| $500,000 to $749,999 | 10 (1.7%) | 48 (4.3%) |
| $750,000 to $999,999 | 0 (0.0%) | 0 (0.0%) |
| $1,000,000 or more | 0 (0.0%) | 0 (0.0%) |
| Total | 603 (100.0%) | 1,125 (100.0%) |
Household Income by Mortgage Status in West Dundee
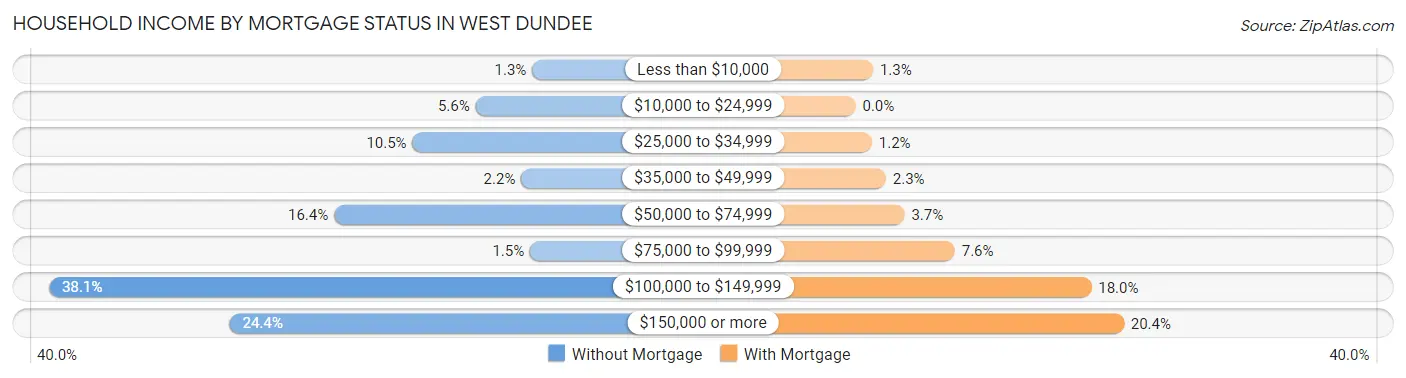
| Household Income | Without Mortgage | With Mortgage |
| Less than $10,000 | 8 (1.3%) | 15 (1.3%) |
| $10,000 to $24,999 | 34 (5.6%) | 0 (0.0%) |
| $25,000 to $34,999 | 63 (10.4%) | 14 (1.2%) |
| $35,000 to $49,999 | 13 (2.2%) | 26 (2.3%) |
| $50,000 to $74,999 | 99 (16.4%) | 42 (3.7%) |
| $75,000 to $99,999 | 9 (1.5%) | 85 (7.6%) |
| $100,000 to $149,999 | 230 (38.1%) | 202 (18.0%) |
| $150,000 or more | 147 (24.4%) | 230 (20.4%) |
| Total | 603 (100.0%) | 1,125 (100.0%) |
Property Value to Household Income Ratio in West Dundee
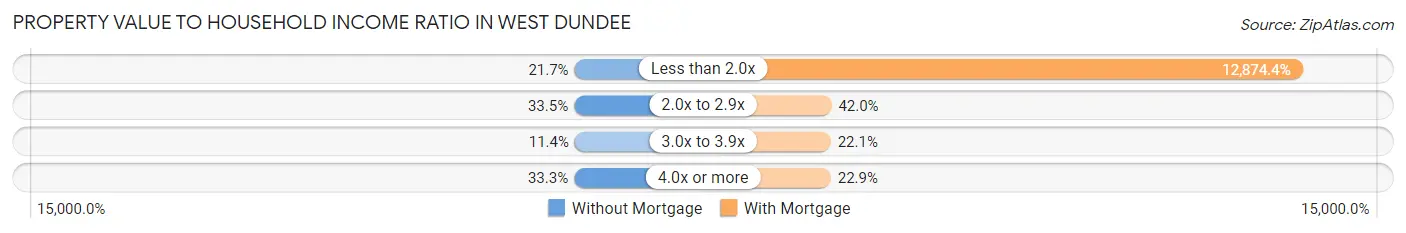
| Value-to-Income Ratio | Without Mortgage | With Mortgage |
| Less than 2.0x | 131 (21.7%) | 144,837 (12,874.4%) |
| 2.0x to 2.9x | 202 (33.5%) | 472 (42.0%) |
| 3.0x to 3.9x | 69 (11.4%) | 249 (22.1%) |
| 4.0x or more | 201 (33.3%) | 258 (22.9%) |
| Total | 603 (100.0%) | 1,125 (100.0%) |
Real Estate Taxes by Mortgage Status in West Dundee
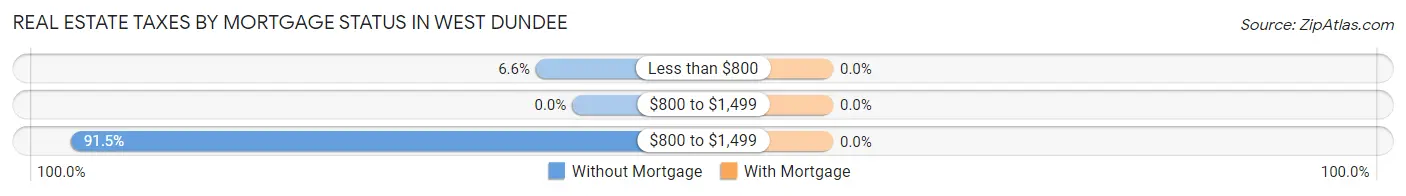
| Property Taxes | Without Mortgage | With Mortgage |
| Less than $800 | 40 (6.6%) | 0 (0.0%) |
| $800 to $1,499 | 0 (0.0%) | 0 (0.0%) |
| $800 to $1,499 | 552 (91.5%) | 0 (0.0%) |
| Total | 603 (100.0%) | 1,125 (100.0%) |
Health & Disability in West Dundee
Health Insurance Coverage by Age in West Dundee
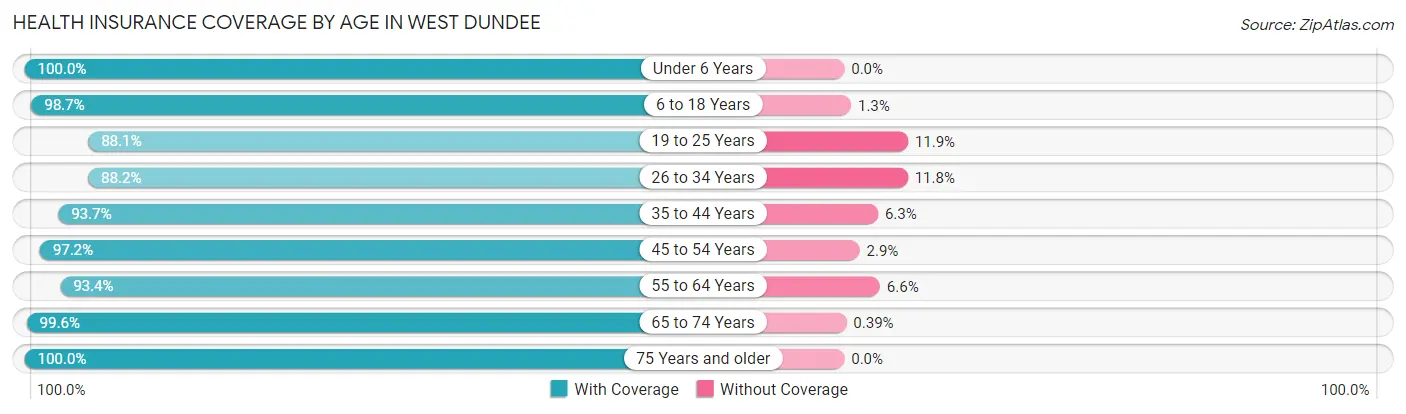
| Age Bracket | With Coverage | Without Coverage |
| Under 6 Years | 577 (100.0%) | 0 (0.0%) |
| 6 to 18 Years | 1,176 (98.7%) | 15 (1.3%) |
| 19 to 25 Years | 787 (88.1%) | 106 (11.9%) |
| 26 to 34 Years | 1,163 (88.2%) | 156 (11.8%) |
| 35 to 44 Years | 686 (93.7%) | 46 (6.3%) |
| 45 to 54 Years | 1,293 (97.2%) | 38 (2.9%) |
| 55 to 64 Years | 858 (93.4%) | 61 (6.6%) |
| 65 to 74 Years | 510 (99.6%) | 2 (0.4%) |
| 75 Years and older | 349 (100.0%) | 0 (0.0%) |
| Total | 7,399 (94.6%) | 424 (5.4%) |
Health Insurance Coverage by Citizenship Status in West Dundee
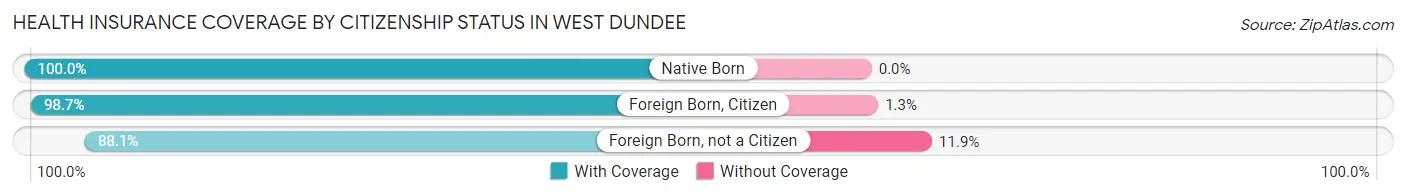
| Citizenship Status | With Coverage | Without Coverage |
| Native Born | 577 (100.0%) | 0 (0.0%) |
| Foreign Born, Citizen | 1,176 (98.7%) | 15 (1.3%) |
| Foreign Born, not a Citizen | 787 (88.1%) | 106 (11.9%) |
Health Insurance Coverage by Household Income in West Dundee
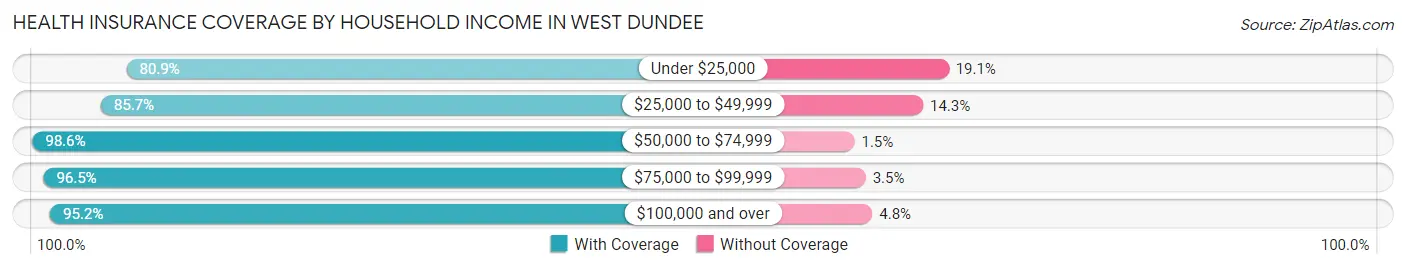
| Household Income | With Coverage | Without Coverage |
| Under $25,000 | 250 (80.9%) | 59 (19.1%) |
| $25,000 to $49,999 | 474 (85.7%) | 79 (14.3%) |
| $50,000 to $74,999 | 813 (98.6%) | 12 (1.5%) |
| $75,000 to $99,999 | 1,498 (96.5%) | 55 (3.5%) |
| $100,000 and over | 4,364 (95.2%) | 219 (4.8%) |
Public vs Private Health Insurance Coverage by Age in West Dundee
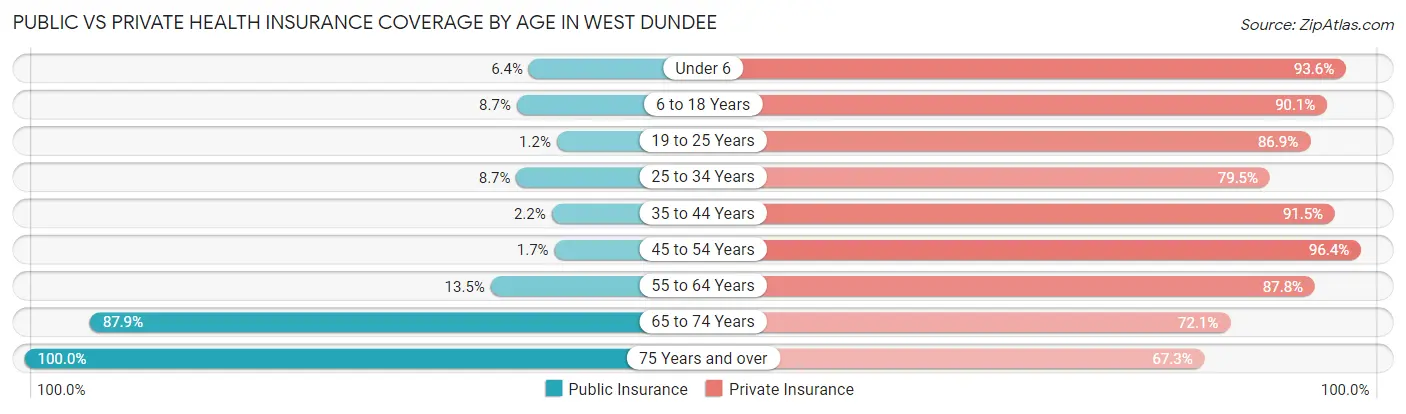
| Age Bracket | Public Insurance | Private Insurance |
| Under 6 | 37 (6.4%) | 540 (93.6%) |
| 6 to 18 Years | 103 (8.6%) | 1,073 (90.1%) |
| 19 to 25 Years | 11 (1.2%) | 776 (86.9%) |
| 25 to 34 Years | 115 (8.7%) | 1,048 (79.4%) |
| 35 to 44 Years | 16 (2.2%) | 670 (91.5%) |
| 45 to 54 Years | 22 (1.7%) | 1,283 (96.4%) |
| 55 to 64 Years | 124 (13.5%) | 807 (87.8%) |
| 65 to 74 Years | 450 (87.9%) | 369 (72.1%) |
| 75 Years and over | 349 (100.0%) | 235 (67.3%) |
| Total | 1,227 (15.7%) | 6,801 (86.9%) |
Disability Status by Sex by Age in West Dundee
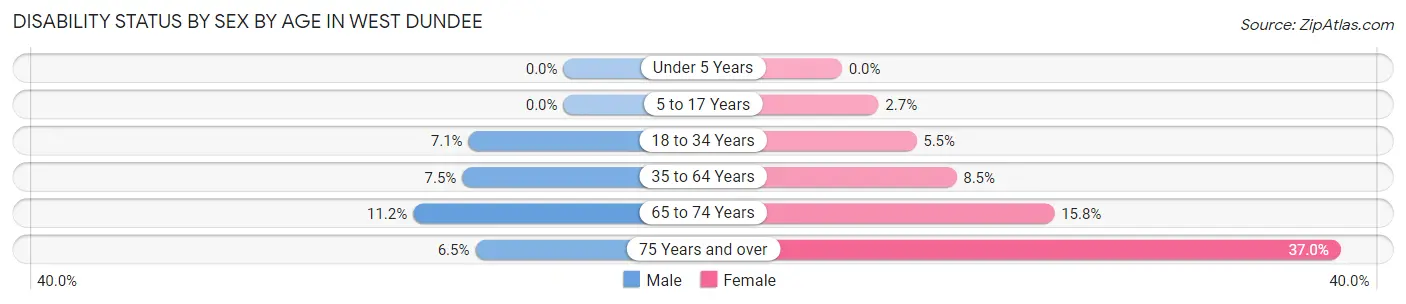
| Age Bracket | Male | Female |
| Under 5 Years | 0 (0.0%) | 0 (0.0%) |
| 5 to 17 Years | 0 (0.0%) | 14 (2.7%) |
| 18 to 34 Years | 88 (7.0%) | 60 (5.5%) |
| 35 to 64 Years | 110 (7.5%) | 129 (8.5%) |
| 65 to 74 Years | 26 (11.2%) | 44 (15.8%) |
| 75 Years and over | 14 (6.5%) | 50 (37.0%) |
Disability Class by Sex by Age in West Dundee
Disability Class: Hearing Difficulty
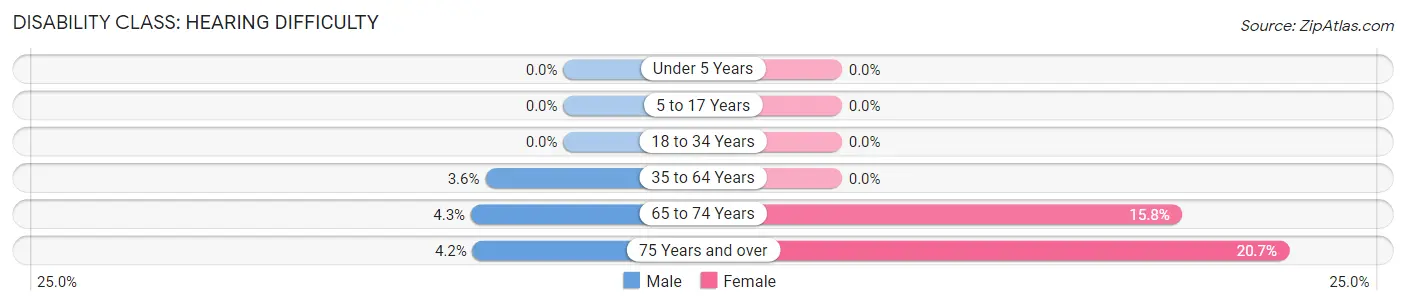
| Age Bracket | Male | Female |
| Under 5 Years | 0 (0.0%) | 0 (0.0%) |
| 5 to 17 Years | 0 (0.0%) | 0 (0.0%) |
| 18 to 34 Years | 0 (0.0%) | 0 (0.0%) |
| 35 to 64 Years | 53 (3.6%) | 0 (0.0%) |
| 65 to 74 Years | 10 (4.3%) | 44 (15.8%) |
| 75 Years and over | 9 (4.2%) | 28 (20.7%) |
Disability Class: Vision Difficulty
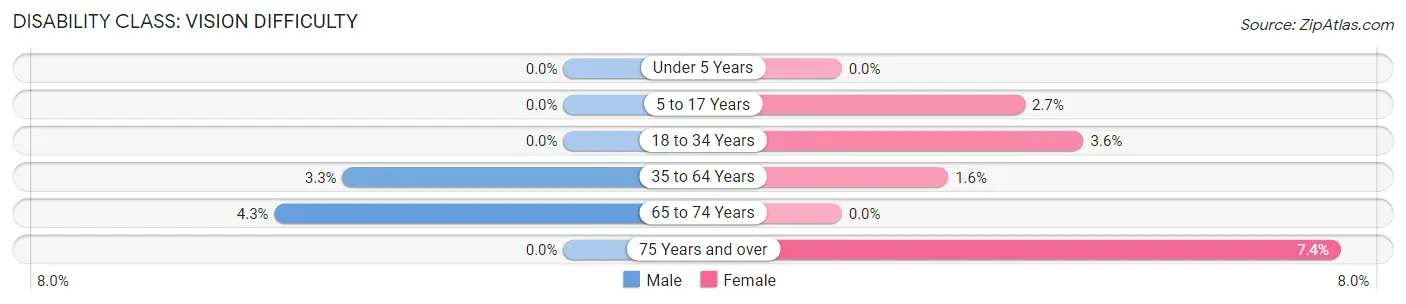
| Age Bracket | Male | Female |
| Under 5 Years | 0 (0.0%) | 0 (0.0%) |
| 5 to 17 Years | 0 (0.0%) | 14 (2.7%) |
| 18 to 34 Years | 0 (0.0%) | 39 (3.6%) |
| 35 to 64 Years | 48 (3.3%) | 24 (1.6%) |
| 65 to 74 Years | 10 (4.3%) | 0 (0.0%) |
| 75 Years and over | 0 (0.0%) | 10 (7.4%) |
Disability Class: Cognitive Difficulty
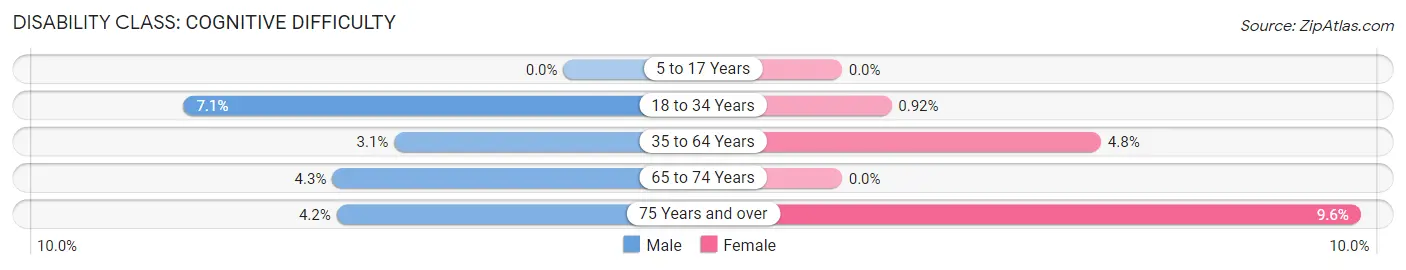
| Age Bracket | Male | Female |
| 5 to 17 Years | 0 (0.0%) | 0 (0.0%) |
| 18 to 34 Years | 88 (7.0%) | 10 (0.9%) |
| 35 to 64 Years | 46 (3.1%) | 73 (4.8%) |
| 65 to 74 Years | 10 (4.3%) | 0 (0.0%) |
| 75 Years and over | 9 (4.2%) | 13 (9.6%) |
Disability Class: Ambulatory Difficulty
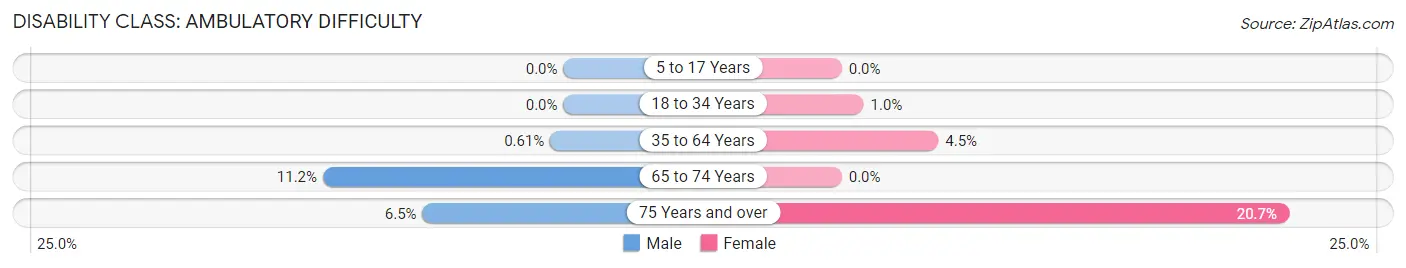
| Age Bracket | Male | Female |
| 5 to 17 Years | 0 (0.0%) | 0 (0.0%) |
| 18 to 34 Years | 0 (0.0%) | 11 (1.0%) |
| 35 to 64 Years | 9 (0.6%) | 68 (4.5%) |
| 65 to 74 Years | 26 (11.2%) | 0 (0.0%) |
| 75 Years and over | 14 (6.5%) | 28 (20.7%) |
Disability Class: Self-Care Difficulty
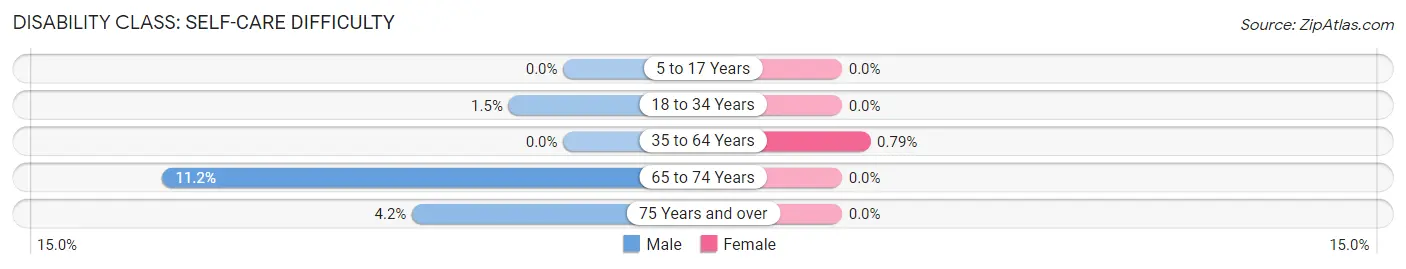
| Age Bracket | Male | Female |
| 5 to 17 Years | 0 (0.0%) | 0 (0.0%) |
| 18 to 34 Years | 19 (1.5%) | 0 (0.0%) |
| 35 to 64 Years | 0 (0.0%) | 12 (0.8%) |
| 65 to 74 Years | 26 (11.2%) | 0 (0.0%) |
| 75 Years and over | 9 (4.2%) | 0 (0.0%) |
Technology Access in West Dundee
Computing Device Access in West Dundee
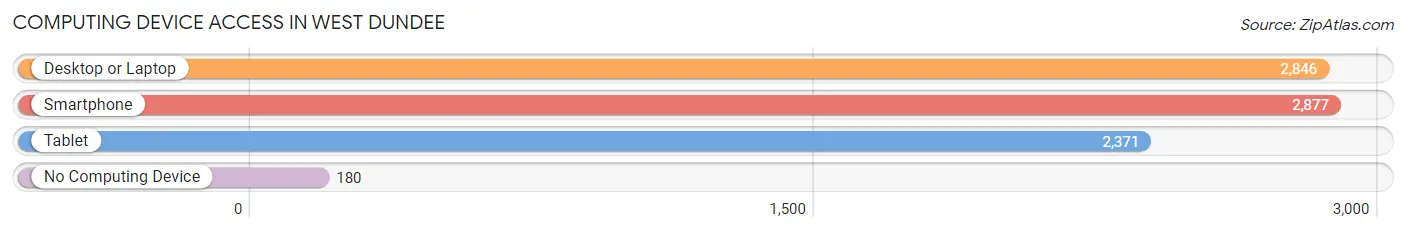
| Device Type | # Households | % Households |
| Desktop or Laptop | 2,846 | 90.6% |
| Smartphone | 2,877 | 91.6% |
| Tablet | 2,371 | 75.5% |
| No Computing Device | 180 | 5.7% |
| Total | 3,142 | 100.0% |
Internet Access in West Dundee
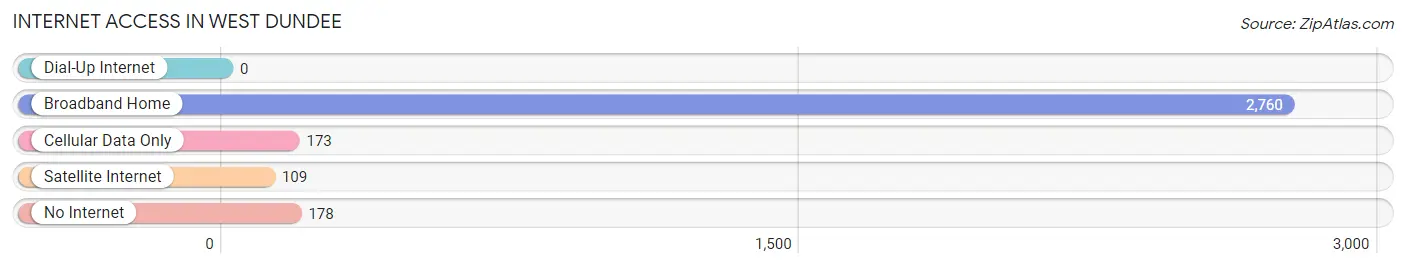
| Internet Type | # Households | % Households |
| Dial-Up Internet | 0 | 0.0% |
| Broadband Home | 2,760 | 87.8% |
| Cellular Data Only | 173 | 5.5% |
| Satellite Internet | 109 | 3.5% |
| No Internet | 178 | 5.7% |
| Total | 3,142 | 100.0% |
West Dundee Summary
History
West Dundee, Illinois is a village located in Kane County, Illinois, United States. The village is located approximately 40 miles northwest of Chicago and is part of the Fox River Valley. The village was first settled in 1835 by John and Mary Miller, who were among the first settlers in the area. The village was originally known as Miller’s Mill, but was later changed to Dundee in 1837. The name was changed to West Dundee in 1867 to distinguish it from the nearby village of East Dundee.
West Dundee was incorporated as a village in 1887. The village was primarily an agricultural community until the 1950s, when the population began to grow rapidly due to the expansion of the Chicago metropolitan area. The village has since become a popular bedroom community for commuters to Chicago.
Geography
West Dundee is located in Kane County, Illinois, approximately 40 miles northwest of Chicago. The village is situated on the Fox River, which flows through the village and is a popular recreational area. The village is bordered by the villages of East Dundee, Carpentersville, Sleepy Hollow, and Gilberts. The village covers an area of 4.2 square miles and has a population of 8,890 as of the 2010 census.
The village is located in the Fox River Valley, which is characterized by rolling hills and wooded areas. The village is home to several parks, including the Fox River Park, which offers a variety of recreational activities, including fishing, boating, and hiking.
Economy
West Dundee is primarily a residential community, with most of its residents commuting to Chicago for work. The village is home to several small businesses, including restaurants, retail stores, and professional services. The village is also home to several industrial parks, which are home to a variety of businesses, including manufacturing, distribution, and technology companies.
The village is also home to several large employers, including the West Dundee Industrial Park, which is home to several manufacturing and distribution companies. The village is also home to the West Dundee Technology Park, which is home to several technology companies.
Demographics
As of the 2010 census, West Dundee had a population of 8,890. The population is primarily white (90.2%), with a small percentage of African Americans (2.2%), Asians (2.7%), and Hispanics (3.3%). The median household income is $76,945, and the median home value is $223,400. The village has a high rate of homeownership (83.2%), and the unemployment rate is 4.2%.
West Dundee is served by several school districts, including Community Unit School District 300, Dundee-Crown High School District 300, and West Dundee Elementary School District 300. The village is also home to several private schools, including St. Catherine of Siena Catholic School and Dundee Christian School.
Common Questions
What is Per Capita Income in West Dundee?
Per Capita income in West Dundee is $48,831.
What is the Median Family Income in West Dundee?
Median Family Income in West Dundee is $119,543.
What is the Median Household income in West Dundee?
Median Household Income in West Dundee is $99,653.
What is Income or Wage Gap in West Dundee?
Income or Wage Gap in West Dundee is 6.2%.
Women in West Dundee earn 93.8 cents for every dollar earned by a man.
What is Inequality or Gini Index in West Dundee?
Inequality or Gini Index in West Dundee is 0.39.
What is the Total Population of West Dundee?
Total Population of West Dundee is 7,845.
What is the Total Male Population of West Dundee?
Total Male Population of West Dundee is 4,127.
What is the Total Female Population of West Dundee?
Total Female Population of West Dundee is 3,718.
What is the Ratio of Males per 100 Females in West Dundee?
There are 111.00 Males per 100 Females in West Dundee.
What is the Ratio of Females per 100 Males in West Dundee?
There are 90.09 Females per 100 Males in West Dundee.
What is the Median Population Age in West Dundee?
Median Population Age in West Dundee is 34.8 Years.
What is the Average Family Size in West Dundee
Average Family Size in West Dundee is 3.0 People.
What is the Average Household Size in West Dundee
Average Household Size in West Dundee is 2.5 People.
How Large is the Labor Force in West Dundee?
There are 4,827 People in the Labor Forcein in West Dundee.
What is the Percentage of People in the Labor Force in West Dundee?
75.8% of People are in the Labor Force in West Dundee.
What is the Unemployment Rate in West Dundee?
Unemployment Rate in West Dundee is 4.3%.