Woodridge, IL Map & Demographics
Woodridge Map
Woodridge Overview
$48,262
PER CAPITA INCOME
$109,478
AVG FAMILY INCOME
$95,756
AVG HOUSEHOLD INCOME
25.6%
WAGE / INCOME GAP [ % ]
74.4¢/ $1
WAGE / INCOME GAP [ $ ]
0.42
INEQUALITY / GINI INDEX
34,027
TOTAL POPULATION
16,973
MALE POPULATION
17,054
FEMALE POPULATION
99.53
MALES / 100 FEMALES
100.48
FEMALES / 100 MALES
37.7
MEDIAN AGE
3.2
AVG FAMILY SIZE
2.6
AVG HOUSEHOLD SIZE
19,611
LABOR FORCE [ PEOPLE ]
73.1%
PERCENT IN LABOR FORCE
3.9%
UNEMPLOYMENT RATE
Woodridge Zip Codes
Income in Woodridge
Income Overview in Woodridge
Per Capita Income in Woodridge is $48,262, while median incomes of families and households are $109,478 and $95,756 respectively.
| Characteristic | Number | Measure |
| Per Capita Income | 34,027 | $48,262 |
| Median Family Income | 8,966 | $109,478 |
| Mean Family Income | 8,966 | $142,357 |
| Median Household Income | 13,084 | $95,756 |
| Mean Household Income | 13,084 | $123,605 |
| Income Deficit | 8,966 | $0 |
| Wage / Income Gap (%) | 34,027 | 25.64% |
| Wage / Income Gap ($) | 34,027 | 74.36¢ per $1 |
| Gini / Inequality Index | 34,027 | 0.42 |
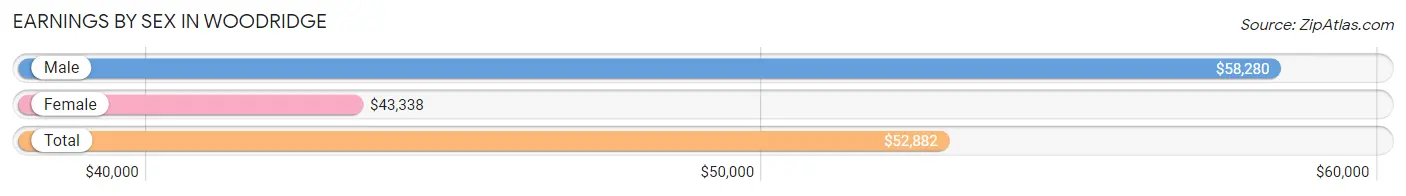
Earnings by Sex in Woodridge
Average Earnings in Woodridge are $52,882, $58,280 for men and $43,338 for women, a difference of 25.6%.
| Sex | Number | Average Earnings |
| Male | 10,941 (54.2%) | $58,280 |
| Female | 9,254 (45.8%) | $43,338 |
| Total | 20,195 (100.0%) | $52,882 |
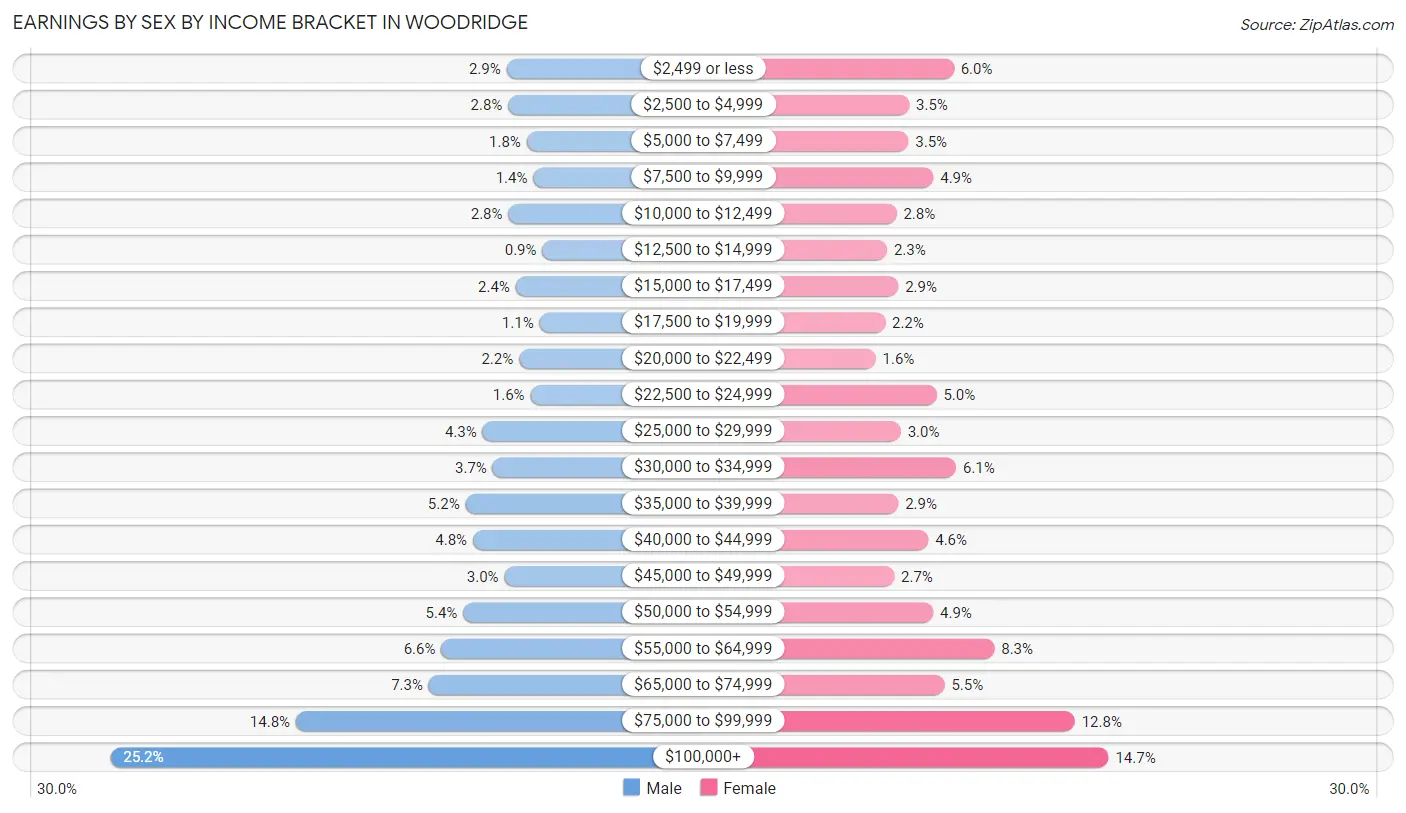
Earnings by Sex by Income Bracket in Woodridge
The most common earnings brackets in Woodridge are $100,000+ for men (2,755 | 25.2%) and $100,000+ for women (1,361 | 14.7%).
| Income | Male | Female |
| $2,499 or less | 318 (2.9%) | 556 (6.0%) |
| $2,500 to $4,999 | 308 (2.8%) | 324 (3.5%) |
| $5,000 to $7,499 | 195 (1.8%) | 320 (3.5%) |
| $7,500 to $9,999 | 154 (1.4%) | 450 (4.9%) |
| $10,000 to $12,499 | 307 (2.8%) | 258 (2.8%) |
| $12,500 to $14,999 | 98 (0.9%) | 209 (2.3%) |
| $15,000 to $17,499 | 263 (2.4%) | 267 (2.9%) |
| $17,500 to $19,999 | 116 (1.1%) | 199 (2.1%) |
| $20,000 to $22,499 | 242 (2.2%) | 150 (1.6%) |
| $22,500 to $24,999 | 172 (1.6%) | 466 (5.0%) |
| $25,000 to $29,999 | 466 (4.3%) | 280 (3.0%) |
| $30,000 to $34,999 | 404 (3.7%) | 568 (6.1%) |
| $35,000 to $39,999 | 571 (5.2%) | 267 (2.9%) |
| $40,000 to $44,999 | 525 (4.8%) | 424 (4.6%) |
| $45,000 to $49,999 | 331 (3.0%) | 246 (2.7%) |
| $50,000 to $54,999 | 585 (5.3%) | 449 (4.9%) |
| $55,000 to $64,999 | 720 (6.6%) | 767 (8.3%) |
| $65,000 to $74,999 | 797 (7.3%) | 508 (5.5%) |
| $75,000 to $99,999 | 1,614 (14.7%) | 1,185 (12.8%) |
| $100,000+ | 2,755 (25.2%) | 1,361 (14.7%) |
| Total | 10,941 (100.0%) | 9,254 (100.0%) |
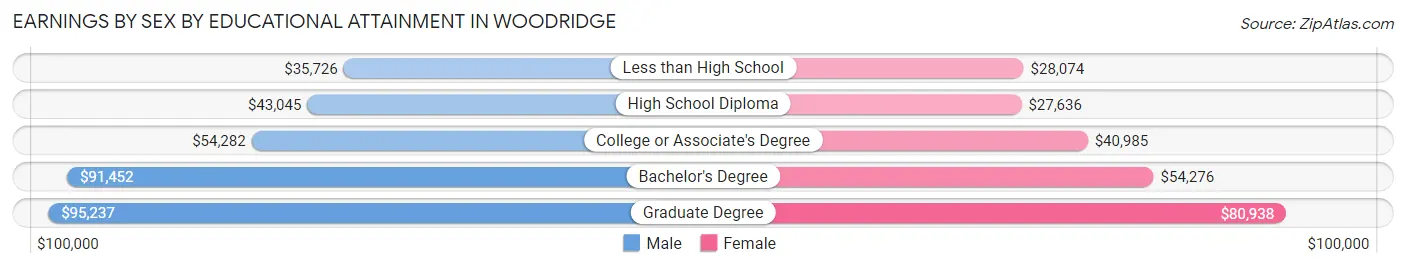
Earnings by Sex by Educational Attainment in Woodridge
Average earnings in Woodridge are $68,991 for men and $51,715 for women, a difference of 25.0%. Men with an educational attainment of graduate degree enjoy the highest average annual earnings of $95,237, while those with less than high school education earn the least with $35,726. Women with an educational attainment of graduate degree earn the most with the average annual earnings of $80,938, while those with high school diploma education have the smallest earnings of $27,636.
| Educational Attainment | Male Income | Female Income |
| Less than High School | $35,726 | $28,074 |
| High School Diploma | $43,045 | $27,636 |
| College or Associate's Degree | $54,282 | $40,985 |
| Bachelor's Degree | $91,452 | $54,276 |
| Graduate Degree | $95,237 | $80,938 |
| Total | $68,991 | $51,715 |
Family Income in Woodridge
Family Income Brackets in Woodridge
According to the Woodridge family income data, there are 1,802 families falling into the $200,000+ income range, which is the most common income bracket and makes up 20.1% of all families.
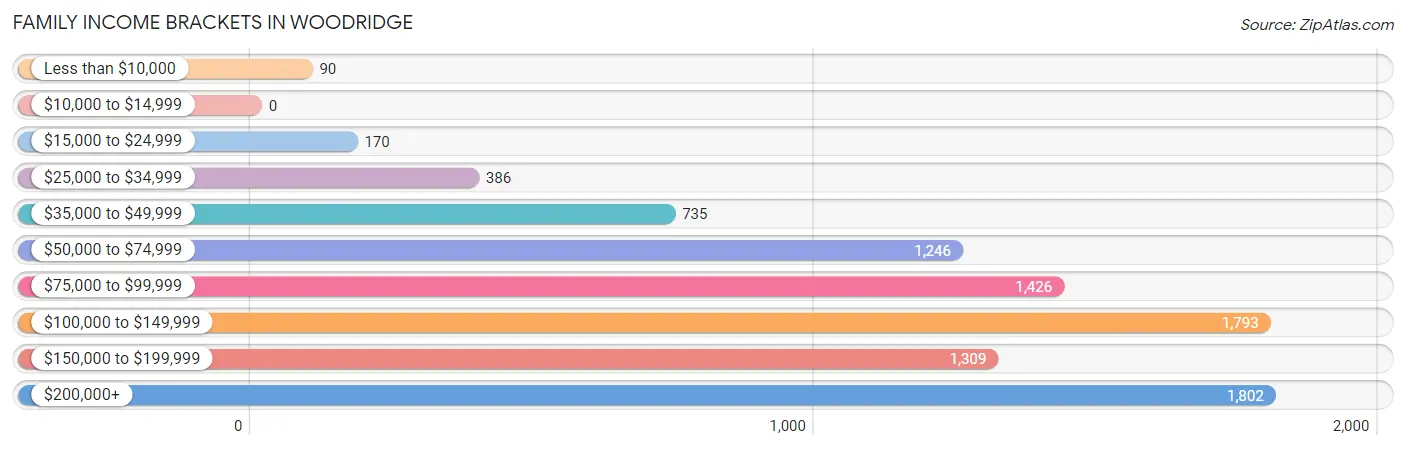
| Income Bracket | # Families | % Families |
| Less than $10,000 | 90 | 1.0% |
| $10,000 to $14,999 | 0 | 0.0% |
| $15,000 to $24,999 | 170 | 1.9% |
| $25,000 to $34,999 | 386 | 4.3% |
| $35,000 to $49,999 | 735 | 8.2% |
| $50,000 to $74,999 | 1,246 | 13.9% |
| $75,000 to $99,999 | 1,426 | 15.9% |
| $100,000 to $149,999 | 1,793 | 20.0% |
| $150,000 to $199,999 | 1,309 | 14.6% |
| $200,000+ | 1,802 | 20.1% |
Family Income by Famaliy Size in Woodridge
4-person families (1,805 | 20.1%) account for the highest median family income in Woodridge with $145,451 per family, while 2-person families (3,847 | 42.9%) have the highest median income of $50,161 per family member.
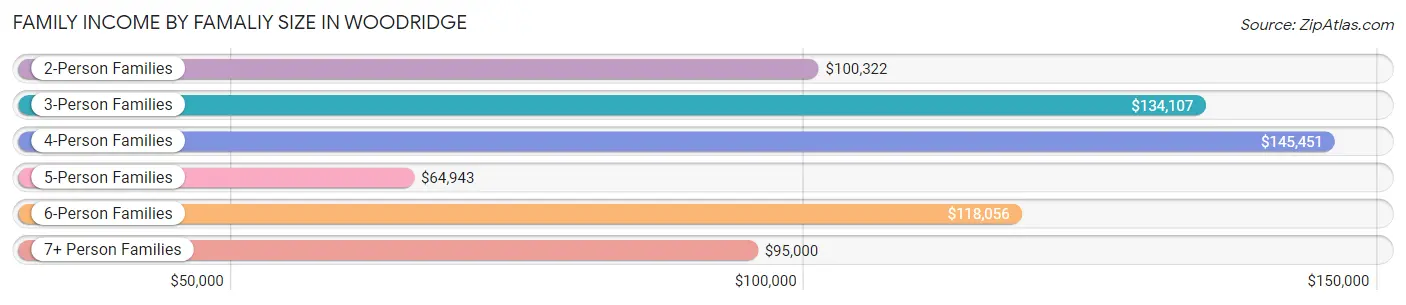
| Income Bracket | # Families | Median Income |
| 2-Person Families | 3,847 (42.9%) | $100,322 |
| 3-Person Families | 1,991 (22.2%) | $134,107 |
| 4-Person Families | 1,805 (20.1%) | $145,451 |
| 5-Person Families | 1,025 (11.4%) | $64,943 |
| 6-Person Families | 248 (2.8%) | $118,056 |
| 7+ Person Families | 50 (0.6%) | $95,000 |
| Total | 8,966 (100.0%) | $109,478 |
Family Income by Number of Earners in Woodridge
The median family income in Woodridge is $109,478, with families comprising 3+ earners (1,399) having the highest median family income of $152,321, while families with no earners (796) have the lowest median family income of $66,279, accounting for 15.6% and 8.9% of families, respectively.
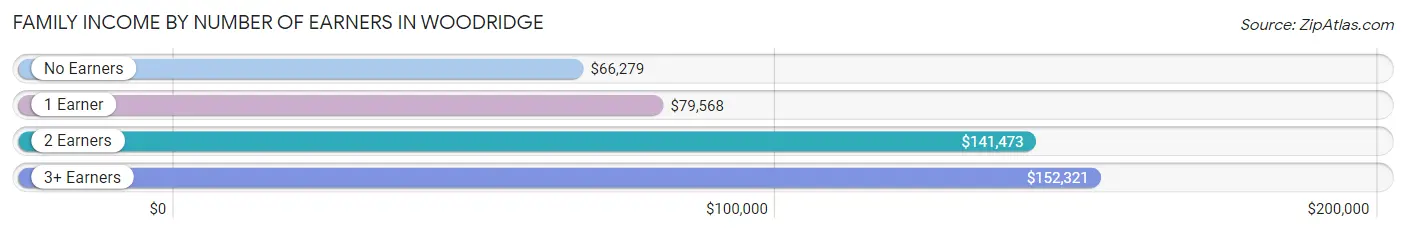
| Number of Earners | # Families | Median Income |
| No Earners | 796 (8.9%) | $66,279 |
| 1 Earner | 2,499 (27.9%) | $79,568 |
| 2 Earners | 4,272 (47.6%) | $141,473 |
| 3+ Earners | 1,399 (15.6%) | $152,321 |
| Total | 8,966 (100.0%) | $109,478 |
Household Income in Woodridge
Household Income Brackets in Woodridge
With 2,721 households falling in the category, the $100,000 to $149,999 income range is the most frequent in Woodridge, accounting for 20.8% of all households. In contrast, only 144 households (1.1%) fall into the $10,000 to $14,999 income bracket, making it the least populous group.
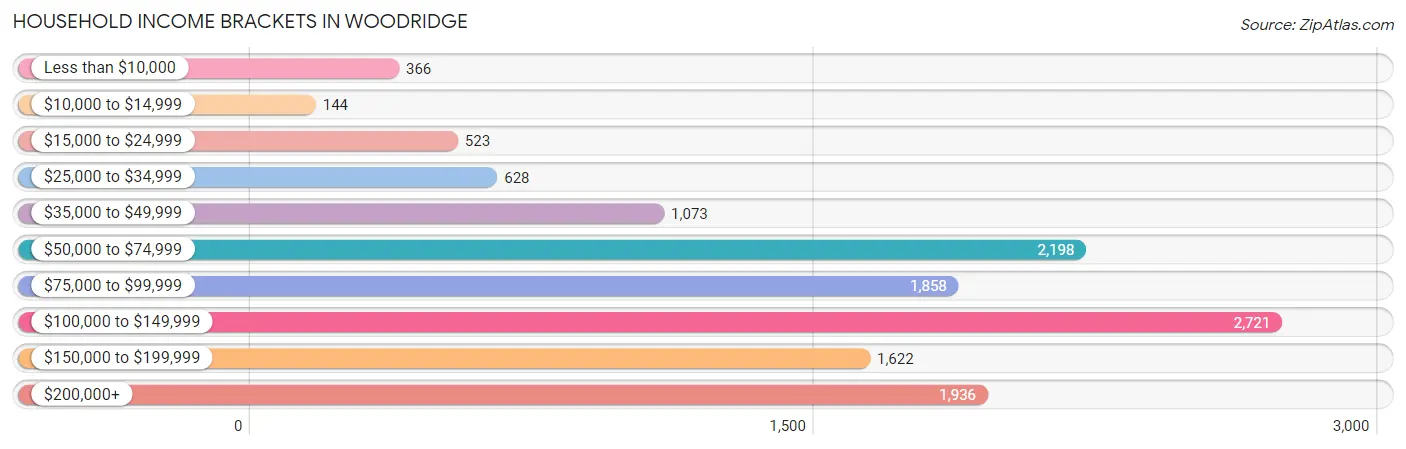
| Income Bracket | # Households | % Households |
| Less than $10,000 | 366 | 2.8% |
| $10,000 to $14,999 | 144 | 1.1% |
| $15,000 to $24,999 | 523 | 4.0% |
| $25,000 to $34,999 | 628 | 4.8% |
| $35,000 to $49,999 | 1,073 | 8.2% |
| $50,000 to $74,999 | 2,198 | 16.8% |
| $75,000 to $99,999 | 1,858 | 14.2% |
| $100,000 to $149,999 | 2,721 | 20.8% |
| $150,000 to $199,999 | 1,622 | 12.4% |
| $200,000+ | 1,936 | 14.8% |
Household Income by Householder Age in Woodridge
The median household income in Woodridge is $95,756, with the highest median household income of $112,397 found in the 45 to 64 years age bracket for the primary householder. A total of 5,506 households (42.1%) fall into this category. Meanwhile, the 15 to 24 years age bracket for the primary householder has the lowest median household income of $65,864, with 397 households (3.0%) in this group.
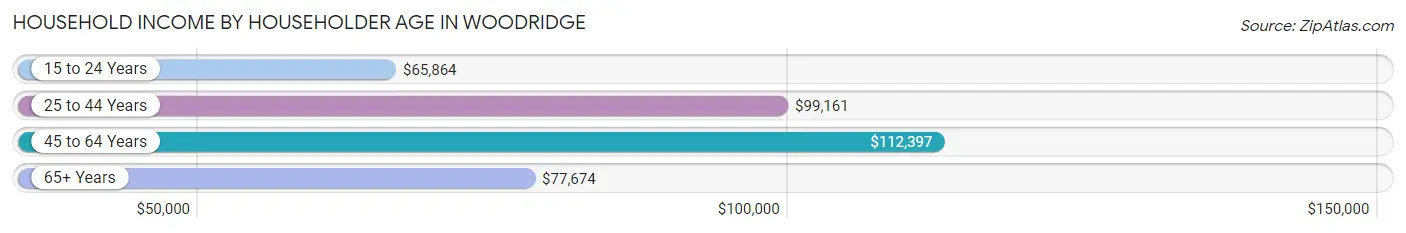
| Income Bracket | # Households | Median Income |
| 15 to 24 Years | 397 (3.0%) | $65,864 |
| 25 to 44 Years | 4,705 (36.0%) | $99,161 |
| 45 to 64 Years | 5,506 (42.1%) | $112,397 |
| 65+ Years | 2,476 (18.9%) | $77,674 |
| Total | 13,084 (100.0%) | $95,756 |
Poverty in Woodridge
Income Below Poverty by Sex and Age in Woodridge
With 3.5% poverty level for males and 6.1% for females among the residents of Woodridge, 15 year old males and 16 and 17 year old females are the most vulnerable to poverty, with 62 males (19.6%) and 129 females (24.4%) in their respective age groups living below the poverty level.
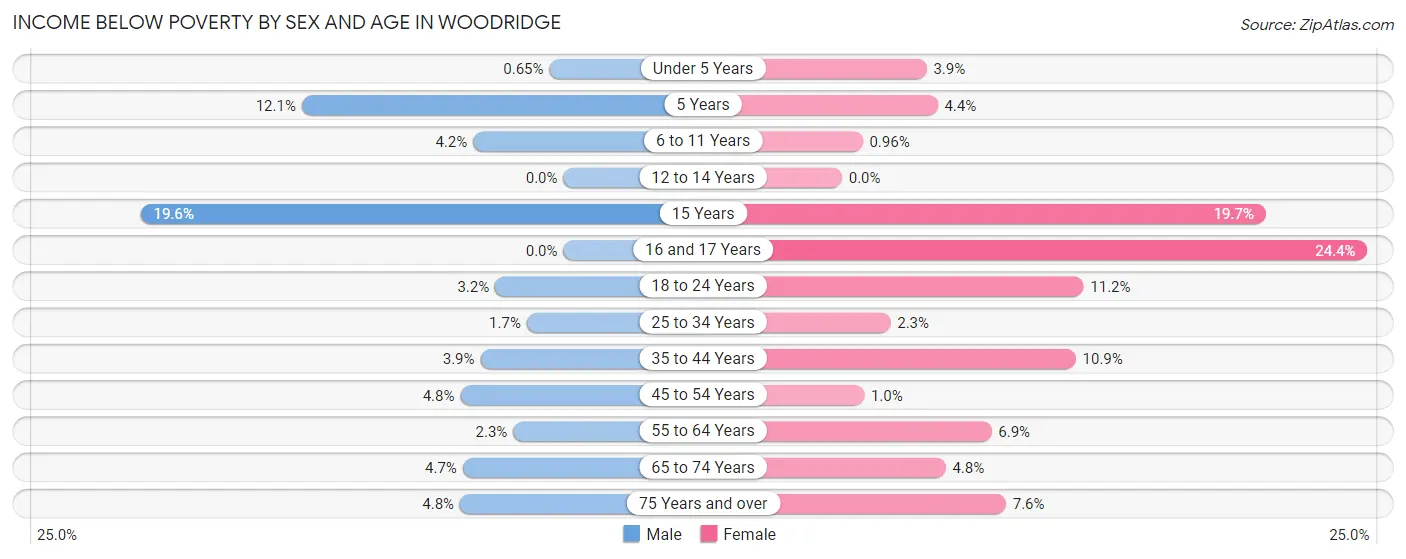
| Age Bracket | Male | Female |
| Under 5 Years | 8 (0.6%) | 35 (3.9%) |
| 5 Years | 25 (12.1%) | 13 (4.4%) |
| 6 to 11 Years | 63 (4.2%) | 13 (1.0%) |
| 12 to 14 Years | 0 (0.0%) | 0 (0.0%) |
| 15 Years | 62 (19.6%) | 59 (19.7%) |
| 16 and 17 Years | 0 (0.0%) | 129 (24.4%) |
| 18 to 24 Years | 53 (3.2%) | 115 (11.2%) |
| 25 to 34 Years | 48 (1.7%) | 49 (2.2%) |
| 35 to 44 Years | 97 (3.8%) | 276 (10.8%) |
| 45 to 54 Years | 99 (4.8%) | 20 (1.0%) |
| 55 to 64 Years | 49 (2.3%) | 219 (6.9%) |
| 65 to 74 Years | 61 (4.7%) | 64 (4.8%) |
| 75 Years and over | 35 (4.8%) | 53 (7.6%) |
| Total | 600 (3.5%) | 1,045 (6.1%) |
Income Above Poverty by Sex and Age in Woodridge
According to the poverty statistics in Woodridge, males aged 12 to 14 years and females aged 12 to 14 years are the age groups that are most secure financially, with 100.0% of males and 100.0% of females in these age groups living above the poverty line.
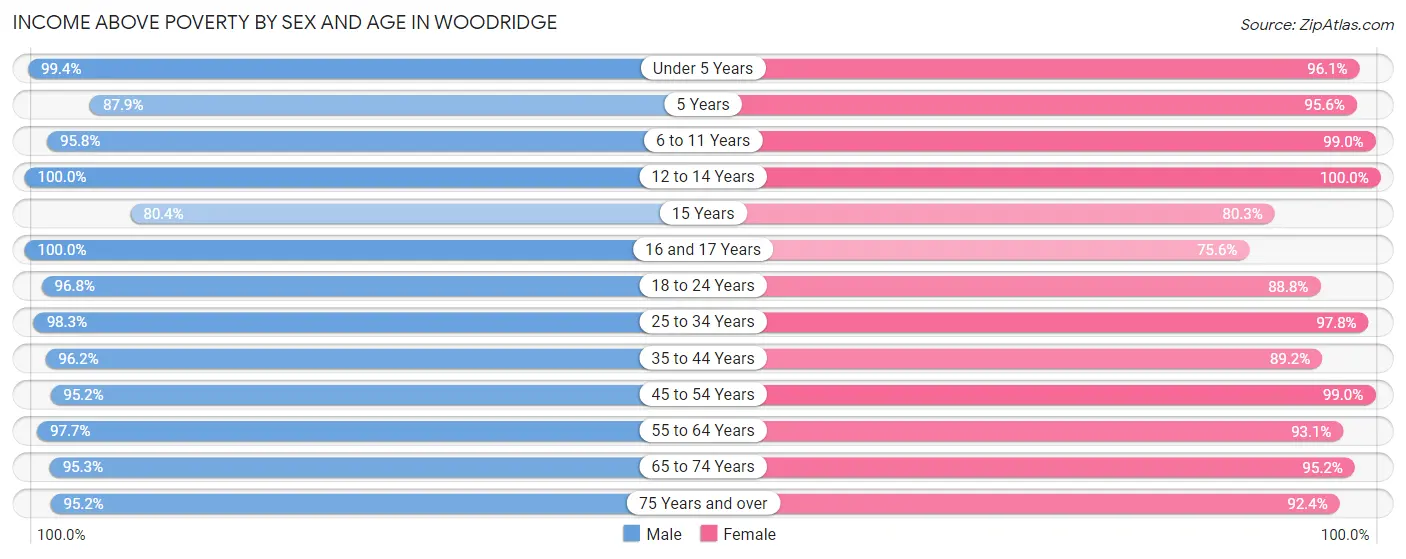
| Age Bracket | Male | Female |
| Under 5 Years | 1,217 (99.4%) | 856 (96.1%) |
| 5 Years | 181 (87.9%) | 280 (95.6%) |
| 6 to 11 Years | 1,439 (95.8%) | 1,346 (99.0%) |
| 12 to 14 Years | 282 (100.0%) | 797 (100.0%) |
| 15 Years | 254 (80.4%) | 241 (80.3%) |
| 16 and 17 Years | 171 (100.0%) | 400 (75.6%) |
| 18 to 24 Years | 1,619 (96.8%) | 911 (88.8%) |
| 25 to 34 Years | 2,779 (98.3%) | 2,129 (97.8%) |
| 35 to 44 Years | 2,422 (96.2%) | 2,267 (89.1%) |
| 45 to 54 Years | 1,972 (95.2%) | 1,918 (99.0%) |
| 55 to 64 Years | 2,052 (97.7%) | 2,936 (93.1%) |
| 65 to 74 Years | 1,244 (95.3%) | 1,266 (95.2%) |
| 75 Years and over | 694 (95.2%) | 643 (92.4%) |
| Total | 16,326 (96.5%) | 15,990 (93.9%) |
Income Below Poverty Among Married-Couple Families in Woodridge
The poverty statistics for married-couple families in Woodridge show that 1.4% or 99 of the total 6,887 families live below the poverty line. Families with 3 or 4 children have the highest poverty rate of 7.8%, comprising of 56 families. On the other hand, families with no children have the lowest poverty rate of 0.4%, which includes 14 families.
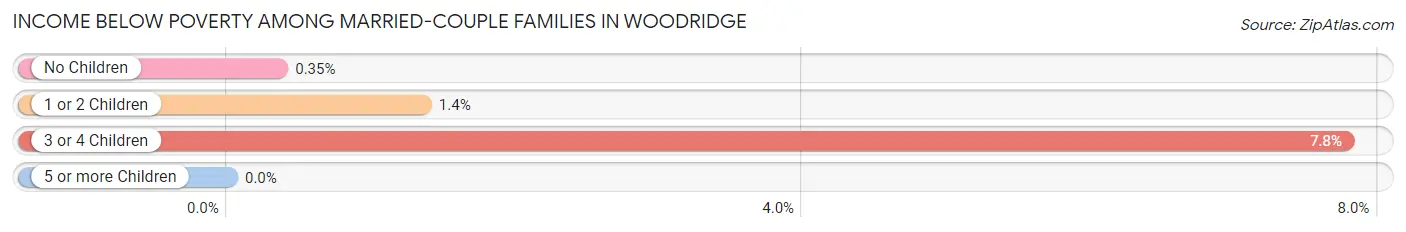
| Children | Above Poverty | Below Poverty |
| No Children | 4,007 (99.7%) | 14 (0.4%) |
| 1 or 2 Children | 2,116 (98.7%) | 29 (1.3%) |
| 3 or 4 Children | 665 (92.2%) | 56 (7.8%) |
| 5 or more Children | 0 (0.0%) | 0 (0.0%) |
| Total | 6,788 (98.6%) | 99 (1.4%) |
Income Below Poverty Among Single-Parent Households in Woodridge
According to the poverty data in Woodridge, 1.8% or 10 single-father households and 6.7% or 101 single-mother households are living below the poverty line. Among single-father households, those with 1 or 2 children have the highest poverty rate, with 10 households (7.8%) experiencing poverty. Likewise, among single-mother households, those with 3 or 4 children have the highest poverty rate, with 24 households (12.1%) falling below the poverty line.
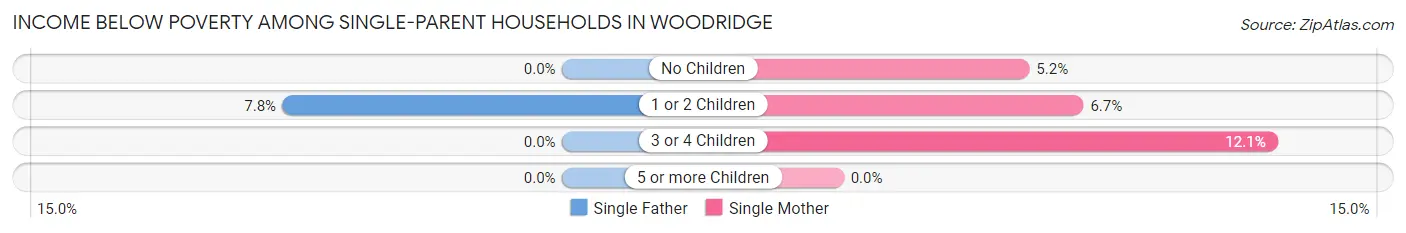
| Children | Single Father | Single Mother |
| No Children | 0 (0.0%) | 38 (5.2%) |
| 1 or 2 Children | 10 (7.8%) | 39 (6.7%) |
| 3 or 4 Children | 0 (0.0%) | 24 (12.1%) |
| 5 or more Children | 0 (0.0%) | 0 (0.0%) |
| Total | 10 (1.8%) | 101 (6.7%) |
Income Below Poverty Among Married-Couple vs Single-Parent Households in Woodridge
The poverty data for Woodridge shows that 99 of the married-couple family households (1.4%) and 111 of the single-parent households (5.3%) are living below the poverty level. Within the married-couple family households, those with 3 or 4 children have the highest poverty rate, with 56 households (7.8%) falling below the poverty line. Among the single-parent households, those with 3 or 4 children have the highest poverty rate, with 24 household (8.7%) living below poverty.
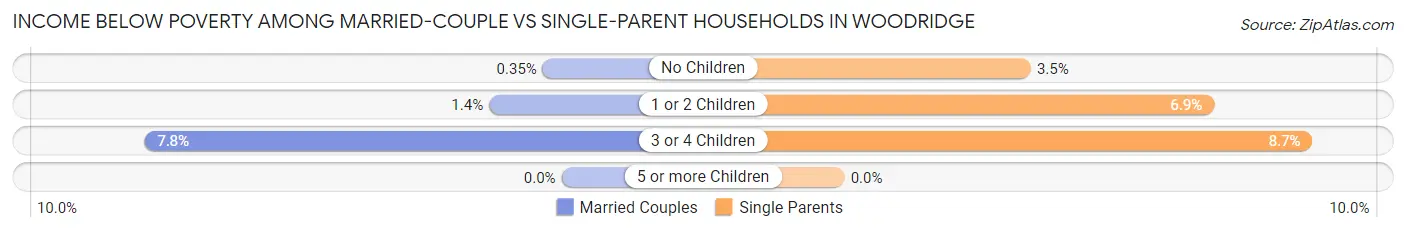
| Children | Married-Couple Families | Single-Parent Households |
| No Children | 14 (0.4%) | 38 (3.5%) |
| 1 or 2 Children | 29 (1.3%) | 49 (6.9%) |
| 3 or 4 Children | 56 (7.8%) | 24 (8.7%) |
| 5 or more Children | 0 (0.0%) | 0 (0.0%) |
| Total | 99 (1.4%) | 111 (5.3%) |
Race in Woodridge
The most populous races in Woodridge are White / Caucasian (22,262 | 65.4%), Hispanic or Latino (5,343 | 15.7%), and Asian (4,201 | 12.3%).
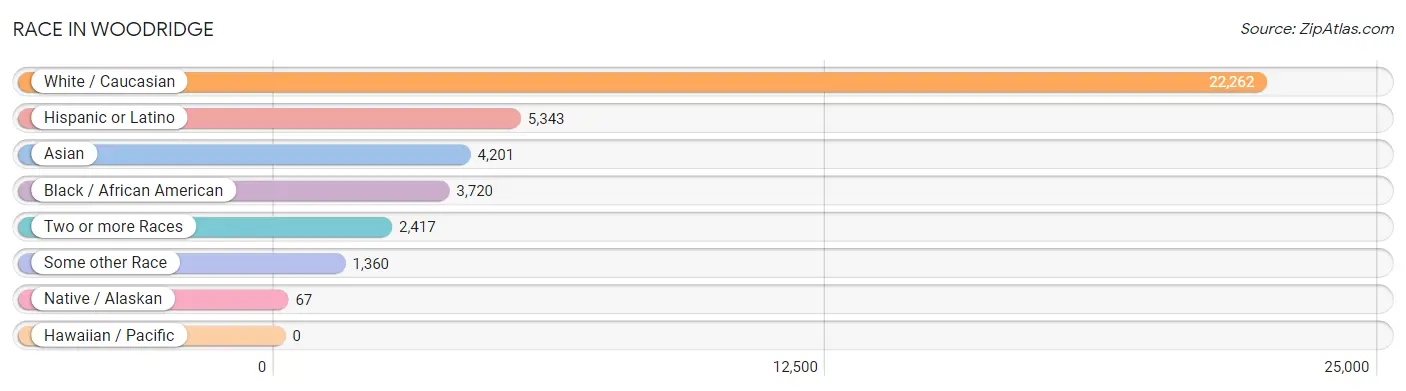
| Race | # Population | % Population |
| Asian | 4,201 | 12.3% |
| Black / African American | 3,720 | 10.9% |
| Hawaiian / Pacific | 0 | 0.0% |
| Hispanic or Latino | 5,343 | 15.7% |
| Native / Alaskan | 67 | 0.2% |
| White / Caucasian | 22,262 | 65.4% |
| Two or more Races | 2,417 | 7.1% |
| Some other Race | 1,360 | 4.0% |
| Total | 34,027 | 100.0% |
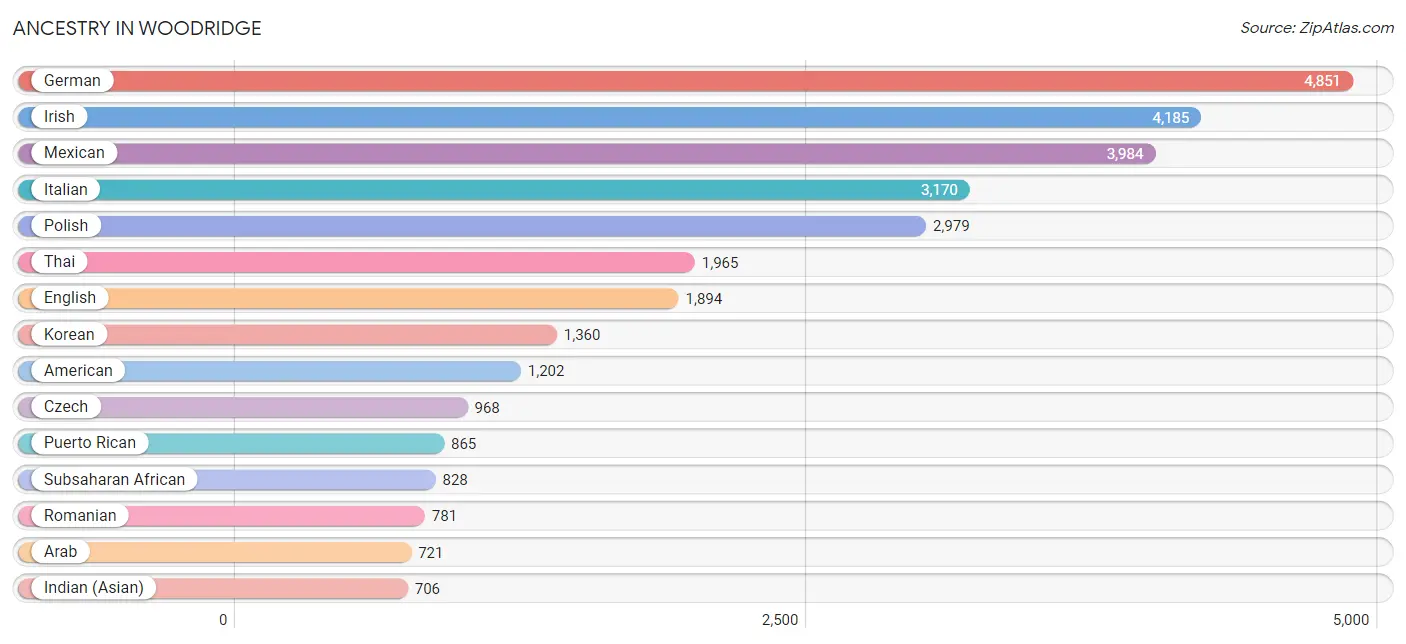
Ancestry in Woodridge
The most populous ancestries reported in Woodridge are German (4,851 | 14.3%), Irish (4,185 | 12.3%), Mexican (3,984 | 11.7%), Italian (3,170 | 9.3%), and Polish (2,979 | 8.7%), together accounting for 56.3% of all Woodridge residents.
| Ancestry | # Population | % Population |
| Afghan | 12 | 0.0% |
| African | 144 | 0.4% |
| American | 1,202 | 3.5% |
| Arab | 721 | 2.1% |
| Argentinean | 15 | 0.0% |
| Assyrian / Chaldean / Syriac | 5 | 0.0% |
| Austrian | 176 | 0.5% |
| Barbadian | 7 | 0.0% |
| Belgian | 8 | 0.0% |
| Bhutanese | 131 | 0.4% |
| Brazilian | 45 | 0.1% |
| British | 85 | 0.3% |
| Burmese | 85 | 0.3% |
| Canadian | 4 | 0.0% |
| Central American | 34 | 0.1% |
| Cherokee | 54 | 0.2% |
| Chilean | 60 | 0.2% |
| Choctaw | 9 | 0.0% |
| Colombian | 29 | 0.1% |
| Costa Rican | 22 | 0.1% |
| Croatian | 97 | 0.3% |
| Cuban | 114 | 0.3% |
| Czech | 968 | 2.8% |
| Czechoslovakian | 154 | 0.4% |
| Danish | 192 | 0.6% |
| Dutch | 488 | 1.4% |
| Eastern European | 92 | 0.3% |
| Ecuadorian | 50 | 0.2% |
| Egyptian | 213 | 0.6% |
| English | 1,894 | 5.6% |
| Estonian | 11 | 0.0% |
| European | 195 | 0.6% |
| Filipino | 41 | 0.1% |
| Finnish | 54 | 0.2% |
| French | 366 | 1.1% |
| French Canadian | 43 | 0.1% |
| German | 4,851 | 14.3% |
| Ghanaian | 630 | 1.8% |
| Greek | 492 | 1.5% |
| Hungarian | 54 | 0.2% |
| Indian (Asian) | 706 | 2.1% |
| Irish | 4,185 | 12.3% |
| Iroquois | 31 | 0.1% |
| Israeli | 16 | 0.1% |
| Italian | 3,170 | 9.3% |
| Jamaican | 16 | 0.1% |
| Japanese | 22 | 0.1% |
| Jordanian | 27 | 0.1% |
| Korean | 1,360 | 4.0% |
| Latvian | 23 | 0.1% |
| Lebanese | 257 | 0.8% |
| Lithuanian | 485 | 1.4% |
| Luxembourger | 6 | 0.0% |
| Macedonian | 35 | 0.1% |
| Mexican | 3,984 | 11.7% |
| Mexican American Indian | 25 | 0.1% |
| Nicaraguan | 12 | 0.0% |
| Nigerian | 54 | 0.2% |
| Northern European | 19 | 0.1% |
| Norwegian | 424 | 1.3% |
| Pakistani | 58 | 0.2% |
| Palestinian | 8 | 0.0% |
| Peruvian | 6 | 0.0% |
| Polish | 2,979 | 8.7% |
| Puerto Rican | 865 | 2.5% |
| Romanian | 781 | 2.3% |
| Russian | 181 | 0.5% |
| Scandinavian | 3 | 0.0% |
| Scotch-Irish | 150 | 0.4% |
| Scottish | 310 | 0.9% |
| Serbian | 52 | 0.2% |
| Sioux | 5 | 0.0% |
| Slovak | 91 | 0.3% |
| Slovene | 30 | 0.1% |
| South American | 214 | 0.6% |
| Spaniard | 48 | 0.1% |
| Spanish | 76 | 0.2% |
| Sri Lankan | 136 | 0.4% |
| Subsaharan African | 828 | 2.4% |
| Swedish | 591 | 1.7% |
| Thai | 1,965 | 5.8% |
| Turkish | 48 | 0.1% |
| Ukrainian | 377 | 1.1% |
| Uruguayan | 43 | 0.1% |
| Venezuelan | 11 | 0.0% |
| Welsh | 59 | 0.2% |
| Yugoslavian | 1 | 0.0% | View All 87 Rows |
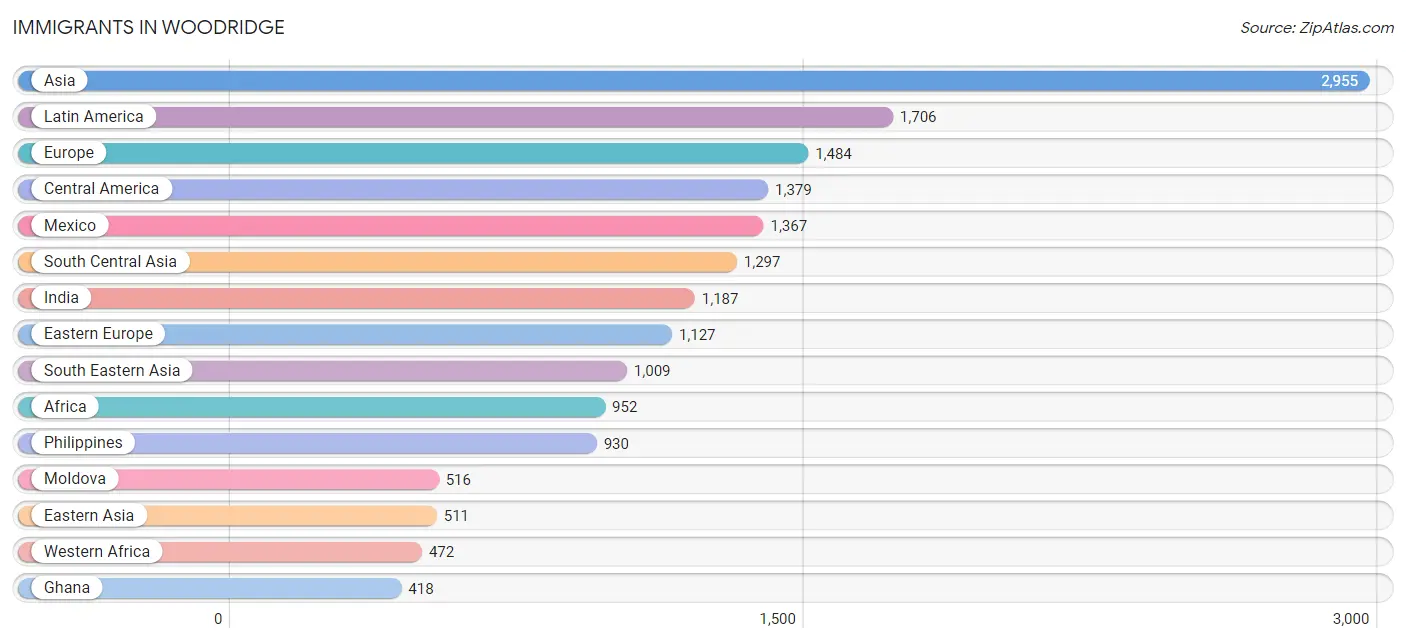
Immigrants in Woodridge
The most numerous immigrant groups reported in Woodridge came from Asia (2,955 | 8.7%), Latin America (1,706 | 5.0%), Europe (1,484 | 4.4%), Central America (1,379 | 4.1%), and Mexico (1,367 | 4.0%), together accounting for 26.1% of all Woodridge residents.
| Immigration Origin | # Population | % Population |
| Afghanistan | 12 | 0.0% |
| Africa | 952 | 2.8% |
| Argentina | 7 | 0.0% |
| Asia | 2,955 | 8.7% |
| Australia | 7 | 0.0% |
| Austria | 23 | 0.1% |
| Bangladesh | 6 | 0.0% |
| Brazil | 40 | 0.1% |
| Cambodia | 22 | 0.1% |
| Canada | 49 | 0.1% |
| Caribbean | 68 | 0.2% |
| Central America | 1,379 | 4.1% |
| China | 361 | 1.1% |
| Colombia | 12 | 0.0% |
| Congo | 10 | 0.0% |
| Croatia | 6 | 0.0% |
| Cuba | 53 | 0.2% |
| Czechoslovakia | 49 | 0.1% |
| Eastern Africa | 57 | 0.2% |
| Eastern Asia | 511 | 1.5% |
| Eastern Europe | 1,127 | 3.3% |
| Ecuador | 36 | 0.1% |
| Egypt | 219 | 0.6% |
| Europe | 1,484 | 4.4% |
| Germany | 118 | 0.4% |
| Ghana | 418 | 1.2% |
| Hong Kong | 35 | 0.1% |
| India | 1,187 | 3.5% |
| Ireland | 10 | 0.0% |
| Italy | 120 | 0.4% |
| Jamaica | 15 | 0.0% |
| Jordan | 27 | 0.1% |
| Kenya | 23 | 0.1% |
| Korea | 150 | 0.4% |
| Latin America | 1,706 | 5.0% |
| Latvia | 14 | 0.0% |
| Lebanon | 8 | 0.0% |
| Lithuania | 73 | 0.2% |
| Mexico | 1,367 | 4.0% |
| Middle Africa | 31 | 0.1% |
| Moldova | 516 | 1.5% |
| Netherlands | 12 | 0.0% |
| Nicaragua | 12 | 0.0% |
| Nigeria | 54 | 0.2% |
| North Macedonia | 16 | 0.1% |
| Northern Africa | 392 | 1.1% |
| Northern Europe | 84 | 0.3% |
| Oceania | 7 | 0.0% |
| Pakistan | 92 | 0.3% |
| Peru | 6 | 0.0% |
| Philippines | 930 | 2.7% |
| Poland | 140 | 0.4% |
| Romania | 38 | 0.1% |
| Russia | 75 | 0.2% |
| Saudi Arabia | 38 | 0.1% |
| Serbia | 15 | 0.0% |
| South America | 259 | 0.8% |
| South Central Asia | 1,297 | 3.8% |
| South Eastern Asia | 1,009 | 3.0% |
| Southern Europe | 120 | 0.4% |
| Taiwan | 87 | 0.3% |
| Turkey | 28 | 0.1% |
| Uganda | 34 | 0.1% |
| Ukraine | 180 | 0.5% |
| Uruguay | 46 | 0.1% |
| Venezuela | 112 | 0.3% |
| Vietnam | 57 | 0.2% |
| Western Africa | 472 | 1.4% |
| Western Asia | 138 | 0.4% |
| Western Europe | 153 | 0.4% |
| Zaire | 21 | 0.1% | View All 71 Rows |
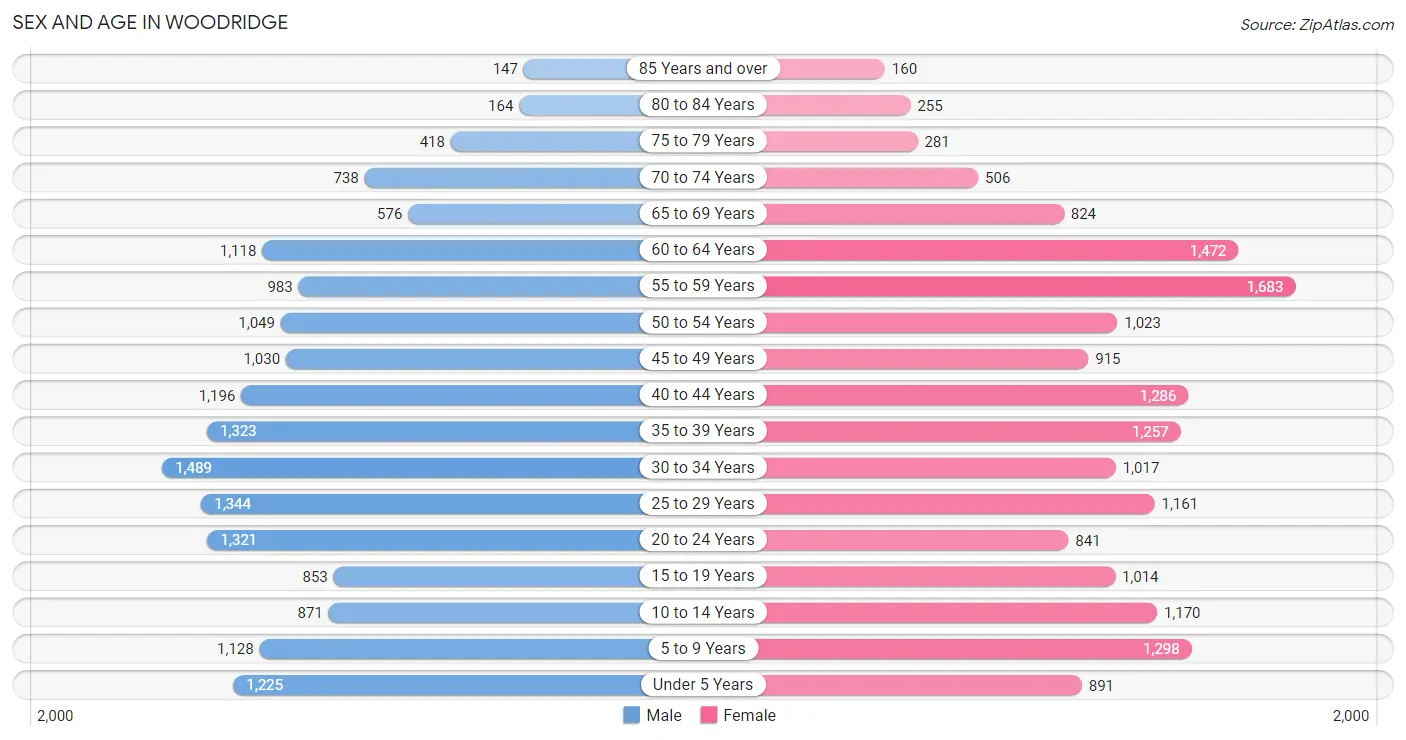
Sex and Age in Woodridge
Sex and Age in Woodridge
The most populous age groups in Woodridge are 30 to 34 Years (1,489 | 8.8%) for men and 55 to 59 Years (1,683 | 9.9%) for women.
| Age Bracket | Male | Female |
| Under 5 Years | 1,225 (7.2%) | 891 (5.2%) |
| 5 to 9 Years | 1,128 (6.7%) | 1,298 (7.6%) |
| 10 to 14 Years | 871 (5.1%) | 1,170 (6.9%) |
| 15 to 19 Years | 853 (5.0%) | 1,014 (5.9%) |
| 20 to 24 Years | 1,321 (7.8%) | 841 (4.9%) |
| 25 to 29 Years | 1,344 (7.9%) | 1,161 (6.8%) |
| 30 to 34 Years | 1,489 (8.8%) | 1,017 (6.0%) |
| 35 to 39 Years | 1,323 (7.8%) | 1,257 (7.4%) |
| 40 to 44 Years | 1,196 (7.0%) | 1,286 (7.5%) |
| 45 to 49 Years | 1,030 (6.1%) | 915 (5.4%) |
| 50 to 54 Years | 1,049 (6.2%) | 1,023 (6.0%) |
| 55 to 59 Years | 983 (5.8%) | 1,683 (9.9%) |
| 60 to 64 Years | 1,118 (6.6%) | 1,472 (8.6%) |
| 65 to 69 Years | 576 (3.4%) | 824 (4.8%) |
| 70 to 74 Years | 738 (4.3%) | 506 (3.0%) |
| 75 to 79 Years | 418 (2.5%) | 281 (1.7%) |
| 80 to 84 Years | 164 (1.0%) | 255 (1.5%) |
| 85 Years and over | 147 (0.9%) | 160 (0.9%) |
| Total | 16,973 (100.0%) | 17,054 (100.0%) |
Families and Households in Woodridge
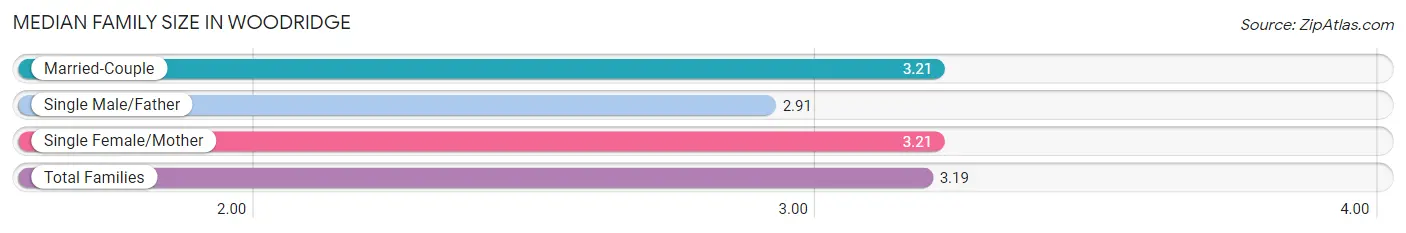
Median Family Size in Woodridge
The median family size in Woodridge is 3.19 persons per family, with married-couple families (6,887 | 76.8%) accounting for the largest median family size of 3.21 persons per family. On the other hand, single male/father families (567 | 6.3%) represent the smallest median family size with 2.91 persons per family.
| Family Type | # Families | Family Size |
| Married-Couple | 6,887 (76.8%) | 3.21 |
| Single Male/Father | 567 (6.3%) | 2.91 |
| Single Female/Mother | 1,512 (16.9%) | 3.21 |
| Total Families | 8,966 (100.0%) | 3.19 |
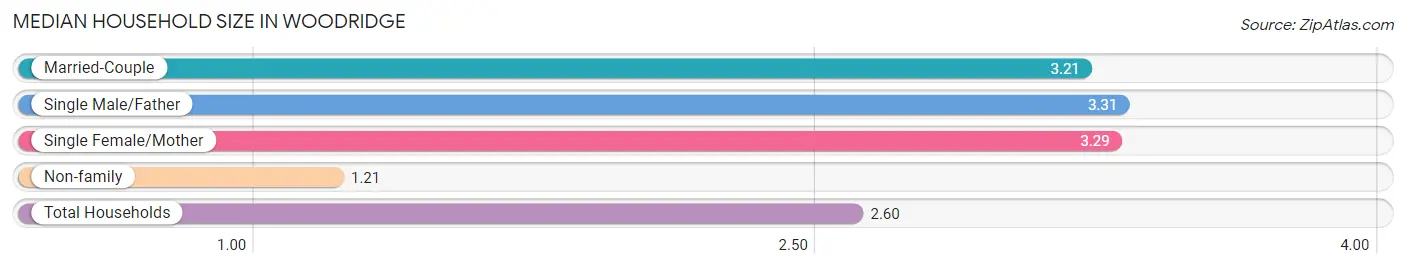
Median Household Size in Woodridge
The median household size in Woodridge is 2.60 persons per household, with single male/father households (567 | 4.3%) accounting for the largest median household size of 3.31 persons per household. non-family households (4,118 | 31.5%) represent the smallest median household size with 1.21 persons per household.
| Household Type | # Households | Household Size |
| Married-Couple | 6,887 (52.6%) | 3.21 |
| Single Male/Father | 567 (4.3%) | 3.31 |
| Single Female/Mother | 1,512 (11.6%) | 3.29 |
| Non-family | 4,118 (31.5%) | 1.21 |
| Total Households | 13,084 (100.0%) | 2.60 |
Household Size by Marriage Status in Woodridge
Out of a total of 13,084 households in Woodridge, 8,966 (68.5%) are family households, while 4,118 (31.5%) are nonfamily households. The most numerous type of family households are 2-person households, comprising 3,758, and the most common type of nonfamily households are 1-person households, comprising 3,419.
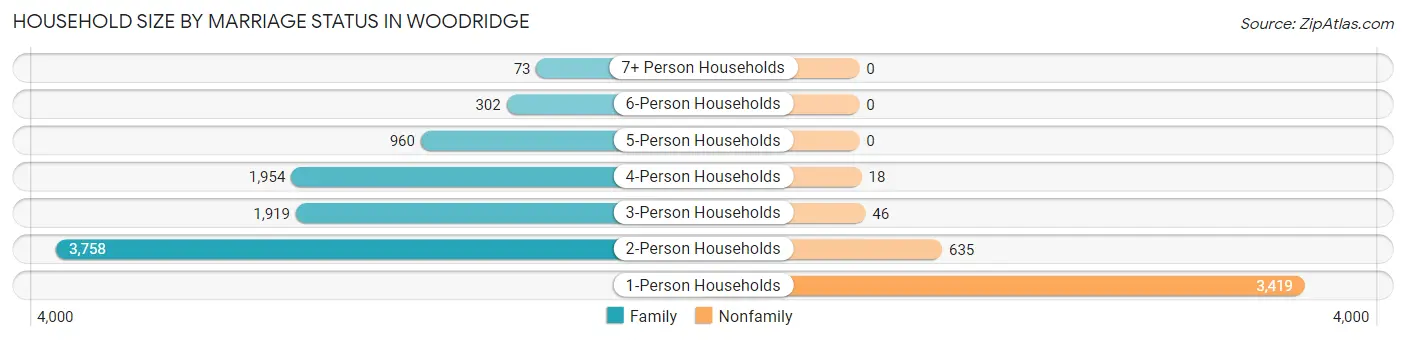
| Household Size | Family Households | Nonfamily Households |
| 1-Person Households | - | 3,419 (26.1%) |
| 2-Person Households | 3,758 (28.7%) | 635 (4.9%) |
| 3-Person Households | 1,919 (14.7%) | 46 (0.4%) |
| 4-Person Households | 1,954 (14.9%) | 18 (0.1%) |
| 5-Person Households | 960 (7.3%) | 0 (0.0%) |
| 6-Person Households | 302 (2.3%) | 0 (0.0%) |
| 7+ Person Households | 73 (0.6%) | 0 (0.0%) |
| Total | 8,966 (68.5%) | 4,118 (31.5%) |
Female Fertility in Woodridge
Fertility by Age in Woodridge
Average fertility rate in Woodridge is 57.0 births per 1,000 women. Women in the age bracket of 20 to 34 years have the highest fertility rate with 107.0 births per 1,000 women. Women in the age bracket of 20 to 34 years acount for 73.9% of all women with births.
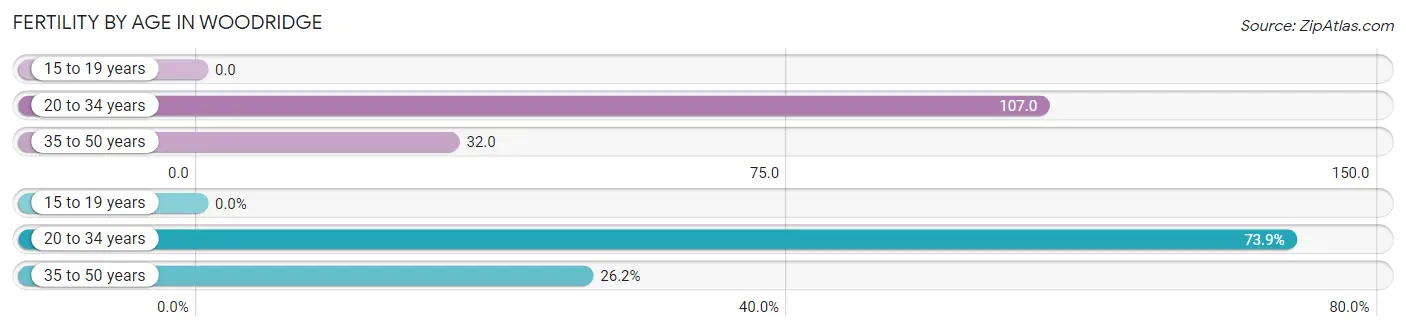
| Age Bracket | Women with Births | Births / 1,000 Women |
| 15 to 19 years | 0 (0.0%) | 0.0 |
| 20 to 34 years | 322 (73.9%) | 107.0 |
| 35 to 50 years | 114 (26.2%) | 32.0 |
| Total | 436 (100.0%) | 57.0 |
Fertility by Age by Marriage Status in Woodridge
64.7% of women with births (436) in Woodridge are married. The highest percentage of unmarried women with births falls into 20 to 34 years age bracket with 47.8% of them unmarried at the time of birth, while the lowest percentage of unmarried women with births belong to 35 to 50 years age bracket with 0.0% of them unmarried.
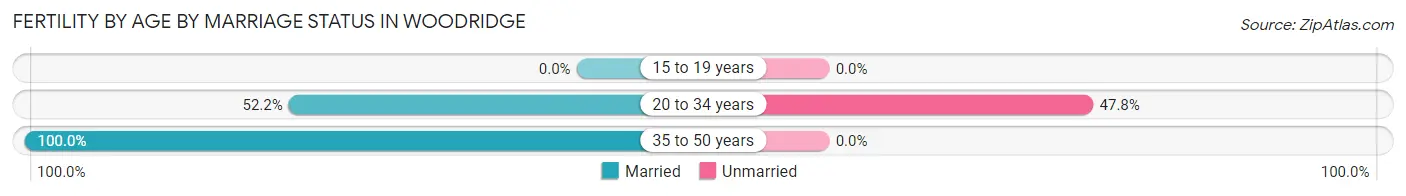
| Age Bracket | Married | Unmarried |
| 15 to 19 years | 0 (0.0%) | 0 (0.0%) |
| 20 to 34 years | 168 (52.2%) | 154 (47.8%) |
| 35 to 50 years | 114 (100.0%) | 0 (0.0%) |
| Total | 282 (64.7%) | 154 (35.3%) |
Fertility by Education in Woodridge
Average fertility rate in Woodridge is 57.0 births per 1,000 women. Women with the education attainment of graduate degree have the highest fertility rate of 87.0 births per 1,000 women, while women with the education attainment of less than high school have the lowest fertility at 6.0 births per 1,000 women. Women with the education attainment of bachelor's degree represent 38.3% of all women with births.
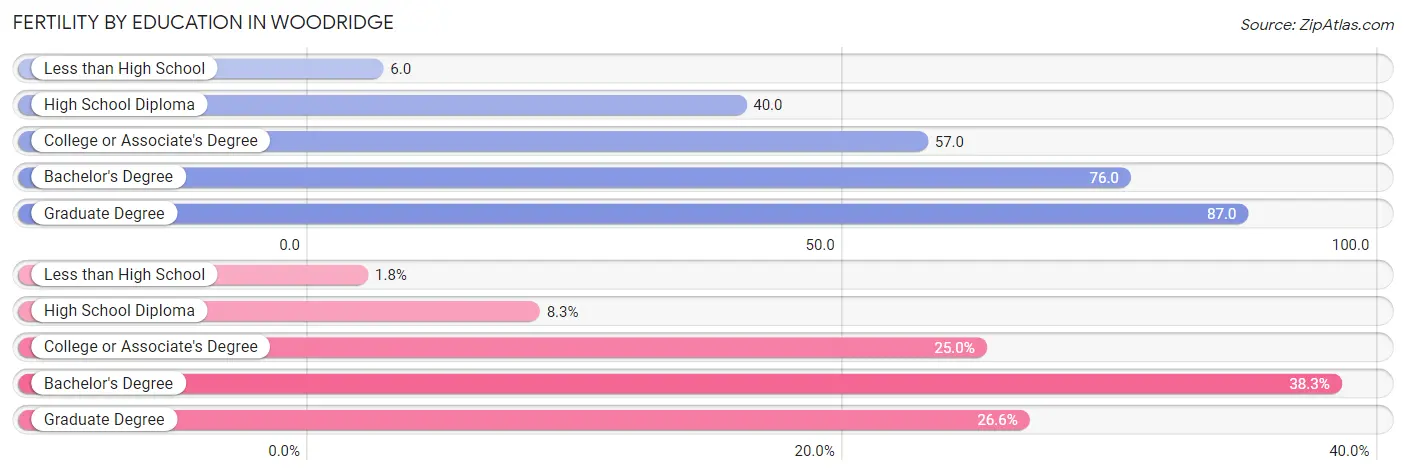
| Educational Attainment | Women with Births | Births / 1,000 Women |
| Less than High School | 8 (1.8%) | 6.0 |
| High School Diploma | 36 (8.3%) | 40.0 |
| College or Associate's Degree | 109 (25.0%) | 57.0 |
| Bachelor's Degree | 167 (38.3%) | 76.0 |
| Graduate Degree | 116 (26.6%) | 87.0 |
| Total | 436 (100.0%) | 57.0 |
Fertility by Education by Marriage Status in Woodridge
35.3% of women with births in Woodridge are unmarried. Women with the educational attainment of less than high school are most likely to be married with 100.0% of them married at childbirth, while women with the educational attainment of bachelor's degree are least likely to be married with 58.7% of them unmarried at childbirth.
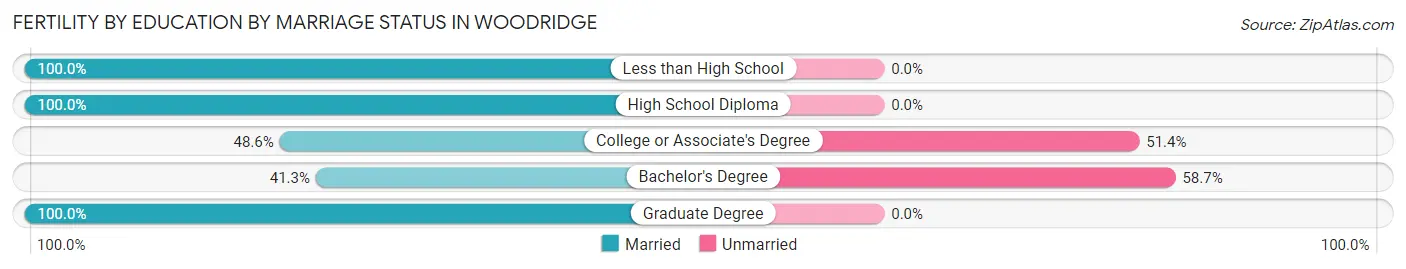
| Educational Attainment | Married | Unmarried |
| Less than High School | 8 (100.0%) | 0 (0.0%) |
| High School Diploma | 36 (100.0%) | 0 (0.0%) |
| College or Associate's Degree | 53 (48.6%) | 56 (51.4%) |
| Bachelor's Degree | 69 (41.3%) | 98 (58.7%) |
| Graduate Degree | 116 (100.0%) | 0 (0.0%) |
| Total | 282 (64.7%) | 154 (35.3%) |
Employment Characteristics in Woodridge
Employment by Class of Employer in Woodridge
Among the 18,477 employed individuals in Woodridge, private company employees (13,785 | 74.6%), not-for-profit organizations (1,425 | 7.7%), and local government employees (1,049 | 5.7%) make up the most common classes of employment.

| Employer Class | # Employees | % Employees |
| Private Company Employees | 13,785 | 74.6% |
| Self-Employed (Incorporated) | 898 | 4.9% |
| Self-Employed (Not Incorporated) | 683 | 3.7% |
| Not-for-profit Organizations | 1,425 | 7.7% |
| Local Government Employees | 1,049 | 5.7% |
| State Government Employees | 326 | 1.8% |
| Federal Government Employees | 299 | 1.6% |
| Unpaid Family Workers | 12 | 0.1% |
| Total | 18,477 | 100.0% |
Employment Status by Age in Woodridge
According to the labor force statistics for Woodridge, out of the total population over 16 years of age (26,828), 73.1% or 19,611 individuals are in the labor force, with 3.9% or 765 of them unemployed. The age group with the highest labor force participation rate is 35 to 44 years, with 89.3% or 4,520 individuals in the labor force. Within the labor force, the 20 to 24 years age range has the highest percentage of unemployed individuals, with 12.6% or 227 of them being unemployed.
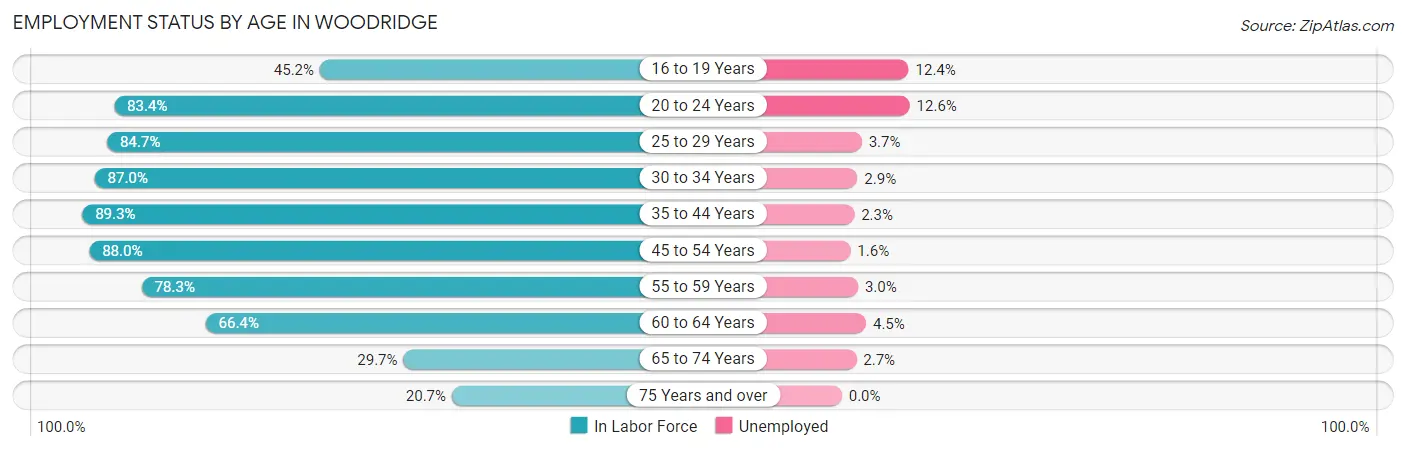
| Age Bracket | In Labor Force | Unemployed |
| 16 to 19 Years | 565 (45.2%) | 70 (12.4%) |
| 20 to 24 Years | 1,803 (83.4%) | 227 (12.6%) |
| 25 to 29 Years | 2,122 (84.7%) | 79 (3.7%) |
| 30 to 34 Years | 2,180 (87.0%) | 63 (2.9%) |
| 35 to 44 Years | 4,520 (89.3%) | 104 (2.3%) |
| 45 to 54 Years | 3,535 (88.0%) | 57 (1.6%) |
| 55 to 59 Years | 2,087 (78.3%) | 63 (3.0%) |
| 60 to 64 Years | 1,720 (66.4%) | 77 (4.5%) |
| 65 to 74 Years | 785 (29.7%) | 21 (2.7%) |
| 75 Years and over | 295 (20.7%) | 0 (0.0%) |
| Total | 19,611 (73.1%) | 765 (3.9%) |
Employment Status by Educational Attainment in Woodridge
According to labor force statistics for Woodridge, 83.5% of individuals (16,154) out of the total population between 25 and 64 years of age (19,346) are in the labor force, with 2.7% or 436 of them being unemployed. The group with the highest labor force participation rate are those with the educational attainment of bachelor's degree or higher, with 89.0% or 8,369 individuals in the labor force. Within the labor force, individuals with college / associate degree education have the highest percentage of unemployment, with 3.5% or 165 of them being unemployed.
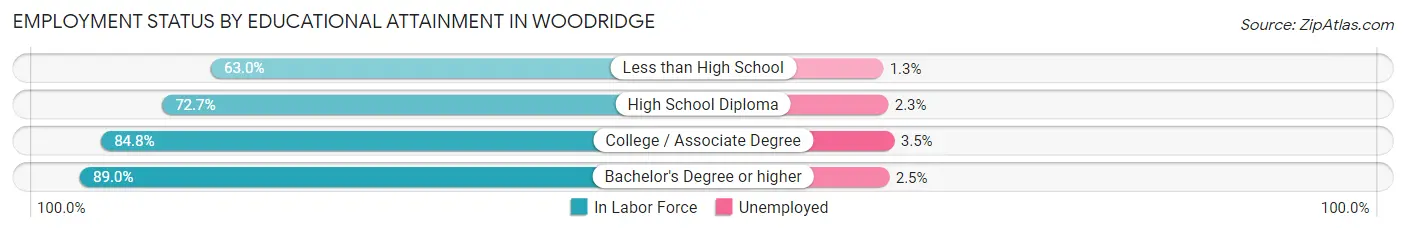
| Educational Attainment | In Labor Force | Unemployed |
| Less than High School | 697 (63.0%) | 14 (1.3%) |
| High School Diploma | 2,372 (72.7%) | 75 (2.3%) |
| College / Associate Degree | 4,727 (84.8%) | 195 (3.5%) |
| Bachelor's Degree or higher | 8,369 (89.0%) | 235 (2.5%) |
| Total | 16,154 (83.5%) | 522 (2.7%) |
Employment Occupations by Sex in Woodridge
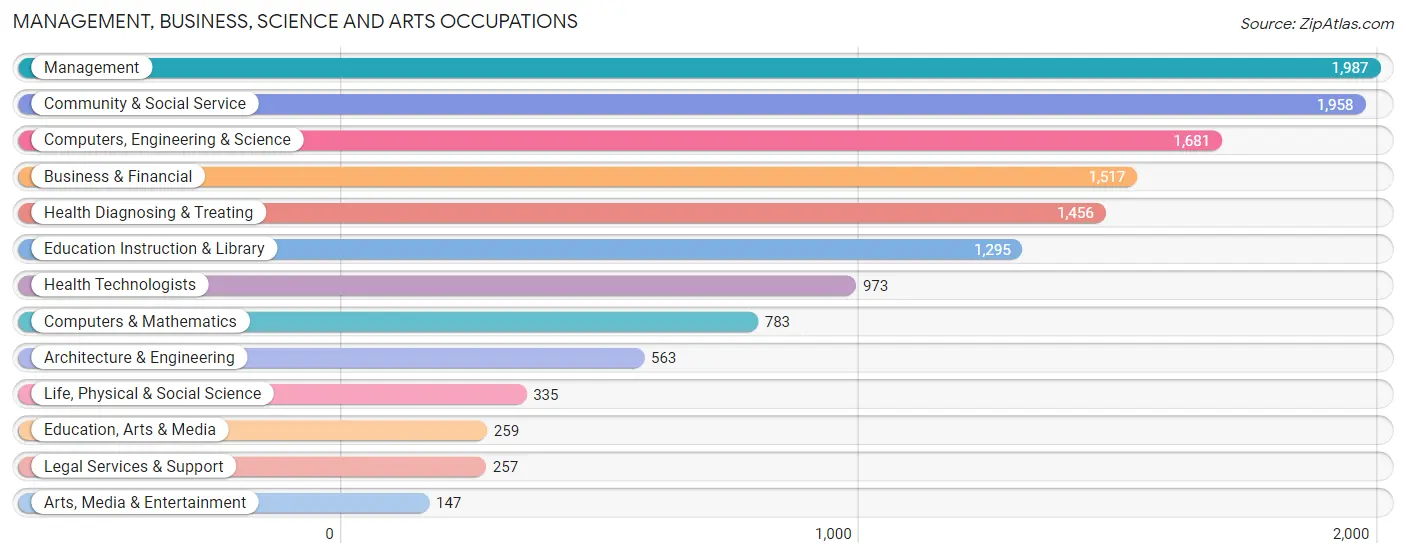
Management, Business, Science and Arts Occupations
The most common Management, Business, Science and Arts occupations in Woodridge are Management (1,987 | 10.5%), Community & Social Service (1,958 | 10.4%), Computers, Engineering & Science (1,681 | 8.9%), Business & Financial (1,517 | 8.1%), and Health Diagnosing & Treating (1,456 | 7.7%).
Management, Business, Science and Arts Occupations by Sex
Within the Management, Business, Science and Arts occupations in Woodridge, the most male-oriented occupations are Architecture & Engineering (89.3%), Computers & Mathematics (81.0%), and Computers, Engineering & Science (79.2%), while the most female-oriented occupations are Education, Arts & Media (84.2%), Health Technologists (71.9%), and Health Diagnosing & Treating (69.0%).
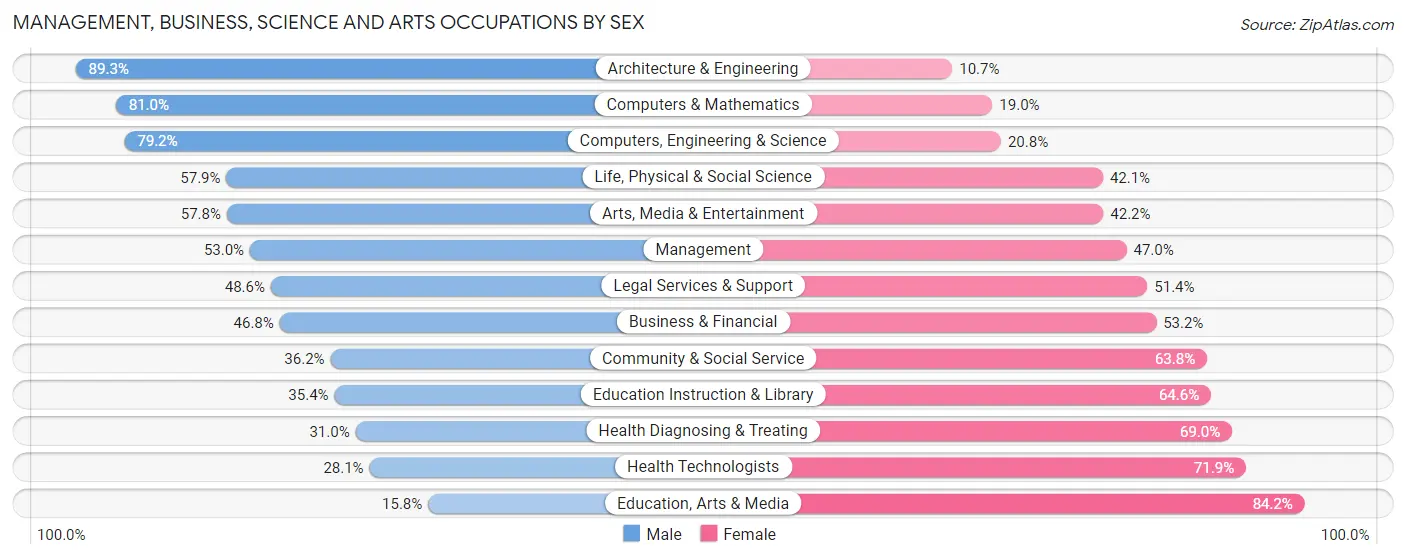
| Occupation | Male | Female |
| Management | 1,053 (53.0%) | 934 (47.0%) |
| Business & Financial | 710 (46.8%) | 807 (53.2%) |
| Computers, Engineering & Science | 1,331 (79.2%) | 350 (20.8%) |
| Computers & Mathematics | 634 (81.0%) | 149 (19.0%) |
| Architecture & Engineering | 503 (89.3%) | 60 (10.7%) |
| Life, Physical & Social Science | 194 (57.9%) | 141 (42.1%) |
| Community & Social Service | 709 (36.2%) | 1,249 (63.8%) |
| Education, Arts & Media | 41 (15.8%) | 218 (84.2%) |
| Legal Services & Support | 125 (48.6%) | 132 (51.4%) |
| Education Instruction & Library | 458 (35.4%) | 837 (64.6%) |
| Arts, Media & Entertainment | 85 (57.8%) | 62 (42.2%) |
| Health Diagnosing & Treating | 451 (31.0%) | 1,005 (69.0%) |
| Health Technologists | 273 (28.1%) | 700 (71.9%) |
| Total (Category) | 4,254 (49.5%) | 4,345 (50.5%) |
| Total (Overall) | 10,161 (53.9%) | 8,688 (46.1%) |
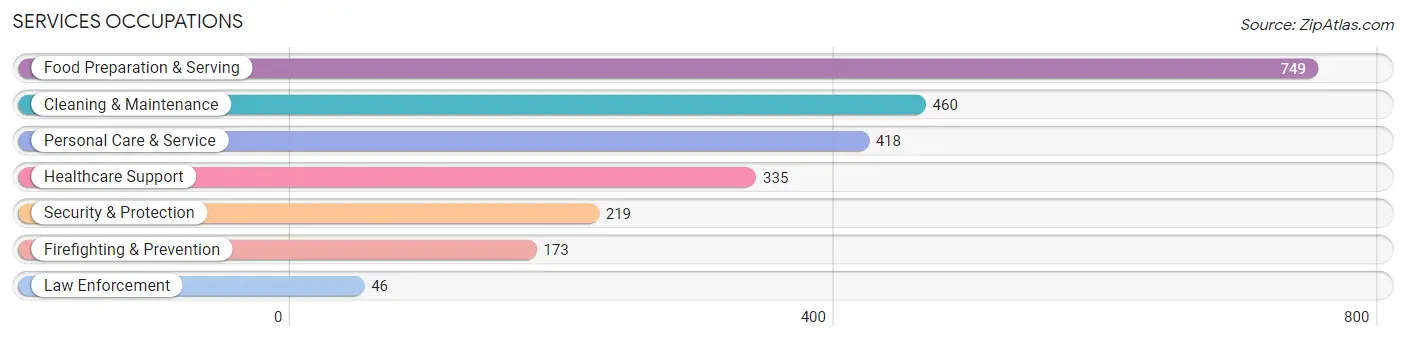
Services Occupations
The most common Services occupations in Woodridge are Food Preparation & Serving (749 | 4.0%), Cleaning & Maintenance (460 | 2.4%), Personal Care & Service (418 | 2.2%), Healthcare Support (335 | 1.8%), and Security & Protection (219 | 1.2%).
Services Occupations by Sex
Within the Services occupations in Woodridge, the most male-oriented occupations are Law Enforcement (100.0%), Security & Protection (82.2%), and Firefighting & Prevention (77.5%), while the most female-oriented occupations are Healthcare Support (91.3%), Personal Care & Service (78.7%), and Food Preparation & Serving (61.2%).
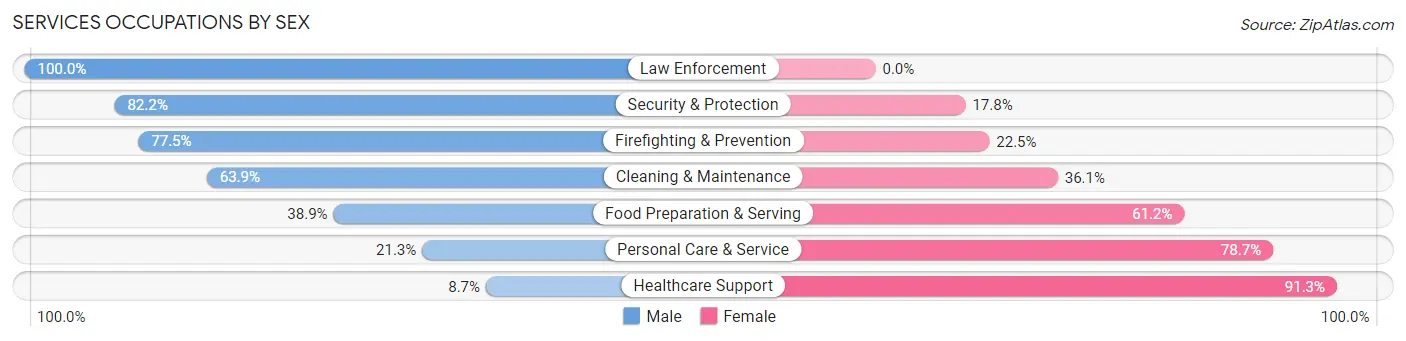
| Occupation | Male | Female |
| Healthcare Support | 29 (8.7%) | 306 (91.3%) |
| Security & Protection | 180 (82.2%) | 39 (17.8%) |
| Firefighting & Prevention | 134 (77.5%) | 39 (22.5%) |
| Law Enforcement | 46 (100.0%) | 0 (0.0%) |
| Food Preparation & Serving | 291 (38.9%) | 458 (61.2%) |
| Cleaning & Maintenance | 294 (63.9%) | 166 (36.1%) |
| Personal Care & Service | 89 (21.3%) | 329 (78.7%) |
| Total (Category) | 883 (40.5%) | 1,298 (59.5%) |
| Total (Overall) | 10,161 (53.9%) | 8,688 (46.1%) |
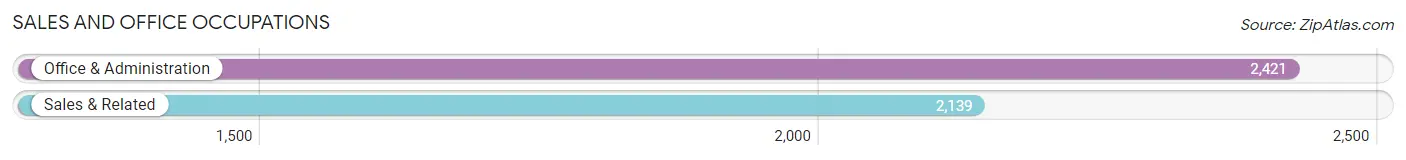
Sales and Office Occupations
The most common Sales and Office occupations in Woodridge are Office & Administration (2,421 | 12.8%), and Sales & Related (2,139 | 11.4%).
Sales and Office Occupations by Sex
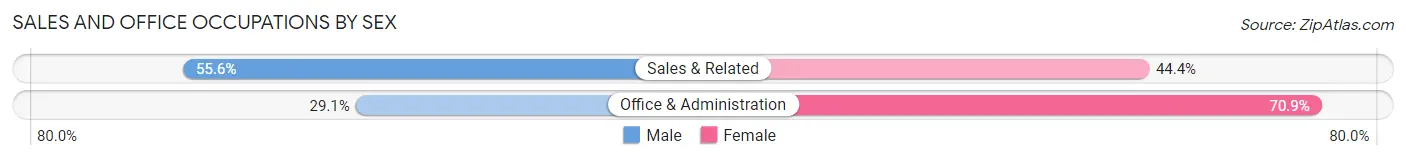
| Occupation | Male | Female |
| Sales & Related | 1,190 (55.6%) | 949 (44.4%) |
| Office & Administration | 704 (29.1%) | 1,717 (70.9%) |
| Total (Category) | 1,894 (41.5%) | 2,666 (58.5%) |
| Total (Overall) | 10,161 (53.9%) | 8,688 (46.1%) |
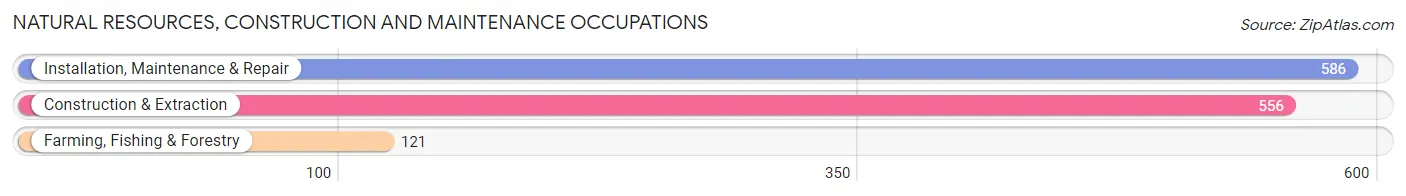
Natural Resources, Construction and Maintenance Occupations
The most common Natural Resources, Construction and Maintenance occupations in Woodridge are Installation, Maintenance & Repair (586 | 3.1%), Construction & Extraction (556 | 2.9%), and Farming, Fishing & Forestry (121 | 0.6%).
Natural Resources, Construction and Maintenance Occupations by Sex
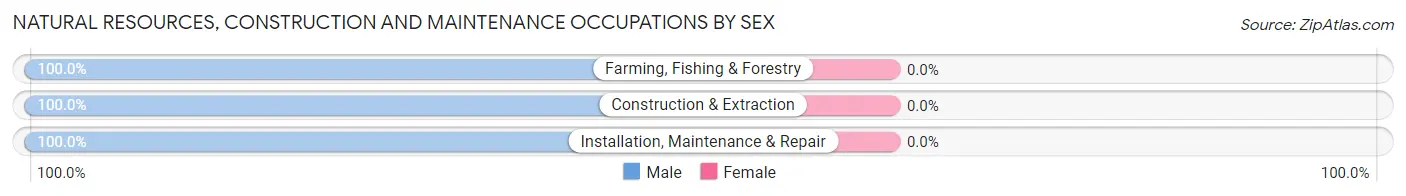
| Occupation | Male | Female |
| Farming, Fishing & Forestry | 121 (100.0%) | 0 (0.0%) |
| Construction & Extraction | 556 (100.0%) | 0 (0.0%) |
| Installation, Maintenance & Repair | 586 (100.0%) | 0 (0.0%) |
| Total (Category) | 1,263 (100.0%) | 0 (0.0%) |
| Total (Overall) | 10,161 (53.9%) | 8,688 (46.1%) |
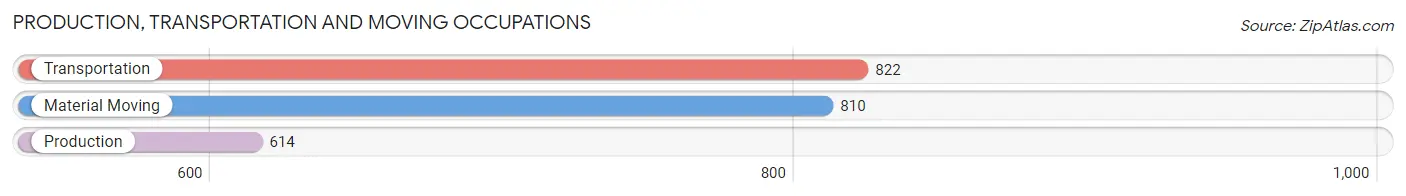
Production, Transportation and Moving Occupations
The most common Production, Transportation and Moving occupations in Woodridge are Transportation (822 | 4.4%), Material Moving (810 | 4.3%), and Production (614 | 3.3%).
Production, Transportation and Moving Occupations by Sex
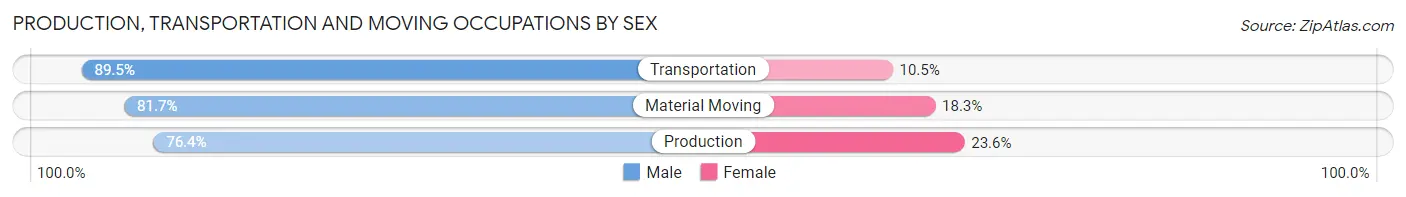
| Occupation | Male | Female |
| Production | 469 (76.4%) | 145 (23.6%) |
| Transportation | 736 (89.5%) | 86 (10.5%) |
| Material Moving | 662 (81.7%) | 148 (18.3%) |
| Total (Category) | 1,867 (83.1%) | 379 (16.9%) |
| Total (Overall) | 10,161 (53.9%) | 8,688 (46.1%) |
Employment Industries by Sex in Woodridge
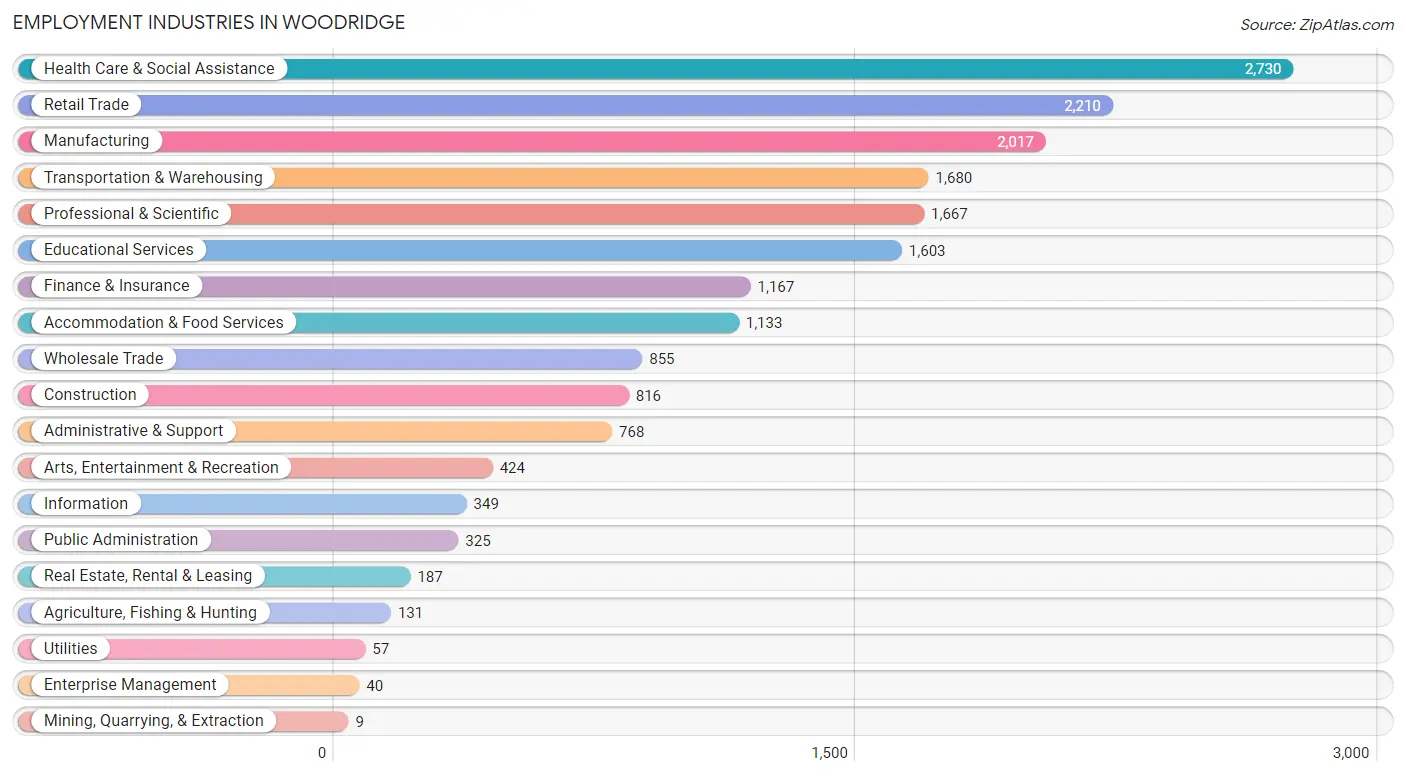
Employment Industries in Woodridge
The major employment industries in Woodridge include Health Care & Social Assistance (2,730 | 14.5%), Retail Trade (2,210 | 11.7%), Manufacturing (2,017 | 10.7%), Transportation & Warehousing (1,680 | 8.9%), and Professional & Scientific (1,667 | 8.8%).
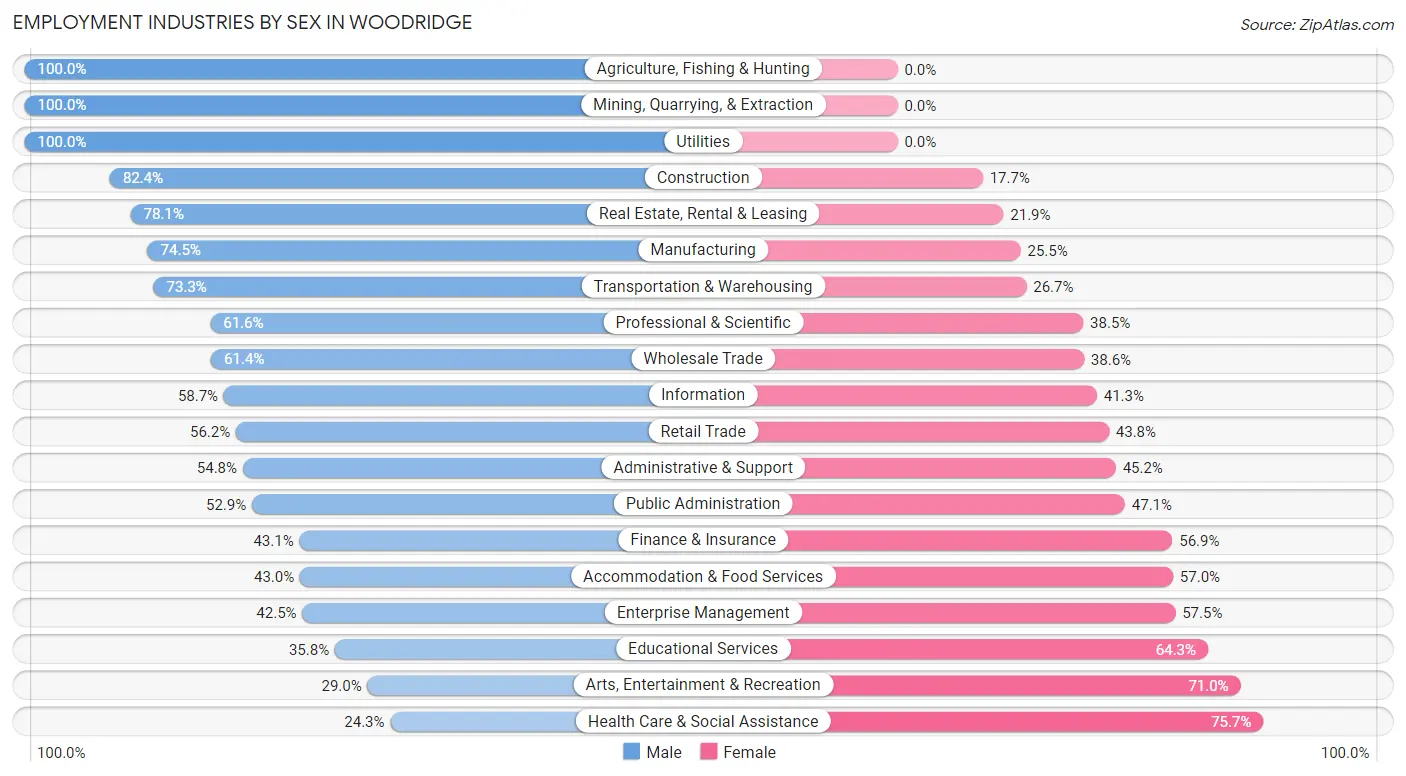
Employment Industries by Sex in Woodridge
The Woodridge industries that see more men than women are Agriculture, Fishing & Hunting (100.0%), Mining, Quarrying, & Extraction (100.0%), and Utilities (100.0%), whereas the industries that tend to have a higher number of women are Health Care & Social Assistance (75.7%), Arts, Entertainment & Recreation (71.0%), and Educational Services (64.2%).
| Industry | Male | Female |
| Agriculture, Fishing & Hunting | 131 (100.0%) | 0 (0.0%) |
| Mining, Quarrying, & Extraction | 9 (100.0%) | 0 (0.0%) |
| Construction | 672 (82.4%) | 144 (17.6%) |
| Manufacturing | 1,503 (74.5%) | 514 (25.5%) |
| Wholesale Trade | 525 (61.4%) | 330 (38.6%) |
| Retail Trade | 1,243 (56.2%) | 967 (43.8%) |
| Transportation & Warehousing | 1,232 (73.3%) | 448 (26.7%) |
| Utilities | 57 (100.0%) | 0 (0.0%) |
| Information | 205 (58.7%) | 144 (41.3%) |
| Finance & Insurance | 503 (43.1%) | 664 (56.9%) |
| Real Estate, Rental & Leasing | 146 (78.1%) | 41 (21.9%) |
| Professional & Scientific | 1,026 (61.6%) | 641 (38.5%) |
| Enterprise Management | 17 (42.5%) | 23 (57.5%) |
| Administrative & Support | 421 (54.8%) | 347 (45.2%) |
| Educational Services | 573 (35.7%) | 1,030 (64.2%) |
| Health Care & Social Assistance | 663 (24.3%) | 2,067 (75.7%) |
| Arts, Entertainment & Recreation | 123 (29.0%) | 301 (71.0%) |
| Accommodation & Food Services | 487 (43.0%) | 646 (57.0%) |
| Public Administration | 172 (52.9%) | 153 (47.1%) |
| Total | 10,161 (53.9%) | 8,688 (46.1%) |
Education in Woodridge
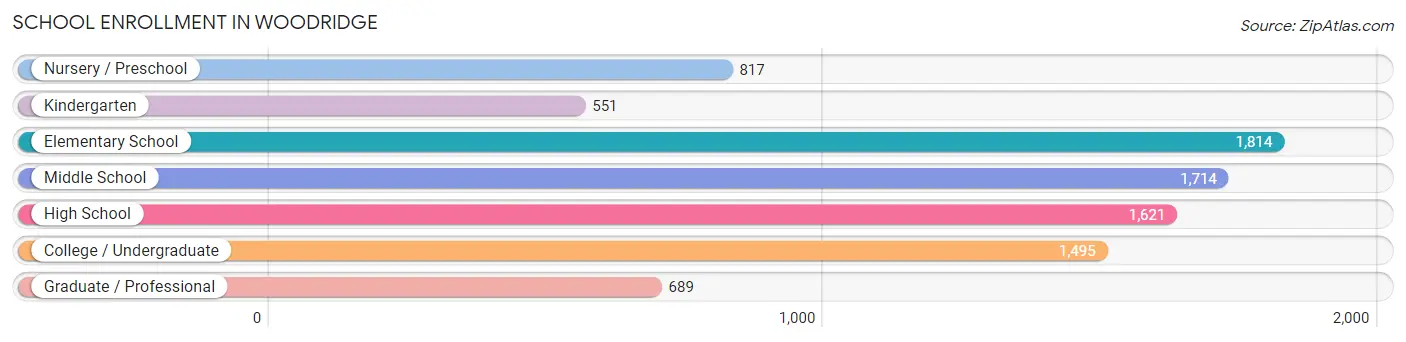
School Enrollment in Woodridge
The most common levels of schooling among the 8,701 students in Woodridge are elementary school (1,814 | 20.8%), middle school (1,714 | 19.7%), and high school (1,621 | 18.6%).
| School Level | # Students | % Students |
| Nursery / Preschool | 817 | 9.4% |
| Kindergarten | 551 | 6.3% |
| Elementary School | 1,814 | 20.8% |
| Middle School | 1,714 | 19.7% |
| High School | 1,621 | 18.6% |
| College / Undergraduate | 1,495 | 17.2% |
| Graduate / Professional | 689 | 7.9% |
| Total | 8,701 | 100.0% |
School Enrollment by Age by Funding Source in Woodridge
Out of a total of 8,701 students who are enrolled in schools in Woodridge, 1,792 (20.6%) attend a private institution, while the remaining 6,909 (79.4%) are enrolled in public schools. The age group of 3 to 4 year olds has the highest likelihood of being enrolled in private schools, with 296 (57.0% in the age bracket) enrolled. Conversely, the age group of 10 to 14 year olds has the lowest likelihood of being enrolled in a private school, with 1,846 (90.4% in the age bracket) attending a public institution.

| Age Bracket | Public School | Private School |
| 3 to 4 Year Olds | 223 (43.0%) | 296 (57.0%) |
| 5 to 9 Year Old | 1,903 (80.1%) | 472 (19.9%) |
| 10 to 14 Year Olds | 1,846 (90.4%) | 195 (9.6%) |
| 15 to 17 Year Olds | 1,136 (90.4%) | 120 (9.6%) |
| 18 to 19 Year Olds | 357 (79.7%) | 91 (20.3%) |
| 20 to 24 Year Olds | 872 (82.2%) | 189 (17.8%) |
| 25 to 34 Year Olds | 195 (47.3%) | 217 (52.7%) |
| 35 Years and over | 379 (64.3%) | 210 (35.6%) |
| Total | 6,909 (79.4%) | 1,792 (20.6%) |
Educational Attainment by Field of Study in Woodridge
Business (2,518 | 21.2%), education (1,509 | 12.7%), science & technology (1,333 | 11.2%), social sciences (959 | 8.1%), and engineering (916 | 7.7%) are the most common fields of study among 11,869 individuals in Woodridge who have obtained a bachelor's degree or higher.
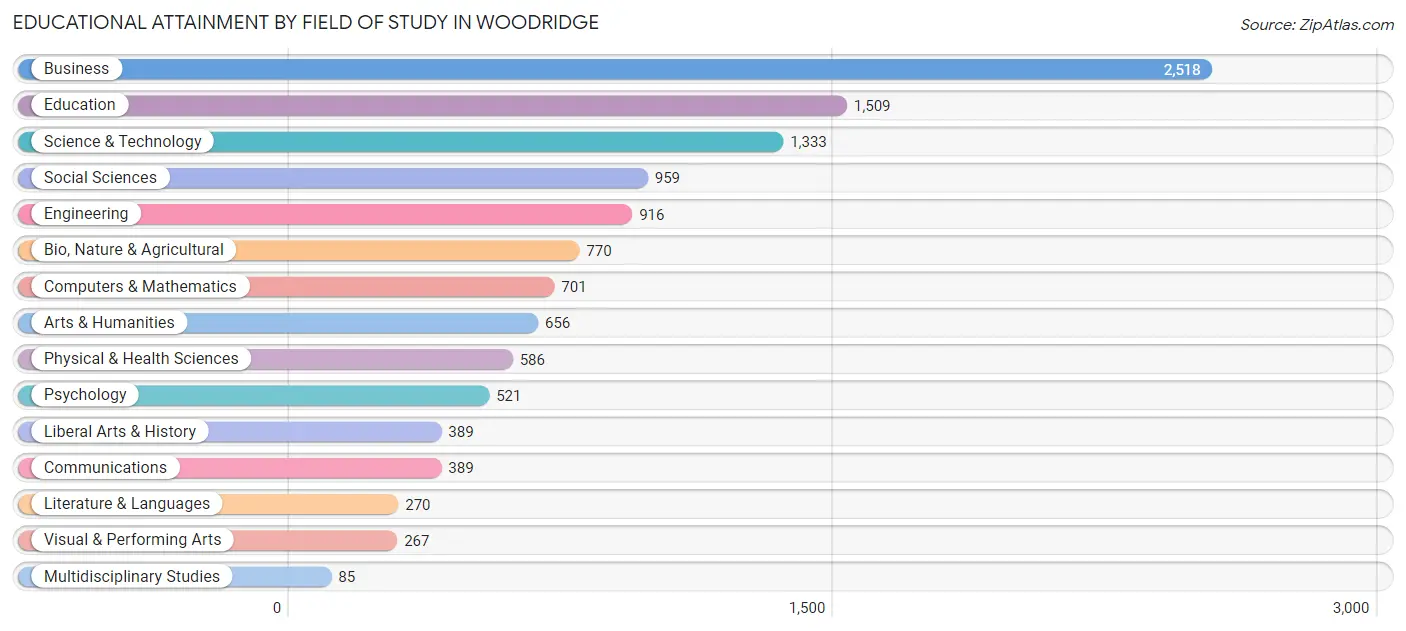
| Field of Study | # Graduates | % Graduates |
| Computers & Mathematics | 701 | 5.9% |
| Bio, Nature & Agricultural | 770 | 6.5% |
| Physical & Health Sciences | 586 | 4.9% |
| Psychology | 521 | 4.4% |
| Social Sciences | 959 | 8.1% |
| Engineering | 916 | 7.7% |
| Multidisciplinary Studies | 85 | 0.7% |
| Science & Technology | 1,333 | 11.2% |
| Business | 2,518 | 21.2% |
| Education | 1,509 | 12.7% |
| Literature & Languages | 270 | 2.3% |
| Liberal Arts & History | 389 | 3.3% |
| Visual & Performing Arts | 267 | 2.2% |
| Communications | 389 | 3.3% |
| Arts & Humanities | 656 | 5.5% |
| Total | 11,869 | 100.0% |
Transportation & Commute in Woodridge
Vehicle Availability by Sex in Woodridge
The most prevalent vehicle ownership categories in Woodridge are males with 2 vehicles (5,009, accounting for 50.0%) and females with 2 vehicles (4,308, making up 59.2%).
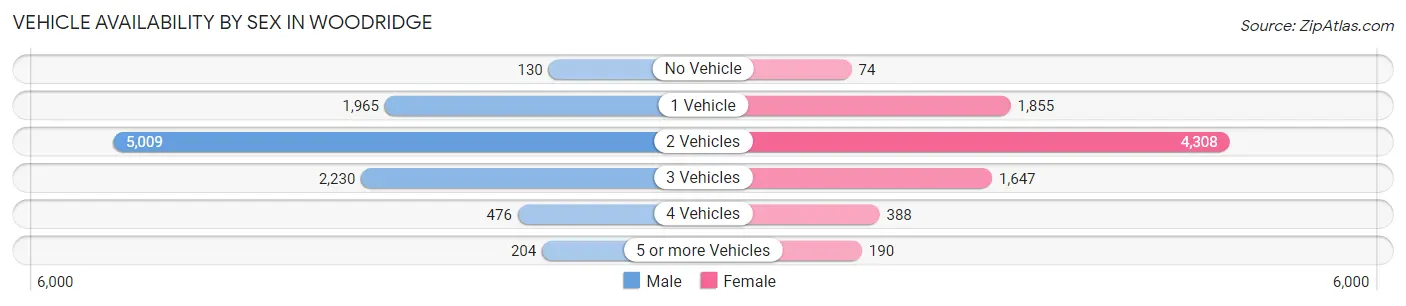
| Vehicles Available | Male | Female |
| No Vehicle | 130 (1.3%) | 74 (0.9%) |
| 1 Vehicle | 1,965 (19.6%) | 1,855 (21.9%) |
| 2 Vehicles | 5,009 (50.0%) | 4,308 (50.9%) |
| 3 Vehicles | 2,230 (22.3%) | 1,647 (19.5%) |
| 4 Vehicles | 476 (4.8%) | 388 (4.6%) |
| 5 or more Vehicles | 204 (2.0%) | 190 (2.2%) |
| Total | 10,014 (100.0%) | 8,462 (100.0%) |
Commute Time in Woodridge
The most frequently occuring commute durations in Woodridge are 15 to 19 minutes (2,121 commuters, 13.8%), 30 to 34 minutes (2,106 commuters, 13.7%), and 20 to 24 minutes (1,838 commuters, 11.9%).
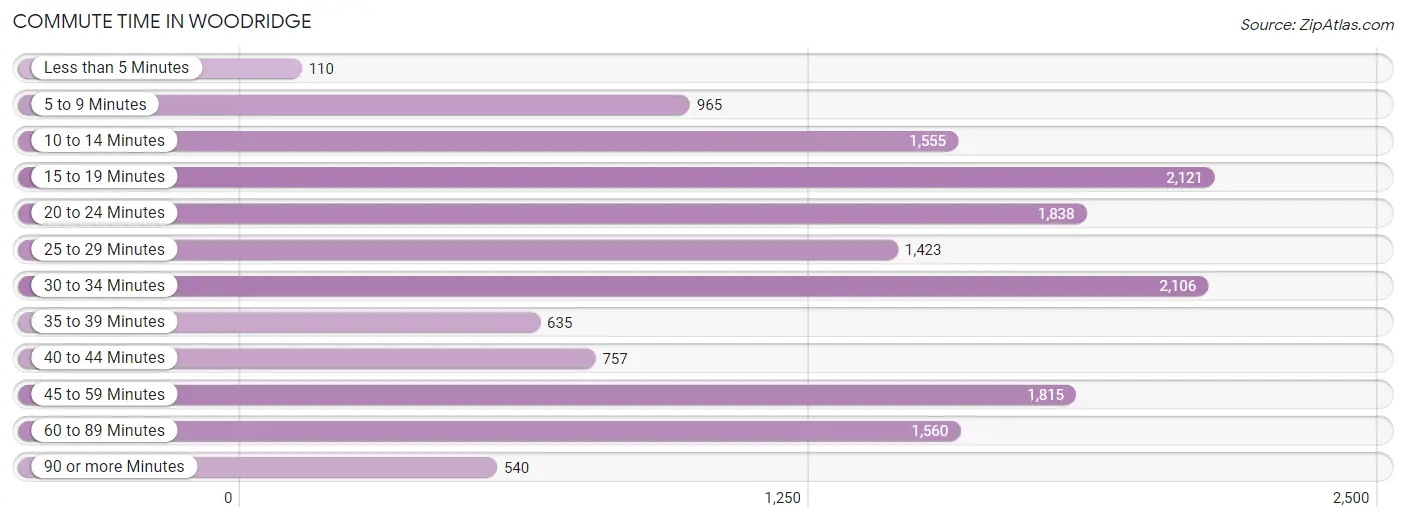
| Commute Time | # Commuters | % Commuters |
| Less than 5 Minutes | 110 | 0.7% |
| 5 to 9 Minutes | 965 | 6.3% |
| 10 to 14 Minutes | 1,555 | 10.1% |
| 15 to 19 Minutes | 2,121 | 13.8% |
| 20 to 24 Minutes | 1,838 | 11.9% |
| 25 to 29 Minutes | 1,423 | 9.2% |
| 30 to 34 Minutes | 2,106 | 13.7% |
| 35 to 39 Minutes | 635 | 4.1% |
| 40 to 44 Minutes | 757 | 4.9% |
| 45 to 59 Minutes | 1,815 | 11.8% |
| 60 to 89 Minutes | 1,560 | 10.1% |
| 90 or more Minutes | 540 | 3.5% |
Commute Time by Sex in Woodridge
The most common commute times in Woodridge are 30 to 34 minutes (1,480 commuters, 17.3%) for males and 15 to 19 minutes (1,138 commuters, 16.5%) for females.
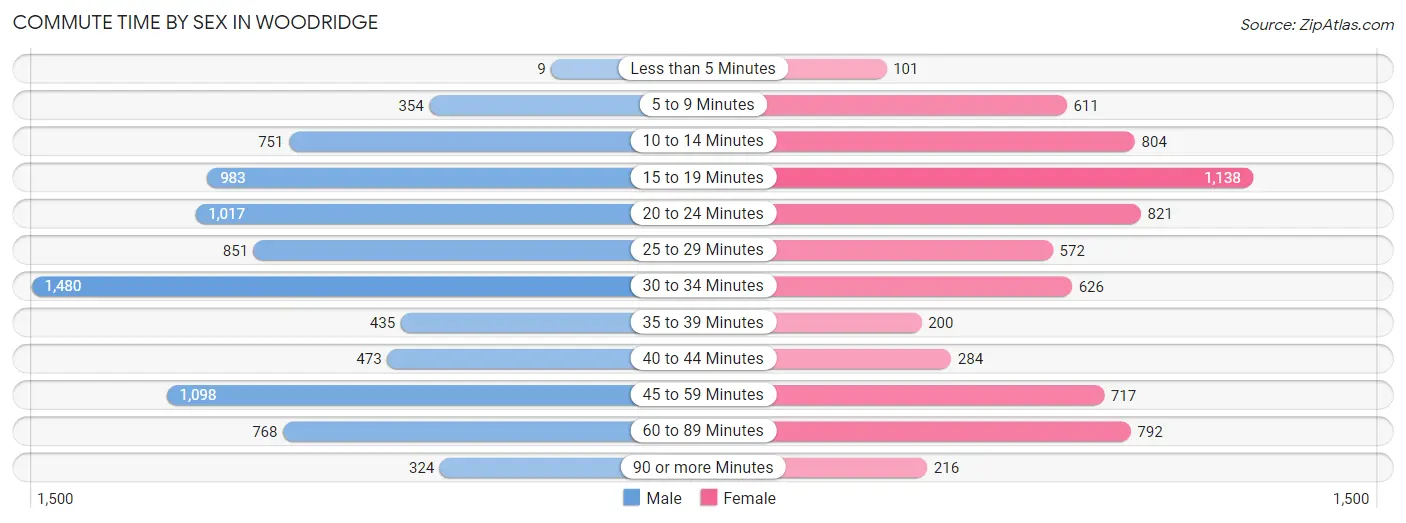
| Commute Time | Male | Female |
| Less than 5 Minutes | 9 (0.1%) | 101 (1.5%) |
| 5 to 9 Minutes | 354 (4.1%) | 611 (8.9%) |
| 10 to 14 Minutes | 751 (8.8%) | 804 (11.7%) |
| 15 to 19 Minutes | 983 (11.5%) | 1,138 (16.5%) |
| 20 to 24 Minutes | 1,017 (11.9%) | 821 (11.9%) |
| 25 to 29 Minutes | 851 (10.0%) | 572 (8.3%) |
| 30 to 34 Minutes | 1,480 (17.3%) | 626 (9.1%) |
| 35 to 39 Minutes | 435 (5.1%) | 200 (2.9%) |
| 40 to 44 Minutes | 473 (5.5%) | 284 (4.1%) |
| 45 to 59 Minutes | 1,098 (12.9%) | 717 (10.4%) |
| 60 to 89 Minutes | 768 (9.0%) | 792 (11.5%) |
| 90 or more Minutes | 324 (3.8%) | 216 (3.1%) |
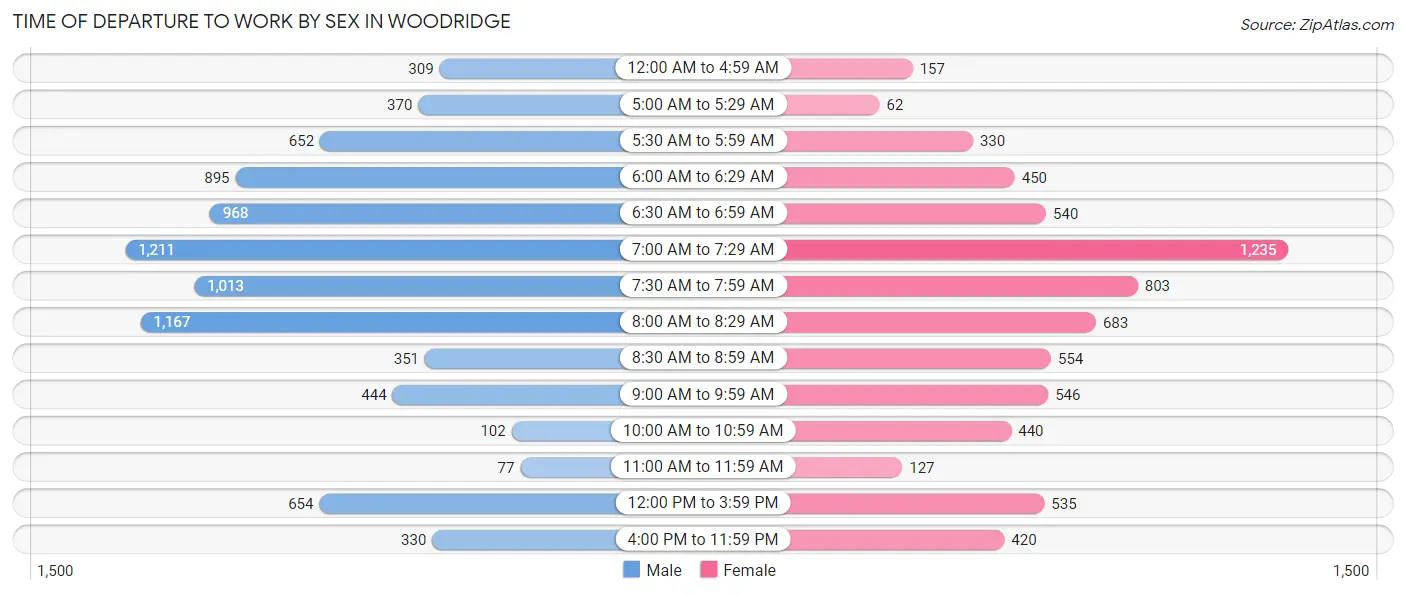
Time of Departure to Work by Sex in Woodridge
The most frequent times of departure to work in Woodridge are 7:00 AM to 7:29 AM (1,211, 14.2%) for males and 7:00 AM to 7:29 AM (1,235, 17.9%) for females.
| Time of Departure | Male | Female |
| 12:00 AM to 4:59 AM | 309 (3.6%) | 157 (2.3%) |
| 5:00 AM to 5:29 AM | 370 (4.3%) | 62 (0.9%) |
| 5:30 AM to 5:59 AM | 652 (7.6%) | 330 (4.8%) |
| 6:00 AM to 6:29 AM | 895 (10.5%) | 450 (6.5%) |
| 6:30 AM to 6:59 AM | 968 (11.3%) | 540 (7.9%) |
| 7:00 AM to 7:29 AM | 1,211 (14.2%) | 1,235 (17.9%) |
| 7:30 AM to 7:59 AM | 1,013 (11.9%) | 803 (11.7%) |
| 8:00 AM to 8:29 AM | 1,167 (13.7%) | 683 (9.9%) |
| 8:30 AM to 8:59 AM | 351 (4.1%) | 554 (8.1%) |
| 9:00 AM to 9:59 AM | 444 (5.2%) | 546 (7.9%) |
| 10:00 AM to 10:59 AM | 102 (1.2%) | 440 (6.4%) |
| 11:00 AM to 11:59 AM | 77 (0.9%) | 127 (1.8%) |
| 12:00 PM to 3:59 PM | 654 (7.7%) | 535 (7.8%) |
| 4:00 PM to 11:59 PM | 330 (3.9%) | 420 (6.1%) |
| Total | 8,543 (100.0%) | 6,882 (100.0%) |
Housing Occupancy in Woodridge
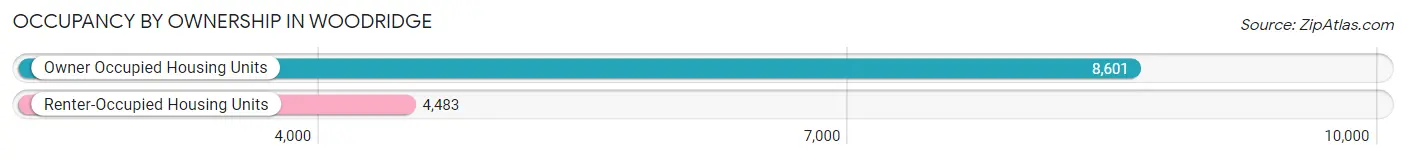
Occupancy by Ownership in Woodridge
Of the total 13,084 dwellings in Woodridge, owner-occupied units account for 8,601 (65.7%), while renter-occupied units make up 4,483 (34.3%).
| Occupancy | # Housing Units | % Housing Units |
| Owner Occupied Housing Units | 8,601 | 65.7% |
| Renter-Occupied Housing Units | 4,483 | 34.3% |
| Total Occupied Housing Units | 13,084 | 100.0% |
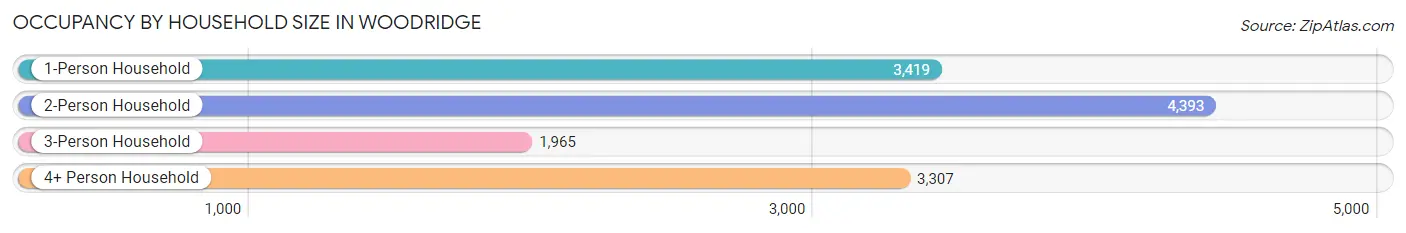
Occupancy by Household Size in Woodridge
| Household Size | # Housing Units | % Housing Units |
| 1-Person Household | 3,419 | 26.1% |
| 2-Person Household | 4,393 | 33.6% |
| 3-Person Household | 1,965 | 15.0% |
| 4+ Person Household | 3,307 | 25.3% |
| Total Housing Units | 13,084 | 100.0% |
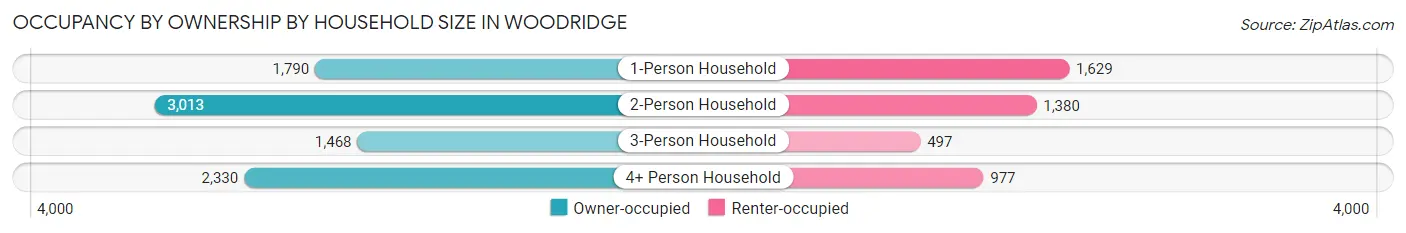
Occupancy by Ownership by Household Size in Woodridge
| Household Size | Owner-occupied | Renter-occupied |
| 1-Person Household | 1,790 (52.3%) | 1,629 (47.6%) |
| 2-Person Household | 3,013 (68.6%) | 1,380 (31.4%) |
| 3-Person Household | 1,468 (74.7%) | 497 (25.3%) |
| 4+ Person Household | 2,330 (70.5%) | 977 (29.5%) |
| Total Housing Units | 8,601 (65.7%) | 4,483 (34.3%) |
Occupancy by Educational Attainment in Woodridge
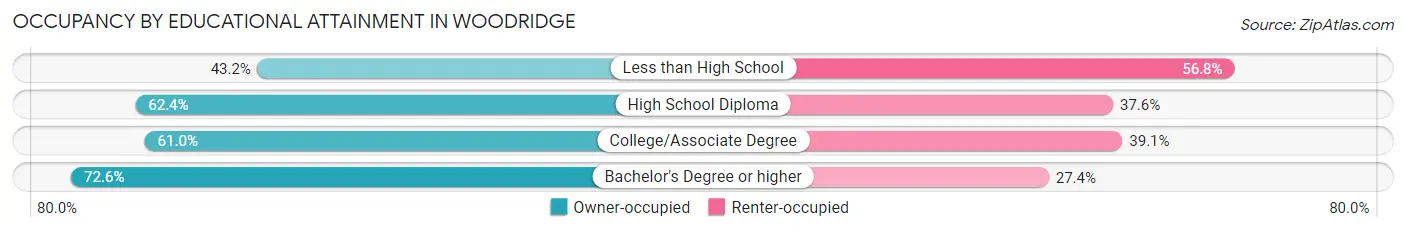
| Household Size | Owner-occupied | Renter-occupied |
| Less than High School | 311 (43.2%) | 409 (56.8%) |
| High School Diploma | 1,301 (62.4%) | 783 (37.6%) |
| College/Associate Degree | 2,490 (61.0%) | 1,595 (39.1%) |
| Bachelor's Degree or higher | 4,499 (72.6%) | 1,696 (27.4%) |
Occupancy by Age of Householder in Woodridge
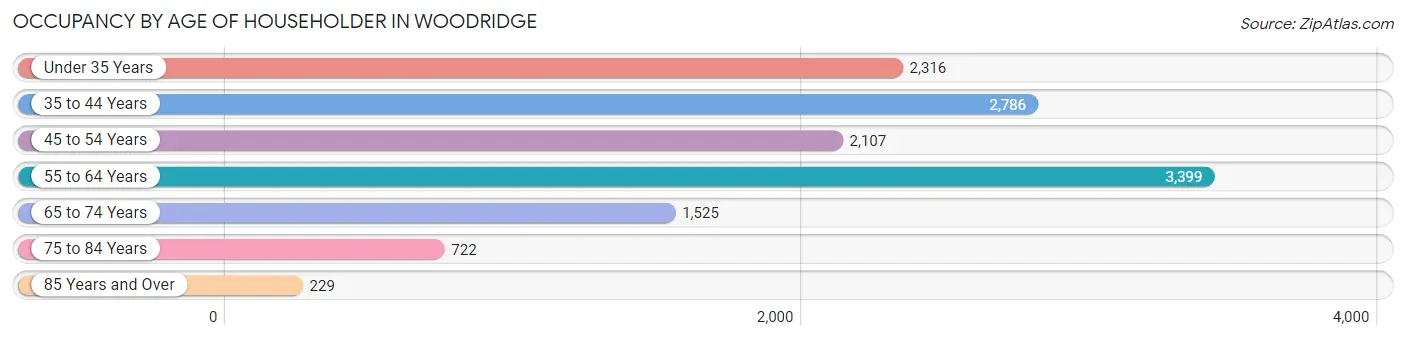
| Age Bracket | # Households | % Households |
| Under 35 Years | 2,316 | 17.7% |
| 35 to 44 Years | 2,786 | 21.3% |
| 45 to 54 Years | 2,107 | 16.1% |
| 55 to 64 Years | 3,399 | 26.0% |
| 65 to 74 Years | 1,525 | 11.7% |
| 75 to 84 Years | 722 | 5.5% |
| 85 Years and Over | 229 | 1.8% |
| Total | 13,084 | 100.0% |
Housing Finances in Woodridge
Median Income by Occupancy in Woodridge
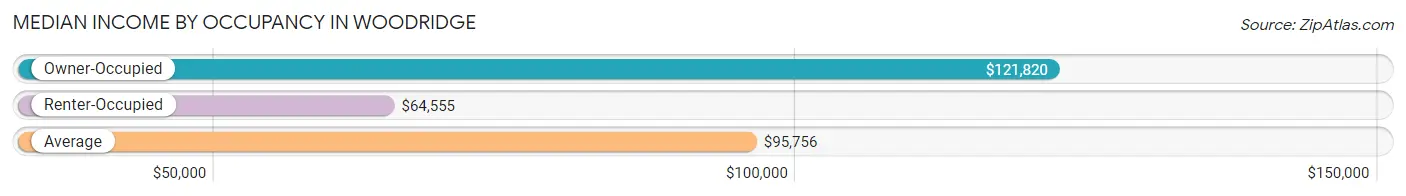
| Occupancy Type | # Households | Median Income |
| Owner-Occupied | 8,601 (65.7%) | $121,820 |
| Renter-Occupied | 4,483 (34.3%) | $64,555 |
| Average | 13,084 (100.0%) | $95,756 |
Occupancy by Householder Income Bracket in Woodridge
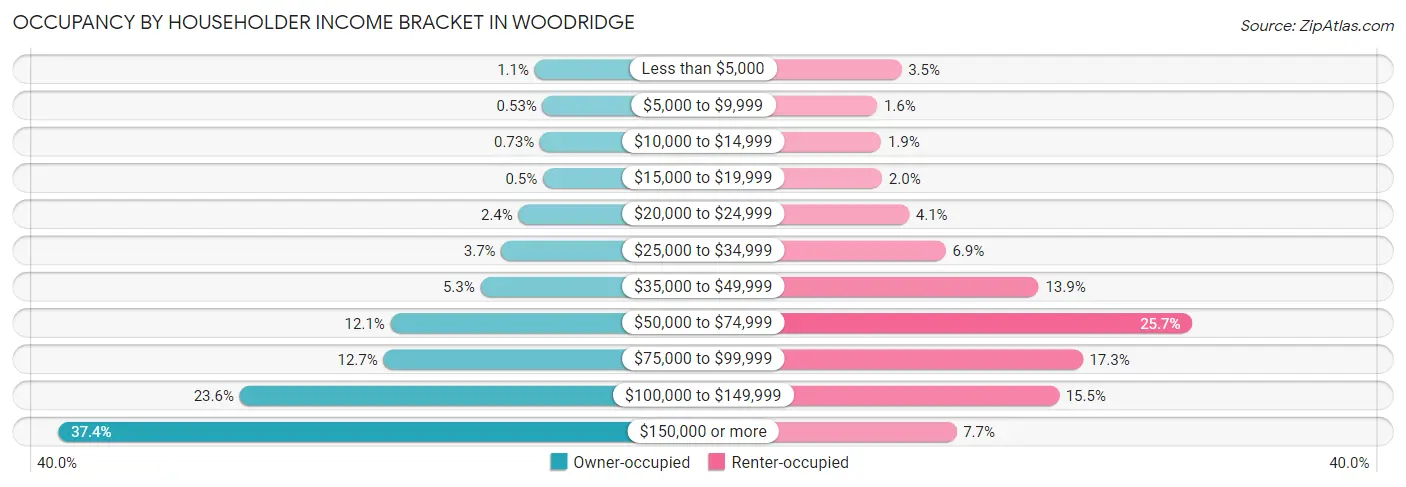
| Income Bracket | Owner-occupied | Renter-occupied |
| Less than $5,000 | 97 (1.1%) | 156 (3.5%) |
| $5,000 to $9,999 | 46 (0.5%) | 73 (1.6%) |
| $10,000 to $14,999 | 63 (0.7%) | 87 (1.9%) |
| $15,000 to $19,999 | 43 (0.5%) | 90 (2.0%) |
| $20,000 to $24,999 | 203 (2.4%) | 182 (4.1%) |
| $25,000 to $34,999 | 316 (3.7%) | 307 (6.9%) |
| $35,000 to $49,999 | 452 (5.3%) | 625 (13.9%) |
| $50,000 to $74,999 | 1,042 (12.1%) | 1,150 (25.7%) |
| $75,000 to $99,999 | 1,088 (12.7%) | 775 (17.3%) |
| $100,000 to $149,999 | 2,031 (23.6%) | 694 (15.5%) |
| $150,000 or more | 3,220 (37.4%) | 344 (7.7%) |
| Total | 8,601 (100.0%) | 4,483 (100.0%) |
Monthly Housing Cost Tiers in Woodridge
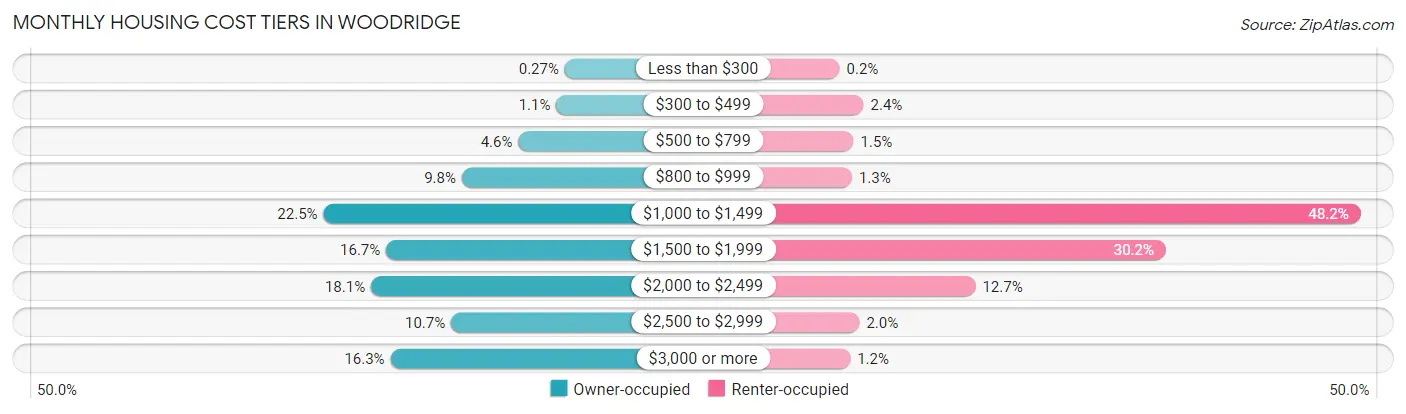
| Monthly Cost | Owner-occupied | Renter-occupied |
| Less than $300 | 23 (0.3%) | 9 (0.2%) |
| $300 to $499 | 90 (1.1%) | 108 (2.4%) |
| $500 to $799 | 391 (4.5%) | 67 (1.5%) |
| $800 to $999 | 839 (9.8%) | 60 (1.3%) |
| $1,000 to $1,499 | 1,934 (22.5%) | 2,159 (48.2%) |
| $1,500 to $1,999 | 1,438 (16.7%) | 1,355 (30.2%) |
| $2,000 to $2,499 | 1,558 (18.1%) | 570 (12.7%) |
| $2,500 to $2,999 | 924 (10.7%) | 91 (2.0%) |
| $3,000 or more | 1,404 (16.3%) | 53 (1.2%) |
| Total | 8,601 (100.0%) | 4,483 (100.0%) |
Physical Housing Characteristics in Woodridge
Housing Structures in Woodridge
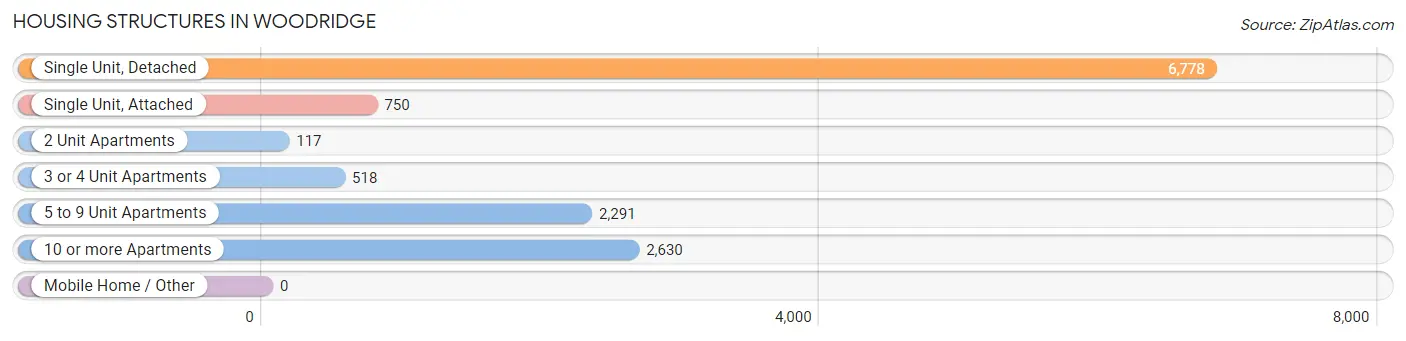
| Structure Type | # Housing Units | % Housing Units |
| Single Unit, Detached | 6,778 | 51.8% |
| Single Unit, Attached | 750 | 5.7% |
| 2 Unit Apartments | 117 | 0.9% |
| 3 or 4 Unit Apartments | 518 | 4.0% |
| 5 to 9 Unit Apartments | 2,291 | 17.5% |
| 10 or more Apartments | 2,630 | 20.1% |
| Mobile Home / Other | 0 | 0.0% |
| Total | 13,084 | 100.0% |
Housing Structures by Occupancy in Woodridge
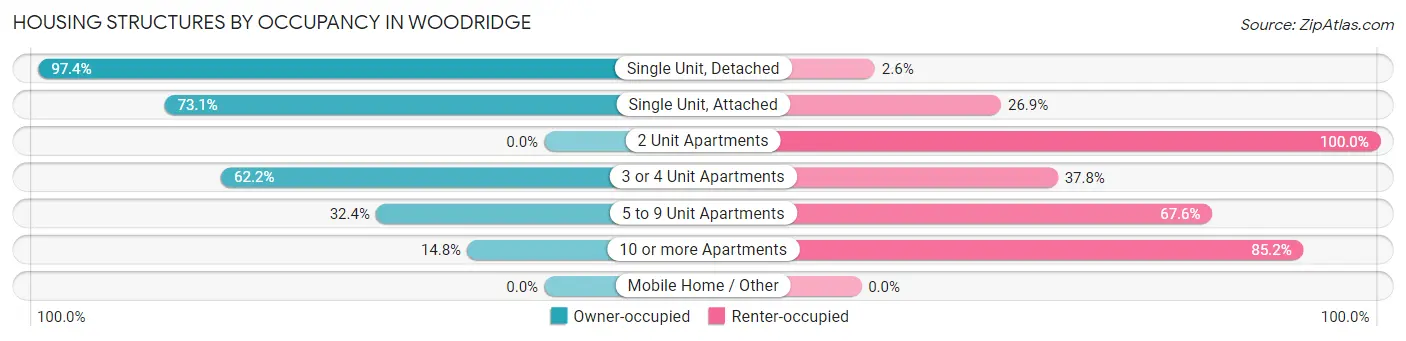
| Structure Type | Owner-occupied | Renter-occupied |
| Single Unit, Detached | 6,599 (97.4%) | 179 (2.6%) |
| Single Unit, Attached | 548 (73.1%) | 202 (26.9%) |
| 2 Unit Apartments | 0 (0.0%) | 117 (100.0%) |
| 3 or 4 Unit Apartments | 322 (62.2%) | 196 (37.8%) |
| 5 to 9 Unit Apartments | 742 (32.4%) | 1,549 (67.6%) |
| 10 or more Apartments | 390 (14.8%) | 2,240 (85.2%) |
| Mobile Home / Other | 0 (0.0%) | 0 (0.0%) |
| Total | 8,601 (65.7%) | 4,483 (34.3%) |
Housing Structures by Number of Rooms in Woodridge
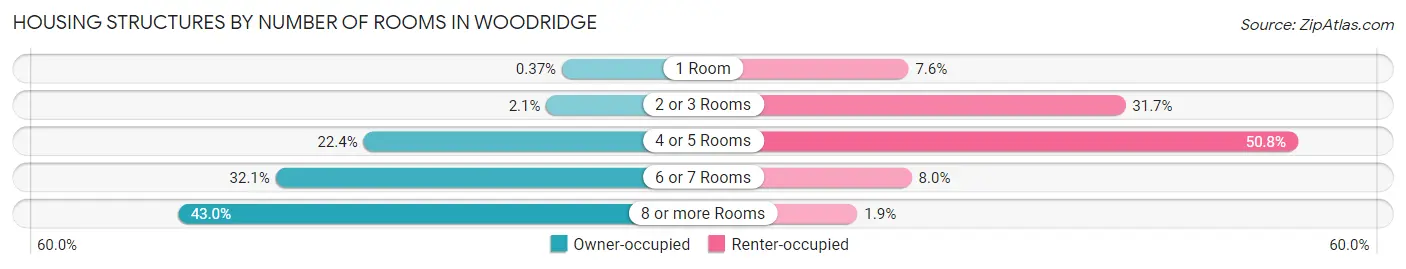
| Number of Rooms | Owner-occupied | Renter-occupied |
| 1 Room | 32 (0.4%) | 341 (7.6%) |
| 2 or 3 Rooms | 181 (2.1%) | 1,420 (31.7%) |
| 4 or 5 Rooms | 1,926 (22.4%) | 2,278 (50.8%) |
| 6 or 7 Rooms | 2,764 (32.1%) | 357 (8.0%) |
| 8 or more Rooms | 3,698 (43.0%) | 87 (1.9%) |
| Total | 8,601 (100.0%) | 4,483 (100.0%) |
Housing Structure by Heating Type in Woodridge
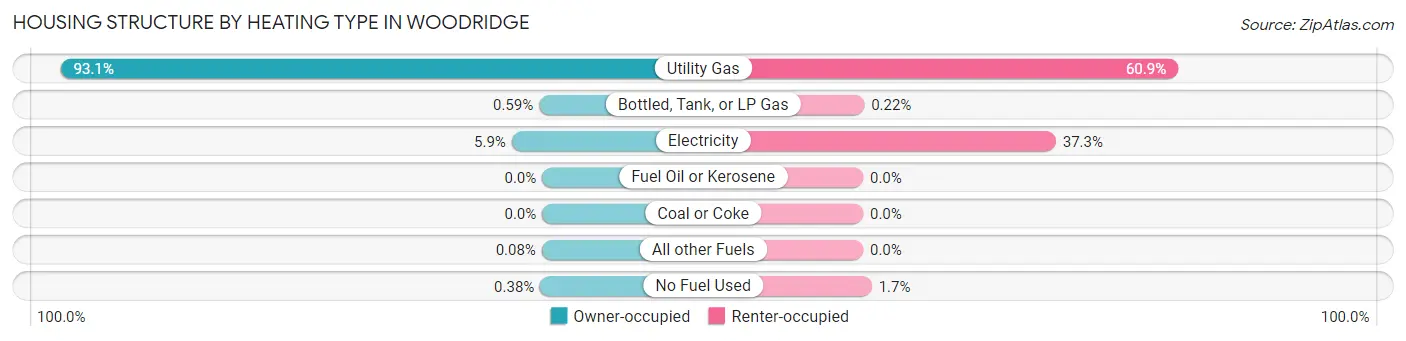
| Heating Type | Owner-occupied | Renter-occupied |
| Utility Gas | 8,004 (93.1%) | 2,728 (60.9%) |
| Bottled, Tank, or LP Gas | 51 (0.6%) | 10 (0.2%) |
| Electricity | 506 (5.9%) | 1,670 (37.2%) |
| Fuel Oil or Kerosene | 0 (0.0%) | 0 (0.0%) |
| Coal or Coke | 0 (0.0%) | 0 (0.0%) |
| All other Fuels | 7 (0.1%) | 0 (0.0%) |
| No Fuel Used | 33 (0.4%) | 75 (1.7%) |
| Total | 8,601 (100.0%) | 4,483 (100.0%) |
Household Vehicle Usage in Woodridge
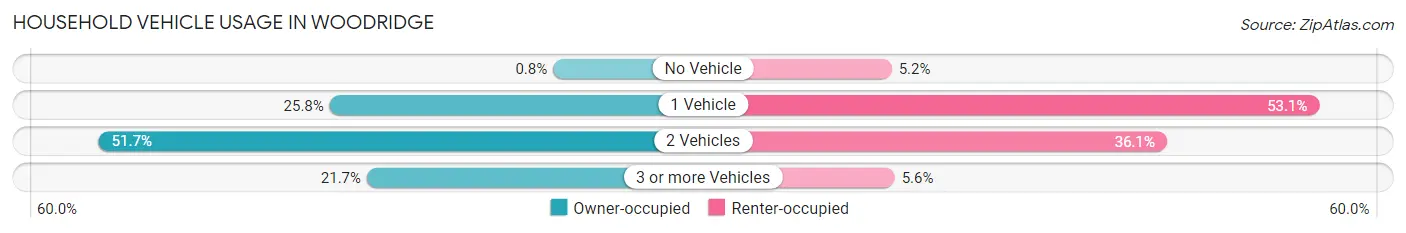
| Vehicles per Household | Owner-occupied | Renter-occupied |
| No Vehicle | 69 (0.8%) | 235 (5.2%) |
| 1 Vehicle | 2,222 (25.8%) | 2,382 (53.1%) |
| 2 Vehicles | 4,447 (51.7%) | 1,616 (36.0%) |
| 3 or more Vehicles | 1,863 (21.7%) | 250 (5.6%) |
| Total | 8,601 (100.0%) | 4,483 (100.0%) |
Real Estate & Mortgages in Woodridge
Real Estate and Mortgage Overview in Woodridge
| Characteristic | Without Mortgage | With Mortgage |
| Housing Units | 2,498 | 6,103 |
| Median Property Value | $340,500 | $329,300 |
| Median Household Income | $103,143 | $2,435 |
| Monthly Housing Costs | $1,045 | $1,404 |
| Real Estate Taxes | $7,872 | $26 |
Property Value by Mortgage Status in Woodridge
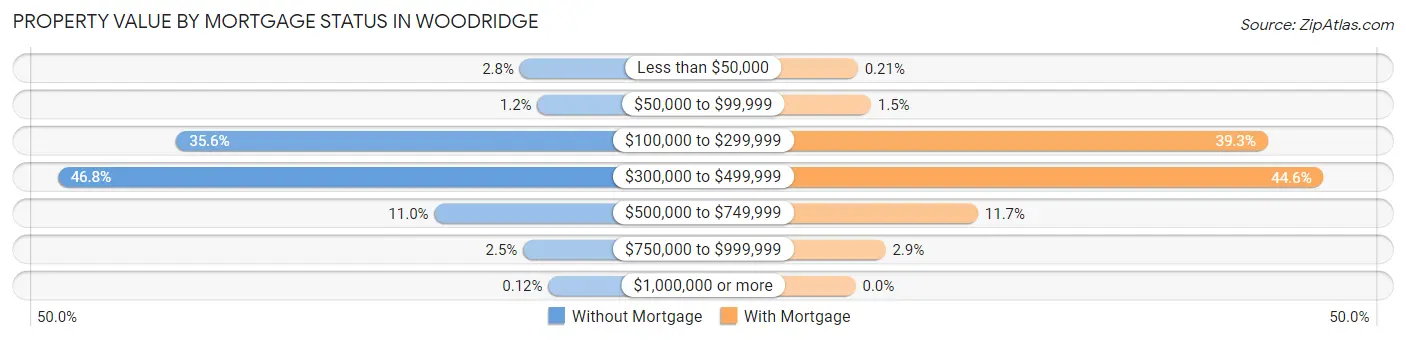
| Property Value | Without Mortgage | With Mortgage |
| Less than $50,000 | 71 (2.8%) | 13 (0.2%) |
| $50,000 to $99,999 | 29 (1.2%) | 89 (1.5%) |
| $100,000 to $299,999 | 888 (35.5%) | 2,396 (39.3%) |
| $300,000 to $499,999 | 1,170 (46.8%) | 2,720 (44.6%) |
| $500,000 to $749,999 | 274 (11.0%) | 711 (11.7%) |
| $750,000 to $999,999 | 63 (2.5%) | 174 (2.9%) |
| $1,000,000 or more | 3 (0.1%) | 0 (0.0%) |
| Total | 2,498 (100.0%) | 6,103 (100.0%) |
Household Income by Mortgage Status in Woodridge
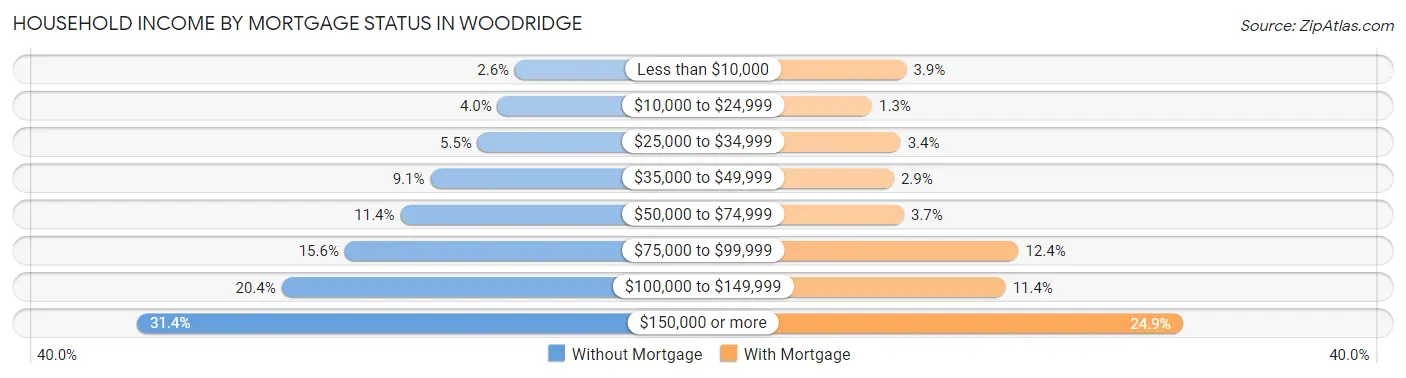
| Household Income | Without Mortgage | With Mortgage |
| Less than $10,000 | 66 (2.6%) | 237 (3.9%) |
| $10,000 to $24,999 | 99 (4.0%) | 77 (1.3%) |
| $25,000 to $34,999 | 137 (5.5%) | 210 (3.4%) |
| $35,000 to $49,999 | 227 (9.1%) | 179 (2.9%) |
| $50,000 to $74,999 | 284 (11.4%) | 225 (3.7%) |
| $75,000 to $99,999 | 390 (15.6%) | 758 (12.4%) |
| $100,000 to $149,999 | 510 (20.4%) | 698 (11.4%) |
| $150,000 or more | 785 (31.4%) | 1,521 (24.9%) |
| Total | 2,498 (100.0%) | 6,103 (100.0%) |
Property Value to Household Income Ratio in Woodridge
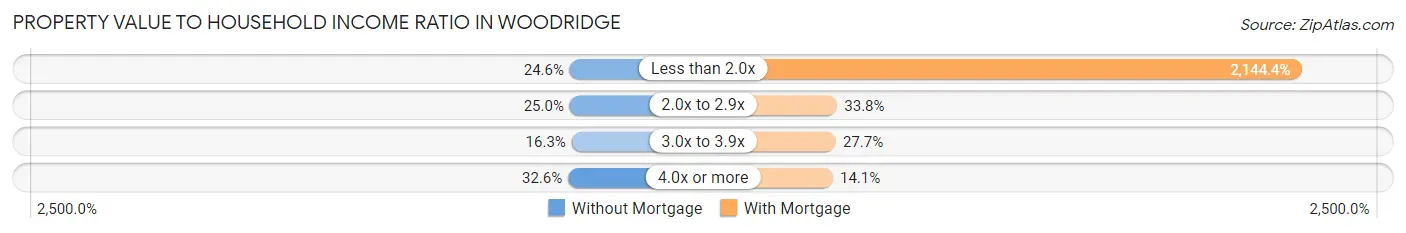
| Value-to-Income Ratio | Without Mortgage | With Mortgage |
| Less than 2.0x | 615 (24.6%) | 130,875 (2,144.4%) |
| 2.0x to 2.9x | 624 (25.0%) | 2,063 (33.8%) |
| 3.0x to 3.9x | 407 (16.3%) | 1,692 (27.7%) |
| 4.0x or more | 813 (32.6%) | 862 (14.1%) |
| Total | 2,498 (100.0%) | 6,103 (100.0%) |
Real Estate Taxes by Mortgage Status in Woodridge
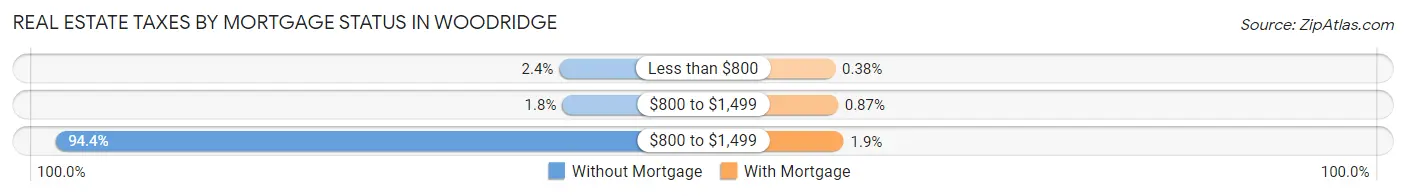
| Property Taxes | Without Mortgage | With Mortgage |
| Less than $800 | 59 (2.4%) | 23 (0.4%) |
| $800 to $1,499 | 45 (1.8%) | 53 (0.9%) |
| $800 to $1,499 | 2,358 (94.4%) | 117 (1.9%) |
| Total | 2,498 (100.0%) | 6,103 (100.0%) |
Health & Disability in Woodridge
Health Insurance Coverage by Age in Woodridge
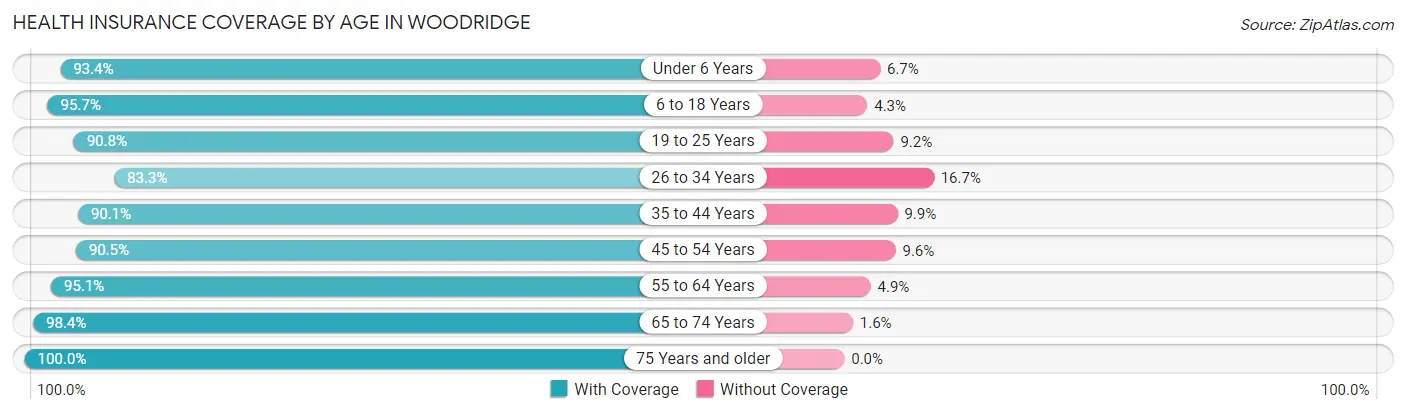
| Age Bracket | With Coverage | Without Coverage |
| Under 6 Years | 2,441 (93.3%) | 174 (6.7%) |
| 6 to 18 Years | 5,381 (95.7%) | 241 (4.3%) |
| 19 to 25 Years | 2,497 (90.8%) | 252 (9.2%) |
| 26 to 34 Years | 3,846 (83.3%) | 770 (16.7%) |
| 35 to 44 Years | 4,560 (90.1%) | 502 (9.9%) |
| 45 to 54 Years | 3,626 (90.4%) | 383 (9.6%) |
| 55 to 64 Years | 4,998 (95.1%) | 258 (4.9%) |
| 65 to 74 Years | 2,593 (98.4%) | 42 (1.6%) |
| 75 Years and older | 1,425 (100.0%) | 0 (0.0%) |
| Total | 31,367 (92.3%) | 2,622 (7.7%) |
Health Insurance Coverage by Citizenship Status in Woodridge
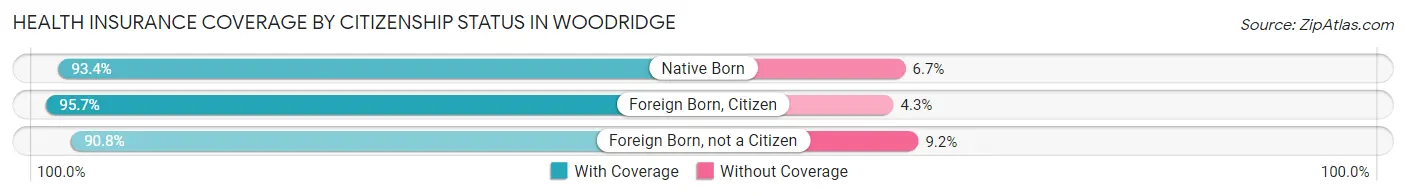
| Citizenship Status | With Coverage | Without Coverage |
| Native Born | 2,441 (93.3%) | 174 (6.7%) |
| Foreign Born, Citizen | 5,381 (95.7%) | 241 (4.3%) |
| Foreign Born, not a Citizen | 2,497 (90.8%) | 252 (9.2%) |
Health Insurance Coverage by Household Income in Woodridge
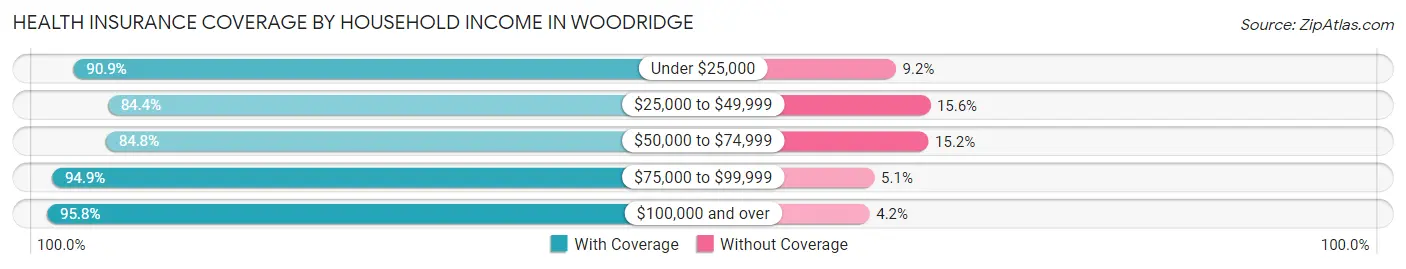
| Household Income | With Coverage | Without Coverage |
| Under $25,000 | 1,241 (90.8%) | 125 (9.1%) |
| $25,000 to $49,999 | 3,575 (84.4%) | 660 (15.6%) |
| $50,000 to $74,999 | 4,586 (84.8%) | 824 (15.2%) |
| $75,000 to $99,999 | 4,606 (94.9%) | 249 (5.1%) |
| $100,000 and over | 17,332 (95.8%) | 762 (4.2%) |
Public vs Private Health Insurance Coverage by Age in Woodridge
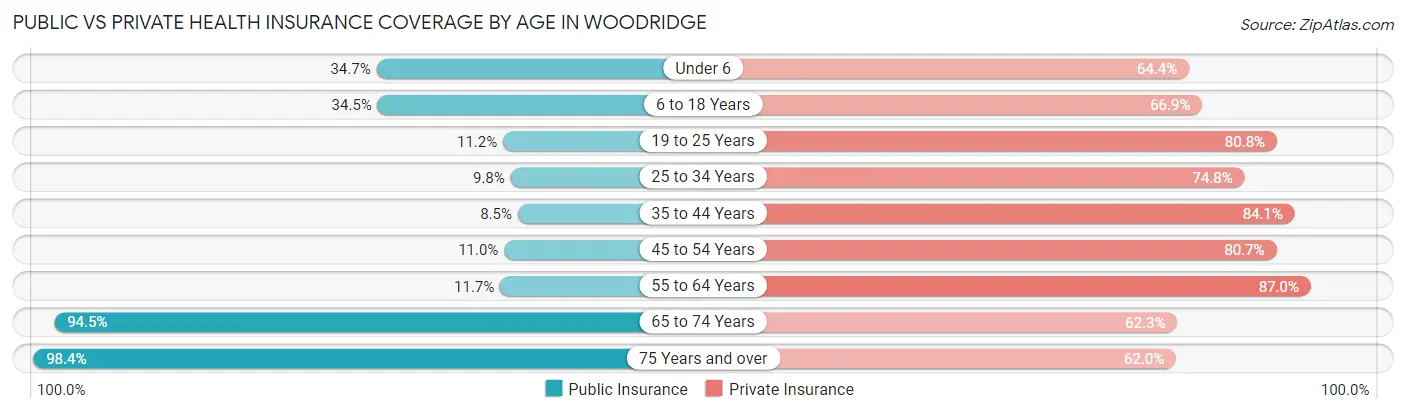
| Age Bracket | Public Insurance | Private Insurance |
| Under 6 | 907 (34.7%) | 1,685 (64.4%) |
| 6 to 18 Years | 1,938 (34.5%) | 3,761 (66.9%) |
| 19 to 25 Years | 308 (11.2%) | 2,220 (80.8%) |
| 25 to 34 Years | 452 (9.8%) | 3,451 (74.8%) |
| 35 to 44 Years | 428 (8.5%) | 4,256 (84.1%) |
| 45 to 54 Years | 440 (11.0%) | 3,234 (80.7%) |
| 55 to 64 Years | 617 (11.7%) | 4,575 (87.0%) |
| 65 to 74 Years | 2,490 (94.5%) | 1,641 (62.3%) |
| 75 Years and over | 1,402 (98.4%) | 884 (62.0%) |
| Total | 8,982 (26.4%) | 25,707 (75.6%) |
Disability Status by Sex by Age in Woodridge
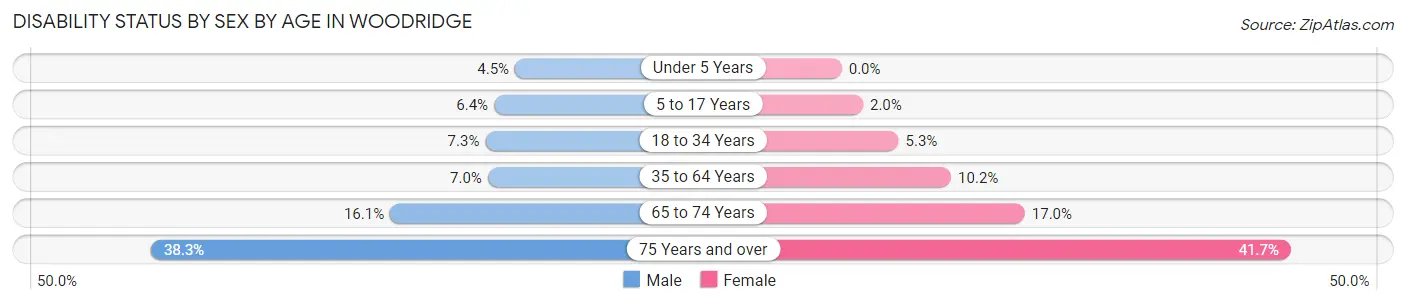
| Age Bracket | Male | Female |
| Under 5 Years | 55 (4.5%) | 0 (0.0%) |
| 5 to 17 Years | 160 (6.4%) | 65 (2.0%) |
| 18 to 34 Years | 326 (7.2%) | 169 (5.3%) |
| 35 to 64 Years | 470 (7.0%) | 775 (10.2%) |
| 65 to 74 Years | 210 (16.1%) | 226 (17.0%) |
| 75 Years and over | 279 (38.3%) | 290 (41.7%) |
Disability Class by Sex by Age in Woodridge
Disability Class: Hearing Difficulty
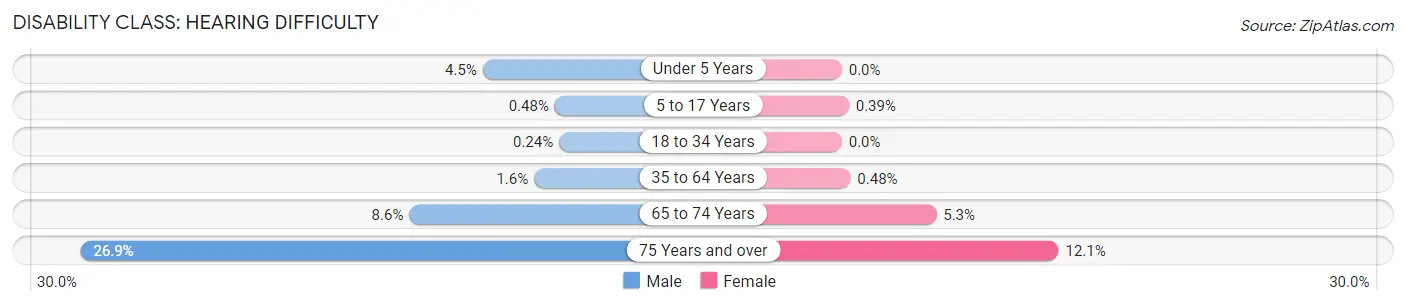
| Age Bracket | Male | Female |
| Under 5 Years | 55 (4.5%) | 0 (0.0%) |
| 5 to 17 Years | 12 (0.5%) | 13 (0.4%) |
| 18 to 34 Years | 11 (0.2%) | 0 (0.0%) |
| 35 to 64 Years | 109 (1.6%) | 37 (0.5%) |
| 65 to 74 Years | 112 (8.6%) | 70 (5.3%) |
| 75 Years and over | 196 (26.9%) | 84 (12.1%) |
Disability Class: Vision Difficulty
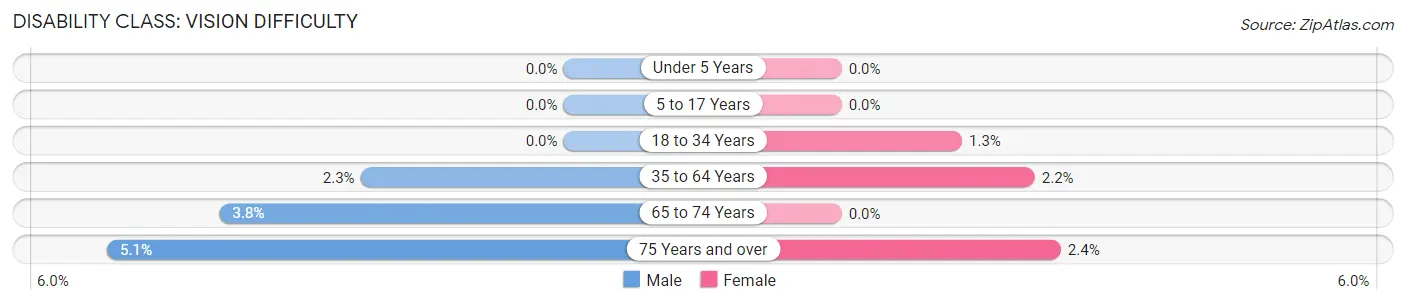
| Age Bracket | Male | Female |
| Under 5 Years | 0 (0.0%) | 0 (0.0%) |
| 5 to 17 Years | 0 (0.0%) | 0 (0.0%) |
| 18 to 34 Years | 0 (0.0%) | 43 (1.3%) |
| 35 to 64 Years | 151 (2.3%) | 164 (2.1%) |
| 65 to 74 Years | 50 (3.8%) | 0 (0.0%) |
| 75 Years and over | 37 (5.1%) | 17 (2.4%) |
Disability Class: Cognitive Difficulty
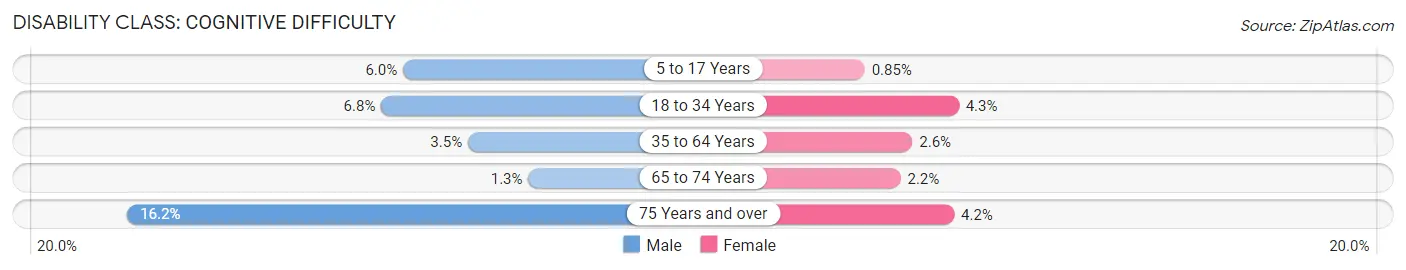
| Age Bracket | Male | Female |
| 5 to 17 Years | 148 (5.9%) | 28 (0.9%) |
| 18 to 34 Years | 304 (6.8%) | 139 (4.3%) |
| 35 to 64 Years | 237 (3.5%) | 200 (2.6%) |
| 65 to 74 Years | 17 (1.3%) | 29 (2.2%) |
| 75 Years and over | 118 (16.2%) | 29 (4.2%) |
Disability Class: Ambulatory Difficulty
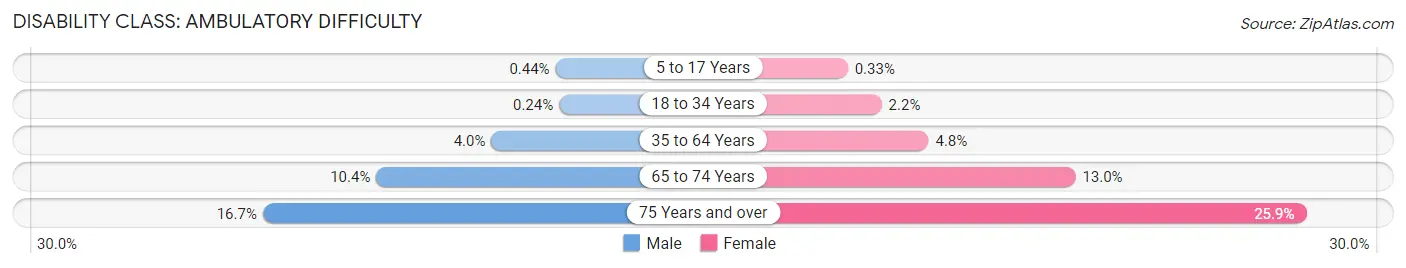
| Age Bracket | Male | Female |
| 5 to 17 Years | 11 (0.4%) | 11 (0.3%) |
| 18 to 34 Years | 11 (0.2%) | 71 (2.2%) |
| 35 to 64 Years | 268 (4.0%) | 369 (4.8%) |
| 65 to 74 Years | 136 (10.4%) | 173 (13.0%) |
| 75 Years and over | 122 (16.7%) | 180 (25.9%) |
Disability Class: Self-Care Difficulty
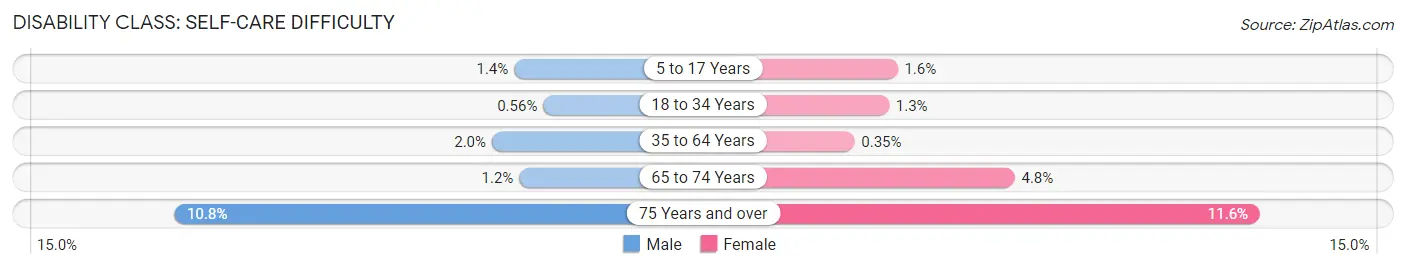
| Age Bracket | Male | Female |
| 5 to 17 Years | 34 (1.4%) | 51 (1.5%) |
| 18 to 34 Years | 25 (0.6%) | 42 (1.3%) |
| 35 to 64 Years | 133 (2.0%) | 27 (0.4%) |
| 65 to 74 Years | 16 (1.2%) | 64 (4.8%) |
| 75 Years and over | 79 (10.8%) | 81 (11.6%) |
Technology Access in Woodridge
Computing Device Access in Woodridge
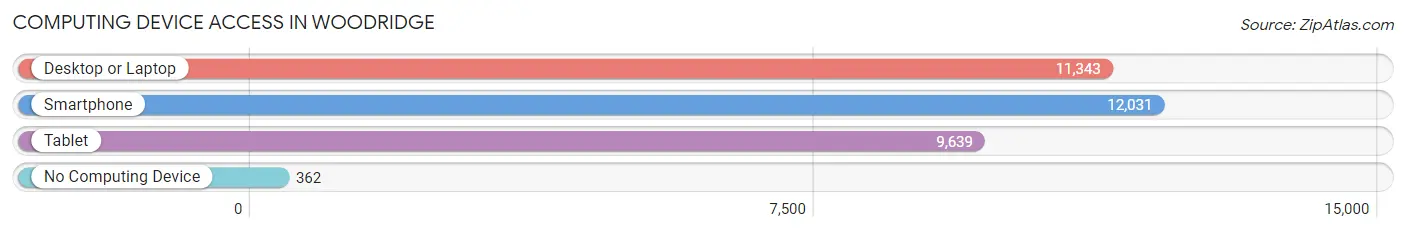
| Device Type | # Households | % Households |
| Desktop or Laptop | 11,343 | 86.7% |
| Smartphone | 12,031 | 91.9% |
| Tablet | 9,639 | 73.7% |
| No Computing Device | 362 | 2.8% |
| Total | 13,084 | 100.0% |
Internet Access in Woodridge
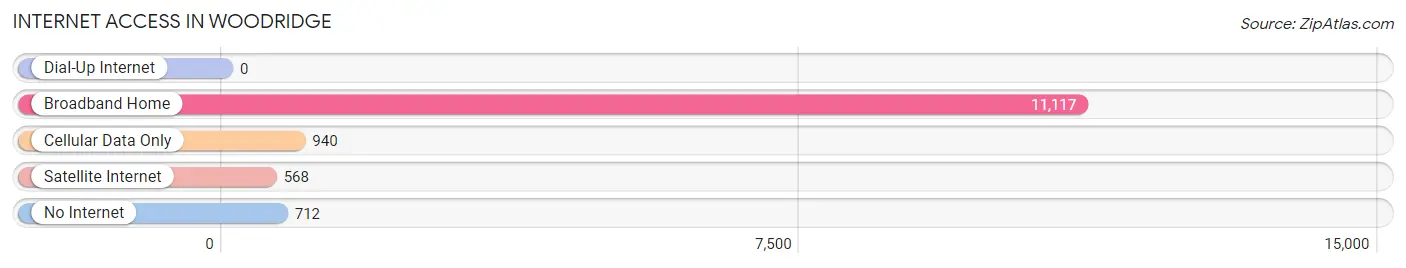
| Internet Type | # Households | % Households |
| Dial-Up Internet | 0 | 0.0% |
| Broadband Home | 11,117 | 85.0% |
| Cellular Data Only | 940 | 7.2% |
| Satellite Internet | 568 | 4.3% |
| No Internet | 712 | 5.4% |
| Total | 13,084 | 100.0% |
Woodridge Summary
Woodridge, Illinois is a village located in DuPage County, approximately 25 miles southwest of Chicago. It is part of the Chicago metropolitan area and is bordered by the cities of Darien, Lemont, Bolingbrook, and Willowbrook. The village was incorporated in 1959 and has a population of 33,971 as of the 2010 census.
Geography
Woodridge is located at 41°45'7" North, 88°2'56" West (41.7519, -88.0489). It has a total area of 8.2 square miles, of which 8.1 square miles is land and 0.1 square miles is water. The village is located in the northeastern portion of DuPage County and is bordered by the cities of Darien, Lemont, Bolingbrook, and Willowbrook.
The village is located in the watershed of the Des Plaines River, which flows through the western portion of the village. The village is also located in the watershed of the DuPage River, which flows through the eastern portion of the village. The village is located in the Woodridge-Lisle-Naperville area, which is part of the Chicago metropolitan area.
Climate
Woodridge has a humid continental climate, with hot, humid summers and cold, snowy winters. The average annual temperature is 48.2°F, with an average high of 61.2°F in July and an average low of 34.2°F in January. The average annual precipitation is 37.2 inches, with an average of 4.2 inches of snow in January.
Demographics
As of the 2010 census, there were 33,971 people, 11,945 households, and 8,845 families residing in the village. The population density was 4,164.2 people per square mile. The racial makeup of the village was 79.2% White, 5.3% African American, 0.2% Native American, 8.7% Asian, 0.1% Pacific Islander, 3.7% from other races, and 2.9% from two or more races. Hispanic or Latino of any race were 11.2% of the population.
The median age in the village was 36.7 years. 24.3% of residents were under the age of 18; 8.2% were between the ages of 18 and 24; 28.2% were from 25 to 44; 25.7% were from 45 to 64; and 13.6% were 65 years of age or older. The gender makeup of the village was 48.3% male and 51.7% female.
Economy
Woodridge is home to a variety of businesses, including retail stores, restaurants, and professional services. The village is also home to several industrial parks, which provide employment opportunities for local residents. The village is also home to the Woodridge Corporate Center, which is a business park that houses a variety of corporate offices.
The village is served by two major highways, Interstate 55 and Interstate 355. The village is also served by Metra, which provides commuter rail service to Chicago and its suburbs.
The median household income in the village was $77,845 in 2018. The median home value was $269,400 in 2018. The unemployment rate in the village was 3.7% in 2018.
Conclusion
Woodridge, Illinois is a village located in DuPage County, approximately 25 miles southwest of Chicago. It is part of the Chicago metropolitan area and is bordered by the cities of Darien, Lemont, Bolingbrook, and Willowbrook. The village was incorporated in 1959 and has a population of 33,971 as of the 2010 census. Woodridge has a humid continental climate, with hot, humid summers and cold, snowy winters. The village is home to a variety of businesses, including retail stores, restaurants, and professional services. The median household income in the village was $77,845 in 2018 and the median home value was $269,400 in 2018.
Common Questions
What is Per Capita Income in Woodridge?
Per Capita income in Woodridge is $48,262.
What is the Median Family Income in Woodridge?
Median Family Income in Woodridge is $109,478.
What is the Median Household income in Woodridge?
Median Household Income in Woodridge is $95,756.
What is Income or Wage Gap in Woodridge?
Income or Wage Gap in Woodridge is 25.6%.
Women in Woodridge earn 74.4 cents for every dollar earned by a man.
What is Inequality or Gini Index in Woodridge?
Inequality or Gini Index in Woodridge is 0.42.
What is the Total Population of Woodridge?
Total Population of Woodridge is 34,027.
What is the Total Male Population of Woodridge?
Total Male Population of Woodridge is 16,973.
What is the Total Female Population of Woodridge?
Total Female Population of Woodridge is 17,054.
What is the Ratio of Males per 100 Females in Woodridge?
There are 99.53 Males per 100 Females in Woodridge.
What is the Ratio of Females per 100 Males in Woodridge?
There are 100.48 Females per 100 Males in Woodridge.
What is the Median Population Age in Woodridge?
Median Population Age in Woodridge is 37.7 Years.
What is the Average Family Size in Woodridge
Average Family Size in Woodridge is 3.2 People.
What is the Average Household Size in Woodridge
Average Household Size in Woodridge is 2.6 People.
How Large is the Labor Force in Woodridge?
There are 19,611 People in the Labor Forcein in Woodridge.
What is the Percentage of People in the Labor Force in Woodridge?
73.1% of People are in the Labor Force in Woodridge.
What is the Unemployment Rate in Woodridge?
Unemployment Rate in Woodridge is 3.9%.