Mount Prospect, IL Map & Demographics
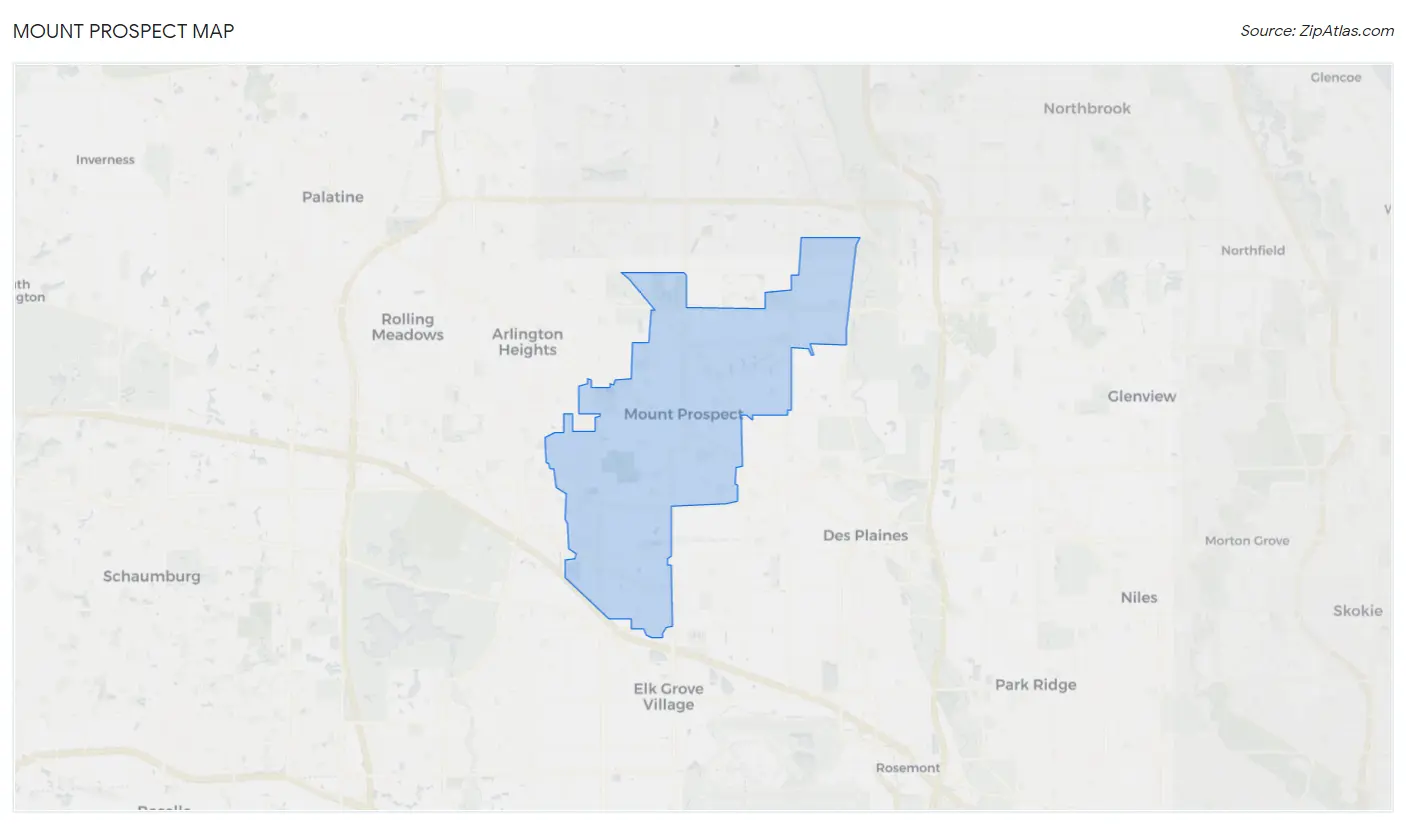
Mount Prospect Map
Mount Prospect Overview
$47,614
PER CAPITA INCOME
$123,969
AVG FAMILY INCOME
$100,526
AVG HOUSEHOLD INCOME
28.0%
WAGE / INCOME GAP [ % ]
72.0¢/ $1
WAGE / INCOME GAP [ $ ]
0.41
INEQUALITY / GINI INDEX
56,191
TOTAL POPULATION
28,074
MALE POPULATION
28,117
FEMALE POPULATION
99.85
MALES / 100 FEMALES
100.15
FEMALES / 100 MALES
41.2
MEDIAN AGE
3.1
AVG FAMILY SIZE
2.6
AVG HOUSEHOLD SIZE
30,569
LABOR FORCE [ PEOPLE ]
67.7%
PERCENT IN LABOR FORCE
3.5%
UNEMPLOYMENT RATE
Mount Prospect Zip Codes
Income in Mount Prospect
Income Overview in Mount Prospect
Per Capita Income in Mount Prospect is $47,614, while median incomes of families and households are $123,969 and $100,526 respectively.
| Characteristic | Number | Measure |
| Per Capita Income | 56,191 | $47,614 |
| Median Family Income | 14,923 | $123,969 |
| Mean Family Income | 14,923 | $140,630 |
| Median Household Income | 21,917 | $100,526 |
| Mean Household Income | 21,917 | $120,557 |
| Income Deficit | 14,923 | $0 |
| Wage / Income Gap (%) | 56,191 | 27.96% |
| Wage / Income Gap ($) | 56,191 | 72.04¢ per $1 |
| Gini / Inequality Index | 56,191 | 0.41 |
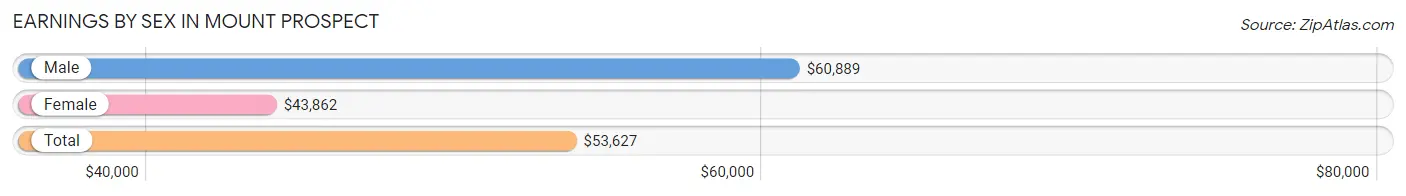
Earnings by Sex in Mount Prospect
Average Earnings in Mount Prospect are $53,627, $60,889 for men and $43,862 for women, a difference of 28.0%.
| Sex | Number | Average Earnings |
| Male | 16,769 (53.4%) | $60,889 |
| Female | 14,631 (46.6%) | $43,862 |
| Total | 31,400 (100.0%) | $53,627 |
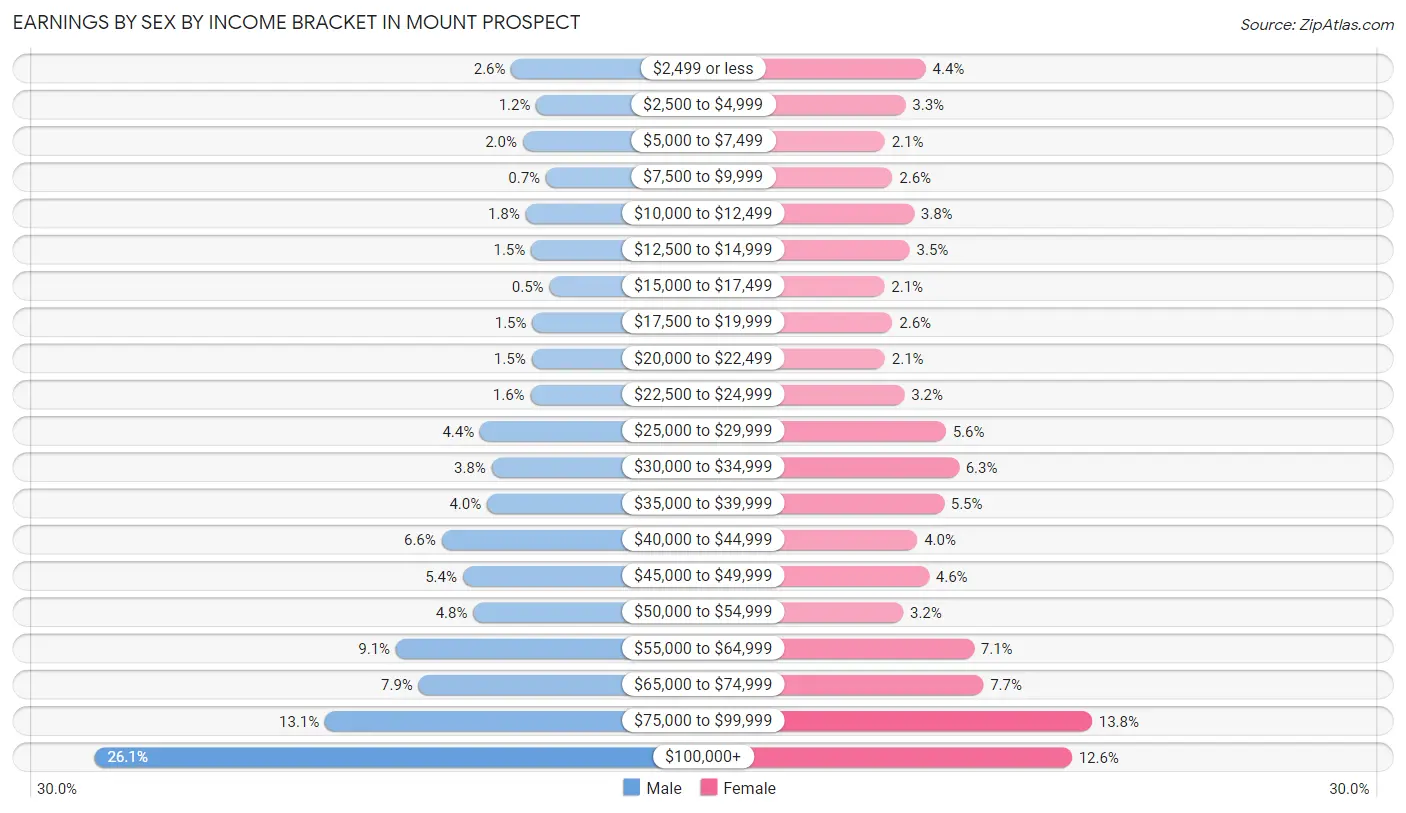
Earnings by Sex by Income Bracket in Mount Prospect
The most common earnings brackets in Mount Prospect are $100,000+ for men (4,371 | 26.1%) and $75,000 to $99,999 for women (2,014 | 13.8%).
| Income | Male | Female |
| $2,499 or less | 442 (2.6%) | 648 (4.4%) |
| $2,500 to $4,999 | 208 (1.2%) | 481 (3.3%) |
| $5,000 to $7,499 | 335 (2.0%) | 312 (2.1%) |
| $7,500 to $9,999 | 118 (0.7%) | 374 (2.6%) |
| $10,000 to $12,499 | 308 (1.8%) | 552 (3.8%) |
| $12,500 to $14,999 | 256 (1.5%) | 517 (3.5%) |
| $15,000 to $17,499 | 84 (0.5%) | 309 (2.1%) |
| $17,500 to $19,999 | 245 (1.5%) | 375 (2.6%) |
| $20,000 to $22,499 | 253 (1.5%) | 313 (2.1%) |
| $22,500 to $24,999 | 263 (1.6%) | 472 (3.2%) |
| $25,000 to $29,999 | 738 (4.4%) | 813 (5.6%) |
| $30,000 to $34,999 | 628 (3.7%) | 921 (6.3%) |
| $35,000 to $39,999 | 672 (4.0%) | 797 (5.4%) |
| $40,000 to $44,999 | 1,100 (6.6%) | 579 (4.0%) |
| $45,000 to $49,999 | 900 (5.4%) | 675 (4.6%) |
| $50,000 to $54,999 | 802 (4.8%) | 462 (3.2%) |
| $55,000 to $64,999 | 1,531 (9.1%) | 1,045 (7.1%) |
| $65,000 to $74,999 | 1,317 (7.9%) | 1,122 (7.7%) |
| $75,000 to $99,999 | 2,198 (13.1%) | 2,014 (13.8%) |
| $100,000+ | 4,371 (26.1%) | 1,850 (12.6%) |
| Total | 16,769 (100.0%) | 14,631 (100.0%) |
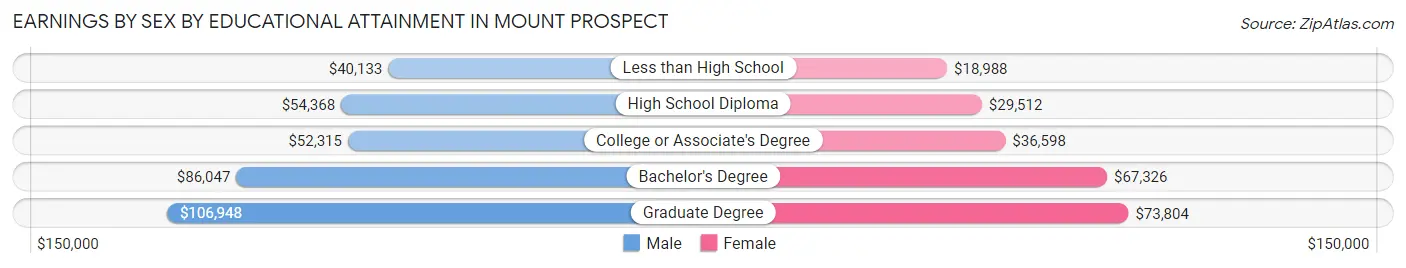
Earnings by Sex by Educational Attainment in Mount Prospect
Average earnings in Mount Prospect are $67,162 for men and $48,010 for women, a difference of 28.5%. Men with an educational attainment of graduate degree enjoy the highest average annual earnings of $106,948, while those with less than high school education earn the least with $40,133. Women with an educational attainment of graduate degree earn the most with the average annual earnings of $73,804, while those with less than high school education have the smallest earnings of $18,988.
| Educational Attainment | Male Income | Female Income |
| Less than High School | $40,133 | $18,988 |
| High School Diploma | $54,368 | $29,512 |
| College or Associate's Degree | $52,315 | $36,598 |
| Bachelor's Degree | $86,047 | $67,326 |
| Graduate Degree | $106,948 | $73,804 |
| Total | $67,162 | $48,010 |
Family Income in Mount Prospect
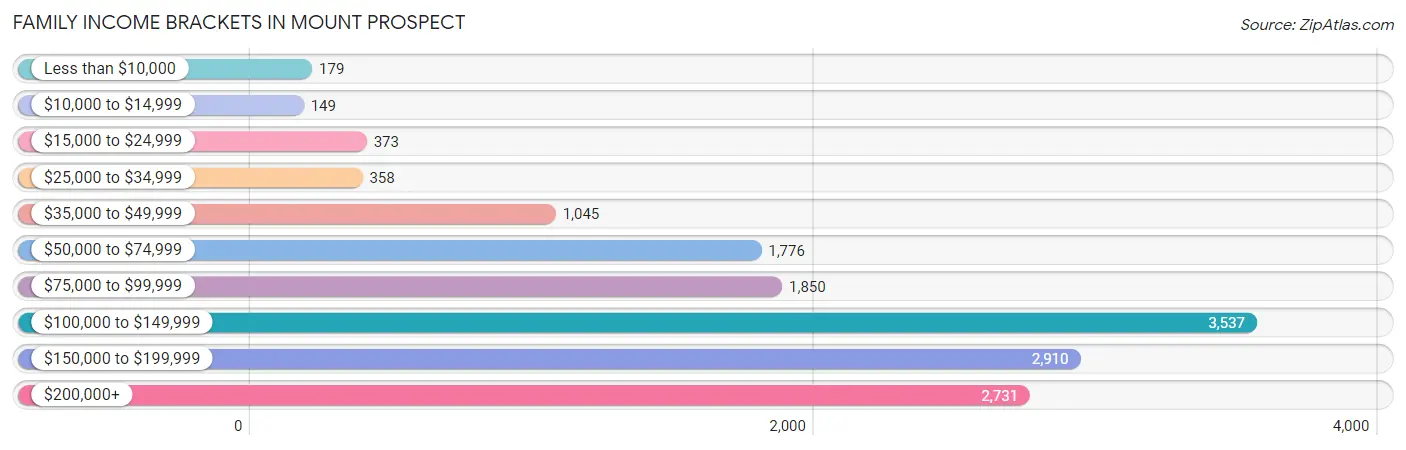
Family Income Brackets in Mount Prospect
According to the Mount Prospect family income data, there are 3,537 families falling into the $100,000 to $149,999 income range, which is the most common income bracket and makes up 23.7% of all families. Conversely, the $10,000 to $14,999 income bracket is the least frequent group with only 149 families (1.0%) belonging to this category.
| Income Bracket | # Families | % Families |
| Less than $10,000 | 179 | 1.2% |
| $10,000 to $14,999 | 149 | 1.0% |
| $15,000 to $24,999 | 373 | 2.5% |
| $25,000 to $34,999 | 358 | 2.4% |
| $35,000 to $49,999 | 1,045 | 7.0% |
| $50,000 to $74,999 | 1,776 | 11.9% |
| $75,000 to $99,999 | 1,850 | 12.4% |
| $100,000 to $149,999 | 3,537 | 23.7% |
| $150,000 to $199,999 | 2,910 | 19.5% |
| $200,000+ | 2,731 | 18.3% |
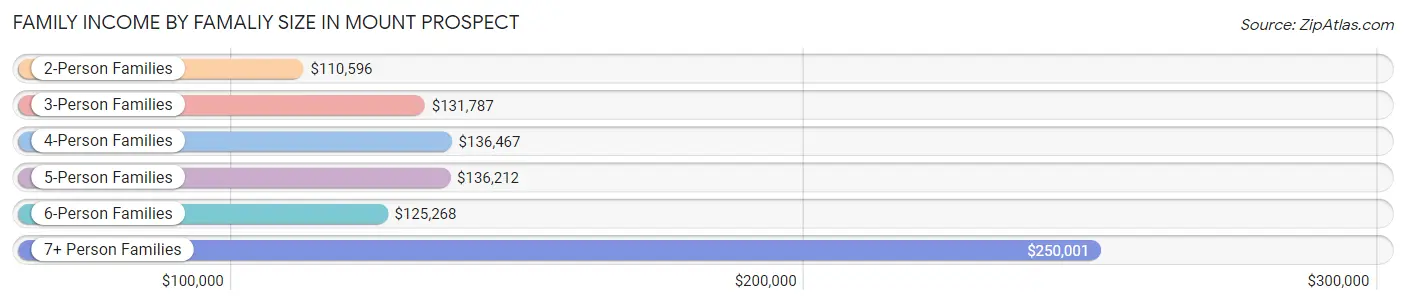
Family Income by Famaliy Size in Mount Prospect
7+ person families (53 | 0.4%) account for the highest median family income in Mount Prospect with $250,001 per family, while 2-person families (6,488 | 43.5%) have the highest median income of $55,298 per family member.
| Income Bracket | # Families | Median Income |
| 2-Person Families | 6,488 (43.5%) | $110,596 |
| 3-Person Families | 3,497 (23.4%) | $131,787 |
| 4-Person Families | 3,150 (21.1%) | $136,467 |
| 5-Person Families | 1,414 (9.5%) | $136,212 |
| 6-Person Families | 321 (2.1%) | $125,268 |
| 7+ Person Families | 53 (0.4%) | $250,001 |
| Total | 14,923 (100.0%) | $123,969 |
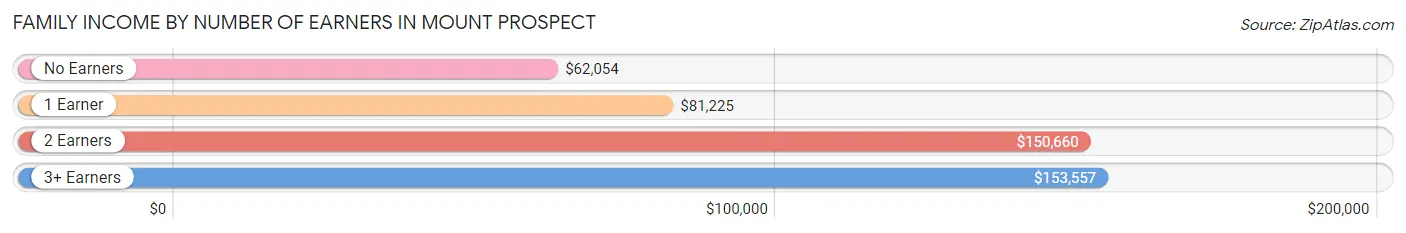
Family Income by Number of Earners in Mount Prospect
The median family income in Mount Prospect is $123,969, with families comprising 3+ earners (2,247) having the highest median family income of $153,557, while families with no earners (1,749) have the lowest median family income of $62,054, accounting for 15.1% and 11.7% of families, respectively.
| Number of Earners | # Families | Median Income |
| No Earners | 1,749 (11.7%) | $62,054 |
| 1 Earner | 4,090 (27.4%) | $81,225 |
| 2 Earners | 6,837 (45.8%) | $150,660 |
| 3+ Earners | 2,247 (15.1%) | $153,557 |
| Total | 14,923 (100.0%) | $123,969 |
Household Income in Mount Prospect
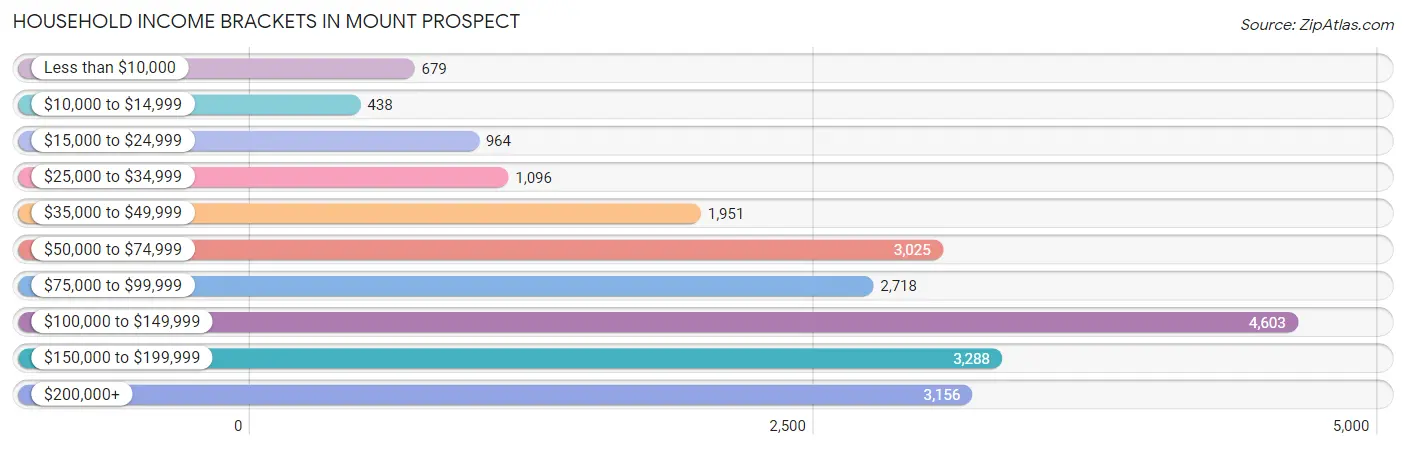
Household Income Brackets in Mount Prospect
With 4,603 households falling in the category, the $100,000 to $149,999 income range is the most frequent in Mount Prospect, accounting for 21.0% of all households. In contrast, only 438 households (2.0%) fall into the $10,000 to $14,999 income bracket, making it the least populous group.
| Income Bracket | # Households | % Households |
| Less than $10,000 | 679 | 3.1% |
| $10,000 to $14,999 | 438 | 2.0% |
| $15,000 to $24,999 | 964 | 4.4% |
| $25,000 to $34,999 | 1,096 | 5.0% |
| $35,000 to $49,999 | 1,951 | 8.9% |
| $50,000 to $74,999 | 3,025 | 13.8% |
| $75,000 to $99,999 | 2,718 | 12.4% |
| $100,000 to $149,999 | 4,603 | 21.0% |
| $150,000 to $199,999 | 3,288 | 15.0% |
| $200,000+ | 3,156 | 14.4% |
Household Income by Householder Age in Mount Prospect
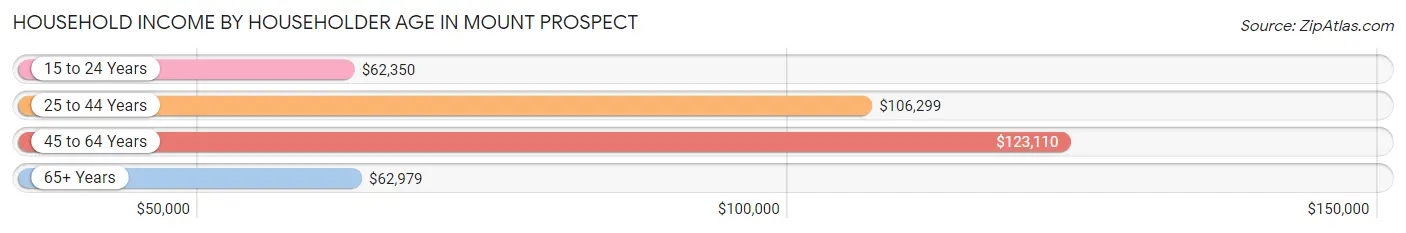
The median household income in Mount Prospect is $100,526, with the highest median household income of $123,110 found in the 45 to 64 years age bracket for the primary householder. A total of 8,119 households (37.0%) fall into this category. Meanwhile, the 15 to 24 years age bracket for the primary householder has the lowest median household income of $62,350, with 364 households (1.7%) in this group.
| Income Bracket | # Households | Median Income |
| 15 to 24 Years | 364 (1.7%) | $62,350 |
| 25 to 44 Years | 7,048 (32.2%) | $106,299 |
| 45 to 64 Years | 8,119 (37.0%) | $123,110 |
| 65+ Years | 6,386 (29.1%) | $62,979 |
| Total | 21,917 (100.0%) | $100,526 |
Poverty in Mount Prospect
Income Below Poverty by Sex and Age in Mount Prospect
With 4.9% poverty level for males and 5.0% for females among the residents of Mount Prospect, 16 and 17 year old males and 18 to 24 year old females are the most vulnerable to poverty, with 53 males (9.5%) and 107 females (8.7%) in their respective age groups living below the poverty level.
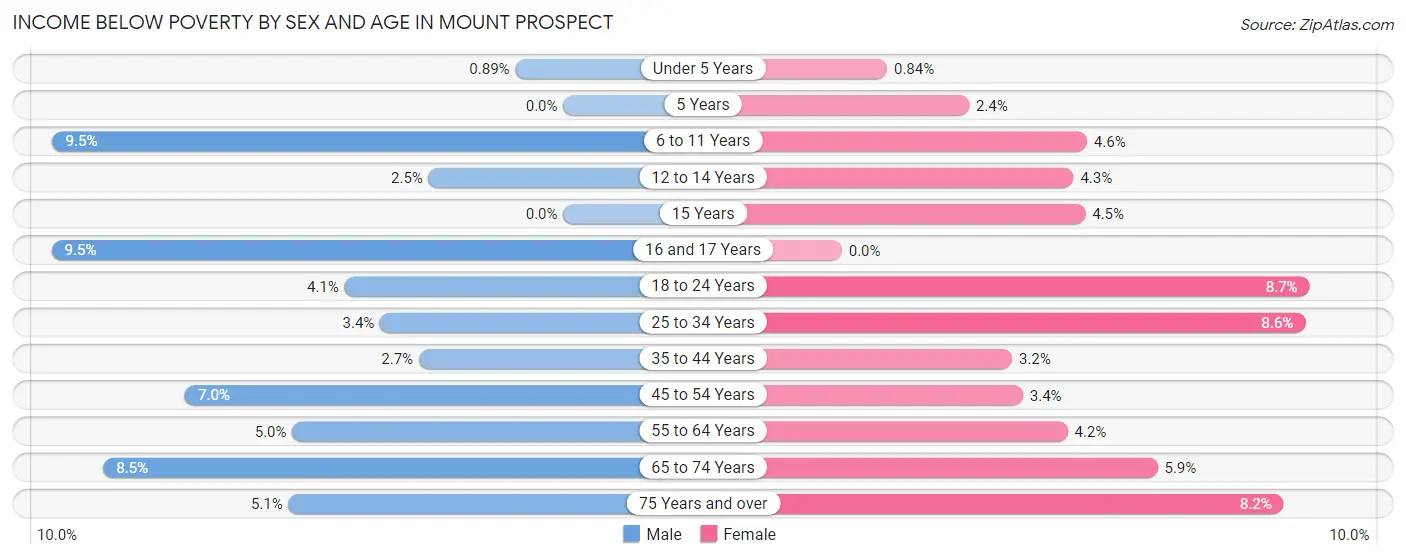
| Age Bracket | Male | Female |
| Under 5 Years | 15 (0.9%) | 13 (0.8%) |
| 5 Years | 0 (0.0%) | 5 (2.4%) |
| 6 to 11 Years | 172 (9.5%) | 82 (4.5%) |
| 12 to 14 Years | 30 (2.5%) | 52 (4.3%) |
| 15 Years | 0 (0.0%) | 16 (4.5%) |
| 16 and 17 Years | 53 (9.5%) | 0 (0.0%) |
| 18 to 24 Years | 72 (4.1%) | 107 (8.7%) |
| 25 to 34 Years | 136 (3.4%) | 341 (8.6%) |
| 35 to 44 Years | 110 (2.7%) | 106 (3.2%) |
| 45 to 54 Years | 295 (7.0%) | 132 (3.4%) |
| 55 to 64 Years | 156 (5.0%) | 164 (4.2%) |
| 65 to 74 Years | 222 (8.5%) | 166 (5.9%) |
| 75 Years and over | 104 (5.1%) | 221 (8.2%) |
| Total | 1,365 (4.9%) | 1,405 (5.0%) |
Income Above Poverty by Sex and Age in Mount Prospect
According to the poverty statistics in Mount Prospect, males aged 5 years and females aged 16 and 17 years are the age groups that are most secure financially, with 100.0% of males and 100.0% of females in these age groups living above the poverty line.
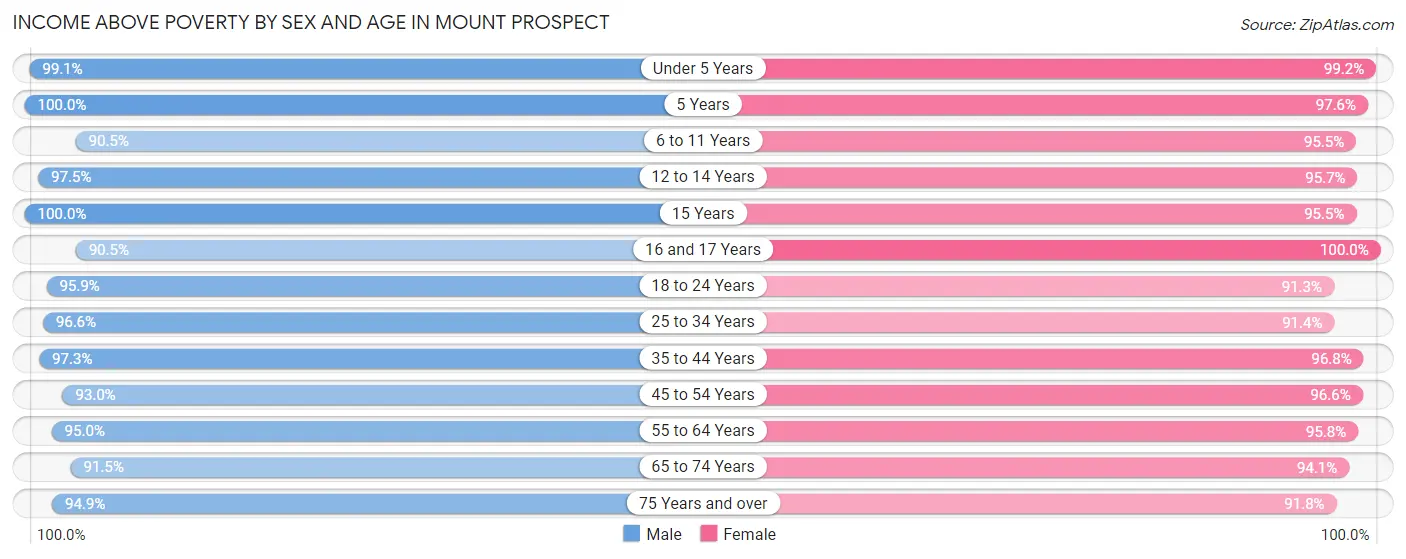
| Age Bracket | Male | Female |
| Under 5 Years | 1,679 (99.1%) | 1,533 (99.2%) |
| 5 Years | 386 (100.0%) | 207 (97.6%) |
| 6 to 11 Years | 1,642 (90.5%) | 1,722 (95.5%) |
| 12 to 14 Years | 1,169 (97.5%) | 1,156 (95.7%) |
| 15 Years | 411 (100.0%) | 338 (95.5%) |
| 16 and 17 Years | 505 (90.5%) | 822 (100.0%) |
| 18 to 24 Years | 1,702 (95.9%) | 1,126 (91.3%) |
| 25 to 34 Years | 3,868 (96.6%) | 3,622 (91.4%) |
| 35 to 44 Years | 4,002 (97.3%) | 3,249 (96.8%) |
| 45 to 54 Years | 3,909 (93.0%) | 3,791 (96.6%) |
| 55 to 64 Years | 2,948 (95.0%) | 3,749 (95.8%) |
| 65 to 74 Years | 2,377 (91.5%) | 2,665 (94.1%) |
| 75 Years and over | 1,937 (94.9%) | 2,475 (91.8%) |
| Total | 26,535 (95.1%) | 26,455 (95.0%) |
Income Below Poverty Among Married-Couple Families in Mount Prospect
The poverty statistics for married-couple families in Mount Prospect show that 2.8% or 340 of the total 12,338 families live below the poverty line. Families with no children have the highest poverty rate of 3.9%, comprising of 269 families. On the other hand, families with 3 or 4 children have the lowest poverty rate of 0.0%, which includes 0 families.
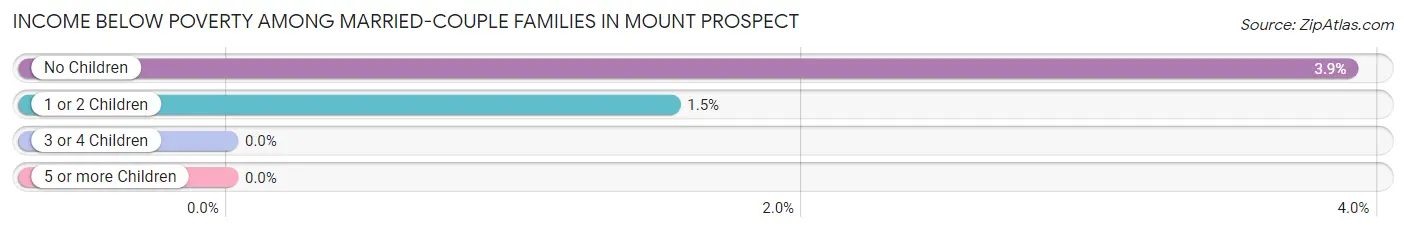
| Children | Above Poverty | Below Poverty |
| No Children | 6,626 (96.1%) | 269 (3.9%) |
| 1 or 2 Children | 4,526 (98.5%) | 71 (1.5%) |
| 3 or 4 Children | 846 (100.0%) | 0 (0.0%) |
| 5 or more Children | 0 (0.0%) | 0 (0.0%) |
| Total | 11,998 (97.2%) | 340 (2.8%) |
Income Below Poverty Among Single-Parent Households in Mount Prospect
According to the poverty data in Mount Prospect, 2.3% or 18 single-father households and 8.7% or 156 single-mother households are living below the poverty line. Among single-father households, those with no children have the highest poverty rate, with 18 households (3.0%) experiencing poverty. Likewise, among single-mother households, those with 3 or 4 children have the highest poverty rate, with 56 households (18.4%) falling below the poverty line.
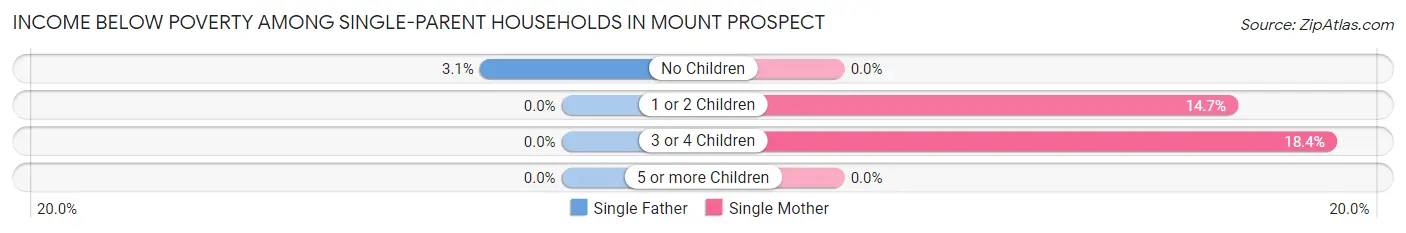
| Children | Single Father | Single Mother |
| No Children | 18 (3.0%) | 0 (0.0%) |
| 1 or 2 Children | 0 (0.0%) | 100 (14.7%) |
| 3 or 4 Children | 0 (0.0%) | 56 (18.4%) |
| 5 or more Children | 0 (0.0%) | 0 (0.0%) |
| Total | 18 (2.3%) | 156 (8.7%) |
Income Below Poverty Among Married-Couple vs Single-Parent Households in Mount Prospect
The poverty data for Mount Prospect shows that 340 of the married-couple family households (2.8%) and 174 of the single-parent households (6.7%) are living below the poverty level. Within the married-couple family households, those with no children have the highest poverty rate, with 269 households (3.9%) falling below the poverty line. Among the single-parent households, those with 3 or 4 children have the highest poverty rate, with 56 household (18.4%) living below poverty.
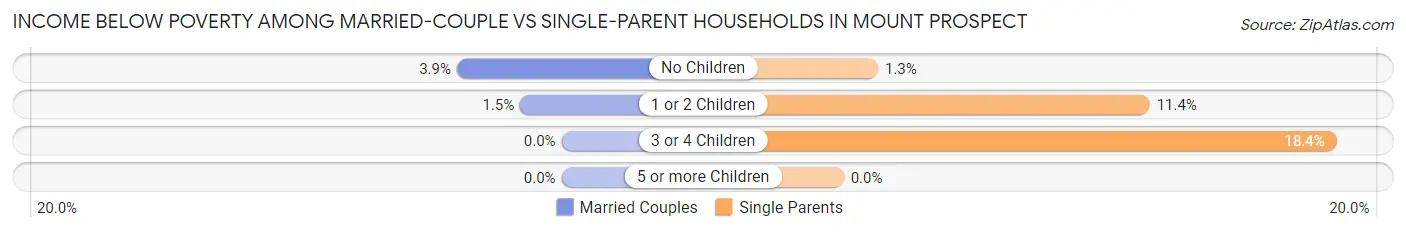
| Children | Married-Couple Families | Single-Parent Households |
| No Children | 269 (3.9%) | 18 (1.3%) |
| 1 or 2 Children | 71 (1.5%) | 100 (11.4%) |
| 3 or 4 Children | 0 (0.0%) | 56 (18.4%) |
| 5 or more Children | 0 (0.0%) | 0 (0.0%) |
| Total | 340 (2.8%) | 174 (6.7%) |
Race in Mount Prospect
The most populous races in Mount Prospect are White / Caucasian (38,006 | 67.6%), Hispanic or Latino (8,962 | 16.0%), and Asian (7,729 | 13.8%).
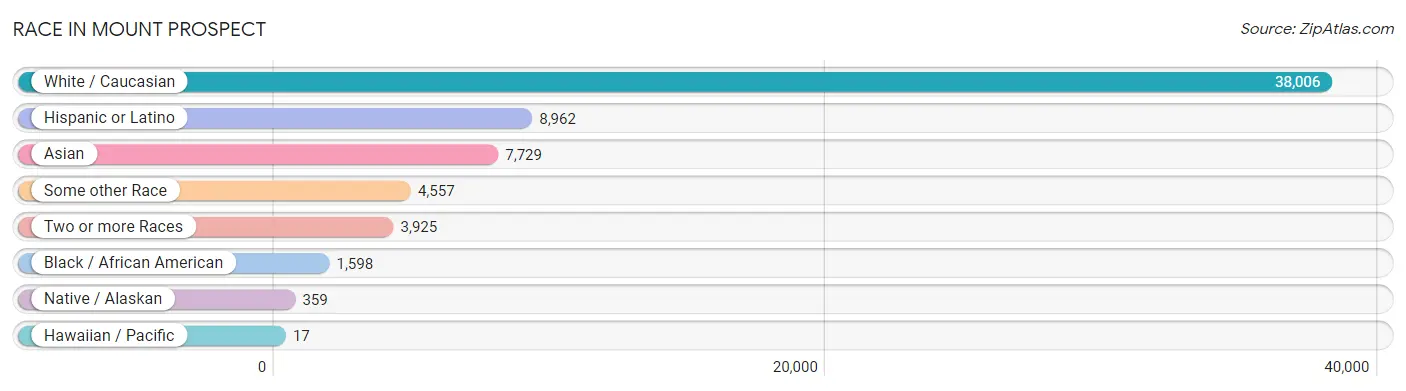
| Race | # Population | % Population |
| Asian | 7,729 | 13.8% |
| Black / African American | 1,598 | 2.8% |
| Hawaiian / Pacific | 17 | 0.0% |
| Hispanic or Latino | 8,962 | 16.0% |
| Native / Alaskan | 359 | 0.6% |
| White / Caucasian | 38,006 | 67.6% |
| Two or more Races | 3,925 | 7.0% |
| Some other Race | 4,557 | 8.1% |
| Total | 56,191 | 100.0% |
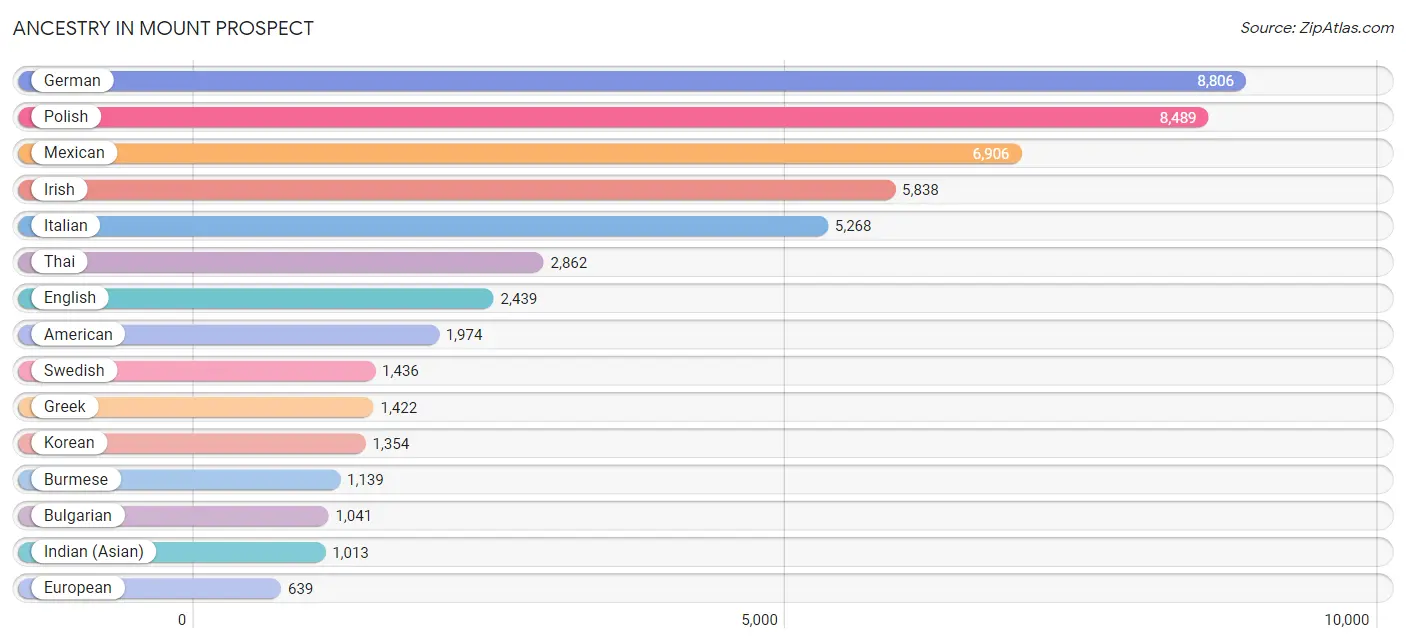
Ancestry in Mount Prospect
The most populous ancestries reported in Mount Prospect are German (8,806 | 15.7%), Polish (8,489 | 15.1%), Mexican (6,906 | 12.3%), Irish (5,838 | 10.4%), and Italian (5,268 | 9.4%), together accounting for 62.8% of all Mount Prospect residents.
| Ancestry | # Population | % Population |
| African | 73 | 0.1% |
| Albanian | 69 | 0.1% |
| American | 1,974 | 3.5% |
| Apache | 23 | 0.0% |
| Arab | 518 | 0.9% |
| Argentinean | 63 | 0.1% |
| Armenian | 36 | 0.1% |
| Assyrian / Chaldean / Syriac | 518 | 0.9% |
| Australian | 16 | 0.0% |
| Austrian | 396 | 0.7% |
| Belgian | 57 | 0.1% |
| Bhutanese | 268 | 0.5% |
| Blackfeet | 7 | 0.0% |
| Bolivian | 87 | 0.2% |
| Brazilian | 116 | 0.2% |
| British | 145 | 0.3% |
| Bulgarian | 1,041 | 1.8% |
| Burmese | 1,139 | 2.0% |
| Cambodian | 364 | 0.6% |
| Canadian | 144 | 0.3% |
| Central American | 516 | 0.9% |
| Central American Indian | 218 | 0.4% |
| Cherokee | 30 | 0.1% |
| Colombian | 18 | 0.0% |
| Costa Rican | 26 | 0.1% |
| Cree | 11 | 0.0% |
| Croatian | 264 | 0.5% |
| Cuban | 270 | 0.5% |
| Cypriot | 22 | 0.0% |
| Czech | 352 | 0.6% |
| Czechoslovakian | 89 | 0.2% |
| Danish | 220 | 0.4% |
| Dutch | 359 | 0.6% |
| Eastern European | 57 | 0.1% |
| Ecuadorian | 169 | 0.3% |
| Egyptian | 21 | 0.0% |
| English | 2,439 | 4.3% |
| European | 639 | 1.1% |
| Filipino | 118 | 0.2% |
| Finnish | 97 | 0.2% |
| French | 584 | 1.0% |
| French Canadian | 59 | 0.1% |
| German | 8,806 | 15.7% |
| Greek | 1,422 | 2.5% |
| Guatemalan | 211 | 0.4% |
| Hungarian | 293 | 0.5% |
| Indian (Asian) | 1,013 | 1.8% |
| Indonesian | 102 | 0.2% |
| Iranian | 94 | 0.2% |
| Iraqi | 173 | 0.3% |
| Irish | 5,838 | 10.4% |
| Iroquois | 58 | 0.1% |
| Italian | 5,268 | 9.4% |
| Jamaican | 207 | 0.4% |
| Jordanian | 50 | 0.1% |
| Korean | 1,354 | 2.4% |
| Latvian | 123 | 0.2% |
| Lebanese | 46 | 0.1% |
| Lithuanian | 260 | 0.5% |
| Luxembourger | 17 | 0.0% |
| Macedonian | 135 | 0.2% |
| Mexican | 6,906 | 12.3% |
| Mexican American Indian | 179 | 0.3% |
| Mongolian | 2 | 0.0% |
| Native Hawaiian | 40 | 0.1% |
| Navajo | 13 | 0.0% |
| Nicaraguan | 13 | 0.0% |
| Nigerian | 183 | 0.3% |
| Northern European | 8 | 0.0% |
| Norwegian | 514 | 0.9% |
| Palestinian | 77 | 0.1% |
| Peruvian | 23 | 0.0% |
| Polish | 8,489 | 15.1% |
| Portuguese | 30 | 0.1% |
| Puerto Rican | 574 | 1.0% |
| Romanian | 594 | 1.1% |
| Russian | 529 | 0.9% |
| Salvadoran | 266 | 0.5% |
| Scandinavian | 112 | 0.2% |
| Scotch-Irish | 299 | 0.5% |
| Scottish | 540 | 1.0% |
| Serbian | 302 | 0.5% |
| Slavic | 87 | 0.2% |
| Slovak | 211 | 0.4% |
| Slovene | 25 | 0.0% |
| South American | 394 | 0.7% |
| Spaniard | 69 | 0.1% |
| Spanish | 122 | 0.2% |
| Sri Lankan | 519 | 0.9% |
| Subsaharan African | 256 | 0.5% |
| Swedish | 1,436 | 2.6% |
| Swiss | 83 | 0.2% |
| Syrian | 77 | 0.1% |
| Thai | 2,862 | 5.1% |
| Turkish | 60 | 0.1% |
| Ukrainian | 285 | 0.5% |
| Venezuelan | 34 | 0.1% |
| Welsh | 124 | 0.2% |
| West Indian | 29 | 0.1% |
| Yugoslavian | 107 | 0.2% | View All 100 Rows |
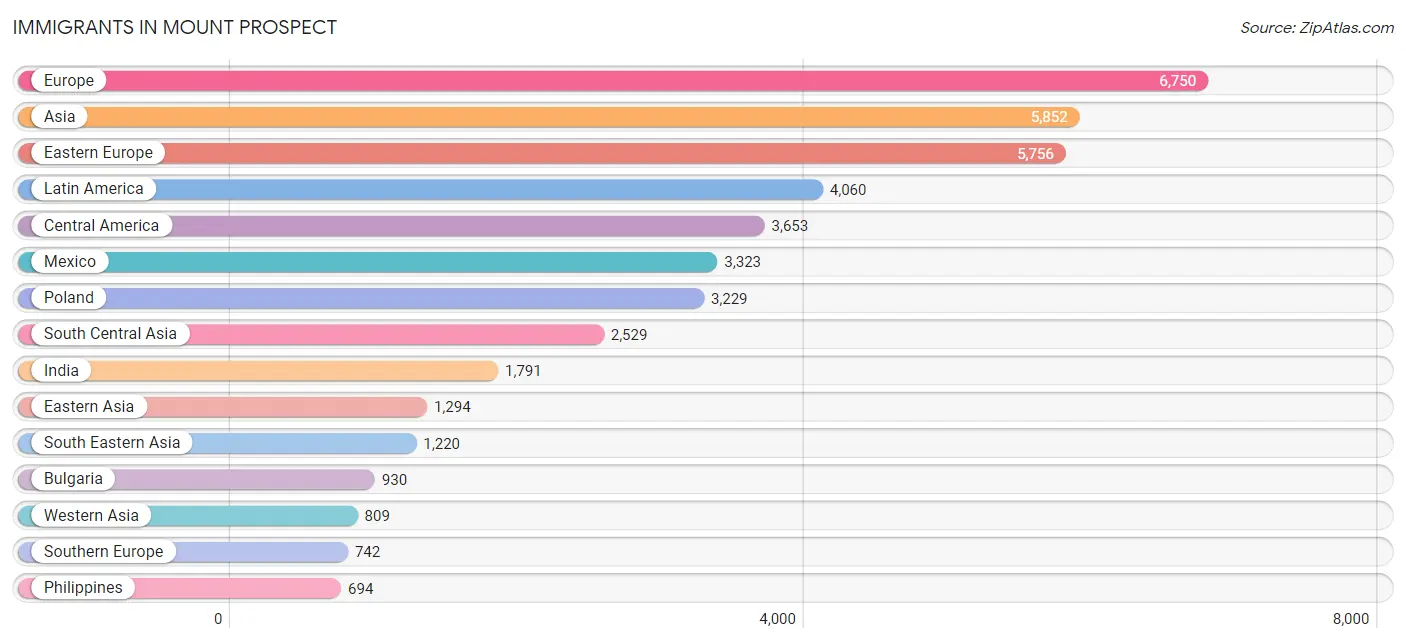
Immigrants in Mount Prospect
The most numerous immigrant groups reported in Mount Prospect came from Europe (6,750 | 12.0%), Asia (5,852 | 10.4%), Eastern Europe (5,756 | 10.2%), Latin America (4,060 | 7.2%), and Central America (3,653 | 6.5%), together accounting for 46.4% of all Mount Prospect residents.
| Immigration Origin | # Population | % Population |
| Africa | 168 | 0.3% |
| Argentina | 15 | 0.0% |
| Asia | 5,852 | 10.4% |
| Australia | 16 | 0.0% |
| Austria | 16 | 0.0% |
| Belarus | 32 | 0.1% |
| Bolivia | 87 | 0.2% |
| Bosnia and Herzegovina | 149 | 0.3% |
| Brazil | 58 | 0.1% |
| Bulgaria | 930 | 1.7% |
| Cambodia | 129 | 0.2% |
| Canada | 22 | 0.0% |
| Caribbean | 149 | 0.3% |
| Central America | 3,653 | 6.5% |
| China | 315 | 0.6% |
| Colombia | 9 | 0.0% |
| Costa Rica | 13 | 0.0% |
| Croatia | 40 | 0.1% |
| Cuba | 12 | 0.0% |
| Czechoslovakia | 78 | 0.1% |
| Eastern Africa | 73 | 0.1% |
| Eastern Asia | 1,294 | 2.3% |
| Eastern Europe | 5,756 | 10.2% |
| Ecuador | 22 | 0.0% |
| Egypt | 21 | 0.0% |
| El Salvador | 128 | 0.2% |
| England | 15 | 0.0% |
| Europe | 6,750 | 12.0% |
| France | 24 | 0.0% |
| Germany | 74 | 0.1% |
| Greece | 315 | 0.6% |
| Guatemala | 189 | 0.3% |
| Hong Kong | 94 | 0.2% |
| India | 1,791 | 3.2% |
| Iran | 82 | 0.2% |
| Iraq | 297 | 0.5% |
| Ireland | 46 | 0.1% |
| Israel | 41 | 0.1% |
| Italy | 394 | 0.7% |
| Jamaica | 137 | 0.2% |
| Japan | 96 | 0.2% |
| Jordan | 50 | 0.1% |
| Kazakhstan | 59 | 0.1% |
| Korea | 686 | 1.2% |
| Latin America | 4,060 | 7.2% |
| Latvia | 5 | 0.0% |
| Lebanon | 81 | 0.1% |
| Lithuania | 31 | 0.1% |
| Mexico | 3,323 | 5.9% |
| Moldova | 186 | 0.3% |
| Nepal | 27 | 0.1% |
| Nigeria | 42 | 0.1% |
| North Macedonia | 135 | 0.2% |
| Northern Africa | 53 | 0.1% |
| Northern Europe | 134 | 0.2% |
| Oceania | 16 | 0.0% |
| Pakistan | 131 | 0.2% |
| Peru | 12 | 0.0% |
| Philippines | 694 | 1.2% |
| Poland | 3,229 | 5.8% |
| Romania | 401 | 0.7% |
| Russia | 87 | 0.2% |
| Saudi Arabia | 44 | 0.1% |
| Serbia | 25 | 0.0% |
| Singapore | 2 | 0.0% |
| South America | 258 | 0.5% |
| South Central Asia | 2,529 | 4.5% |
| South Eastern Asia | 1,220 | 2.2% |
| Southern Europe | 742 | 1.3% |
| Spain | 33 | 0.1% |
| Syria | 85 | 0.2% |
| Taiwan | 58 | 0.1% |
| Turkey | 96 | 0.2% |
| Ukraine | 390 | 0.7% |
| Venezuela | 45 | 0.1% |
| Vietnam | 293 | 0.5% |
| Western Africa | 42 | 0.1% |
| Western Asia | 809 | 1.4% |
| Western Europe | 118 | 0.2% | View All 79 Rows |
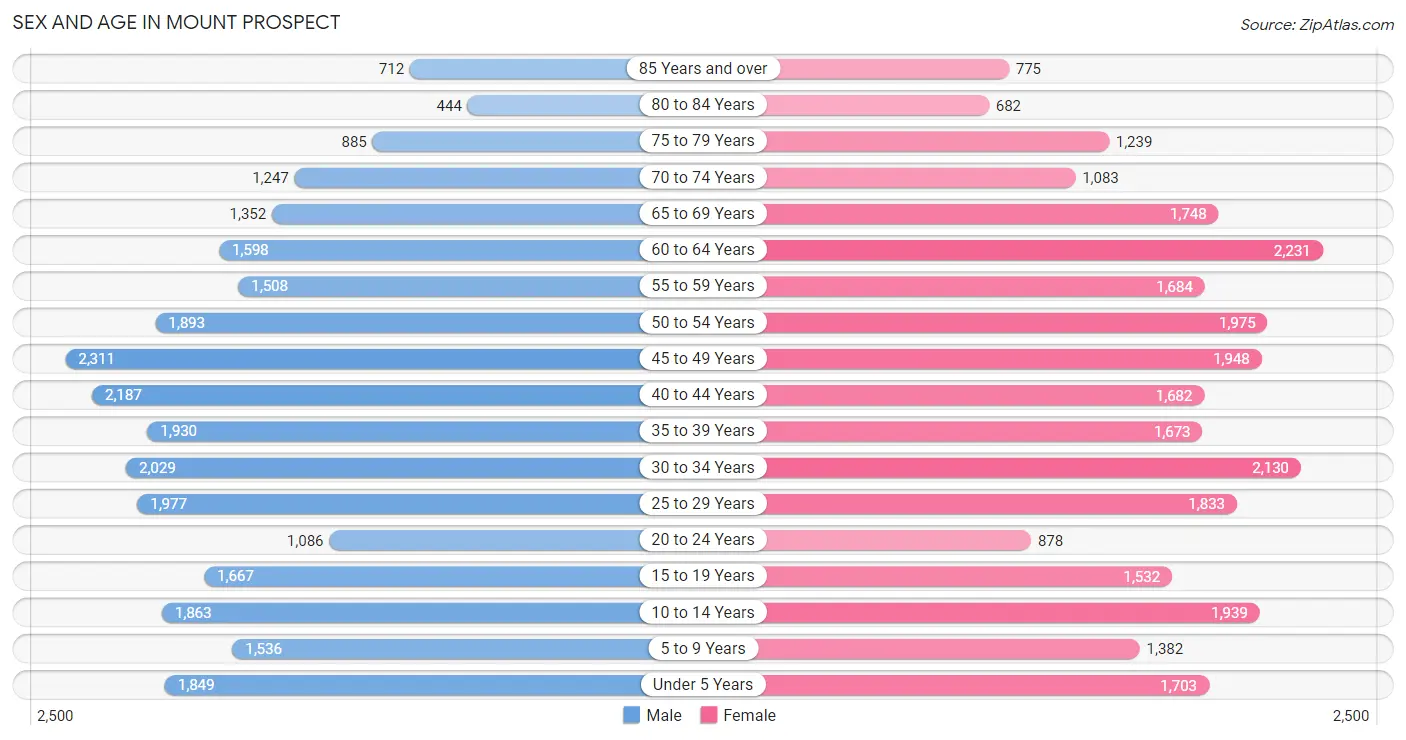
Sex and Age in Mount Prospect
Sex and Age in Mount Prospect
The most populous age groups in Mount Prospect are 45 to 49 Years (2,311 | 8.2%) for men and 60 to 64 Years (2,231 | 7.9%) for women.
| Age Bracket | Male | Female |
| Under 5 Years | 1,849 (6.6%) | 1,703 (6.1%) |
| 5 to 9 Years | 1,536 (5.5%) | 1,382 (4.9%) |
| 10 to 14 Years | 1,863 (6.6%) | 1,939 (6.9%) |
| 15 to 19 Years | 1,667 (5.9%) | 1,532 (5.4%) |
| 20 to 24 Years | 1,086 (3.9%) | 878 (3.1%) |
| 25 to 29 Years | 1,977 (7.0%) | 1,833 (6.5%) |
| 30 to 34 Years | 2,029 (7.2%) | 2,130 (7.6%) |
| 35 to 39 Years | 1,930 (6.9%) | 1,673 (5.9%) |
| 40 to 44 Years | 2,187 (7.8%) | 1,682 (6.0%) |
| 45 to 49 Years | 2,311 (8.2%) | 1,948 (6.9%) |
| 50 to 54 Years | 1,893 (6.7%) | 1,975 (7.0%) |
| 55 to 59 Years | 1,508 (5.4%) | 1,684 (6.0%) |
| 60 to 64 Years | 1,598 (5.7%) | 2,231 (7.9%) |
| 65 to 69 Years | 1,352 (4.8%) | 1,748 (6.2%) |
| 70 to 74 Years | 1,247 (4.4%) | 1,083 (3.8%) |
| 75 to 79 Years | 885 (3.2%) | 1,239 (4.4%) |
| 80 to 84 Years | 444 (1.6%) | 682 (2.4%) |
| 85 Years and over | 712 (2.5%) | 775 (2.8%) |
| Total | 28,074 (100.0%) | 28,117 (100.0%) |
Families and Households in Mount Prospect
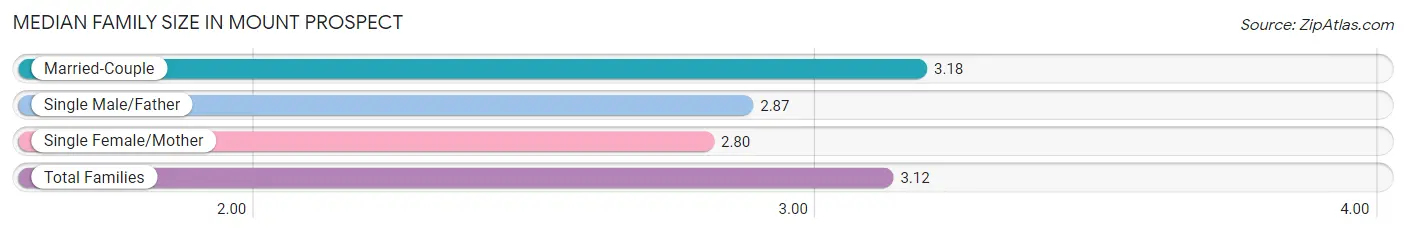
Median Family Size in Mount Prospect
The median family size in Mount Prospect is 3.12 persons per family, with married-couple families (12,338 | 82.7%) accounting for the largest median family size of 3.18 persons per family. On the other hand, single female/mother families (1,798 | 12.0%) represent the smallest median family size with 2.80 persons per family.
| Family Type | # Families | Family Size |
| Married-Couple | 12,338 (82.7%) | 3.18 |
| Single Male/Father | 787 (5.3%) | 2.87 |
| Single Female/Mother | 1,798 (12.0%) | 2.80 |
| Total Families | 14,923 (100.0%) | 3.12 |
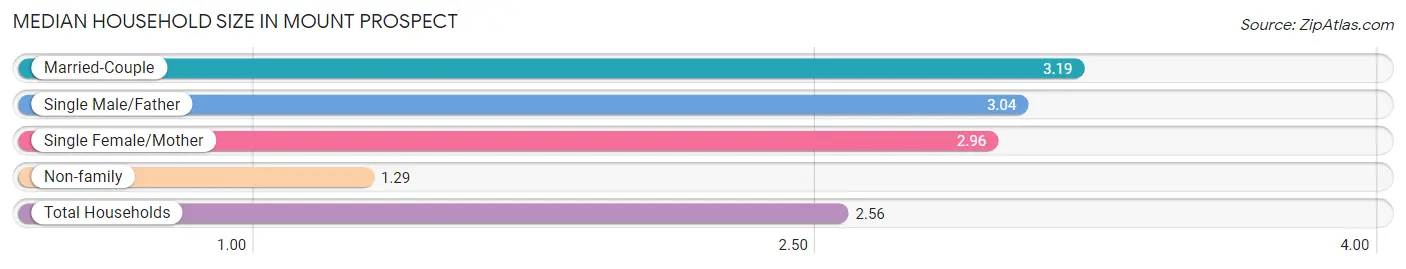
Median Household Size in Mount Prospect
The median household size in Mount Prospect is 2.56 persons per household, with married-couple households (12,338 | 56.3%) accounting for the largest median household size of 3.19 persons per household. non-family households (6,994 | 31.9%) represent the smallest median household size with 1.29 persons per household.
| Household Type | # Households | Household Size |
| Married-Couple | 12,338 (56.3%) | 3.19 |
| Single Male/Father | 787 (3.6%) | 3.04 |
| Single Female/Mother | 1,798 (8.2%) | 2.96 |
| Non-family | 6,994 (31.9%) | 1.29 |
| Total Households | 21,917 (100.0%) | 2.56 |
Household Size by Marriage Status in Mount Prospect
Out of a total of 21,917 households in Mount Prospect, 14,923 (68.1%) are family households, while 6,994 (31.9%) are nonfamily households. The most numerous type of family households are 2-person households, comprising 6,200, and the most common type of nonfamily households are 1-person households, comprising 5,552.
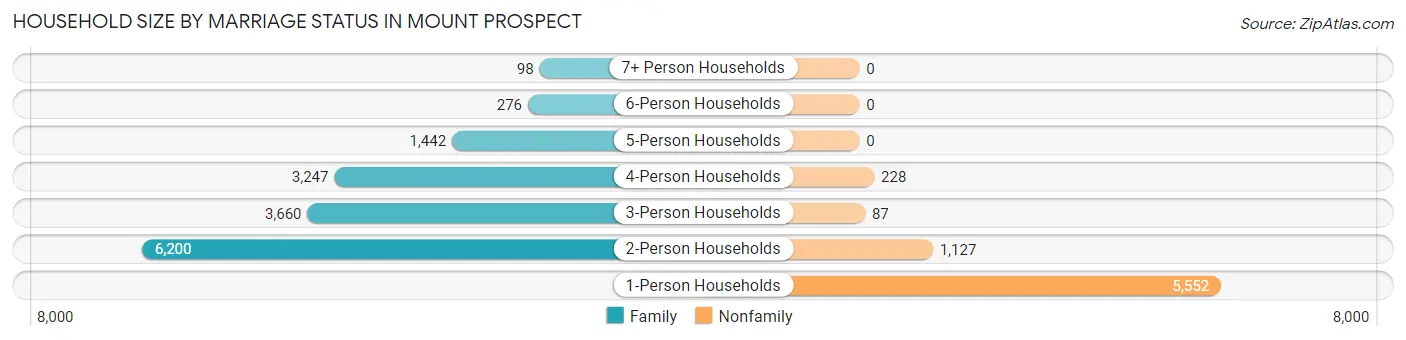
| Household Size | Family Households | Nonfamily Households |
| 1-Person Households | - | 5,552 (25.3%) |
| 2-Person Households | 6,200 (28.3%) | 1,127 (5.1%) |
| 3-Person Households | 3,660 (16.7%) | 87 (0.4%) |
| 4-Person Households | 3,247 (14.8%) | 228 (1.0%) |
| 5-Person Households | 1,442 (6.6%) | 0 (0.0%) |
| 6-Person Households | 276 (1.3%) | 0 (0.0%) |
| 7+ Person Households | 98 (0.4%) | 0 (0.0%) |
| Total | 14,923 (68.1%) | 6,994 (31.9%) |
Female Fertility in Mount Prospect
Fertility by Age in Mount Prospect
Average fertility rate in Mount Prospect is 62.0 births per 1,000 women. Women in the age bracket of 20 to 34 years have the highest fertility rate with 115.0 births per 1,000 women. Women in the age bracket of 20 to 34 years acount for 74.3% of all women with births.
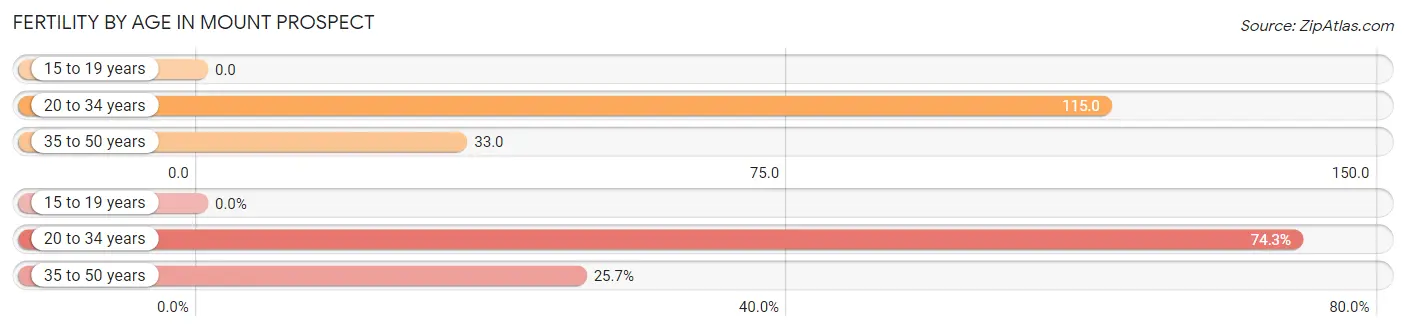
| Age Bracket | Women with Births | Births / 1,000 Women |
| 15 to 19 years | 0 (0.0%) | 0.0 |
| 20 to 34 years | 555 (74.3%) | 115.0 |
| 35 to 50 years | 192 (25.7%) | 33.0 |
| Total | 747 (100.0%) | 62.0 |
Fertility by Age by Marriage Status in Mount Prospect
86.9% of women with births (747) in Mount Prospect are married. The highest percentage of unmarried women with births falls into 20 to 34 years age bracket with 15.9% of them unmarried at the time of birth, while the lowest percentage of unmarried women with births belong to 35 to 50 years age bracket with 5.2% of them unmarried.
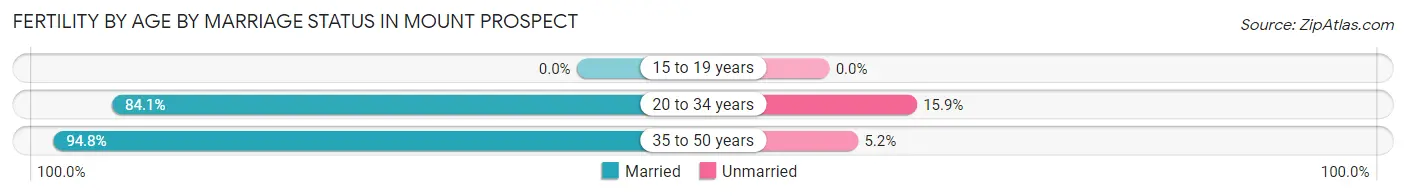
| Age Bracket | Married | Unmarried |
| 15 to 19 years | 0 (0.0%) | 0 (0.0%) |
| 20 to 34 years | 467 (84.1%) | 88 (15.9%) |
| 35 to 50 years | 182 (94.8%) | 10 (5.2%) |
| Total | 649 (86.9%) | 98 (13.1%) |
Fertility by Education in Mount Prospect
Average fertility rate in Mount Prospect is 62.0 births per 1,000 women. Women with the education attainment of graduate degree have the highest fertility rate of 94.0 births per 1,000 women, while women with the education attainment of less than high school have the lowest fertility at 25.0 births per 1,000 women. Women with the education attainment of bachelor's degree represent 44.7% of all women with births.
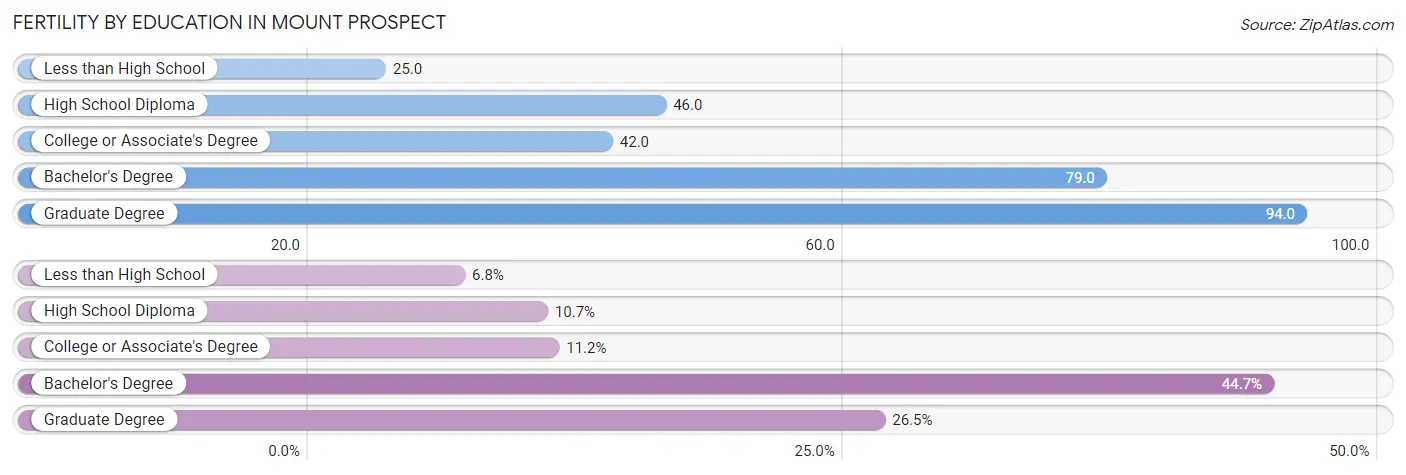
| Educational Attainment | Women with Births | Births / 1,000 Women |
| Less than High School | 51 (6.8%) | 25.0 |
| High School Diploma | 80 (10.7%) | 46.0 |
| College or Associate's Degree | 84 (11.2%) | 42.0 |
| Bachelor's Degree | 334 (44.7%) | 79.0 |
| Graduate Degree | 198 (26.5%) | 94.0 |
| Total | 747 (100.0%) | 62.0 |
Fertility by Education by Marriage Status in Mount Prospect
13.1% of women with births in Mount Prospect are unmarried. Women with the educational attainment of high school diploma are most likely to be married with 100.0% of them married at childbirth, while women with the educational attainment of bachelor's degree are least likely to be married with 23.4% of them unmarried at childbirth.
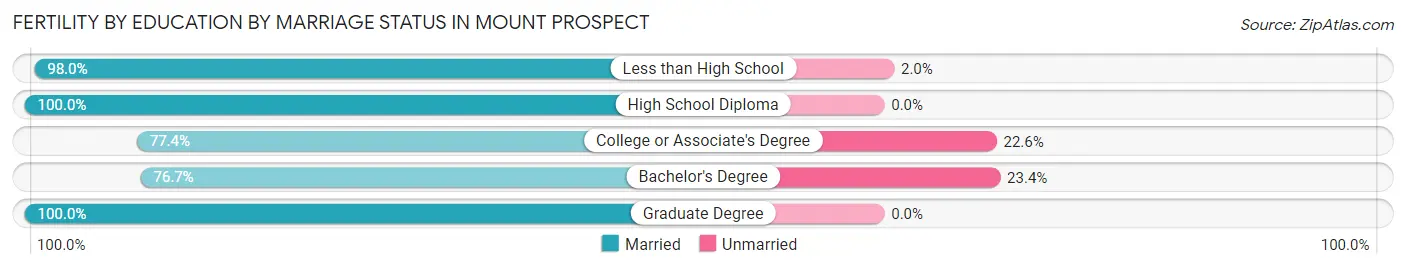
| Educational Attainment | Married | Unmarried |
| Less than High School | 50 (98.0%) | 1 (2.0%) |
| High School Diploma | 80 (100.0%) | 0 (0.0%) |
| College or Associate's Degree | 65 (77.4%) | 19 (22.6%) |
| Bachelor's Degree | 256 (76.6%) | 78 (23.4%) |
| Graduate Degree | 198 (100.0%) | 0 (0.0%) |
| Total | 649 (86.9%) | 98 (13.1%) |
Employment Characteristics in Mount Prospect
Employment by Class of Employer in Mount Prospect
Among the 29,015 employed individuals in Mount Prospect, private company employees (20,557 | 70.9%), not-for-profit organizations (2,822 | 9.7%), and local government employees (2,011 | 6.9%) make up the most common classes of employment.
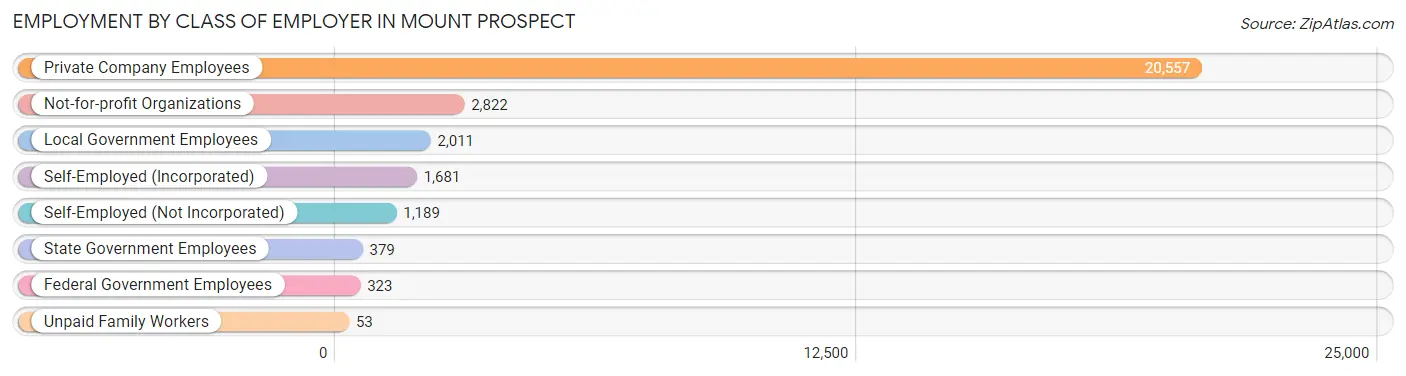
| Employer Class | # Employees | % Employees |
| Private Company Employees | 20,557 | 70.9% |
| Self-Employed (Incorporated) | 1,681 | 5.8% |
| Self-Employed (Not Incorporated) | 1,189 | 4.1% |
| Not-for-profit Organizations | 2,822 | 9.7% |
| Local Government Employees | 2,011 | 6.9% |
| State Government Employees | 379 | 1.3% |
| Federal Government Employees | 323 | 1.1% |
| Unpaid Family Workers | 53 | 0.2% |
| Total | 29,015 | 100.0% |
Employment Status by Age in Mount Prospect
According to the labor force statistics for Mount Prospect, out of the total population over 16 years of age (45,154), 67.7% or 30,569 individuals are in the labor force, with 3.5% or 1,070 of them unemployed. The age group with the highest labor force participation rate is 35 to 44 years, with 89.7% or 6,702 individuals in the labor force. Within the labor force, the 20 to 24 years age range has the highest percentage of unemployed individuals, with 18.0% or 269 of them being unemployed.
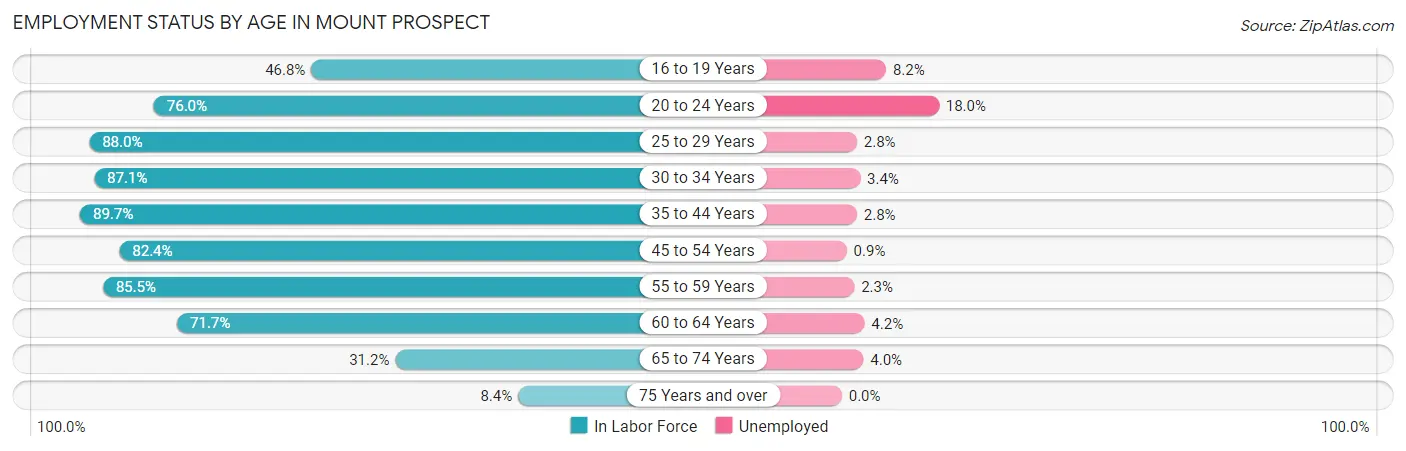
| Age Bracket | In Labor Force | Unemployed |
| 16 to 19 Years | 1,139 (46.8%) | 93 (8.2%) |
| 20 to 24 Years | 1,493 (76.0%) | 269 (18.0%) |
| 25 to 29 Years | 3,353 (88.0%) | 94 (2.8%) |
| 30 to 34 Years | 3,622 (87.1%) | 123 (3.4%) |
| 35 to 44 Years | 6,702 (89.7%) | 188 (2.8%) |
| 45 to 54 Years | 6,697 (82.4%) | 60 (0.9%) |
| 55 to 59 Years | 2,729 (85.5%) | 63 (2.3%) |
| 60 to 64 Years | 2,745 (71.7%) | 115 (4.2%) |
| 65 to 74 Years | 1,694 (31.2%) | 68 (4.0%) |
| 75 Years and over | 398 (8.4%) | 0 (0.0%) |
| Total | 30,569 (67.7%) | 1,070 (3.5%) |
Employment Status by Educational Attainment in Mount Prospect
According to labor force statistics for Mount Prospect, 84.5% of individuals (25,848) out of the total population between 25 and 64 years of age (30,589) are in the labor force, with 2.5% or 646 of them being unemployed. The group with the highest labor force participation rate are those with the educational attainment of college / associate degree, with 87.1% or 5,729 individuals in the labor force. Within the labor force, individuals with high school diploma education have the highest percentage of unemployment, with 4.2% or 197 of them being unemployed.
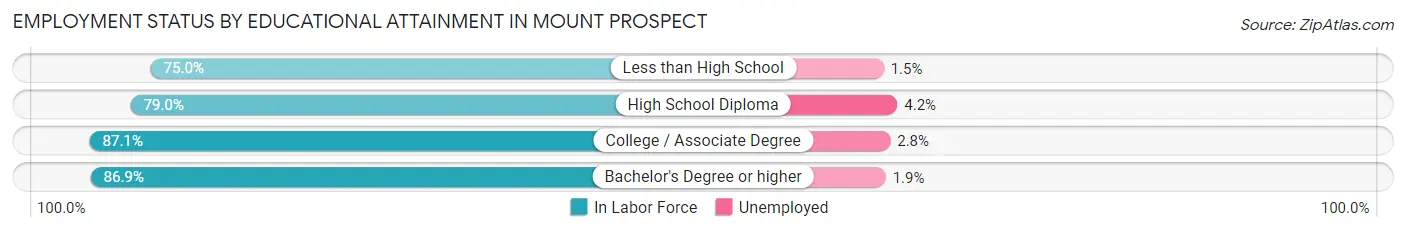
| Educational Attainment | In Labor Force | Unemployed |
| Less than High School | 1,814 (75.0%) | 36 (1.5%) |
| High School Diploma | 4,689 (79.0%) | 249 (4.2%) |
| College / Associate Degree | 5,729 (87.1%) | 184 (2.8%) |
| Bachelor's Degree or higher | 13,605 (86.9%) | 297 (1.9%) |
| Total | 25,848 (84.5%) | 765 (2.5%) |
Employment Occupations by Sex in Mount Prospect
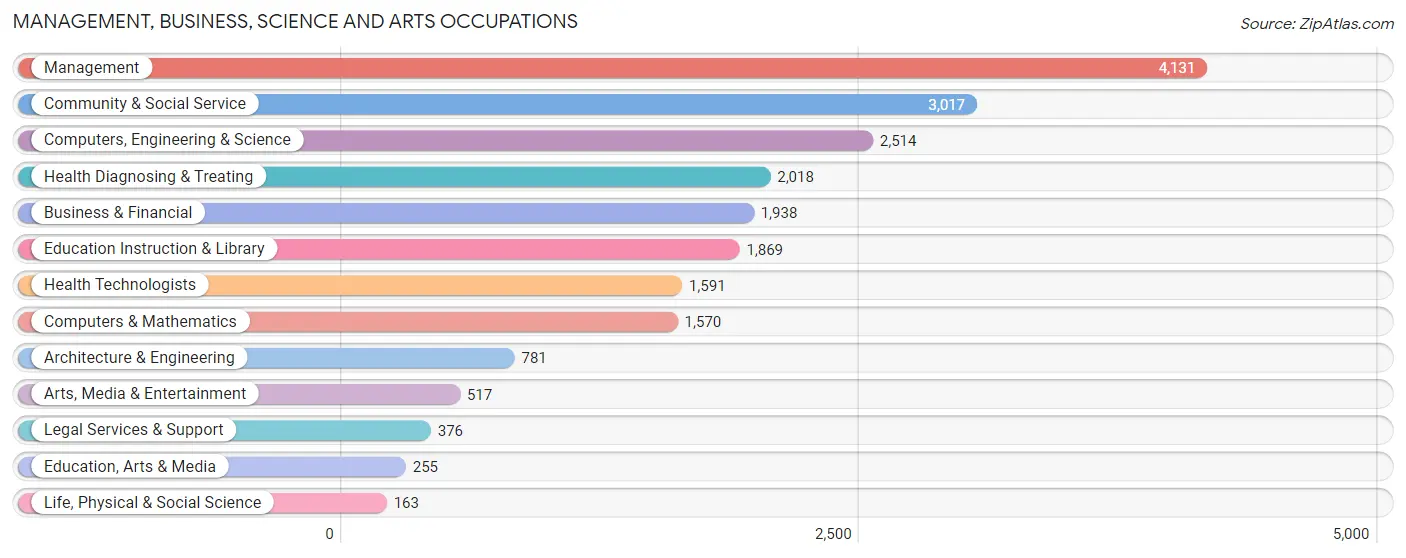
Management, Business, Science and Arts Occupations
The most common Management, Business, Science and Arts occupations in Mount Prospect are Management (4,131 | 14.0%), Community & Social Service (3,017 | 10.2%), Computers, Engineering & Science (2,514 | 8.5%), Health Diagnosing & Treating (2,018 | 6.8%), and Business & Financial (1,938 | 6.6%).
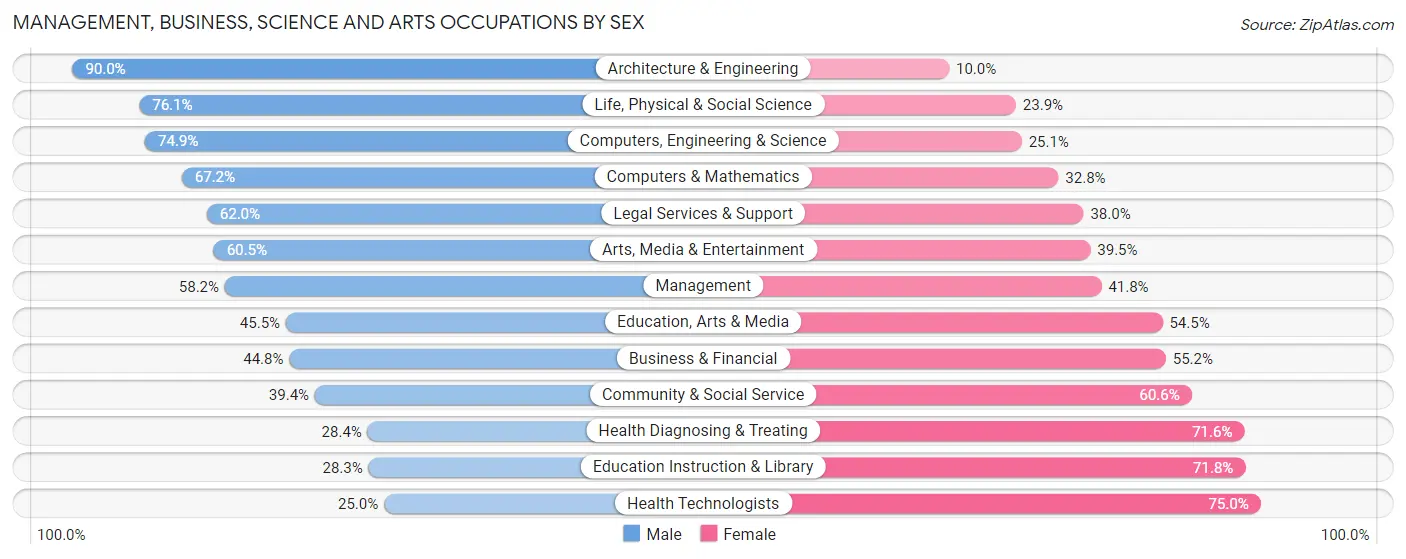
Management, Business, Science and Arts Occupations by Sex
Within the Management, Business, Science and Arts occupations in Mount Prospect, the most male-oriented occupations are Architecture & Engineering (90.0%), Life, Physical & Social Science (76.1%), and Computers, Engineering & Science (74.9%), while the most female-oriented occupations are Health Technologists (75.0%), Education Instruction & Library (71.8%), and Health Diagnosing & Treating (71.6%).
| Occupation | Male | Female |
| Management | 2,405 (58.2%) | 1,726 (41.8%) |
| Business & Financial | 868 (44.8%) | 1,070 (55.2%) |
| Computers, Engineering & Science | 1,882 (74.9%) | 632 (25.1%) |
| Computers & Mathematics | 1,055 (67.2%) | 515 (32.8%) |
| Architecture & Engineering | 703 (90.0%) | 78 (10.0%) |
| Life, Physical & Social Science | 124 (76.1%) | 39 (23.9%) |
| Community & Social Service | 1,190 (39.4%) | 1,827 (60.6%) |
| Education, Arts & Media | 116 (45.5%) | 139 (54.5%) |
| Legal Services & Support | 233 (62.0%) | 143 (38.0%) |
| Education Instruction & Library | 528 (28.2%) | 1,341 (71.8%) |
| Arts, Media & Entertainment | 313 (60.5%) | 204 (39.5%) |
| Health Diagnosing & Treating | 574 (28.4%) | 1,444 (71.6%) |
| Health Technologists | 398 (25.0%) | 1,193 (75.0%) |
| Total (Category) | 6,919 (50.8%) | 6,699 (49.2%) |
| Total (Overall) | 15,902 (53.9%) | 13,589 (46.1%) |
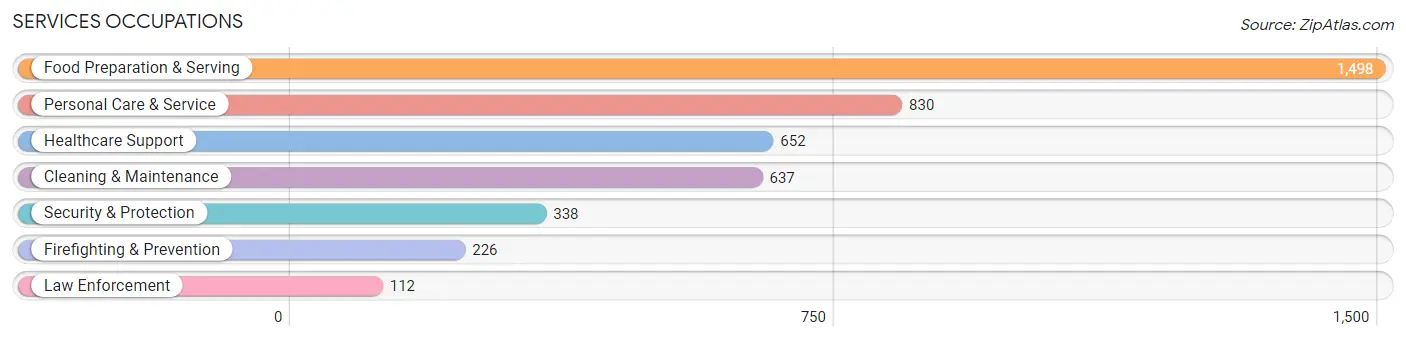
Services Occupations
The most common Services occupations in Mount Prospect are Food Preparation & Serving (1,498 | 5.1%), Personal Care & Service (830 | 2.8%), Healthcare Support (652 | 2.2%), Cleaning & Maintenance (637 | 2.2%), and Security & Protection (338 | 1.1%).
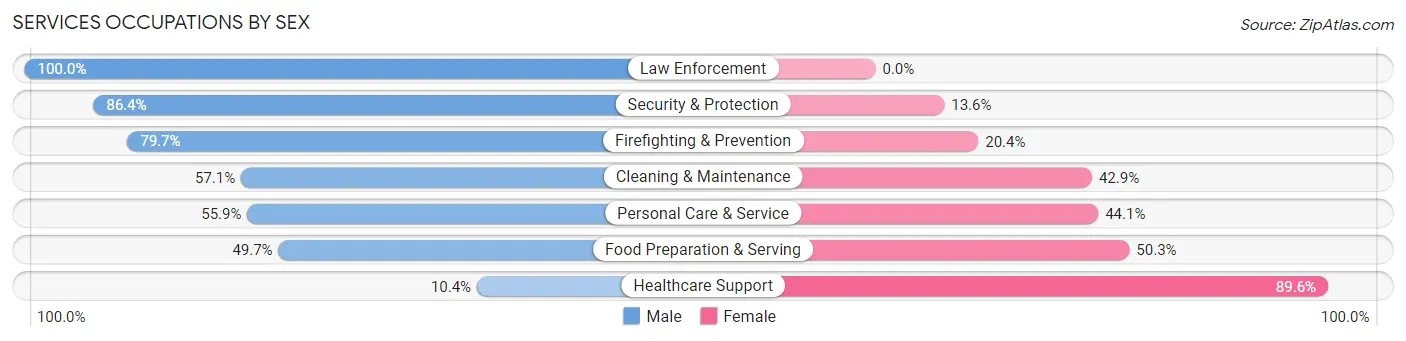
Services Occupations by Sex
Within the Services occupations in Mount Prospect, the most male-oriented occupations are Law Enforcement (100.0%), Security & Protection (86.4%), and Firefighting & Prevention (79.6%), while the most female-oriented occupations are Healthcare Support (89.6%), Food Preparation & Serving (50.3%), and Personal Care & Service (44.1%).
| Occupation | Male | Female |
| Healthcare Support | 68 (10.4%) | 584 (89.6%) |
| Security & Protection | 292 (86.4%) | 46 (13.6%) |
| Firefighting & Prevention | 180 (79.6%) | 46 (20.3%) |
| Law Enforcement | 112 (100.0%) | 0 (0.0%) |
| Food Preparation & Serving | 745 (49.7%) | 753 (50.3%) |
| Cleaning & Maintenance | 364 (57.1%) | 273 (42.9%) |
| Personal Care & Service | 464 (55.9%) | 366 (44.1%) |
| Total (Category) | 1,933 (48.9%) | 2,022 (51.1%) |
| Total (Overall) | 15,902 (53.9%) | 13,589 (46.1%) |
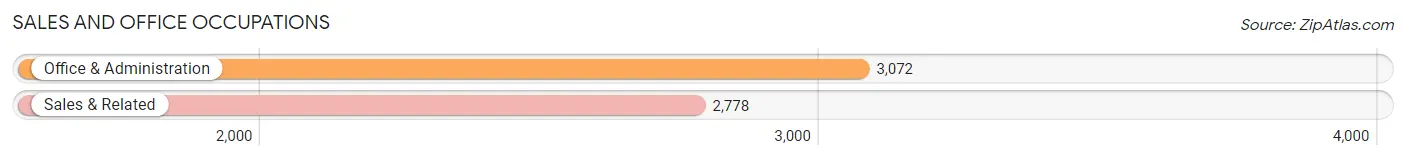
Sales and Office Occupations
The most common Sales and Office occupations in Mount Prospect are Office & Administration (3,072 | 10.4%), and Sales & Related (2,778 | 9.4%).
Sales and Office Occupations by Sex
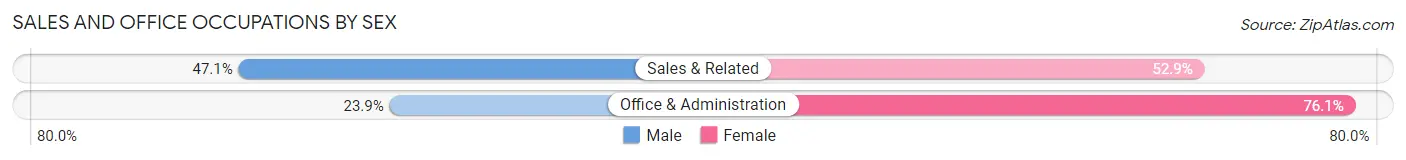
| Occupation | Male | Female |
| Sales & Related | 1,308 (47.1%) | 1,470 (52.9%) |
| Office & Administration | 733 (23.9%) | 2,339 (76.1%) |
| Total (Category) | 2,041 (34.9%) | 3,809 (65.1%) |
| Total (Overall) | 15,902 (53.9%) | 13,589 (46.1%) |
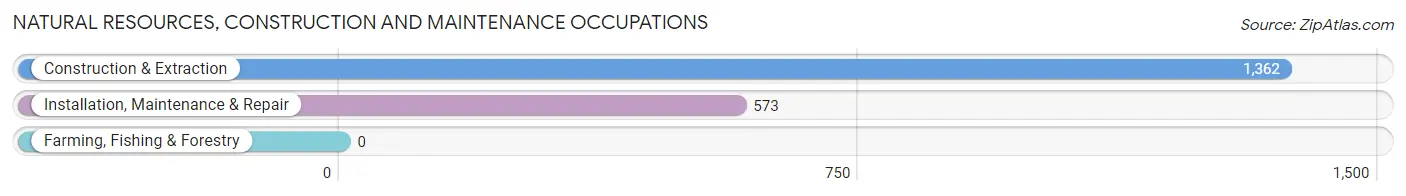
Natural Resources, Construction and Maintenance Occupations
The most common Natural Resources, Construction and Maintenance occupations in Mount Prospect are Construction & Extraction (1,362 | 4.6%), and Installation, Maintenance & Repair (573 | 1.9%).
Natural Resources, Construction and Maintenance Occupations by Sex
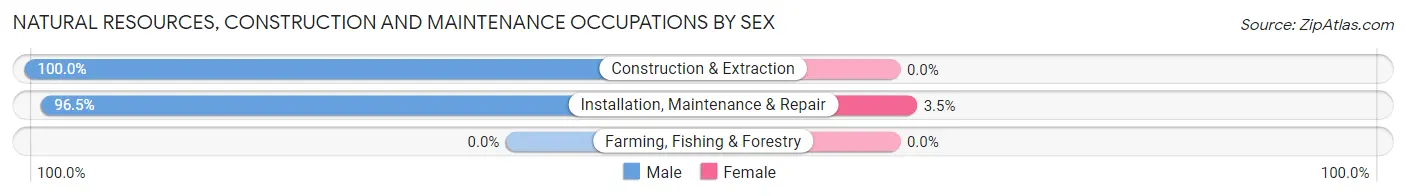
| Occupation | Male | Female |
| Farming, Fishing & Forestry | 0 (0.0%) | 0 (0.0%) |
| Construction & Extraction | 1,362 (100.0%) | 0 (0.0%) |
| Installation, Maintenance & Repair | 553 (96.5%) | 20 (3.5%) |
| Total (Category) | 1,915 (99.0%) | 20 (1.0%) |
| Total (Overall) | 15,902 (53.9%) | 13,589 (46.1%) |
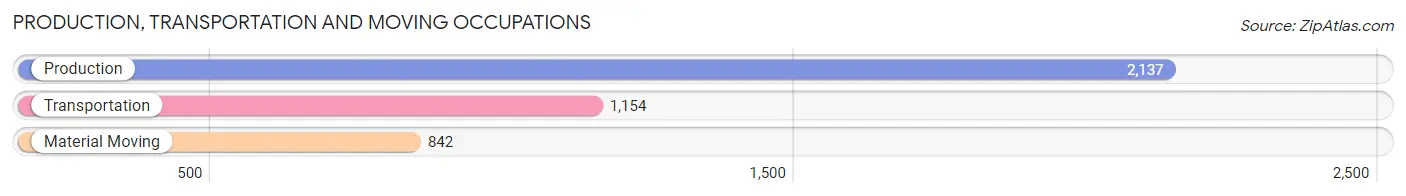
Production, Transportation and Moving Occupations
The most common Production, Transportation and Moving occupations in Mount Prospect are Production (2,137 | 7.2%), Transportation (1,154 | 3.9%), and Material Moving (842 | 2.9%).
Production, Transportation and Moving Occupations by Sex
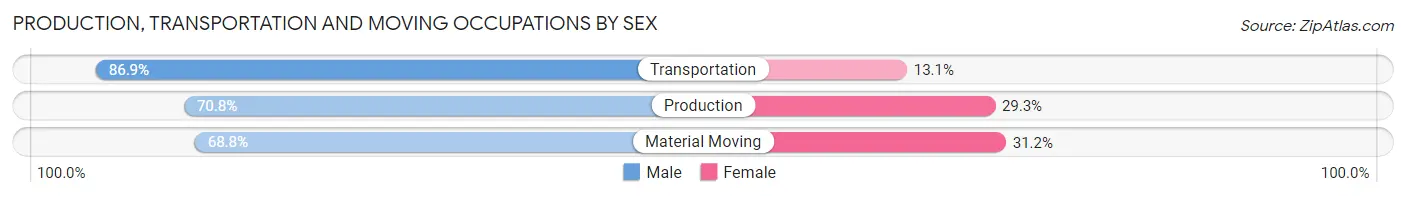
| Occupation | Male | Female |
| Production | 1,512 (70.8%) | 625 (29.2%) |
| Transportation | 1,003 (86.9%) | 151 (13.1%) |
| Material Moving | 579 (68.8%) | 263 (31.2%) |
| Total (Category) | 3,094 (74.9%) | 1,039 (25.1%) |
| Total (Overall) | 15,902 (53.9%) | 13,589 (46.1%) |
Employment Industries by Sex in Mount Prospect
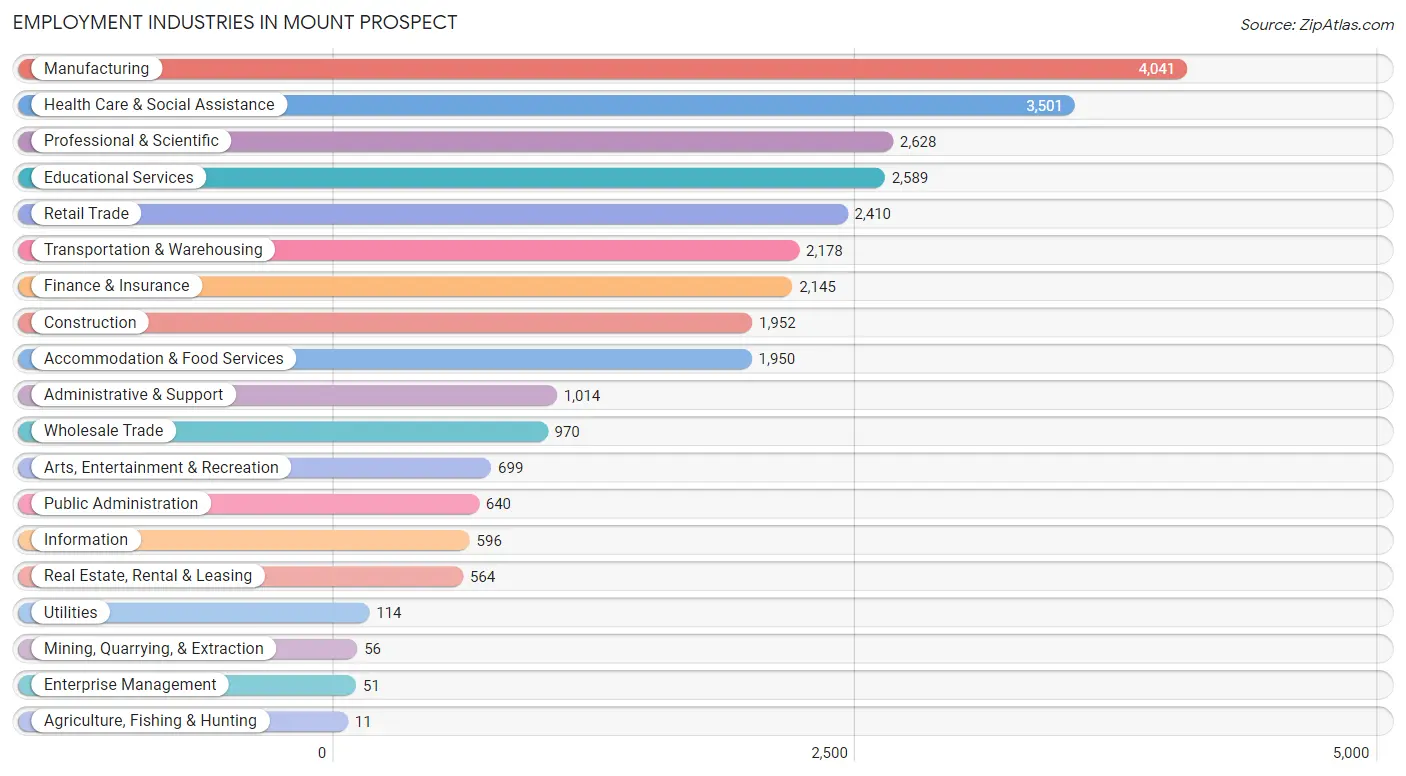
Employment Industries in Mount Prospect
The major employment industries in Mount Prospect include Manufacturing (4,041 | 13.7%), Health Care & Social Assistance (3,501 | 11.9%), Professional & Scientific (2,628 | 8.9%), Educational Services (2,589 | 8.8%), and Retail Trade (2,410 | 8.2%).
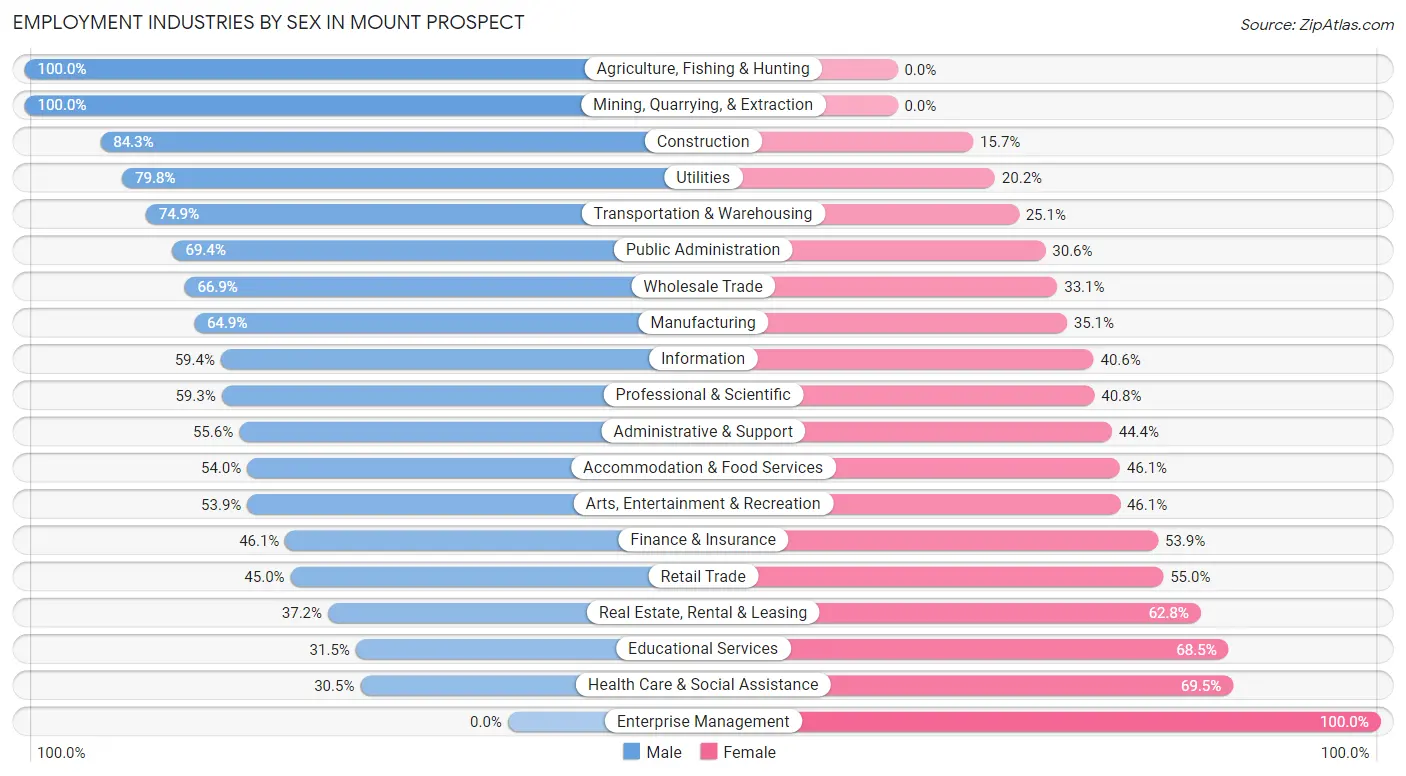
Employment Industries by Sex in Mount Prospect
The Mount Prospect industries that see more men than women are Agriculture, Fishing & Hunting (100.0%), Mining, Quarrying, & Extraction (100.0%), and Construction (84.3%), whereas the industries that tend to have a higher number of women are Enterprise Management (100.0%), Health Care & Social Assistance (69.5%), and Educational Services (68.5%).
| Industry | Male | Female |
| Agriculture, Fishing & Hunting | 11 (100.0%) | 0 (0.0%) |
| Mining, Quarrying, & Extraction | 56 (100.0%) | 0 (0.0%) |
| Construction | 1,646 (84.3%) | 306 (15.7%) |
| Manufacturing | 2,624 (64.9%) | 1,417 (35.1%) |
| Wholesale Trade | 649 (66.9%) | 321 (33.1%) |
| Retail Trade | 1,084 (45.0%) | 1,326 (55.0%) |
| Transportation & Warehousing | 1,631 (74.9%) | 547 (25.1%) |
| Utilities | 91 (79.8%) | 23 (20.2%) |
| Information | 354 (59.4%) | 242 (40.6%) |
| Finance & Insurance | 988 (46.1%) | 1,157 (53.9%) |
| Real Estate, Rental & Leasing | 210 (37.2%) | 354 (62.8%) |
| Professional & Scientific | 1,557 (59.3%) | 1,071 (40.7%) |
| Enterprise Management | 0 (0.0%) | 51 (100.0%) |
| Administrative & Support | 564 (55.6%) | 450 (44.4%) |
| Educational Services | 815 (31.5%) | 1,774 (68.5%) |
| Health Care & Social Assistance | 1,069 (30.5%) | 2,432 (69.5%) |
| Arts, Entertainment & Recreation | 377 (53.9%) | 322 (46.1%) |
| Accommodation & Food Services | 1,052 (53.9%) | 898 (46.1%) |
| Public Administration | 444 (69.4%) | 196 (30.6%) |
| Total | 15,902 (53.9%) | 13,589 (46.1%) |
Education in Mount Prospect
School Enrollment in Mount Prospect
The most common levels of schooling among the 12,333 students in Mount Prospect are middle school (3,023 | 24.5%), high school (3,014 | 24.4%), and elementary school (2,158 | 17.5%).
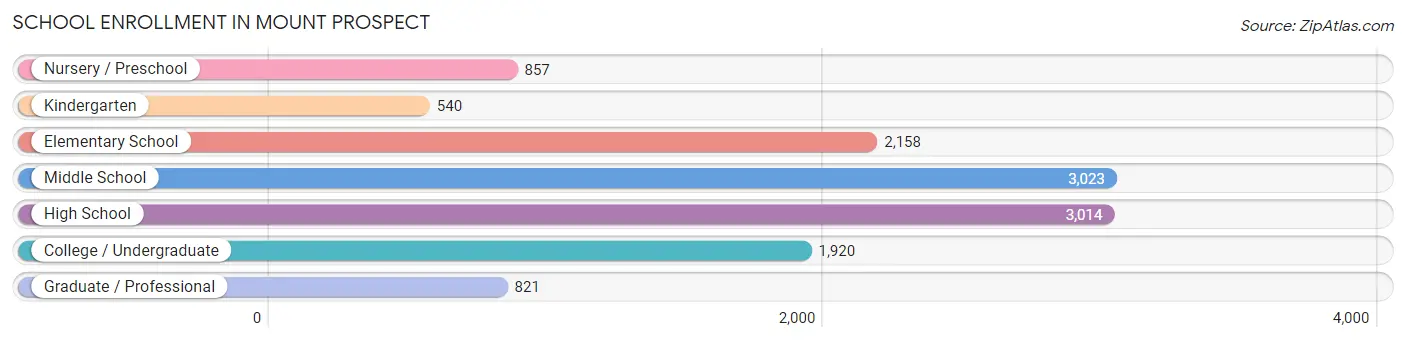
| School Level | # Students | % Students |
| Nursery / Preschool | 857 | 7.0% |
| Kindergarten | 540 | 4.4% |
| Elementary School | 2,158 | 17.5% |
| Middle School | 3,023 | 24.5% |
| High School | 3,014 | 24.4% |
| College / Undergraduate | 1,920 | 15.6% |
| Graduate / Professional | 821 | 6.7% |
| Total | 12,333 | 100.0% |
School Enrollment by Age by Funding Source in Mount Prospect
Out of a total of 12,333 students who are enrolled in schools in Mount Prospect, 2,109 (17.1%) attend a private institution, while the remaining 10,224 (82.9%) are enrolled in public schools. The age group of 3 to 4 year olds has the highest likelihood of being enrolled in private schools, with 393 (55.7% in the age bracket) enrolled. Conversely, the age group of 15 to 17 year olds has the lowest likelihood of being enrolled in a private school, with 2,061 (96.9% in the age bracket) attending a public institution.
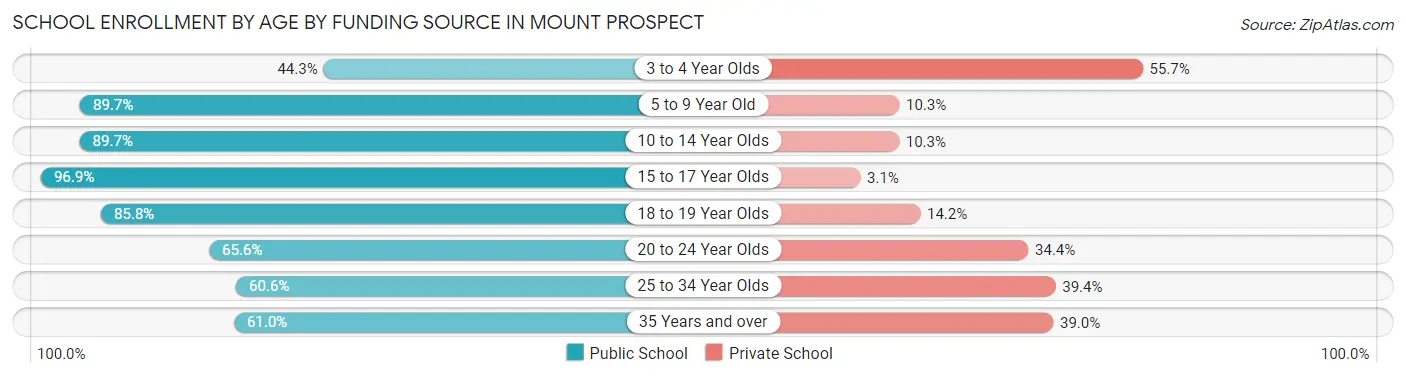
| Age Bracket | Public School | Private School |
| 3 to 4 Year Olds | 313 (44.3%) | 393 (55.7%) |
| 5 to 9 Year Old | 2,422 (89.7%) | 279 (10.3%) |
| 10 to 14 Year Olds | 3,273 (89.7%) | 374 (10.3%) |
| 15 to 17 Year Olds | 2,061 (96.9%) | 65 (3.1%) |
| 18 to 19 Year Olds | 699 (85.8%) | 116 (14.2%) |
| 20 to 24 Year Olds | 491 (65.6%) | 257 (34.4%) |
| 25 to 34 Year Olds | 429 (60.6%) | 279 (39.4%) |
| 35 Years and over | 538 (61.0%) | 344 (39.0%) |
| Total | 10,224 (82.9%) | 2,109 (17.1%) |
Educational Attainment by Field of Study in Mount Prospect
Business (5,026 | 24.0%), science & technology (2,151 | 10.2%), engineering (2,043 | 9.7%), social sciences (1,940 | 9.2%), and education (1,937 | 9.2%) are the most common fields of study among 20,979 individuals in Mount Prospect who have obtained a bachelor's degree or higher.
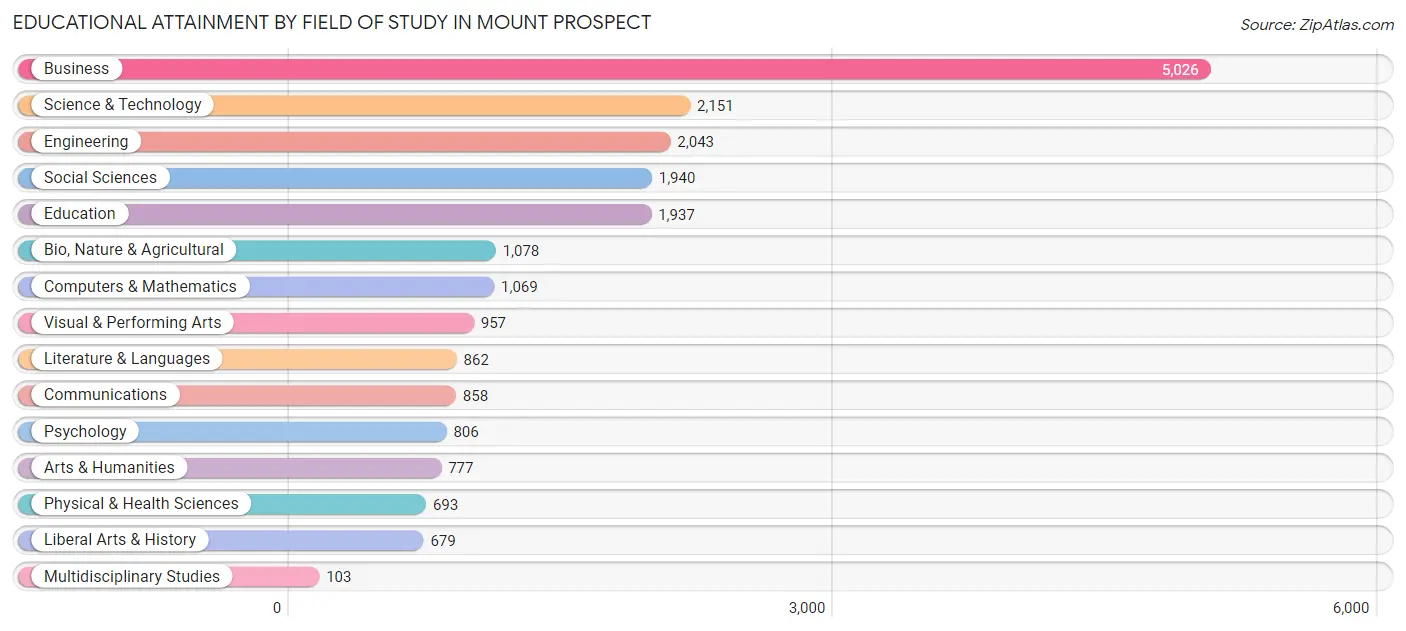
| Field of Study | # Graduates | % Graduates |
| Computers & Mathematics | 1,069 | 5.1% |
| Bio, Nature & Agricultural | 1,078 | 5.1% |
| Physical & Health Sciences | 693 | 3.3% |
| Psychology | 806 | 3.8% |
| Social Sciences | 1,940 | 9.2% |
| Engineering | 2,043 | 9.7% |
| Multidisciplinary Studies | 103 | 0.5% |
| Science & Technology | 2,151 | 10.2% |
| Business | 5,026 | 24.0% |
| Education | 1,937 | 9.2% |
| Literature & Languages | 862 | 4.1% |
| Liberal Arts & History | 679 | 3.2% |
| Visual & Performing Arts | 957 | 4.6% |
| Communications | 858 | 4.1% |
| Arts & Humanities | 777 | 3.7% |
| Total | 20,979 | 100.0% |
Transportation & Commute in Mount Prospect
Vehicle Availability by Sex in Mount Prospect
The most prevalent vehicle ownership categories in Mount Prospect are males with 2 vehicles (8,842, accounting for 56.2%) and females with 2 vehicles (6,635, making up 66.5%).
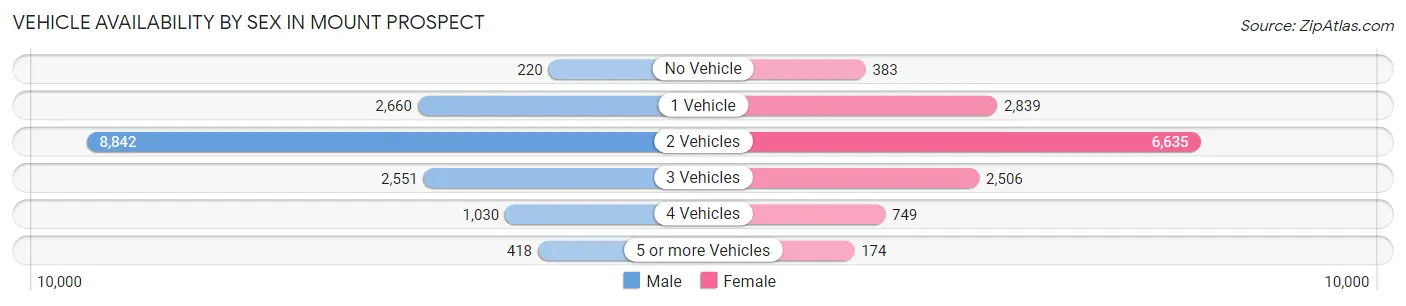
| Vehicles Available | Male | Female |
| No Vehicle | 220 (1.4%) | 383 (2.9%) |
| 1 Vehicle | 2,660 (16.9%) | 2,839 (21.4%) |
| 2 Vehicles | 8,842 (56.2%) | 6,635 (49.9%) |
| 3 Vehicles | 2,551 (16.2%) | 2,506 (18.9%) |
| 4 Vehicles | 1,030 (6.6%) | 749 (5.6%) |
| 5 or more Vehicles | 418 (2.7%) | 174 (1.3%) |
| Total | 15,721 (100.0%) | 13,286 (100.0%) |
Commute Time in Mount Prospect
The most frequently occuring commute durations in Mount Prospect are 30 to 34 minutes (3,956 commuters, 15.7%), 15 to 19 minutes (3,571 commuters, 14.1%), and 20 to 24 minutes (3,298 commuters, 13.1%).
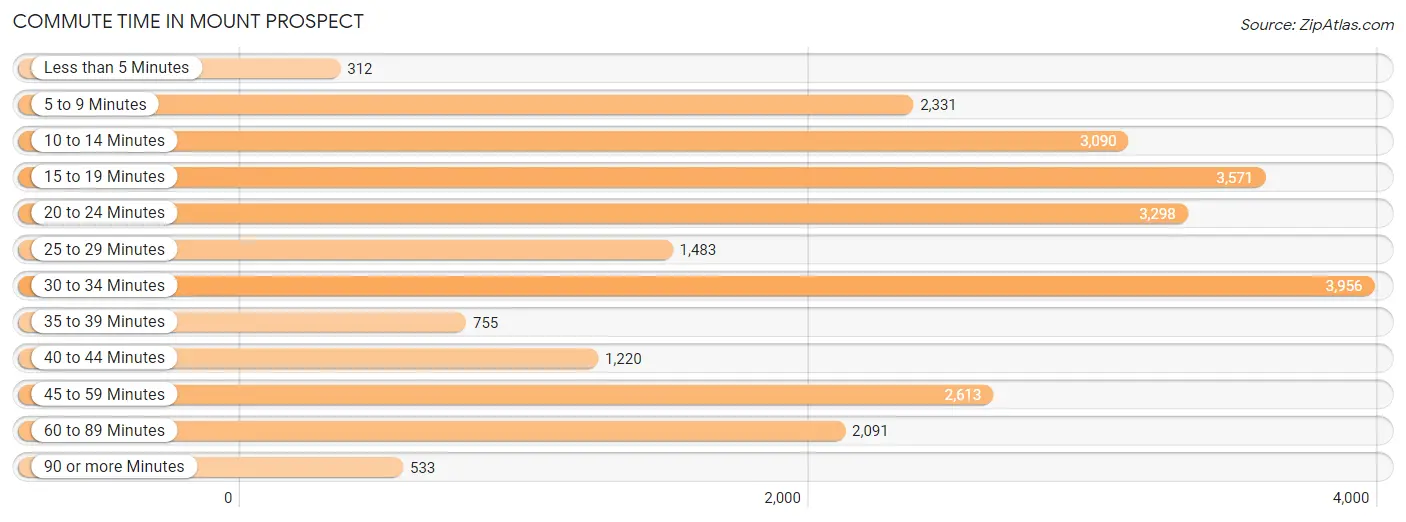
| Commute Time | # Commuters | % Commuters |
| Less than 5 Minutes | 312 | 1.2% |
| 5 to 9 Minutes | 2,331 | 9.2% |
| 10 to 14 Minutes | 3,090 | 12.2% |
| 15 to 19 Minutes | 3,571 | 14.1% |
| 20 to 24 Minutes | 3,298 | 13.1% |
| 25 to 29 Minutes | 1,483 | 5.9% |
| 30 to 34 Minutes | 3,956 | 15.7% |
| 35 to 39 Minutes | 755 | 3.0% |
| 40 to 44 Minutes | 1,220 | 4.8% |
| 45 to 59 Minutes | 2,613 | 10.3% |
| 60 to 89 Minutes | 2,091 | 8.3% |
| 90 or more Minutes | 533 | 2.1% |
Commute Time by Sex in Mount Prospect
The most common commute times in Mount Prospect are 30 to 34 minutes (2,374 commuters, 17.1%) for males and 15 to 19 minutes (1,948 commuters, 17.1%) for females.
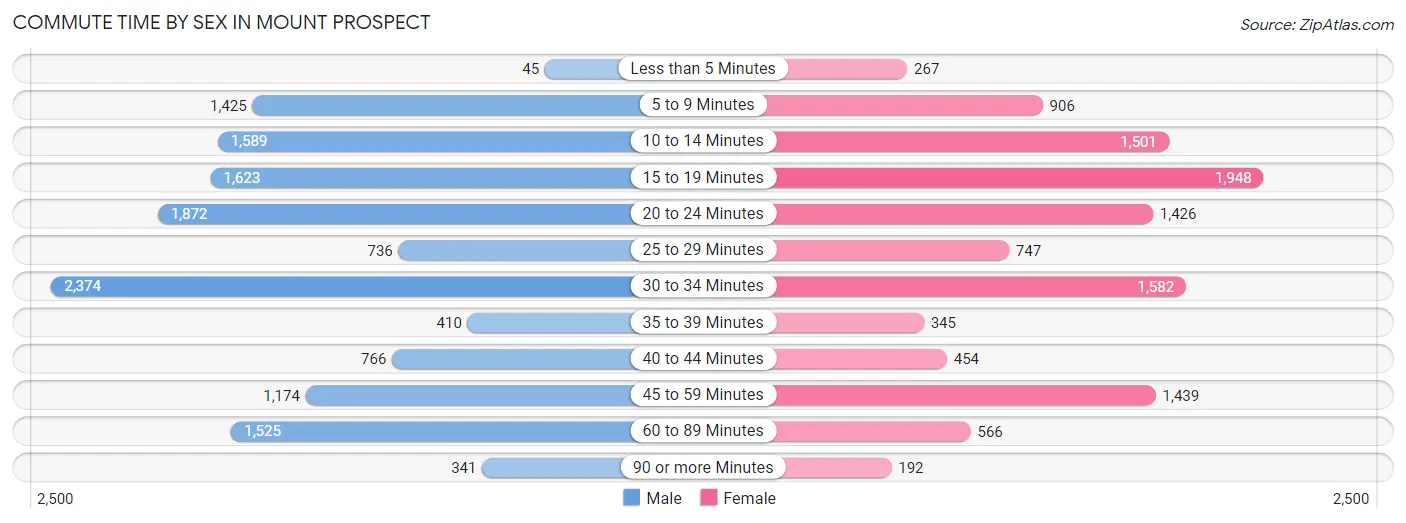
| Commute Time | Male | Female |
| Less than 5 Minutes | 45 (0.3%) | 267 (2.4%) |
| 5 to 9 Minutes | 1,425 (10.3%) | 906 (8.0%) |
| 10 to 14 Minutes | 1,589 (11.5%) | 1,501 (13.2%) |
| 15 to 19 Minutes | 1,623 (11.7%) | 1,948 (17.1%) |
| 20 to 24 Minutes | 1,872 (13.5%) | 1,426 (12.5%) |
| 25 to 29 Minutes | 736 (5.3%) | 747 (6.6%) |
| 30 to 34 Minutes | 2,374 (17.1%) | 1,582 (13.9%) |
| 35 to 39 Minutes | 410 (2.9%) | 345 (3.0%) |
| 40 to 44 Minutes | 766 (5.5%) | 454 (4.0%) |
| 45 to 59 Minutes | 1,174 (8.5%) | 1,439 (12.7%) |
| 60 to 89 Minutes | 1,525 (11.0%) | 566 (5.0%) |
| 90 or more Minutes | 341 (2.5%) | 192 (1.7%) |
Time of Departure to Work by Sex in Mount Prospect
The most frequent times of departure to work in Mount Prospect are 7:00 AM to 7:29 AM (2,020, 14.5%) for males and 7:00 AM to 7:29 AM (1,810, 15.9%) for females.
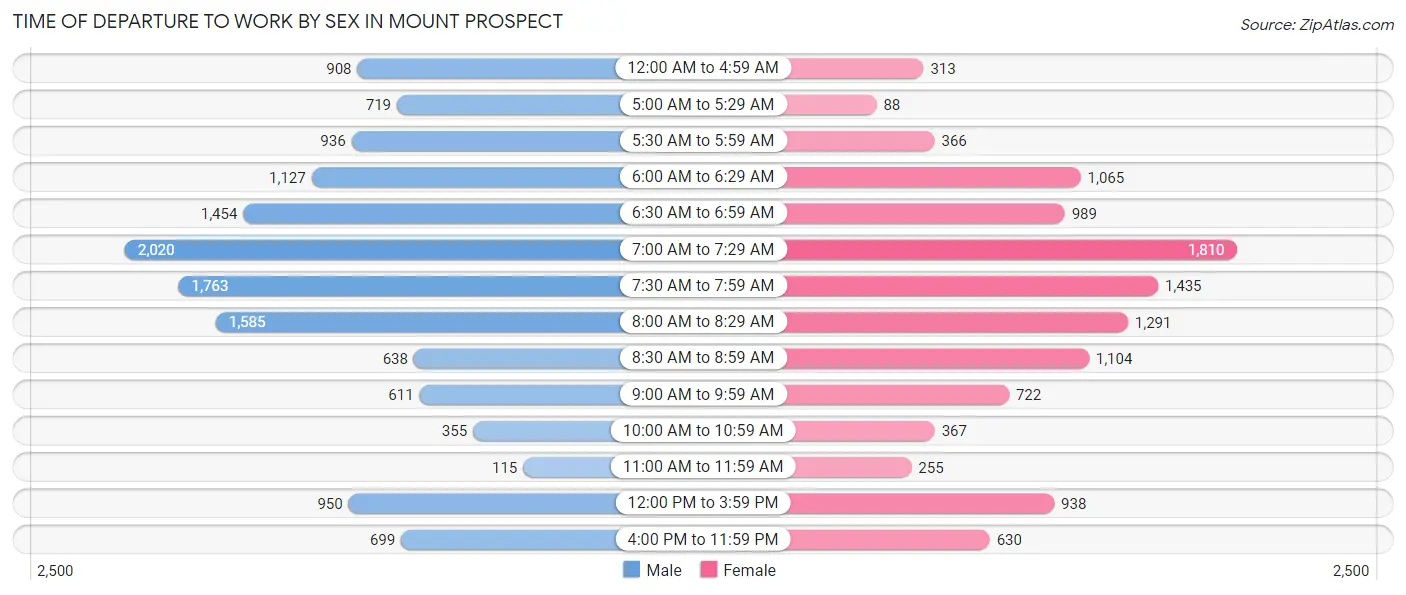
| Time of Departure | Male | Female |
| 12:00 AM to 4:59 AM | 908 (6.5%) | 313 (2.8%) |
| 5:00 AM to 5:29 AM | 719 (5.2%) | 88 (0.8%) |
| 5:30 AM to 5:59 AM | 936 (6.7%) | 366 (3.2%) |
| 6:00 AM to 6:29 AM | 1,127 (8.1%) | 1,065 (9.4%) |
| 6:30 AM to 6:59 AM | 1,454 (10.5%) | 989 (8.7%) |
| 7:00 AM to 7:29 AM | 2,020 (14.5%) | 1,810 (15.9%) |
| 7:30 AM to 7:59 AM | 1,763 (12.7%) | 1,435 (12.6%) |
| 8:00 AM to 8:29 AM | 1,585 (11.4%) | 1,291 (11.4%) |
| 8:30 AM to 8:59 AM | 638 (4.6%) | 1,104 (9.7%) |
| 9:00 AM to 9:59 AM | 611 (4.4%) | 722 (6.4%) |
| 10:00 AM to 10:59 AM | 355 (2.6%) | 367 (3.2%) |
| 11:00 AM to 11:59 AM | 115 (0.8%) | 255 (2.2%) |
| 12:00 PM to 3:59 PM | 950 (6.8%) | 938 (8.3%) |
| 4:00 PM to 11:59 PM | 699 (5.0%) | 630 (5.5%) |
| Total | 13,880 (100.0%) | 11,373 (100.0%) |
Housing Occupancy in Mount Prospect
Occupancy by Ownership in Mount Prospect
Of the total 21,917 dwellings in Mount Prospect, owner-occupied units account for 15,312 (69.9%), while renter-occupied units make up 6,605 (30.1%).
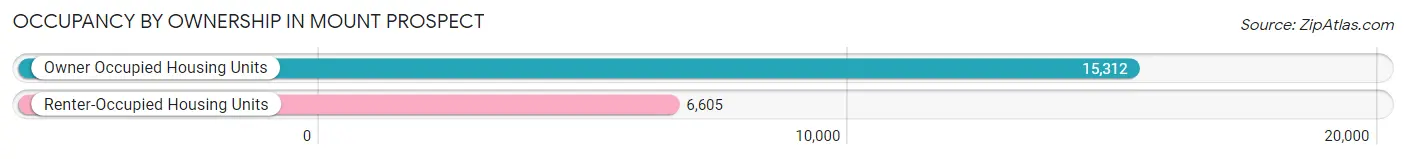
| Occupancy | # Housing Units | % Housing Units |
| Owner Occupied Housing Units | 15,312 | 69.9% |
| Renter-Occupied Housing Units | 6,605 | 30.1% |
| Total Occupied Housing Units | 21,917 | 100.0% |
Occupancy by Household Size in Mount Prospect
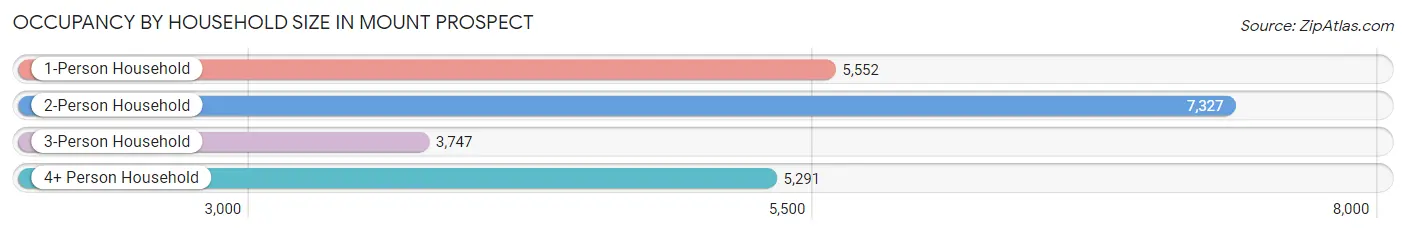
| Household Size | # Housing Units | % Housing Units |
| 1-Person Household | 5,552 | 25.3% |
| 2-Person Household | 7,327 | 33.4% |
| 3-Person Household | 3,747 | 17.1% |
| 4+ Person Household | 5,291 | 24.1% |
| Total Housing Units | 21,917 | 100.0% |
Occupancy by Ownership by Household Size in Mount Prospect
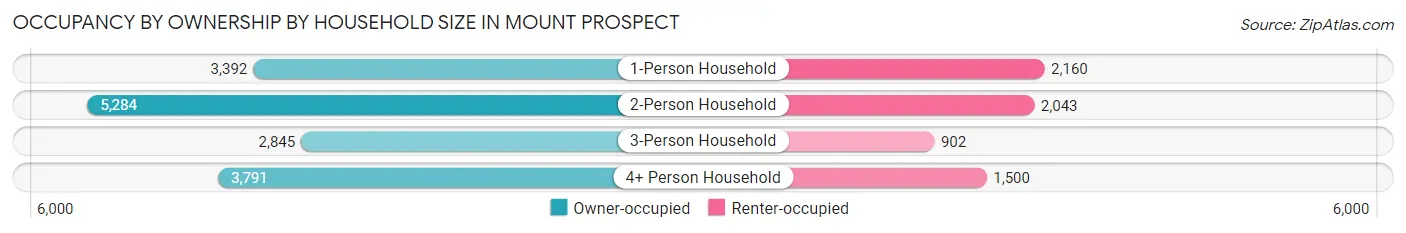
| Household Size | Owner-occupied | Renter-occupied |
| 1-Person Household | 3,392 (61.1%) | 2,160 (38.9%) |
| 2-Person Household | 5,284 (72.1%) | 2,043 (27.9%) |
| 3-Person Household | 2,845 (75.9%) | 902 (24.1%) |
| 4+ Person Household | 3,791 (71.7%) | 1,500 (28.3%) |
| Total Housing Units | 15,312 (69.9%) | 6,605 (30.1%) |
Occupancy by Educational Attainment in Mount Prospect
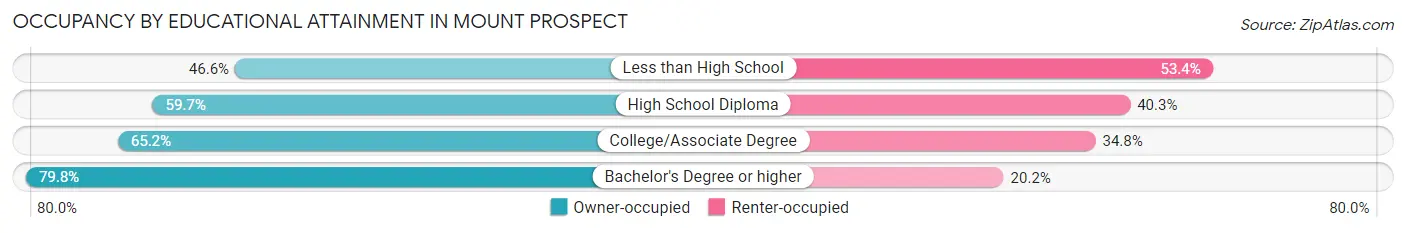
| Household Size | Owner-occupied | Renter-occupied |
| Less than High School | 792 (46.6%) | 906 (53.4%) |
| High School Diploma | 2,301 (59.7%) | 1,553 (40.3%) |
| College/Associate Degree | 3,743 (65.2%) | 1,998 (34.8%) |
| Bachelor's Degree or higher | 8,476 (79.8%) | 2,148 (20.2%) |
Occupancy by Age of Householder in Mount Prospect
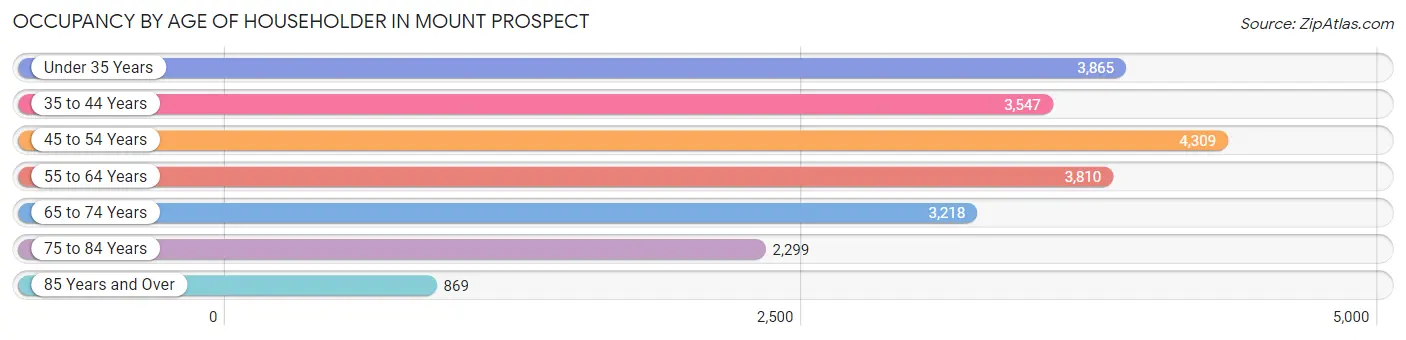
| Age Bracket | # Households | % Households |
| Under 35 Years | 3,865 | 17.6% |
| 35 to 44 Years | 3,547 | 16.2% |
| 45 to 54 Years | 4,309 | 19.7% |
| 55 to 64 Years | 3,810 | 17.4% |
| 65 to 74 Years | 3,218 | 14.7% |
| 75 to 84 Years | 2,299 | 10.5% |
| 85 Years and Over | 869 | 4.0% |
| Total | 21,917 | 100.0% |
Housing Finances in Mount Prospect
Median Income by Occupancy in Mount Prospect
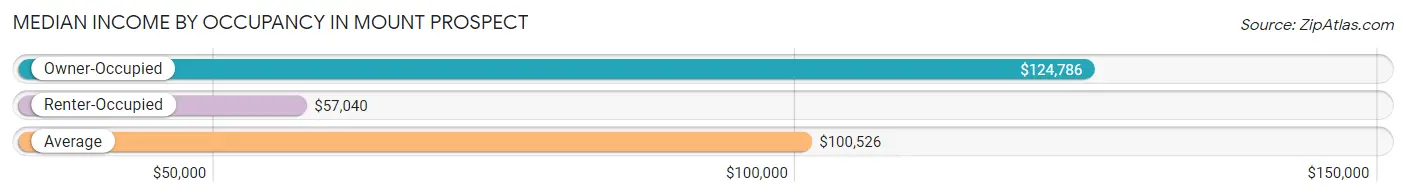
| Occupancy Type | # Households | Median Income |
| Owner-Occupied | 15,312 (69.9%) | $124,786 |
| Renter-Occupied | 6,605 (30.1%) | $57,040 |
| Average | 21,917 (100.0%) | $100,526 |
Occupancy by Householder Income Bracket in Mount Prospect
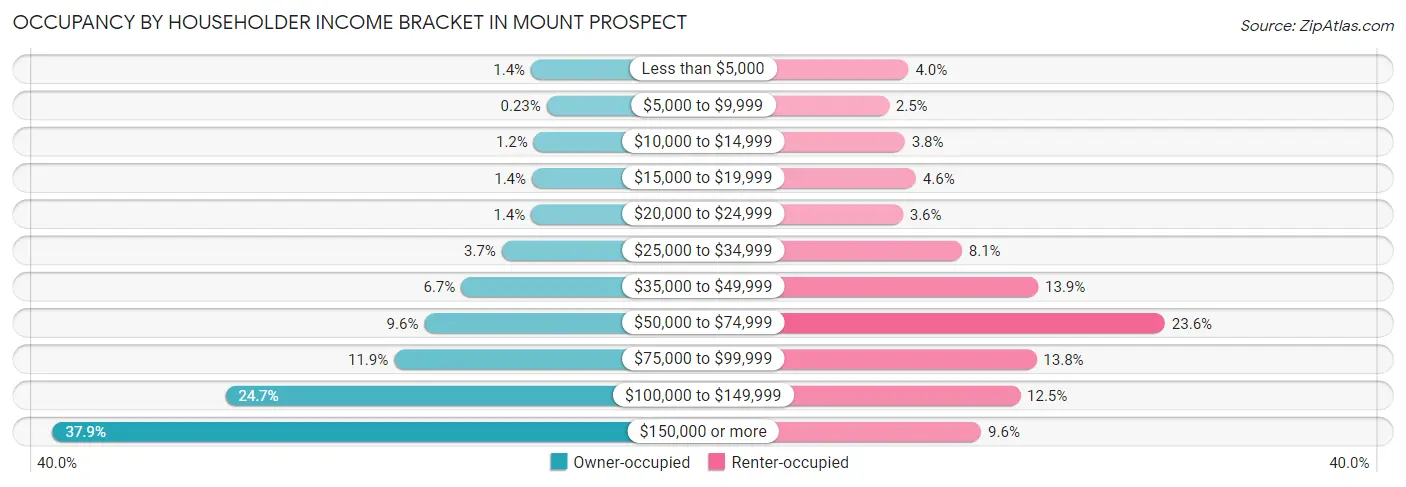
| Income Bracket | Owner-occupied | Renter-occupied |
| Less than $5,000 | 218 (1.4%) | 266 (4.0%) |
| $5,000 to $9,999 | 35 (0.2%) | 168 (2.5%) |
| $10,000 to $14,999 | 187 (1.2%) | 248 (3.7%) |
| $15,000 to $19,999 | 207 (1.3%) | 304 (4.6%) |
| $20,000 to $24,999 | 216 (1.4%) | 238 (3.6%) |
| $25,000 to $34,999 | 559 (3.6%) | 535 (8.1%) |
| $35,000 to $49,999 | 1,032 (6.7%) | 919 (13.9%) |
| $50,000 to $74,999 | 1,463 (9.6%) | 1,557 (23.6%) |
| $75,000 to $99,999 | 1,815 (11.8%) | 910 (13.8%) |
| $100,000 to $149,999 | 3,782 (24.7%) | 828 (12.5%) |
| $150,000 or more | 5,798 (37.9%) | 632 (9.6%) |
| Total | 15,312 (100.0%) | 6,605 (100.0%) |
Monthly Housing Cost Tiers in Mount Prospect
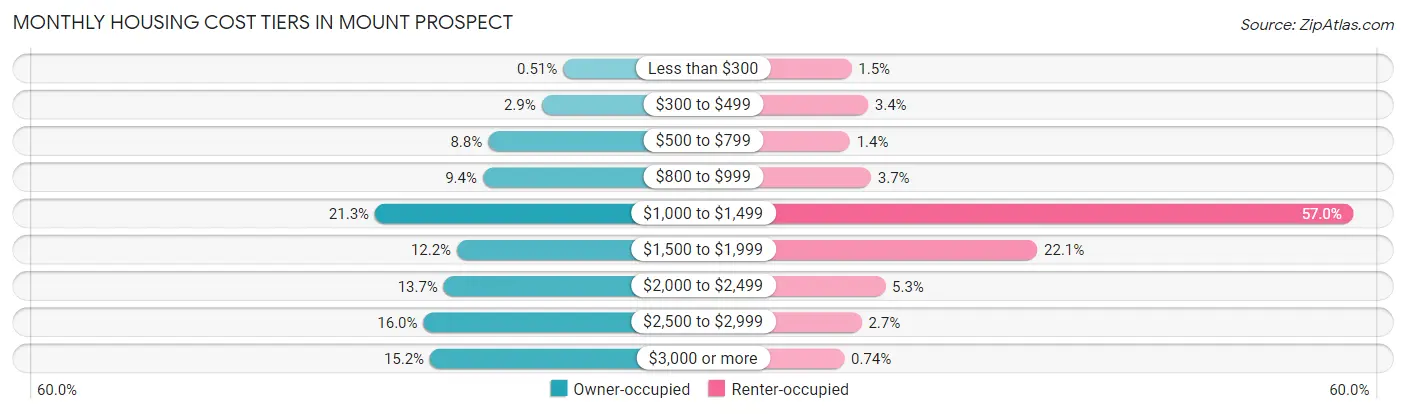
| Monthly Cost | Owner-occupied | Renter-occupied |
| Less than $300 | 78 (0.5%) | 102 (1.5%) |
| $300 to $499 | 442 (2.9%) | 222 (3.4%) |
| $500 to $799 | 1,348 (8.8%) | 90 (1.4%) |
| $800 to $999 | 1,436 (9.4%) | 244 (3.7%) |
| $1,000 to $1,499 | 3,262 (21.3%) | 3,767 (57.0%) |
| $1,500 to $1,999 | 1,874 (12.2%) | 1,457 (22.1%) |
| $2,000 to $2,499 | 2,098 (13.7%) | 348 (5.3%) |
| $2,500 to $2,999 | 2,443 (16.0%) | 176 (2.7%) |
| $3,000 or more | 2,331 (15.2%) | 49 (0.7%) |
| Total | 15,312 (100.0%) | 6,605 (100.0%) |
Physical Housing Characteristics in Mount Prospect
Housing Structures in Mount Prospect
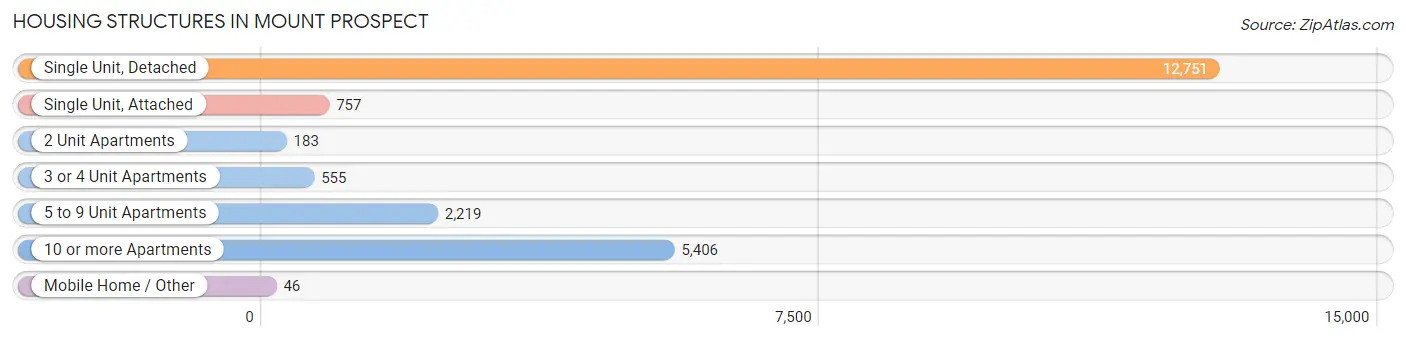
| Structure Type | # Housing Units | % Housing Units |
| Single Unit, Detached | 12,751 | 58.2% |
| Single Unit, Attached | 757 | 3.5% |
| 2 Unit Apartments | 183 | 0.8% |
| 3 or 4 Unit Apartments | 555 | 2.5% |
| 5 to 9 Unit Apartments | 2,219 | 10.1% |
| 10 or more Apartments | 5,406 | 24.7% |
| Mobile Home / Other | 46 | 0.2% |
| Total | 21,917 | 100.0% |
Housing Structures by Occupancy in Mount Prospect
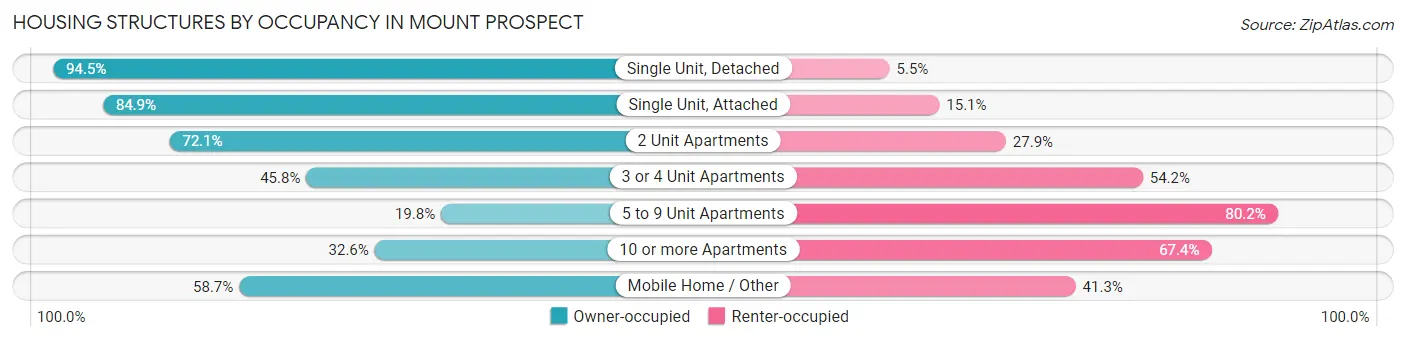
| Structure Type | Owner-occupied | Renter-occupied |
| Single Unit, Detached | 12,053 (94.5%) | 698 (5.5%) |
| Single Unit, Attached | 643 (84.9%) | 114 (15.1%) |
| 2 Unit Apartments | 132 (72.1%) | 51 (27.9%) |
| 3 or 4 Unit Apartments | 254 (45.8%) | 301 (54.2%) |
| 5 to 9 Unit Apartments | 440 (19.8%) | 1,779 (80.2%) |
| 10 or more Apartments | 1,763 (32.6%) | 3,643 (67.4%) |
| Mobile Home / Other | 27 (58.7%) | 19 (41.3%) |
| Total | 15,312 (69.9%) | 6,605 (30.1%) |
Housing Structures by Number of Rooms in Mount Prospect
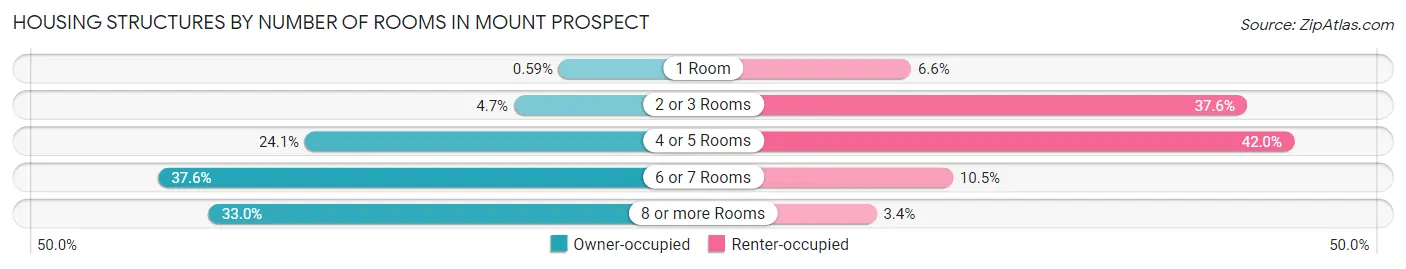
| Number of Rooms | Owner-occupied | Renter-occupied |
| 1 Room | 91 (0.6%) | 434 (6.6%) |
| 2 or 3 Rooms | 726 (4.7%) | 2,485 (37.6%) |
| 4 or 5 Rooms | 3,686 (24.1%) | 2,773 (42.0%) |
| 6 or 7 Rooms | 5,763 (37.6%) | 690 (10.4%) |
| 8 or more Rooms | 5,046 (33.0%) | 223 (3.4%) |
| Total | 15,312 (100.0%) | 6,605 (100.0%) |
Housing Structure by Heating Type in Mount Prospect
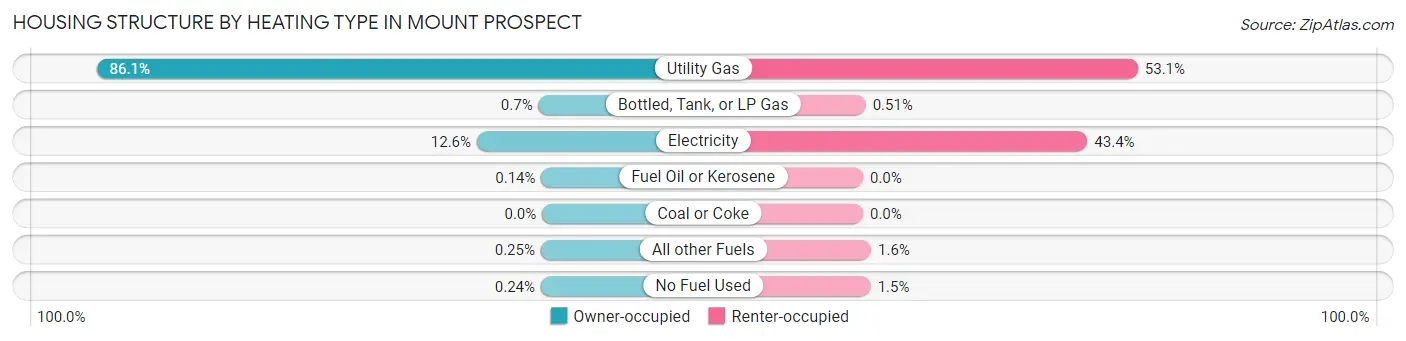
| Heating Type | Owner-occupied | Renter-occupied |
| Utility Gas | 13,179 (86.1%) | 3,507 (53.1%) |
| Bottled, Tank, or LP Gas | 107 (0.7%) | 34 (0.5%) |
| Electricity | 1,931 (12.6%) | 2,863 (43.3%) |
| Fuel Oil or Kerosene | 21 (0.1%) | 0 (0.0%) |
| Coal or Coke | 0 (0.0%) | 0 (0.0%) |
| All other Fuels | 38 (0.3%) | 103 (1.6%) |
| No Fuel Used | 36 (0.2%) | 98 (1.5%) |
| Total | 15,312 (100.0%) | 6,605 (100.0%) |
Household Vehicle Usage in Mount Prospect
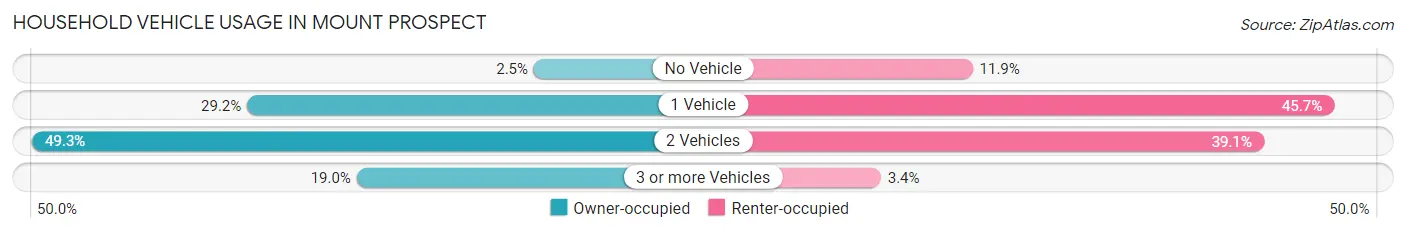
| Vehicles per Household | Owner-occupied | Renter-occupied |
| No Vehicle | 377 (2.5%) | 787 (11.9%) |
| 1 Vehicle | 4,476 (29.2%) | 3,015 (45.7%) |
| 2 Vehicles | 7,550 (49.3%) | 2,582 (39.1%) |
| 3 or more Vehicles | 2,909 (19.0%) | 221 (3.4%) |
| Total | 15,312 (100.0%) | 6,605 (100.0%) |
Real Estate & Mortgages in Mount Prospect
Real Estate and Mortgage Overview in Mount Prospect
| Characteristic | Without Mortgage | With Mortgage |
| Housing Units | 6,195 | 9,117 |
| Median Property Value | $363,000 | $370,900 |
| Median Household Income | $94,400 | $4,132 |
| Monthly Housing Costs | $1,011 | $2,323 |
| Real Estate Taxes | $7,878 | $118 |
Property Value by Mortgage Status in Mount Prospect
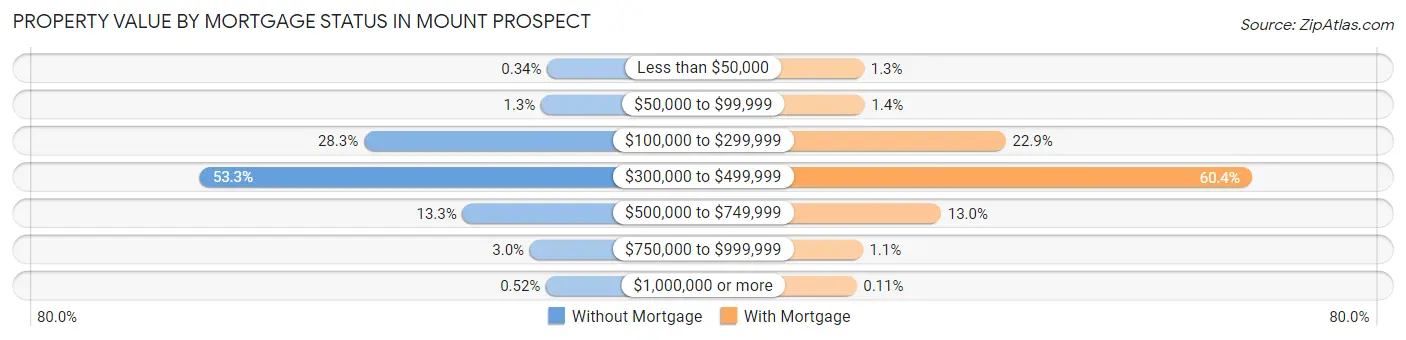
| Property Value | Without Mortgage | With Mortgage |
| Less than $50,000 | 21 (0.3%) | 114 (1.3%) |
| $50,000 to $99,999 | 80 (1.3%) | 124 (1.4%) |
| $100,000 to $299,999 | 1,752 (28.3%) | 2,084 (22.9%) |
| $300,000 to $499,999 | 3,302 (53.3%) | 5,505 (60.4%) |
| $500,000 to $749,999 | 822 (13.3%) | 1,184 (13.0%) |
| $750,000 to $999,999 | 186 (3.0%) | 96 (1.1%) |
| $1,000,000 or more | 32 (0.5%) | 10 (0.1%) |
| Total | 6,195 (100.0%) | 9,117 (100.0%) |
Household Income by Mortgage Status in Mount Prospect
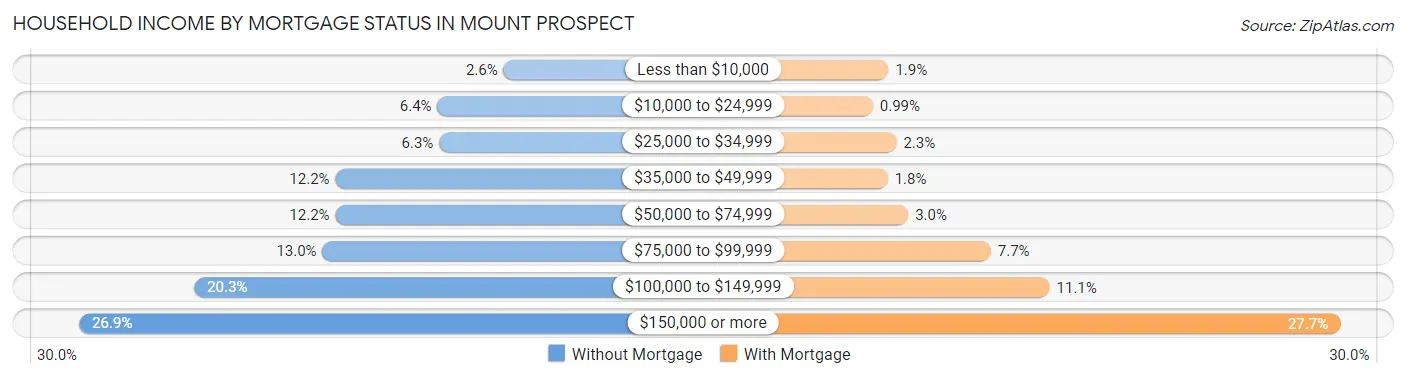
| Household Income | Without Mortgage | With Mortgage |
| Less than $10,000 | 163 (2.6%) | 171 (1.9%) |
| $10,000 to $24,999 | 397 (6.4%) | 90 (1.0%) |
| $25,000 to $34,999 | 391 (6.3%) | 213 (2.3%) |
| $35,000 to $49,999 | 758 (12.2%) | 168 (1.8%) |
| $50,000 to $74,999 | 758 (12.2%) | 274 (3.0%) |
| $75,000 to $99,999 | 804 (13.0%) | 705 (7.7%) |
| $100,000 to $149,999 | 1,258 (20.3%) | 1,011 (11.1%) |
| $150,000 or more | 1,666 (26.9%) | 2,524 (27.7%) |
| Total | 6,195 (100.0%) | 9,117 (100.0%) |
Property Value to Household Income Ratio in Mount Prospect
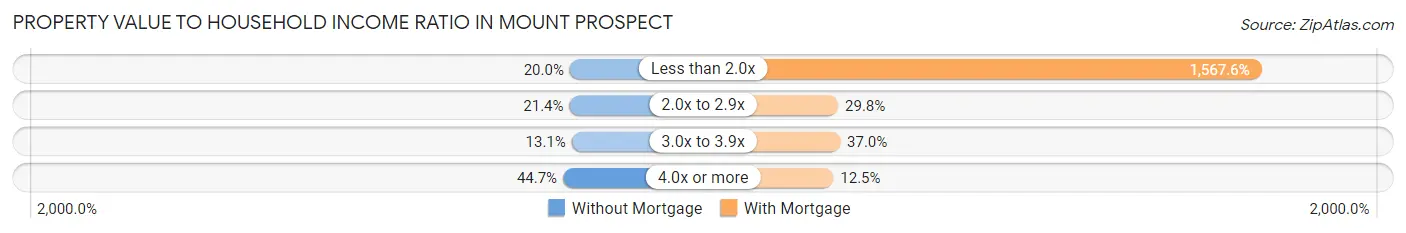
| Value-to-Income Ratio | Without Mortgage | With Mortgage |
| Less than 2.0x | 1,237 (20.0%) | 142,917 (1,567.6%) |
| 2.0x to 2.9x | 1,324 (21.4%) | 2,713 (29.8%) |
| 3.0x to 3.9x | 811 (13.1%) | 3,369 (36.9%) |
| 4.0x or more | 2,768 (44.7%) | 1,136 (12.5%) |
| Total | 6,195 (100.0%) | 9,117 (100.0%) |
Real Estate Taxes by Mortgage Status in Mount Prospect
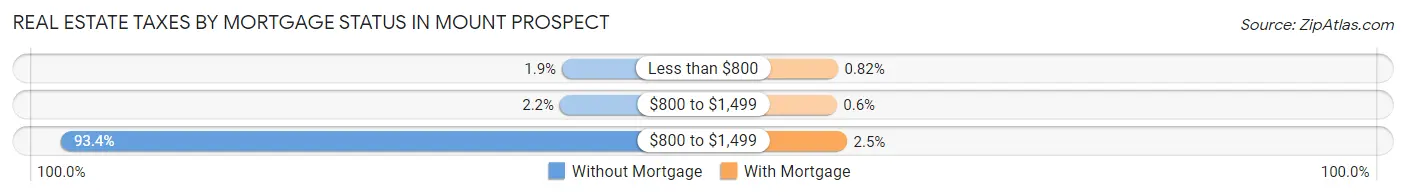
| Property Taxes | Without Mortgage | With Mortgage |
| Less than $800 | 115 (1.9%) | 75 (0.8%) |
| $800 to $1,499 | 138 (2.2%) | 55 (0.6%) |
| $800 to $1,499 | 5,783 (93.3%) | 225 (2.5%) |
| Total | 6,195 (100.0%) | 9,117 (100.0%) |
Health & Disability in Mount Prospect
Health Insurance Coverage by Age in Mount Prospect
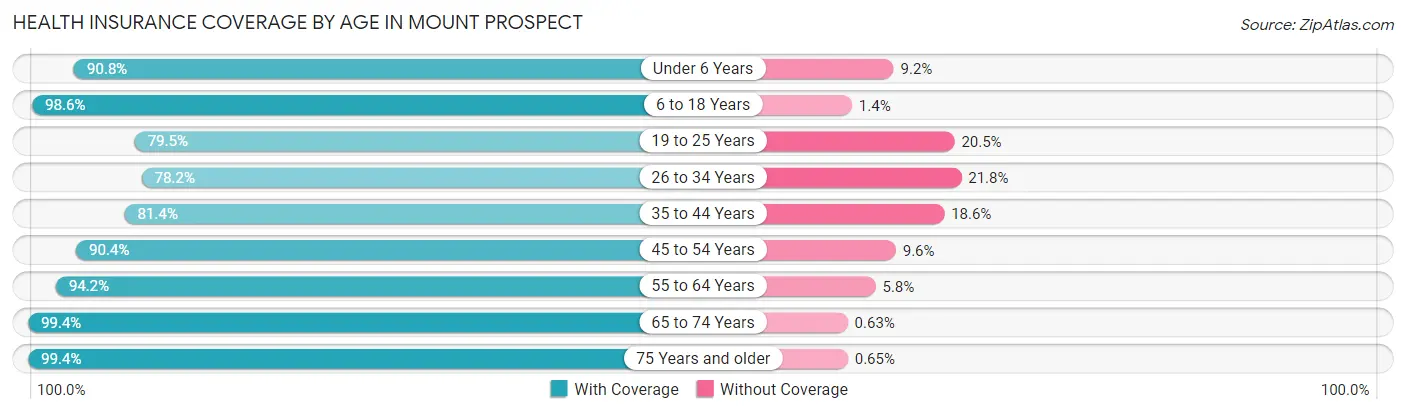
| Age Bracket | With Coverage | Without Coverage |
| Under 6 Years | 3,768 (90.8%) | 382 (9.2%) |
| 6 to 18 Years | 8,753 (98.6%) | 126 (1.4%) |
| 19 to 25 Years | 2,608 (79.5%) | 674 (20.5%) |
| 26 to 34 Years | 5,545 (78.2%) | 1,548 (21.8%) |
| 35 to 44 Years | 6,080 (81.4%) | 1,392 (18.6%) |
| 45 to 54 Years | 7,347 (90.4%) | 780 (9.6%) |
| 55 to 64 Years | 6,612 (94.2%) | 409 (5.8%) |
| 65 to 74 Years | 5,396 (99.4%) | 34 (0.6%) |
| 75 Years and older | 4,706 (99.4%) | 31 (0.6%) |
| Total | 50,815 (90.4%) | 5,376 (9.6%) |
Health Insurance Coverage by Citizenship Status in Mount Prospect
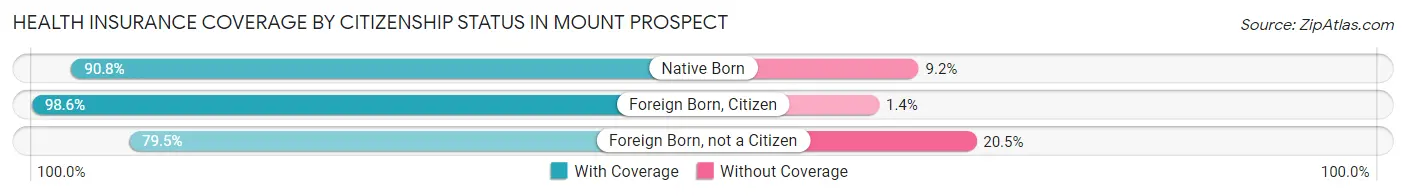
| Citizenship Status | With Coverage | Without Coverage |
| Native Born | 3,768 (90.8%) | 382 (9.2%) |
| Foreign Born, Citizen | 8,753 (98.6%) | 126 (1.4%) |
| Foreign Born, not a Citizen | 2,608 (79.5%) | 674 (20.5%) |
Health Insurance Coverage by Household Income in Mount Prospect
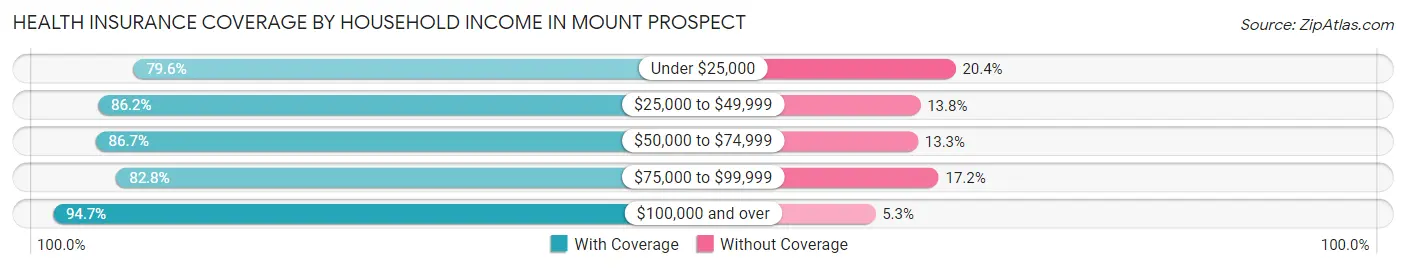
| Household Income | With Coverage | Without Coverage |
| Under $25,000 | 2,758 (79.6%) | 705 (20.4%) |
| $25,000 to $49,999 | 4,856 (86.2%) | 775 (13.8%) |
| $50,000 to $74,999 | 6,277 (86.7%) | 964 (13.3%) |
| $75,000 to $99,999 | 5,696 (82.8%) | 1,182 (17.2%) |
| $100,000 and over | 31,105 (94.7%) | 1,747 (5.3%) |
Public vs Private Health Insurance Coverage by Age in Mount Prospect
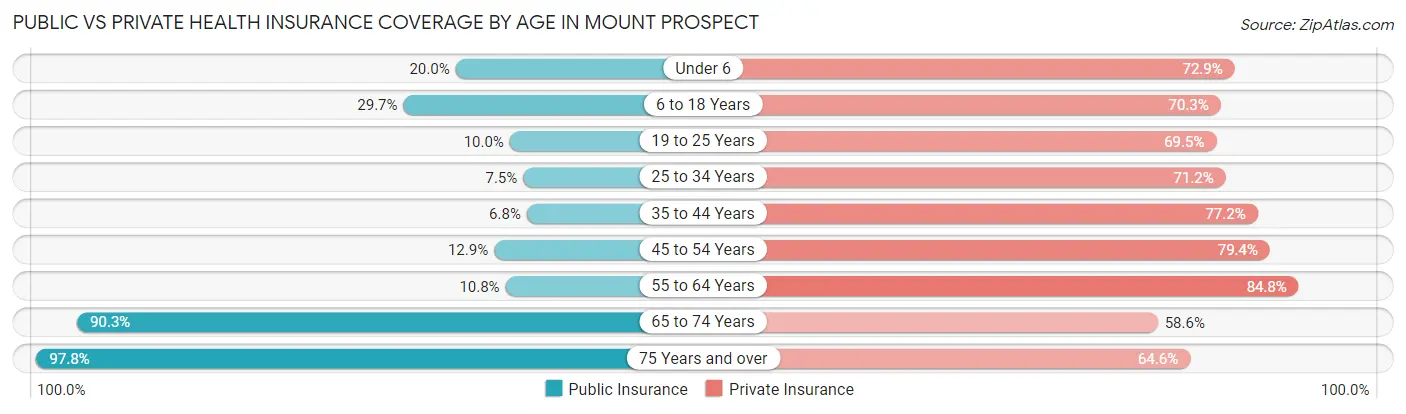
| Age Bracket | Public Insurance | Private Insurance |
| Under 6 | 831 (20.0%) | 3,025 (72.9%) |
| 6 to 18 Years | 2,637 (29.7%) | 6,243 (70.3%) |
| 19 to 25 Years | 327 (10.0%) | 2,281 (69.5%) |
| 25 to 34 Years | 530 (7.5%) | 5,053 (71.2%) |
| 35 to 44 Years | 508 (6.8%) | 5,765 (77.1%) |
| 45 to 54 Years | 1,047 (12.9%) | 6,456 (79.4%) |
| 55 to 64 Years | 755 (10.7%) | 5,954 (84.8%) |
| 65 to 74 Years | 4,902 (90.3%) | 3,184 (58.6%) |
| 75 Years and over | 4,633 (97.8%) | 3,062 (64.6%) |
| Total | 16,170 (28.8%) | 41,023 (73.0%) |
Disability Status by Sex by Age in Mount Prospect
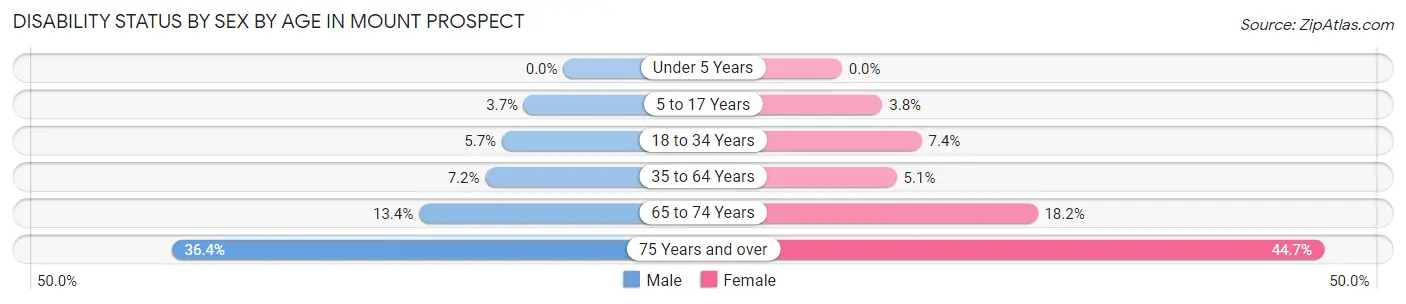
| Age Bracket | Male | Female |
| Under 5 Years | 0 (0.0%) | 0 (0.0%) |
| 5 to 17 Years | 160 (3.7%) | 169 (3.8%) |
| 18 to 34 Years | 330 (5.7%) | 385 (7.4%) |
| 35 to 64 Years | 827 (7.2%) | 570 (5.1%) |
| 65 to 74 Years | 348 (13.4%) | 514 (18.2%) |
| 75 Years and over | 742 (36.3%) | 1,206 (44.7%) |
Disability Class by Sex by Age in Mount Prospect
Disability Class: Hearing Difficulty
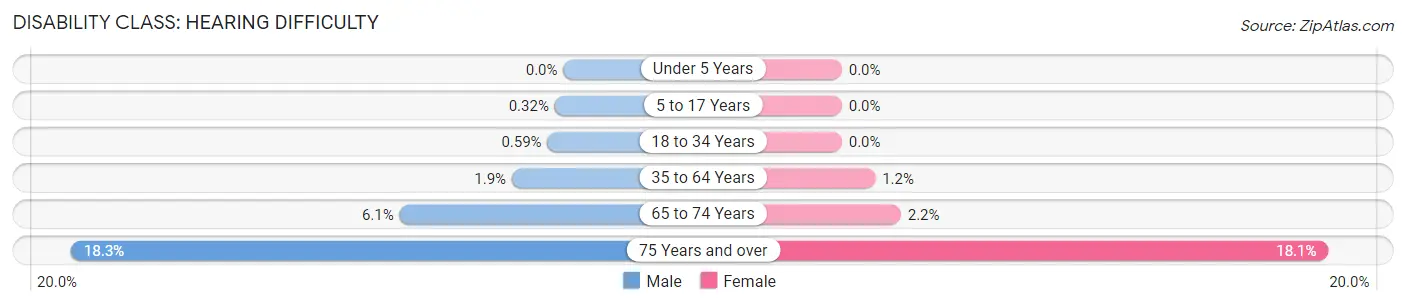
| Age Bracket | Male | Female |
| Under 5 Years | 0 (0.0%) | 0 (0.0%) |
| 5 to 17 Years | 14 (0.3%) | 0 (0.0%) |
| 18 to 34 Years | 34 (0.6%) | 0 (0.0%) |
| 35 to 64 Years | 218 (1.9%) | 139 (1.2%) |
| 65 to 74 Years | 158 (6.1%) | 62 (2.2%) |
| 75 Years and over | 373 (18.3%) | 487 (18.1%) |
Disability Class: Vision Difficulty
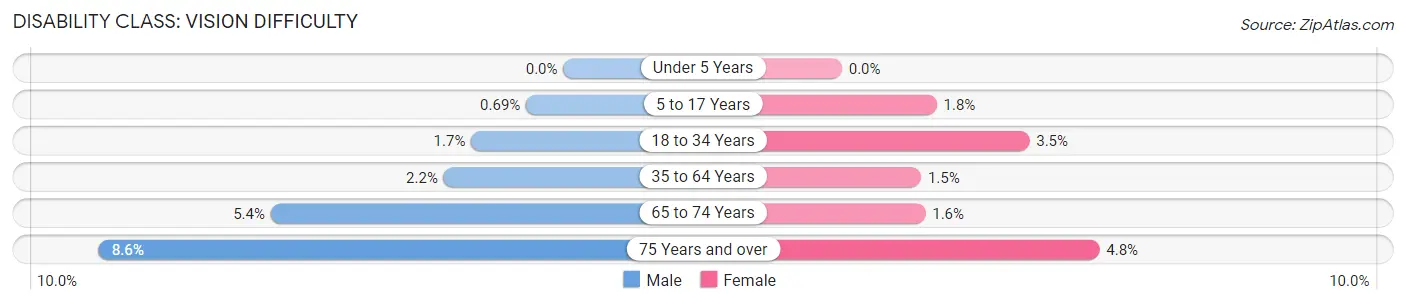
| Age Bracket | Male | Female |
| Under 5 Years | 0 (0.0%) | 0 (0.0%) |
| 5 to 17 Years | 30 (0.7%) | 79 (1.8%) |
| 18 to 34 Years | 99 (1.7%) | 181 (3.5%) |
| 35 to 64 Years | 254 (2.2%) | 164 (1.5%) |
| 65 to 74 Years | 141 (5.4%) | 44 (1.5%) |
| 75 Years and over | 176 (8.6%) | 129 (4.8%) |
Disability Class: Cognitive Difficulty
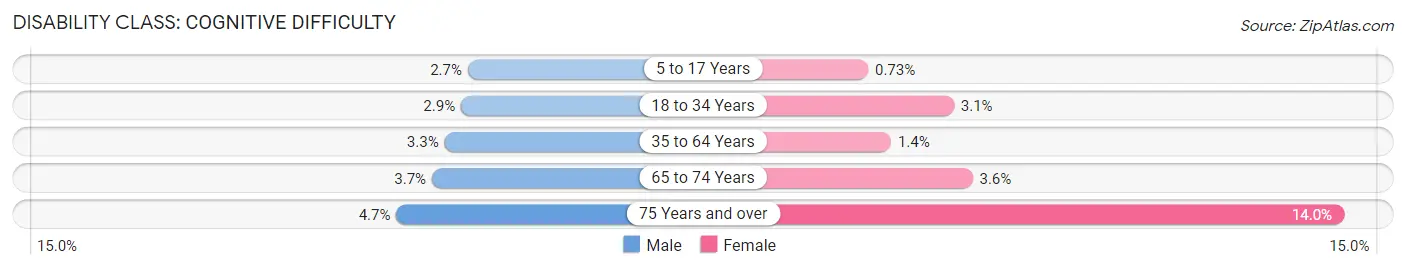
| Age Bracket | Male | Female |
| 5 to 17 Years | 116 (2.7%) | 33 (0.7%) |
| 18 to 34 Years | 165 (2.9%) | 162 (3.1%) |
| 35 to 64 Years | 378 (3.3%) | 153 (1.4%) |
| 65 to 74 Years | 95 (3.7%) | 103 (3.6%) |
| 75 Years and over | 95 (4.6%) | 377 (14.0%) |
Disability Class: Ambulatory Difficulty
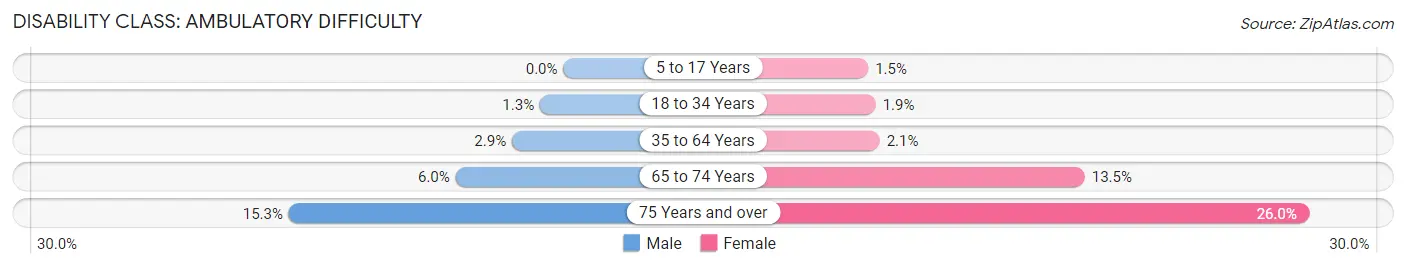
| Age Bracket | Male | Female |
| 5 to 17 Years | 0 (0.0%) | 66 (1.5%) |
| 18 to 34 Years | 75 (1.3%) | 98 (1.9%) |
| 35 to 64 Years | 327 (2.9%) | 236 (2.1%) |
| 65 to 74 Years | 156 (6.0%) | 383 (13.5%) |
| 75 Years and over | 312 (15.3%) | 701 (26.0%) |
Disability Class: Self-Care Difficulty
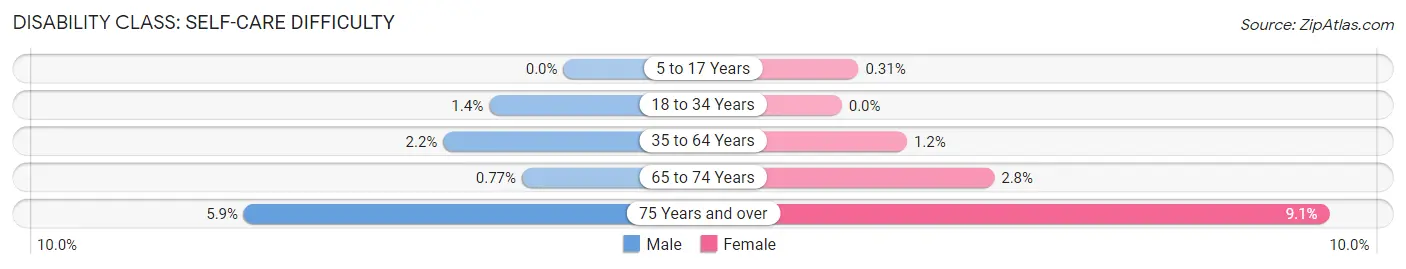
| Age Bracket | Male | Female |
| 5 to 17 Years | 0 (0.0%) | 14 (0.3%) |
| 18 to 34 Years | 80 (1.4%) | 0 (0.0%) |
| 35 to 64 Years | 255 (2.2%) | 135 (1.2%) |
| 65 to 74 Years | 20 (0.8%) | 80 (2.8%) |
| 75 Years and over | 121 (5.9%) | 244 (9.0%) |
Technology Access in Mount Prospect
Computing Device Access in Mount Prospect
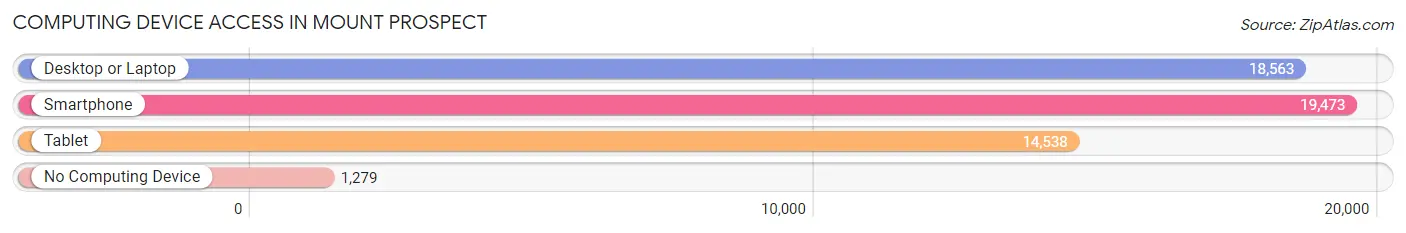
| Device Type | # Households | % Households |
| Desktop or Laptop | 18,563 | 84.7% |
| Smartphone | 19,473 | 88.8% |
| Tablet | 14,538 | 66.3% |
| No Computing Device | 1,279 | 5.8% |
| Total | 21,917 | 100.0% |
Internet Access in Mount Prospect
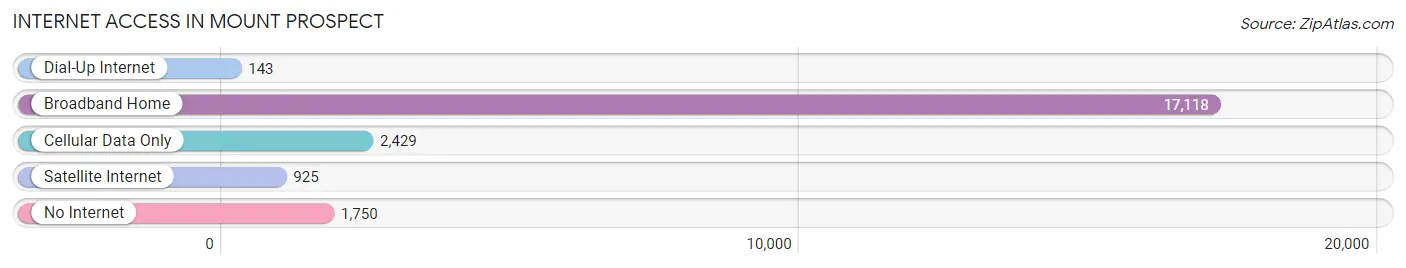
| Internet Type | # Households | % Households |
| Dial-Up Internet | 143 | 0.6% |
| Broadband Home | 17,118 | 78.1% |
| Cellular Data Only | 2,429 | 11.1% |
| Satellite Internet | 925 | 4.2% |
| No Internet | 1,750 | 8.0% |
| Total | 21,917 | 100.0% |
Mount Prospect Summary
Introduction
Mount Prospect is a village located in Cook and Lake counties in the state of Illinois. It is a northwest suburb of Chicago and is part of the Chicago metropolitan area. The village has a population of 54,167 as of the 2019 census. It is known for its diverse population, excellent schools, and vibrant downtown.
History
Mount Prospect was first settled in 1835 by German immigrants. The village was originally known as “Prospect Heights” and was incorporated in 1917. The village was named after the nearby Mount Prospect, which was a popular lookout point for settlers.
The village experienced rapid growth in the 1950s and 1960s due to its proximity to Chicago and its excellent transportation links. The population of the village grew from 4,000 in 1950 to over 54,000 in 2019.
Geography
Mount Prospect is located in Cook and Lake counties in the state of Illinois. It is a northwest suburb of Chicago and is part of the Chicago metropolitan area. The village is situated on the Des Plaines River and is bordered by the villages of Arlington Heights, Des Plaines, Elk Grove Village, and Prospect Heights.
The village has a total area of 8.3 square miles, of which 8.2 square miles is land and 0.1 square miles is water. The village has a humid continental climate, with hot summers and cold winters.
Economy
Mount Prospect is a major economic center in the Chicago metropolitan area. The village is home to a number of large companies, including Motorola Solutions, Zurich North America, and the American Academy of Pediatrics. The village also has a thriving retail sector, with a number of shopping centers and malls.
The village has a strong manufacturing sector, with a number of factories producing a variety of products. The village is also home to a number of small businesses, including restaurants, bars, and other retail outlets.
Demographics
As of the 2019 census, the village had a population of 54,167. The population is diverse, with a mix of races and ethnicities. The largest racial group is White (77.2%), followed by Asian (10.2%), Hispanic or Latino (7.2%), and African American (3.2%).
The median household income in the village is $76,845, and the median home value is $272,400. The village has a high rate of homeownership, with 73.2% of households owning their own homes.
Conclusion
Mount Prospect is a vibrant village located in Cook and Lake counties in the state of Illinois. It is a northwest suburb of Chicago and is part of the Chicago metropolitan area. The village has a population of 54,167 as of the 2019 census and is known for its diverse population, excellent schools, and vibrant downtown. The village has a strong economy, with a number of large companies and a thriving retail sector. The village also has a diverse population, with a mix of races and ethnicities.
Common Questions
What is Per Capita Income in Mount Prospect?
Per Capita income in Mount Prospect is $47,614.
What is the Median Family Income in Mount Prospect?
Median Family Income in Mount Prospect is $123,969.
What is the Median Household income in Mount Prospect?
Median Household Income in Mount Prospect is $100,526.
What is Income or Wage Gap in Mount Prospect?
Income or Wage Gap in Mount Prospect is 28.0%.
Women in Mount Prospect earn 72.0 cents for every dollar earned by a man.
What is Inequality or Gini Index in Mount Prospect?
Inequality or Gini Index in Mount Prospect is 0.41.
What is the Total Population of Mount Prospect?
Total Population of Mount Prospect is 56,191.
What is the Total Male Population of Mount Prospect?
Total Male Population of Mount Prospect is 28,074.
What is the Total Female Population of Mount Prospect?
Total Female Population of Mount Prospect is 28,117.
What is the Ratio of Males per 100 Females in Mount Prospect?
There are 99.85 Males per 100 Females in Mount Prospect.
What is the Ratio of Females per 100 Males in Mount Prospect?
There are 100.15 Females per 100 Males in Mount Prospect.
What is the Median Population Age in Mount Prospect?
Median Population Age in Mount Prospect is 41.2 Years.
What is the Average Family Size in Mount Prospect
Average Family Size in Mount Prospect is 3.1 People.
What is the Average Household Size in Mount Prospect
Average Household Size in Mount Prospect is 2.6 People.
How Large is the Labor Force in Mount Prospect?
There are 30,569 People in the Labor Forcein in Mount Prospect.
What is the Percentage of People in the Labor Force in Mount Prospect?
67.7% of People are in the Labor Force in Mount Prospect.
What is the Unemployment Rate in Mount Prospect?
Unemployment Rate in Mount Prospect is 3.5%.