Justice, IL Map & Demographics
Justice Map
Justice Overview
$29,512
PER CAPITA INCOME
$80,000
AVG FAMILY INCOME
$60,083
AVG HOUSEHOLD INCOME
5.1%
WAGE / INCOME GAP [ % ]
94.9¢/ $1
WAGE / INCOME GAP [ $ ]
$10,546
FAMILY INCOME DEFICIT
0.44
INEQUALITY / GINI INDEX
12,525
TOTAL POPULATION
6,033
MALE POPULATION
6,492
FEMALE POPULATION
92.93
MALES / 100 FEMALES
107.61
FEMALES / 100 MALES
31.1
MEDIAN AGE
3.3
AVG FAMILY SIZE
2.8
AVG HOUSEHOLD SIZE
6,737
LABOR FORCE [ PEOPLE ]
69.0%
PERCENT IN LABOR FORCE
5.0%
UNEMPLOYMENT RATE
Justice Zip Codes
Justice Area Codes
Income in Justice
Income Overview in Justice
Per Capita Income in Justice is $29,512, while median incomes of families and households are $80,000 and $60,083 respectively.
| Characteristic | Number | Measure |
| Per Capita Income | 12,525 | $29,512 |
| Median Family Income | 3,022 | $80,000 |
| Mean Family Income | 3,022 | $90,636 |
| Median Household Income | 4,511 | $60,083 |
| Mean Household Income | 4,511 | $79,012 |
| Income Deficit | 3,022 | $10,546 |
| Wage / Income Gap (%) | 12,525 | 5.08% |
| Wage / Income Gap ($) | 12,525 | 94.92¢ per $1 |
| Gini / Inequality Index | 12,525 | 0.44 |
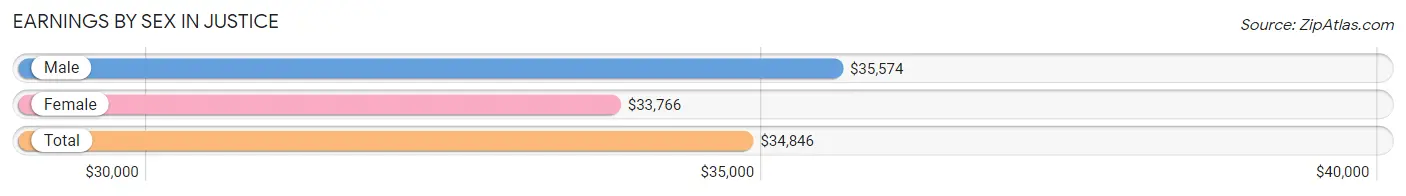
Earnings by Sex in Justice
Average Earnings in Justice are $34,846, $35,574 for men and $33,766 for women, a difference of 5.1%.
| Sex | Number | Average Earnings |
| Male | 3,790 (55.3%) | $35,574 |
| Female | 3,057 (44.7%) | $33,766 |
| Total | 6,847 (100.0%) | $34,846 |
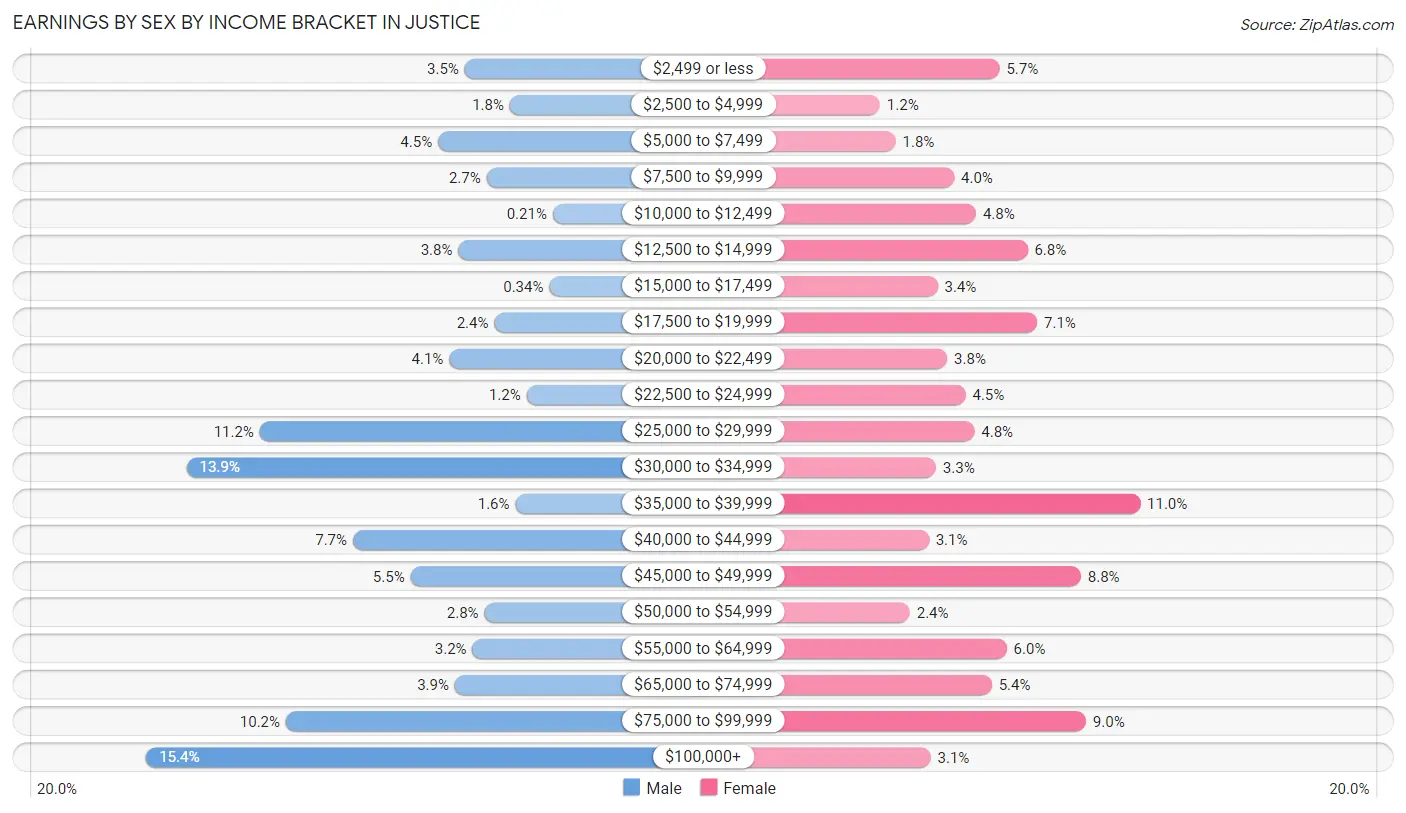
Earnings by Sex by Income Bracket in Justice
The most common earnings brackets in Justice are $100,000+ for men (585 | 15.4%) and $35,000 to $39,999 for women (336 | 11.0%).
| Income | Male | Female |
| $2,499 or less | 133 (3.5%) | 175 (5.7%) |
| $2,500 to $4,999 | 69 (1.8%) | 38 (1.2%) |
| $5,000 to $7,499 | 171 (4.5%) | 56 (1.8%) |
| $7,500 to $9,999 | 102 (2.7%) | 123 (4.0%) |
| $10,000 to $12,499 | 8 (0.2%) | 148 (4.8%) |
| $12,500 to $14,999 | 142 (3.7%) | 207 (6.8%) |
| $15,000 to $17,499 | 13 (0.3%) | 104 (3.4%) |
| $17,500 to $19,999 | 91 (2.4%) | 218 (7.1%) |
| $20,000 to $22,499 | 155 (4.1%) | 115 (3.8%) |
| $22,500 to $24,999 | 45 (1.2%) | 136 (4.4%) |
| $25,000 to $29,999 | 424 (11.2%) | 146 (4.8%) |
| $30,000 to $34,999 | 528 (13.9%) | 102 (3.3%) |
| $35,000 to $39,999 | 61 (1.6%) | 336 (11.0%) |
| $40,000 to $44,999 | 292 (7.7%) | 94 (3.1%) |
| $45,000 to $49,999 | 210 (5.5%) | 268 (8.8%) |
| $50,000 to $54,999 | 105 (2.8%) | 72 (2.4%) |
| $55,000 to $64,999 | 122 (3.2%) | 183 (6.0%) |
| $65,000 to $74,999 | 147 (3.9%) | 166 (5.4%) |
| $75,000 to $99,999 | 387 (10.2%) | 274 (9.0%) |
| $100,000+ | 585 (15.4%) | 96 (3.1%) |
| Total | 3,790 (100.0%) | 3,057 (100.0%) |
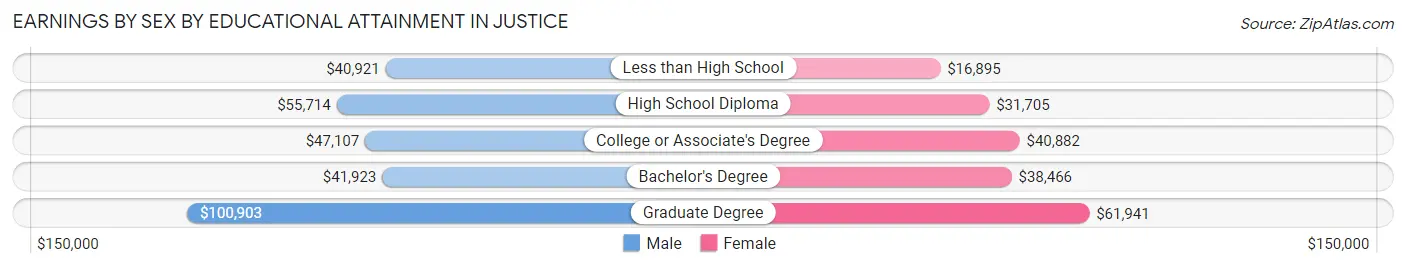
Earnings by Sex by Educational Attainment in Justice
Average earnings in Justice are $49,315 for men and $37,206 for women, a difference of 24.5%. Men with an educational attainment of graduate degree enjoy the highest average annual earnings of $100,903, while those with less than high school education earn the least with $40,921. Women with an educational attainment of graduate degree earn the most with the average annual earnings of $61,941, while those with less than high school education have the smallest earnings of $16,895.
| Educational Attainment | Male Income | Female Income |
| Less than High School | $40,921 | $16,895 |
| High School Diploma | $55,714 | $31,705 |
| College or Associate's Degree | $47,107 | $40,882 |
| Bachelor's Degree | $41,923 | $38,466 |
| Graduate Degree | $100,903 | $61,941 |
| Total | $49,315 | $37,206 |
Family Income in Justice
Family Income Brackets in Justice
According to the Justice family income data, there are 538 families falling into the $100,000 to $149,999 income range, which is the most common income bracket and makes up 17.8% of all families. Conversely, the less than $10,000 income bracket is the least frequent group with only 91 families (3.0%) belonging to this category.
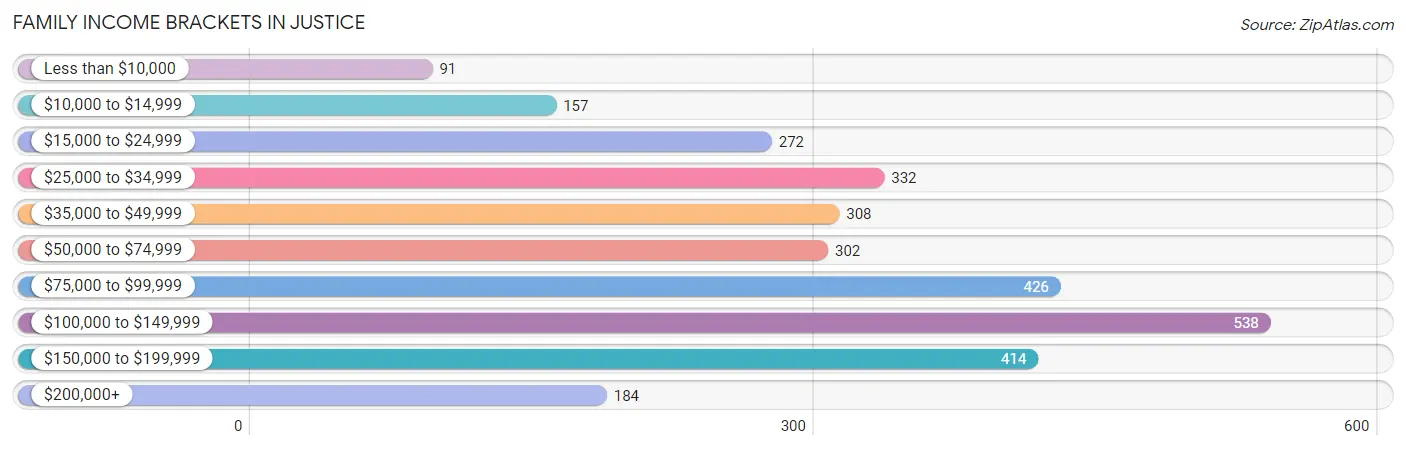
| Income Bracket | # Families | % Families |
| Less than $10,000 | 91 | 3.0% |
| $10,000 to $14,999 | 157 | 5.2% |
| $15,000 to $24,999 | 272 | 9.0% |
| $25,000 to $34,999 | 332 | 11.0% |
| $35,000 to $49,999 | 308 | 10.2% |
| $50,000 to $74,999 | 302 | 10.0% |
| $75,000 to $99,999 | 426 | 14.1% |
| $100,000 to $149,999 | 538 | 17.8% |
| $150,000 to $199,999 | 414 | 13.7% |
| $200,000+ | 184 | 6.1% |
Family Income by Famaliy Size in Justice
5-person families (234 | 7.7%) account for the highest median family income in Justice with $135,729 per family, while 3-person families (919 | 30.4%) have the highest median income of $30,366 per family member.
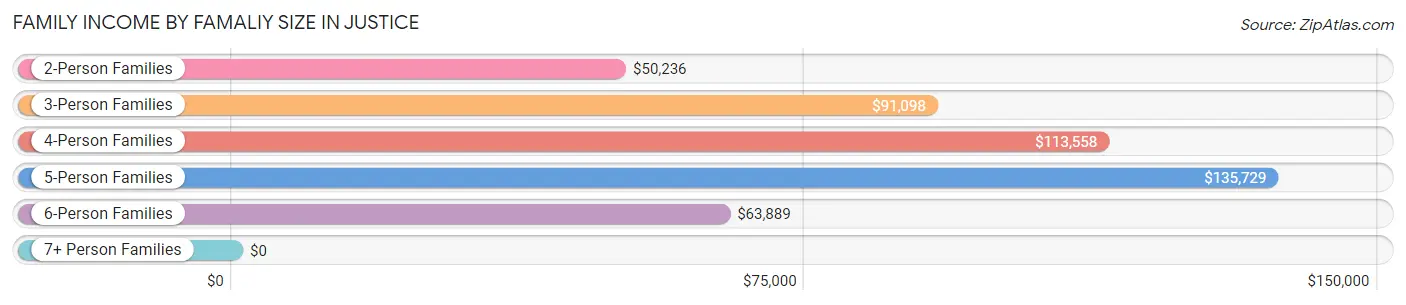
| Income Bracket | # Families | Median Income |
| 2-Person Families | 1,009 (33.4%) | $50,236 |
| 3-Person Families | 919 (30.4%) | $91,098 |
| 4-Person Families | 754 (24.9%) | $113,558 |
| 5-Person Families | 234 (7.7%) | $135,729 |
| 6-Person Families | 68 (2.2%) | $63,889 |
| 7+ Person Families | 38 (1.3%) | $0 |
| Total | 3,022 (100.0%) | $80,000 |
Family Income by Number of Earners in Justice
The median family income in Justice is $80,000, with families comprising 3+ earners (341) having the highest median family income of $156,406, while families with no earners (236) have the lowest median family income of $32,120, accounting for 11.3% and 7.8% of families, respectively.
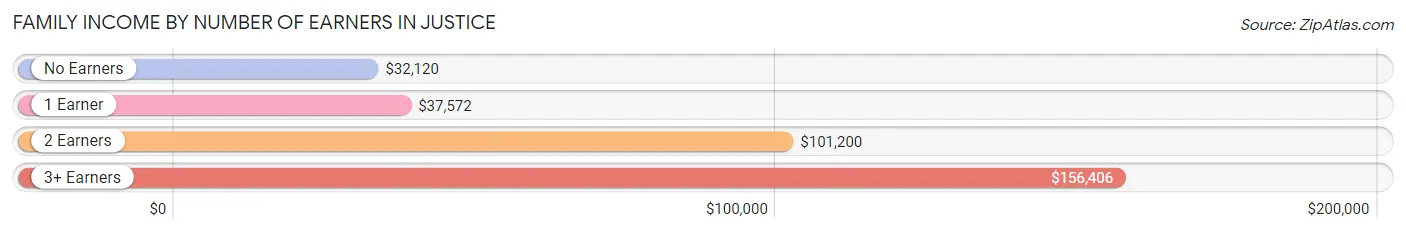
| Number of Earners | # Families | Median Income |
| No Earners | 236 (7.8%) | $32,120 |
| 1 Earner | 1,177 (39.0%) | $37,572 |
| 2 Earners | 1,268 (42.0%) | $101,200 |
| 3+ Earners | 341 (11.3%) | $156,406 |
| Total | 3,022 (100.0%) | $80,000 |
Household Income in Justice
Household Income Brackets in Justice
With 645 households falling in the category, the $75,000 to $99,999 income range is the most frequent in Justice, accounting for 14.3% of all households. In contrast, only 248 households (5.5%) fall into the $200,000+ income bracket, making it the least populous group.
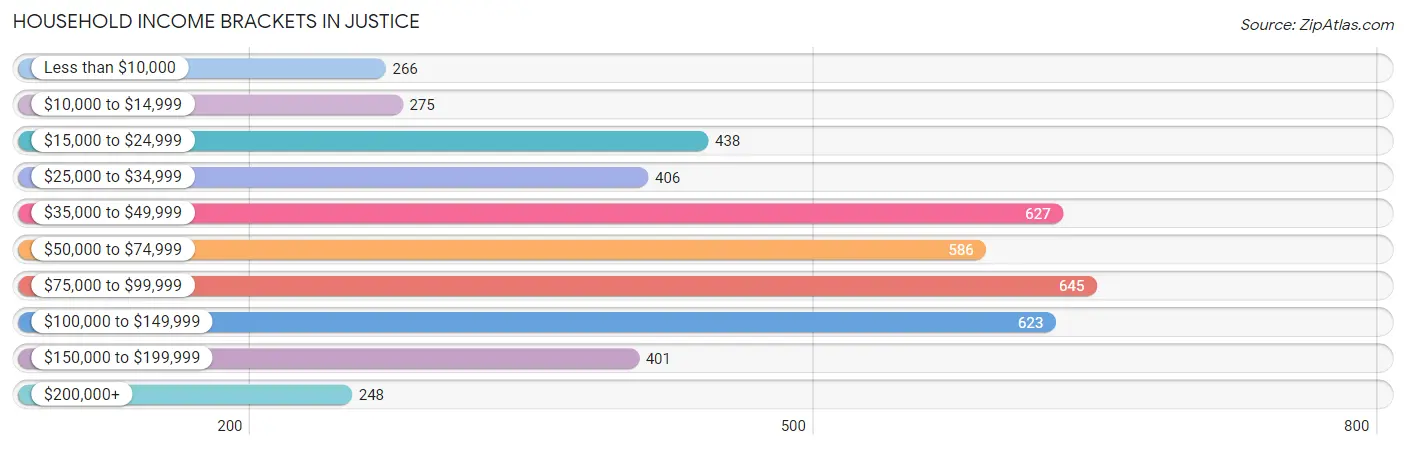
| Income Bracket | # Households | % Households |
| Less than $10,000 | 266 | 5.9% |
| $10,000 to $14,999 | 275 | 6.1% |
| $15,000 to $24,999 | 438 | 9.7% |
| $25,000 to $34,999 | 406 | 9.0% |
| $35,000 to $49,999 | 627 | 13.9% |
| $50,000 to $74,999 | 586 | 13.0% |
| $75,000 to $99,999 | 645 | 14.3% |
| $100,000 to $149,999 | 623 | 13.8% |
| $150,000 to $199,999 | 401 | 8.9% |
| $200,000+ | 248 | 5.5% |
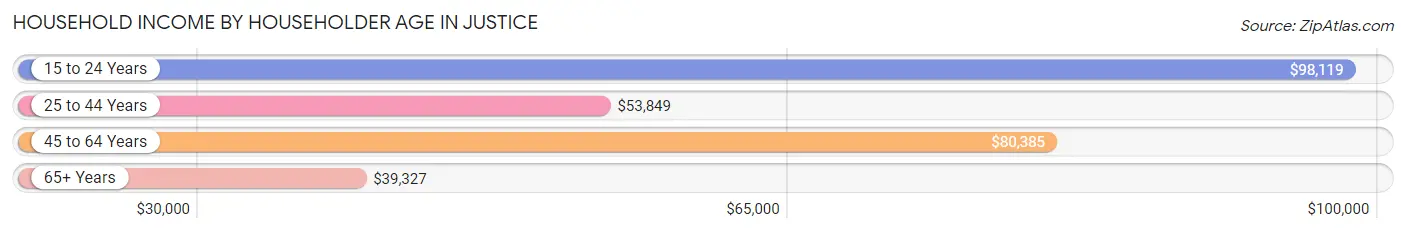
Household Income by Householder Age in Justice
The median household income in Justice is $60,083, with the highest median household income of $98,119 found in the 15 to 24 years age bracket for the primary householder. A total of 180 households (4.0%) fall into this category. Meanwhile, the 65+ years age bracket for the primary householder has the lowest median household income of $39,327, with 912 households (20.2%) in this group.
| Income Bracket | # Households | Median Income |
| 15 to 24 Years | 180 (4.0%) | $98,119 |
| 25 to 44 Years | 1,897 (42.0%) | $53,849 |
| 45 to 64 Years | 1,522 (33.7%) | $80,385 |
| 65+ Years | 912 (20.2%) | $39,327 |
| Total | 4,511 (100.0%) | $60,083 |
Poverty in Justice
Income Below Poverty by Sex and Age in Justice
With 20.7% poverty level for males and 23.0% for females among the residents of Justice, 5 year old males and 5 year old females are the most vulnerable to poverty, with 57 males (61.3%) and 49 females (45.0%) in their respective age groups living below the poverty level.
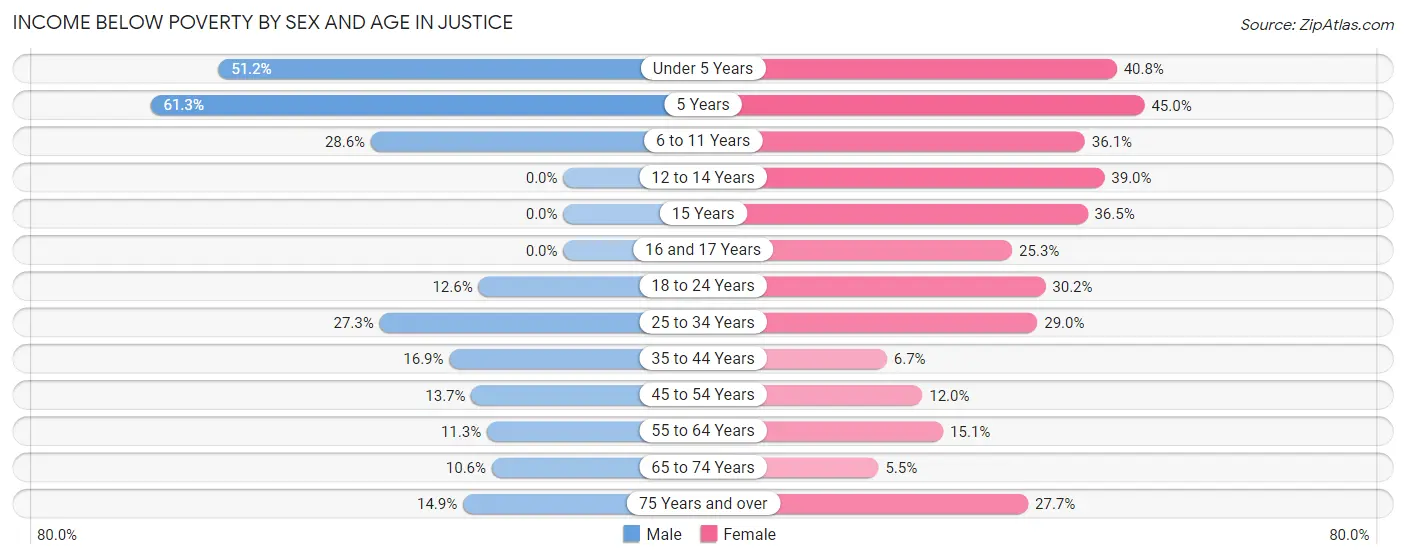
| Age Bracket | Male | Female |
| Under 5 Years | 334 (51.2%) | 220 (40.8%) |
| 5 Years | 57 (61.3%) | 49 (45.0%) |
| 6 to 11 Years | 114 (28.6%) | 161 (36.1%) |
| 12 to 14 Years | 0 (0.0%) | 85 (39.0%) |
| 15 Years | 0 (0.0%) | 58 (36.5%) |
| 16 and 17 Years | 0 (0.0%) | 42 (25.3%) |
| 18 to 24 Years | 157 (12.6%) | 224 (30.2%) |
| 25 to 34 Years | 200 (27.3%) | 297 (29.0%) |
| 35 to 44 Years | 185 (16.9%) | 65 (6.7%) |
| 45 to 54 Years | 72 (13.7%) | 78 (12.0%) |
| 55 to 64 Years | 55 (11.3%) | 104 (15.0%) |
| 65 to 74 Years | 53 (10.6%) | 25 (5.4%) |
| 75 Years and over | 21 (14.9%) | 88 (27.7%) |
| Total | 1,248 (20.7%) | 1,496 (23.0%) |
Income Above Poverty by Sex and Age in Justice
According to the poverty statistics in Justice, males aged 12 to 14 years and females aged 65 to 74 years are the age groups that are most secure financially, with 100.0% of males and 94.6% of females in these age groups living above the poverty line.
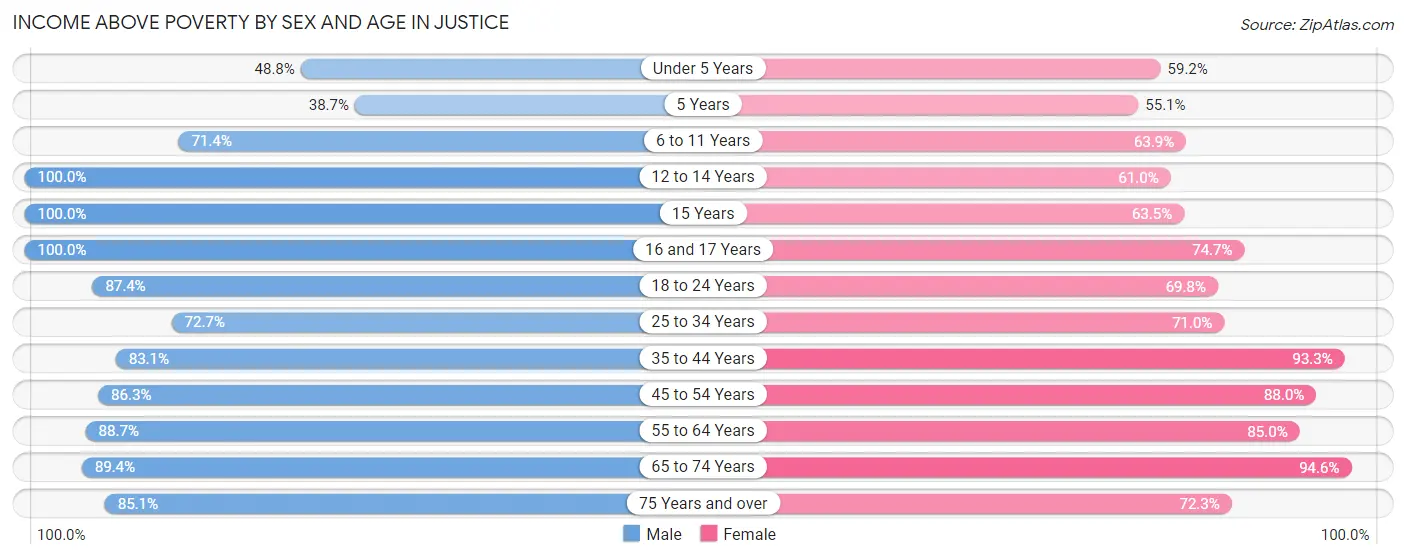
| Age Bracket | Male | Female |
| Under 5 Years | 318 (48.8%) | 319 (59.2%) |
| 5 Years | 36 (38.7%) | 60 (55.0%) |
| 6 to 11 Years | 285 (71.4%) | 285 (63.9%) |
| 12 to 14 Years | 72 (100.0%) | 133 (61.0%) |
| 15 Years | 74 (100.0%) | 101 (63.5%) |
| 16 and 17 Years | 19 (100.0%) | 124 (74.7%) |
| 18 to 24 Years | 1,089 (87.4%) | 517 (69.8%) |
| 25 to 34 Years | 533 (72.7%) | 726 (71.0%) |
| 35 to 44 Years | 908 (83.1%) | 906 (93.3%) |
| 45 to 54 Years | 455 (86.3%) | 574 (88.0%) |
| 55 to 64 Years | 430 (88.7%) | 587 (85.0%) |
| 65 to 74 Years | 446 (89.4%) | 434 (94.6%) |
| 75 Years and over | 120 (85.1%) | 230 (72.3%) |
| Total | 4,785 (79.3%) | 4,996 (77.0%) |
Income Below Poverty Among Married-Couple Families in Justice
The poverty statistics for married-couple families in Justice show that 13.9% or 289 of the total 2,077 families live below the poverty line. Families with 5 or more children have the highest poverty rate of 100.0%, comprising of 18 families. On the other hand, families with no children have the lowest poverty rate of 5.9%, which includes 60 families.
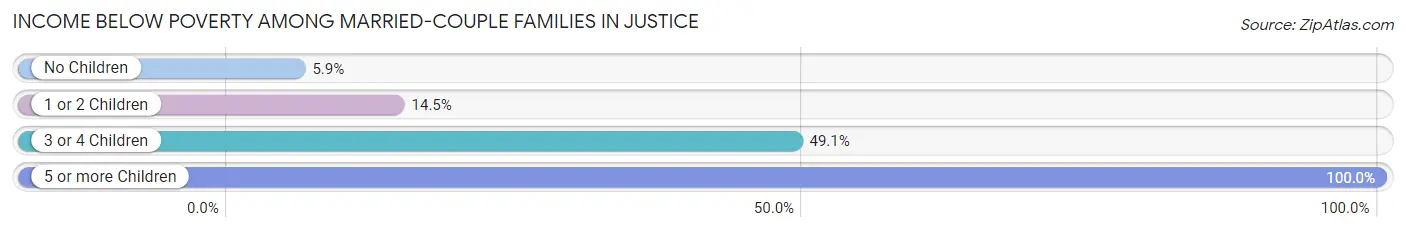
| Children | Above Poverty | Below Poverty |
| No Children | 962 (94.1%) | 60 (5.9%) |
| 1 or 2 Children | 737 (85.5%) | 125 (14.5%) |
| 3 or 4 Children | 89 (50.9%) | 86 (49.1%) |
| 5 or more Children | 0 (0.0%) | 18 (100.0%) |
| Total | 1,788 (86.1%) | 289 (13.9%) |
Income Below Poverty Among Single-Parent Households in Justice
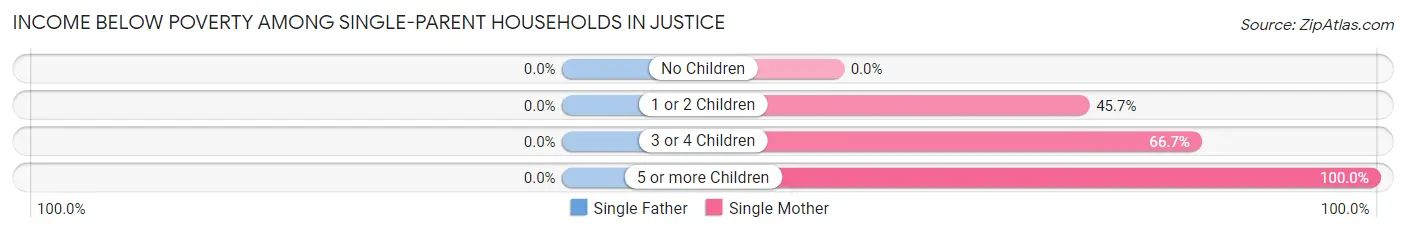
| Children | Single Father | Single Mother |
| No Children | 0 (0.0%) | 0 (0.0%) |
| 1 or 2 Children | 0 (0.0%) | 188 (45.7%) |
| 3 or 4 Children | 0 (0.0%) | 24 (66.7%) |
| 5 or more Children | 0 (0.0%) | 20 (100.0%) |
| Total | 0 (0.0%) | 232 (29.2%) |
Income Below Poverty Among Married-Couple vs Single-Parent Households in Justice
The poverty data for Justice shows that 289 of the married-couple family households (13.9%) and 232 of the single-parent households (24.5%) are living below the poverty level. Within the married-couple family households, those with 5 or more children have the highest poverty rate, with 18 households (100.0%) falling below the poverty line. Among the single-parent households, those with 5 or more children have the highest poverty rate, with 20 household (100.0%) living below poverty.
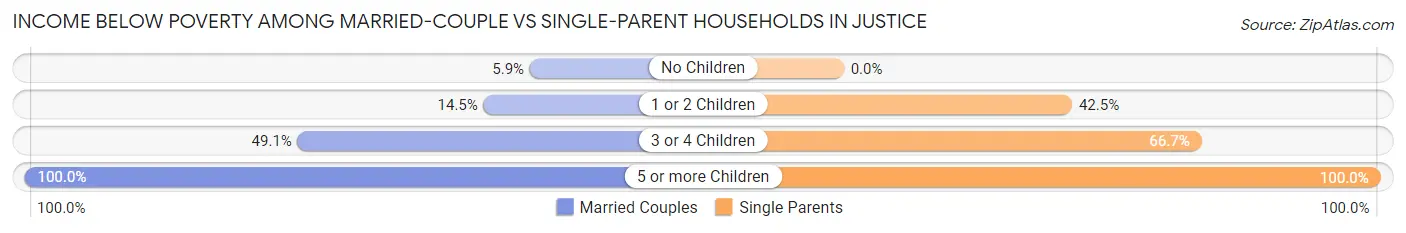
| Children | Married-Couple Families | Single-Parent Households |
| No Children | 60 (5.9%) | 0 (0.0%) |
| 1 or 2 Children | 125 (14.5%) | 188 (42.5%) |
| 3 or 4 Children | 86 (49.1%) | 24 (66.7%) |
| 5 or more Children | 18 (100.0%) | 20 (100.0%) |
| Total | 289 (13.9%) | 232 (24.5%) |
Race in Justice
The most populous races in Justice are White / Caucasian (7,406 | 59.1%), Black / African American (2,710 | 21.6%), and Hispanic or Latino (2,485 | 19.8%).
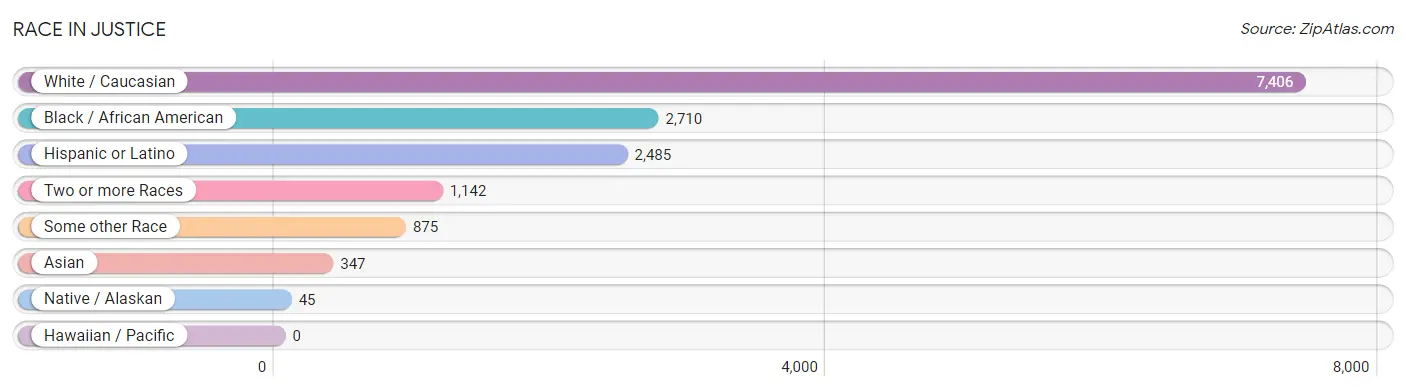
| Race | # Population | % Population |
| Asian | 347 | 2.8% |
| Black / African American | 2,710 | 21.6% |
| Hawaiian / Pacific | 0 | 0.0% |
| Hispanic or Latino | 2,485 | 19.8% |
| Native / Alaskan | 45 | 0.4% |
| White / Caucasian | 7,406 | 59.1% |
| Two or more Races | 1,142 | 9.1% |
| Some other Race | 875 | 7.0% |
| Total | 12,525 | 100.0% |
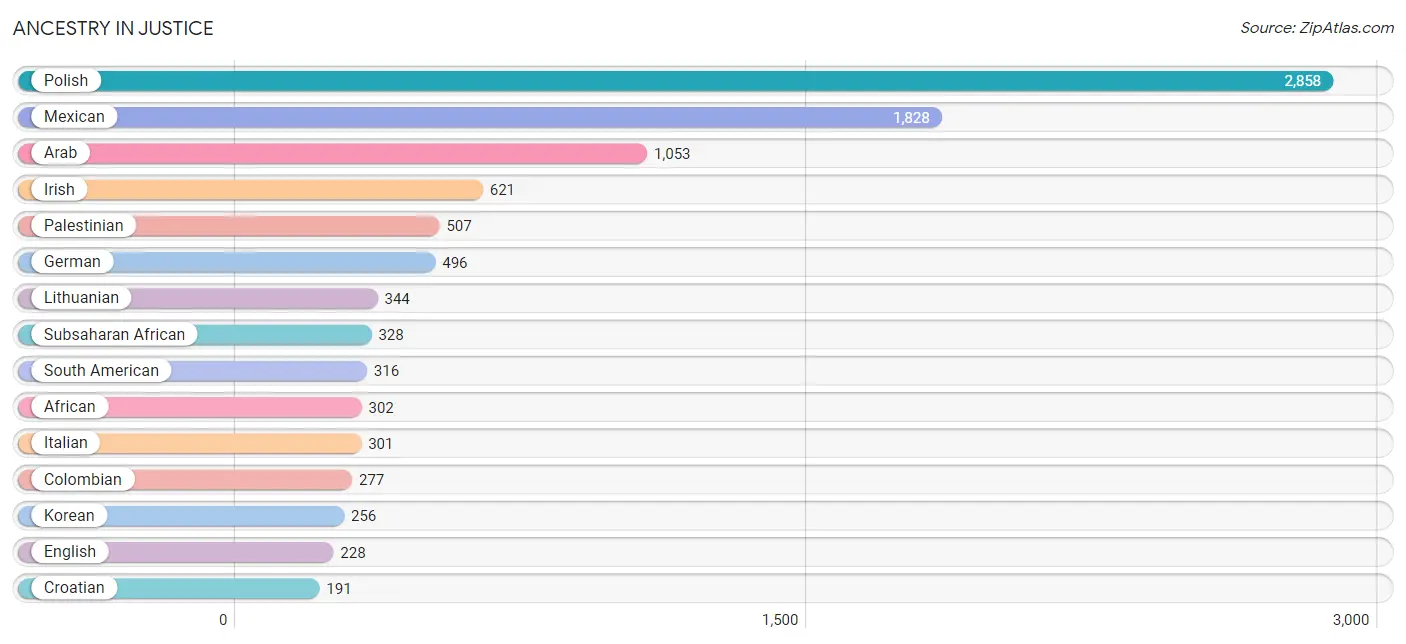
Ancestry in Justice
The most populous ancestries reported in Justice are Polish (2,858 | 22.8%), Mexican (1,828 | 14.6%), Arab (1,053 | 8.4%), Irish (621 | 5.0%), and Palestinian (507 | 4.1%), together accounting for 54.8% of all Justice residents.
| Ancestry | # Population | % Population |
| African | 302 | 2.4% |
| American | 174 | 1.4% |
| Arab | 1,053 | 8.4% |
| British | 24 | 0.2% |
| Canadian | 12 | 0.1% |
| Central American | 157 | 1.3% |
| Colombian | 277 | 2.2% |
| Costa Rican | 100 | 0.8% |
| Croatian | 191 | 1.5% |
| Czech | 126 | 1.0% |
| Danish | 14 | 0.1% |
| Dutch | 19 | 0.2% |
| Eastern European | 12 | 0.1% |
| Ecuadorian | 39 | 0.3% |
| English | 228 | 1.8% |
| European | 9 | 0.1% |
| Finnish | 12 | 0.1% |
| French | 11 | 0.1% |
| German | 496 | 4.0% |
| Greek | 21 | 0.2% |
| Guatemalan | 57 | 0.5% |
| Indian (Asian) | 153 | 1.2% |
| Irish | 621 | 5.0% |
| Italian | 301 | 2.4% |
| Jordanian | 78 | 0.6% |
| Korean | 256 | 2.0% |
| Lebanese | 17 | 0.1% |
| Lithuanian | 344 | 2.8% |
| Mexican | 1,828 | 14.6% |
| Nigerian | 26 | 0.2% |
| Pakistani | 14 | 0.1% |
| Palestinian | 507 | 4.1% |
| Polish | 2,858 | 22.8% |
| Puerto Rican | 107 | 0.9% |
| Russian | 48 | 0.4% |
| Scandinavian | 12 | 0.1% |
| Scotch-Irish | 23 | 0.2% |
| Scottish | 23 | 0.2% |
| Serbian | 48 | 0.4% |
| Sioux | 18 | 0.1% |
| Slovak | 114 | 0.9% |
| Slovene | 4 | 0.0% |
| South American | 316 | 2.5% |
| Spaniard | 67 | 0.5% |
| Subsaharan African | 328 | 2.6% |
| Swedish | 18 | 0.1% |
| Swiss | 89 | 0.7% |
| Ukrainian | 9 | 0.1% | View All 48 Rows |
Immigrants in Justice
The most numerous immigrant groups reported in Justice came from Europe (1,787 | 14.3%), Eastern Europe (1,778 | 14.2%), Poland (1,623 | 13.0%), Asia (962 | 7.7%), and Western Asia (393 | 3.1%), together accounting for 52.2% of all Justice residents.
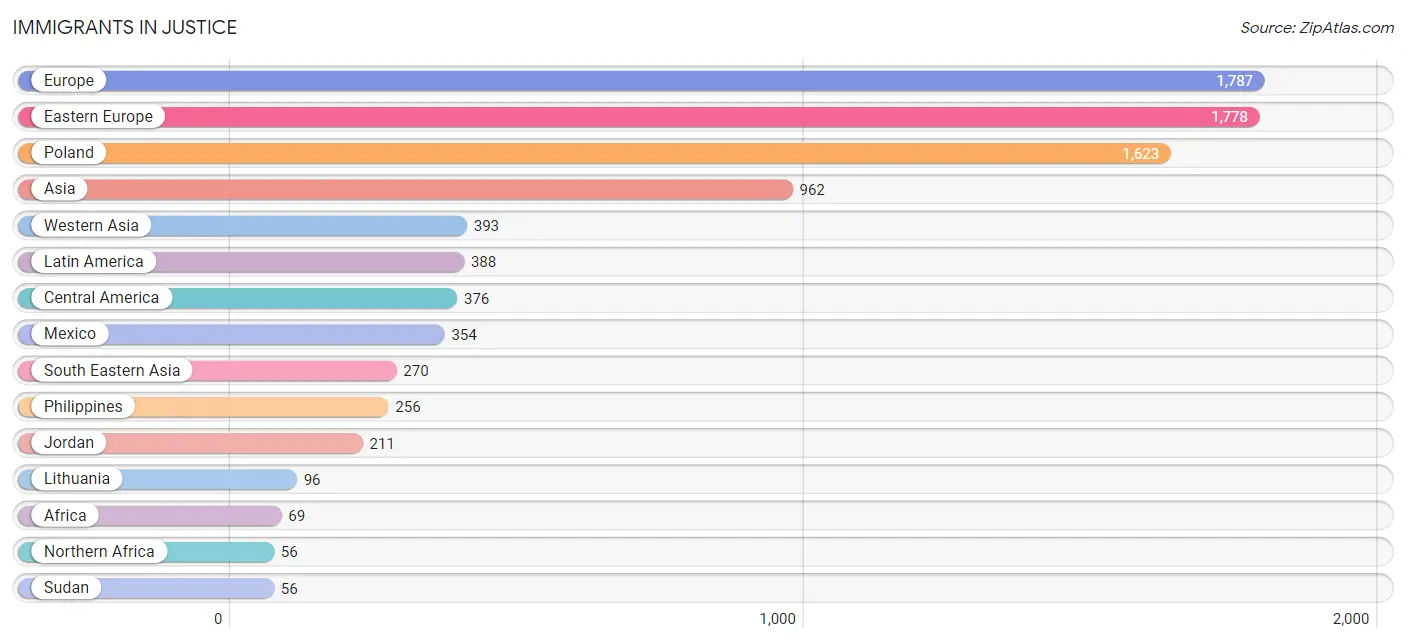
| Immigration Origin | # Population | % Population |
| Africa | 69 | 0.5% |
| Asia | 962 | 7.7% |
| Austria | 9 | 0.1% |
| Central America | 376 | 3.0% |
| China | 45 | 0.4% |
| Czechoslovakia | 25 | 0.2% |
| Eastern Asia | 45 | 0.4% |
| Eastern Europe | 1,778 | 14.2% |
| Ecuador | 12 | 0.1% |
| Europe | 1,787 | 14.3% |
| Guatemala | 22 | 0.2% |
| Israel | 9 | 0.1% |
| Jordan | 211 | 1.7% |
| Kuwait | 38 | 0.3% |
| Latin America | 388 | 3.1% |
| Lebanon | 35 | 0.3% |
| Lithuania | 96 | 0.8% |
| Mexico | 354 | 2.8% |
| Nigeria | 13 | 0.1% |
| Northern Africa | 56 | 0.4% |
| Pakistan | 27 | 0.2% |
| Philippines | 256 | 2.0% |
| Poland | 1,623 | 13.0% |
| Russia | 10 | 0.1% |
| Saudi Arabia | 11 | 0.1% |
| South America | 12 | 0.1% |
| South Central Asia | 27 | 0.2% |
| South Eastern Asia | 270 | 2.2% |
| Sudan | 56 | 0.4% |
| Syria | 29 | 0.2% |
| Thailand | 14 | 0.1% |
| Western Africa | 13 | 0.1% |
| Western Asia | 393 | 3.1% |
| Western Europe | 9 | 0.1% |
| Yemen | 55 | 0.4% | View All 35 Rows |
Sex and Age in Justice
Sex and Age in Justice
The most populous age groups in Justice are 20 to 24 Years (1,038 | 17.2%) for men and 25 to 29 Years (626 | 9.6%) for women.
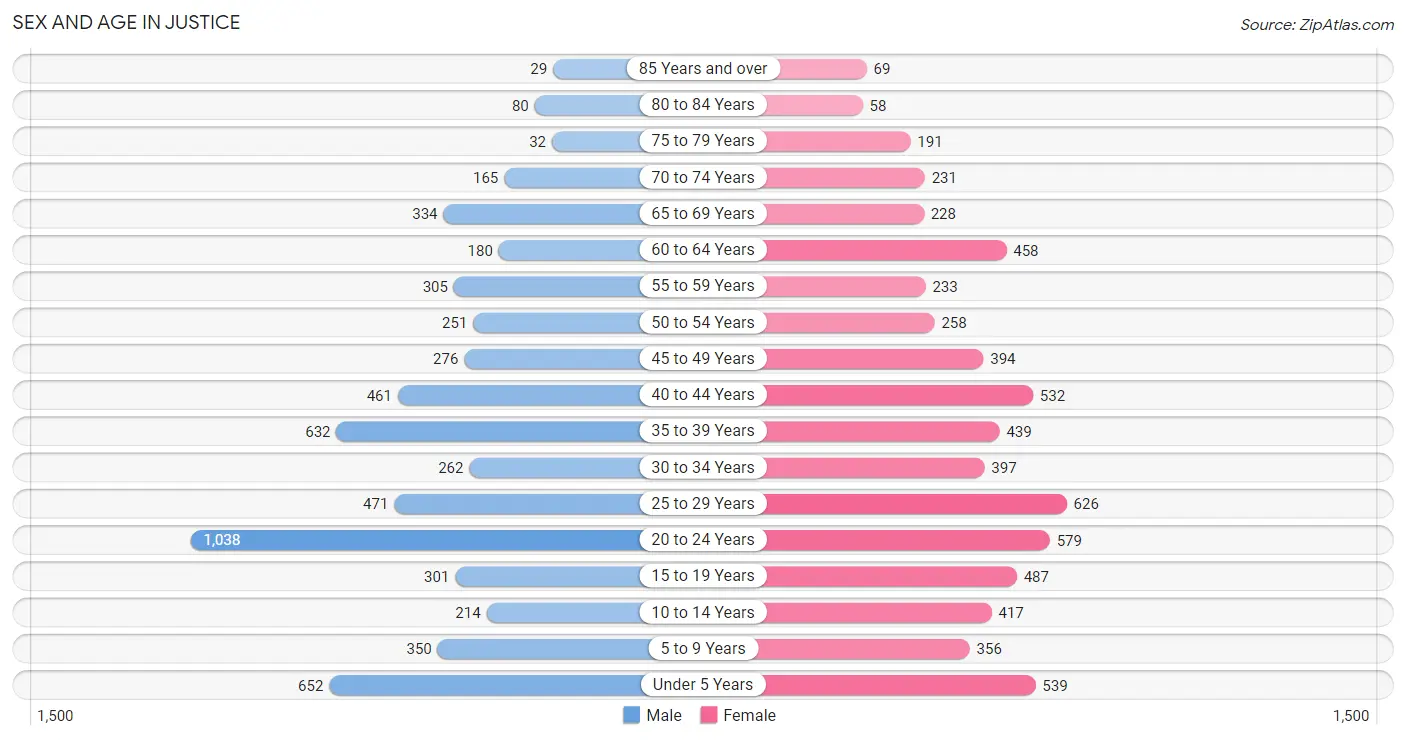
| Age Bracket | Male | Female |
| Under 5 Years | 652 (10.8%) | 539 (8.3%) |
| 5 to 9 Years | 350 (5.8%) | 356 (5.5%) |
| 10 to 14 Years | 214 (3.5%) | 417 (6.4%) |
| 15 to 19 Years | 301 (5.0%) | 487 (7.5%) |
| 20 to 24 Years | 1,038 (17.2%) | 579 (8.9%) |
| 25 to 29 Years | 471 (7.8%) | 626 (9.6%) |
| 30 to 34 Years | 262 (4.3%) | 397 (6.1%) |
| 35 to 39 Years | 632 (10.5%) | 439 (6.8%) |
| 40 to 44 Years | 461 (7.6%) | 532 (8.2%) |
| 45 to 49 Years | 276 (4.6%) | 394 (6.1%) |
| 50 to 54 Years | 251 (4.2%) | 258 (4.0%) |
| 55 to 59 Years | 305 (5.1%) | 233 (3.6%) |
| 60 to 64 Years | 180 (3.0%) | 458 (7.0%) |
| 65 to 69 Years | 334 (5.5%) | 228 (3.5%) |
| 70 to 74 Years | 165 (2.7%) | 231 (3.6%) |
| 75 to 79 Years | 32 (0.5%) | 191 (2.9%) |
| 80 to 84 Years | 80 (1.3%) | 58 (0.9%) |
| 85 Years and over | 29 (0.5%) | 69 (1.1%) |
| Total | 6,033 (100.0%) | 6,492 (100.0%) |
Families and Households in Justice
Median Family Size in Justice
The median family size in Justice is 3.32 persons per family, with married-couple families (2,077 | 68.7%) accounting for the largest median family size of 3.45 persons per family. On the other hand, single male/father families (151 | 5.0%) represent the smallest median family size with 2.62 persons per family.
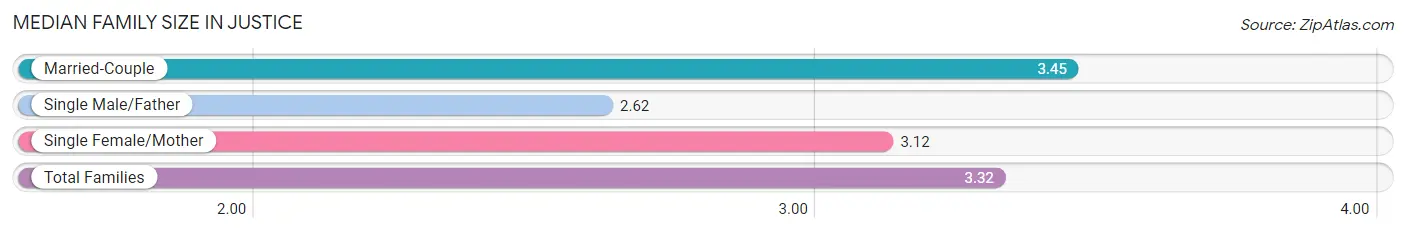
| Family Type | # Families | Family Size |
| Married-Couple | 2,077 (68.7%) | 3.45 |
| Single Male/Father | 151 (5.0%) | 2.62 |
| Single Female/Mother | 794 (26.3%) | 3.12 |
| Total Families | 3,022 (100.0%) | 3.32 |
Median Household Size in Justice
The median household size in Justice is 2.78 persons per household, with single female/mother households (794 | 17.6%) accounting for the largest median household size of 3.53 persons per household. non-family households (1,489 | 33.0%) represent the smallest median household size with 1.40 persons per household.
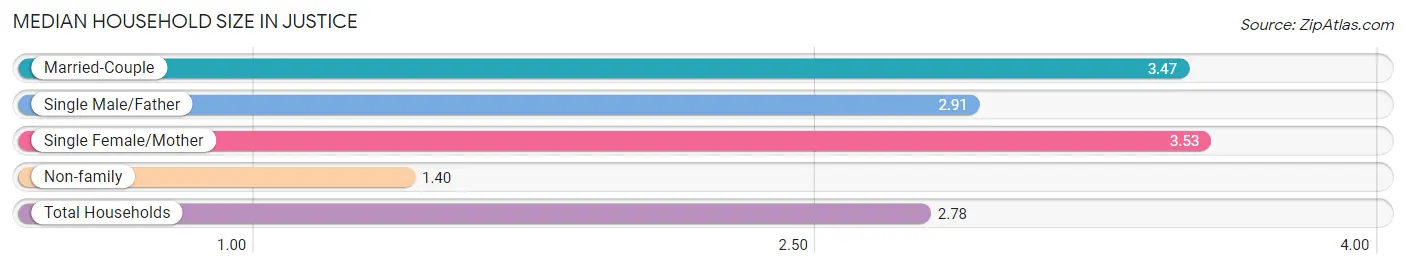
| Household Type | # Households | Household Size |
| Married-Couple | 2,077 (46.0%) | 3.47 |
| Single Male/Father | 151 (3.4%) | 2.91 |
| Single Female/Mother | 794 (17.6%) | 3.53 |
| Non-family | 1,489 (33.0%) | 1.40 |
| Total Households | 4,511 (100.0%) | 2.78 |
Household Size by Marriage Status in Justice
Out of a total of 4,511 households in Justice, 3,022 (67.0%) are family households, while 1,489 (33.0%) are nonfamily households. The most numerous type of family households are 3-person households, comprising 1,054, and the most common type of nonfamily households are 1-person households, comprising 1,237.
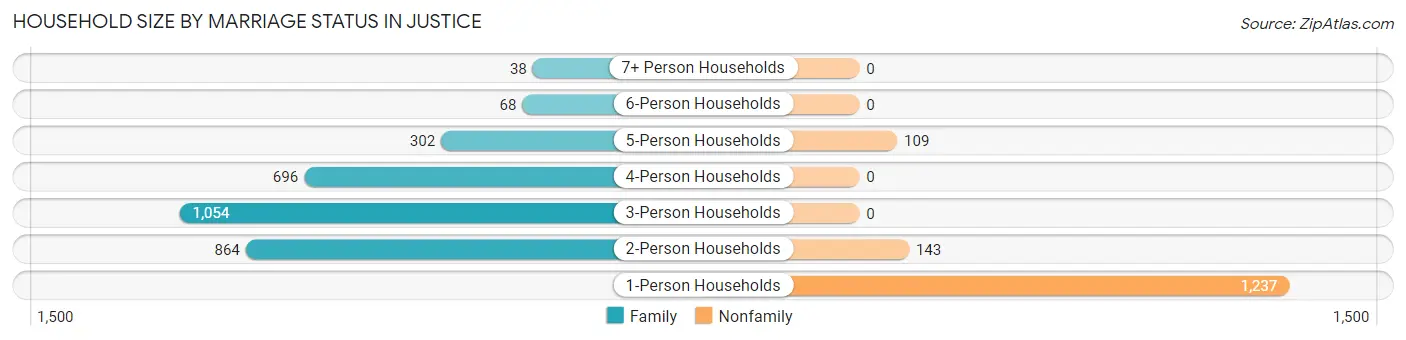
| Household Size | Family Households | Nonfamily Households |
| 1-Person Households | - | 1,237 (27.4%) |
| 2-Person Households | 864 (19.2%) | 143 (3.2%) |
| 3-Person Households | 1,054 (23.4%) | 0 (0.0%) |
| 4-Person Households | 696 (15.4%) | 0 (0.0%) |
| 5-Person Households | 302 (6.7%) | 109 (2.4%) |
| 6-Person Households | 68 (1.5%) | 0 (0.0%) |
| 7+ Person Households | 38 (0.8%) | 0 (0.0%) |
| Total | 3,022 (67.0%) | 1,489 (33.0%) |
Female Fertility in Justice
Fertility by Age in Justice
Average fertility rate in Justice is 71.0 births per 1,000 women. Women in the age bracket of 20 to 34 years have the highest fertility rate with 96.0 births per 1,000 women. Women in the age bracket of 20 to 34 years acount for 62.2% of all women with births.
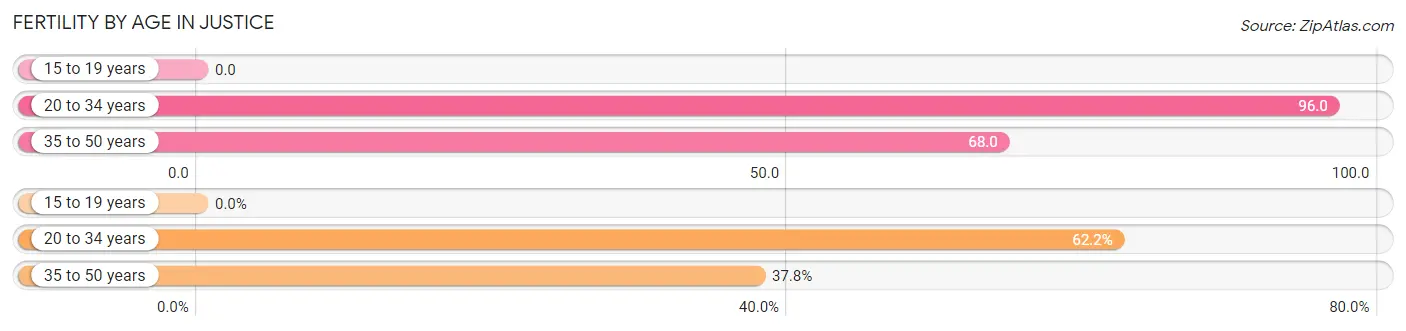
| Age Bracket | Women with Births | Births / 1,000 Women |
| 15 to 19 years | 0 (0.0%) | 0.0 |
| 20 to 34 years | 153 (62.2%) | 96.0 |
| 35 to 50 years | 93 (37.8%) | 68.0 |
| Total | 246 (100.0%) | 71.0 |
Fertility by Age by Marriage Status in Justice
78.9% of women with births (246) in Justice are married. The highest percentage of unmarried women with births falls into 20 to 34 years age bracket with 24.8% of them unmarried at the time of birth, while the lowest percentage of unmarried women with births belong to 35 to 50 years age bracket with 15.0% of them unmarried.
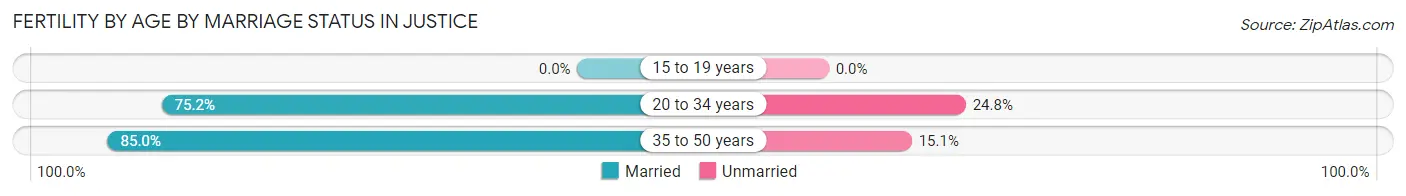
| Age Bracket | Married | Unmarried |
| 15 to 19 years | 0 (0.0%) | 0 (0.0%) |
| 20 to 34 years | 115 (75.2%) | 38 (24.8%) |
| 35 to 50 years | 79 (85.0%) | 14 (15.0%) |
| Total | 194 (78.9%) | 52 (21.1%) |
Fertility by Education in Justice
Average fertility rate in Justice is 71.0 births per 1,000 women. Women with the education attainment of less than high school have the highest fertility rate of 176.0 births per 1,000 women, while women with the education attainment of bachelor's degree have the lowest fertility at 18.0 births per 1,000 women. Women with the education attainment of less than high school represent 37.4% of all women with births.
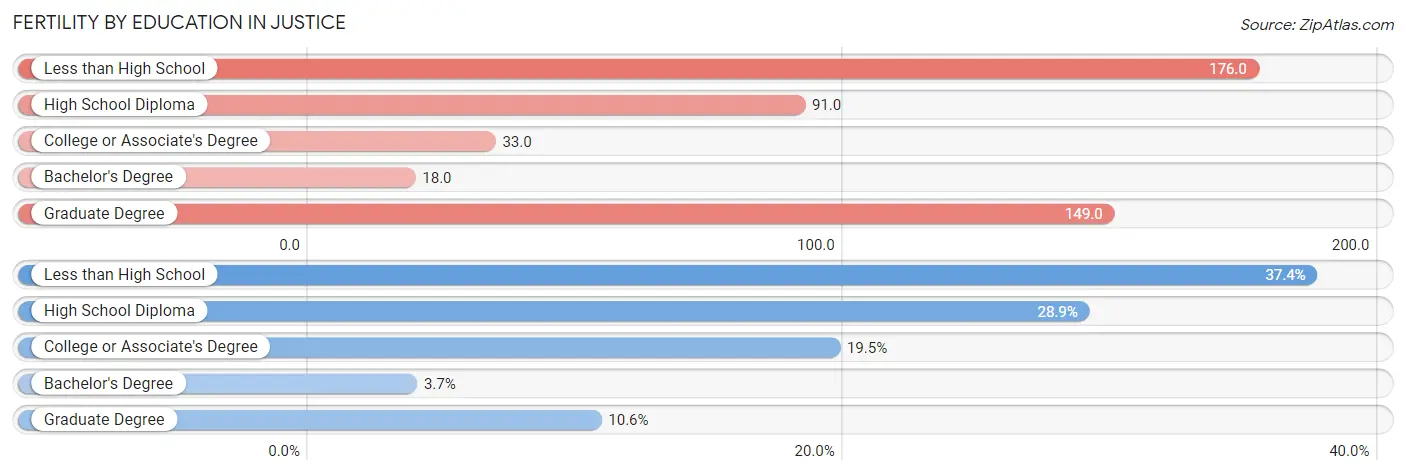
| Educational Attainment | Women with Births | Births / 1,000 Women |
| Less than High School | 92 (37.4%) | 176.0 |
| High School Diploma | 71 (28.9%) | 91.0 |
| College or Associate's Degree | 48 (19.5%) | 33.0 |
| Bachelor's Degree | 9 (3.7%) | 18.0 |
| Graduate Degree | 26 (10.6%) | 149.0 |
| Total | 246 (100.0%) | 71.0 |
Fertility by Education by Marriage Status in Justice
21.1% of women with births in Justice are unmarried. Women with the educational attainment of college or associate's degree are most likely to be married with 100.0% of them married at childbirth, while women with the educational attainment of bachelor's degree are least likely to be married with 100.0% of them unmarried at childbirth.
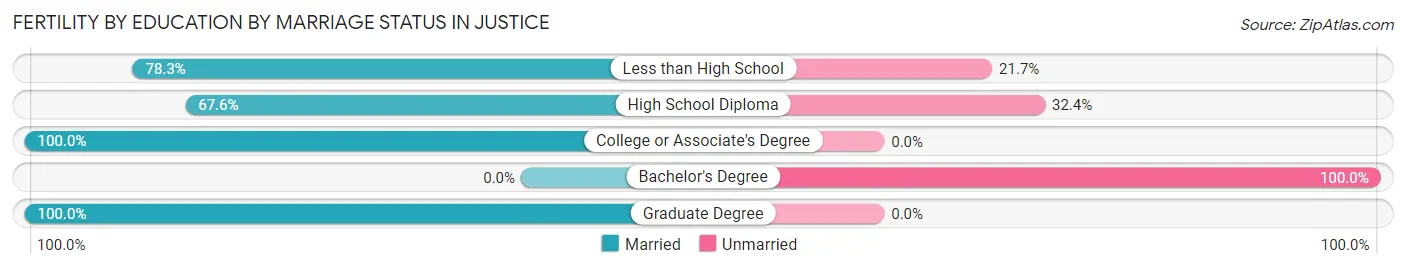
| Educational Attainment | Married | Unmarried |
| Less than High School | 72 (78.3%) | 20 (21.7%) |
| High School Diploma | 48 (67.6%) | 23 (32.4%) |
| College or Associate's Degree | 48 (100.0%) | 0 (0.0%) |
| Bachelor's Degree | 0 (0.0%) | 9 (100.0%) |
| Graduate Degree | 26 (100.0%) | 0 (0.0%) |
| Total | 194 (78.9%) | 52 (21.1%) |
Employment Characteristics in Justice
Employment by Class of Employer in Justice
Among the 5,977 employed individuals in Justice, private company employees (4,441 | 74.3%), not-for-profit organizations (579 | 9.7%), and self-employed (incorporated) (490 | 8.2%) make up the most common classes of employment.
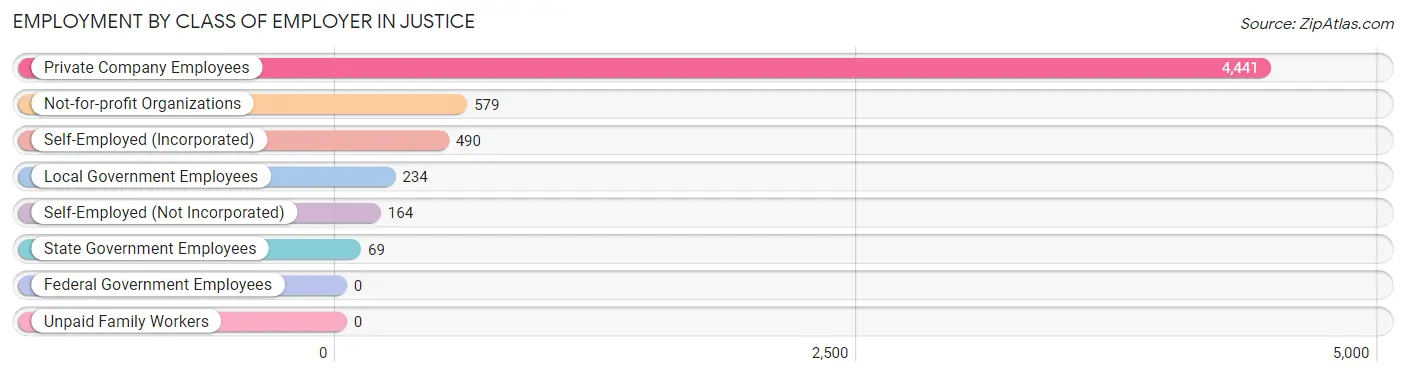
| Employer Class | # Employees | % Employees |
| Private Company Employees | 4,441 | 74.3% |
| Self-Employed (Incorporated) | 490 | 8.2% |
| Self-Employed (Not Incorporated) | 164 | 2.7% |
| Not-for-profit Organizations | 579 | 9.7% |
| Local Government Employees | 234 | 3.9% |
| State Government Employees | 69 | 1.1% |
| Federal Government Employees | 0 | 0.0% |
| Unpaid Family Workers | 0 | 0.0% |
| Total | 5,977 | 100.0% |
Employment Status by Age in Justice
According to the labor force statistics for Justice, out of the total population over 16 years of age (9,764), 69.0% or 6,737 individuals are in the labor force, with 5.0% or 337 of them unemployed. The age group with the highest labor force participation rate is 20 to 24 years, with 89.4% or 1,446 individuals in the labor force. Within the labor force, the 16 to 19 years age range has the highest percentage of unemployed individuals, with 28.1% or 79 of them being unemployed.
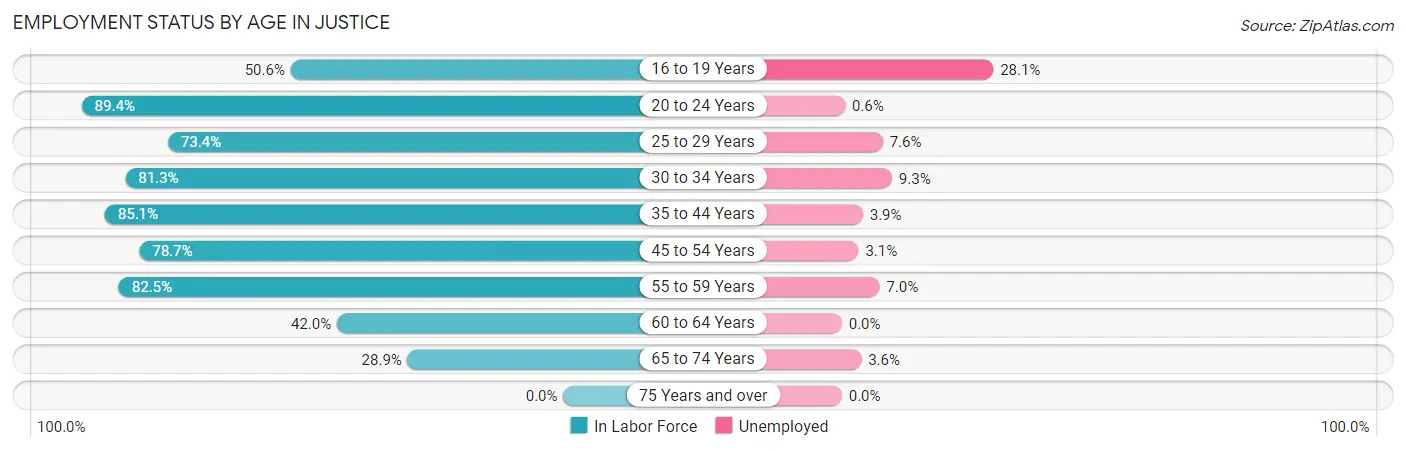
| Age Bracket | In Labor Force | Unemployed |
| 16 to 19 Years | 281 (50.6%) | 79 (28.1%) |
| 20 to 24 Years | 1,446 (89.4%) | 9 (0.6%) |
| 25 to 29 Years | 805 (73.4%) | 61 (7.6%) |
| 30 to 34 Years | 536 (81.3%) | 50 (9.3%) |
| 35 to 44 Years | 1,756 (85.1%) | 68 (3.9%) |
| 45 to 54 Years | 928 (78.7%) | 29 (3.1%) |
| 55 to 59 Years | 444 (82.5%) | 31 (7.0%) |
| 60 to 64 Years | 268 (42.0%) | 0 (0.0%) |
| 65 to 74 Years | 277 (28.9%) | 10 (3.6%) |
| 75 Years and over | 0 (0.0%) | 0 (0.0%) |
| Total | 6,737 (69.0%) | 337 (5.0%) |
Employment Status by Educational Attainment in Justice
According to labor force statistics for Justice, 76.7% of individuals (4,736) out of the total population between 25 and 64 years of age (6,175) are in the labor force, with 5.1% or 242 of them being unemployed. The group with the highest labor force participation rate are those with the educational attainment of bachelor's degree or higher, with 90.6% or 1,055 individuals in the labor force. Within the labor force, individuals with college / associate degree education have the highest percentage of unemployment, with 6.9% or 142 of them being unemployed.
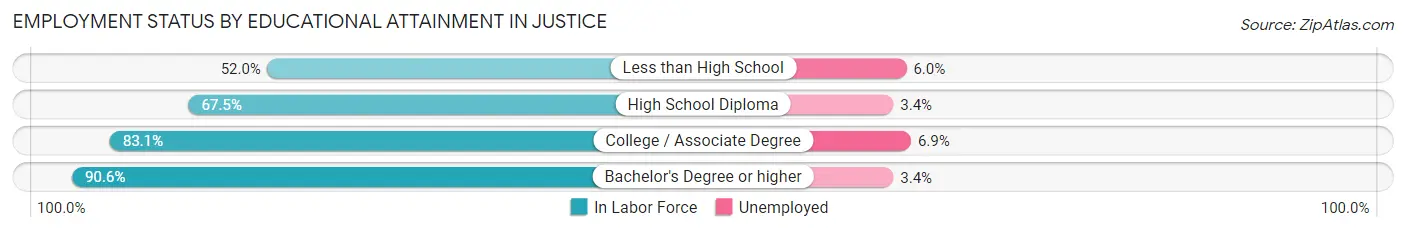
| Educational Attainment | In Labor Force | Unemployed |
| Less than High School | 284 (52.0%) | 33 (6.0%) |
| High School Diploma | 1,348 (67.5%) | 68 (3.4%) |
| College / Associate Degree | 2,051 (83.1%) | 170 (6.9%) |
| Bachelor's Degree or higher | 1,055 (90.6%) | 40 (3.4%) |
| Total | 4,736 (76.7%) | 315 (5.1%) |
Employment Occupations by Sex in Justice
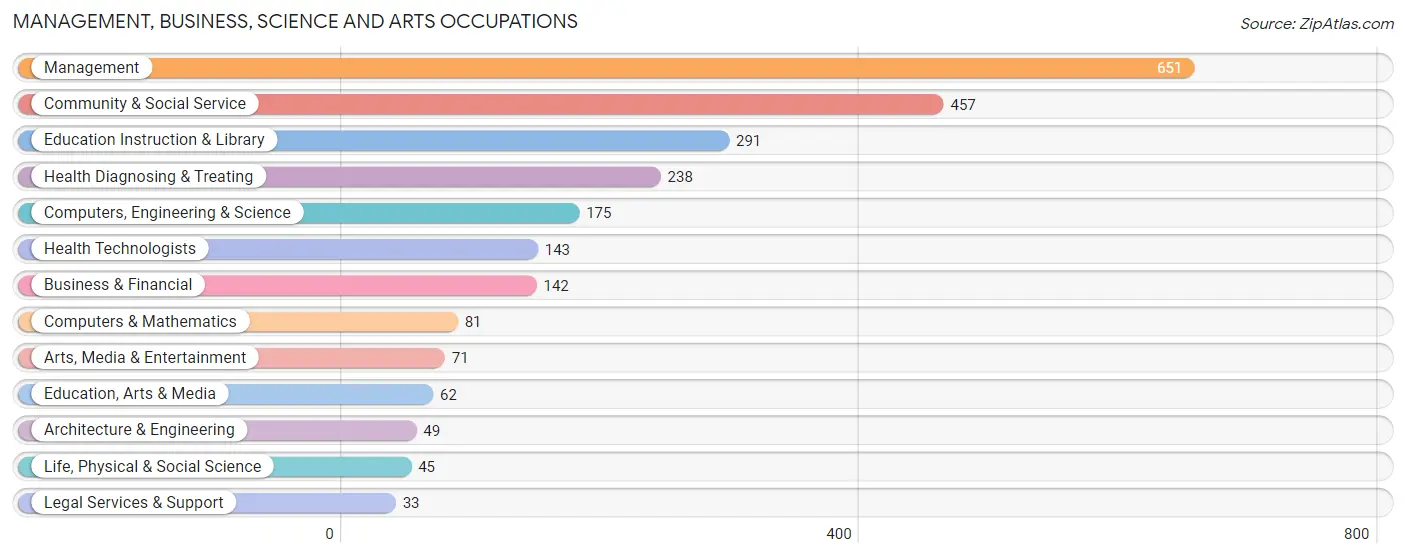
Management, Business, Science and Arts Occupations
The most common Management, Business, Science and Arts occupations in Justice are Management (651 | 10.2%), Community & Social Service (457 | 7.1%), Education Instruction & Library (291 | 4.5%), Health Diagnosing & Treating (238 | 3.7%), and Computers, Engineering & Science (175 | 2.7%).
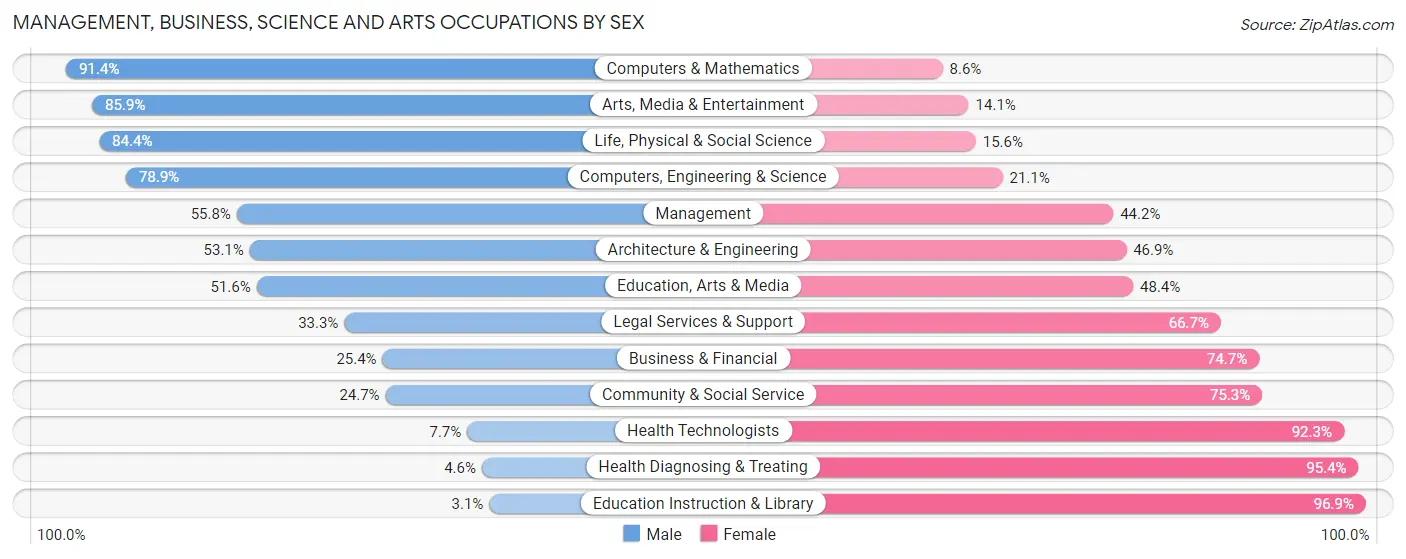
Management, Business, Science and Arts Occupations by Sex
Within the Management, Business, Science and Arts occupations in Justice, the most male-oriented occupations are Computers & Mathematics (91.4%), Arts, Media & Entertainment (85.9%), and Life, Physical & Social Science (84.4%), while the most female-oriented occupations are Education Instruction & Library (96.9%), Health Diagnosing & Treating (95.4%), and Health Technologists (92.3%).
| Occupation | Male | Female |
| Management | 363 (55.8%) | 288 (44.2%) |
| Business & Financial | 36 (25.4%) | 106 (74.7%) |
| Computers, Engineering & Science | 138 (78.9%) | 37 (21.1%) |
| Computers & Mathematics | 74 (91.4%) | 7 (8.6%) |
| Architecture & Engineering | 26 (53.1%) | 23 (46.9%) |
| Life, Physical & Social Science | 38 (84.4%) | 7 (15.6%) |
| Community & Social Service | 113 (24.7%) | 344 (75.3%) |
| Education, Arts & Media | 32 (51.6%) | 30 (48.4%) |
| Legal Services & Support | 11 (33.3%) | 22 (66.7%) |
| Education Instruction & Library | 9 (3.1%) | 282 (96.9%) |
| Arts, Media & Entertainment | 61 (85.9%) | 10 (14.1%) |
| Health Diagnosing & Treating | 11 (4.6%) | 227 (95.4%) |
| Health Technologists | 11 (7.7%) | 132 (92.3%) |
| Total (Category) | 661 (39.8%) | 1,002 (60.3%) |
| Total (Overall) | 3,556 (55.5%) | 2,848 (44.5%) |
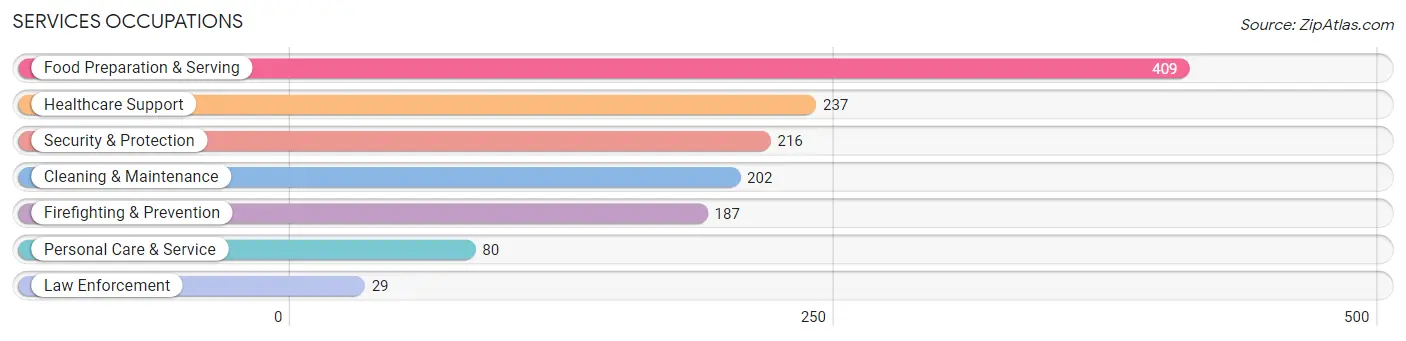
Services Occupations
The most common Services occupations in Justice are Food Preparation & Serving (409 | 6.4%), Healthcare Support (237 | 3.7%), Security & Protection (216 | 3.4%), Cleaning & Maintenance (202 | 3.2%), and Firefighting & Prevention (187 | 2.9%).
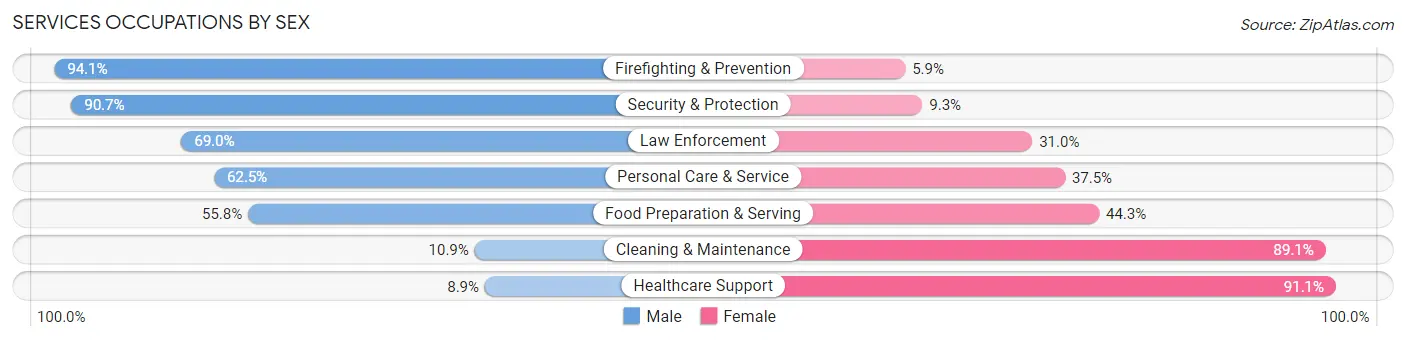
Services Occupations by Sex
Within the Services occupations in Justice, the most male-oriented occupations are Firefighting & Prevention (94.1%), Security & Protection (90.7%), and Law Enforcement (69.0%), while the most female-oriented occupations are Healthcare Support (91.1%), Cleaning & Maintenance (89.1%), and Food Preparation & Serving (44.3%).
| Occupation | Male | Female |
| Healthcare Support | 21 (8.9%) | 216 (91.1%) |
| Security & Protection | 196 (90.7%) | 20 (9.3%) |
| Firefighting & Prevention | 176 (94.1%) | 11 (5.9%) |
| Law Enforcement | 20 (69.0%) | 9 (31.0%) |
| Food Preparation & Serving | 228 (55.7%) | 181 (44.3%) |
| Cleaning & Maintenance | 22 (10.9%) | 180 (89.1%) |
| Personal Care & Service | 50 (62.5%) | 30 (37.5%) |
| Total (Category) | 517 (45.2%) | 627 (54.8%) |
| Total (Overall) | 3,556 (55.5%) | 2,848 (44.5%) |
Sales and Office Occupations
The most common Sales and Office occupations in Justice are Sales & Related (1,232 | 19.2%), and Office & Administration (506 | 7.9%).

Sales and Office Occupations by Sex

| Occupation | Male | Female |
| Sales & Related | 719 (58.4%) | 513 (41.6%) |
| Office & Administration | 98 (19.4%) | 408 (80.6%) |
| Total (Category) | 817 (47.0%) | 921 (53.0%) |
| Total (Overall) | 3,556 (55.5%) | 2,848 (44.5%) |
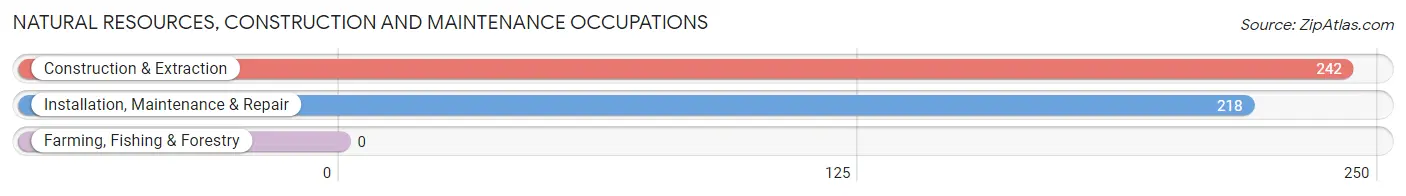
Natural Resources, Construction and Maintenance Occupations
The most common Natural Resources, Construction and Maintenance occupations in Justice are Construction & Extraction (242 | 3.8%), and Installation, Maintenance & Repair (218 | 3.4%).
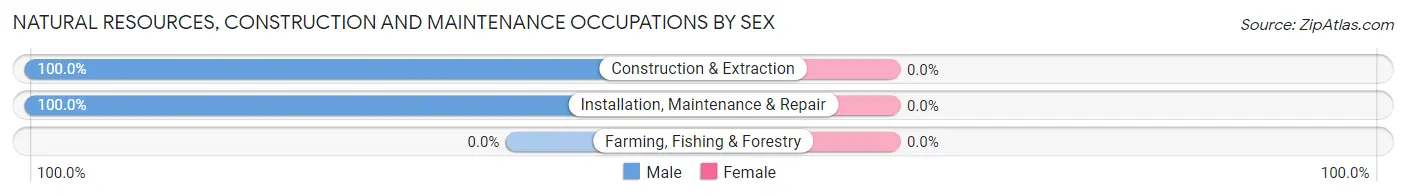
Natural Resources, Construction and Maintenance Occupations by Sex
| Occupation | Male | Female |
| Farming, Fishing & Forestry | 0 (0.0%) | 0 (0.0%) |
| Construction & Extraction | 242 (100.0%) | 0 (0.0%) |
| Installation, Maintenance & Repair | 218 (100.0%) | 0 (0.0%) |
| Total (Category) | 460 (100.0%) | 0 (0.0%) |
| Total (Overall) | 3,556 (55.5%) | 2,848 (44.5%) |
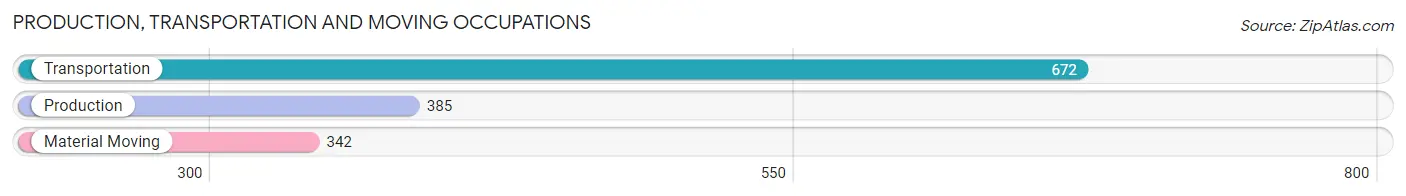
Production, Transportation and Moving Occupations
The most common Production, Transportation and Moving occupations in Justice are Transportation (672 | 10.5%), Production (385 | 6.0%), and Material Moving (342 | 5.3%).
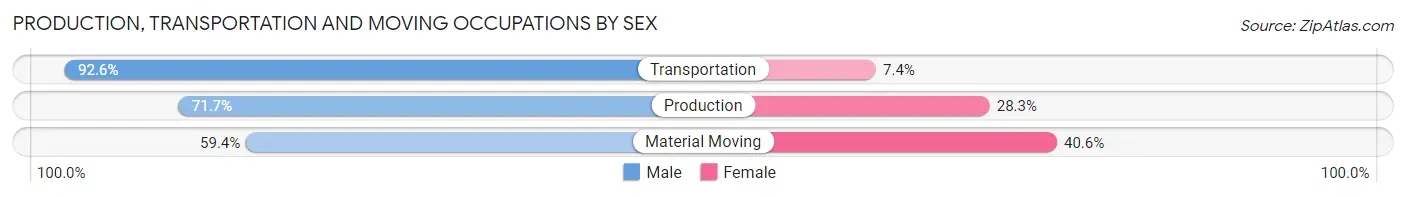
Production, Transportation and Moving Occupations by Sex
| Occupation | Male | Female |
| Production | 276 (71.7%) | 109 (28.3%) |
| Transportation | 622 (92.6%) | 50 (7.4%) |
| Material Moving | 203 (59.4%) | 139 (40.6%) |
| Total (Category) | 1,101 (78.7%) | 298 (21.3%) |
| Total (Overall) | 3,556 (55.5%) | 2,848 (44.5%) |
Employment Industries by Sex in Justice
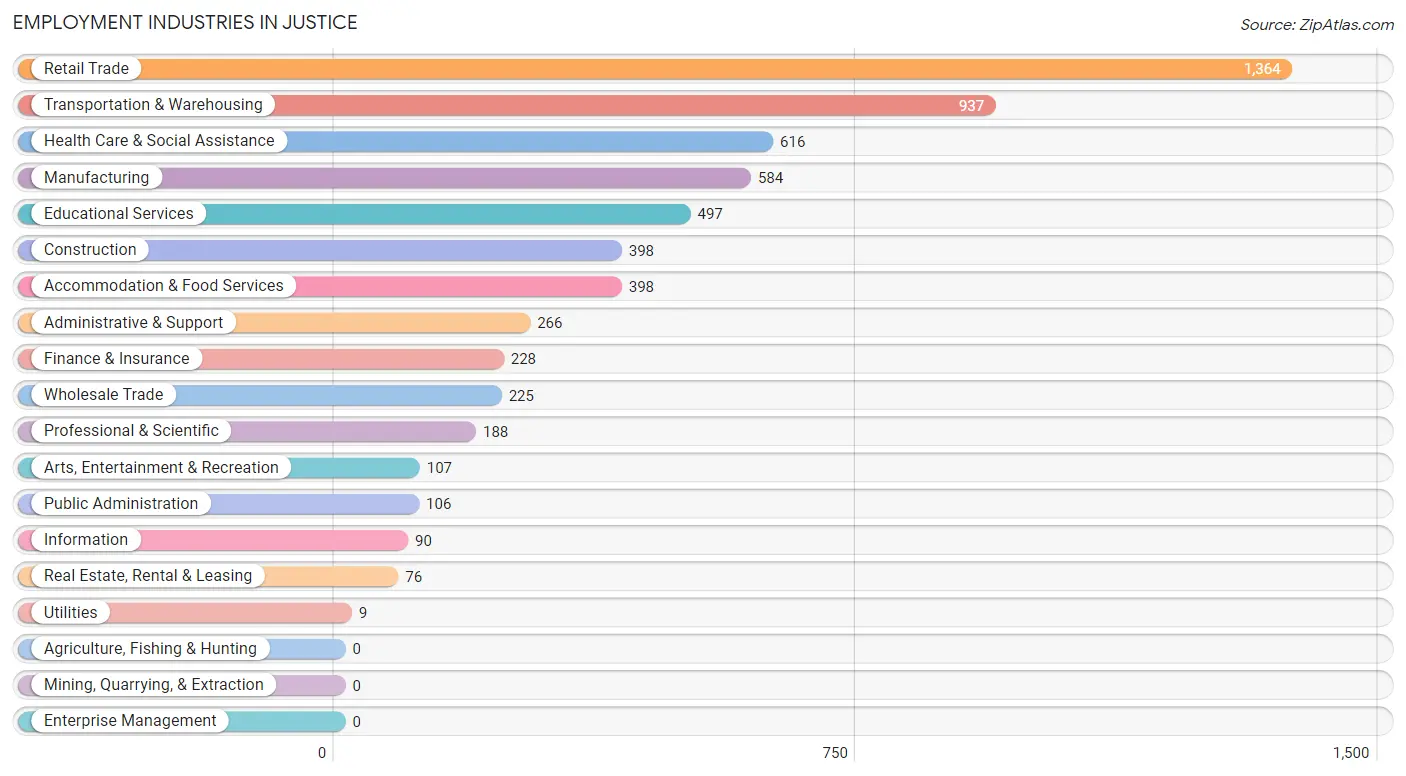
Employment Industries in Justice
The major employment industries in Justice include Retail Trade (1,364 | 21.3%), Transportation & Warehousing (937 | 14.6%), Health Care & Social Assistance (616 | 9.6%), Manufacturing (584 | 9.1%), and Educational Services (497 | 7.8%).
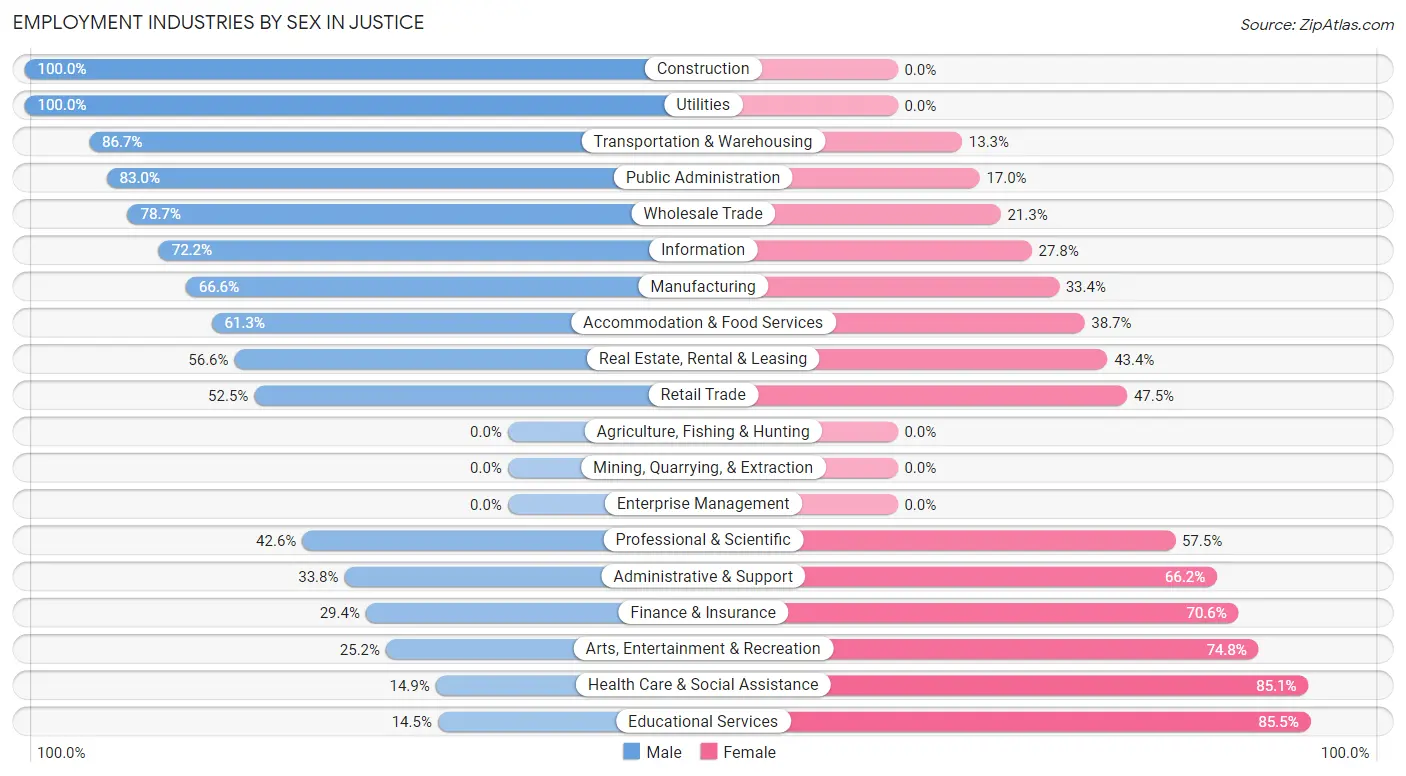
Employment Industries by Sex in Justice
The Justice industries that see more men than women are Construction (100.0%), Utilities (100.0%), and Transportation & Warehousing (86.7%), whereas the industries that tend to have a higher number of women are Educational Services (85.5%), Health Care & Social Assistance (85.1%), and Arts, Entertainment & Recreation (74.8%).
| Industry | Male | Female |
| Agriculture, Fishing & Hunting | 0 (0.0%) | 0 (0.0%) |
| Mining, Quarrying, & Extraction | 0 (0.0%) | 0 (0.0%) |
| Construction | 398 (100.0%) | 0 (0.0%) |
| Manufacturing | 389 (66.6%) | 195 (33.4%) |
| Wholesale Trade | 177 (78.7%) | 48 (21.3%) |
| Retail Trade | 716 (52.5%) | 648 (47.5%) |
| Transportation & Warehousing | 812 (86.7%) | 125 (13.3%) |
| Utilities | 9 (100.0%) | 0 (0.0%) |
| Information | 65 (72.2%) | 25 (27.8%) |
| Finance & Insurance | 67 (29.4%) | 161 (70.6%) |
| Real Estate, Rental & Leasing | 43 (56.6%) | 33 (43.4%) |
| Professional & Scientific | 80 (42.5%) | 108 (57.5%) |
| Enterprise Management | 0 (0.0%) | 0 (0.0%) |
| Administrative & Support | 90 (33.8%) | 176 (66.2%) |
| Educational Services | 72 (14.5%) | 425 (85.5%) |
| Health Care & Social Assistance | 92 (14.9%) | 524 (85.1%) |
| Arts, Entertainment & Recreation | 27 (25.2%) | 80 (74.8%) |
| Accommodation & Food Services | 244 (61.3%) | 154 (38.7%) |
| Public Administration | 88 (83.0%) | 18 (17.0%) |
| Total | 3,556 (55.5%) | 2,848 (44.5%) |
Education in Justice
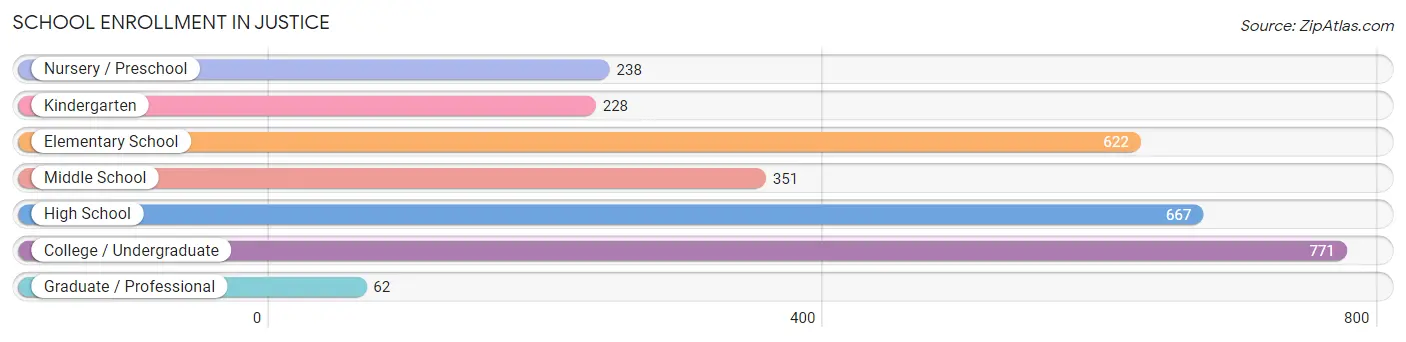
School Enrollment in Justice
The most common levels of schooling among the 2,939 students in Justice are college / undergraduate (771 | 26.2%), high school (667 | 22.7%), and elementary school (622 | 21.2%).
| School Level | # Students | % Students |
| Nursery / Preschool | 238 | 8.1% |
| Kindergarten | 228 | 7.8% |
| Elementary School | 622 | 21.2% |
| Middle School | 351 | 11.9% |
| High School | 667 | 22.7% |
| College / Undergraduate | 771 | 26.2% |
| Graduate / Professional | 62 | 2.1% |
| Total | 2,939 | 100.0% |
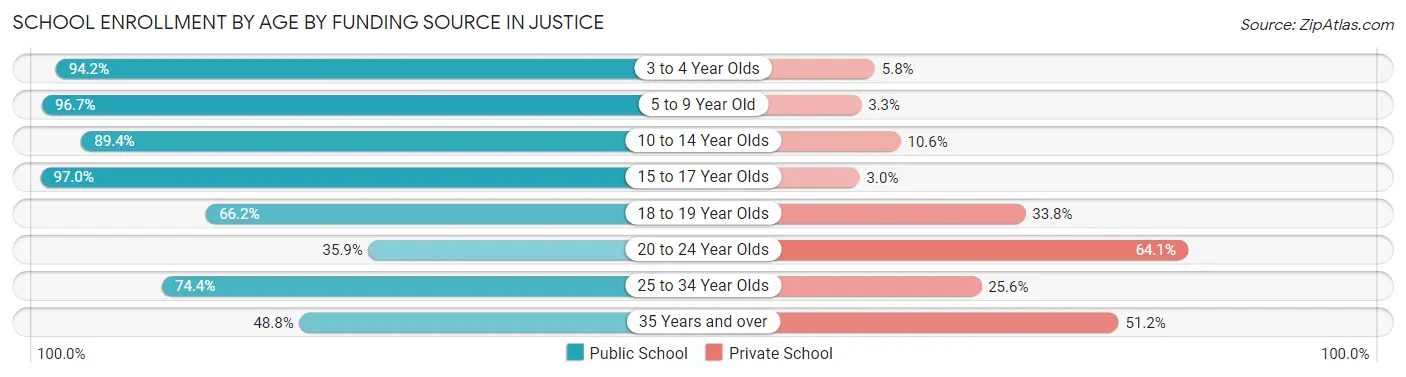
School Enrollment by Age by Funding Source in Justice
Out of a total of 2,939 students who are enrolled in schools in Justice, 579 (19.7%) attend a private institution, while the remaining 2,360 (80.3%) are enrolled in public schools. The age group of 20 to 24 year olds has the highest likelihood of being enrolled in private schools, with 239 (64.1% in the age bracket) enrolled. Conversely, the age group of 15 to 17 year olds has the lowest likelihood of being enrolled in a private school, with 391 (97.0% in the age bracket) attending a public institution.
| Age Bracket | Public School | Private School |
| 3 to 4 Year Olds | 227 (94.2%) | 14 (5.8%) |
| 5 to 9 Year Old | 619 (96.7%) | 21 (3.3%) |
| 10 to 14 Year Olds | 557 (89.4%) | 66 (10.6%) |
| 15 to 17 Year Olds | 391 (97.0%) | 12 (3.0%) |
| 18 to 19 Year Olds | 219 (66.2%) | 112 (33.8%) |
| 20 to 24 Year Olds | 134 (35.9%) | 239 (64.1%) |
| 25 to 34 Year Olds | 151 (74.4%) | 52 (25.6%) |
| 35 Years and over | 61 (48.8%) | 64 (51.2%) |
| Total | 2,360 (80.3%) | 579 (19.7%) |
Educational Attainment by Field of Study in Justice
Business (265 | 20.1%), education (167 | 12.6%), social sciences (152 | 11.5%), psychology (109 | 8.3%), and computers & mathematics (93 | 7.0%) are the most common fields of study among 1,322 individuals in Justice who have obtained a bachelor's degree or higher.
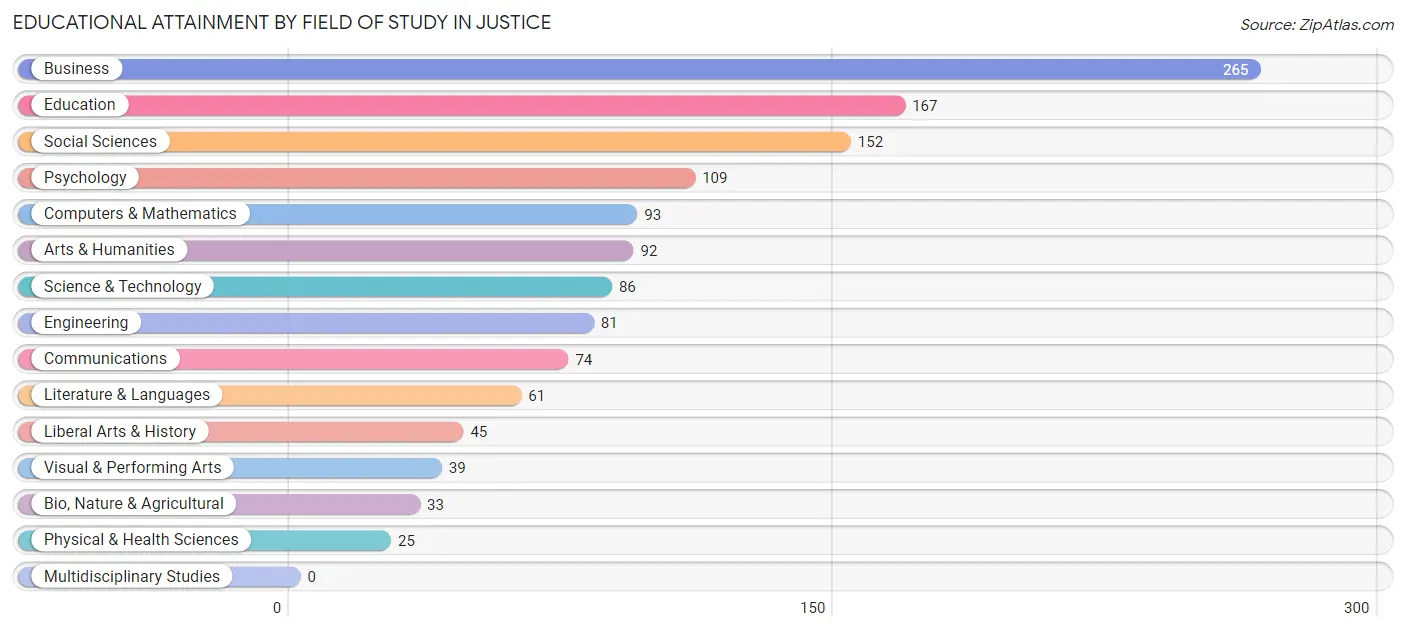
| Field of Study | # Graduates | % Graduates |
| Computers & Mathematics | 93 | 7.0% |
| Bio, Nature & Agricultural | 33 | 2.5% |
| Physical & Health Sciences | 25 | 1.9% |
| Psychology | 109 | 8.3% |
| Social Sciences | 152 | 11.5% |
| Engineering | 81 | 6.1% |
| Multidisciplinary Studies | 0 | 0.0% |
| Science & Technology | 86 | 6.5% |
| Business | 265 | 20.1% |
| Education | 167 | 12.6% |
| Literature & Languages | 61 | 4.6% |
| Liberal Arts & History | 45 | 3.4% |
| Visual & Performing Arts | 39 | 2.9% |
| Communications | 74 | 5.6% |
| Arts & Humanities | 92 | 7.0% |
| Total | 1,322 | 100.0% |
Transportation & Commute in Justice
Vehicle Availability by Sex in Justice
The most prevalent vehicle ownership categories in Justice are males with 3 vehicles (1,181, accounting for 35.6%) and females with 3 vehicles (567, making up 44.5%).
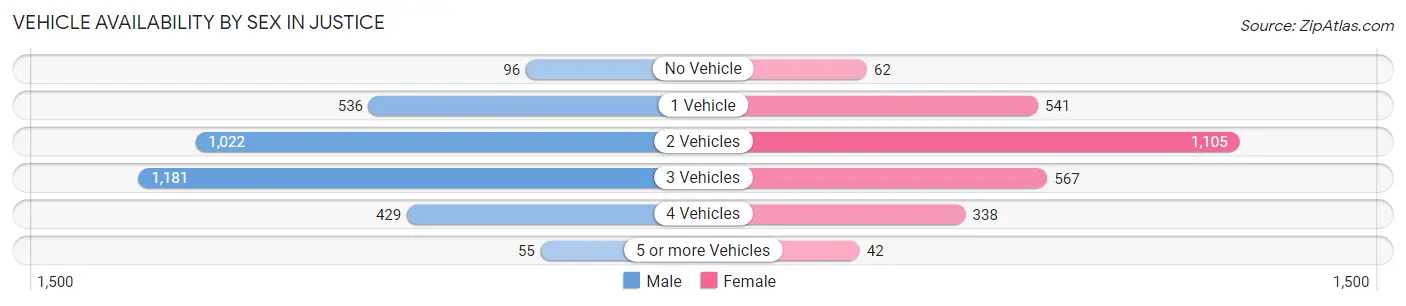
| Vehicles Available | Male | Female |
| No Vehicle | 96 (2.9%) | 62 (2.3%) |
| 1 Vehicle | 536 (16.2%) | 541 (20.4%) |
| 2 Vehicles | 1,022 (30.8%) | 1,105 (41.6%) |
| 3 Vehicles | 1,181 (35.6%) | 567 (21.4%) |
| 4 Vehicles | 429 (12.9%) | 338 (12.7%) |
| 5 or more Vehicles | 55 (1.7%) | 42 (1.6%) |
| Total | 3,319 (100.0%) | 2,655 (100.0%) |
Commute Time in Justice
The most frequently occuring commute durations in Justice are 30 to 34 minutes (1,257 commuters, 22.4%), 15 to 19 minutes (694 commuters, 12.4%), and 10 to 14 minutes (620 commuters, 11.1%).
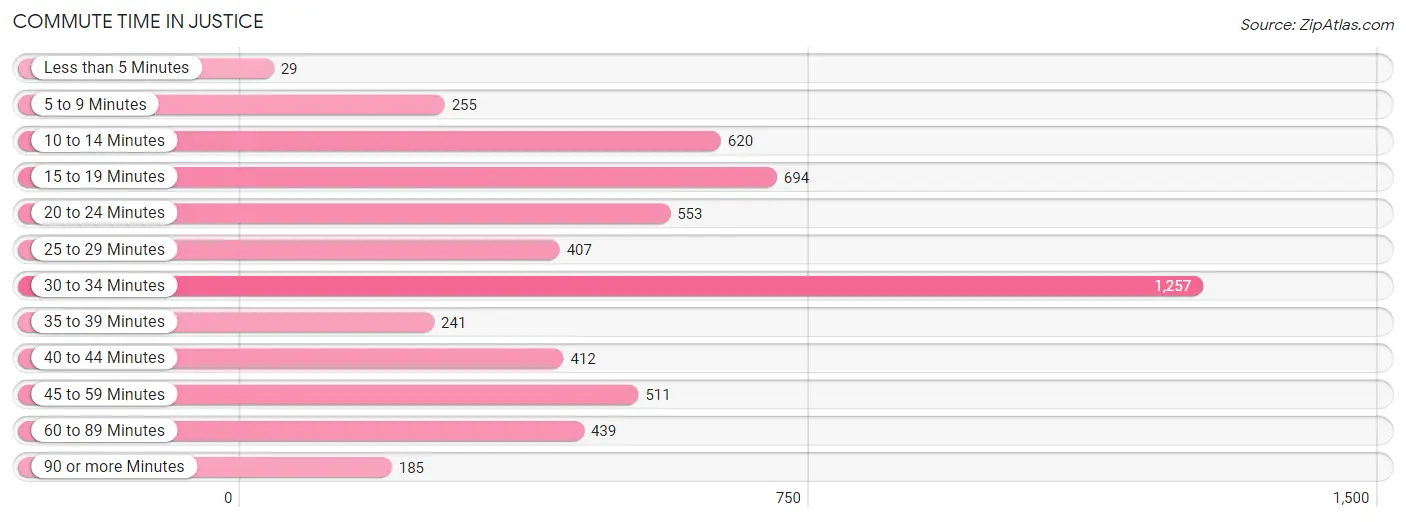
| Commute Time | # Commuters | % Commuters |
| Less than 5 Minutes | 29 | 0.5% |
| 5 to 9 Minutes | 255 | 4.5% |
| 10 to 14 Minutes | 620 | 11.1% |
| 15 to 19 Minutes | 694 | 12.4% |
| 20 to 24 Minutes | 553 | 9.9% |
| 25 to 29 Minutes | 407 | 7.3% |
| 30 to 34 Minutes | 1,257 | 22.4% |
| 35 to 39 Minutes | 241 | 4.3% |
| 40 to 44 Minutes | 412 | 7.3% |
| 45 to 59 Minutes | 511 | 9.1% |
| 60 to 89 Minutes | 439 | 7.8% |
| 90 or more Minutes | 185 | 3.3% |
Commute Time by Sex in Justice
The most common commute times in Justice are 30 to 34 minutes (907 commuters, 28.1%) for males and 15 to 19 minutes (350 commuters, 14.7%) for females.
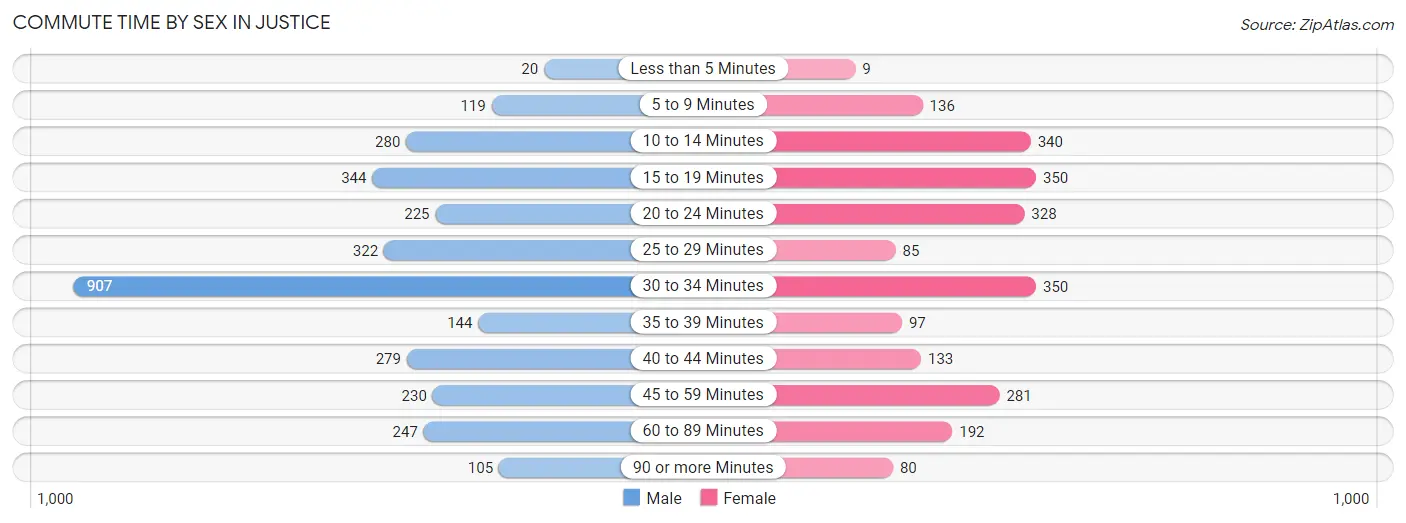
| Commute Time | Male | Female |
| Less than 5 Minutes | 20 (0.6%) | 9 (0.4%) |
| 5 to 9 Minutes | 119 (3.7%) | 136 (5.7%) |
| 10 to 14 Minutes | 280 (8.7%) | 340 (14.3%) |
| 15 to 19 Minutes | 344 (10.7%) | 350 (14.7%) |
| 20 to 24 Minutes | 225 (7.0%) | 328 (13.8%) |
| 25 to 29 Minutes | 322 (10.0%) | 85 (3.6%) |
| 30 to 34 Minutes | 907 (28.1%) | 350 (14.7%) |
| 35 to 39 Minutes | 144 (4.5%) | 97 (4.1%) |
| 40 to 44 Minutes | 279 (8.7%) | 133 (5.6%) |
| 45 to 59 Minutes | 230 (7.1%) | 281 (11.8%) |
| 60 to 89 Minutes | 247 (7.7%) | 192 (8.1%) |
| 90 or more Minutes | 105 (3.3%) | 80 (3.4%) |
Time of Departure to Work by Sex in Justice
The most frequent times of departure to work in Justice are 5:00 AM to 5:29 AM (488, 15.1%) for males and 8:00 AM to 8:29 AM (360, 15.1%) for females.
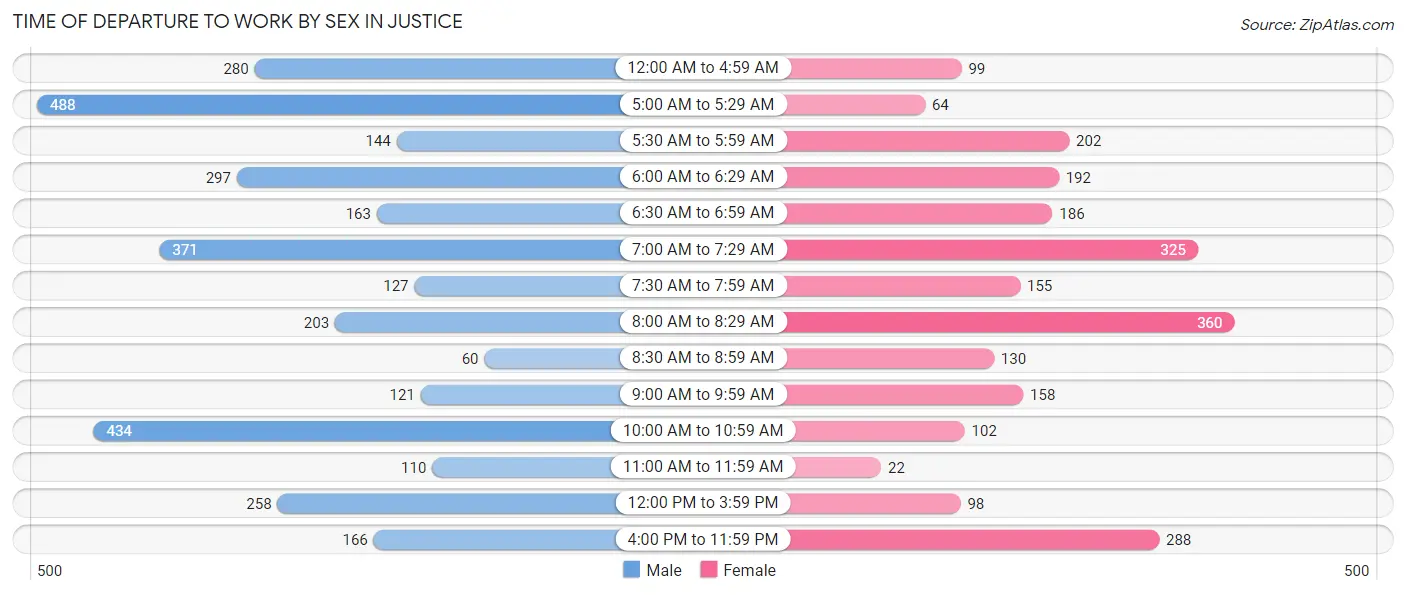
| Time of Departure | Male | Female |
| 12:00 AM to 4:59 AM | 280 (8.7%) | 99 (4.2%) |
| 5:00 AM to 5:29 AM | 488 (15.1%) | 64 (2.7%) |
| 5:30 AM to 5:59 AM | 144 (4.5%) | 202 (8.5%) |
| 6:00 AM to 6:29 AM | 297 (9.2%) | 192 (8.1%) |
| 6:30 AM to 6:59 AM | 163 (5.1%) | 186 (7.8%) |
| 7:00 AM to 7:29 AM | 371 (11.5%) | 325 (13.7%) |
| 7:30 AM to 7:59 AM | 127 (3.9%) | 155 (6.5%) |
| 8:00 AM to 8:29 AM | 203 (6.3%) | 360 (15.1%) |
| 8:30 AM to 8:59 AM | 60 (1.9%) | 130 (5.5%) |
| 9:00 AM to 9:59 AM | 121 (3.8%) | 158 (6.6%) |
| 10:00 AM to 10:59 AM | 434 (13.5%) | 102 (4.3%) |
| 11:00 AM to 11:59 AM | 110 (3.4%) | 22 (0.9%) |
| 12:00 PM to 3:59 PM | 258 (8.0%) | 98 (4.1%) |
| 4:00 PM to 11:59 PM | 166 (5.1%) | 288 (12.1%) |
| Total | 3,222 (100.0%) | 2,381 (100.0%) |
Housing Occupancy in Justice
Occupancy by Ownership in Justice
Of the total 4,511 dwellings in Justice, owner-occupied units account for 2,381 (52.8%), while renter-occupied units make up 2,130 (47.2%).
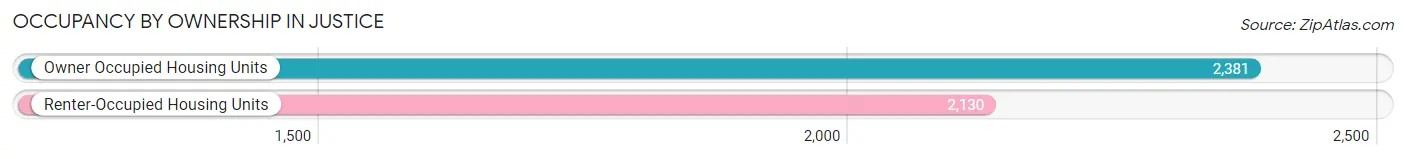
| Occupancy | # Housing Units | % Housing Units |
| Owner Occupied Housing Units | 2,381 | 52.8% |
| Renter-Occupied Housing Units | 2,130 | 47.2% |
| Total Occupied Housing Units | 4,511 | 100.0% |
Occupancy by Household Size in Justice
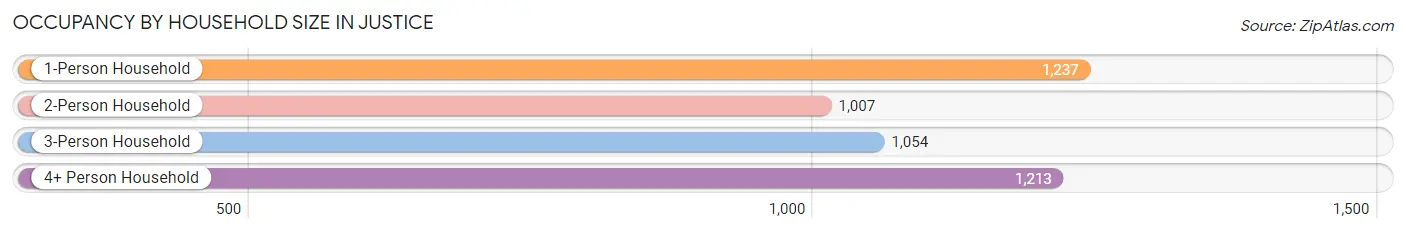
| Household Size | # Housing Units | % Housing Units |
| 1-Person Household | 1,237 | 27.4% |
| 2-Person Household | 1,007 | 22.3% |
| 3-Person Household | 1,054 | 23.4% |
| 4+ Person Household | 1,213 | 26.9% |
| Total Housing Units | 4,511 | 100.0% |
Occupancy by Ownership by Household Size in Justice
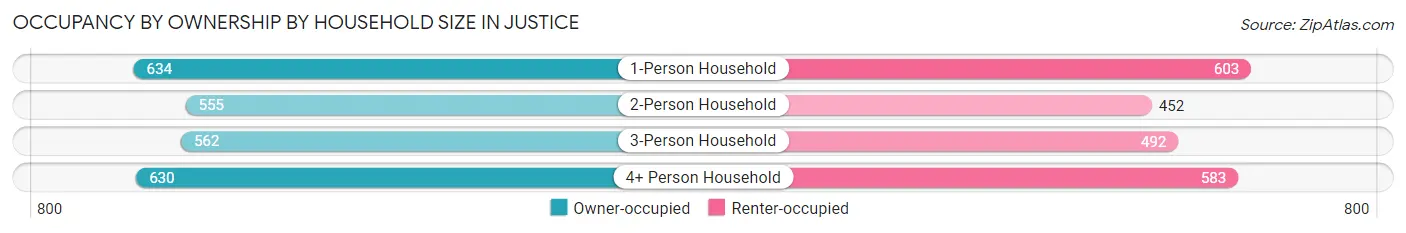
| Household Size | Owner-occupied | Renter-occupied |
| 1-Person Household | 634 (51.2%) | 603 (48.7%) |
| 2-Person Household | 555 (55.1%) | 452 (44.9%) |
| 3-Person Household | 562 (53.3%) | 492 (46.7%) |
| 4+ Person Household | 630 (51.9%) | 583 (48.1%) |
| Total Housing Units | 2,381 (52.8%) | 2,130 (47.2%) |
Occupancy by Educational Attainment in Justice
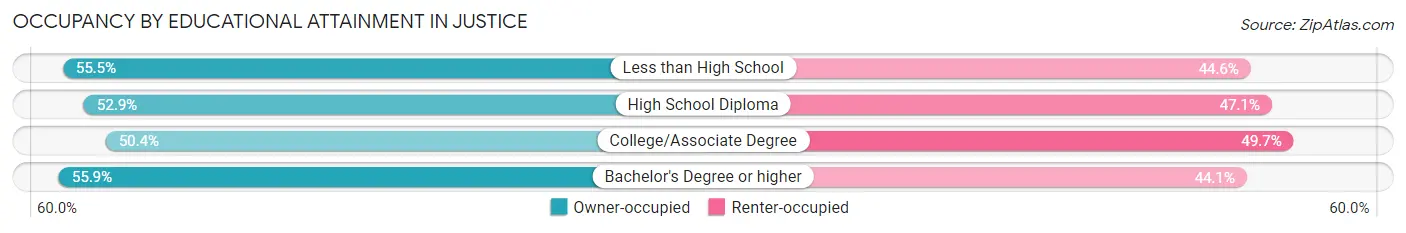
| Household Size | Owner-occupied | Renter-occupied |
| Less than High School | 305 (55.4%) | 245 (44.6%) |
| High School Diploma | 766 (52.9%) | 681 (47.1%) |
| College/Associate Degree | 866 (50.3%) | 854 (49.6%) |
| Bachelor's Degree or higher | 444 (55.9%) | 350 (44.1%) |
Occupancy by Age of Householder in Justice
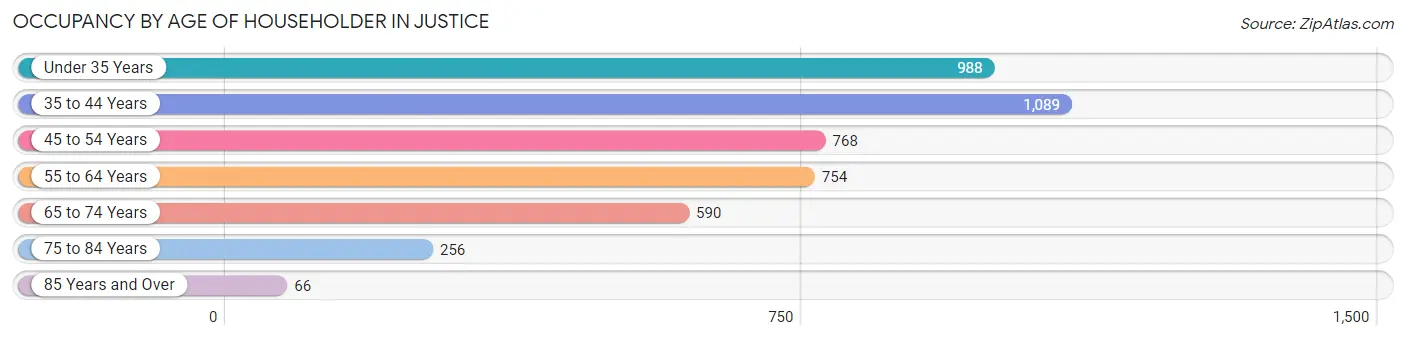
| Age Bracket | # Households | % Households |
| Under 35 Years | 988 | 21.9% |
| 35 to 44 Years | 1,089 | 24.1% |
| 45 to 54 Years | 768 | 17.0% |
| 55 to 64 Years | 754 | 16.7% |
| 65 to 74 Years | 590 | 13.1% |
| 75 to 84 Years | 256 | 5.7% |
| 85 Years and Over | 66 | 1.5% |
| Total | 4,511 | 100.0% |
Housing Finances in Justice
Median Income by Occupancy in Justice
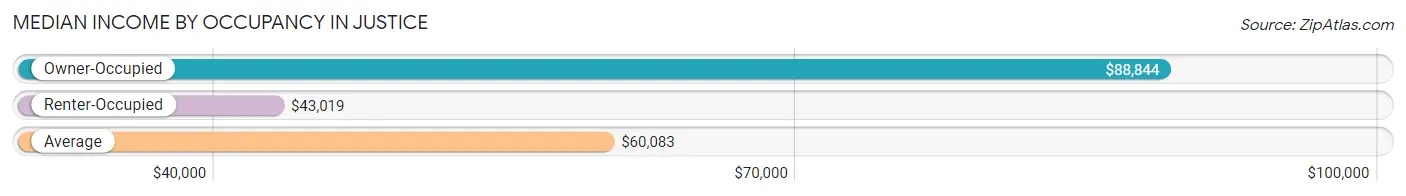
| Occupancy Type | # Households | Median Income |
| Owner-Occupied | 2,381 (52.8%) | $88,844 |
| Renter-Occupied | 2,130 (47.2%) | $43,019 |
| Average | 4,511 (100.0%) | $60,083 |
Occupancy by Householder Income Bracket in Justice
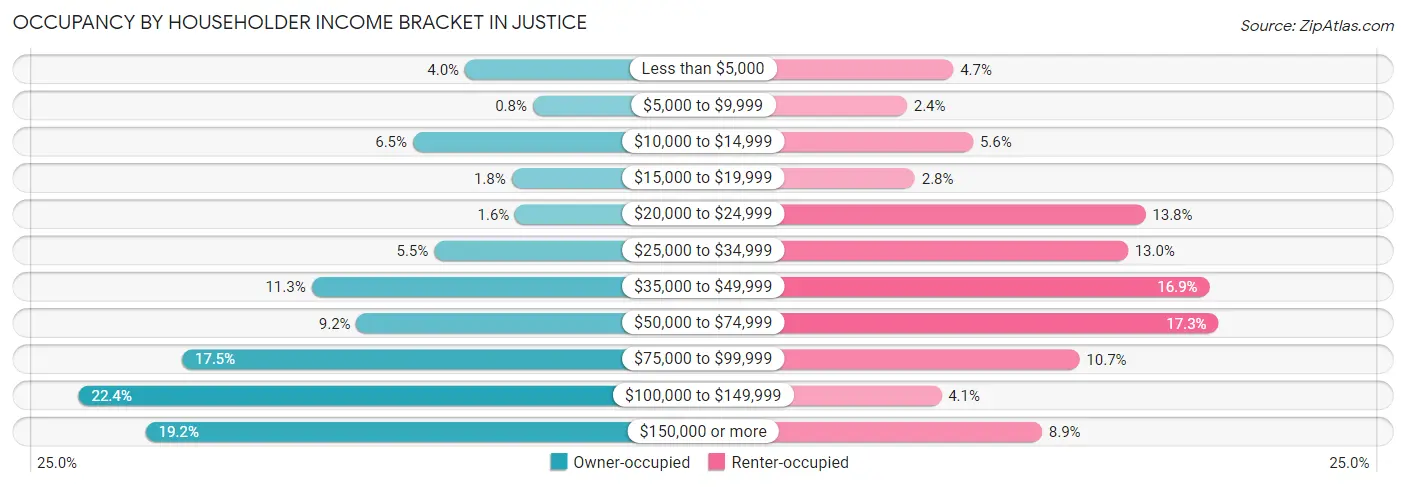
| Income Bracket | Owner-occupied | Renter-occupied |
| Less than $5,000 | 96 (4.0%) | 99 (4.6%) |
| $5,000 to $9,999 | 19 (0.8%) | 52 (2.4%) |
| $10,000 to $14,999 | 155 (6.5%) | 119 (5.6%) |
| $15,000 to $19,999 | 43 (1.8%) | 60 (2.8%) |
| $20,000 to $24,999 | 39 (1.6%) | 294 (13.8%) |
| $25,000 to $34,999 | 131 (5.5%) | 276 (13.0%) |
| $35,000 to $49,999 | 270 (11.3%) | 359 (16.9%) |
| $50,000 to $74,999 | 219 (9.2%) | 368 (17.3%) |
| $75,000 to $99,999 | 417 (17.5%) | 227 (10.7%) |
| $100,000 to $149,999 | 534 (22.4%) | 87 (4.1%) |
| $150,000 or more | 458 (19.2%) | 189 (8.9%) |
| Total | 2,381 (100.0%) | 2,130 (100.0%) |
Monthly Housing Cost Tiers in Justice
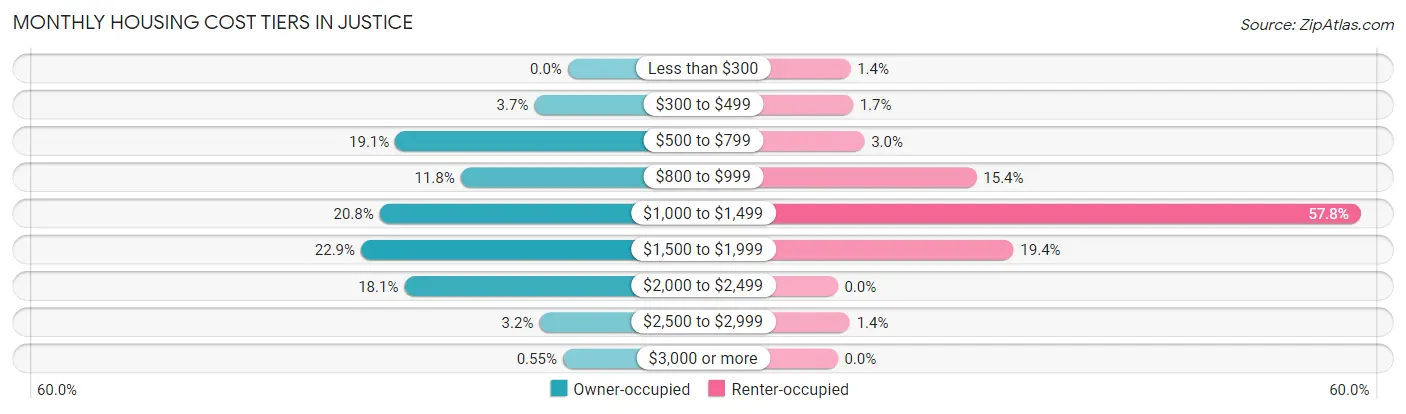
| Monthly Cost | Owner-occupied | Renter-occupied |
| Less than $300 | 0 (0.0%) | 30 (1.4%) |
| $300 to $499 | 88 (3.7%) | 36 (1.7%) |
| $500 to $799 | 454 (19.1%) | 63 (3.0%) |
| $800 to $999 | 282 (11.8%) | 327 (15.3%) |
| $1,000 to $1,499 | 495 (20.8%) | 1,231 (57.8%) |
| $1,500 to $1,999 | 544 (22.9%) | 414 (19.4%) |
| $2,000 to $2,499 | 430 (18.1%) | 0 (0.0%) |
| $2,500 to $2,999 | 75 (3.2%) | 29 (1.4%) |
| $3,000 or more | 13 (0.5%) | 0 (0.0%) |
| Total | 2,381 (100.0%) | 2,130 (100.0%) |
Physical Housing Characteristics in Justice
Housing Structures in Justice
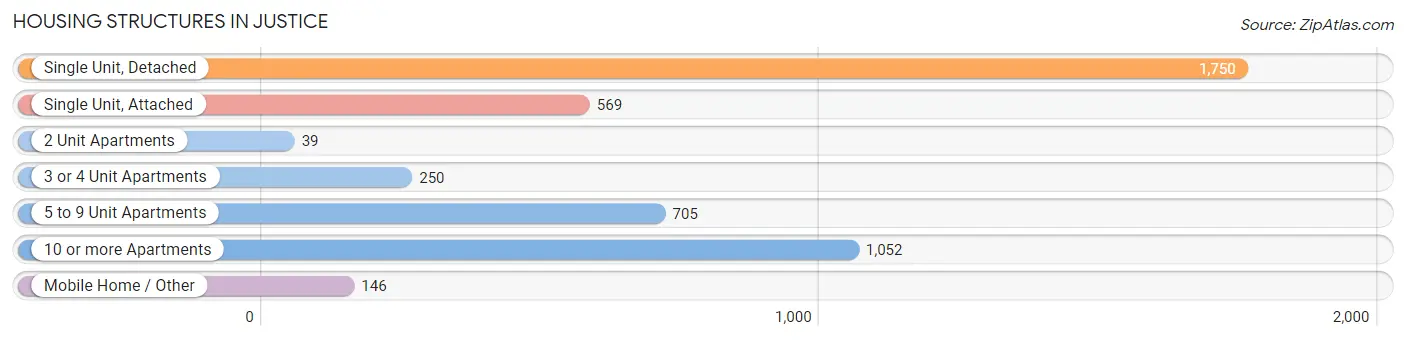
| Structure Type | # Housing Units | % Housing Units |
| Single Unit, Detached | 1,750 | 38.8% |
| Single Unit, Attached | 569 | 12.6% |
| 2 Unit Apartments | 39 | 0.9% |
| 3 or 4 Unit Apartments | 250 | 5.5% |
| 5 to 9 Unit Apartments | 705 | 15.6% |
| 10 or more Apartments | 1,052 | 23.3% |
| Mobile Home / Other | 146 | 3.2% |
| Total | 4,511 | 100.0% |
Housing Structures by Occupancy in Justice
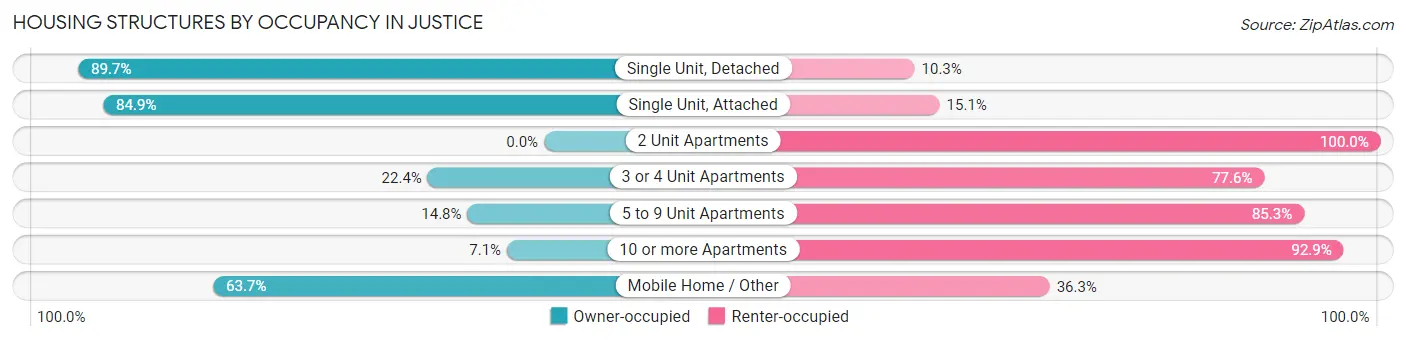
| Structure Type | Owner-occupied | Renter-occupied |
| Single Unit, Detached | 1,570 (89.7%) | 180 (10.3%) |
| Single Unit, Attached | 483 (84.9%) | 86 (15.1%) |
| 2 Unit Apartments | 0 (0.0%) | 39 (100.0%) |
| 3 or 4 Unit Apartments | 56 (22.4%) | 194 (77.6%) |
| 5 to 9 Unit Apartments | 104 (14.7%) | 601 (85.3%) |
| 10 or more Apartments | 75 (7.1%) | 977 (92.9%) |
| Mobile Home / Other | 93 (63.7%) | 53 (36.3%) |
| Total | 2,381 (52.8%) | 2,130 (47.2%) |
Housing Structures by Number of Rooms in Justice
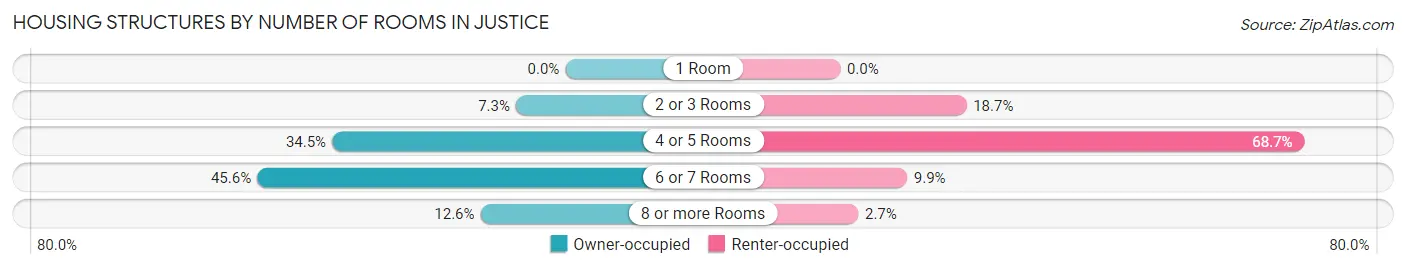
| Number of Rooms | Owner-occupied | Renter-occupied |
| 1 Room | 0 (0.0%) | 0 (0.0%) |
| 2 or 3 Rooms | 174 (7.3%) | 398 (18.7%) |
| 4 or 5 Rooms | 822 (34.5%) | 1,464 (68.7%) |
| 6 or 7 Rooms | 1,086 (45.6%) | 211 (9.9%) |
| 8 or more Rooms | 299 (12.6%) | 57 (2.7%) |
| Total | 2,381 (100.0%) | 2,130 (100.0%) |
Housing Structure by Heating Type in Justice
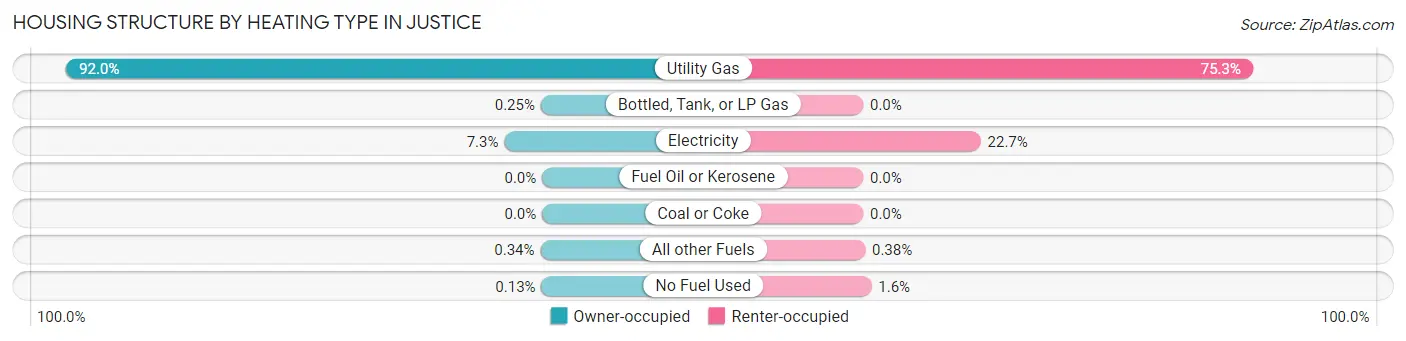
| Heating Type | Owner-occupied | Renter-occupied |
| Utility Gas | 2,190 (92.0%) | 1,604 (75.3%) |
| Bottled, Tank, or LP Gas | 6 (0.3%) | 0 (0.0%) |
| Electricity | 174 (7.3%) | 484 (22.7%) |
| Fuel Oil or Kerosene | 0 (0.0%) | 0 (0.0%) |
| Coal or Coke | 0 (0.0%) | 0 (0.0%) |
| All other Fuels | 8 (0.3%) | 8 (0.4%) |
| No Fuel Used | 3 (0.1%) | 34 (1.6%) |
| Total | 2,381 (100.0%) | 2,130 (100.0%) |
Household Vehicle Usage in Justice
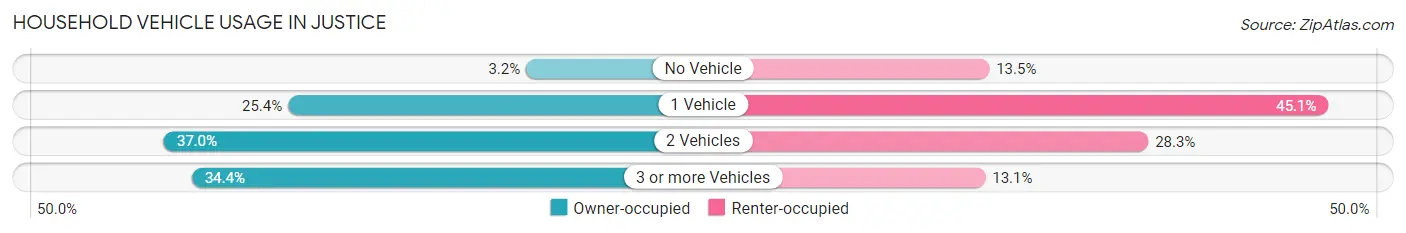
| Vehicles per Household | Owner-occupied | Renter-occupied |
| No Vehicle | 76 (3.2%) | 287 (13.5%) |
| 1 Vehicle | 605 (25.4%) | 961 (45.1%) |
| 2 Vehicles | 881 (37.0%) | 603 (28.3%) |
| 3 or more Vehicles | 819 (34.4%) | 279 (13.1%) |
| Total | 2,381 (100.0%) | 2,130 (100.0%) |
Real Estate & Mortgages in Justice
Real Estate and Mortgage Overview in Justice
| Characteristic | Without Mortgage | With Mortgage |
| Housing Units | 968 | 1,413 |
| Median Property Value | $213,600 | $235,800 |
| Median Household Income | $88,936 | $226 |
| Monthly Housing Costs | $794 | $13 |
| Real Estate Taxes | $5,058 | $0 |
Property Value by Mortgage Status in Justice
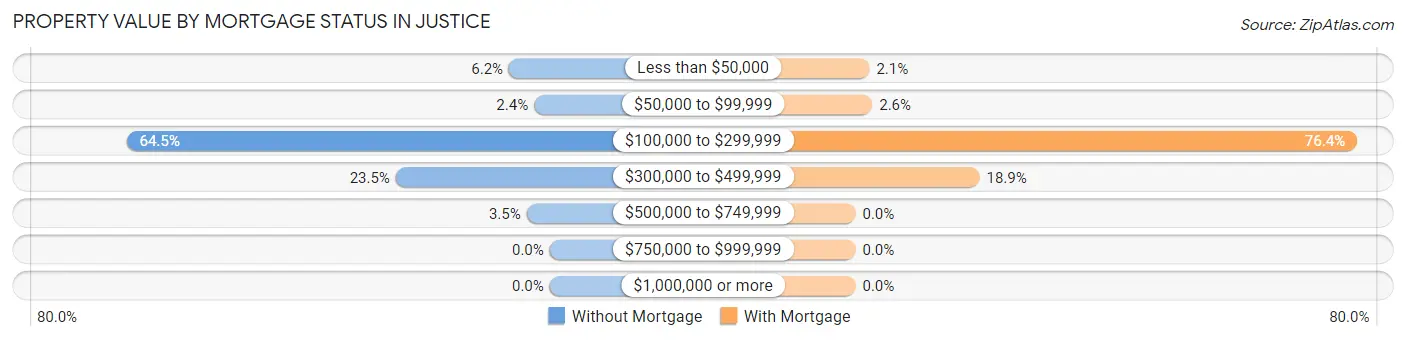
| Property Value | Without Mortgage | With Mortgage |
| Less than $50,000 | 60 (6.2%) | 30 (2.1%) |
| $50,000 to $99,999 | 23 (2.4%) | 36 (2.5%) |
| $100,000 to $299,999 | 624 (64.5%) | 1,080 (76.4%) |
| $300,000 to $499,999 | 227 (23.4%) | 267 (18.9%) |
| $500,000 to $749,999 | 34 (3.5%) | 0 (0.0%) |
| $750,000 to $999,999 | 0 (0.0%) | 0 (0.0%) |
| $1,000,000 or more | 0 (0.0%) | 0 (0.0%) |
| Total | 968 (100.0%) | 1,413 (100.0%) |
Household Income by Mortgage Status in Justice
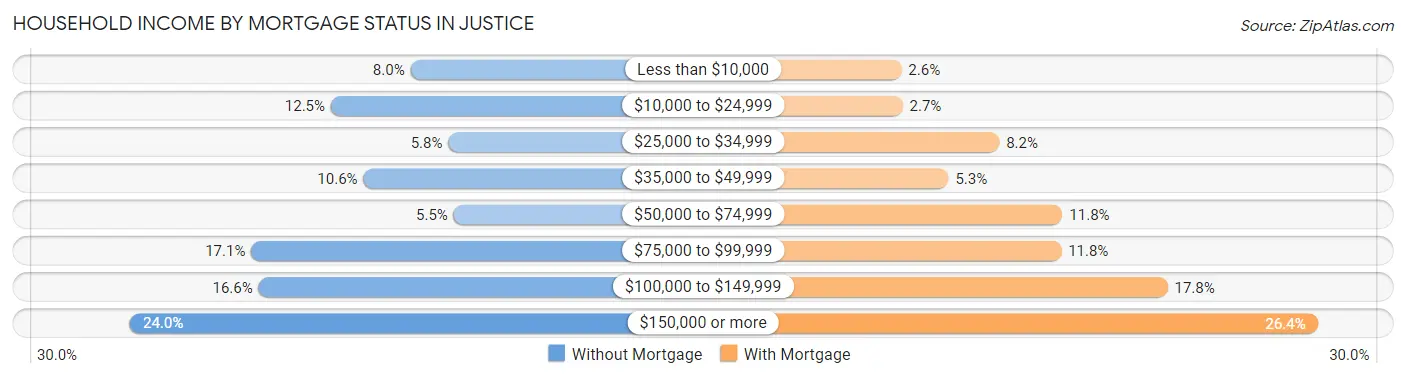
| Household Income | Without Mortgage | With Mortgage |
| Less than $10,000 | 77 (8.0%) | 37 (2.6%) |
| $10,000 to $24,999 | 121 (12.5%) | 38 (2.7%) |
| $25,000 to $34,999 | 56 (5.8%) | 116 (8.2%) |
| $35,000 to $49,999 | 103 (10.6%) | 75 (5.3%) |
| $50,000 to $74,999 | 53 (5.5%) | 167 (11.8%) |
| $75,000 to $99,999 | 165 (17.1%) | 166 (11.7%) |
| $100,000 to $149,999 | 161 (16.6%) | 252 (17.8%) |
| $150,000 or more | 232 (24.0%) | 373 (26.4%) |
| Total | 968 (100.0%) | 1,413 (100.0%) |
Property Value to Household Income Ratio in Justice
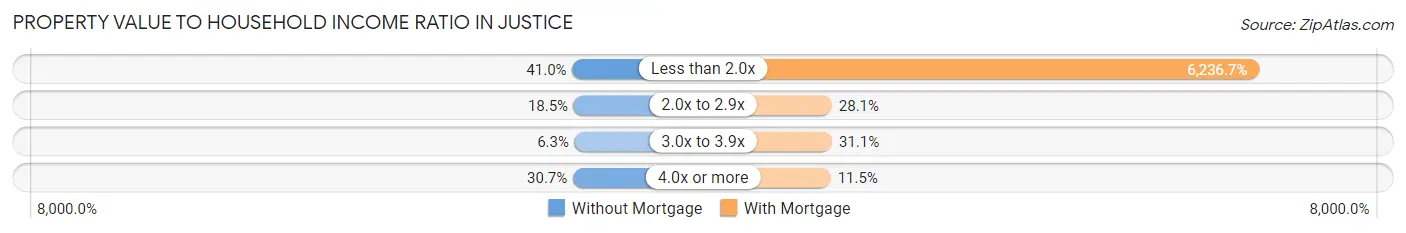
| Value-to-Income Ratio | Without Mortgage | With Mortgage |
| Less than 2.0x | 397 (41.0%) | 88,125 (6,236.7%) |
| 2.0x to 2.9x | 179 (18.5%) | 397 (28.1%) |
| 3.0x to 3.9x | 61 (6.3%) | 439 (31.1%) |
| 4.0x or more | 297 (30.7%) | 162 (11.5%) |
| Total | 968 (100.0%) | 1,413 (100.0%) |
Real Estate Taxes by Mortgage Status in Justice
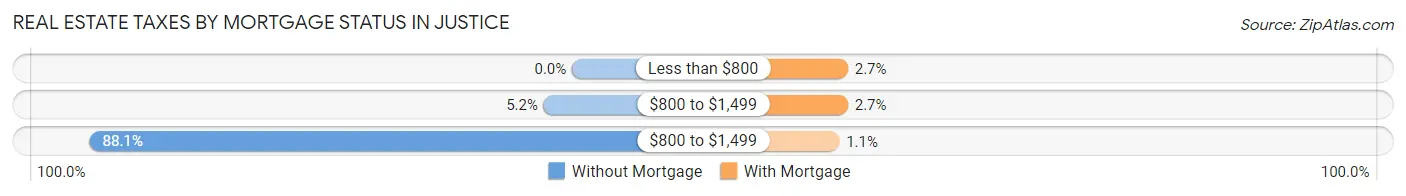
| Property Taxes | Without Mortgage | With Mortgage |
| Less than $800 | 0 (0.0%) | 38 (2.7%) |
| $800 to $1,499 | 50 (5.2%) | 38 (2.7%) |
| $800 to $1,499 | 853 (88.1%) | 16 (1.1%) |
| Total | 968 (100.0%) | 1,413 (100.0%) |
Health & Disability in Justice
Health Insurance Coverage by Age in Justice
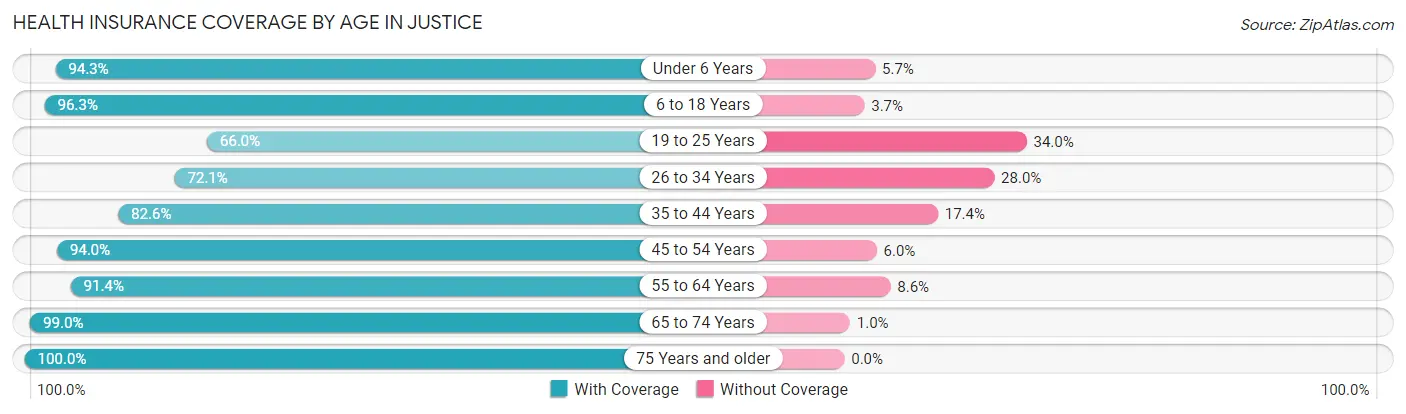
| Age Bracket | With Coverage | Without Coverage |
| Under 6 Years | 1,313 (94.3%) | 80 (5.7%) |
| 6 to 18 Years | 1,677 (96.3%) | 65 (3.7%) |
| 19 to 25 Years | 1,340 (66.0%) | 690 (34.0%) |
| 26 to 34 Years | 1,098 (72.1%) | 426 (28.0%) |
| 35 to 44 Years | 1,704 (82.6%) | 360 (17.4%) |
| 45 to 54 Years | 1,108 (94.0%) | 71 (6.0%) |
| 55 to 64 Years | 1,075 (91.4%) | 101 (8.6%) |
| 65 to 74 Years | 948 (99.0%) | 10 (1.0%) |
| 75 Years and older | 459 (100.0%) | 0 (0.0%) |
| Total | 10,722 (85.6%) | 1,803 (14.4%) |
Health Insurance Coverage by Citizenship Status in Justice
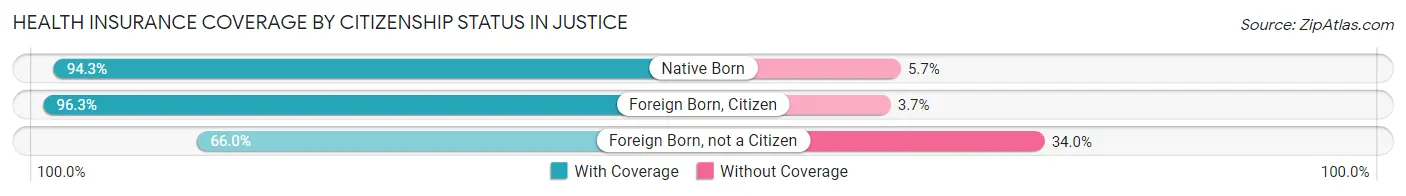
| Citizenship Status | With Coverage | Without Coverage |
| Native Born | 1,313 (94.3%) | 80 (5.7%) |
| Foreign Born, Citizen | 1,677 (96.3%) | 65 (3.7%) |
| Foreign Born, not a Citizen | 1,340 (66.0%) | 690 (34.0%) |
Health Insurance Coverage by Household Income in Justice
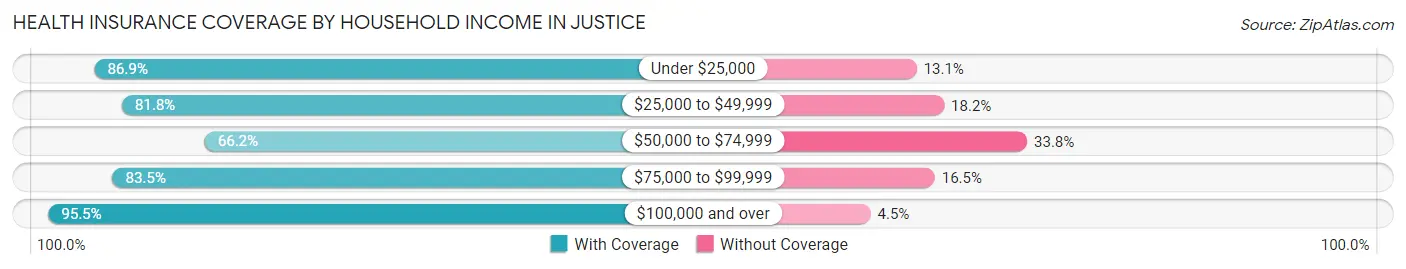
| Household Income | With Coverage | Without Coverage |
| Under $25,000 | 2,083 (86.9%) | 314 (13.1%) |
| $25,000 to $49,999 | 1,654 (81.8%) | 369 (18.2%) |
| $50,000 to $74,999 | 1,188 (66.2%) | 606 (33.8%) |
| $75,000 to $99,999 | 1,616 (83.5%) | 319 (16.5%) |
| $100,000 and over | 4,178 (95.5%) | 195 (4.5%) |
Public vs Private Health Insurance Coverage by Age in Justice
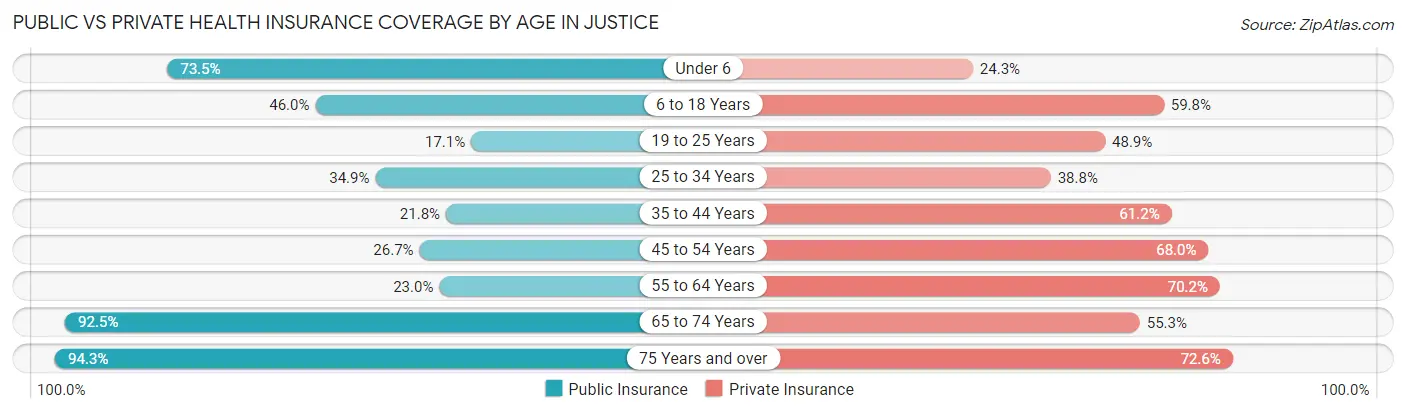
| Age Bracket | Public Insurance | Private Insurance |
| Under 6 | 1,024 (73.5%) | 339 (24.3%) |
| 6 to 18 Years | 802 (46.0%) | 1,041 (59.8%) |
| 19 to 25 Years | 348 (17.1%) | 992 (48.9%) |
| 25 to 34 Years | 532 (34.9%) | 591 (38.8%) |
| 35 to 44 Years | 450 (21.8%) | 1,263 (61.2%) |
| 45 to 54 Years | 315 (26.7%) | 802 (68.0%) |
| 55 to 64 Years | 271 (23.0%) | 825 (70.2%) |
| 65 to 74 Years | 886 (92.5%) | 530 (55.3%) |
| 75 Years and over | 433 (94.3%) | 333 (72.6%) |
| Total | 5,061 (40.4%) | 6,716 (53.6%) |
Disability Status by Sex by Age in Justice
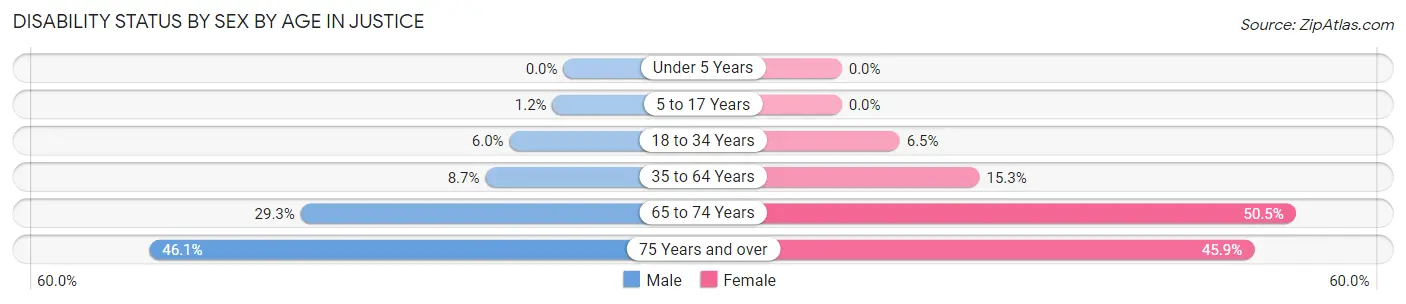
| Age Bracket | Male | Female |
| Under 5 Years | 0 (0.0%) | 0 (0.0%) |
| 5 to 17 Years | 8 (1.2%) | 0 (0.0%) |
| 18 to 34 Years | 119 (6.0%) | 114 (6.5%) |
| 35 to 64 Years | 183 (8.7%) | 355 (15.3%) |
| 65 to 74 Years | 146 (29.3%) | 232 (50.5%) |
| 75 Years and over | 65 (46.1%) | 146 (45.9%) |
Disability Class by Sex by Age in Justice
Disability Class: Hearing Difficulty
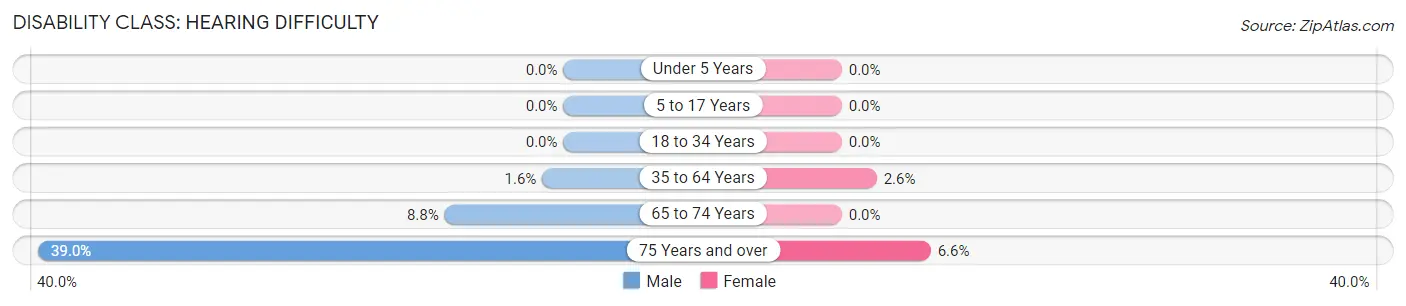
| Age Bracket | Male | Female |
| Under 5 Years | 0 (0.0%) | 0 (0.0%) |
| 5 to 17 Years | 0 (0.0%) | 0 (0.0%) |
| 18 to 34 Years | 0 (0.0%) | 0 (0.0%) |
| 35 to 64 Years | 33 (1.6%) | 60 (2.6%) |
| 65 to 74 Years | 44 (8.8%) | 0 (0.0%) |
| 75 Years and over | 55 (39.0%) | 21 (6.6%) |
Disability Class: Vision Difficulty
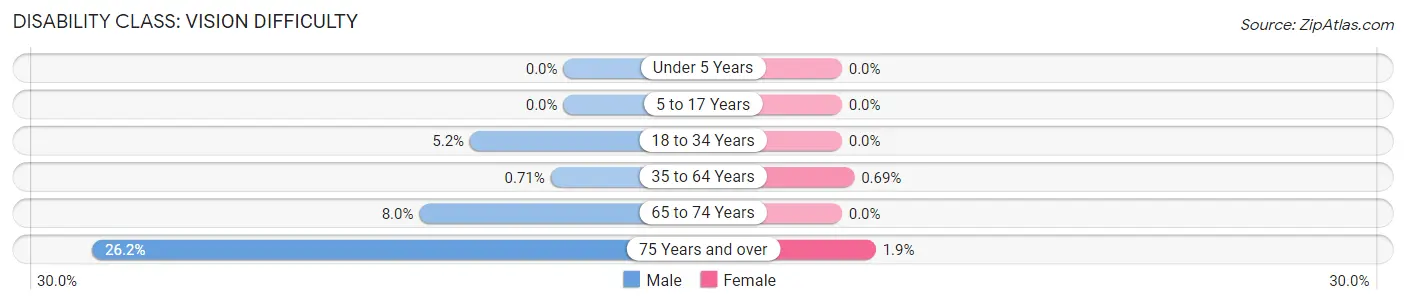
| Age Bracket | Male | Female |
| Under 5 Years | 0 (0.0%) | 0 (0.0%) |
| 5 to 17 Years | 0 (0.0%) | 0 (0.0%) |
| 18 to 34 Years | 103 (5.2%) | 0 (0.0%) |
| 35 to 64 Years | 15 (0.7%) | 16 (0.7%) |
| 65 to 74 Years | 40 (8.0%) | 0 (0.0%) |
| 75 Years and over | 37 (26.2%) | 6 (1.9%) |
Disability Class: Cognitive Difficulty
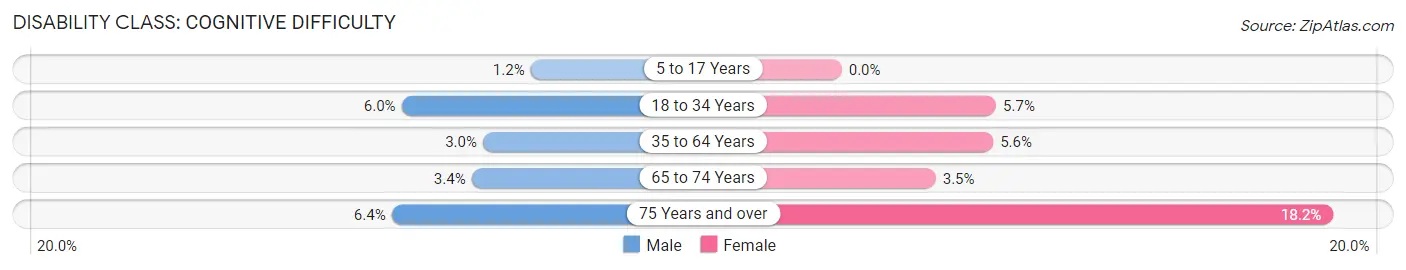
| Age Bracket | Male | Female |
| 5 to 17 Years | 8 (1.2%) | 0 (0.0%) |
| 18 to 34 Years | 119 (6.0%) | 101 (5.7%) |
| 35 to 64 Years | 63 (3.0%) | 130 (5.6%) |
| 65 to 74 Years | 17 (3.4%) | 16 (3.5%) |
| 75 Years and over | 9 (6.4%) | 58 (18.2%) |
Disability Class: Ambulatory Difficulty
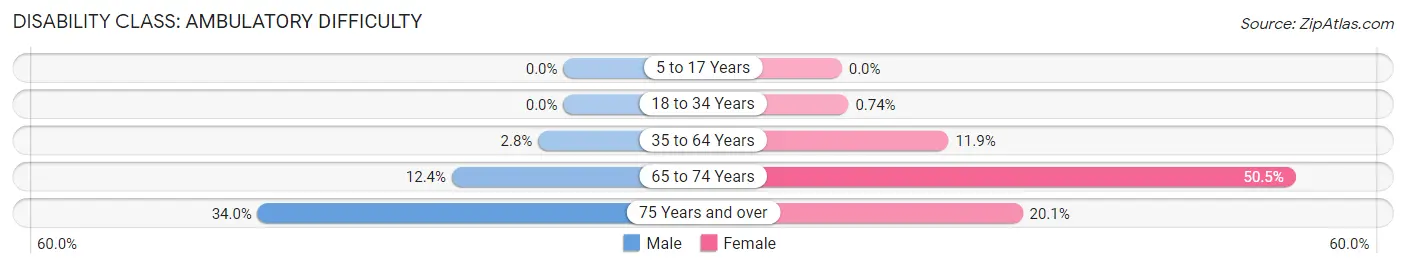
| Age Bracket | Male | Female |
| 5 to 17 Years | 0 (0.0%) | 0 (0.0%) |
| 18 to 34 Years | 0 (0.0%) | 13 (0.7%) |
| 35 to 64 Years | 59 (2.8%) | 275 (11.9%) |
| 65 to 74 Years | 62 (12.4%) | 232 (50.5%) |
| 75 Years and over | 48 (34.0%) | 64 (20.1%) |
Disability Class: Self-Care Difficulty
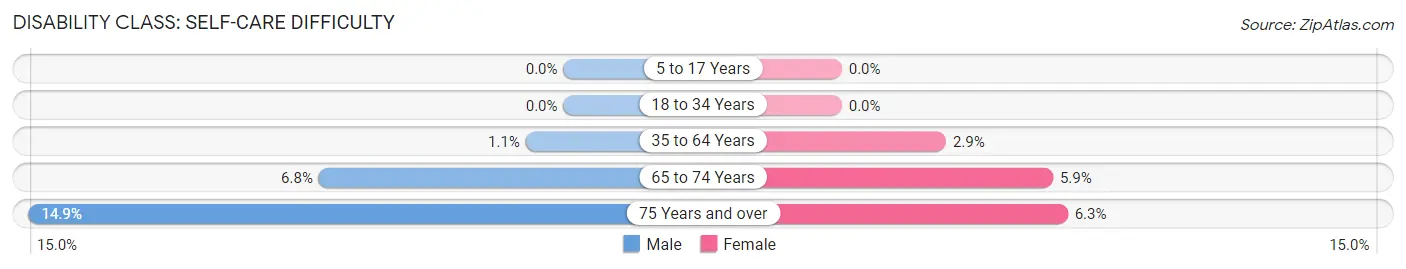
| Age Bracket | Male | Female |
| 5 to 17 Years | 0 (0.0%) | 0 (0.0%) |
| 18 to 34 Years | 0 (0.0%) | 0 (0.0%) |
| 35 to 64 Years | 22 (1.1%) | 67 (2.9%) |
| 65 to 74 Years | 34 (6.8%) | 27 (5.9%) |
| 75 Years and over | 21 (14.9%) | 20 (6.3%) |
Technology Access in Justice
Computing Device Access in Justice
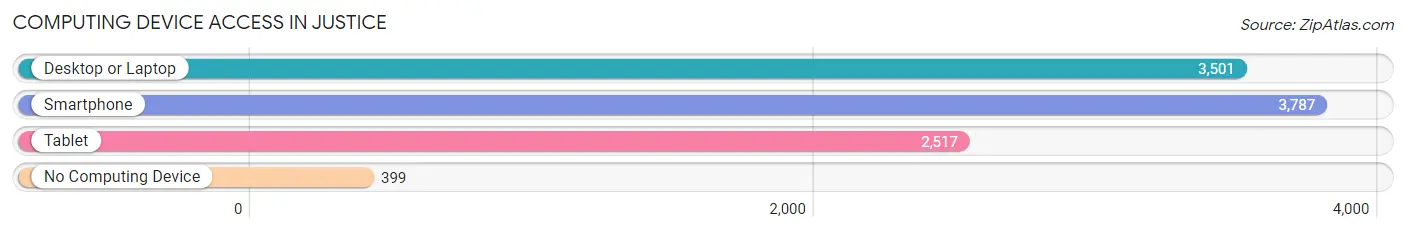
| Device Type | # Households | % Households |
| Desktop or Laptop | 3,501 | 77.6% |
| Smartphone | 3,787 | 84.0% |
| Tablet | 2,517 | 55.8% |
| No Computing Device | 399 | 8.8% |
| Total | 4,511 | 100.0% |
Internet Access in Justice
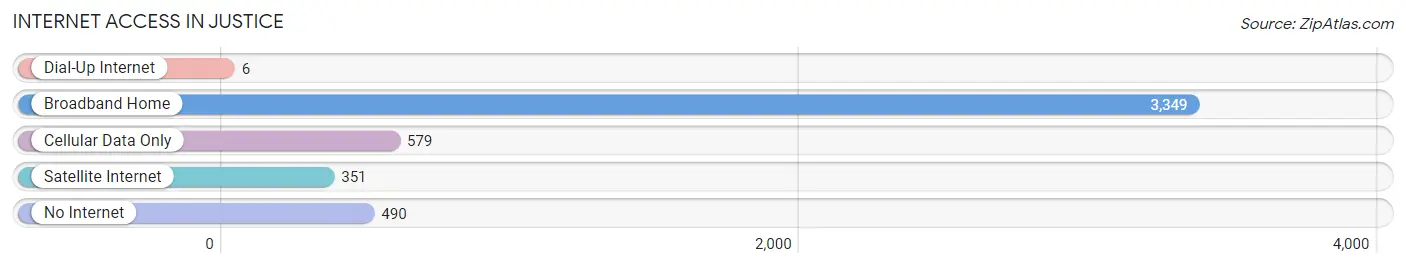
| Internet Type | # Households | % Households |
| Dial-Up Internet | 6 | 0.1% |
| Broadband Home | 3,349 | 74.2% |
| Cellular Data Only | 579 | 12.8% |
| Satellite Internet | 351 | 7.8% |
| No Internet | 490 | 10.9% |
| Total | 4,511 | 100.0% |
Justice Summary
Justice, Illinois is a small village located in Cook County, Illinois. It is a part of the Chicago metropolitan area and is located about 25 miles southwest of the city. The village has a population of about 5,000 people and is known for its small-town charm and close-knit community.
Geography
Justice is located in the southwestern corner of Cook County, Illinois. It is bordered by the villages of Bridgeview, Hickory Hills, and Oak Lawn. The village is situated on the Des Plaines River, which is a tributary of the Illinois River. The village is located in the Chicago Plain, which is a flat, low-lying area of land. The village is also located near the Palos Hills, which are a series of rolling hills located in the area.
Economy
Justice is a small village with a limited economy. The village is home to a few small businesses, including a grocery store, a hardware store, and a few restaurants. The village also has a few industrial businesses, including a manufacturing plant and a trucking company. The village is also home to a few small farms, which produce a variety of crops.
Demographics
As of the 2010 census, the population of Justice was 5,099. The racial makeup of the village was 94.3% White, 1.2% African American, 0.3% Native American, 0.7% Asian, 0.1% Pacific Islander, 1.7% from other races, and 1.9% from two or more races. Hispanic or Latino of any race were 4.3% of the population.
The median household income in Justice was $50,945 in 2018. The median age of the village was 41.7 years. The village had a poverty rate of 8.3%, which was lower than the national average of 11.8%.
History
Justice was founded in 1836 by a group of settlers from New York. The village was named after the Justice family, who were among the first settlers. The village was incorporated in 1887 and has remained a small, rural community ever since.
In the early 20th century, Justice was a popular destination for Chicagoans looking to escape the city. The village was home to a number of resorts and summer homes. The village also had a number of small businesses, including a general store, a blacksmith, and a post office.
In the late 20th century, Justice began to experience a population decline as many of its residents moved to the suburbs of Chicago. The village has since seen a resurgence in population as more people have moved back to the area.
Conclusion
Justice, Illinois is a small village located in Cook County, Illinois. It is a part of the Chicago metropolitan area and is known for its small-town charm and close-knit community. The village has a population of about 5,000 people and is located on the Des Plaines River. The village has a limited economy, with a few small businesses and industrial businesses. The village has a diverse population, with a median household income of $50,945 and a poverty rate of 8.3%. Justice was founded in 1836 and has remained a small, rural community ever since.
Common Questions
What is Per Capita Income in Justice?
Per Capita income in Justice is $29,512.
What is the Median Family Income in Justice?
Median Family Income in Justice is $80,000.
What is the Median Household income in Justice?
Median Household Income in Justice is $60,083.
What is Income or Wage Gap in Justice?
Income or Wage Gap in Justice is 5.1%.
Women in Justice earn 94.9 cents for every dollar earned by a man.
What is Family Income Deficit in Justice?
Family Income Deficit in Justice is $10,546.
Families that are below poverty line in Justice earn $10,546 less on average than the poverty threshold level.
What is Inequality or Gini Index in Justice?
Inequality or Gini Index in Justice is 0.44.
What is the Total Population of Justice?
Total Population of Justice is 12,525.
What is the Total Male Population of Justice?
Total Male Population of Justice is 6,033.
What is the Total Female Population of Justice?
Total Female Population of Justice is 6,492.
What is the Ratio of Males per 100 Females in Justice?
There are 92.93 Males per 100 Females in Justice.
What is the Ratio of Females per 100 Males in Justice?
There are 107.61 Females per 100 Males in Justice.
What is the Median Population Age in Justice?
Median Population Age in Justice is 31.1 Years.
What is the Average Family Size in Justice
Average Family Size in Justice is 3.3 People.
What is the Average Household Size in Justice
Average Household Size in Justice is 2.8 People.
How Large is the Labor Force in Justice?
There are 6,737 People in the Labor Forcein in Justice.
What is the Percentage of People in the Labor Force in Justice?
69.0% of People are in the Labor Force in Justice.
What is the Unemployment Rate in Justice?
Unemployment Rate in Justice is 5.0%.