Rock Island, IL Map & Demographics
Rock Island Map
Rock Island Overview
$30,235
PER CAPITA INCOME
$69,568
AVG FAMILY INCOME
$55,732
AVG HOUSEHOLD INCOME
21.6%
WAGE / INCOME GAP [ % ]
78.4¢/ $1
WAGE / INCOME GAP [ $ ]
$11,770
FAMILY INCOME DEFICIT
0.46
INEQUALITY / GINI INDEX
37,264
TOTAL POPULATION
18,464
MALE POPULATION
18,800
FEMALE POPULATION
98.21
MALES / 100 FEMALES
101.82
FEMALES / 100 MALES
35.0
MEDIAN AGE
3.1
AVG FAMILY SIZE
2.3
AVG HOUSEHOLD SIZE
18,287
LABOR FORCE [ PEOPLE ]
61.3%
PERCENT IN LABOR FORCE
7.3%
UNEMPLOYMENT RATE
Rock Island Zip Codes
Rock Island Area Codes
Income in Rock Island
Income Overview in Rock Island
Per Capita Income in Rock Island is $30,235, while median incomes of families and households are $69,568 and $55,732 respectively.
| Characteristic | Number | Measure |
| Per Capita Income | 37,264 | $30,235 |
| Median Family Income | 7,974 | $69,568 |
| Mean Family Income | 7,974 | $90,325 |
| Median Household Income | 15,247 | $55,732 |
| Mean Household Income | 15,247 | $73,007 |
| Income Deficit | 7,974 | $11,770 |
| Wage / Income Gap (%) | 37,264 | 21.62% |
| Wage / Income Gap ($) | 37,264 | 78.38¢ per $1 |
| Gini / Inequality Index | 37,264 | 0.46 |
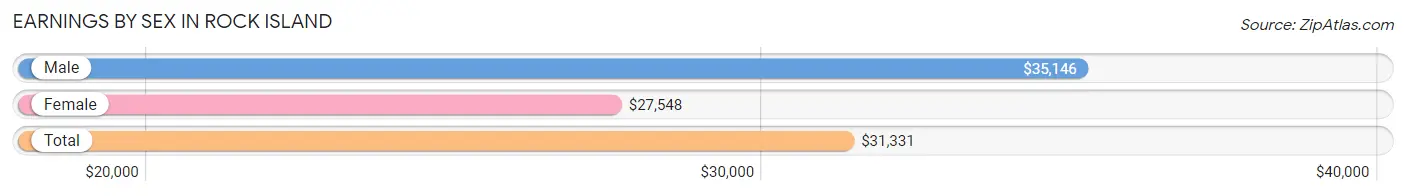
Earnings by Sex in Rock Island
Average Earnings in Rock Island are $31,331, $35,146 for men and $27,548 for women, a difference of 21.6%.
| Sex | Number | Average Earnings |
| Male | 10,374 (52.4%) | $35,146 |
| Female | 9,407 (47.6%) | $27,548 |
| Total | 19,781 (100.0%) | $31,331 |
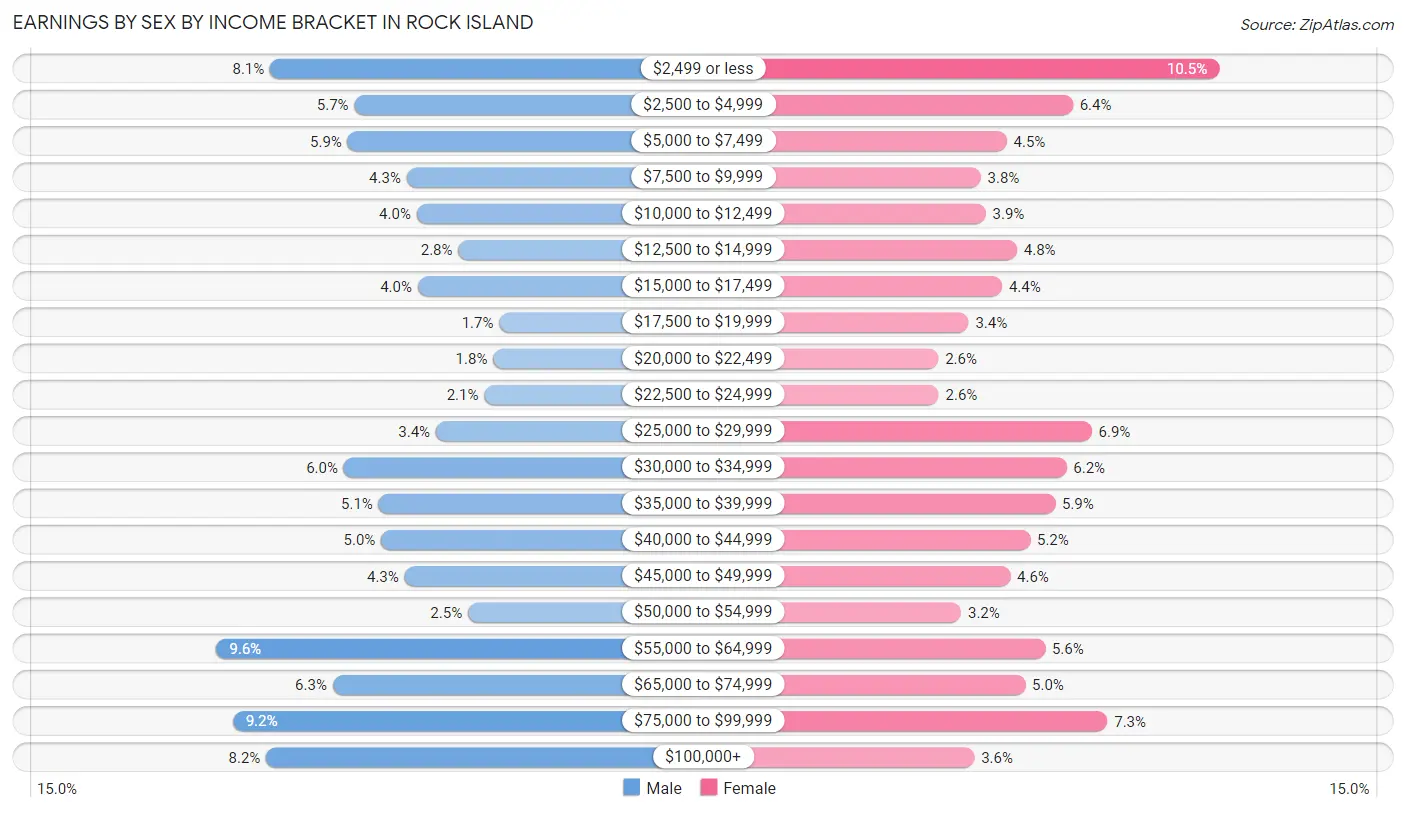
Earnings by Sex by Income Bracket in Rock Island
The most common earnings brackets in Rock Island are $55,000 to $64,999 for men (997 | 9.6%) and $2,499 or less for women (984 | 10.5%).
| Income | Male | Female |
| $2,499 or less | 840 (8.1%) | 984 (10.5%) |
| $2,500 to $4,999 | 594 (5.7%) | 597 (6.4%) |
| $5,000 to $7,499 | 614 (5.9%) | 422 (4.5%) |
| $7,500 to $9,999 | 442 (4.3%) | 354 (3.8%) |
| $10,000 to $12,499 | 413 (4.0%) | 367 (3.9%) |
| $12,500 to $14,999 | 292 (2.8%) | 450 (4.8%) |
| $15,000 to $17,499 | 410 (4.0%) | 410 (4.4%) |
| $17,500 to $19,999 | 172 (1.7%) | 322 (3.4%) |
| $20,000 to $22,499 | 190 (1.8%) | 242 (2.6%) |
| $22,500 to $24,999 | 216 (2.1%) | 243 (2.6%) |
| $25,000 to $29,999 | 357 (3.4%) | 647 (6.9%) |
| $30,000 to $34,999 | 626 (6.0%) | 580 (6.2%) |
| $35,000 to $39,999 | 524 (5.1%) | 550 (5.9%) |
| $40,000 to $44,999 | 517 (5.0%) | 484 (5.1%) |
| $45,000 to $49,999 | 448 (4.3%) | 432 (4.6%) |
| $50,000 to $54,999 | 263 (2.5%) | 302 (3.2%) |
| $55,000 to $64,999 | 997 (9.6%) | 524 (5.6%) |
| $65,000 to $74,999 | 658 (6.3%) | 471 (5.0%) |
| $75,000 to $99,999 | 949 (9.1%) | 689 (7.3%) |
| $100,000+ | 852 (8.2%) | 337 (3.6%) |
| Total | 10,374 (100.0%) | 9,407 (100.0%) |
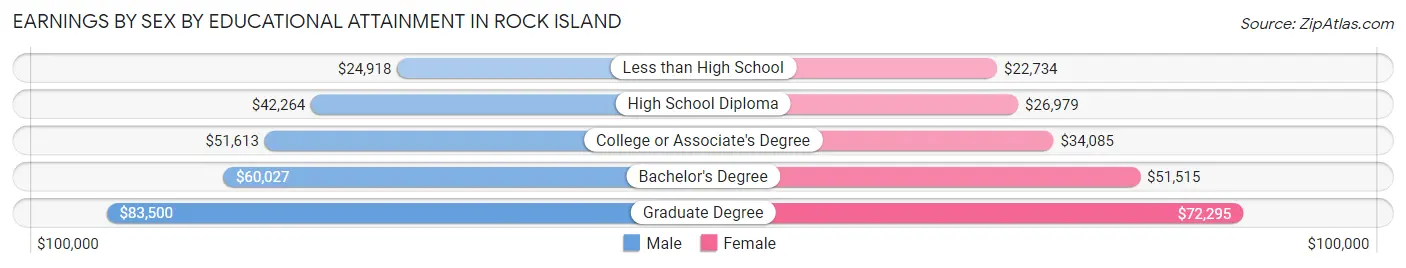
Earnings by Sex by Educational Attainment in Rock Island
Average earnings in Rock Island are $46,373 for men and $36,522 for women, a difference of 21.2%. Men with an educational attainment of graduate degree enjoy the highest average annual earnings of $83,500, while those with less than high school education earn the least with $24,918. Women with an educational attainment of graduate degree earn the most with the average annual earnings of $72,295, while those with less than high school education have the smallest earnings of $22,734.
| Educational Attainment | Male Income | Female Income |
| Less than High School | $24,918 | $22,734 |
| High School Diploma | $42,264 | $26,979 |
| College or Associate's Degree | $51,613 | $34,085 |
| Bachelor's Degree | $60,027 | $51,515 |
| Graduate Degree | $83,500 | $72,295 |
| Total | $46,373 | $36,522 |
Family Income in Rock Island
Family Income Brackets in Rock Island
According to the Rock Island family income data, there are 1,595 families falling into the $50,000 to $74,999 income range, which is the most common income bracket and makes up 20.0% of all families. Conversely, the $10,000 to $14,999 income bracket is the least frequent group with only 311 families (3.9%) belonging to this category.
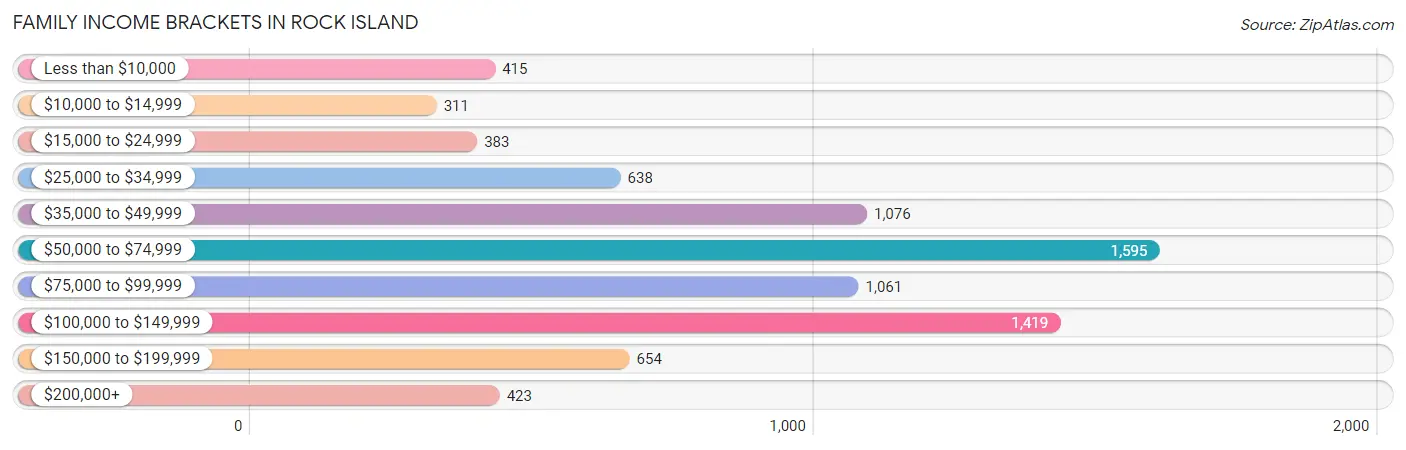
| Income Bracket | # Families | % Families |
| Less than $10,000 | 415 | 5.2% |
| $10,000 to $14,999 | 311 | 3.9% |
| $15,000 to $24,999 | 383 | 4.8% |
| $25,000 to $34,999 | 638 | 8.0% |
| $35,000 to $49,999 | 1,076 | 13.5% |
| $50,000 to $74,999 | 1,595 | 20.0% |
| $75,000 to $99,999 | 1,061 | 13.3% |
| $100,000 to $149,999 | 1,419 | 17.8% |
| $150,000 to $199,999 | 654 | 8.2% |
| $200,000+ | 423 | 5.3% |
Family Income by Famaliy Size in Rock Island
4-person families (1,152 | 14.4%) account for the highest median family income in Rock Island with $78,526 per family, while 2-person families (4,257 | 53.4%) have the highest median income of $35,446 per family member.
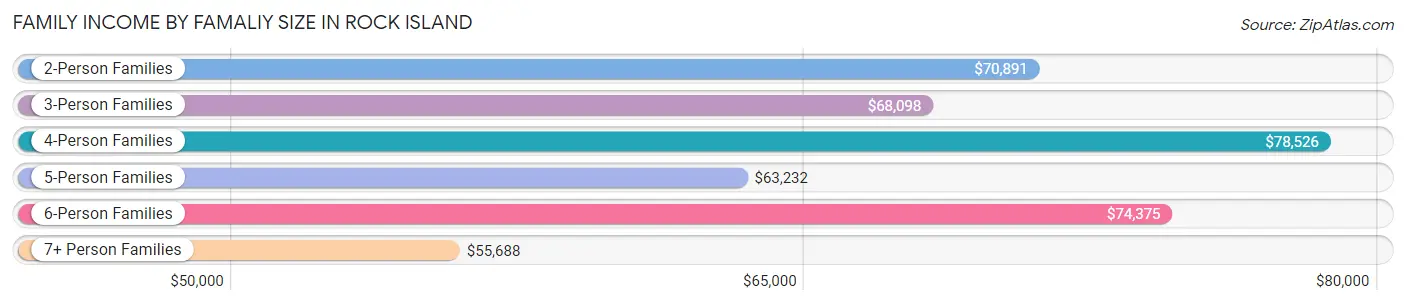
| Income Bracket | # Families | Median Income |
| 2-Person Families | 4,257 (53.4%) | $70,891 |
| 3-Person Families | 1,555 (19.5%) | $68,098 |
| 4-Person Families | 1,152 (14.4%) | $78,526 |
| 5-Person Families | 577 (7.2%) | $63,232 |
| 6-Person Families | 288 (3.6%) | $74,375 |
| 7+ Person Families | 145 (1.8%) | $55,688 |
| Total | 7,974 (100.0%) | $69,568 |
Family Income by Number of Earners in Rock Island
The median family income in Rock Island is $69,568, with families comprising 2 earners (2,738) having the highest median family income of $96,085, while families with no earners (1,471) have the lowest median family income of $46,234, accounting for 34.3% and 18.4% of families, respectively.
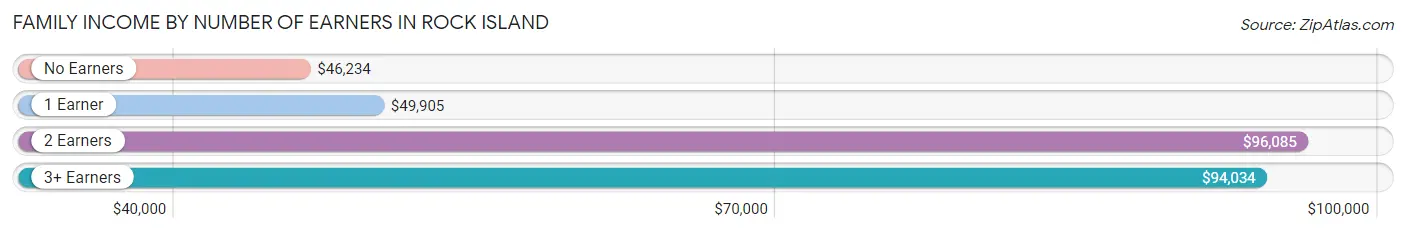
| Number of Earners | # Families | Median Income |
| No Earners | 1,471 (18.4%) | $46,234 |
| 1 Earner | 2,959 (37.1%) | $49,905 |
| 2 Earners | 2,738 (34.3%) | $96,085 |
| 3+ Earners | 806 (10.1%) | $94,034 |
| Total | 7,974 (100.0%) | $69,568 |
Household Income in Rock Island
Household Income Brackets in Rock Island
With 2,943 households falling in the category, the $50,000 to $74,999 income range is the most frequent in Rock Island, accounting for 19.3% of all households. In contrast, only 579 households (3.8%) fall into the $200,000+ income bracket, making it the least populous group.
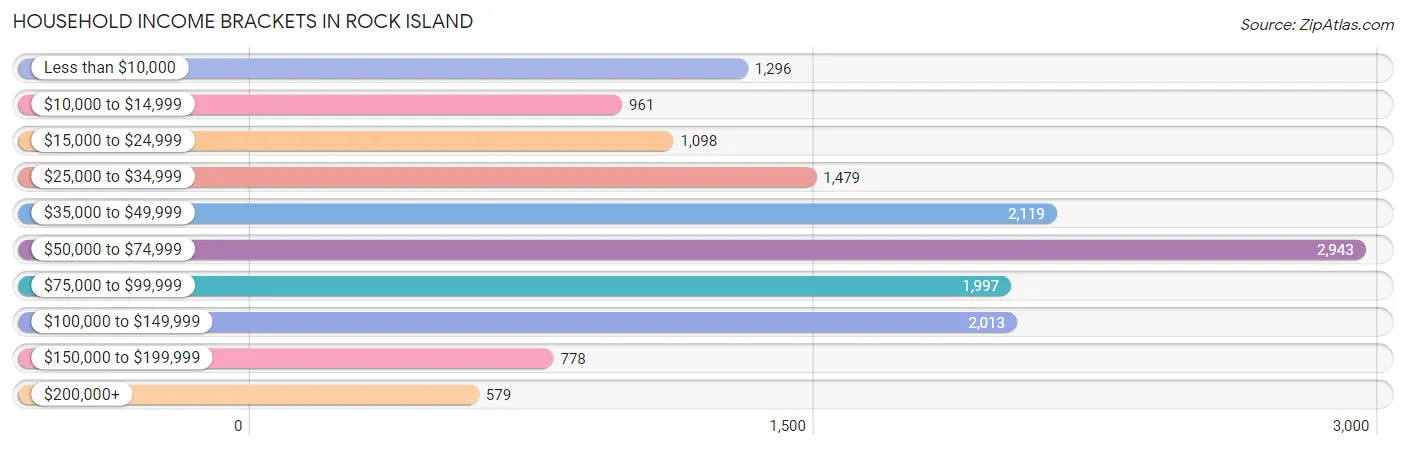
| Income Bracket | # Households | % Households |
| Less than $10,000 | 1,296 | 8.5% |
| $10,000 to $14,999 | 961 | 6.3% |
| $15,000 to $24,999 | 1,098 | 7.2% |
| $25,000 to $34,999 | 1,479 | 9.7% |
| $35,000 to $49,999 | 2,119 | 13.9% |
| $50,000 to $74,999 | 2,943 | 19.3% |
| $75,000 to $99,999 | 1,997 | 13.1% |
| $100,000 to $149,999 | 2,013 | 13.2% |
| $150,000 to $199,999 | 778 | 5.1% |
| $200,000+ | 579 | 3.8% |
Household Income by Householder Age in Rock Island
The median household income in Rock Island is $55,732, with the highest median household income of $63,465 found in the 45 to 64 years age bracket for the primary householder. A total of 4,980 households (32.7%) fall into this category. Meanwhile, the 15 to 24 years age bracket for the primary householder has the lowest median household income of $44,911, with 1,148 households (7.5%) in this group.
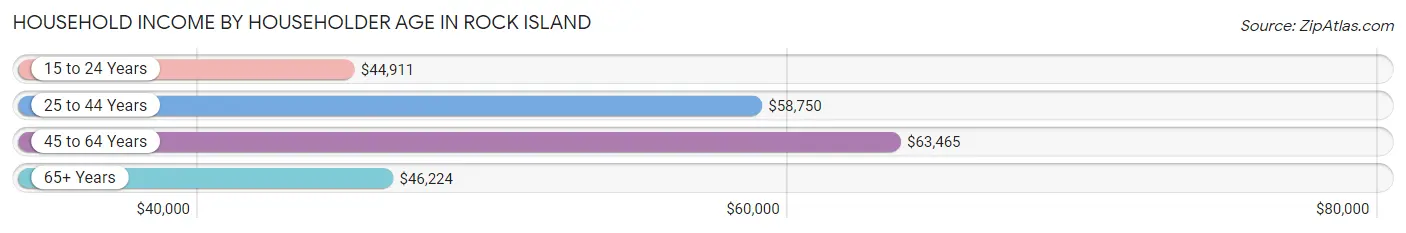
| Income Bracket | # Households | Median Income |
| 15 to 24 Years | 1,148 (7.5%) | $44,911 |
| 25 to 44 Years | 4,844 (31.8%) | $58,750 |
| 45 to 64 Years | 4,980 (32.7%) | $63,465 |
| 65+ Years | 4,275 (28.0%) | $46,224 |
| Total | 15,247 (100.0%) | $55,732 |
Poverty in Rock Island
Income Below Poverty by Sex and Age in Rock Island
With 22.7% poverty level for males and 22.7% for females among the residents of Rock Island, under 5 year old males and 5 year old females are the most vulnerable to poverty, with 568 males (42.8%) and 65 females (49.6%) in their respective age groups living below the poverty level.
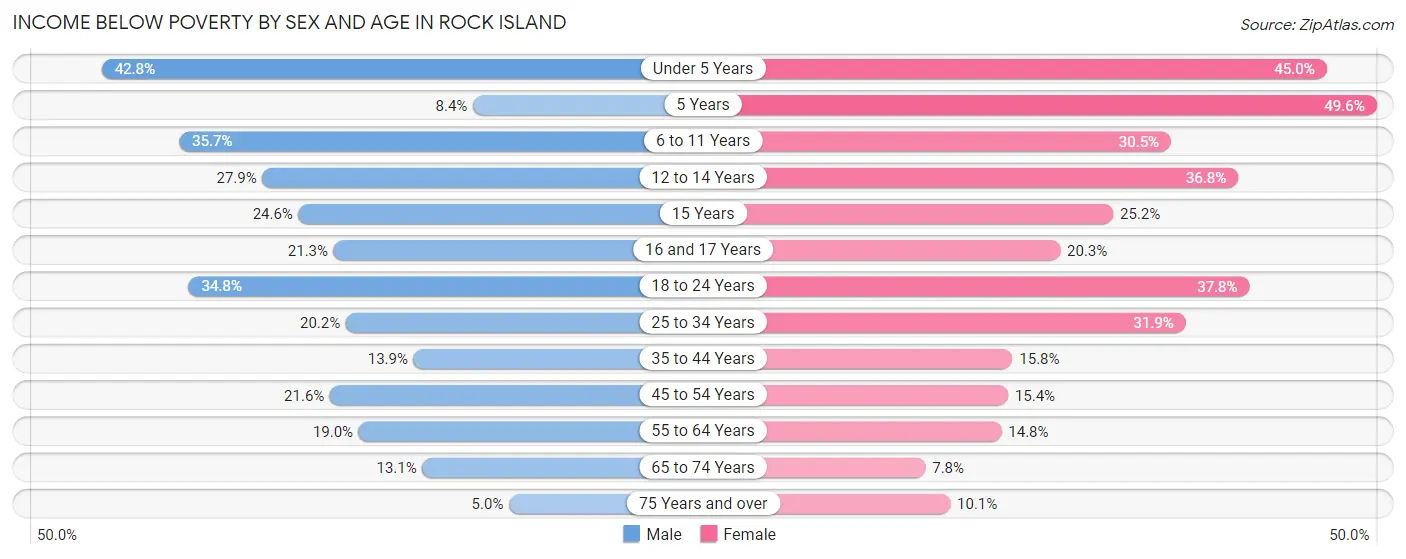
| Age Bracket | Male | Female |
| Under 5 Years | 568 (42.8%) | 466 (45.0%) |
| 5 Years | 20 (8.4%) | 65 (49.6%) |
| 6 to 11 Years | 480 (35.7%) | 427 (30.5%) |
| 12 to 14 Years | 165 (27.9%) | 267 (36.8%) |
| 15 Years | 56 (24.6%) | 70 (25.2%) |
| 16 and 17 Years | 82 (21.3%) | 94 (20.3%) |
| 18 to 24 Years | 640 (34.8%) | 657 (37.8%) |
| 25 to 34 Years | 507 (20.2%) | 667 (31.9%) |
| 35 to 44 Years | 262 (13.9%) | 320 (15.8%) |
| 45 to 54 Years | 381 (21.6%) | 282 (15.4%) |
| 55 to 64 Years | 421 (19.0%) | 345 (14.8%) |
| 65 to 74 Years | 222 (13.1%) | 154 (7.7%) |
| 75 Years and over | 49 (5.0%) | 145 (10.1%) |
| Total | 3,853 (22.7%) | 3,959 (22.7%) |
Income Above Poverty by Sex and Age in Rock Island
According to the poverty statistics in Rock Island, males aged 75 years and over and females aged 65 to 74 years are the age groups that are most secure financially, with 95.0% of males and 92.2% of females in these age groups living above the poverty line.
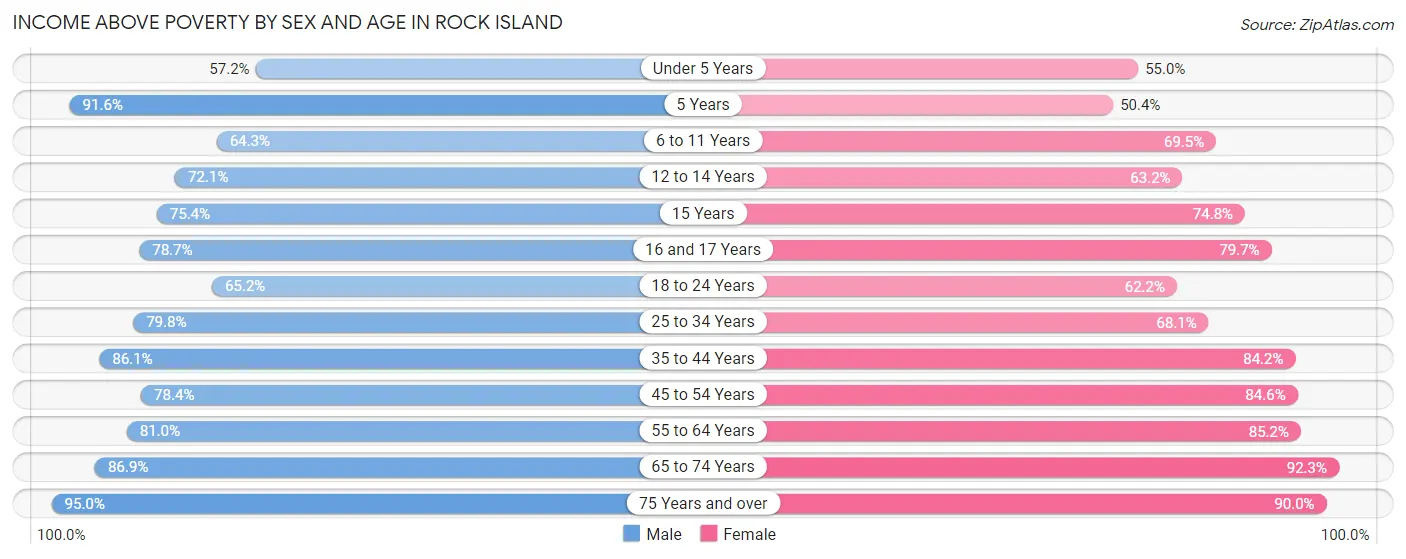
| Age Bracket | Male | Female |
| Under 5 Years | 758 (57.2%) | 570 (55.0%) |
| 5 Years | 219 (91.6%) | 66 (50.4%) |
| 6 to 11 Years | 866 (64.3%) | 971 (69.5%) |
| 12 to 14 Years | 426 (72.1%) | 459 (63.2%) |
| 15 Years | 172 (75.4%) | 208 (74.8%) |
| 16 and 17 Years | 303 (78.7%) | 370 (79.7%) |
| 18 to 24 Years | 1,200 (65.2%) | 1,080 (62.2%) |
| 25 to 34 Years | 2,007 (79.8%) | 1,423 (68.1%) |
| 35 to 44 Years | 1,625 (86.1%) | 1,701 (84.2%) |
| 45 to 54 Years | 1,380 (78.4%) | 1,547 (84.6%) |
| 55 to 64 Years | 1,798 (81.0%) | 1,984 (85.2%) |
| 65 to 74 Years | 1,477 (86.9%) | 1,832 (92.2%) |
| 75 Years and over | 928 (95.0%) | 1,298 (89.9%) |
| Total | 13,159 (77.3%) | 13,509 (77.3%) |
Income Below Poverty Among Married-Couple Families in Rock Island
The poverty statistics for married-couple families in Rock Island show that 7.7% or 400 of the total 5,176 families live below the poverty line. Families with 5 or more children have the highest poverty rate of 41.6%, comprising of 32 families. On the other hand, families with no children have the lowest poverty rate of 2.6%, which includes 87 families.
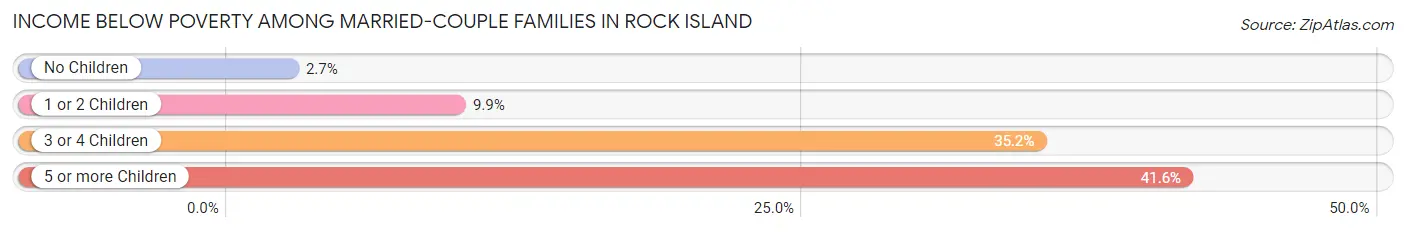
| Children | Above Poverty | Below Poverty |
| No Children | 3,192 (97.4%) | 87 (2.6%) |
| 1 or 2 Children | 1,281 (90.1%) | 141 (9.9%) |
| 3 or 4 Children | 258 (64.8%) | 140 (35.2%) |
| 5 or more Children | 45 (58.4%) | 32 (41.6%) |
| Total | 4,776 (92.3%) | 400 (7.7%) |
Income Below Poverty Among Single-Parent Households in Rock Island
According to the poverty data in Rock Island, 22.7% or 150 single-father households and 30.5% or 652 single-mother households are living below the poverty line. Among single-father households, those with 3 or 4 children have the highest poverty rate, with 79 households (82.3%) experiencing poverty. Likewise, among single-mother households, those with 5 or more children have the highest poverty rate, with 10 households (58.8%) falling below the poverty line.
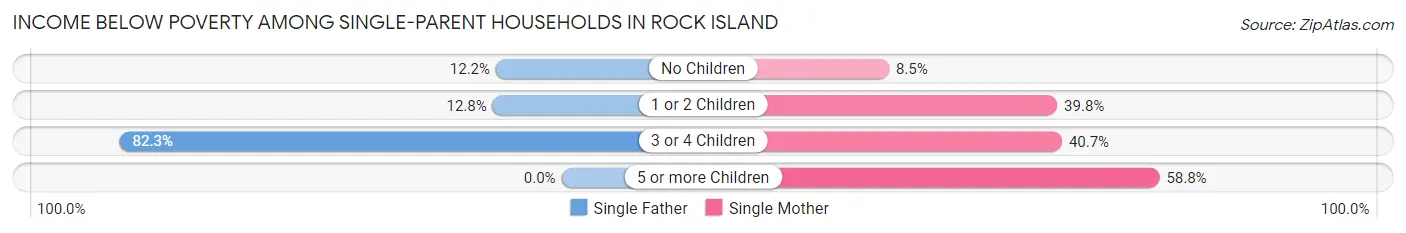
| Children | Single Father | Single Mother |
| No Children | 33 (12.2%) | 55 (8.5%) |
| 1 or 2 Children | 38 (12.8%) | 439 (39.8%) |
| 3 or 4 Children | 79 (82.3%) | 148 (40.7%) |
| 5 or more Children | 0 (0.0%) | 10 (58.8%) |
| Total | 150 (22.7%) | 652 (30.5%) |
Income Below Poverty Among Married-Couple vs Single-Parent Households in Rock Island
The poverty data for Rock Island shows that 400 of the married-couple family households (7.7%) and 802 of the single-parent households (28.7%) are living below the poverty level. Within the married-couple family households, those with 5 or more children have the highest poverty rate, with 32 households (41.6%) falling below the poverty line. Among the single-parent households, those with 5 or more children have the highest poverty rate, with 10 household (58.8%) living below poverty.
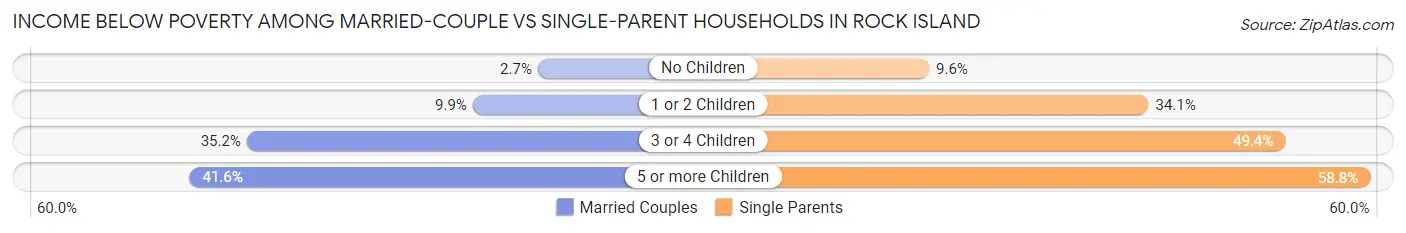
| Children | Married-Couple Families | Single-Parent Households |
| No Children | 87 (2.6%) | 88 (9.6%) |
| 1 or 2 Children | 141 (9.9%) | 477 (34.1%) |
| 3 or 4 Children | 140 (35.2%) | 227 (49.3%) |
| 5 or more Children | 32 (41.6%) | 10 (58.8%) |
| Total | 400 (7.7%) | 802 (28.7%) |
Race in Rock Island
The most populous races in Rock Island are White / Caucasian (25,447 | 68.3%), Black / African American (6,366 | 17.1%), and Hispanic or Latino (5,078 | 13.6%).
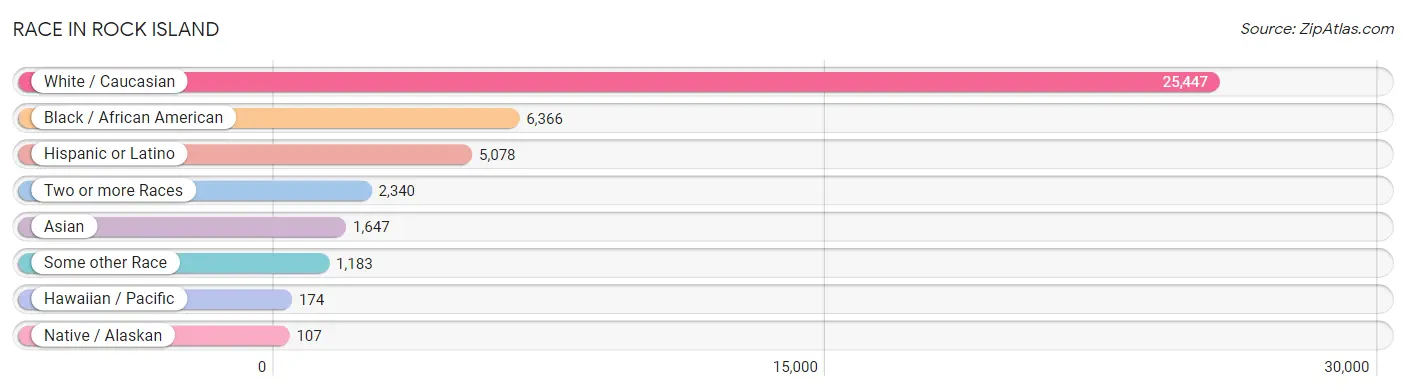
| Race | # Population | % Population |
| Asian | 1,647 | 4.4% |
| Black / African American | 6,366 | 17.1% |
| Hawaiian / Pacific | 174 | 0.5% |
| Hispanic or Latino | 5,078 | 13.6% |
| Native / Alaskan | 107 | 0.3% |
| White / Caucasian | 25,447 | 68.3% |
| Two or more Races | 2,340 | 6.3% |
| Some other Race | 1,183 | 3.2% |
| Total | 37,264 | 100.0% |
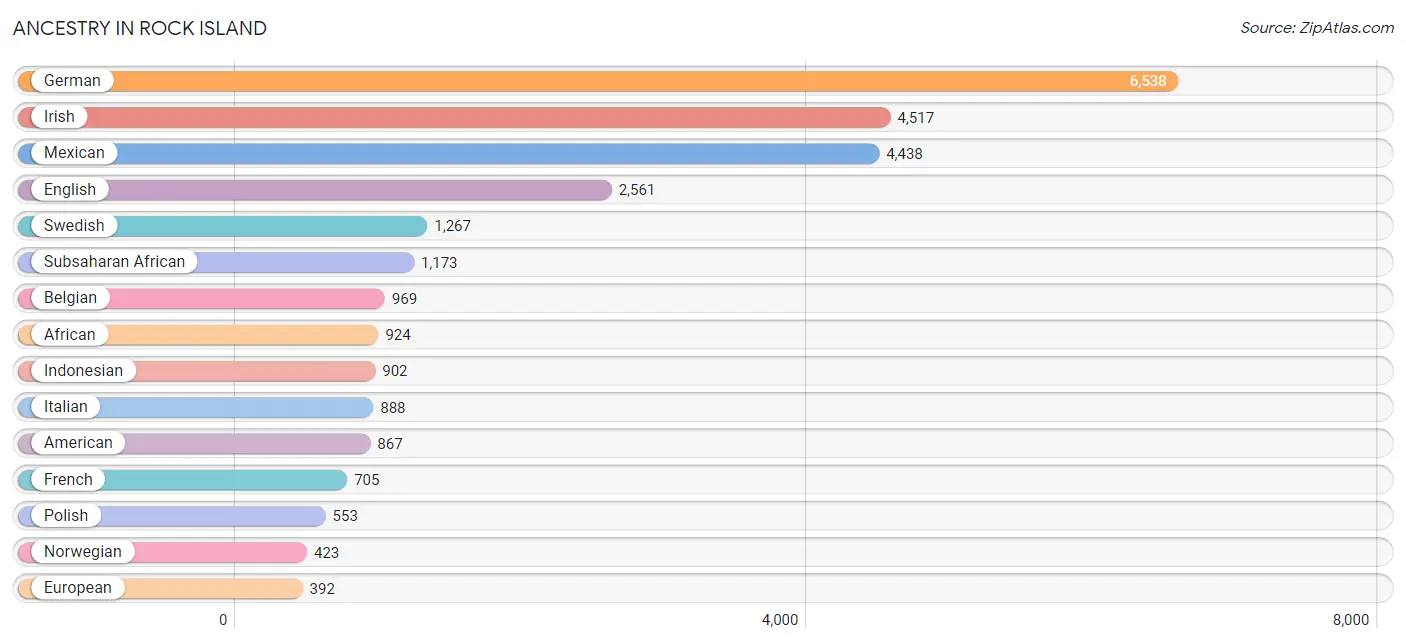
Ancestry in Rock Island
The most populous ancestries reported in Rock Island are German (6,538 | 17.5%), Irish (4,517 | 12.1%), Mexican (4,438 | 11.9%), English (2,561 | 6.9%), and Swedish (1,267 | 3.4%), together accounting for 51.8% of all Rock Island residents.
| Ancestry | # Population | % Population |
| African | 924 | 2.5% |
| Albanian | 7 | 0.0% |
| American | 867 | 2.3% |
| Apache | 21 | 0.1% |
| Arab | 37 | 0.1% |
| Armenian | 9 | 0.0% |
| Austrian | 20 | 0.1% |
| Belgian | 969 | 2.6% |
| Bhutanese | 7 | 0.0% |
| Blackfeet | 24 | 0.1% |
| Brazilian | 10 | 0.0% |
| British | 299 | 0.8% |
| Burmese | 164 | 0.4% |
| Canadian | 5 | 0.0% |
| Central American | 189 | 0.5% |
| Central American Indian | 36 | 0.1% |
| Cherokee | 87 | 0.2% |
| Cheyenne | 4 | 0.0% |
| Chickasaw | 7 | 0.0% |
| Chippewa | 2 | 0.0% |
| Choctaw | 18 | 0.1% |
| Colombian | 10 | 0.0% |
| Cree | 7 | 0.0% |
| Croatian | 43 | 0.1% |
| Cuban | 111 | 0.3% |
| Czech | 249 | 0.7% |
| Czechoslovakian | 28 | 0.1% |
| Danish | 113 | 0.3% |
| Delaware | 5 | 0.0% |
| Dutch | 384 | 1.0% |
| Eastern European | 40 | 0.1% |
| Ecuadorian | 16 | 0.0% |
| English | 2,561 | 6.9% |
| Ethiopian | 79 | 0.2% |
| European | 392 | 1.1% |
| Finnish | 15 | 0.0% |
| French | 705 | 1.9% |
| French Canadian | 61 | 0.2% |
| German | 6,538 | 17.5% |
| German Russian | 5 | 0.0% |
| Ghanaian | 20 | 0.1% |
| Greek | 169 | 0.4% |
| Guamanian / Chamorro | 52 | 0.1% |
| Guatemalan | 98 | 0.3% |
| Haitian | 8 | 0.0% |
| Honduran | 85 | 0.2% |
| Hungarian | 46 | 0.1% |
| Indian (Asian) | 180 | 0.5% |
| Indonesian | 902 | 2.4% |
| Iraqi | 5 | 0.0% |
| Irish | 4,517 | 12.1% |
| Italian | 888 | 2.4% |
| Kiowa | 4 | 0.0% |
| Korean | 153 | 0.4% |
| Lebanese | 7 | 0.0% |
| Liberian | 13 | 0.0% |
| Lithuanian | 119 | 0.3% |
| Mexican | 4,438 | 11.9% |
| Mexican American Indian | 19 | 0.1% |
| Mongolian | 12 | 0.0% |
| Moroccan | 12 | 0.0% |
| Native Hawaiian | 220 | 0.6% |
| Nicaraguan | 6 | 0.0% |
| Nigerian | 9 | 0.0% |
| Northern European | 16 | 0.0% |
| Norwegian | 423 | 1.1% |
| Pakistani | 46 | 0.1% |
| Palestinian | 13 | 0.0% |
| Peruvian | 10 | 0.0% |
| Polish | 553 | 1.5% |
| Portuguese | 17 | 0.1% |
| Puerto Rican | 137 | 0.4% |
| Romanian | 60 | 0.2% |
| Russian | 197 | 0.5% |
| Samoan | 8 | 0.0% |
| Scandinavian | 131 | 0.4% |
| Scotch-Irish | 208 | 0.6% |
| Scottish | 377 | 1.0% |
| Serbian | 26 | 0.1% |
| Sioux | 4 | 0.0% |
| Slavic | 8 | 0.0% |
| Slovak | 13 | 0.0% |
| Slovene | 22 | 0.1% |
| South American | 36 | 0.1% |
| Spaniard | 99 | 0.3% |
| Spanish | 55 | 0.2% |
| Sri Lankan | 99 | 0.3% |
| Subsaharan African | 1,173 | 3.2% |
| Swedish | 1,267 | 3.4% |
| Swiss | 40 | 0.1% |
| Thai | 121 | 0.3% |
| Ugandan | 1 | 0.0% |
| Ukrainian | 24 | 0.1% |
| Welsh | 155 | 0.4% |
| Yugoslavian | 10 | 0.0% | View All 95 Rows |
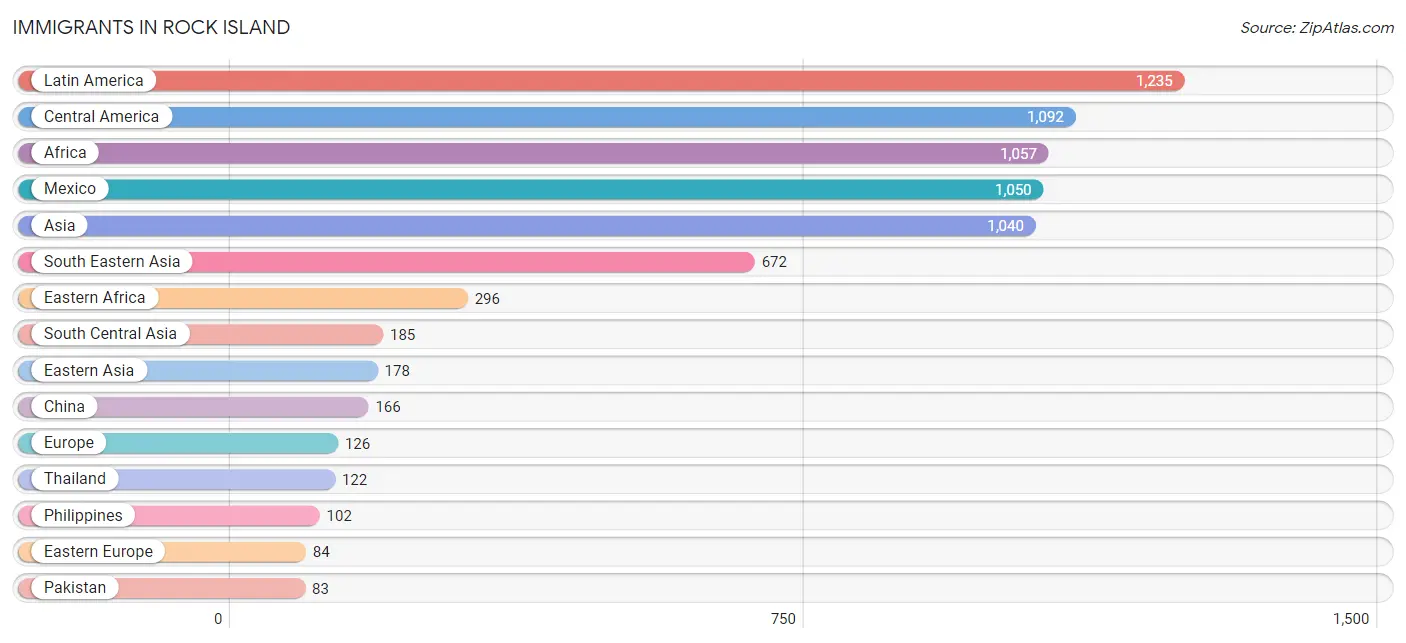
Immigrants in Rock Island
The most numerous immigrant groups reported in Rock Island came from Latin America (1,235 | 3.3%), Central America (1,092 | 2.9%), Africa (1,057 | 2.8%), Mexico (1,050 | 2.8%), and Asia (1,040 | 2.8%), together accounting for 14.7% of all Rock Island residents.
| Immigration Origin | # Population | % Population |
| Africa | 1,057 | 2.8% |
| Asia | 1,040 | 2.8% |
| Belarus | 38 | 0.1% |
| Brazil | 11 | 0.0% |
| Canada | 8 | 0.0% |
| Caribbean | 60 | 0.2% |
| Central America | 1,092 | 2.9% |
| China | 166 | 0.4% |
| Colombia | 10 | 0.0% |
| Congo | 22 | 0.1% |
| Cuba | 42 | 0.1% |
| Eastern Africa | 296 | 0.8% |
| Eastern Asia | 178 | 0.5% |
| Eastern Europe | 84 | 0.2% |
| Ecuador | 11 | 0.0% |
| England | 12 | 0.0% |
| Ethiopia | 55 | 0.2% |
| Europe | 126 | 0.3% |
| Ghana | 34 | 0.1% |
| Guatemala | 36 | 0.1% |
| Guyana | 51 | 0.1% |
| India | 74 | 0.2% |
| Iraq | 5 | 0.0% |
| Italy | 13 | 0.0% |
| Korea | 12 | 0.0% |
| Latin America | 1,235 | 3.3% |
| Liberia | 13 | 0.0% |
| Malaysia | 28 | 0.1% |
| Mexico | 1,050 | 2.8% |
| Middle Africa | 78 | 0.2% |
| Moldova | 5 | 0.0% |
| Morocco | 12 | 0.0% |
| Nepal | 28 | 0.1% |
| Netherlands | 17 | 0.1% |
| Nicaragua | 6 | 0.0% |
| Nigeria | 14 | 0.0% |
| Northern Africa | 12 | 0.0% |
| Northern Europe | 12 | 0.0% |
| Pakistan | 83 | 0.2% |
| Philippines | 102 | 0.3% |
| Poland | 11 | 0.0% |
| Russia | 9 | 0.0% |
| Serbia | 21 | 0.1% |
| South America | 83 | 0.2% |
| South Central Asia | 185 | 0.5% |
| South Eastern Asia | 672 | 1.8% |
| Southern Europe | 13 | 0.0% |
| St. Vincent and the Grenadines | 18 | 0.1% |
| Taiwan | 10 | 0.0% |
| Thailand | 122 | 0.3% |
| Uganda | 1 | 0.0% |
| Vietnam | 70 | 0.2% |
| Western Africa | 79 | 0.2% |
| Western Asia | 5 | 0.0% |
| Western Europe | 17 | 0.1% |
| Zaire | 56 | 0.2% | View All 56 Rows |
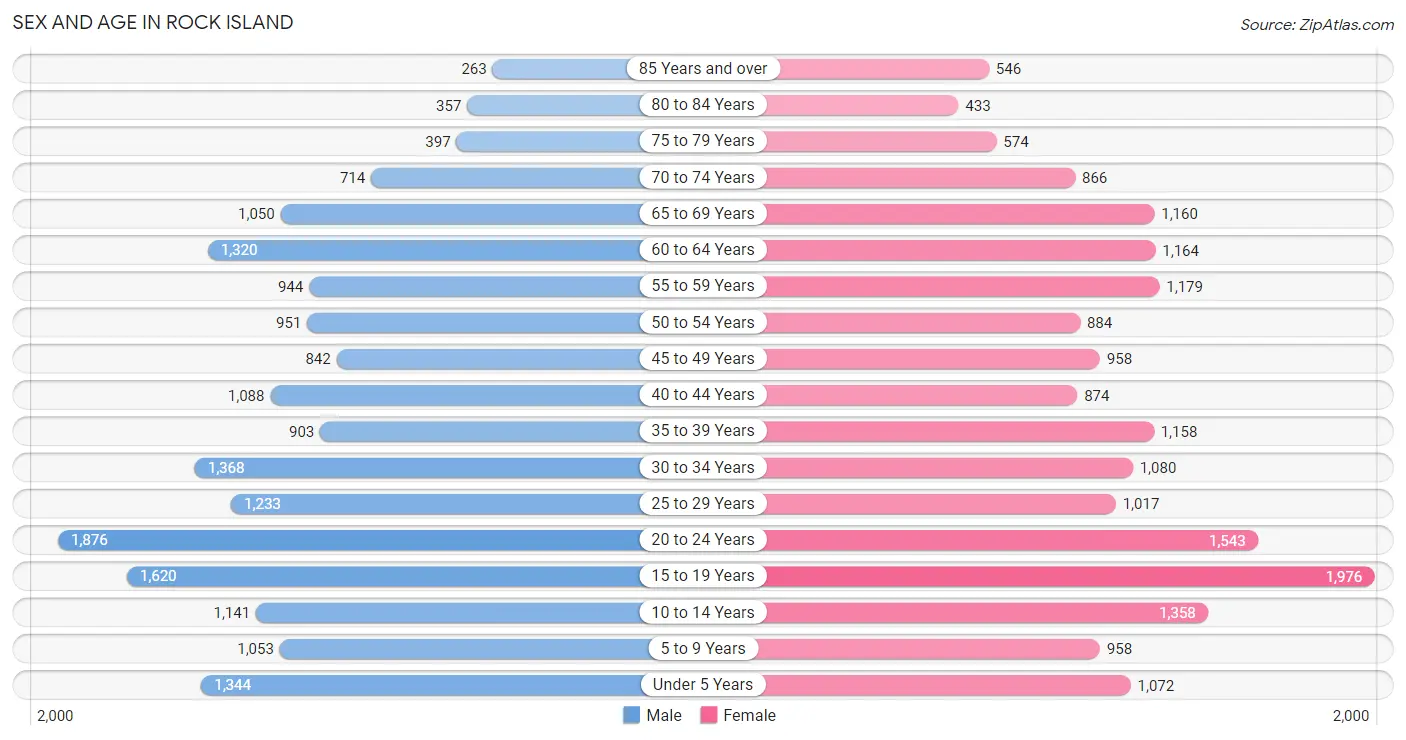
Sex and Age in Rock Island
Sex and Age in Rock Island
The most populous age groups in Rock Island are 20 to 24 Years (1,876 | 10.2%) for men and 15 to 19 Years (1,976 | 10.5%) for women.
| Age Bracket | Male | Female |
| Under 5 Years | 1,344 (7.3%) | 1,072 (5.7%) |
| 5 to 9 Years | 1,053 (5.7%) | 958 (5.1%) |
| 10 to 14 Years | 1,141 (6.2%) | 1,358 (7.2%) |
| 15 to 19 Years | 1,620 (8.8%) | 1,976 (10.5%) |
| 20 to 24 Years | 1,876 (10.2%) | 1,543 (8.2%) |
| 25 to 29 Years | 1,233 (6.7%) | 1,017 (5.4%) |
| 30 to 34 Years | 1,368 (7.4%) | 1,080 (5.7%) |
| 35 to 39 Years | 903 (4.9%) | 1,158 (6.2%) |
| 40 to 44 Years | 1,088 (5.9%) | 874 (4.6%) |
| 45 to 49 Years | 842 (4.6%) | 958 (5.1%) |
| 50 to 54 Years | 951 (5.1%) | 884 (4.7%) |
| 55 to 59 Years | 944 (5.1%) | 1,179 (6.3%) |
| 60 to 64 Years | 1,320 (7.1%) | 1,164 (6.2%) |
| 65 to 69 Years | 1,050 (5.7%) | 1,160 (6.2%) |
| 70 to 74 Years | 714 (3.9%) | 866 (4.6%) |
| 75 to 79 Years | 397 (2.1%) | 574 (3.0%) |
| 80 to 84 Years | 357 (1.9%) | 433 (2.3%) |
| 85 Years and over | 263 (1.4%) | 546 (2.9%) |
| Total | 18,464 (100.0%) | 18,800 (100.0%) |
Families and Households in Rock Island
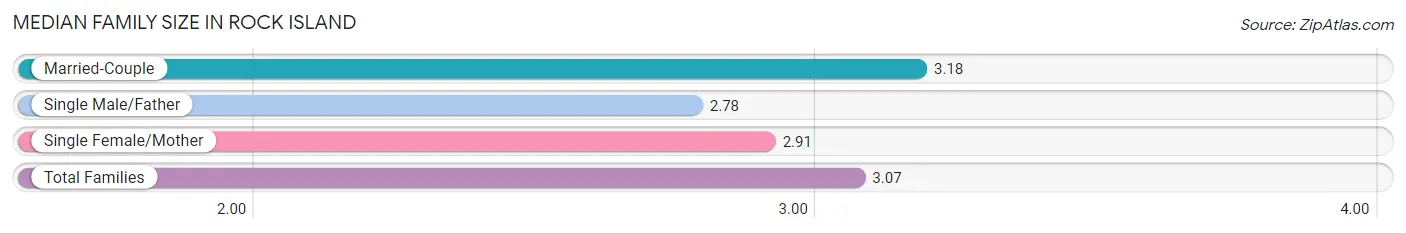
Median Family Size in Rock Island
The median family size in Rock Island is 3.07 persons per family, with married-couple families (5,176 | 64.9%) accounting for the largest median family size of 3.18 persons per family. On the other hand, single male/father families (662 | 8.3%) represent the smallest median family size with 2.78 persons per family.
| Family Type | # Families | Family Size |
| Married-Couple | 5,176 (64.9%) | 3.18 |
| Single Male/Father | 662 (8.3%) | 2.78 |
| Single Female/Mother | 2,136 (26.8%) | 2.91 |
| Total Families | 7,974 (100.0%) | 3.07 |
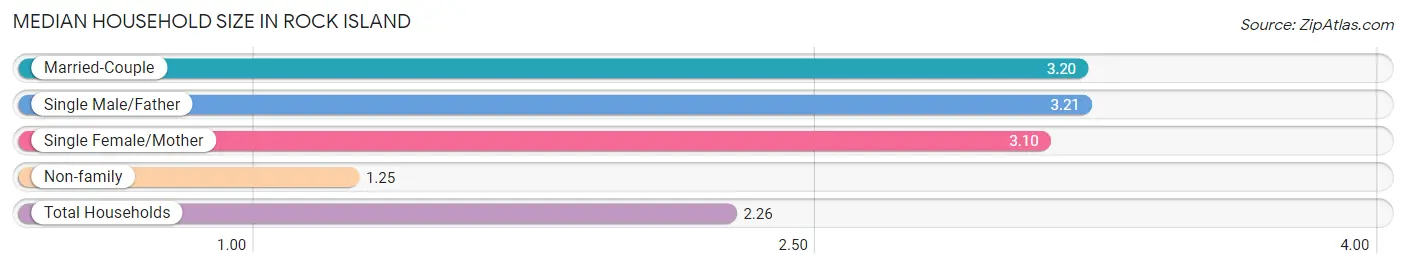
Median Household Size in Rock Island
The median household size in Rock Island is 2.26 persons per household, with single male/father households (662 | 4.3%) accounting for the largest median household size of 3.21 persons per household. non-family households (7,273 | 47.7%) represent the smallest median household size with 1.25 persons per household.
| Household Type | # Households | Household Size |
| Married-Couple | 5,176 (34.0%) | 3.20 |
| Single Male/Father | 662 (4.3%) | 3.21 |
| Single Female/Mother | 2,136 (14.0%) | 3.10 |
| Non-family | 7,273 (47.7%) | 1.25 |
| Total Households | 15,247 (100.0%) | 2.26 |
Household Size by Marriage Status in Rock Island
Out of a total of 15,247 households in Rock Island, 7,974 (52.3%) are family households, while 7,273 (47.7%) are nonfamily households. The most numerous type of family households are 2-person households, comprising 3,939, and the most common type of nonfamily households are 1-person households, comprising 5,722.
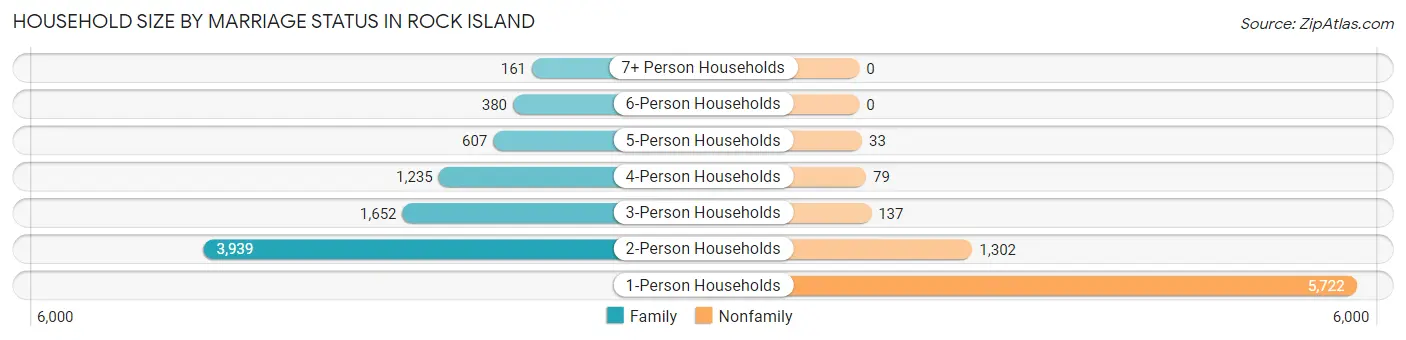
| Household Size | Family Households | Nonfamily Households |
| 1-Person Households | - | 5,722 (37.5%) |
| 2-Person Households | 3,939 (25.8%) | 1,302 (8.5%) |
| 3-Person Households | 1,652 (10.8%) | 137 (0.9%) |
| 4-Person Households | 1,235 (8.1%) | 79 (0.5%) |
| 5-Person Households | 607 (4.0%) | 33 (0.2%) |
| 6-Person Households | 380 (2.5%) | 0 (0.0%) |
| 7+ Person Households | 161 (1.1%) | 0 (0.0%) |
| Total | 7,974 (52.3%) | 7,273 (47.7%) |
Female Fertility in Rock Island
Fertility by Age in Rock Island
Average fertility rate in Rock Island is 79.0 births per 1,000 women. Women in the age bracket of 20 to 34 years have the highest fertility rate with 143.0 births per 1,000 women. Women in the age bracket of 20 to 34 years acount for 74.1% of all women with births.
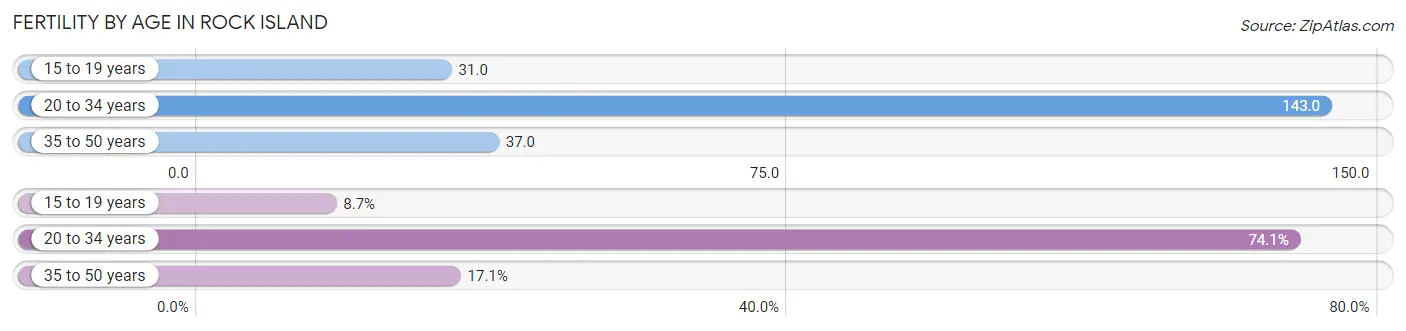
| Age Bracket | Women with Births | Births / 1,000 Women |
| 15 to 19 years | 61 (8.7%) | 31.0 |
| 20 to 34 years | 519 (74.1%) | 143.0 |
| 35 to 50 years | 120 (17.1%) | 37.0 |
| Total | 700 (100.0%) | 79.0 |
Fertility by Age by Marriage Status in Rock Island
49.1% of women with births (700) in Rock Island are married. The highest percentage of unmarried women with births falls into 15 to 19 years age bracket with 100.0% of them unmarried at the time of birth, while the lowest percentage of unmarried women with births belong to 35 to 50 years age bracket with 45.8% of them unmarried.
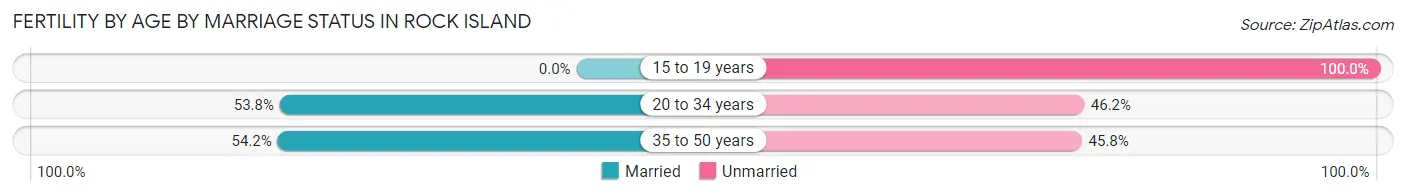
| Age Bracket | Married | Unmarried |
| 15 to 19 years | 0 (0.0%) | 61 (100.0%) |
| 20 to 34 years | 279 (53.8%) | 240 (46.2%) |
| 35 to 50 years | 65 (54.2%) | 55 (45.8%) |
| Total | 344 (49.1%) | 356 (50.9%) |
Fertility by Education in Rock Island
Average fertility rate in Rock Island is 79.0 births per 1,000 women. Women with the education attainment of high school diploma have the highest fertility rate of 107.0 births per 1,000 women, while women with the education attainment of graduate degree have the lowest fertility at 32.0 births per 1,000 women. Women with the education attainment of high school diploma represent 35.3% of all women with births.
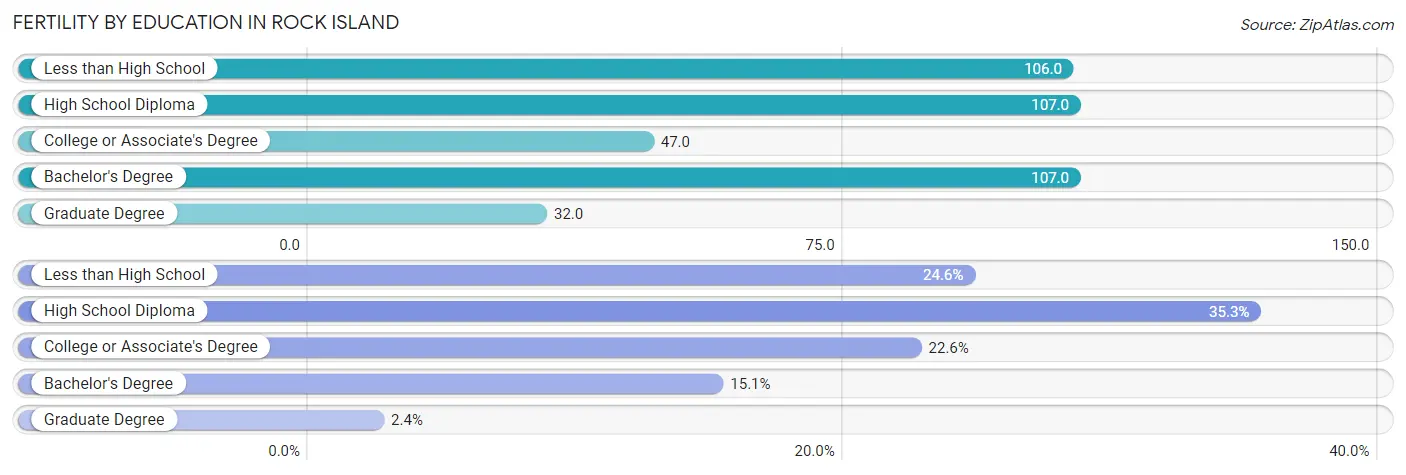
| Educational Attainment | Women with Births | Births / 1,000 Women |
| Less than High School | 172 (24.6%) | 106.0 |
| High School Diploma | 247 (35.3%) | 107.0 |
| College or Associate's Degree | 158 (22.6%) | 47.0 |
| Bachelor's Degree | 106 (15.1%) | 107.0 |
| Graduate Degree | 17 (2.4%) | 32.0 |
| Total | 700 (100.0%) | 79.0 |
Fertility by Education by Marriage Status in Rock Island
50.9% of women with births in Rock Island are unmarried. Women with the educational attainment of bachelor's degree are most likely to be married with 81.1% of them married at childbirth, while women with the educational attainment of less than high school are least likely to be married with 72.1% of them unmarried at childbirth.
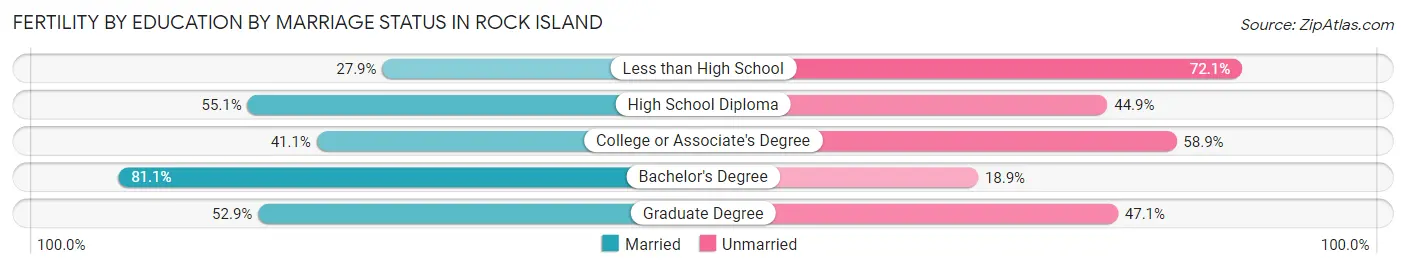
| Educational Attainment | Married | Unmarried |
| Less than High School | 48 (27.9%) | 124 (72.1%) |
| High School Diploma | 136 (55.1%) | 111 (44.9%) |
| College or Associate's Degree | 65 (41.1%) | 93 (58.9%) |
| Bachelor's Degree | 86 (81.1%) | 20 (18.9%) |
| Graduate Degree | 9 (52.9%) | 8 (47.1%) |
| Total | 344 (49.1%) | 356 (50.9%) |
Employment Characteristics in Rock Island
Employment by Class of Employer in Rock Island
Among the 16,232 employed individuals in Rock Island, private company employees (11,730 | 72.3%), not-for-profit organizations (1,656 | 10.2%), and local government employees (1,121 | 6.9%) make up the most common classes of employment.
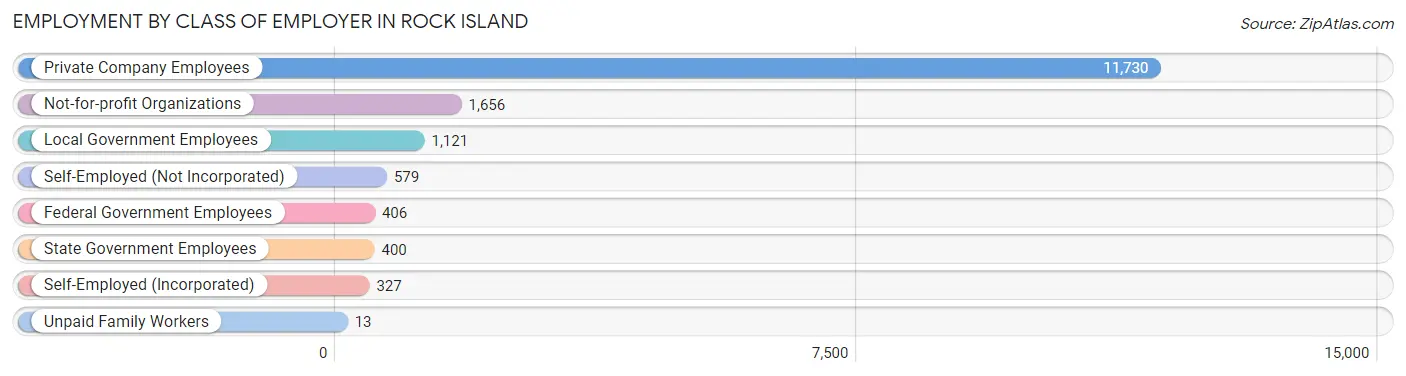
| Employer Class | # Employees | % Employees |
| Private Company Employees | 11,730 | 72.3% |
| Self-Employed (Incorporated) | 327 | 2.0% |
| Self-Employed (Not Incorporated) | 579 | 3.6% |
| Not-for-profit Organizations | 1,656 | 10.2% |
| Local Government Employees | 1,121 | 6.9% |
| State Government Employees | 400 | 2.5% |
| Federal Government Employees | 406 | 2.5% |
| Unpaid Family Workers | 13 | 0.1% |
| Total | 16,232 | 100.0% |
Employment Status by Age in Rock Island
According to the labor force statistics for Rock Island, out of the total population over 16 years of age (29,832), 61.3% or 18,287 individuals are in the labor force, with 7.3% or 1,335 of them unemployed. The age group with the highest labor force participation rate is 35 to 44 years, with 83.0% or 3,339 individuals in the labor force. Within the labor force, the 75 years and over age range has the highest percentage of unemployed individuals, with 16.5% or 23 of them being unemployed.
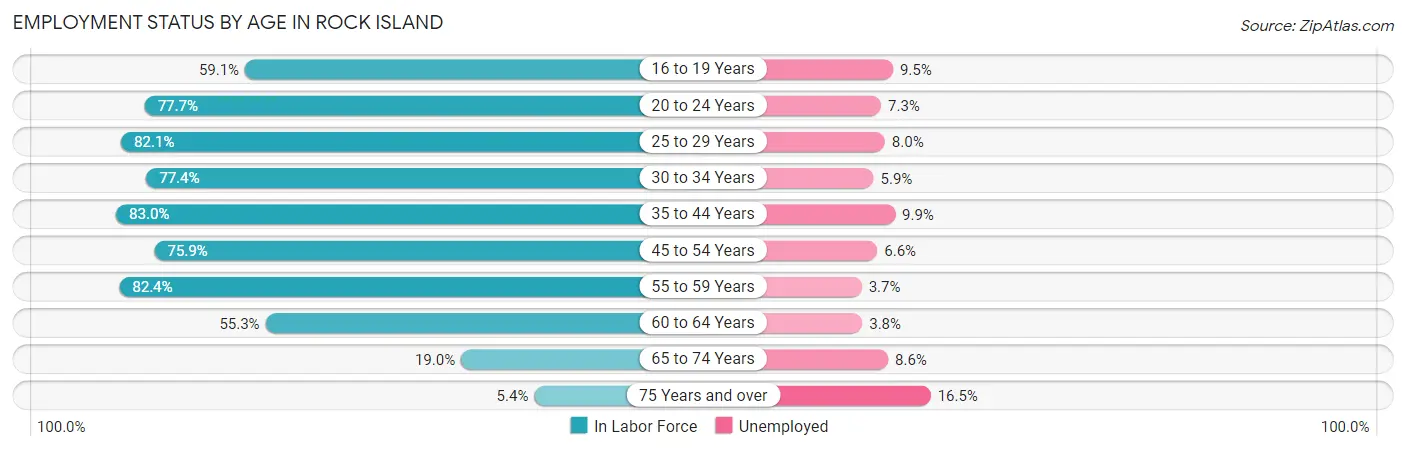
| Age Bracket | In Labor Force | Unemployed |
| 16 to 19 Years | 1,826 (59.1%) | 173 (9.5%) |
| 20 to 24 Years | 2,657 (77.7%) | 194 (7.3%) |
| 25 to 29 Years | 1,847 (82.1%) | 148 (8.0%) |
| 30 to 34 Years | 1,895 (77.4%) | 112 (5.9%) |
| 35 to 44 Years | 3,339 (83.0%) | 331 (9.9%) |
| 45 to 54 Years | 2,759 (75.9%) | 182 (6.6%) |
| 55 to 59 Years | 1,749 (82.4%) | 65 (3.7%) |
| 60 to 64 Years | 1,374 (55.3%) | 52 (3.8%) |
| 65 to 74 Years | 720 (19.0%) | 62 (8.6%) |
| 75 Years and over | 139 (5.4%) | 23 (16.5%) |
| Total | 18,287 (61.3%) | 1,335 (7.3%) |
Employment Status by Educational Attainment in Rock Island
According to labor force statistics for Rock Island, 76.4% of individuals (12,960) out of the total population between 25 and 64 years of age (16,963) are in the labor force, with 6.9% or 894 of them being unemployed. The group with the highest labor force participation rate are those with the educational attainment of bachelor's degree or higher, with 89.6% or 3,376 individuals in the labor force. Within the labor force, individuals with less than high school education have the highest percentage of unemployment, with 22.7% or 284 of them being unemployed.
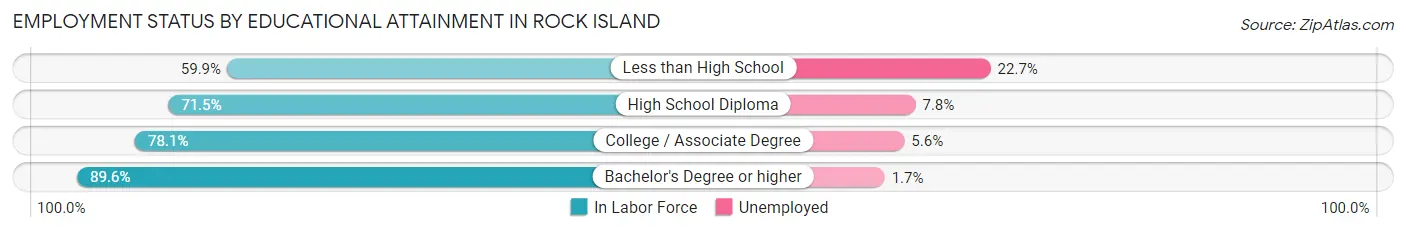
| Educational Attainment | In Labor Force | Unemployed |
| Less than High School | 1,253 (59.9%) | 475 (22.7%) |
| High School Diploma | 3,712 (71.5%) | 405 (7.8%) |
| College / Associate Degree | 4,617 (78.1%) | 331 (5.6%) |
| Bachelor's Degree or higher | 3,376 (89.6%) | 64 (1.7%) |
| Total | 12,960 (76.4%) | 1,170 (6.9%) |
Employment Occupations by Sex in Rock Island
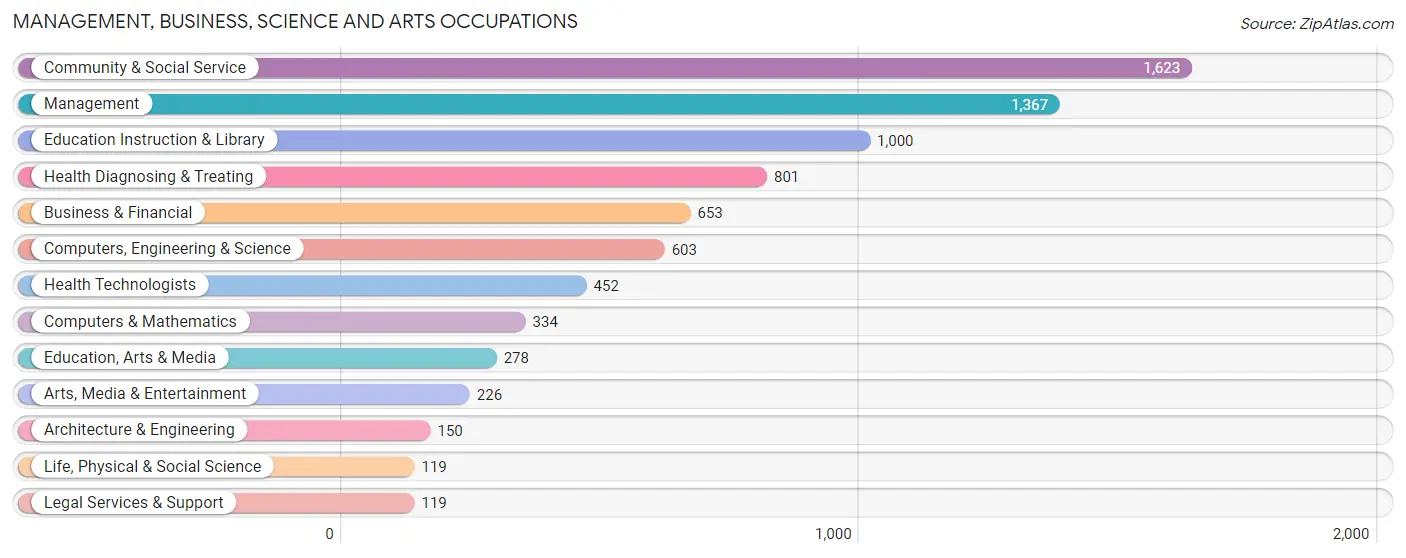
Management, Business, Science and Arts Occupations
The most common Management, Business, Science and Arts occupations in Rock Island are Community & Social Service (1,623 | 9.6%), Management (1,367 | 8.1%), Education Instruction & Library (1,000 | 5.9%), Health Diagnosing & Treating (801 | 4.7%), and Business & Financial (653 | 3.8%).
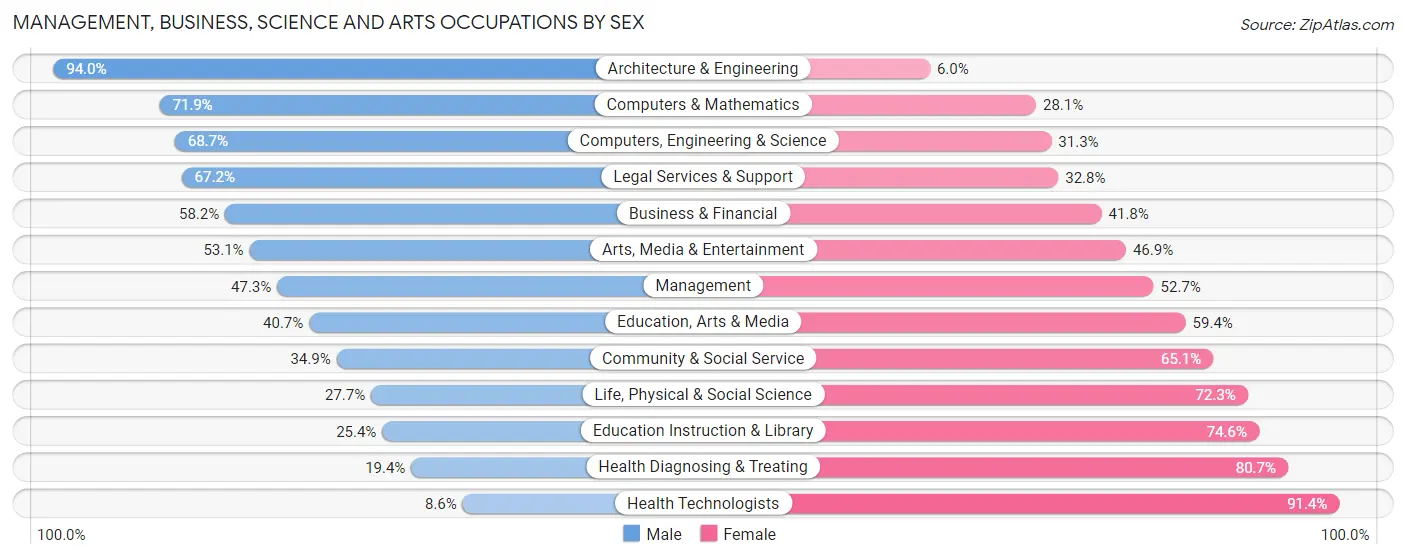
Management, Business, Science and Arts Occupations by Sex
Within the Management, Business, Science and Arts occupations in Rock Island, the most male-oriented occupations are Architecture & Engineering (94.0%), Computers & Mathematics (71.9%), and Computers, Engineering & Science (68.7%), while the most female-oriented occupations are Health Technologists (91.4%), Health Diagnosing & Treating (80.6%), and Education Instruction & Library (74.6%).
| Occupation | Male | Female |
| Management | 647 (47.3%) | 720 (52.7%) |
| Business & Financial | 380 (58.2%) | 273 (41.8%) |
| Computers, Engineering & Science | 414 (68.7%) | 189 (31.3%) |
| Computers & Mathematics | 240 (71.9%) | 94 (28.1%) |
| Architecture & Engineering | 141 (94.0%) | 9 (6.0%) |
| Life, Physical & Social Science | 33 (27.7%) | 86 (72.3%) |
| Community & Social Service | 567 (34.9%) | 1,056 (65.1%) |
| Education, Arts & Media | 113 (40.6%) | 165 (59.4%) |
| Legal Services & Support | 80 (67.2%) | 39 (32.8%) |
| Education Instruction & Library | 254 (25.4%) | 746 (74.6%) |
| Arts, Media & Entertainment | 120 (53.1%) | 106 (46.9%) |
| Health Diagnosing & Treating | 155 (19.4%) | 646 (80.6%) |
| Health Technologists | 39 (8.6%) | 413 (91.4%) |
| Total (Category) | 2,163 (42.9%) | 2,884 (57.1%) |
| Total (Overall) | 8,712 (51.4%) | 8,246 (48.6%) |
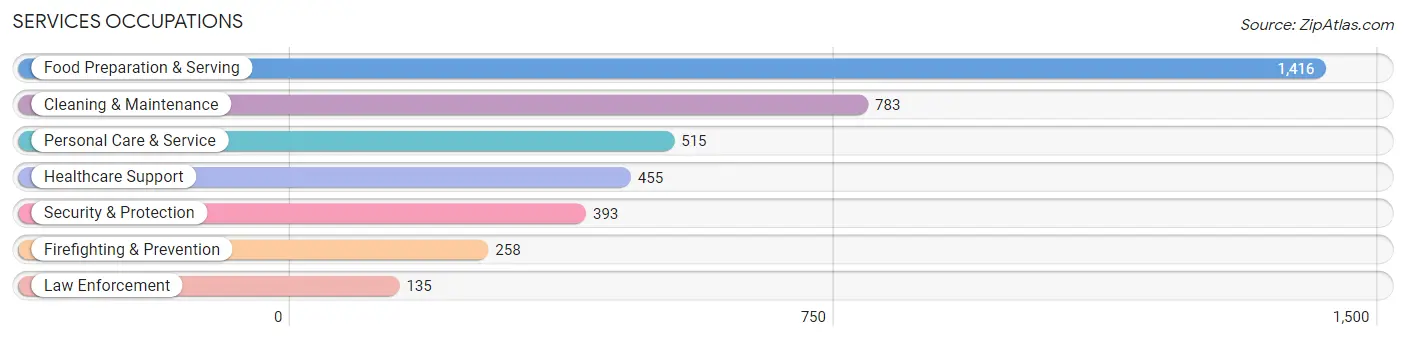
Services Occupations
The most common Services occupations in Rock Island are Food Preparation & Serving (1,416 | 8.4%), Cleaning & Maintenance (783 | 4.6%), Personal Care & Service (515 | 3.0%), Healthcare Support (455 | 2.7%), and Security & Protection (393 | 2.3%).
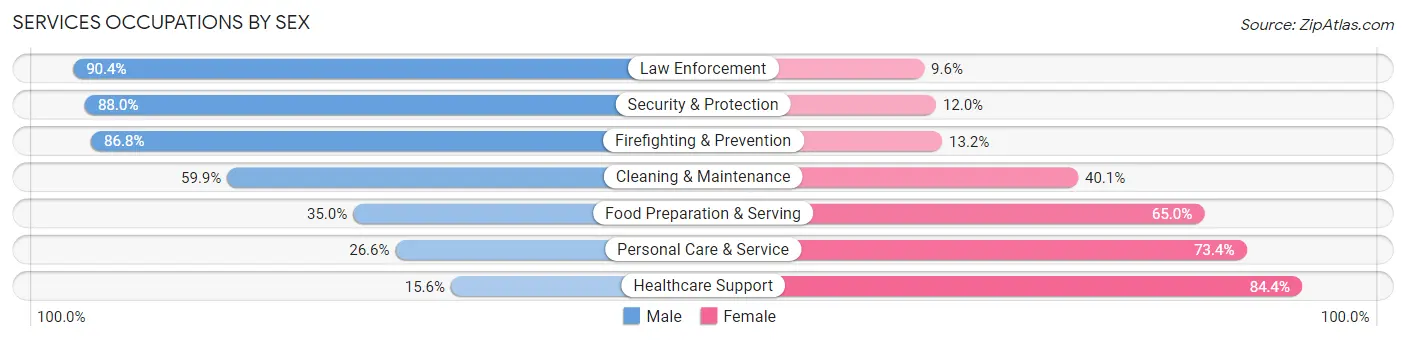
Services Occupations by Sex
Within the Services occupations in Rock Island, the most male-oriented occupations are Law Enforcement (90.4%), Security & Protection (88.0%), and Firefighting & Prevention (86.8%), while the most female-oriented occupations are Healthcare Support (84.4%), Personal Care & Service (73.4%), and Food Preparation & Serving (65.0%).
| Occupation | Male | Female |
| Healthcare Support | 71 (15.6%) | 384 (84.4%) |
| Security & Protection | 346 (88.0%) | 47 (12.0%) |
| Firefighting & Prevention | 224 (86.8%) | 34 (13.2%) |
| Law Enforcement | 122 (90.4%) | 13 (9.6%) |
| Food Preparation & Serving | 495 (35.0%) | 921 (65.0%) |
| Cleaning & Maintenance | 469 (59.9%) | 314 (40.1%) |
| Personal Care & Service | 137 (26.6%) | 378 (73.4%) |
| Total (Category) | 1,518 (42.6%) | 2,044 (57.4%) |
| Total (Overall) | 8,712 (51.4%) | 8,246 (48.6%) |
Sales and Office Occupations
The most common Sales and Office occupations in Rock Island are Office & Administration (2,210 | 13.0%), and Sales & Related (1,451 | 8.6%).

Sales and Office Occupations by Sex
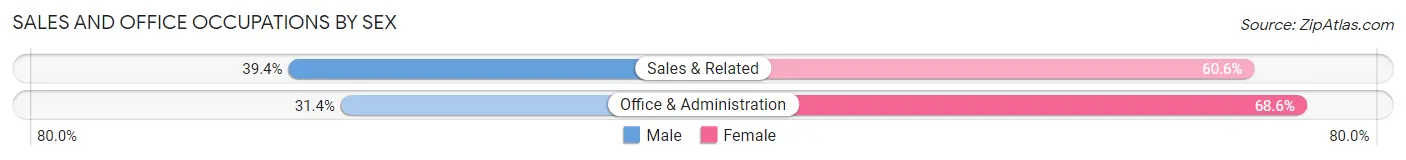
| Occupation | Male | Female |
| Sales & Related | 572 (39.4%) | 879 (60.6%) |
| Office & Administration | 693 (31.4%) | 1,517 (68.6%) |
| Total (Category) | 1,265 (34.5%) | 2,396 (65.4%) |
| Total (Overall) | 8,712 (51.4%) | 8,246 (48.6%) |
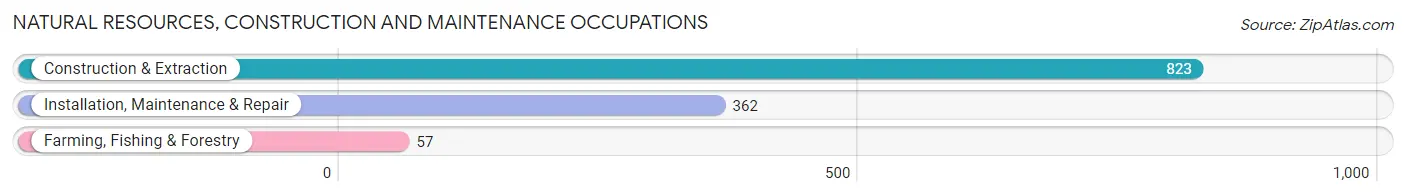
Natural Resources, Construction and Maintenance Occupations
The most common Natural Resources, Construction and Maintenance occupations in Rock Island are Construction & Extraction (823 | 4.9%), Installation, Maintenance & Repair (362 | 2.1%), and Farming, Fishing & Forestry (57 | 0.3%).
Natural Resources, Construction and Maintenance Occupations by Sex
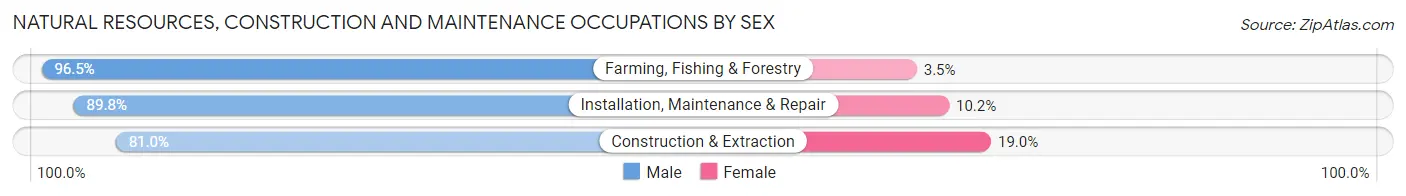
| Occupation | Male | Female |
| Farming, Fishing & Forestry | 55 (96.5%) | 2 (3.5%) |
| Construction & Extraction | 667 (81.0%) | 156 (19.0%) |
| Installation, Maintenance & Repair | 325 (89.8%) | 37 (10.2%) |
| Total (Category) | 1,047 (84.3%) | 195 (15.7%) |
| Total (Overall) | 8,712 (51.4%) | 8,246 (48.6%) |
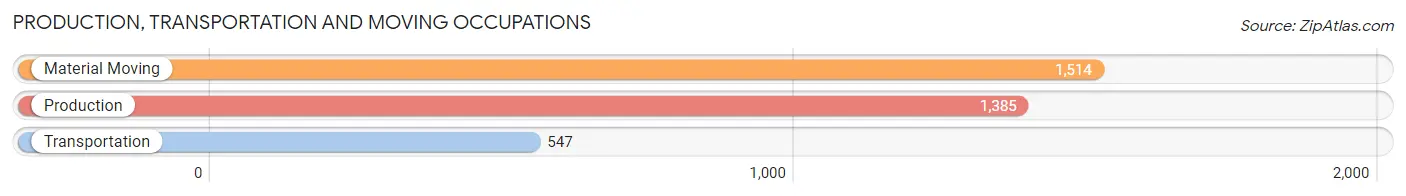
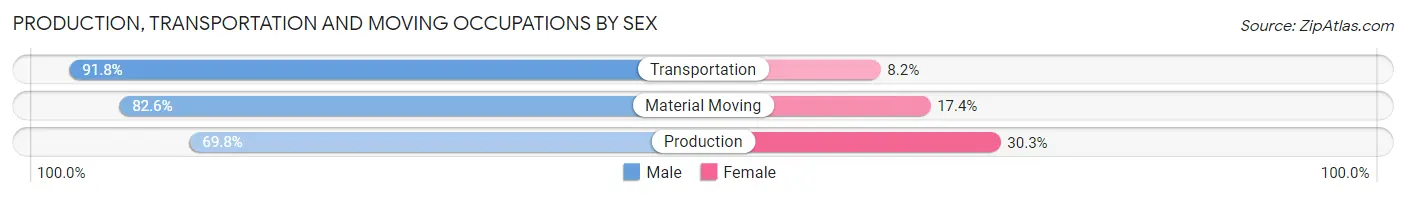
Production, Transportation and Moving Occupations
The most common Production, Transportation and Moving occupations in Rock Island are Material Moving (1,514 | 8.9%), Production (1,385 | 8.2%), and Transportation (547 | 3.2%).
Production, Transportation and Moving Occupations by Sex
| Occupation | Male | Female |
| Production | 966 (69.8%) | 419 (30.2%) |
| Transportation | 502 (91.8%) | 45 (8.2%) |
| Material Moving | 1,251 (82.6%) | 263 (17.4%) |
| Total (Category) | 2,719 (78.9%) | 727 (21.1%) |
| Total (Overall) | 8,712 (51.4%) | 8,246 (48.6%) |
Employment Industries by Sex in Rock Island
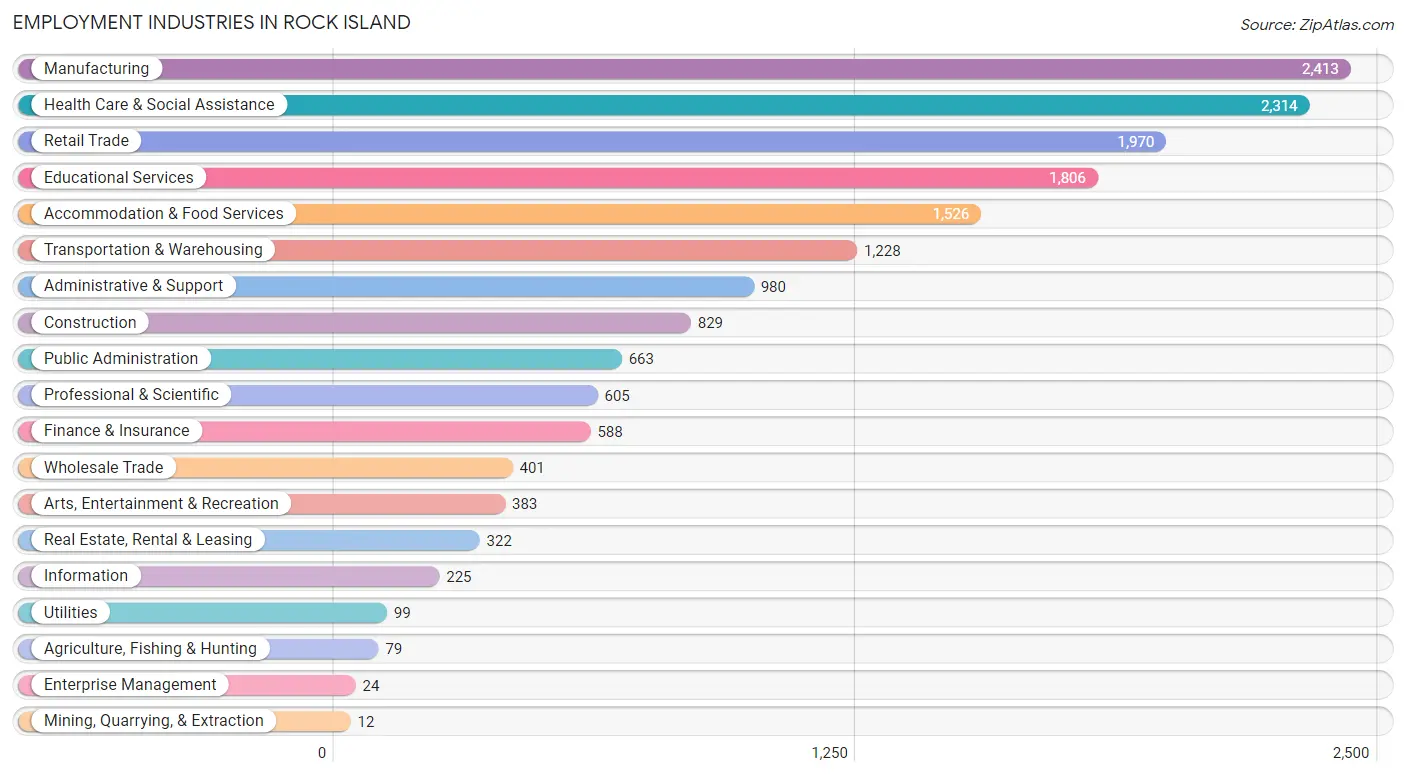
Employment Industries in Rock Island
The major employment industries in Rock Island include Manufacturing (2,413 | 14.2%), Health Care & Social Assistance (2,314 | 13.7%), Retail Trade (1,970 | 11.6%), Educational Services (1,806 | 10.6%), and Accommodation & Food Services (1,526 | 9.0%).
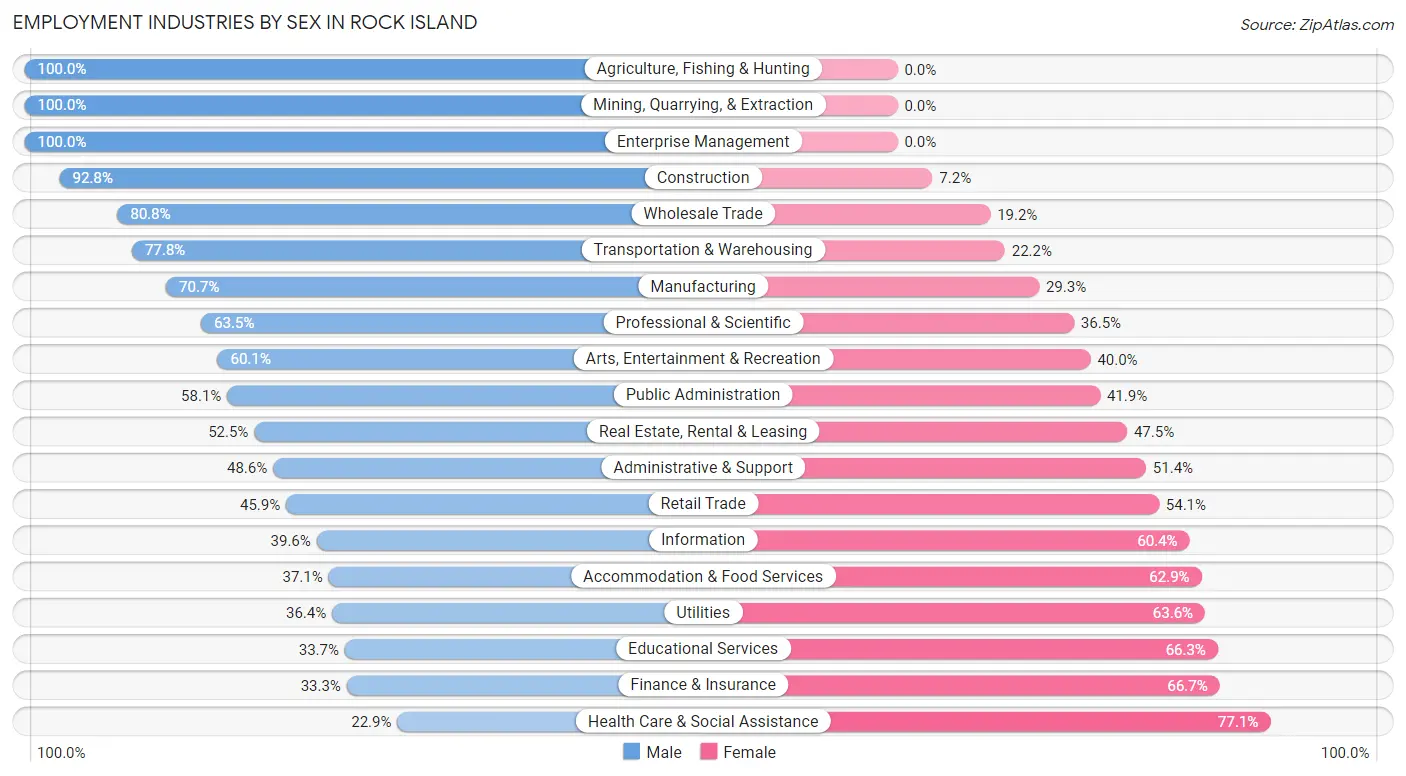
Employment Industries by Sex in Rock Island
The Rock Island industries that see more men than women are Agriculture, Fishing & Hunting (100.0%), Mining, Quarrying, & Extraction (100.0%), and Enterprise Management (100.0%), whereas the industries that tend to have a higher number of women are Health Care & Social Assistance (77.1%), Finance & Insurance (66.7%), and Educational Services (66.3%).
| Industry | Male | Female |
| Agriculture, Fishing & Hunting | 79 (100.0%) | 0 (0.0%) |
| Mining, Quarrying, & Extraction | 12 (100.0%) | 0 (0.0%) |
| Construction | 769 (92.8%) | 60 (7.2%) |
| Manufacturing | 1,706 (70.7%) | 707 (29.3%) |
| Wholesale Trade | 324 (80.8%) | 77 (19.2%) |
| Retail Trade | 904 (45.9%) | 1,066 (54.1%) |
| Transportation & Warehousing | 955 (77.8%) | 273 (22.2%) |
| Utilities | 36 (36.4%) | 63 (63.6%) |
| Information | 89 (39.6%) | 136 (60.4%) |
| Finance & Insurance | 196 (33.3%) | 392 (66.7%) |
| Real Estate, Rental & Leasing | 169 (52.5%) | 153 (47.5%) |
| Professional & Scientific | 384 (63.5%) | 221 (36.5%) |
| Enterprise Management | 24 (100.0%) | 0 (0.0%) |
| Administrative & Support | 476 (48.6%) | 504 (51.4%) |
| Educational Services | 609 (33.7%) | 1,197 (66.3%) |
| Health Care & Social Assistance | 529 (22.9%) | 1,785 (77.1%) |
| Arts, Entertainment & Recreation | 230 (60.1%) | 153 (40.0%) |
| Accommodation & Food Services | 566 (37.1%) | 960 (62.9%) |
| Public Administration | 385 (58.1%) | 278 (41.9%) |
| Total | 8,712 (51.4%) | 8,246 (48.6%) |
Education in Rock Island
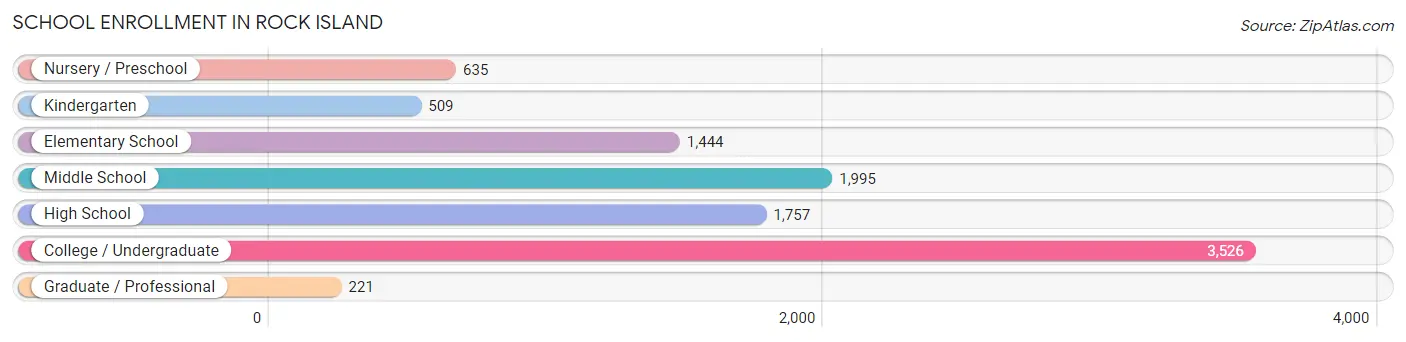
School Enrollment in Rock Island
The most common levels of schooling among the 10,087 students in Rock Island are college / undergraduate (3,526 | 35.0%), middle school (1,995 | 19.8%), and high school (1,757 | 17.4%).
| School Level | # Students | % Students |
| Nursery / Preschool | 635 | 6.3% |
| Kindergarten | 509 | 5.1% |
| Elementary School | 1,444 | 14.3% |
| Middle School | 1,995 | 19.8% |
| High School | 1,757 | 17.4% |
| College / Undergraduate | 3,526 | 35.0% |
| Graduate / Professional | 221 | 2.2% |
| Total | 10,087 | 100.0% |
School Enrollment by Age by Funding Source in Rock Island
Out of a total of 10,087 students who are enrolled in schools in Rock Island, 3,329 (33.0%) attend a private institution, while the remaining 6,758 (67.0%) are enrolled in public schools. The age group of 20 to 24 year olds has the highest likelihood of being enrolled in private schools, with 1,423 (80.4% in the age bracket) enrolled. Conversely, the age group of 3 to 4 year olds has the lowest likelihood of being enrolled in a private school, with 477 (93.0% in the age bracket) attending a public institution.
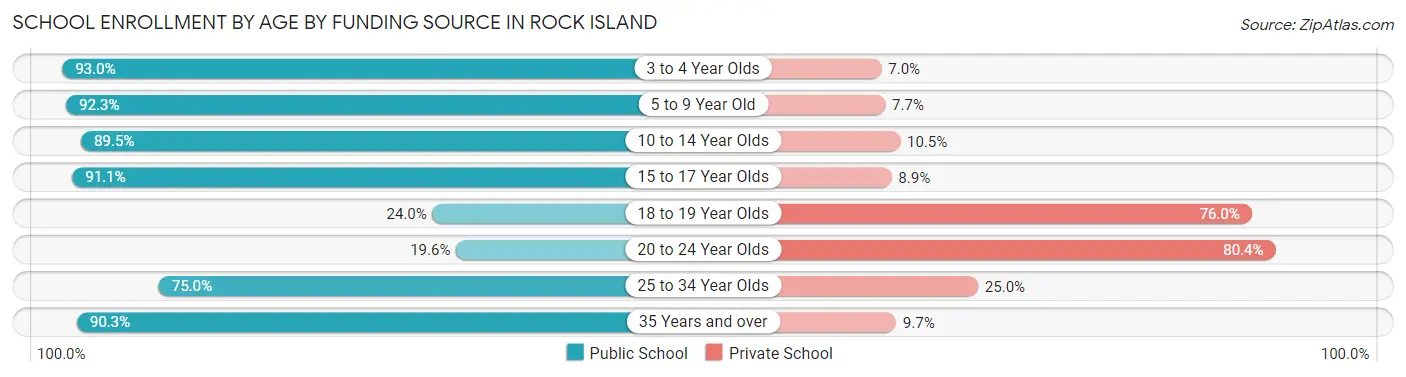
| Age Bracket | Public School | Private School |
| 3 to 4 Year Olds | 477 (93.0%) | 36 (7.0%) |
| 5 to 9 Year Old | 1,743 (92.3%) | 146 (7.7%) |
| 10 to 14 Year Olds | 2,137 (89.5%) | 251 (10.5%) |
| 15 to 17 Year Olds | 1,189 (91.1%) | 116 (8.9%) |
| 18 to 19 Year Olds | 396 (24.0%) | 1,253 (76.0%) |
| 20 to 24 Year Olds | 347 (19.6%) | 1,423 (80.4%) |
| 25 to 34 Year Olds | 237 (75.0%) | 79 (25.0%) |
| 35 Years and over | 232 (90.3%) | 25 (9.7%) |
| Total | 6,758 (67.0%) | 3,329 (33.0%) |
Educational Attainment by Field of Study in Rock Island
Education (968 | 17.1%), business (891 | 15.8%), liberal arts & history (587 | 10.4%), arts & humanities (496 | 8.8%), and science & technology (478 | 8.5%) are the most common fields of study among 5,657 individuals in Rock Island who have obtained a bachelor's degree or higher.
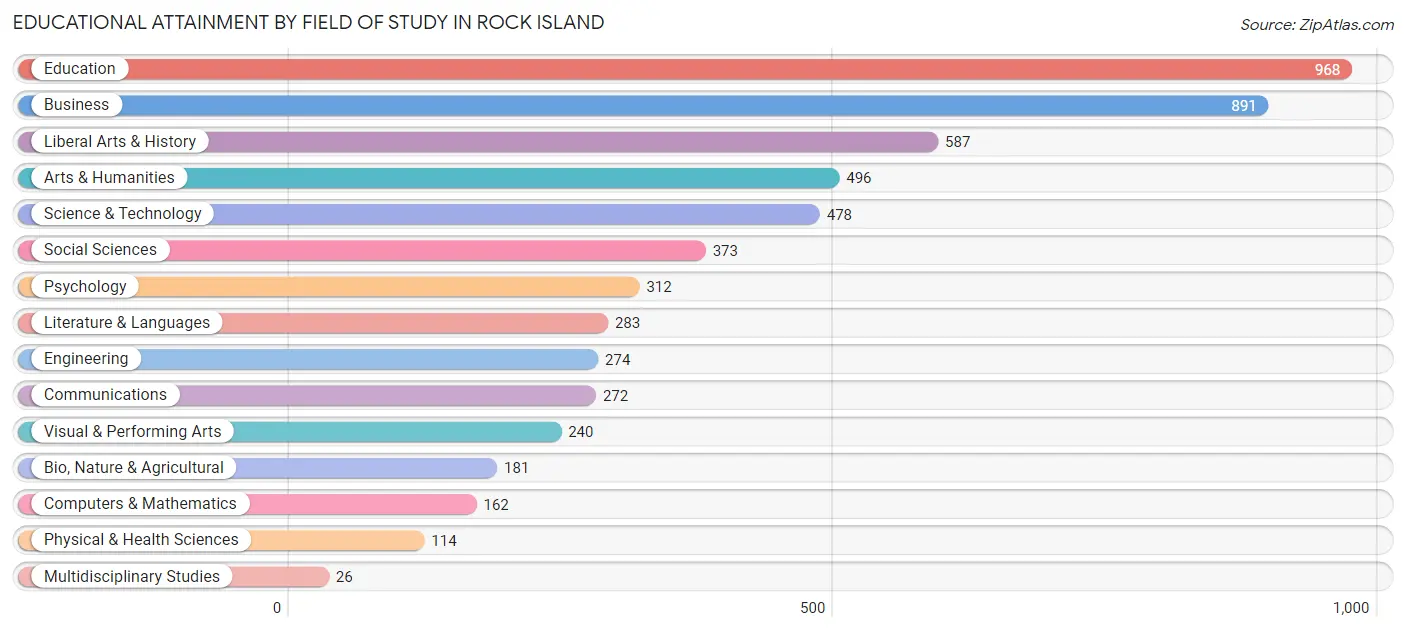
| Field of Study | # Graduates | % Graduates |
| Computers & Mathematics | 162 | 2.9% |
| Bio, Nature & Agricultural | 181 | 3.2% |
| Physical & Health Sciences | 114 | 2.0% |
| Psychology | 312 | 5.5% |
| Social Sciences | 373 | 6.6% |
| Engineering | 274 | 4.8% |
| Multidisciplinary Studies | 26 | 0.5% |
| Science & Technology | 478 | 8.5% |
| Business | 891 | 15.8% |
| Education | 968 | 17.1% |
| Literature & Languages | 283 | 5.0% |
| Liberal Arts & History | 587 | 10.4% |
| Visual & Performing Arts | 240 | 4.2% |
| Communications | 272 | 4.8% |
| Arts & Humanities | 496 | 8.8% |
| Total | 5,657 | 100.0% |
Transportation & Commute in Rock Island
Vehicle Availability by Sex in Rock Island
The most prevalent vehicle ownership categories in Rock Island are males with 2 vehicles (3,804, accounting for 47.6%) and females with 2 vehicles (3,344, making up 52.8%).
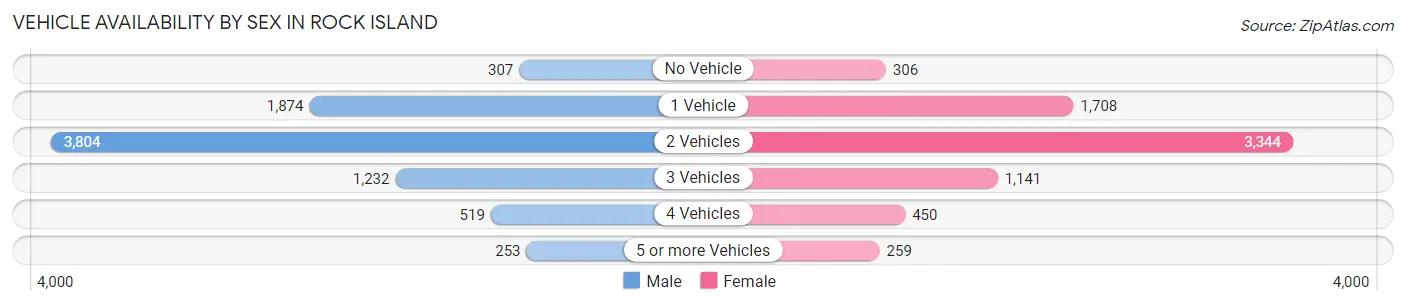
| Vehicles Available | Male | Female |
| No Vehicle | 307 (3.8%) | 306 (4.3%) |
| 1 Vehicle | 1,874 (23.5%) | 1,708 (23.7%) |
| 2 Vehicles | 3,804 (47.6%) | 3,344 (46.4%) |
| 3 Vehicles | 1,232 (15.4%) | 1,141 (15.8%) |
| 4 Vehicles | 519 (6.5%) | 450 (6.2%) |
| 5 or more Vehicles | 253 (3.2%) | 259 (3.6%) |
| Total | 7,989 (100.0%) | 7,208 (100.0%) |
Commute Time in Rock Island
The most frequently occuring commute durations in Rock Island are 15 to 19 minutes (3,637 commuters, 24.0%), 10 to 14 minutes (2,778 commuters, 18.4%), and 20 to 24 minutes (2,539 commuters, 16.8%).
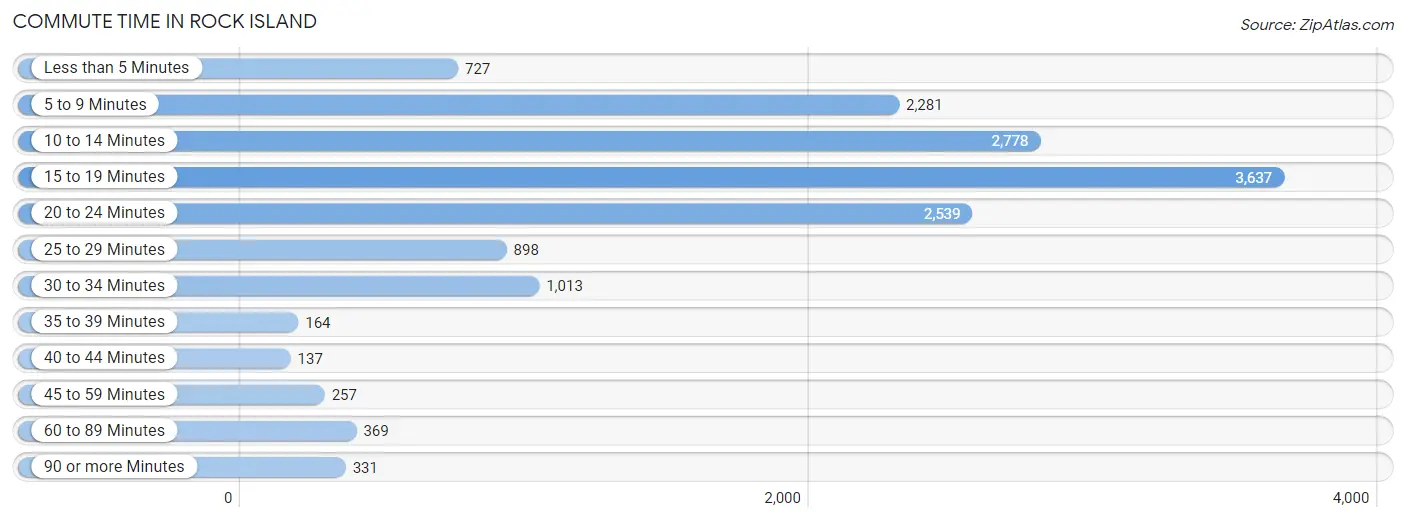
| Commute Time | # Commuters | % Commuters |
| Less than 5 Minutes | 727 | 4.8% |
| 5 to 9 Minutes | 2,281 | 15.1% |
| 10 to 14 Minutes | 2,778 | 18.4% |
| 15 to 19 Minutes | 3,637 | 24.0% |
| 20 to 24 Minutes | 2,539 | 16.8% |
| 25 to 29 Minutes | 898 | 5.9% |
| 30 to 34 Minutes | 1,013 | 6.7% |
| 35 to 39 Minutes | 164 | 1.1% |
| 40 to 44 Minutes | 137 | 0.9% |
| 45 to 59 Minutes | 257 | 1.7% |
| 60 to 89 Minutes | 369 | 2.4% |
| 90 or more Minutes | 331 | 2.2% |
Commute Time by Sex in Rock Island
The most common commute times in Rock Island are 15 to 19 minutes (1,654 commuters, 20.8%) for males and 15 to 19 minutes (1,983 commuters, 27.7%) for females.
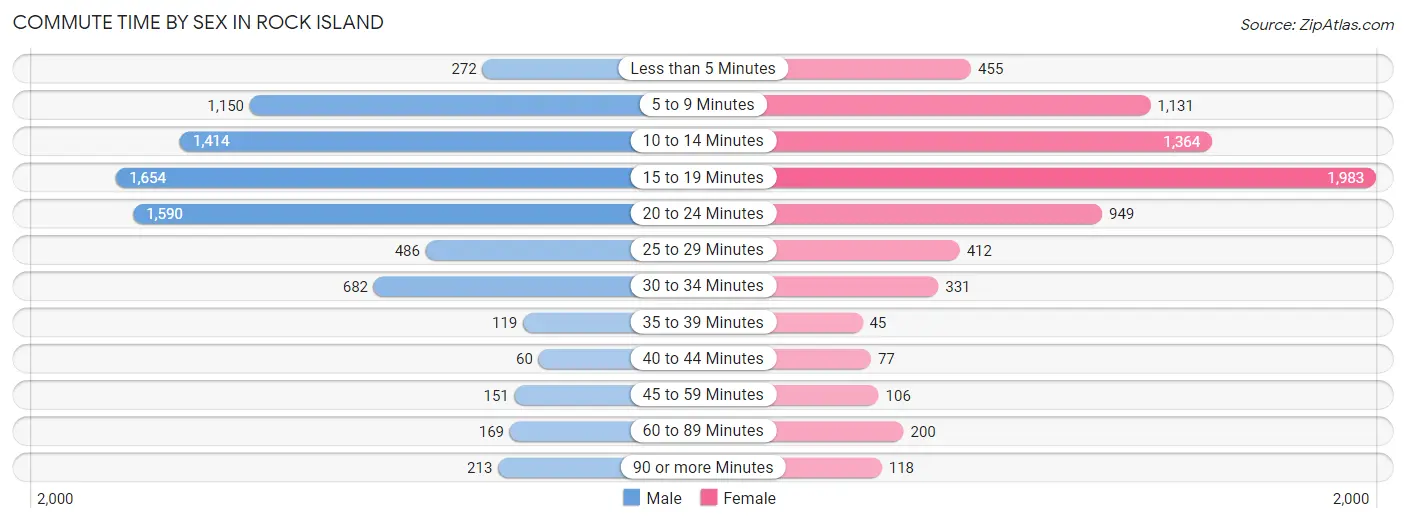
| Commute Time | Male | Female |
| Less than 5 Minutes | 272 (3.4%) | 455 (6.4%) |
| 5 to 9 Minutes | 1,150 (14.4%) | 1,131 (15.8%) |
| 10 to 14 Minutes | 1,414 (17.8%) | 1,364 (19.0%) |
| 15 to 19 Minutes | 1,654 (20.8%) | 1,983 (27.7%) |
| 20 to 24 Minutes | 1,590 (20.0%) | 949 (13.2%) |
| 25 to 29 Minutes | 486 (6.1%) | 412 (5.8%) |
| 30 to 34 Minutes | 682 (8.6%) | 331 (4.6%) |
| 35 to 39 Minutes | 119 (1.5%) | 45 (0.6%) |
| 40 to 44 Minutes | 60 (0.7%) | 77 (1.1%) |
| 45 to 59 Minutes | 151 (1.9%) | 106 (1.5%) |
| 60 to 89 Minutes | 169 (2.1%) | 200 (2.8%) |
| 90 or more Minutes | 213 (2.7%) | 118 (1.7%) |
Time of Departure to Work by Sex in Rock Island
The most frequent times of departure to work in Rock Island are 12:00 PM to 3:59 PM (1,216, 15.3%) for males and 7:30 AM to 7:59 AM (1,252, 17.5%) for females.
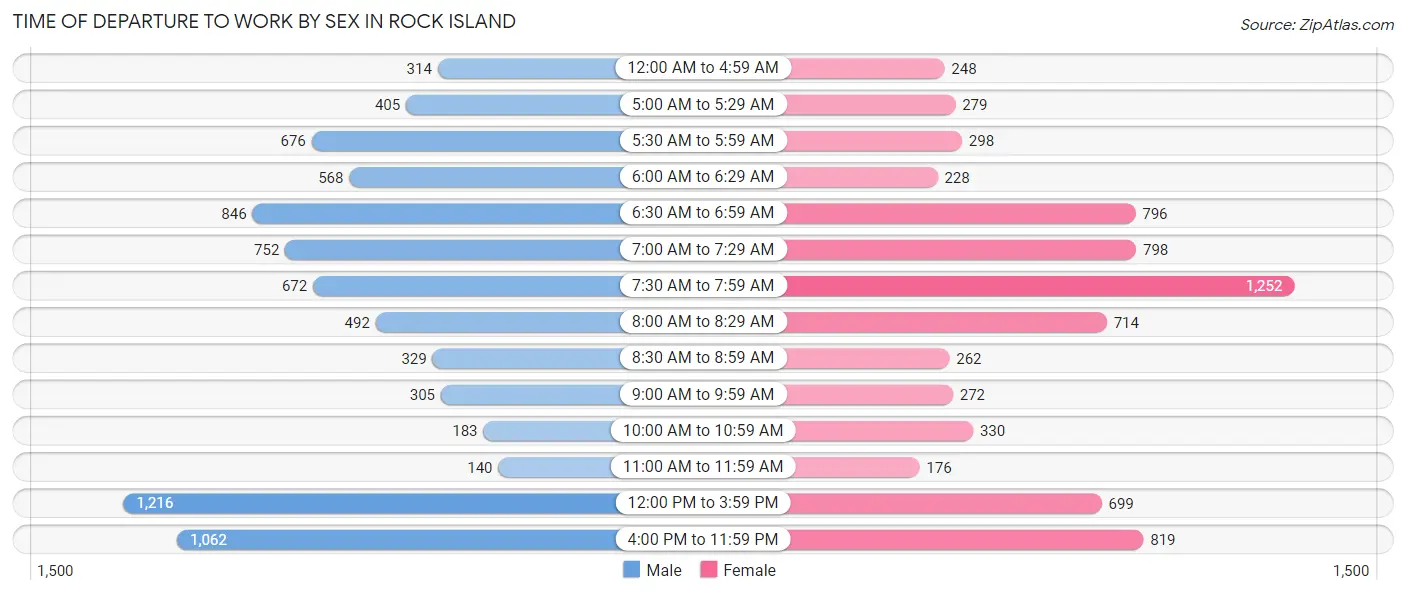
| Time of Departure | Male | Female |
| 12:00 AM to 4:59 AM | 314 (3.9%) | 248 (3.5%) |
| 5:00 AM to 5:29 AM | 405 (5.1%) | 279 (3.9%) |
| 5:30 AM to 5:59 AM | 676 (8.5%) | 298 (4.2%) |
| 6:00 AM to 6:29 AM | 568 (7.1%) | 228 (3.2%) |
| 6:30 AM to 6:59 AM | 846 (10.6%) | 796 (11.1%) |
| 7:00 AM to 7:29 AM | 752 (9.5%) | 798 (11.1%) |
| 7:30 AM to 7:59 AM | 672 (8.4%) | 1,252 (17.5%) |
| 8:00 AM to 8:29 AM | 492 (6.2%) | 714 (10.0%) |
| 8:30 AM to 8:59 AM | 329 (4.1%) | 262 (3.6%) |
| 9:00 AM to 9:59 AM | 305 (3.8%) | 272 (3.8%) |
| 10:00 AM to 10:59 AM | 183 (2.3%) | 330 (4.6%) |
| 11:00 AM to 11:59 AM | 140 (1.8%) | 176 (2.5%) |
| 12:00 PM to 3:59 PM | 1,216 (15.3%) | 699 (9.8%) |
| 4:00 PM to 11:59 PM | 1,062 (13.3%) | 819 (11.4%) |
| Total | 7,960 (100.0%) | 7,171 (100.0%) |
Housing Occupancy in Rock Island
Occupancy by Ownership in Rock Island
Of the total 15,247 dwellings in Rock Island, owner-occupied units account for 9,510 (62.4%), while renter-occupied units make up 5,737 (37.6%).
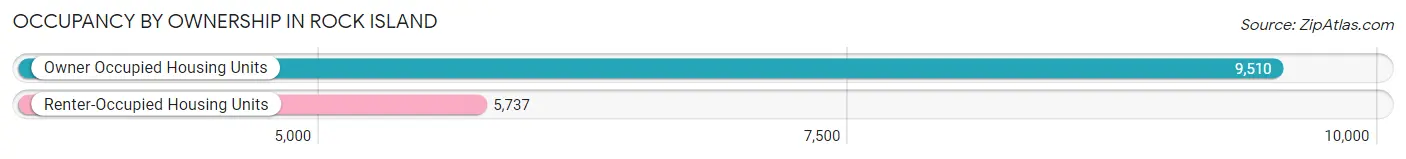
| Occupancy | # Housing Units | % Housing Units |
| Owner Occupied Housing Units | 9,510 | 62.4% |
| Renter-Occupied Housing Units | 5,737 | 37.6% |
| Total Occupied Housing Units | 15,247 | 100.0% |
Occupancy by Household Size in Rock Island
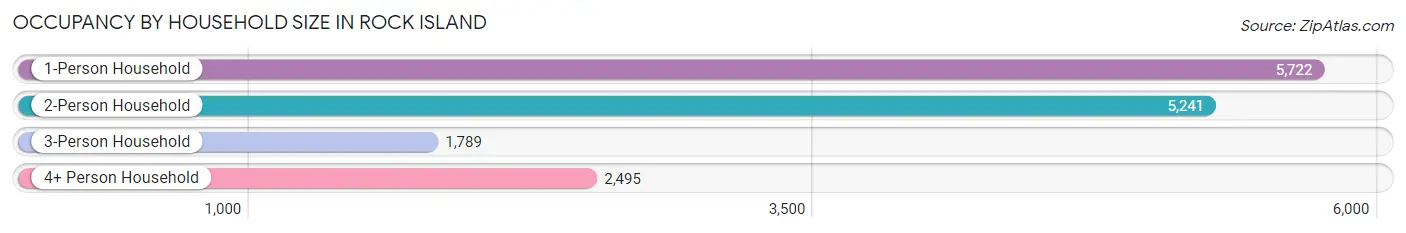
| Household Size | # Housing Units | % Housing Units |
| 1-Person Household | 5,722 | 37.5% |
| 2-Person Household | 5,241 | 34.4% |
| 3-Person Household | 1,789 | 11.7% |
| 4+ Person Household | 2,495 | 16.4% |
| Total Housing Units | 15,247 | 100.0% |
Occupancy by Ownership by Household Size in Rock Island
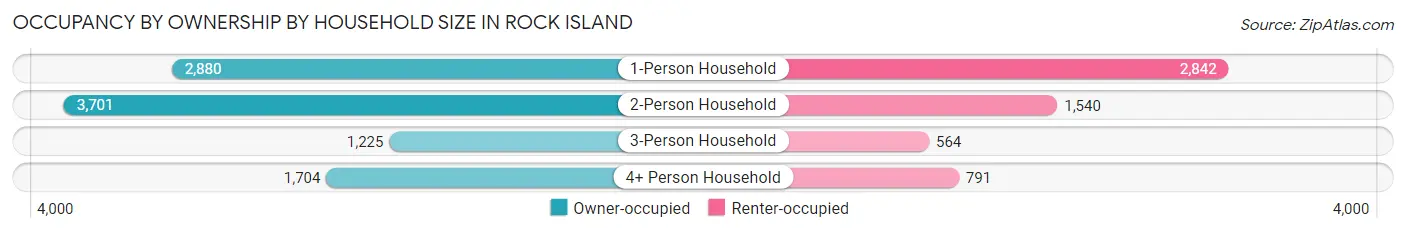
| Household Size | Owner-occupied | Renter-occupied |
| 1-Person Household | 2,880 (50.3%) | 2,842 (49.7%) |
| 2-Person Household | 3,701 (70.6%) | 1,540 (29.4%) |
| 3-Person Household | 1,225 (68.5%) | 564 (31.5%) |
| 4+ Person Household | 1,704 (68.3%) | 791 (31.7%) |
| Total Housing Units | 9,510 (62.4%) | 5,737 (37.6%) |
Occupancy by Educational Attainment in Rock Island
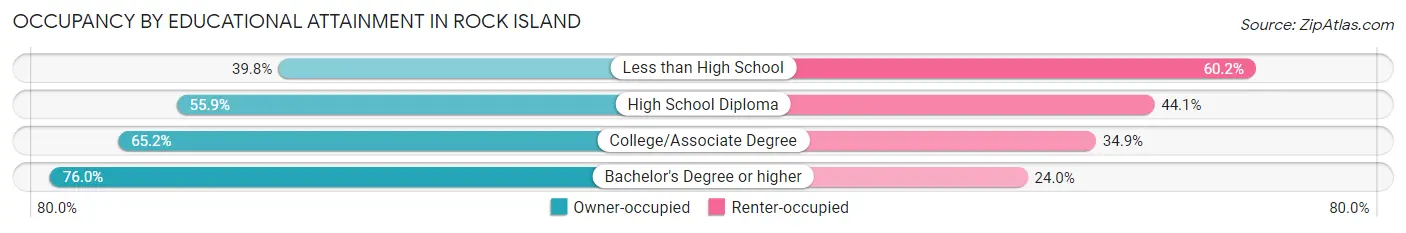
| Household Size | Owner-occupied | Renter-occupied |
| Less than High School | 597 (39.8%) | 903 (60.2%) |
| High School Diploma | 2,532 (55.9%) | 1,999 (44.1%) |
| College/Associate Degree | 3,737 (65.1%) | 1,999 (34.8%) |
| Bachelor's Degree or higher | 2,644 (76.0%) | 836 (24.0%) |
Occupancy by Age of Householder in Rock Island
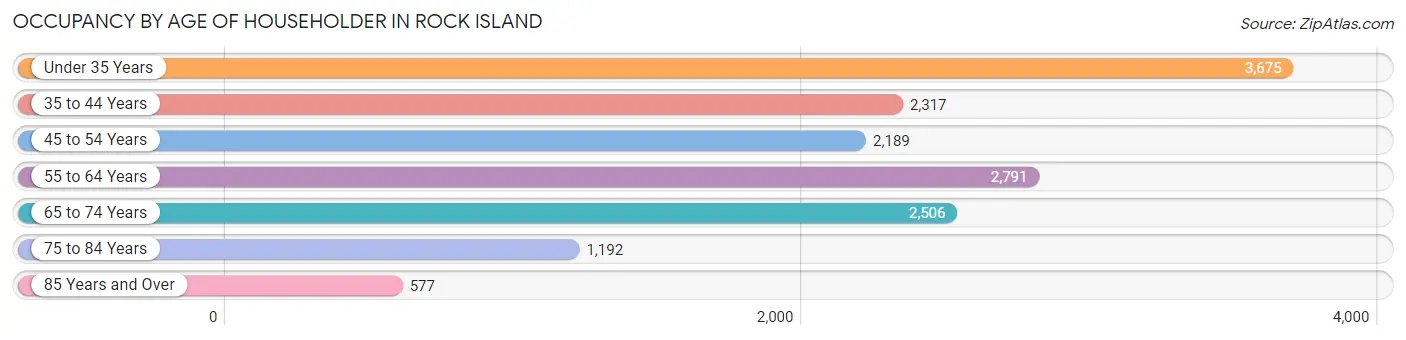
| Age Bracket | # Households | % Households |
| Under 35 Years | 3,675 | 24.1% |
| 35 to 44 Years | 2,317 | 15.2% |
| 45 to 54 Years | 2,189 | 14.4% |
| 55 to 64 Years | 2,791 | 18.3% |
| 65 to 74 Years | 2,506 | 16.4% |
| 75 to 84 Years | 1,192 | 7.8% |
| 85 Years and Over | 577 | 3.8% |
| Total | 15,247 | 100.0% |
Housing Finances in Rock Island
Median Income by Occupancy in Rock Island
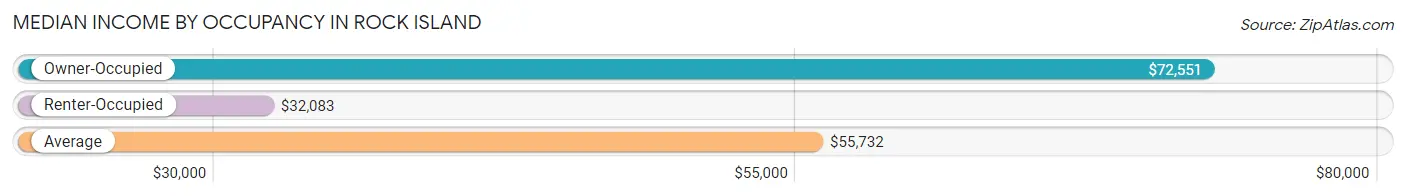
| Occupancy Type | # Households | Median Income |
| Owner-Occupied | 9,510 (62.4%) | $72,551 |
| Renter-Occupied | 5,737 (37.6%) | $32,083 |
| Average | 15,247 (100.0%) | $55,732 |
Occupancy by Householder Income Bracket in Rock Island
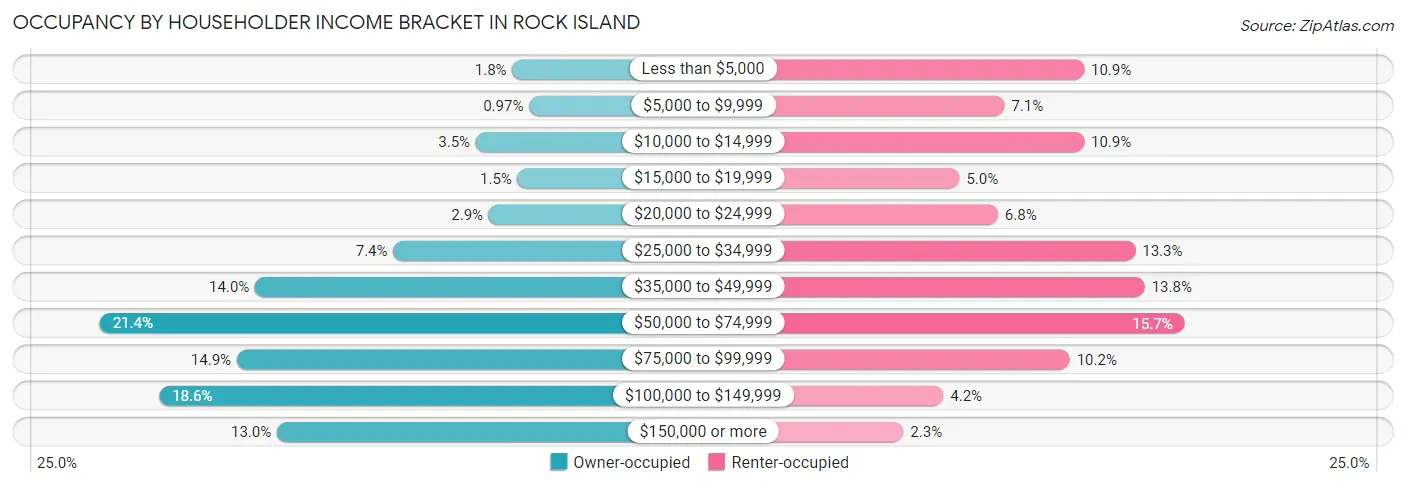
| Income Bracket | Owner-occupied | Renter-occupied |
| Less than $5,000 | 168 (1.8%) | 624 (10.9%) |
| $5,000 to $9,999 | 92 (1.0%) | 407 (7.1%) |
| $10,000 to $14,999 | 334 (3.5%) | 624 (10.9%) |
| $15,000 to $19,999 | 145 (1.5%) | 284 (5.0%) |
| $20,000 to $24,999 | 275 (2.9%) | 389 (6.8%) |
| $25,000 to $34,999 | 708 (7.4%) | 764 (13.3%) |
| $35,000 to $49,999 | 1,333 (14.0%) | 790 (13.8%) |
| $50,000 to $74,999 | 2,037 (21.4%) | 899 (15.7%) |
| $75,000 to $99,999 | 1,416 (14.9%) | 585 (10.2%) |
| $100,000 to $149,999 | 1,768 (18.6%) | 240 (4.2%) |
| $150,000 or more | 1,234 (13.0%) | 131 (2.3%) |
| Total | 9,510 (100.0%) | 5,737 (100.0%) |
Monthly Housing Cost Tiers in Rock Island
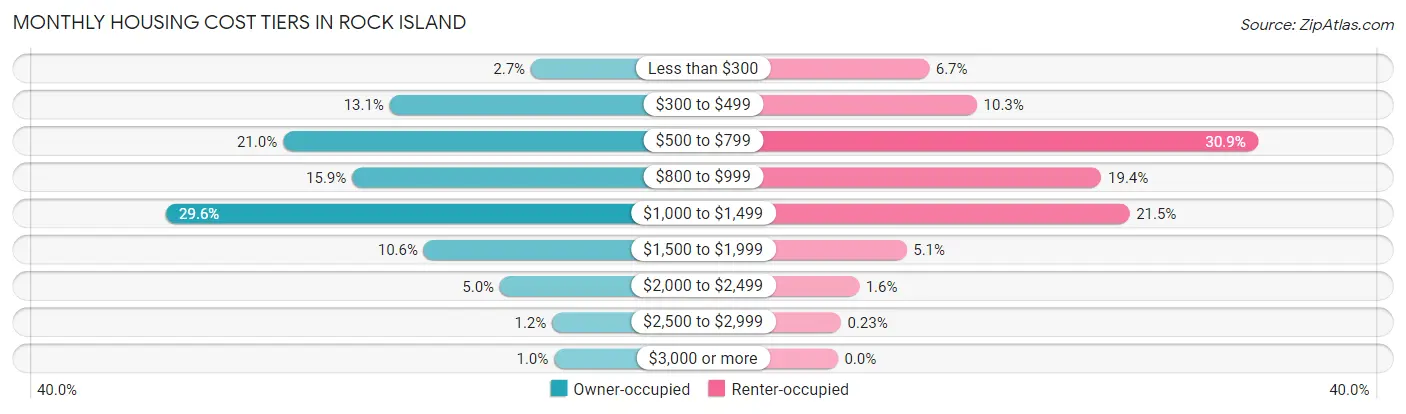
| Monthly Cost | Owner-occupied | Renter-occupied |
| Less than $300 | 258 (2.7%) | 386 (6.7%) |
| $300 to $499 | 1,247 (13.1%) | 588 (10.2%) |
| $500 to $799 | 1,994 (21.0%) | 1,775 (30.9%) |
| $800 to $999 | 1,510 (15.9%) | 1,114 (19.4%) |
| $1,000 to $1,499 | 2,814 (29.6%) | 1,233 (21.5%) |
| $1,500 to $1,999 | 1,008 (10.6%) | 291 (5.1%) |
| $2,000 to $2,499 | 475 (5.0%) | 90 (1.6%) |
| $2,500 to $2,999 | 109 (1.1%) | 13 (0.2%) |
| $3,000 or more | 95 (1.0%) | 0 (0.0%) |
| Total | 9,510 (100.0%) | 5,737 (100.0%) |
Physical Housing Characteristics in Rock Island
Housing Structures in Rock Island
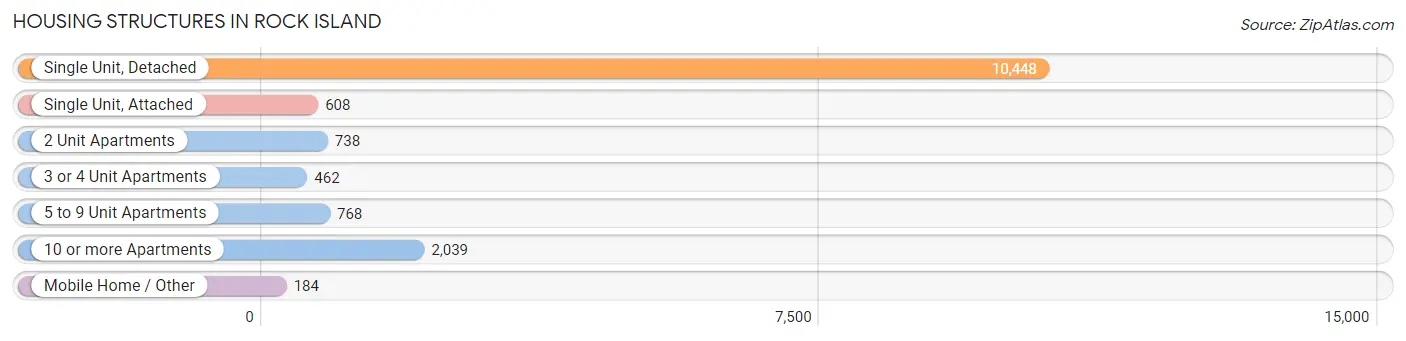
| Structure Type | # Housing Units | % Housing Units |
| Single Unit, Detached | 10,448 | 68.5% |
| Single Unit, Attached | 608 | 4.0% |
| 2 Unit Apartments | 738 | 4.8% |
| 3 or 4 Unit Apartments | 462 | 3.0% |
| 5 to 9 Unit Apartments | 768 | 5.0% |
| 10 or more Apartments | 2,039 | 13.4% |
| Mobile Home / Other | 184 | 1.2% |
| Total | 15,247 | 100.0% |
Housing Structures by Occupancy in Rock Island
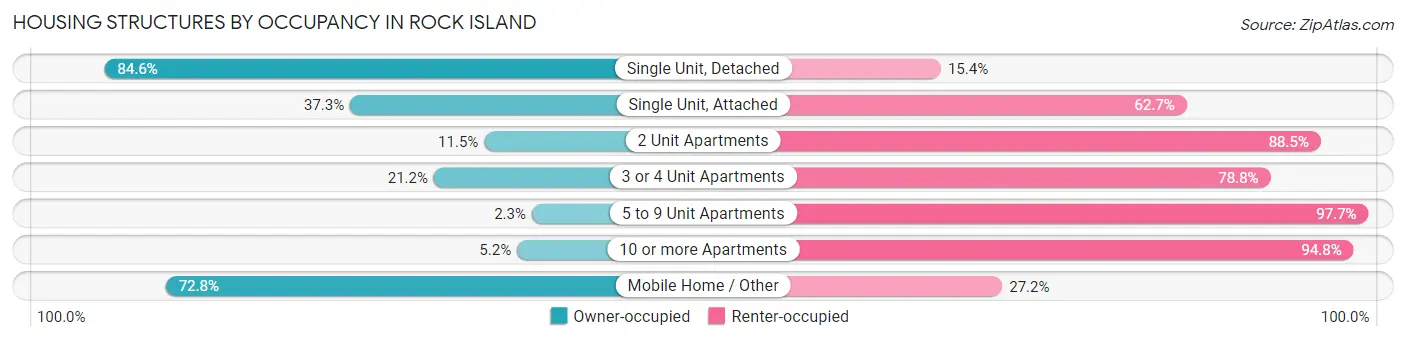
| Structure Type | Owner-occupied | Renter-occupied |
| Single Unit, Detached | 8,842 (84.6%) | 1,606 (15.4%) |
| Single Unit, Attached | 227 (37.3%) | 381 (62.7%) |
| 2 Unit Apartments | 85 (11.5%) | 653 (88.5%) |
| 3 or 4 Unit Apartments | 98 (21.2%) | 364 (78.8%) |
| 5 to 9 Unit Apartments | 18 (2.3%) | 750 (97.7%) |
| 10 or more Apartments | 106 (5.2%) | 1,933 (94.8%) |
| Mobile Home / Other | 134 (72.8%) | 50 (27.2%) |
| Total | 9,510 (62.4%) | 5,737 (37.6%) |
Housing Structures by Number of Rooms in Rock Island
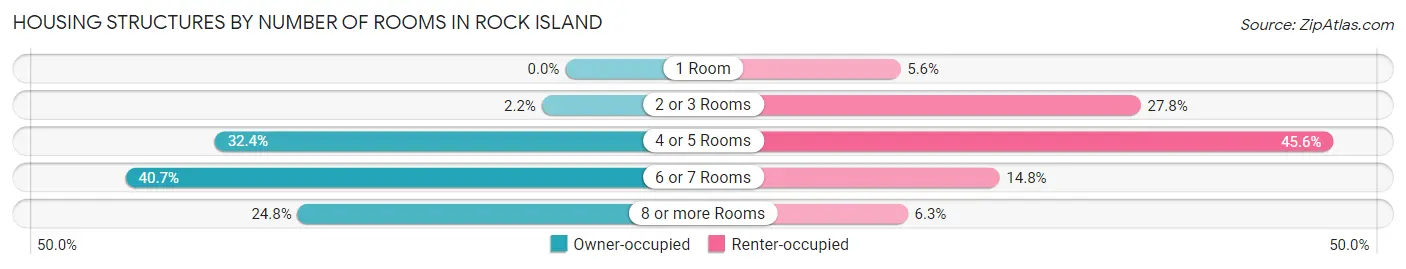
| Number of Rooms | Owner-occupied | Renter-occupied |
| 1 Room | 0 (0.0%) | 320 (5.6%) |
| 2 or 3 Rooms | 207 (2.2%) | 1,595 (27.8%) |
| 4 or 5 Rooms | 3,082 (32.4%) | 2,617 (45.6%) |
| 6 or 7 Rooms | 3,866 (40.6%) | 846 (14.7%) |
| 8 or more Rooms | 2,355 (24.8%) | 359 (6.3%) |
| Total | 9,510 (100.0%) | 5,737 (100.0%) |
Housing Structure by Heating Type in Rock Island
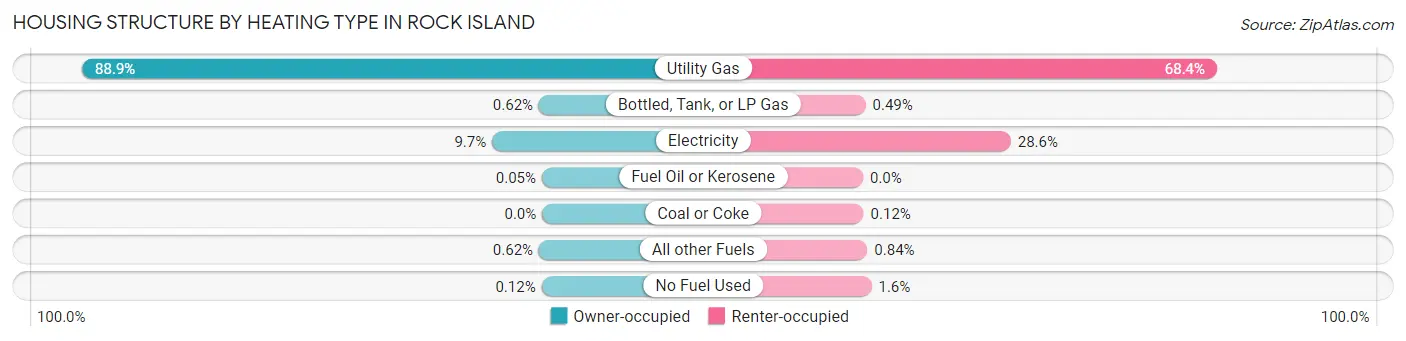
| Heating Type | Owner-occupied | Renter-occupied |
| Utility Gas | 8,456 (88.9%) | 3,922 (68.4%) |
| Bottled, Tank, or LP Gas | 59 (0.6%) | 28 (0.5%) |
| Electricity | 920 (9.7%) | 1,638 (28.5%) |
| Fuel Oil or Kerosene | 5 (0.1%) | 0 (0.0%) |
| Coal or Coke | 0 (0.0%) | 7 (0.1%) |
| All other Fuels | 59 (0.6%) | 48 (0.8%) |
| No Fuel Used | 11 (0.1%) | 94 (1.6%) |
| Total | 9,510 (100.0%) | 5,737 (100.0%) |
Household Vehicle Usage in Rock Island
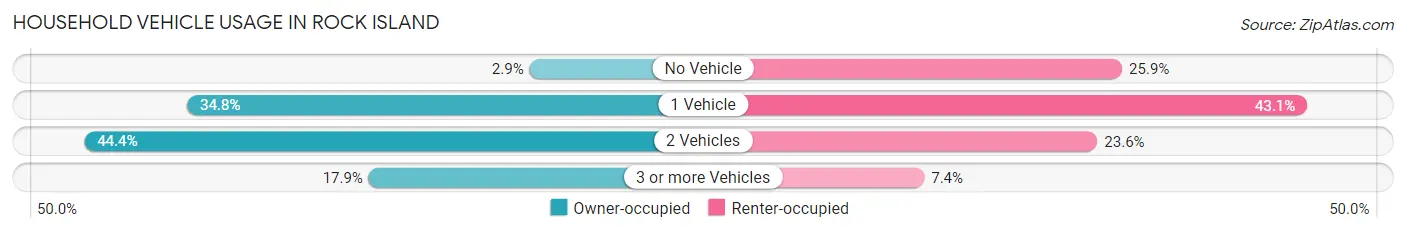
| Vehicles per Household | Owner-occupied | Renter-occupied |
| No Vehicle | 273 (2.9%) | 1,485 (25.9%) |
| 1 Vehicle | 3,312 (34.8%) | 2,475 (43.1%) |
| 2 Vehicles | 4,225 (44.4%) | 1,352 (23.6%) |
| 3 or more Vehicles | 1,700 (17.9%) | 425 (7.4%) |
| Total | 9,510 (100.0%) | 5,737 (100.0%) |
Real Estate & Mortgages in Rock Island
Real Estate and Mortgage Overview in Rock Island
| Characteristic | Without Mortgage | With Mortgage |
| Housing Units | 3,603 | 5,907 |
| Median Property Value | $110,800 | $118,100 |
| Median Household Income | $57,834 | $881 |
| Monthly Housing Costs | $559 | $84 |
| Real Estate Taxes | $2,758 | $235 |
Property Value by Mortgage Status in Rock Island
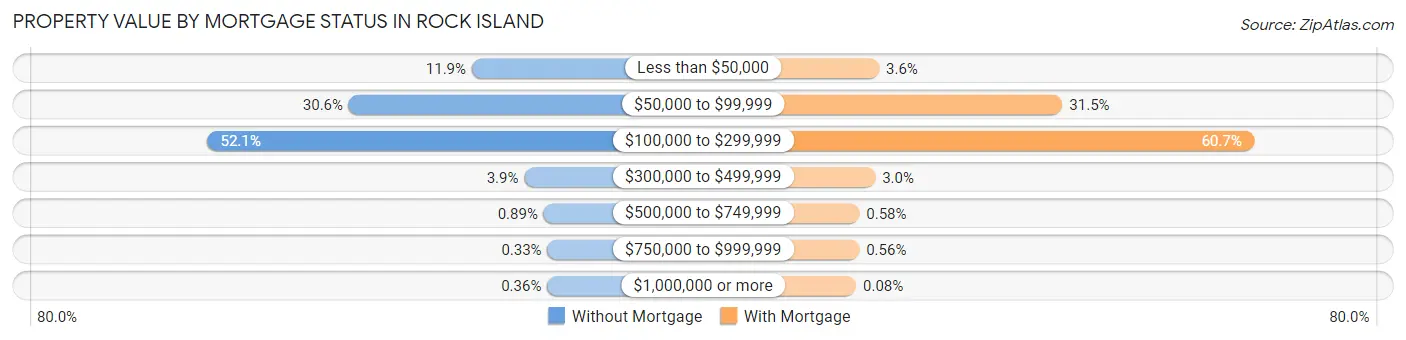
| Property Value | Without Mortgage | With Mortgage |
| Less than $50,000 | 427 (11.8%) | 212 (3.6%) |
| $50,000 to $99,999 | 1,102 (30.6%) | 1,862 (31.5%) |
| $100,000 to $299,999 | 1,878 (52.1%) | 3,584 (60.7%) |
| $300,000 to $499,999 | 139 (3.9%) | 177 (3.0%) |
| $500,000 to $749,999 | 32 (0.9%) | 34 (0.6%) |
| $750,000 to $999,999 | 12 (0.3%) | 33 (0.6%) |
| $1,000,000 or more | 13 (0.4%) | 5 (0.1%) |
| Total | 3,603 (100.0%) | 5,907 (100.0%) |
Household Income by Mortgage Status in Rock Island
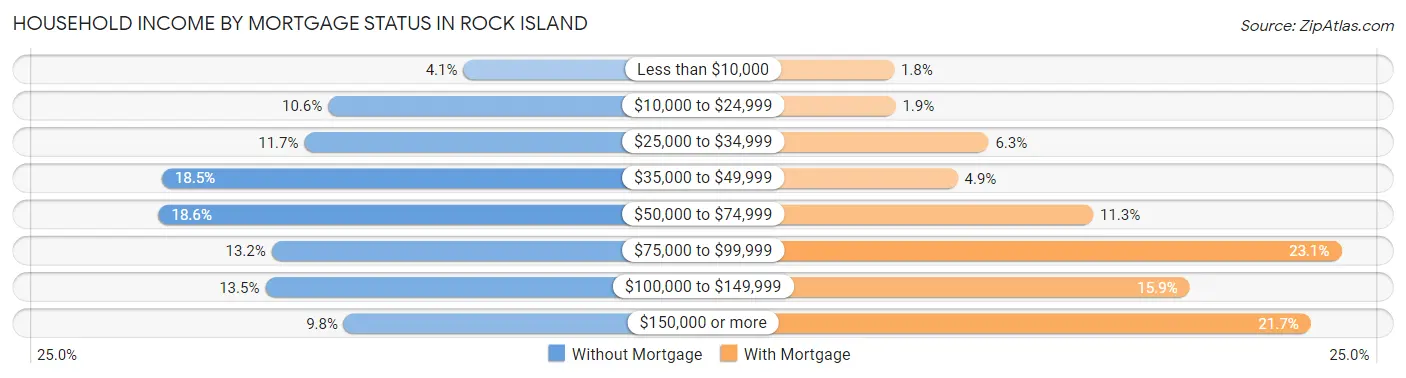
| Household Income | Without Mortgage | With Mortgage |
| Less than $10,000 | 148 (4.1%) | 108 (1.8%) |
| $10,000 to $24,999 | 380 (10.5%) | 112 (1.9%) |
| $25,000 to $34,999 | 421 (11.7%) | 374 (6.3%) |
| $35,000 to $49,999 | 665 (18.5%) | 287 (4.9%) |
| $50,000 to $74,999 | 671 (18.6%) | 668 (11.3%) |
| $75,000 to $99,999 | 477 (13.2%) | 1,366 (23.1%) |
| $100,000 to $149,999 | 488 (13.5%) | 939 (15.9%) |
| $150,000 or more | 353 (9.8%) | 1,280 (21.7%) |
| Total | 3,603 (100.0%) | 5,907 (100.0%) |
Property Value to Household Income Ratio in Rock Island
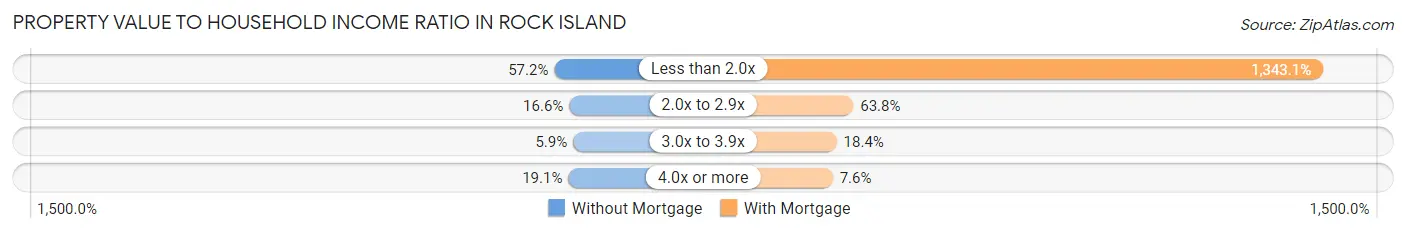
| Value-to-Income Ratio | Without Mortgage | With Mortgage |
| Less than 2.0x | 2,059 (57.2%) | 79,338 (1,343.1%) |
| 2.0x to 2.9x | 597 (16.6%) | 3,767 (63.8%) |
| 3.0x to 3.9x | 212 (5.9%) | 1,087 (18.4%) |
| 4.0x or more | 687 (19.1%) | 450 (7.6%) |
| Total | 3,603 (100.0%) | 5,907 (100.0%) |
Real Estate Taxes by Mortgage Status in Rock Island
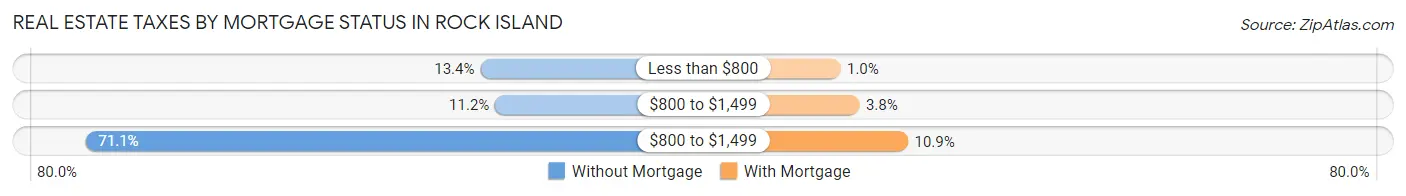
| Property Taxes | Without Mortgage | With Mortgage |
| Less than $800 | 483 (13.4%) | 60 (1.0%) |
| $800 to $1,499 | 405 (11.2%) | 224 (3.8%) |
| $800 to $1,499 | 2,562 (71.1%) | 643 (10.9%) |
| Total | 3,603 (100.0%) | 5,907 (100.0%) |
Health & Disability in Rock Island
Health Insurance Coverage by Age in Rock Island
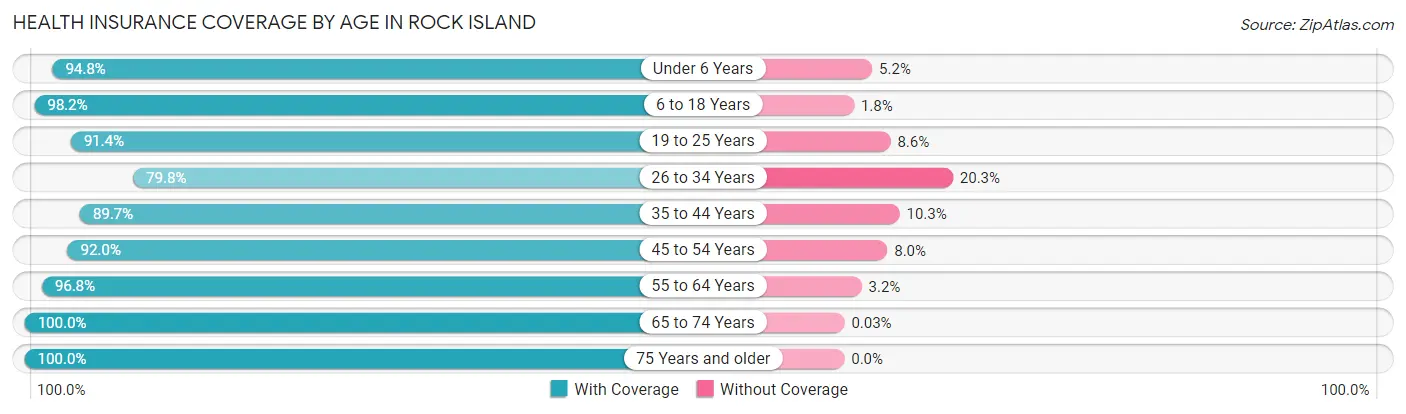
| Age Bracket | With Coverage | Without Coverage |
| Under 6 Years | 2,659 (94.8%) | 146 (5.2%) |
| 6 to 18 Years | 6,343 (98.2%) | 117 (1.8%) |
| 19 to 25 Years | 4,640 (91.4%) | 437 (8.6%) |
| 26 to 34 Years | 3,347 (79.7%) | 850 (20.3%) |
| 35 to 44 Years | 3,505 (89.7%) | 403 (10.3%) |
| 45 to 54 Years | 3,302 (92.0%) | 288 (8.0%) |
| 55 to 64 Years | 4,401 (96.8%) | 147 (3.2%) |
| 65 to 74 Years | 3,684 (100.0%) | 1 (0.0%) |
| 75 Years and older | 2,420 (100.0%) | 0 (0.0%) |
| Total | 34,301 (93.5%) | 2,389 (6.5%) |
Health Insurance Coverage by Citizenship Status in Rock Island
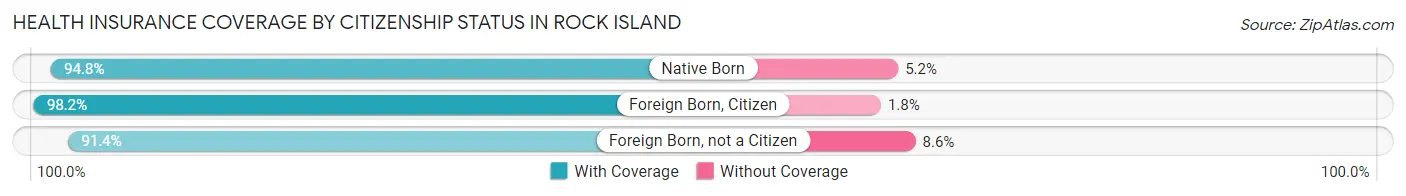
| Citizenship Status | With Coverage | Without Coverage |
| Native Born | 2,659 (94.8%) | 146 (5.2%) |
| Foreign Born, Citizen | 6,343 (98.2%) | 117 (1.8%) |
| Foreign Born, not a Citizen | 4,640 (91.4%) | 437 (8.6%) |
Health Insurance Coverage by Household Income in Rock Island
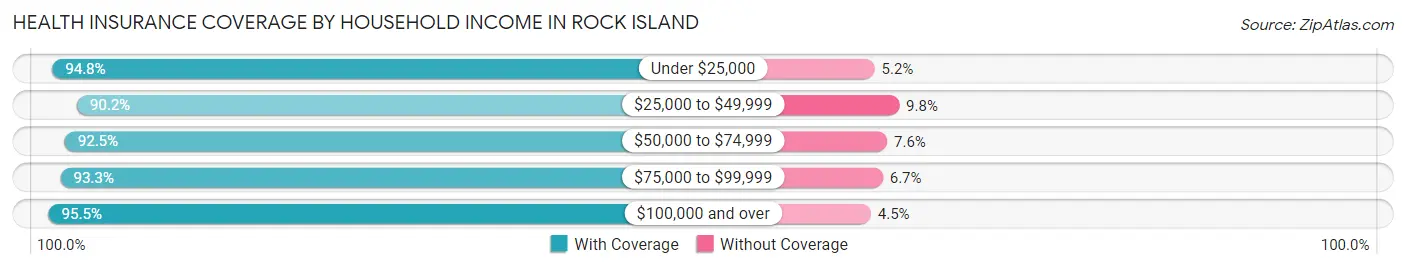
| Household Income | With Coverage | Without Coverage |
| Under $25,000 | 5,571 (94.8%) | 306 (5.2%) |
| $25,000 to $49,999 | 6,871 (90.2%) | 747 (9.8%) |
| $50,000 to $74,999 | 6,241 (92.4%) | 510 (7.5%) |
| $75,000 to $99,999 | 4,854 (93.3%) | 351 (6.7%) |
| $100,000 and over | 8,561 (95.5%) | 404 (4.5%) |
Public vs Private Health Insurance Coverage by Age in Rock Island
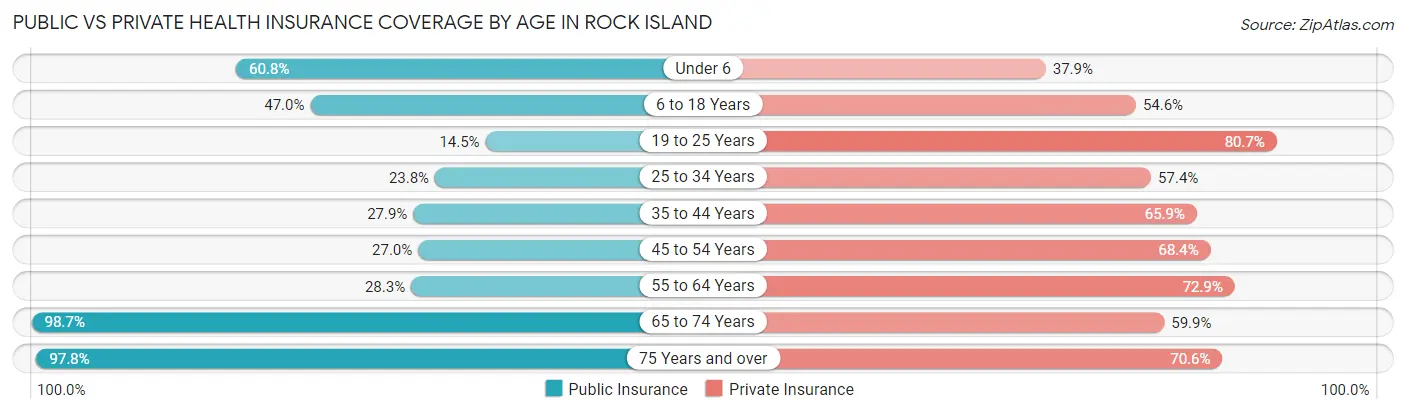
| Age Bracket | Public Insurance | Private Insurance |
| Under 6 | 1,704 (60.8%) | 1,062 (37.9%) |
| 6 to 18 Years | 3,034 (47.0%) | 3,527 (54.6%) |
| 19 to 25 Years | 734 (14.5%) | 4,098 (80.7%) |
| 25 to 34 Years | 1,000 (23.8%) | 2,410 (57.4%) |
| 35 to 44 Years | 1,089 (27.9%) | 2,575 (65.9%) |
| 45 to 54 Years | 968 (27.0%) | 2,457 (68.4%) |
| 55 to 64 Years | 1,286 (28.3%) | 3,317 (72.9%) |
| 65 to 74 Years | 3,637 (98.7%) | 2,206 (59.9%) |
| 75 Years and over | 2,367 (97.8%) | 1,709 (70.6%) |
| Total | 15,819 (43.1%) | 23,361 (63.7%) |
Disability Status by Sex by Age in Rock Island
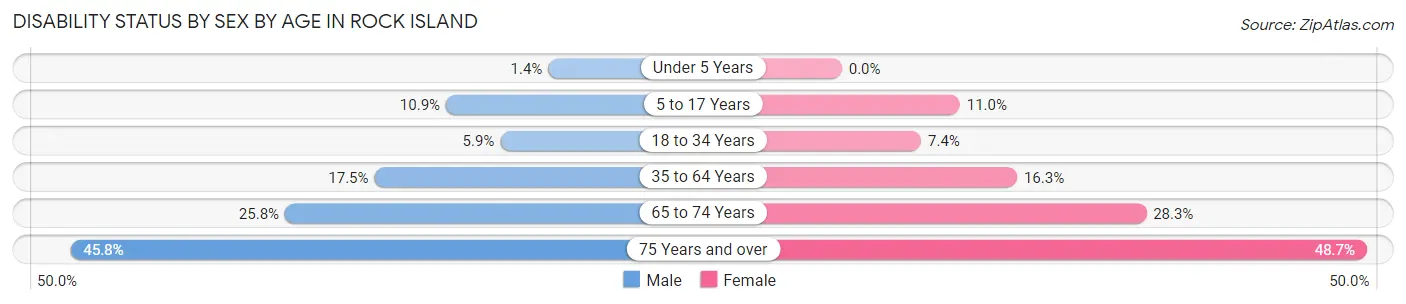
| Age Bracket | Male | Female |
| Under 5 Years | 19 (1.4%) | 0 (0.0%) |
| 5 to 17 Years | 306 (10.9%) | 335 (11.0%) |
| 18 to 34 Years | 316 (5.9%) | 358 (7.4%) |
| 35 to 64 Years | 1,029 (17.5%) | 1,005 (16.3%) |
| 65 to 74 Years | 439 (25.8%) | 561 (28.2%) |
| 75 Years and over | 447 (45.8%) | 703 (48.7%) |
Disability Class by Sex by Age in Rock Island
Disability Class: Hearing Difficulty
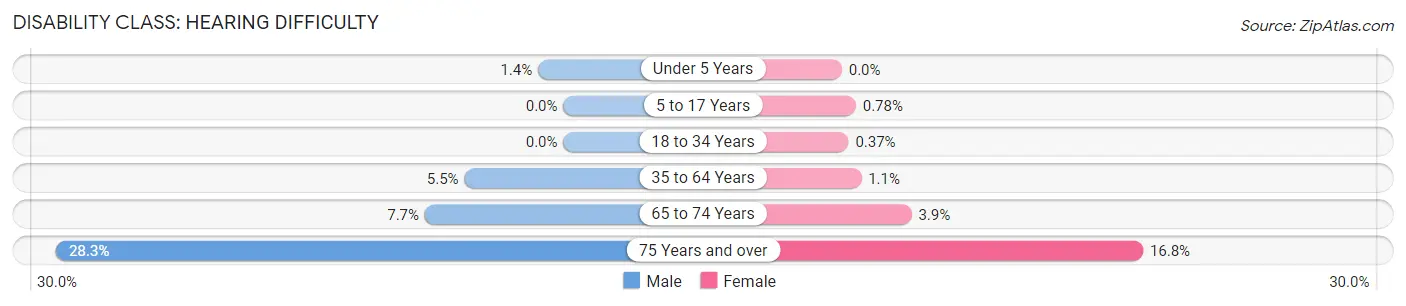
| Age Bracket | Male | Female |
| Under 5 Years | 19 (1.4%) | 0 (0.0%) |
| 5 to 17 Years | 0 (0.0%) | 24 (0.8%) |
| 18 to 34 Years | 0 (0.0%) | 18 (0.4%) |
| 35 to 64 Years | 323 (5.5%) | 67 (1.1%) |
| 65 to 74 Years | 131 (7.7%) | 77 (3.9%) |
| 75 Years and over | 276 (28.2%) | 242 (16.8%) |
Disability Class: Vision Difficulty
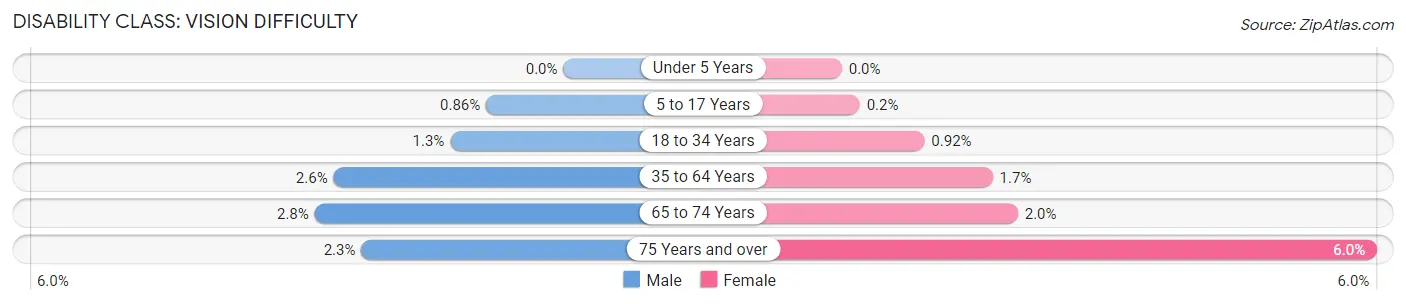
| Age Bracket | Male | Female |
| Under 5 Years | 0 (0.0%) | 0 (0.0%) |
| 5 to 17 Years | 24 (0.9%) | 6 (0.2%) |
| 18 to 34 Years | 68 (1.3%) | 45 (0.9%) |
| 35 to 64 Years | 150 (2.6%) | 104 (1.7%) |
| 65 to 74 Years | 47 (2.8%) | 39 (2.0%) |
| 75 Years and over | 22 (2.2%) | 86 (6.0%) |
Disability Class: Cognitive Difficulty
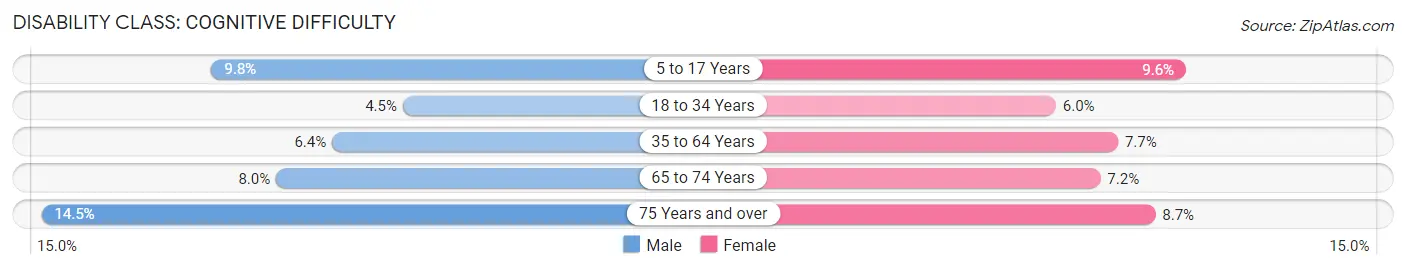
| Age Bracket | Male | Female |
| 5 to 17 Years | 275 (9.8%) | 293 (9.6%) |
| 18 to 34 Years | 241 (4.5%) | 290 (6.0%) |
| 35 to 64 Years | 378 (6.4%) | 475 (7.7%) |
| 65 to 74 Years | 136 (8.0%) | 143 (7.2%) |
| 75 Years and over | 142 (14.5%) | 126 (8.7%) |
Disability Class: Ambulatory Difficulty
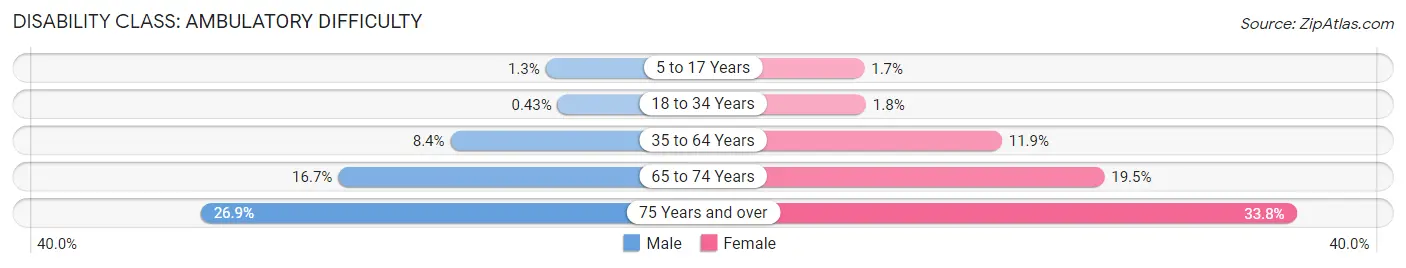
| Age Bracket | Male | Female |
| 5 to 17 Years | 37 (1.3%) | 51 (1.7%) |
| 18 to 34 Years | 23 (0.4%) | 87 (1.8%) |
| 35 to 64 Years | 492 (8.4%) | 734 (11.9%) |
| 65 to 74 Years | 284 (16.7%) | 387 (19.5%) |
| 75 Years and over | 263 (26.9%) | 487 (33.8%) |
Disability Class: Self-Care Difficulty
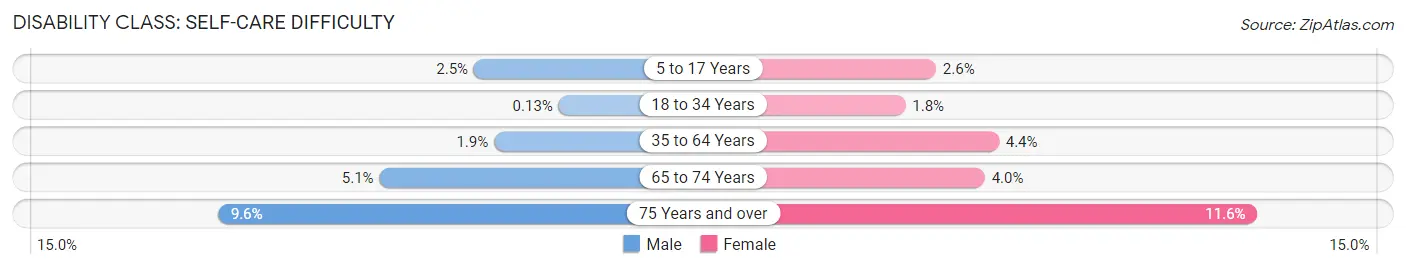
| Age Bracket | Male | Female |
| 5 to 17 Years | 70 (2.5%) | 80 (2.6%) |
| 18 to 34 Years | 7 (0.1%) | 86 (1.8%) |
| 35 to 64 Years | 113 (1.9%) | 270 (4.4%) |
| 65 to 74 Years | 87 (5.1%) | 79 (4.0%) |
| 75 Years and over | 94 (9.6%) | 167 (11.6%) |
Technology Access in Rock Island
Computing Device Access in Rock Island
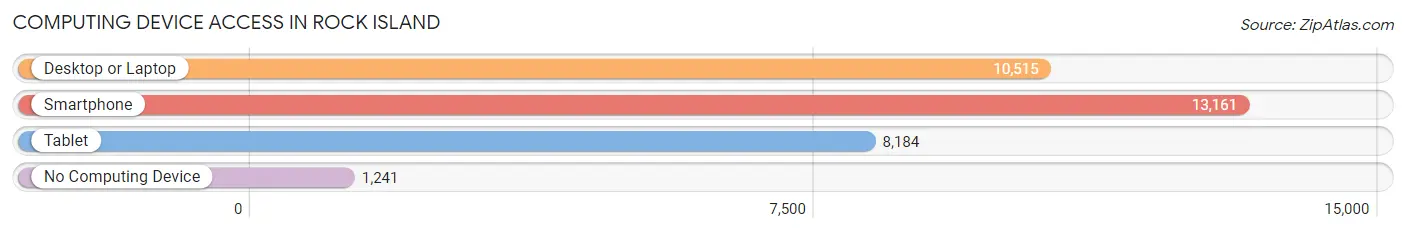
| Device Type | # Households | % Households |
| Desktop or Laptop | 10,515 | 69.0% |
| Smartphone | 13,161 | 86.3% |
| Tablet | 8,184 | 53.7% |
| No Computing Device | 1,241 | 8.1% |
| Total | 15,247 | 100.0% |
Internet Access in Rock Island
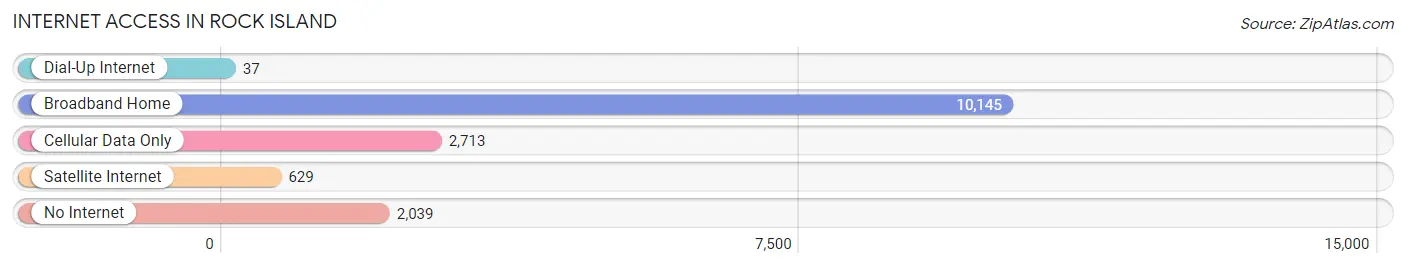
| Internet Type | # Households | % Households |
| Dial-Up Internet | 37 | 0.2% |
| Broadband Home | 10,145 | 66.5% |
| Cellular Data Only | 2,713 | 17.8% |
| Satellite Internet | 629 | 4.1% |
| No Internet | 2,039 | 13.4% |
| Total | 15,247 | 100.0% |
Rock Island Summary
Rock Island, Illinois is a city located in the northwestern corner of the state, along the Mississippi River. It is the county seat of Rock Island County and is part of the Quad Cities metropolitan area, which includes the cities of Davenport and Bettendorf in Iowa, and Moline and East Moline in Illinois. The city has a population of 39,018, according to the 2010 census, and is the largest city in the Quad Cities.
History
The area that is now Rock Island was first inhabited by Native Americans, including the Sauk and Fox tribes. The first European settlers arrived in the area in the early 19th century, and the city was officially founded in 1833. The city was named after Rock Island, an island in the Mississippi River that was used as a landmark by early settlers.
In the mid-19th century, Rock Island became an important transportation hub, with the construction of the Rock Island Railroad and the Rock Island Arsenal. The railroad connected the city to Chicago and other major cities, and the arsenal was a major supplier of weapons and ammunition for the Union Army during the Civil War.
In the late 19th century, Rock Island became a major industrial center, with the establishment of several factories and mills. The city also became a popular tourist destination, with the opening of the Rock Island Line, a steamboat line that ran between St. Louis and Rock Island.
Geography
Rock Island is located in northwestern Illinois, along the Mississippi River. It is bordered by the cities of Moline and East Moline to the east, and Davenport and Bettendorf in Iowa to the west. The city covers an area of 16.6 square miles, and has a population density of 2,346 people per square mile.
The city is located in a humid continental climate zone, with hot, humid summers and cold, snowy winters. The average annual temperature is 48.2 degrees Fahrenheit, and the average annual precipitation is 36.2 inches.
Economy
Rock Island's economy is largely based on manufacturing and tourism. The city is home to several major employers, including John Deere, Alcoa, and the Rock Island Arsenal. The city also has a thriving tourism industry, with several attractions, including the Rock Island Line, the Rock Island County Historical Society, and the Quad City Botanical Center.
Demographics
According to the 2010 census, Rock Island has a population of 39,018. The racial makeup of the city is 79.2% White, 14.2% African American, 0.7% Native American, 1.3% Asian, and 4.6% from other races. The median household income is $37,945, and the median age is 36.7 years.
Rock Island is a diverse city, with a variety of cultures and religions represented. The city is home to a large Catholic population, as well as a growing Muslim community. The city also has a large LGBT population, and is home to several LGBT organizations and events.
Common Questions
What is Per Capita Income in Rock Island?
Per Capita income in Rock Island is $30,235.
What is the Median Family Income in Rock Island?
Median Family Income in Rock Island is $69,568.
What is the Median Household income in Rock Island?
Median Household Income in Rock Island is $55,732.
What is Income or Wage Gap in Rock Island?
Income or Wage Gap in Rock Island is 21.6%.
Women in Rock Island earn 78.4 cents for every dollar earned by a man.
What is Family Income Deficit in Rock Island?
Family Income Deficit in Rock Island is $11,770.
Families that are below poverty line in Rock Island earn $11,770 less on average than the poverty threshold level.
What is Inequality or Gini Index in Rock Island?
Inequality or Gini Index in Rock Island is 0.46.
What is the Total Population of Rock Island?
Total Population of Rock Island is 37,264.
What is the Total Male Population of Rock Island?
Total Male Population of Rock Island is 18,464.
What is the Total Female Population of Rock Island?
Total Female Population of Rock Island is 18,800.
What is the Ratio of Males per 100 Females in Rock Island?
There are 98.21 Males per 100 Females in Rock Island.
What is the Ratio of Females per 100 Males in Rock Island?
There are 101.82 Females per 100 Males in Rock Island.
What is the Median Population Age in Rock Island?
Median Population Age in Rock Island is 35.0 Years.
What is the Average Family Size in Rock Island
Average Family Size in Rock Island is 3.1 People.
What is the Average Household Size in Rock Island
Average Household Size in Rock Island is 2.3 People.
How Large is the Labor Force in Rock Island?
There are 18,287 People in the Labor Forcein in Rock Island.
What is the Percentage of People in the Labor Force in Rock Island?
61.3% of People are in the Labor Force in Rock Island.
What is the Unemployment Rate in Rock Island?
Unemployment Rate in Rock Island is 7.3%.