Lansing, IL Map & Demographics
Lansing Map
Lansing Overview
$32,591
PER CAPITA INCOME
$86,698
AVG FAMILY INCOME
$68,766
AVG HOUSEHOLD INCOME
33.5%
WAGE / INCOME GAP [ % ]
66.5¢/ $1
WAGE / INCOME GAP [ $ ]
$12,899
FAMILY INCOME DEFICIT
0.42
INEQUALITY / GINI INDEX
28,713
TOTAL POPULATION
13,987
MALE POPULATION
14,726
FEMALE POPULATION
94.98
MALES / 100 FEMALES
105.28
FEMALES / 100 MALES
40.7
MEDIAN AGE
3.3
AVG FAMILY SIZE
2.6
AVG HOUSEHOLD SIZE
15,397
LABOR FORCE [ PEOPLE ]
66.7%
PERCENT IN LABOR FORCE
10.9%
UNEMPLOYMENT RATE
Lansing Zip Codes
Lansing Area Codes
Income in Lansing
Income Overview in Lansing
Per Capita Income in Lansing is $32,591, while median incomes of families and households are $86,698 and $68,766 respectively.
| Characteristic | Number | Measure |
| Per Capita Income | 28,713 | $32,591 |
| Median Family Income | 7,064 | $86,698 |
| Mean Family Income | 7,064 | $95,754 |
| Median Household Income | 11,179 | $68,766 |
| Mean Household Income | 11,179 | $84,940 |
| Income Deficit | 7,064 | $12,899 |
| Wage / Income Gap (%) | 28,713 | 33.48% |
| Wage / Income Gap ($) | 28,713 | 66.52¢ per $1 |
| Gini / Inequality Index | 28,713 | 0.42 |
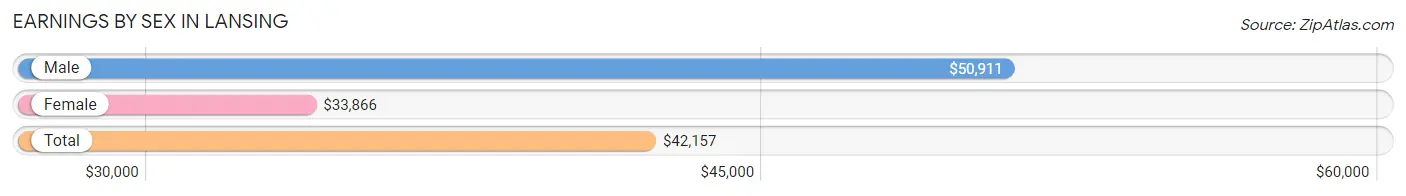
Earnings by Sex in Lansing
Average Earnings in Lansing are $42,157, $50,911 for men and $33,866 for women, a difference of 33.5%.
| Sex | Number | Average Earnings |
| Male | 7,733 (51.2%) | $50,911 |
| Female | 7,358 (48.8%) | $33,866 |
| Total | 15,091 (100.0%) | $42,157 |
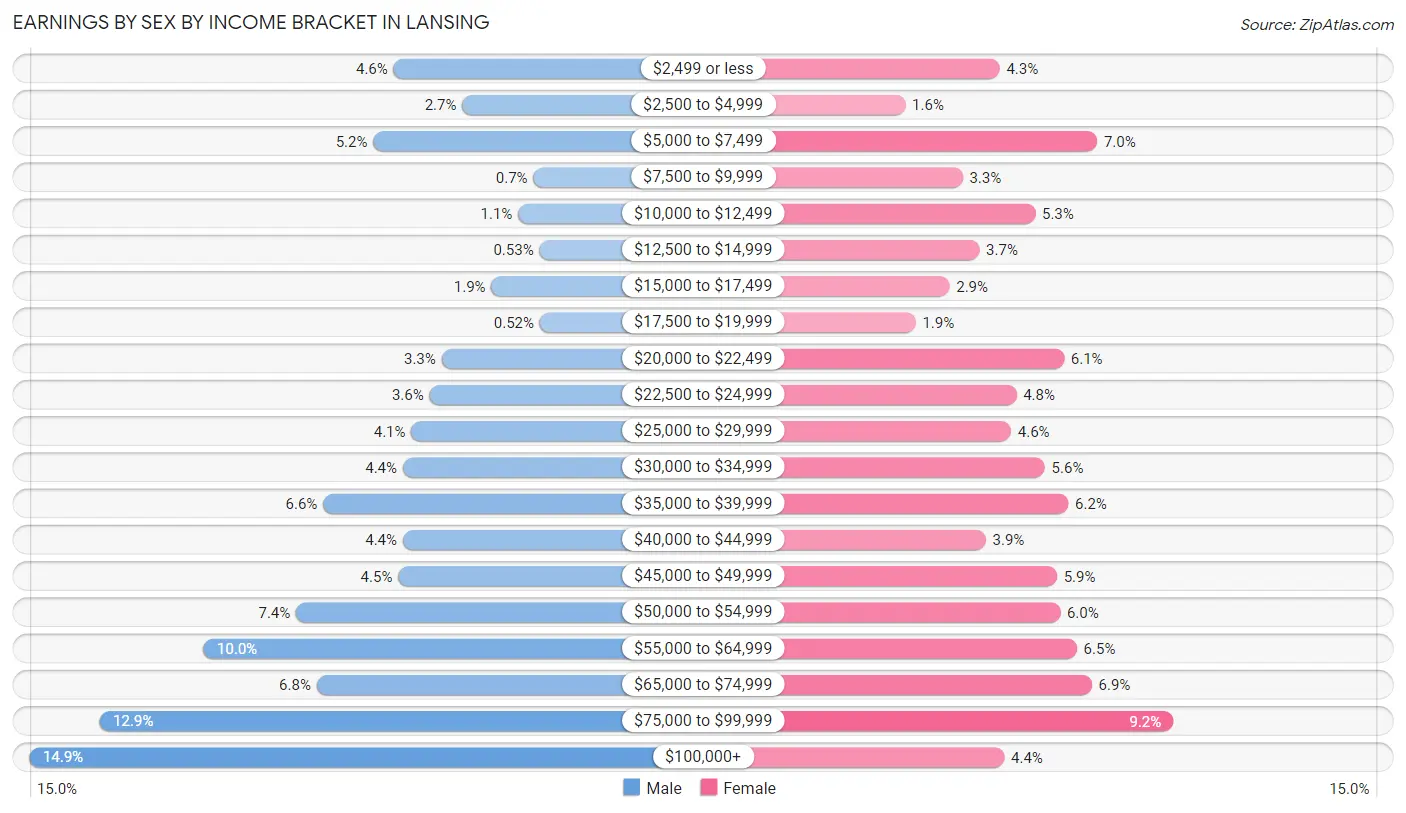
Earnings by Sex by Income Bracket in Lansing
The most common earnings brackets in Lansing are $100,000+ for men (1,148 | 14.8%) and $75,000 to $99,999 for women (675 | 9.2%).
| Income | Male | Female |
| $2,499 or less | 358 (4.6%) | 316 (4.3%) |
| $2,500 to $4,999 | 209 (2.7%) | 121 (1.6%) |
| $5,000 to $7,499 | 402 (5.2%) | 517 (7.0%) |
| $7,500 to $9,999 | 54 (0.7%) | 239 (3.3%) |
| $10,000 to $12,499 | 87 (1.1%) | 389 (5.3%) |
| $12,500 to $14,999 | 41 (0.5%) | 274 (3.7%) |
| $15,000 to $17,499 | 145 (1.9%) | 212 (2.9%) |
| $17,500 to $19,999 | 40 (0.5%) | 142 (1.9%) |
| $20,000 to $22,499 | 254 (3.3%) | 449 (6.1%) |
| $22,500 to $24,999 | 280 (3.6%) | 350 (4.8%) |
| $25,000 to $29,999 | 319 (4.1%) | 339 (4.6%) |
| $30,000 to $34,999 | 338 (4.4%) | 409 (5.6%) |
| $35,000 to $39,999 | 511 (6.6%) | 458 (6.2%) |
| $40,000 to $44,999 | 338 (4.4%) | 287 (3.9%) |
| $45,000 to $49,999 | 348 (4.5%) | 434 (5.9%) |
| $50,000 to $54,999 | 570 (7.4%) | 441 (6.0%) |
| $55,000 to $64,999 | 770 (10.0%) | 475 (6.5%) |
| $65,000 to $74,999 | 525 (6.8%) | 506 (6.9%) |
| $75,000 to $99,999 | 996 (12.9%) | 675 (9.2%) |
| $100,000+ | 1,148 (14.8%) | 325 (4.4%) |
| Total | 7,733 (100.0%) | 7,358 (100.0%) |
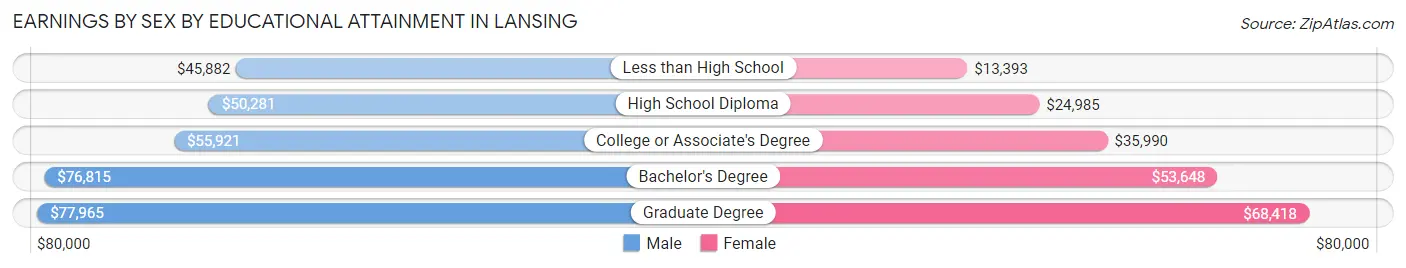
Earnings by Sex by Educational Attainment in Lansing
Average earnings in Lansing are $54,867 for men and $38,282 for women, a difference of 30.2%. Men with an educational attainment of graduate degree enjoy the highest average annual earnings of $77,965, while those with less than high school education earn the least with $45,882. Women with an educational attainment of graduate degree earn the most with the average annual earnings of $68,418, while those with less than high school education have the smallest earnings of $13,393.
| Educational Attainment | Male Income | Female Income |
| Less than High School | $45,882 | $13,393 |
| High School Diploma | $50,281 | $24,985 |
| College or Associate's Degree | $55,921 | $35,990 |
| Bachelor's Degree | $76,815 | $53,648 |
| Graduate Degree | $77,965 | $68,418 |
| Total | $54,867 | $38,282 |
Family Income in Lansing
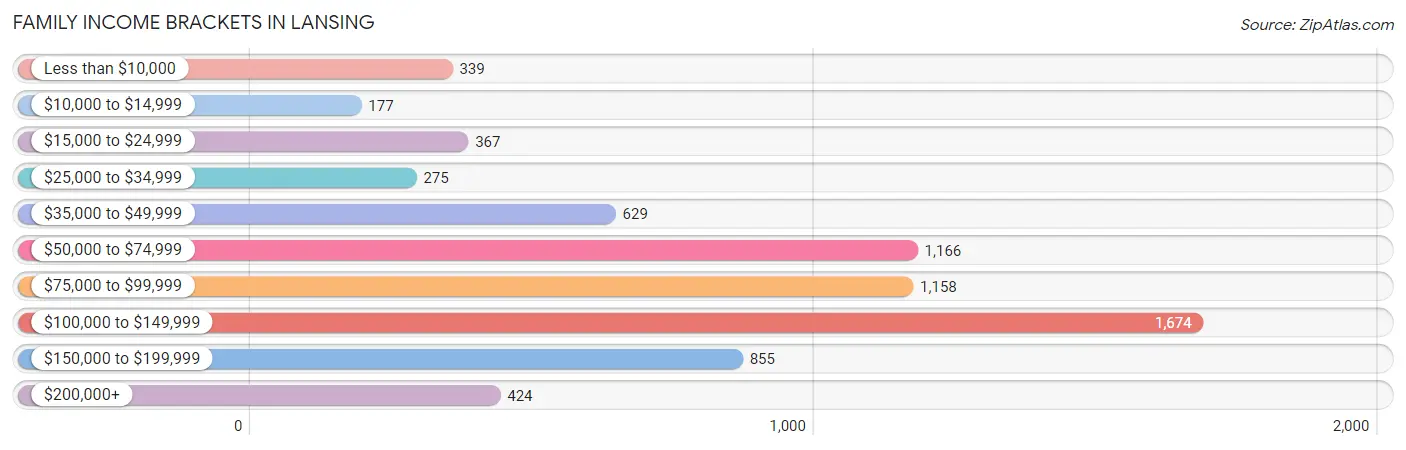
Family Income Brackets in Lansing
According to the Lansing family income data, there are 1,674 families falling into the $100,000 to $149,999 income range, which is the most common income bracket and makes up 23.7% of all families. Conversely, the $10,000 to $14,999 income bracket is the least frequent group with only 177 families (2.5%) belonging to this category.
| Income Bracket | # Families | % Families |
| Less than $10,000 | 339 | 4.8% |
| $10,000 to $14,999 | 177 | 2.5% |
| $15,000 to $24,999 | 367 | 5.2% |
| $25,000 to $34,999 | 275 | 3.9% |
| $35,000 to $49,999 | 629 | 8.9% |
| $50,000 to $74,999 | 1,166 | 16.5% |
| $75,000 to $99,999 | 1,158 | 16.4% |
| $100,000 to $149,999 | 1,674 | 23.7% |
| $150,000 to $199,999 | 855 | 12.1% |
| $200,000+ | 424 | 6.0% |
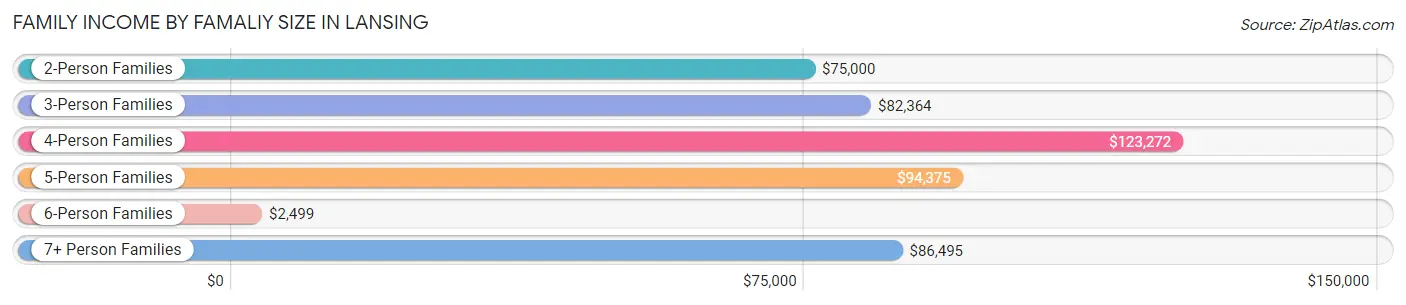
Family Income by Famaliy Size in Lansing
4-person families (1,403 | 19.9%) account for the highest median family income in Lansing with $123,272 per family, while 2-person families (3,002 | 42.5%) have the highest median income of $37,500 per family member.
| Income Bracket | # Families | Median Income |
| 2-Person Families | 3,002 (42.5%) | $75,000 |
| 3-Person Families | 1,665 (23.6%) | $82,364 |
| 4-Person Families | 1,403 (19.9%) | $123,272 |
| 5-Person Families | 789 (11.2%) | $94,375 |
| 6-Person Families | 134 (1.9%) | $2,499 |
| 7+ Person Families | 71 (1.0%) | $86,495 |
| Total | 7,064 (100.0%) | $86,698 |
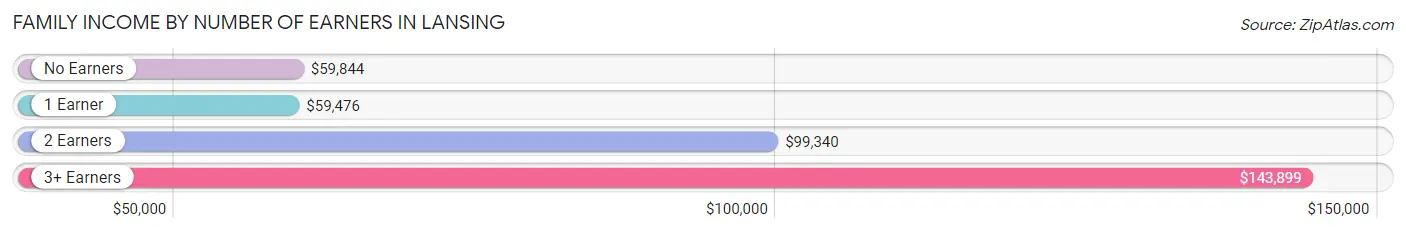
Family Income by Number of Earners in Lansing
The median family income in Lansing is $86,698, with families comprising 3+ earners (1,187) having the highest median family income of $143,899, while families with 1 earner (2,752) have the lowest median family income of $59,476, accounting for 16.8% and 39.0% of families, respectively.
| Number of Earners | # Families | Median Income |
| No Earners | 771 (10.9%) | $59,844 |
| 1 Earner | 2,752 (39.0%) | $59,476 |
| 2 Earners | 2,354 (33.3%) | $99,340 |
| 3+ Earners | 1,187 (16.8%) | $143,899 |
| Total | 7,064 (100.0%) | $86,698 |
Household Income in Lansing
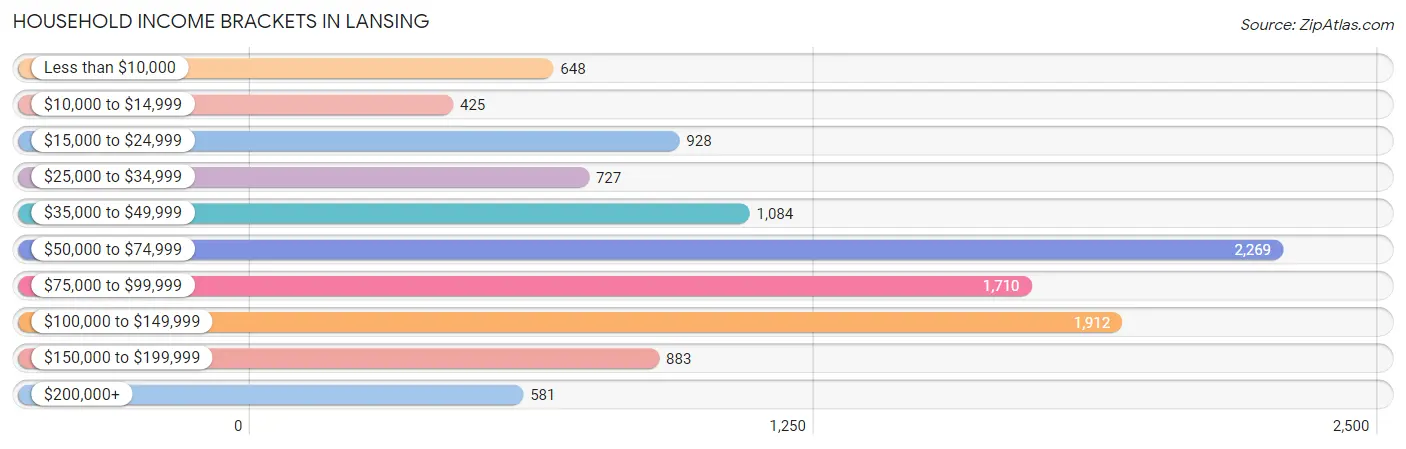
Household Income Brackets in Lansing
With 2,269 households falling in the category, the $50,000 to $74,999 income range is the most frequent in Lansing, accounting for 20.3% of all households. In contrast, only 425 households (3.8%) fall into the $10,000 to $14,999 income bracket, making it the least populous group.
| Income Bracket | # Households | % Households |
| Less than $10,000 | 648 | 5.8% |
| $10,000 to $14,999 | 425 | 3.8% |
| $15,000 to $24,999 | 928 | 8.3% |
| $25,000 to $34,999 | 727 | 6.5% |
| $35,000 to $49,999 | 1,084 | 9.7% |
| $50,000 to $74,999 | 2,269 | 20.3% |
| $75,000 to $99,999 | 1,710 | 15.3% |
| $100,000 to $149,999 | 1,912 | 17.1% |
| $150,000 to $199,999 | 883 | 7.9% |
| $200,000+ | 581 | 5.2% |
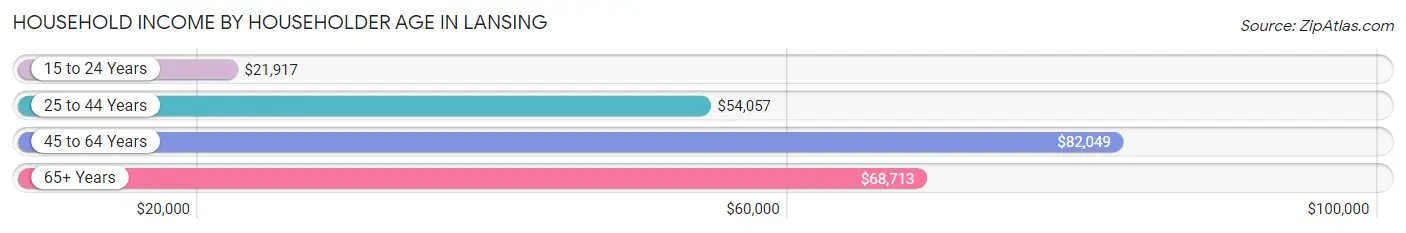
Household Income by Householder Age in Lansing
The median household income in Lansing is $68,766, with the highest median household income of $82,049 found in the 45 to 64 years age bracket for the primary householder. A total of 4,917 households (44.0%) fall into this category. Meanwhile, the 15 to 24 years age bracket for the primary householder has the lowest median household income of $21,917, with 288 households (2.6%) in this group.
| Income Bracket | # Households | Median Income |
| 15 to 24 Years | 288 (2.6%) | $21,917 |
| 25 to 44 Years | 3,243 (29.0%) | $54,057 |
| 45 to 64 Years | 4,917 (44.0%) | $82,049 |
| 65+ Years | 2,731 (24.4%) | $68,713 |
| Total | 11,179 (100.0%) | $68,766 |
Poverty in Lansing
Income Below Poverty by Sex and Age in Lansing
With 13.7% poverty level for males and 19.2% for females among the residents of Lansing, under 5 year old males and 5 year old females are the most vulnerable to poverty, with 424 males (52.0%) and 123 females (58.3%) in their respective age groups living below the poverty level.
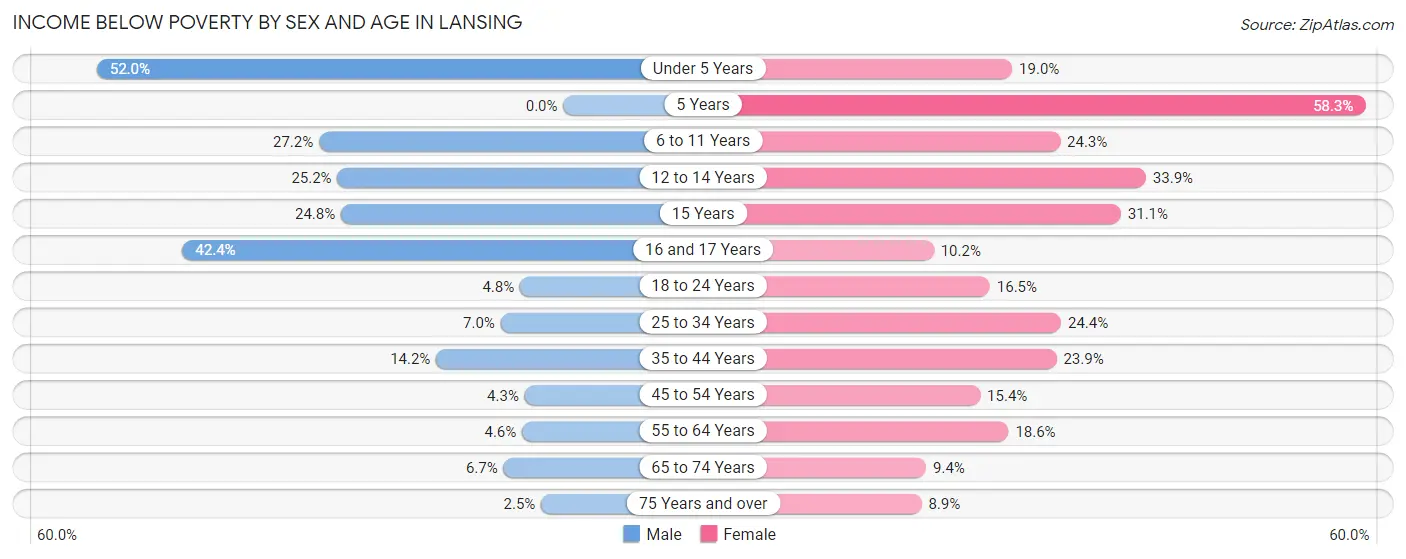
| Age Bracket | Male | Female |
| Under 5 Years | 424 (52.0%) | 81 (19.0%) |
| 5 Years | 0 (0.0%) | 123 (58.3%) |
| 6 to 11 Years | 286 (27.2%) | 290 (24.3%) |
| 12 to 14 Years | 196 (25.2%) | 209 (33.9%) |
| 15 Years | 79 (24.8%) | 46 (31.1%) |
| 16 and 17 Years | 249 (42.4%) | 56 (10.2%) |
| 18 to 24 Years | 51 (4.8%) | 183 (16.5%) |
| 25 to 34 Years | 126 (7.0%) | 475 (24.4%) |
| 35 to 44 Years | 234 (14.2%) | 405 (23.9%) |
| 45 to 54 Years | 101 (4.3%) | 332 (15.4%) |
| 55 to 64 Years | 80 (4.6%) | 386 (18.6%) |
| 65 to 74 Years | 68 (6.7%) | 135 (9.4%) |
| 75 Years and over | 18 (2.5%) | 97 (8.9%) |
| Total | 1,912 (13.7%) | 2,818 (19.2%) |
Income Above Poverty by Sex and Age in Lansing
According to the poverty statistics in Lansing, males aged 5 years and females aged 75 years and over are the age groups that are most secure financially, with 100.0% of males and 91.1% of females in these age groups living above the poverty line.
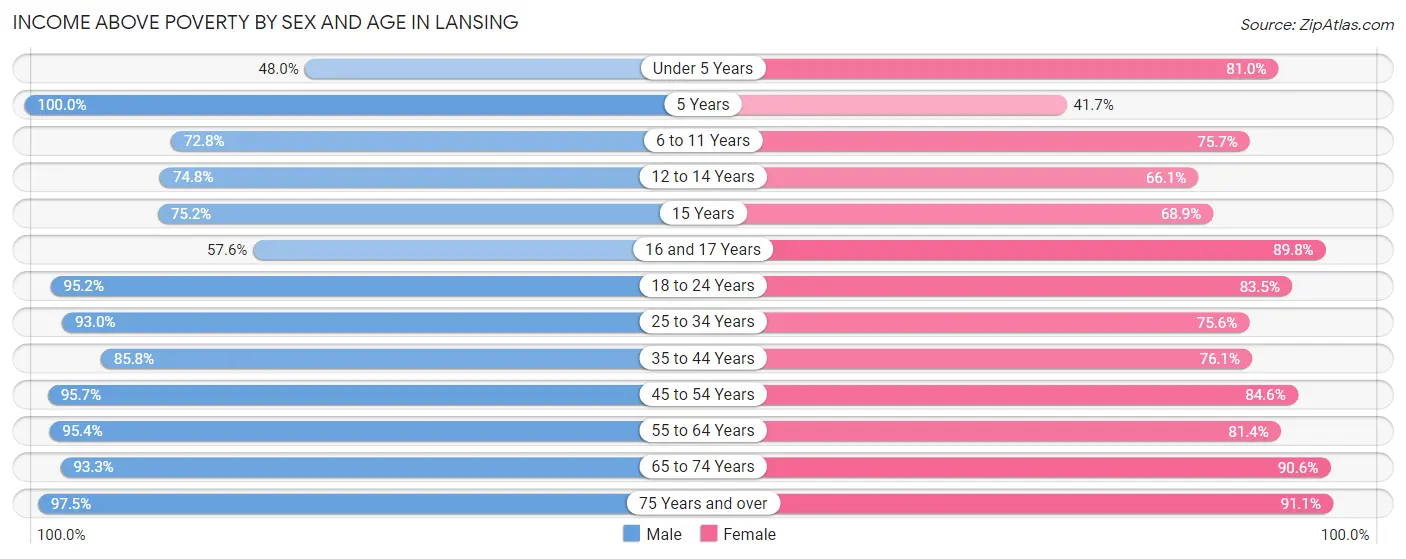
| Age Bracket | Male | Female |
| Under 5 Years | 392 (48.0%) | 346 (81.0%) |
| 5 Years | 56 (100.0%) | 88 (41.7%) |
| 6 to 11 Years | 765 (72.8%) | 903 (75.7%) |
| 12 to 14 Years | 583 (74.8%) | 408 (66.1%) |
| 15 Years | 240 (75.2%) | 102 (68.9%) |
| 16 and 17 Years | 338 (57.6%) | 491 (89.8%) |
| 18 to 24 Years | 1,006 (95.2%) | 927 (83.5%) |
| 25 to 34 Years | 1,679 (93.0%) | 1,470 (75.6%) |
| 35 to 44 Years | 1,418 (85.8%) | 1,289 (76.1%) |
| 45 to 54 Years | 2,249 (95.7%) | 1,823 (84.6%) |
| 55 to 64 Years | 1,663 (95.4%) | 1,694 (81.4%) |
| 65 to 74 Years | 953 (93.3%) | 1,303 (90.6%) |
| 75 Years and over | 711 (97.5%) | 996 (91.1%) |
| Total | 12,053 (86.3%) | 11,840 (80.8%) |
Income Below Poverty Among Married-Couple Families in Lansing
The poverty statistics for married-couple families in Lansing show that 5.3% or 195 of the total 3,703 families live below the poverty line. Families with 1 or 2 children have the highest poverty rate of 12.2%, comprising of 148 families. On the other hand, families with 5 or more children have the lowest poverty rate of 0.0%, which includes 0 families.
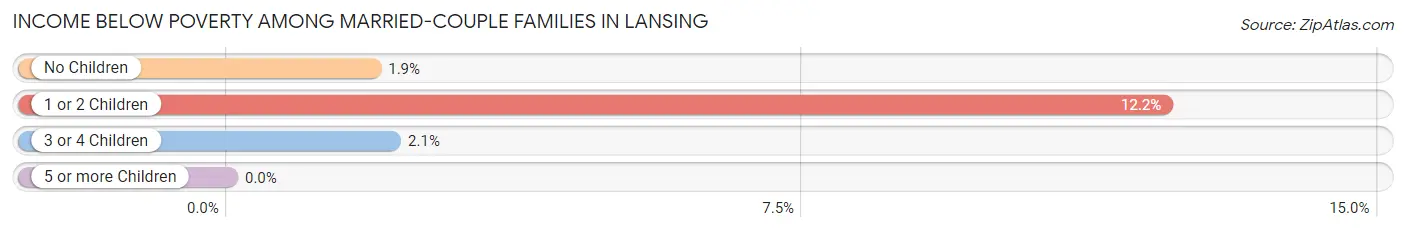
| Children | Above Poverty | Below Poverty |
| No Children | 2,208 (98.1%) | 42 (1.9%) |
| 1 or 2 Children | 1,064 (87.8%) | 148 (12.2%) |
| 3 or 4 Children | 230 (97.9%) | 5 (2.1%) |
| 5 or more Children | 6 (100.0%) | 0 (0.0%) |
| Total | 3,508 (94.7%) | 195 (5.3%) |
Income Below Poverty Among Single-Parent Households in Lansing
According to the poverty data in Lansing, 7.4% or 66 single-father households and 23.6% or 583 single-mother households are living below the poverty line. Among single-father households, those with 1 or 2 children have the highest poverty rate, with 66 households (11.6%) experiencing poverty. Likewise, among single-mother households, those with 3 or 4 children have the highest poverty rate, with 173 households (100.0%) falling below the poverty line.
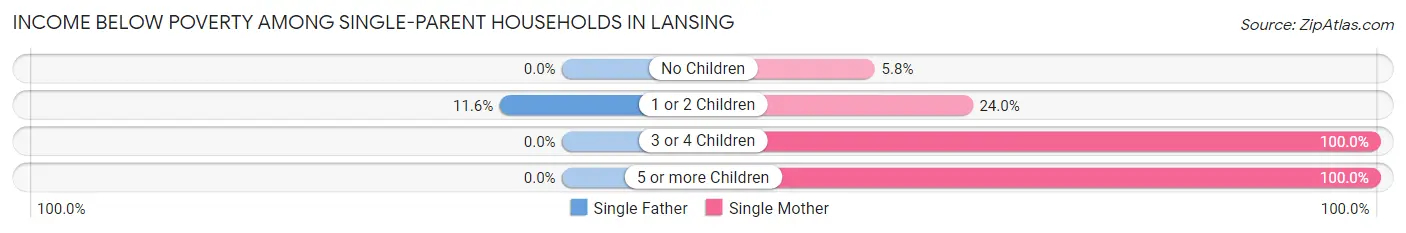
| Children | Single Father | Single Mother |
| No Children | 0 (0.0%) | 64 (5.8%) |
| 1 or 2 Children | 66 (11.6%) | 266 (24.0%) |
| 3 or 4 Children | 0 (0.0%) | 173 (100.0%) |
| 5 or more Children | 0 (0.0%) | 80 (100.0%) |
| Total | 66 (7.4%) | 583 (23.6%) |
Income Below Poverty Among Married-Couple vs Single-Parent Households in Lansing
The poverty data for Lansing shows that 195 of the married-couple family households (5.3%) and 649 of the single-parent households (19.3%) are living below the poverty level. Within the married-couple family households, those with 1 or 2 children have the highest poverty rate, with 148 households (12.2%) falling below the poverty line. Among the single-parent households, those with 5 or more children have the highest poverty rate, with 80 household (100.0%) living below poverty.
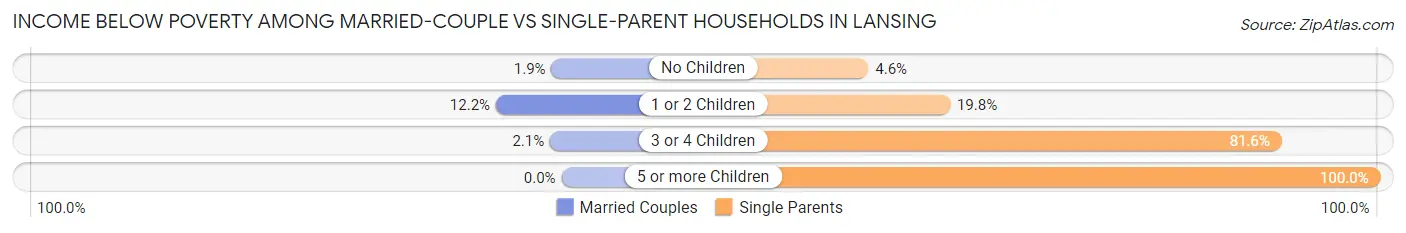
| Children | Married-Couple Families | Single-Parent Households |
| No Children | 42 (1.9%) | 64 (4.6%) |
| 1 or 2 Children | 148 (12.2%) | 332 (19.8%) |
| 3 or 4 Children | 5 (2.1%) | 173 (81.6%) |
| 5 or more Children | 0 (0.0%) | 80 (100.0%) |
| Total | 195 (5.3%) | 649 (19.3%) |
Race in Lansing
The most populous races in Lansing are Black / African American (13,661 | 47.6%), White / Caucasian (10,356 | 36.1%), and Hispanic or Latino (5,562 | 19.4%).
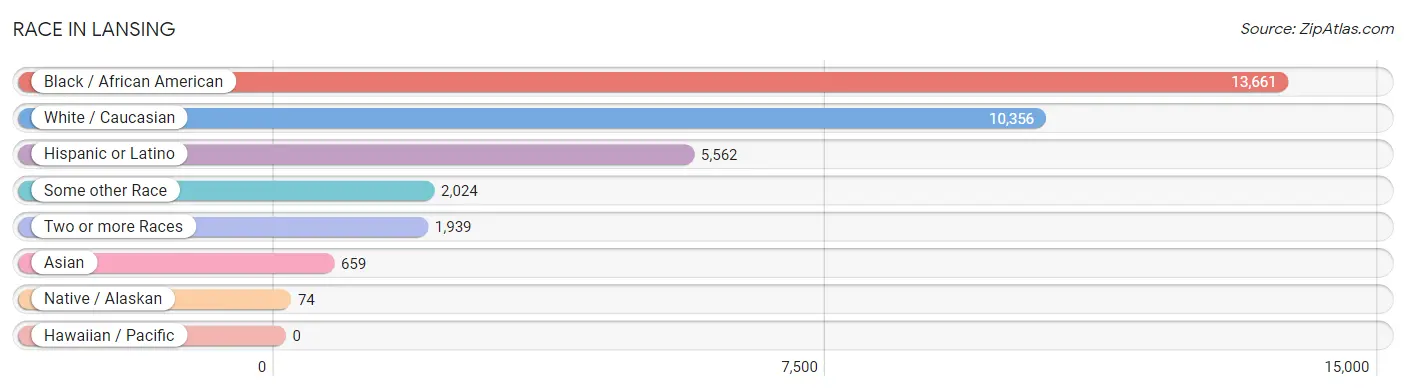
| Race | # Population | % Population |
| Asian | 659 | 2.3% |
| Black / African American | 13,661 | 47.6% |
| Hawaiian / Pacific | 0 | 0.0% |
| Hispanic or Latino | 5,562 | 19.4% |
| Native / Alaskan | 74 | 0.3% |
| White / Caucasian | 10,356 | 36.1% |
| Two or more Races | 1,939 | 6.8% |
| Some other Race | 2,024 | 7.0% |
| Total | 28,713 | 100.0% |
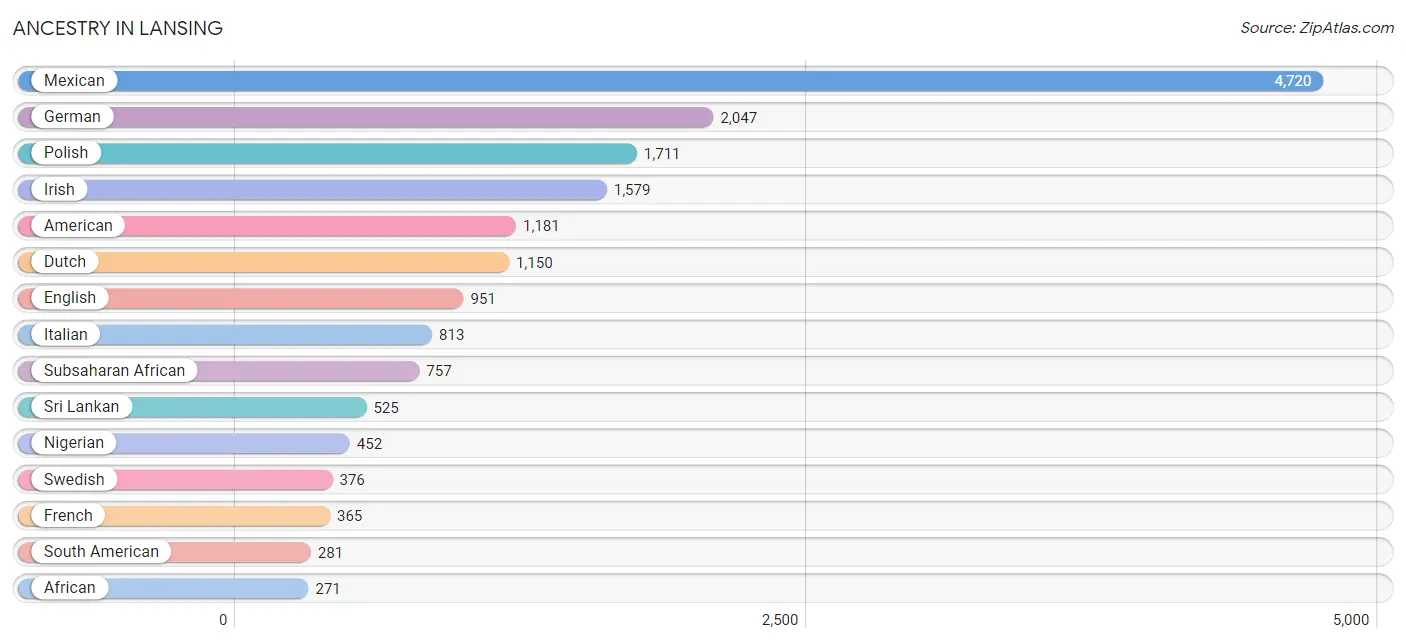
Ancestry in Lansing
The most populous ancestries reported in Lansing are Mexican (4,720 | 16.4%), German (2,047 | 7.1%), Polish (1,711 | 6.0%), Irish (1,579 | 5.5%), and American (1,181 | 4.1%), together accounting for 39.1% of all Lansing residents.
| Ancestry | # Population | % Population |
| African | 271 | 0.9% |
| American | 1,181 | 4.1% |
| Arab | 29 | 0.1% |
| Barbadian | 7 | 0.0% |
| Bolivian | 150 | 0.5% |
| British | 36 | 0.1% |
| Burmese | 131 | 0.5% |
| Central American | 51 | 0.2% |
| Cherokee | 89 | 0.3% |
| Colombian | 8 | 0.0% |
| Croatian | 145 | 0.5% |
| Cuban | 105 | 0.4% |
| Czech | 134 | 0.5% |
| Czechoslovakian | 24 | 0.1% |
| Danish | 45 | 0.2% |
| Dutch | 1,150 | 4.0% |
| Eastern European | 17 | 0.1% |
| Ecuadorian | 96 | 0.3% |
| English | 951 | 3.3% |
| European | 69 | 0.2% |
| Finnish | 31 | 0.1% |
| French | 365 | 1.3% |
| French Canadian | 74 | 0.3% |
| German | 2,047 | 7.1% |
| Greek | 71 | 0.3% |
| Guatemalan | 51 | 0.2% |
| Haitian | 64 | 0.2% |
| Hungarian | 33 | 0.1% |
| Irish | 1,579 | 5.5% |
| Italian | 813 | 2.8% |
| Jamaican | 89 | 0.3% |
| Korean | 115 | 0.4% |
| Lithuanian | 41 | 0.1% |
| Macedonian | 9 | 0.0% |
| Maltese | 16 | 0.1% |
| Mexican | 4,720 | 16.4% |
| Nigerian | 452 | 1.6% |
| Norwegian | 61 | 0.2% |
| Pennsylvania German | 8 | 0.0% |
| Peruvian | 27 | 0.1% |
| Polish | 1,711 | 6.0% |
| Puerto Rican | 268 | 0.9% |
| Romanian | 8 | 0.0% |
| Russian | 7 | 0.0% |
| Scandinavian | 10 | 0.0% |
| Scotch-Irish | 67 | 0.2% |
| Scottish | 121 | 0.4% |
| Serbian | 208 | 0.7% |
| Slovak | 49 | 0.2% |
| South American | 281 | 1.0% |
| Sri Lankan | 525 | 1.8% |
| Subsaharan African | 757 | 2.6% |
| Swedish | 376 | 1.3% |
| Swiss | 24 | 0.1% |
| Syrian | 29 | 0.1% |
| Thai | 46 | 0.2% |
| Turkish | 1 | 0.0% |
| Ukrainian | 44 | 0.2% |
| Welsh | 9 | 0.0% | View All 59 Rows |
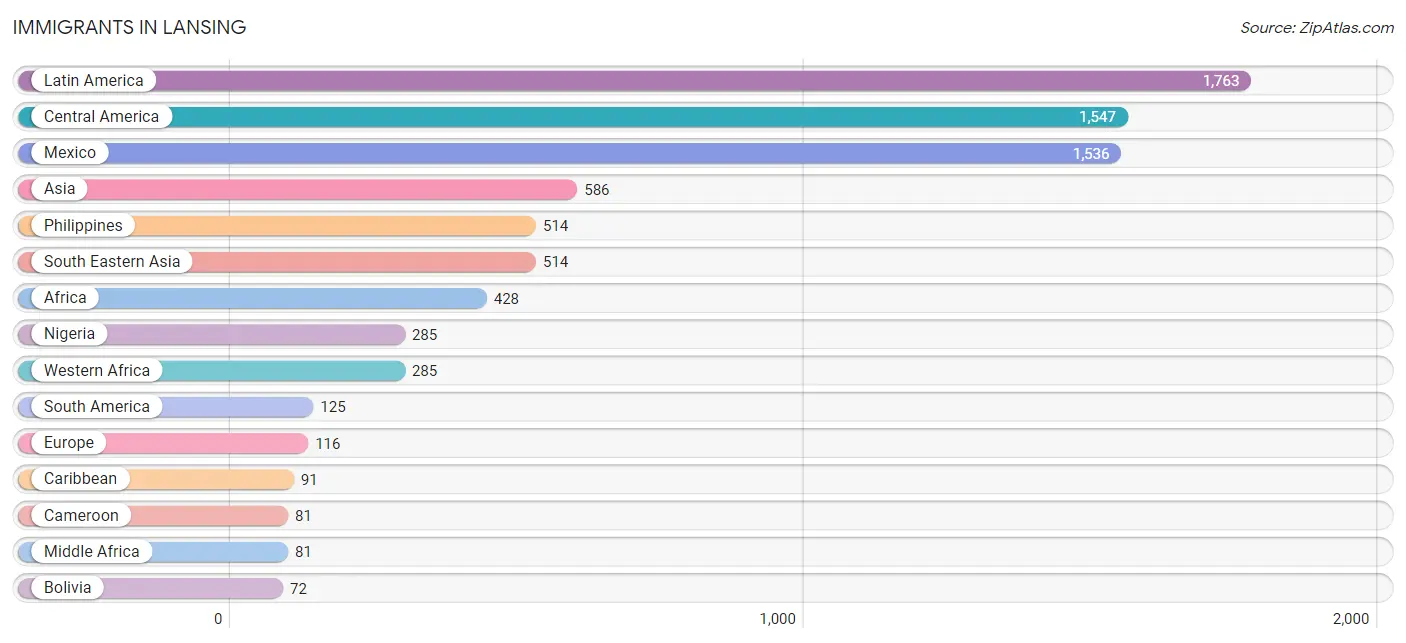
Immigrants in Lansing
The most numerous immigrant groups reported in Lansing came from Latin America (1,763 | 6.1%), Central America (1,547 | 5.4%), Mexico (1,536 | 5.3%), Asia (586 | 2.0%), and Philippines (514 | 1.8%), together accounting for 20.7% of all Lansing residents.
| Immigration Origin | # Population | % Population |
| Africa | 428 | 1.5% |
| Asia | 586 | 2.0% |
| Barbados | 7 | 0.0% |
| Bolivia | 72 | 0.3% |
| Cameroon | 81 | 0.3% |
| Canada | 59 | 0.2% |
| Caribbean | 91 | 0.3% |
| Central America | 1,547 | 5.4% |
| Colombia | 8 | 0.0% |
| Cuba | 15 | 0.1% |
| Eastern Asia | 61 | 0.2% |
| Eastern Europe | 52 | 0.2% |
| Ecuador | 45 | 0.2% |
| England | 18 | 0.1% |
| Europe | 116 | 0.4% |
| Guatemala | 11 | 0.0% |
| Haiti | 39 | 0.1% |
| India | 10 | 0.0% |
| Italy | 5 | 0.0% |
| Jamaica | 30 | 0.1% |
| Korea | 61 | 0.2% |
| Latin America | 1,763 | 6.1% |
| Mexico | 1,536 | 5.3% |
| Middle Africa | 81 | 0.3% |
| Netherlands | 12 | 0.0% |
| Nigeria | 285 | 1.0% |
| Northern Europe | 31 | 0.1% |
| Philippines | 514 | 1.8% |
| Poland | 18 | 0.1% |
| Scotland | 13 | 0.1% |
| Serbia | 34 | 0.1% |
| South America | 125 | 0.4% |
| South Central Asia | 10 | 0.0% |
| South Eastern Asia | 514 | 1.8% |
| Southern Europe | 21 | 0.1% |
| Turkey | 1 | 0.0% |
| Western Africa | 285 | 1.0% |
| Western Asia | 1 | 0.0% |
| Western Europe | 12 | 0.0% | View All 39 Rows |
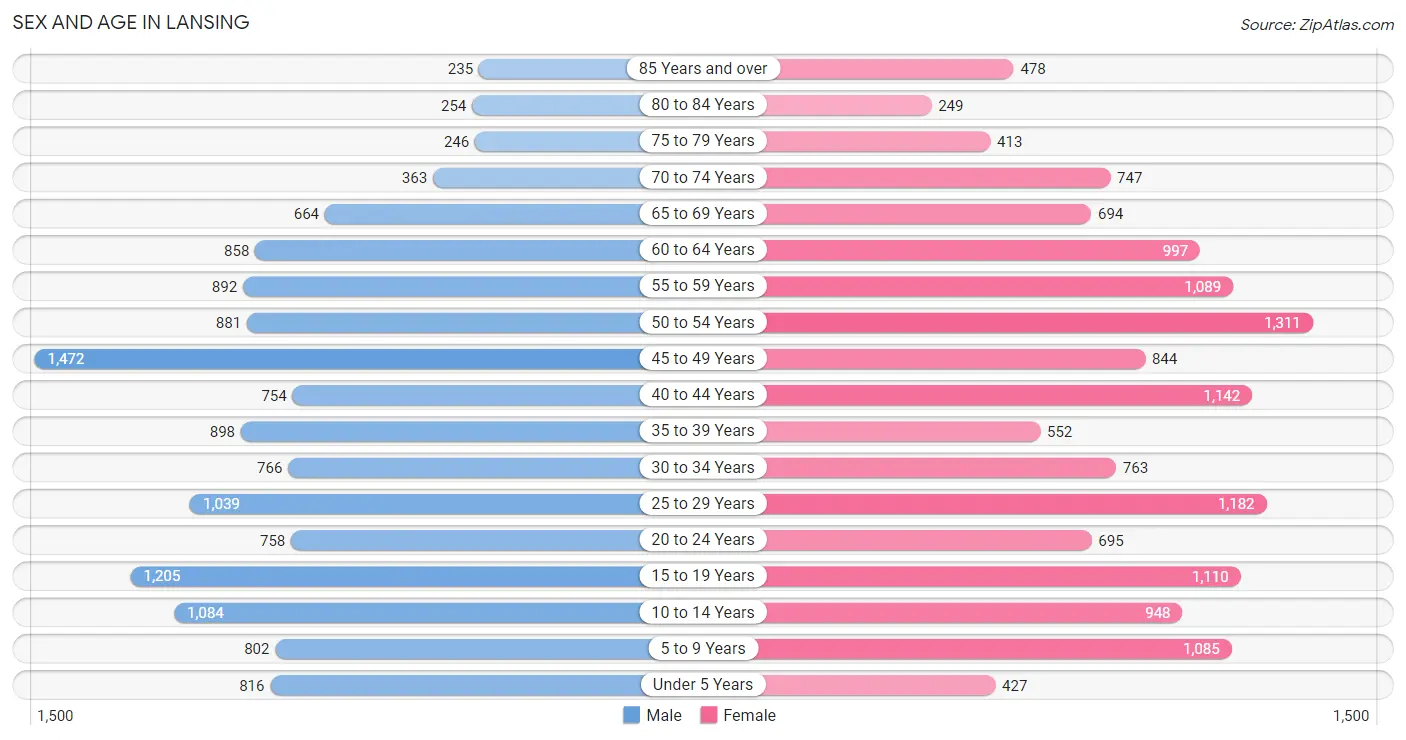
Sex and Age in Lansing
Sex and Age in Lansing
The most populous age groups in Lansing are 45 to 49 Years (1,472 | 10.5%) for men and 50 to 54 Years (1,311 | 8.9%) for women.
| Age Bracket | Male | Female |
| Under 5 Years | 816 (5.8%) | 427 (2.9%) |
| 5 to 9 Years | 802 (5.7%) | 1,085 (7.4%) |
| 10 to 14 Years | 1,084 (7.7%) | 948 (6.4%) |
| 15 to 19 Years | 1,205 (8.6%) | 1,110 (7.5%) |
| 20 to 24 Years | 758 (5.4%) | 695 (4.7%) |
| 25 to 29 Years | 1,039 (7.4%) | 1,182 (8.0%) |
| 30 to 34 Years | 766 (5.5%) | 763 (5.2%) |
| 35 to 39 Years | 898 (6.4%) | 552 (3.7%) |
| 40 to 44 Years | 754 (5.4%) | 1,142 (7.7%) |
| 45 to 49 Years | 1,472 (10.5%) | 844 (5.7%) |
| 50 to 54 Years | 881 (6.3%) | 1,311 (8.9%) |
| 55 to 59 Years | 892 (6.4%) | 1,089 (7.4%) |
| 60 to 64 Years | 858 (6.1%) | 997 (6.8%) |
| 65 to 69 Years | 664 (4.8%) | 694 (4.7%) |
| 70 to 74 Years | 363 (2.6%) | 747 (5.1%) |
| 75 to 79 Years | 246 (1.8%) | 413 (2.8%) |
| 80 to 84 Years | 254 (1.8%) | 249 (1.7%) |
| 85 Years and over | 235 (1.7%) | 478 (3.3%) |
| Total | 13,987 (100.0%) | 14,726 (100.0%) |
Families and Households in Lansing
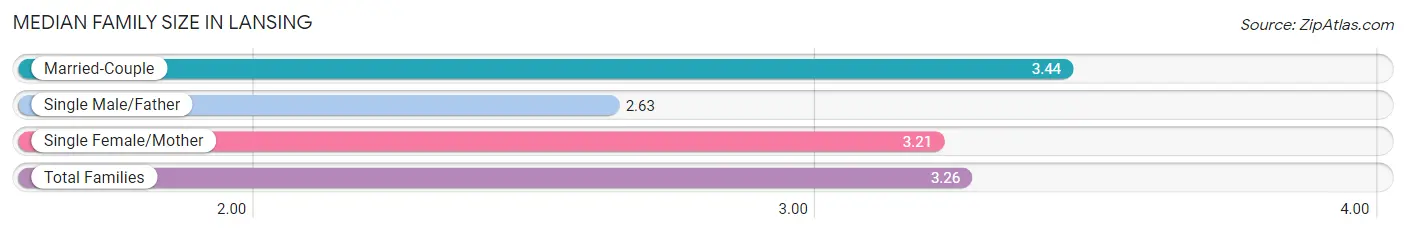
Median Family Size in Lansing
The median family size in Lansing is 3.26 persons per family, with married-couple families (3,703 | 52.4%) accounting for the largest median family size of 3.44 persons per family. On the other hand, single male/father families (889 | 12.6%) represent the smallest median family size with 2.63 persons per family.
| Family Type | # Families | Family Size |
| Married-Couple | 3,703 (52.4%) | 3.44 |
| Single Male/Father | 889 (12.6%) | 2.63 |
| Single Female/Mother | 2,472 (35.0%) | 3.21 |
| Total Families | 7,064 (100.0%) | 3.26 |
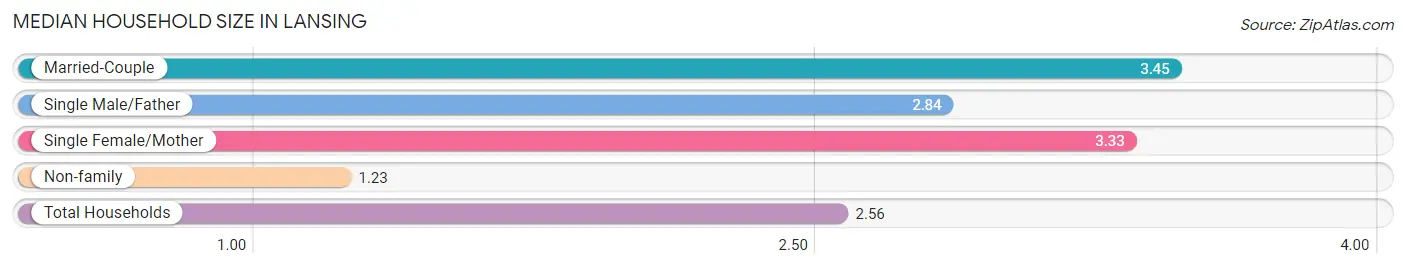
Median Household Size in Lansing
The median household size in Lansing is 2.56 persons per household, with married-couple households (3,703 | 33.1%) accounting for the largest median household size of 3.45 persons per household. non-family households (4,115 | 36.8%) represent the smallest median household size with 1.23 persons per household.
| Household Type | # Households | Household Size |
| Married-Couple | 3,703 (33.1%) | 3.45 |
| Single Male/Father | 889 (8.0%) | 2.84 |
| Single Female/Mother | 2,472 (22.1%) | 3.33 |
| Non-family | 4,115 (36.8%) | 1.23 |
| Total Households | 11,179 (100.0%) | 2.56 |
Household Size by Marriage Status in Lansing
Out of a total of 11,179 households in Lansing, 7,064 (63.2%) are family households, while 4,115 (36.8%) are nonfamily households. The most numerous type of family households are 2-person households, comprising 2,799, and the most common type of nonfamily households are 1-person households, comprising 3,590.
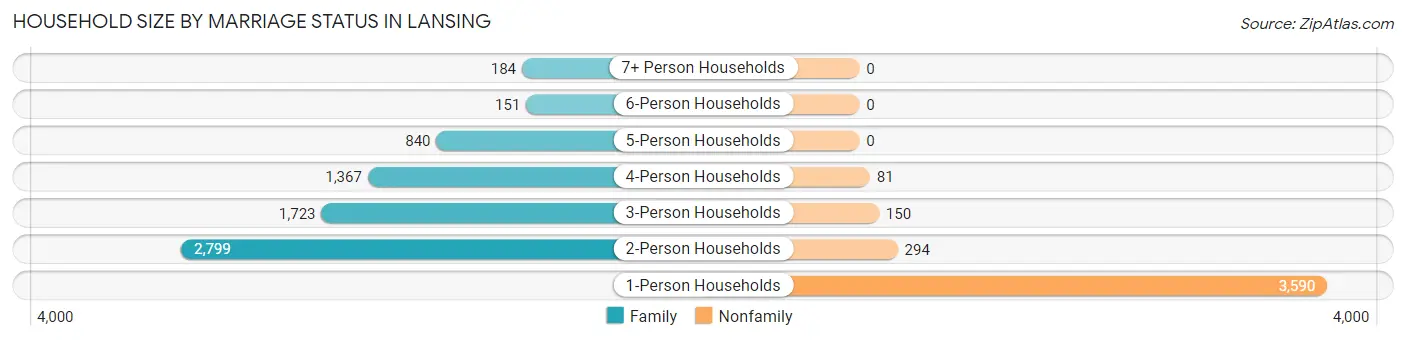
| Household Size | Family Households | Nonfamily Households |
| 1-Person Households | - | 3,590 (32.1%) |
| 2-Person Households | 2,799 (25.0%) | 294 (2.6%) |
| 3-Person Households | 1,723 (15.4%) | 150 (1.3%) |
| 4-Person Households | 1,367 (12.2%) | 81 (0.7%) |
| 5-Person Households | 840 (7.5%) | 0 (0.0%) |
| 6-Person Households | 151 (1.3%) | 0 (0.0%) |
| 7+ Person Households | 184 (1.7%) | 0 (0.0%) |
| Total | 7,064 (63.2%) | 4,115 (36.8%) |
Female Fertility in Lansing
Fertility by Age in Lansing
Average fertility rate in Lansing is 54.0 births per 1,000 women. Women in the age bracket of 20 to 34 years have the highest fertility rate with 119.0 births per 1,000 women. Women in the age bracket of 20 to 34 years acount for 90.2% of all women with births.
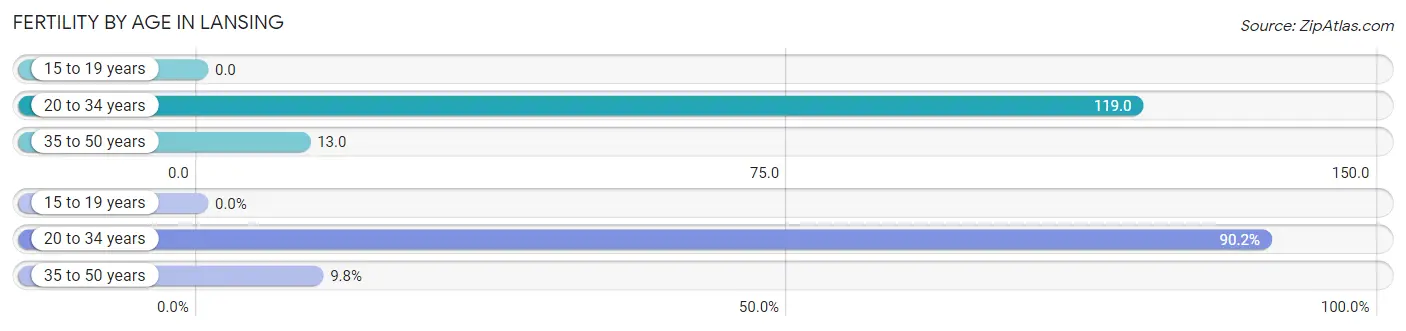
| Age Bracket | Women with Births | Births / 1,000 Women |
| 15 to 19 years | 0 (0.0%) | 0.0 |
| 20 to 34 years | 314 (90.2%) | 119.0 |
| 35 to 50 years | 34 (9.8%) | 13.0 |
| Total | 348 (100.0%) | 54.0 |
Fertility by Age by Marriage Status in Lansing
39.9% of women with births (348) in Lansing are married. The highest percentage of unmarried women with births falls into 20 to 34 years age bracket with 61.5% of them unmarried at the time of birth, while the lowest percentage of unmarried women with births belong to 35 to 50 years age bracket with 47.1% of them unmarried.
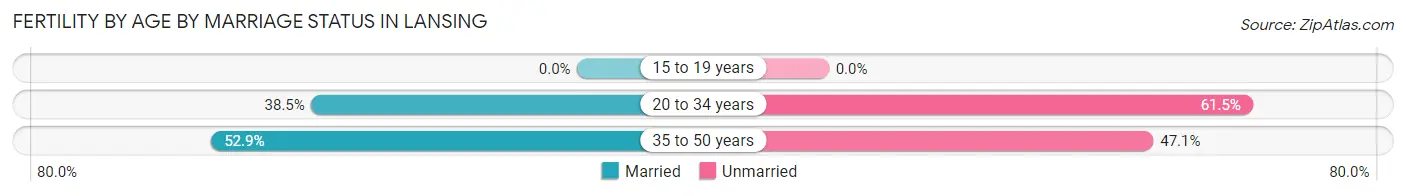
| Age Bracket | Married | Unmarried |
| 15 to 19 years | 0 (0.0%) | 0 (0.0%) |
| 20 to 34 years | 121 (38.5%) | 193 (61.5%) |
| 35 to 50 years | 18 (52.9%) | 16 (47.1%) |
| Total | 139 (39.9%) | 209 (60.1%) |
Fertility by Education in Lansing
Average fertility rate in Lansing is 54.0 births per 1,000 women. Women with the education attainment of high school diploma have the highest fertility rate of 87.0 births per 1,000 women, while women with the education attainment of less than high school have the lowest fertility at 33.0 births per 1,000 women. Women with the education attainment of college or associate's degree represent 29.9% of all women with births.
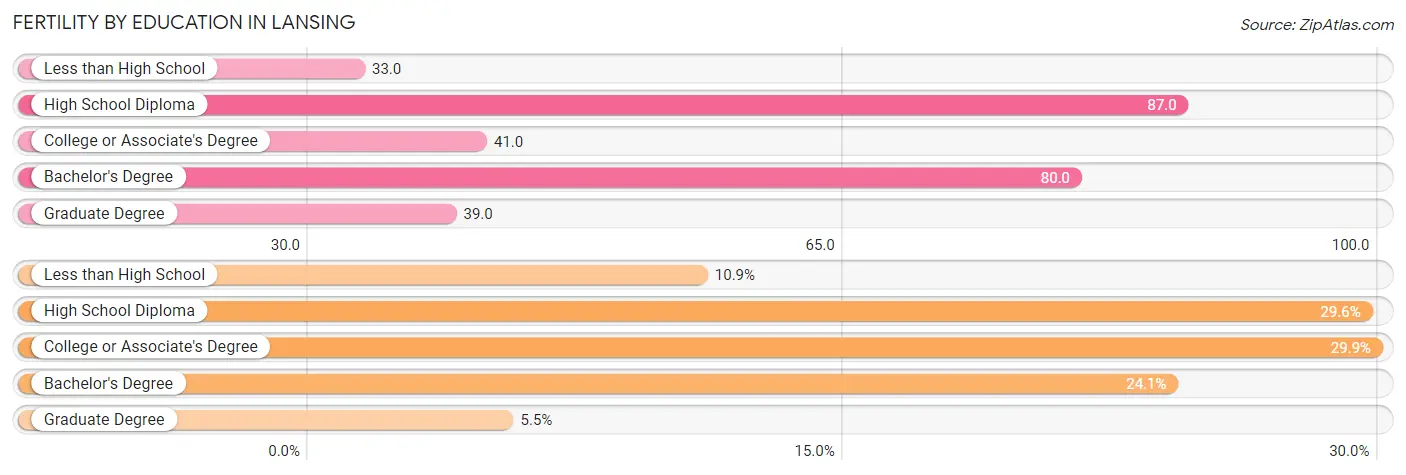
| Educational Attainment | Women with Births | Births / 1,000 Women |
| Less than High School | 38 (10.9%) | 33.0 |
| High School Diploma | 103 (29.6%) | 87.0 |
| College or Associate's Degree | 104 (29.9%) | 41.0 |
| Bachelor's Degree | 84 (24.1%) | 80.0 |
| Graduate Degree | 19 (5.5%) | 39.0 |
| Total | 348 (100.0%) | 54.0 |
Fertility by Education by Marriage Status in Lansing
60.1% of women with births in Lansing are unmarried. Women with the educational attainment of bachelor's degree are most likely to be married with 79.8% of them married at childbirth, while women with the educational attainment of less than high school are least likely to be married with 100.0% of them unmarried at childbirth.
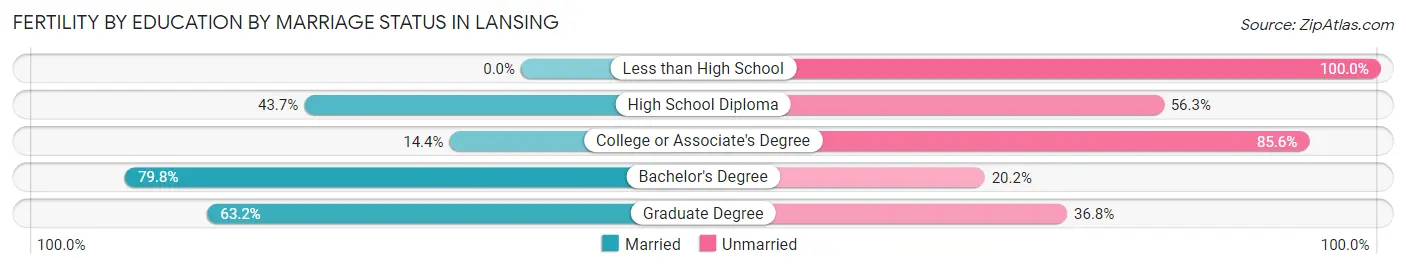
| Educational Attainment | Married | Unmarried |
| Less than High School | 0 (0.0%) | 38 (100.0%) |
| High School Diploma | 45 (43.7%) | 58 (56.3%) |
| College or Associate's Degree | 15 (14.4%) | 89 (85.6%) |
| Bachelor's Degree | 67 (79.8%) | 17 (20.2%) |
| Graduate Degree | 12 (63.2%) | 7 (36.8%) |
| Total | 139 (39.9%) | 209 (60.1%) |
Employment Characteristics in Lansing
Employment by Class of Employer in Lansing
Among the 13,220 employed individuals in Lansing, private company employees (9,132 | 69.1%), not-for-profit organizations (1,591 | 12.0%), and local government employees (1,274 | 9.6%) make up the most common classes of employment.
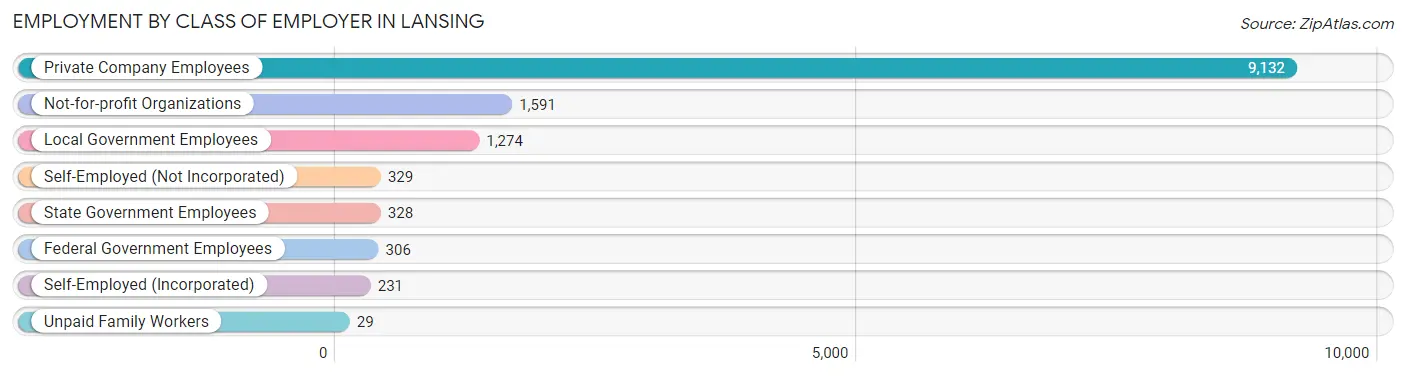
| Employer Class | # Employees | % Employees |
| Private Company Employees | 9,132 | 69.1% |
| Self-Employed (Incorporated) | 231 | 1.8% |
| Self-Employed (Not Incorporated) | 329 | 2.5% |
| Not-for-profit Organizations | 1,591 | 12.0% |
| Local Government Employees | 1,274 | 9.6% |
| State Government Employees | 328 | 2.5% |
| Federal Government Employees | 306 | 2.3% |
| Unpaid Family Workers | 29 | 0.2% |
| Total | 13,220 | 100.0% |
Employment Status by Age in Lansing
According to the labor force statistics for Lansing, out of the total population over 16 years of age (23,084), 66.7% or 15,397 individuals are in the labor force, with 10.9% or 1,678 of them unemployed. The age group with the highest labor force participation rate is 25 to 29 years, with 87.2% or 1,937 individuals in the labor force. Within the labor force, the 16 to 19 years age range has the highest percentage of unemployed individuals, with 41.2% or 403 of them being unemployed.
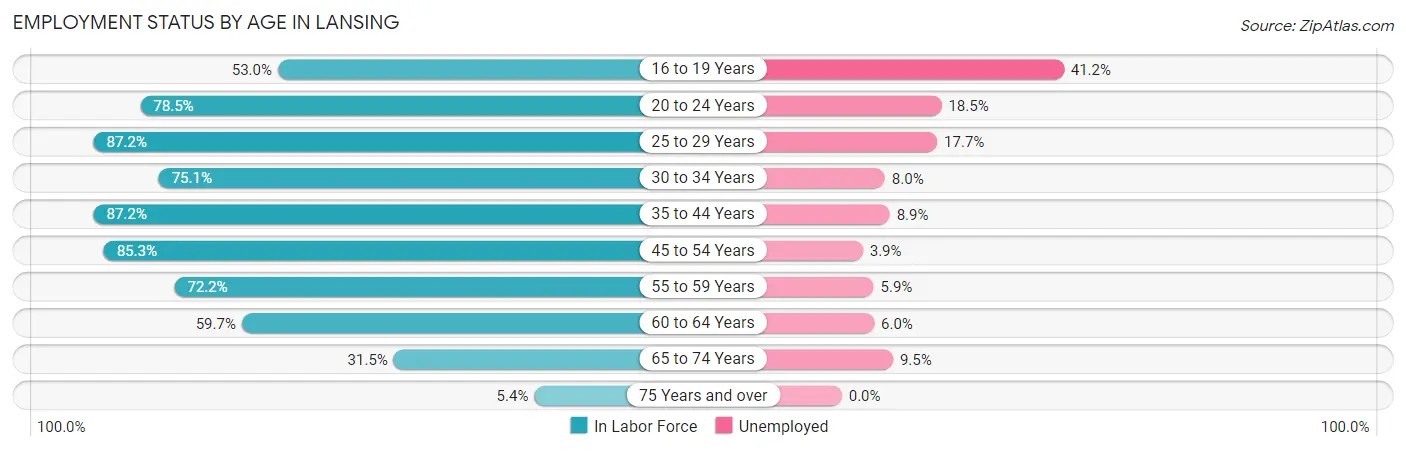
| Age Bracket | In Labor Force | Unemployed |
| 16 to 19 Years | 979 (53.0%) | 403 (41.2%) |
| 20 to 24 Years | 1,141 (78.5%) | 211 (18.5%) |
| 25 to 29 Years | 1,937 (87.2%) | 343 (17.7%) |
| 30 to 34 Years | 1,148 (75.1%) | 92 (8.0%) |
| 35 to 44 Years | 2,918 (87.2%) | 260 (8.9%) |
| 45 to 54 Years | 3,845 (85.3%) | 150 (3.9%) |
| 55 to 59 Years | 1,430 (72.2%) | 84 (5.9%) |
| 60 to 64 Years | 1,107 (59.7%) | 66 (6.0%) |
| 65 to 74 Years | 777 (31.5%) | 74 (9.5%) |
| 75 Years and over | 101 (5.4%) | 0 (0.0%) |
| Total | 15,397 (66.7%) | 1,678 (10.9%) |
Employment Status by Educational Attainment in Lansing
According to labor force statistics for Lansing, 80.2% of individuals (12,383) out of the total population between 25 and 64 years of age (15,440) are in the labor force, with 8.0% or 991 of them being unemployed. The group with the highest labor force participation rate are those with the educational attainment of bachelor's degree or higher, with 91.1% or 3,516 individuals in the labor force. Within the labor force, individuals with high school diploma education have the highest percentage of unemployment, with 12.6% or 421 of them being unemployed.
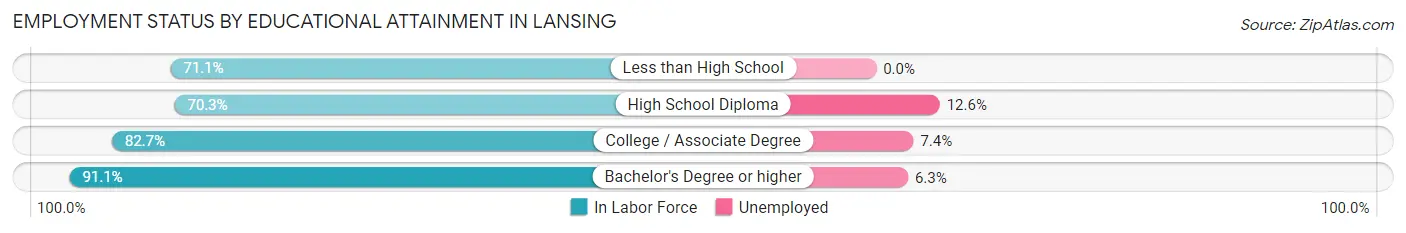
| Educational Attainment | In Labor Force | Unemployed |
| Less than High School | 721 (71.1%) | 0 (0.0%) |
| High School Diploma | 3,338 (70.3%) | 598 (12.6%) |
| College / Associate Degree | 4,812 (82.7%) | 431 (7.4%) |
| Bachelor's Degree or higher | 3,516 (91.1%) | 243 (6.3%) |
| Total | 12,383 (80.2%) | 1,235 (8.0%) |
Employment Occupations by Sex in Lansing
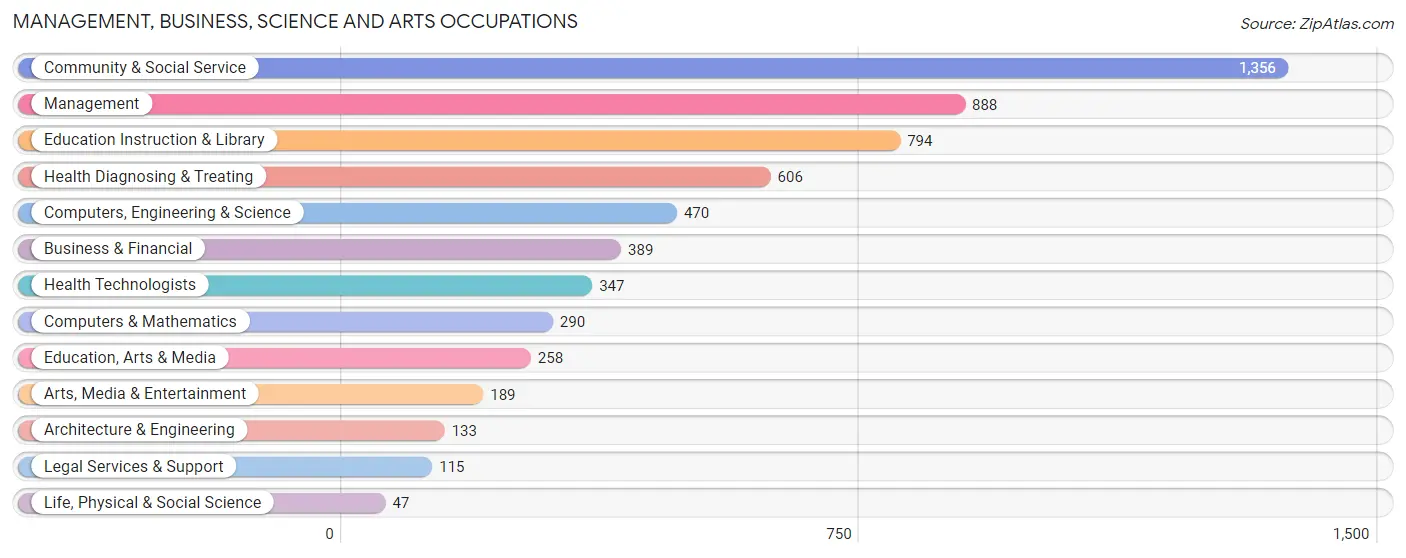
Management, Business, Science and Arts Occupations
The most common Management, Business, Science and Arts occupations in Lansing are Community & Social Service (1,356 | 9.9%), Management (888 | 6.5%), Education Instruction & Library (794 | 5.8%), Health Diagnosing & Treating (606 | 4.4%), and Computers, Engineering & Science (470 | 3.4%).
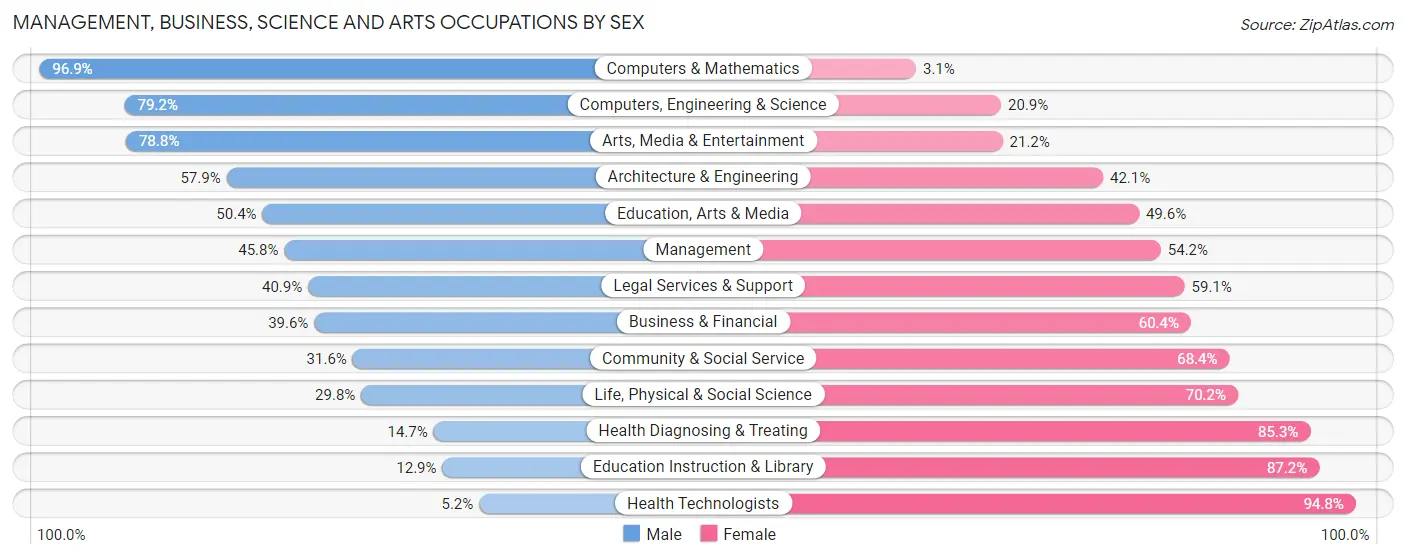
Management, Business, Science and Arts Occupations by Sex
Within the Management, Business, Science and Arts occupations in Lansing, the most male-oriented occupations are Computers & Mathematics (96.9%), Computers, Engineering & Science (79.1%), and Arts, Media & Entertainment (78.8%), while the most female-oriented occupations are Health Technologists (94.8%), Education Instruction & Library (87.2%), and Health Diagnosing & Treating (85.3%).
| Occupation | Male | Female |
| Management | 407 (45.8%) | 481 (54.2%) |
| Business & Financial | 154 (39.6%) | 235 (60.4%) |
| Computers, Engineering & Science | 372 (79.1%) | 98 (20.8%) |
| Computers & Mathematics | 281 (96.9%) | 9 (3.1%) |
| Architecture & Engineering | 77 (57.9%) | 56 (42.1%) |
| Life, Physical & Social Science | 14 (29.8%) | 33 (70.2%) |
| Community & Social Service | 428 (31.6%) | 928 (68.4%) |
| Education, Arts & Media | 130 (50.4%) | 128 (49.6%) |
| Legal Services & Support | 47 (40.9%) | 68 (59.1%) |
| Education Instruction & Library | 102 (12.9%) | 692 (87.2%) |
| Arts, Media & Entertainment | 149 (78.8%) | 40 (21.2%) |
| Health Diagnosing & Treating | 89 (14.7%) | 517 (85.3%) |
| Health Technologists | 18 (5.2%) | 329 (94.8%) |
| Total (Category) | 1,450 (39.1%) | 2,259 (60.9%) |
| Total (Overall) | 7,025 (51.3%) | 6,656 (48.6%) |
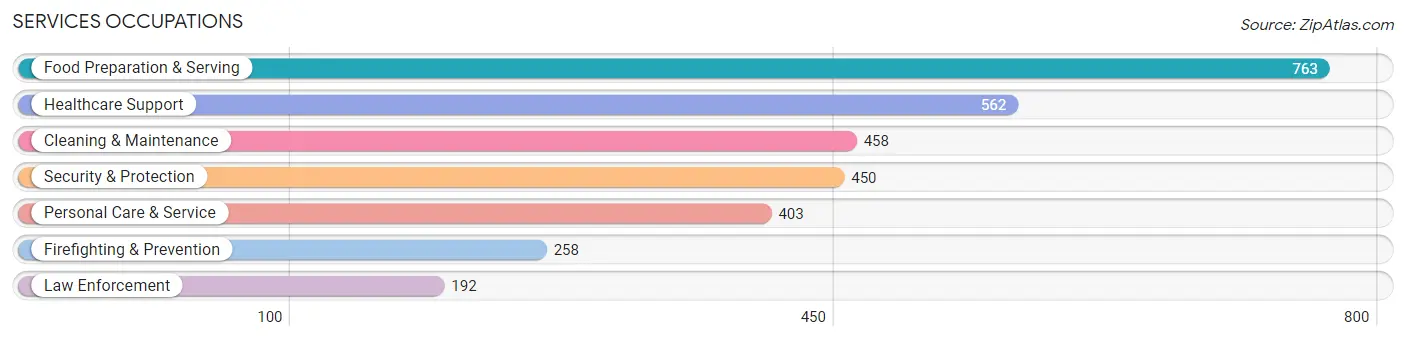
Services Occupations
The most common Services occupations in Lansing are Food Preparation & Serving (763 | 5.6%), Healthcare Support (562 | 4.1%), Cleaning & Maintenance (458 | 3.4%), Security & Protection (450 | 3.3%), and Personal Care & Service (403 | 2.9%).
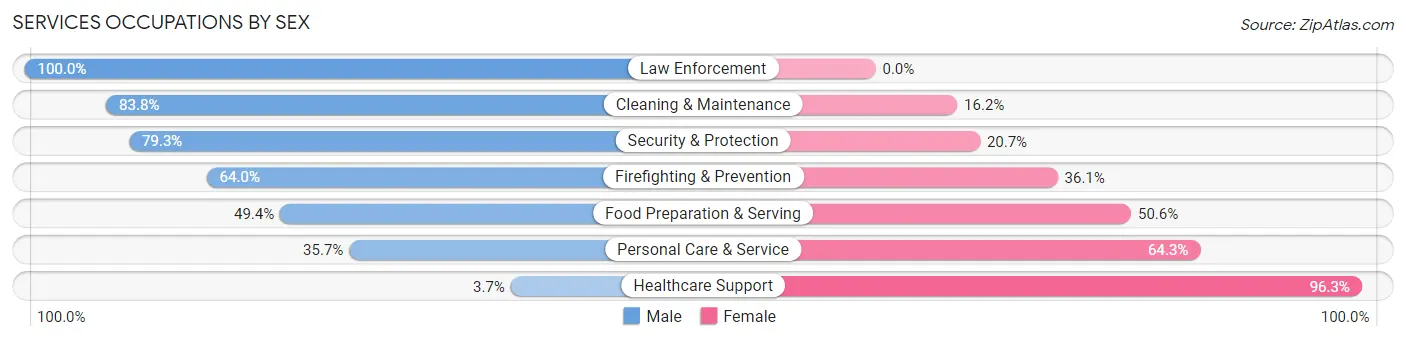
Services Occupations by Sex
Within the Services occupations in Lansing, the most male-oriented occupations are Law Enforcement (100.0%), Cleaning & Maintenance (83.8%), and Security & Protection (79.3%), while the most female-oriented occupations are Healthcare Support (96.3%), Personal Care & Service (64.3%), and Food Preparation & Serving (50.6%).
| Occupation | Male | Female |
| Healthcare Support | 21 (3.7%) | 541 (96.3%) |
| Security & Protection | 357 (79.3%) | 93 (20.7%) |
| Firefighting & Prevention | 165 (63.9%) | 93 (36.0%) |
| Law Enforcement | 192 (100.0%) | 0 (0.0%) |
| Food Preparation & Serving | 377 (49.4%) | 386 (50.6%) |
| Cleaning & Maintenance | 384 (83.8%) | 74 (16.2%) |
| Personal Care & Service | 144 (35.7%) | 259 (64.3%) |
| Total (Category) | 1,283 (48.7%) | 1,353 (51.3%) |
| Total (Overall) | 7,025 (51.3%) | 6,656 (48.6%) |
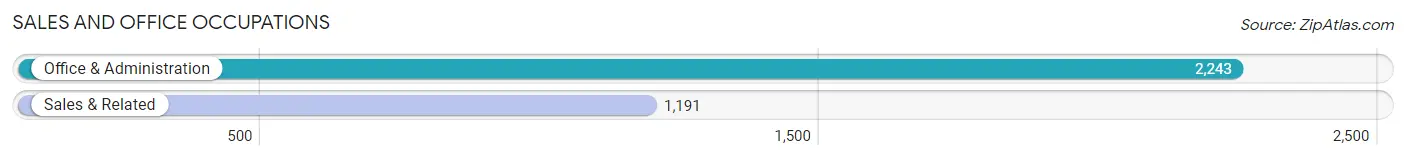
Sales and Office Occupations
The most common Sales and Office occupations in Lansing are Office & Administration (2,243 | 16.4%), and Sales & Related (1,191 | 8.7%).
Sales and Office Occupations by Sex
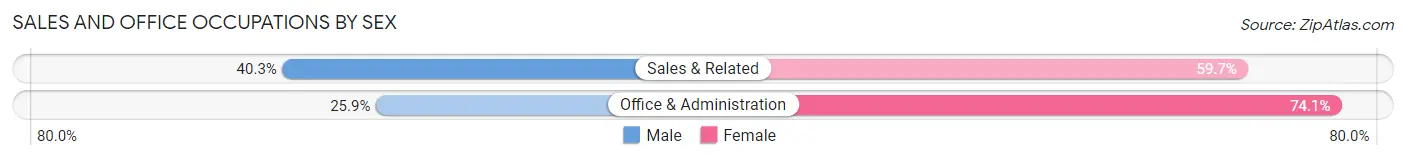
| Occupation | Male | Female |
| Sales & Related | 480 (40.3%) | 711 (59.7%) |
| Office & Administration | 581 (25.9%) | 1,662 (74.1%) |
| Total (Category) | 1,061 (30.9%) | 2,373 (69.1%) |
| Total (Overall) | 7,025 (51.3%) | 6,656 (48.6%) |
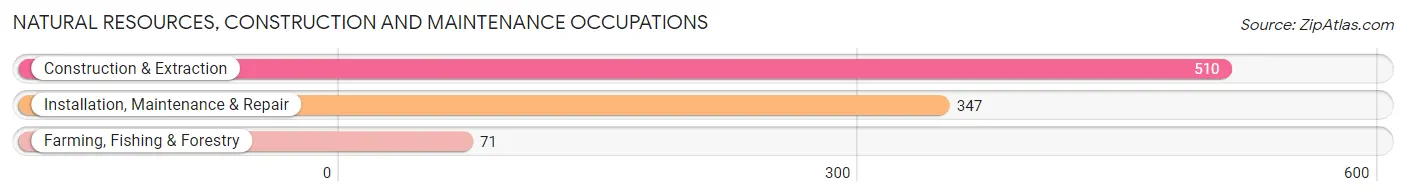
Natural Resources, Construction and Maintenance Occupations
The most common Natural Resources, Construction and Maintenance occupations in Lansing are Construction & Extraction (510 | 3.7%), Installation, Maintenance & Repair (347 | 2.5%), and Farming, Fishing & Forestry (71 | 0.5%).
Natural Resources, Construction and Maintenance Occupations by Sex
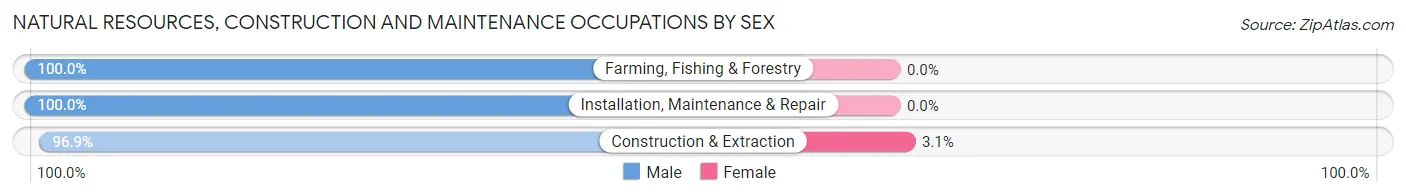
| Occupation | Male | Female |
| Farming, Fishing & Forestry | 71 (100.0%) | 0 (0.0%) |
| Construction & Extraction | 494 (96.9%) | 16 (3.1%) |
| Installation, Maintenance & Repair | 347 (100.0%) | 0 (0.0%) |
| Total (Category) | 912 (98.3%) | 16 (1.7%) |
| Total (Overall) | 7,025 (51.3%) | 6,656 (48.6%) |
Production, Transportation and Moving Occupations
The most common Production, Transportation and Moving occupations in Lansing are Transportation (1,160 | 8.5%), Production (992 | 7.2%), and Material Moving (822 | 6.0%).
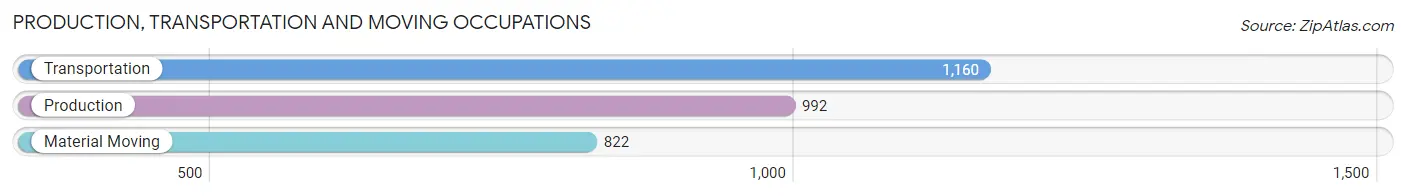
Production, Transportation and Moving Occupations by Sex
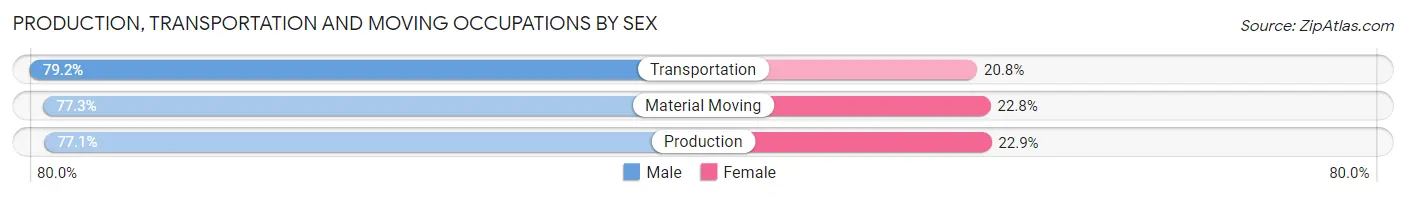
| Occupation | Male | Female |
| Production | 765 (77.1%) | 227 (22.9%) |
| Transportation | 919 (79.2%) | 241 (20.8%) |
| Material Moving | 635 (77.2%) | 187 (22.8%) |
| Total (Category) | 2,319 (78.0%) | 655 (22.0%) |
| Total (Overall) | 7,025 (51.3%) | 6,656 (48.6%) |
Employment Industries by Sex in Lansing
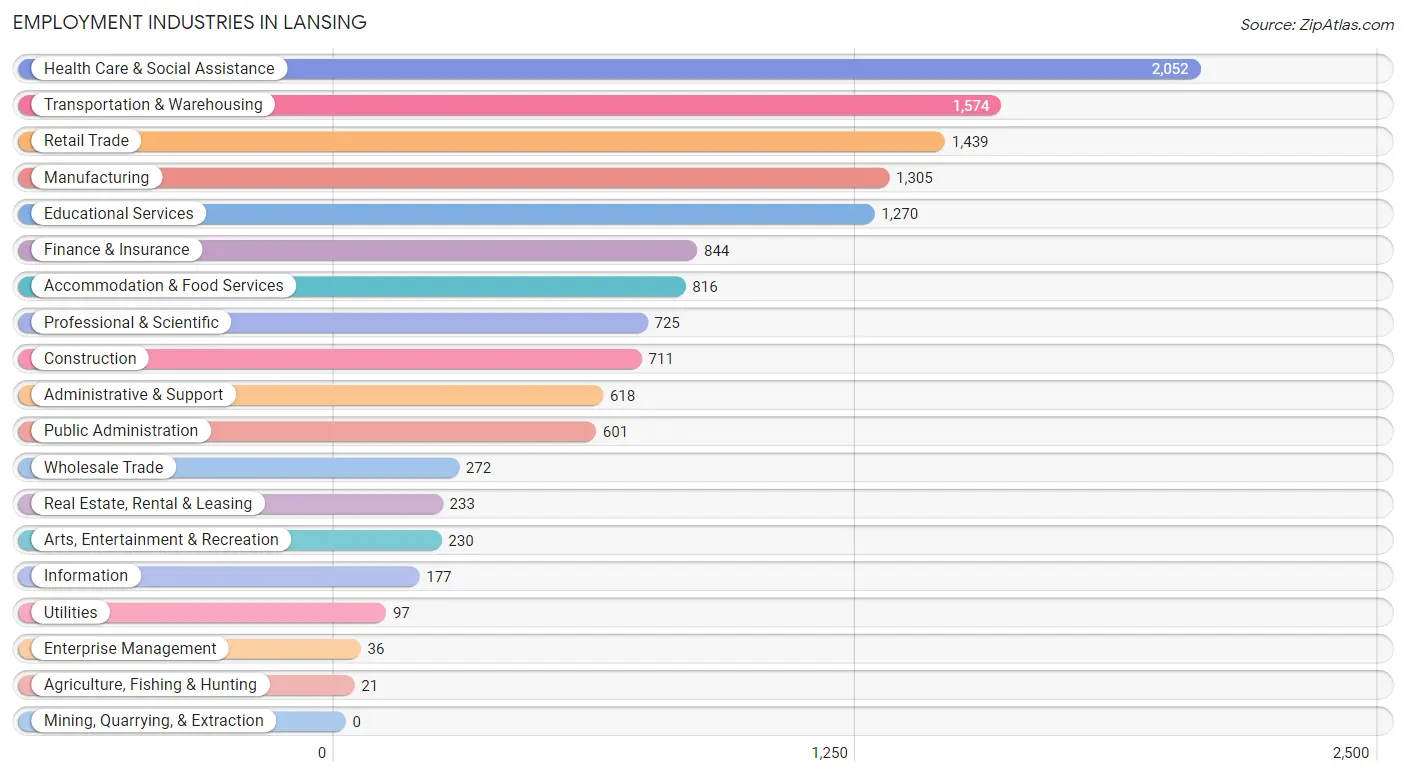
Employment Industries in Lansing
The major employment industries in Lansing include Health Care & Social Assistance (2,052 | 15.0%), Transportation & Warehousing (1,574 | 11.5%), Retail Trade (1,439 | 10.5%), Manufacturing (1,305 | 9.5%), and Educational Services (1,270 | 9.3%).
Employment Industries by Sex in Lansing
The Lansing industries that see more men than women are Agriculture, Fishing & Hunting (95.2%), Wholesale Trade (86.8%), and Construction (85.4%), whereas the industries that tend to have a higher number of women are Enterprise Management (100.0%), Health Care & Social Assistance (80.3%), and Finance & Insurance (75.6%).
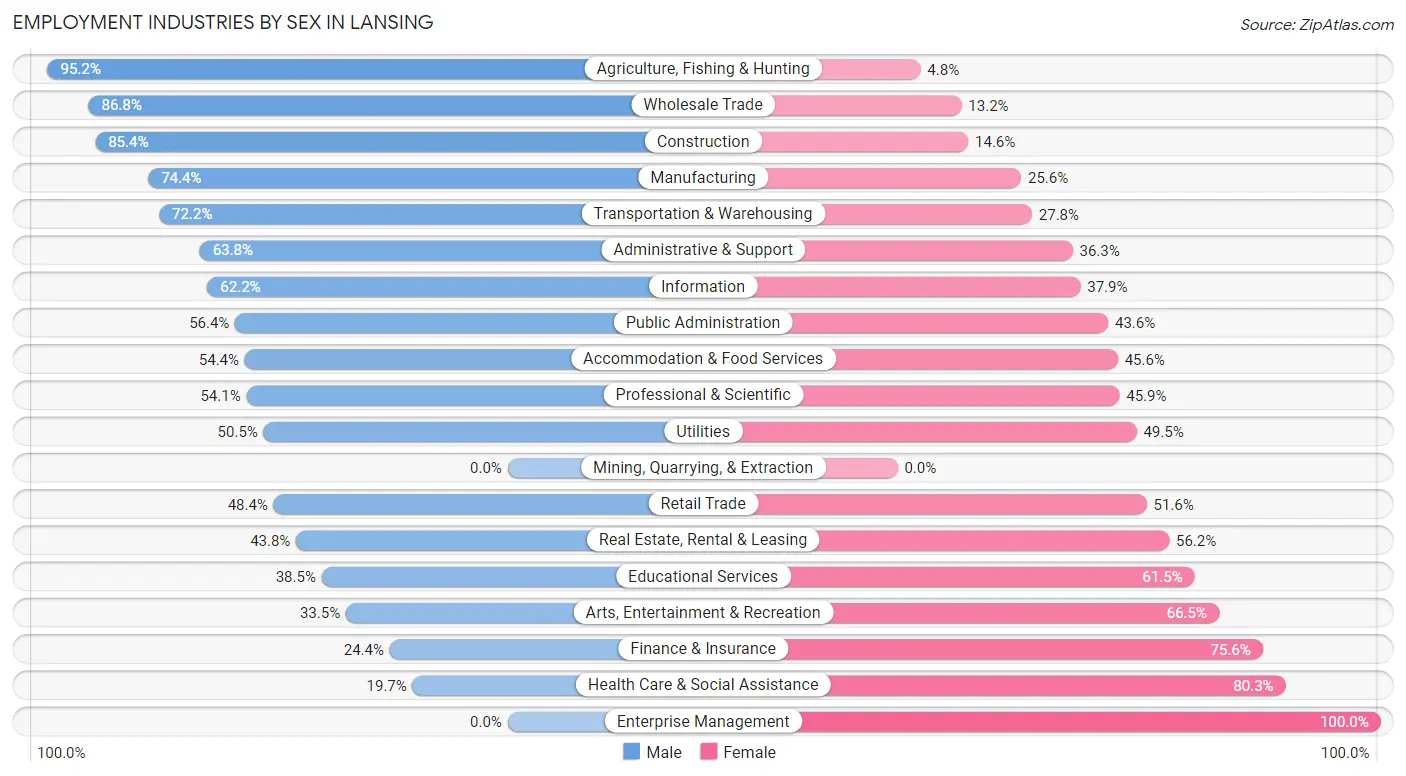
| Industry | Male | Female |
| Agriculture, Fishing & Hunting | 20 (95.2%) | 1 (4.8%) |
| Mining, Quarrying, & Extraction | 0 (0.0%) | 0 (0.0%) |
| Construction | 607 (85.4%) | 104 (14.6%) |
| Manufacturing | 971 (74.4%) | 334 (25.6%) |
| Wholesale Trade | 236 (86.8%) | 36 (13.2%) |
| Retail Trade | 697 (48.4%) | 742 (51.6%) |
| Transportation & Warehousing | 1,136 (72.2%) | 438 (27.8%) |
| Utilities | 49 (50.5%) | 48 (49.5%) |
| Information | 110 (62.2%) | 67 (37.9%) |
| Finance & Insurance | 206 (24.4%) | 638 (75.6%) |
| Real Estate, Rental & Leasing | 102 (43.8%) | 131 (56.2%) |
| Professional & Scientific | 392 (54.1%) | 333 (45.9%) |
| Enterprise Management | 0 (0.0%) | 36 (100.0%) |
| Administrative & Support | 394 (63.7%) | 224 (36.2%) |
| Educational Services | 489 (38.5%) | 781 (61.5%) |
| Health Care & Social Assistance | 404 (19.7%) | 1,648 (80.3%) |
| Arts, Entertainment & Recreation | 77 (33.5%) | 153 (66.5%) |
| Accommodation & Food Services | 444 (54.4%) | 372 (45.6%) |
| Public Administration | 339 (56.4%) | 262 (43.6%) |
| Total | 7,025 (51.3%) | 6,656 (48.6%) |
Education in Lansing
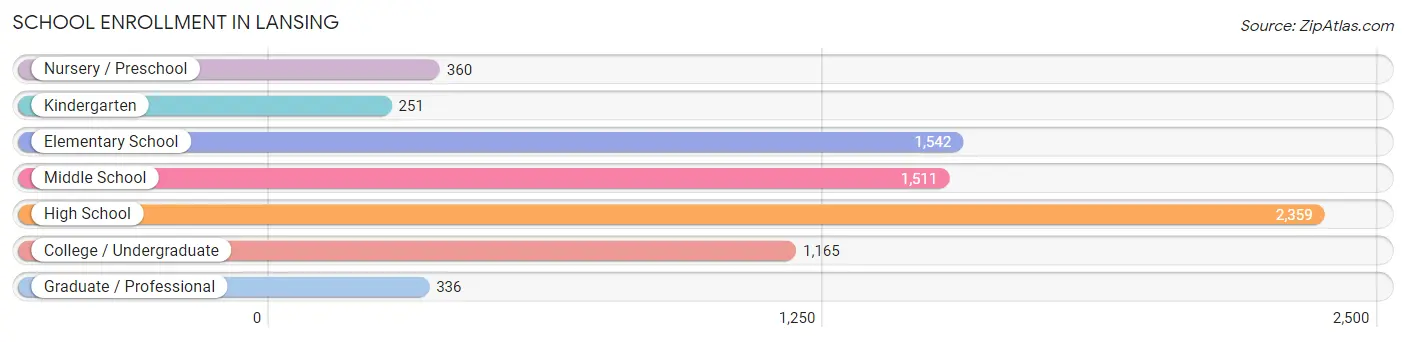
School Enrollment in Lansing
The most common levels of schooling among the 7,524 students in Lansing are high school (2,359 | 31.4%), elementary school (1,542 | 20.5%), and middle school (1,511 | 20.1%).
| School Level | # Students | % Students |
| Nursery / Preschool | 360 | 4.8% |
| Kindergarten | 251 | 3.3% |
| Elementary School | 1,542 | 20.5% |
| Middle School | 1,511 | 20.1% |
| High School | 2,359 | 31.4% |
| College / Undergraduate | 1,165 | 15.5% |
| Graduate / Professional | 336 | 4.5% |
| Total | 7,524 | 100.0% |
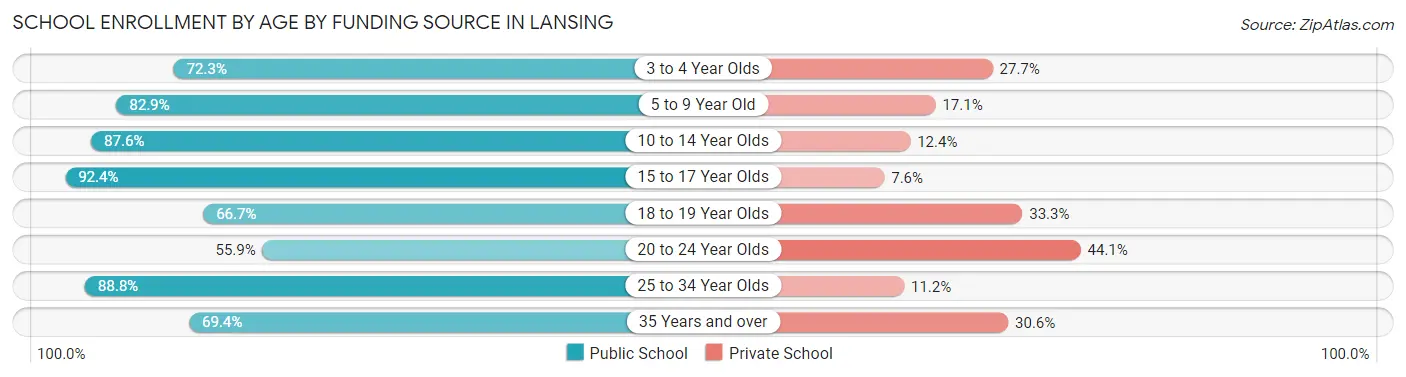
School Enrollment by Age by Funding Source in Lansing
Out of a total of 7,524 students who are enrolled in schools in Lansing, 1,287 (17.1%) attend a private institution, while the remaining 6,237 (82.9%) are enrolled in public schools. The age group of 20 to 24 year olds has the highest likelihood of being enrolled in private schools, with 158 (44.1% in the age bracket) enrolled. Conversely, the age group of 15 to 17 year olds has the lowest likelihood of being enrolled in a private school, with 1,478 (92.4% in the age bracket) attending a public institution.
| Age Bracket | Public School | Private School |
| 3 to 4 Year Olds | 237 (72.3%) | 91 (27.7%) |
| 5 to 9 Year Old | 1,435 (82.9%) | 296 (17.1%) |
| 10 to 14 Year Olds | 1,780 (87.6%) | 252 (12.4%) |
| 15 to 17 Year Olds | 1,478 (92.4%) | 121 (7.6%) |
| 18 to 19 Year Olds | 377 (66.7%) | 188 (33.3%) |
| 20 to 24 Year Olds | 200 (55.9%) | 158 (44.1%) |
| 25 to 34 Year Olds | 458 (88.8%) | 58 (11.2%) |
| 35 Years and over | 274 (69.4%) | 121 (30.6%) |
| Total | 6,237 (82.9%) | 1,287 (17.1%) |
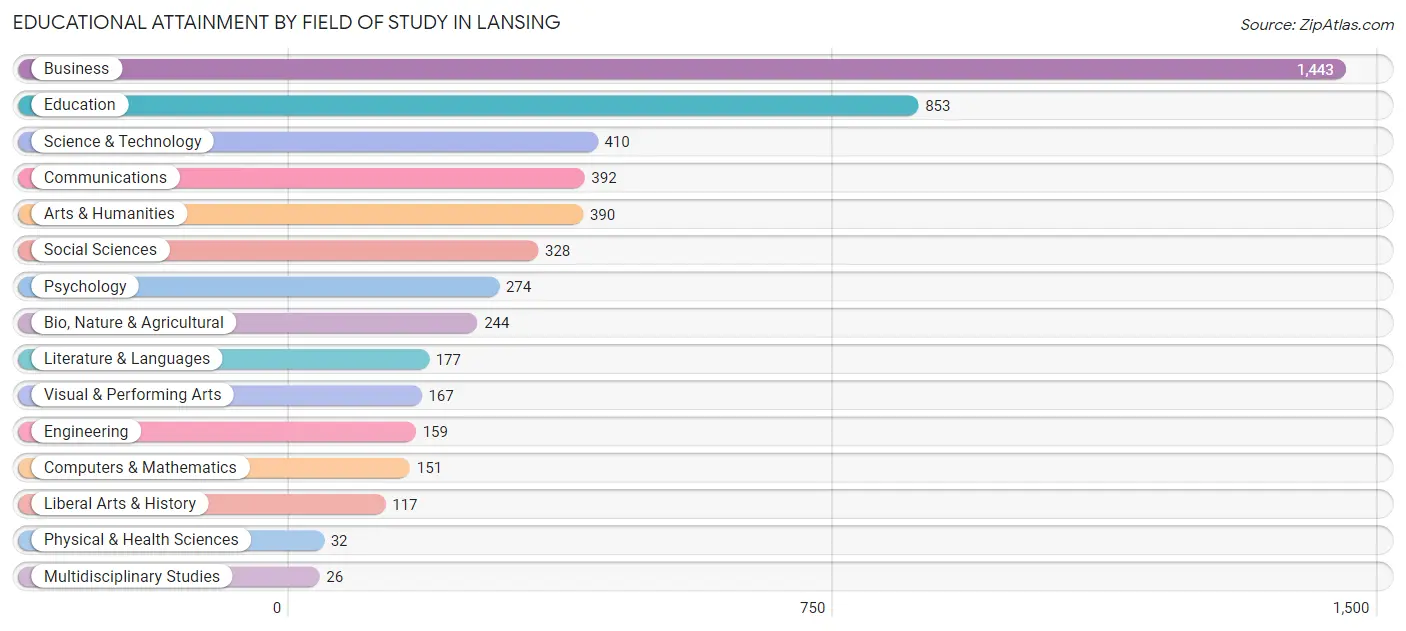
Educational Attainment by Field of Study in Lansing
Business (1,443 | 28.0%), education (853 | 16.5%), science & technology (410 | 7.9%), communications (392 | 7.6%), and arts & humanities (390 | 7.5%) are the most common fields of study among 5,163 individuals in Lansing who have obtained a bachelor's degree or higher.
| Field of Study | # Graduates | % Graduates |
| Computers & Mathematics | 151 | 2.9% |
| Bio, Nature & Agricultural | 244 | 4.7% |
| Physical & Health Sciences | 32 | 0.6% |
| Psychology | 274 | 5.3% |
| Social Sciences | 328 | 6.4% |
| Engineering | 159 | 3.1% |
| Multidisciplinary Studies | 26 | 0.5% |
| Science & Technology | 410 | 7.9% |
| Business | 1,443 | 28.0% |
| Education | 853 | 16.5% |
| Literature & Languages | 177 | 3.4% |
| Liberal Arts & History | 117 | 2.3% |
| Visual & Performing Arts | 167 | 3.2% |
| Communications | 392 | 7.6% |
| Arts & Humanities | 390 | 7.5% |
| Total | 5,163 | 100.0% |
Transportation & Commute in Lansing
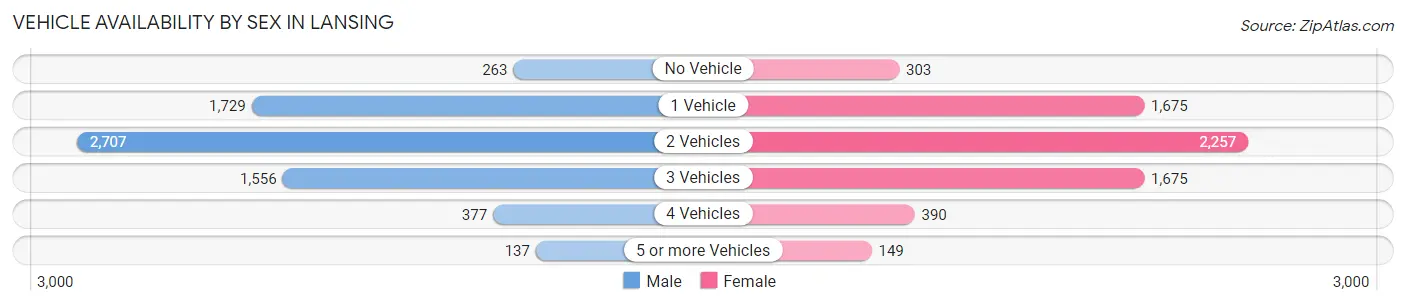
Vehicle Availability by Sex in Lansing
The most prevalent vehicle ownership categories in Lansing are males with 2 vehicles (2,707, accounting for 40.0%) and females with 2 vehicles (2,257, making up 42.0%).
| Vehicles Available | Male | Female |
| No Vehicle | 263 (3.9%) | 303 (4.7%) |
| 1 Vehicle | 1,729 (25.5%) | 1,675 (26.0%) |
| 2 Vehicles | 2,707 (40.0%) | 2,257 (35.0%) |
| 3 Vehicles | 1,556 (23.0%) | 1,675 (26.0%) |
| 4 Vehicles | 377 (5.6%) | 390 (6.0%) |
| 5 or more Vehicles | 137 (2.0%) | 149 (2.3%) |
| Total | 6,769 (100.0%) | 6,449 (100.0%) |
Commute Time in Lansing
The most frequently occuring commute durations in Lansing are 10 to 14 minutes (1,807 commuters, 14.9%), 45 to 59 minutes (1,745 commuters, 14.4%), and 30 to 34 minutes (1,593 commuters, 13.2%).
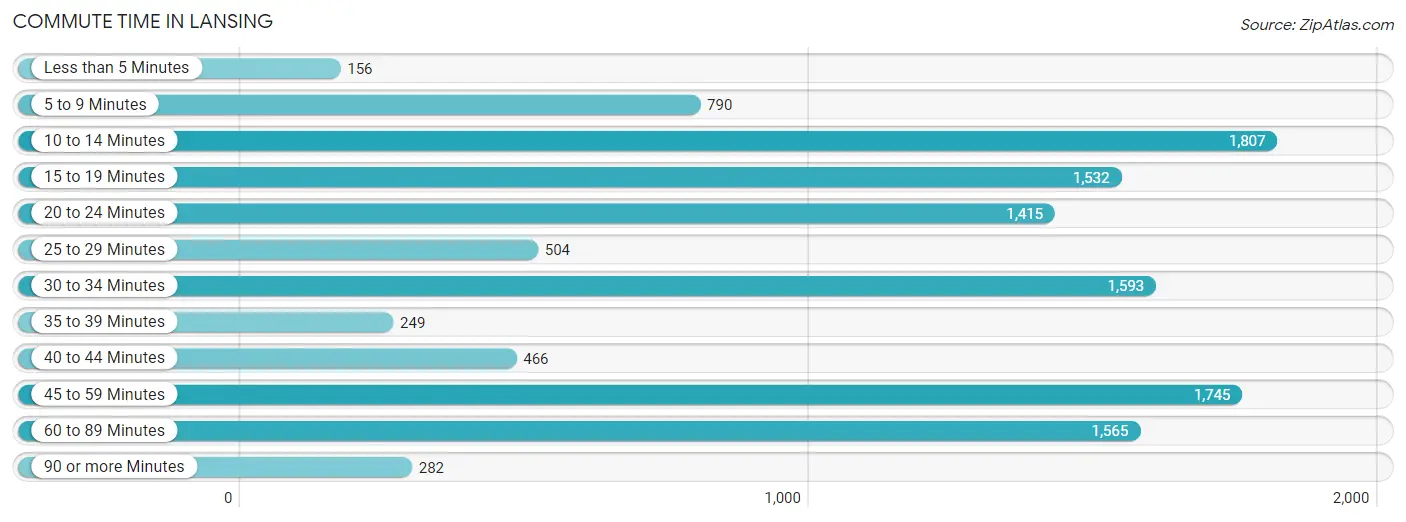
| Commute Time | # Commuters | % Commuters |
| Less than 5 Minutes | 156 | 1.3% |
| 5 to 9 Minutes | 790 | 6.5% |
| 10 to 14 Minutes | 1,807 | 14.9% |
| 15 to 19 Minutes | 1,532 | 12.7% |
| 20 to 24 Minutes | 1,415 | 11.7% |
| 25 to 29 Minutes | 504 | 4.2% |
| 30 to 34 Minutes | 1,593 | 13.2% |
| 35 to 39 Minutes | 249 | 2.1% |
| 40 to 44 Minutes | 466 | 3.8% |
| 45 to 59 Minutes | 1,745 | 14.4% |
| 60 to 89 Minutes | 1,565 | 12.9% |
| 90 or more Minutes | 282 | 2.3% |
Commute Time by Sex in Lansing
The most common commute times in Lansing are 30 to 34 minutes (983 commuters, 15.4%) for males and 10 to 14 minutes (982 commuters, 17.2%) for females.
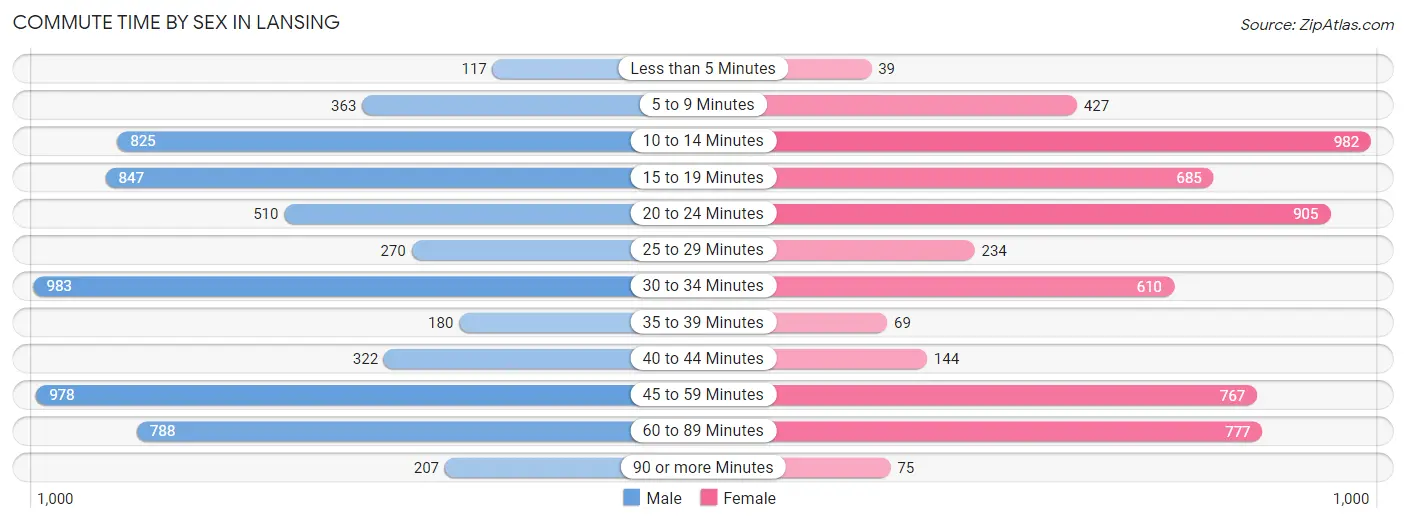
| Commute Time | Male | Female |
| Less than 5 Minutes | 117 (1.8%) | 39 (0.7%) |
| 5 to 9 Minutes | 363 (5.7%) | 427 (7.5%) |
| 10 to 14 Minutes | 825 (12.9%) | 982 (17.2%) |
| 15 to 19 Minutes | 847 (13.3%) | 685 (12.0%) |
| 20 to 24 Minutes | 510 (8.0%) | 905 (15.8%) |
| 25 to 29 Minutes | 270 (4.2%) | 234 (4.1%) |
| 30 to 34 Minutes | 983 (15.4%) | 610 (10.7%) |
| 35 to 39 Minutes | 180 (2.8%) | 69 (1.2%) |
| 40 to 44 Minutes | 322 (5.0%) | 144 (2.5%) |
| 45 to 59 Minutes | 978 (15.3%) | 767 (13.4%) |
| 60 to 89 Minutes | 788 (12.3%) | 777 (13.6%) |
| 90 or more Minutes | 207 (3.2%) | 75 (1.3%) |
Time of Departure to Work by Sex in Lansing
The most frequent times of departure to work in Lansing are 6:00 AM to 6:29 AM (829, 13.0%) for males and 8:00 AM to 8:29 AM (801, 14.0%) for females.
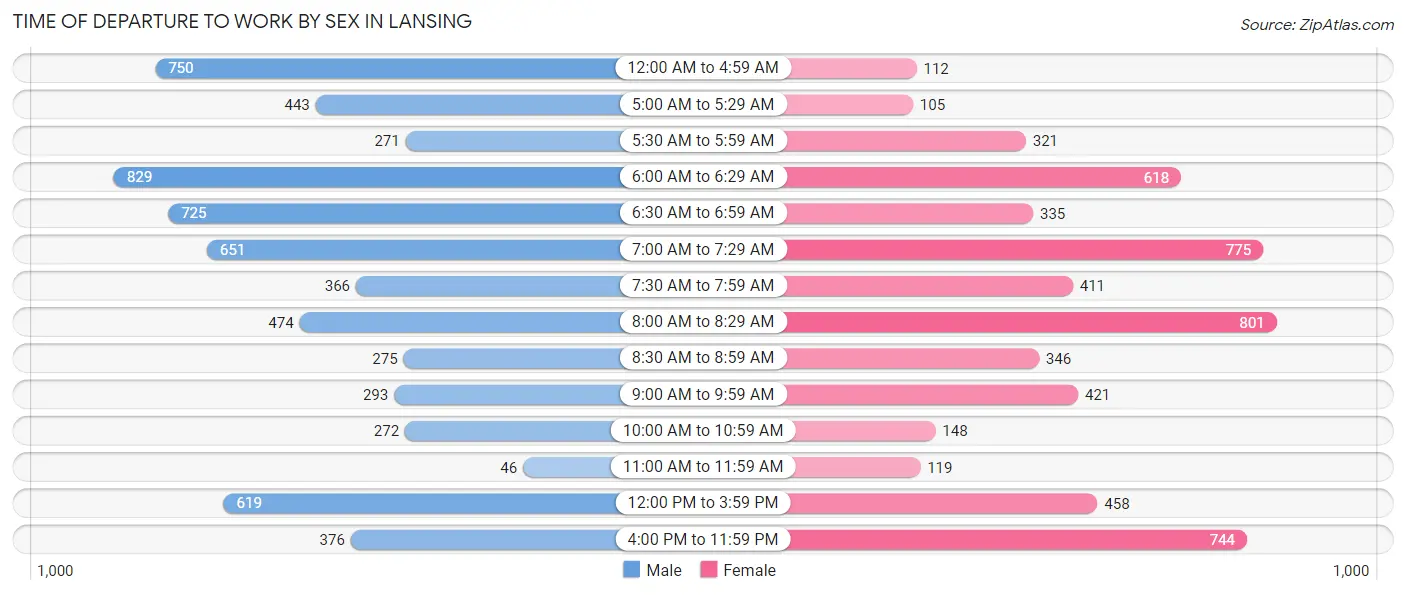
| Time of Departure | Male | Female |
| 12:00 AM to 4:59 AM | 750 (11.7%) | 112 (2.0%) |
| 5:00 AM to 5:29 AM | 443 (6.9%) | 105 (1.8%) |
| 5:30 AM to 5:59 AM | 271 (4.2%) | 321 (5.6%) |
| 6:00 AM to 6:29 AM | 829 (13.0%) | 618 (10.8%) |
| 6:30 AM to 6:59 AM | 725 (11.4%) | 335 (5.9%) |
| 7:00 AM to 7:29 AM | 651 (10.2%) | 775 (13.6%) |
| 7:30 AM to 7:59 AM | 366 (5.7%) | 411 (7.2%) |
| 8:00 AM to 8:29 AM | 474 (7.4%) | 801 (14.0%) |
| 8:30 AM to 8:59 AM | 275 (4.3%) | 346 (6.1%) |
| 9:00 AM to 9:59 AM | 293 (4.6%) | 421 (7.4%) |
| 10:00 AM to 10:59 AM | 272 (4.3%) | 148 (2.6%) |
| 11:00 AM to 11:59 AM | 46 (0.7%) | 119 (2.1%) |
| 12:00 PM to 3:59 PM | 619 (9.7%) | 458 (8.0%) |
| 4:00 PM to 11:59 PM | 376 (5.9%) | 744 (13.0%) |
| Total | 6,390 (100.0%) | 5,714 (100.0%) |
Housing Occupancy in Lansing
Occupancy by Ownership in Lansing
Of the total 11,179 dwellings in Lansing, owner-occupied units account for 7,977 (71.4%), while renter-occupied units make up 3,202 (28.6%).
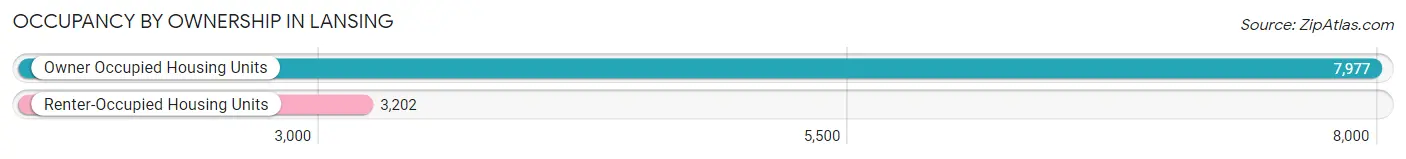
| Occupancy | # Housing Units | % Housing Units |
| Owner Occupied Housing Units | 7,977 | 71.4% |
| Renter-Occupied Housing Units | 3,202 | 28.6% |
| Total Occupied Housing Units | 11,179 | 100.0% |
Occupancy by Household Size in Lansing
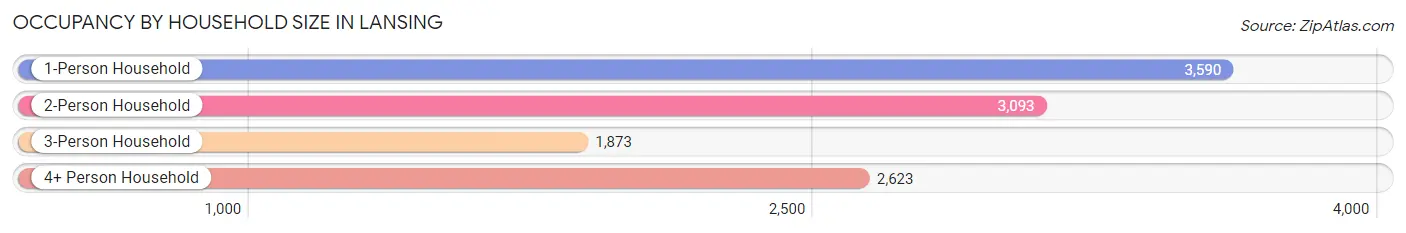
| Household Size | # Housing Units | % Housing Units |
| 1-Person Household | 3,590 | 32.1% |
| 2-Person Household | 3,093 | 27.7% |
| 3-Person Household | 1,873 | 16.8% |
| 4+ Person Household | 2,623 | 23.5% |
| Total Housing Units | 11,179 | 100.0% |
Occupancy by Ownership by Household Size in Lansing
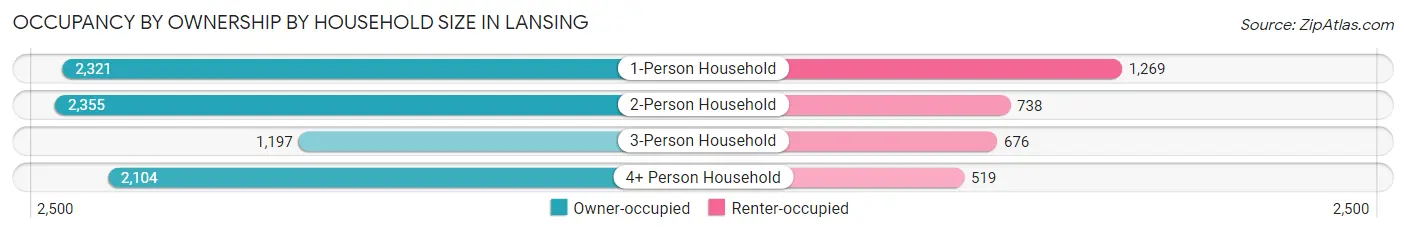
| Household Size | Owner-occupied | Renter-occupied |
| 1-Person Household | 2,321 (64.6%) | 1,269 (35.3%) |
| 2-Person Household | 2,355 (76.1%) | 738 (23.9%) |
| 3-Person Household | 1,197 (63.9%) | 676 (36.1%) |
| 4+ Person Household | 2,104 (80.2%) | 519 (19.8%) |
| Total Housing Units | 7,977 (71.4%) | 3,202 (28.6%) |
Occupancy by Educational Attainment in Lansing
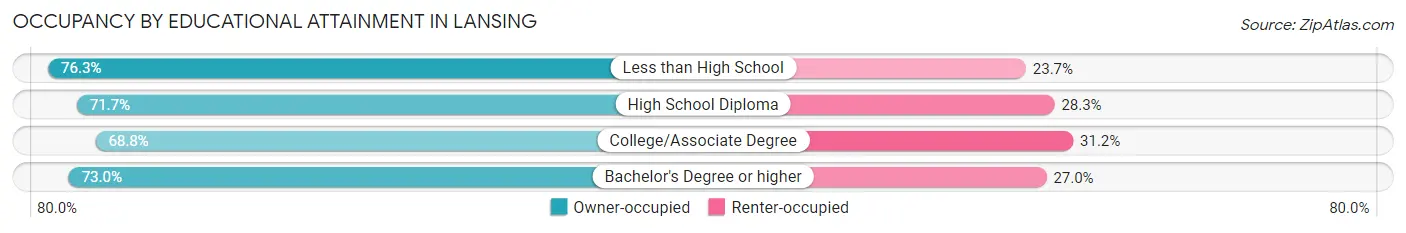
| Household Size | Owner-occupied | Renter-occupied |
| Less than High School | 652 (76.3%) | 203 (23.7%) |
| High School Diploma | 2,153 (71.7%) | 849 (28.3%) |
| College/Associate Degree | 2,797 (68.8%) | 1,271 (31.2%) |
| Bachelor's Degree or higher | 2,375 (73.0%) | 879 (27.0%) |
Occupancy by Age of Householder in Lansing
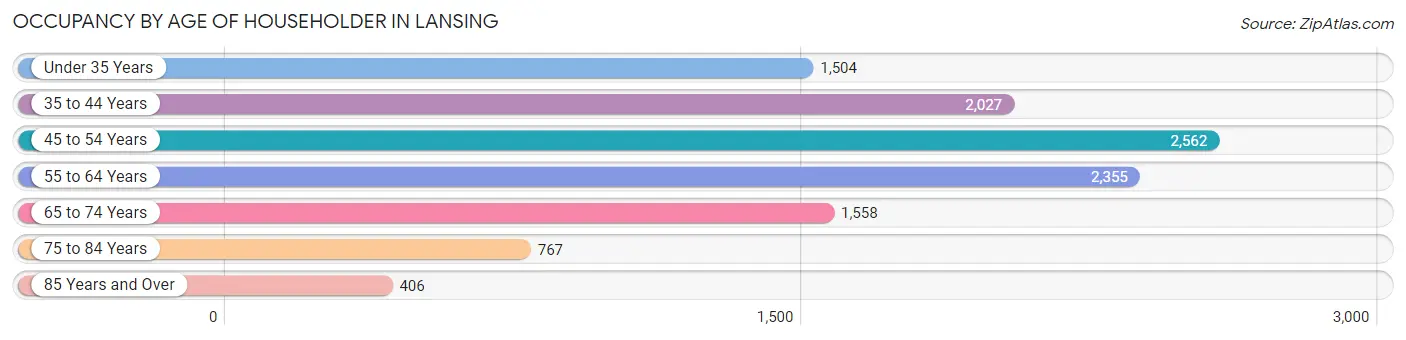
| Age Bracket | # Households | % Households |
| Under 35 Years | 1,504 | 13.5% |
| 35 to 44 Years | 2,027 | 18.1% |
| 45 to 54 Years | 2,562 | 22.9% |
| 55 to 64 Years | 2,355 | 21.1% |
| 65 to 74 Years | 1,558 | 13.9% |
| 75 to 84 Years | 767 | 6.9% |
| 85 Years and Over | 406 | 3.6% |
| Total | 11,179 | 100.0% |
Housing Finances in Lansing
Median Income by Occupancy in Lansing
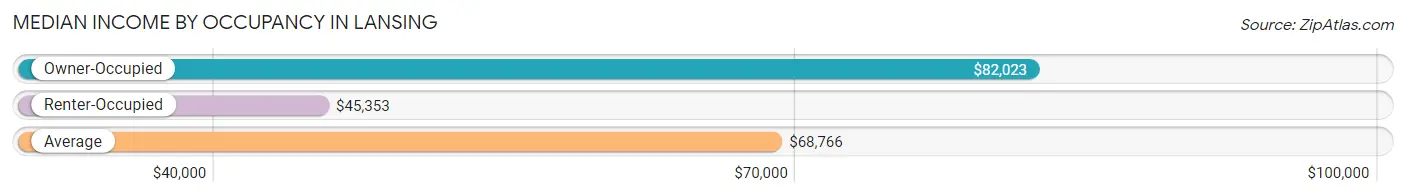
| Occupancy Type | # Households | Median Income |
| Owner-Occupied | 7,977 (71.4%) | $82,023 |
| Renter-Occupied | 3,202 (28.6%) | $45,353 |
| Average | 11,179 (100.0%) | $68,766 |
Occupancy by Householder Income Bracket in Lansing
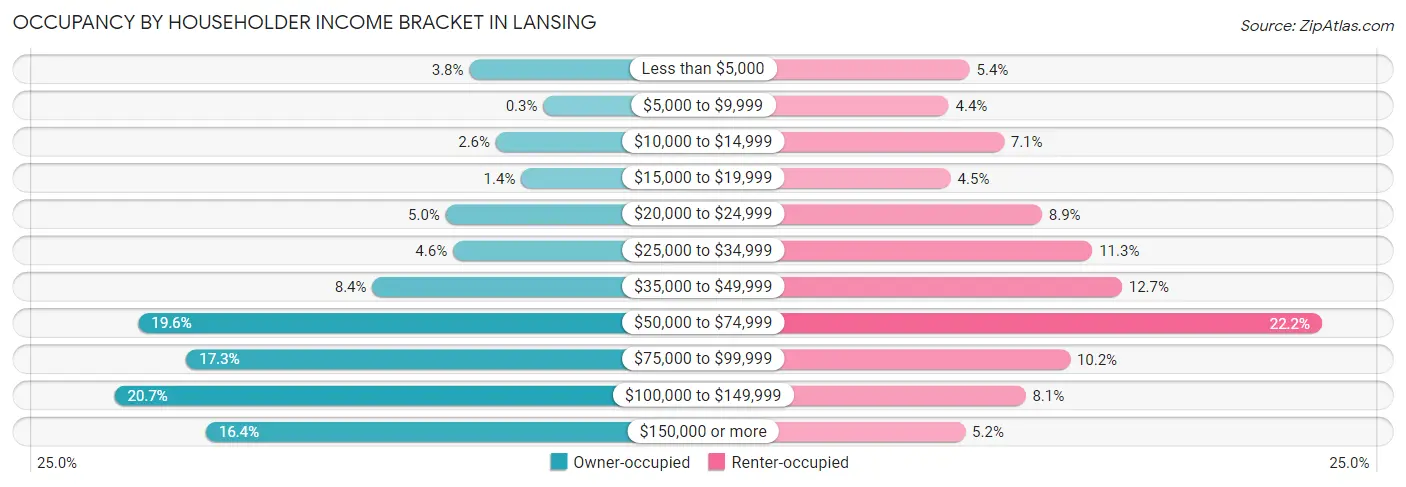
| Income Bracket | Owner-occupied | Renter-occupied |
| Less than $5,000 | 305 (3.8%) | 174 (5.4%) |
| $5,000 to $9,999 | 24 (0.3%) | 142 (4.4%) |
| $10,000 to $14,999 | 204 (2.6%) | 226 (7.1%) |
| $15,000 to $19,999 | 108 (1.3%) | 145 (4.5%) |
| $20,000 to $24,999 | 395 (5.0%) | 284 (8.9%) |
| $25,000 to $34,999 | 367 (4.6%) | 361 (11.3%) |
| $35,000 to $49,999 | 673 (8.4%) | 406 (12.7%) |
| $50,000 to $74,999 | 1,562 (19.6%) | 711 (22.2%) |
| $75,000 to $99,999 | 1,380 (17.3%) | 327 (10.2%) |
| $100,000 to $149,999 | 1,653 (20.7%) | 259 (8.1%) |
| $150,000 or more | 1,306 (16.4%) | 167 (5.2%) |
| Total | 7,977 (100.0%) | 3,202 (100.0%) |
Monthly Housing Cost Tiers in Lansing
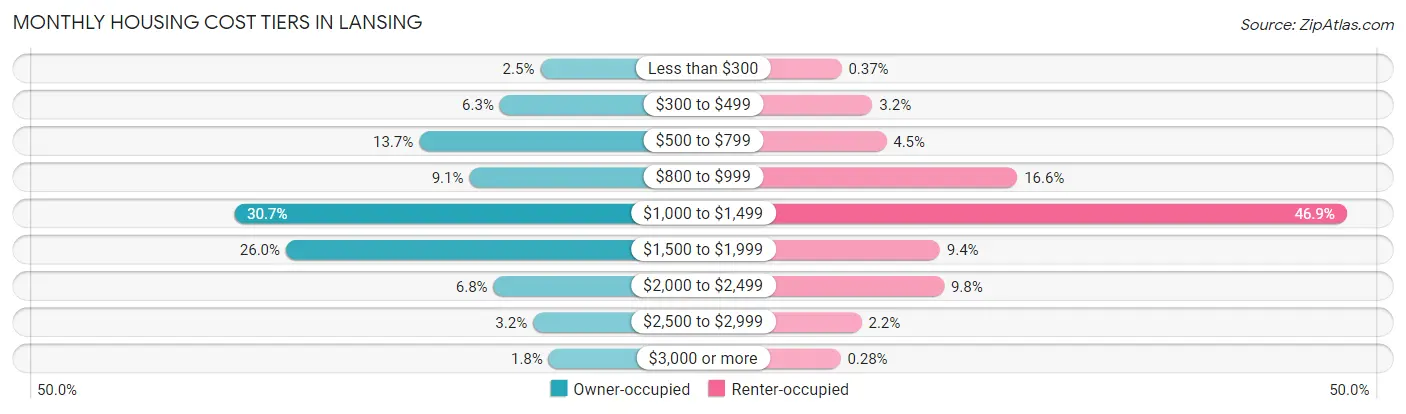
| Monthly Cost | Owner-occupied | Renter-occupied |
| Less than $300 | 202 (2.5%) | 12 (0.4%) |
| $300 to $499 | 499 (6.3%) | 103 (3.2%) |
| $500 to $799 | 1,092 (13.7%) | 144 (4.5%) |
| $800 to $999 | 723 (9.1%) | 530 (16.6%) |
| $1,000 to $1,499 | 2,450 (30.7%) | 1,501 (46.9%) |
| $1,500 to $1,999 | 2,070 (26.0%) | 302 (9.4%) |
| $2,000 to $2,499 | 546 (6.8%) | 314 (9.8%) |
| $2,500 to $2,999 | 255 (3.2%) | 71 (2.2%) |
| $3,000 or more | 140 (1.8%) | 9 (0.3%) |
| Total | 7,977 (100.0%) | 3,202 (100.0%) |
Physical Housing Characteristics in Lansing
Housing Structures in Lansing
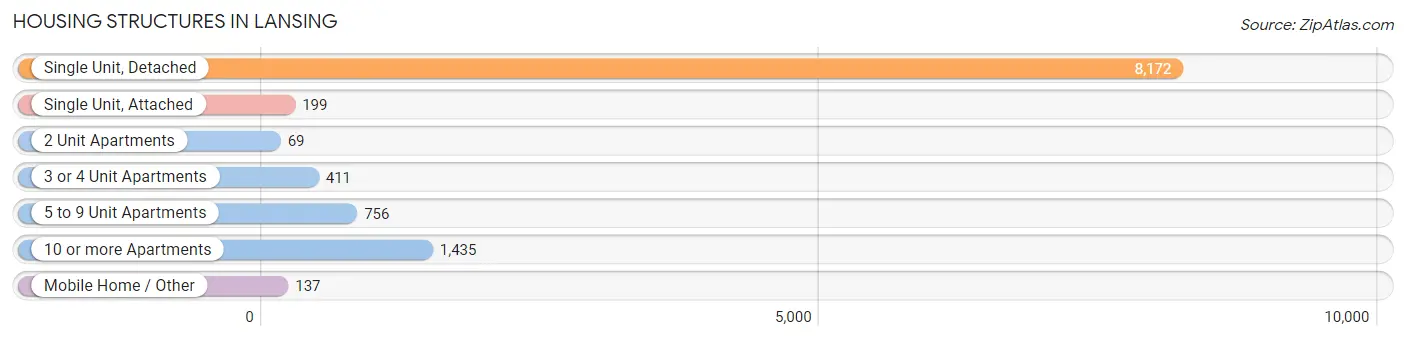
| Structure Type | # Housing Units | % Housing Units |
| Single Unit, Detached | 8,172 | 73.1% |
| Single Unit, Attached | 199 | 1.8% |
| 2 Unit Apartments | 69 | 0.6% |
| 3 or 4 Unit Apartments | 411 | 3.7% |
| 5 to 9 Unit Apartments | 756 | 6.8% |
| 10 or more Apartments | 1,435 | 12.8% |
| Mobile Home / Other | 137 | 1.2% |
| Total | 11,179 | 100.0% |
Housing Structures by Occupancy in Lansing
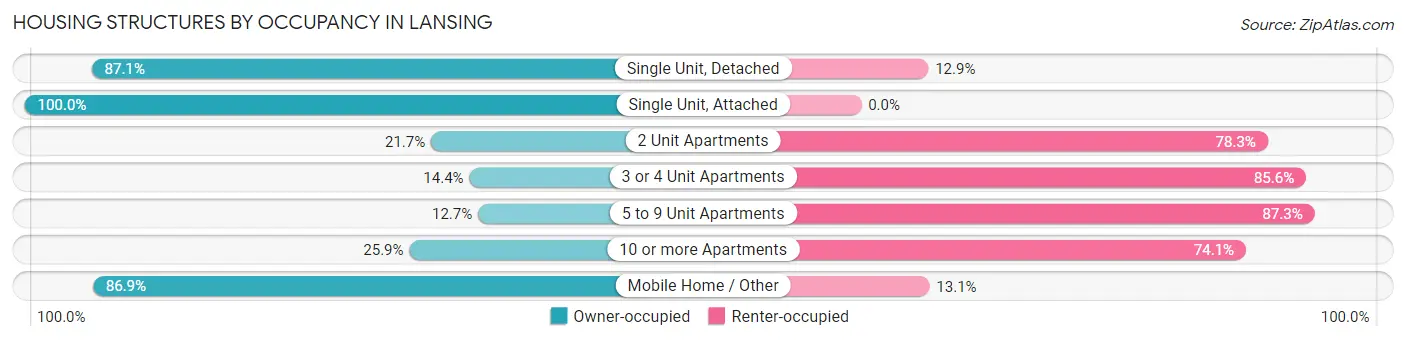
| Structure Type | Owner-occupied | Renter-occupied |
| Single Unit, Detached | 7,117 (87.1%) | 1,055 (12.9%) |
| Single Unit, Attached | 199 (100.0%) | 0 (0.0%) |
| 2 Unit Apartments | 15 (21.7%) | 54 (78.3%) |
| 3 or 4 Unit Apartments | 59 (14.4%) | 352 (85.6%) |
| 5 to 9 Unit Apartments | 96 (12.7%) | 660 (87.3%) |
| 10 or more Apartments | 372 (25.9%) | 1,063 (74.1%) |
| Mobile Home / Other | 119 (86.9%) | 18 (13.1%) |
| Total | 7,977 (71.4%) | 3,202 (28.6%) |
Housing Structures by Number of Rooms in Lansing
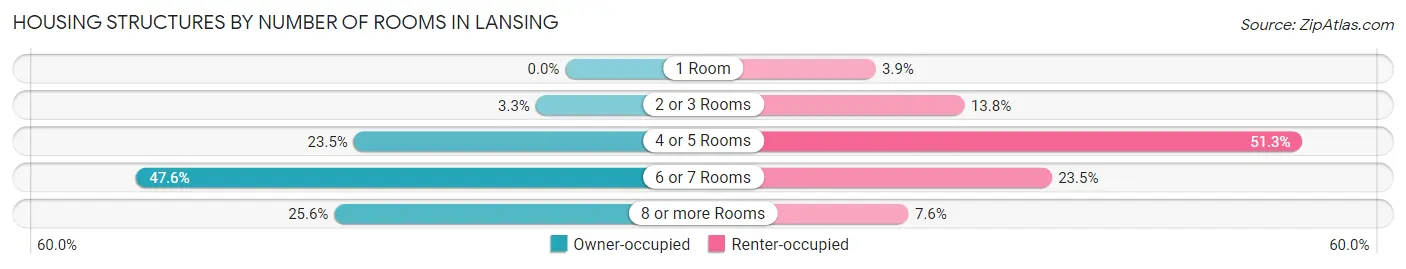
| Number of Rooms | Owner-occupied | Renter-occupied |
| 1 Room | 0 (0.0%) | 125 (3.9%) |
| 2 or 3 Rooms | 262 (3.3%) | 441 (13.8%) |
| 4 or 5 Rooms | 1,873 (23.5%) | 1,643 (51.3%) |
| 6 or 7 Rooms | 3,797 (47.6%) | 751 (23.4%) |
| 8 or more Rooms | 2,045 (25.6%) | 242 (7.6%) |
| Total | 7,977 (100.0%) | 3,202 (100.0%) |
Housing Structure by Heating Type in Lansing
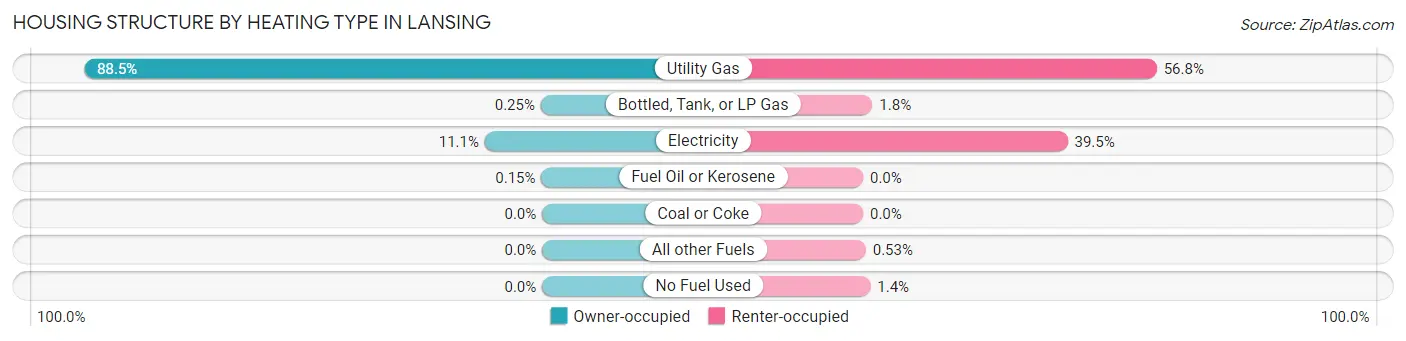
| Heating Type | Owner-occupied | Renter-occupied |
| Utility Gas | 7,062 (88.5%) | 1,817 (56.8%) |
| Bottled, Tank, or LP Gas | 20 (0.3%) | 58 (1.8%) |
| Electricity | 883 (11.1%) | 1,265 (39.5%) |
| Fuel Oil or Kerosene | 12 (0.2%) | 0 (0.0%) |
| Coal or Coke | 0 (0.0%) | 0 (0.0%) |
| All other Fuels | 0 (0.0%) | 17 (0.5%) |
| No Fuel Used | 0 (0.0%) | 45 (1.4%) |
| Total | 7,977 (100.0%) | 3,202 (100.0%) |
Household Vehicle Usage in Lansing
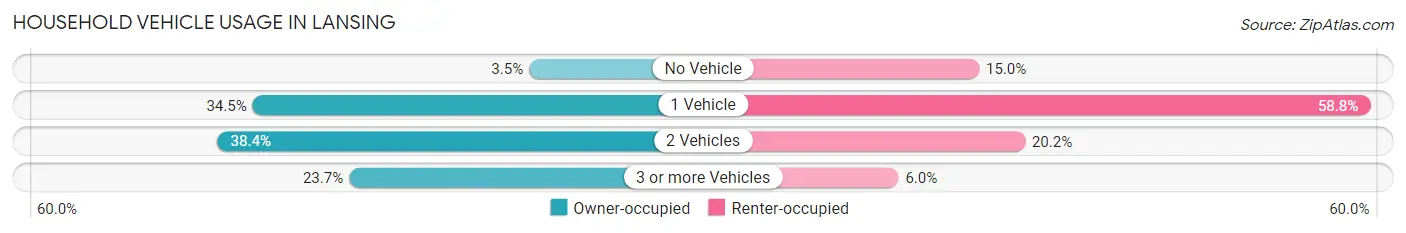
| Vehicles per Household | Owner-occupied | Renter-occupied |
| No Vehicle | 279 (3.5%) | 481 (15.0%) |
| 1 Vehicle | 2,750 (34.5%) | 1,883 (58.8%) |
| 2 Vehicles | 3,061 (38.4%) | 646 (20.2%) |
| 3 or more Vehicles | 1,887 (23.7%) | 192 (6.0%) |
| Total | 7,977 (100.0%) | 3,202 (100.0%) |
Real Estate & Mortgages in Lansing
Real Estate and Mortgage Overview in Lansing
| Characteristic | Without Mortgage | With Mortgage |
| Housing Units | 2,468 | 5,509 |
| Median Property Value | $157,500 | $158,500 |
| Median Household Income | $80,985 | $966 |
| Monthly Housing Costs | $742 | $125 |
| Real Estate Taxes | $4,675 | $362 |
Property Value by Mortgage Status in Lansing
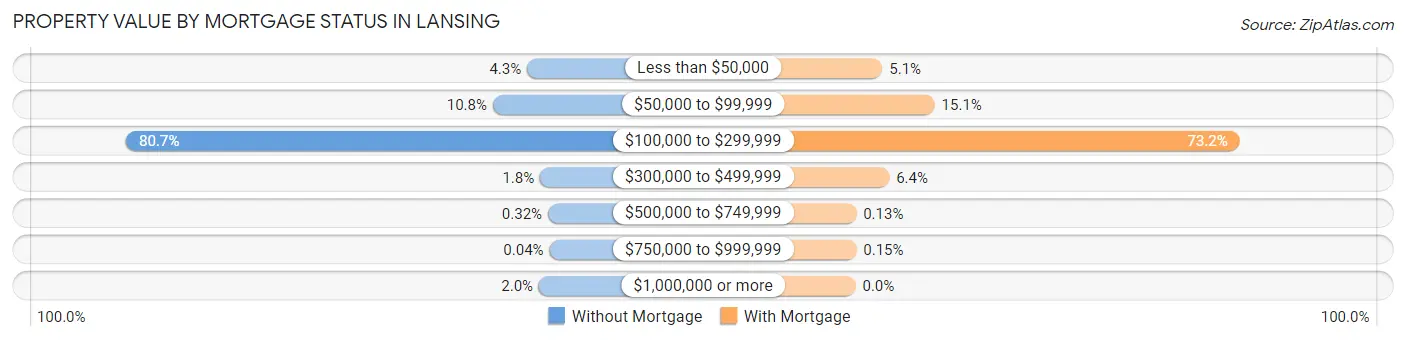
| Property Value | Without Mortgage | With Mortgage |
| Less than $50,000 | 106 (4.3%) | 281 (5.1%) |
| $50,000 to $99,999 | 267 (10.8%) | 830 (15.1%) |
| $100,000 to $299,999 | 1,991 (80.7%) | 4,030 (73.2%) |
| $300,000 to $499,999 | 45 (1.8%) | 353 (6.4%) |
| $500,000 to $749,999 | 8 (0.3%) | 7 (0.1%) |
| $750,000 to $999,999 | 1 (0.0%) | 8 (0.2%) |
| $1,000,000 or more | 50 (2.0%) | 0 (0.0%) |
| Total | 2,468 (100.0%) | 5,509 (100.0%) |
Household Income by Mortgage Status in Lansing
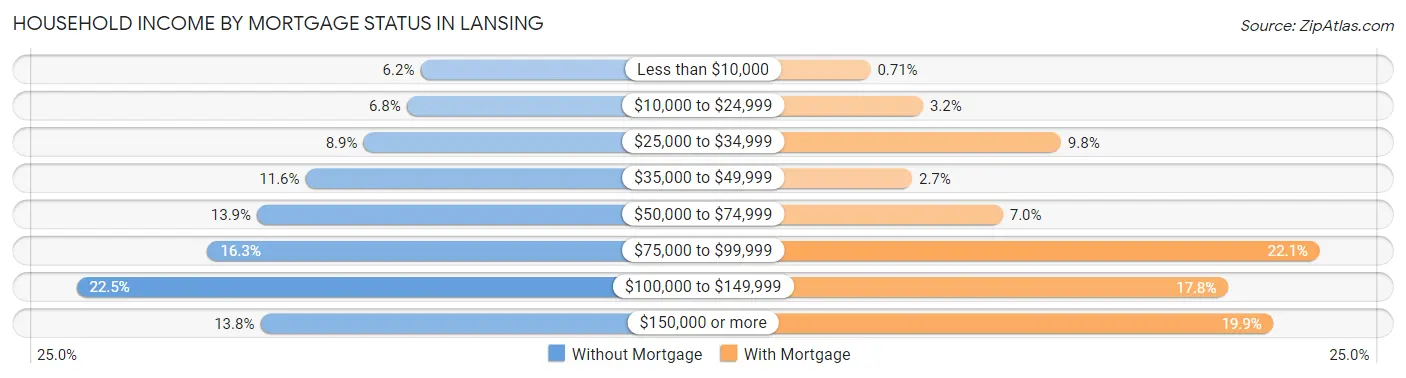
| Household Income | Without Mortgage | With Mortgage |
| Less than $10,000 | 152 (6.2%) | 39 (0.7%) |
| $10,000 to $24,999 | 168 (6.8%) | 177 (3.2%) |
| $25,000 to $34,999 | 219 (8.9%) | 539 (9.8%) |
| $35,000 to $49,999 | 287 (11.6%) | 148 (2.7%) |
| $50,000 to $74,999 | 344 (13.9%) | 386 (7.0%) |
| $75,000 to $99,999 | 402 (16.3%) | 1,218 (22.1%) |
| $100,000 to $149,999 | 556 (22.5%) | 978 (17.7%) |
| $150,000 or more | 340 (13.8%) | 1,097 (19.9%) |
| Total | 2,468 (100.0%) | 5,509 (100.0%) |
Property Value to Household Income Ratio in Lansing
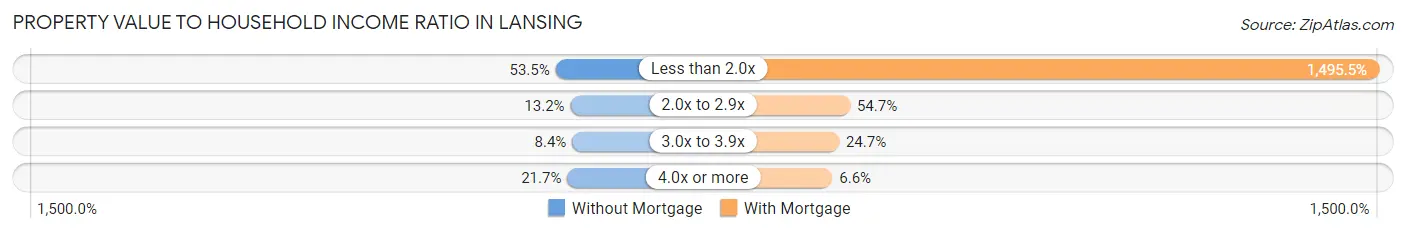
| Value-to-Income Ratio | Without Mortgage | With Mortgage |
| Less than 2.0x | 1,321 (53.5%) | 82,387 (1,495.5%) |
| 2.0x to 2.9x | 325 (13.2%) | 3,013 (54.7%) |
| 3.0x to 3.9x | 207 (8.4%) | 1,362 (24.7%) |
| 4.0x or more | 536 (21.7%) | 363 (6.6%) |
| Total | 2,468 (100.0%) | 5,509 (100.0%) |
Real Estate Taxes by Mortgage Status in Lansing
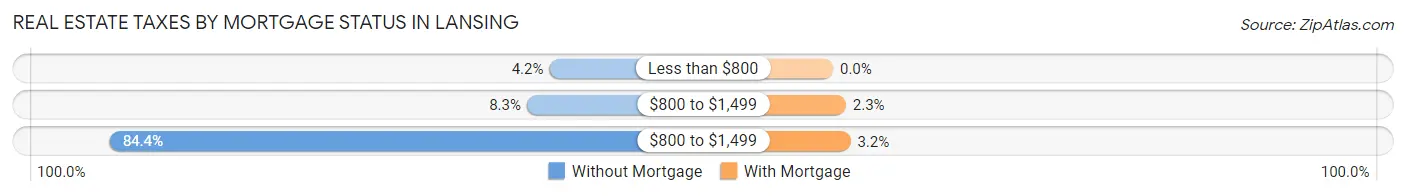
| Property Taxes | Without Mortgage | With Mortgage |
| Less than $800 | 103 (4.2%) | 0 (0.0%) |
| $800 to $1,499 | 204 (8.3%) | 129 (2.3%) |
| $800 to $1,499 | 2,084 (84.4%) | 175 (3.2%) |
| Total | 2,468 (100.0%) | 5,509 (100.0%) |
Health & Disability in Lansing
Health Insurance Coverage by Age in Lansing
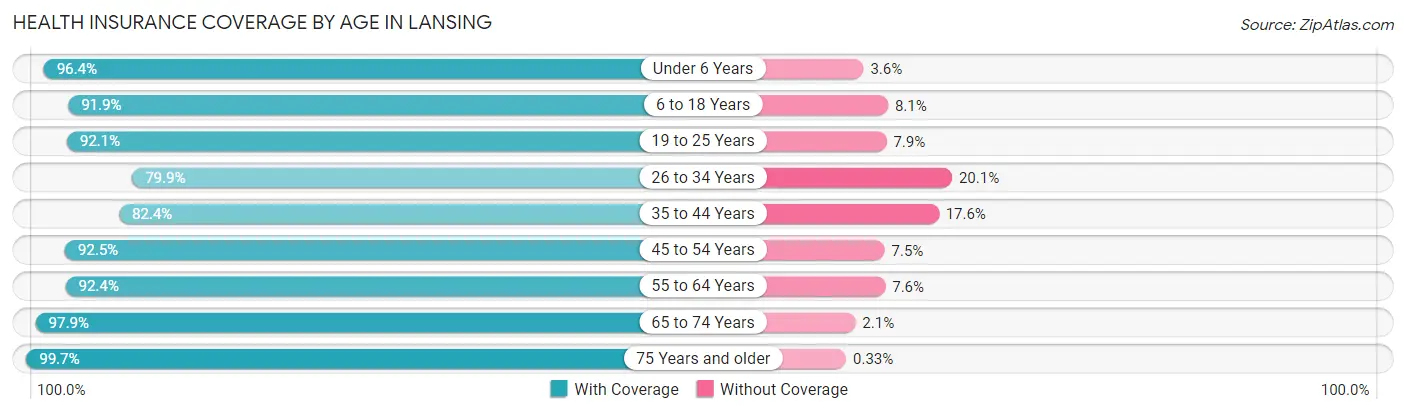
| Age Bracket | With Coverage | Without Coverage |
| Under 6 Years | 1,456 (96.4%) | 54 (3.6%) |
| 6 to 18 Years | 5,181 (91.9%) | 459 (8.1%) |
| 19 to 25 Years | 2,141 (92.1%) | 183 (7.9%) |
| 26 to 34 Years | 2,543 (79.9%) | 639 (20.1%) |
| 35 to 44 Years | 2,757 (82.4%) | 589 (17.6%) |
| 45 to 54 Years | 4,166 (92.5%) | 339 (7.5%) |
| 55 to 64 Years | 3,531 (92.4%) | 292 (7.6%) |
| 65 to 74 Years | 2,408 (97.9%) | 51 (2.1%) |
| 75 Years and older | 1,816 (99.7%) | 6 (0.3%) |
| Total | 25,999 (90.9%) | 2,612 (9.1%) |
Health Insurance Coverage by Citizenship Status in Lansing
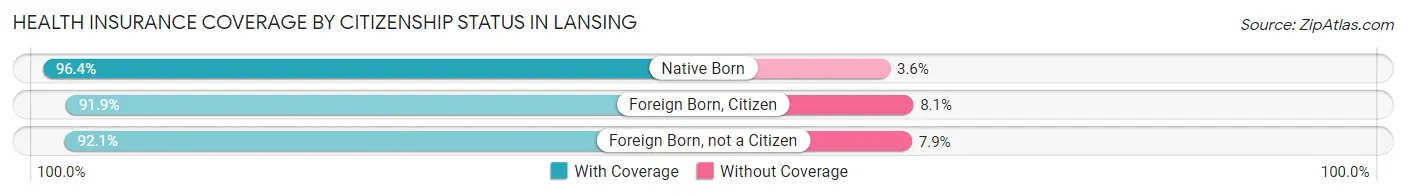
| Citizenship Status | With Coverage | Without Coverage |
| Native Born | 1,456 (96.4%) | 54 (3.6%) |
| Foreign Born, Citizen | 5,181 (91.9%) | 459 (8.1%) |
| Foreign Born, not a Citizen | 2,141 (92.1%) | 183 (7.9%) |
Health Insurance Coverage by Household Income in Lansing
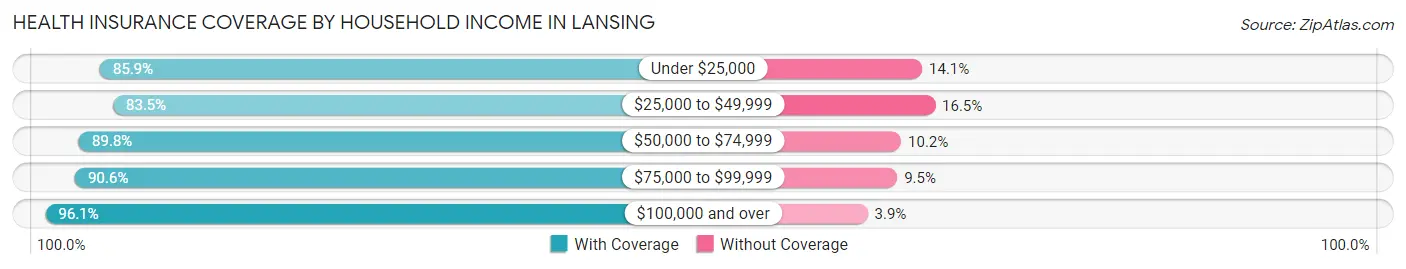
| Household Income | With Coverage | Without Coverage |
| Under $25,000 | 3,853 (85.9%) | 633 (14.1%) |
| $25,000 to $49,999 | 3,361 (83.5%) | 666 (16.5%) |
| $50,000 to $74,999 | 3,873 (89.8%) | 439 (10.2%) |
| $75,000 to $99,999 | 4,235 (90.5%) | 442 (9.5%) |
| $100,000 and over | 10,645 (96.1%) | 432 (3.9%) |
Public vs Private Health Insurance Coverage by Age in Lansing
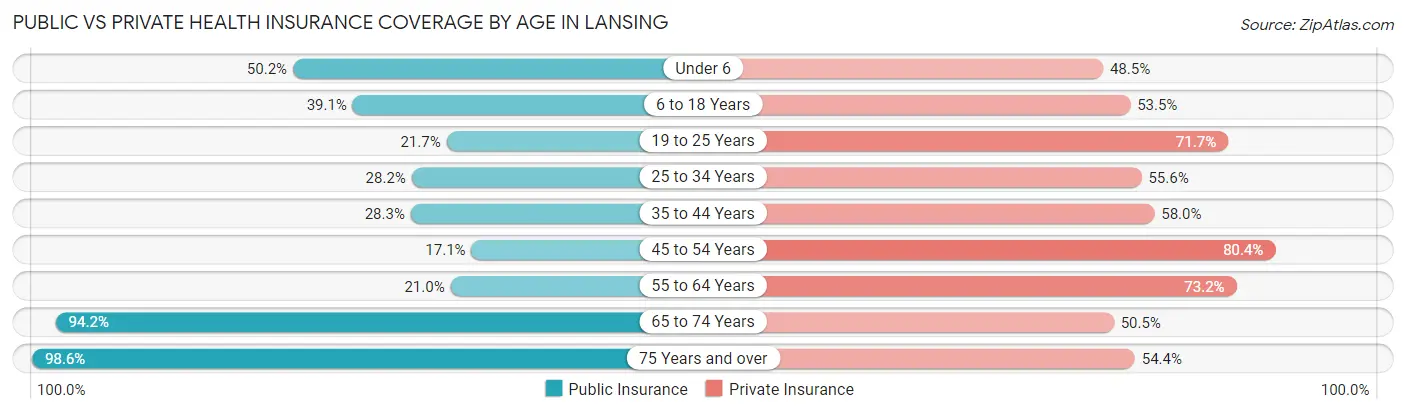
| Age Bracket | Public Insurance | Private Insurance |
| Under 6 | 758 (50.2%) | 732 (48.5%) |
| 6 to 18 Years | 2,205 (39.1%) | 3,019 (53.5%) |
| 19 to 25 Years | 504 (21.7%) | 1,666 (71.7%) |
| 25 to 34 Years | 896 (28.2%) | 1,770 (55.6%) |
| 35 to 44 Years | 948 (28.3%) | 1,941 (58.0%) |
| 45 to 54 Years | 769 (17.1%) | 3,624 (80.4%) |
| 55 to 64 Years | 801 (20.9%) | 2,800 (73.2%) |
| 65 to 74 Years | 2,317 (94.2%) | 1,241 (50.5%) |
| 75 Years and over | 1,797 (98.6%) | 991 (54.4%) |
| Total | 10,995 (38.4%) | 17,784 (62.2%) |
Disability Status by Sex by Age in Lansing
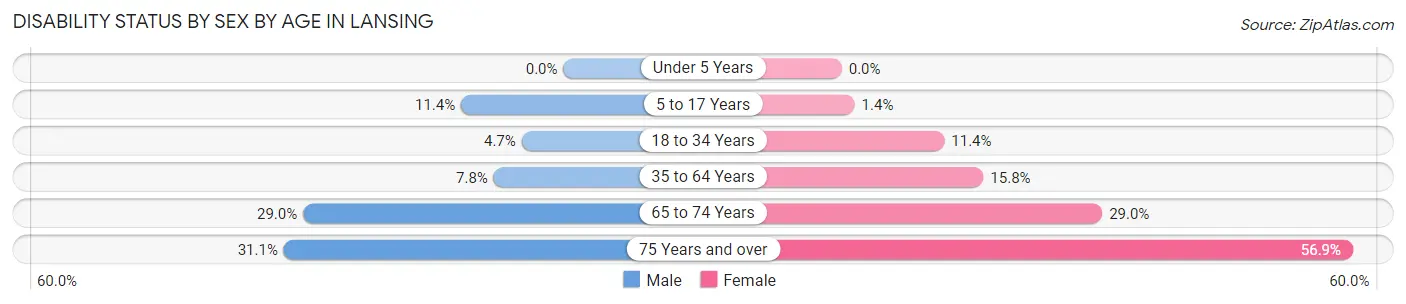
| Age Bracket | Male | Female |
| Under 5 Years | 0 (0.0%) | 0 (0.0%) |
| 5 to 17 Years | 318 (11.4%) | 39 (1.4%) |
| 18 to 34 Years | 132 (4.6%) | 349 (11.4%) |
| 35 to 64 Years | 446 (7.8%) | 935 (15.8%) |
| 65 to 74 Years | 296 (29.0%) | 417 (29.0%) |
| 75 Years and over | 227 (31.1%) | 622 (56.9%) |
Disability Class by Sex by Age in Lansing
Disability Class: Hearing Difficulty
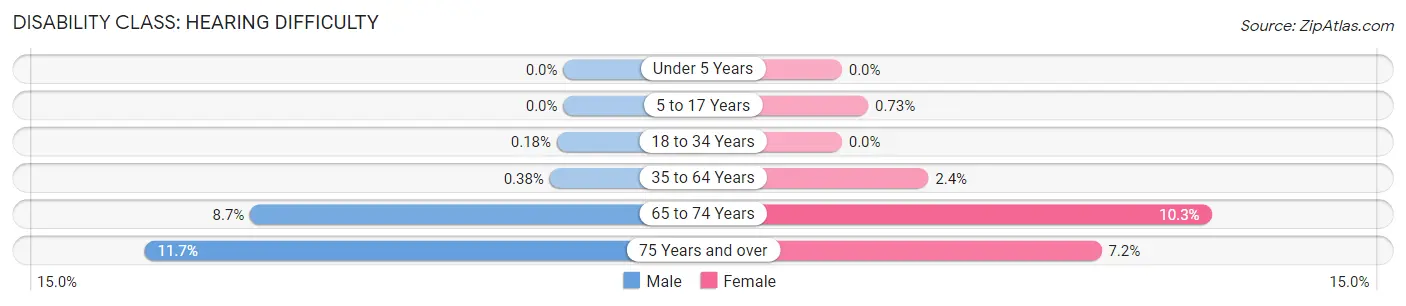
| Age Bracket | Male | Female |
| Under 5 Years | 0 (0.0%) | 0 (0.0%) |
| 5 to 17 Years | 0 (0.0%) | 20 (0.7%) |
| 18 to 34 Years | 5 (0.2%) | 0 (0.0%) |
| 35 to 64 Years | 22 (0.4%) | 143 (2.4%) |
| 65 to 74 Years | 89 (8.7%) | 148 (10.3%) |
| 75 Years and over | 85 (11.7%) | 79 (7.2%) |
Disability Class: Vision Difficulty
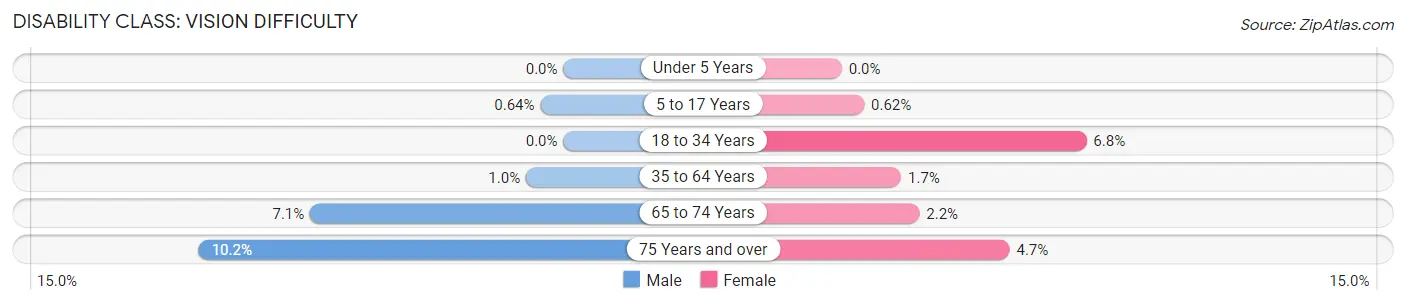
| Age Bracket | Male | Female |
| Under 5 Years | 0 (0.0%) | 0 (0.0%) |
| 5 to 17 Years | 18 (0.6%) | 17 (0.6%) |
| 18 to 34 Years | 0 (0.0%) | 208 (6.8%) |
| 35 to 64 Years | 60 (1.0%) | 98 (1.7%) |
| 65 to 74 Years | 72 (7.0%) | 31 (2.2%) |
| 75 Years and over | 74 (10.2%) | 51 (4.7%) |
Disability Class: Cognitive Difficulty
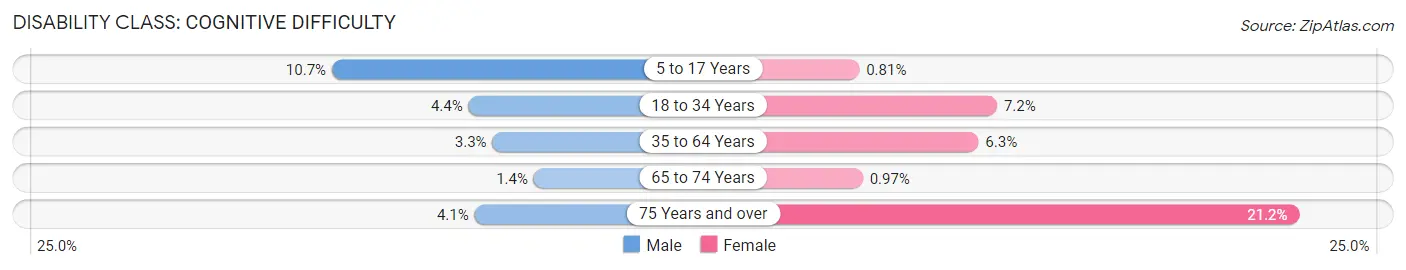
| Age Bracket | Male | Female |
| 5 to 17 Years | 300 (10.7%) | 22 (0.8%) |
| 18 to 34 Years | 125 (4.4%) | 220 (7.2%) |
| 35 to 64 Years | 189 (3.3%) | 376 (6.3%) |
| 65 to 74 Years | 14 (1.4%) | 14 (1.0%) |
| 75 Years and over | 30 (4.1%) | 232 (21.2%) |
Disability Class: Ambulatory Difficulty
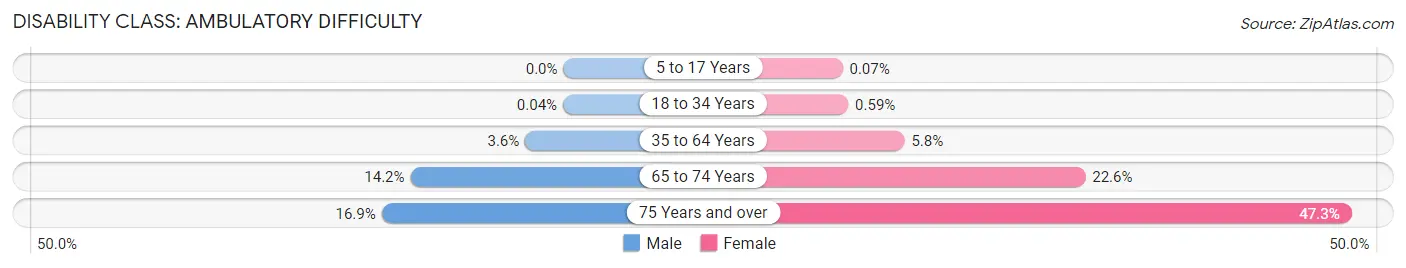
| Age Bracket | Male | Female |
| 5 to 17 Years | 0 (0.0%) | 2 (0.1%) |
| 18 to 34 Years | 1 (0.0%) | 18 (0.6%) |
| 35 to 64 Years | 204 (3.5%) | 345 (5.8%) |
| 65 to 74 Years | 145 (14.2%) | 325 (22.6%) |
| 75 Years and over | 123 (16.9%) | 517 (47.3%) |
Disability Class: Self-Care Difficulty
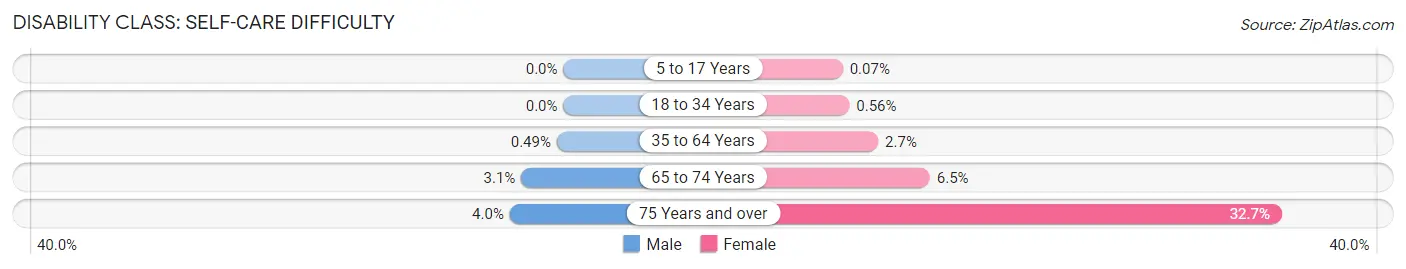
| Age Bracket | Male | Female |
| 5 to 17 Years | 0 (0.0%) | 2 (0.1%) |
| 18 to 34 Years | 0 (0.0%) | 17 (0.6%) |
| 35 to 64 Years | 28 (0.5%) | 160 (2.7%) |
| 65 to 74 Years | 32 (3.1%) | 94 (6.5%) |
| 75 Years and over | 29 (4.0%) | 357 (32.7%) |
Technology Access in Lansing
Computing Device Access in Lansing
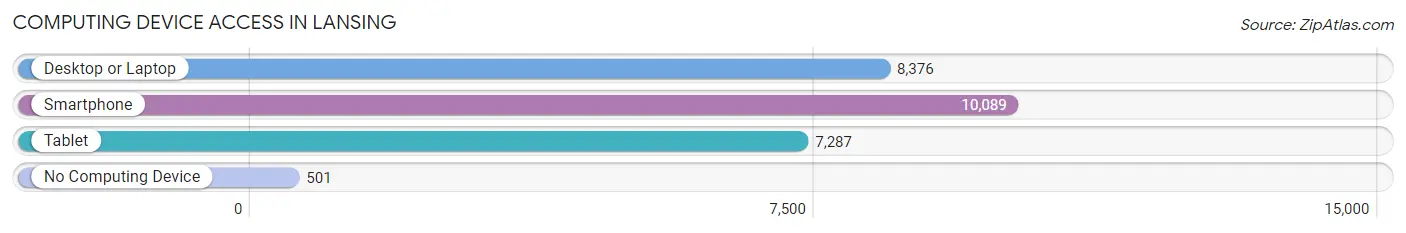
| Device Type | # Households | % Households |
| Desktop or Laptop | 8,376 | 74.9% |
| Smartphone | 10,089 | 90.2% |
| Tablet | 7,287 | 65.2% |
| No Computing Device | 501 | 4.5% |
| Total | 11,179 | 100.0% |
Internet Access in Lansing
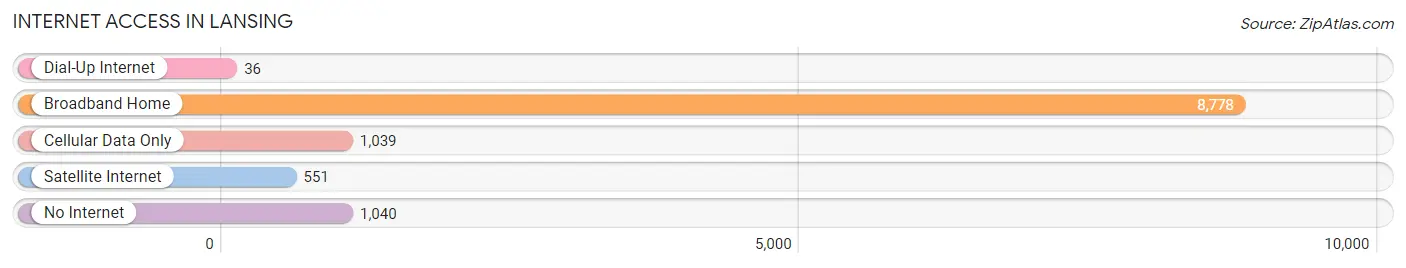
| Internet Type | # Households | % Households |
| Dial-Up Internet | 36 | 0.3% |
| Broadband Home | 8,778 | 78.5% |
| Cellular Data Only | 1,039 | 9.3% |
| Satellite Internet | 551 | 4.9% |
| No Internet | 1,040 | 9.3% |
| Total | 11,179 | 100.0% |
Lansing Summary
Lansing is a village located in Cook County, Illinois, United States. The population was 28,331 at the 2010 census. Lansing is located on the southern edge of Cook County, bordered by the city of Chicago to the north, the village of Calumet City to the east, the village of Lynwood to the south, and the village of Thornton to the west.
History
The area that is now Lansing was first settled in the early 19th century by German and Dutch immigrants. The village was incorporated in 1893 and was named after the first postmaster, John Lansing. The village was originally a farming community, but it began to grow rapidly in the 1950s and 1960s due to its proximity to Chicago.
Geography
Lansing is located at 41°32'17" North, 87°35'17" West (41.538, -87.588). According to the United States Census Bureau, the village has a total area of 5.2 square miles (13.4 km2), all land.
Economy
Lansing is a largely residential community, but it does have a few businesses. The village is home to a number of manufacturing and industrial companies, including a steel mill, a paper mill, and a plastics plant. Lansing also has a number of retail stores, restaurants, and other businesses.
Demographics
As of the 2010 census, there were 28,331 people, 10,845 households, and 7,717 families residing in the village. The population density was 5,444.3 people per square mile (2,098.7/km2). There were 11,541 housing units at an average density of 2,232.2 per square mile (861.2/km2). The racial makeup of the village was 68.2% White, 19.2% African American, 0.3% Native American, 5.2% Asian, 4.2% from other races, and 2.9% from two or more races. Hispanic or Latino of any race were 11.7% of the population.
The median income for a household in the village was $54,945, and the median income for a family was $63,945. Males had a median income of $45,945 versus $35,945 for females. The per capita income for the village was $25,945. About 5.2% of families and 7.2% of the population were below the poverty line, including 9.2% of those under age 18 and 5.2% of those age 65 or over.
Common Questions
What is Per Capita Income in Lansing?
Per Capita income in Lansing is $32,591.
What is the Median Family Income in Lansing?
Median Family Income in Lansing is $86,698.
What is the Median Household income in Lansing?
Median Household Income in Lansing is $68,766.
What is Income or Wage Gap in Lansing?
Income or Wage Gap in Lansing is 33.5%.
Women in Lansing earn 66.5 cents for every dollar earned by a man.
What is Family Income Deficit in Lansing?
Family Income Deficit in Lansing is $12,899.
Families that are below poverty line in Lansing earn $12,899 less on average than the poverty threshold level.
What is Inequality or Gini Index in Lansing?
Inequality or Gini Index in Lansing is 0.42.
What is the Total Population of Lansing?
Total Population of Lansing is 28,713.
What is the Total Male Population of Lansing?
Total Male Population of Lansing is 13,987.
What is the Total Female Population of Lansing?
Total Female Population of Lansing is 14,726.
What is the Ratio of Males per 100 Females in Lansing?
There are 94.98 Males per 100 Females in Lansing.
What is the Ratio of Females per 100 Males in Lansing?
There are 105.28 Females per 100 Males in Lansing.
What is the Median Population Age in Lansing?
Median Population Age in Lansing is 40.7 Years.
What is the Average Family Size in Lansing
Average Family Size in Lansing is 3.3 People.
What is the Average Household Size in Lansing
Average Household Size in Lansing is 2.6 People.
How Large is the Labor Force in Lansing?
There are 15,397 People in the Labor Forcein in Lansing.
What is the Percentage of People in the Labor Force in Lansing?
66.7% of People are in the Labor Force in Lansing.
What is the Unemployment Rate in Lansing?
Unemployment Rate in Lansing is 10.9%.