Rockford, IL Map & Demographics
Rockford Map
Rockford Overview
$29,187
PER CAPITA INCOME
$64,220
AVG FAMILY INCOME
$50,744
AVG HOUSEHOLD INCOME
27.3%
WAGE / INCOME GAP [ % ]
72.7¢/ $1
WAGE / INCOME GAP [ $ ]
$12,725
FAMILY INCOME DEFICIT
0.48
INEQUALITY / GINI INDEX
148,173
TOTAL POPULATION
72,282
MALE POPULATION
75,891
FEMALE POPULATION
95.24
MALES / 100 FEMALES
104.99
FEMALES / 100 MALES
37.5
MEDIAN AGE
3.1
AVG FAMILY SIZE
2.4
AVG HOUSEHOLD SIZE
69,546
LABOR FORCE [ PEOPLE ]
60.0%
PERCENT IN LABOR FORCE
9.0%
UNEMPLOYMENT RATE
Income in Rockford
Income Overview in Rockford
Per Capita Income in Rockford is $29,187, while median incomes of families and households are $64,220 and $50,744 respectively.
| Characteristic | Number | Measure |
| Per Capita Income | 148,173 | $29,187 |
| Median Family Income | 35,842 | $64,220 |
| Mean Family Income | 35,842 | $84,254 |
| Median Household Income | 61,242 | $50,744 |
| Mean Household Income | 61,242 | $69,196 |
| Income Deficit | 35,842 | $12,725 |
| Wage / Income Gap (%) | 148,173 | 27.32% |
| Wage / Income Gap ($) | 148,173 | 72.68¢ per $1 |
| Gini / Inequality Index | 148,173 | 0.48 |
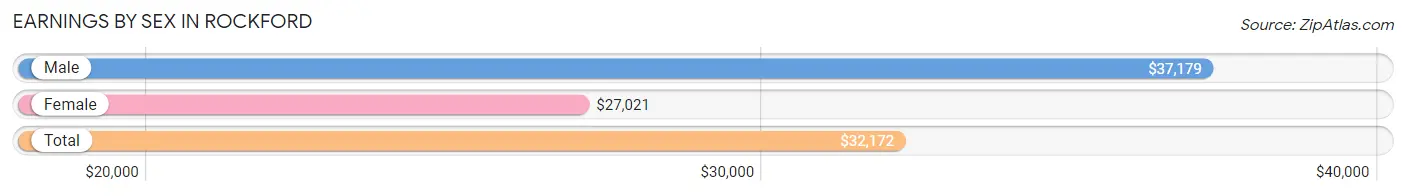
Earnings by Sex in Rockford
Average Earnings in Rockford are $32,172, $37,179 for men and $27,021 for women, a difference of 27.3%.
| Sex | Number | Average Earnings |
| Male | 36,773 (50.8%) | $37,179 |
| Female | 35,564 (49.2%) | $27,021 |
| Total | 72,337 (100.0%) | $32,172 |
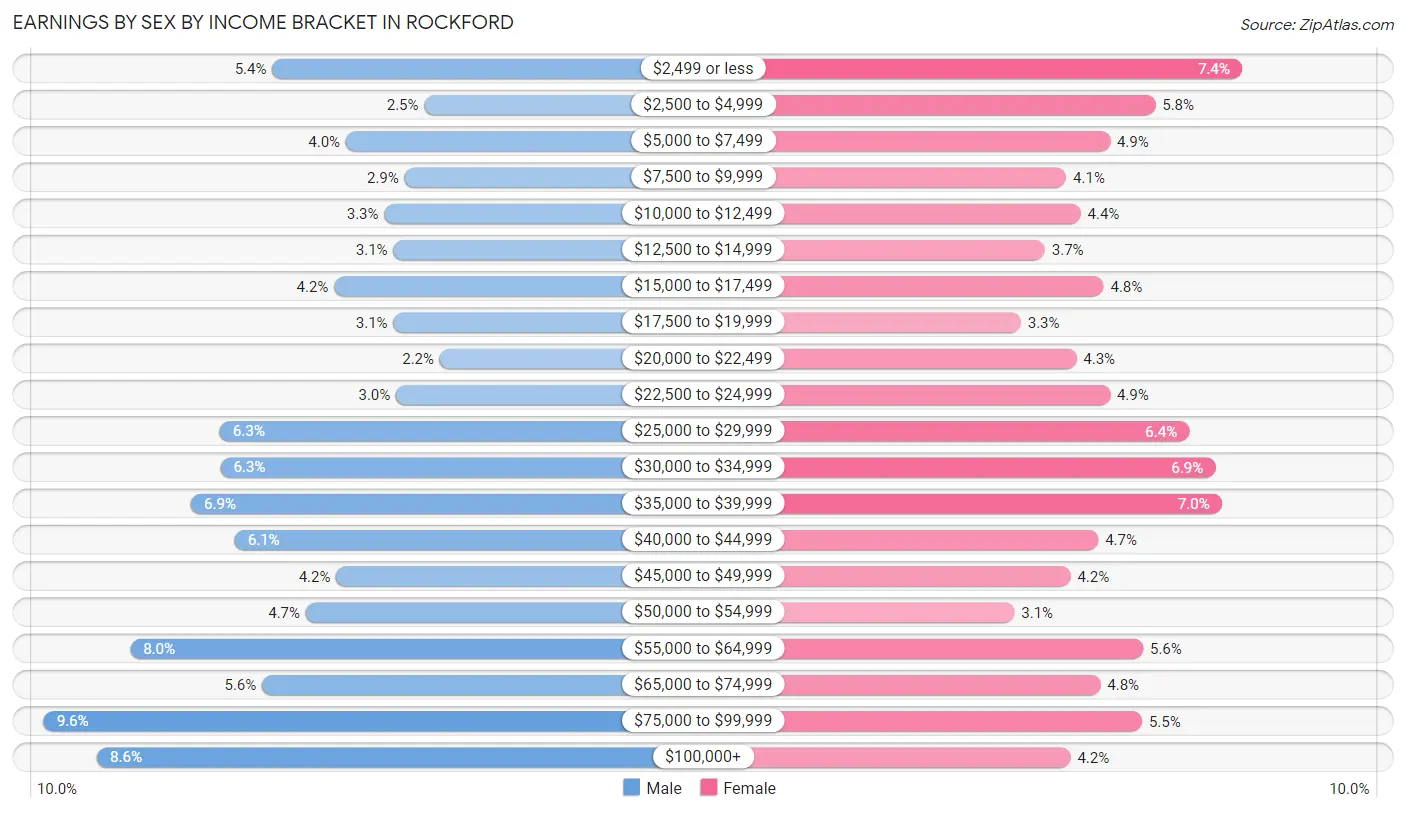
Earnings by Sex by Income Bracket in Rockford
The most common earnings brackets in Rockford are $75,000 to $99,999 for men (3,545 | 9.6%) and $2,499 or less for women (2,633 | 7.4%).
| Income | Male | Female |
| $2,499 or less | 1,972 (5.4%) | 2,633 (7.4%) |
| $2,500 to $4,999 | 922 (2.5%) | 2,056 (5.8%) |
| $5,000 to $7,499 | 1,465 (4.0%) | 1,754 (4.9%) |
| $7,500 to $9,999 | 1,060 (2.9%) | 1,463 (4.1%) |
| $10,000 to $12,499 | 1,200 (3.3%) | 1,556 (4.4%) |
| $12,500 to $14,999 | 1,138 (3.1%) | 1,319 (3.7%) |
| $15,000 to $17,499 | 1,545 (4.2%) | 1,712 (4.8%) |
| $17,500 to $19,999 | 1,137 (3.1%) | 1,158 (3.3%) |
| $20,000 to $22,499 | 816 (2.2%) | 1,530 (4.3%) |
| $22,500 to $24,999 | 1,118 (3.0%) | 1,754 (4.9%) |
| $25,000 to $29,999 | 2,331 (6.3%) | 2,278 (6.4%) |
| $30,000 to $34,999 | 2,329 (6.3%) | 2,453 (6.9%) |
| $35,000 to $39,999 | 2,530 (6.9%) | 2,498 (7.0%) |
| $40,000 to $44,999 | 2,228 (6.1%) | 1,675 (4.7%) |
| $45,000 to $49,999 | 1,528 (4.2%) | 1,491 (4.2%) |
| $50,000 to $54,999 | 1,739 (4.7%) | 1,116 (3.1%) |
| $55,000 to $64,999 | 2,950 (8.0%) | 1,973 (5.6%) |
| $65,000 to $74,999 | 2,041 (5.6%) | 1,691 (4.8%) |
| $75,000 to $99,999 | 3,545 (9.6%) | 1,965 (5.5%) |
| $100,000+ | 3,179 (8.6%) | 1,489 (4.2%) |
| Total | 36,773 (100.0%) | 35,564 (100.0%) |
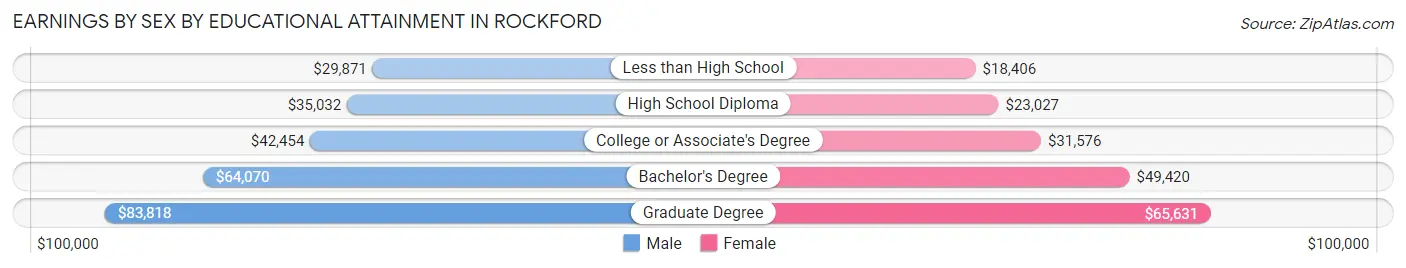
Earnings by Sex by Educational Attainment in Rockford
Average earnings in Rockford are $41,985 for men and $31,092 for women, a difference of 25.9%. Men with an educational attainment of graduate degree enjoy the highest average annual earnings of $83,818, while those with less than high school education earn the least with $29,871. Women with an educational attainment of graduate degree earn the most with the average annual earnings of $65,631, while those with less than high school education have the smallest earnings of $18,406.
| Educational Attainment | Male Income | Female Income |
| Less than High School | $29,871 | $18,406 |
| High School Diploma | $35,032 | $23,027 |
| College or Associate's Degree | $42,454 | $31,576 |
| Bachelor's Degree | $64,070 | $49,420 |
| Graduate Degree | $83,818 | $65,631 |
| Total | $41,985 | $31,092 |
Family Income in Rockford
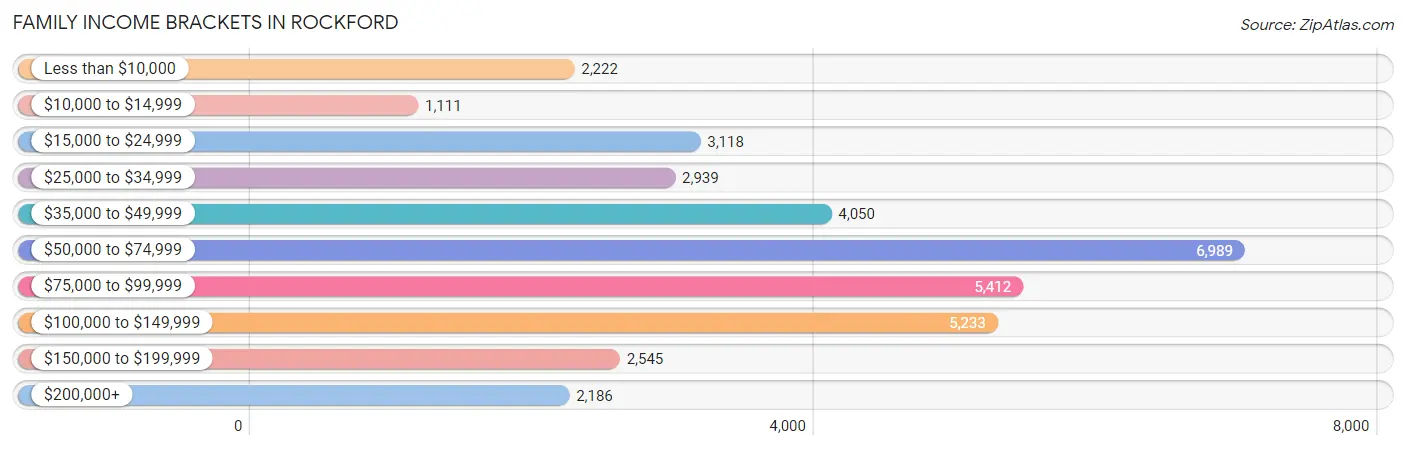
Family Income Brackets in Rockford
According to the Rockford family income data, there are 6,989 families falling into the $50,000 to $74,999 income range, which is the most common income bracket and makes up 19.5% of all families. Conversely, the $10,000 to $14,999 income bracket is the least frequent group with only 1,111 families (3.1%) belonging to this category.
| Income Bracket | # Families | % Families |
| Less than $10,000 | 2,222 | 6.2% |
| $10,000 to $14,999 | 1,111 | 3.1% |
| $15,000 to $24,999 | 3,118 | 8.7% |
| $25,000 to $34,999 | 2,939 | 8.2% |
| $35,000 to $49,999 | 4,050 | 11.3% |
| $50,000 to $74,999 | 6,989 | 19.5% |
| $75,000 to $99,999 | 5,412 | 15.1% |
| $100,000 to $149,999 | 5,233 | 14.6% |
| $150,000 to $199,999 | 2,545 | 7.1% |
| $200,000+ | 2,186 | 6.1% |
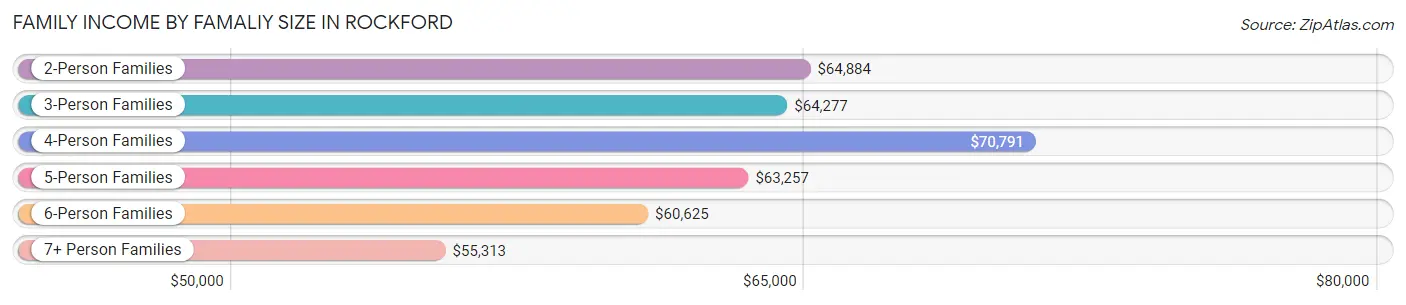
Family Income by Famaliy Size in Rockford
4-person families (5,990 | 16.7%) account for the highest median family income in Rockford with $70,791 per family, while 2-person families (17,617 | 49.1%) have the highest median income of $32,442 per family member.
| Income Bracket | # Families | Median Income |
| 2-Person Families | 17,617 (49.1%) | $64,884 |
| 3-Person Families | 7,089 (19.8%) | $64,277 |
| 4-Person Families | 5,990 (16.7%) | $70,791 |
| 5-Person Families | 2,835 (7.9%) | $63,257 |
| 6-Person Families | 1,501 (4.2%) | $60,625 |
| 7+ Person Families | 810 (2.3%) | $55,313 |
| Total | 35,842 (100.0%) | $64,220 |
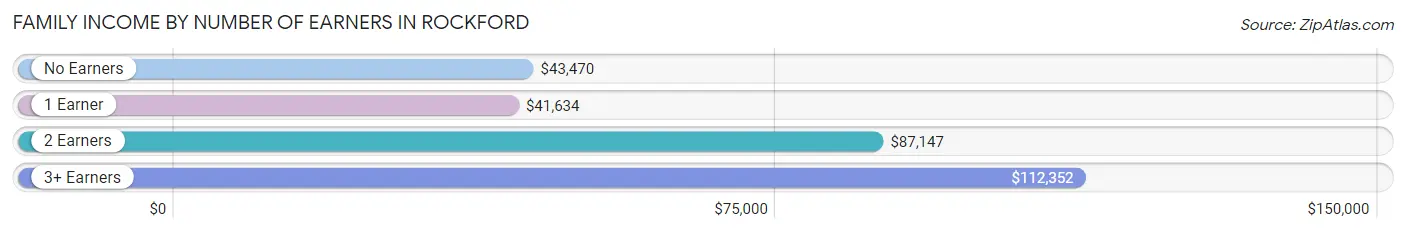
Family Income by Number of Earners in Rockford
The median family income in Rockford is $64,220, with families comprising 3+ earners (3,449) having the highest median family income of $112,352, while families with 1 earner (13,597) have the lowest median family income of $41,634, accounting for 9.6% and 37.9% of families, respectively.
| Number of Earners | # Families | Median Income |
| No Earners | 6,121 (17.1%) | $43,470 |
| 1 Earner | 13,597 (37.9%) | $41,634 |
| 2 Earners | 12,675 (35.4%) | $87,147 |
| 3+ Earners | 3,449 (9.6%) | $112,352 |
| Total | 35,842 (100.0%) | $64,220 |
Household Income in Rockford
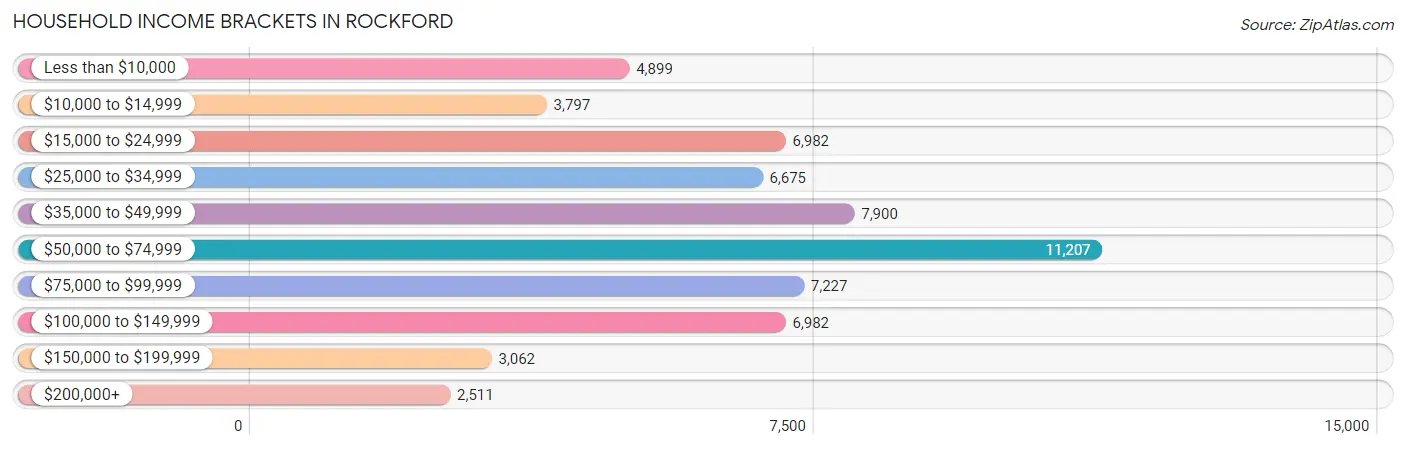
Household Income Brackets in Rockford
With 11,207 households falling in the category, the $50,000 to $74,999 income range is the most frequent in Rockford, accounting for 18.3% of all households. In contrast, only 2,511 households (4.1%) fall into the $200,000+ income bracket, making it the least populous group.
| Income Bracket | # Households | % Households |
| Less than $10,000 | 4,899 | 8.0% |
| $10,000 to $14,999 | 3,797 | 6.2% |
| $15,000 to $24,999 | 6,982 | 11.4% |
| $25,000 to $34,999 | 6,675 | 10.9% |
| $35,000 to $49,999 | 7,900 | 12.9% |
| $50,000 to $74,999 | 11,207 | 18.3% |
| $75,000 to $99,999 | 7,227 | 11.8% |
| $100,000 to $149,999 | 6,982 | 11.4% |
| $150,000 to $199,999 | 3,062 | 5.0% |
| $200,000+ | 2,511 | 4.1% |
Household Income by Householder Age in Rockford
The median household income in Rockford is $50,744, with the highest median household income of $58,541 found in the 45 to 64 years age bracket for the primary householder. A total of 21,722 households (35.5%) fall into this category. Meanwhile, the 15 to 24 years age bracket for the primary householder has the lowest median household income of $35,193, with 2,763 households (4.5%) in this group.
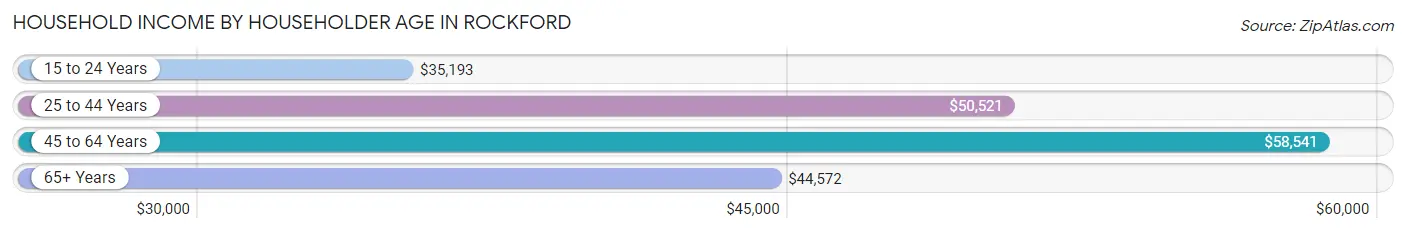
| Income Bracket | # Households | Median Income |
| 15 to 24 Years | 2,763 (4.5%) | $35,193 |
| 25 to 44 Years | 19,761 (32.3%) | $50,521 |
| 45 to 64 Years | 21,722 (35.5%) | $58,541 |
| 65+ Years | 16,996 (27.8%) | $44,572 |
| Total | 61,242 (100.0%) | $50,744 |
Poverty in Rockford
Income Below Poverty by Sex and Age in Rockford
With 21.8% poverty level for males and 22.6% for females among the residents of Rockford, 5 year old males and 15 year old females are the most vulnerable to poverty, with 529 males (53.9%) and 416 females (36.9%) in their respective age groups living below the poverty level.
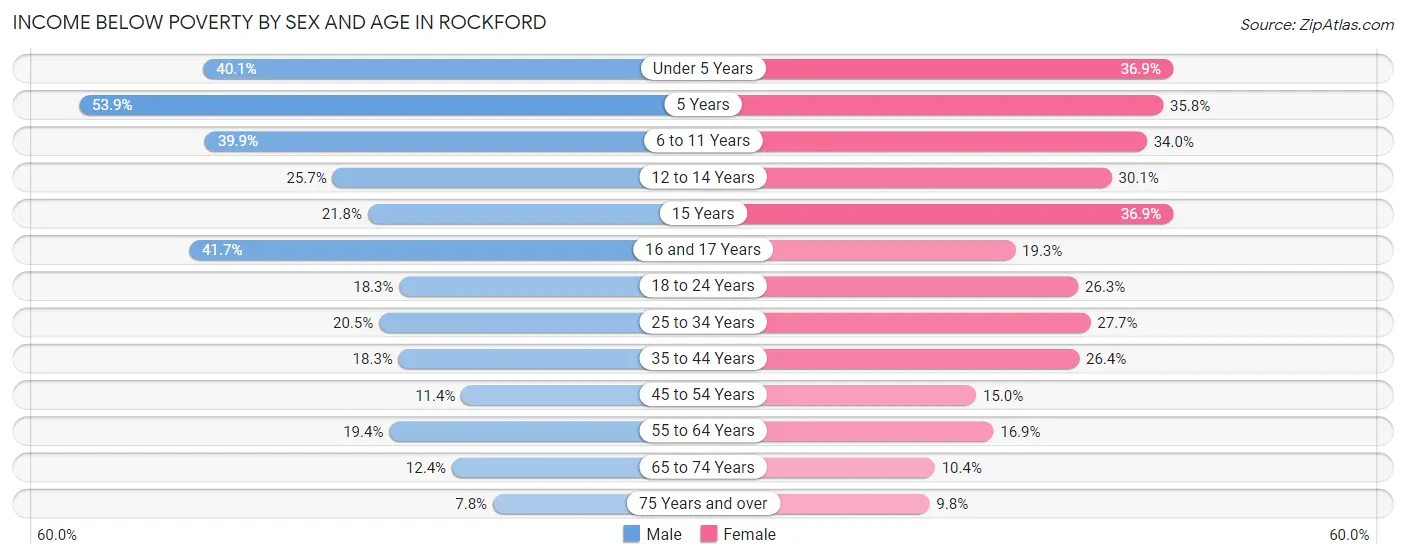
| Age Bracket | Male | Female |
| Under 5 Years | 1,999 (40.1%) | 1,758 (36.8%) |
| 5 Years | 529 (53.9%) | 404 (35.8%) |
| 6 to 11 Years | 2,564 (39.9%) | 1,964 (34.0%) |
| 12 to 14 Years | 829 (25.7%) | 741 (30.0%) |
| 15 Years | 193 (21.8%) | 416 (36.9%) |
| 16 and 17 Years | 901 (41.7%) | 351 (19.3%) |
| 18 to 24 Years | 1,130 (18.3%) | 1,678 (26.3%) |
| 25 to 34 Years | 1,939 (20.5%) | 2,851 (27.7%) |
| 35 to 44 Years | 1,508 (18.3%) | 2,370 (26.4%) |
| 45 to 54 Years | 963 (11.4%) | 1,296 (14.9%) |
| 55 to 64 Years | 1,680 (19.4%) | 1,559 (16.9%) |
| 65 to 74 Years | 821 (12.4%) | 756 (10.3%) |
| 75 Years and over | 338 (7.8%) | 618 (9.8%) |
| Total | 15,394 (21.8%) | 16,762 (22.6%) |
Income Above Poverty by Sex and Age in Rockford
According to the poverty statistics in Rockford, males aged 75 years and over and females aged 75 years and over are the age groups that are most secure financially, with 92.2% of males and 90.2% of females in these age groups living above the poverty line.
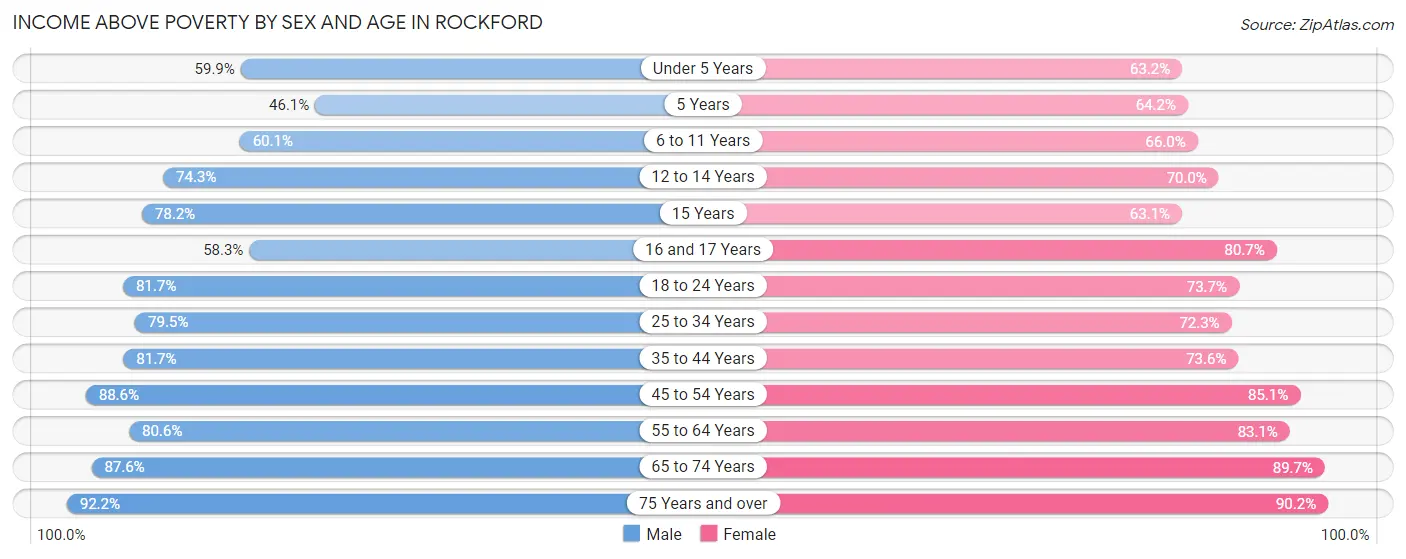
| Age Bracket | Male | Female |
| Under 5 Years | 2,987 (59.9%) | 3,013 (63.1%) |
| 5 Years | 452 (46.1%) | 725 (64.2%) |
| 6 to 11 Years | 3,858 (60.1%) | 3,819 (66.0%) |
| 12 to 14 Years | 2,397 (74.3%) | 1,725 (70.0%) |
| 15 Years | 693 (78.2%) | 712 (63.1%) |
| 16 and 17 Years | 1,260 (58.3%) | 1,468 (80.7%) |
| 18 to 24 Years | 5,056 (81.7%) | 4,697 (73.7%) |
| 25 to 34 Years | 7,512 (79.5%) | 7,449 (72.3%) |
| 35 to 44 Years | 6,713 (81.7%) | 6,599 (73.6%) |
| 45 to 54 Years | 7,504 (88.6%) | 7,375 (85.1%) |
| 55 to 64 Years | 6,986 (80.6%) | 7,682 (83.1%) |
| 65 to 74 Years | 5,792 (87.6%) | 6,551 (89.6%) |
| 75 Years and over | 3,973 (92.2%) | 5,711 (90.2%) |
| Total | 55,183 (78.2%) | 57,526 (77.4%) |
Income Below Poverty Among Married-Couple Families in Rockford
The poverty statistics for married-couple families in Rockford show that 6.1% or 1,348 of the total 22,193 families live below the poverty line. Families with 5 or more children have the highest poverty rate of 26.8%, comprising of 66 families. On the other hand, families with no children have the lowest poverty rate of 2.8%, which includes 393 families.
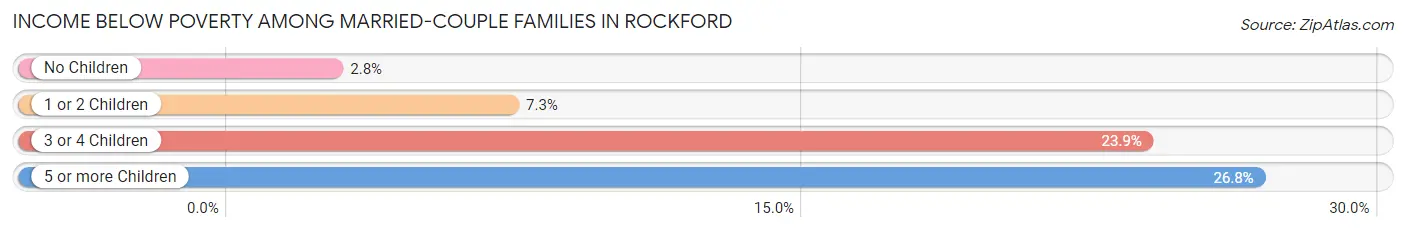
| Children | Above Poverty | Below Poverty |
| No Children | 13,897 (97.3%) | 393 (2.8%) |
| 1 or 2 Children | 5,266 (92.7%) | 417 (7.3%) |
| 3 or 4 Children | 1,502 (76.1%) | 472 (23.9%) |
| 5 or more Children | 180 (73.2%) | 66 (26.8%) |
| Total | 20,845 (93.9%) | 1,348 (6.1%) |
Income Below Poverty Among Single-Parent Households in Rockford
According to the poverty data in Rockford, 26.2% or 847 single-father households and 37.8% or 3,939 single-mother households are living below the poverty line. Among single-father households, those with 5 or more children have the highest poverty rate, with 75 households (86.2%) experiencing poverty. Likewise, among single-mother households, those with 5 or more children have the highest poverty rate, with 290 households (72.5%) falling below the poverty line.
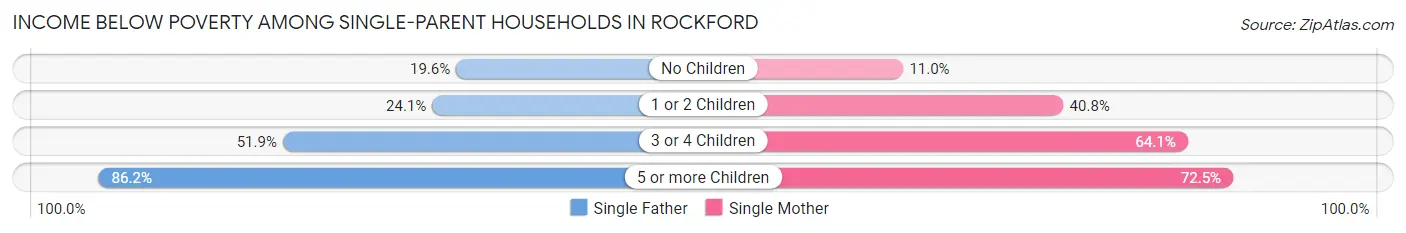
| Children | Single Father | Single Mother |
| No Children | 320 (19.6%) | 314 (11.0%) |
| 1 or 2 Children | 290 (24.1%) | 2,182 (40.8%) |
| 3 or 4 Children | 162 (51.9%) | 1,153 (64.1%) |
| 5 or more Children | 75 (86.2%) | 290 (72.5%) |
| Total | 847 (26.2%) | 3,939 (37.8%) |
Income Below Poverty Among Married-Couple vs Single-Parent Households in Rockford
The poverty data for Rockford shows that 1,348 of the married-couple family households (6.1%) and 4,786 of the single-parent households (35.1%) are living below the poverty level. Within the married-couple family households, those with 5 or more children have the highest poverty rate, with 66 households (26.8%) falling below the poverty line. Among the single-parent households, those with 5 or more children have the highest poverty rate, with 365 household (75.0%) living below poverty.
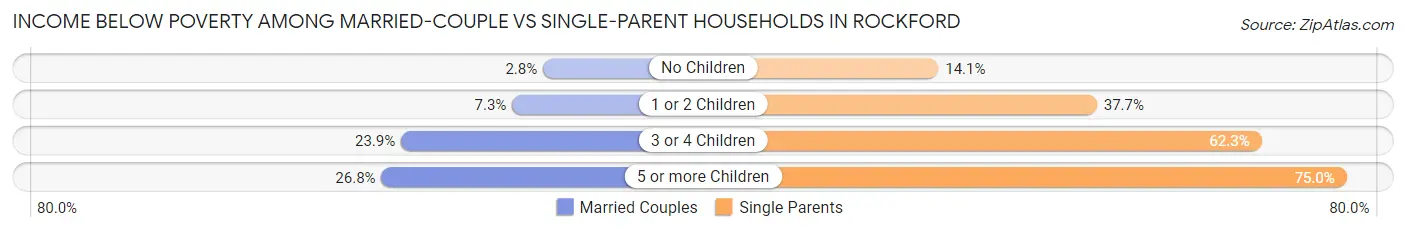
| Children | Married-Couple Families | Single-Parent Households |
| No Children | 393 (2.8%) | 634 (14.1%) |
| 1 or 2 Children | 417 (7.3%) | 2,472 (37.7%) |
| 3 or 4 Children | 472 (23.9%) | 1,315 (62.3%) |
| 5 or more Children | 66 (26.8%) | 365 (75.0%) |
| Total | 1,348 (6.1%) | 4,786 (35.1%) |
Race in Rockford
The most populous races in Rockford are White / Caucasian (87,206 | 58.9%), Black / African American (32,531 | 22.0%), and Hispanic or Latino (28,264 | 19.1%).
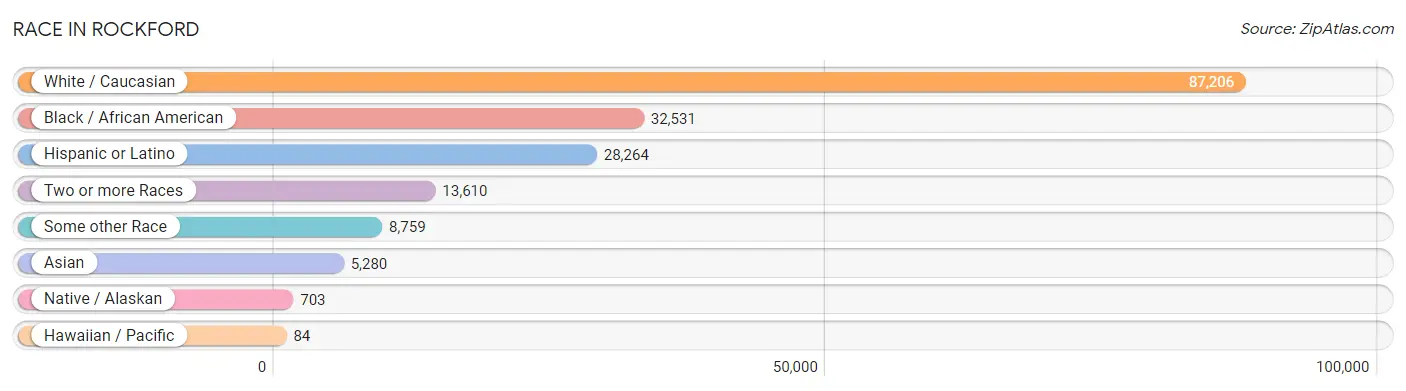
| Race | # Population | % Population |
| Asian | 5,280 | 3.6% |
| Black / African American | 32,531 | 22.0% |
| Hawaiian / Pacific | 84 | 0.1% |
| Hispanic or Latino | 28,264 | 19.1% |
| Native / Alaskan | 703 | 0.5% |
| White / Caucasian | 87,206 | 58.9% |
| Two or more Races | 13,610 | 9.2% |
| Some other Race | 8,759 | 5.9% |
| Total | 148,173 | 100.0% |
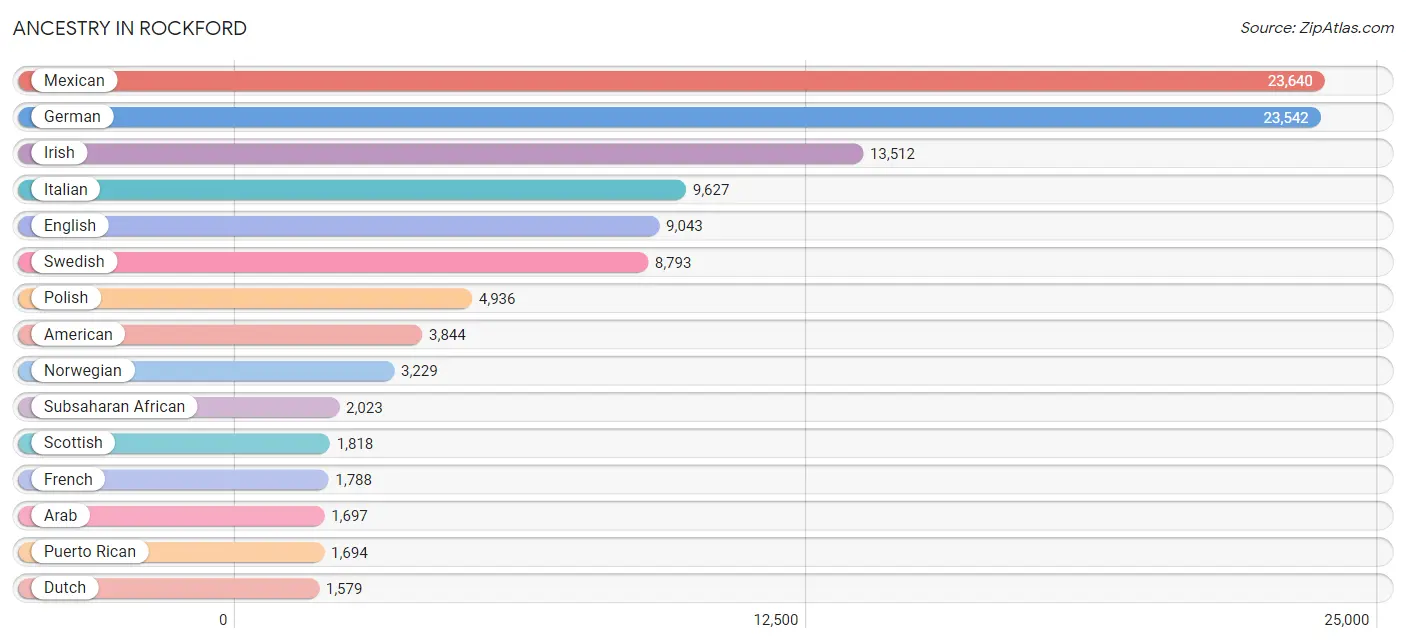
Ancestry in Rockford
The most populous ancestries reported in Rockford are Mexican (23,640 | 16.0%), German (23,542 | 15.9%), Irish (13,512 | 9.1%), Italian (9,627 | 6.5%), and English (9,043 | 6.1%), together accounting for 53.6% of all Rockford residents.
| Ancestry | # Population | % Population |
| African | 695 | 0.5% |
| Albanian | 58 | 0.0% |
| Alsatian | 14 | 0.0% |
| American | 3,844 | 2.6% |
| Apache | 2 | 0.0% |
| Arab | 1,697 | 1.1% |
| Argentinean | 11 | 0.0% |
| Armenian | 49 | 0.0% |
| Assyrian / Chaldean / Syriac | 6 | 0.0% |
| Australian | 18 | 0.0% |
| Austrian | 121 | 0.1% |
| Barbadian | 55 | 0.0% |
| Belgian | 123 | 0.1% |
| Belizean | 9 | 0.0% |
| Bhutanese | 114 | 0.1% |
| Blackfeet | 49 | 0.0% |
| Brazilian | 18 | 0.0% |
| British | 444 | 0.3% |
| British West Indian | 64 | 0.0% |
| Bulgarian | 7 | 0.0% |
| Burmese | 327 | 0.2% |
| Cajun | 14 | 0.0% |
| Cambodian | 163 | 0.1% |
| Canadian | 47 | 0.0% |
| Celtic | 40 | 0.0% |
| Central American | 907 | 0.6% |
| Central American Indian | 22 | 0.0% |
| Cherokee | 330 | 0.2% |
| Cheyenne | 38 | 0.0% |
| Chippewa | 40 | 0.0% |
| Choctaw | 70 | 0.1% |
| Colombian | 171 | 0.1% |
| Creek | 21 | 0.0% |
| Croatian | 164 | 0.1% |
| Cuban | 491 | 0.3% |
| Cypriot | 35 | 0.0% |
| Czech | 507 | 0.3% |
| Czechoslovakian | 112 | 0.1% |
| Danish | 1,072 | 0.7% |
| Dominican | 230 | 0.2% |
| Dutch | 1,579 | 1.1% |
| Eastern European | 223 | 0.2% |
| Ecuadorian | 68 | 0.1% |
| Egyptian | 316 | 0.2% |
| English | 9,043 | 6.1% |
| Ethiopian | 87 | 0.1% |
| European | 1,217 | 0.8% |
| Filipino | 16 | 0.0% |
| Finnish | 144 | 0.1% |
| French | 1,788 | 1.2% |
| French Canadian | 205 | 0.1% |
| German | 23,542 | 15.9% |
| Ghanaian | 28 | 0.0% |
| Greek | 437 | 0.3% |
| Guamanian / Chamorro | 13 | 0.0% |
| Guatemalan | 244 | 0.2% |
| Haitian | 57 | 0.0% |
| Honduran | 89 | 0.1% |
| Hopi | 5 | 0.0% |
| Hungarian | 238 | 0.2% |
| Icelander | 10 | 0.0% |
| Indian (Asian) | 628 | 0.4% |
| Indonesian | 459 | 0.3% |
| Inupiat | 2 | 0.0% |
| Iranian | 20 | 0.0% |
| Iraqi | 712 | 0.5% |
| Irish | 13,512 | 9.1% |
| Israeli | 6 | 0.0% |
| Italian | 9,627 | 6.5% |
| Jamaican | 222 | 0.2% |
| Jordanian | 284 | 0.2% |
| Kenyan | 126 | 0.1% |
| Korean | 946 | 0.6% |
| Laotian | 7 | 0.0% |
| Latvian | 17 | 0.0% |
| Lebanese | 80 | 0.1% |
| Lithuanian | 317 | 0.2% |
| Luxembourger | 6 | 0.0% |
| Malaysian | 1,315 | 0.9% |
| Maltese | 75 | 0.1% |
| Menominee | 16 | 0.0% |
| Mexican | 23,640 | 16.0% |
| Mexican American Indian | 702 | 0.5% |
| Mongolian | 19 | 0.0% |
| Moroccan | 47 | 0.0% |
| Navajo | 14 | 0.0% |
| New Zealander | 5 | 0.0% |
| Nicaraguan | 55 | 0.0% |
| Nigerian | 307 | 0.2% |
| Northern European | 66 | 0.0% |
| Norwegian | 3,229 | 2.2% |
| Pakistani | 219 | 0.2% |
| Palestinian | 44 | 0.0% |
| Pennsylvania German | 75 | 0.1% |
| Polish | 4,936 | 3.3% |
| Portuguese | 63 | 0.0% |
| Potawatomi | 6 | 0.0% |
| Pueblo | 6 | 0.0% |
| Puerto Rican | 1,694 | 1.1% |
| Romanian | 53 | 0.0% |
| Russian | 654 | 0.4% |
| Salvadoran | 519 | 0.4% |
| Scandinavian | 443 | 0.3% |
| Scotch-Irish | 922 | 0.6% |
| Scottish | 1,818 | 1.2% |
| Serbian | 71 | 0.1% |
| Sioux | 30 | 0.0% |
| Slavic | 17 | 0.0% |
| Slovak | 180 | 0.1% |
| Slovene | 36 | 0.0% |
| South African | 193 | 0.1% |
| South American | 301 | 0.2% |
| South American Indian | 129 | 0.1% |
| Spaniard | 505 | 0.3% |
| Spanish | 28 | 0.0% |
| Sri Lankan | 547 | 0.4% |
| Subsaharan African | 2,023 | 1.4% |
| Swedish | 8,793 | 5.9% |
| Swiss | 424 | 0.3% |
| Syrian | 15 | 0.0% |
| Thai | 1,404 | 0.9% |
| Turkish | 6 | 0.0% |
| Ukrainian | 200 | 0.1% |
| Venezuelan | 51 | 0.0% |
| Vietnamese | 62 | 0.0% |
| Welsh | 470 | 0.3% |
| West Indian | 9 | 0.0% |
| Yugoslavian | 201 | 0.1% | View All 128 Rows |
Immigrants in Rockford
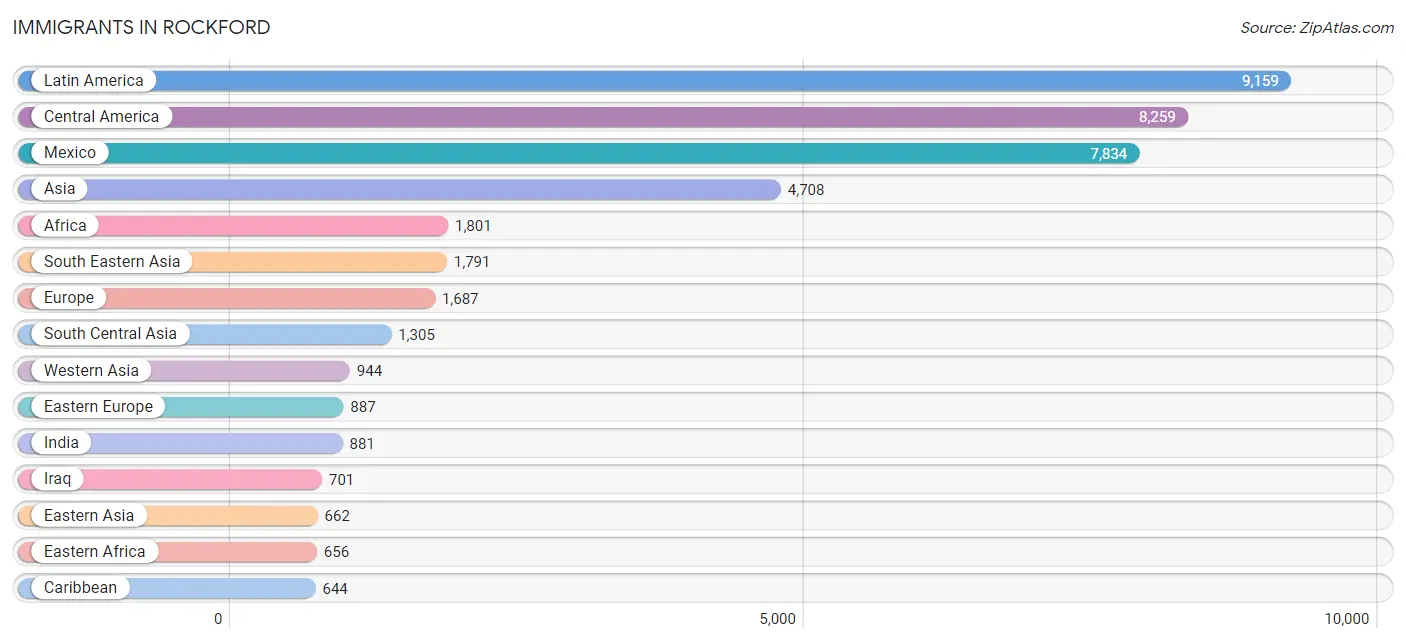
The most numerous immigrant groups reported in Rockford came from Latin America (9,159 | 6.2%), Central America (8,259 | 5.6%), Mexico (7,834 | 5.3%), Asia (4,708 | 3.2%), and Africa (1,801 | 1.2%), together accounting for 21.4% of all Rockford residents.
| Immigration Origin | # Population | % Population |
| Africa | 1,801 | 1.2% |
| Asia | 4,708 | 3.2% |
| Bangladesh | 44 | 0.0% |
| Barbados | 58 | 0.0% |
| Belize | 4 | 0.0% |
| Bosnia and Herzegovina | 188 | 0.1% |
| Brazil | 38 | 0.0% |
| Bulgaria | 13 | 0.0% |
| Canada | 346 | 0.2% |
| Caribbean | 644 | 0.4% |
| Central America | 8,259 | 5.6% |
| China | 390 | 0.3% |
| Colombia | 166 | 0.1% |
| Congo | 69 | 0.1% |
| Croatia | 23 | 0.0% |
| Cuba | 306 | 0.2% |
| Czechoslovakia | 8 | 0.0% |
| Dominican Republic | 152 | 0.1% |
| Eastern Africa | 656 | 0.4% |
| Eastern Asia | 662 | 0.4% |
| Eastern Europe | 887 | 0.6% |
| Ecuador | 1 | 0.0% |
| Egypt | 187 | 0.1% |
| El Salvador | 203 | 0.1% |
| England | 59 | 0.0% |
| Europe | 1,687 | 1.1% |
| France | 36 | 0.0% |
| Germany | 161 | 0.1% |
| Ghana | 25 | 0.0% |
| Greece | 51 | 0.0% |
| Guatemala | 111 | 0.1% |
| Haiti | 42 | 0.0% |
| Honduras | 107 | 0.1% |
| Hong Kong | 30 | 0.0% |
| India | 881 | 0.6% |
| Indonesia | 7 | 0.0% |
| Iran | 12 | 0.0% |
| Iraq | 701 | 0.5% |
| Ireland | 17 | 0.0% |
| Italy | 118 | 0.1% |
| Jamaica | 80 | 0.1% |
| Japan | 24 | 0.0% |
| Jordan | 181 | 0.1% |
| Kazakhstan | 252 | 0.2% |
| Kenya | 137 | 0.1% |
| Korea | 143 | 0.1% |
| Kuwait | 16 | 0.0% |
| Laos | 453 | 0.3% |
| Latin America | 9,159 | 6.2% |
| Lithuania | 19 | 0.0% |
| Malaysia | 19 | 0.0% |
| Mexico | 7,834 | 5.3% |
| Middle Africa | 481 | 0.3% |
| Morocco | 23 | 0.0% |
| Nigeria | 200 | 0.1% |
| North Macedonia | 8 | 0.0% |
| Northern Africa | 210 | 0.1% |
| Northern Europe | 373 | 0.3% |
| Norway | 48 | 0.0% |
| Pakistan | 105 | 0.1% |
| Philippines | 538 | 0.4% |
| Poland | 328 | 0.2% |
| Russia | 120 | 0.1% |
| Saudi Arabia | 6 | 0.0% |
| Scotland | 50 | 0.0% |
| Serbia | 9 | 0.0% |
| South Africa | 92 | 0.1% |
| South America | 256 | 0.2% |
| South Central Asia | 1,305 | 0.9% |
| South Eastern Asia | 1,791 | 1.2% |
| Southern Europe | 189 | 0.1% |
| Spain | 20 | 0.0% |
| Sri Lanka | 11 | 0.0% |
| Switzerland | 20 | 0.0% |
| Syria | 29 | 0.0% |
| Taiwan | 21 | 0.0% |
| Thailand | 297 | 0.2% |
| Uganda | 39 | 0.0% |
| Ukraine | 86 | 0.1% |
| Venezuela | 51 | 0.0% |
| Vietnam | 222 | 0.2% |
| Western Africa | 316 | 0.2% |
| Western Asia | 944 | 0.6% |
| Western Europe | 217 | 0.2% |
| Yemen | 11 | 0.0% |
| Zaire | 396 | 0.3% | View All 86 Rows |
Sex and Age in Rockford
Sex and Age in Rockford
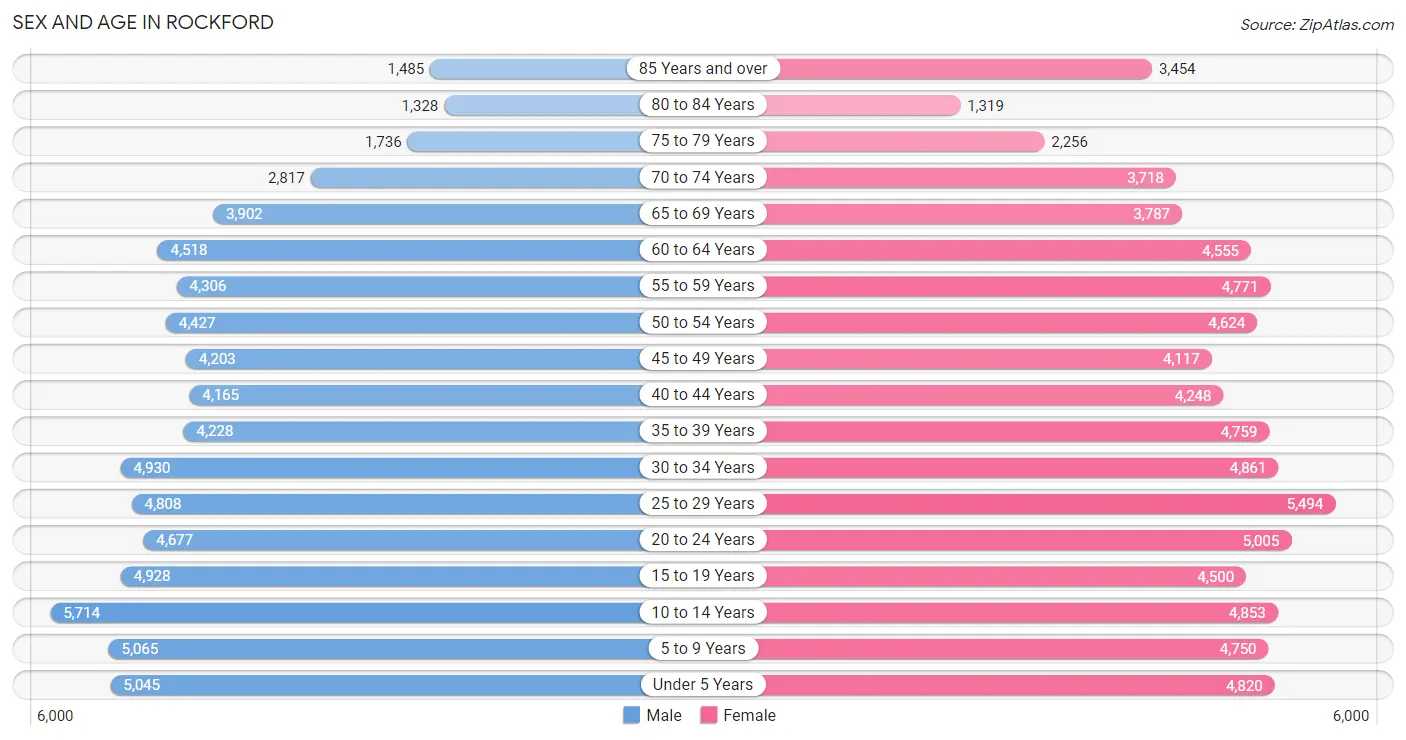
The most populous age groups in Rockford are 10 to 14 Years (5,714 | 7.9%) for men and 25 to 29 Years (5,494 | 7.2%) for women.
| Age Bracket | Male | Female |
| Under 5 Years | 5,045 (7.0%) | 4,820 (6.4%) |
| 5 to 9 Years | 5,065 (7.0%) | 4,750 (6.3%) |
| 10 to 14 Years | 5,714 (7.9%) | 4,853 (6.4%) |
| 15 to 19 Years | 4,928 (6.8%) | 4,500 (5.9%) |
| 20 to 24 Years | 4,677 (6.5%) | 5,005 (6.6%) |
| 25 to 29 Years | 4,808 (6.7%) | 5,494 (7.2%) |
| 30 to 34 Years | 4,930 (6.8%) | 4,861 (6.4%) |
| 35 to 39 Years | 4,228 (5.9%) | 4,759 (6.3%) |
| 40 to 44 Years | 4,165 (5.8%) | 4,248 (5.6%) |
| 45 to 49 Years | 4,203 (5.8%) | 4,117 (5.4%) |
| 50 to 54 Years | 4,427 (6.1%) | 4,624 (6.1%) |
| 55 to 59 Years | 4,306 (6.0%) | 4,771 (6.3%) |
| 60 to 64 Years | 4,518 (6.2%) | 4,555 (6.0%) |
| 65 to 69 Years | 3,902 (5.4%) | 3,787 (5.0%) |
| 70 to 74 Years | 2,817 (3.9%) | 3,718 (4.9%) |
| 75 to 79 Years | 1,736 (2.4%) | 2,256 (3.0%) |
| 80 to 84 Years | 1,328 (1.8%) | 1,319 (1.7%) |
| 85 Years and over | 1,485 (2.1%) | 3,454 (4.5%) |
| Total | 72,282 (100.0%) | 75,891 (100.0%) |
Families and Households in Rockford
Median Family Size in Rockford
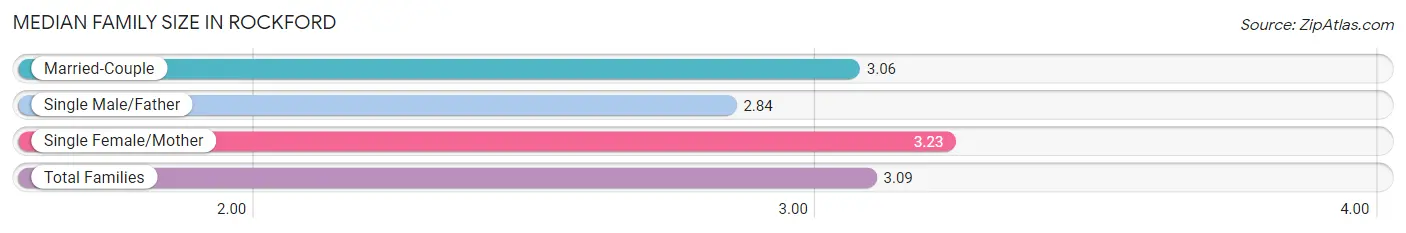
The median family size in Rockford is 3.09 persons per family, with single female/mother families (10,417 | 29.1%) accounting for the largest median family size of 3.23 persons per family. On the other hand, single male/father families (3,232 | 9.0%) represent the smallest median family size with 2.84 persons per family.
| Family Type | # Families | Family Size |
| Married-Couple | 22,193 (61.9%) | 3.06 |
| Single Male/Father | 3,232 (9.0%) | 2.84 |
| Single Female/Mother | 10,417 (29.1%) | 3.23 |
| Total Families | 35,842 (100.0%) | 3.09 |
Median Household Size in Rockford
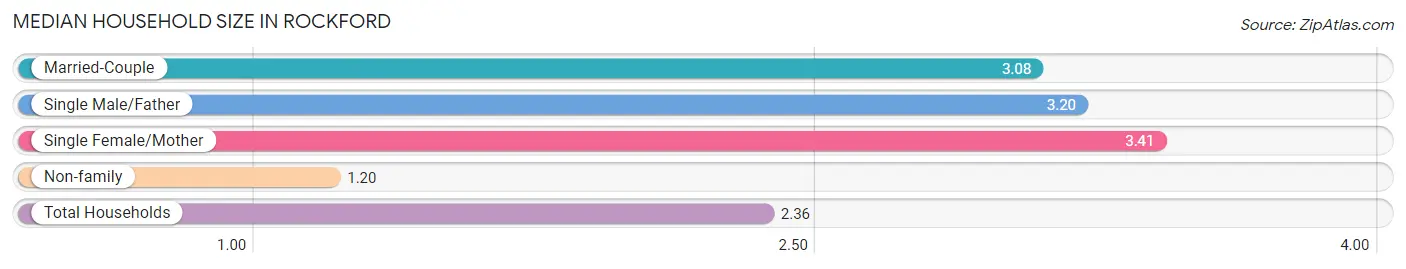
The median household size in Rockford is 2.36 persons per household, with single female/mother households (10,417 | 17.0%) accounting for the largest median household size of 3.41 persons per household. non-family households (25,400 | 41.5%) represent the smallest median household size with 1.20 persons per household.
| Household Type | # Households | Household Size |
| Married-Couple | 22,193 (36.2%) | 3.08 |
| Single Male/Father | 3,232 (5.3%) | 3.20 |
| Single Female/Mother | 10,417 (17.0%) | 3.41 |
| Non-family | 25,400 (41.5%) | 1.20 |
| Total Households | 61,242 (100.0%) | 2.36 |
Household Size by Marriage Status in Rockford
Out of a total of 61,242 households in Rockford, 35,842 (58.5%) are family households, while 25,400 (41.5%) are nonfamily households. The most numerous type of family households are 2-person households, comprising 16,325, and the most common type of nonfamily households are 1-person households, comprising 21,329.
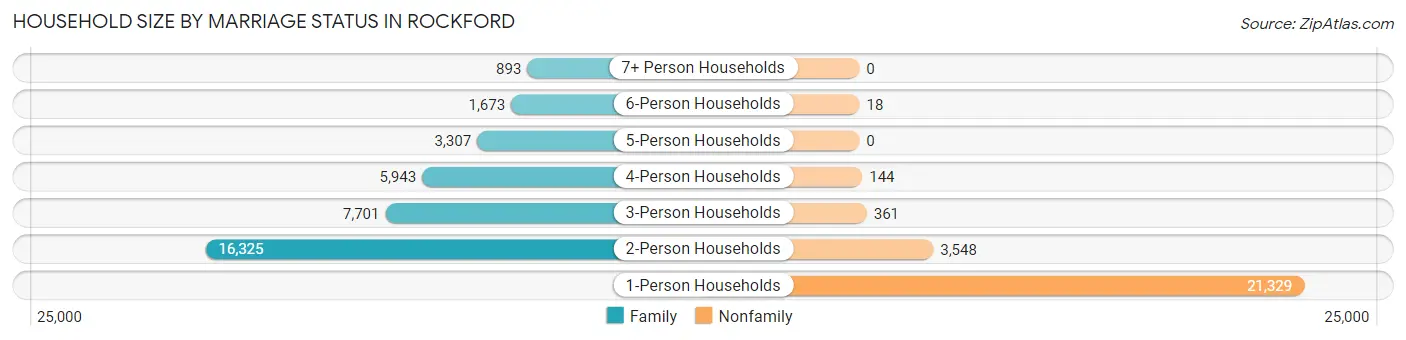
| Household Size | Family Households | Nonfamily Households |
| 1-Person Households | - | 21,329 (34.8%) |
| 2-Person Households | 16,325 (26.7%) | 3,548 (5.8%) |
| 3-Person Households | 7,701 (12.6%) | 361 (0.6%) |
| 4-Person Households | 5,943 (9.7%) | 144 (0.2%) |
| 5-Person Households | 3,307 (5.4%) | 0 (0.0%) |
| 6-Person Households | 1,673 (2.7%) | 18 (0.0%) |
| 7+ Person Households | 893 (1.5%) | 0 (0.0%) |
| Total | 35,842 (58.5%) | 25,400 (41.5%) |
Female Fertility in Rockford
Fertility by Age in Rockford
Average fertility rate in Rockford is 67.0 births per 1,000 women. Women in the age bracket of 20 to 34 years have the highest fertility rate with 118.0 births per 1,000 women. Women in the age bracket of 20 to 34 years acount for 80.0% of all women with births.
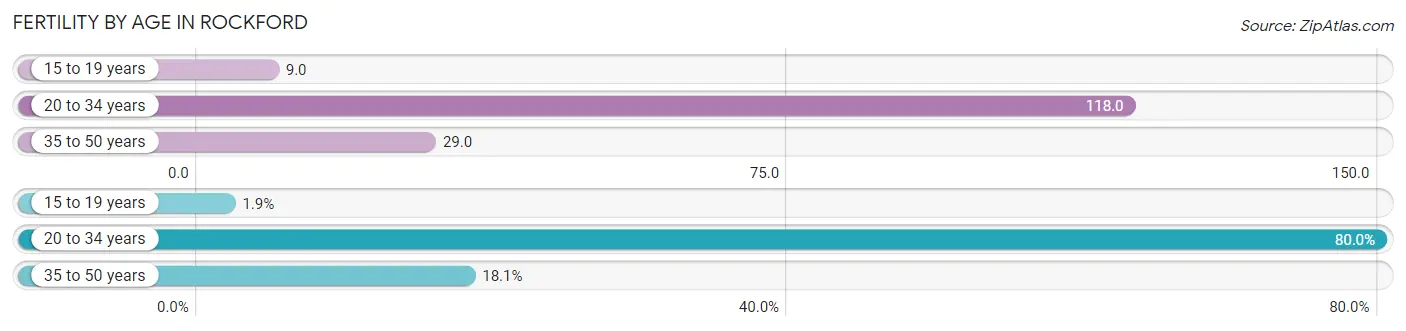
| Age Bracket | Women with Births | Births / 1,000 Women |
| 15 to 19 years | 42 (1.9%) | 9.0 |
| 20 to 34 years | 1,808 (80.0%) | 118.0 |
| 35 to 50 years | 410 (18.1%) | 29.0 |
| Total | 2,260 (100.0%) | 67.0 |
Fertility by Age by Marriage Status in Rockford
41.6% of women with births (2,260) in Rockford are married. The highest percentage of unmarried women with births falls into 15 to 19 years age bracket with 85.7% of them unmarried at the time of birth, while the lowest percentage of unmarried women with births belong to 35 to 50 years age bracket with 42.4% of them unmarried.
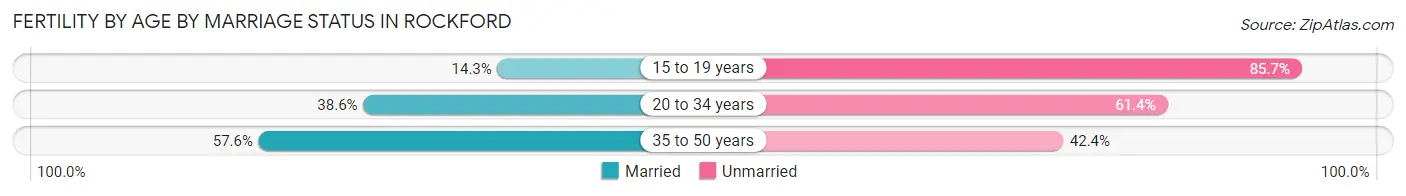
| Age Bracket | Married | Unmarried |
| 15 to 19 years | 6 (14.3%) | 36 (85.7%) |
| 20 to 34 years | 698 (38.6%) | 1,110 (61.4%) |
| 35 to 50 years | 236 (57.6%) | 174 (42.4%) |
| Total | 940 (41.6%) | 1,320 (58.4%) |
Fertility by Education in Rockford
Average fertility rate in Rockford is 67.0 births per 1,000 women. Women with the education attainment of high school diploma have the highest fertility rate of 84.0 births per 1,000 women, while women with the education attainment of graduate degree have the lowest fertility at 47.0 births per 1,000 women. Women with the education attainment of high school diploma represent 34.8% of all women with births.
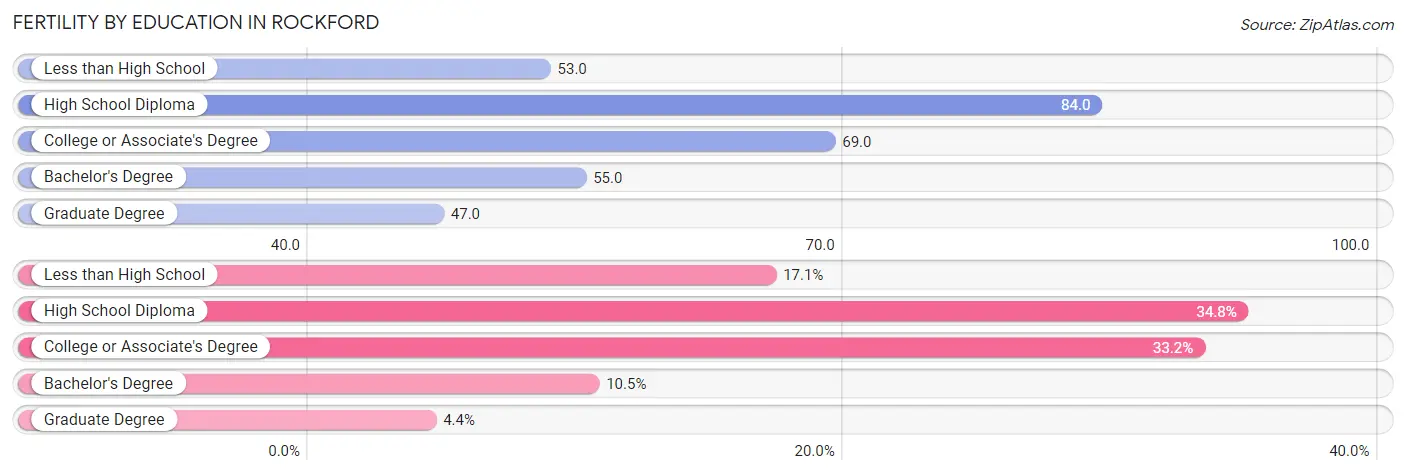
| Educational Attainment | Women with Births | Births / 1,000 Women |
| Less than High School | 387 (17.1%) | 53.0 |
| High School Diploma | 787 (34.8%) | 84.0 |
| College or Associate's Degree | 750 (33.2%) | 69.0 |
| Bachelor's Degree | 237 (10.5%) | 55.0 |
| Graduate Degree | 99 (4.4%) | 47.0 |
| Total | 2,260 (100.0%) | 67.0 |
Fertility by Education by Marriage Status in Rockford
58.4% of women with births in Rockford are unmarried. Women with the educational attainment of bachelor's degree are most likely to be married with 70.0% of them married at childbirth, while women with the educational attainment of less than high school are least likely to be married with 69.8% of them unmarried at childbirth.
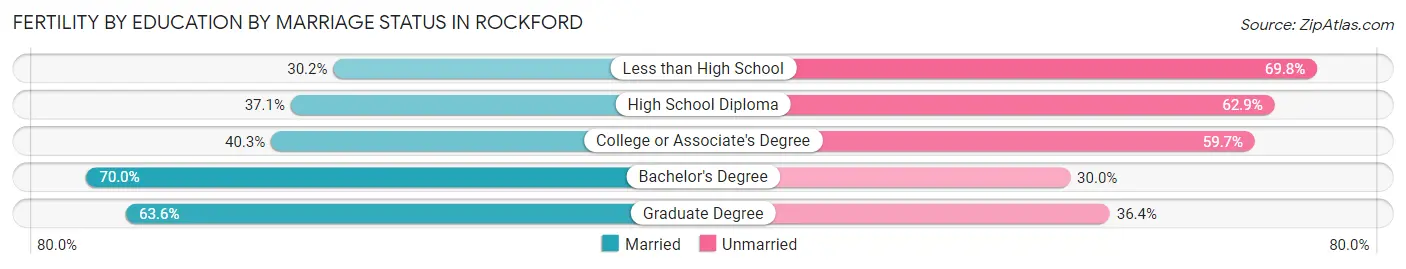
| Educational Attainment | Married | Unmarried |
| Less than High School | 117 (30.2%) | 270 (69.8%) |
| High School Diploma | 292 (37.1%) | 495 (62.9%) |
| College or Associate's Degree | 302 (40.3%) | 448 (59.7%) |
| Bachelor's Degree | 166 (70.0%) | 71 (30.0%) |
| Graduate Degree | 63 (63.6%) | 36 (36.4%) |
| Total | 940 (41.6%) | 1,320 (58.4%) |
Employment Characteristics in Rockford
Employment by Class of Employer in Rockford
Among the 61,720 employed individuals in Rockford, private company employees (46,070 | 74.6%), not-for-profit organizations (5,831 | 9.5%), and local government employees (3,287 | 5.3%) make up the most common classes of employment.
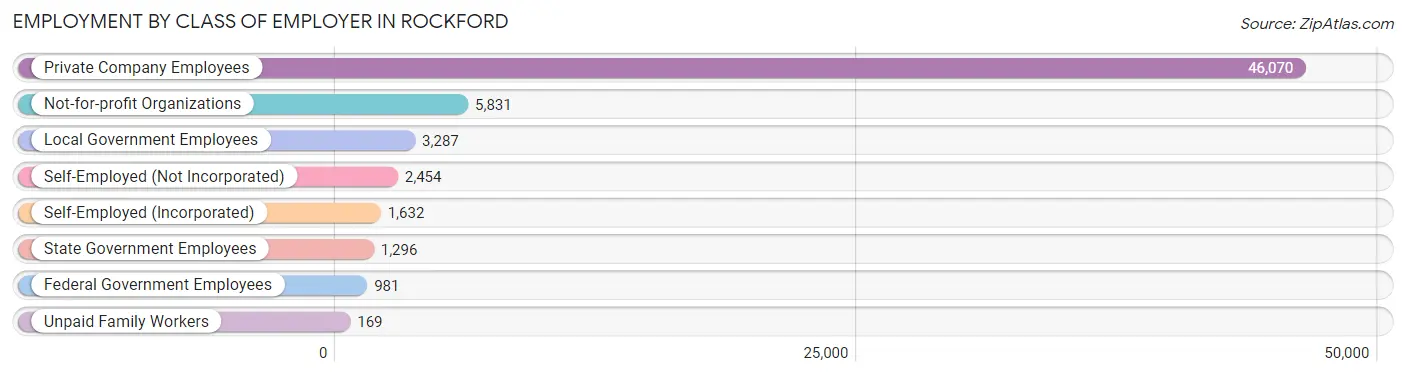
| Employer Class | # Employees | % Employees |
| Private Company Employees | 46,070 | 74.6% |
| Self-Employed (Incorporated) | 1,632 | 2.6% |
| Self-Employed (Not Incorporated) | 2,454 | 4.0% |
| Not-for-profit Organizations | 5,831 | 9.5% |
| Local Government Employees | 3,287 | 5.3% |
| State Government Employees | 1,296 | 2.1% |
| Federal Government Employees | 981 | 1.6% |
| Unpaid Family Workers | 169 | 0.3% |
| Total | 61,720 | 100.0% |
Employment Status by Age in Rockford
According to the labor force statistics for Rockford, out of the total population over 16 years of age (115,910), 60.0% or 69,546 individuals are in the labor force, with 9.0% or 6,259 of them unemployed. The age group with the highest labor force participation rate is 25 to 29 years, with 83.9% or 8,643 individuals in the labor force. Within the labor force, the 16 to 19 years age range has the highest percentage of unemployed individuals, with 24.2% or 848 of them being unemployed.
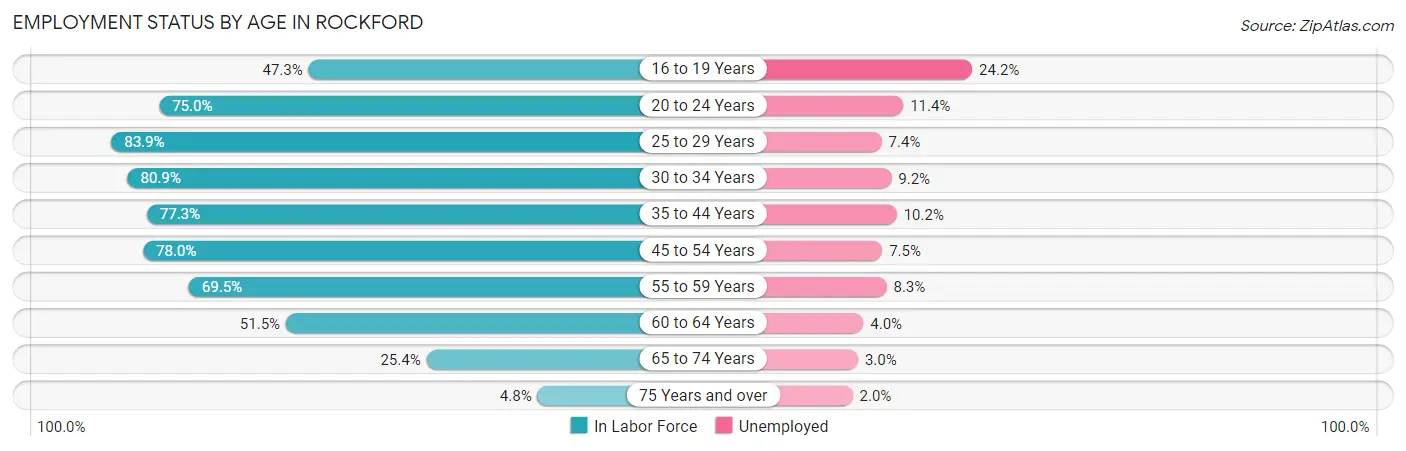
| Age Bracket | In Labor Force | Unemployed |
| 16 to 19 Years | 3,506 (47.3%) | 848 (24.2%) |
| 20 to 24 Years | 7,262 (75.0%) | 828 (11.4%) |
| 25 to 29 Years | 8,643 (83.9%) | 640 (7.4%) |
| 30 to 34 Years | 7,921 (80.9%) | 729 (9.2%) |
| 35 to 44 Years | 13,450 (77.3%) | 1,372 (10.2%) |
| 45 to 54 Years | 13,549 (78.0%) | 1,016 (7.5%) |
| 55 to 59 Years | 6,309 (69.5%) | 524 (8.3%) |
| 60 to 64 Years | 4,673 (51.5%) | 187 (4.0%) |
| 65 to 74 Years | 3,613 (25.4%) | 108 (3.0%) |
| 75 Years and over | 556 (4.8%) | 11 (2.0%) |
| Total | 69,546 (60.0%) | 6,259 (9.0%) |
Employment Status by Educational Attainment in Rockford
According to labor force statistics for Rockford, 74.7% of individuals (54,541) out of the total population between 25 and 64 years of age (73,014) are in the labor force, with 8.2% or 4,472 of them being unemployed. The group with the highest labor force participation rate are those with the educational attainment of bachelor's degree or higher, with 82.2% or 13,066 individuals in the labor force. Within the labor force, individuals with high school diploma education have the highest percentage of unemployment, with 11.3% or 1,810 of them being unemployed.
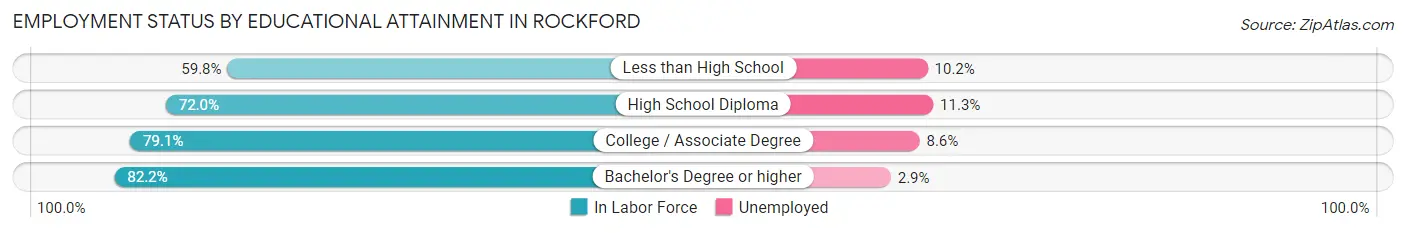
| Educational Attainment | In Labor Force | Unemployed |
| Less than High School | 6,532 (59.8%) | 1,114 (10.2%) |
| High School Diploma | 16,021 (72.0%) | 2,514 (11.3%) |
| College / Associate Degree | 18,940 (79.1%) | 2,059 (8.6%) |
| Bachelor's Degree or higher | 13,066 (82.2%) | 461 (2.9%) |
| Total | 54,541 (74.7%) | 5,987 (8.2%) |
Employment Occupations by Sex in Rockford
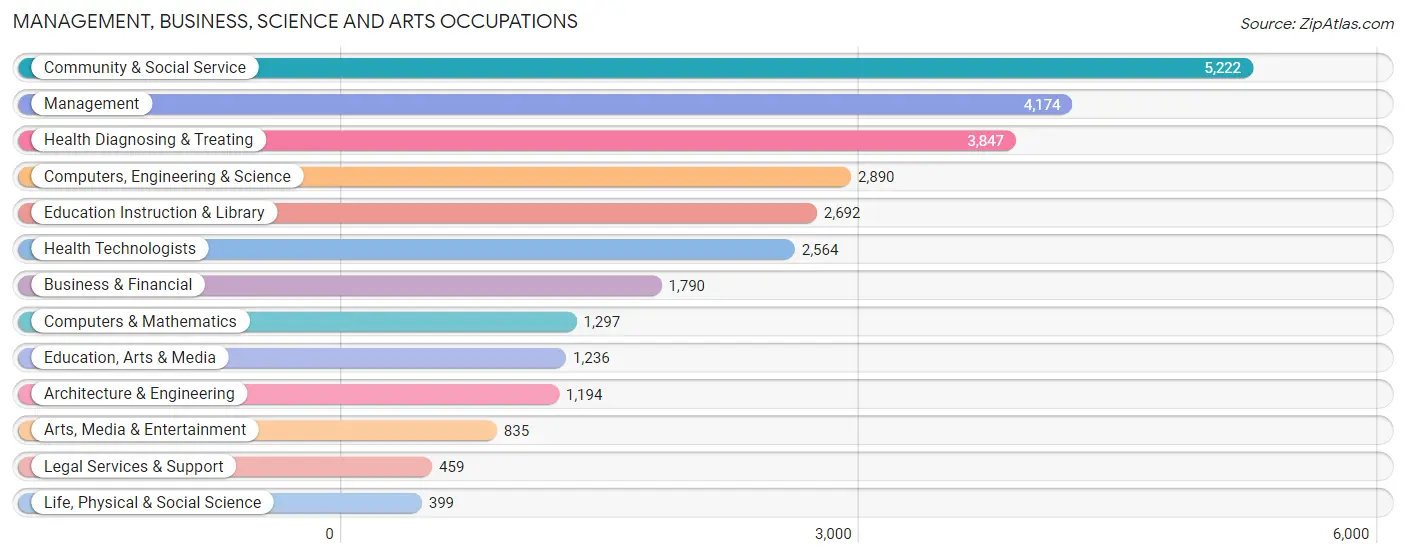
Management, Business, Science and Arts Occupations
The most common Management, Business, Science and Arts occupations in Rockford are Community & Social Service (5,222 | 8.3%), Management (4,174 | 6.6%), Health Diagnosing & Treating (3,847 | 6.1%), Computers, Engineering & Science (2,890 | 4.6%), and Education Instruction & Library (2,692 | 4.3%).
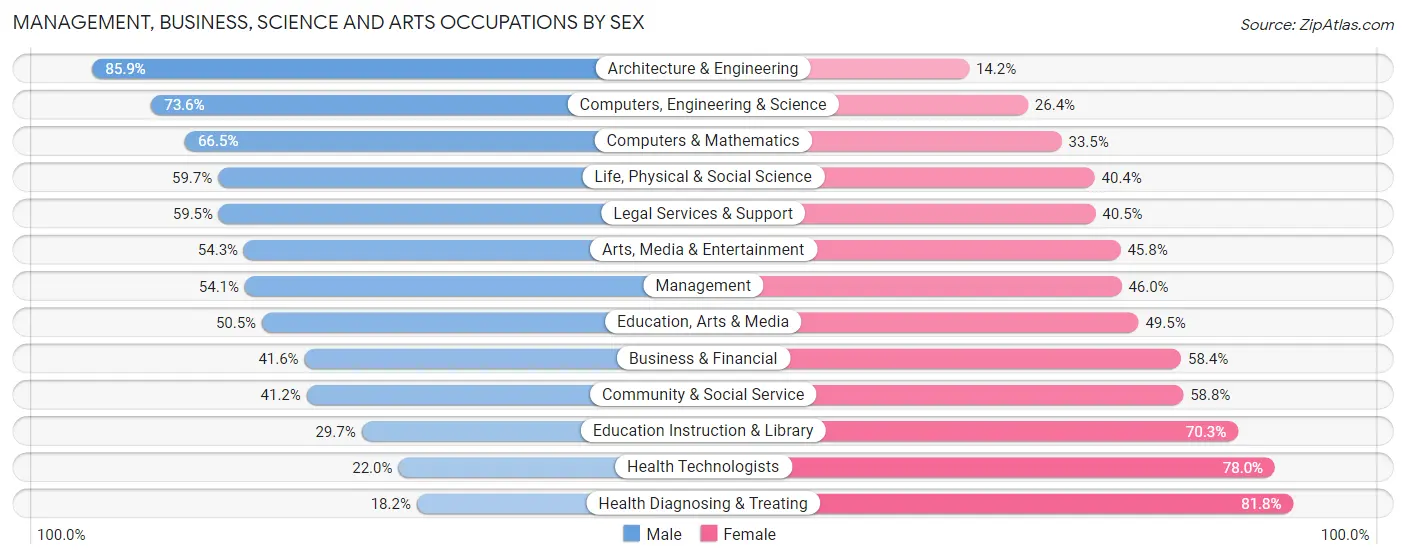
Management, Business, Science and Arts Occupations by Sex
Within the Management, Business, Science and Arts occupations in Rockford, the most male-oriented occupations are Architecture & Engineering (85.9%), Computers, Engineering & Science (73.6%), and Computers & Mathematics (66.5%), while the most female-oriented occupations are Health Diagnosing & Treating (81.8%), Health Technologists (78.0%), and Education Instruction & Library (70.3%).
| Occupation | Male | Female |
| Management | 2,256 (54.0%) | 1,918 (46.0%) |
| Business & Financial | 745 (41.6%) | 1,045 (58.4%) |
| Computers, Engineering & Science | 2,126 (73.6%) | 764 (26.4%) |
| Computers & Mathematics | 863 (66.5%) | 434 (33.5%) |
| Architecture & Engineering | 1,025 (85.9%) | 169 (14.1%) |
| Life, Physical & Social Science | 238 (59.7%) | 161 (40.4%) |
| Community & Social Service | 2,150 (41.2%) | 3,072 (58.8%) |
| Education, Arts & Media | 624 (50.5%) | 612 (49.5%) |
| Legal Services & Support | 273 (59.5%) | 186 (40.5%) |
| Education Instruction & Library | 800 (29.7%) | 1,892 (70.3%) |
| Arts, Media & Entertainment | 453 (54.2%) | 382 (45.8%) |
| Health Diagnosing & Treating | 700 (18.2%) | 3,147 (81.8%) |
| Health Technologists | 565 (22.0%) | 1,999 (78.0%) |
| Total (Category) | 7,977 (44.5%) | 9,946 (55.5%) |
| Total (Overall) | 32,258 (51.0%) | 30,959 (49.0%) |
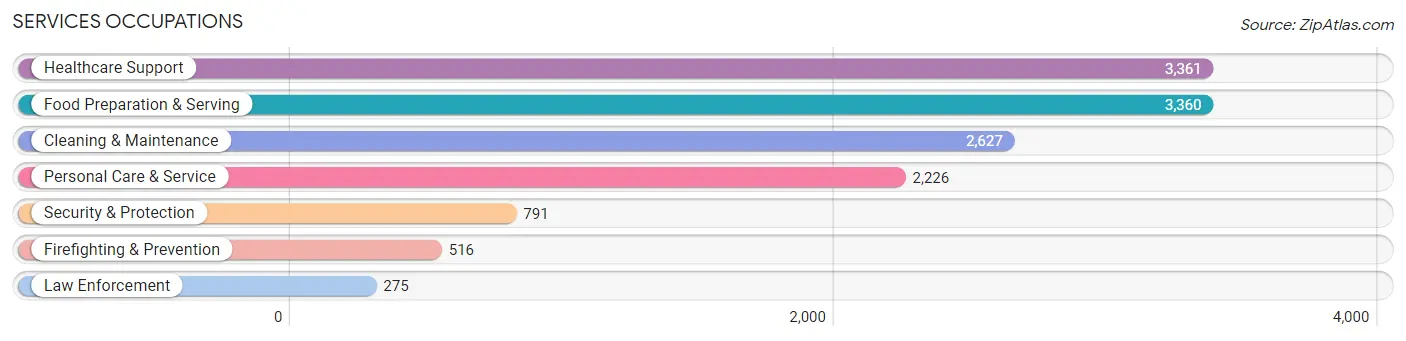
Services Occupations
The most common Services occupations in Rockford are Healthcare Support (3,361 | 5.3%), Food Preparation & Serving (3,360 | 5.3%), Cleaning & Maintenance (2,627 | 4.2%), Personal Care & Service (2,226 | 3.5%), and Security & Protection (791 | 1.3%).
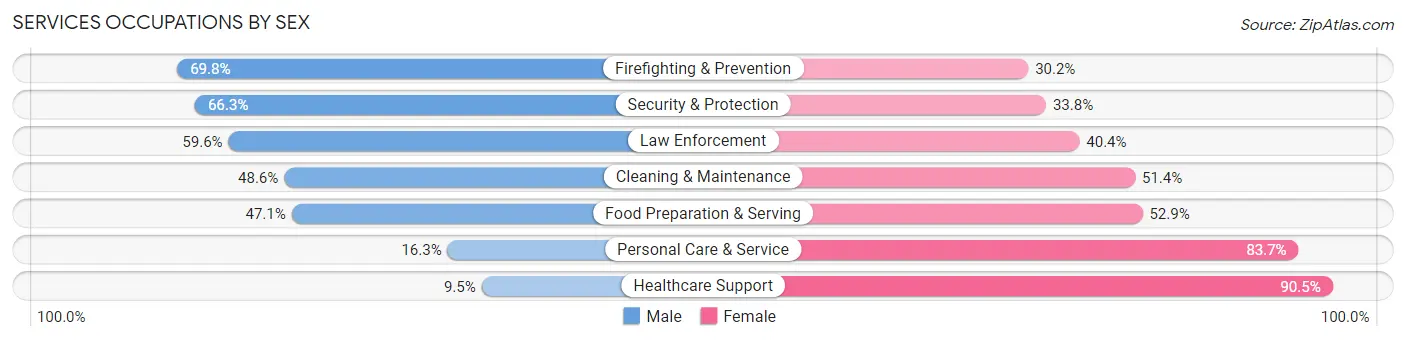
Services Occupations by Sex
Within the Services occupations in Rockford, the most male-oriented occupations are Firefighting & Prevention (69.8%), Security & Protection (66.2%), and Law Enforcement (59.6%), while the most female-oriented occupations are Healthcare Support (90.5%), Personal Care & Service (83.7%), and Food Preparation & Serving (52.9%).
| Occupation | Male | Female |
| Healthcare Support | 320 (9.5%) | 3,041 (90.5%) |
| Security & Protection | 524 (66.2%) | 267 (33.8%) |
| Firefighting & Prevention | 360 (69.8%) | 156 (30.2%) |
| Law Enforcement | 164 (59.6%) | 111 (40.4%) |
| Food Preparation & Serving | 1,584 (47.1%) | 1,776 (52.9%) |
| Cleaning & Maintenance | 1,277 (48.6%) | 1,350 (51.4%) |
| Personal Care & Service | 362 (16.3%) | 1,864 (83.7%) |
| Total (Category) | 4,067 (32.9%) | 8,298 (67.1%) |
| Total (Overall) | 32,258 (51.0%) | 30,959 (49.0%) |
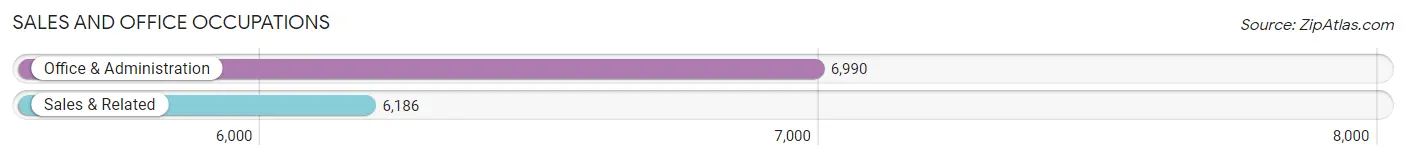
Sales and Office Occupations
The most common Sales and Office occupations in Rockford are Office & Administration (6,990 | 11.1%), and Sales & Related (6,186 | 9.8%).
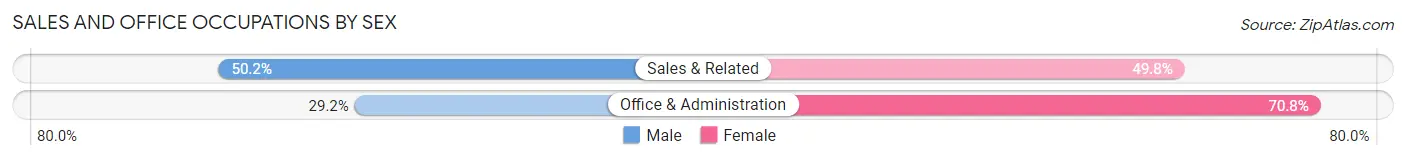
Sales and Office Occupations by Sex
| Occupation | Male | Female |
| Sales & Related | 3,103 (50.2%) | 3,083 (49.8%) |
| Office & Administration | 2,043 (29.2%) | 4,947 (70.8%) |
| Total (Category) | 5,146 (39.1%) | 8,030 (60.9%) |
| Total (Overall) | 32,258 (51.0%) | 30,959 (49.0%) |
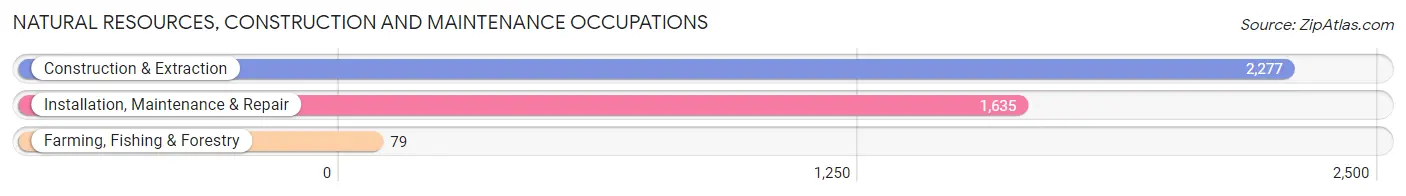
Natural Resources, Construction and Maintenance Occupations
The most common Natural Resources, Construction and Maintenance occupations in Rockford are Construction & Extraction (2,277 | 3.6%), Installation, Maintenance & Repair (1,635 | 2.6%), and Farming, Fishing & Forestry (79 | 0.1%).
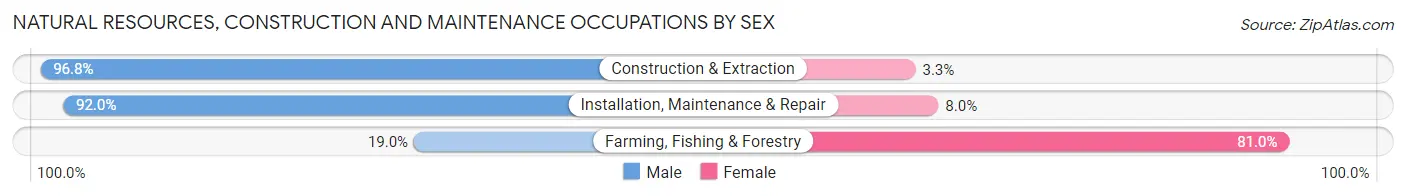
Natural Resources, Construction and Maintenance Occupations by Sex
| Occupation | Male | Female |
| Farming, Fishing & Forestry | 15 (19.0%) | 64 (81.0%) |
| Construction & Extraction | 2,203 (96.8%) | 74 (3.3%) |
| Installation, Maintenance & Repair | 1,504 (92.0%) | 131 (8.0%) |
| Total (Category) | 3,722 (93.3%) | 269 (6.7%) |
| Total (Overall) | 32,258 (51.0%) | 30,959 (49.0%) |
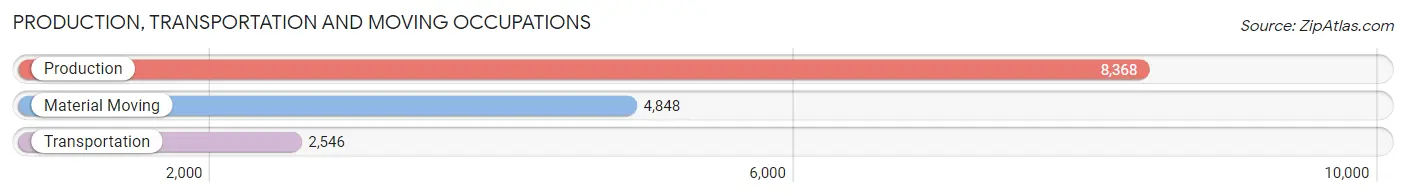
Production, Transportation and Moving Occupations
The most common Production, Transportation and Moving occupations in Rockford are Production (8,368 | 13.2%), Material Moving (4,848 | 7.7%), and Transportation (2,546 | 4.0%).
Production, Transportation and Moving Occupations by Sex
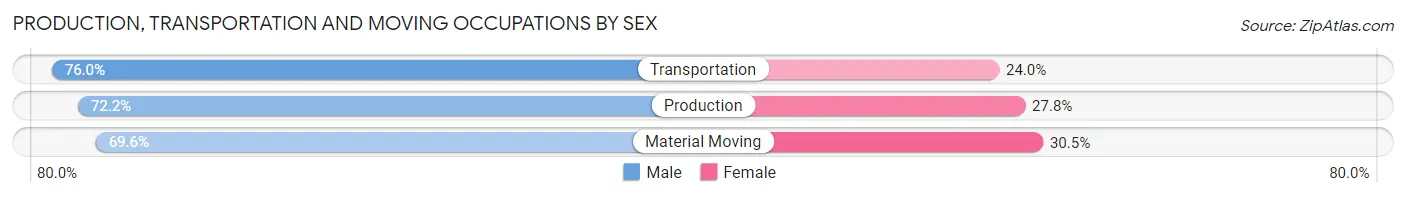
| Occupation | Male | Female |
| Production | 6,039 (72.2%) | 2,329 (27.8%) |
| Transportation | 1,935 (76.0%) | 611 (24.0%) |
| Material Moving | 3,372 (69.6%) | 1,476 (30.4%) |
| Total (Category) | 11,346 (72.0%) | 4,416 (28.0%) |
| Total (Overall) | 32,258 (51.0%) | 30,959 (49.0%) |
Employment Industries by Sex in Rockford
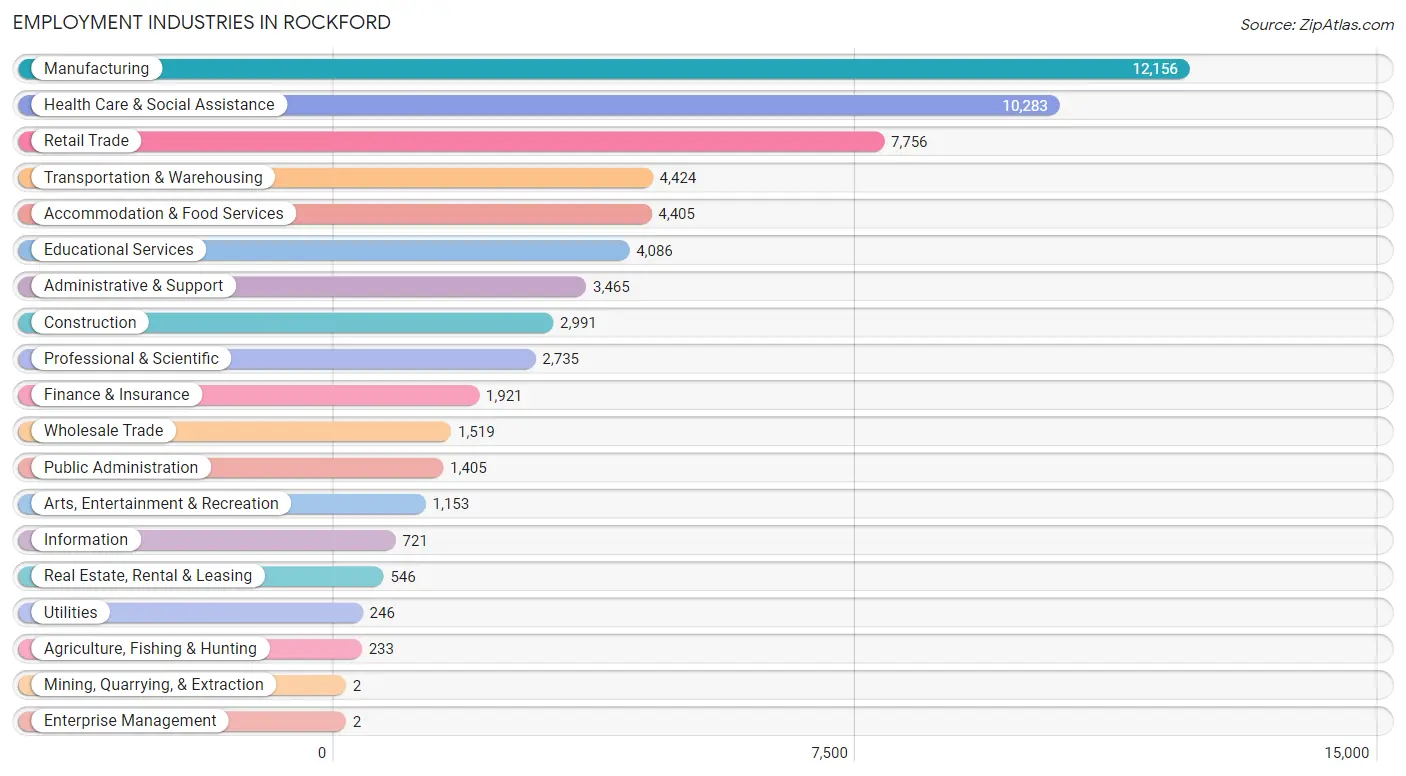
Employment Industries in Rockford
The major employment industries in Rockford include Manufacturing (12,156 | 19.2%), Health Care & Social Assistance (10,283 | 16.3%), Retail Trade (7,756 | 12.3%), Transportation & Warehousing (4,424 | 7.0%), and Accommodation & Food Services (4,405 | 7.0%).
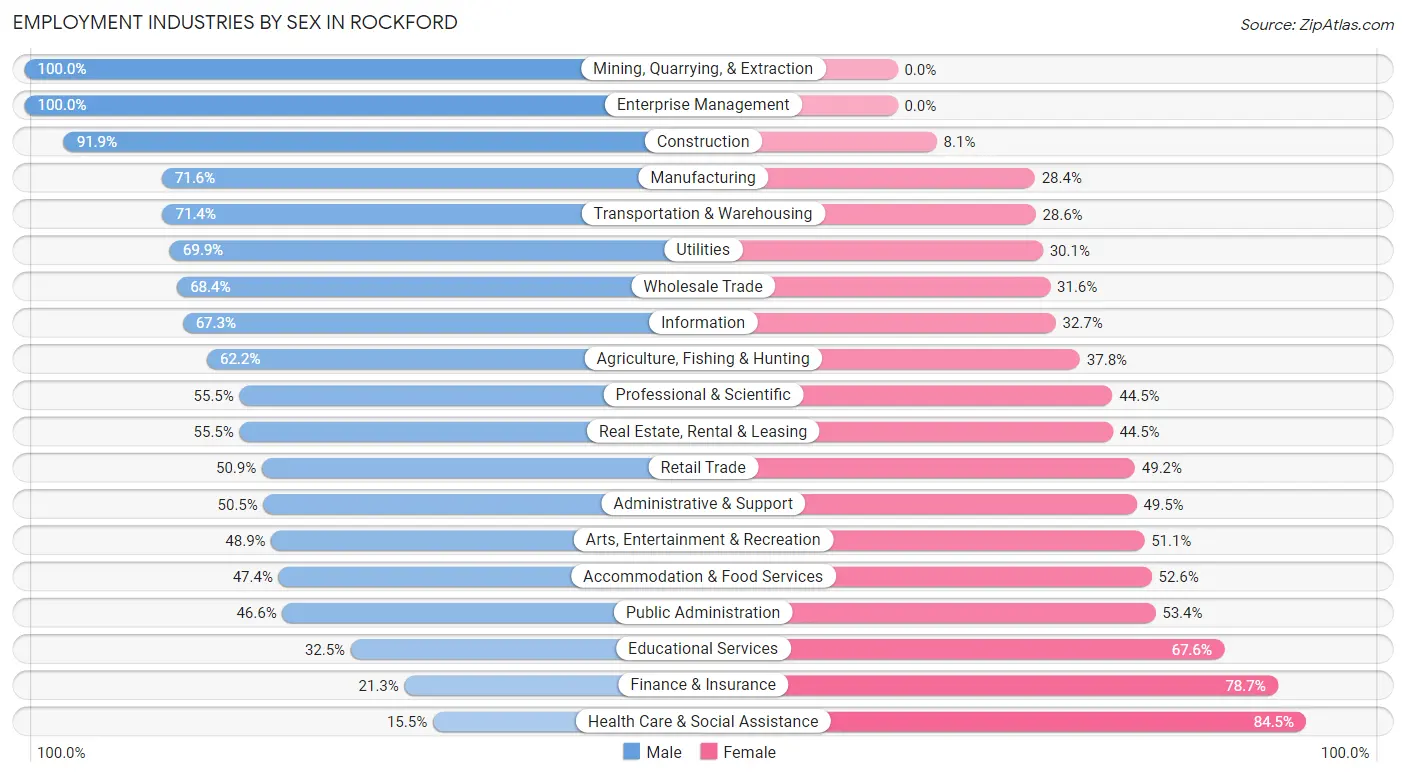
Employment Industries by Sex in Rockford
The Rockford industries that see more men than women are Mining, Quarrying, & Extraction (100.0%), Enterprise Management (100.0%), and Construction (91.9%), whereas the industries that tend to have a higher number of women are Health Care & Social Assistance (84.5%), Finance & Insurance (78.7%), and Educational Services (67.5%).
| Industry | Male | Female |
| Agriculture, Fishing & Hunting | 145 (62.2%) | 88 (37.8%) |
| Mining, Quarrying, & Extraction | 2 (100.0%) | 0 (0.0%) |
| Construction | 2,748 (91.9%) | 243 (8.1%) |
| Manufacturing | 8,701 (71.6%) | 3,455 (28.4%) |
| Wholesale Trade | 1,039 (68.4%) | 480 (31.6%) |
| Retail Trade | 3,944 (50.8%) | 3,812 (49.1%) |
| Transportation & Warehousing | 3,160 (71.4%) | 1,264 (28.6%) |
| Utilities | 172 (69.9%) | 74 (30.1%) |
| Information | 485 (67.3%) | 236 (32.7%) |
| Finance & Insurance | 410 (21.3%) | 1,511 (78.7%) |
| Real Estate, Rental & Leasing | 303 (55.5%) | 243 (44.5%) |
| Professional & Scientific | 1,518 (55.5%) | 1,217 (44.5%) |
| Enterprise Management | 2 (100.0%) | 0 (0.0%) |
| Administrative & Support | 1,751 (50.5%) | 1,714 (49.5%) |
| Educational Services | 1,326 (32.5%) | 2,760 (67.5%) |
| Health Care & Social Assistance | 1,591 (15.5%) | 8,692 (84.5%) |
| Arts, Entertainment & Recreation | 564 (48.9%) | 589 (51.1%) |
| Accommodation & Food Services | 2,088 (47.4%) | 2,317 (52.6%) |
| Public Administration | 655 (46.6%) | 750 (53.4%) |
| Total | 32,258 (51.0%) | 30,959 (49.0%) |
Education in Rockford
School Enrollment in Rockford
The most common levels of schooling among the 34,958 students in Rockford are middle school (8,066 | 23.1%), elementary school (7,852 | 22.5%), and high school (7,631 | 21.8%).
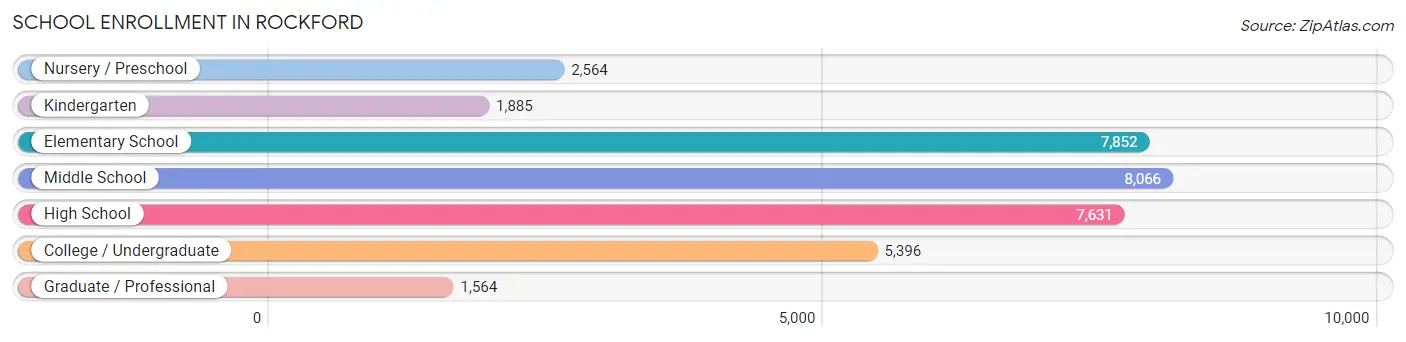
| School Level | # Students | % Students |
| Nursery / Preschool | 2,564 | 7.3% |
| Kindergarten | 1,885 | 5.4% |
| Elementary School | 7,852 | 22.5% |
| Middle School | 8,066 | 23.1% |
| High School | 7,631 | 21.8% |
| College / Undergraduate | 5,396 | 15.4% |
| Graduate / Professional | 1,564 | 4.5% |
| Total | 34,958 | 100.0% |
School Enrollment by Age by Funding Source in Rockford
Out of a total of 34,958 students who are enrolled in schools in Rockford, 6,118 (17.5%) attend a private institution, while the remaining 28,840 (82.5%) are enrolled in public schools. The age group of 25 to 34 year olds has the highest likelihood of being enrolled in private schools, with 654 (32.5% in the age bracket) enrolled. Conversely, the age group of 10 to 14 year olds has the lowest likelihood of being enrolled in a private school, with 8,786 (87.2% in the age bracket) attending a public institution.
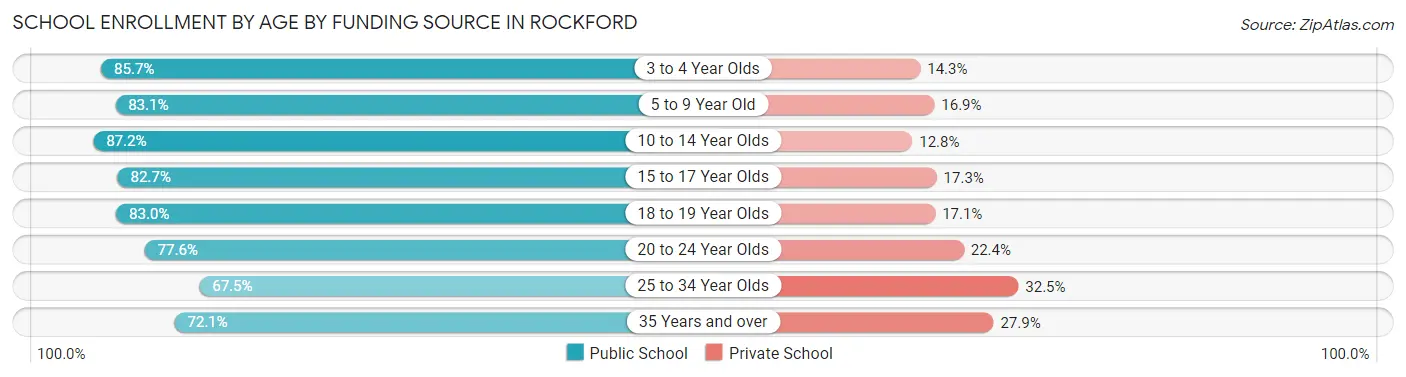
| Age Bracket | Public School | Private School |
| 3 to 4 Year Olds | 1,790 (85.7%) | 298 (14.3%) |
| 5 to 9 Year Old | 7,352 (83.1%) | 1,494 (16.9%) |
| 10 to 14 Year Olds | 8,786 (87.2%) | 1,289 (12.8%) |
| 15 to 17 Year Olds | 4,631 (82.7%) | 970 (17.3%) |
| 18 to 19 Year Olds | 1,571 (83.0%) | 323 (17.1%) |
| 20 to 24 Year Olds | 2,117 (77.6%) | 610 (22.4%) |
| 25 to 34 Year Olds | 1,356 (67.5%) | 654 (32.5%) |
| 35 Years and over | 1,238 (72.1%) | 479 (27.9%) |
| Total | 28,840 (82.5%) | 6,118 (17.5%) |
Educational Attainment by Field of Study in Rockford
Business (4,096 | 16.5%), education (3,915 | 15.8%), science & technology (2,890 | 11.6%), engineering (1,833 | 7.4%), and liberal arts & history (1,755 | 7.1%) are the most common fields of study among 24,840 individuals in Rockford who have obtained a bachelor's degree or higher.
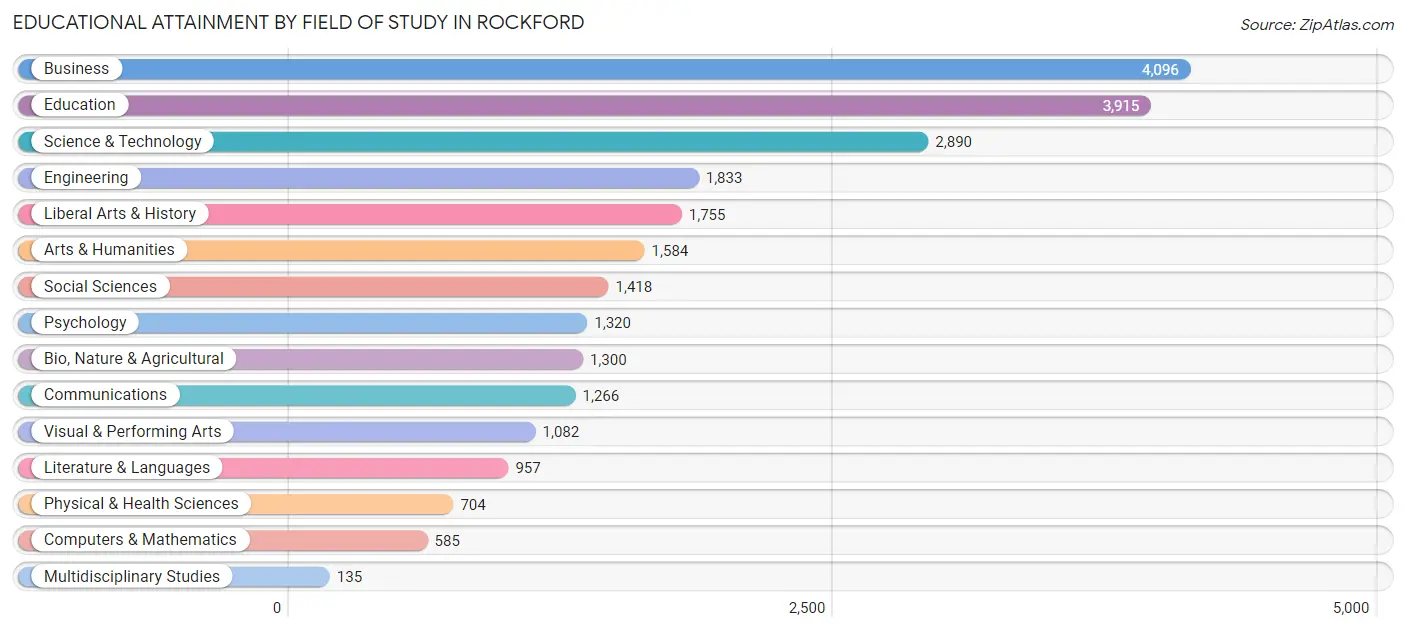
| Field of Study | # Graduates | % Graduates |
| Computers & Mathematics | 585 | 2.4% |
| Bio, Nature & Agricultural | 1,300 | 5.2% |
| Physical & Health Sciences | 704 | 2.8% |
| Psychology | 1,320 | 5.3% |
| Social Sciences | 1,418 | 5.7% |
| Engineering | 1,833 | 7.4% |
| Multidisciplinary Studies | 135 | 0.5% |
| Science & Technology | 2,890 | 11.6% |
| Business | 4,096 | 16.5% |
| Education | 3,915 | 15.8% |
| Literature & Languages | 957 | 3.8% |
| Liberal Arts & History | 1,755 | 7.1% |
| Visual & Performing Arts | 1,082 | 4.4% |
| Communications | 1,266 | 5.1% |
| Arts & Humanities | 1,584 | 6.4% |
| Total | 24,840 | 100.0% |
Transportation & Commute in Rockford
Vehicle Availability by Sex in Rockford
The most prevalent vehicle ownership categories in Rockford are males with 2 vehicles (12,995, accounting for 41.2%) and females with 2 vehicles (11,294, making up 43.4%).
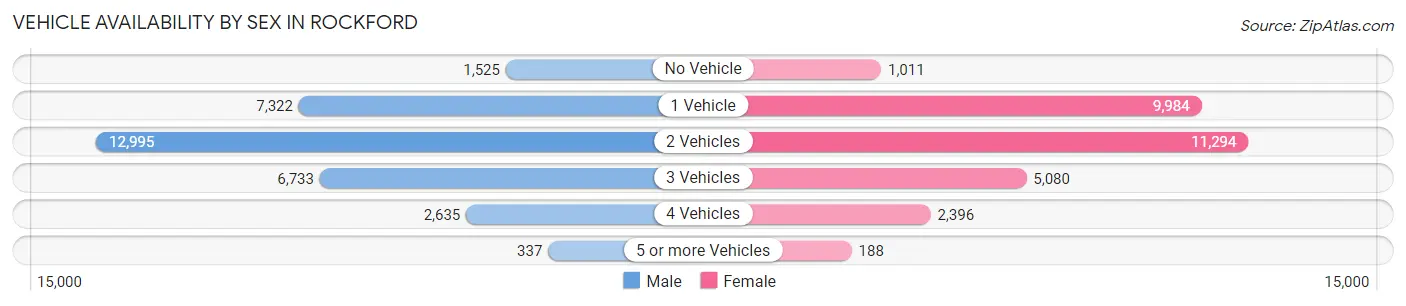
| Vehicles Available | Male | Female |
| No Vehicle | 1,525 (4.8%) | 1,011 (3.4%) |
| 1 Vehicle | 7,322 (23.2%) | 9,984 (33.3%) |
| 2 Vehicles | 12,995 (41.2%) | 11,294 (37.7%) |
| 3 Vehicles | 6,733 (21.3%) | 5,080 (17.0%) |
| 4 Vehicles | 2,635 (8.4%) | 2,396 (8.0%) |
| 5 or more Vehicles | 337 (1.1%) | 188 (0.6%) |
| Total | 31,547 (100.0%) | 29,953 (100.0%) |
Commute Time in Rockford
The most frequently occuring commute durations in Rockford are 10 to 14 minutes (12,415 commuters, 21.6%), 15 to 19 minutes (12,283 commuters, 21.4%), and 20 to 24 minutes (8,972 commuters, 15.6%).
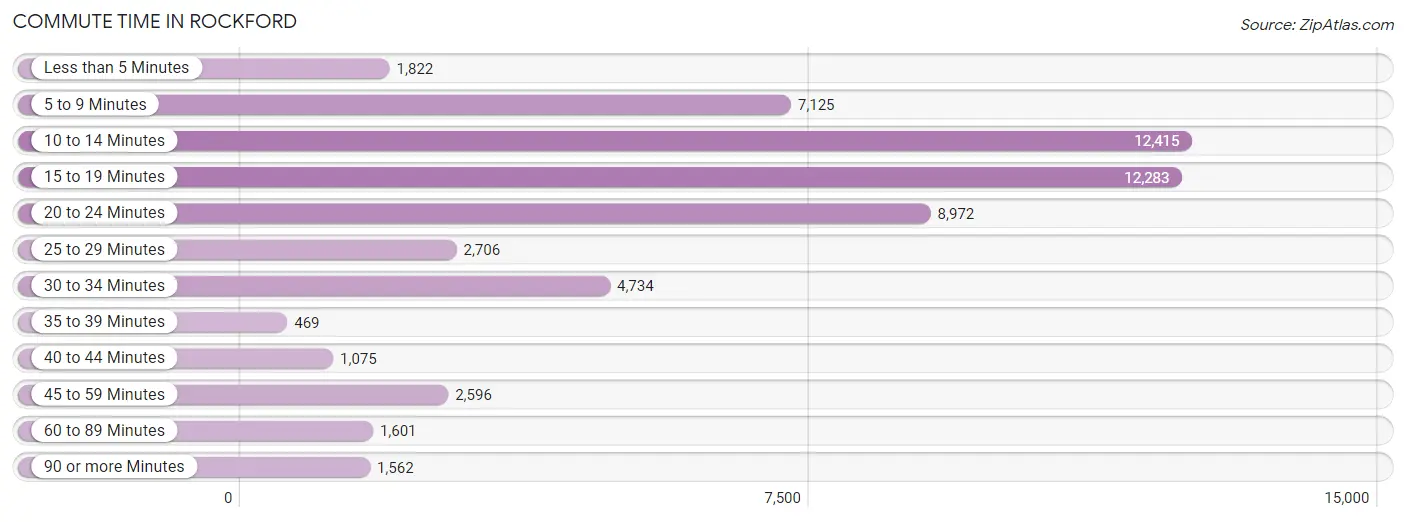
| Commute Time | # Commuters | % Commuters |
| Less than 5 Minutes | 1,822 | 3.2% |
| 5 to 9 Minutes | 7,125 | 12.4% |
| 10 to 14 Minutes | 12,415 | 21.6% |
| 15 to 19 Minutes | 12,283 | 21.4% |
| 20 to 24 Minutes | 8,972 | 15.6% |
| 25 to 29 Minutes | 2,706 | 4.7% |
| 30 to 34 Minutes | 4,734 | 8.3% |
| 35 to 39 Minutes | 469 | 0.8% |
| 40 to 44 Minutes | 1,075 | 1.9% |
| 45 to 59 Minutes | 2,596 | 4.5% |
| 60 to 89 Minutes | 1,601 | 2.8% |
| 90 or more Minutes | 1,562 | 2.7% |
Commute Time by Sex in Rockford
The most common commute times in Rockford are 10 to 14 minutes (6,548 commuters, 21.8%) for males and 15 to 19 minutes (6,225 commuters, 22.8%) for females.
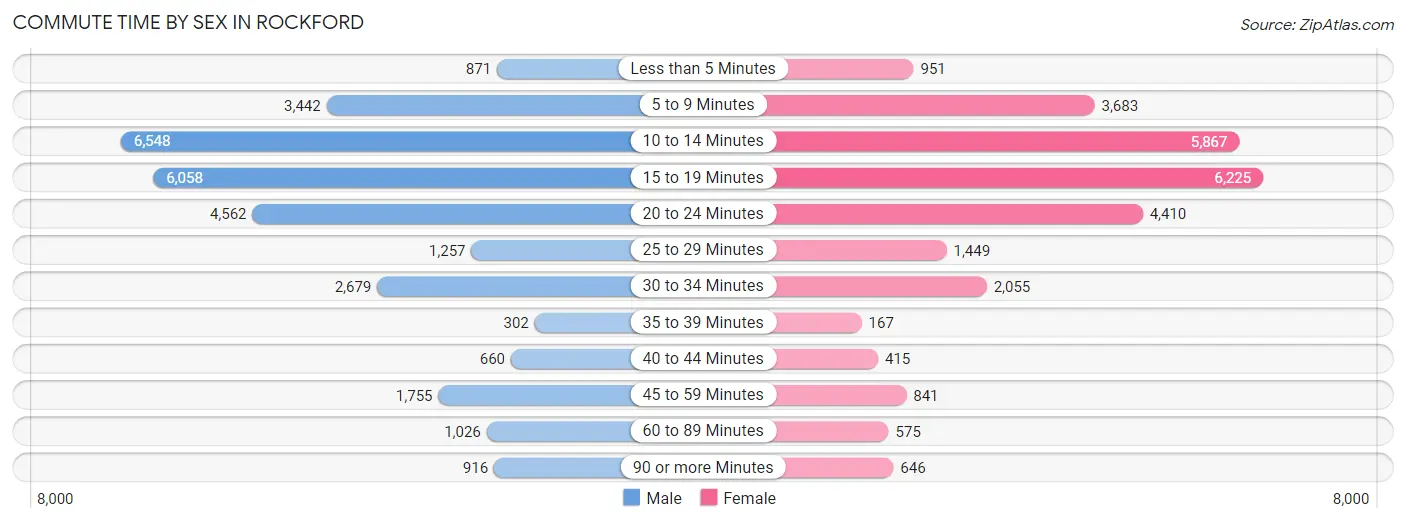
| Commute Time | Male | Female |
| Less than 5 Minutes | 871 (2.9%) | 951 (3.5%) |
| 5 to 9 Minutes | 3,442 (11.4%) | 3,683 (13.5%) |
| 10 to 14 Minutes | 6,548 (21.8%) | 5,867 (21.5%) |
| 15 to 19 Minutes | 6,058 (20.1%) | 6,225 (22.8%) |
| 20 to 24 Minutes | 4,562 (15.2%) | 4,410 (16.2%) |
| 25 to 29 Minutes | 1,257 (4.2%) | 1,449 (5.3%) |
| 30 to 34 Minutes | 2,679 (8.9%) | 2,055 (7.5%) |
| 35 to 39 Minutes | 302 (1.0%) | 167 (0.6%) |
| 40 to 44 Minutes | 660 (2.2%) | 415 (1.5%) |
| 45 to 59 Minutes | 1,755 (5.8%) | 841 (3.1%) |
| 60 to 89 Minutes | 1,026 (3.4%) | 575 (2.1%) |
| 90 or more Minutes | 916 (3.0%) | 646 (2.4%) |
Time of Departure to Work by Sex in Rockford
The most frequent times of departure to work in Rockford are 12:00 PM to 3:59 PM (3,474, 11.6%) for males and 4:00 PM to 11:59 PM (3,529, 12.9%) for females.
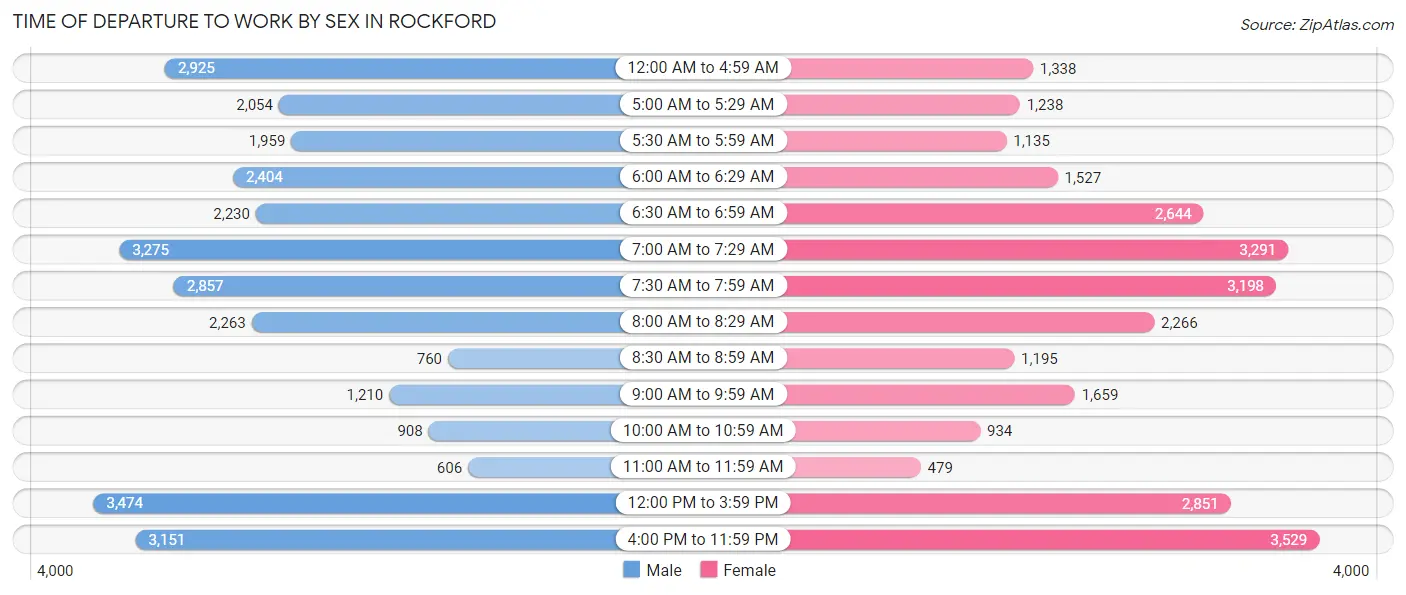
| Time of Departure | Male | Female |
| 12:00 AM to 4:59 AM | 2,925 (9.7%) | 1,338 (4.9%) |
| 5:00 AM to 5:29 AM | 2,054 (6.8%) | 1,238 (4.5%) |
| 5:30 AM to 5:59 AM | 1,959 (6.5%) | 1,135 (4.2%) |
| 6:00 AM to 6:29 AM | 2,404 (8.0%) | 1,527 (5.6%) |
| 6:30 AM to 6:59 AM | 2,230 (7.4%) | 2,644 (9.7%) |
| 7:00 AM to 7:29 AM | 3,275 (10.9%) | 3,291 (12.1%) |
| 7:30 AM to 7:59 AM | 2,857 (9.5%) | 3,198 (11.7%) |
| 8:00 AM to 8:29 AM | 2,263 (7.5%) | 2,266 (8.3%) |
| 8:30 AM to 8:59 AM | 760 (2.5%) | 1,195 (4.4%) |
| 9:00 AM to 9:59 AM | 1,210 (4.0%) | 1,659 (6.1%) |
| 10:00 AM to 10:59 AM | 908 (3.0%) | 934 (3.4%) |
| 11:00 AM to 11:59 AM | 606 (2.0%) | 479 (1.8%) |
| 12:00 PM to 3:59 PM | 3,474 (11.6%) | 2,851 (10.4%) |
| 4:00 PM to 11:59 PM | 3,151 (10.5%) | 3,529 (12.9%) |
| Total | 30,076 (100.0%) | 27,284 (100.0%) |
Housing Occupancy in Rockford
Occupancy by Ownership in Rockford
Of the total 61,242 dwellings in Rockford, owner-occupied units account for 33,141 (54.1%), while renter-occupied units make up 28,101 (45.9%).
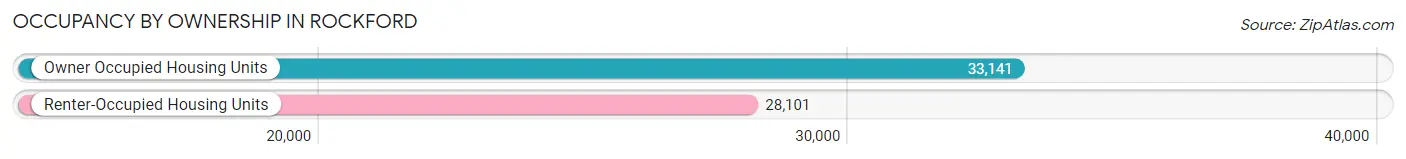
| Occupancy | # Housing Units | % Housing Units |
| Owner Occupied Housing Units | 33,141 | 54.1% |
| Renter-Occupied Housing Units | 28,101 | 45.9% |
| Total Occupied Housing Units | 61,242 | 100.0% |
Occupancy by Household Size in Rockford
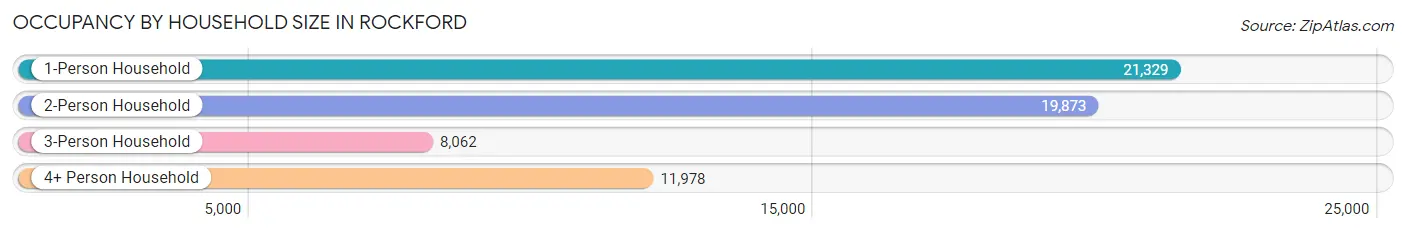
| Household Size | # Housing Units | % Housing Units |
| 1-Person Household | 21,329 | 34.8% |
| 2-Person Household | 19,873 | 32.5% |
| 3-Person Household | 8,062 | 13.2% |
| 4+ Person Household | 11,978 | 19.6% |
| Total Housing Units | 61,242 | 100.0% |
Occupancy by Ownership by Household Size in Rockford
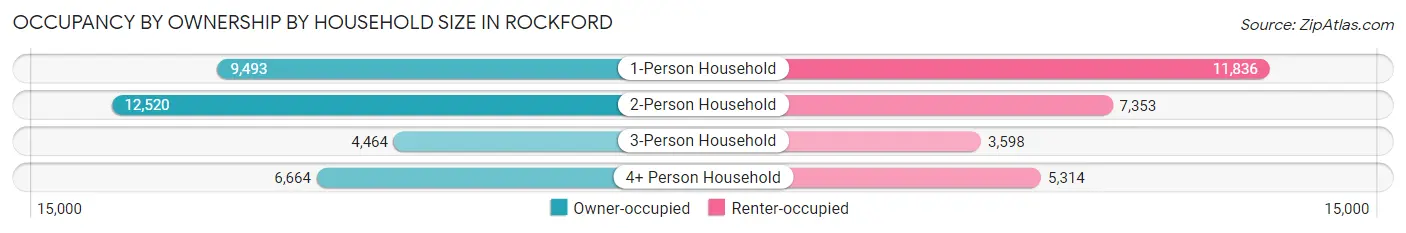
| Household Size | Owner-occupied | Renter-occupied |
| 1-Person Household | 9,493 (44.5%) | 11,836 (55.5%) |
| 2-Person Household | 12,520 (63.0%) | 7,353 (37.0%) |
| 3-Person Household | 4,464 (55.4%) | 3,598 (44.6%) |
| 4+ Person Household | 6,664 (55.6%) | 5,314 (44.4%) |
| Total Housing Units | 33,141 (54.1%) | 28,101 (45.9%) |
Occupancy by Educational Attainment in Rockford
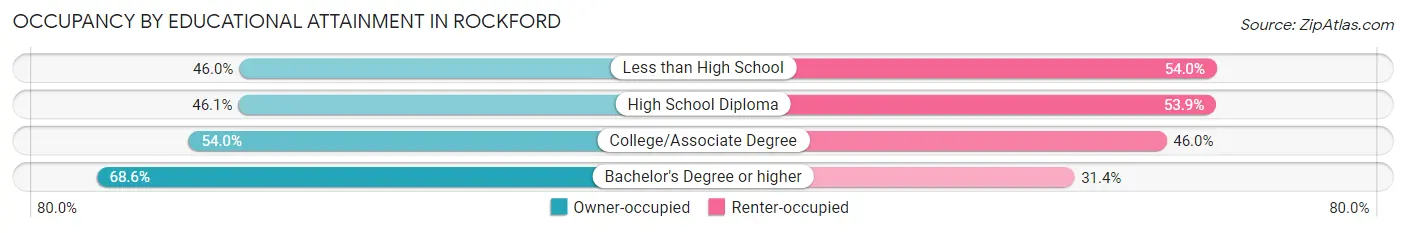
| Household Size | Owner-occupied | Renter-occupied |
| Less than High School | 3,897 (46.0%) | 4,581 (54.0%) |
| High School Diploma | 8,058 (46.1%) | 9,420 (53.9%) |
| College/Associate Degree | 11,156 (54.0%) | 9,507 (46.0%) |
| Bachelor's Degree or higher | 10,030 (68.6%) | 4,593 (31.4%) |
Occupancy by Age of Householder in Rockford
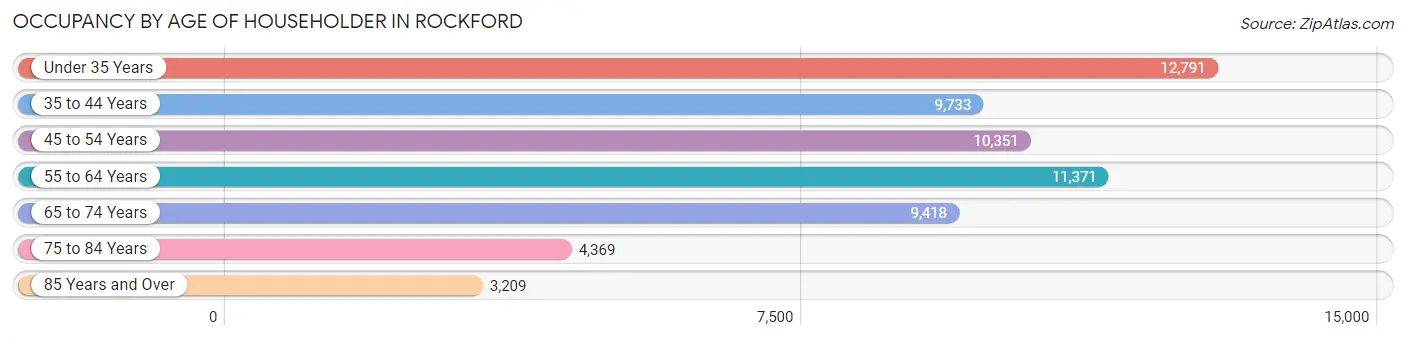
| Age Bracket | # Households | % Households |
| Under 35 Years | 12,791 | 20.9% |
| 35 to 44 Years | 9,733 | 15.9% |
| 45 to 54 Years | 10,351 | 16.9% |
| 55 to 64 Years | 11,371 | 18.6% |
| 65 to 74 Years | 9,418 | 15.4% |
| 75 to 84 Years | 4,369 | 7.1% |
| 85 Years and Over | 3,209 | 5.2% |
| Total | 61,242 | 100.0% |
Housing Finances in Rockford
Median Income by Occupancy in Rockford
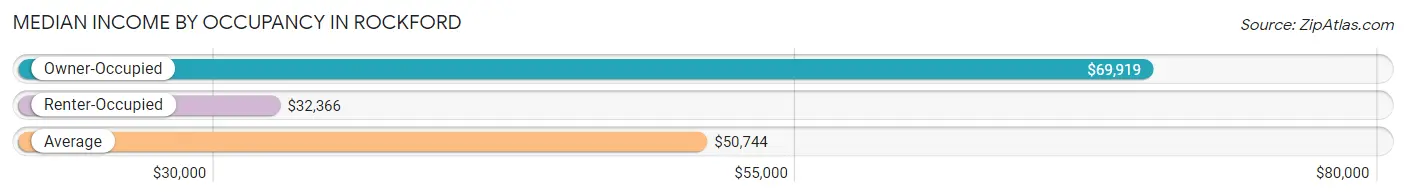
| Occupancy Type | # Households | Median Income |
| Owner-Occupied | 33,141 (54.1%) | $69,919 |
| Renter-Occupied | 28,101 (45.9%) | $32,366 |
| Average | 61,242 (100.0%) | $50,744 |
Occupancy by Householder Income Bracket in Rockford
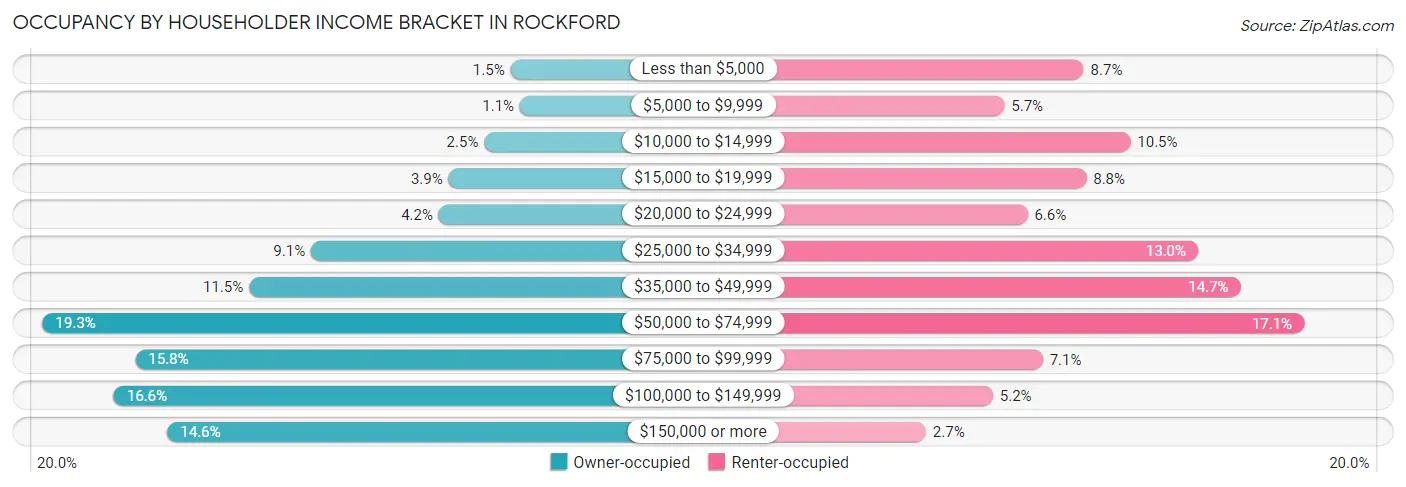
| Income Bracket | Owner-occupied | Renter-occupied |
| Less than $5,000 | 495 (1.5%) | 2,442 (8.7%) |
| $5,000 to $9,999 | 374 (1.1%) | 1,593 (5.7%) |
| $10,000 to $14,999 | 826 (2.5%) | 2,941 (10.5%) |
| $15,000 to $19,999 | 1,276 (3.8%) | 2,470 (8.8%) |
| $20,000 to $24,999 | 1,400 (4.2%) | 1,841 (6.6%) |
| $25,000 to $34,999 | 3,013 (9.1%) | 3,665 (13.0%) |
| $35,000 to $49,999 | 3,796 (11.5%) | 4,119 (14.7%) |
| $50,000 to $74,999 | 6,403 (19.3%) | 4,801 (17.1%) |
| $75,000 to $99,999 | 5,231 (15.8%) | 2,005 (7.1%) |
| $100,000 to $149,999 | 5,503 (16.6%) | 1,470 (5.2%) |
| $150,000 or more | 4,824 (14.6%) | 754 (2.7%) |
| Total | 33,141 (100.0%) | 28,101 (100.0%) |
Monthly Housing Cost Tiers in Rockford
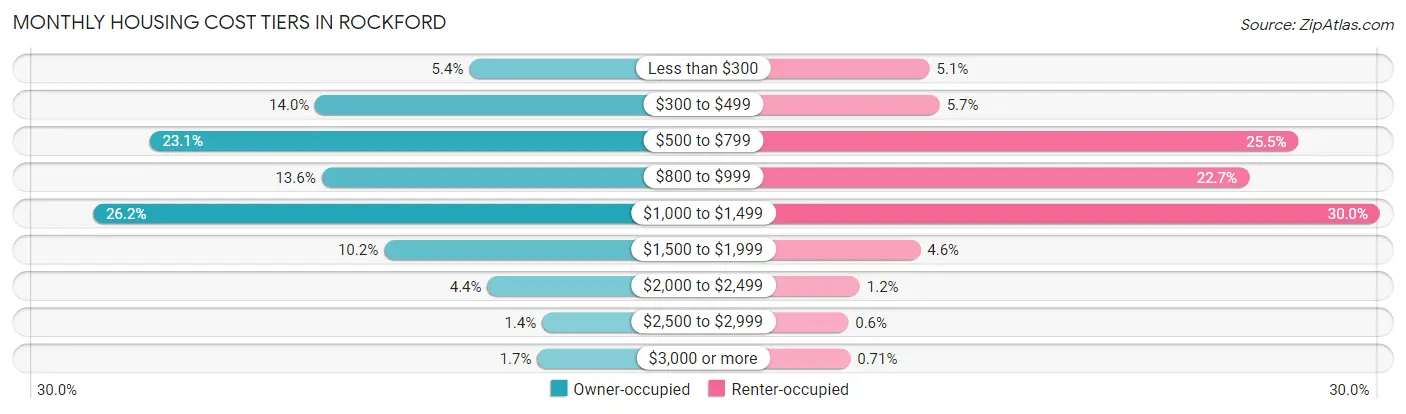
| Monthly Cost | Owner-occupied | Renter-occupied |
| Less than $300 | 1,803 (5.4%) | 1,429 (5.1%) |
| $300 to $499 | 4,623 (14.0%) | 1,589 (5.7%) |
| $500 to $799 | 7,656 (23.1%) | 7,155 (25.5%) |
| $800 to $999 | 4,508 (13.6%) | 6,384 (22.7%) |
| $1,000 to $1,499 | 8,691 (26.2%) | 8,418 (30.0%) |
| $1,500 to $1,999 | 3,364 (10.2%) | 1,287 (4.6%) |
| $2,000 to $2,499 | 1,470 (4.4%) | 348 (1.2%) |
| $2,500 to $2,999 | 469 (1.4%) | 168 (0.6%) |
| $3,000 or more | 557 (1.7%) | 200 (0.7%) |
| Total | 33,141 (100.0%) | 28,101 (100.0%) |
Physical Housing Characteristics in Rockford
Housing Structures in Rockford
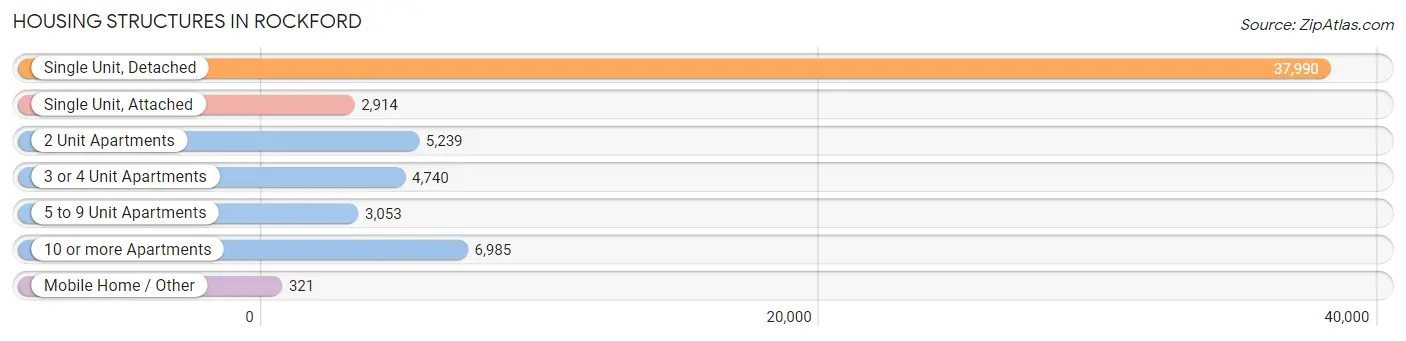
| Structure Type | # Housing Units | % Housing Units |
| Single Unit, Detached | 37,990 | 62.0% |
| Single Unit, Attached | 2,914 | 4.8% |
| 2 Unit Apartments | 5,239 | 8.6% |
| 3 or 4 Unit Apartments | 4,740 | 7.7% |
| 5 to 9 Unit Apartments | 3,053 | 5.0% |
| 10 or more Apartments | 6,985 | 11.4% |
| Mobile Home / Other | 321 | 0.5% |
| Total | 61,242 | 100.0% |
Housing Structures by Occupancy in Rockford
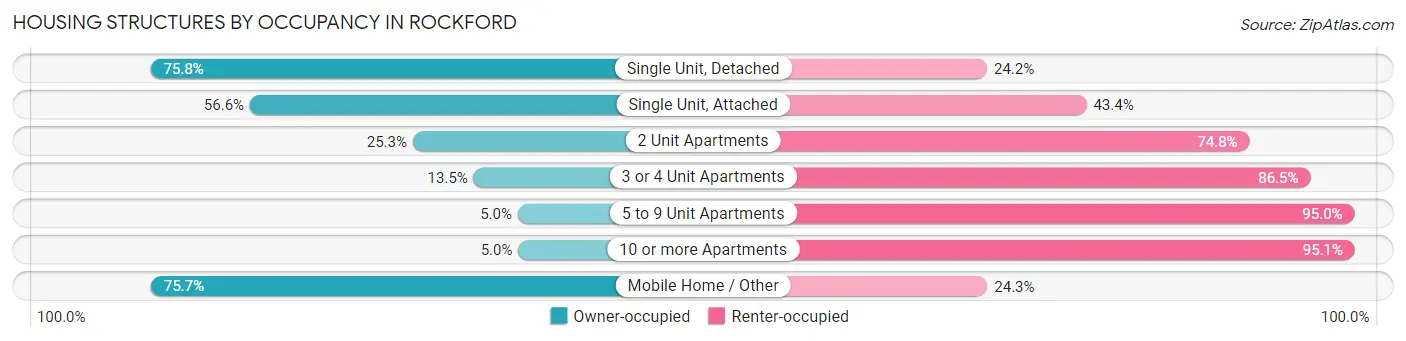
| Structure Type | Owner-occupied | Renter-occupied |
| Single Unit, Detached | 28,783 (75.8%) | 9,207 (24.2%) |
| Single Unit, Attached | 1,650 (56.6%) | 1,264 (43.4%) |
| 2 Unit Apartments | 1,323 (25.3%) | 3,916 (74.8%) |
| 3 or 4 Unit Apartments | 642 (13.5%) | 4,098 (86.5%) |
| 5 to 9 Unit Apartments | 154 (5.0%) | 2,899 (95.0%) |
| 10 or more Apartments | 346 (5.0%) | 6,639 (95.1%) |
| Mobile Home / Other | 243 (75.7%) | 78 (24.3%) |
| Total | 33,141 (54.1%) | 28,101 (45.9%) |
Housing Structures by Number of Rooms in Rockford
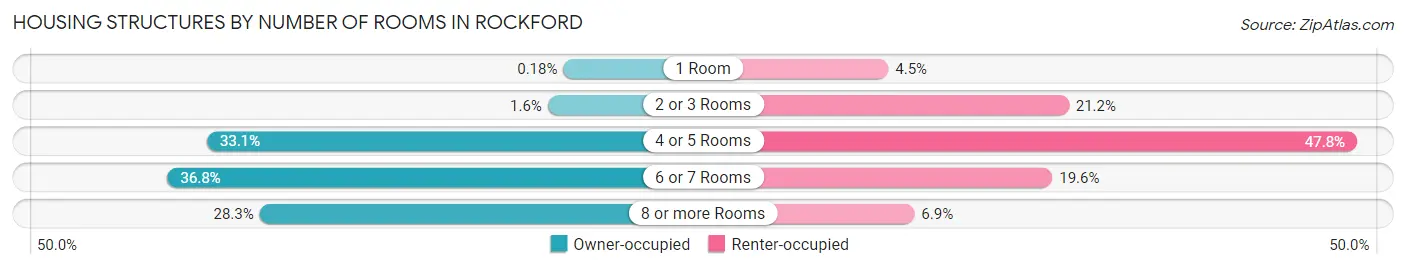
| Number of Rooms | Owner-occupied | Renter-occupied |
| 1 Room | 58 (0.2%) | 1,260 (4.5%) |
| 2 or 3 Rooms | 537 (1.6%) | 5,950 (21.2%) |
| 4 or 5 Rooms | 10,984 (33.1%) | 13,434 (47.8%) |
| 6 or 7 Rooms | 12,192 (36.8%) | 5,520 (19.6%) |
| 8 or more Rooms | 9,370 (28.3%) | 1,937 (6.9%) |
| Total | 33,141 (100.0%) | 28,101 (100.0%) |
Housing Structure by Heating Type in Rockford
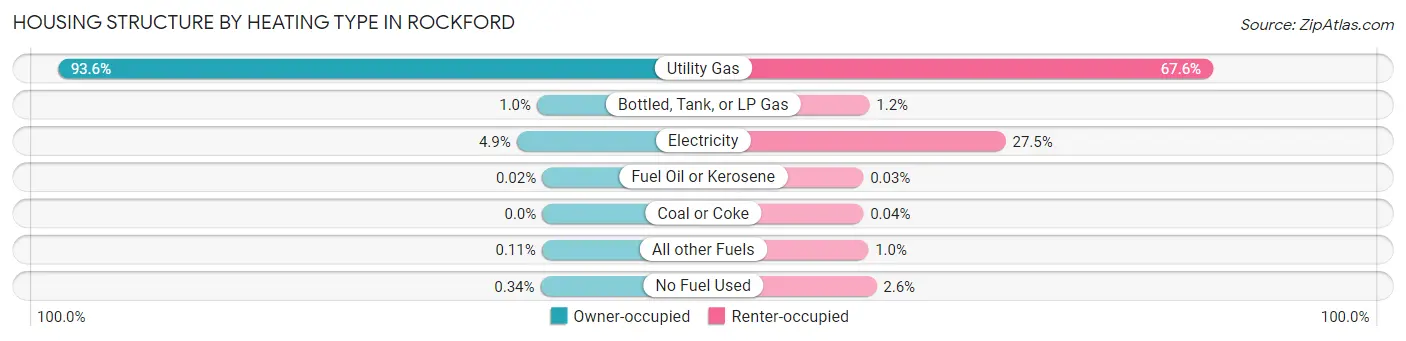
| Heating Type | Owner-occupied | Renter-occupied |
| Utility Gas | 31,016 (93.6%) | 18,997 (67.6%) |
| Bottled, Tank, or LP Gas | 335 (1.0%) | 343 (1.2%) |
| Electricity | 1,633 (4.9%) | 7,737 (27.5%) |
| Fuel Oil or Kerosene | 7 (0.0%) | 9 (0.0%) |
| Coal or Coke | 0 (0.0%) | 12 (0.0%) |
| All other Fuels | 36 (0.1%) | 282 (1.0%) |
| No Fuel Used | 114 (0.3%) | 721 (2.6%) |
| Total | 33,141 (100.0%) | 28,101 (100.0%) |
Household Vehicle Usage in Rockford
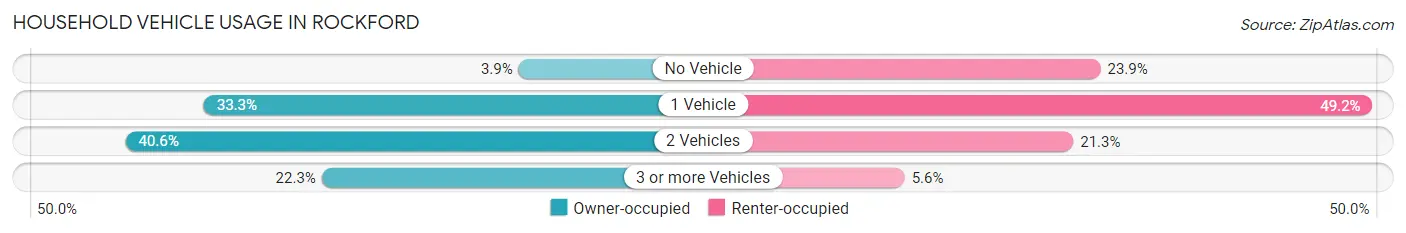
| Vehicles per Household | Owner-occupied | Renter-occupied |
| No Vehicle | 1,288 (3.9%) | 6,705 (23.9%) |
| 1 Vehicle | 11,025 (33.3%) | 13,838 (49.2%) |
| 2 Vehicles | 13,448 (40.6%) | 5,990 (21.3%) |
| 3 or more Vehicles | 7,380 (22.3%) | 1,568 (5.6%) |
| Total | 33,141 (100.0%) | 28,101 (100.0%) |
Real Estate & Mortgages in Rockford
Real Estate and Mortgage Overview in Rockford
| Characteristic | Without Mortgage | With Mortgage |
| Housing Units | 14,112 | 19,029 |
| Median Property Value | $106,600 | $119,600 |
| Median Household Income | $58,582 | $3,029 |
| Monthly Housing Costs | $540 | $536 |
| Real Estate Taxes | $2,697 | $314 |
Property Value by Mortgage Status in Rockford
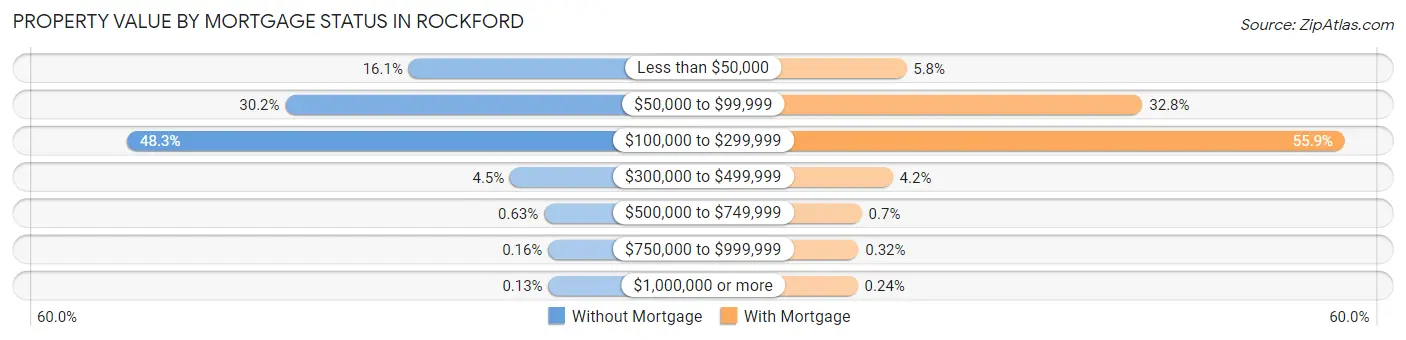
| Property Value | Without Mortgage | With Mortgage |
| Less than $50,000 | 2,272 (16.1%) | 1,104 (5.8%) |
| $50,000 to $99,999 | 4,262 (30.2%) | 6,238 (32.8%) |
| $100,000 to $299,999 | 6,813 (48.3%) | 10,641 (55.9%) |
| $300,000 to $499,999 | 636 (4.5%) | 806 (4.2%) |
| $500,000 to $749,999 | 89 (0.6%) | 134 (0.7%) |
| $750,000 to $999,999 | 22 (0.2%) | 60 (0.3%) |
| $1,000,000 or more | 18 (0.1%) | 46 (0.2%) |
| Total | 14,112 (100.0%) | 19,029 (100.0%) |
Household Income by Mortgage Status in Rockford
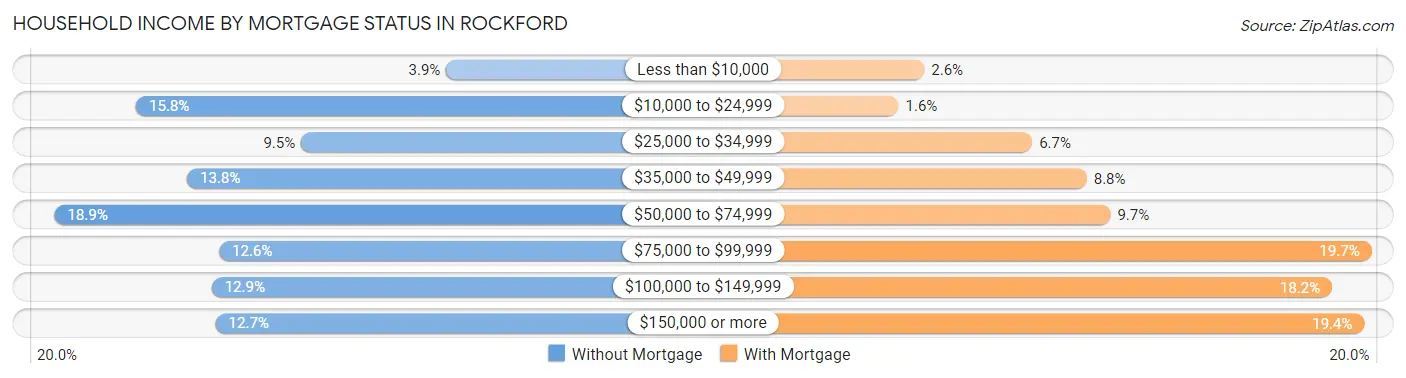
| Household Income | Without Mortgage | With Mortgage |
| Less than $10,000 | 556 (3.9%) | 499 (2.6%) |
| $10,000 to $24,999 | 2,222 (15.8%) | 313 (1.6%) |
| $25,000 to $34,999 | 1,336 (9.5%) | 1,280 (6.7%) |
| $35,000 to $49,999 | 1,949 (13.8%) | 1,677 (8.8%) |
| $50,000 to $74,999 | 2,661 (18.9%) | 1,847 (9.7%) |
| $75,000 to $99,999 | 1,777 (12.6%) | 3,742 (19.7%) |
| $100,000 to $149,999 | 1,816 (12.9%) | 3,454 (18.1%) |
| $150,000 or more | 1,795 (12.7%) | 3,687 (19.4%) |
| Total | 14,112 (100.0%) | 19,029 (100.0%) |
Property Value to Household Income Ratio in Rockford
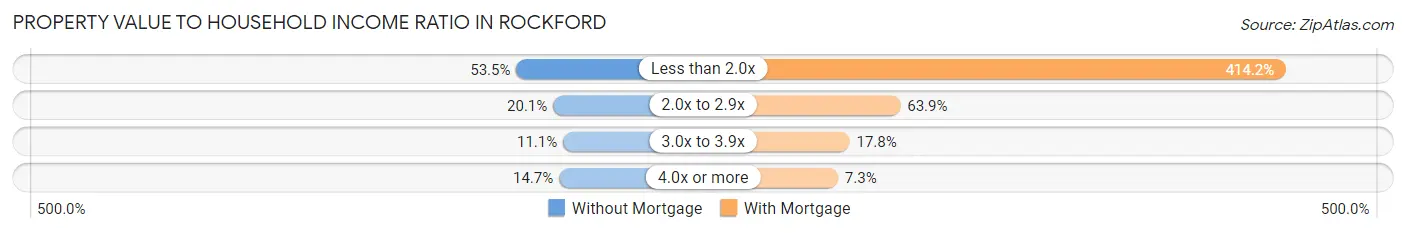
| Value-to-Income Ratio | Without Mortgage | With Mortgage |
| Less than 2.0x | 7,555 (53.5%) | 78,821 (414.2%) |
| 2.0x to 2.9x | 2,838 (20.1%) | 12,160 (63.9%) |
| 3.0x to 3.9x | 1,565 (11.1%) | 3,387 (17.8%) |
| 4.0x or more | 2,070 (14.7%) | 1,384 (7.3%) |
| Total | 14,112 (100.0%) | 19,029 (100.0%) |
Real Estate Taxes by Mortgage Status in Rockford
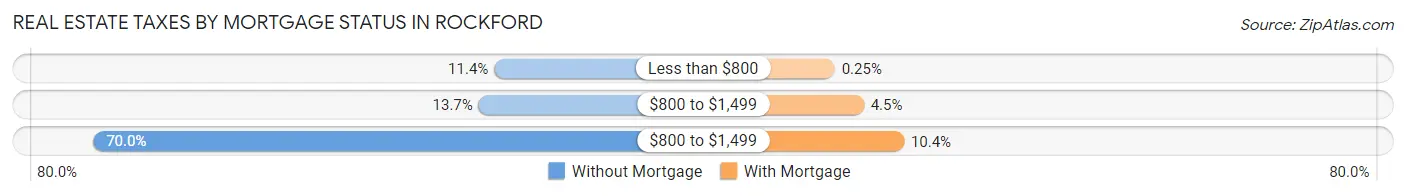
| Property Taxes | Without Mortgage | With Mortgage |
| Less than $800 | 1,608 (11.4%) | 47 (0.3%) |
| $800 to $1,499 | 1,927 (13.7%) | 852 (4.5%) |
| $800 to $1,499 | 9,874 (70.0%) | 1,971 (10.4%) |
| Total | 14,112 (100.0%) | 19,029 (100.0%) |
Health & Disability in Rockford
Health Insurance Coverage by Age in Rockford
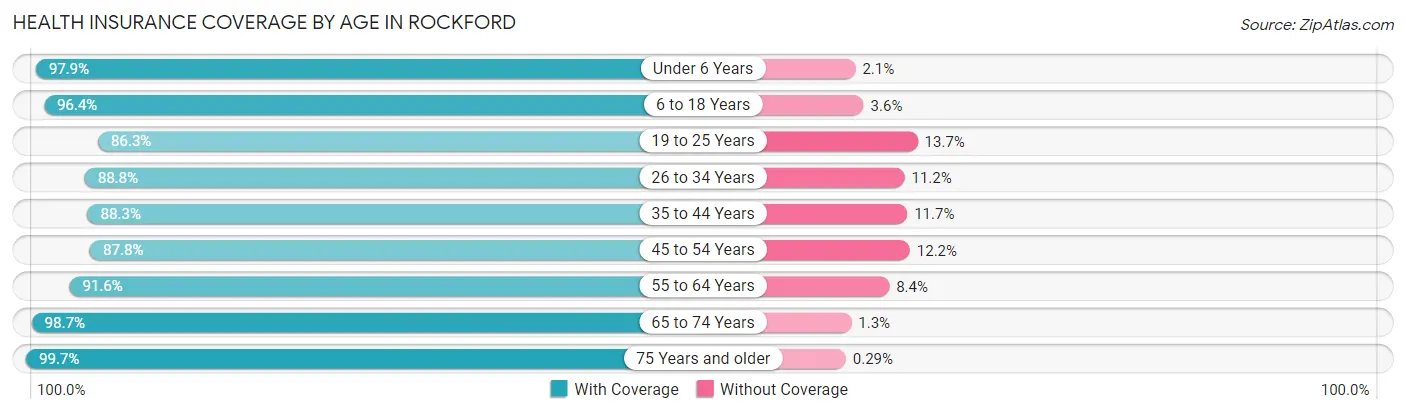
| Age Bracket | With Coverage | Without Coverage |
| Under 6 Years | 11,734 (97.9%) | 251 (2.1%) |
| 6 to 18 Years | 24,884 (96.4%) | 933 (3.6%) |
| 19 to 25 Years | 11,177 (86.3%) | 1,771 (13.7%) |
| 26 to 34 Years | 16,009 (88.8%) | 2,025 (11.2%) |
| 35 to 44 Years | 15,172 (88.3%) | 2,018 (11.7%) |
| 45 to 54 Years | 15,042 (87.8%) | 2,096 (12.2%) |
| 55 to 64 Years | 16,402 (91.6%) | 1,499 (8.4%) |
| 65 to 74 Years | 13,736 (98.7%) | 184 (1.3%) |
| 75 Years and older | 10,609 (99.7%) | 31 (0.3%) |
| Total | 134,765 (92.6%) | 10,808 (7.4%) |
Health Insurance Coverage by Citizenship Status in Rockford
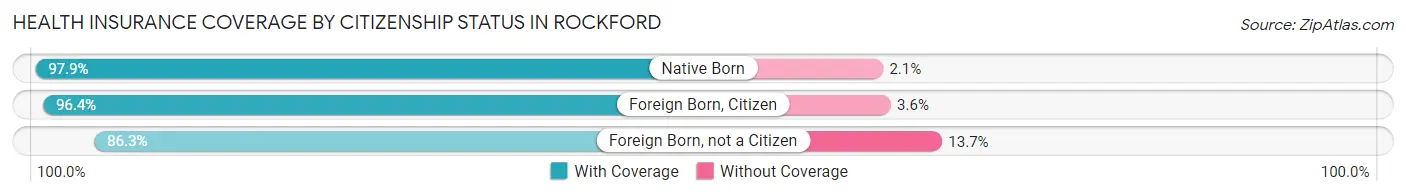
| Citizenship Status | With Coverage | Without Coverage |
| Native Born | 11,734 (97.9%) | 251 (2.1%) |
| Foreign Born, Citizen | 24,884 (96.4%) | 933 (3.6%) |
| Foreign Born, not a Citizen | 11,177 (86.3%) | 1,771 (13.7%) |
Health Insurance Coverage by Household Income in Rockford
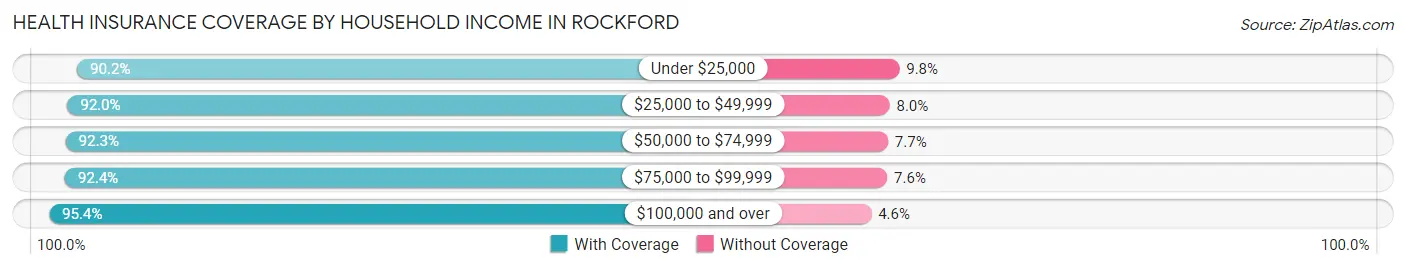
| Household Income | With Coverage | Without Coverage |
| Under $25,000 | 26,554 (90.2%) | 2,896 (9.8%) |
| $25,000 to $49,999 | 28,849 (92.0%) | 2,512 (8.0%) |
| $50,000 to $74,999 | 25,930 (92.3%) | 2,163 (7.7%) |
| $75,000 to $99,999 | 17,384 (92.4%) | 1,421 (7.6%) |
| $100,000 and over | 35,107 (95.4%) | 1,686 (4.6%) |
Public vs Private Health Insurance Coverage by Age in Rockford
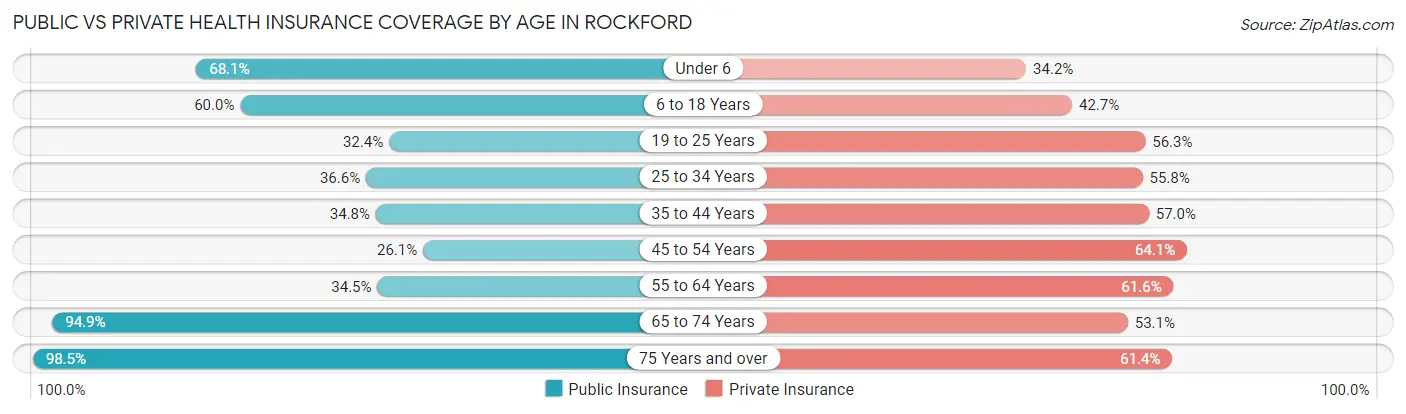
| Age Bracket | Public Insurance | Private Insurance |
| Under 6 | 8,164 (68.1%) | 4,101 (34.2%) |
| 6 to 18 Years | 15,486 (60.0%) | 11,033 (42.7%) |
| 19 to 25 Years | 4,191 (32.4%) | 7,295 (56.3%) |
| 25 to 34 Years | 6,605 (36.6%) | 10,067 (55.8%) |
| 35 to 44 Years | 5,982 (34.8%) | 9,795 (57.0%) |
| 45 to 54 Years | 4,464 (26.1%) | 10,983 (64.1%) |
| 55 to 64 Years | 6,180 (34.5%) | 11,019 (61.6%) |
| 65 to 74 Years | 13,203 (94.9%) | 7,390 (53.1%) |
| 75 Years and over | 10,478 (98.5%) | 6,528 (61.4%) |
| Total | 74,753 (51.3%) | 78,211 (53.7%) |
Disability Status by Sex by Age in Rockford
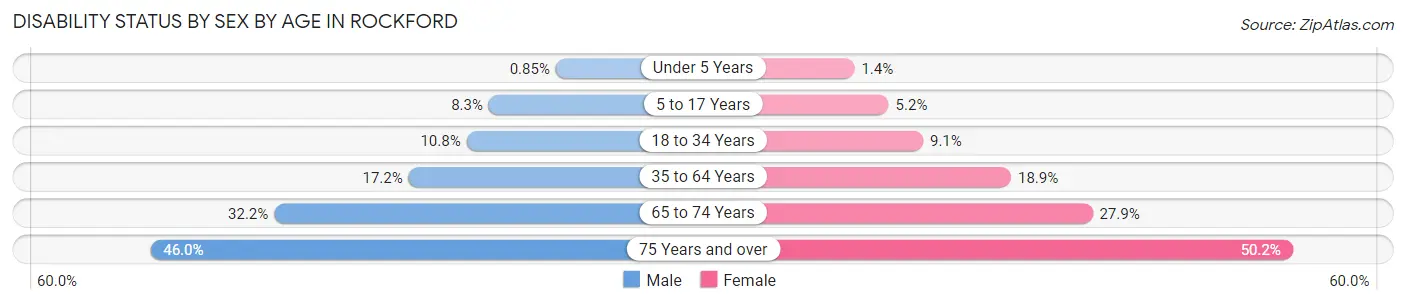
| Age Bracket | Male | Female |
| Under 5 Years | 43 (0.9%) | 68 (1.4%) |
| 5 to 17 Years | 1,147 (8.3%) | 654 (5.2%) |
| 18 to 34 Years | 1,701 (10.8%) | 1,520 (9.0%) |
| 35 to 64 Years | 4,371 (17.2%) | 5,067 (18.9%) |
| 65 to 74 Years | 2,130 (32.2%) | 2,040 (27.9%) |
| 75 Years and over | 1,983 (46.0%) | 3,178 (50.2%) |
Disability Class by Sex by Age in Rockford
Disability Class: Hearing Difficulty
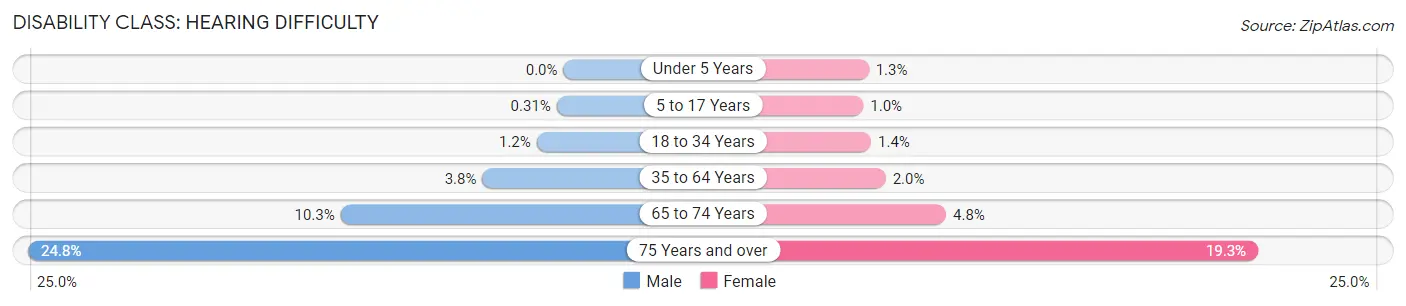
| Age Bracket | Male | Female |
| Under 5 Years | 0 (0.0%) | 60 (1.3%) |
| 5 to 17 Years | 43 (0.3%) | 125 (1.0%) |
| 18 to 34 Years | 195 (1.2%) | 228 (1.4%) |
| 35 to 64 Years | 954 (3.8%) | 549 (2.0%) |
| 65 to 74 Years | 684 (10.3%) | 354 (4.8%) |
| 75 Years and over | 1,071 (24.8%) | 1,222 (19.3%) |
Disability Class: Vision Difficulty
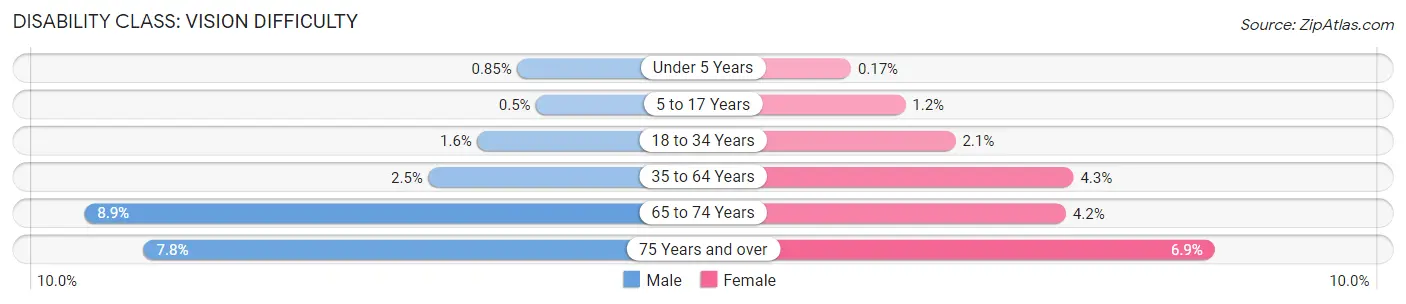
| Age Bracket | Male | Female |
| Under 5 Years | 43 (0.9%) | 8 (0.2%) |
| 5 to 17 Years | 69 (0.5%) | 148 (1.2%) |
| 18 to 34 Years | 250 (1.6%) | 354 (2.1%) |
| 35 to 64 Years | 634 (2.5%) | 1,155 (4.3%) |
| 65 to 74 Years | 588 (8.9%) | 304 (4.2%) |
| 75 Years and over | 336 (7.8%) | 438 (6.9%) |
Disability Class: Cognitive Difficulty
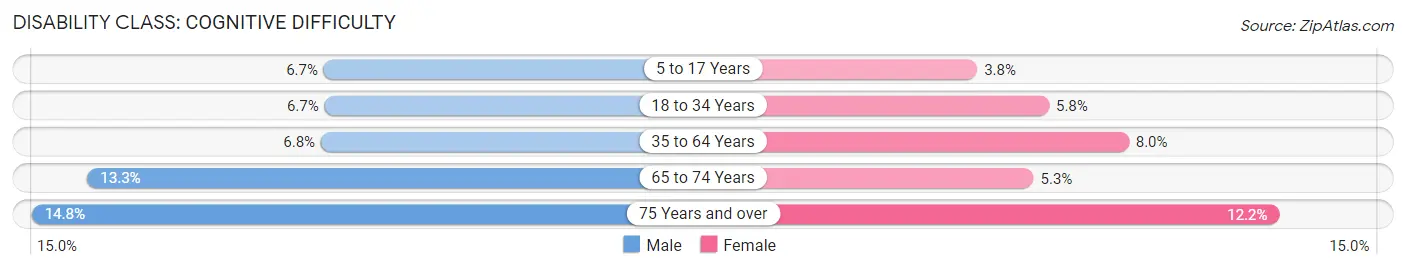
| Age Bracket | Male | Female |
| 5 to 17 Years | 921 (6.7%) | 473 (3.8%) |
| 18 to 34 Years | 1,048 (6.7%) | 969 (5.8%) |
| 35 to 64 Years | 1,710 (6.8%) | 2,148 (8.0%) |
| 65 to 74 Years | 876 (13.3%) | 390 (5.3%) |
| 75 Years and over | 638 (14.8%) | 771 (12.2%) |
Disability Class: Ambulatory Difficulty
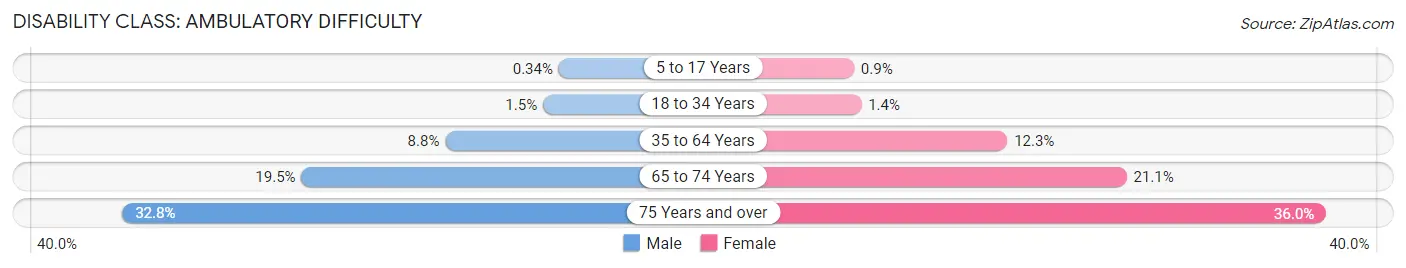
| Age Bracket | Male | Female |
| 5 to 17 Years | 47 (0.3%) | 113 (0.9%) |
| 18 to 34 Years | 238 (1.5%) | 242 (1.4%) |
| 35 to 64 Years | 2,222 (8.8%) | 3,301 (12.3%) |
| 65 to 74 Years | 1,286 (19.5%) | 1,545 (21.1%) |
| 75 Years and over | 1,412 (32.8%) | 2,276 (36.0%) |
Disability Class: Self-Care Difficulty
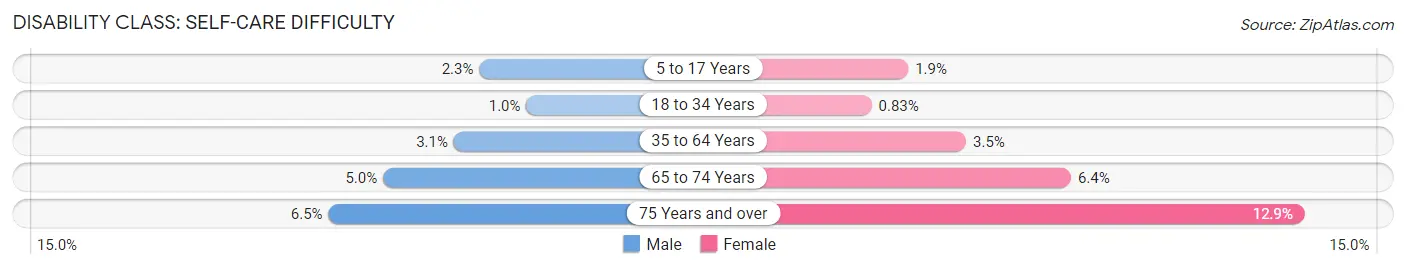
| Age Bracket | Male | Female |
| 5 to 17 Years | 323 (2.3%) | 232 (1.8%) |
| 18 to 34 Years | 162 (1.0%) | 140 (0.8%) |
| 35 to 64 Years | 773 (3.0%) | 929 (3.5%) |
| 65 to 74 Years | 332 (5.0%) | 466 (6.4%) |
| 75 Years and over | 282 (6.5%) | 816 (12.9%) |
Technology Access in Rockford
Computing Device Access in Rockford
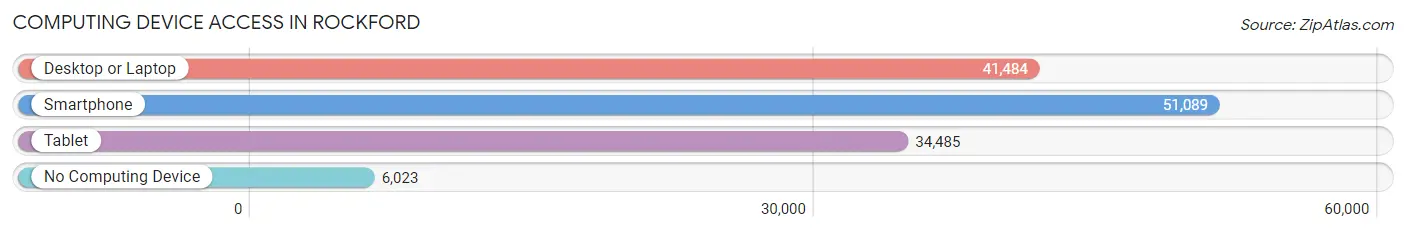
| Device Type | # Households | % Households |
| Desktop or Laptop | 41,484 | 67.7% |
| Smartphone | 51,089 | 83.4% |
| Tablet | 34,485 | 56.3% |
| No Computing Device | 6,023 | 9.8% |
| Total | 61,242 | 100.0% |
Internet Access in Rockford
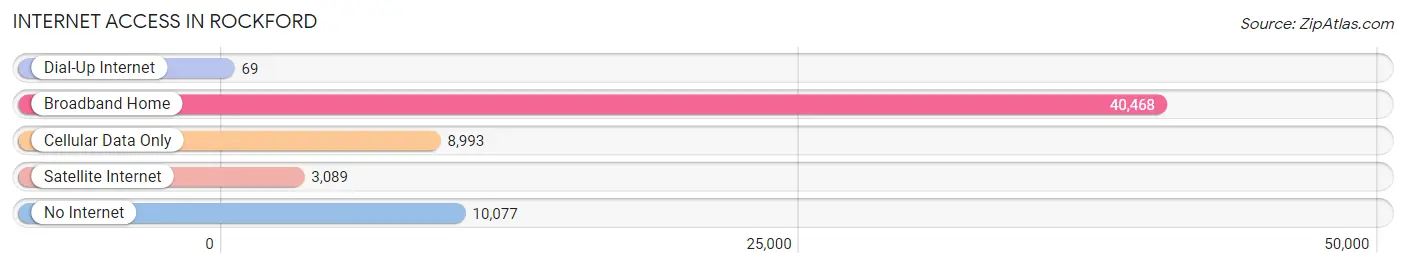
| Internet Type | # Households | % Households |
| Dial-Up Internet | 69 | 0.1% |
| Broadband Home | 40,468 | 66.1% |
| Cellular Data Only | 8,993 | 14.7% |
| Satellite Internet | 3,089 | 5.0% |
| No Internet | 10,077 | 16.5% |
| Total | 61,242 | 100.0% |
Rockford Summary
Rockford, Illinois is a city located in the northern part of the state, in Winnebago County. It is the third-largest city in the state, with a population of 152,871 as of the 2019 census. The city is situated on both banks of the Rock River, and is known for its manufacturing and automotive industries.
History
Rockford was founded in 1834 by New Englanders, and was originally known as Midway. The city was renamed Rockford in 1837, after the nearby Rock River. The city was incorporated in 1852, and was the first city in the state to have a mayor-council form of government.
In the late 19th century, Rockford was a major manufacturing center, producing furniture, tools, and other products. The city was also home to the first automobile factory in the state, the Rockford Automobile Company, which was founded in 1902.
Geography
Rockford is located in northern Illinois, in Winnebago County. The city is situated on both banks of the Rock River, and is surrounded by the cities of Loves Park, Machesney Park, and Rockton. The city has a total area of 37.2 square miles, of which 36.7 square miles is land and 0.5 square miles is water.
Economy
Rockford has a diverse economy, with a mix of manufacturing, healthcare, and service industries. The city is home to several major employers, including Woodward, Inc., Rockford Health System, and the Rockford Public School District.
The city is also home to several automotive companies, including Chrysler, Ford, and General Motors. Rockford is also home to the Rockford International Airport, which serves the city and the surrounding area.
Demographics
As of the 2019 census, Rockford had a population of 152,871. The racial makeup of the city was 79.2% White, 14.2% African American, 0.7% Native American, 2.2% Asian, 0.1% Pacific Islander, 1.7% from other races, and 2.0% from two or more races. Hispanic or Latino of any race were 5.3% of the population.
The median income for a household in the city was $41,945, and the median income for a family was $50,945. The per capita income for the city was $21,845. About 17.2% of the population was below the poverty line.
Rockford is served by several major highways, including Interstate 90, Interstate 39, and U.S. Route 20. The city is also served by the Rockford Mass Transit District, which provides bus service throughout the city.
Common Questions
What is Per Capita Income in Rockford?
Per Capita income in Rockford is $29,187.
What is the Median Family Income in Rockford?
Median Family Income in Rockford is $64,220.
What is the Median Household income in Rockford?
Median Household Income in Rockford is $50,744.
What is Income or Wage Gap in Rockford?
Income or Wage Gap in Rockford is 27.3%.
Women in Rockford earn 72.7 cents for every dollar earned by a man.
What is Family Income Deficit in Rockford?
Family Income Deficit in Rockford is $12,725.
Families that are below poverty line in Rockford earn $12,725 less on average than the poverty threshold level.
What is Inequality or Gini Index in Rockford?
Inequality or Gini Index in Rockford is 0.48.
What is the Total Population of Rockford?
Total Population of Rockford is 148,173.
What is the Total Male Population of Rockford?
Total Male Population of Rockford is 72,282.
What is the Total Female Population of Rockford?
Total Female Population of Rockford is 75,891.
What is the Ratio of Males per 100 Females in Rockford?
There are 95.24 Males per 100 Females in Rockford.
What is the Ratio of Females per 100 Males in Rockford?
There are 104.99 Females per 100 Males in Rockford.
What is the Median Population Age in Rockford?
Median Population Age in Rockford is 37.5 Years.
What is the Average Family Size in Rockford
Average Family Size in Rockford is 3.1 People.
What is the Average Household Size in Rockford
Average Household Size in Rockford is 2.4 People.
How Large is the Labor Force in Rockford?
There are 69,546 People in the Labor Forcein in Rockford.
What is the Percentage of People in the Labor Force in Rockford?
60.0% of People are in the Labor Force in Rockford.
What is the Unemployment Rate in Rockford?
Unemployment Rate in Rockford is 9.0%.