Tinley Park, IL Map & Demographics
Tinley Park Map
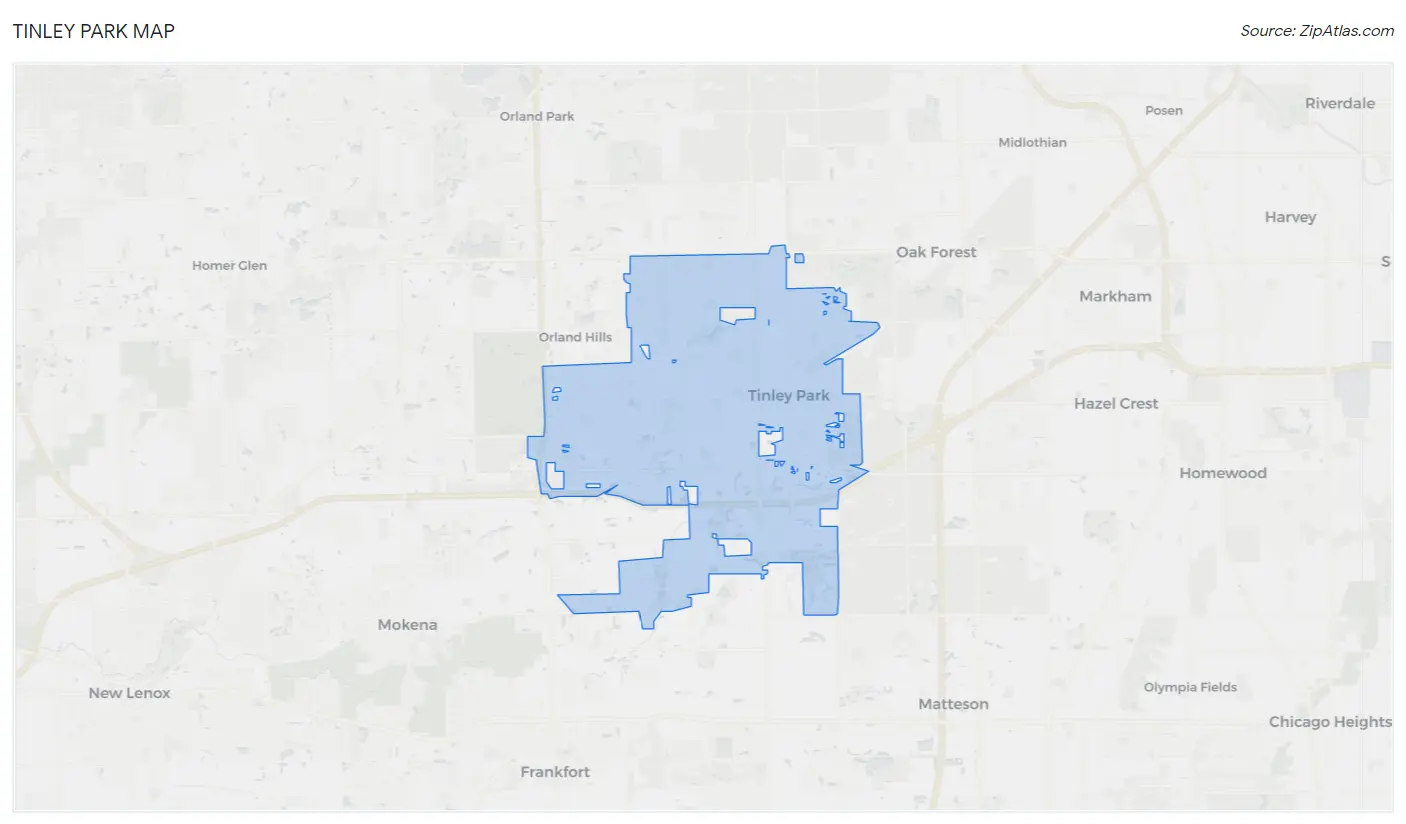
Tinley Park Overview
$49,079
PER CAPITA INCOME
$123,750
AVG FAMILY INCOME
$99,628
AVG HOUSEHOLD INCOME
27.8%
WAGE / INCOME GAP [ % ]
72.2¢/ $1
WAGE / INCOME GAP [ $ ]
$13,982
FAMILY INCOME DEFICIT
0.40
INEQUALITY / GINI INDEX
55,571
TOTAL POPULATION
27,702
MALE POPULATION
27,869
FEMALE POPULATION
99.40
MALES / 100 FEMALES
100.60
FEMALES / 100 MALES
41.6
MEDIAN AGE
3.1
AVG FAMILY SIZE
2.5
AVG HOUSEHOLD SIZE
30,984
LABOR FORCE [ PEOPLE ]
68.3%
PERCENT IN LABOR FORCE
5.7%
UNEMPLOYMENT RATE
Tinley Park Area Codes
Income in Tinley Park
Income Overview in Tinley Park
Per Capita Income in Tinley Park is $49,079, while median incomes of families and households are $123,750 and $99,628 respectively.
| Characteristic | Number | Measure |
| Per Capita Income | 55,571 | $49,079 |
| Median Family Income | 14,777 | $123,750 |
| Mean Family Income | 14,777 | $138,146 |
| Median Household Income | 21,873 | $99,628 |
| Mean Household Income | 21,873 | $124,179 |
| Income Deficit | 14,777 | $13,982 |
| Wage / Income Gap (%) | 55,571 | 27.77% |
| Wage / Income Gap ($) | 55,571 | 72.23¢ per $1 |
| Gini / Inequality Index | 55,571 | 0.40 |
Earnings by Sex in Tinley Park
Average Earnings in Tinley Park are $55,391, $65,504 for men and $47,313 for women, a difference of 27.8%.
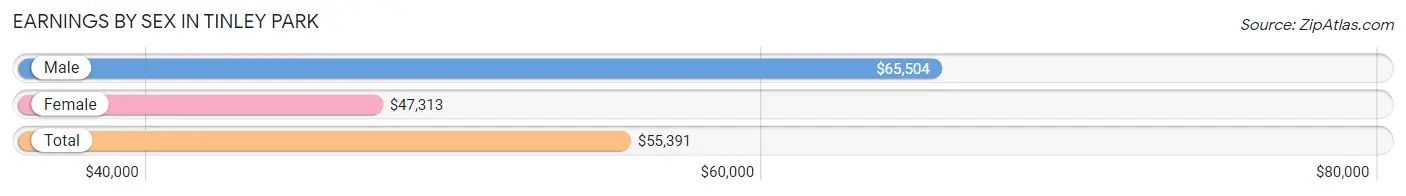
| Sex | Number | Average Earnings |
| Male | 16,880 (53.6%) | $65,504 |
| Female | 14,635 (46.4%) | $47,313 |
| Total | 31,515 (100.0%) | $55,391 |
Earnings by Sex by Income Bracket in Tinley Park
The most common earnings brackets in Tinley Park are $100,000+ for men (4,468 | 26.5%) and $75,000 to $99,999 for women (2,023 | 13.8%).
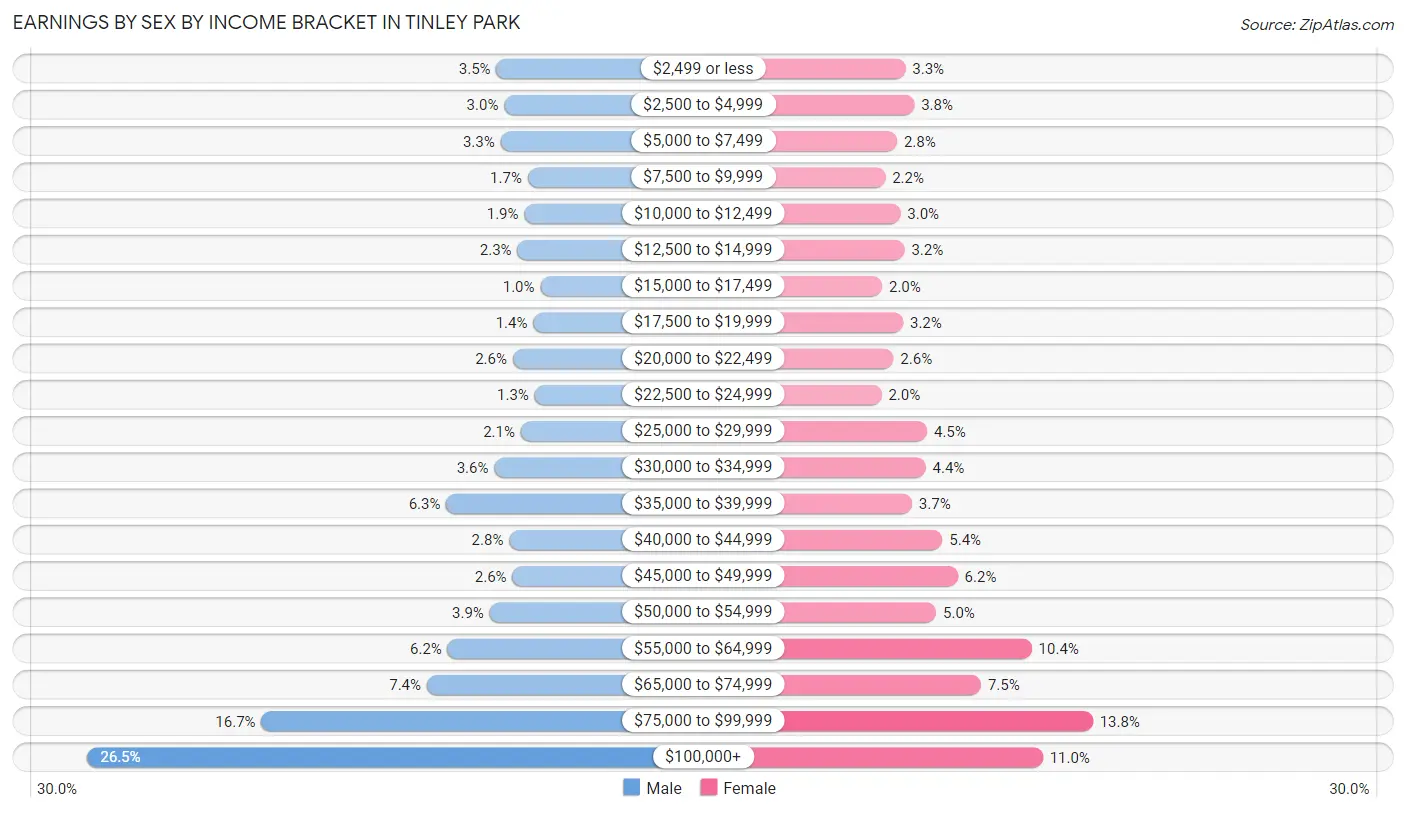
| Income | Male | Female |
| $2,499 or less | 588 (3.5%) | 481 (3.3%) |
| $2,500 to $4,999 | 513 (3.0%) | 555 (3.8%) |
| $5,000 to $7,499 | 549 (3.3%) | 413 (2.8%) |
| $7,500 to $9,999 | 290 (1.7%) | 316 (2.2%) |
| $10,000 to $12,499 | 322 (1.9%) | 441 (3.0%) |
| $12,500 to $14,999 | 389 (2.3%) | 474 (3.2%) |
| $15,000 to $17,499 | 171 (1.0%) | 290 (2.0%) |
| $17,500 to $19,999 | 238 (1.4%) | 463 (3.2%) |
| $20,000 to $22,499 | 432 (2.6%) | 383 (2.6%) |
| $22,500 to $24,999 | 225 (1.3%) | 285 (1.9%) |
| $25,000 to $29,999 | 357 (2.1%) | 660 (4.5%) |
| $30,000 to $34,999 | 608 (3.6%) | 649 (4.4%) |
| $35,000 to $39,999 | 1,063 (6.3%) | 535 (3.7%) |
| $40,000 to $44,999 | 466 (2.8%) | 786 (5.4%) |
| $45,000 to $49,999 | 435 (2.6%) | 912 (6.2%) |
| $50,000 to $54,999 | 652 (3.9%) | 734 (5.0%) |
| $55,000 to $64,999 | 1,050 (6.2%) | 1,520 (10.4%) |
| $65,000 to $74,999 | 1,247 (7.4%) | 1,104 (7.5%) |
| $75,000 to $99,999 | 2,817 (16.7%) | 2,023 (13.8%) |
| $100,000+ | 4,468 (26.5%) | 1,611 (11.0%) |
| Total | 16,880 (100.0%) | 14,635 (100.0%) |
Earnings by Sex by Educational Attainment in Tinley Park
Average earnings in Tinley Park are $75,119 for men and $52,868 for women, a difference of 29.6%. Men with an educational attainment of graduate degree enjoy the highest average annual earnings of $115,177, while those with less than high school education earn the least with $39,884. Women with an educational attainment of graduate degree earn the most with the average annual earnings of $74,254, while those with less than high school education have the smallest earnings of $31,912.
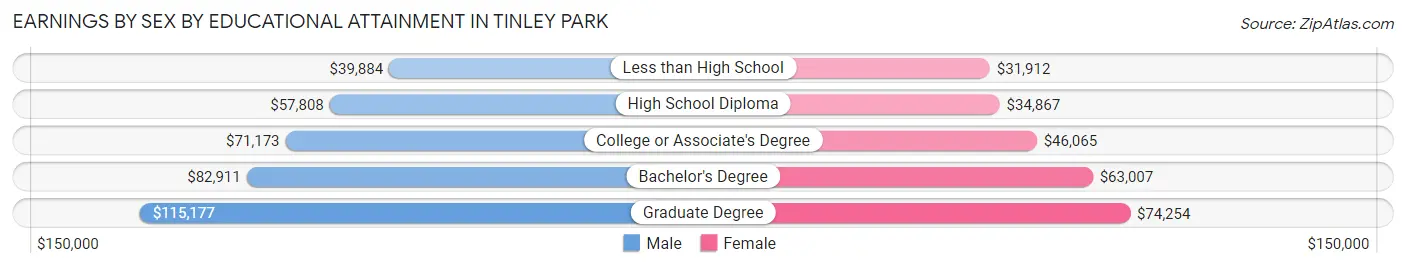
| Educational Attainment | Male Income | Female Income |
| Less than High School | $39,884 | $31,912 |
| High School Diploma | $57,808 | $34,867 |
| College or Associate's Degree | $71,173 | $46,065 |
| Bachelor's Degree | $82,911 | $63,007 |
| Graduate Degree | $115,177 | $74,254 |
| Total | $75,119 | $52,868 |
Family Income in Tinley Park
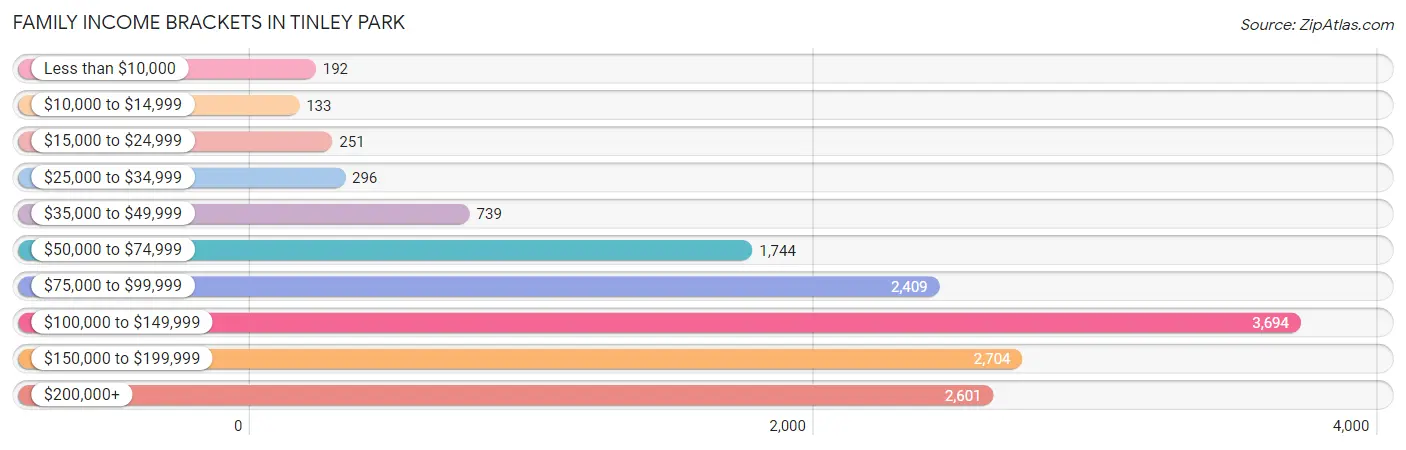
Family Income Brackets in Tinley Park
According to the Tinley Park family income data, there are 3,694 families falling into the $100,000 to $149,999 income range, which is the most common income bracket and makes up 25.0% of all families. Conversely, the $10,000 to $14,999 income bracket is the least frequent group with only 133 families (0.9%) belonging to this category.
| Income Bracket | # Families | % Families |
| Less than $10,000 | 192 | 1.3% |
| $10,000 to $14,999 | 133 | 0.9% |
| $15,000 to $24,999 | 251 | 1.7% |
| $25,000 to $34,999 | 296 | 2.0% |
| $35,000 to $49,999 | 739 | 5.0% |
| $50,000 to $74,999 | 1,744 | 11.8% |
| $75,000 to $99,999 | 2,409 | 16.3% |
| $100,000 to $149,999 | 3,694 | 25.0% |
| $150,000 to $199,999 | 2,704 | 18.3% |
| $200,000+ | 2,601 | 17.6% |
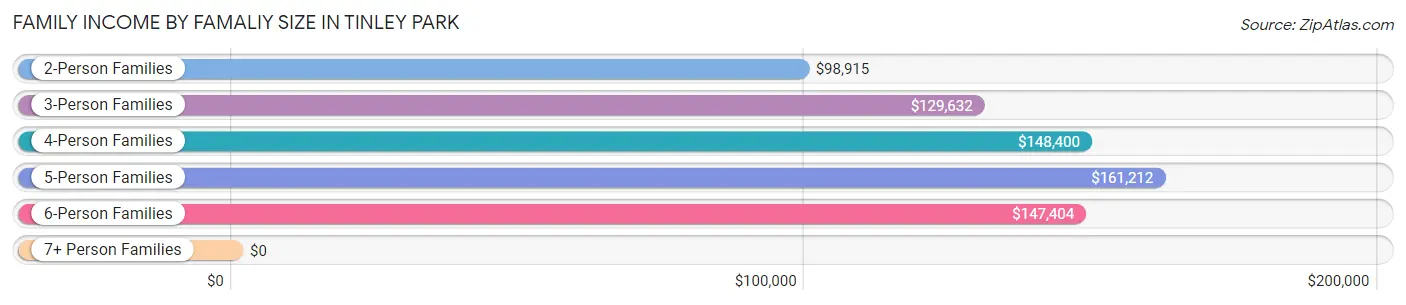
Family Income by Famaliy Size in Tinley Park
5-person families (1,239 | 8.4%) account for the highest median family income in Tinley Park with $161,212 per family, while 2-person families (5,934 | 40.2%) have the highest median income of $49,458 per family member.
| Income Bracket | # Families | Median Income |
| 2-Person Families | 5,934 (40.2%) | $98,915 |
| 3-Person Families | 3,813 (25.8%) | $129,632 |
| 4-Person Families | 3,283 (22.2%) | $148,400 |
| 5-Person Families | 1,239 (8.4%) | $161,212 |
| 6-Person Families | 340 (2.3%) | $147,404 |
| 7+ Person Families | 168 (1.1%) | $0 |
| Total | 14,777 (100.0%) | $123,750 |
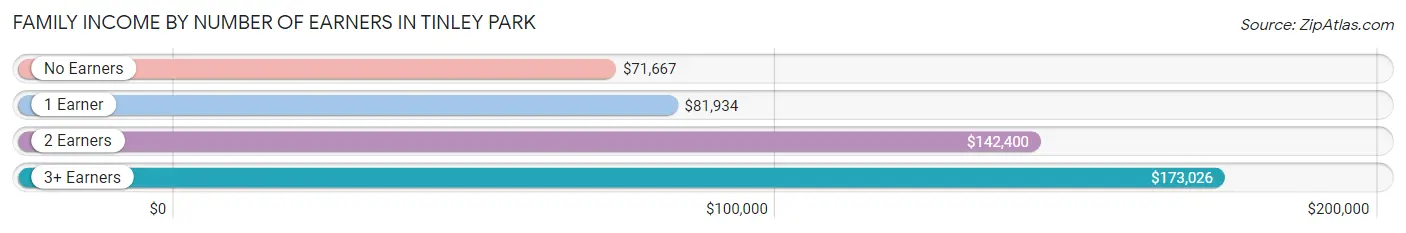
Family Income by Number of Earners in Tinley Park
The median family income in Tinley Park is $123,750, with families comprising 3+ earners (2,843) having the highest median family income of $173,026, while families with no earners (1,992) have the lowest median family income of $71,667, accounting for 19.2% and 13.5% of families, respectively.
| Number of Earners | # Families | Median Income |
| No Earners | 1,992 (13.5%) | $71,667 |
| 1 Earner | 3,473 (23.5%) | $81,934 |
| 2 Earners | 6,469 (43.8%) | $142,400 |
| 3+ Earners | 2,843 (19.2%) | $173,026 |
| Total | 14,777 (100.0%) | $123,750 |
Household Income in Tinley Park
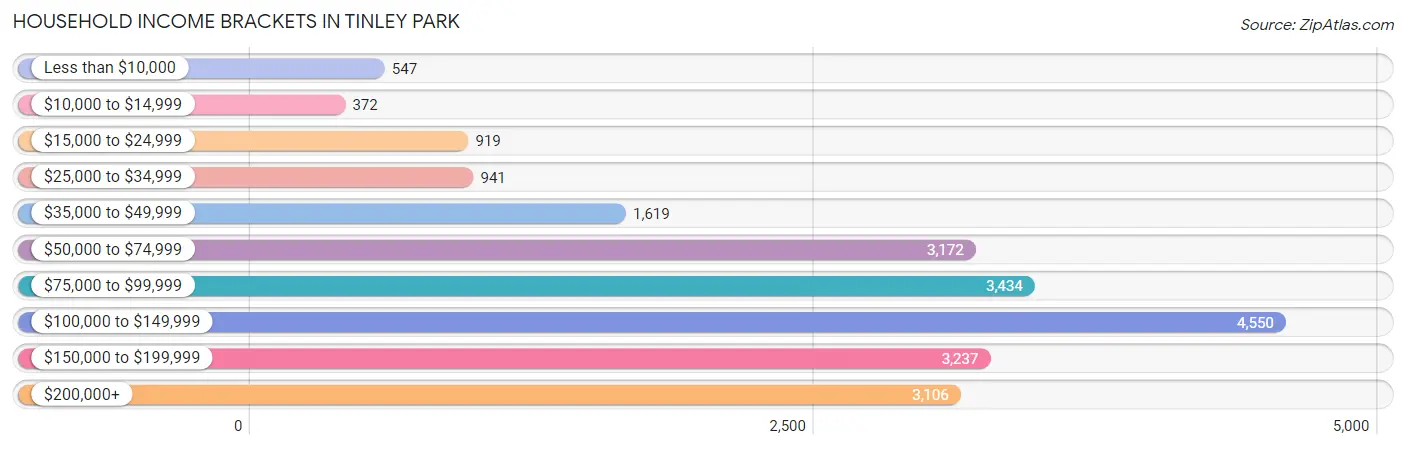
Household Income Brackets in Tinley Park
With 4,550 households falling in the category, the $100,000 to $149,999 income range is the most frequent in Tinley Park, accounting for 20.8% of all households. In contrast, only 372 households (1.7%) fall into the $10,000 to $14,999 income bracket, making it the least populous group.
| Income Bracket | # Households | % Households |
| Less than $10,000 | 547 | 2.5% |
| $10,000 to $14,999 | 372 | 1.7% |
| $15,000 to $24,999 | 919 | 4.2% |
| $25,000 to $34,999 | 941 | 4.3% |
| $35,000 to $49,999 | 1,619 | 7.4% |
| $50,000 to $74,999 | 3,172 | 14.5% |
| $75,000 to $99,999 | 3,434 | 15.7% |
| $100,000 to $149,999 | 4,550 | 20.8% |
| $150,000 to $199,999 | 3,237 | 14.8% |
| $200,000+ | 3,106 | 14.2% |
Household Income by Householder Age in Tinley Park
The median household income in Tinley Park is $99,628, with the highest median household income of $143,468 found in the 45 to 64 years age bracket for the primary householder. A total of 8,614 households (39.4%) fall into this category. Meanwhile, the 15 to 24 years age bracket for the primary householder has the lowest median household income of $0, with 199 households (0.9%) in this group.
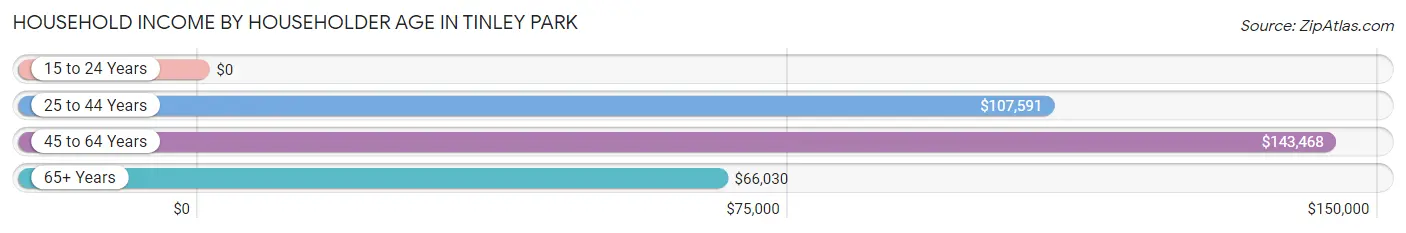
| Income Bracket | # Households | Median Income |
| 15 to 24 Years | 199 (0.9%) | $0 |
| 25 to 44 Years | 6,153 (28.1%) | $107,591 |
| 45 to 64 Years | 8,614 (39.4%) | $143,468 |
| 65+ Years | 6,907 (31.6%) | $66,030 |
| Total | 21,873 (100.0%) | $99,628 |
Poverty in Tinley Park
Income Below Poverty by Sex and Age in Tinley Park
With 4.8% poverty level for males and 5.3% for females among the residents of Tinley Park, 5 year old males and 18 to 24 year old females are the most vulnerable to poverty, with 74 males (23.3%) and 160 females (9.8%) in their respective age groups living below the poverty level.
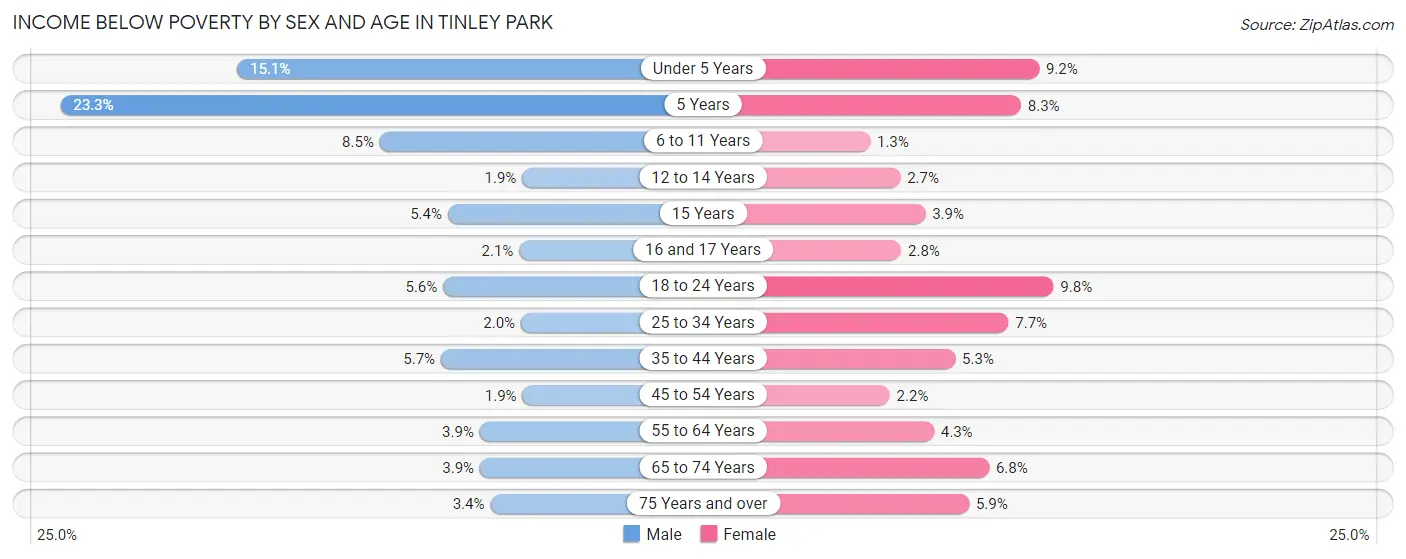
| Age Bracket | Male | Female |
| Under 5 Years | 216 (15.1%) | 120 (9.1%) |
| 5 Years | 74 (23.3%) | 26 (8.3%) |
| 6 to 11 Years | 179 (8.5%) | 24 (1.3%) |
| 12 to 14 Years | 21 (1.9%) | 27 (2.7%) |
| 15 Years | 20 (5.4%) | 14 (3.9%) |
| 16 and 17 Years | 14 (2.1%) | 17 (2.8%) |
| 18 to 24 Years | 140 (5.6%) | 160 (9.8%) |
| 25 to 34 Years | 74 (2.0%) | 260 (7.7%) |
| 35 to 44 Years | 200 (5.7%) | 184 (5.3%) |
| 45 to 54 Years | 62 (1.9%) | 81 (2.2%) |
| 55 to 64 Years | 156 (3.9%) | 183 (4.3%) |
| 65 to 74 Years | 113 (3.9%) | 226 (6.8%) |
| 75 Years and over | 57 (3.4%) | 154 (5.9%) |
| Total | 1,326 (4.8%) | 1,476 (5.3%) |
Income Above Poverty by Sex and Age in Tinley Park
According to the poverty statistics in Tinley Park, males aged 45 to 54 years and females aged 6 to 11 years are the age groups that are most secure financially, with 98.1% of males and 98.7% of females in these age groups living above the poverty line.
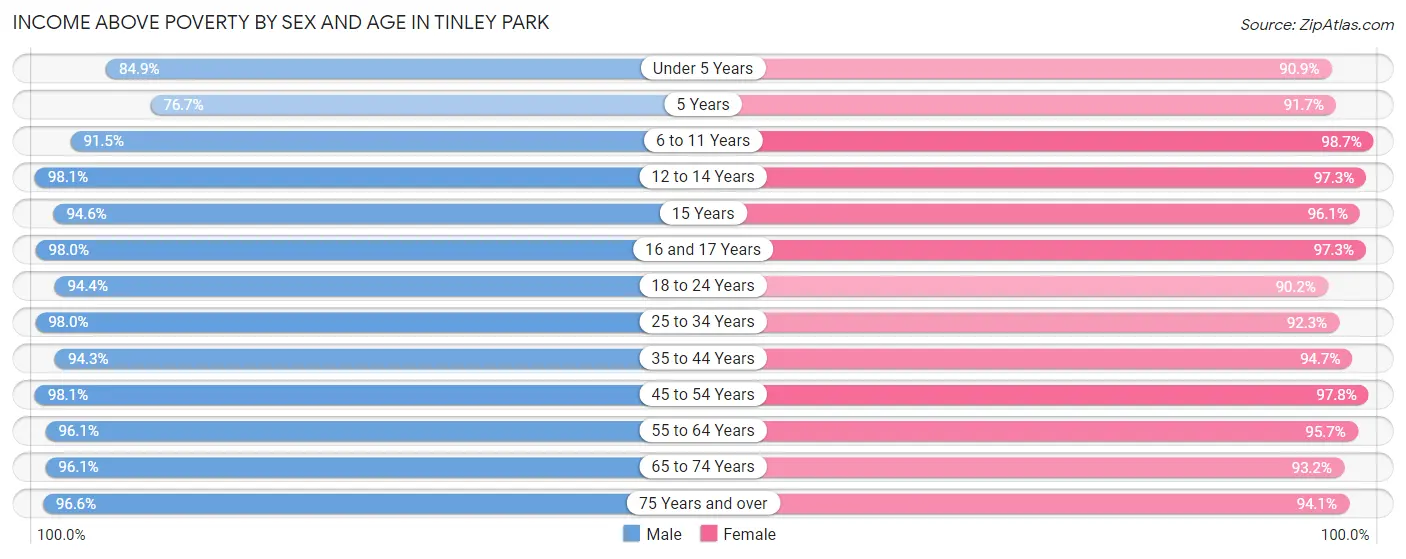
| Age Bracket | Male | Female |
| Under 5 Years | 1,211 (84.9%) | 1,192 (90.8%) |
| 5 Years | 243 (76.7%) | 287 (91.7%) |
| 6 to 11 Years | 1,922 (91.5%) | 1,807 (98.7%) |
| 12 to 14 Years | 1,081 (98.1%) | 971 (97.3%) |
| 15 Years | 353 (94.6%) | 348 (96.1%) |
| 16 and 17 Years | 670 (98.0%) | 601 (97.3%) |
| 18 to 24 Years | 2,369 (94.4%) | 1,469 (90.2%) |
| 25 to 34 Years | 3,688 (98.0%) | 3,104 (92.3%) |
| 35 to 44 Years | 3,323 (94.3%) | 3,316 (94.7%) |
| 45 to 54 Years | 3,203 (98.1%) | 3,574 (97.8%) |
| 55 to 64 Years | 3,868 (96.1%) | 4,106 (95.7%) |
| 65 to 74 Years | 2,806 (96.1%) | 3,083 (93.2%) |
| 75 Years and over | 1,622 (96.6%) | 2,458 (94.1%) |
| Total | 26,359 (95.2%) | 26,316 (94.7%) |
Income Below Poverty Among Married-Couple Families in Tinley Park
The poverty statistics for married-couple families in Tinley Park show that 2.9% or 348 of the total 11,879 families live below the poverty line. Families with 5 or more children have the highest poverty rate of 50.0%, comprising of 20 families. On the other hand, families with no children have the lowest poverty rate of 1.4%, which includes 95 families.
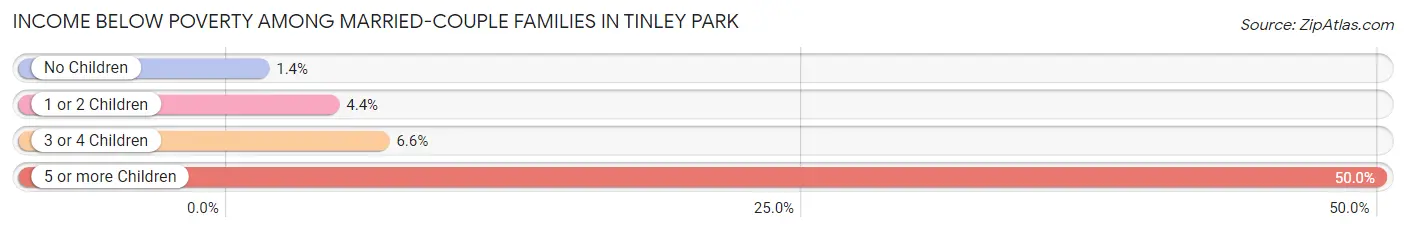
| Children | Above Poverty | Below Poverty |
| No Children | 6,906 (98.6%) | 95 (1.4%) |
| 1 or 2 Children | 3,754 (95.6%) | 173 (4.4%) |
| 3 or 4 Children | 851 (93.4%) | 60 (6.6%) |
| 5 or more Children | 20 (50.0%) | 20 (50.0%) |
| Total | 11,531 (97.1%) | 348 (2.9%) |
Income Below Poverty Among Single-Parent Households in Tinley Park
| Children | Single Father | Single Mother |
| No Children | 0 (0.0%) | 59 (4.7%) |
| 1 or 2 Children | 0 (0.0%) | 72 (10.2%) |
| 3 or 4 Children | 0 (0.0%) | 9 (6.2%) |
| 5 or more Children | 0 (0.0%) | 0 (0.0%) |
| Total | 0 (0.0%) | 140 (6.7%) |
Income Below Poverty Among Married-Couple vs Single-Parent Households in Tinley Park
The poverty data for Tinley Park shows that 348 of the married-couple family households (2.9%) and 140 of the single-parent households (4.8%) are living below the poverty level. Within the married-couple family households, those with 5 or more children have the highest poverty rate, with 20 households (50.0%) falling below the poverty line. Among the single-parent households, those with 1 or 2 children have the highest poverty rate, with 72 household (6.6%) living below poverty.
| Children | Married-Couple Families | Single-Parent Households |
| No Children | 95 (1.4%) | 59 (3.5%) |
| 1 or 2 Children | 173 (4.4%) | 72 (6.6%) |
| 3 or 4 Children | 60 (6.6%) | 9 (6.2%) |
| 5 or more Children | 20 (50.0%) | 0 (0.0%) |
| Total | 348 (2.9%) | 140 (4.8%) |
Race in Tinley Park
The most populous races in Tinley Park are White / Caucasian (44,667 | 80.4%), Hispanic or Latino (6,544 | 11.8%), and Two or more Races (3,752 | 6.8%).
| Race | # Population | % Population |
| Asian | 1,979 | 3.6% |
| Black / African American | 3,379 | 6.1% |
| Hawaiian / Pacific | 0 | 0.0% |
| Hispanic or Latino | 6,544 | 11.8% |
| Native / Alaskan | 19 | 0.0% |
| White / Caucasian | 44,667 | 80.4% |
| Two or more Races | 3,752 | 6.8% |
| Some other Race | 1,775 | 3.2% |
| Total | 55,571 | 100.0% |
Ancestry in Tinley Park
The most populous ancestries reported in Tinley Park are Irish (11,995 | 21.6%), German (9,560 | 17.2%), Polish (9,023 | 16.2%), Italian (5,700 | 10.3%), and Mexican (4,749 | 8.6%), together accounting for 73.8% of all Tinley Park residents.
| Ancestry | # Population | % Population |
| African | 355 | 0.6% |
| Albanian | 9 | 0.0% |
| American | 980 | 1.8% |
| Arab | 3,038 | 5.5% |
| Argentinean | 79 | 0.1% |
| Austrian | 222 | 0.4% |
| Belgian | 10 | 0.0% |
| Bhutanese | 15 | 0.0% |
| Bolivian | 50 | 0.1% |
| British | 125 | 0.2% |
| Burmese | 56 | 0.1% |
| Celtic | 14 | 0.0% |
| Central American | 11 | 0.0% |
| Central American Indian | 20 | 0.0% |
| Cherokee | 33 | 0.1% |
| Chippewa | 22 | 0.0% |
| Colombian | 50 | 0.1% |
| Croatian | 452 | 0.8% |
| Cuban | 77 | 0.1% |
| Czech | 968 | 1.7% |
| Czechoslovakian | 76 | 0.1% |
| Danish | 228 | 0.4% |
| Dominican | 51 | 0.1% |
| Dutch | 1,341 | 2.4% |
| Eastern European | 131 | 0.2% |
| Ecuadorian | 17 | 0.0% |
| Egyptian | 275 | 0.5% |
| English | 2,079 | 3.7% |
| Ethiopian | 32 | 0.1% |
| European | 496 | 0.9% |
| Filipino | 15 | 0.0% |
| French | 983 | 1.8% |
| French American Indian | 4 | 0.0% |
| French Canadian | 199 | 0.4% |
| German | 9,560 | 17.2% |
| Greek | 1,079 | 1.9% |
| Guatemalan | 11 | 0.0% |
| Hungarian | 178 | 0.3% |
| Indian (Asian) | 242 | 0.4% |
| Iranian | 65 | 0.1% |
| Irish | 11,995 | 21.6% |
| Iroquois | 21 | 0.0% |
| Italian | 5,700 | 10.3% |
| Jordanian | 603 | 1.1% |
| Korean | 820 | 1.5% |
| Latvian | 23 | 0.0% |
| Lebanese | 139 | 0.3% |
| Lithuanian | 1,018 | 1.8% |
| Luxembourger | 25 | 0.0% |
| Mexican | 4,749 | 8.6% |
| Mexican American Indian | 78 | 0.1% |
| Moroccan | 117 | 0.2% |
| Nigerian | 38 | 0.1% |
| Norwegian | 582 | 1.1% |
| Ottawa | 7 | 0.0% |
| Pakistani | 89 | 0.2% |
| Palestinian | 1,381 | 2.5% |
| Polish | 9,023 | 16.2% |
| Portuguese | 54 | 0.1% |
| Puerto Rican | 906 | 1.6% |
| Romanian | 63 | 0.1% |
| Russian | 284 | 0.5% |
| Scandinavian | 245 | 0.4% |
| Scotch-Irish | 213 | 0.4% |
| Scottish | 505 | 0.9% |
| Serbian | 120 | 0.2% |
| Sioux | 31 | 0.1% |
| Slovak | 290 | 0.5% |
| Slovene | 42 | 0.1% |
| South American | 256 | 0.5% |
| Spaniard | 246 | 0.4% |
| Spanish | 151 | 0.3% |
| Sri Lankan | 38 | 0.1% |
| Subsaharan African | 436 | 0.8% |
| Swedish | 1,976 | 3.6% |
| Swiss | 35 | 0.1% |
| Thai | 579 | 1.0% |
| Turkish | 32 | 0.1% |
| Ukrainian | 206 | 0.4% |
| Venezuelan | 60 | 0.1% |
| Welsh | 136 | 0.2% | View All 81 Rows |
Immigrants in Tinley Park
The most numerous immigrant groups reported in Tinley Park came from Asia (2,192 | 3.9%), Europe (1,348 | 2.4%), Latin America (1,217 | 2.2%), Central America (1,128 | 2.0%), and Mexico (1,117 | 2.0%), together accounting for 12.6% of all Tinley Park residents.

| Immigration Origin | # Population | % Population |
| Africa | 453 | 0.8% |
| Albania | 26 | 0.1% |
| Argentina | 4 | 0.0% |
| Asia | 2,192 | 3.9% |
| Australia | 24 | 0.0% |
| Austria | 27 | 0.1% |
| Brazil | 4 | 0.0% |
| Canada | 62 | 0.1% |
| Caribbean | 51 | 0.1% |
| Central America | 1,128 | 2.0% |
| China | 168 | 0.3% |
| Colombia | 24 | 0.0% |
| Denmark | 15 | 0.0% |
| Dominican Republic | 51 | 0.1% |
| Eastern Africa | 14 | 0.0% |
| Eastern Asia | 234 | 0.4% |
| Eastern Europe | 845 | 1.5% |
| Ecuador | 6 | 0.0% |
| Egypt | 235 | 0.4% |
| England | 60 | 0.1% |
| Eritrea | 3 | 0.0% |
| Ethiopia | 11 | 0.0% |
| Europe | 1,348 | 2.4% |
| France | 8 | 0.0% |
| Germany | 57 | 0.1% |
| Greece | 69 | 0.1% |
| Guatemala | 11 | 0.0% |
| India | 262 | 0.5% |
| Iran | 31 | 0.1% |
| Iraq | 27 | 0.1% |
| Ireland | 93 | 0.2% |
| Israel | 142 | 0.3% |
| Italy | 141 | 0.3% |
| Japan | 29 | 0.1% |
| Jordan | 365 | 0.7% |
| Korea | 37 | 0.1% |
| Kuwait | 45 | 0.1% |
| Latin America | 1,217 | 2.2% |
| Lebanon | 37 | 0.1% |
| Lithuania | 76 | 0.1% |
| Mexico | 1,117 | 2.0% |
| Morocco | 39 | 0.1% |
| Nepal | 20 | 0.0% |
| Nigeria | 125 | 0.2% |
| North Macedonia | 18 | 0.0% |
| Northern Africa | 286 | 0.5% |
| Northern Europe | 201 | 0.4% |
| Oceania | 52 | 0.1% |
| Pakistan | 200 | 0.4% |
| Philippines | 491 | 0.9% |
| Poland | 527 | 0.9% |
| Scotland | 17 | 0.0% |
| Serbia | 67 | 0.1% |
| South America | 38 | 0.1% |
| South Central Asia | 513 | 0.9% |
| South Eastern Asia | 559 | 1.0% |
| Southern Europe | 210 | 0.4% |
| Syria | 12 | 0.0% |
| Taiwan | 15 | 0.0% |
| Thailand | 54 | 0.1% |
| Ukraine | 122 | 0.2% |
| Western Africa | 153 | 0.3% |
| Western Asia | 684 | 1.2% |
| Western Europe | 92 | 0.2% | View All 64 Rows |
Sex and Age in Tinley Park
Sex and Age in Tinley Park
The most populous age groups in Tinley Park are 35 to 39 Years (2,171 | 7.8%) for men and 55 to 59 Years (2,162 | 7.8%) for women.
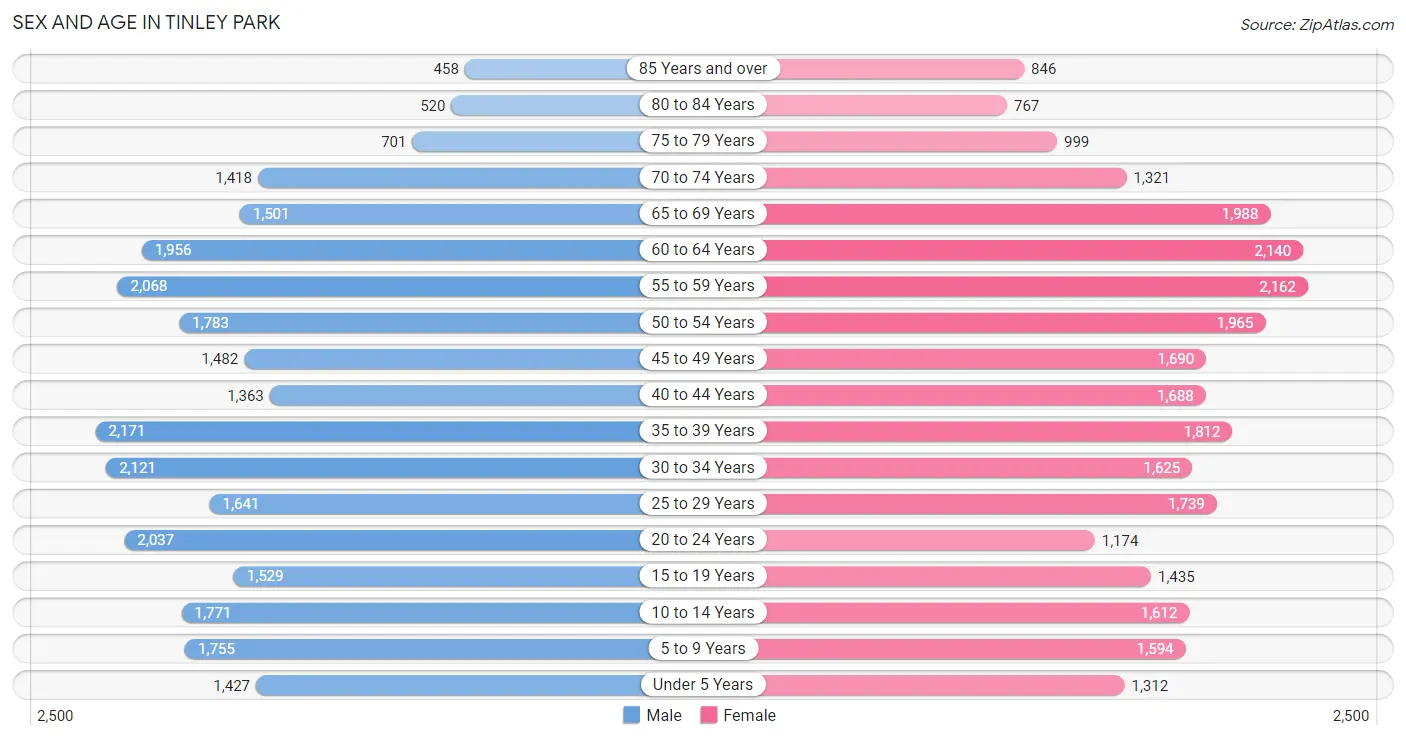
| Age Bracket | Male | Female |
| Under 5 Years | 1,427 (5.1%) | 1,312 (4.7%) |
| 5 to 9 Years | 1,755 (6.3%) | 1,594 (5.7%) |
| 10 to 14 Years | 1,771 (6.4%) | 1,612 (5.8%) |
| 15 to 19 Years | 1,529 (5.5%) | 1,435 (5.1%) |
| 20 to 24 Years | 2,037 (7.3%) | 1,174 (4.2%) |
| 25 to 29 Years | 1,641 (5.9%) | 1,739 (6.2%) |
| 30 to 34 Years | 2,121 (7.7%) | 1,625 (5.8%) |
| 35 to 39 Years | 2,171 (7.8%) | 1,812 (6.5%) |
| 40 to 44 Years | 1,363 (4.9%) | 1,688 (6.1%) |
| 45 to 49 Years | 1,482 (5.3%) | 1,690 (6.1%) |
| 50 to 54 Years | 1,783 (6.4%) | 1,965 (7.0%) |
| 55 to 59 Years | 2,068 (7.5%) | 2,162 (7.8%) |
| 60 to 64 Years | 1,956 (7.1%) | 2,140 (7.7%) |
| 65 to 69 Years | 1,501 (5.4%) | 1,988 (7.1%) |
| 70 to 74 Years | 1,418 (5.1%) | 1,321 (4.7%) |
| 75 to 79 Years | 701 (2.5%) | 999 (3.6%) |
| 80 to 84 Years | 520 (1.9%) | 767 (2.8%) |
| 85 Years and over | 458 (1.7%) | 846 (3.0%) |
| Total | 27,702 (100.0%) | 27,869 (100.0%) |
Families and Households in Tinley Park
Median Family Size in Tinley Park
The median family size in Tinley Park is 3.15 persons per family, with married-couple families (11,879 | 80.4%) accounting for the largest median family size of 3.22 persons per family. On the other hand, single male/father families (796 | 5.4%) represent the smallest median family size with 2.80 persons per family.
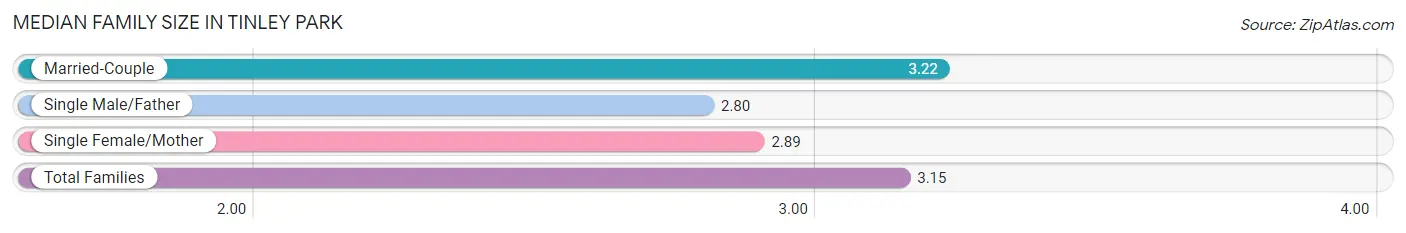
| Family Type | # Families | Family Size |
| Married-Couple | 11,879 (80.4%) | 3.22 |
| Single Male/Father | 796 (5.4%) | 2.80 |
| Single Female/Mother | 2,102 (14.2%) | 2.89 |
| Total Families | 14,777 (100.0%) | 3.15 |
Median Household Size in Tinley Park
The median household size in Tinley Park is 2.54 persons per household, with single male/father households (796 | 3.6%) accounting for the largest median household size of 3.29 persons per household. non-family households (7,096 | 32.4%) represent the smallest median household size with 1.15 persons per household.
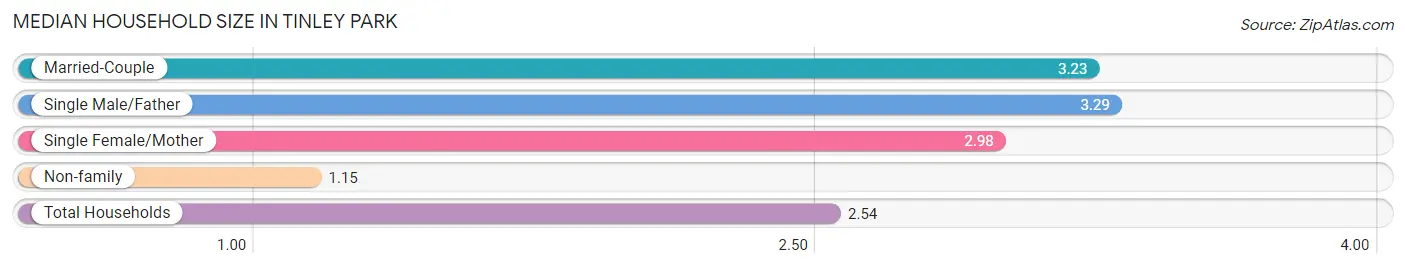
| Household Type | # Households | Household Size |
| Married-Couple | 11,879 (54.3%) | 3.23 |
| Single Male/Father | 796 (3.6%) | 3.29 |
| Single Female/Mother | 2,102 (9.6%) | 2.98 |
| Non-family | 7,096 (32.4%) | 1.15 |
| Total Households | 21,873 (100.0%) | 2.54 |
Household Size by Marriage Status in Tinley Park
Out of a total of 21,873 households in Tinley Park, 14,777 (67.6%) are family households, while 7,096 (32.4%) are nonfamily households. The most numerous type of family households are 2-person households, comprising 5,735, and the most common type of nonfamily households are 1-person households, comprising 6,198.
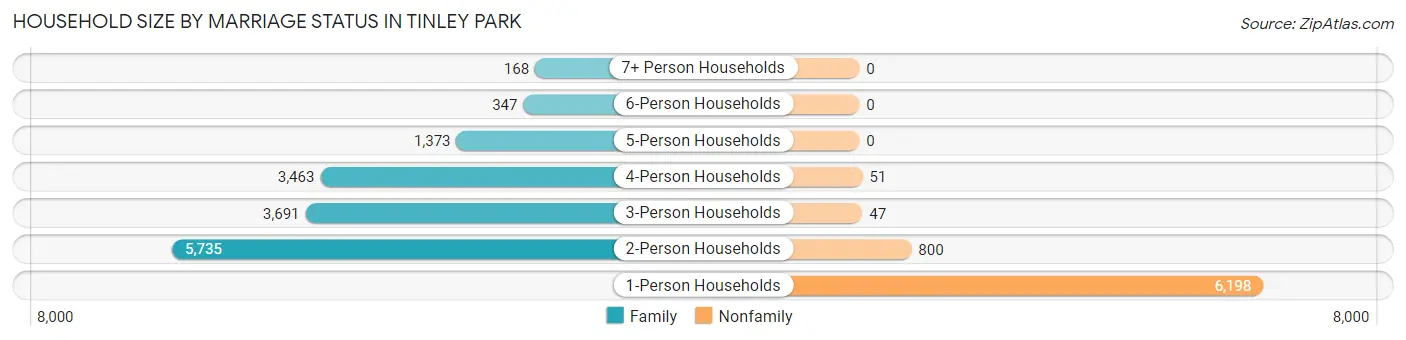
| Household Size | Family Households | Nonfamily Households |
| 1-Person Households | - | 6,198 (28.3%) |
| 2-Person Households | 5,735 (26.2%) | 800 (3.7%) |
| 3-Person Households | 3,691 (16.9%) | 47 (0.2%) |
| 4-Person Households | 3,463 (15.8%) | 51 (0.2%) |
| 5-Person Households | 1,373 (6.3%) | 0 (0.0%) |
| 6-Person Households | 347 (1.6%) | 0 (0.0%) |
| 7+ Person Households | 168 (0.8%) | 0 (0.0%) |
| Total | 14,777 (67.6%) | 7,096 (32.4%) |
Female Fertility in Tinley Park
Fertility by Age in Tinley Park
Average fertility rate in Tinley Park is 62.0 births per 1,000 women. Women in the age bracket of 20 to 34 years have the highest fertility rate with 130.0 births per 1,000 women. Women in the age bracket of 20 to 34 years acount for 82.2% of all women with births.
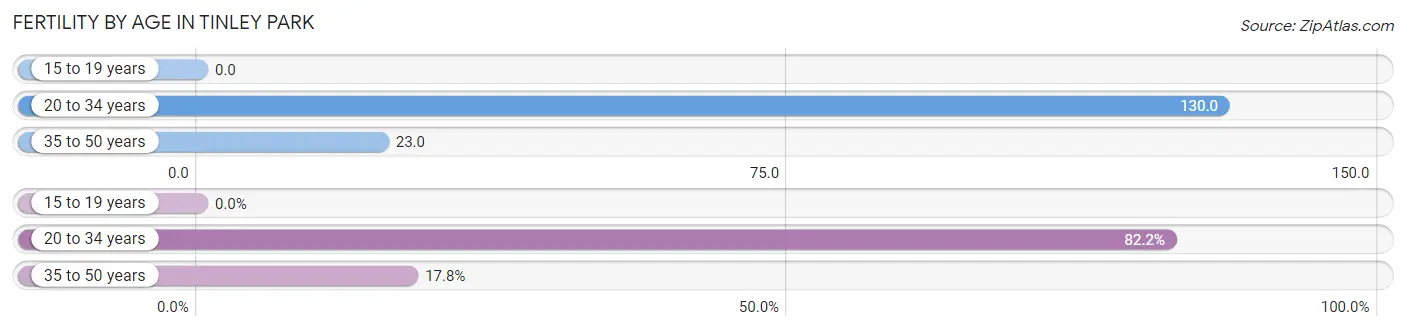
| Age Bracket | Women with Births | Births / 1,000 Women |
| 15 to 19 years | 0 (0.0%) | 0.0 |
| 20 to 34 years | 590 (82.2%) | 130.0 |
| 35 to 50 years | 128 (17.8%) | 23.0 |
| Total | 718 (100.0%) | 62.0 |
Fertility by Age by Marriage Status in Tinley Park
84.4% of women with births (718) in Tinley Park are married. The highest percentage of unmarried women with births falls into 35 to 50 years age bracket with 34.4% of them unmarried at the time of birth, while the lowest percentage of unmarried women with births belong to 20 to 34 years age bracket with 11.5% of them unmarried.
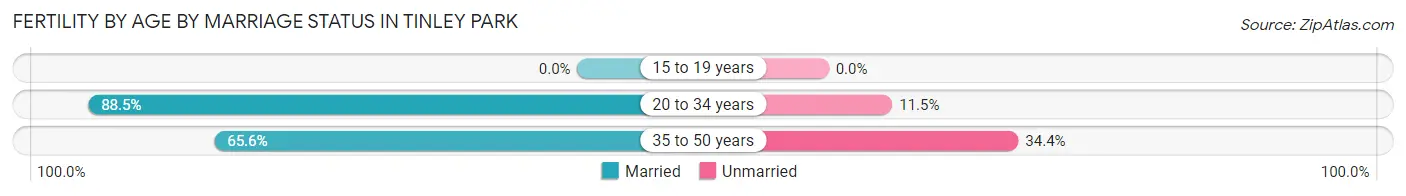
| Age Bracket | Married | Unmarried |
| 15 to 19 years | 0 (0.0%) | 0 (0.0%) |
| 20 to 34 years | 522 (88.5%) | 68 (11.5%) |
| 35 to 50 years | 84 (65.6%) | 44 (34.4%) |
| Total | 606 (84.4%) | 112 (15.6%) |
Fertility by Education in Tinley Park
Average fertility rate in Tinley Park is 62.0 births per 1,000 women. Women with the education attainment of bachelor's degree have the highest fertility rate of 109.0 births per 1,000 women, while women with the education attainment of high school diploma have the lowest fertility at 21.0 births per 1,000 women. Women with the education attainment of bachelor's degree represent 53.3% of all women with births.
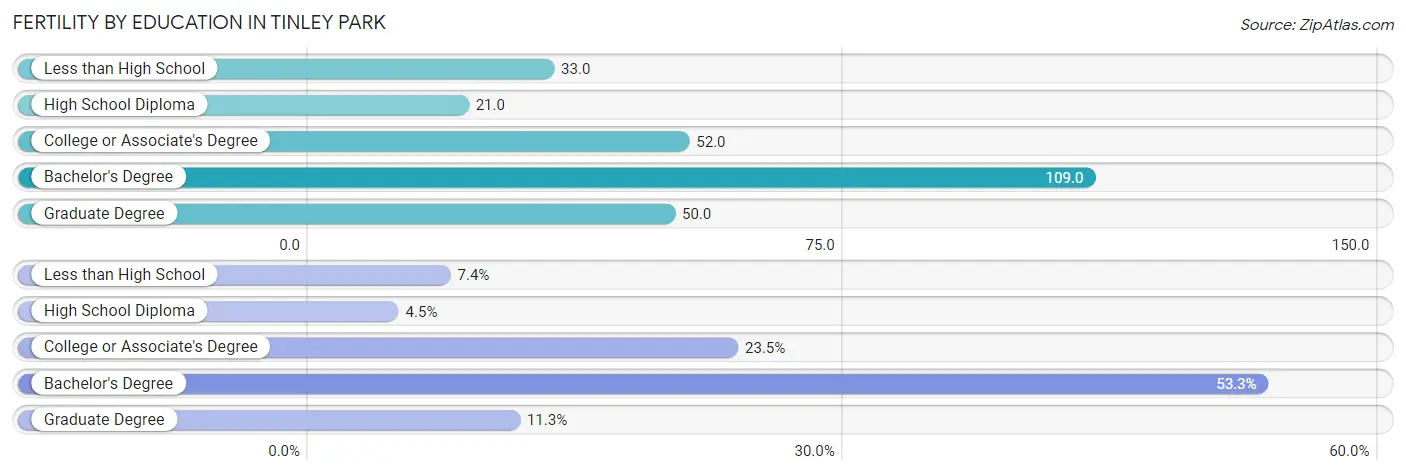
| Educational Attainment | Women with Births | Births / 1,000 Women |
| Less than High School | 53 (7.4%) | 33.0 |
| High School Diploma | 32 (4.5%) | 21.0 |
| College or Associate's Degree | 169 (23.5%) | 52.0 |
| Bachelor's Degree | 383 (53.3%) | 109.0 |
| Graduate Degree | 81 (11.3%) | 50.0 |
| Total | 718 (100.0%) | 62.0 |
Fertility by Education by Marriage Status in Tinley Park
15.6% of women with births in Tinley Park are unmarried. Women with the educational attainment of less than high school are most likely to be married with 100.0% of them married at childbirth, while women with the educational attainment of college or associate's degree are least likely to be married with 55.6% of them unmarried at childbirth.
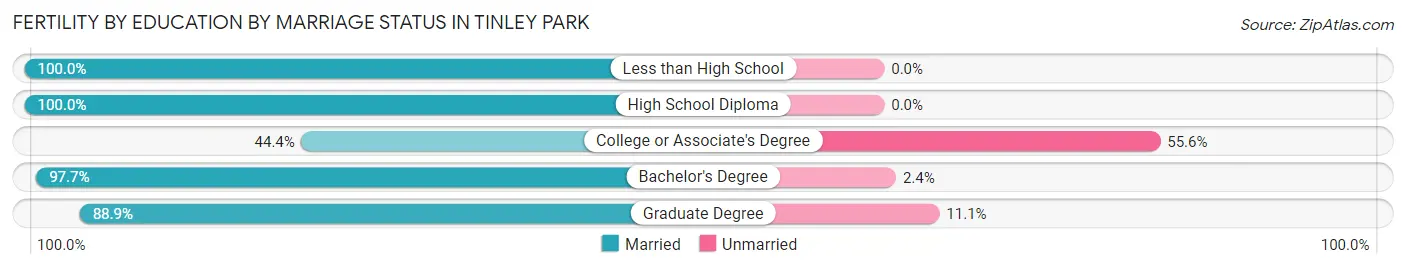
| Educational Attainment | Married | Unmarried |
| Less than High School | 53 (100.0%) | 0 (0.0%) |
| High School Diploma | 32 (100.0%) | 0 (0.0%) |
| College or Associate's Degree | 75 (44.4%) | 94 (55.6%) |
| Bachelor's Degree | 374 (97.7%) | 9 (2.4%) |
| Graduate Degree | 72 (88.9%) | 9 (11.1%) |
| Total | 606 (84.4%) | 112 (15.6%) |
Employment Characteristics in Tinley Park
Employment by Class of Employer in Tinley Park
Among the 28,516 employed individuals in Tinley Park, private company employees (20,255 | 71.0%), local government employees (3,127 | 11.0%), and not-for-profit organizations (2,292 | 8.0%) make up the most common classes of employment.
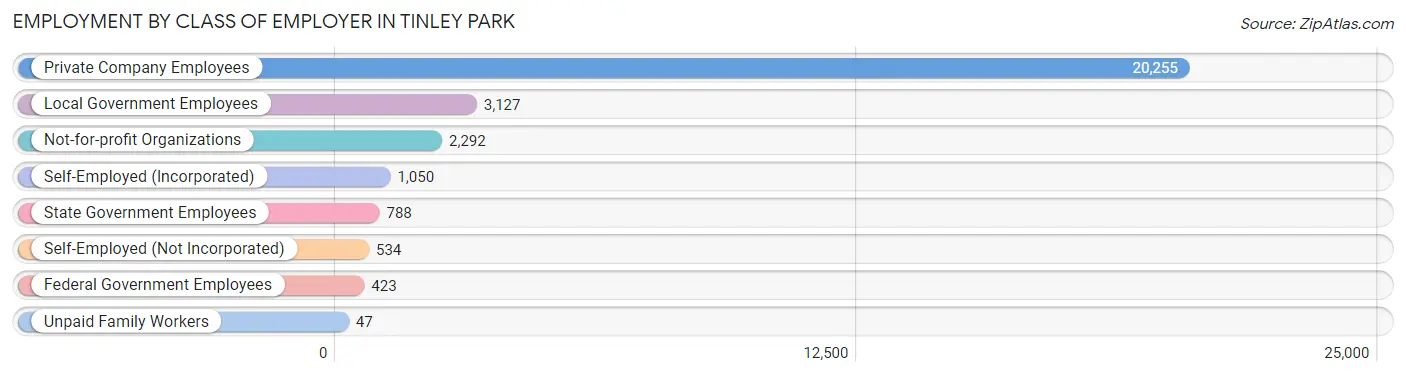
| Employer Class | # Employees | % Employees |
| Private Company Employees | 20,255 | 71.0% |
| Self-Employed (Incorporated) | 1,050 | 3.7% |
| Self-Employed (Not Incorporated) | 534 | 1.9% |
| Not-for-profit Organizations | 2,292 | 8.0% |
| Local Government Employees | 3,127 | 11.0% |
| State Government Employees | 788 | 2.8% |
| Federal Government Employees | 423 | 1.5% |
| Unpaid Family Workers | 47 | 0.2% |
| Total | 28,516 | 100.0% |
Employment Status by Age in Tinley Park
According to the labor force statistics for Tinley Park, out of the total population over 16 years of age (45,365), 68.3% or 30,984 individuals are in the labor force, with 5.7% or 1,766 of them unemployed. The age group with the highest labor force participation rate is 45 to 54 years, with 91.2% or 6,311 individuals in the labor force. Within the labor force, the 16 to 19 years age range has the highest percentage of unemployed individuals, with 22.1% or 186 of them being unemployed.
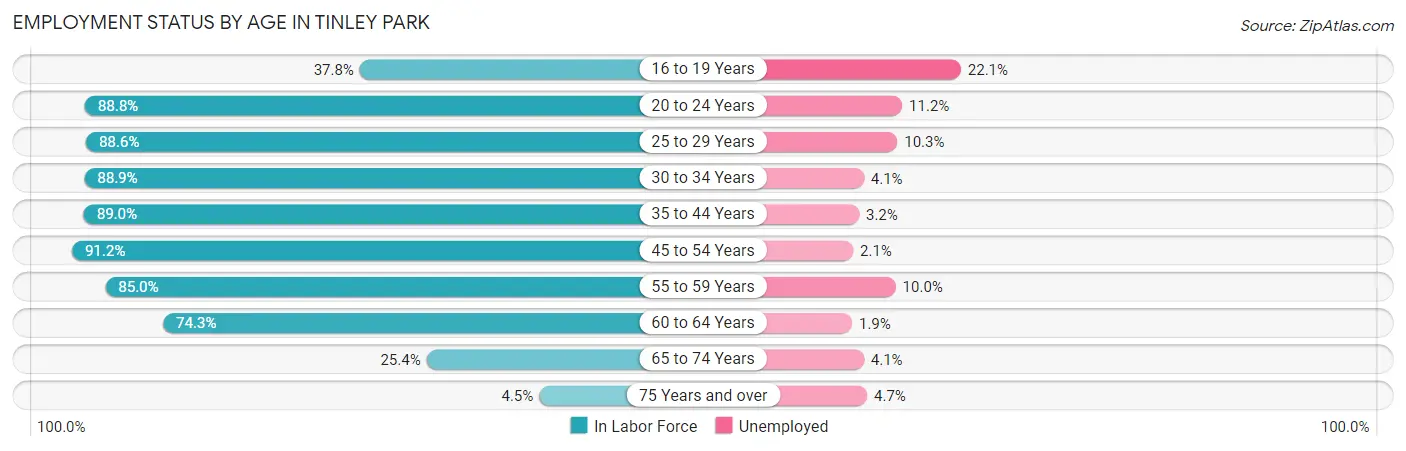
| Age Bracket | In Labor Force | Unemployed |
| 16 to 19 Years | 843 (37.8%) | 186 (22.1%) |
| 20 to 24 Years | 2,851 (88.8%) | 319 (11.2%) |
| 25 to 29 Years | 2,995 (88.6%) | 308 (10.3%) |
| 30 to 34 Years | 3,330 (88.9%) | 137 (4.1%) |
| 35 to 44 Years | 6,260 (89.0%) | 200 (3.2%) |
| 45 to 54 Years | 6,311 (91.2%) | 133 (2.1%) |
| 55 to 59 Years | 3,596 (85.0%) | 360 (10.0%) |
| 60 to 64 Years | 3,043 (74.3%) | 58 (1.9%) |
| 65 to 74 Years | 1,582 (25.4%) | 65 (4.1%) |
| 75 Years and over | 193 (4.5%) | 9 (4.7%) |
| Total | 30,984 (68.3%) | 1,766 (5.7%) |
Employment Status by Educational Attainment in Tinley Park
According to labor force statistics for Tinley Park, 86.8% of individuals (25,524) out of the total population between 25 and 64 years of age (29,406) are in the labor force, with 4.7% or 1,200 of them being unemployed. The group with the highest labor force participation rate are those with the educational attainment of bachelor's degree or higher, with 90.2% or 11,382 individuals in the labor force. Within the labor force, individuals with high school diploma education have the highest percentage of unemployment, with 8.0% or 392 of them being unemployed.
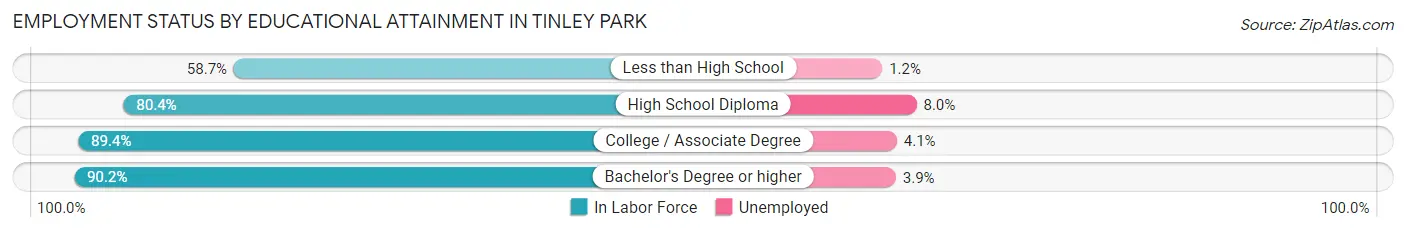
| Educational Attainment | In Labor Force | Unemployed |
| Less than High School | 588 (58.7%) | 12 (1.2%) |
| High School Diploma | 4,898 (80.4%) | 487 (8.0%) |
| College / Associate Degree | 8,666 (89.4%) | 397 (4.1%) |
| Bachelor's Degree or higher | 11,382 (90.2%) | 492 (3.9%) |
| Total | 25,524 (86.8%) | 1,382 (4.7%) |
Employment Occupations by Sex in Tinley Park
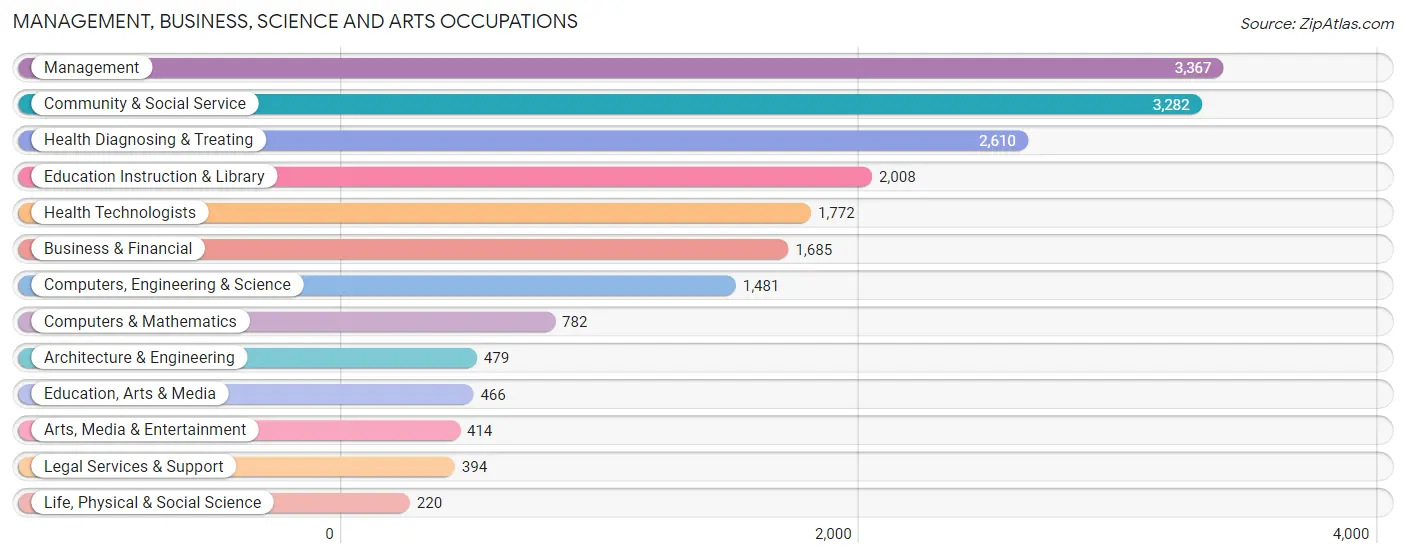
Management, Business, Science and Arts Occupations
The most common Management, Business, Science and Arts occupations in Tinley Park are Management (3,367 | 11.5%), Community & Social Service (3,282 | 11.2%), Health Diagnosing & Treating (2,610 | 8.9%), Education Instruction & Library (2,008 | 6.9%), and Health Technologists (1,772 | 6.1%).
Management, Business, Science and Arts Occupations by Sex
Within the Management, Business, Science and Arts occupations in Tinley Park, the most male-oriented occupations are Architecture & Engineering (98.3%), Computers, Engineering & Science (88.5%), and Computers & Mathematics (85.7%), while the most female-oriented occupations are Education Instruction & Library (84.2%), Legal Services & Support (82.0%), and Community & Social Service (77.6%).
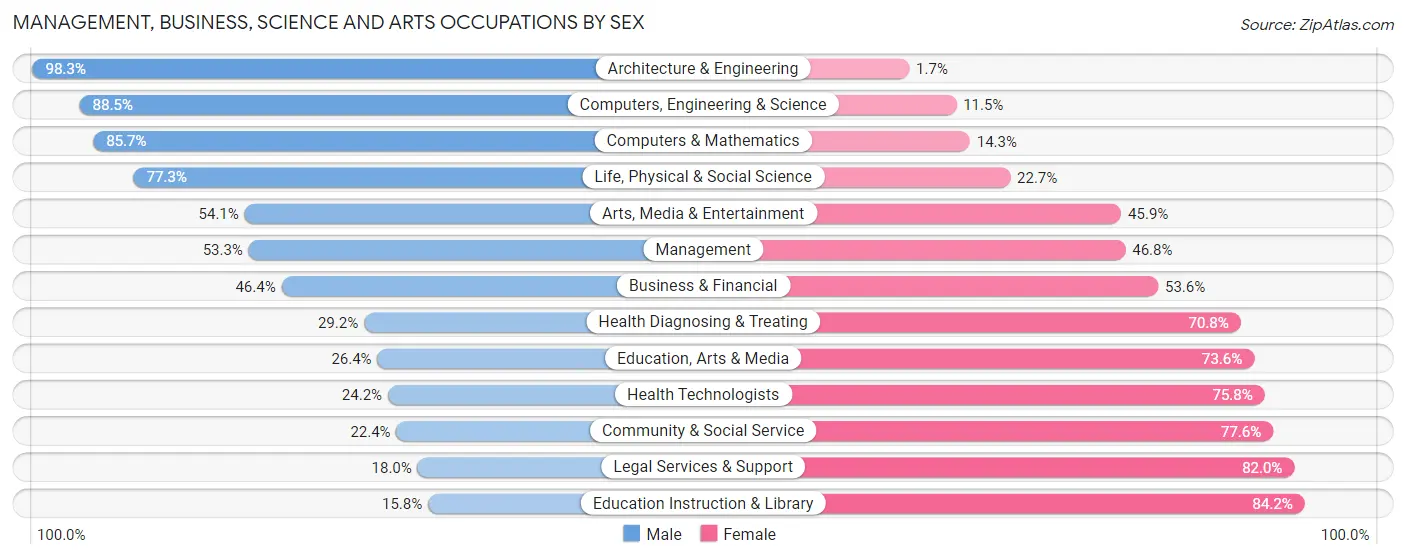
| Occupation | Male | Female |
| Management | 1,793 (53.2%) | 1,574 (46.8%) |
| Business & Financial | 782 (46.4%) | 903 (53.6%) |
| Computers, Engineering & Science | 1,311 (88.5%) | 170 (11.5%) |
| Computers & Mathematics | 670 (85.7%) | 112 (14.3%) |
| Architecture & Engineering | 471 (98.3%) | 8 (1.7%) |
| Life, Physical & Social Science | 170 (77.3%) | 50 (22.7%) |
| Community & Social Service | 736 (22.4%) | 2,546 (77.6%) |
| Education, Arts & Media | 123 (26.4%) | 343 (73.6%) |
| Legal Services & Support | 71 (18.0%) | 323 (82.0%) |
| Education Instruction & Library | 318 (15.8%) | 1,690 (84.2%) |
| Arts, Media & Entertainment | 224 (54.1%) | 190 (45.9%) |
| Health Diagnosing & Treating | 762 (29.2%) | 1,848 (70.8%) |
| Health Technologists | 429 (24.2%) | 1,343 (75.8%) |
| Total (Category) | 5,384 (43.3%) | 7,041 (56.7%) |
| Total (Overall) | 15,568 (53.3%) | 13,647 (46.7%) |
Services Occupations
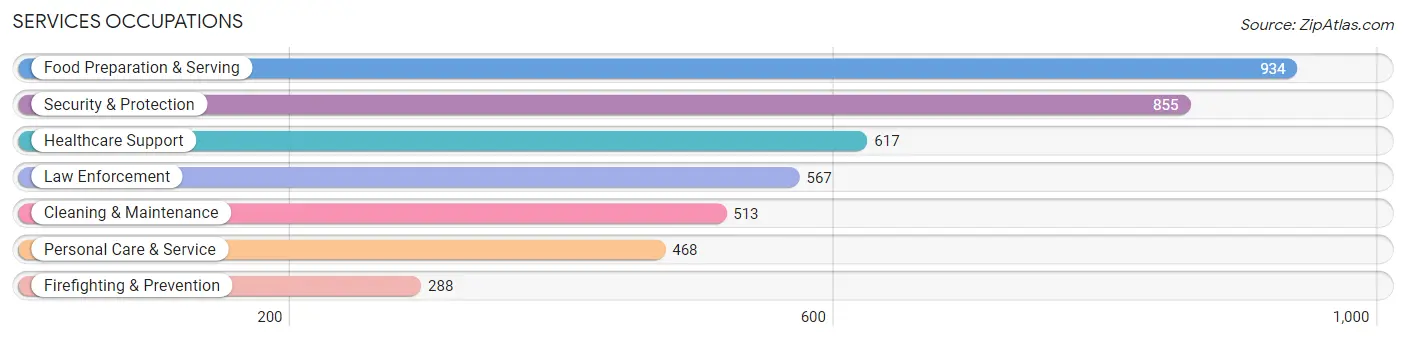
The most common Services occupations in Tinley Park are Food Preparation & Serving (934 | 3.2%), Security & Protection (855 | 2.9%), Healthcare Support (617 | 2.1%), Law Enforcement (567 | 1.9%), and Cleaning & Maintenance (513 | 1.8%).
Services Occupations by Sex
Within the Services occupations in Tinley Park, the most male-oriented occupations are Law Enforcement (98.9%), Security & Protection (88.5%), and Firefighting & Prevention (68.1%), while the most female-oriented occupations are Personal Care & Service (87.8%), Healthcare Support (84.8%), and Food Preparation & Serving (59.7%).
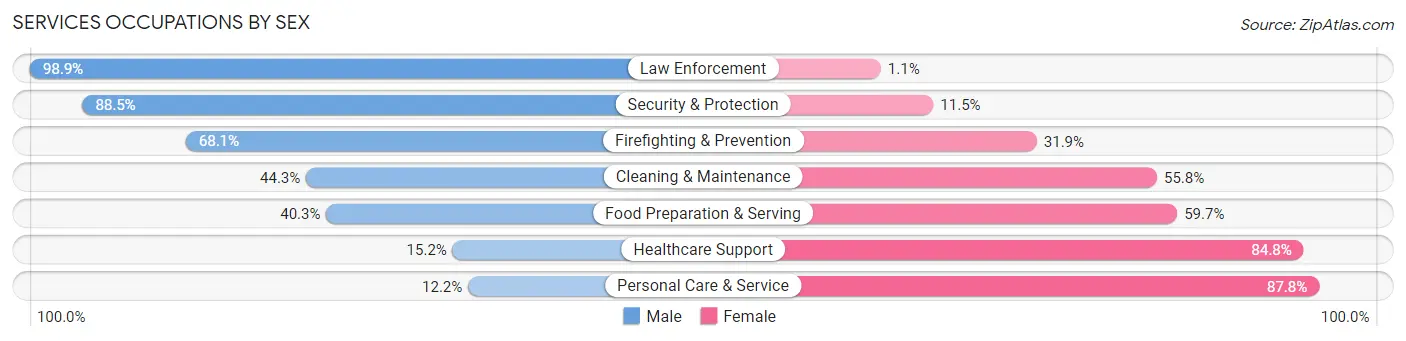
| Occupation | Male | Female |
| Healthcare Support | 94 (15.2%) | 523 (84.8%) |
| Security & Protection | 757 (88.5%) | 98 (11.5%) |
| Firefighting & Prevention | 196 (68.1%) | 92 (31.9%) |
| Law Enforcement | 561 (98.9%) | 6 (1.1%) |
| Food Preparation & Serving | 376 (40.3%) | 558 (59.7%) |
| Cleaning & Maintenance | 227 (44.3%) | 286 (55.7%) |
| Personal Care & Service | 57 (12.2%) | 411 (87.8%) |
| Total (Category) | 1,511 (44.6%) | 1,876 (55.4%) |
| Total (Overall) | 15,568 (53.3%) | 13,647 (46.7%) |
Sales and Office Occupations
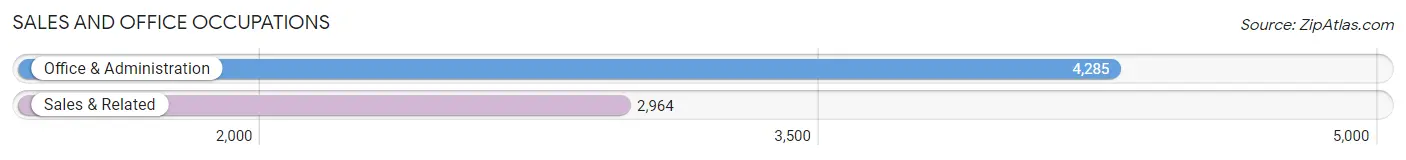
The most common Sales and Office occupations in Tinley Park are Office & Administration (4,285 | 14.7%), and Sales & Related (2,964 | 10.2%).
Sales and Office Occupations by Sex
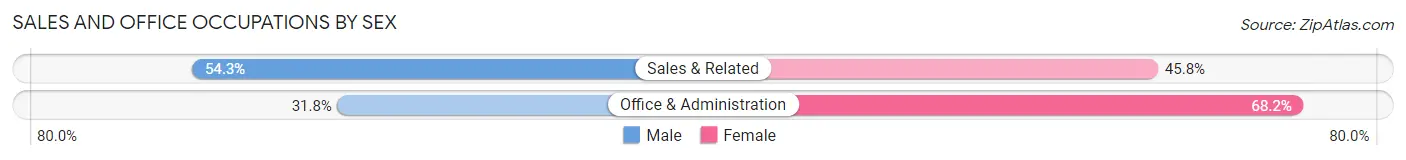
| Occupation | Male | Female |
| Sales & Related | 1,608 (54.2%) | 1,356 (45.8%) |
| Office & Administration | 1,364 (31.8%) | 2,921 (68.2%) |
| Total (Category) | 2,972 (41.0%) | 4,277 (59.0%) |
| Total (Overall) | 15,568 (53.3%) | 13,647 (46.7%) |
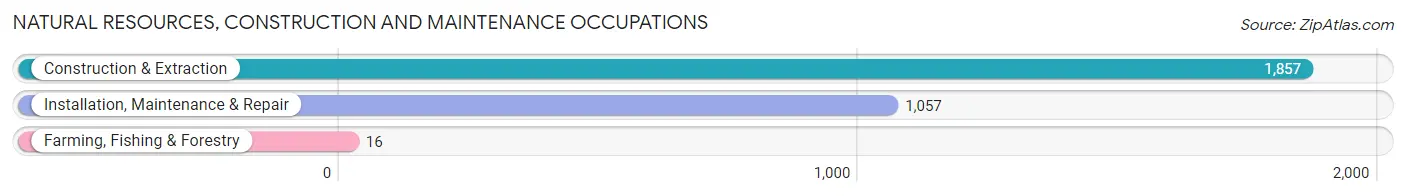
Natural Resources, Construction and Maintenance Occupations
The most common Natural Resources, Construction and Maintenance occupations in Tinley Park are Construction & Extraction (1,857 | 6.4%), Installation, Maintenance & Repair (1,057 | 3.6%), and Farming, Fishing & Forestry (16 | 0.1%).
Natural Resources, Construction and Maintenance Occupations by Sex
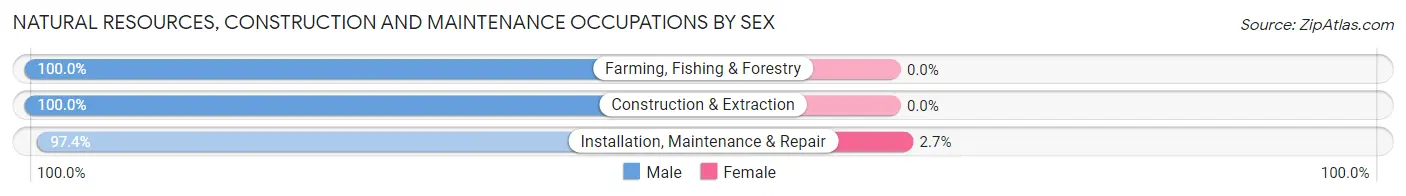
| Occupation | Male | Female |
| Farming, Fishing & Forestry | 16 (100.0%) | 0 (0.0%) |
| Construction & Extraction | 1,857 (100.0%) | 0 (0.0%) |
| Installation, Maintenance & Repair | 1,029 (97.4%) | 28 (2.6%) |
| Total (Category) | 2,902 (99.0%) | 28 (1.0%) |
| Total (Overall) | 15,568 (53.3%) | 13,647 (46.7%) |
Production, Transportation and Moving Occupations
The most common Production, Transportation and Moving occupations in Tinley Park are Transportation (1,188 | 4.1%), Material Moving (1,131 | 3.9%), and Production (905 | 3.1%).
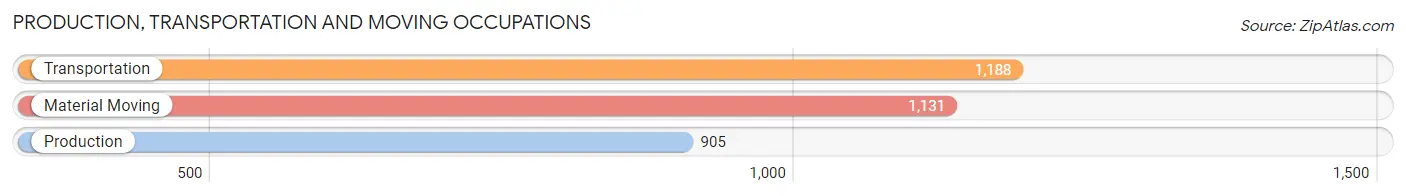
Production, Transportation and Moving Occupations by Sex
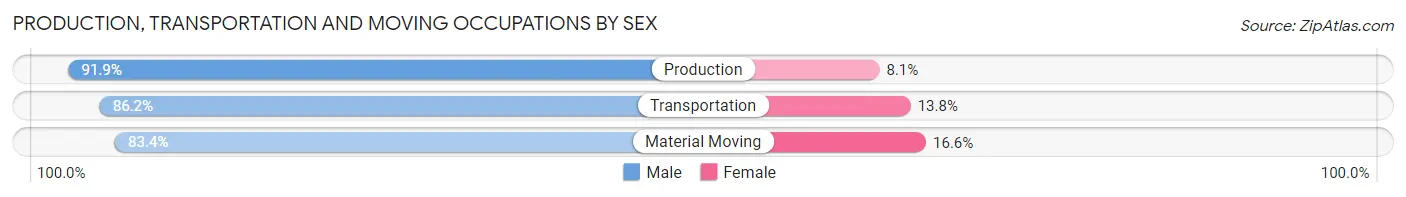
| Occupation | Male | Female |
| Production | 832 (91.9%) | 73 (8.1%) |
| Transportation | 1,024 (86.2%) | 164 (13.8%) |
| Material Moving | 943 (83.4%) | 188 (16.6%) |
| Total (Category) | 2,799 (86.8%) | 425 (13.2%) |
| Total (Overall) | 15,568 (53.3%) | 13,647 (46.7%) |
Employment Industries by Sex in Tinley Park
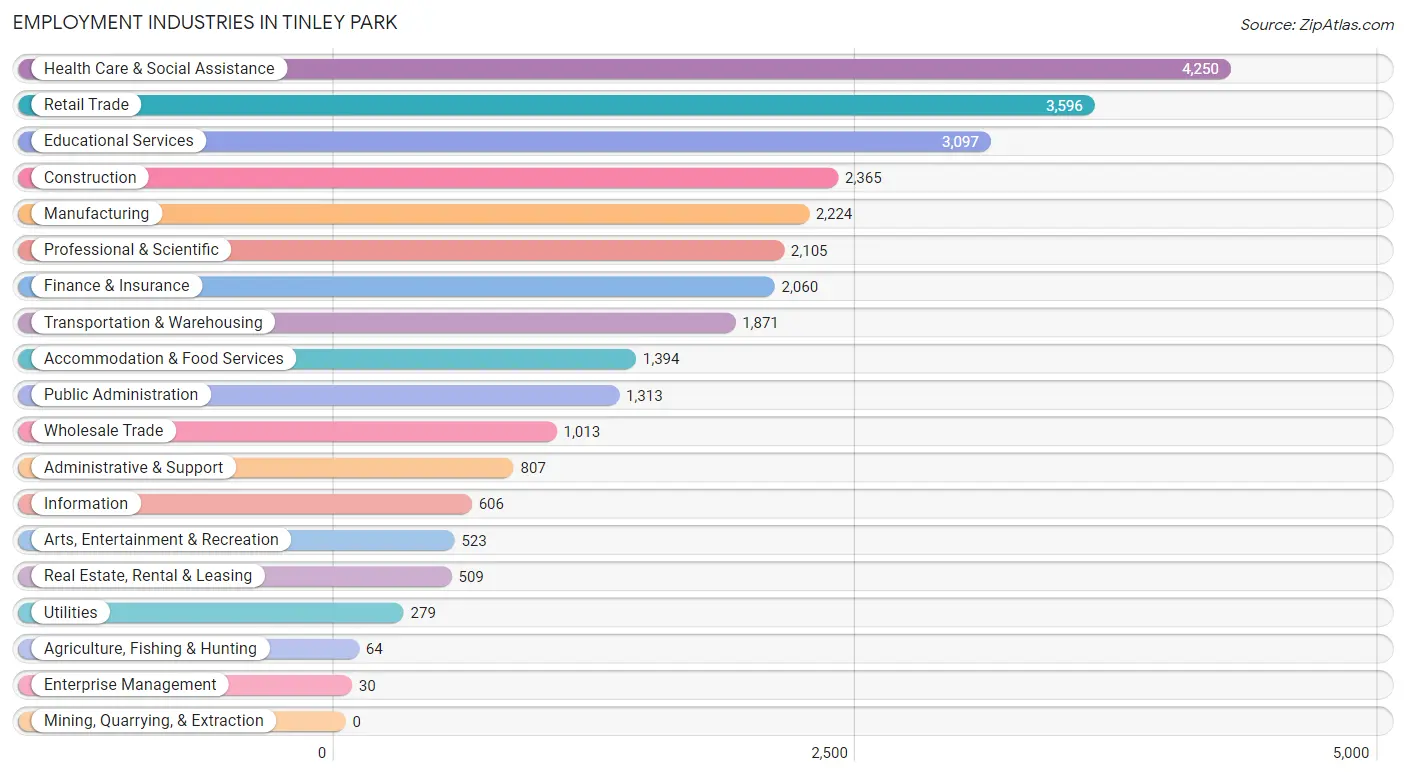
Employment Industries in Tinley Park
The major employment industries in Tinley Park include Health Care & Social Assistance (4,250 | 14.5%), Retail Trade (3,596 | 12.3%), Educational Services (3,097 | 10.6%), Construction (2,365 | 8.1%), and Manufacturing (2,224 | 7.6%).
Employment Industries by Sex in Tinley Park
The Tinley Park industries that see more men than women are Agriculture, Fishing & Hunting (100.0%), Construction (90.7%), and Manufacturing (82.0%), whereas the industries that tend to have a higher number of women are Health Care & Social Assistance (76.4%), Educational Services (73.1%), and Arts, Entertainment & Recreation (63.1%).
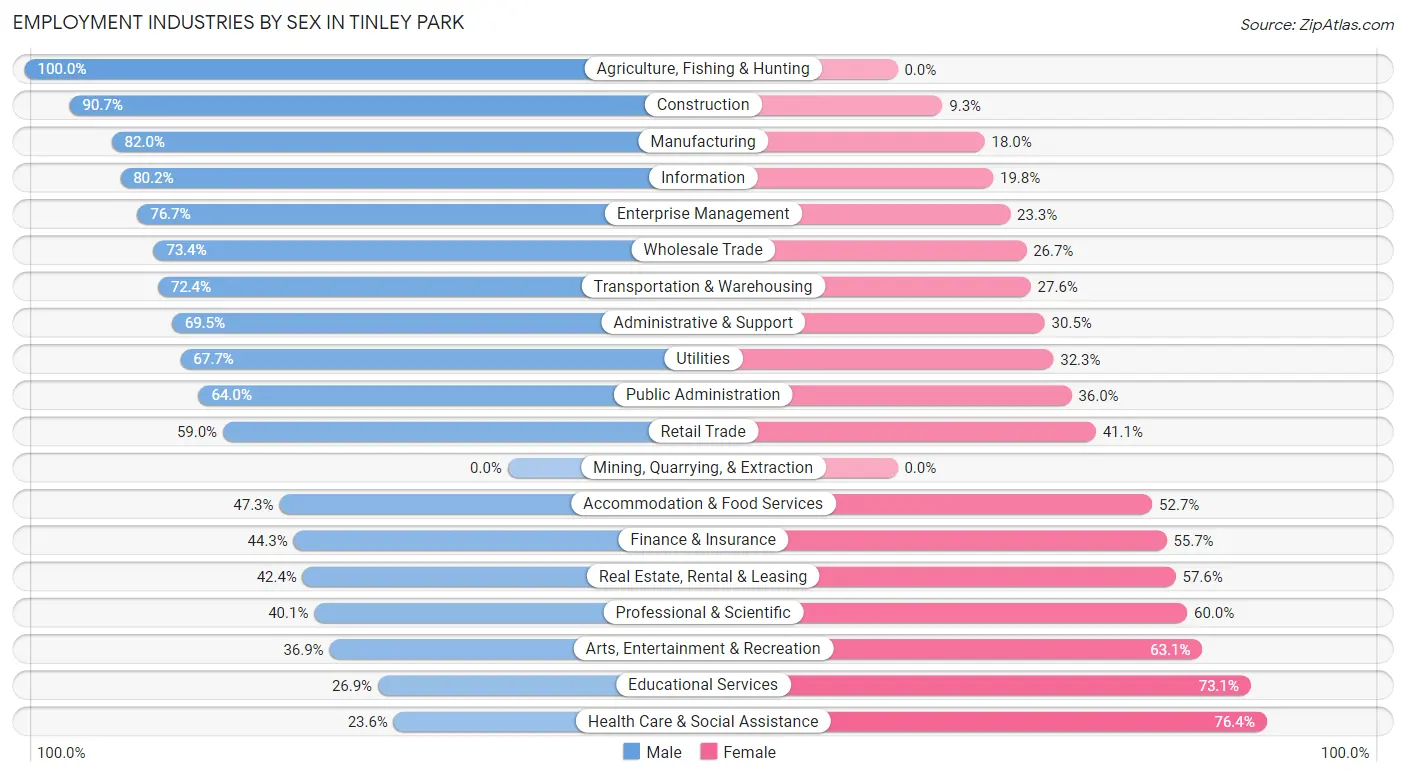
| Industry | Male | Female |
| Agriculture, Fishing & Hunting | 64 (100.0%) | 0 (0.0%) |
| Mining, Quarrying, & Extraction | 0 (0.0%) | 0 (0.0%) |
| Construction | 2,145 (90.7%) | 220 (9.3%) |
| Manufacturing | 1,823 (82.0%) | 401 (18.0%) |
| Wholesale Trade | 743 (73.4%) | 270 (26.7%) |
| Retail Trade | 2,120 (59.0%) | 1,476 (41.0%) |
| Transportation & Warehousing | 1,355 (72.4%) | 516 (27.6%) |
| Utilities | 189 (67.7%) | 90 (32.3%) |
| Information | 486 (80.2%) | 120 (19.8%) |
| Finance & Insurance | 913 (44.3%) | 1,147 (55.7%) |
| Real Estate, Rental & Leasing | 216 (42.4%) | 293 (57.6%) |
| Professional & Scientific | 843 (40.1%) | 1,262 (60.0%) |
| Enterprise Management | 23 (76.7%) | 7 (23.3%) |
| Administrative & Support | 561 (69.5%) | 246 (30.5%) |
| Educational Services | 832 (26.9%) | 2,265 (73.1%) |
| Health Care & Social Assistance | 1,003 (23.6%) | 3,247 (76.4%) |
| Arts, Entertainment & Recreation | 193 (36.9%) | 330 (63.1%) |
| Accommodation & Food Services | 659 (47.3%) | 735 (52.7%) |
| Public Administration | 840 (64.0%) | 473 (36.0%) |
| Total | 15,568 (53.3%) | 13,647 (46.7%) |
Education in Tinley Park
School Enrollment in Tinley Park
The most common levels of schooling among the 11,992 students in Tinley Park are high school (2,690 | 22.4%), elementary school (2,613 | 21.8%), and middle school (2,609 | 21.8%).
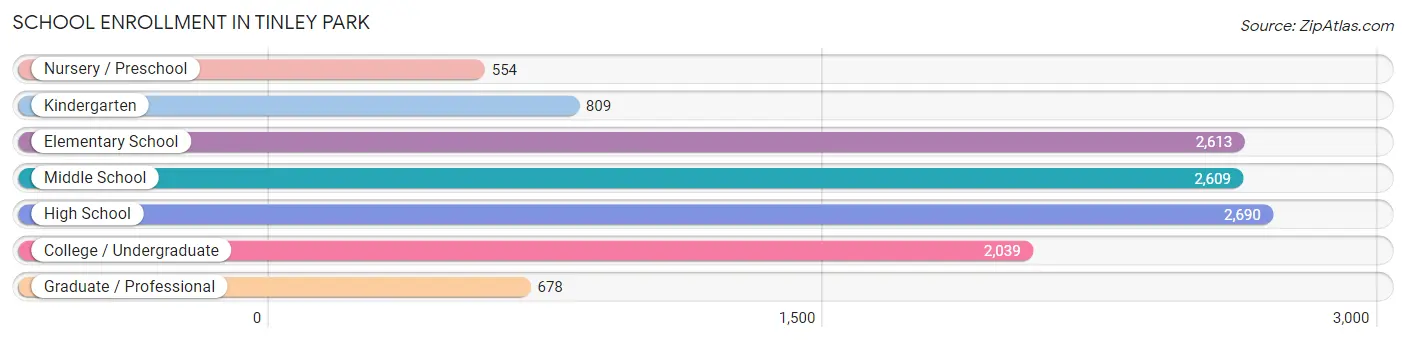
| School Level | # Students | % Students |
| Nursery / Preschool | 554 | 4.6% |
| Kindergarten | 809 | 6.8% |
| Elementary School | 2,613 | 21.8% |
| Middle School | 2,609 | 21.8% |
| High School | 2,690 | 22.4% |
| College / Undergraduate | 2,039 | 17.0% |
| Graduate / Professional | 678 | 5.7% |
| Total | 11,992 | 100.0% |
School Enrollment by Age by Funding Source in Tinley Park
Out of a total of 11,992 students who are enrolled in schools in Tinley Park, 1,679 (14.0%) attend a private institution, while the remaining 10,313 (86.0%) are enrolled in public schools. The age group of 35 years and over has the highest likelihood of being enrolled in private schools, with 420 (69.8% in the age bracket) enrolled. Conversely, the age group of 10 to 14 year olds has the lowest likelihood of being enrolled in a private school, with 3,025 (96.0% in the age bracket) attending a public institution.
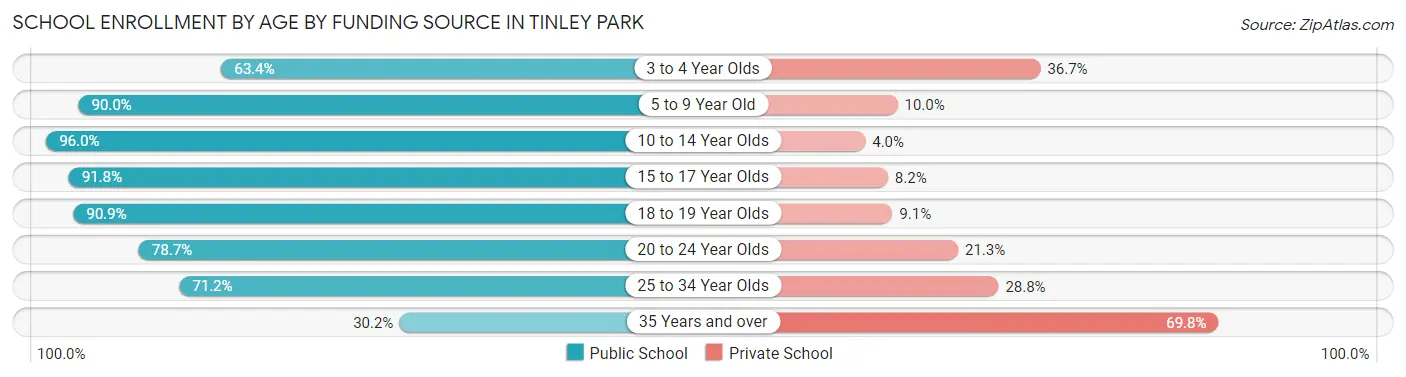
| Age Bracket | Public School | Private School |
| 3 to 4 Year Olds | 306 (63.3%) | 177 (36.6%) |
| 5 to 9 Year Old | 2,885 (90.0%) | 322 (10.0%) |
| 10 to 14 Year Olds | 3,025 (96.0%) | 127 (4.0%) |
| 15 to 17 Year Olds | 1,849 (91.8%) | 166 (8.2%) |
| 18 to 19 Year Olds | 781 (90.9%) | 78 (9.1%) |
| 20 to 24 Year Olds | 968 (78.7%) | 262 (21.3%) |
| 25 to 34 Year Olds | 316 (71.2%) | 128 (28.8%) |
| 35 Years and over | 182 (30.2%) | 420 (69.8%) |
| Total | 10,313 (86.0%) | 1,679 (14.0%) |
Educational Attainment by Field of Study in Tinley Park
Business (3,650 | 23.0%), education (2,611 | 16.4%), science & technology (2,594 | 16.3%), engineering (1,054 | 6.6%), and arts & humanities (950 | 6.0%) are the most common fields of study among 15,906 individuals in Tinley Park who have obtained a bachelor's degree or higher.
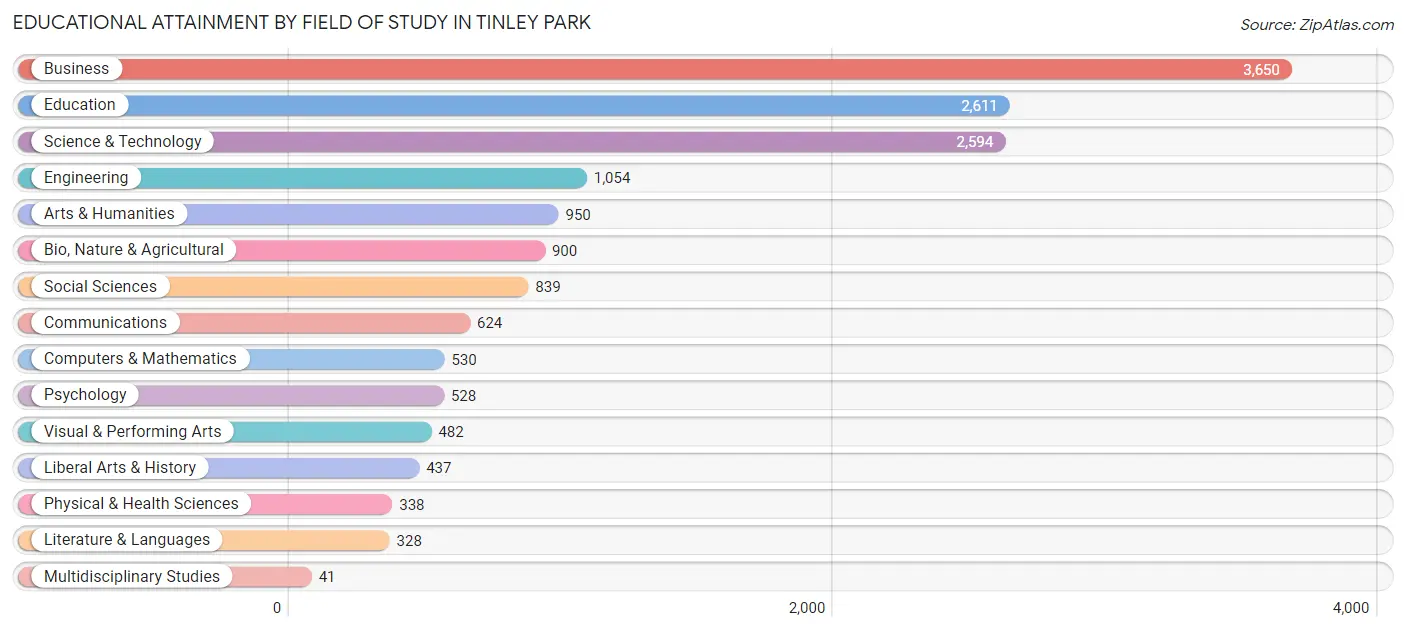
| Field of Study | # Graduates | % Graduates |
| Computers & Mathematics | 530 | 3.3% |
| Bio, Nature & Agricultural | 900 | 5.7% |
| Physical & Health Sciences | 338 | 2.1% |
| Psychology | 528 | 3.3% |
| Social Sciences | 839 | 5.3% |
| Engineering | 1,054 | 6.6% |
| Multidisciplinary Studies | 41 | 0.3% |
| Science & Technology | 2,594 | 16.3% |
| Business | 3,650 | 23.0% |
| Education | 2,611 | 16.4% |
| Literature & Languages | 328 | 2.1% |
| Liberal Arts & History | 437 | 2.8% |
| Visual & Performing Arts | 482 | 3.0% |
| Communications | 624 | 3.9% |
| Arts & Humanities | 950 | 6.0% |
| Total | 15,906 | 100.0% |
Transportation & Commute in Tinley Park
Vehicle Availability by Sex in Tinley Park
The most prevalent vehicle ownership categories in Tinley Park are males with 2 vehicles (7,140, accounting for 46.9%) and females with 2 vehicles (6,451, making up 53.8%).
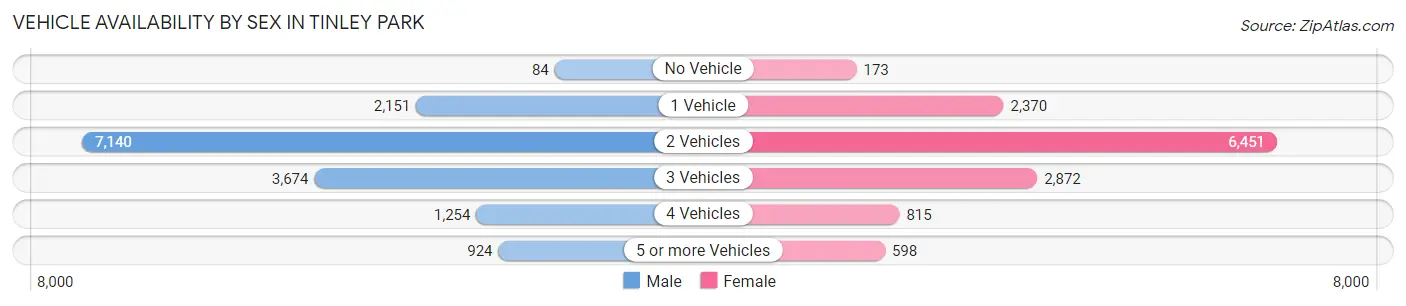
| Vehicles Available | Male | Female |
| No Vehicle | 84 (0.5%) | 173 (1.3%) |
| 1 Vehicle | 2,151 (14.1%) | 2,370 (17.8%) |
| 2 Vehicles | 7,140 (46.9%) | 6,451 (48.6%) |
| 3 Vehicles | 3,674 (24.1%) | 2,872 (21.6%) |
| 4 Vehicles | 1,254 (8.2%) | 815 (6.1%) |
| 5 or more Vehicles | 924 (6.1%) | 598 (4.5%) |
| Total | 15,227 (100.0%) | 13,279 (100.0%) |
Commute Time in Tinley Park
The most frequently occuring commute durations in Tinley Park are 30 to 34 minutes (4,058 commuters, 15.5%), 60 to 89 minutes (3,852 commuters, 14.7%), and 45 to 59 minutes (3,004 commuters, 11.5%).
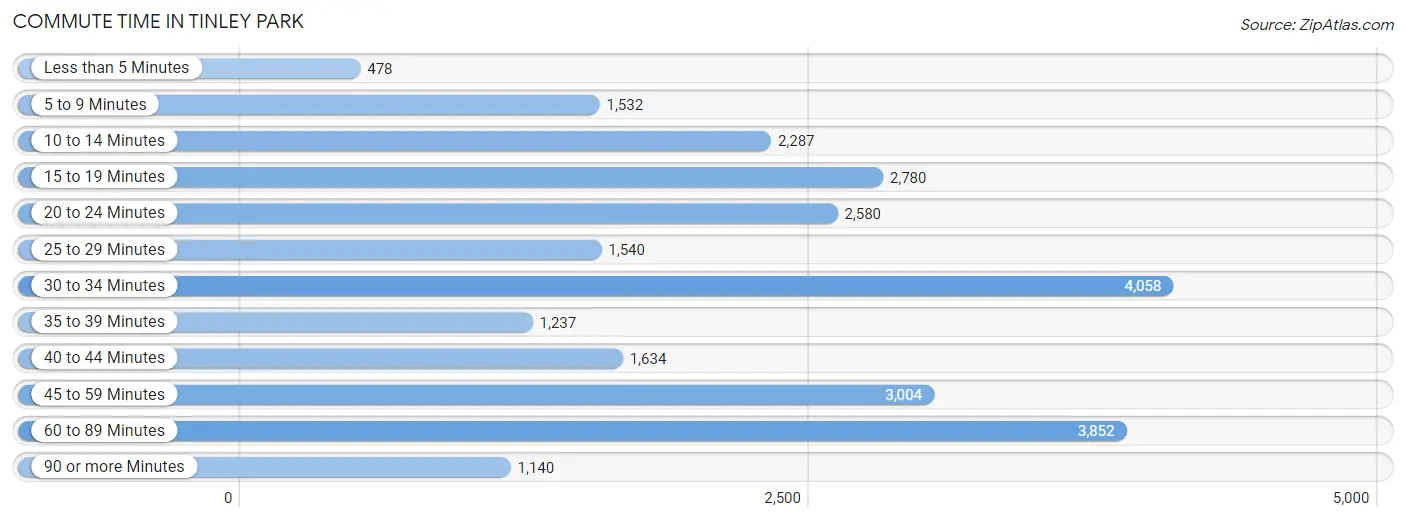
| Commute Time | # Commuters | % Commuters |
| Less than 5 Minutes | 478 | 1.8% |
| 5 to 9 Minutes | 1,532 | 5.9% |
| 10 to 14 Minutes | 2,287 | 8.8% |
| 15 to 19 Minutes | 2,780 | 10.6% |
| 20 to 24 Minutes | 2,580 | 9.9% |
| 25 to 29 Minutes | 1,540 | 5.9% |
| 30 to 34 Minutes | 4,058 | 15.5% |
| 35 to 39 Minutes | 1,237 | 4.7% |
| 40 to 44 Minutes | 1,634 | 6.3% |
| 45 to 59 Minutes | 3,004 | 11.5% |
| 60 to 89 Minutes | 3,852 | 14.7% |
| 90 or more Minutes | 1,140 | 4.4% |
Commute Time by Sex in Tinley Park
The most common commute times in Tinley Park are 60 to 89 minutes (2,528 commuters, 18.0%) for males and 30 to 34 minutes (1,671 commuters, 13.8%) for females.
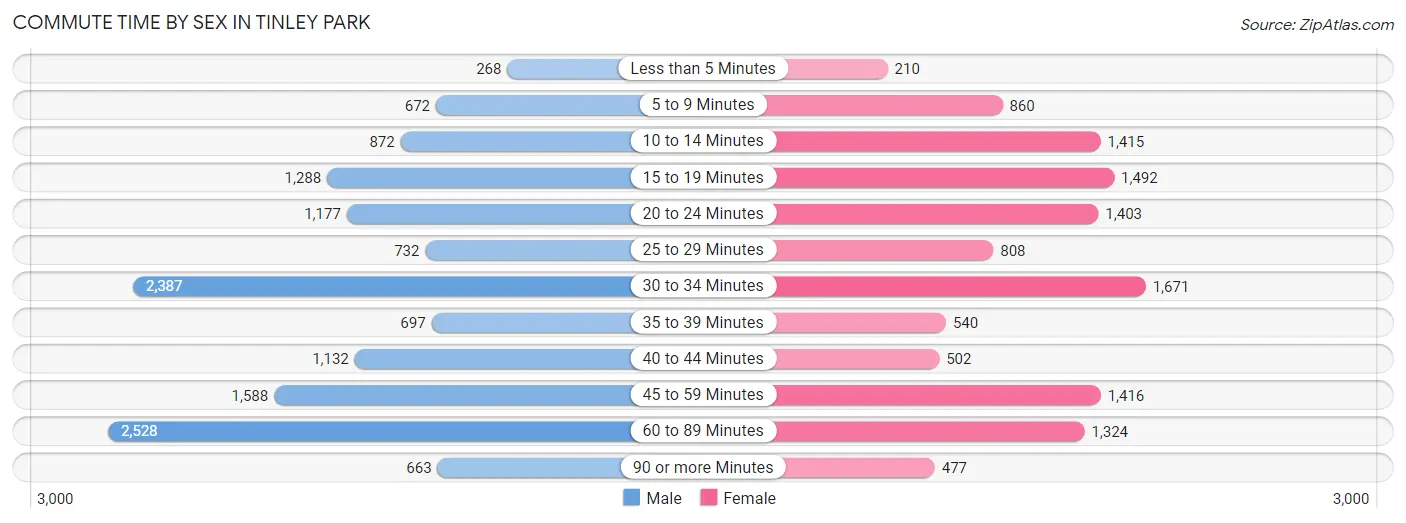
| Commute Time | Male | Female |
| Less than 5 Minutes | 268 (1.9%) | 210 (1.7%) |
| 5 to 9 Minutes | 672 (4.8%) | 860 (7.1%) |
| 10 to 14 Minutes | 872 (6.2%) | 1,415 (11.7%) |
| 15 to 19 Minutes | 1,288 (9.2%) | 1,492 (12.3%) |
| 20 to 24 Minutes | 1,177 (8.4%) | 1,403 (11.6%) |
| 25 to 29 Minutes | 732 (5.2%) | 808 (6.7%) |
| 30 to 34 Minutes | 2,387 (17.1%) | 1,671 (13.8%) |
| 35 to 39 Minutes | 697 (5.0%) | 540 (4.5%) |
| 40 to 44 Minutes | 1,132 (8.1%) | 502 (4.1%) |
| 45 to 59 Minutes | 1,588 (11.3%) | 1,416 (11.7%) |
| 60 to 89 Minutes | 2,528 (18.0%) | 1,324 (10.9%) |
| 90 or more Minutes | 663 (4.7%) | 477 (3.9%) |
Time of Departure to Work by Sex in Tinley Park
The most frequent times of departure to work in Tinley Park are 7:00 AM to 7:29 AM (2,009, 14.3%) for males and 7:00 AM to 7:29 AM (2,106, 17.4%) for females.
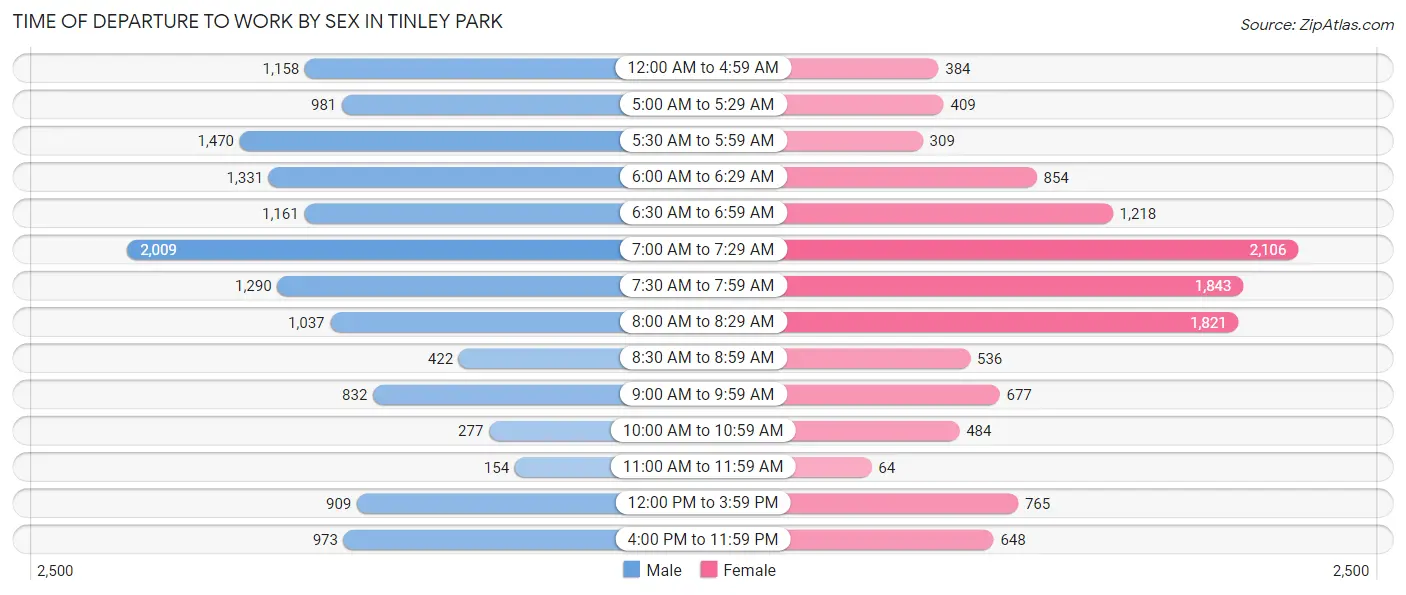
| Time of Departure | Male | Female |
| 12:00 AM to 4:59 AM | 1,158 (8.3%) | 384 (3.2%) |
| 5:00 AM to 5:29 AM | 981 (7.0%) | 409 (3.4%) |
| 5:30 AM to 5:59 AM | 1,470 (10.5%) | 309 (2.5%) |
| 6:00 AM to 6:29 AM | 1,331 (9.5%) | 854 (7.0%) |
| 6:30 AM to 6:59 AM | 1,161 (8.3%) | 1,218 (10.1%) |
| 7:00 AM to 7:29 AM | 2,009 (14.3%) | 2,106 (17.4%) |
| 7:30 AM to 7:59 AM | 1,290 (9.2%) | 1,843 (15.2%) |
| 8:00 AM to 8:29 AM | 1,037 (7.4%) | 1,821 (15.0%) |
| 8:30 AM to 8:59 AM | 422 (3.0%) | 536 (4.4%) |
| 9:00 AM to 9:59 AM | 832 (5.9%) | 677 (5.6%) |
| 10:00 AM to 10:59 AM | 277 (2.0%) | 484 (4.0%) |
| 11:00 AM to 11:59 AM | 154 (1.1%) | 64 (0.5%) |
| 12:00 PM to 3:59 PM | 909 (6.5%) | 765 (6.3%) |
| 4:00 PM to 11:59 PM | 973 (7.0%) | 648 (5.3%) |
| Total | 14,004 (100.0%) | 12,118 (100.0%) |
Housing Occupancy in Tinley Park
Occupancy by Ownership in Tinley Park
Of the total 21,873 dwellings in Tinley Park, owner-occupied units account for 19,128 (87.5%), while renter-occupied units make up 2,745 (12.6%).
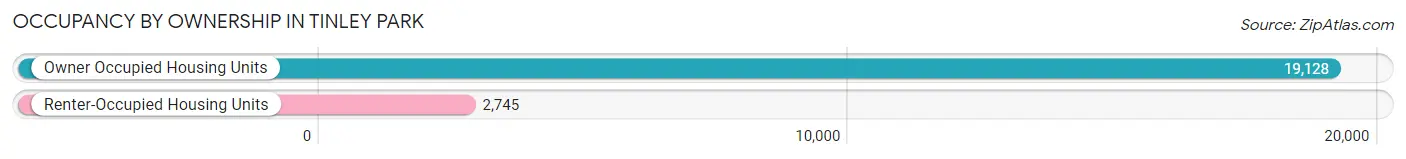
| Occupancy | # Housing Units | % Housing Units |
| Owner Occupied Housing Units | 19,128 | 87.5% |
| Renter-Occupied Housing Units | 2,745 | 12.6% |
| Total Occupied Housing Units | 21,873 | 100.0% |
Occupancy by Household Size in Tinley Park
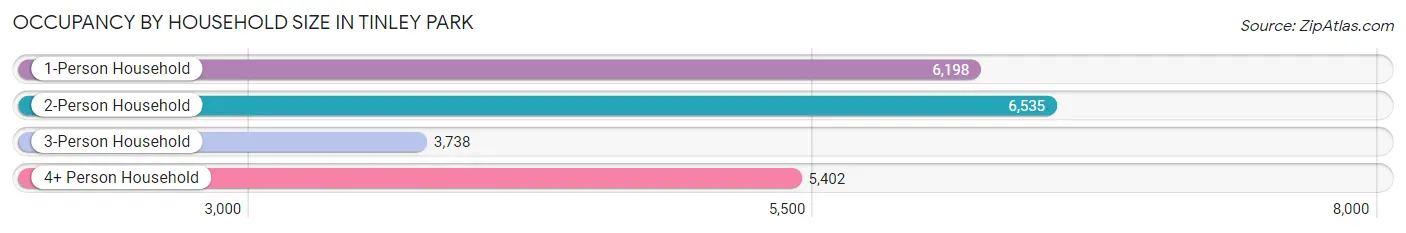
| Household Size | # Housing Units | % Housing Units |
| 1-Person Household | 6,198 | 28.3% |
| 2-Person Household | 6,535 | 29.9% |
| 3-Person Household | 3,738 | 17.1% |
| 4+ Person Household | 5,402 | 24.7% |
| Total Housing Units | 21,873 | 100.0% |
Occupancy by Ownership by Household Size in Tinley Park
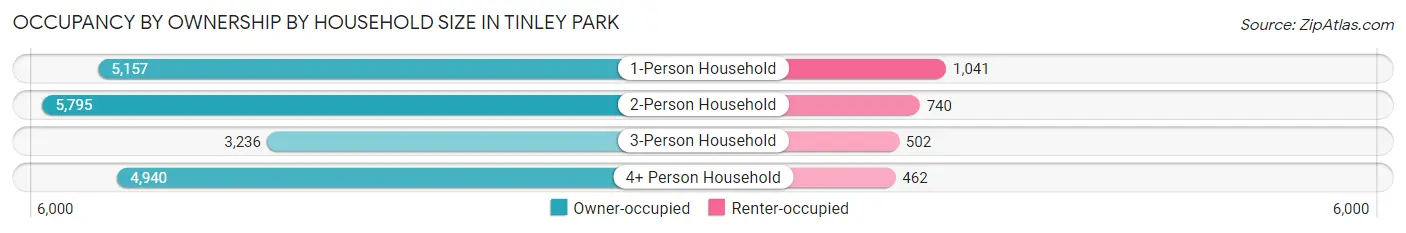
| Household Size | Owner-occupied | Renter-occupied |
| 1-Person Household | 5,157 (83.2%) | 1,041 (16.8%) |
| 2-Person Household | 5,795 (88.7%) | 740 (11.3%) |
| 3-Person Household | 3,236 (86.6%) | 502 (13.4%) |
| 4+ Person Household | 4,940 (91.4%) | 462 (8.6%) |
| Total Housing Units | 19,128 (87.5%) | 2,745 (12.6%) |
Occupancy by Educational Attainment in Tinley Park
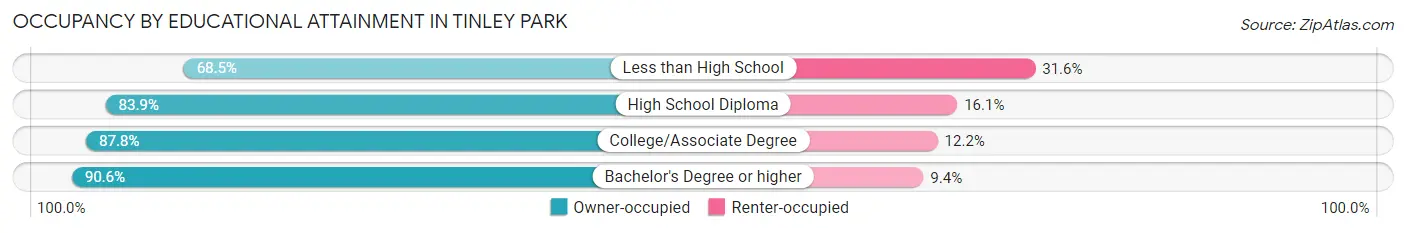
| Household Size | Owner-occupied | Renter-occupied |
| Less than High School | 423 (68.4%) | 195 (31.6%) |
| High School Diploma | 4,517 (83.9%) | 865 (16.1%) |
| College/Associate Degree | 6,204 (87.8%) | 861 (12.2%) |
| Bachelor's Degree or higher | 7,984 (90.6%) | 824 (9.4%) |
Occupancy by Age of Householder in Tinley Park
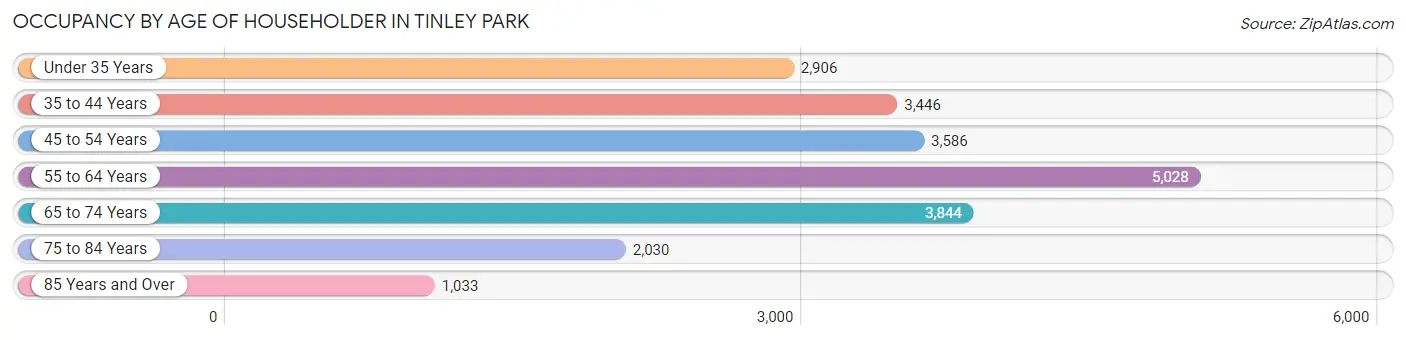
| Age Bracket | # Households | % Households |
| Under 35 Years | 2,906 | 13.3% |
| 35 to 44 Years | 3,446 | 15.8% |
| 45 to 54 Years | 3,586 | 16.4% |
| 55 to 64 Years | 5,028 | 23.0% |
| 65 to 74 Years | 3,844 | 17.6% |
| 75 to 84 Years | 2,030 | 9.3% |
| 85 Years and Over | 1,033 | 4.7% |
| Total | 21,873 | 100.0% |
Housing Finances in Tinley Park
Median Income by Occupancy in Tinley Park
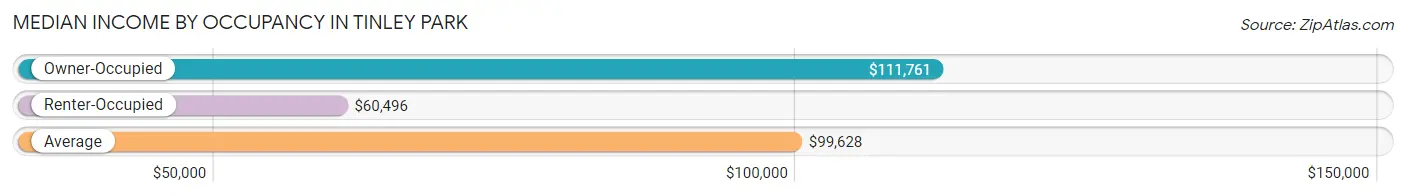
| Occupancy Type | # Households | Median Income |
| Owner-Occupied | 19,128 (87.5%) | $111,761 |
| Renter-Occupied | 2,745 (12.6%) | $60,496 |
| Average | 21,873 (100.0%) | $99,628 |
Occupancy by Householder Income Bracket in Tinley Park
| Income Bracket | Owner-occupied | Renter-occupied |
| Less than $5,000 | 286 (1.5%) | 124 (4.5%) |
| $5,000 to $9,999 | 68 (0.4%) | 66 (2.4%) |
| $10,000 to $14,999 | 240 (1.3%) | 127 (4.6%) |
| $15,000 to $19,999 | 236 (1.2%) | 126 (4.6%) |
| $20,000 to $24,999 | 434 (2.3%) | 120 (4.4%) |
| $25,000 to $34,999 | 761 (4.0%) | 172 (6.3%) |
| $35,000 to $49,999 | 1,289 (6.7%) | 327 (11.9%) |
| $50,000 to $74,999 | 2,515 (13.2%) | 657 (23.9%) |
| $75,000 to $99,999 | 2,970 (15.5%) | 461 (16.8%) |
| $100,000 to $149,999 | 4,105 (21.5%) | 443 (16.1%) |
| $150,000 or more | 6,224 (32.5%) | 122 (4.4%) |
| Total | 19,128 (100.0%) | 2,745 (100.0%) |
Monthly Housing Cost Tiers in Tinley Park
| Monthly Cost | Owner-occupied | Renter-occupied |
| Less than $300 | 202 (1.1%) | 27 (1.0%) |
| $300 to $499 | 533 (2.8%) | 43 (1.6%) |
| $500 to $799 | 1,873 (9.8%) | 72 (2.6%) |
| $800 to $999 | 2,224 (11.6%) | 110 (4.0%) |
| $1,000 to $1,499 | 3,766 (19.7%) | 1,203 (43.8%) |
| $1,500 to $1,999 | 3,367 (17.6%) | 692 (25.2%) |
| $2,000 to $2,499 | 3,092 (16.2%) | 307 (11.2%) |
| $2,500 to $2,999 | 1,959 (10.2%) | 104 (3.8%) |
| $3,000 or more | 2,112 (11.0%) | 0 (0.0%) |
| Total | 19,128 (100.0%) | 2,745 (100.0%) |
Physical Housing Characteristics in Tinley Park
Housing Structures in Tinley Park
| Structure Type | # Housing Units | % Housing Units |
| Single Unit, Detached | 12,410 | 56.7% |
| Single Unit, Attached | 4,662 | 21.3% |
| 2 Unit Apartments | 154 | 0.7% |
| 3 or 4 Unit Apartments | 879 | 4.0% |
| 5 to 9 Unit Apartments | 1,007 | 4.6% |
| 10 or more Apartments | 2,761 | 12.6% |
| Mobile Home / Other | 0 | 0.0% |
| Total | 21,873 | 100.0% |
Housing Structures by Occupancy in Tinley Park
| Structure Type | Owner-occupied | Renter-occupied |
| Single Unit, Detached | 11,889 (95.8%) | 521 (4.2%) |
| Single Unit, Attached | 4,434 (95.1%) | 228 (4.9%) |
| 2 Unit Apartments | 103 (66.9%) | 51 (33.1%) |
| 3 or 4 Unit Apartments | 650 (74.0%) | 229 (26.1%) |
| 5 to 9 Unit Apartments | 574 (57.0%) | 433 (43.0%) |
| 10 or more Apartments | 1,478 (53.5%) | 1,283 (46.5%) |
| Mobile Home / Other | 0 (0.0%) | 0 (0.0%) |
| Total | 19,128 (87.5%) | 2,745 (12.6%) |
Housing Structures by Number of Rooms in Tinley Park
| Number of Rooms | Owner-occupied | Renter-occupied |
| 1 Room | 0 (0.0%) | 101 (3.7%) |
| 2 or 3 Rooms | 456 (2.4%) | 582 (21.2%) |
| 4 or 5 Rooms | 5,276 (27.6%) | 1,454 (53.0%) |
| 6 or 7 Rooms | 7,630 (39.9%) | 425 (15.5%) |
| 8 or more Rooms | 5,766 (30.1%) | 183 (6.7%) |
| Total | 19,128 (100.0%) | 2,745 (100.0%) |
Housing Structure by Heating Type in Tinley Park
| Heating Type | Owner-occupied | Renter-occupied |
| Utility Gas | 18,179 (95.0%) | 1,948 (71.0%) |
| Bottled, Tank, or LP Gas | 50 (0.3%) | 41 (1.5%) |
| Electricity | 874 (4.6%) | 756 (27.5%) |
| Fuel Oil or Kerosene | 0 (0.0%) | 0 (0.0%) |
| Coal or Coke | 0 (0.0%) | 0 (0.0%) |
| All other Fuels | 15 (0.1%) | 0 (0.0%) |
| No Fuel Used | 10 (0.1%) | 0 (0.0%) |
| Total | 19,128 (100.0%) | 2,745 (100.0%) |
Household Vehicle Usage in Tinley Park
| Vehicles per Household | Owner-occupied | Renter-occupied |
| No Vehicle | 344 (1.8%) | 263 (9.6%) |
| 1 Vehicle | 6,184 (32.3%) | 1,285 (46.8%) |
| 2 Vehicles | 8,360 (43.7%) | 1,023 (37.3%) |
| 3 or more Vehicles | 4,240 (22.2%) | 174 (6.3%) |
| Total | 19,128 (100.0%) | 2,745 (100.0%) |
Real Estate & Mortgages in Tinley Park
Real Estate and Mortgage Overview in Tinley Park
| Characteristic | Without Mortgage | With Mortgage |
| Housing Units | 6,922 | 12,206 |
| Median Property Value | $267,100 | $284,200 |
| Median Household Income | $79,614 | $4,650 |
| Monthly Housing Costs | $908 | $2,081 |
| Real Estate Taxes | $6,487 | $110 |
Property Value by Mortgage Status in Tinley Park
| Property Value | Without Mortgage | With Mortgage |
| Less than $50,000 | 344 (5.0%) | 163 (1.3%) |
| $50,000 to $99,999 | 142 (2.1%) | 98 (0.8%) |
| $100,000 to $299,999 | 3,862 (55.8%) | 6,649 (54.5%) |
| $300,000 to $499,999 | 2,152 (31.1%) | 4,769 (39.1%) |
| $500,000 to $749,999 | 297 (4.3%) | 470 (3.8%) |
| $750,000 to $999,999 | 0 (0.0%) | 30 (0.3%) |
| $1,000,000 or more | 125 (1.8%) | 27 (0.2%) |
| Total | 6,922 (100.0%) | 12,206 (100.0%) |
Household Income by Mortgage Status in Tinley Park
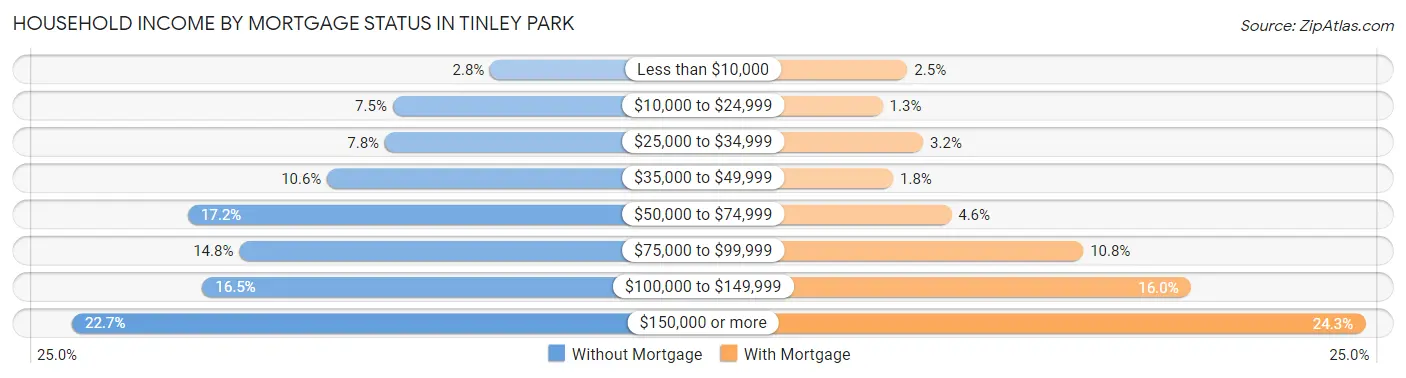
| Household Income | Without Mortgage | With Mortgage |
| Less than $10,000 | 196 (2.8%) | 302 (2.5%) |
| $10,000 to $24,999 | 517 (7.5%) | 158 (1.3%) |
| $25,000 to $34,999 | 543 (7.8%) | 393 (3.2%) |
| $35,000 to $49,999 | 733 (10.6%) | 218 (1.8%) |
| $50,000 to $74,999 | 1,192 (17.2%) | 556 (4.6%) |
| $75,000 to $99,999 | 1,023 (14.8%) | 1,323 (10.8%) |
| $100,000 to $149,999 | 1,144 (16.5%) | 1,947 (16.0%) |
| $150,000 or more | 1,574 (22.7%) | 2,961 (24.3%) |
| Total | 6,922 (100.0%) | 12,206 (100.0%) |
Property Value to Household Income Ratio in Tinley Park
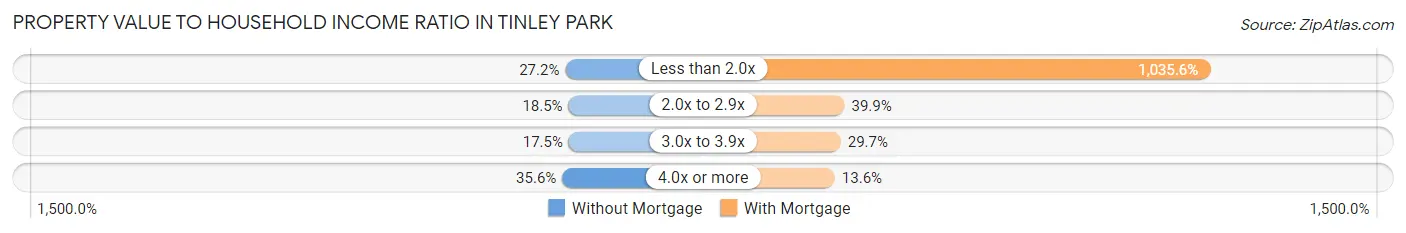
| Value-to-Income Ratio | Without Mortgage | With Mortgage |
| Less than 2.0x | 1,884 (27.2%) | 126,402 (1,035.6%) |
| 2.0x to 2.9x | 1,280 (18.5%) | 4,864 (39.9%) |
| 3.0x to 3.9x | 1,213 (17.5%) | 3,627 (29.7%) |
| 4.0x or more | 2,465 (35.6%) | 1,660 (13.6%) |
| Total | 6,922 (100.0%) | 12,206 (100.0%) |
Real Estate Taxes by Mortgage Status in Tinley Park
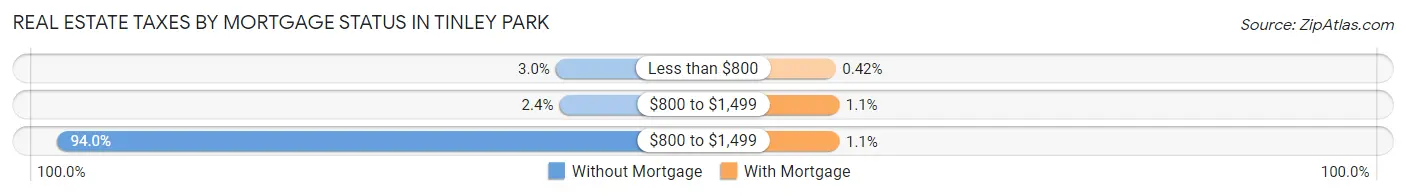
| Property Taxes | Without Mortgage | With Mortgage |
| Less than $800 | 208 (3.0%) | 51 (0.4%) |
| $800 to $1,499 | 163 (2.4%) | 129 (1.1%) |
| $800 to $1,499 | 6,504 (94.0%) | 133 (1.1%) |
| Total | 6,922 (100.0%) | 12,206 (100.0%) |
Health & Disability in Tinley Park
Health Insurance Coverage by Age in Tinley Park
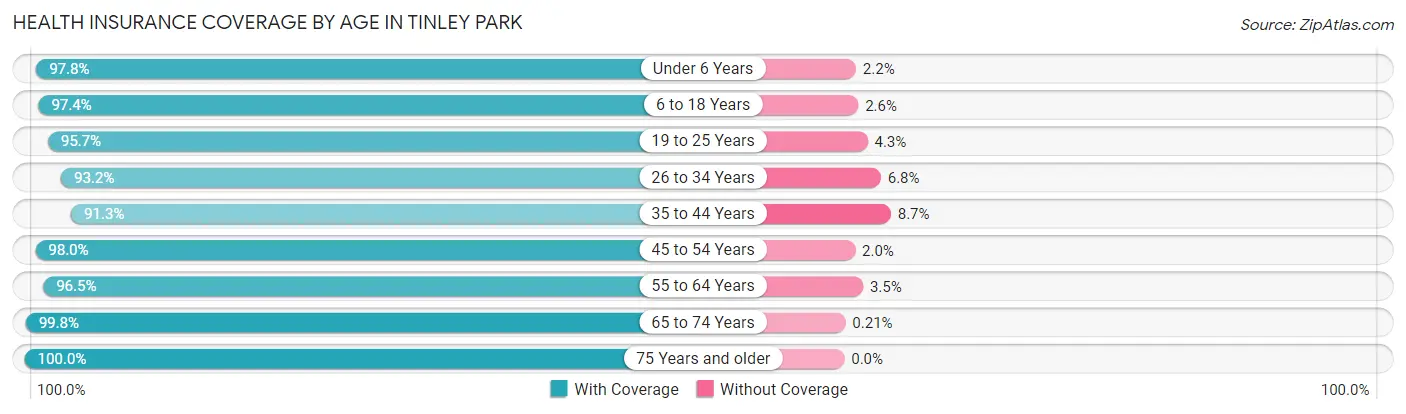
| Age Bracket | With Coverage | Without Coverage |
| Under 6 Years | 3,296 (97.8%) | 73 (2.2%) |
| 6 to 18 Years | 8,498 (97.4%) | 226 (2.6%) |
| 19 to 25 Years | 4,150 (95.7%) | 188 (4.3%) |
| 26 to 34 Years | 5,910 (93.2%) | 431 (6.8%) |
| 35 to 44 Years | 6,414 (91.3%) | 609 (8.7%) |
| 45 to 54 Years | 6,781 (98.0%) | 139 (2.0%) |
| 55 to 64 Years | 8,024 (96.5%) | 289 (3.5%) |
| 65 to 74 Years | 6,215 (99.8%) | 13 (0.2%) |
| 75 Years and older | 4,291 (100.0%) | 0 (0.0%) |
| Total | 53,579 (96.5%) | 1,968 (3.5%) |
Health Insurance Coverage by Citizenship Status in Tinley Park
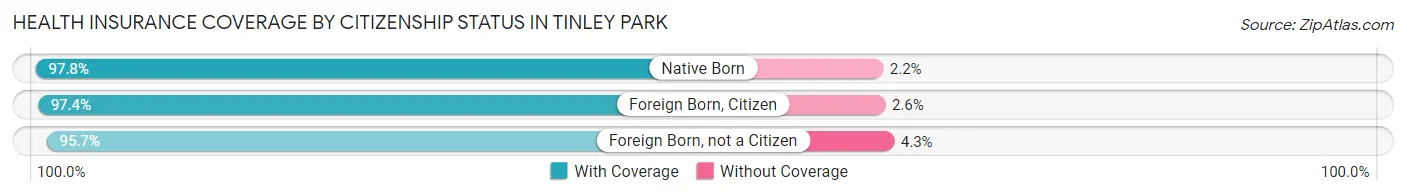
| Citizenship Status | With Coverage | Without Coverage |
| Native Born | 3,296 (97.8%) | 73 (2.2%) |
| Foreign Born, Citizen | 8,498 (97.4%) | 226 (2.6%) |
| Foreign Born, not a Citizen | 4,150 (95.7%) | 188 (4.3%) |
Health Insurance Coverage by Household Income in Tinley Park
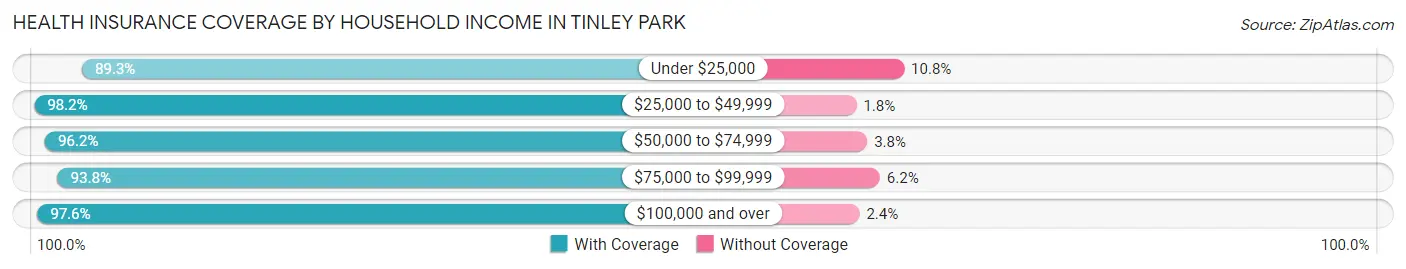
| Household Income | With Coverage | Without Coverage |
| Under $25,000 | 2,749 (89.2%) | 331 (10.7%) |
| $25,000 to $49,999 | 4,004 (98.2%) | 74 (1.8%) |
| $50,000 to $74,999 | 6,151 (96.2%) | 245 (3.8%) |
| $75,000 to $99,999 | 7,903 (93.8%) | 522 (6.2%) |
| $100,000 and over | 32,711 (97.6%) | 796 (2.4%) |
Public vs Private Health Insurance Coverage by Age in Tinley Park
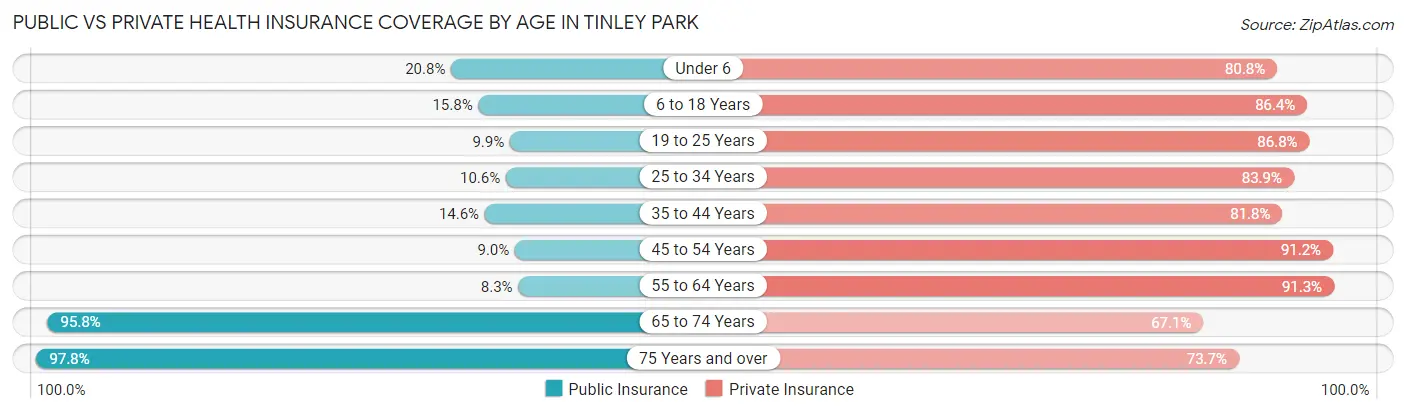
| Age Bracket | Public Insurance | Private Insurance |
| Under 6 | 701 (20.8%) | 2,722 (80.8%) |
| 6 to 18 Years | 1,374 (15.8%) | 7,536 (86.4%) |
| 19 to 25 Years | 429 (9.9%) | 3,765 (86.8%) |
| 25 to 34 Years | 674 (10.6%) | 5,320 (83.9%) |
| 35 to 44 Years | 1,022 (14.5%) | 5,742 (81.8%) |
| 45 to 54 Years | 619 (8.9%) | 6,308 (91.2%) |
| 55 to 64 Years | 693 (8.3%) | 7,593 (91.3%) |
| 65 to 74 Years | 5,964 (95.8%) | 4,178 (67.1%) |
| 75 Years and over | 4,197 (97.8%) | 3,162 (73.7%) |
| Total | 15,673 (28.2%) | 46,326 (83.4%) |
Disability Status by Sex by Age in Tinley Park
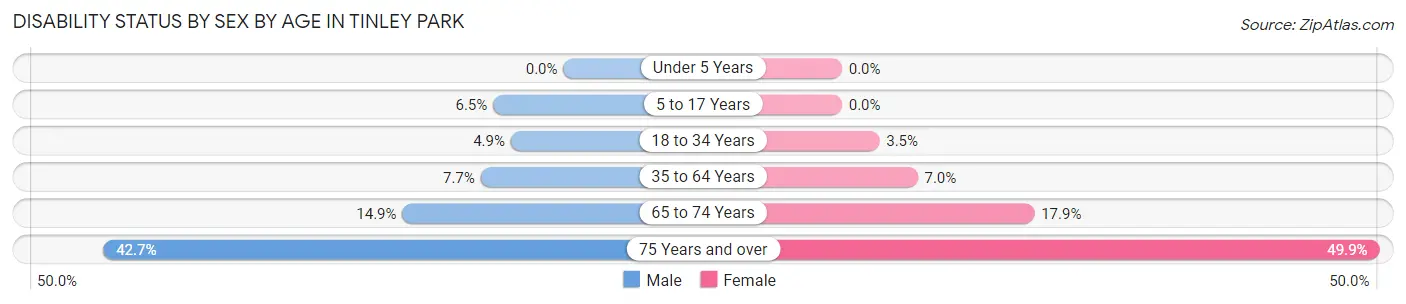
| Age Bracket | Male | Female |
| Under 5 Years | 0 (0.0%) | 0 (0.0%) |
| 5 to 17 Years | 299 (6.5%) | 0 (0.0%) |
| 18 to 34 Years | 306 (4.9%) | 174 (3.5%) |
| 35 to 64 Years | 830 (7.7%) | 804 (7.0%) |
| 65 to 74 Years | 436 (14.9%) | 591 (17.9%) |
| 75 Years and over | 717 (42.7%) | 1,303 (49.9%) |
Disability Class by Sex by Age in Tinley Park
Disability Class: Hearing Difficulty
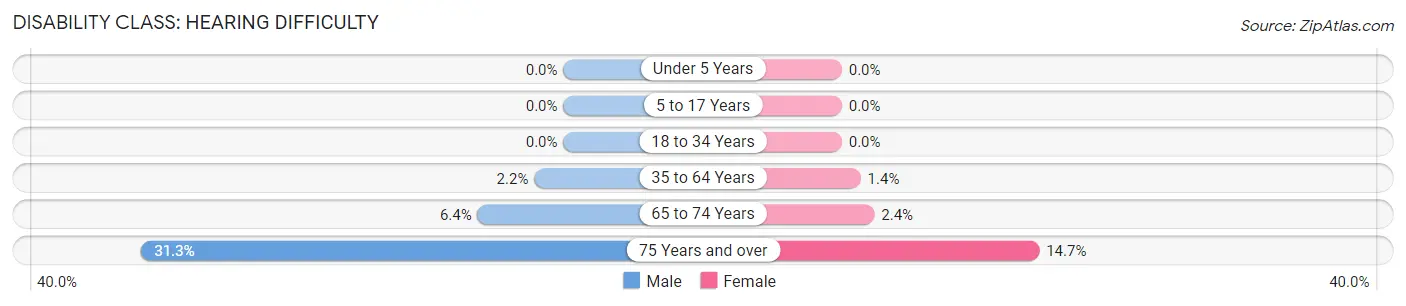
| Age Bracket | Male | Female |
| Under 5 Years | 0 (0.0%) | 0 (0.0%) |
| 5 to 17 Years | 0 (0.0%) | 0 (0.0%) |
| 18 to 34 Years | 0 (0.0%) | 0 (0.0%) |
| 35 to 64 Years | 234 (2.2%) | 160 (1.4%) |
| 65 to 74 Years | 186 (6.4%) | 80 (2.4%) |
| 75 Years and over | 526 (31.3%) | 383 (14.7%) |
Disability Class: Vision Difficulty
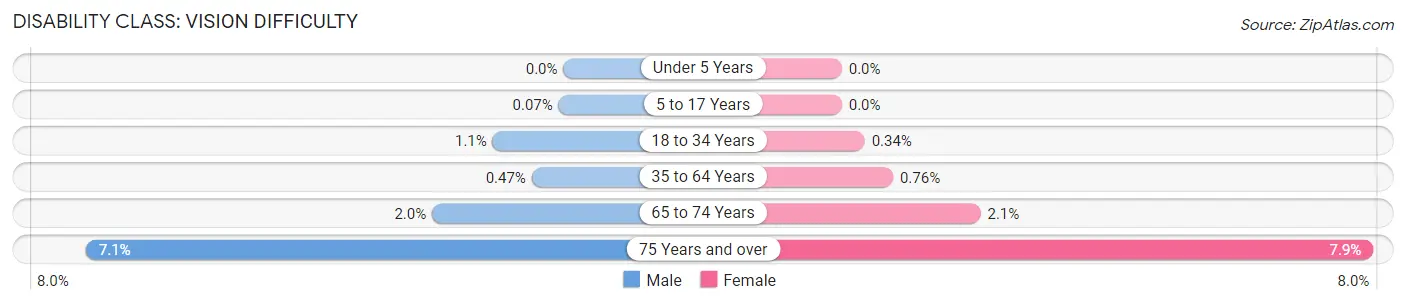
| Age Bracket | Male | Female |
| Under 5 Years | 0 (0.0%) | 0 (0.0%) |
| 5 to 17 Years | 3 (0.1%) | 0 (0.0%) |
| 18 to 34 Years | 66 (1.1%) | 17 (0.3%) |
| 35 to 64 Years | 51 (0.5%) | 87 (0.8%) |
| 65 to 74 Years | 57 (1.9%) | 68 (2.1%) |
| 75 Years and over | 119 (7.1%) | 206 (7.9%) |
Disability Class: Cognitive Difficulty
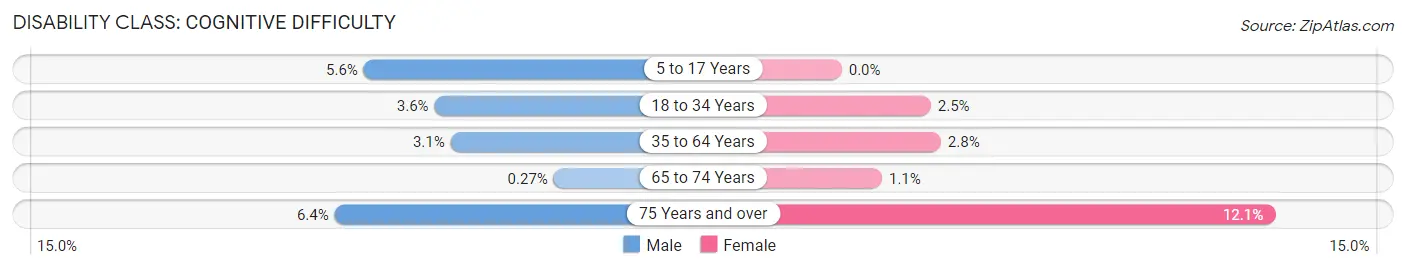
| Age Bracket | Male | Female |
| 5 to 17 Years | 255 (5.6%) | 0 (0.0%) |
| 18 to 34 Years | 225 (3.6%) | 124 (2.5%) |
| 35 to 64 Years | 340 (3.1%) | 316 (2.8%) |
| 65 to 74 Years | 8 (0.3%) | 37 (1.1%) |
| 75 Years and over | 107 (6.4%) | 315 (12.1%) |
Disability Class: Ambulatory Difficulty
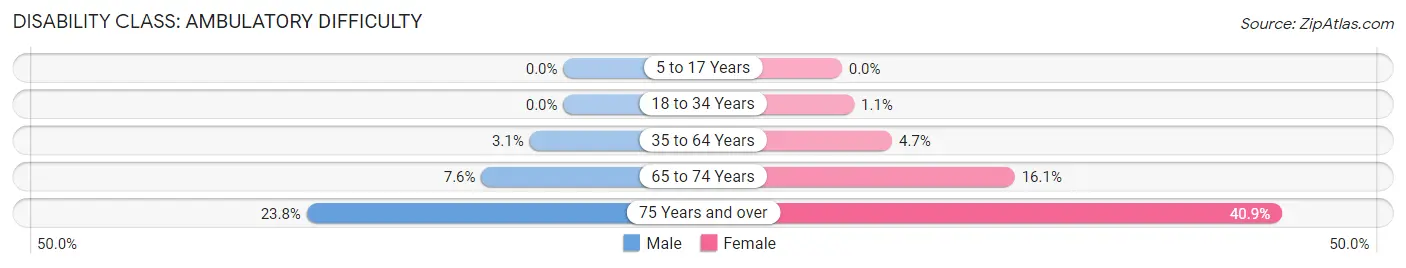
| Age Bracket | Male | Female |
| 5 to 17 Years | 0 (0.0%) | 0 (0.0%) |
| 18 to 34 Years | 0 (0.0%) | 57 (1.1%) |
| 35 to 64 Years | 340 (3.1%) | 534 (4.7%) |
| 65 to 74 Years | 222 (7.6%) | 531 (16.1%) |
| 75 Years and over | 400 (23.8%) | 1,067 (40.8%) |
Disability Class: Self-Care Difficulty
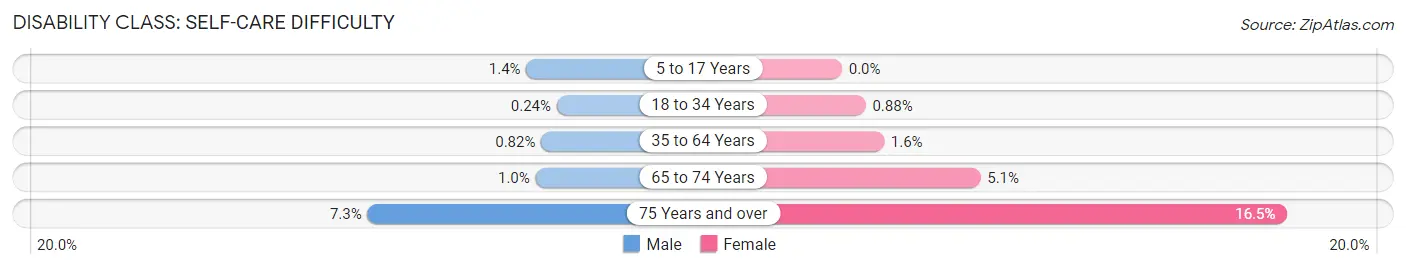
| Age Bracket | Male | Female |
| 5 to 17 Years | 63 (1.4%) | 0 (0.0%) |
| 18 to 34 Years | 15 (0.2%) | 44 (0.9%) |
| 35 to 64 Years | 89 (0.8%) | 179 (1.6%) |
| 65 to 74 Years | 30 (1.0%) | 170 (5.1%) |
| 75 Years and over | 122 (7.3%) | 432 (16.5%) |
Technology Access in Tinley Park
Computing Device Access in Tinley Park
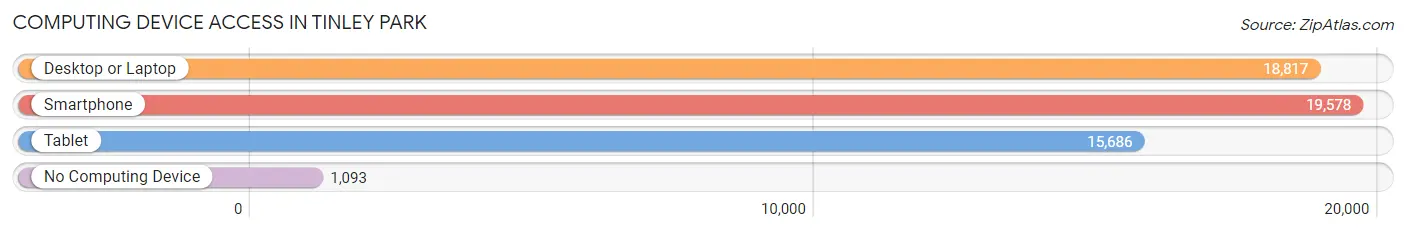
| Device Type | # Households | % Households |
| Desktop or Laptop | 18,817 | 86.0% |
| Smartphone | 19,578 | 89.5% |
| Tablet | 15,686 | 71.7% |
| No Computing Device | 1,093 | 5.0% |
| Total | 21,873 | 100.0% |
Internet Access in Tinley Park
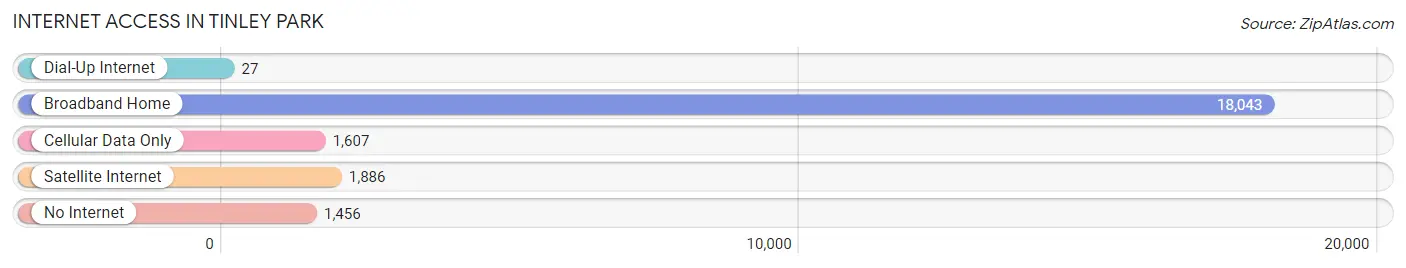
| Internet Type | # Households | % Households |
| Dial-Up Internet | 27 | 0.1% |
| Broadband Home | 18,043 | 82.5% |
| Cellular Data Only | 1,607 | 7.3% |
| Satellite Internet | 1,886 | 8.6% |
| No Internet | 1,456 | 6.7% |
| Total | 21,873 | 100.0% |
Tinley Park Summary
Tinley Park is a village located in Cook County, Illinois, United States. It is a suburb of Chicago, located approximately 30 miles southwest of the city. As of the 2010 census, the village had a population of 56,703, making it the largest village in Illinois.
History
Tinley Park was first settled in the 1830s by a group of German immigrants. The village was originally known as Bremen, but was later renamed Tinley Park in honor of Samuel Tinley, a local politician. Tinley Park was incorporated as a village in 1892.
In the early 20th century, Tinley Park was a rural farming community. The village experienced rapid growth in the 1950s and 1960s, as the population of Chicago began to expand outward. By the 1970s, Tinley Park had become a suburban community, with many of its residents commuting to Chicago for work.
Geography
Tinley Park is located in northeastern Illinois, in Cook County. It is situated on the Tinley Moraine, an area of rolling hills and wetlands. The village is bordered by Orland Park to the north, Oak Forest to the east, and Mokena to the south. The village is located approximately 30 miles southwest of downtown Chicago.
The village has a total area of 16.2 square miles, of which 16.1 square miles is land and 0.1 square miles is water. The village is located in the Tinley Creek watershed.
Economy
Tinley Park has a diverse economy, with a mix of retail, manufacturing, and service-based businesses. The village is home to several large employers, including the Tinley Park Mental Health Center, the Tinley Park Convention Center, and the Tinley Park Public Library.
The village is also home to several shopping centers, including the Tinley Park Mall, the Orland Square Mall, and the Oak Forest Plaza. Tinley Park is also home to several restaurants, bars, and entertainment venues.
Demographics
As of the 2010 census, the village had a population of 56,703. The racial makeup of the village was 79.2% White, 8.3% African American, 0.3% Native American, 5.2% Asian, and 4.9% from other races. Hispanic or Latino of any race were 13.3% of the population.
The median household income in Tinley Park was $72,845, and the median family income was $86,845. The per capita income for the village was $31,945. About 4.2% of families and 5.7% of the population were below the poverty line.
Tinley Park is served by several school districts, including the Tinley Park-Park District School District, the Orland School District, and the Oak Forest School District. The village is also home to several higher education institutions, including Moraine Valley Community College and the University of St. Francis.
Common Questions
What is Per Capita Income in Tinley Park?
Per Capita income in Tinley Park is $49,079.
What is the Median Family Income in Tinley Park?
Median Family Income in Tinley Park is $123,750.
What is the Median Household income in Tinley Park?
Median Household Income in Tinley Park is $99,628.
What is Income or Wage Gap in Tinley Park?
Income or Wage Gap in Tinley Park is 27.8%.
Women in Tinley Park earn 72.2 cents for every dollar earned by a man.
What is Family Income Deficit in Tinley Park?
Family Income Deficit in Tinley Park is $13,982.
Families that are below poverty line in Tinley Park earn $13,982 less on average than the poverty threshold level.
What is Inequality or Gini Index in Tinley Park?
Inequality or Gini Index in Tinley Park is 0.40.
What is the Total Population of Tinley Park?
Total Population of Tinley Park is 55,571.
What is the Total Male Population of Tinley Park?
Total Male Population of Tinley Park is 27,702.
What is the Total Female Population of Tinley Park?
Total Female Population of Tinley Park is 27,869.
What is the Ratio of Males per 100 Females in Tinley Park?
There are 99.40 Males per 100 Females in Tinley Park.
What is the Ratio of Females per 100 Males in Tinley Park?
There are 100.60 Females per 100 Males in Tinley Park.
What is the Median Population Age in Tinley Park?
Median Population Age in Tinley Park is 41.6 Years.
What is the Average Family Size in Tinley Park
Average Family Size in Tinley Park is 3.1 People.
What is the Average Household Size in Tinley Park
Average Household Size in Tinley Park is 2.5 People.
How Large is the Labor Force in Tinley Park?
There are 30,984 People in the Labor Forcein in Tinley Park.
What is the Percentage of People in the Labor Force in Tinley Park?
68.3% of People are in the Labor Force in Tinley Park.
What is the Unemployment Rate in Tinley Park?
Unemployment Rate in Tinley Park is 5.7%.