Mendota, IL Map & Demographics
Mendota Map
Mendota Overview
$30,024
PER CAPITA INCOME
$72,841
AVG FAMILY INCOME
$60,601
AVG HOUSEHOLD INCOME
49.0%
WAGE / INCOME GAP [ % ]
51.0¢/ $1
WAGE / INCOME GAP [ $ ]
0.41
INEQUALITY / GINI INDEX
6,961
TOTAL POPULATION
3,498
MALE POPULATION
3,463
FEMALE POPULATION
101.01
MALES / 100 FEMALES
99.00
FEMALES / 100 MALES
38.9
MEDIAN AGE
3.0
AVG FAMILY SIZE
2.4
AVG HOUSEHOLD SIZE
3,551
LABOR FORCE [ PEOPLE ]
63.6%
PERCENT IN LABOR FORCE
3.8%
UNEMPLOYMENT RATE
Mendota Zip Codes
Mendota Area Codes
Income in Mendota
Income Overview in Mendota
Per Capita Income in Mendota is $30,024, while median incomes of families and households are $72,841 and $60,601 respectively.
| Characteristic | Number | Measure |
| Per Capita Income | 6,961 | $30,024 |
| Median Family Income | 1,877 | $72,841 |
| Mean Family Income | 1,877 | $80,271 |
| Median Household Income | 2,791 | $60,601 |
| Mean Household Income | 2,791 | $71,535 |
| Income Deficit | 1,877 | $0 |
| Wage / Income Gap (%) | 6,961 | 48.97% |
| Wage / Income Gap ($) | 6,961 | 51.03¢ per $1 |
| Gini / Inequality Index | 6,961 | 0.41 |
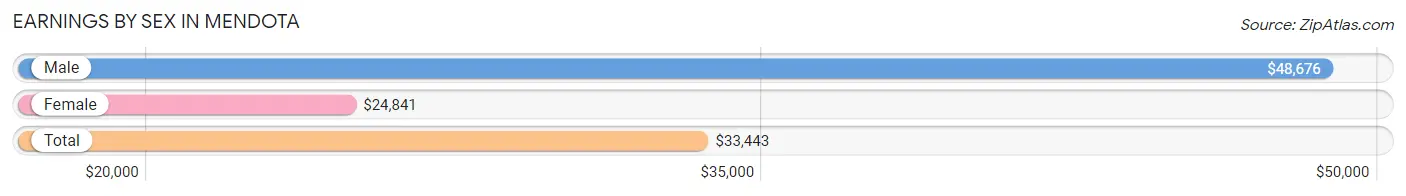
Earnings by Sex in Mendota
Average Earnings in Mendota are $33,443, $48,676 for men and $24,841 for women, a difference of 49.0%.
| Sex | Number | Average Earnings |
| Male | 1,879 (50.8%) | $48,676 |
| Female | 1,817 (49.2%) | $24,841 |
| Total | 3,696 (100.0%) | $33,443 |
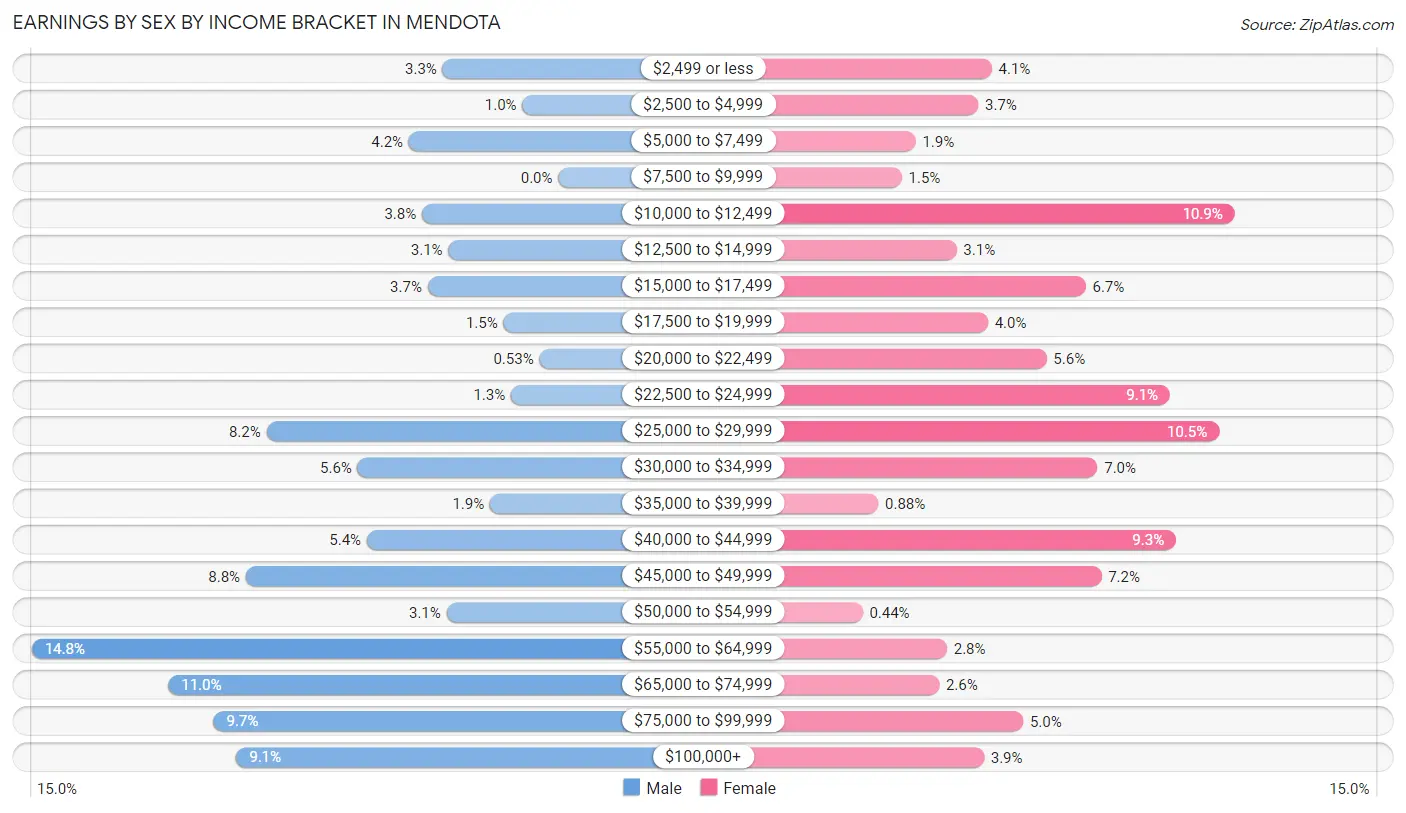
Earnings by Sex by Income Bracket in Mendota
The most common earnings brackets in Mendota are $55,000 to $64,999 for men (278 | 14.8%) and $10,000 to $12,499 for women (198 | 10.9%).
| Income | Male | Female |
| $2,499 or less | 61 (3.3%) | 74 (4.1%) |
| $2,500 to $4,999 | 19 (1.0%) | 67 (3.7%) |
| $5,000 to $7,499 | 79 (4.2%) | 35 (1.9%) |
| $7,500 to $9,999 | 0 (0.0%) | 28 (1.5%) |
| $10,000 to $12,499 | 72 (3.8%) | 198 (10.9%) |
| $12,500 to $14,999 | 58 (3.1%) | 56 (3.1%) |
| $15,000 to $17,499 | 69 (3.7%) | 122 (6.7%) |
| $17,500 to $19,999 | 29 (1.5%) | 72 (4.0%) |
| $20,000 to $22,499 | 10 (0.5%) | 102 (5.6%) |
| $22,500 to $24,999 | 25 (1.3%) | 165 (9.1%) |
| $25,000 to $29,999 | 154 (8.2%) | 190 (10.5%) |
| $30,000 to $34,999 | 106 (5.6%) | 128 (7.0%) |
| $35,000 to $39,999 | 36 (1.9%) | 16 (0.9%) |
| $40,000 to $44,999 | 101 (5.4%) | 168 (9.2%) |
| $45,000 to $49,999 | 165 (8.8%) | 130 (7.1%) |
| $50,000 to $54,999 | 59 (3.1%) | 8 (0.4%) |
| $55,000 to $64,999 | 278 (14.8%) | 51 (2.8%) |
| $65,000 to $74,999 | 206 (11.0%) | 47 (2.6%) |
| $75,000 to $99,999 | 182 (9.7%) | 90 (5.0%) |
| $100,000+ | 170 (9.0%) | 70 (3.8%) |
| Total | 1,879 (100.0%) | 1,817 (100.0%) |
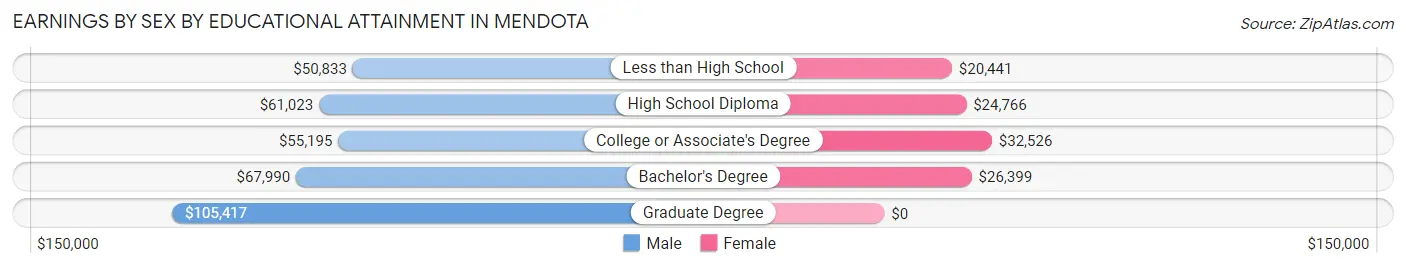
Earnings by Sex by Educational Attainment in Mendota
Average earnings in Mendota are $58,471 for men and $28,409 for women, a difference of 51.4%. Men with an educational attainment of graduate degree enjoy the highest average annual earnings of $105,417, while those with less than high school education earn the least with $50,833. Women with an educational attainment of college or associate's degree earn the most with the average annual earnings of $32,526, while those with less than high school education have the smallest earnings of $20,441.
| Educational Attainment | Male Income | Female Income |
| Less than High School | $50,833 | $20,441 |
| High School Diploma | $61,023 | $24,766 |
| College or Associate's Degree | $55,195 | $32,526 |
| Bachelor's Degree | $67,990 | $26,399 |
| Graduate Degree | $105,417 | $0 |
| Total | $58,471 | $28,409 |
Family Income in Mendota
Family Income Brackets in Mendota
According to the Mendota family income data, there are 370 families falling into the $75,000 to $99,999 income range, which is the most common income bracket and makes up 19.7% of all families. Conversely, the less than $10,000 income bracket is the least frequent group with only 19 families (1.0%) belonging to this category.
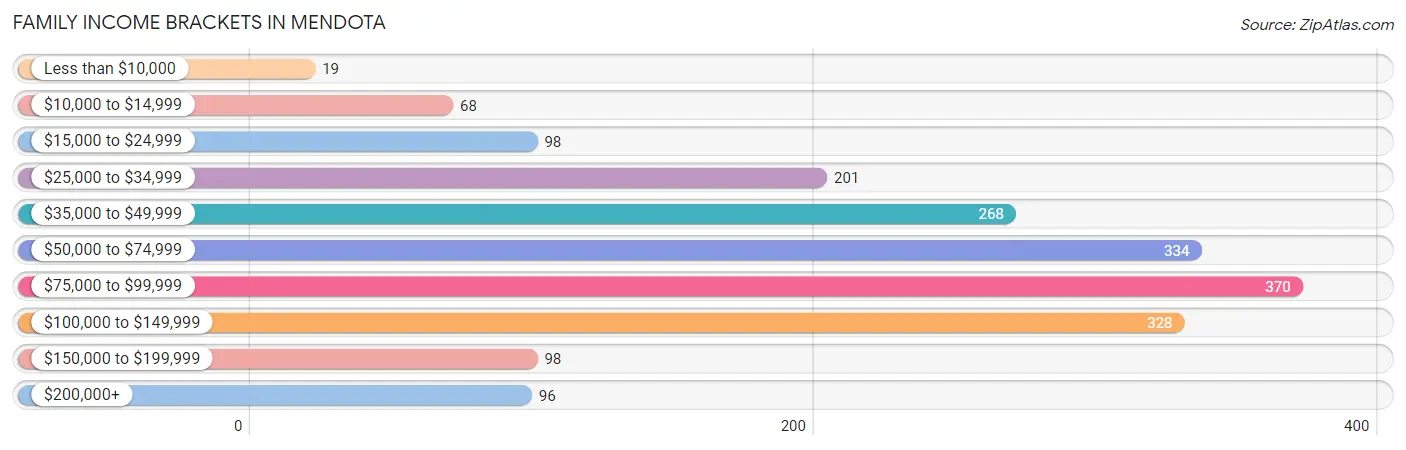
| Income Bracket | # Families | % Families |
| Less than $10,000 | 19 | 1.0% |
| $10,000 to $14,999 | 68 | 3.6% |
| $15,000 to $24,999 | 98 | 5.2% |
| $25,000 to $34,999 | 201 | 10.7% |
| $35,000 to $49,999 | 268 | 14.3% |
| $50,000 to $74,999 | 334 | 17.8% |
| $75,000 to $99,999 | 370 | 19.7% |
| $100,000 to $149,999 | 328 | 17.5% |
| $150,000 to $199,999 | 98 | 5.2% |
| $200,000+ | 96 | 5.1% |
Family Income by Famaliy Size in Mendota
4-person families (204 | 10.9%) account for the highest median family income in Mendota with $82,772 per family, while 2-person families (901 | 48.0%) have the highest median income of $33,970 per family member.
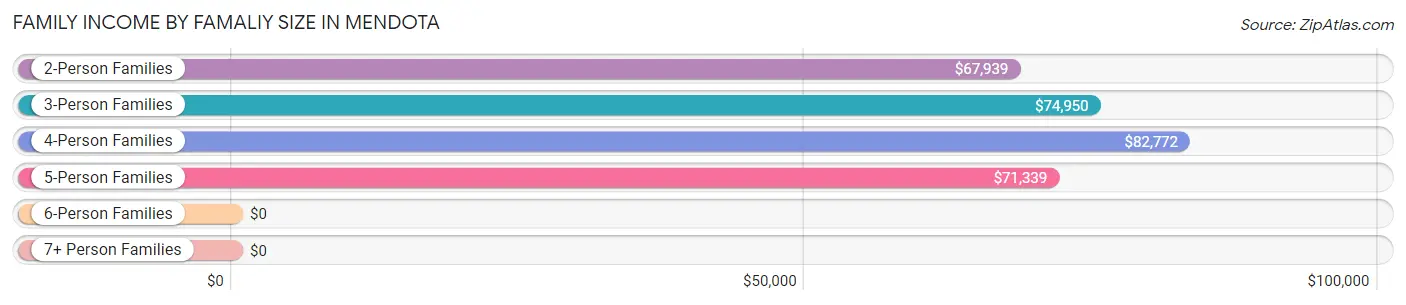
| Income Bracket | # Families | Median Income |
| 2-Person Families | 901 (48.0%) | $67,939 |
| 3-Person Families | 501 (26.7%) | $74,950 |
| 4-Person Families | 204 (10.9%) | $82,772 |
| 5-Person Families | 208 (11.1%) | $71,339 |
| 6-Person Families | 40 (2.1%) | $0 |
| 7+ Person Families | 23 (1.2%) | $0 |
| Total | 1,877 (100.0%) | $72,841 |
Family Income by Number of Earners in Mendota
The median family income in Mendota is $72,841, with families comprising 3+ earners (263) having the highest median family income of $116,161, while families with no earners (307) have the lowest median family income of $36,250, accounting for 14.0% and 16.4% of families, respectively.
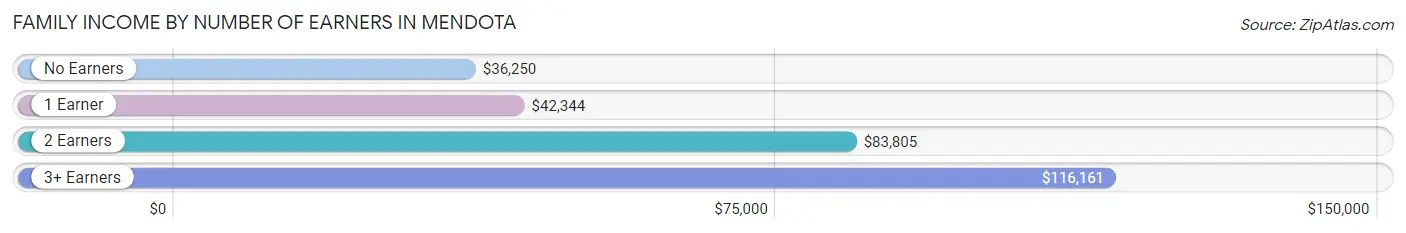
| Number of Earners | # Families | Median Income |
| No Earners | 307 (16.4%) | $36,250 |
| 1 Earner | 562 (29.9%) | $42,344 |
| 2 Earners | 745 (39.7%) | $83,805 |
| 3+ Earners | 263 (14.0%) | $116,161 |
| Total | 1,877 (100.0%) | $72,841 |
Household Income in Mendota
Household Income Brackets in Mendota
With 441 households falling in the category, the $35,000 to $49,999 income range is the most frequent in Mendota, accounting for 15.8% of all households. In contrast, only 103 households (3.7%) fall into the $10,000 to $14,999 income bracket, making it the least populous group.
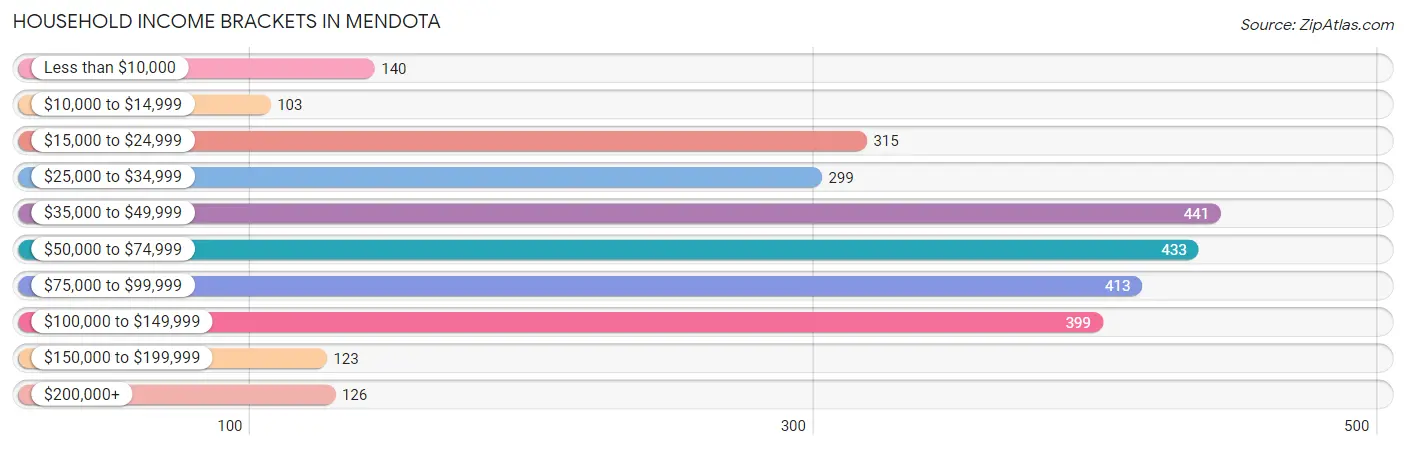
| Income Bracket | # Households | % Households |
| Less than $10,000 | 140 | 5.0% |
| $10,000 to $14,999 | 103 | 3.7% |
| $15,000 to $24,999 | 315 | 11.3% |
| $25,000 to $34,999 | 299 | 10.7% |
| $35,000 to $49,999 | 441 | 15.8% |
| $50,000 to $74,999 | 433 | 15.5% |
| $75,000 to $99,999 | 413 | 14.8% |
| $100,000 to $149,999 | 399 | 14.3% |
| $150,000 to $199,999 | 123 | 4.4% |
| $200,000+ | 126 | 4.5% |
Household Income by Householder Age in Mendota
The median household income in Mendota is $60,601, with the highest median household income of $87,063 found in the 45 to 64 years age bracket for the primary householder. A total of 955 households (34.2%) fall into this category. Meanwhile, the 65+ years age bracket for the primary householder has the lowest median household income of $35,598, with 881 households (31.6%) in this group.
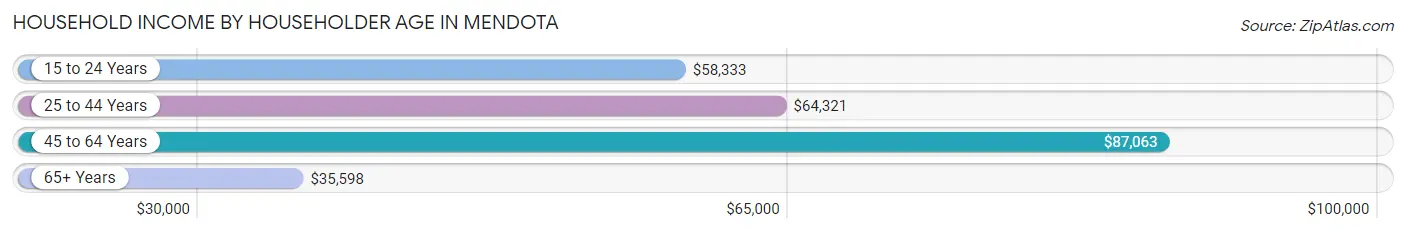
| Income Bracket | # Households | Median Income |
| 15 to 24 Years | 146 (5.2%) | $58,333 |
| 25 to 44 Years | 809 (29.0%) | $64,321 |
| 45 to 64 Years | 955 (34.2%) | $87,063 |
| 65+ Years | 881 (31.6%) | $35,598 |
| Total | 2,791 (100.0%) | $60,601 |
Poverty in Mendota
Income Below Poverty by Sex and Age in Mendota
With 7.1% poverty level for males and 11.7% for females among the residents of Mendota, under 5 year old males and 6 to 11 year old females are the most vulnerable to poverty, with 50 males (22.9%) and 74 females (24.4%) in their respective age groups living below the poverty level.
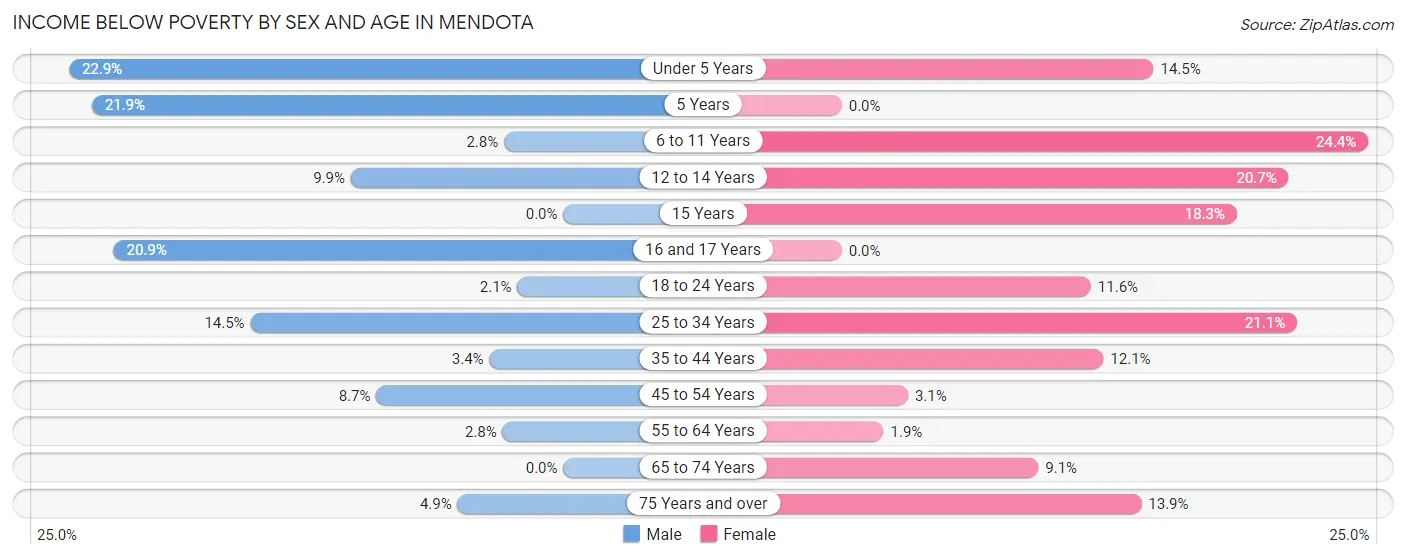
| Age Bracket | Male | Female |
| Under 5 Years | 50 (22.9%) | 22 (14.5%) |
| 5 Years | 14 (21.9%) | 0 (0.0%) |
| 6 to 11 Years | 9 (2.8%) | 74 (24.4%) |
| 12 to 14 Years | 14 (9.9%) | 17 (20.7%) |
| 15 Years | 0 (0.0%) | 11 (18.3%) |
| 16 and 17 Years | 24 (20.9%) | 0 (0.0%) |
| 18 to 24 Years | 8 (2.1%) | 46 (11.6%) |
| 25 to 34 Years | 53 (14.5%) | 97 (21.1%) |
| 35 to 44 Years | 14 (3.4%) | 38 (12.1%) |
| 45 to 54 Years | 35 (8.7%) | 15 (3.1%) |
| 55 to 64 Years | 9 (2.8%) | 8 (1.9%) |
| 65 to 74 Years | 0 (0.0%) | 28 (9.1%) |
| 75 Years and over | 13 (4.9%) | 36 (13.9%) |
| Total | 243 (7.1%) | 392 (11.7%) |
Income Above Poverty by Sex and Age in Mendota
According to the poverty statistics in Mendota, males aged 15 years and females aged 16 and 17 years are the age groups that are most secure financially, with 100.0% of males and 100.0% of females in these age groups living above the poverty line.
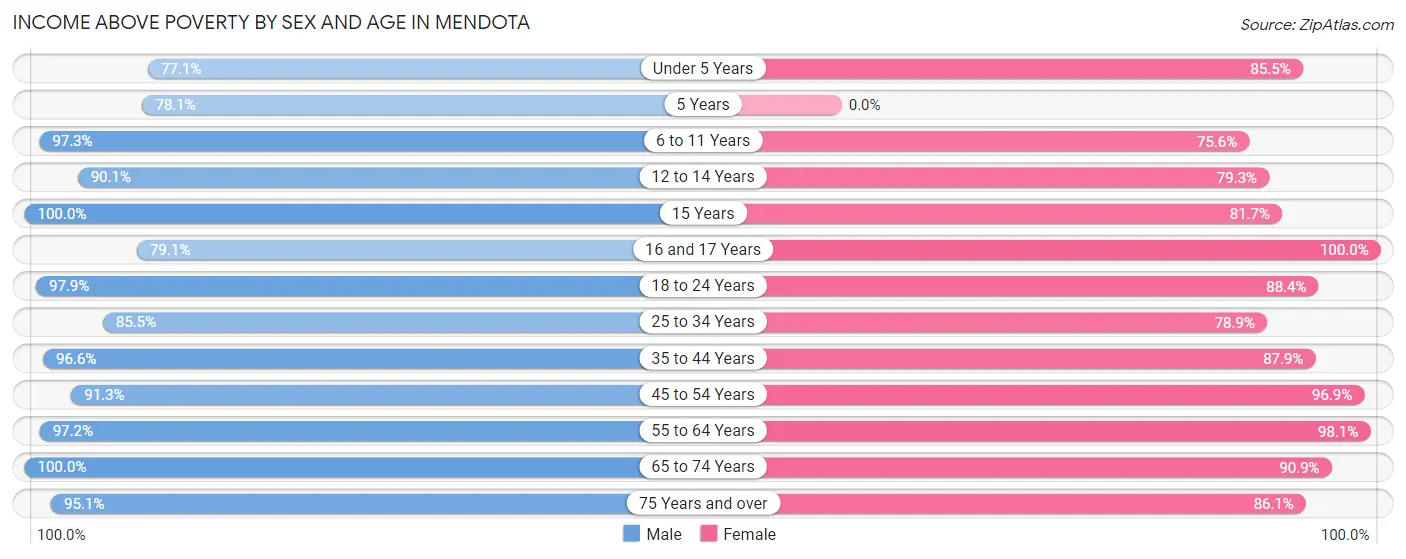
| Age Bracket | Male | Female |
| Under 5 Years | 168 (77.1%) | 130 (85.5%) |
| 5 Years | 50 (78.1%) | 0 (0.0%) |
| 6 to 11 Years | 318 (97.3%) | 229 (75.6%) |
| 12 to 14 Years | 128 (90.1%) | 65 (79.3%) |
| 15 Years | 8 (100.0%) | 49 (81.7%) |
| 16 and 17 Years | 91 (79.1%) | 106 (100.0%) |
| 18 to 24 Years | 368 (97.9%) | 352 (88.4%) |
| 25 to 34 Years | 312 (85.5%) | 362 (78.9%) |
| 35 to 44 Years | 394 (96.6%) | 275 (87.9%) |
| 45 to 54 Years | 368 (91.3%) | 474 (96.9%) |
| 55 to 64 Years | 310 (97.2%) | 404 (98.1%) |
| 65 to 74 Years | 429 (100.0%) | 279 (90.9%) |
| 75 Years and over | 252 (95.1%) | 223 (86.1%) |
| Total | 3,196 (92.9%) | 2,948 (88.3%) |
Income Below Poverty Among Married-Couple Families in Mendota
The poverty statistics for married-couple families in Mendota show that 0.7% or 9 of the total 1,341 families live below the poverty line. Families with no children have the highest poverty rate of 1.1%, comprising of 9 families. On the other hand, families with 1 or 2 children have the lowest poverty rate of 0.0%, which includes 0 families.
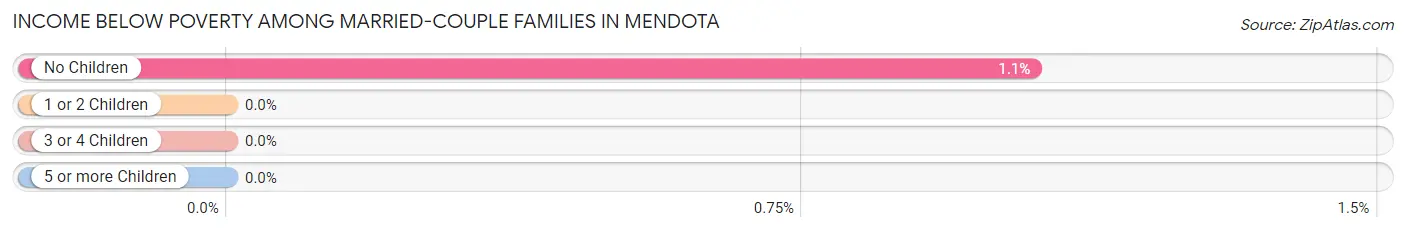
| Children | Above Poverty | Below Poverty |
| No Children | 846 (99.0%) | 9 (1.1%) |
| 1 or 2 Children | 342 (100.0%) | 0 (0.0%) |
| 3 or 4 Children | 144 (100.0%) | 0 (0.0%) |
| 5 or more Children | 0 (0.0%) | 0 (0.0%) |
| Total | 1,332 (99.3%) | 9 (0.7%) |
Income Below Poverty Among Single-Parent Households in Mendota
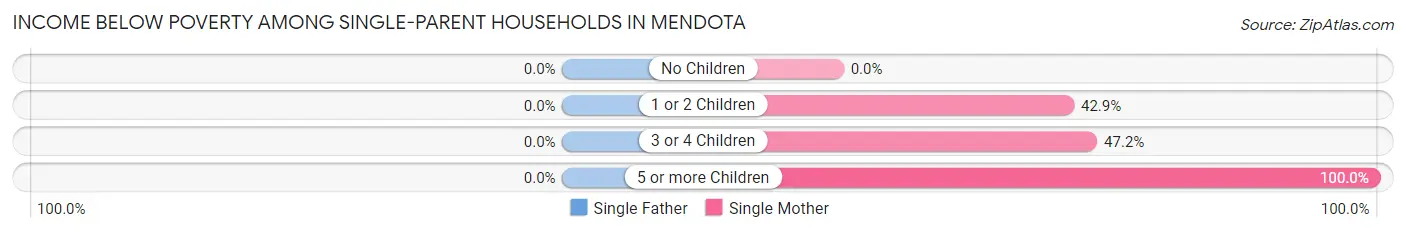
| Children | Single Father | Single Mother |
| No Children | 0 (0.0%) | 0 (0.0%) |
| 1 or 2 Children | 0 (0.0%) | 106 (42.9%) |
| 3 or 4 Children | 0 (0.0%) | 17 (47.2%) |
| 5 or more Children | 0 (0.0%) | 9 (100.0%) |
| Total | 0 (0.0%) | 132 (34.1%) |
Income Below Poverty Among Married-Couple vs Single-Parent Households in Mendota
The poverty data for Mendota shows that 9 of the married-couple family households (0.7%) and 132 of the single-parent households (24.6%) are living below the poverty level. Within the married-couple family households, those with no children have the highest poverty rate, with 9 households (1.1%) falling below the poverty line. Among the single-parent households, those with 5 or more children have the highest poverty rate, with 9 household (100.0%) living below poverty.
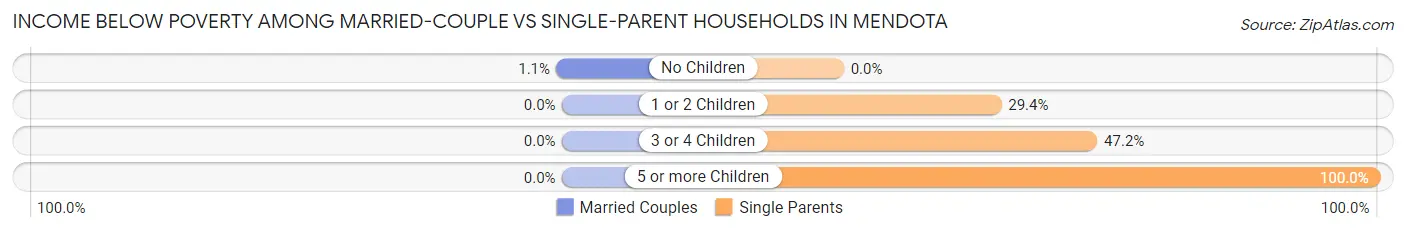
| Children | Married-Couple Families | Single-Parent Households |
| No Children | 9 (1.1%) | 0 (0.0%) |
| 1 or 2 Children | 0 (0.0%) | 106 (29.4%) |
| 3 or 4 Children | 0 (0.0%) | 17 (47.2%) |
| 5 or more Children | 0 (0.0%) | 9 (100.0%) |
| Total | 9 (0.7%) | 132 (24.6%) |
Race in Mendota
The most populous races in Mendota are White / Caucasian (5,693 | 81.8%), Hispanic or Latino (1,575 | 22.6%), and Some other Race (828 | 11.9%).
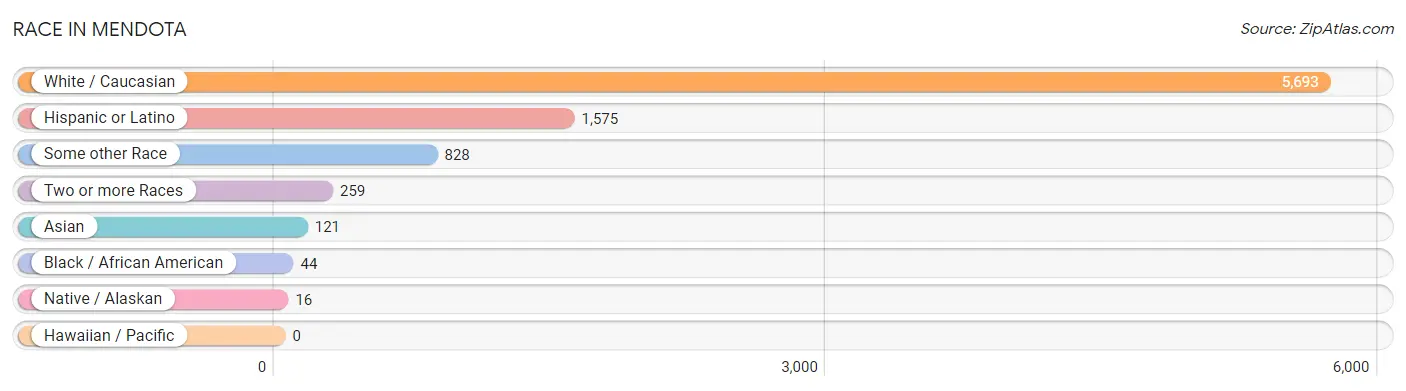
| Race | # Population | % Population |
| Asian | 121 | 1.7% |
| Black / African American | 44 | 0.6% |
| Hawaiian / Pacific | 0 | 0.0% |
| Hispanic or Latino | 1,575 | 22.6% |
| Native / Alaskan | 16 | 0.2% |
| White / Caucasian | 5,693 | 81.8% |
| Two or more Races | 259 | 3.7% |
| Some other Race | 828 | 11.9% |
| Total | 6,961 | 100.0% |
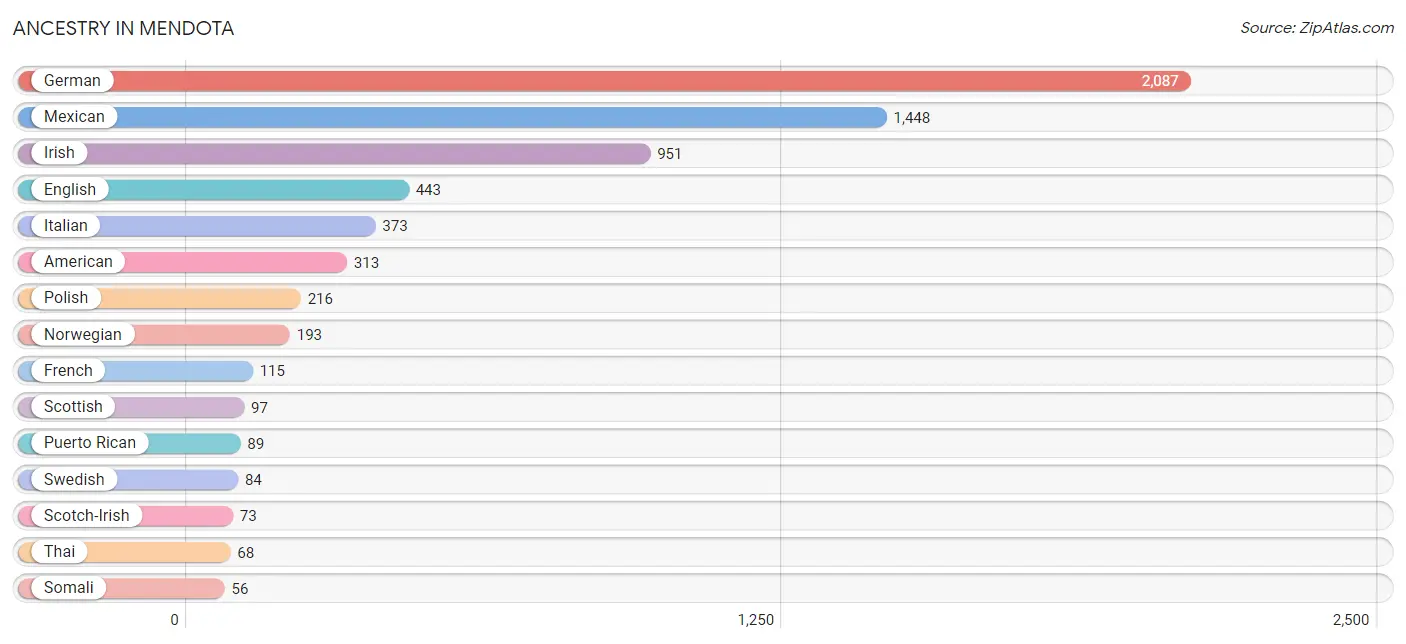
Ancestry in Mendota
The most populous ancestries reported in Mendota are German (2,087 | 30.0%), Mexican (1,448 | 20.8%), Irish (951 | 13.7%), English (443 | 6.4%), and Italian (373 | 5.4%), together accounting for 76.2% of all Mendota residents.
| Ancestry | # Population | % Population |
| Albanian | 50 | 0.7% |
| American | 313 | 4.5% |
| Austrian | 4 | 0.1% |
| Belgian | 39 | 0.6% |
| Bhutanese | 40 | 0.6% |
| Blackfeet | 2 | 0.0% |
| British | 5 | 0.1% |
| Canadian | 26 | 0.4% |
| Central American | 28 | 0.4% |
| Cherokee | 2 | 0.0% |
| Croatian | 12 | 0.2% |
| Czech | 9 | 0.1% |
| Dutch | 53 | 0.8% |
| English | 443 | 6.4% |
| European | 25 | 0.4% |
| French | 115 | 1.7% |
| German | 2,087 | 30.0% |
| Guatemalan | 28 | 0.4% |
| Hungarian | 13 | 0.2% |
| Indian (Asian) | 50 | 0.7% |
| Irish | 951 | 13.7% |
| Italian | 373 | 5.4% |
| Mexican | 1,448 | 20.8% |
| Mexican American Indian | 12 | 0.2% |
| Norwegian | 193 | 2.8% |
| Pennsylvania German | 10 | 0.1% |
| Polish | 216 | 3.1% |
| Puerto Rican | 89 | 1.3% |
| Scandinavian | 7 | 0.1% |
| Scotch-Irish | 73 | 1.1% |
| Scottish | 97 | 1.4% |
| Slovak | 46 | 0.7% |
| Slovene | 8 | 0.1% |
| Somali | 56 | 0.8% |
| Spanish | 10 | 0.1% |
| Subsaharan African | 56 | 0.8% |
| Swedish | 84 | 1.2% |
| Thai | 68 | 1.0% |
| Tohono O'Odham | 4 | 0.1% |
| Welsh | 47 | 0.7% | View All 40 Rows |
Immigrants in Mendota
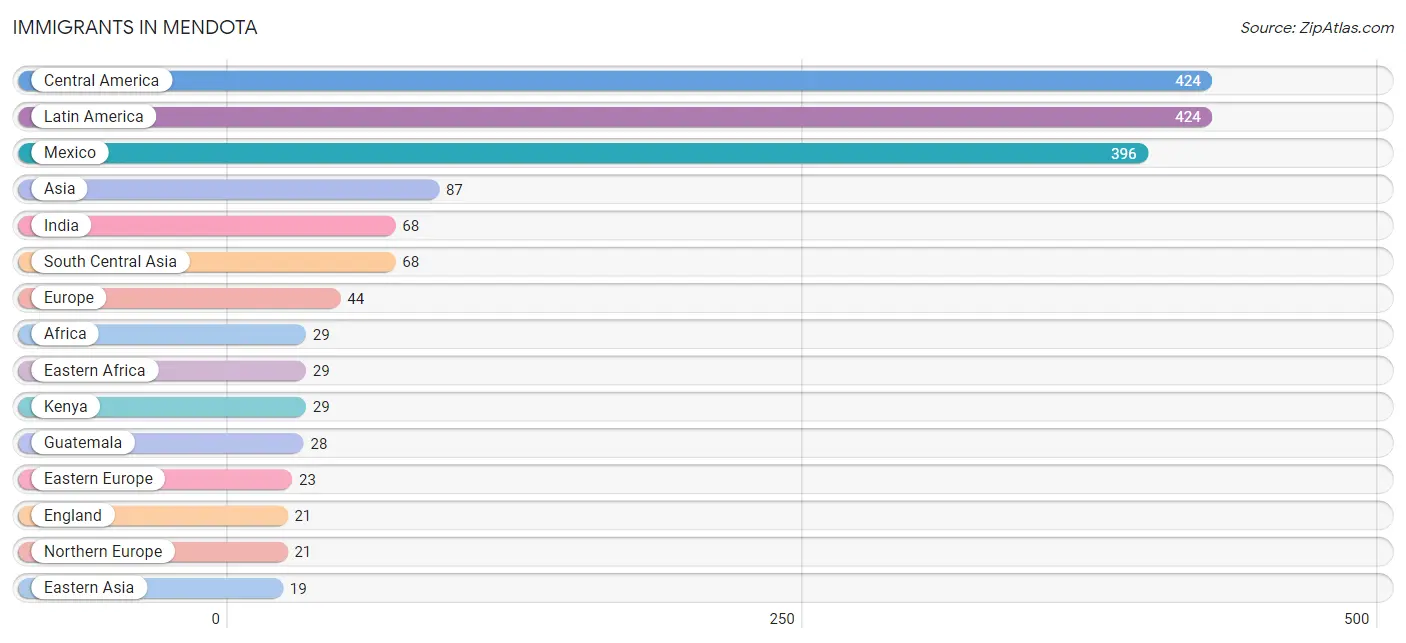
The most numerous immigrant groups reported in Mendota came from Central America (424 | 6.1%), Latin America (424 | 6.1%), Mexico (396 | 5.7%), Asia (87 | 1.3%), and India (68 | 1.0%), together accounting for 20.1% of all Mendota residents.
| Immigration Origin | # Population | % Population |
| Africa | 29 | 0.4% |
| Asia | 87 | 1.3% |
| Central America | 424 | 6.1% |
| China | 16 | 0.2% |
| Eastern Africa | 29 | 0.4% |
| Eastern Asia | 19 | 0.3% |
| Eastern Europe | 23 | 0.3% |
| England | 21 | 0.3% |
| Europe | 44 | 0.6% |
| Guatemala | 28 | 0.4% |
| Hong Kong | 16 | 0.2% |
| India | 68 | 1.0% |
| Japan | 3 | 0.0% |
| Kenya | 29 | 0.4% |
| Latin America | 424 | 6.1% |
| Mexico | 396 | 5.7% |
| Northern Europe | 21 | 0.3% |
| South Central Asia | 68 | 1.0% | View All 18 Rows |
Sex and Age in Mendota
Sex and Age in Mendota
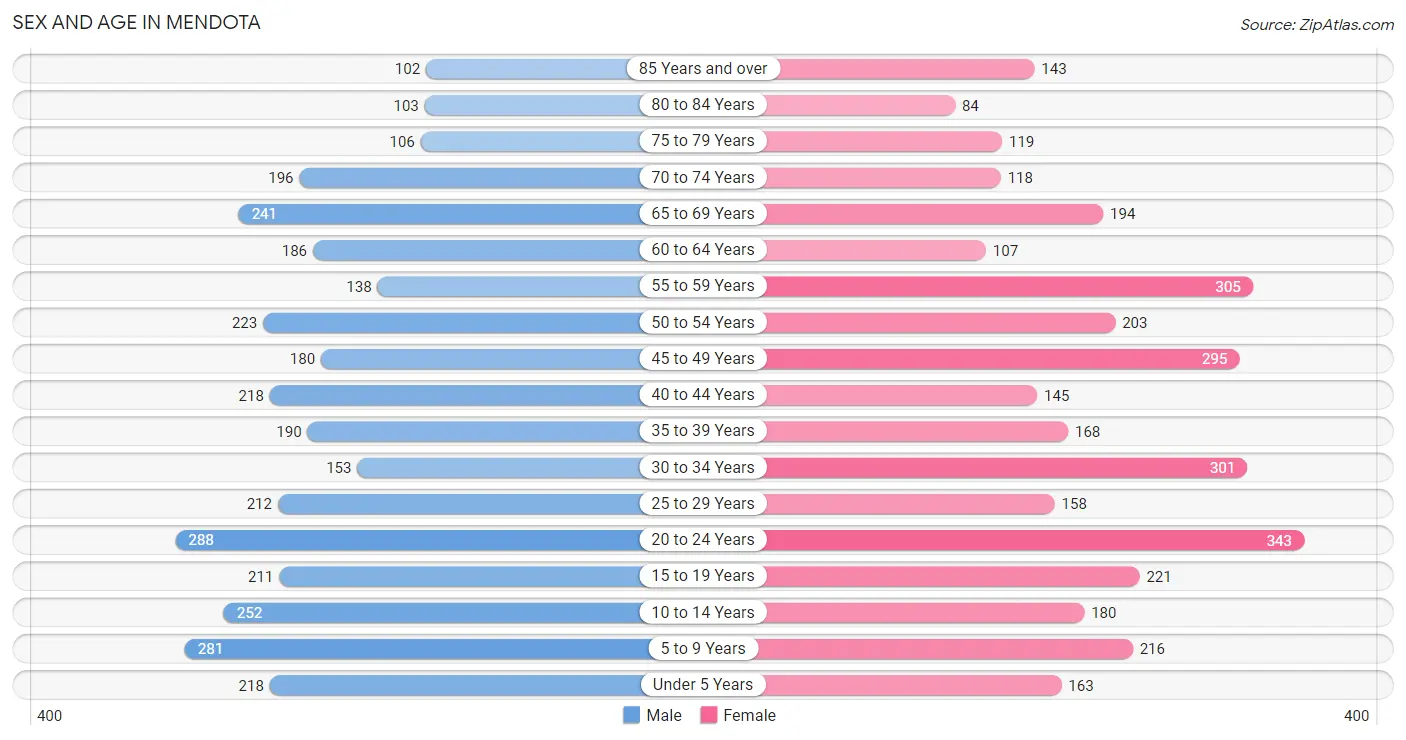
The most populous age groups in Mendota are 20 to 24 Years (288 | 8.2%) for men and 20 to 24 Years (343 | 9.9%) for women.
| Age Bracket | Male | Female |
| Under 5 Years | 218 (6.2%) | 163 (4.7%) |
| 5 to 9 Years | 281 (8.0%) | 216 (6.2%) |
| 10 to 14 Years | 252 (7.2%) | 180 (5.2%) |
| 15 to 19 Years | 211 (6.0%) | 221 (6.4%) |
| 20 to 24 Years | 288 (8.2%) | 343 (9.9%) |
| 25 to 29 Years | 212 (6.1%) | 158 (4.6%) |
| 30 to 34 Years | 153 (4.4%) | 301 (8.7%) |
| 35 to 39 Years | 190 (5.4%) | 168 (4.9%) |
| 40 to 44 Years | 218 (6.2%) | 145 (4.2%) |
| 45 to 49 Years | 180 (5.1%) | 295 (8.5%) |
| 50 to 54 Years | 223 (6.4%) | 203 (5.9%) |
| 55 to 59 Years | 138 (4.0%) | 305 (8.8%) |
| 60 to 64 Years | 186 (5.3%) | 107 (3.1%) |
| 65 to 69 Years | 241 (6.9%) | 194 (5.6%) |
| 70 to 74 Years | 196 (5.6%) | 118 (3.4%) |
| 75 to 79 Years | 106 (3.0%) | 119 (3.4%) |
| 80 to 84 Years | 103 (2.9%) | 84 (2.4%) |
| 85 Years and over | 102 (2.9%) | 143 (4.1%) |
| Total | 3,498 (100.0%) | 3,463 (100.0%) |
Families and Households in Mendota
Median Family Size in Mendota
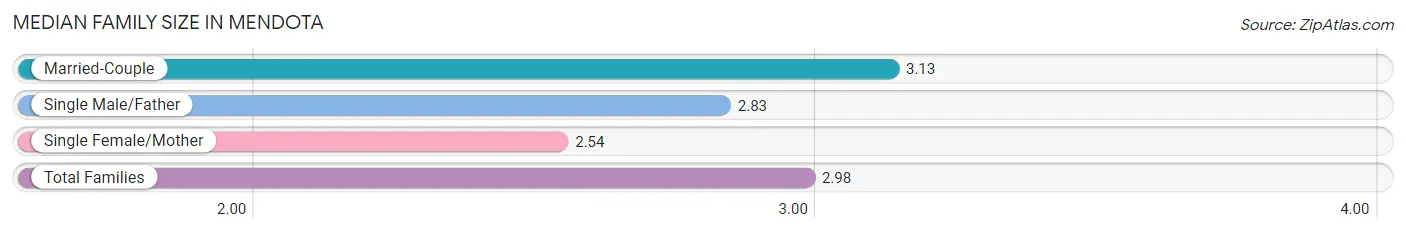
The median family size in Mendota is 2.98 persons per family, with married-couple families (1,341 | 71.4%) accounting for the largest median family size of 3.13 persons per family. On the other hand, single female/mother families (387 | 20.6%) represent the smallest median family size with 2.54 persons per family.
| Family Type | # Families | Family Size |
| Married-Couple | 1,341 (71.4%) | 3.13 |
| Single Male/Father | 149 (7.9%) | 2.83 |
| Single Female/Mother | 387 (20.6%) | 2.54 |
| Total Families | 1,877 (100.0%) | 2.98 |
Median Household Size in Mendota
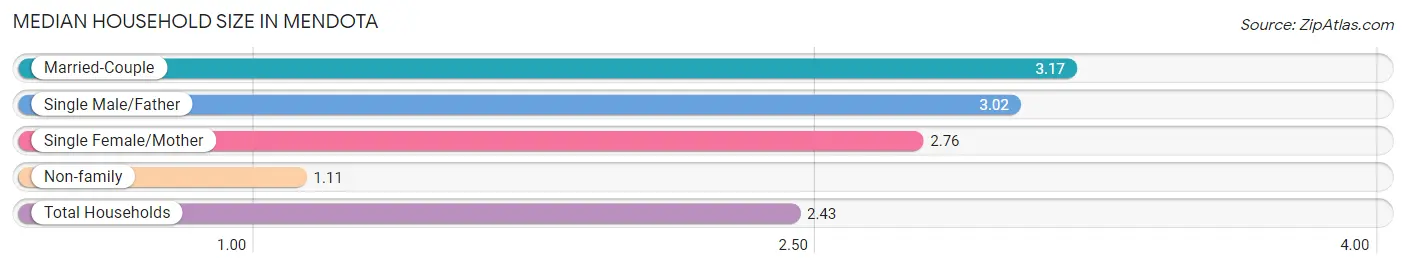
The median household size in Mendota is 2.43 persons per household, with married-couple households (1,341 | 48.0%) accounting for the largest median household size of 3.17 persons per household. non-family households (914 | 32.8%) represent the smallest median household size with 1.11 persons per household.
| Household Type | # Households | Household Size |
| Married-Couple | 1,341 (48.0%) | 3.17 |
| Single Male/Father | 149 (5.3%) | 3.02 |
| Single Female/Mother | 387 (13.9%) | 2.76 |
| Non-family | 914 (32.8%) | 1.11 |
| Total Households | 2,791 (100.0%) | 2.43 |
Household Size by Marriage Status in Mendota
Out of a total of 2,791 households in Mendota, 1,877 (67.2%) are family households, while 914 (32.8%) are nonfamily households. The most numerous type of family households are 2-person households, comprising 813, and the most common type of nonfamily households are 1-person households, comprising 802.
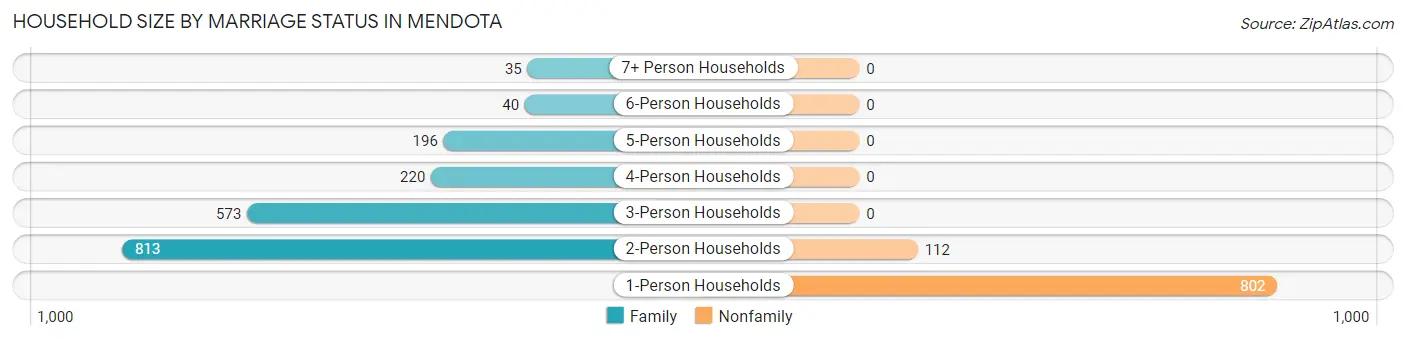
| Household Size | Family Households | Nonfamily Households |
| 1-Person Households | - | 802 (28.7%) |
| 2-Person Households | 813 (29.1%) | 112 (4.0%) |
| 3-Person Households | 573 (20.5%) | 0 (0.0%) |
| 4-Person Households | 220 (7.9%) | 0 (0.0%) |
| 5-Person Households | 196 (7.0%) | 0 (0.0%) |
| 6-Person Households | 40 (1.4%) | 0 (0.0%) |
| 7+ Person Households | 35 (1.3%) | 0 (0.0%) |
| Total | 1,877 (67.2%) | 914 (32.8%) |
Female Fertility in Mendota
Fertility by Age in Mendota
Average fertility rate in Mendota is 72.0 births per 1,000 women. Women in the age bracket of 20 to 34 years have the highest fertility rate with 116.0 births per 1,000 women. Women in the age bracket of 20 to 34 years acount for 76.2% of all women with births.
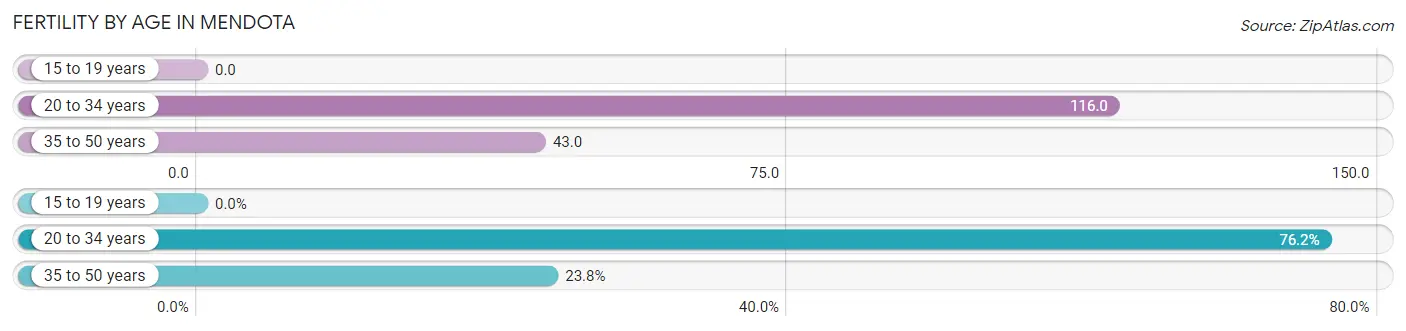
| Age Bracket | Women with Births | Births / 1,000 Women |
| 15 to 19 years | 0 (0.0%) | 0.0 |
| 20 to 34 years | 93 (76.2%) | 116.0 |
| 35 to 50 years | 29 (23.8%) | 43.0 |
| Total | 122 (100.0%) | 72.0 |
Fertility by Age by Marriage Status in Mendota
64.8% of women with births (122) in Mendota are married. The highest percentage of unmarried women with births falls into 20 to 34 years age bracket with 36.6% of them unmarried at the time of birth, while the lowest percentage of unmarried women with births belong to 35 to 50 years age bracket with 31.0% of them unmarried.
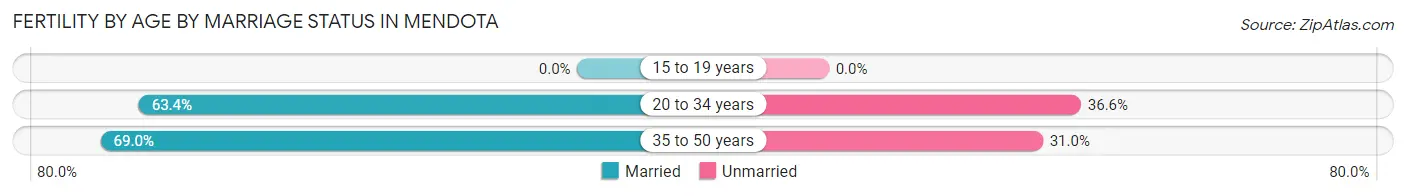
| Age Bracket | Married | Unmarried |
| 15 to 19 years | 0 (0.0%) | 0 (0.0%) |
| 20 to 34 years | 59 (63.4%) | 34 (36.6%) |
| 35 to 50 years | 20 (69.0%) | 9 (31.0%) |
| Total | 79 (64.7%) | 43 (35.2%) |
Fertility by Education in Mendota
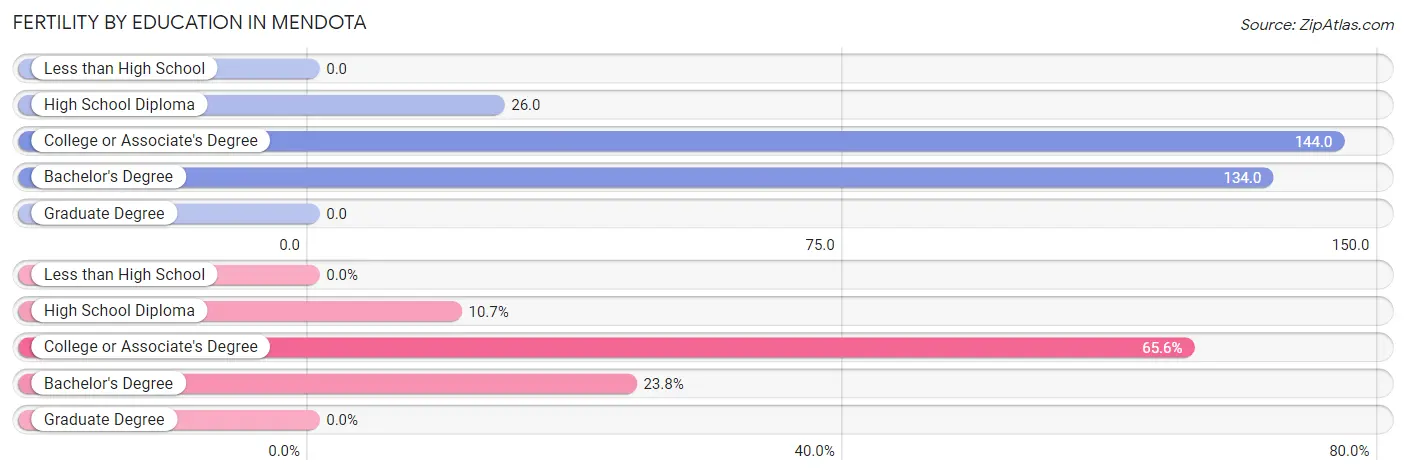
| Educational Attainment | Women with Births | Births / 1,000 Women |
| Less than High School | 0 (0.0%) | 0.0 |
| High School Diploma | 13 (10.7%) | 26.0 |
| College or Associate's Degree | 80 (65.6%) | 144.0 |
| Bachelor's Degree | 29 (23.8%) | 134.0 |
| Graduate Degree | 0 (0.0%) | 0.0 |
| Total | 122 (100.0%) | 72.0 |
Fertility by Education by Marriage Status in Mendota
35.2% of women with births in Mendota are unmarried. Women with the educational attainment of bachelor's degree are most likely to be married with 100.0% of them married at childbirth, while women with the educational attainment of high school diploma are least likely to be married with 100.0% of them unmarried at childbirth.
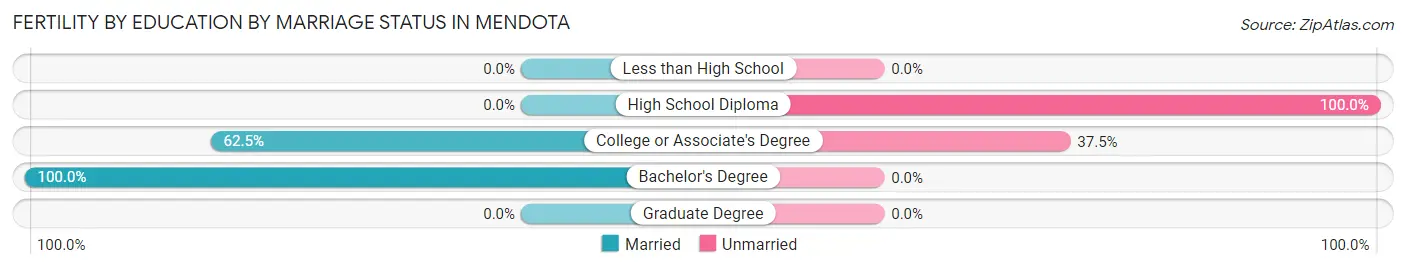
| Educational Attainment | Married | Unmarried |
| Less than High School | 0 (0.0%) | 0 (0.0%) |
| High School Diploma | 0 (0.0%) | 13 (100.0%) |
| College or Associate's Degree | 50 (62.5%) | 30 (37.5%) |
| Bachelor's Degree | 29 (100.0%) | 0 (0.0%) |
| Graduate Degree | 0 (0.0%) | 0 (0.0%) |
| Total | 79 (64.7%) | 43 (35.2%) |
Employment Characteristics in Mendota
Employment by Class of Employer in Mendota
Among the 3,404 employed individuals in Mendota, private company employees (2,352 | 69.1%), not-for-profit organizations (421 | 12.4%), and local government employees (263 | 7.7%) make up the most common classes of employment.
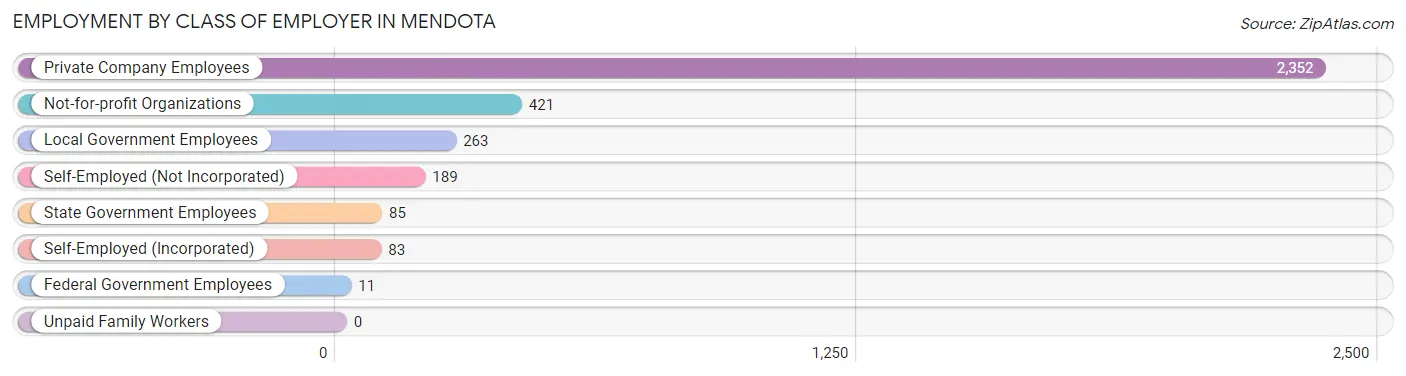
| Employer Class | # Employees | % Employees |
| Private Company Employees | 2,352 | 69.1% |
| Self-Employed (Incorporated) | 83 | 2.4% |
| Self-Employed (Not Incorporated) | 189 | 5.6% |
| Not-for-profit Organizations | 421 | 12.4% |
| Local Government Employees | 263 | 7.7% |
| State Government Employees | 85 | 2.5% |
| Federal Government Employees | 11 | 0.3% |
| Unpaid Family Workers | 0 | 0.0% |
| Total | 3,404 | 100.0% |
Employment Status by Age in Mendota
According to the labor force statistics for Mendota, out of the total population over 16 years of age (5,583), 63.6% or 3,551 individuals are in the labor force, with 3.8% or 135 of them unemployed. The age group with the highest labor force participation rate is 55 to 59 years, with 91.9% or 407 individuals in the labor force. Within the labor force, the 16 to 19 years age range has the highest percentage of unemployed individuals, with 19.5% or 34 of them being unemployed.
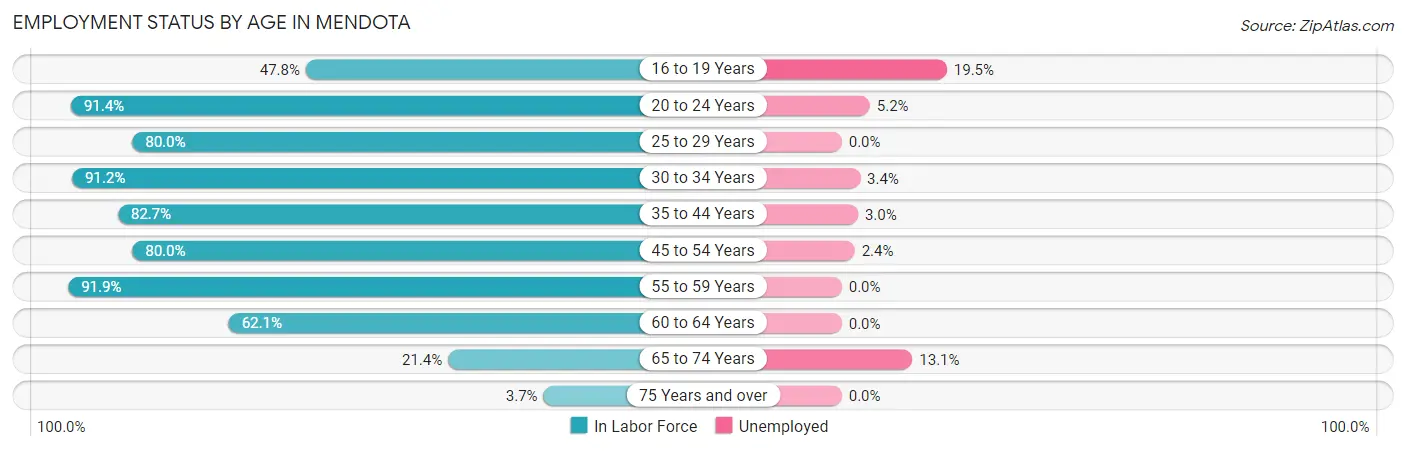
| Age Bracket | In Labor Force | Unemployed |
| 16 to 19 Years | 174 (47.8%) | 34 (19.5%) |
| 20 to 24 Years | 577 (91.4%) | 30 (5.2%) |
| 25 to 29 Years | 296 (80.0%) | 0 (0.0%) |
| 30 to 34 Years | 414 (91.2%) | 14 (3.4%) |
| 35 to 44 Years | 596 (82.7%) | 18 (3.0%) |
| 45 to 54 Years | 721 (80.0%) | 17 (2.4%) |
| 55 to 59 Years | 407 (91.9%) | 0 (0.0%) |
| 60 to 64 Years | 182 (62.1%) | 0 (0.0%) |
| 65 to 74 Years | 160 (21.4%) | 21 (13.1%) |
| 75 Years and over | 24 (3.7%) | 0 (0.0%) |
| Total | 3,551 (63.6%) | 135 (3.8%) |
Employment Status by Educational Attainment in Mendota
According to labor force statistics for Mendota, 82.2% of individuals (2,616) out of the total population between 25 and 64 years of age (3,182) are in the labor force, with 1.9% or 50 of them being unemployed. The group with the highest labor force participation rate are those with the educational attainment of bachelor's degree or higher, with 92.5% or 663 individuals in the labor force. Within the labor force, individuals with less than high school education have the highest percentage of unemployment, with 10.6% or 33 of them being unemployed.
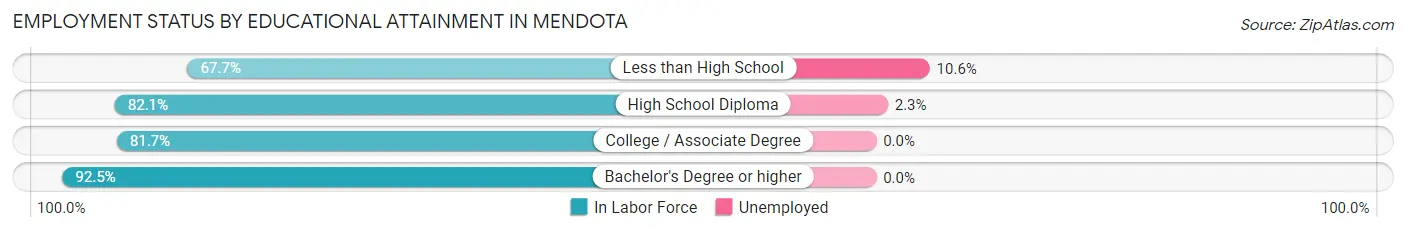
| Educational Attainment | In Labor Force | Unemployed |
| Less than High School | 310 (67.7%) | 49 (10.6%) |
| High School Diploma | 705 (82.1%) | 20 (2.3%) |
| College / Associate Degree | 938 (81.7%) | 0 (0.0%) |
| Bachelor's Degree or higher | 663 (92.5%) | 0 (0.0%) |
| Total | 2,616 (82.2%) | 60 (1.9%) |
Employment Occupations by Sex in Mendota
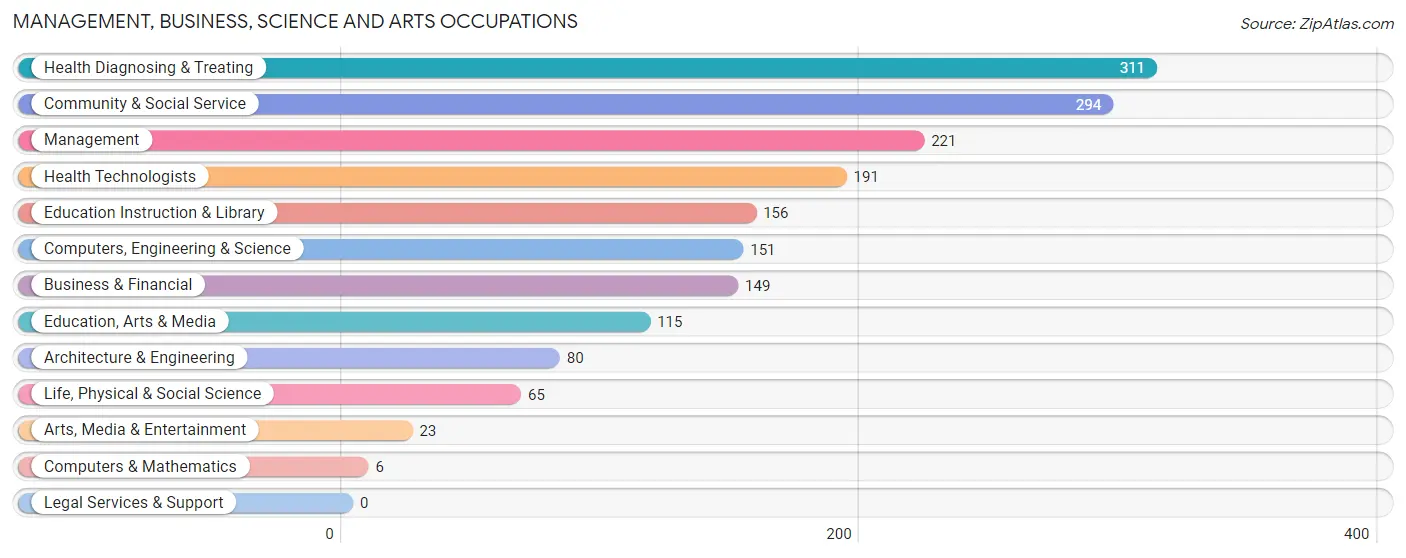
Management, Business, Science and Arts Occupations
The most common Management, Business, Science and Arts occupations in Mendota are Health Diagnosing & Treating (311 | 9.1%), Community & Social Service (294 | 8.6%), Management (221 | 6.5%), Health Technologists (191 | 5.6%), and Education Instruction & Library (156 | 4.6%).
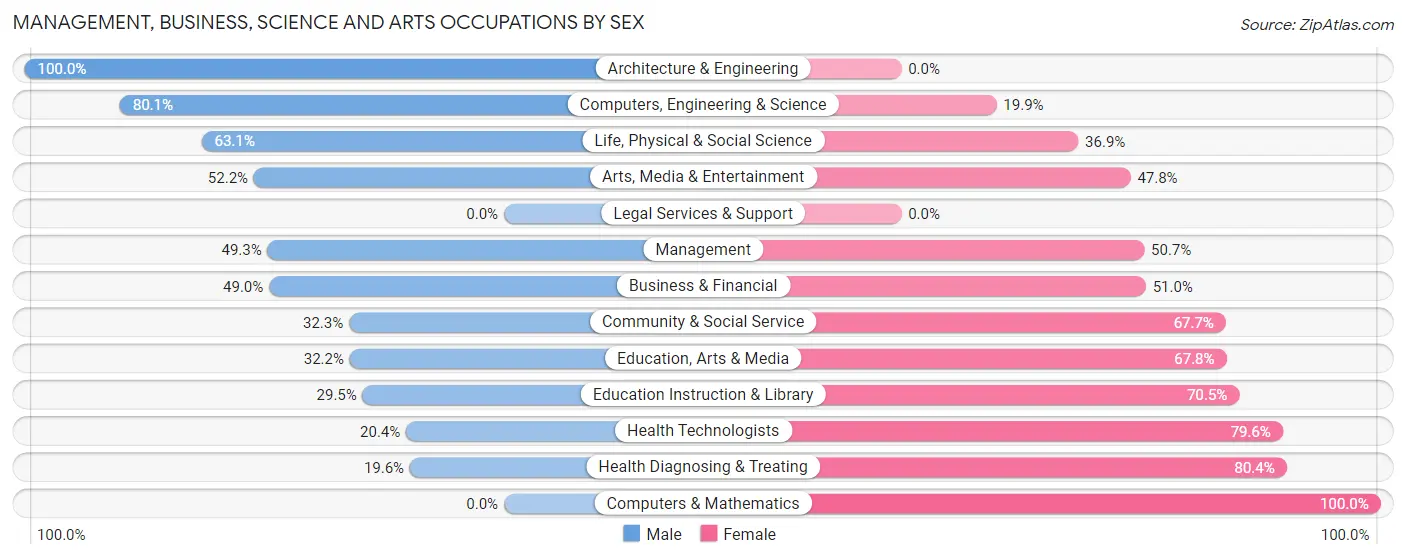
Management, Business, Science and Arts Occupations by Sex
Within the Management, Business, Science and Arts occupations in Mendota, the most male-oriented occupations are Architecture & Engineering (100.0%), Computers, Engineering & Science (80.1%), and Life, Physical & Social Science (63.1%), while the most female-oriented occupations are Computers & Mathematics (100.0%), Health Diagnosing & Treating (80.4%), and Health Technologists (79.6%).
| Occupation | Male | Female |
| Management | 109 (49.3%) | 112 (50.7%) |
| Business & Financial | 73 (49.0%) | 76 (51.0%) |
| Computers, Engineering & Science | 121 (80.1%) | 30 (19.9%) |
| Computers & Mathematics | 0 (0.0%) | 6 (100.0%) |
| Architecture & Engineering | 80 (100.0%) | 0 (0.0%) |
| Life, Physical & Social Science | 41 (63.1%) | 24 (36.9%) |
| Community & Social Service | 95 (32.3%) | 199 (67.7%) |
| Education, Arts & Media | 37 (32.2%) | 78 (67.8%) |
| Legal Services & Support | 0 (0.0%) | 0 (0.0%) |
| Education Instruction & Library | 46 (29.5%) | 110 (70.5%) |
| Arts, Media & Entertainment | 12 (52.2%) | 11 (47.8%) |
| Health Diagnosing & Treating | 61 (19.6%) | 250 (80.4%) |
| Health Technologists | 39 (20.4%) | 152 (79.6%) |
| Total (Category) | 459 (40.8%) | 667 (59.2%) |
| Total (Overall) | 1,753 (51.3%) | 1,664 (48.7%) |
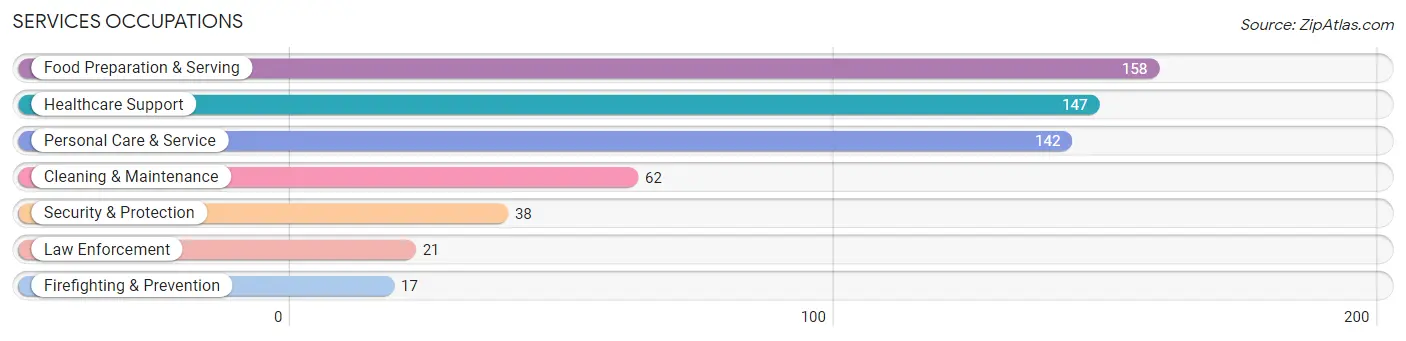
Services Occupations
The most common Services occupations in Mendota are Food Preparation & Serving (158 | 4.6%), Healthcare Support (147 | 4.3%), Personal Care & Service (142 | 4.2%), Cleaning & Maintenance (62 | 1.8%), and Security & Protection (38 | 1.1%).
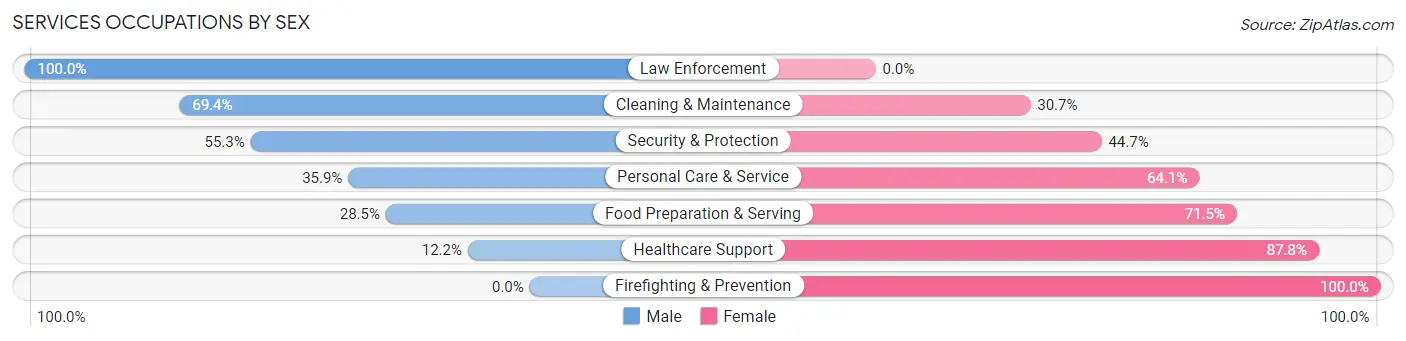
Services Occupations by Sex
Within the Services occupations in Mendota, the most male-oriented occupations are Law Enforcement (100.0%), Cleaning & Maintenance (69.4%), and Security & Protection (55.3%), while the most female-oriented occupations are Firefighting & Prevention (100.0%), Healthcare Support (87.8%), and Food Preparation & Serving (71.5%).
| Occupation | Male | Female |
| Healthcare Support | 18 (12.2%) | 129 (87.8%) |
| Security & Protection | 21 (55.3%) | 17 (44.7%) |
| Firefighting & Prevention | 0 (0.0%) | 17 (100.0%) |
| Law Enforcement | 21 (100.0%) | 0 (0.0%) |
| Food Preparation & Serving | 45 (28.5%) | 113 (71.5%) |
| Cleaning & Maintenance | 43 (69.4%) | 19 (30.6%) |
| Personal Care & Service | 51 (35.9%) | 91 (64.1%) |
| Total (Category) | 178 (32.5%) | 369 (67.5%) |
| Total (Overall) | 1,753 (51.3%) | 1,664 (48.7%) |
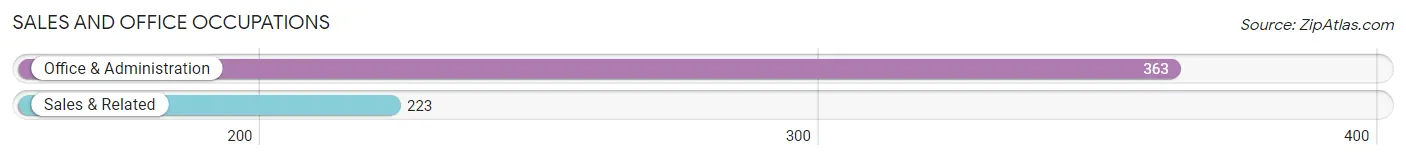
Sales and Office Occupations
The most common Sales and Office occupations in Mendota are Office & Administration (363 | 10.6%), and Sales & Related (223 | 6.5%).
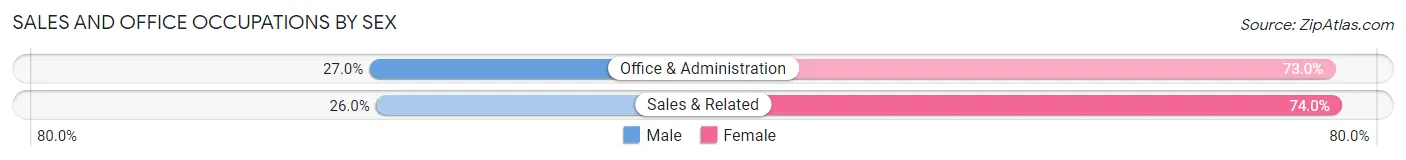
Sales and Office Occupations by Sex
| Occupation | Male | Female |
| Sales & Related | 58 (26.0%) | 165 (74.0%) |
| Office & Administration | 98 (27.0%) | 265 (73.0%) |
| Total (Category) | 156 (26.6%) | 430 (73.4%) |
| Total (Overall) | 1,753 (51.3%) | 1,664 (48.7%) |
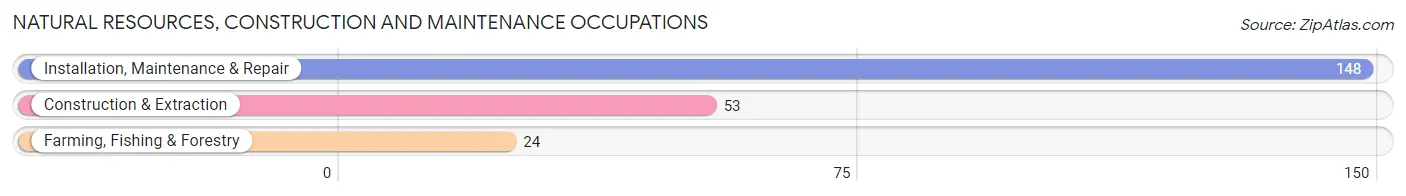
Natural Resources, Construction and Maintenance Occupations
The most common Natural Resources, Construction and Maintenance occupations in Mendota are Installation, Maintenance & Repair (148 | 4.3%), Construction & Extraction (53 | 1.5%), and Farming, Fishing & Forestry (24 | 0.7%).
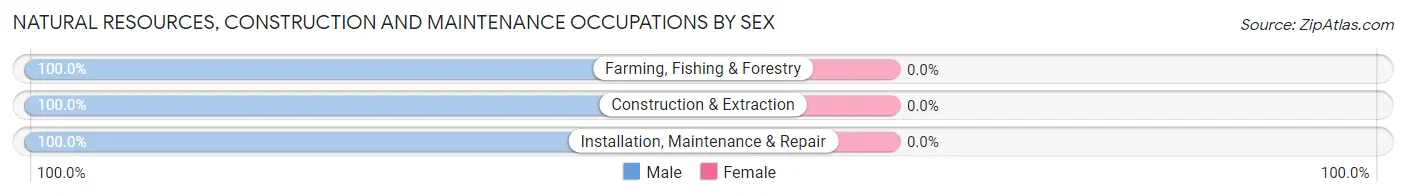
Natural Resources, Construction and Maintenance Occupations by Sex
| Occupation | Male | Female |
| Farming, Fishing & Forestry | 24 (100.0%) | 0 (0.0%) |
| Construction & Extraction | 53 (100.0%) | 0 (0.0%) |
| Installation, Maintenance & Repair | 148 (100.0%) | 0 (0.0%) |
| Total (Category) | 225 (100.0%) | 0 (0.0%) |
| Total (Overall) | 1,753 (51.3%) | 1,664 (48.7%) |
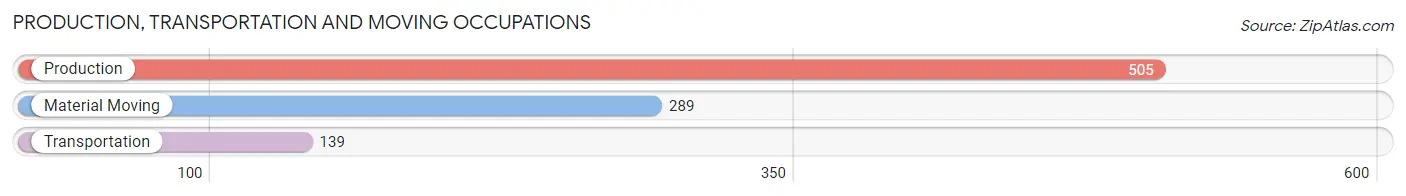
Production, Transportation and Moving Occupations
The most common Production, Transportation and Moving occupations in Mendota are Production (505 | 14.8%), Material Moving (289 | 8.5%), and Transportation (139 | 4.1%).
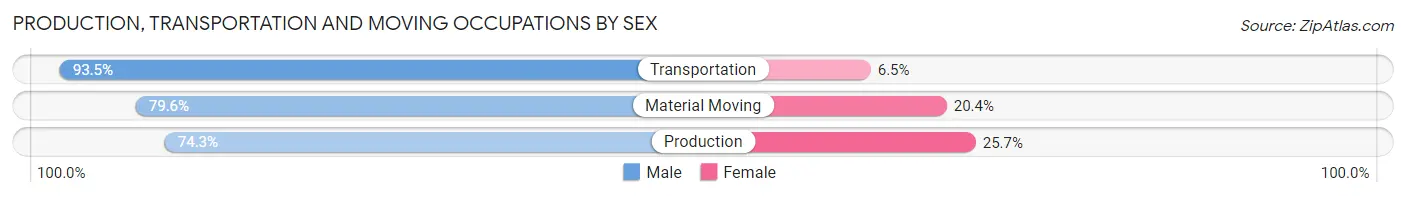
Production, Transportation and Moving Occupations by Sex
| Occupation | Male | Female |
| Production | 375 (74.3%) | 130 (25.7%) |
| Transportation | 130 (93.5%) | 9 (6.5%) |
| Material Moving | 230 (79.6%) | 59 (20.4%) |
| Total (Category) | 735 (78.8%) | 198 (21.2%) |
| Total (Overall) | 1,753 (51.3%) | 1,664 (48.7%) |
Employment Industries by Sex in Mendota
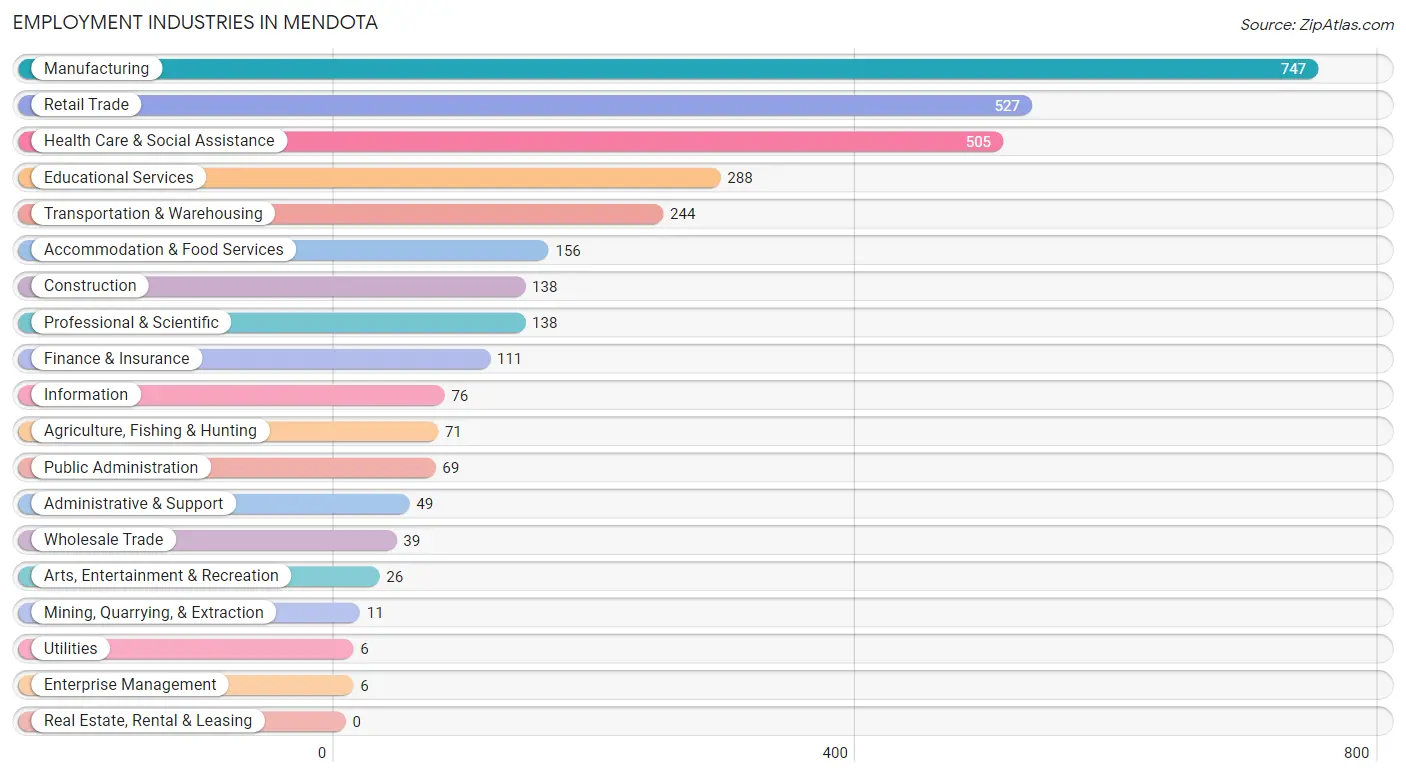
Employment Industries in Mendota
The major employment industries in Mendota include Manufacturing (747 | 21.9%), Retail Trade (527 | 15.4%), Health Care & Social Assistance (505 | 14.8%), Educational Services (288 | 8.4%), and Transportation & Warehousing (244 | 7.1%).
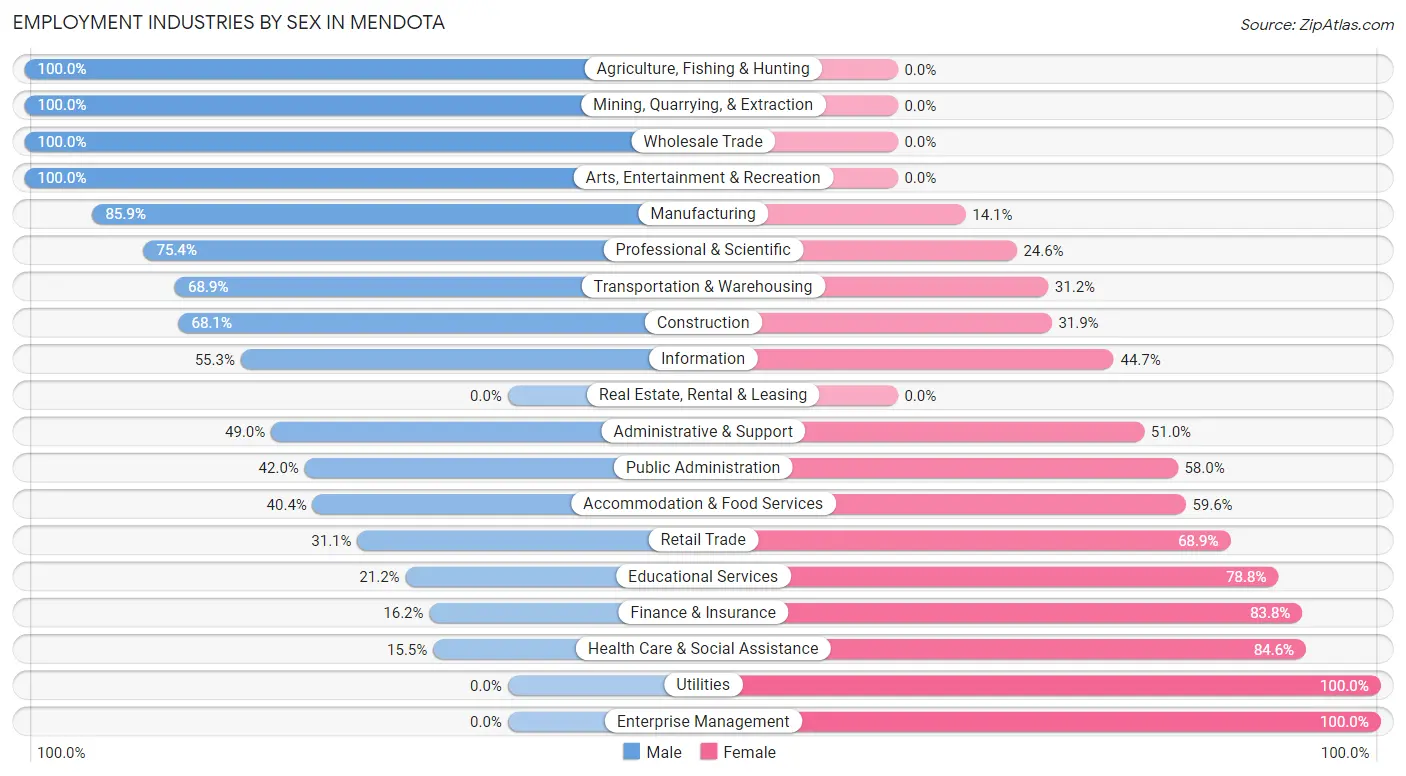
Employment Industries by Sex in Mendota
The Mendota industries that see more men than women are Agriculture, Fishing & Hunting (100.0%), Mining, Quarrying, & Extraction (100.0%), and Wholesale Trade (100.0%), whereas the industries that tend to have a higher number of women are Utilities (100.0%), Enterprise Management (100.0%), and Health Care & Social Assistance (84.6%).
| Industry | Male | Female |
| Agriculture, Fishing & Hunting | 71 (100.0%) | 0 (0.0%) |
| Mining, Quarrying, & Extraction | 11 (100.0%) | 0 (0.0%) |
| Construction | 94 (68.1%) | 44 (31.9%) |
| Manufacturing | 642 (85.9%) | 105 (14.1%) |
| Wholesale Trade | 39 (100.0%) | 0 (0.0%) |
| Retail Trade | 164 (31.1%) | 363 (68.9%) |
| Transportation & Warehousing | 168 (68.9%) | 76 (31.1%) |
| Utilities | 0 (0.0%) | 6 (100.0%) |
| Information | 42 (55.3%) | 34 (44.7%) |
| Finance & Insurance | 18 (16.2%) | 93 (83.8%) |
| Real Estate, Rental & Leasing | 0 (0.0%) | 0 (0.0%) |
| Professional & Scientific | 104 (75.4%) | 34 (24.6%) |
| Enterprise Management | 0 (0.0%) | 6 (100.0%) |
| Administrative & Support | 24 (49.0%) | 25 (51.0%) |
| Educational Services | 61 (21.2%) | 227 (78.8%) |
| Health Care & Social Assistance | 78 (15.4%) | 427 (84.6%) |
| Arts, Entertainment & Recreation | 26 (100.0%) | 0 (0.0%) |
| Accommodation & Food Services | 63 (40.4%) | 93 (59.6%) |
| Public Administration | 29 (42.0%) | 40 (58.0%) |
| Total | 1,753 (51.3%) | 1,664 (48.7%) |
Education in Mendota
School Enrollment in Mendota
The most common levels of schooling among the 1,791 students in Mendota are elementary school (425 | 23.7%), high school (352 | 19.7%), and middle school (345 | 19.3%).
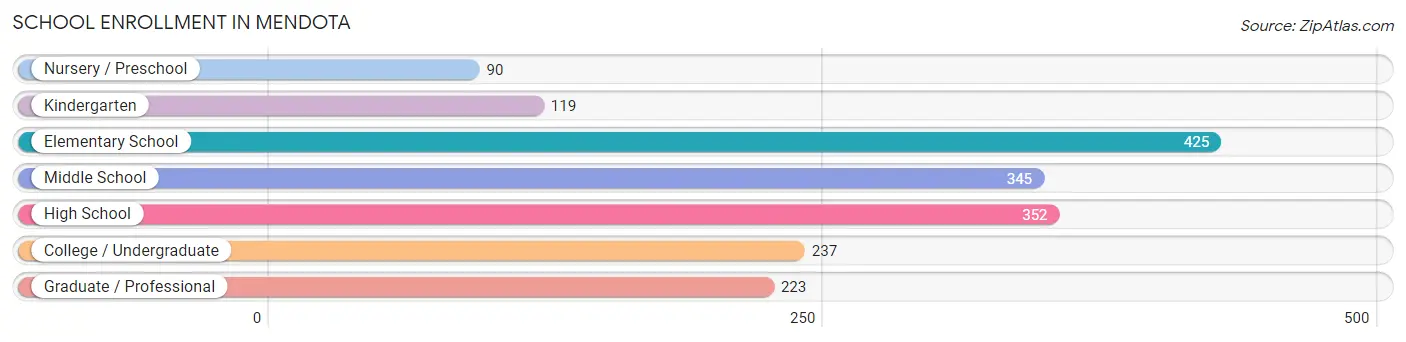
| School Level | # Students | % Students |
| Nursery / Preschool | 90 | 5.0% |
| Kindergarten | 119 | 6.6% |
| Elementary School | 425 | 23.7% |
| Middle School | 345 | 19.3% |
| High School | 352 | 19.7% |
| College / Undergraduate | 237 | 13.2% |
| Graduate / Professional | 223 | 12.4% |
| Total | 1,791 | 100.0% |
School Enrollment by Age by Funding Source in Mendota
Out of a total of 1,791 students who are enrolled in schools in Mendota, 416 (23.2%) attend a private institution, while the remaining 1,375 (76.8%) are enrolled in public schools. The age group of 35 years and over has the highest likelihood of being enrolled in private schools, with 124 (95.4% in the age bracket) enrolled. Conversely, the age group of 18 to 19 year olds has the lowest likelihood of being enrolled in a private school, with 95 (100.0% in the age bracket) attending a public institution.
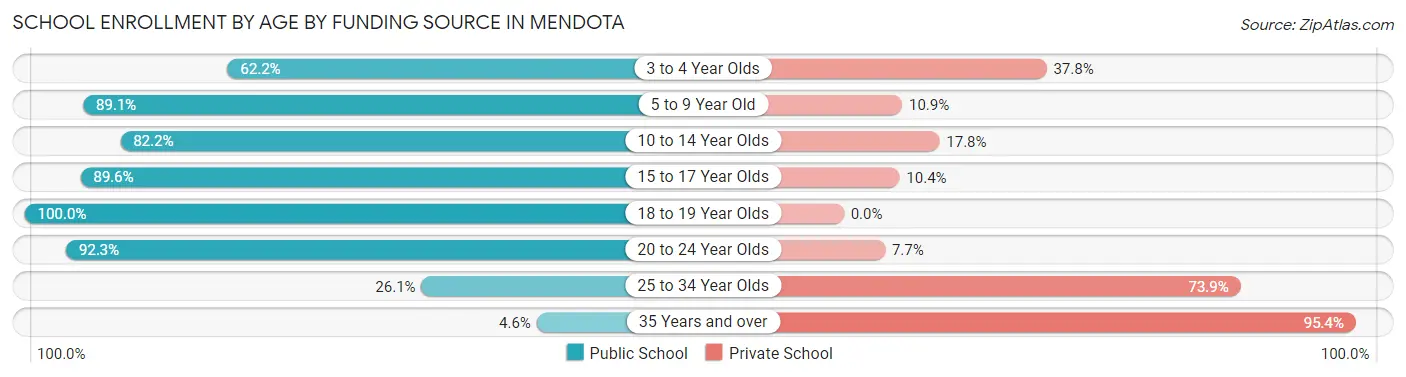
| Age Bracket | Public School | Private School |
| 3 to 4 Year Olds | 56 (62.2%) | 34 (37.8%) |
| 5 to 9 Year Old | 443 (89.1%) | 54 (10.9%) |
| 10 to 14 Year Olds | 355 (82.2%) | 77 (17.8%) |
| 15 to 17 Year Olds | 259 (89.6%) | 30 (10.4%) |
| 18 to 19 Year Olds | 95 (100.0%) | 0 (0.0%) |
| 20 to 24 Year Olds | 132 (92.3%) | 11 (7.7%) |
| 25 to 34 Year Olds | 30 (26.1%) | 85 (73.9%) |
| 35 Years and over | 6 (4.6%) | 124 (95.4%) |
| Total | 1,375 (76.8%) | 416 (23.2%) |
Educational Attainment by Field of Study in Mendota
Science & technology (163 | 16.9%), education (144 | 14.9%), communications (109 | 11.3%), business (97 | 10.1%), and bio, nature & agricultural (92 | 9.5%) are the most common fields of study among 965 individuals in Mendota who have obtained a bachelor's degree or higher.
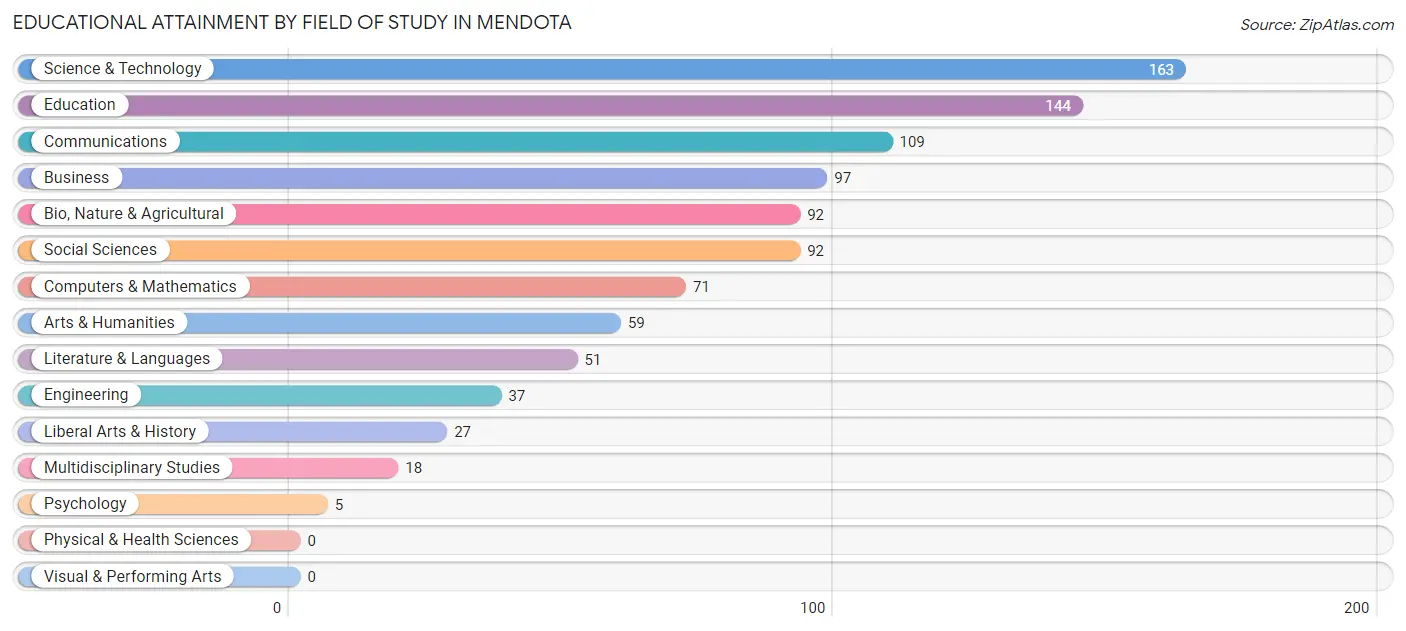
| Field of Study | # Graduates | % Graduates |
| Computers & Mathematics | 71 | 7.4% |
| Bio, Nature & Agricultural | 92 | 9.5% |
| Physical & Health Sciences | 0 | 0.0% |
| Psychology | 5 | 0.5% |
| Social Sciences | 92 | 9.5% |
| Engineering | 37 | 3.8% |
| Multidisciplinary Studies | 18 | 1.9% |
| Science & Technology | 163 | 16.9% |
| Business | 97 | 10.1% |
| Education | 144 | 14.9% |
| Literature & Languages | 51 | 5.3% |
| Liberal Arts & History | 27 | 2.8% |
| Visual & Performing Arts | 0 | 0.0% |
| Communications | 109 | 11.3% |
| Arts & Humanities | 59 | 6.1% |
| Total | 965 | 100.0% |
Transportation & Commute in Mendota
Vehicle Availability by Sex in Mendota
The most prevalent vehicle ownership categories in Mendota are males with 2 vehicles (763, accounting for 43.7%) and females with 2 vehicles (671, making up 46.4%).
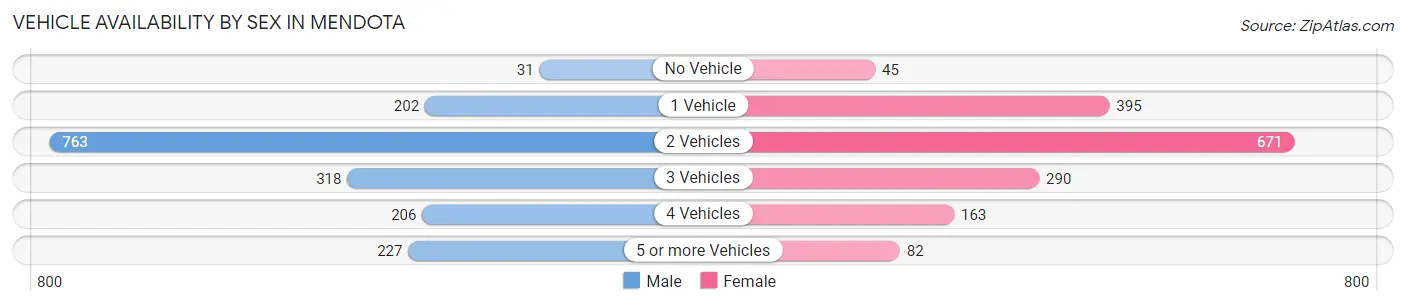
| Vehicles Available | Male | Female |
| No Vehicle | 31 (1.8%) | 45 (2.7%) |
| 1 Vehicle | 202 (11.6%) | 395 (24.0%) |
| 2 Vehicles | 763 (43.7%) | 671 (40.8%) |
| 3 Vehicles | 318 (18.2%) | 290 (17.6%) |
| 4 Vehicles | 206 (11.8%) | 163 (9.9%) |
| 5 or more Vehicles | 227 (13.0%) | 82 (5.0%) |
| Total | 1,747 (100.0%) | 1,646 (100.0%) |
Commute Time in Mendota
The most frequently occuring commute durations in Mendota are 5 to 9 minutes (900 commuters, 26.8%), 10 to 14 minutes (453 commuters, 13.5%), and 30 to 34 minutes (364 commuters, 10.8%).
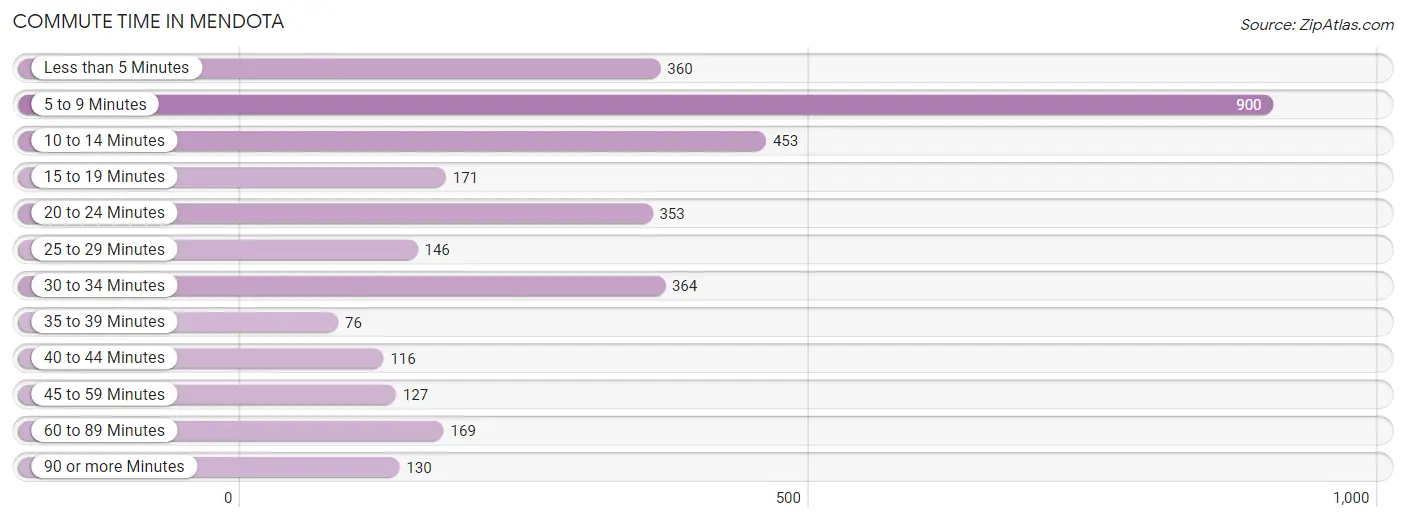
| Commute Time | # Commuters | % Commuters |
| Less than 5 Minutes | 360 | 10.7% |
| 5 to 9 Minutes | 900 | 26.8% |
| 10 to 14 Minutes | 453 | 13.5% |
| 15 to 19 Minutes | 171 | 5.1% |
| 20 to 24 Minutes | 353 | 10.5% |
| 25 to 29 Minutes | 146 | 4.3% |
| 30 to 34 Minutes | 364 | 10.8% |
| 35 to 39 Minutes | 76 | 2.3% |
| 40 to 44 Minutes | 116 | 3.5% |
| 45 to 59 Minutes | 127 | 3.8% |
| 60 to 89 Minutes | 169 | 5.0% |
| 90 or more Minutes | 130 | 3.9% |
Commute Time by Sex in Mendota
The most common commute times in Mendota are 5 to 9 minutes (362 commuters, 20.9%) for males and 5 to 9 minutes (538 commuters, 32.9%) for females.
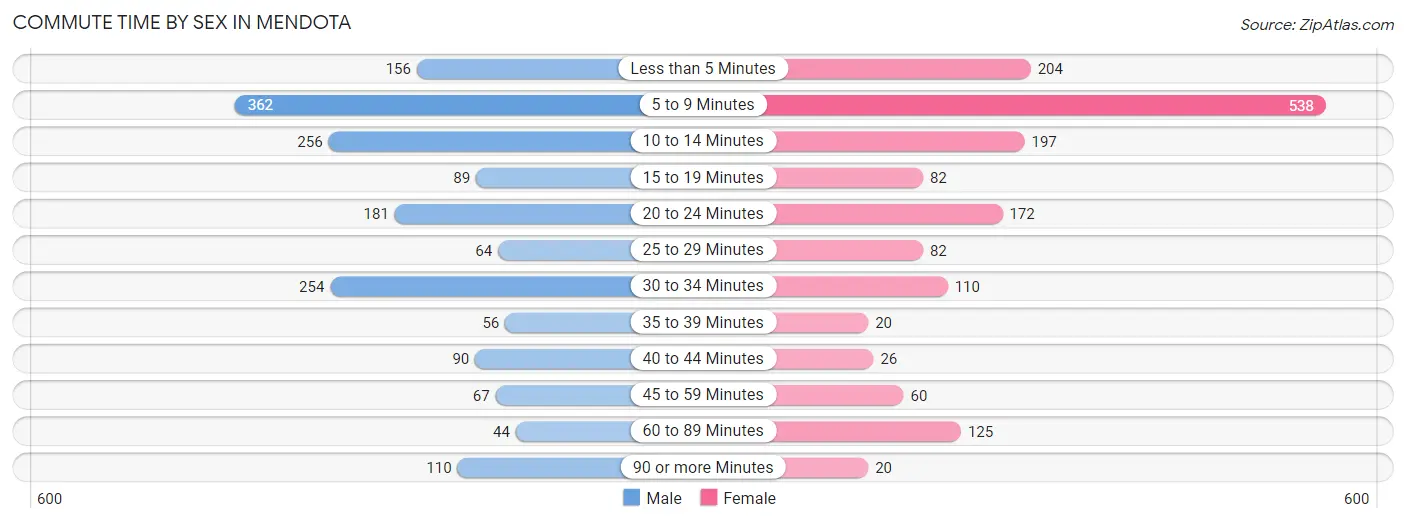
| Commute Time | Male | Female |
| Less than 5 Minutes | 156 (9.0%) | 204 (12.5%) |
| 5 to 9 Minutes | 362 (20.9%) | 538 (32.9%) |
| 10 to 14 Minutes | 256 (14.8%) | 197 (12.0%) |
| 15 to 19 Minutes | 89 (5.1%) | 82 (5.0%) |
| 20 to 24 Minutes | 181 (10.5%) | 172 (10.5%) |
| 25 to 29 Minutes | 64 (3.7%) | 82 (5.0%) |
| 30 to 34 Minutes | 254 (14.7%) | 110 (6.7%) |
| 35 to 39 Minutes | 56 (3.2%) | 20 (1.2%) |
| 40 to 44 Minutes | 90 (5.2%) | 26 (1.6%) |
| 45 to 59 Minutes | 67 (3.9%) | 60 (3.7%) |
| 60 to 89 Minutes | 44 (2.5%) | 125 (7.6%) |
| 90 or more Minutes | 110 (6.4%) | 20 (1.2%) |
Time of Departure to Work by Sex in Mendota
The most frequent times of departure to work in Mendota are 7:00 AM to 7:29 AM (272, 15.7%) for males and 7:00 AM to 7:29 AM (305, 18.6%) for females.
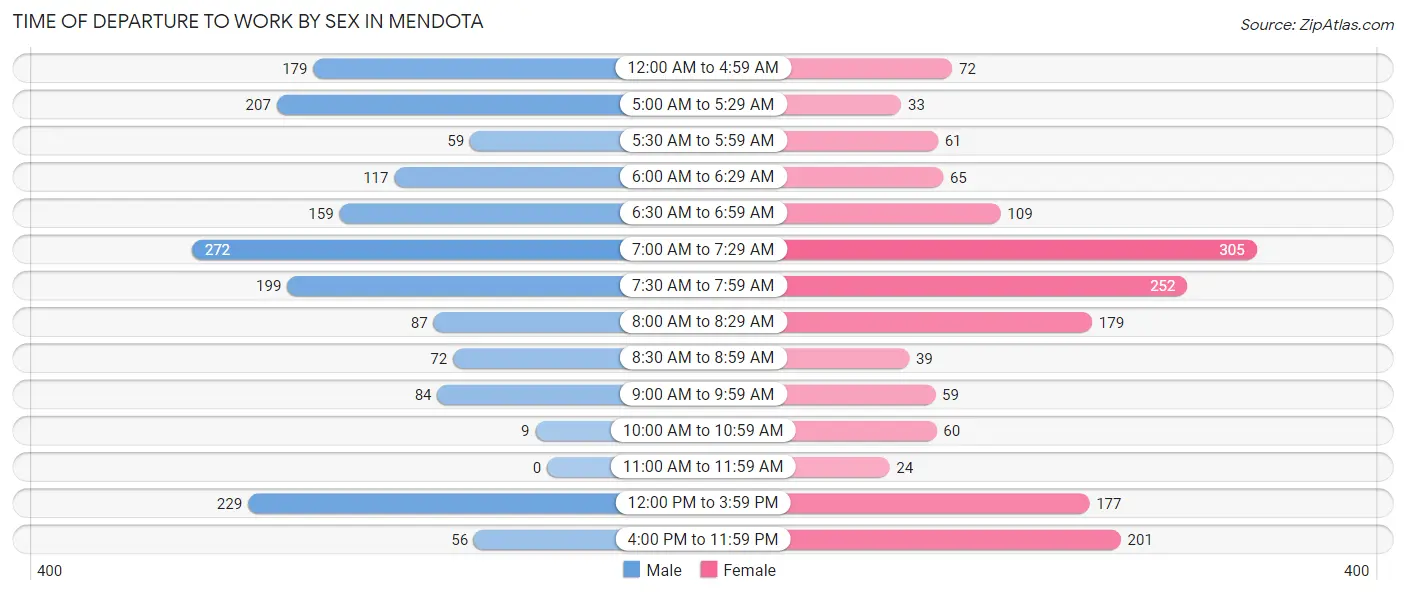
| Time of Departure | Male | Female |
| 12:00 AM to 4:59 AM | 179 (10.3%) | 72 (4.4%) |
| 5:00 AM to 5:29 AM | 207 (12.0%) | 33 (2.0%) |
| 5:30 AM to 5:59 AM | 59 (3.4%) | 61 (3.7%) |
| 6:00 AM to 6:29 AM | 117 (6.8%) | 65 (4.0%) |
| 6:30 AM to 6:59 AM | 159 (9.2%) | 109 (6.7%) |
| 7:00 AM to 7:29 AM | 272 (15.7%) | 305 (18.6%) |
| 7:30 AM to 7:59 AM | 199 (11.5%) | 252 (15.4%) |
| 8:00 AM to 8:29 AM | 87 (5.0%) | 179 (10.9%) |
| 8:30 AM to 8:59 AM | 72 (4.2%) | 39 (2.4%) |
| 9:00 AM to 9:59 AM | 84 (4.9%) | 59 (3.6%) |
| 10:00 AM to 10:59 AM | 9 (0.5%) | 60 (3.7%) |
| 11:00 AM to 11:59 AM | 0 (0.0%) | 24 (1.5%) |
| 12:00 PM to 3:59 PM | 229 (13.2%) | 177 (10.8%) |
| 4:00 PM to 11:59 PM | 56 (3.2%) | 201 (12.3%) |
| Total | 1,729 (100.0%) | 1,636 (100.0%) |
Housing Occupancy in Mendota
Occupancy by Ownership in Mendota
Of the total 2,791 dwellings in Mendota, owner-occupied units account for 2,000 (71.7%), while renter-occupied units make up 791 (28.3%).
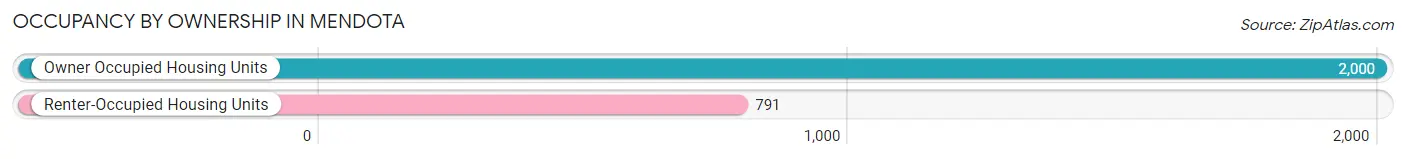
| Occupancy | # Housing Units | % Housing Units |
| Owner Occupied Housing Units | 2,000 | 71.7% |
| Renter-Occupied Housing Units | 791 | 28.3% |
| Total Occupied Housing Units | 2,791 | 100.0% |
Occupancy by Household Size in Mendota
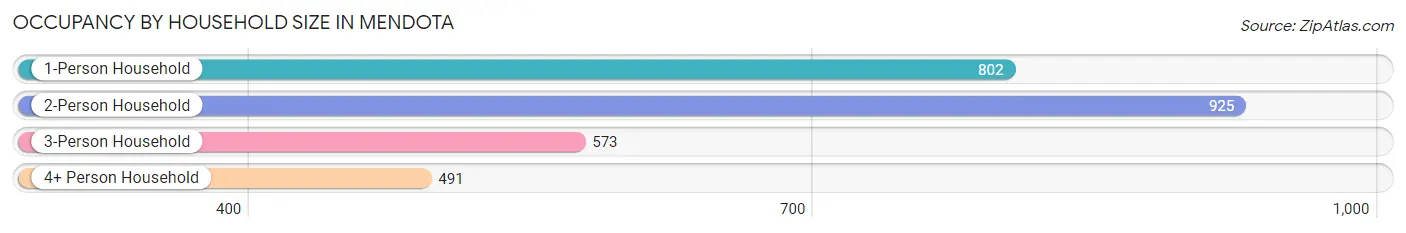
| Household Size | # Housing Units | % Housing Units |
| 1-Person Household | 802 | 28.7% |
| 2-Person Household | 925 | 33.1% |
| 3-Person Household | 573 | 20.5% |
| 4+ Person Household | 491 | 17.6% |
| Total Housing Units | 2,791 | 100.0% |
Occupancy by Ownership by Household Size in Mendota
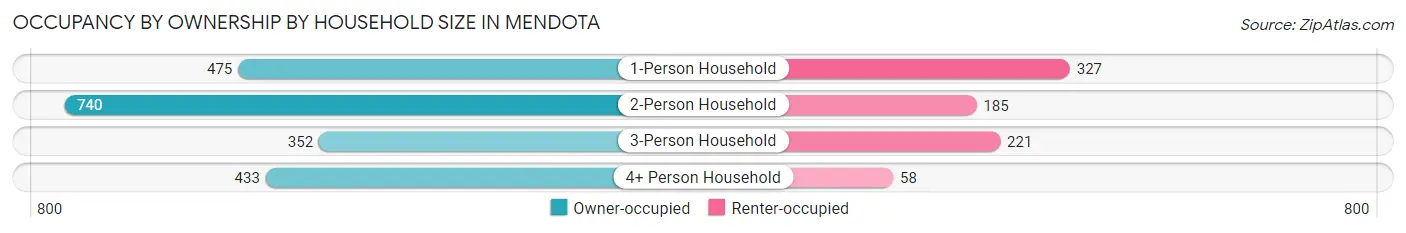
| Household Size | Owner-occupied | Renter-occupied |
| 1-Person Household | 475 (59.2%) | 327 (40.8%) |
| 2-Person Household | 740 (80.0%) | 185 (20.0%) |
| 3-Person Household | 352 (61.4%) | 221 (38.6%) |
| 4+ Person Household | 433 (88.2%) | 58 (11.8%) |
| Total Housing Units | 2,000 (71.7%) | 791 (28.3%) |
Occupancy by Educational Attainment in Mendota
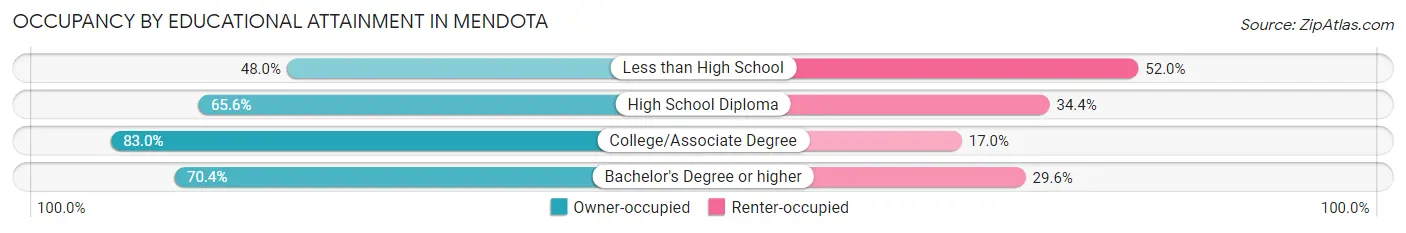
| Household Size | Owner-occupied | Renter-occupied |
| Less than High School | 121 (48.0%) | 131 (52.0%) |
| High School Diploma | 588 (65.6%) | 308 (34.4%) |
| College/Associate Degree | 885 (83.0%) | 181 (17.0%) |
| Bachelor's Degree or higher | 406 (70.4%) | 171 (29.6%) |
Occupancy by Age of Householder in Mendota
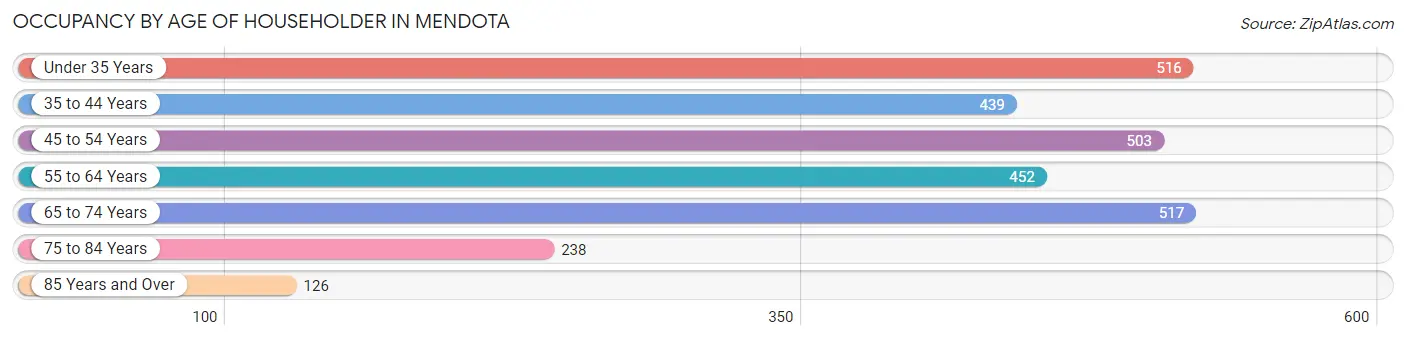
| Age Bracket | # Households | % Households |
| Under 35 Years | 516 | 18.5% |
| 35 to 44 Years | 439 | 15.7% |
| 45 to 54 Years | 503 | 18.0% |
| 55 to 64 Years | 452 | 16.2% |
| 65 to 74 Years | 517 | 18.5% |
| 75 to 84 Years | 238 | 8.5% |
| 85 Years and Over | 126 | 4.5% |
| Total | 2,791 | 100.0% |
Housing Finances in Mendota
Median Income by Occupancy in Mendota
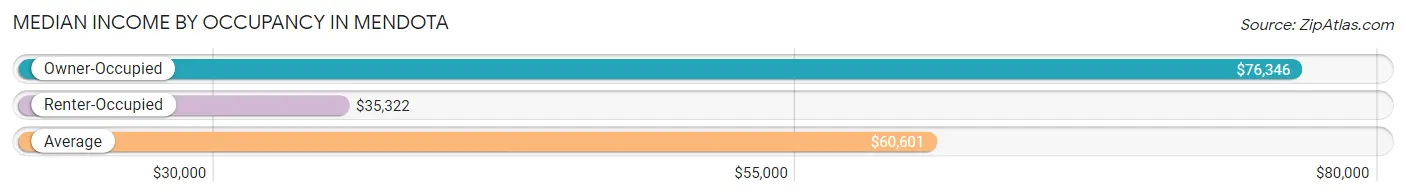
| Occupancy Type | # Households | Median Income |
| Owner-Occupied | 2,000 (71.7%) | $76,346 |
| Renter-Occupied | 791 (28.3%) | $35,322 |
| Average | 2,791 (100.0%) | $60,601 |
Occupancy by Householder Income Bracket in Mendota
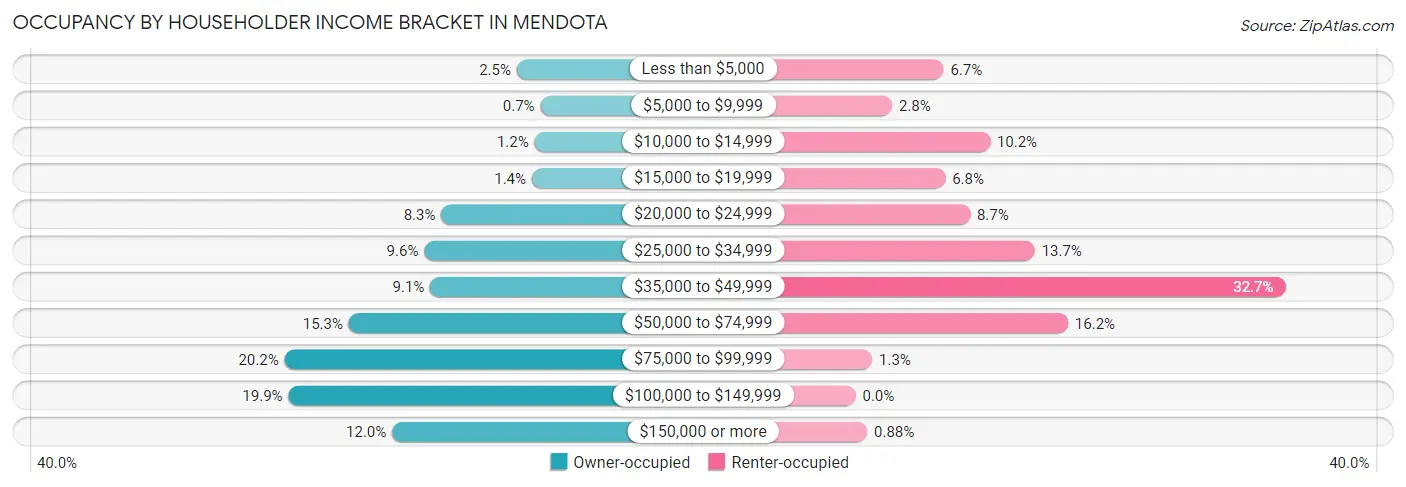
| Income Bracket | Owner-occupied | Renter-occupied |
| Less than $5,000 | 50 (2.5%) | 53 (6.7%) |
| $5,000 to $9,999 | 14 (0.7%) | 22 (2.8%) |
| $10,000 to $14,999 | 23 (1.1%) | 81 (10.2%) |
| $15,000 to $19,999 | 27 (1.3%) | 54 (6.8%) |
| $20,000 to $24,999 | 165 (8.3%) | 69 (8.7%) |
| $25,000 to $34,999 | 191 (9.6%) | 108 (13.7%) |
| $35,000 to $49,999 | 182 (9.1%) | 259 (32.7%) |
| $50,000 to $74,999 | 306 (15.3%) | 128 (16.2%) |
| $75,000 to $99,999 | 404 (20.2%) | 10 (1.3%) |
| $100,000 to $149,999 | 398 (19.9%) | 0 (0.0%) |
| $150,000 or more | 240 (12.0%) | 7 (0.9%) |
| Total | 2,000 (100.0%) | 791 (100.0%) |
Monthly Housing Cost Tiers in Mendota
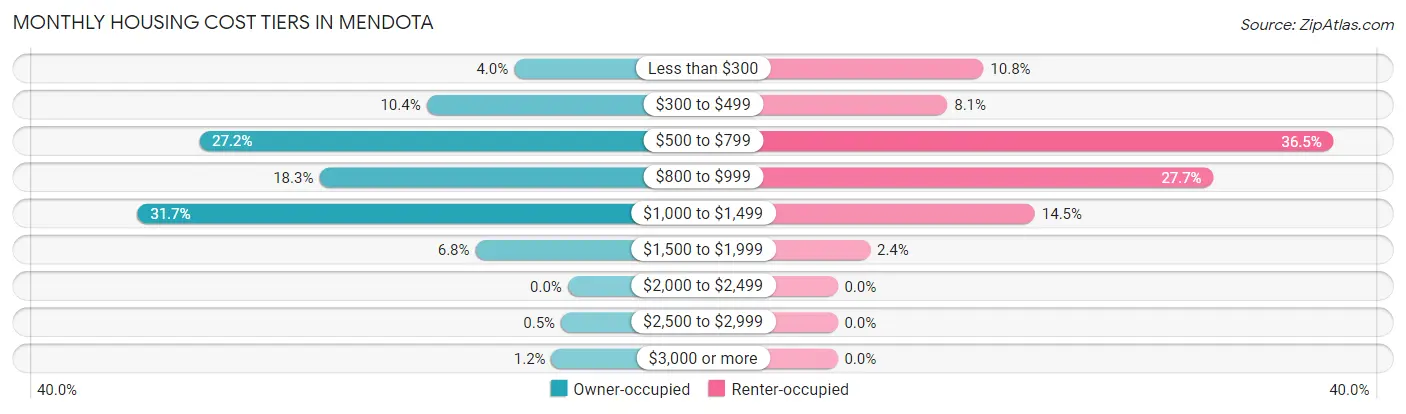
| Monthly Cost | Owner-occupied | Renter-occupied |
| Less than $300 | 79 (4.0%) | 85 (10.7%) |
| $300 to $499 | 208 (10.4%) | 64 (8.1%) |
| $500 to $799 | 543 (27.2%) | 289 (36.5%) |
| $800 to $999 | 366 (18.3%) | 219 (27.7%) |
| $1,000 to $1,499 | 634 (31.7%) | 115 (14.5%) |
| $1,500 to $1,999 | 136 (6.8%) | 19 (2.4%) |
| $2,000 to $2,499 | 0 (0.0%) | 0 (0.0%) |
| $2,500 to $2,999 | 10 (0.5%) | 0 (0.0%) |
| $3,000 or more | 24 (1.2%) | 0 (0.0%) |
| Total | 2,000 (100.0%) | 791 (100.0%) |
Physical Housing Characteristics in Mendota
Housing Structures in Mendota
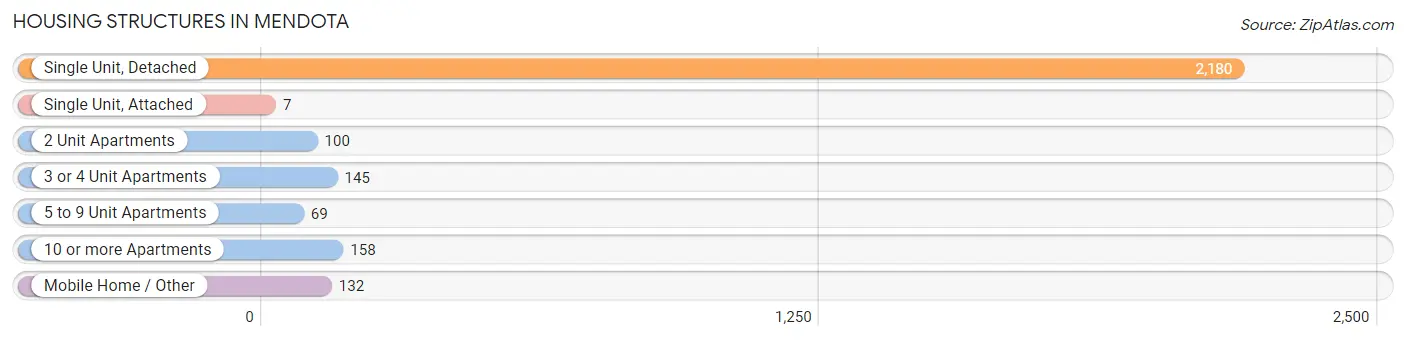
| Structure Type | # Housing Units | % Housing Units |
| Single Unit, Detached | 2,180 | 78.1% |
| Single Unit, Attached | 7 | 0.3% |
| 2 Unit Apartments | 100 | 3.6% |
| 3 or 4 Unit Apartments | 145 | 5.2% |
| 5 to 9 Unit Apartments | 69 | 2.5% |
| 10 or more Apartments | 158 | 5.7% |
| Mobile Home / Other | 132 | 4.7% |
| Total | 2,791 | 100.0% |
Housing Structures by Occupancy in Mendota
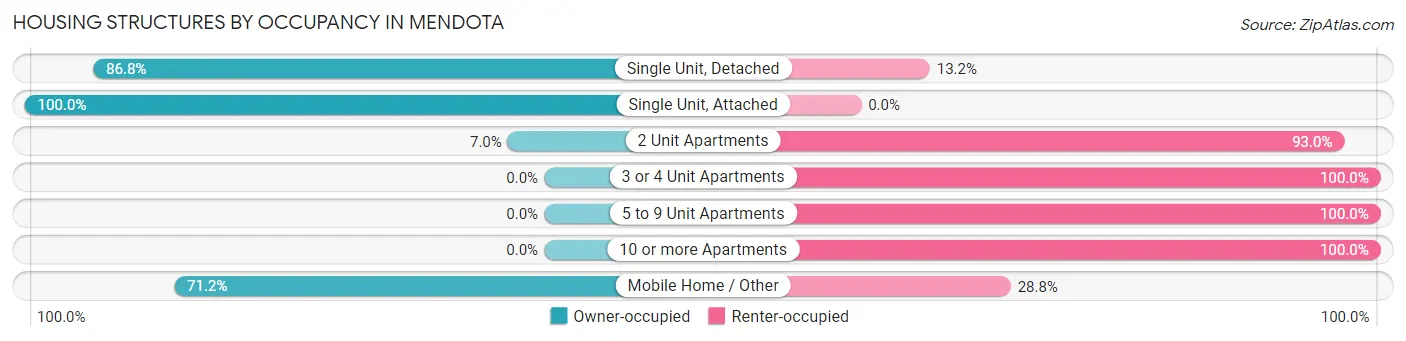
| Structure Type | Owner-occupied | Renter-occupied |
| Single Unit, Detached | 1,892 (86.8%) | 288 (13.2%) |
| Single Unit, Attached | 7 (100.0%) | 0 (0.0%) |
| 2 Unit Apartments | 7 (7.0%) | 93 (93.0%) |
| 3 or 4 Unit Apartments | 0 (0.0%) | 145 (100.0%) |
| 5 to 9 Unit Apartments | 0 (0.0%) | 69 (100.0%) |
| 10 or more Apartments | 0 (0.0%) | 158 (100.0%) |
| Mobile Home / Other | 94 (71.2%) | 38 (28.8%) |
| Total | 2,000 (71.7%) | 791 (28.3%) |
Housing Structures by Number of Rooms in Mendota
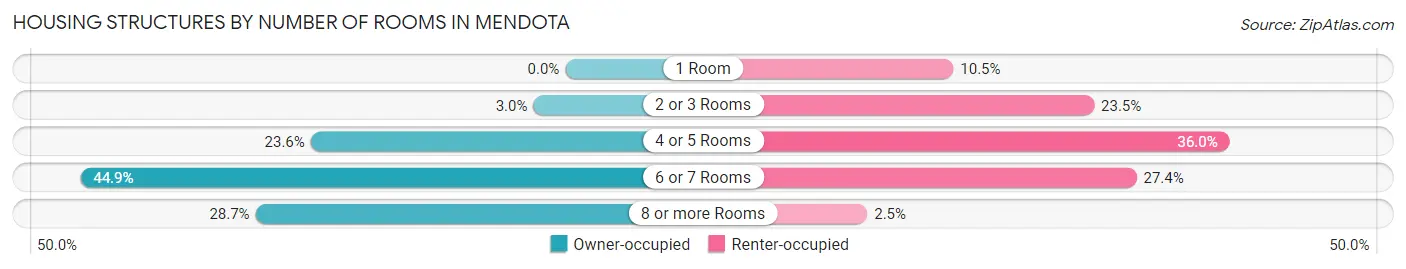
| Number of Rooms | Owner-occupied | Renter-occupied |
| 1 Room | 0 (0.0%) | 83 (10.5%) |
| 2 or 3 Rooms | 59 (2.9%) | 186 (23.5%) |
| 4 or 5 Rooms | 471 (23.5%) | 285 (36.0%) |
| 6 or 7 Rooms | 897 (44.9%) | 217 (27.4%) |
| 8 or more Rooms | 573 (28.6%) | 20 (2.5%) |
| Total | 2,000 (100.0%) | 791 (100.0%) |
Housing Structure by Heating Type in Mendota
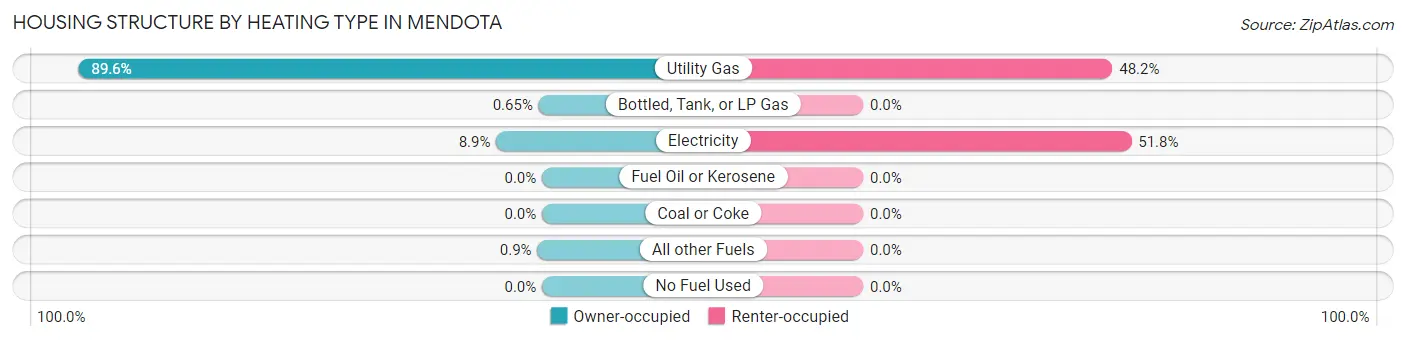
| Heating Type | Owner-occupied | Renter-occupied |
| Utility Gas | 1,792 (89.6%) | 381 (48.2%) |
| Bottled, Tank, or LP Gas | 13 (0.6%) | 0 (0.0%) |
| Electricity | 177 (8.8%) | 410 (51.8%) |
| Fuel Oil or Kerosene | 0 (0.0%) | 0 (0.0%) |
| Coal or Coke | 0 (0.0%) | 0 (0.0%) |
| All other Fuels | 18 (0.9%) | 0 (0.0%) |
| No Fuel Used | 0 (0.0%) | 0 (0.0%) |
| Total | 2,000 (100.0%) | 791 (100.0%) |
Household Vehicle Usage in Mendota
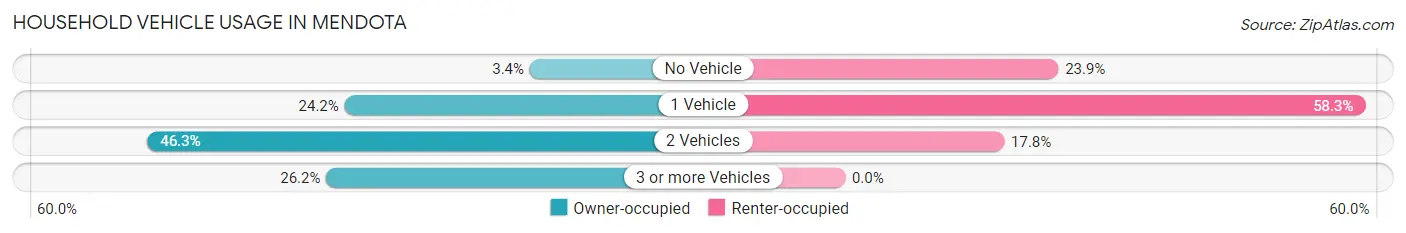
| Vehicles per Household | Owner-occupied | Renter-occupied |
| No Vehicle | 68 (3.4%) | 189 (23.9%) |
| 1 Vehicle | 483 (24.1%) | 461 (58.3%) |
| 2 Vehicles | 925 (46.3%) | 141 (17.8%) |
| 3 or more Vehicles | 524 (26.2%) | 0 (0.0%) |
| Total | 2,000 (100.0%) | 791 (100.0%) |
Real Estate & Mortgages in Mendota
Real Estate and Mortgage Overview in Mendota
| Characteristic | Without Mortgage | With Mortgage |
| Housing Units | 817 | 1,183 |
| Median Property Value | $126,700 | $120,500 |
| Median Household Income | $76,215 | $139 |
| Monthly Housing Costs | $576 | $24 |
| Real Estate Taxes | $2,524 | $16 |
Property Value by Mortgage Status in Mendota
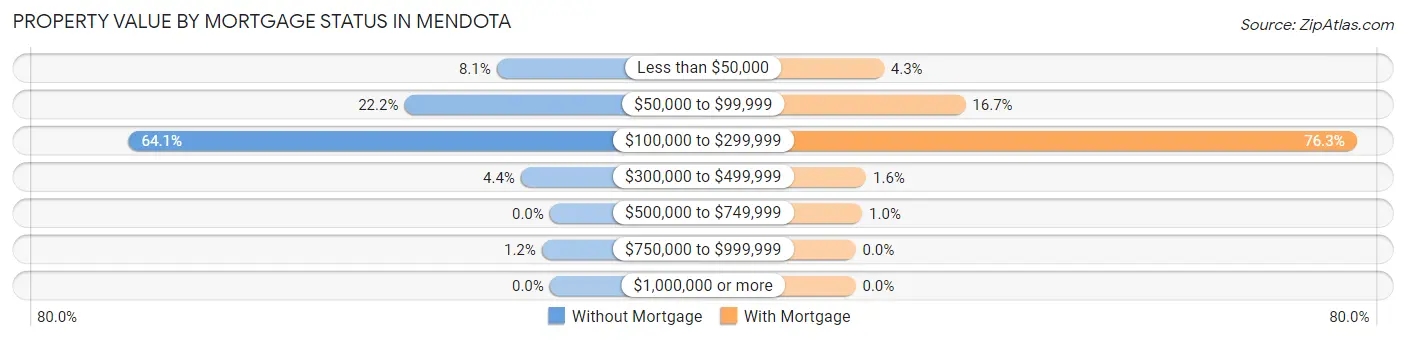
| Property Value | Without Mortgage | With Mortgage |
| Less than $50,000 | 66 (8.1%) | 51 (4.3%) |
| $50,000 to $99,999 | 181 (22.2%) | 198 (16.7%) |
| $100,000 to $299,999 | 524 (64.1%) | 903 (76.3%) |
| $300,000 to $499,999 | 36 (4.4%) | 19 (1.6%) |
| $500,000 to $749,999 | 0 (0.0%) | 12 (1.0%) |
| $750,000 to $999,999 | 10 (1.2%) | 0 (0.0%) |
| $1,000,000 or more | 0 (0.0%) | 0 (0.0%) |
| Total | 817 (100.0%) | 1,183 (100.0%) |
Household Income by Mortgage Status in Mendota
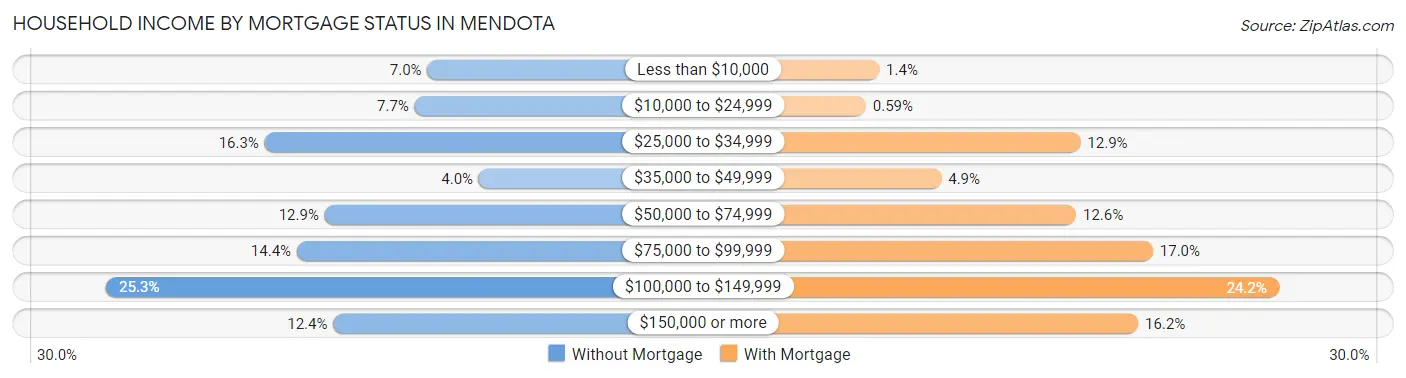
| Household Income | Without Mortgage | With Mortgage |
| Less than $10,000 | 57 (7.0%) | 16 (1.3%) |
| $10,000 to $24,999 | 63 (7.7%) | 7 (0.6%) |
| $25,000 to $34,999 | 133 (16.3%) | 152 (12.9%) |
| $35,000 to $49,999 | 33 (4.0%) | 58 (4.9%) |
| $50,000 to $74,999 | 105 (12.9%) | 149 (12.6%) |
| $75,000 to $99,999 | 118 (14.4%) | 201 (17.0%) |
| $100,000 to $149,999 | 207 (25.3%) | 286 (24.2%) |
| $150,000 or more | 101 (12.4%) | 191 (16.2%) |
| Total | 817 (100.0%) | 1,183 (100.0%) |
Property Value to Household Income Ratio in Mendota
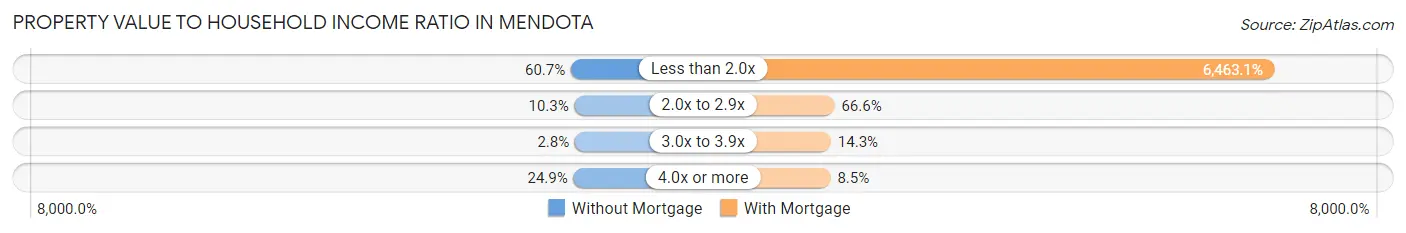
| Value-to-Income Ratio | Without Mortgage | With Mortgage |
| Less than 2.0x | 496 (60.7%) | 76,458 (6,463.1%) |
| 2.0x to 2.9x | 84 (10.3%) | 788 (66.6%) |
| 3.0x to 3.9x | 23 (2.8%) | 169 (14.3%) |
| 4.0x or more | 203 (24.8%) | 100 (8.5%) |
| Total | 817 (100.0%) | 1,183 (100.0%) |
Real Estate Taxes by Mortgage Status in Mendota
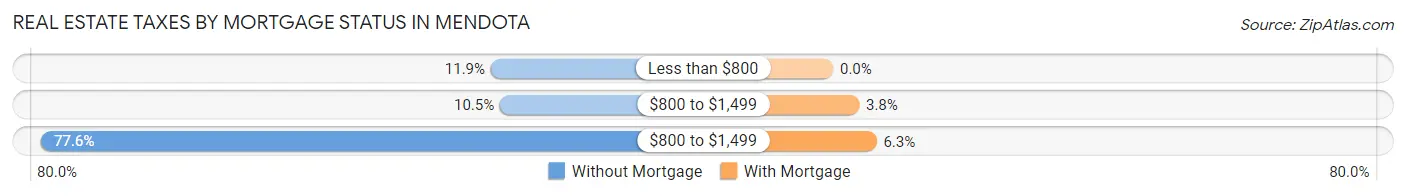
| Property Taxes | Without Mortgage | With Mortgage |
| Less than $800 | 97 (11.9%) | 0 (0.0%) |
| $800 to $1,499 | 86 (10.5%) | 45 (3.8%) |
| $800 to $1,499 | 634 (77.6%) | 75 (6.3%) |
| Total | 817 (100.0%) | 1,183 (100.0%) |
Health & Disability in Mendota
Health Insurance Coverage by Age in Mendota
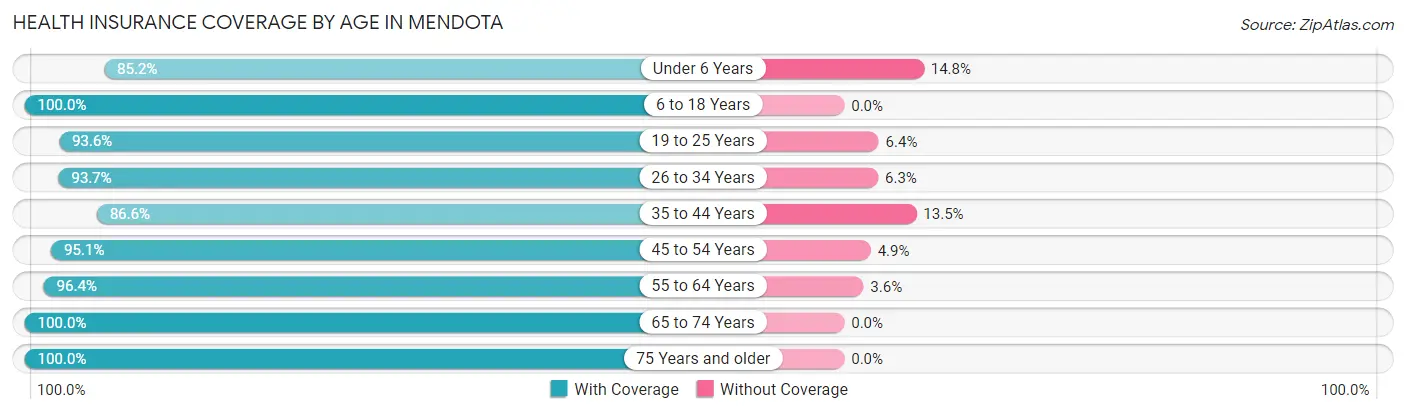
| Age Bracket | With Coverage | Without Coverage |
| Under 6 Years | 379 (85.2%) | 66 (14.8%) |
| 6 to 18 Years | 1,240 (100.0%) | 0 (0.0%) |
| 19 to 25 Years | 672 (93.6%) | 46 (6.4%) |
| 26 to 34 Years | 744 (93.7%) | 50 (6.3%) |
| 35 to 44 Years | 624 (86.6%) | 97 (13.5%) |
| 45 to 54 Years | 848 (95.1%) | 44 (4.9%) |
| 55 to 64 Years | 705 (96.4%) | 26 (3.6%) |
| 65 to 74 Years | 736 (100.0%) | 0 (0.0%) |
| 75 Years and older | 524 (100.0%) | 0 (0.0%) |
| Total | 6,472 (95.2%) | 329 (4.8%) |
Health Insurance Coverage by Citizenship Status in Mendota
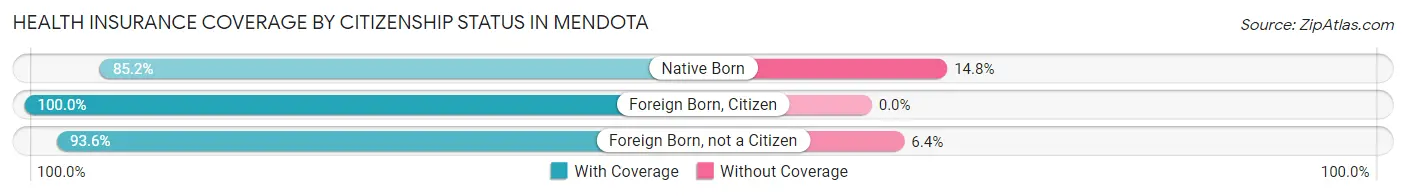
| Citizenship Status | With Coverage | Without Coverage |
| Native Born | 379 (85.2%) | 66 (14.8%) |
| Foreign Born, Citizen | 1,240 (100.0%) | 0 (0.0%) |
| Foreign Born, not a Citizen | 672 (93.6%) | 46 (6.4%) |
Health Insurance Coverage by Household Income in Mendota
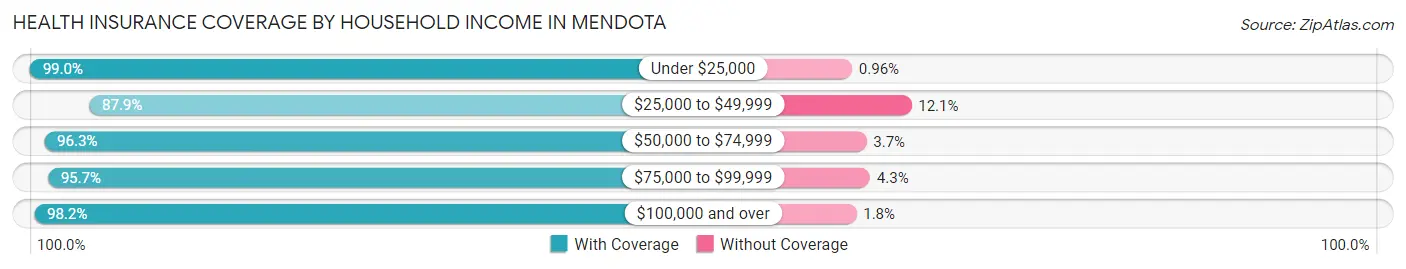
| Household Income | With Coverage | Without Coverage |
| Under $25,000 | 823 (99.0%) | 8 (1.0%) |
| $25,000 to $49,999 | 1,381 (87.9%) | 190 (12.1%) |
| $50,000 to $74,999 | 1,075 (96.3%) | 41 (3.7%) |
| $75,000 to $99,999 | 1,194 (95.7%) | 54 (4.3%) |
| $100,000 and over | 1,984 (98.2%) | 36 (1.8%) |
Public vs Private Health Insurance Coverage by Age in Mendota
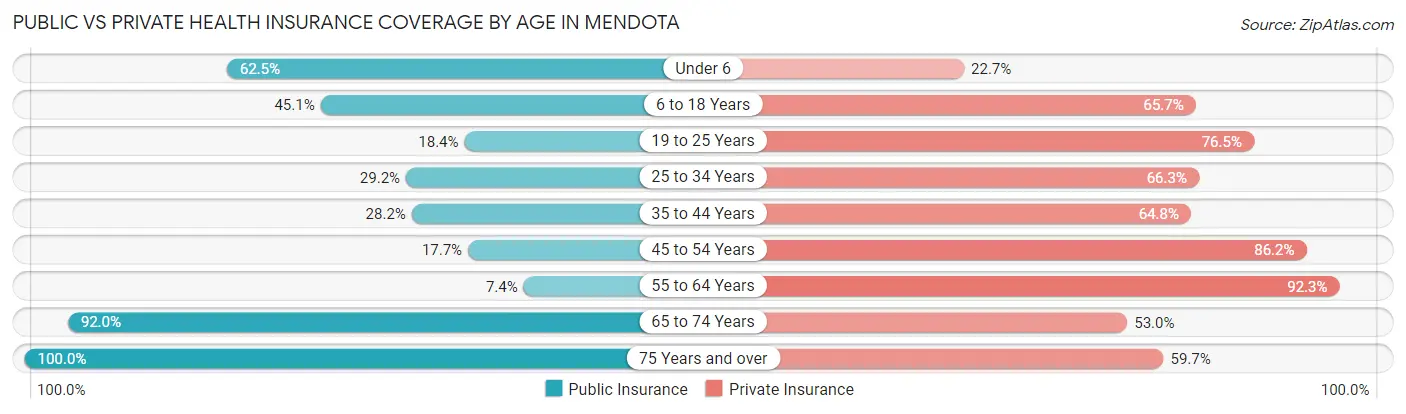
| Age Bracket | Public Insurance | Private Insurance |
| Under 6 | 278 (62.5%) | 101 (22.7%) |
| 6 to 18 Years | 559 (45.1%) | 814 (65.6%) |
| 19 to 25 Years | 132 (18.4%) | 549 (76.5%) |
| 25 to 34 Years | 232 (29.2%) | 526 (66.2%) |
| 35 to 44 Years | 203 (28.2%) | 467 (64.8%) |
| 45 to 54 Years | 158 (17.7%) | 769 (86.2%) |
| 55 to 64 Years | 54 (7.4%) | 675 (92.3%) |
| 65 to 74 Years | 677 (92.0%) | 390 (53.0%) |
| 75 Years and over | 524 (100.0%) | 313 (59.7%) |
| Total | 2,817 (41.4%) | 4,604 (67.7%) |
Disability Status by Sex by Age in Mendota
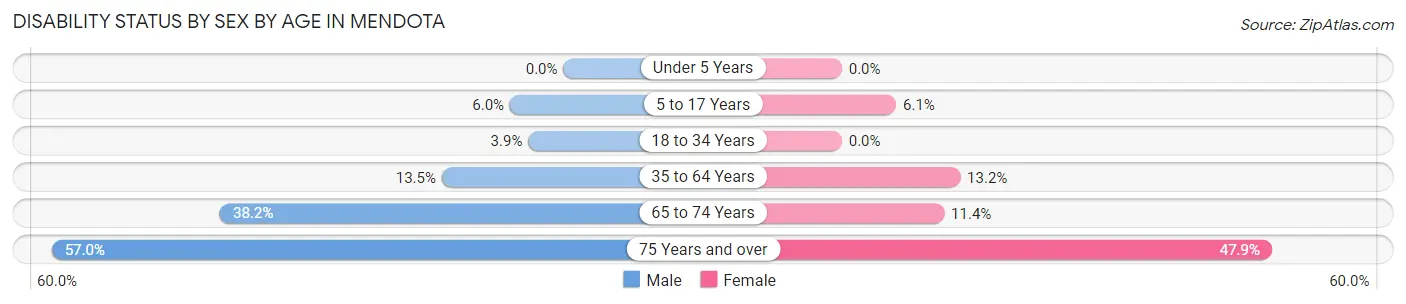
| Age Bracket | Male | Female |
| Under 5 Years | 0 (0.0%) | 0 (0.0%) |
| 5 to 17 Years | 39 (5.9%) | 34 (6.0%) |
| 18 to 34 Years | 29 (3.9%) | 0 (0.0%) |
| 35 to 64 Years | 153 (13.5%) | 160 (13.2%) |
| 65 to 74 Years | 164 (38.2%) | 35 (11.4%) |
| 75 Years and over | 151 (57.0%) | 124 (47.9%) |
Disability Class by Sex by Age in Mendota
Disability Class: Hearing Difficulty
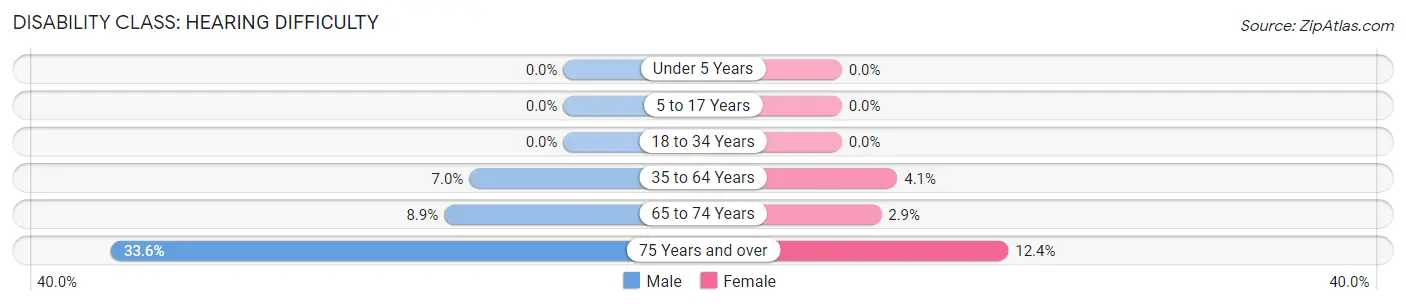
| Age Bracket | Male | Female |
| Under 5 Years | 0 (0.0%) | 0 (0.0%) |
| 5 to 17 Years | 0 (0.0%) | 0 (0.0%) |
| 18 to 34 Years | 0 (0.0%) | 0 (0.0%) |
| 35 to 64 Years | 79 (7.0%) | 50 (4.1%) |
| 65 to 74 Years | 38 (8.9%) | 9 (2.9%) |
| 75 Years and over | 89 (33.6%) | 32 (12.4%) |
Disability Class: Vision Difficulty
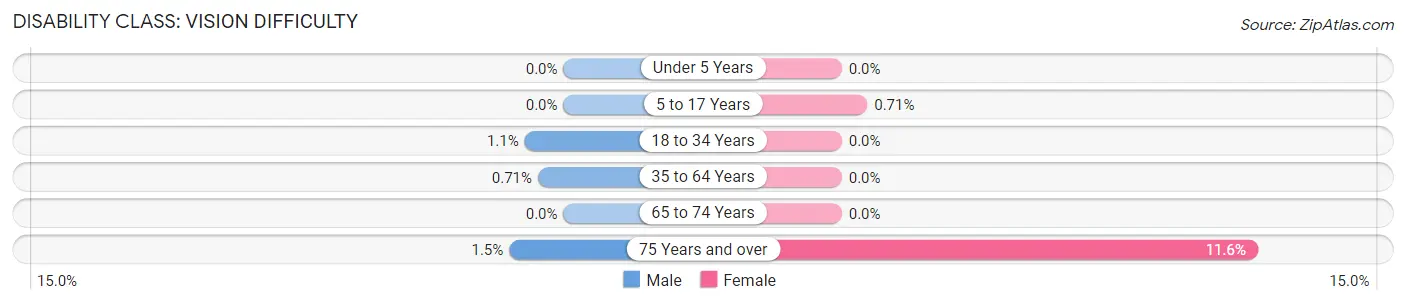
| Age Bracket | Male | Female |
| Under 5 Years | 0 (0.0%) | 0 (0.0%) |
| 5 to 17 Years | 0 (0.0%) | 4 (0.7%) |
| 18 to 34 Years | 8 (1.1%) | 0 (0.0%) |
| 35 to 64 Years | 8 (0.7%) | 0 (0.0%) |
| 65 to 74 Years | 0 (0.0%) | 0 (0.0%) |
| 75 Years and over | 4 (1.5%) | 30 (11.6%) |
Disability Class: Cognitive Difficulty
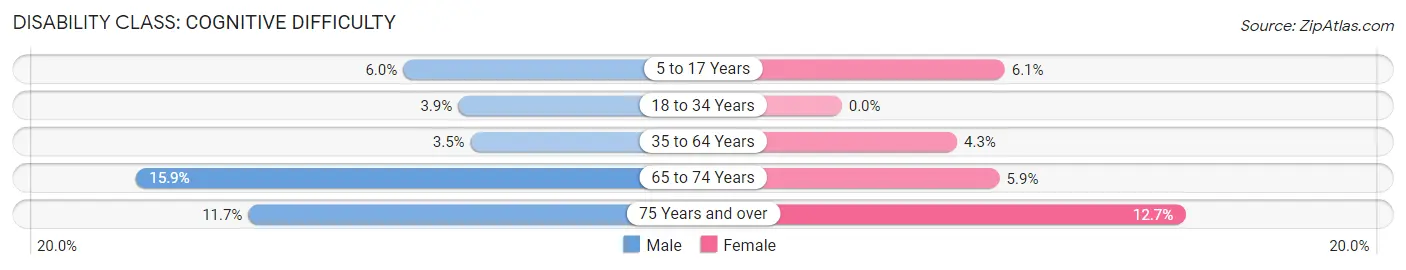
| Age Bracket | Male | Female |
| 5 to 17 Years | 39 (5.9%) | 34 (6.0%) |
| 18 to 34 Years | 29 (3.9%) | 0 (0.0%) |
| 35 to 64 Years | 39 (3.5%) | 52 (4.3%) |
| 65 to 74 Years | 68 (15.9%) | 18 (5.9%) |
| 75 Years and over | 31 (11.7%) | 33 (12.7%) |
Disability Class: Ambulatory Difficulty
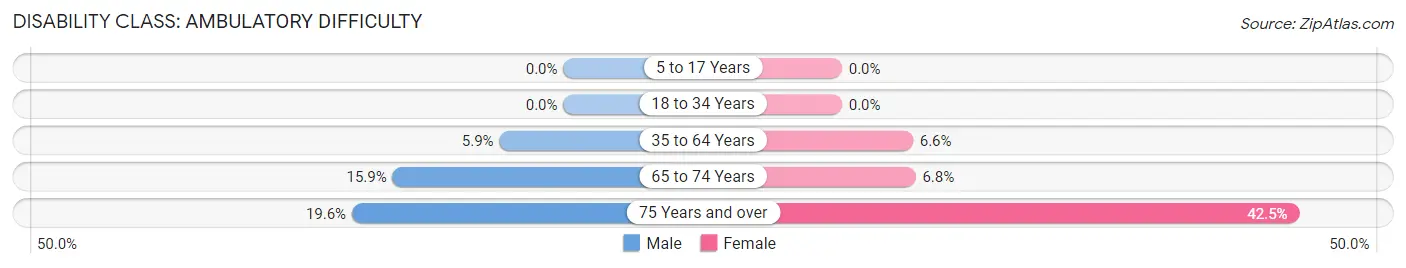
| Age Bracket | Male | Female |
| 5 to 17 Years | 0 (0.0%) | 0 (0.0%) |
| 18 to 34 Years | 0 (0.0%) | 0 (0.0%) |
| 35 to 64 Years | 67 (5.9%) | 80 (6.6%) |
| 65 to 74 Years | 68 (15.9%) | 21 (6.8%) |
| 75 Years and over | 52 (19.6%) | 110 (42.5%) |
Disability Class: Self-Care Difficulty
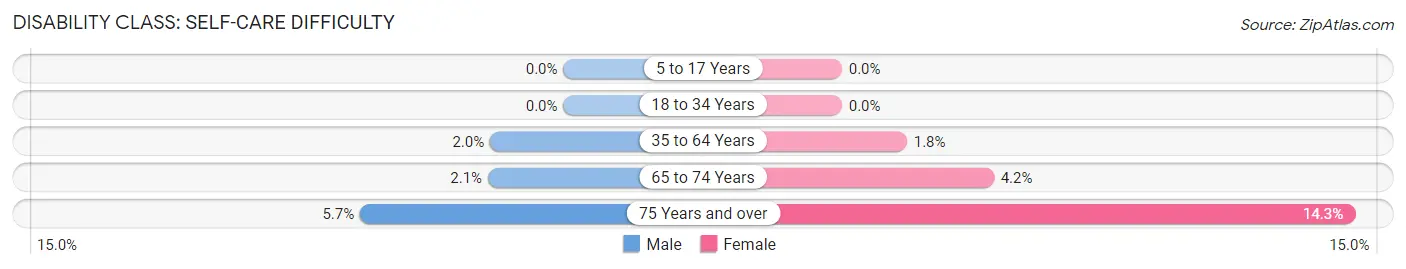
| Age Bracket | Male | Female |
| 5 to 17 Years | 0 (0.0%) | 0 (0.0%) |
| 18 to 34 Years | 0 (0.0%) | 0 (0.0%) |
| 35 to 64 Years | 23 (2.0%) | 22 (1.8%) |
| 65 to 74 Years | 9 (2.1%) | 13 (4.2%) |
| 75 Years and over | 15 (5.7%) | 37 (14.3%) |
Technology Access in Mendota
Computing Device Access in Mendota
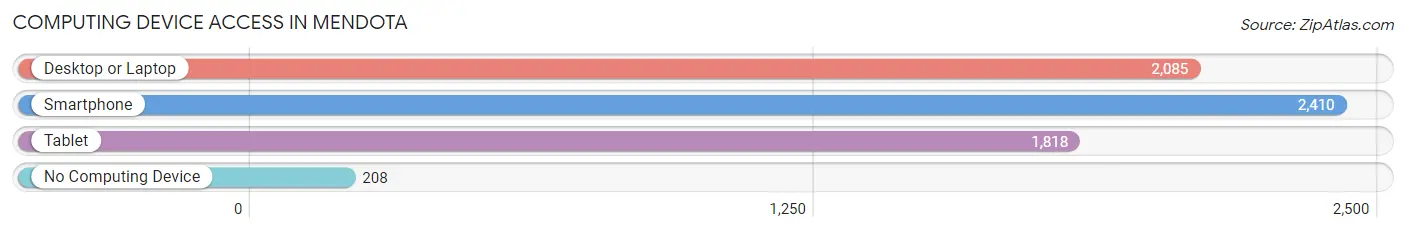
| Device Type | # Households | % Households |
| Desktop or Laptop | 2,085 | 74.7% |
| Smartphone | 2,410 | 86.4% |
| Tablet | 1,818 | 65.1% |
| No Computing Device | 208 | 7.4% |
| Total | 2,791 | 100.0% |
Internet Access in Mendota
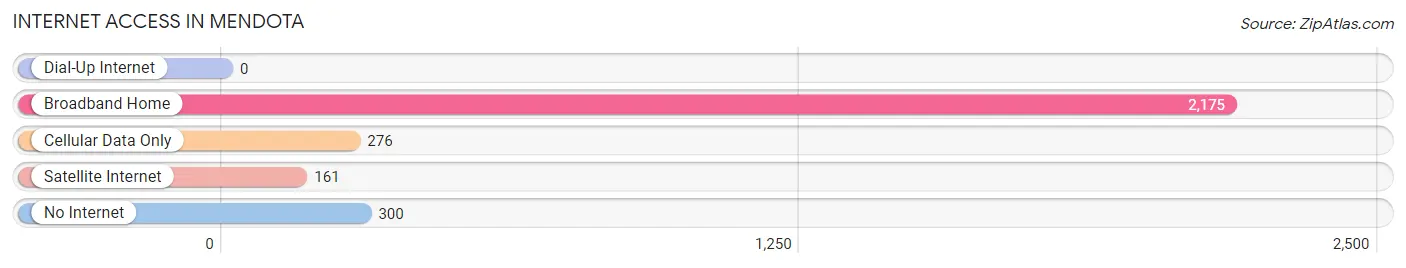
| Internet Type | # Households | % Households |
| Dial-Up Internet | 0 | 0.0% |
| Broadband Home | 2,175 | 77.9% |
| Cellular Data Only | 276 | 9.9% |
| Satellite Internet | 161 | 5.8% |
| No Internet | 300 | 10.7% |
| Total | 2,791 | 100.0% |
Mendota Summary
Mendota, Illinois is a small city located in LaSalle County, Illinois, United States. The city is situated on the banks of the Illinois River, approximately 80 miles southwest of Chicago. As of the 2010 census, the population of Mendota was 7,372.
History
Mendota was founded in 1835 by a group of settlers from New York. The city was named after the Mendota tribe of Native Americans who lived in the area. The first settlers were primarily farmers, and the city quickly grew to become an important agricultural center. In 1854, the Illinois Central Railroad was built through Mendota, connecting the city to Chicago and other major cities. This allowed for the growth of the city’s economy and population.
In the late 19th century, Mendota became an important industrial center. The city was home to several factories, including a brickyard, a flour mill, and a canning factory. The city also had a large lumber industry, which provided jobs for many of the city’s residents.
Geography
Mendota is located in LaSalle County, Illinois, at the intersection of Interstate 39 and U.S. Route 34. The city is situated on the banks of the Illinois River, approximately 80 miles southwest of Chicago. The city has a total area of 4.2 square miles, all of which is land.
The climate in Mendota is classified as humid continental, with hot, humid summers and cold, snowy winters. The average temperature in the summer is around 75 degrees Fahrenheit, and the average temperature in the winter is around 25 degrees Fahrenheit.
Economy
Mendota’s economy is primarily based on agriculture and manufacturing. The city is home to several factories, including a brickyard, a flour mill, and a canning factory. The city also has a large lumber industry, which provides jobs for many of the city’s residents.
The city is also home to several retail stores, restaurants, and other businesses. The city’s largest employer is the Mendota Community Hospital, which employs over 1,000 people.
Demographics
As of the 2010 census, the population of Mendota was 7,372. The racial makeup of the city was 87.3% White, 8.2% African American, 0.3% Native American, 0.7% Asian, 0.1% Pacific Islander, 1.2% from other races, and 2.3% from two or more races. Hispanic or Latino of any race were 4.2% of the population.
The median income for a household in Mendota was $41,944, and the median income for a family was $50,917. The per capita income for the city was $20,845. About 11.2% of families and 14.2% of the population were below the poverty line, including 19.2% of those under age 18 and 8.2% of those age 65 or over.
Common Questions
What is Per Capita Income in Mendota?
Per Capita income in Mendota is $30,024.
What is the Median Family Income in Mendota?
Median Family Income in Mendota is $72,841.
What is the Median Household income in Mendota?
Median Household Income in Mendota is $60,601.
What is Income or Wage Gap in Mendota?
Income or Wage Gap in Mendota is 49.0%.
Women in Mendota earn 51.0 cents for every dollar earned by a man.
What is Inequality or Gini Index in Mendota?
Inequality or Gini Index in Mendota is 0.41.
What is the Total Population of Mendota?
Total Population of Mendota is 6,961.
What is the Total Male Population of Mendota?
Total Male Population of Mendota is 3,498.
What is the Total Female Population of Mendota?
Total Female Population of Mendota is 3,463.
What is the Ratio of Males per 100 Females in Mendota?
There are 101.01 Males per 100 Females in Mendota.
What is the Ratio of Females per 100 Males in Mendota?
There are 99.00 Females per 100 Males in Mendota.
What is the Median Population Age in Mendota?
Median Population Age in Mendota is 38.9 Years.
What is the Average Family Size in Mendota
Average Family Size in Mendota is 3.0 People.
What is the Average Household Size in Mendota
Average Household Size in Mendota is 2.4 People.
How Large is the Labor Force in Mendota?
There are 3,551 People in the Labor Forcein in Mendota.
What is the Percentage of People in the Labor Force in Mendota?
63.6% of People are in the Labor Force in Mendota.
What is the Unemployment Rate in Mendota?
Unemployment Rate in Mendota is 3.8%.