Worth, IL Map & Demographics
Worth Map
Worth Overview
$31,036
PER CAPITA INCOME
$72,411
AVG FAMILY INCOME
$54,893
AVG HOUSEHOLD INCOME
36.6%
WAGE / INCOME GAP [ % ]
63.4¢/ $1
WAGE / INCOME GAP [ $ ]
$11,107
FAMILY INCOME DEFICIT
0.44
INEQUALITY / GINI INDEX
10,859
TOTAL POPULATION
5,432
MALE POPULATION
5,427
FEMALE POPULATION
100.09
MALES / 100 FEMALES
99.91
FEMALES / 100 MALES
39.1
MEDIAN AGE
3.1
AVG FAMILY SIZE
2.5
AVG HOUSEHOLD SIZE
5,727
LABOR FORCE [ PEOPLE ]
64.5%
PERCENT IN LABOR FORCE
10.8%
UNEMPLOYMENT RATE
Worth Zip Codes
Income in Worth
Income Overview in Worth
Per Capita Income in Worth is $31,036, while median incomes of families and households are $72,411 and $54,893 respectively.
| Characteristic | Number | Measure |
| Per Capita Income | 10,859 | $31,036 |
| Median Family Income | 2,848 | $72,411 |
| Mean Family Income | 2,848 | $89,128 |
| Median Household Income | 4,363 | $54,893 |
| Mean Household Income | 4,363 | $74,210 |
| Income Deficit | 2,848 | $11,107 |
| Wage / Income Gap (%) | 10,859 | 36.63% |
| Wage / Income Gap ($) | 10,859 | 63.37¢ per $1 |
| Gini / Inequality Index | 10,859 | 0.44 |
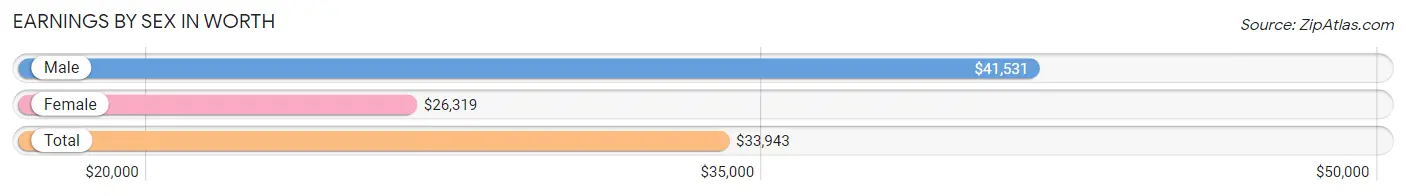
Earnings by Sex in Worth
Average Earnings in Worth are $33,943, $41,531 for men and $26,319 for women, a difference of 36.6%.
| Sex | Number | Average Earnings |
| Male | 3,105 (52.5%) | $41,531 |
| Female | 2,806 (47.5%) | $26,319 |
| Total | 5,911 (100.0%) | $33,943 |
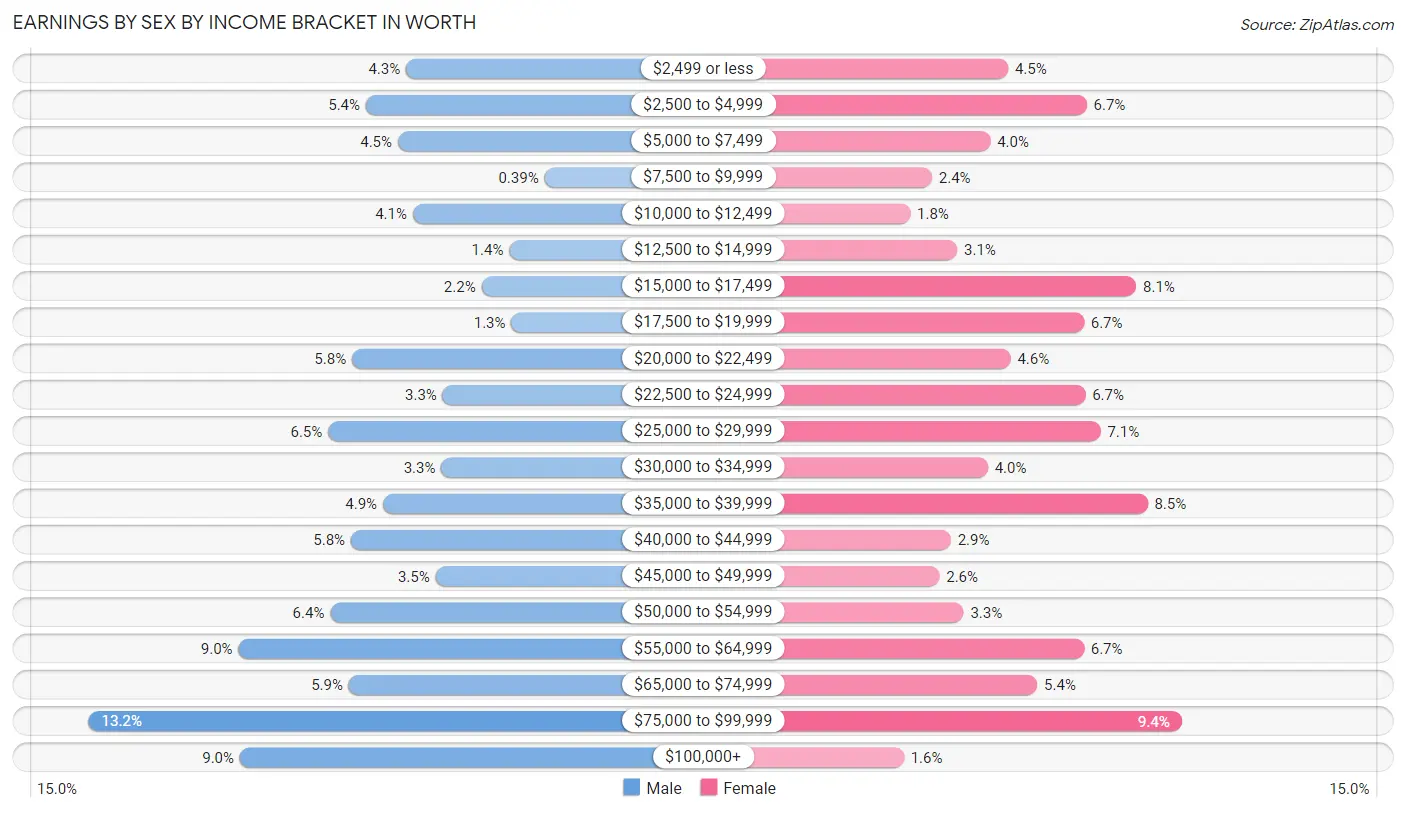
Earnings by Sex by Income Bracket in Worth
The most common earnings brackets in Worth are $75,000 to $99,999 for men (410 | 13.2%) and $75,000 to $99,999 for women (264 | 9.4%).
| Income | Male | Female |
| $2,499 or less | 133 (4.3%) | 127 (4.5%) |
| $2,500 to $4,999 | 168 (5.4%) | 189 (6.7%) |
| $5,000 to $7,499 | 140 (4.5%) | 113 (4.0%) |
| $7,500 to $9,999 | 12 (0.4%) | 67 (2.4%) |
| $10,000 to $12,499 | 127 (4.1%) | 50 (1.8%) |
| $12,500 to $14,999 | 43 (1.4%) | 87 (3.1%) |
| $15,000 to $17,499 | 67 (2.2%) | 228 (8.1%) |
| $17,500 to $19,999 | 41 (1.3%) | 187 (6.7%) |
| $20,000 to $22,499 | 180 (5.8%) | 129 (4.6%) |
| $22,500 to $24,999 | 101 (3.3%) | 188 (6.7%) |
| $25,000 to $29,999 | 201 (6.5%) | 200 (7.1%) |
| $30,000 to $34,999 | 102 (3.3%) | 111 (4.0%) |
| $35,000 to $39,999 | 153 (4.9%) | 237 (8.5%) |
| $40,000 to $44,999 | 181 (5.8%) | 82 (2.9%) |
| $45,000 to $49,999 | 107 (3.5%) | 73 (2.6%) |
| $50,000 to $54,999 | 199 (6.4%) | 92 (3.3%) |
| $55,000 to $64,999 | 279 (9.0%) | 187 (6.7%) |
| $65,000 to $74,999 | 183 (5.9%) | 150 (5.3%) |
| $75,000 to $99,999 | 410 (13.2%) | 264 (9.4%) |
| $100,000+ | 278 (8.9%) | 45 (1.6%) |
| Total | 3,105 (100.0%) | 2,806 (100.0%) |
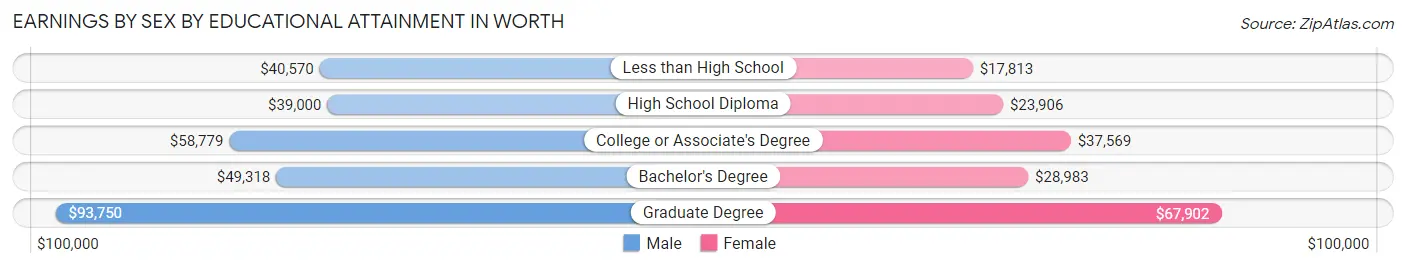
Earnings by Sex by Educational Attainment in Worth
Average earnings in Worth are $47,353 for men and $30,455 for women, a difference of 35.7%. Men with an educational attainment of graduate degree enjoy the highest average annual earnings of $93,750, while those with high school diploma education earn the least with $39,000. Women with an educational attainment of graduate degree earn the most with the average annual earnings of $67,902, while those with less than high school education have the smallest earnings of $17,813.
| Educational Attainment | Male Income | Female Income |
| Less than High School | $40,570 | $17,813 |
| High School Diploma | $39,000 | $23,906 |
| College or Associate's Degree | $58,779 | $37,569 |
| Bachelor's Degree | $49,318 | $28,983 |
| Graduate Degree | $93,750 | $67,902 |
| Total | $47,353 | $30,455 |
Family Income in Worth
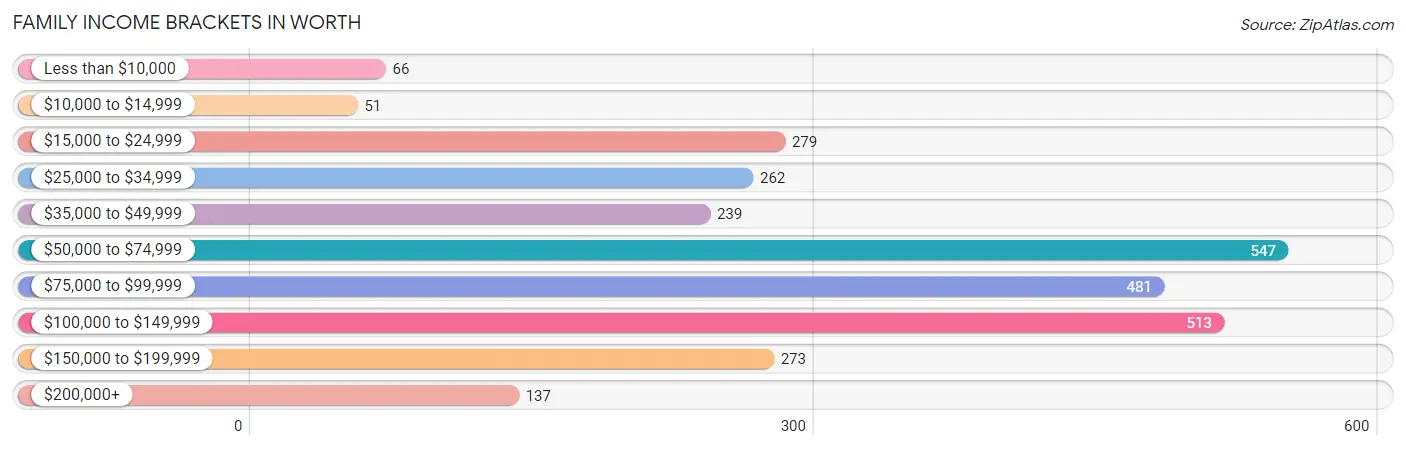
Family Income Brackets in Worth
According to the Worth family income data, there are 547 families falling into the $50,000 to $74,999 income range, which is the most common income bracket and makes up 19.2% of all families. Conversely, the $10,000 to $14,999 income bracket is the least frequent group with only 51 families (1.8%) belonging to this category.
| Income Bracket | # Families | % Families |
| Less than $10,000 | 66 | 2.3% |
| $10,000 to $14,999 | 51 | 1.8% |
| $15,000 to $24,999 | 279 | 9.8% |
| $25,000 to $34,999 | 262 | 9.2% |
| $35,000 to $49,999 | 239 | 8.4% |
| $50,000 to $74,999 | 547 | 19.2% |
| $75,000 to $99,999 | 481 | 16.9% |
| $100,000 to $149,999 | 513 | 18.0% |
| $150,000 to $199,999 | 273 | 9.6% |
| $200,000+ | 137 | 4.8% |
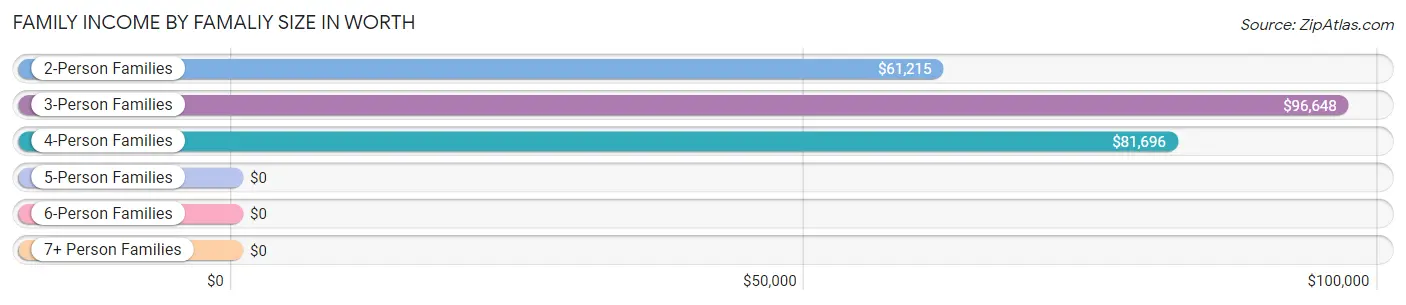
Family Income by Famaliy Size in Worth
3-person families (593 | 20.8%) account for the highest median family income in Worth with $96,648 per family, while 3-person families (593 | 20.8%) have the highest median income of $32,216 per family member.
| Income Bracket | # Families | Median Income |
| 2-Person Families | 1,259 (44.2%) | $61,215 |
| 3-Person Families | 593 (20.8%) | $96,648 |
| 4-Person Families | 733 (25.7%) | $81,696 |
| 5-Person Families | 173 (6.1%) | $0 |
| 6-Person Families | 66 (2.3%) | $0 |
| 7+ Person Families | 24 (0.8%) | $0 |
| Total | 2,848 (100.0%) | $72,411 |
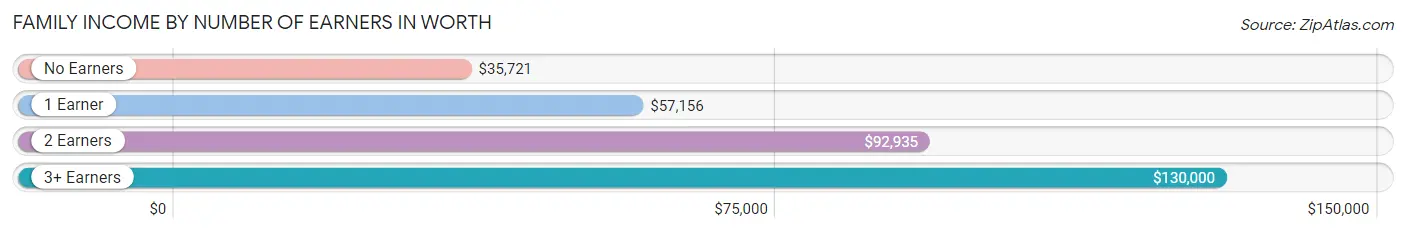
Family Income by Number of Earners in Worth
The median family income in Worth is $72,411, with families comprising 3+ earners (418) having the highest median family income of $130,000, while families with no earners (423) have the lowest median family income of $35,721, accounting for 14.7% and 14.8% of families, respectively.
| Number of Earners | # Families | Median Income |
| No Earners | 423 (14.8%) | $35,721 |
| 1 Earner | 939 (33.0%) | $57,156 |
| 2 Earners | 1,068 (37.5%) | $92,935 |
| 3+ Earners | 418 (14.7%) | $130,000 |
| Total | 2,848 (100.0%) | $72,411 |
Household Income in Worth
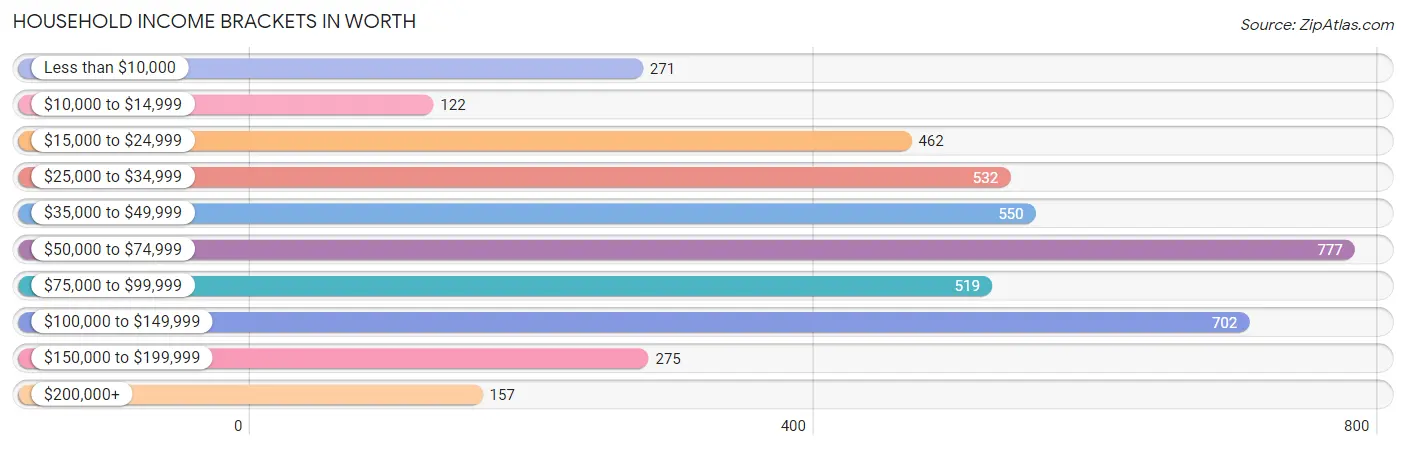
Household Income Brackets in Worth
With 777 households falling in the category, the $50,000 to $74,999 income range is the most frequent in Worth, accounting for 17.8% of all households. In contrast, only 122 households (2.8%) fall into the $10,000 to $14,999 income bracket, making it the least populous group.
| Income Bracket | # Households | % Households |
| Less than $10,000 | 271 | 6.2% |
| $10,000 to $14,999 | 122 | 2.8% |
| $15,000 to $24,999 | 462 | 10.6% |
| $25,000 to $34,999 | 532 | 12.2% |
| $35,000 to $49,999 | 550 | 12.6% |
| $50,000 to $74,999 | 777 | 17.8% |
| $75,000 to $99,999 | 519 | 11.9% |
| $100,000 to $149,999 | 702 | 16.1% |
| $150,000 to $199,999 | 275 | 6.3% |
| $200,000+ | 157 | 3.6% |
Household Income by Householder Age in Worth
The median household income in Worth is $54,893, with the highest median household income of $63,281 found in the 45 to 64 years age bracket for the primary householder. A total of 1,692 households (38.8%) fall into this category. Meanwhile, the 15 to 24 years age bracket for the primary householder has the lowest median household income of $38,333, with 180 households (4.1%) in this group.
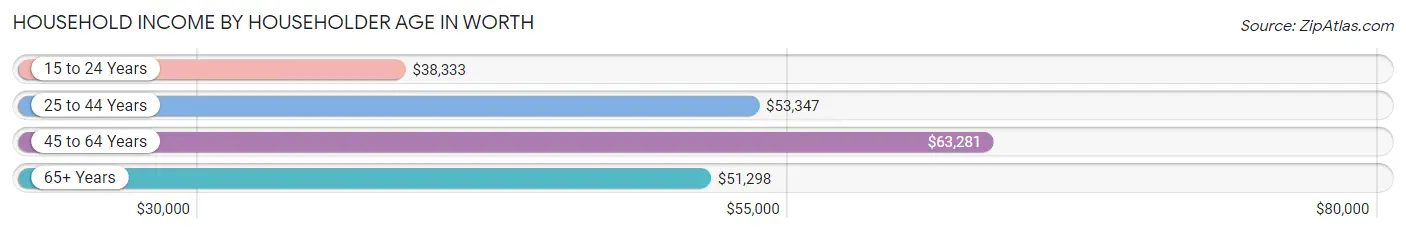
| Income Bracket | # Households | Median Income |
| 15 to 24 Years | 180 (4.1%) | $38,333 |
| 25 to 44 Years | 1,532 (35.1%) | $53,347 |
| 45 to 64 Years | 1,692 (38.8%) | $63,281 |
| 65+ Years | 959 (22.0%) | $51,298 |
| Total | 4,363 (100.0%) | $54,893 |
Poverty in Worth
Income Below Poverty by Sex and Age in Worth
With 19.1% poverty level for males and 15.9% for females among the residents of Worth, 6 to 11 year old males and 15 year old females are the most vulnerable to poverty, with 322 males (65.0%) and 13 females (59.1%) in their respective age groups living below the poverty level.
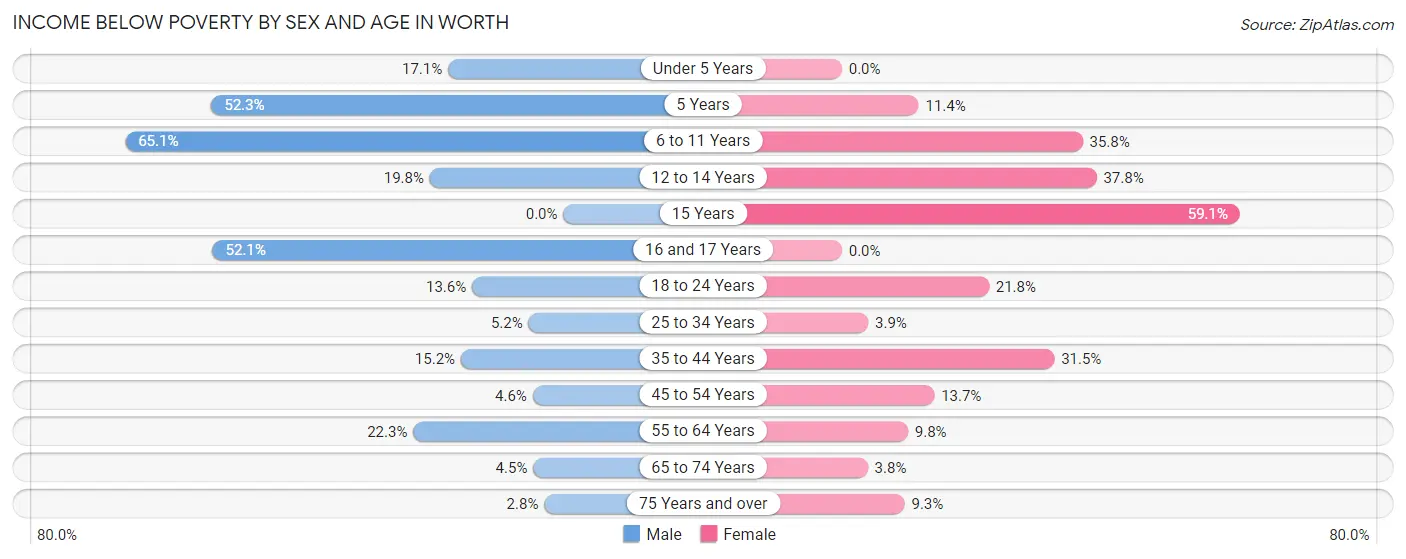
| Age Bracket | Male | Female |
| Under 5 Years | 38 (17.1%) | 0 (0.0%) |
| 5 Years | 23 (52.3%) | 13 (11.4%) |
| 6 to 11 Years | 322 (65.0%) | 133 (35.7%) |
| 12 to 14 Years | 23 (19.8%) | 90 (37.8%) |
| 15 Years | 0 (0.0%) | 13 (59.1%) |
| 16 and 17 Years | 163 (52.1%) | 0 (0.0%) |
| 18 to 24 Years | 72 (13.6%) | 98 (21.8%) |
| 25 to 34 Years | 36 (5.2%) | 25 (3.9%) |
| 35 to 44 Years | 122 (15.2%) | 276 (31.5%) |
| 45 to 54 Years | 26 (4.5%) | 86 (13.7%) |
| 55 to 64 Years | 185 (22.3%) | 71 (9.8%) |
| 65 to 74 Years | 21 (4.5%) | 19 (3.8%) |
| 75 Years and over | 8 (2.8%) | 41 (9.3%) |
| Total | 1,039 (19.1%) | 865 (15.9%) |
Income Above Poverty by Sex and Age in Worth
According to the poverty statistics in Worth, males aged 15 years and females aged under 5 years are the age groups that are most secure financially, with 100.0% of males and 100.0% of females in these age groups living above the poverty line.
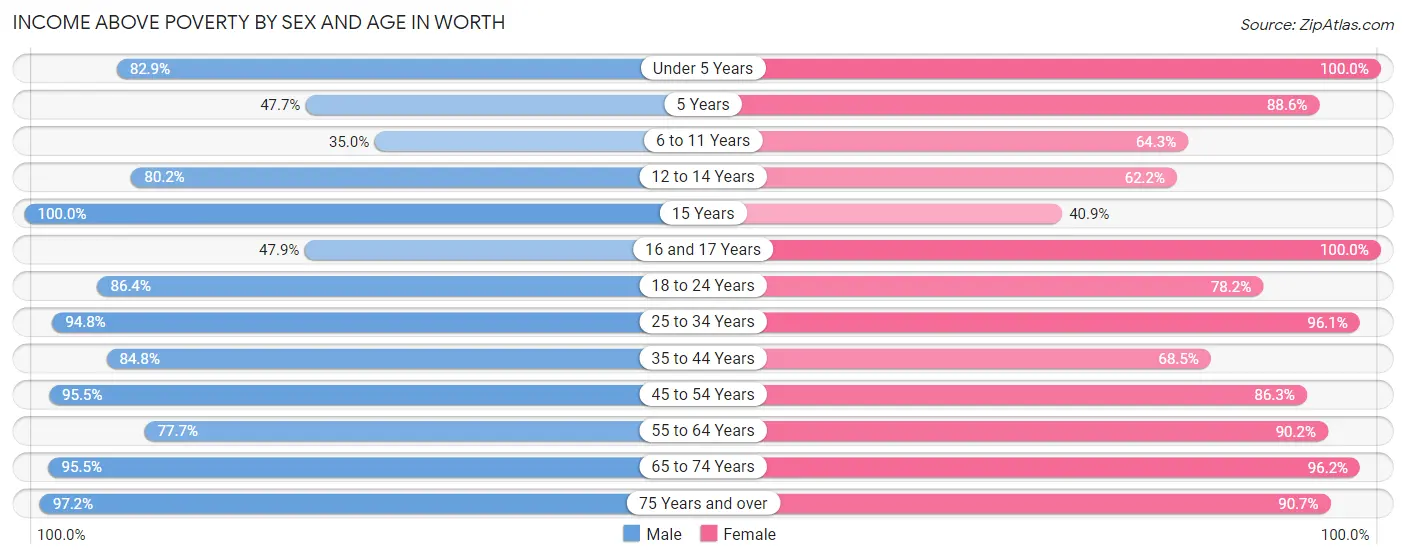
| Age Bracket | Male | Female |
| Under 5 Years | 184 (82.9%) | 297 (100.0%) |
| 5 Years | 21 (47.7%) | 101 (88.6%) |
| 6 to 11 Years | 173 (34.9%) | 239 (64.2%) |
| 12 to 14 Years | 93 (80.2%) | 148 (62.2%) |
| 15 Years | 60 (100.0%) | 9 (40.9%) |
| 16 and 17 Years | 150 (47.9%) | 135 (100.0%) |
| 18 to 24 Years | 459 (86.4%) | 351 (78.2%) |
| 25 to 34 Years | 660 (94.8%) | 614 (96.1%) |
| 35 to 44 Years | 680 (84.8%) | 599 (68.5%) |
| 45 to 54 Years | 545 (95.5%) | 541 (86.3%) |
| 55 to 64 Years | 645 (77.7%) | 653 (90.2%) |
| 65 to 74 Years | 449 (95.5%) | 476 (96.2%) |
| 75 Years and over | 274 (97.2%) | 399 (90.7%) |
| Total | 4,393 (80.9%) | 4,562 (84.1%) |
Income Below Poverty Among Married-Couple Families in Worth
The poverty statistics for married-couple families in Worth show that 8.2% or 168 of the total 2,050 families live below the poverty line. Families with 3 or 4 children have the highest poverty rate of 37.9%, comprising of 66 families. On the other hand, families with no children have the lowest poverty rate of 1.6%, which includes 19 families.
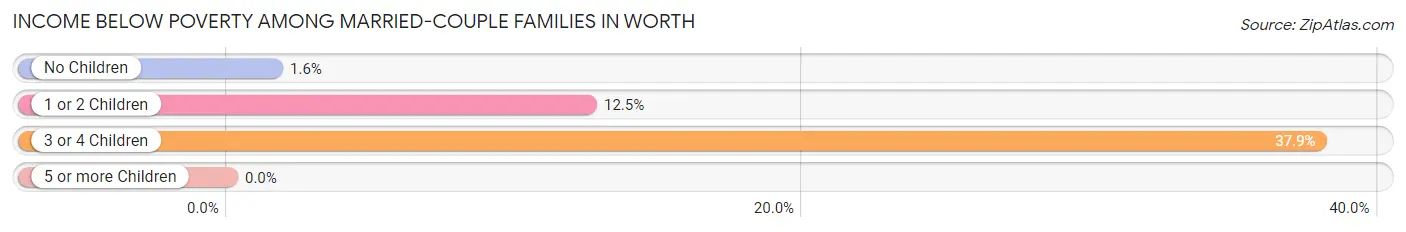
| Children | Above Poverty | Below Poverty |
| No Children | 1,193 (98.4%) | 19 (1.6%) |
| 1 or 2 Children | 581 (87.5%) | 83 (12.5%) |
| 3 or 4 Children | 108 (62.1%) | 66 (37.9%) |
| 5 or more Children | 0 (0.0%) | 0 (0.0%) |
| Total | 1,882 (91.8%) | 168 (8.2%) |
Income Below Poverty Among Single-Parent Households in Worth
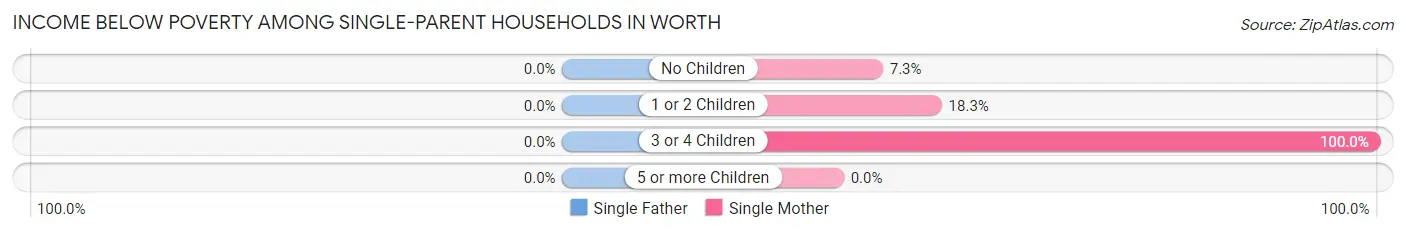
| Children | Single Father | Single Mother |
| No Children | 0 (0.0%) | 18 (7.3%) |
| 1 or 2 Children | 0 (0.0%) | 50 (18.2%) |
| 3 or 4 Children | 0 (0.0%) | 116 (100.0%) |
| 5 or more Children | 0 (0.0%) | 0 (0.0%) |
| Total | 0 (0.0%) | 184 (28.9%) |
Income Below Poverty Among Married-Couple vs Single-Parent Households in Worth
The poverty data for Worth shows that 168 of the married-couple family households (8.2%) and 184 of the single-parent households (23.1%) are living below the poverty level. Within the married-couple family households, those with 3 or 4 children have the highest poverty rate, with 66 households (37.9%) falling below the poverty line. Among the single-parent households, those with 3 or 4 children have the highest poverty rate, with 116 household (92.1%) living below poverty.
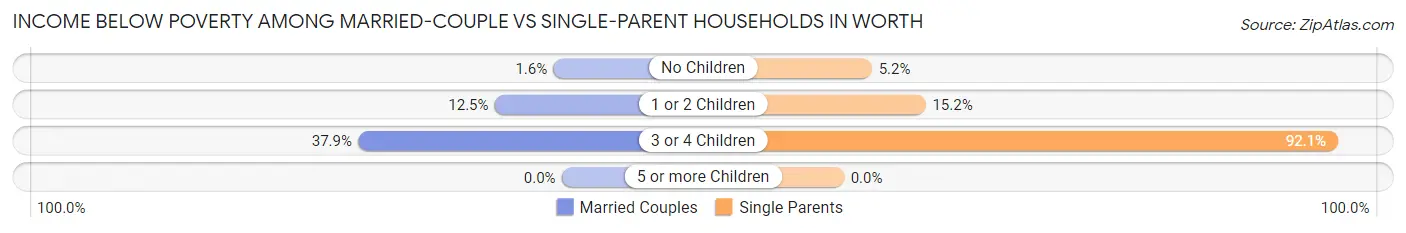
| Children | Married-Couple Families | Single-Parent Households |
| No Children | 19 (1.6%) | 18 (5.2%) |
| 1 or 2 Children | 83 (12.5%) | 50 (15.2%) |
| 3 or 4 Children | 66 (37.9%) | 116 (92.1%) |
| 5 or more Children | 0 (0.0%) | 0 (0.0%) |
| Total | 168 (8.2%) | 184 (23.1%) |
Race in Worth
The most populous races in Worth are White / Caucasian (8,460 | 77.9%), Hispanic or Latino (1,948 | 17.9%), and Some other Race (1,282 | 11.8%).
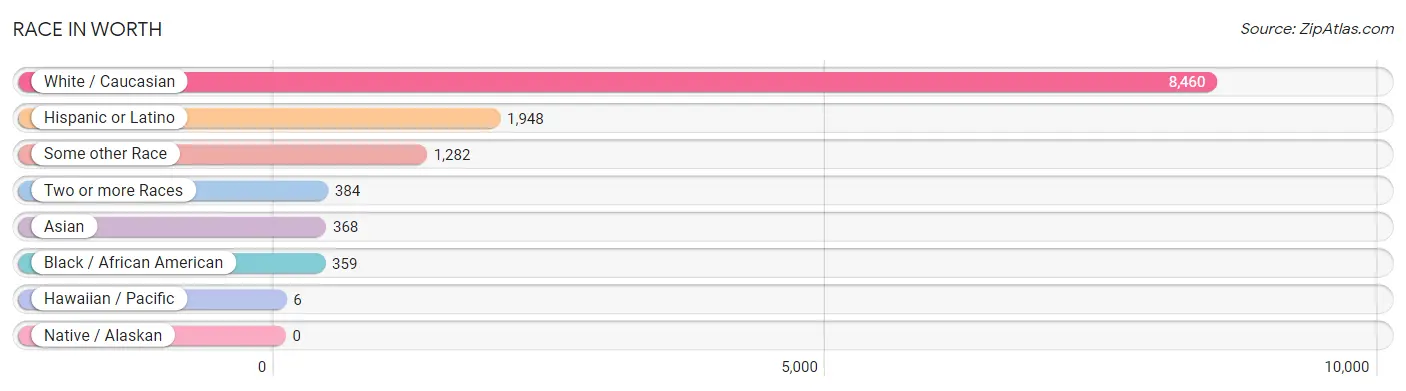
| Race | # Population | % Population |
| Asian | 368 | 3.4% |
| Black / African American | 359 | 3.3% |
| Hawaiian / Pacific | 6 | 0.1% |
| Hispanic or Latino | 1,948 | 17.9% |
| Native / Alaskan | 0 | 0.0% |
| White / Caucasian | 8,460 | 77.9% |
| Two or more Races | 384 | 3.5% |
| Some other Race | 1,282 | 11.8% |
| Total | 10,859 | 100.0% |
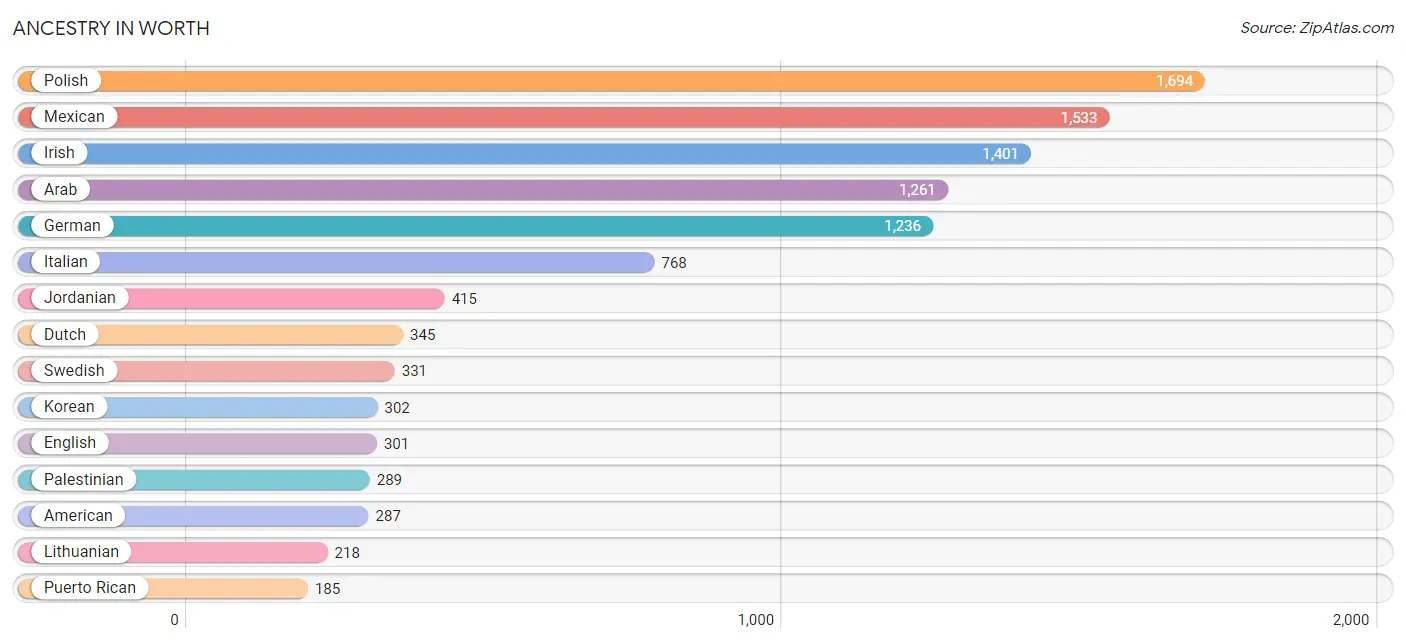
Ancestry in Worth
The most populous ancestries reported in Worth are Polish (1,694 | 15.6%), Mexican (1,533 | 14.1%), Irish (1,401 | 12.9%), Arab (1,261 | 11.6%), and German (1,236 | 11.4%), together accounting for 65.6% of all Worth residents.
| Ancestry | # Population | % Population |
| Albanian | 32 | 0.3% |
| American | 287 | 2.6% |
| Arab | 1,261 | 11.6% |
| Austrian | 151 | 1.4% |
| British | 20 | 0.2% |
| Bulgarian | 9 | 0.1% |
| Burmese | 1 | 0.0% |
| Central American | 37 | 0.3% |
| Cherokee | 8 | 0.1% |
| Croatian | 72 | 0.7% |
| Cuban | 41 | 0.4% |
| Czech | 134 | 1.2% |
| Czechoslovakian | 9 | 0.1% |
| Dutch | 345 | 3.2% |
| Eastern European | 27 | 0.3% |
| English | 301 | 2.8% |
| European | 90 | 0.8% |
| French | 153 | 1.4% |
| German | 1,236 | 11.4% |
| Ghanaian | 53 | 0.5% |
| Greek | 161 | 1.5% |
| Guatemalan | 31 | 0.3% |
| Haitian | 19 | 0.2% |
| Hungarian | 16 | 0.2% |
| Irish | 1,401 | 12.9% |
| Italian | 768 | 7.1% |
| Jamaican | 19 | 0.2% |
| Jordanian | 415 | 3.8% |
| Korean | 302 | 2.8% |
| Lithuanian | 218 | 2.0% |
| Luxembourger | 9 | 0.1% |
| Macedonian | 7 | 0.1% |
| Mexican | 1,533 | 14.1% |
| Norwegian | 30 | 0.3% |
| Palestinian | 289 | 2.7% |
| Peruvian | 25 | 0.2% |
| Polish | 1,694 | 15.6% |
| Puerto Rican | 185 | 1.7% |
| Russian | 20 | 0.2% |
| Salvadoran | 6 | 0.1% |
| Samoan | 6 | 0.1% |
| Scandinavian | 141 | 1.3% |
| Scotch-Irish | 8 | 0.1% |
| Scottish | 48 | 0.4% |
| Sioux | 6 | 0.1% |
| Slovak | 113 | 1.0% |
| South American | 85 | 0.8% |
| Spaniard | 67 | 0.6% |
| Subsaharan African | 53 | 0.5% |
| Swedish | 331 | 3.0% |
| Swiss | 18 | 0.2% |
| Thai | 108 | 1.0% |
| Venezuelan | 60 | 0.5% | View All 53 Rows |
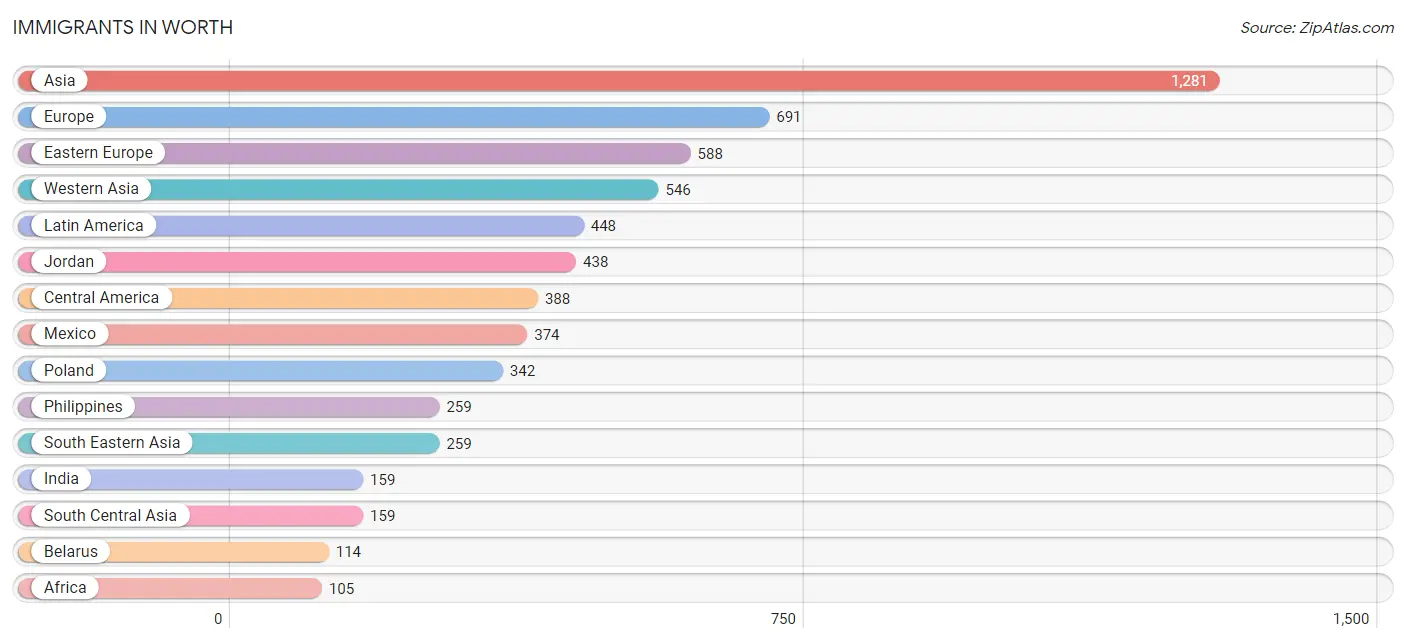
Immigrants in Worth
The most numerous immigrant groups reported in Worth came from Asia (1,281 | 11.8%), Europe (691 | 6.4%), Eastern Europe (588 | 5.4%), Western Asia (546 | 5.0%), and Latin America (448 | 4.1%), together accounting for 32.7% of all Worth residents.
| Immigration Origin | # Population | % Population |
| Africa | 105 | 1.0% |
| Asia | 1,281 | 11.8% |
| Belarus | 114 | 1.1% |
| Bulgaria | 9 | 0.1% |
| Central America | 388 | 3.6% |
| Croatia | 29 | 0.3% |
| Czechoslovakia | 69 | 0.6% |
| Eastern Asia | 21 | 0.2% |
| Eastern Europe | 588 | 5.4% |
| Europe | 691 | 6.4% |
| Ghana | 35 | 0.3% |
| Greece | 38 | 0.4% |
| India | 159 | 1.5% |
| Ireland | 14 | 0.1% |
| Israel | 34 | 0.3% |
| Italy | 51 | 0.5% |
| Japan | 21 | 0.2% |
| Jordan | 438 | 4.0% |
| Latin America | 448 | 4.1% |
| Lithuania | 20 | 0.2% |
| Mexico | 374 | 3.4% |
| Nigeria | 70 | 0.6% |
| Northern Europe | 14 | 0.1% |
| Panama | 14 | 0.1% |
| Philippines | 259 | 2.4% |
| Poland | 342 | 3.2% |
| South America | 60 | 0.5% |
| South Central Asia | 159 | 1.5% |
| South Eastern Asia | 259 | 2.4% |
| Southern Europe | 89 | 0.8% |
| Syria | 22 | 0.2% |
| Venezuela | 60 | 0.5% |
| Western Africa | 105 | 1.0% |
| Western Asia | 546 | 5.0% |
| Yemen | 52 | 0.5% | View All 35 Rows |
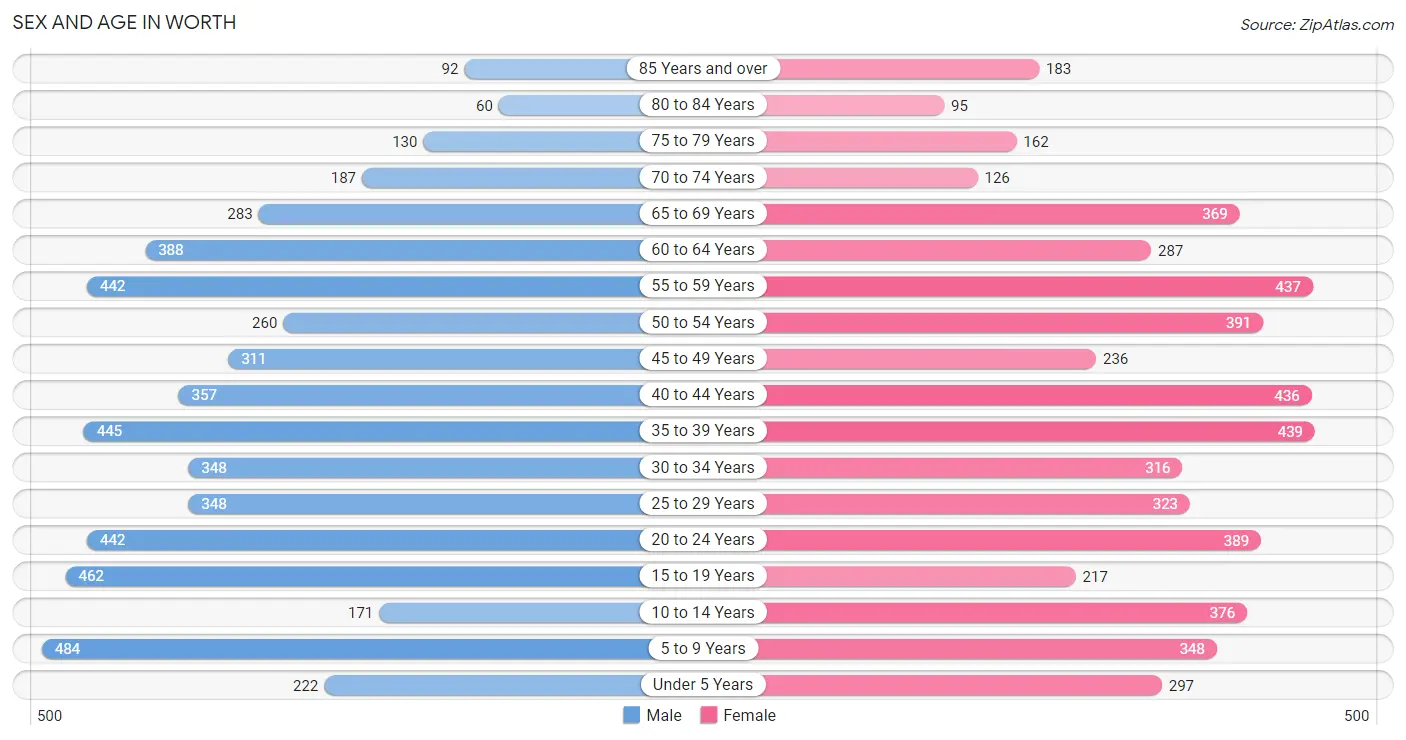
Sex and Age in Worth
Sex and Age in Worth
The most populous age groups in Worth are 5 to 9 Years (484 | 8.9%) for men and 35 to 39 Years (439 | 8.1%) for women.
| Age Bracket | Male | Female |
| Under 5 Years | 222 (4.1%) | 297 (5.5%) |
| 5 to 9 Years | 484 (8.9%) | 348 (6.4%) |
| 10 to 14 Years | 171 (3.2%) | 376 (6.9%) |
| 15 to 19 Years | 462 (8.5%) | 217 (4.0%) |
| 20 to 24 Years | 442 (8.1%) | 389 (7.2%) |
| 25 to 29 Years | 348 (6.4%) | 323 (5.9%) |
| 30 to 34 Years | 348 (6.4%) | 316 (5.8%) |
| 35 to 39 Years | 445 (8.2%) | 439 (8.1%) |
| 40 to 44 Years | 357 (6.6%) | 436 (8.0%) |
| 45 to 49 Years | 311 (5.7%) | 236 (4.3%) |
| 50 to 54 Years | 260 (4.8%) | 391 (7.2%) |
| 55 to 59 Years | 442 (8.1%) | 437 (8.1%) |
| 60 to 64 Years | 388 (7.1%) | 287 (5.3%) |
| 65 to 69 Years | 283 (5.2%) | 369 (6.8%) |
| 70 to 74 Years | 187 (3.4%) | 126 (2.3%) |
| 75 to 79 Years | 130 (2.4%) | 162 (3.0%) |
| 80 to 84 Years | 60 (1.1%) | 95 (1.8%) |
| 85 Years and over | 92 (1.7%) | 183 (3.4%) |
| Total | 5,432 (100.0%) | 5,427 (100.0%) |
Families and Households in Worth
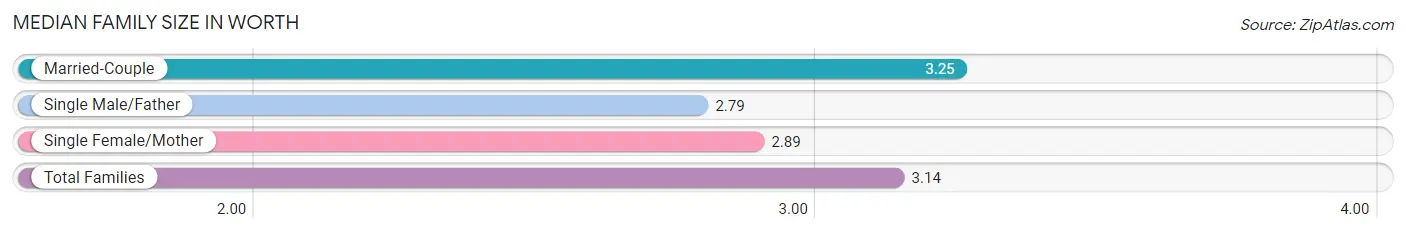
Median Family Size in Worth
The median family size in Worth is 3.14 persons per family, with married-couple families (2,050 | 72.0%) accounting for the largest median family size of 3.25 persons per family. On the other hand, single male/father families (161 | 5.7%) represent the smallest median family size with 2.79 persons per family.
| Family Type | # Families | Family Size |
| Married-Couple | 2,050 (72.0%) | 3.25 |
| Single Male/Father | 161 (5.7%) | 2.79 |
| Single Female/Mother | 637 (22.4%) | 2.89 |
| Total Families | 2,848 (100.0%) | 3.14 |
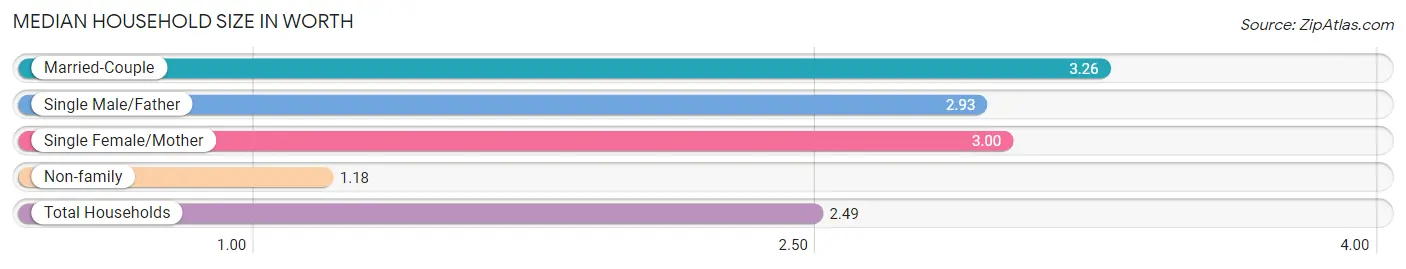
Median Household Size in Worth
The median household size in Worth is 2.49 persons per household, with married-couple households (2,050 | 47.0%) accounting for the largest median household size of 3.26 persons per household. non-family households (1,515 | 34.7%) represent the smallest median household size with 1.18 persons per household.
| Household Type | # Households | Household Size |
| Married-Couple | 2,050 (47.0%) | 3.26 |
| Single Male/Father | 161 (3.7%) | 2.93 |
| Single Female/Mother | 637 (14.6%) | 3.00 |
| Non-family | 1,515 (34.7%) | 1.18 |
| Total Households | 4,363 (100.0%) | 2.49 |
Household Size by Marriage Status in Worth
Out of a total of 4,363 households in Worth, 2,848 (65.3%) are family households, while 1,515 (34.7%) are nonfamily households. The most numerous type of family households are 2-person households, comprising 1,194, and the most common type of nonfamily households are 1-person households, comprising 1,243.
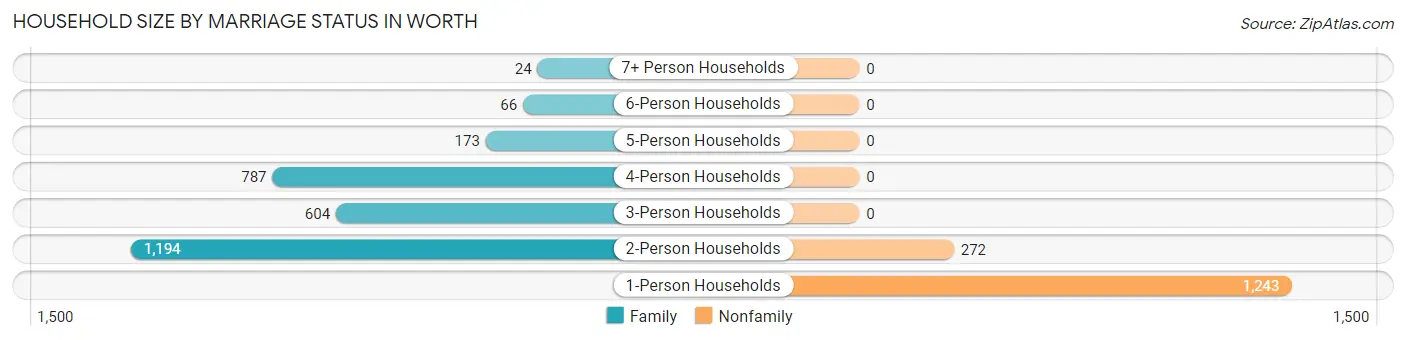
| Household Size | Family Households | Nonfamily Households |
| 1-Person Households | - | 1,243 (28.5%) |
| 2-Person Households | 1,194 (27.4%) | 272 (6.2%) |
| 3-Person Households | 604 (13.8%) | 0 (0.0%) |
| 4-Person Households | 787 (18.0%) | 0 (0.0%) |
| 5-Person Households | 173 (4.0%) | 0 (0.0%) |
| 6-Person Households | 66 (1.5%) | 0 (0.0%) |
| 7+ Person Households | 24 (0.5%) | 0 (0.0%) |
| Total | 2,848 (65.3%) | 1,515 (34.7%) |
Female Fertility in Worth
Fertility by Age in Worth
Average fertility rate in Worth is 72.0 births per 1,000 women. Women in the age bracket of 20 to 34 years have the highest fertility rate with 89.0 births per 1,000 women. Women in the age bracket of 20 to 34 years acount for 51.4% of all women with births.
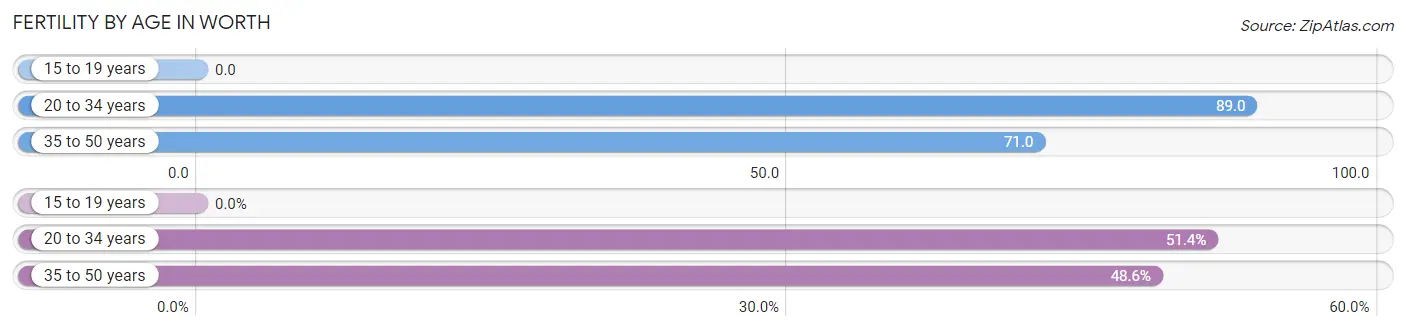
| Age Bracket | Women with Births | Births / 1,000 Women |
| 15 to 19 years | 0 (0.0%) | 0.0 |
| 20 to 34 years | 91 (51.4%) | 89.0 |
| 35 to 50 years | 86 (48.6%) | 71.0 |
| Total | 177 (100.0%) | 72.0 |
Fertility by Age by Marriage Status in Worth
81.9% of women with births (177) in Worth are married. The highest percentage of unmarried women with births falls into 35 to 50 years age bracket with 37.2% of them unmarried at the time of birth, while the lowest percentage of unmarried women with births belong to 20 to 34 years age bracket with 0.0% of them unmarried.
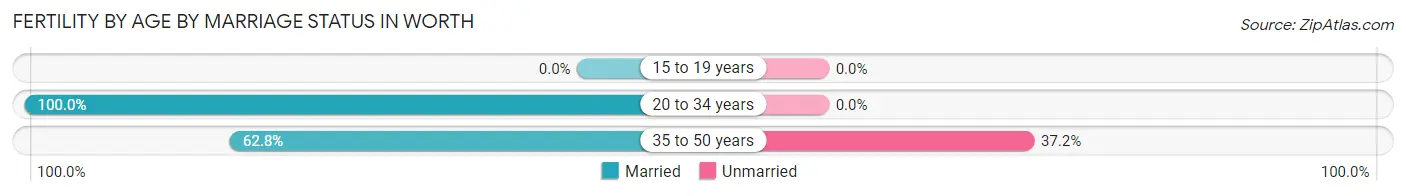
| Age Bracket | Married | Unmarried |
| 15 to 19 years | 0 (0.0%) | 0 (0.0%) |
| 20 to 34 years | 91 (100.0%) | 0 (0.0%) |
| 35 to 50 years | 54 (62.8%) | 32 (37.2%) |
| Total | 145 (81.9%) | 32 (18.1%) |
Fertility by Education in Worth
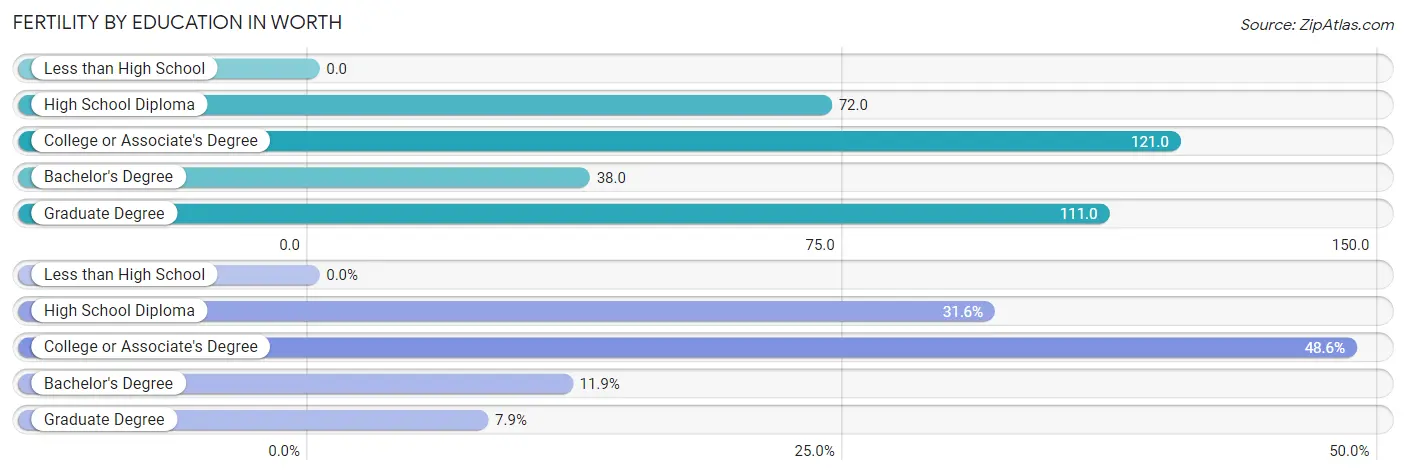
| Educational Attainment | Women with Births | Births / 1,000 Women |
| Less than High School | 0 (0.0%) | 0.0 |
| High School Diploma | 56 (31.6%) | 72.0 |
| College or Associate's Degree | 86 (48.6%) | 121.0 |
| Bachelor's Degree | 21 (11.9%) | 38.0 |
| Graduate Degree | 14 (7.9%) | 111.0 |
| Total | 177 (100.0%) | 72.0 |
Fertility by Education by Marriage Status in Worth
18.1% of women with births in Worth are unmarried. Women with the educational attainment of college or associate's degree are most likely to be married with 100.0% of them married at childbirth, while women with the educational attainment of high school diploma are least likely to be married with 57.1% of them unmarried at childbirth.
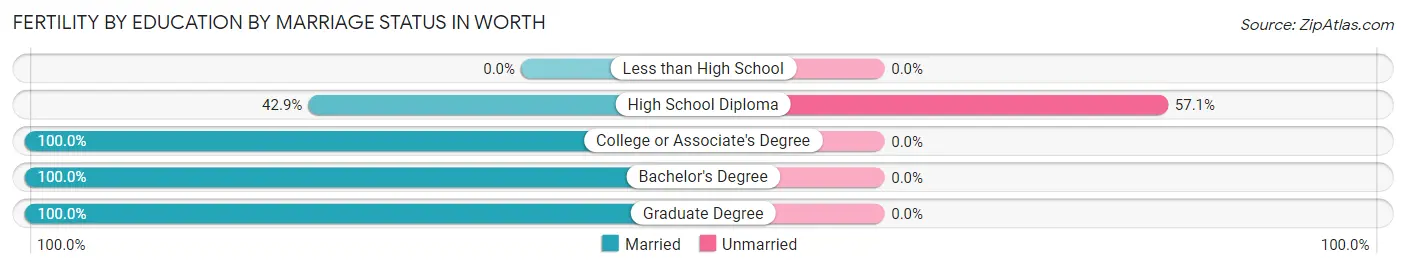
| Educational Attainment | Married | Unmarried |
| Less than High School | 0 (0.0%) | 0 (0.0%) |
| High School Diploma | 24 (42.9%) | 32 (57.1%) |
| College or Associate's Degree | 86 (100.0%) | 0 (0.0%) |
| Bachelor's Degree | 21 (100.0%) | 0 (0.0%) |
| Graduate Degree | 14 (100.0%) | 0 (0.0%) |
| Total | 145 (81.9%) | 32 (18.1%) |
Employment Characteristics in Worth
Employment by Class of Employer in Worth
Among the 4,853 employed individuals in Worth, private company employees (3,386 | 69.8%), local government employees (550 | 11.3%), and not-for-profit organizations (268 | 5.5%) make up the most common classes of employment.
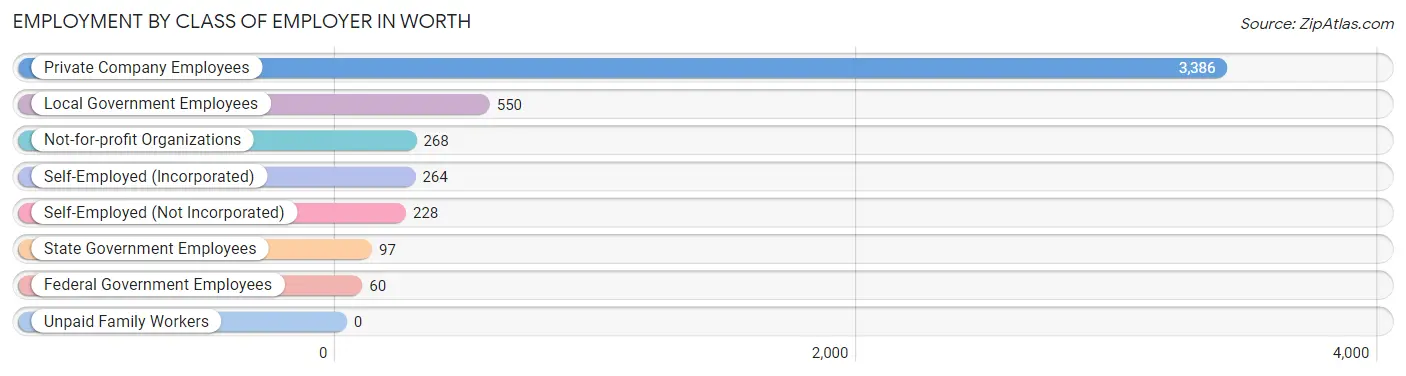
| Employer Class | # Employees | % Employees |
| Private Company Employees | 3,386 | 69.8% |
| Self-Employed (Incorporated) | 264 | 5.4% |
| Self-Employed (Not Incorporated) | 228 | 4.7% |
| Not-for-profit Organizations | 268 | 5.5% |
| Local Government Employees | 550 | 11.3% |
| State Government Employees | 97 | 2.0% |
| Federal Government Employees | 60 | 1.2% |
| Unpaid Family Workers | 0 | 0.0% |
| Total | 4,853 | 100.0% |
Employment Status by Age in Worth
According to the labor force statistics for Worth, out of the total population over 16 years of age (8,879), 64.5% or 5,727 individuals are in the labor force, with 10.8% or 619 of them unemployed. The age group with the highest labor force participation rate is 30 to 34 years, with 92.3% or 613 individuals in the labor force. Within the labor force, the 65 to 74 years age range has the highest percentage of unemployed individuals, with 25.4% or 122 of them being unemployed.
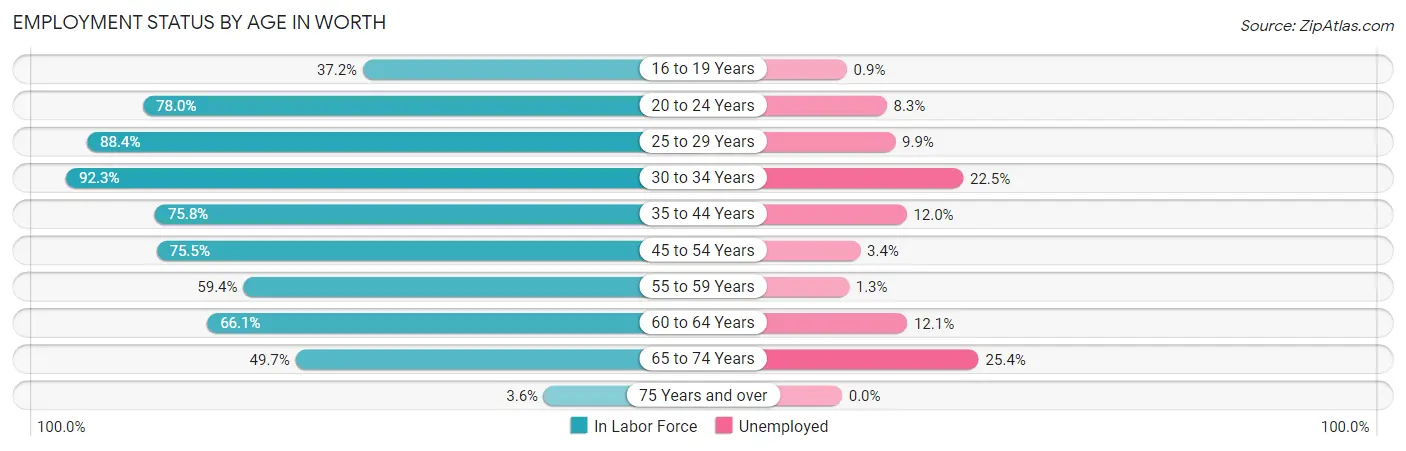
| Age Bracket | In Labor Force | Unemployed |
| 16 to 19 Years | 222 (37.2%) | 2 (0.9%) |
| 20 to 24 Years | 648 (78.0%) | 54 (8.3%) |
| 25 to 29 Years | 593 (88.4%) | 59 (9.9%) |
| 30 to 34 Years | 613 (92.3%) | 138 (22.5%) |
| 35 to 44 Years | 1,271 (75.8%) | 153 (12.0%) |
| 45 to 54 Years | 904 (75.5%) | 31 (3.4%) |
| 55 to 59 Years | 522 (59.4%) | 7 (1.3%) |
| 60 to 64 Years | 446 (66.1%) | 54 (12.1%) |
| 65 to 74 Years | 480 (49.7%) | 122 (25.4%) |
| 75 Years and over | 26 (3.6%) | 0 (0.0%) |
| Total | 5,727 (64.5%) | 619 (10.8%) |
Employment Status by Educational Attainment in Worth
According to labor force statistics for Worth, 75.5% of individuals (4,352) out of the total population between 25 and 64 years of age (5,764) are in the labor force, with 10.2% or 444 of them being unemployed. The group with the highest labor force participation rate are those with the educational attainment of bachelor's degree or higher, with 86.7% or 1,002 individuals in the labor force. Within the labor force, individuals with high school diploma education have the highest percentage of unemployment, with 12.8% or 207 of them being unemployed.
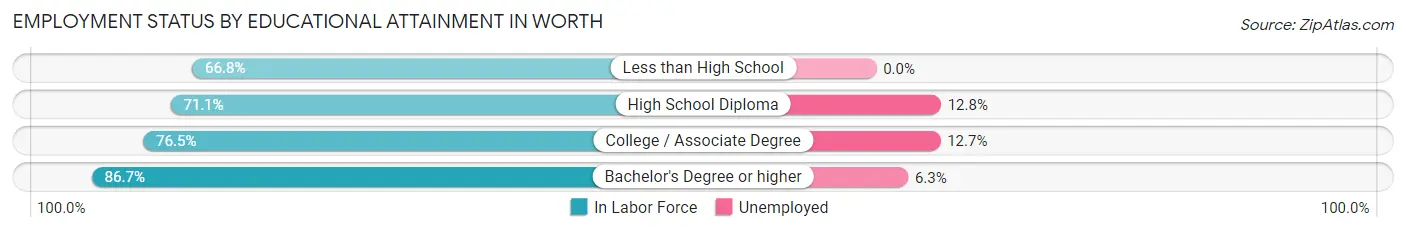
| Educational Attainment | In Labor Force | Unemployed |
| Less than High School | 379 (66.8%) | 0 (0.0%) |
| High School Diploma | 1,619 (71.1%) | 291 (12.8%) |
| College / Associate Degree | 1,349 (76.5%) | 224 (12.7%) |
| Bachelor's Degree or higher | 1,002 (86.7%) | 73 (6.3%) |
| Total | 4,352 (75.5%) | 588 (10.2%) |
Employment Occupations by Sex in Worth
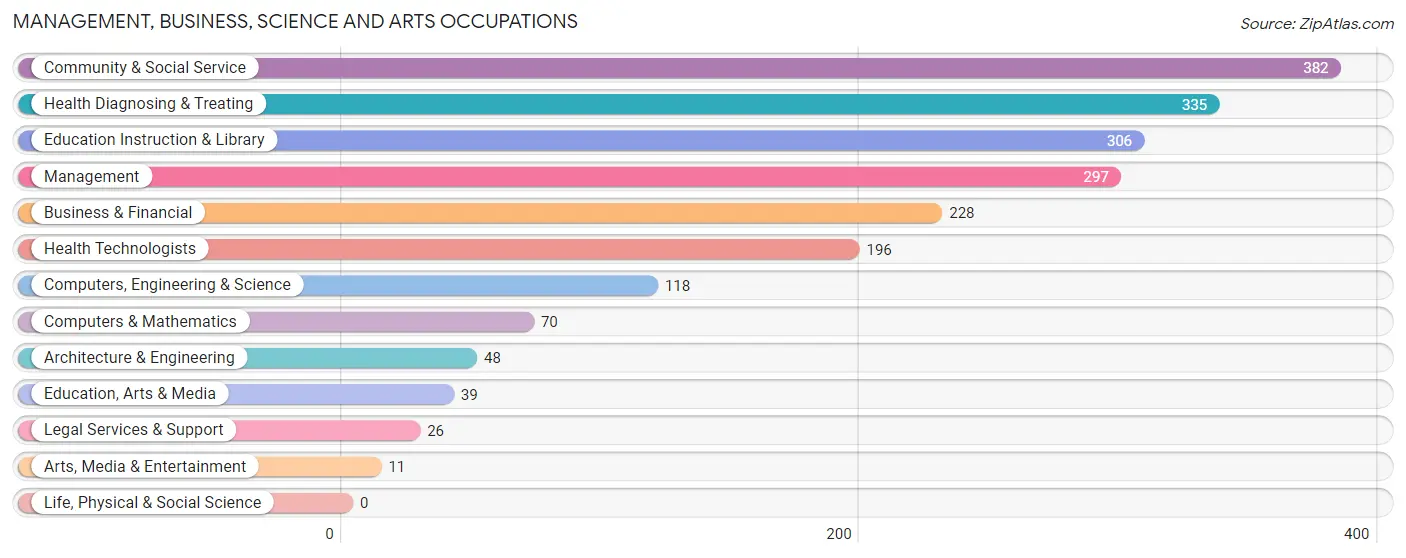
Management, Business, Science and Arts Occupations
The most common Management, Business, Science and Arts occupations in Worth are Community & Social Service (382 | 7.5%), Health Diagnosing & Treating (335 | 6.6%), Education Instruction & Library (306 | 6.0%), Management (297 | 5.8%), and Business & Financial (228 | 4.5%).
Management, Business, Science and Arts Occupations by Sex
Within the Management, Business, Science and Arts occupations in Worth, the most male-oriented occupations are Architecture & Engineering (79.2%), Health Technologists (70.4%), and Computers, Engineering & Science (67.8%), while the most female-oriented occupations are Education, Arts & Media (100.0%), Arts, Media & Entertainment (100.0%), and Education Instruction & Library (93.5%).
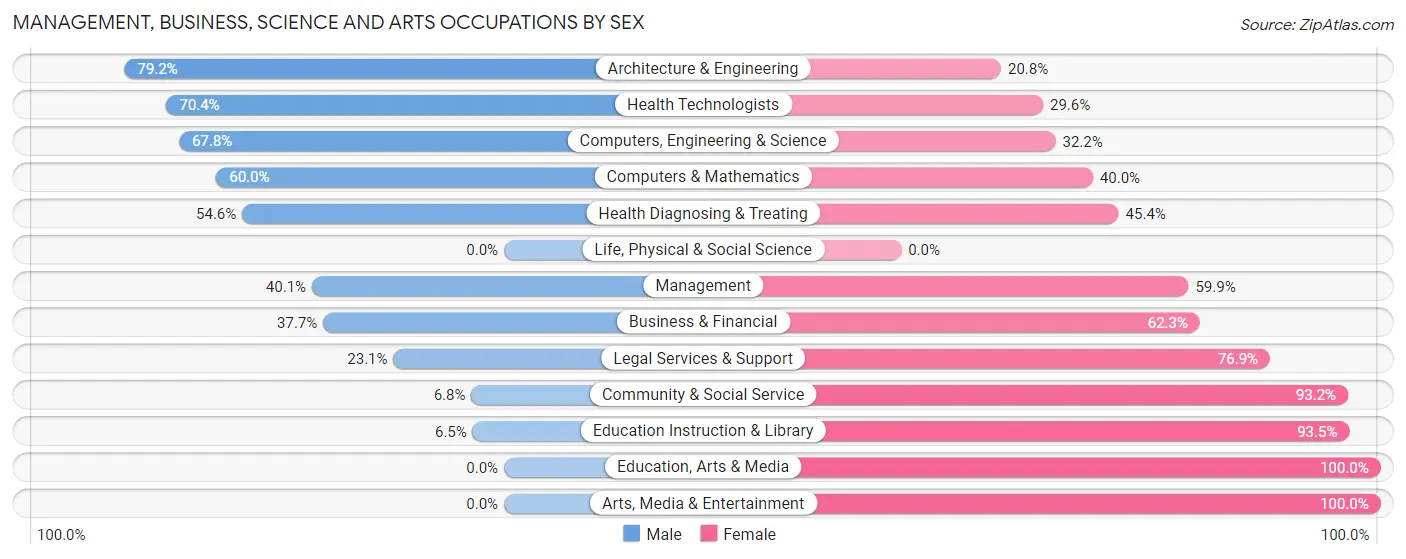
| Occupation | Male | Female |
| Management | 119 (40.1%) | 178 (59.9%) |
| Business & Financial | 86 (37.7%) | 142 (62.3%) |
| Computers, Engineering & Science | 80 (67.8%) | 38 (32.2%) |
| Computers & Mathematics | 42 (60.0%) | 28 (40.0%) |
| Architecture & Engineering | 38 (79.2%) | 10 (20.8%) |
| Life, Physical & Social Science | 0 (0.0%) | 0 (0.0%) |
| Community & Social Service | 26 (6.8%) | 356 (93.2%) |
| Education, Arts & Media | 0 (0.0%) | 39 (100.0%) |
| Legal Services & Support | 6 (23.1%) | 20 (76.9%) |
| Education Instruction & Library | 20 (6.5%) | 286 (93.5%) |
| Arts, Media & Entertainment | 0 (0.0%) | 11 (100.0%) |
| Health Diagnosing & Treating | 183 (54.6%) | 152 (45.4%) |
| Health Technologists | 138 (70.4%) | 58 (29.6%) |
| Total (Category) | 494 (36.3%) | 866 (63.7%) |
| Total (Overall) | 2,772 (54.3%) | 2,334 (45.7%) |
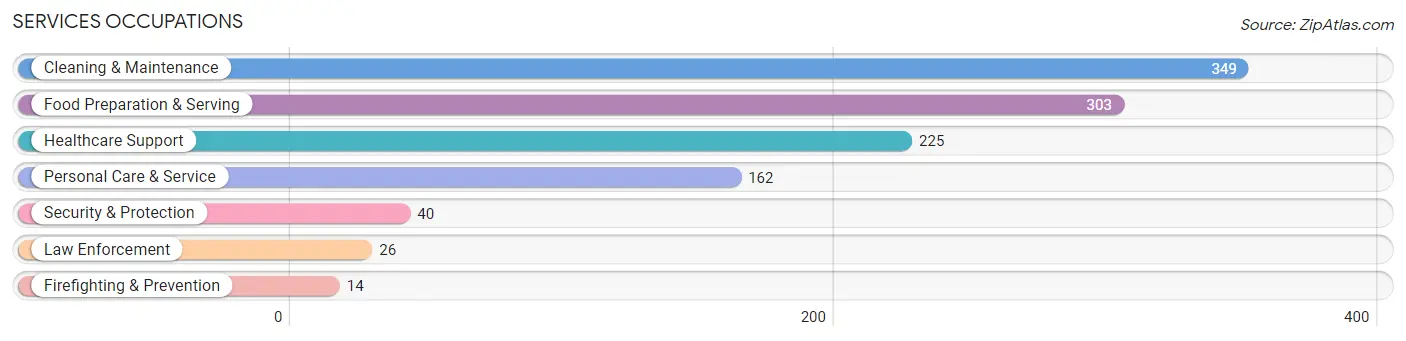
Services Occupations
The most common Services occupations in Worth are Cleaning & Maintenance (349 | 6.8%), Food Preparation & Serving (303 | 5.9%), Healthcare Support (225 | 4.4%), Personal Care & Service (162 | 3.2%), and Security & Protection (40 | 0.8%).
Services Occupations by Sex
Within the Services occupations in Worth, the most male-oriented occupations are Food Preparation & Serving (85.5%), Law Enforcement (46.2%), and Security & Protection (42.5%), while the most female-oriented occupations are Healthcare Support (100.0%), Personal Care & Service (66.7%), and Cleaning & Maintenance (65.3%).
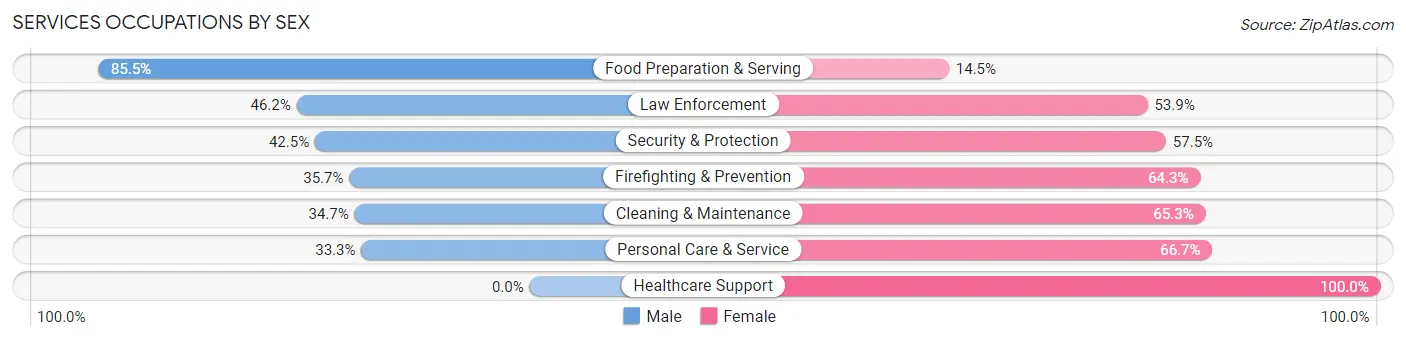
| Occupation | Male | Female |
| Healthcare Support | 0 (0.0%) | 225 (100.0%) |
| Security & Protection | 17 (42.5%) | 23 (57.5%) |
| Firefighting & Prevention | 5 (35.7%) | 9 (64.3%) |
| Law Enforcement | 12 (46.2%) | 14 (53.8%) |
| Food Preparation & Serving | 259 (85.5%) | 44 (14.5%) |
| Cleaning & Maintenance | 121 (34.7%) | 228 (65.3%) |
| Personal Care & Service | 54 (33.3%) | 108 (66.7%) |
| Total (Category) | 451 (41.8%) | 628 (58.2%) |
| Total (Overall) | 2,772 (54.3%) | 2,334 (45.7%) |
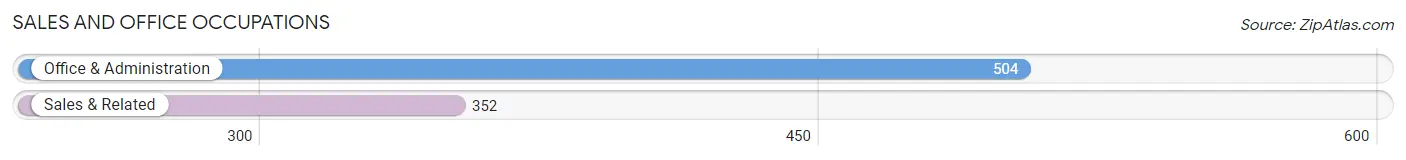
Sales and Office Occupations
The most common Sales and Office occupations in Worth are Office & Administration (504 | 9.9%), and Sales & Related (352 | 6.9%).
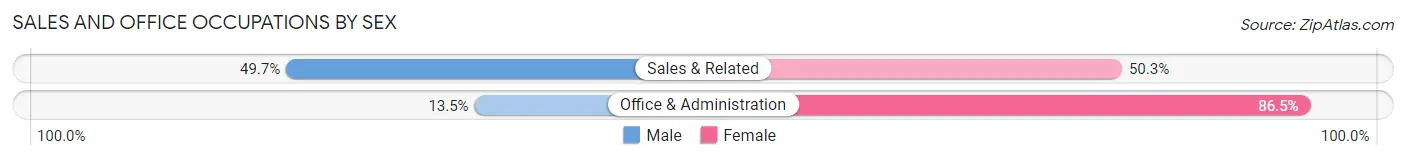
Sales and Office Occupations by Sex
| Occupation | Male | Female |
| Sales & Related | 175 (49.7%) | 177 (50.3%) |
| Office & Administration | 68 (13.5%) | 436 (86.5%) |
| Total (Category) | 243 (28.4%) | 613 (71.6%) |
| Total (Overall) | 2,772 (54.3%) | 2,334 (45.7%) |
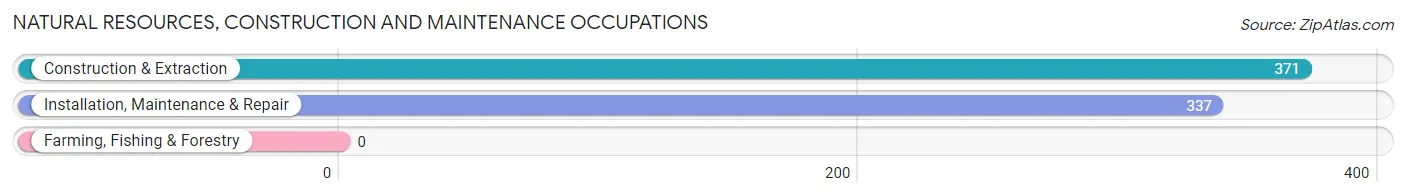
Natural Resources, Construction and Maintenance Occupations
The most common Natural Resources, Construction and Maintenance occupations in Worth are Construction & Extraction (371 | 7.3%), and Installation, Maintenance & Repair (337 | 6.6%).
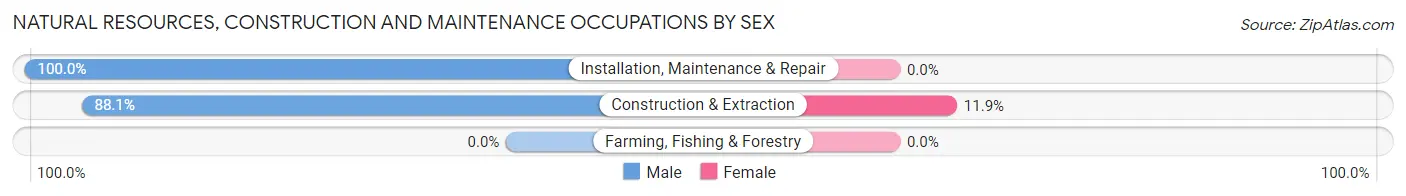
Natural Resources, Construction and Maintenance Occupations by Sex
| Occupation | Male | Female |
| Farming, Fishing & Forestry | 0 (0.0%) | 0 (0.0%) |
| Construction & Extraction | 327 (88.1%) | 44 (11.9%) |
| Installation, Maintenance & Repair | 337 (100.0%) | 0 (0.0%) |
| Total (Category) | 664 (93.8%) | 44 (6.2%) |
| Total (Overall) | 2,772 (54.3%) | 2,334 (45.7%) |
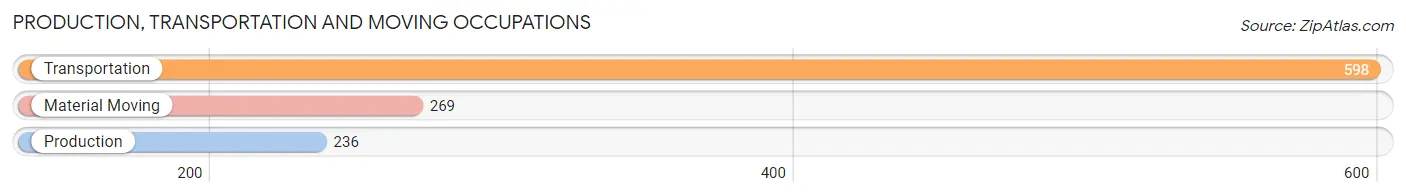
Production, Transportation and Moving Occupations
The most common Production, Transportation and Moving occupations in Worth are Transportation (598 | 11.7%), Material Moving (269 | 5.3%), and Production (236 | 4.6%).
Production, Transportation and Moving Occupations by Sex
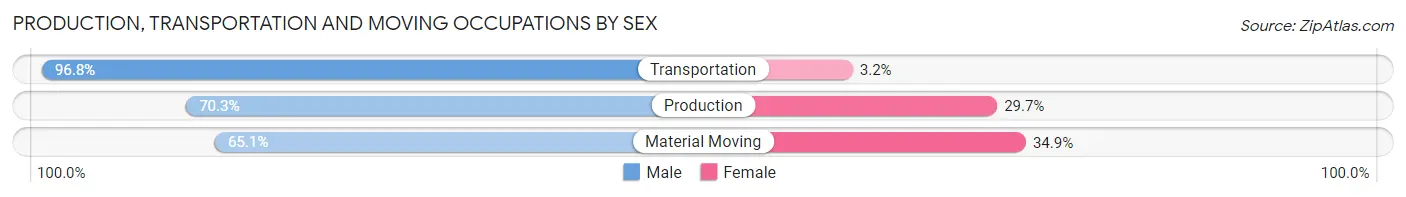
| Occupation | Male | Female |
| Production | 166 (70.3%) | 70 (29.7%) |
| Transportation | 579 (96.8%) | 19 (3.2%) |
| Material Moving | 175 (65.1%) | 94 (34.9%) |
| Total (Category) | 920 (83.4%) | 183 (16.6%) |
| Total (Overall) | 2,772 (54.3%) | 2,334 (45.7%) |
Employment Industries by Sex in Worth
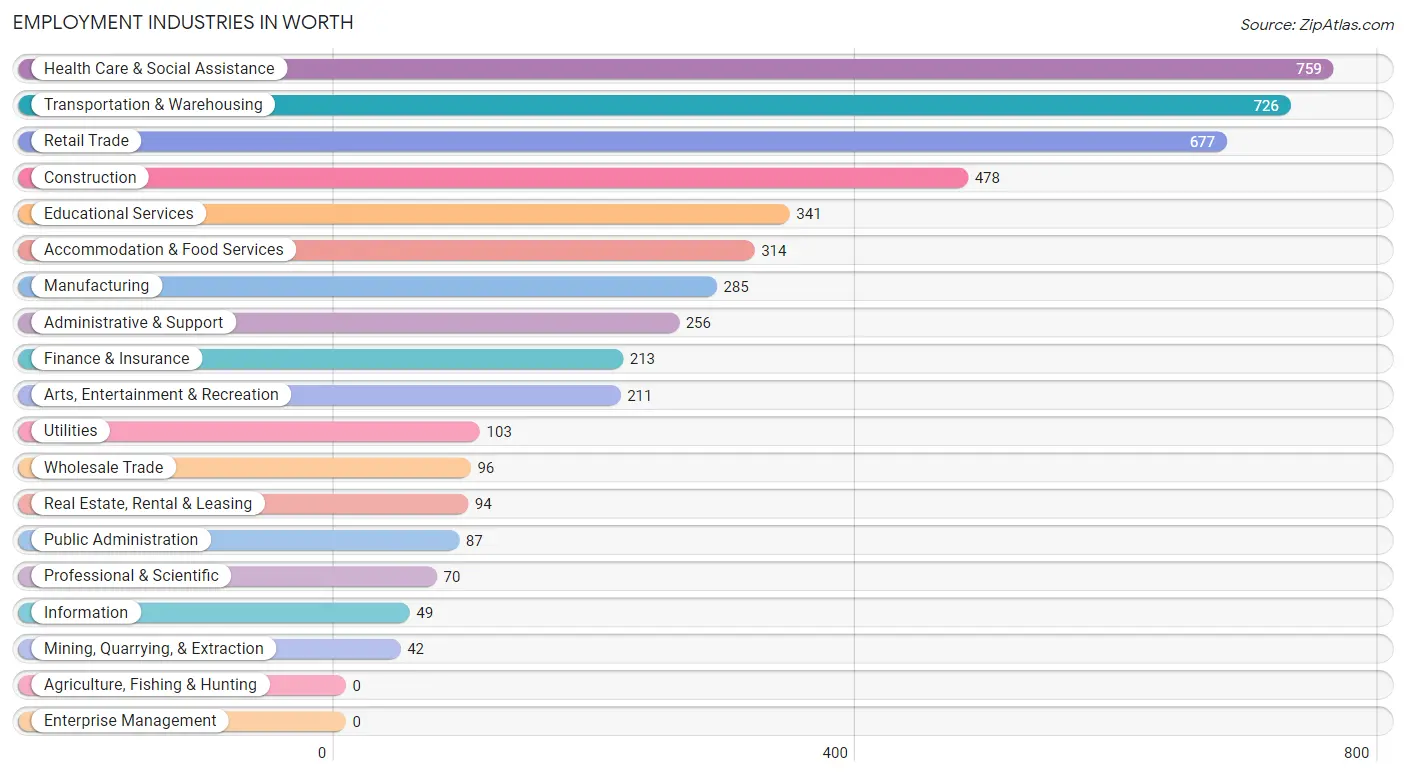
Employment Industries in Worth
The major employment industries in Worth include Health Care & Social Assistance (759 | 14.9%), Transportation & Warehousing (726 | 14.2%), Retail Trade (677 | 13.3%), Construction (478 | 9.4%), and Educational Services (341 | 6.7%).
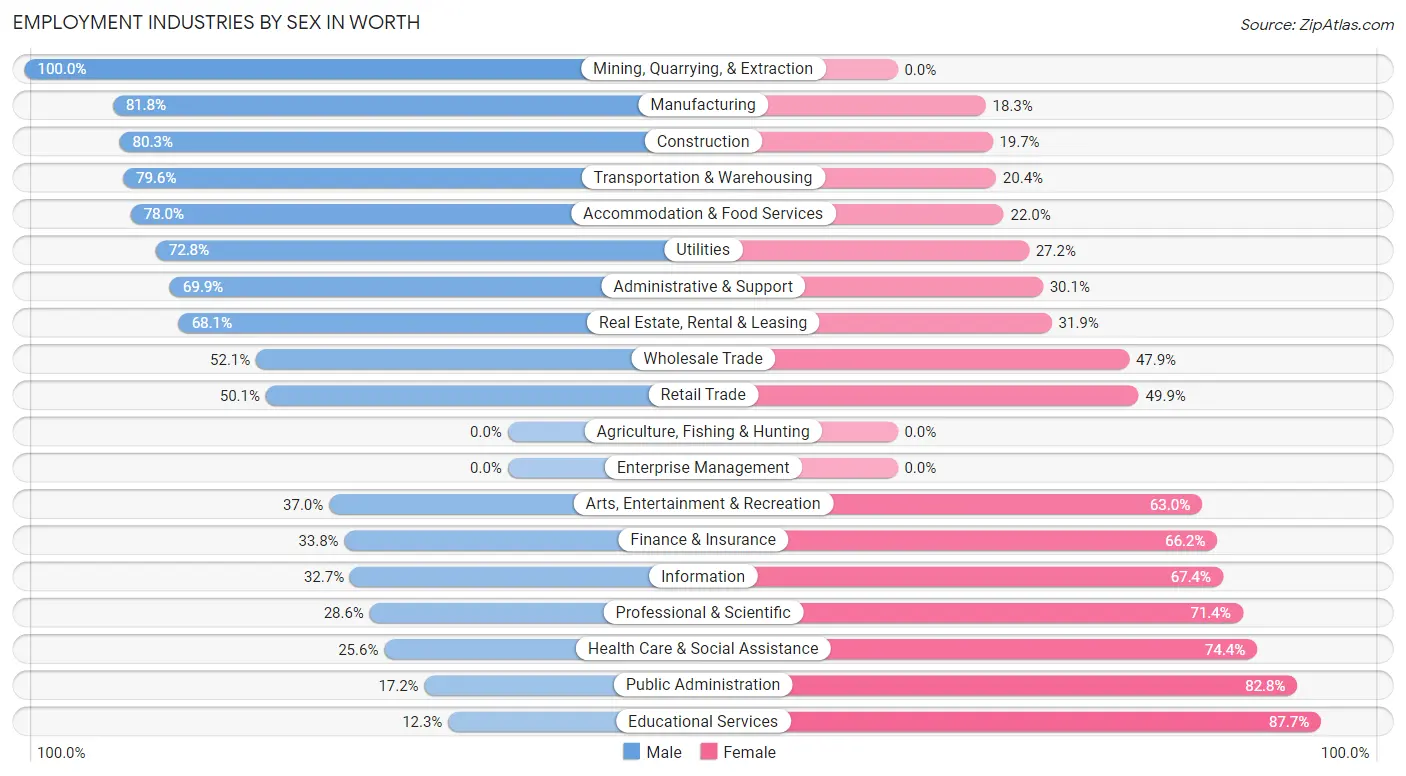
Employment Industries by Sex in Worth
The Worth industries that see more men than women are Mining, Quarrying, & Extraction (100.0%), Manufacturing (81.8%), and Construction (80.3%), whereas the industries that tend to have a higher number of women are Educational Services (87.7%), Public Administration (82.8%), and Health Care & Social Assistance (74.4%).
| Industry | Male | Female |
| Agriculture, Fishing & Hunting | 0 (0.0%) | 0 (0.0%) |
| Mining, Quarrying, & Extraction | 42 (100.0%) | 0 (0.0%) |
| Construction | 384 (80.3%) | 94 (19.7%) |
| Manufacturing | 233 (81.8%) | 52 (18.2%) |
| Wholesale Trade | 50 (52.1%) | 46 (47.9%) |
| Retail Trade | 339 (50.1%) | 338 (49.9%) |
| Transportation & Warehousing | 578 (79.6%) | 148 (20.4%) |
| Utilities | 75 (72.8%) | 28 (27.2%) |
| Information | 16 (32.7%) | 33 (67.3%) |
| Finance & Insurance | 72 (33.8%) | 141 (66.2%) |
| Real Estate, Rental & Leasing | 64 (68.1%) | 30 (31.9%) |
| Professional & Scientific | 20 (28.6%) | 50 (71.4%) |
| Enterprise Management | 0 (0.0%) | 0 (0.0%) |
| Administrative & Support | 179 (69.9%) | 77 (30.1%) |
| Educational Services | 42 (12.3%) | 299 (87.7%) |
| Health Care & Social Assistance | 194 (25.6%) | 565 (74.4%) |
| Arts, Entertainment & Recreation | 78 (37.0%) | 133 (63.0%) |
| Accommodation & Food Services | 245 (78.0%) | 69 (22.0%) |
| Public Administration | 15 (17.2%) | 72 (82.8%) |
| Total | 2,772 (54.3%) | 2,334 (45.7%) |
Education in Worth
School Enrollment in Worth
The most common levels of schooling among the 2,635 students in Worth are high school (697 | 26.5%), college / undergraduate (566 | 21.5%), and elementary school (507 | 19.2%).
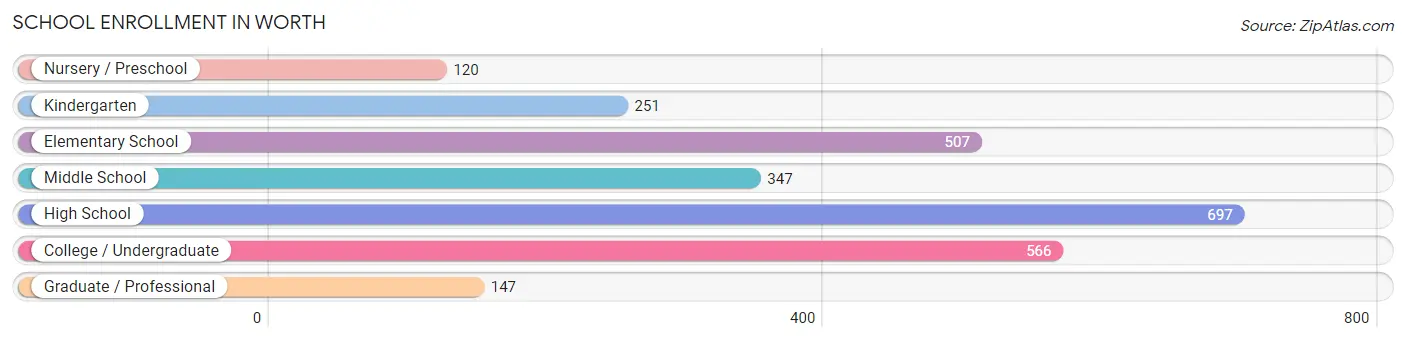
| School Level | # Students | % Students |
| Nursery / Preschool | 120 | 4.5% |
| Kindergarten | 251 | 9.5% |
| Elementary School | 507 | 19.2% |
| Middle School | 347 | 13.2% |
| High School | 697 | 26.5% |
| College / Undergraduate | 566 | 21.5% |
| Graduate / Professional | 147 | 5.6% |
| Total | 2,635 | 100.0% |
School Enrollment by Age by Funding Source in Worth
Out of a total of 2,635 students who are enrolled in schools in Worth, 609 (23.1%) attend a private institution, while the remaining 2,026 (76.9%) are enrolled in public schools. The age group of 3 to 4 year olds has the highest likelihood of being enrolled in private schools, with 48 (81.4% in the age bracket) enrolled. Conversely, the age group of 18 to 19 year olds has the lowest likelihood of being enrolled in a private school, with 135 (100.0% in the age bracket) attending a public institution.
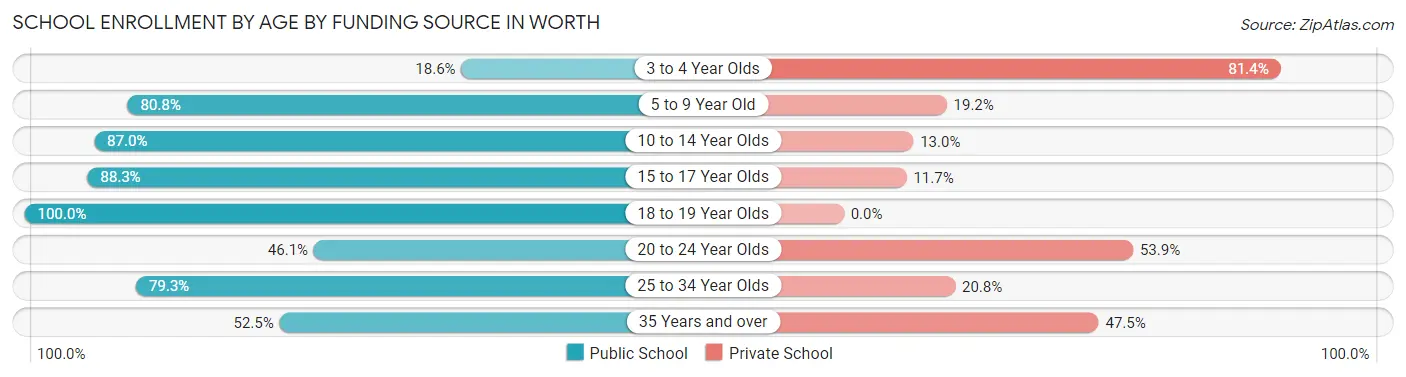
| Age Bracket | Public School | Private School |
| 3 to 4 Year Olds | 11 (18.6%) | 48 (81.4%) |
| 5 to 9 Year Old | 624 (80.8%) | 148 (19.2%) |
| 10 to 14 Year Olds | 430 (87.0%) | 64 (13.0%) |
| 15 to 17 Year Olds | 468 (88.3%) | 62 (11.7%) |
| 18 to 19 Year Olds | 135 (100.0%) | 0 (0.0%) |
| 20 to 24 Year Olds | 160 (46.1%) | 187 (53.9%) |
| 25 to 34 Year Olds | 126 (79.2%) | 33 (20.7%) |
| 35 Years and over | 73 (52.5%) | 66 (47.5%) |
| Total | 2,026 (76.9%) | 609 (23.1%) |
Educational Attainment by Field of Study in Worth
Business (303 | 21.0%), science & technology (205 | 14.2%), education (168 | 11.7%), social sciences (150 | 10.4%), and bio, nature & agricultural (119 | 8.3%) are the most common fields of study among 1,441 individuals in Worth who have obtained a bachelor's degree or higher.
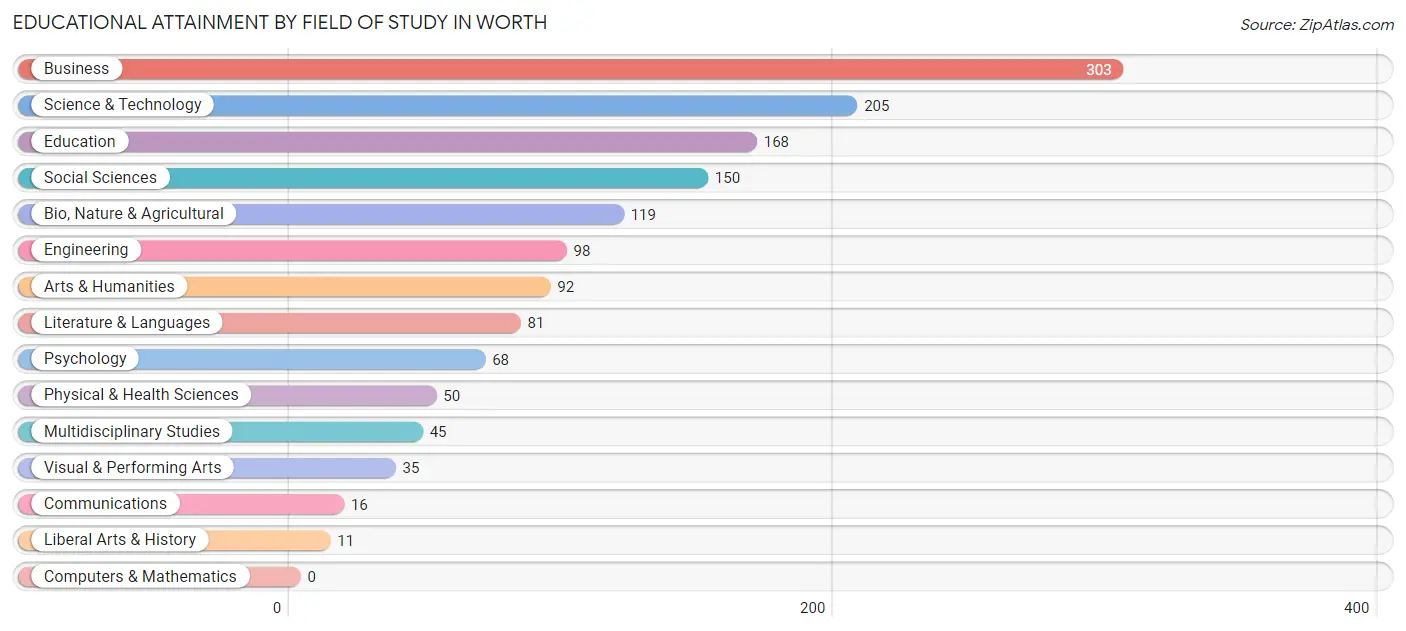
| Field of Study | # Graduates | % Graduates |
| Computers & Mathematics | 0 | 0.0% |
| Bio, Nature & Agricultural | 119 | 8.3% |
| Physical & Health Sciences | 50 | 3.5% |
| Psychology | 68 | 4.7% |
| Social Sciences | 150 | 10.4% |
| Engineering | 98 | 6.8% |
| Multidisciplinary Studies | 45 | 3.1% |
| Science & Technology | 205 | 14.2% |
| Business | 303 | 21.0% |
| Education | 168 | 11.7% |
| Literature & Languages | 81 | 5.6% |
| Liberal Arts & History | 11 | 0.8% |
| Visual & Performing Arts | 35 | 2.4% |
| Communications | 16 | 1.1% |
| Arts & Humanities | 92 | 6.4% |
| Total | 1,441 | 100.0% |
Transportation & Commute in Worth
Vehicle Availability by Sex in Worth
The most prevalent vehicle ownership categories in Worth are males with 2 vehicles (1,001, accounting for 39.3%) and females with 2 vehicles (634, making up 43.4%).
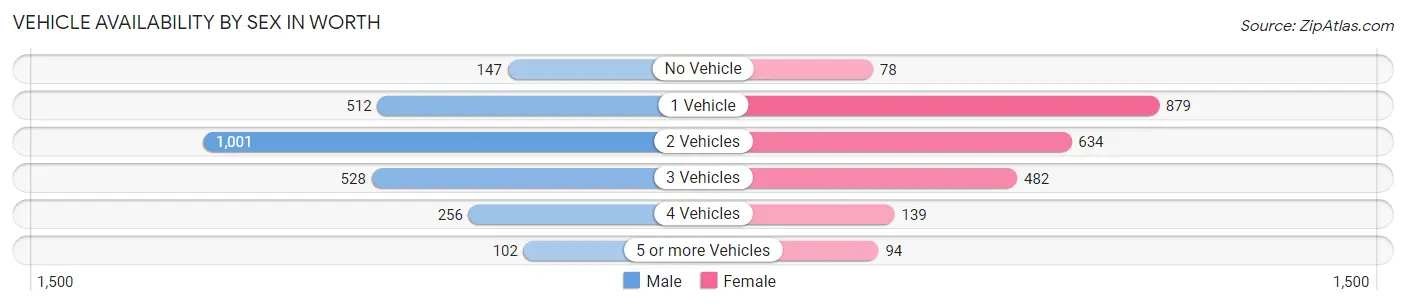
| Vehicles Available | Male | Female |
| No Vehicle | 147 (5.8%) | 78 (3.4%) |
| 1 Vehicle | 512 (20.1%) | 879 (38.1%) |
| 2 Vehicles | 1,001 (39.3%) | 634 (27.5%) |
| 3 Vehicles | 528 (20.7%) | 482 (20.9%) |
| 4 Vehicles | 256 (10.1%) | 139 (6.0%) |
| 5 or more Vehicles | 102 (4.0%) | 94 (4.1%) |
| Total | 2,546 (100.0%) | 2,306 (100.0%) |
Commute Time in Worth
The most frequently occuring commute durations in Worth are 20 to 24 minutes (638 commuters, 14.1%), 30 to 34 minutes (619 commuters, 13.6%), and 10 to 14 minutes (604 commuters, 13.3%).
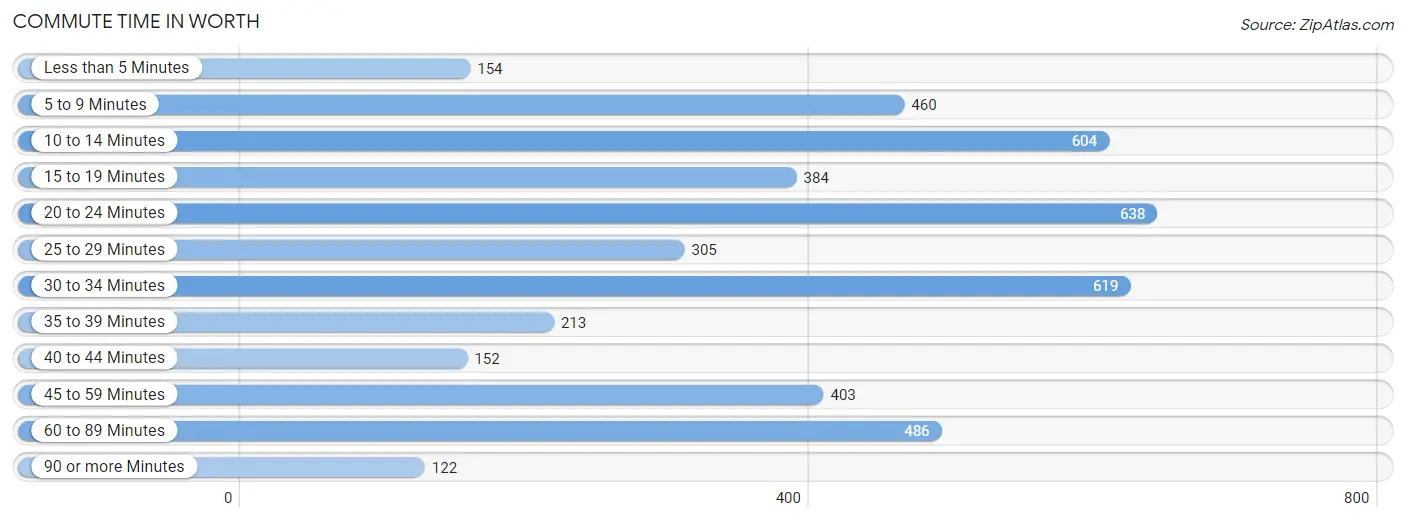
| Commute Time | # Commuters | % Commuters |
| Less than 5 Minutes | 154 | 3.4% |
| 5 to 9 Minutes | 460 | 10.1% |
| 10 to 14 Minutes | 604 | 13.3% |
| 15 to 19 Minutes | 384 | 8.5% |
| 20 to 24 Minutes | 638 | 14.1% |
| 25 to 29 Minutes | 305 | 6.7% |
| 30 to 34 Minutes | 619 | 13.6% |
| 35 to 39 Minutes | 213 | 4.7% |
| 40 to 44 Minutes | 152 | 3.4% |
| 45 to 59 Minutes | 403 | 8.9% |
| 60 to 89 Minutes | 486 | 10.7% |
| 90 or more Minutes | 122 | 2.7% |
Commute Time by Sex in Worth
The most common commute times in Worth are 20 to 24 minutes (367 commuters, 14.8%) for males and 10 to 14 minutes (415 commuters, 20.1%) for females.
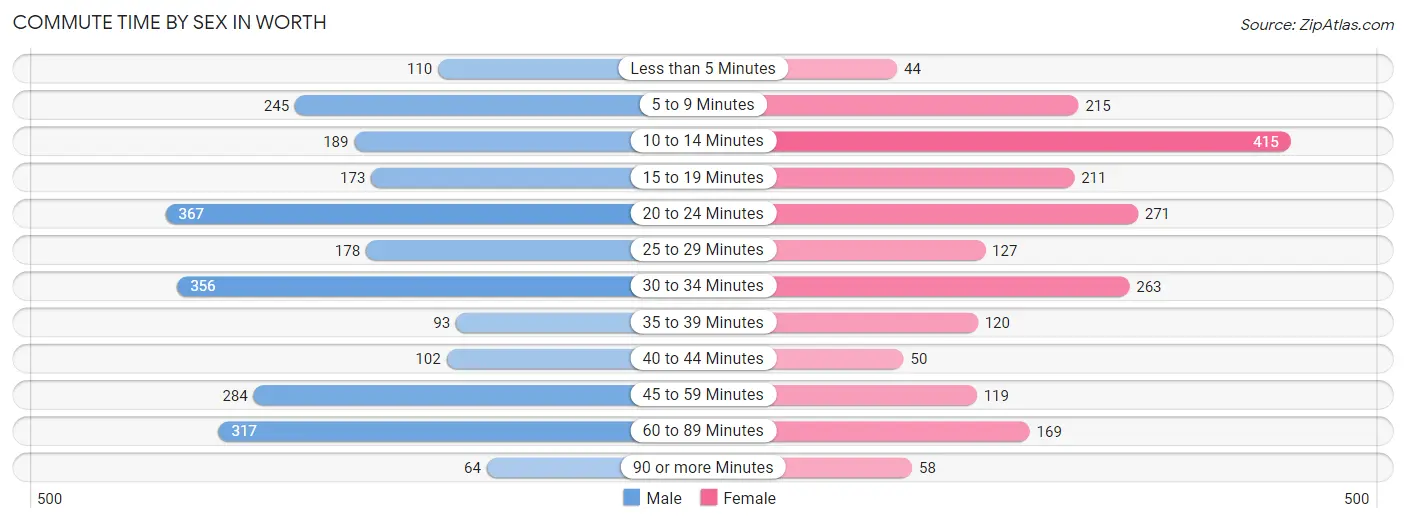
| Commute Time | Male | Female |
| Less than 5 Minutes | 110 (4.4%) | 44 (2.1%) |
| 5 to 9 Minutes | 245 (9.9%) | 215 (10.4%) |
| 10 to 14 Minutes | 189 (7.6%) | 415 (20.1%) |
| 15 to 19 Minutes | 173 (7.0%) | 211 (10.2%) |
| 20 to 24 Minutes | 367 (14.8%) | 271 (13.1%) |
| 25 to 29 Minutes | 178 (7.2%) | 127 (6.2%) |
| 30 to 34 Minutes | 356 (14.4%) | 263 (12.8%) |
| 35 to 39 Minutes | 93 (3.7%) | 120 (5.8%) |
| 40 to 44 Minutes | 102 (4.1%) | 50 (2.4%) |
| 45 to 59 Minutes | 284 (11.5%) | 119 (5.8%) |
| 60 to 89 Minutes | 317 (12.8%) | 169 (8.2%) |
| 90 or more Minutes | 64 (2.6%) | 58 (2.8%) |
Time of Departure to Work by Sex in Worth
The most frequent times of departure to work in Worth are 7:30 AM to 7:59 AM (360, 14.5%) for males and 7:30 AM to 7:59 AM (382, 18.5%) for females.
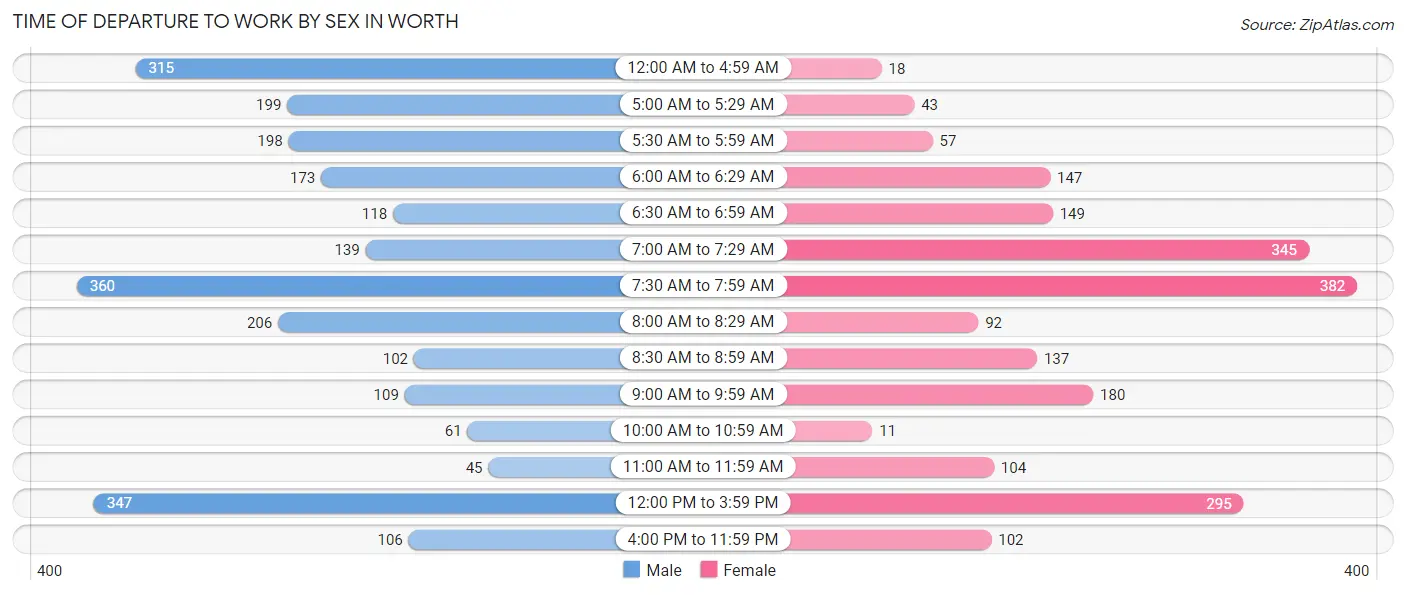
| Time of Departure | Male | Female |
| 12:00 AM to 4:59 AM | 315 (12.7%) | 18 (0.9%) |
| 5:00 AM to 5:29 AM | 199 (8.0%) | 43 (2.1%) |
| 5:30 AM to 5:59 AM | 198 (8.0%) | 57 (2.8%) |
| 6:00 AM to 6:29 AM | 173 (7.0%) | 147 (7.1%) |
| 6:30 AM to 6:59 AM | 118 (4.8%) | 149 (7.2%) |
| 7:00 AM to 7:29 AM | 139 (5.6%) | 345 (16.7%) |
| 7:30 AM to 7:59 AM | 360 (14.5%) | 382 (18.5%) |
| 8:00 AM to 8:29 AM | 206 (8.3%) | 92 (4.5%) |
| 8:30 AM to 8:59 AM | 102 (4.1%) | 137 (6.6%) |
| 9:00 AM to 9:59 AM | 109 (4.4%) | 180 (8.7%) |
| 10:00 AM to 10:59 AM | 61 (2.5%) | 11 (0.5%) |
| 11:00 AM to 11:59 AM | 45 (1.8%) | 104 (5.0%) |
| 12:00 PM to 3:59 PM | 347 (14.0%) | 295 (14.3%) |
| 4:00 PM to 11:59 PM | 106 (4.3%) | 102 (5.0%) |
| Total | 2,478 (100.0%) | 2,062 (100.0%) |
Housing Occupancy in Worth
Occupancy by Ownership in Worth
Of the total 4,363 dwellings in Worth, owner-occupied units account for 2,738 (62.7%), while renter-occupied units make up 1,625 (37.2%).
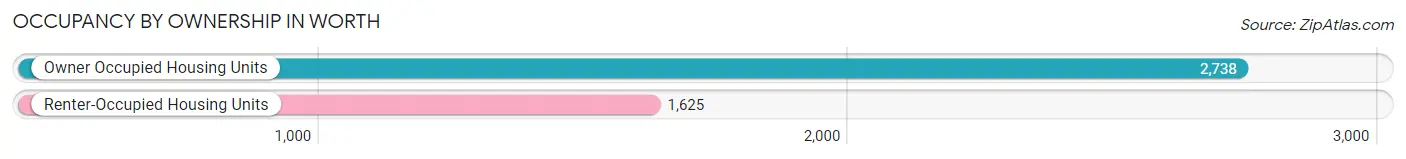
| Occupancy | # Housing Units | % Housing Units |
| Owner Occupied Housing Units | 2,738 | 62.7% |
| Renter-Occupied Housing Units | 1,625 | 37.2% |
| Total Occupied Housing Units | 4,363 | 100.0% |
Occupancy by Household Size in Worth
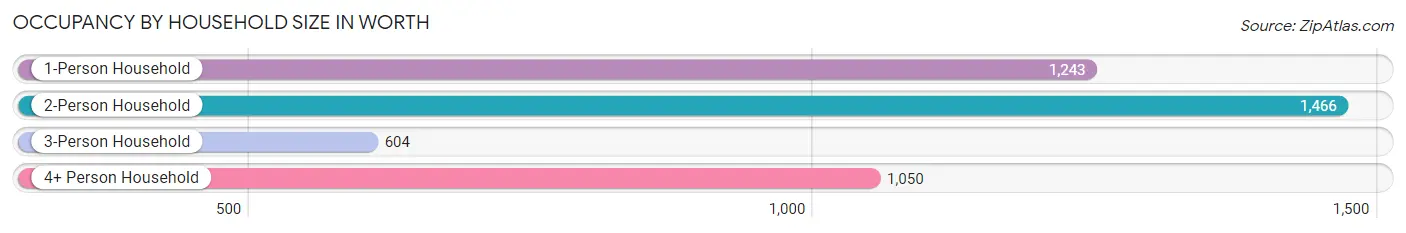
| Household Size | # Housing Units | % Housing Units |
| 1-Person Household | 1,243 | 28.5% |
| 2-Person Household | 1,466 | 33.6% |
| 3-Person Household | 604 | 13.8% |
| 4+ Person Household | 1,050 | 24.1% |
| Total Housing Units | 4,363 | 100.0% |
Occupancy by Ownership by Household Size in Worth
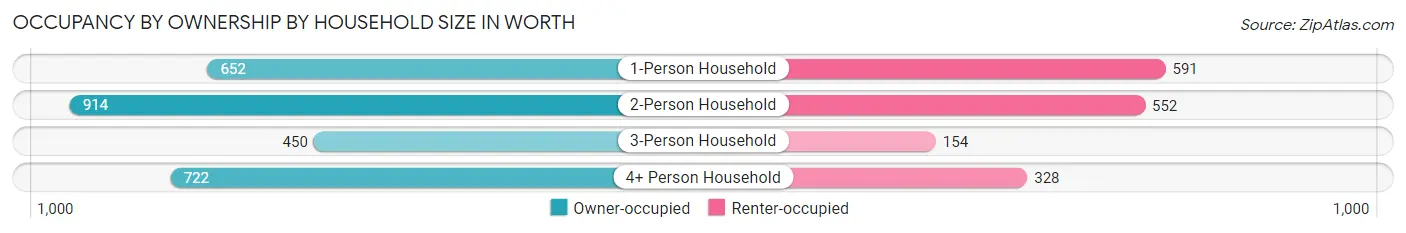
| Household Size | Owner-occupied | Renter-occupied |
| 1-Person Household | 652 (52.4%) | 591 (47.5%) |
| 2-Person Household | 914 (62.4%) | 552 (37.7%) |
| 3-Person Household | 450 (74.5%) | 154 (25.5%) |
| 4+ Person Household | 722 (68.8%) | 328 (31.2%) |
| Total Housing Units | 2,738 (62.7%) | 1,625 (37.2%) |
Occupancy by Educational Attainment in Worth
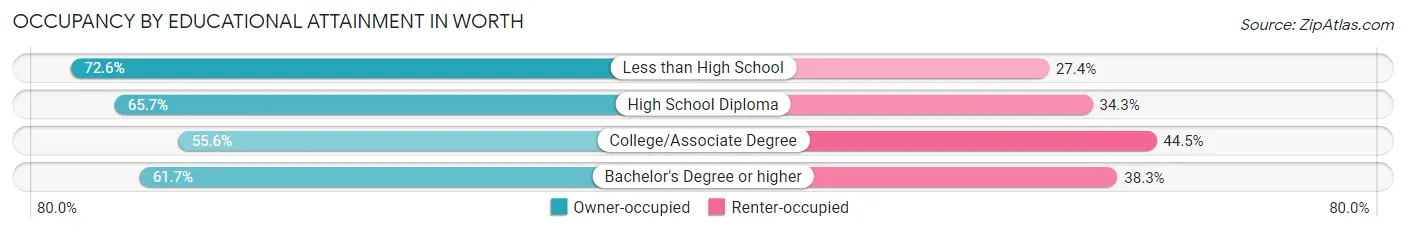
| Household Size | Owner-occupied | Renter-occupied |
| Less than High School | 347 (72.6%) | 131 (27.4%) |
| High School Diploma | 1,150 (65.7%) | 601 (34.3%) |
| College/Associate Degree | 686 (55.5%) | 549 (44.5%) |
| Bachelor's Degree or higher | 555 (61.7%) | 344 (38.3%) |
Occupancy by Age of Householder in Worth
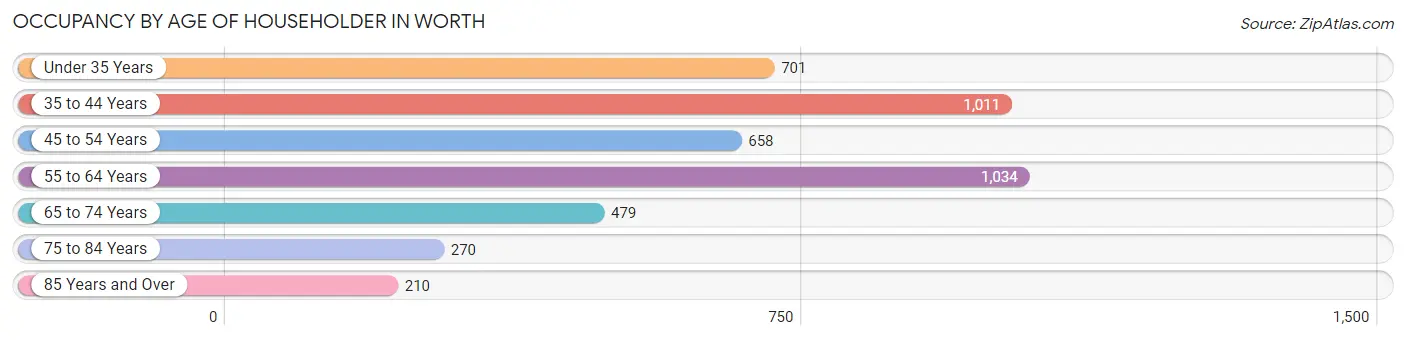
| Age Bracket | # Households | % Households |
| Under 35 Years | 701 | 16.1% |
| 35 to 44 Years | 1,011 | 23.2% |
| 45 to 54 Years | 658 | 15.1% |
| 55 to 64 Years | 1,034 | 23.7% |
| 65 to 74 Years | 479 | 11.0% |
| 75 to 84 Years | 270 | 6.2% |
| 85 Years and Over | 210 | 4.8% |
| Total | 4,363 | 100.0% |
Housing Finances in Worth
Median Income by Occupancy in Worth
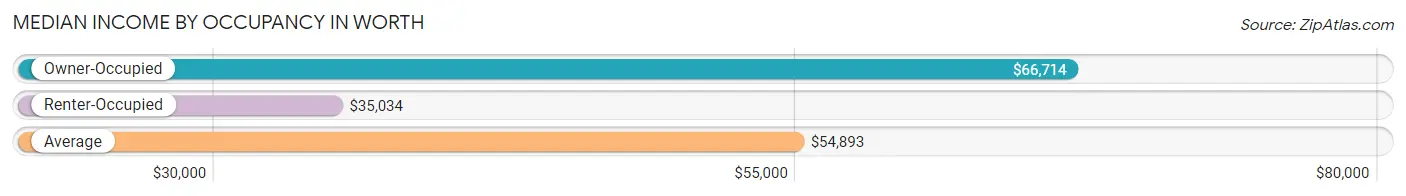
| Occupancy Type | # Households | Median Income |
| Owner-Occupied | 2,738 (62.7%) | $66,714 |
| Renter-Occupied | 1,625 (37.2%) | $35,034 |
| Average | 4,363 (100.0%) | $54,893 |
Occupancy by Householder Income Bracket in Worth
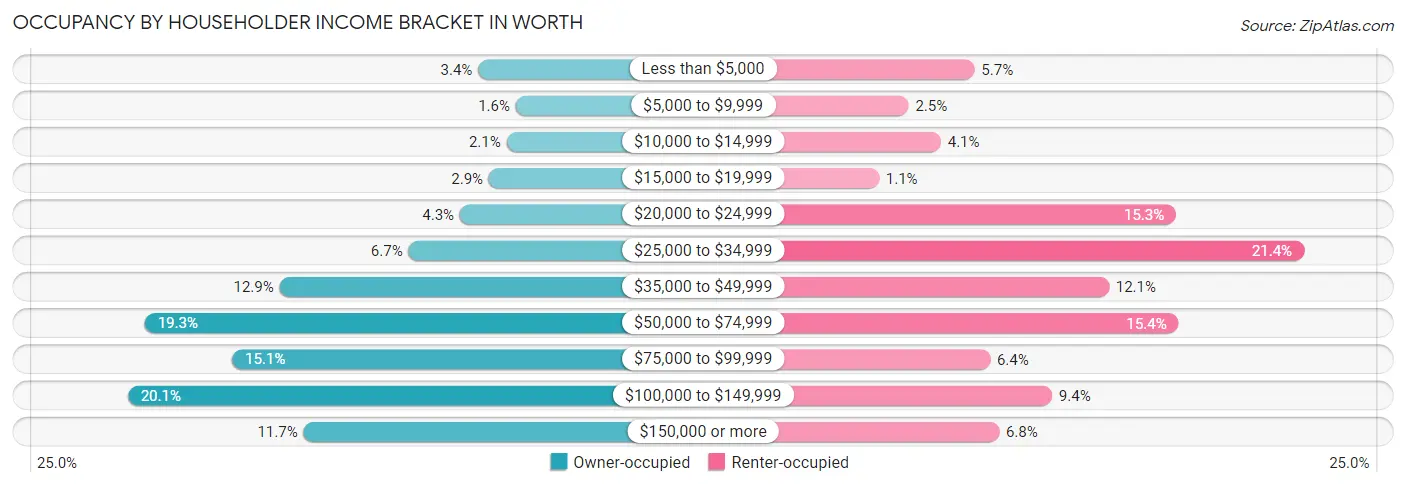
| Income Bracket | Owner-occupied | Renter-occupied |
| Less than $5,000 | 93 (3.4%) | 92 (5.7%) |
| $5,000 to $9,999 | 44 (1.6%) | 41 (2.5%) |
| $10,000 to $14,999 | 56 (2.1%) | 66 (4.1%) |
| $15,000 to $19,999 | 79 (2.9%) | 18 (1.1%) |
| $20,000 to $24,999 | 117 (4.3%) | 248 (15.3%) |
| $25,000 to $34,999 | 184 (6.7%) | 347 (21.3%) |
| $35,000 to $49,999 | 352 (12.9%) | 196 (12.1%) |
| $50,000 to $74,999 | 528 (19.3%) | 250 (15.4%) |
| $75,000 to $99,999 | 414 (15.1%) | 104 (6.4%) |
| $100,000 to $149,999 | 550 (20.1%) | 152 (9.3%) |
| $150,000 or more | 321 (11.7%) | 111 (6.8%) |
| Total | 2,738 (100.0%) | 1,625 (100.0%) |
Monthly Housing Cost Tiers in Worth
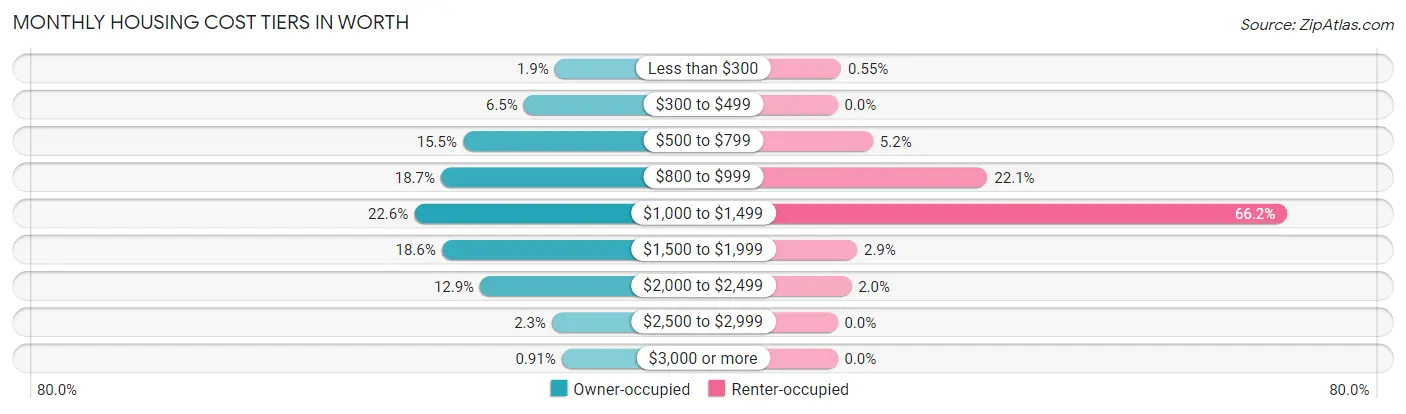
| Monthly Cost | Owner-occupied | Renter-occupied |
| Less than $300 | 53 (1.9%) | 9 (0.5%) |
| $300 to $499 | 178 (6.5%) | 0 (0.0%) |
| $500 to $799 | 423 (15.4%) | 85 (5.2%) |
| $800 to $999 | 512 (18.7%) | 359 (22.1%) |
| $1,000 to $1,499 | 620 (22.6%) | 1,076 (66.2%) |
| $1,500 to $1,999 | 509 (18.6%) | 47 (2.9%) |
| $2,000 to $2,499 | 354 (12.9%) | 33 (2.0%) |
| $2,500 to $2,999 | 64 (2.3%) | 0 (0.0%) |
| $3,000 or more | 25 (0.9%) | 0 (0.0%) |
| Total | 2,738 (100.0%) | 1,625 (100.0%) |
Physical Housing Characteristics in Worth
Housing Structures in Worth
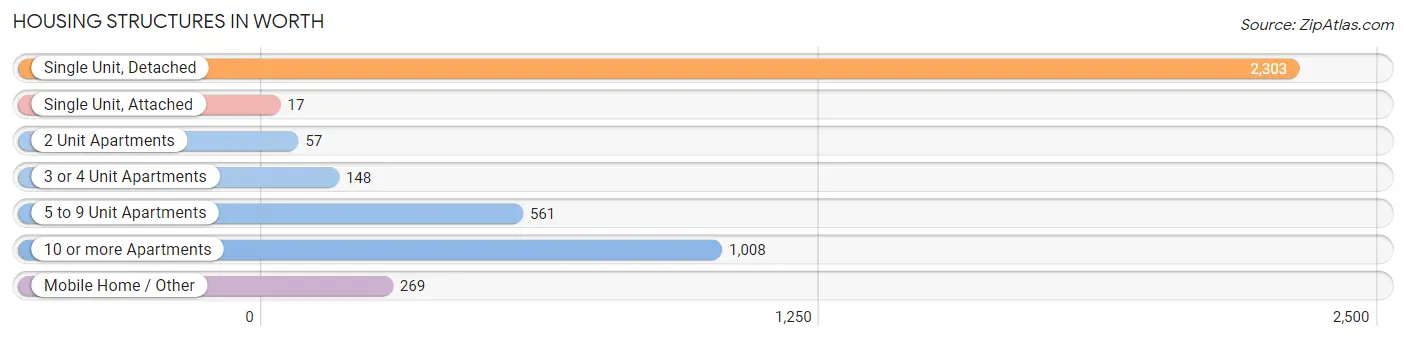
| Structure Type | # Housing Units | % Housing Units |
| Single Unit, Detached | 2,303 | 52.8% |
| Single Unit, Attached | 17 | 0.4% |
| 2 Unit Apartments | 57 | 1.3% |
| 3 or 4 Unit Apartments | 148 | 3.4% |
| 5 to 9 Unit Apartments | 561 | 12.9% |
| 10 or more Apartments | 1,008 | 23.1% |
| Mobile Home / Other | 269 | 6.2% |
| Total | 4,363 | 100.0% |
Housing Structures by Occupancy in Worth
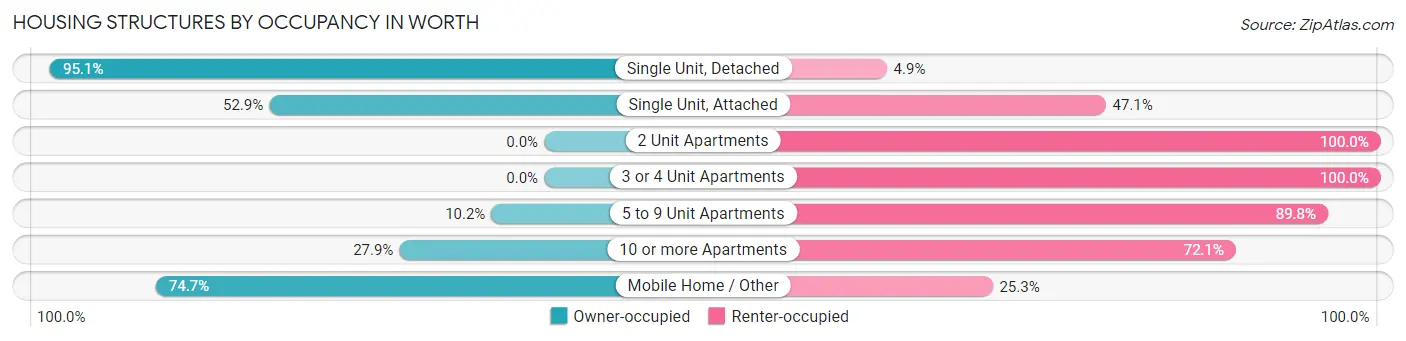
| Structure Type | Owner-occupied | Renter-occupied |
| Single Unit, Detached | 2,190 (95.1%) | 113 (4.9%) |
| Single Unit, Attached | 9 (52.9%) | 8 (47.1%) |
| 2 Unit Apartments | 0 (0.0%) | 57 (100.0%) |
| 3 or 4 Unit Apartments | 0 (0.0%) | 148 (100.0%) |
| 5 to 9 Unit Apartments | 57 (10.2%) | 504 (89.8%) |
| 10 or more Apartments | 281 (27.9%) | 727 (72.1%) |
| Mobile Home / Other | 201 (74.7%) | 68 (25.3%) |
| Total | 2,738 (62.7%) | 1,625 (37.2%) |
Housing Structures by Number of Rooms in Worth
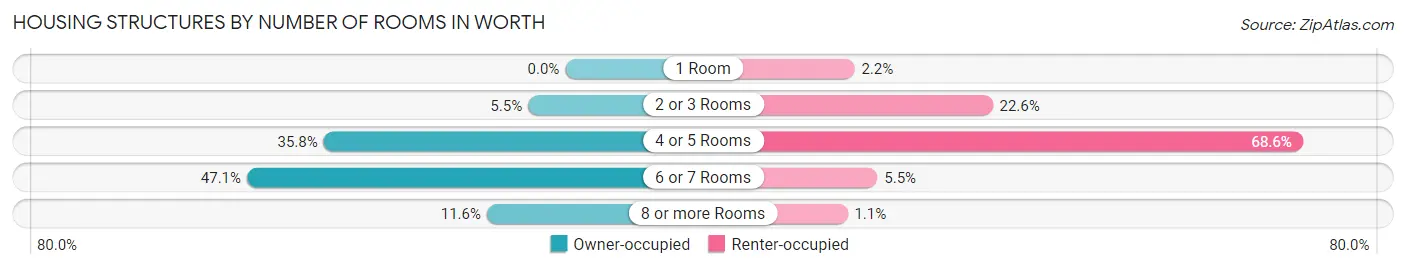
| Number of Rooms | Owner-occupied | Renter-occupied |
| 1 Room | 0 (0.0%) | 35 (2.1%) |
| 2 or 3 Rooms | 151 (5.5%) | 367 (22.6%) |
| 4 or 5 Rooms | 979 (35.8%) | 1,115 (68.6%) |
| 6 or 7 Rooms | 1,290 (47.1%) | 90 (5.5%) |
| 8 or more Rooms | 318 (11.6%) | 18 (1.1%) |
| Total | 2,738 (100.0%) | 1,625 (100.0%) |
Housing Structure by Heating Type in Worth
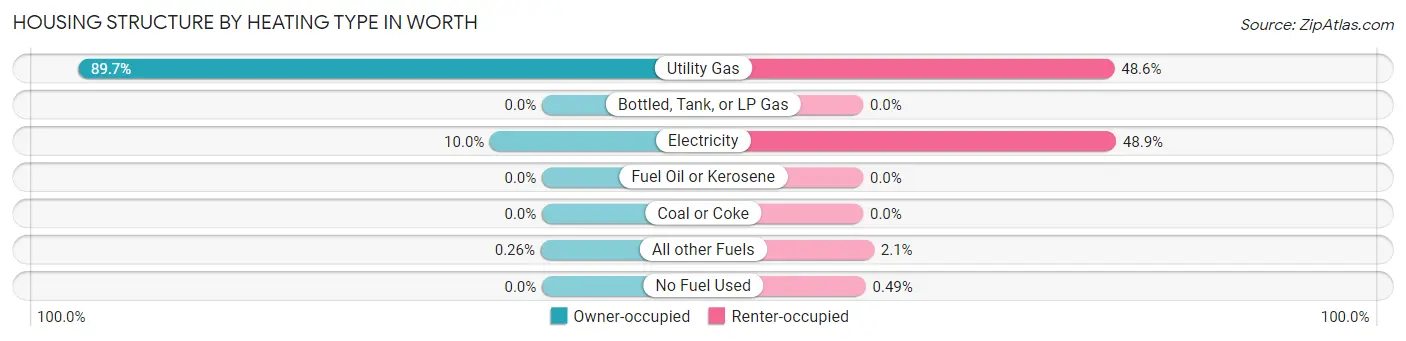
| Heating Type | Owner-occupied | Renter-occupied |
| Utility Gas | 2,456 (89.7%) | 789 (48.5%) |
| Bottled, Tank, or LP Gas | 0 (0.0%) | 0 (0.0%) |
| Electricity | 275 (10.0%) | 794 (48.9%) |
| Fuel Oil or Kerosene | 0 (0.0%) | 0 (0.0%) |
| Coal or Coke | 0 (0.0%) | 0 (0.0%) |
| All other Fuels | 7 (0.3%) | 34 (2.1%) |
| No Fuel Used | 0 (0.0%) | 8 (0.5%) |
| Total | 2,738 (100.0%) | 1,625 (100.0%) |
Household Vehicle Usage in Worth
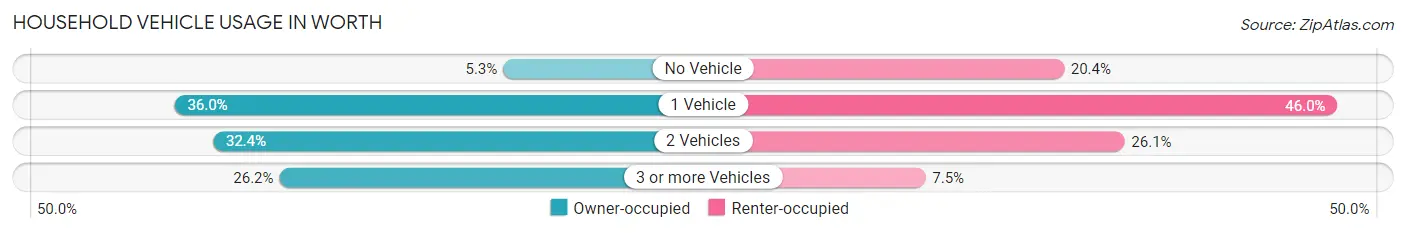
| Vehicles per Household | Owner-occupied | Renter-occupied |
| No Vehicle | 146 (5.3%) | 332 (20.4%) |
| 1 Vehicle | 986 (36.0%) | 747 (46.0%) |
| 2 Vehicles | 888 (32.4%) | 424 (26.1%) |
| 3 or more Vehicles | 718 (26.2%) | 122 (7.5%) |
| Total | 2,738 (100.0%) | 1,625 (100.0%) |
Real Estate & Mortgages in Worth
Real Estate and Mortgage Overview in Worth
| Characteristic | Without Mortgage | With Mortgage |
| Housing Units | 1,138 | 1,600 |
| Median Property Value | $214,300 | $208,900 |
| Median Household Income | $54,934 | $202 |
| Monthly Housing Costs | $769 | $25 |
| Real Estate Taxes | $5,757 | $126 |
Property Value by Mortgage Status in Worth
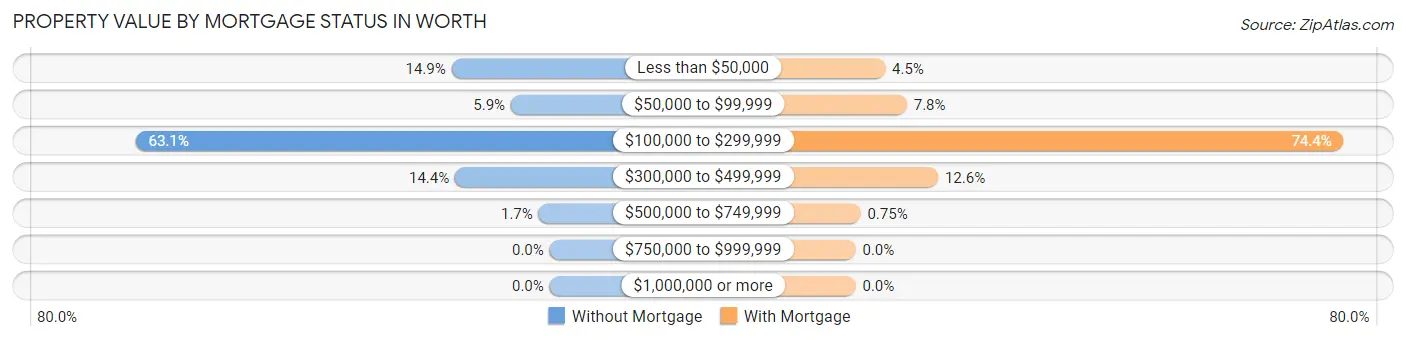
| Property Value | Without Mortgage | With Mortgage |
| Less than $50,000 | 170 (14.9%) | 72 (4.5%) |
| $50,000 to $99,999 | 67 (5.9%) | 125 (7.8%) |
| $100,000 to $299,999 | 718 (63.1%) | 1,190 (74.4%) |
| $300,000 to $499,999 | 164 (14.4%) | 201 (12.6%) |
| $500,000 to $749,999 | 19 (1.7%) | 12 (0.7%) |
| $750,000 to $999,999 | 0 (0.0%) | 0 (0.0%) |
| $1,000,000 or more | 0 (0.0%) | 0 (0.0%) |
| Total | 1,138 (100.0%) | 1,600 (100.0%) |
Household Income by Mortgage Status in Worth
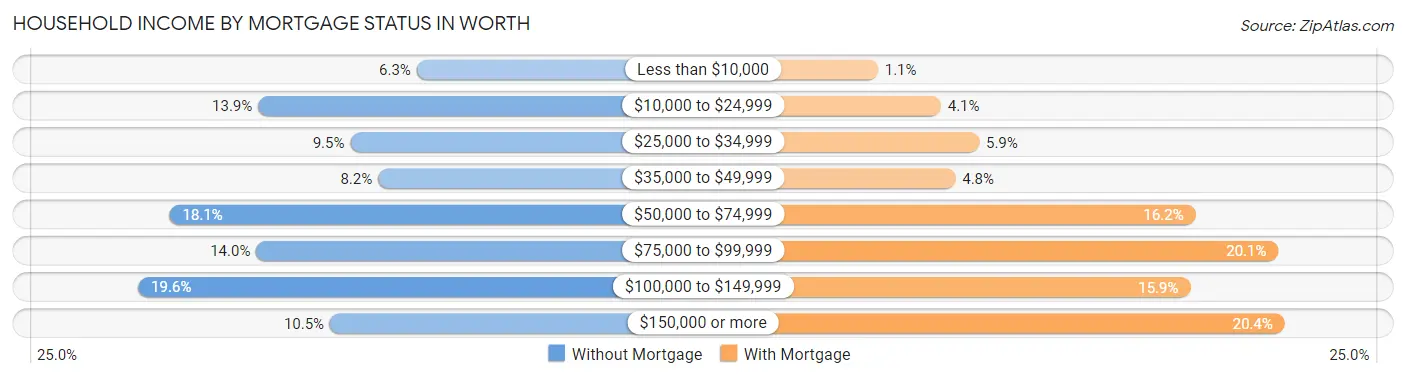
| Household Income | Without Mortgage | With Mortgage |
| Less than $10,000 | 72 (6.3%) | 17 (1.1%) |
| $10,000 to $24,999 | 158 (13.9%) | 65 (4.1%) |
| $25,000 to $34,999 | 108 (9.5%) | 94 (5.9%) |
| $35,000 to $49,999 | 93 (8.2%) | 76 (4.8%) |
| $50,000 to $74,999 | 206 (18.1%) | 259 (16.2%) |
| $75,000 to $99,999 | 159 (14.0%) | 322 (20.1%) |
| $100,000 to $149,999 | 223 (19.6%) | 255 (15.9%) |
| $150,000 or more | 119 (10.5%) | 327 (20.4%) |
| Total | 1,138 (100.0%) | 1,600 (100.0%) |
Property Value to Household Income Ratio in Worth
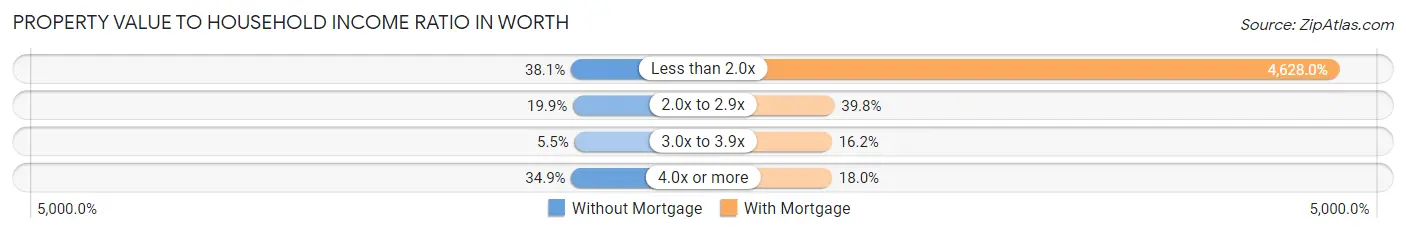
| Value-to-Income Ratio | Without Mortgage | With Mortgage |
| Less than 2.0x | 433 (38.1%) | 74,048 (4,628.0%) |
| 2.0x to 2.9x | 226 (19.9%) | 637 (39.8%) |
| 3.0x to 3.9x | 63 (5.5%) | 259 (16.2%) |
| 4.0x or more | 397 (34.9%) | 288 (18.0%) |
| Total | 1,138 (100.0%) | 1,600 (100.0%) |
Real Estate Taxes by Mortgage Status in Worth
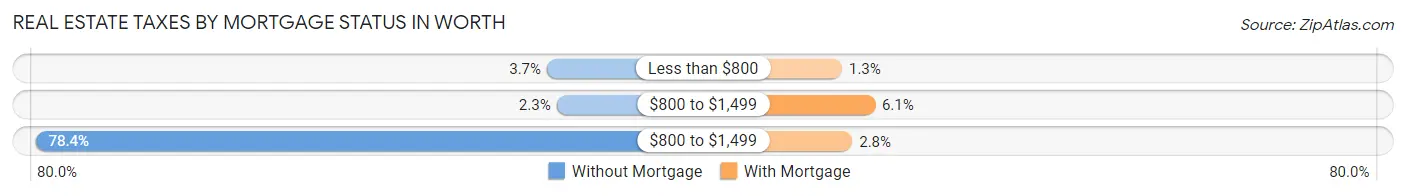
| Property Taxes | Without Mortgage | With Mortgage |
| Less than $800 | 42 (3.7%) | 21 (1.3%) |
| $800 to $1,499 | 26 (2.3%) | 98 (6.1%) |
| $800 to $1,499 | 892 (78.4%) | 45 (2.8%) |
| Total | 1,138 (100.0%) | 1,600 (100.0%) |
Health & Disability in Worth
Health Insurance Coverage by Age in Worth
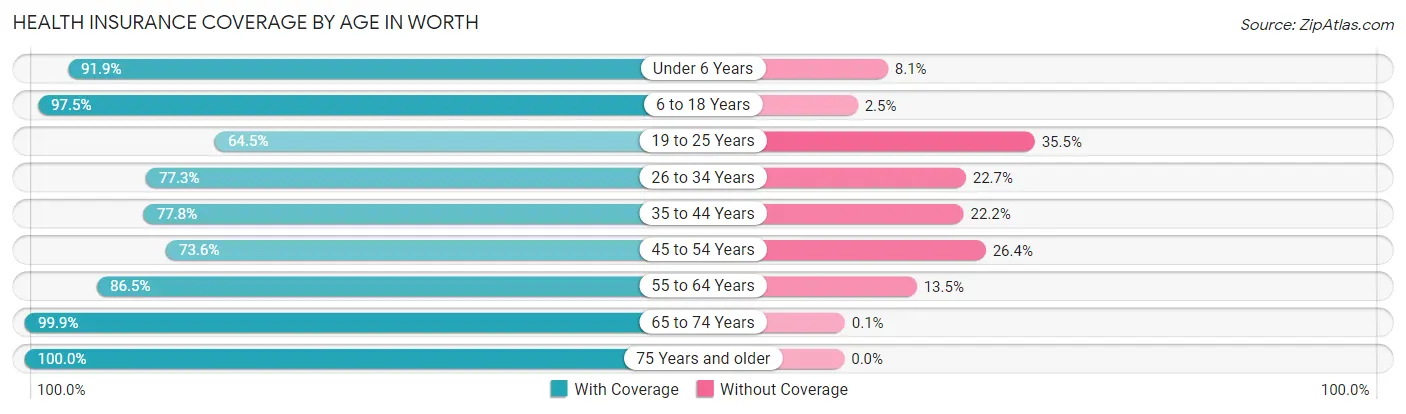
| Age Bracket | With Coverage | Without Coverage |
| Under 6 Years | 622 (91.9%) | 55 (8.1%) |
| 6 to 18 Years | 1,794 (97.5%) | 46 (2.5%) |
| 19 to 25 Years | 670 (64.5%) | 369 (35.5%) |
| 26 to 34 Years | 918 (77.3%) | 269 (22.7%) |
| 35 to 44 Years | 1,304 (77.8%) | 373 (22.2%) |
| 45 to 54 Years | 882 (73.6%) | 316 (26.4%) |
| 55 to 64 Years | 1,344 (86.5%) | 210 (13.5%) |
| 65 to 74 Years | 964 (99.9%) | 1 (0.1%) |
| 75 Years and older | 722 (100.0%) | 0 (0.0%) |
| Total | 9,220 (84.9%) | 1,639 (15.1%) |
Health Insurance Coverage by Citizenship Status in Worth
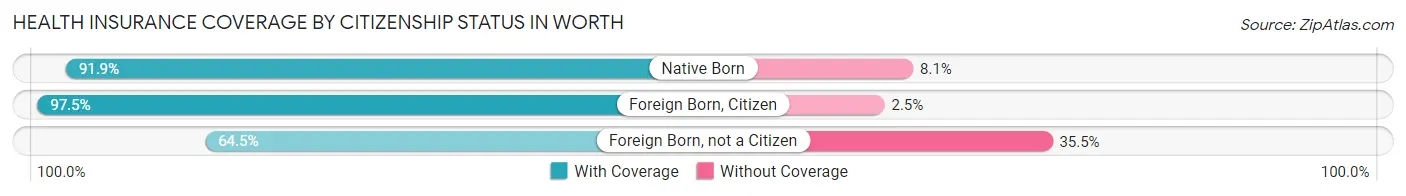
| Citizenship Status | With Coverage | Without Coverage |
| Native Born | 622 (91.9%) | 55 (8.1%) |
| Foreign Born, Citizen | 1,794 (97.5%) | 46 (2.5%) |
| Foreign Born, not a Citizen | 670 (64.5%) | 369 (35.5%) |
Health Insurance Coverage by Household Income in Worth
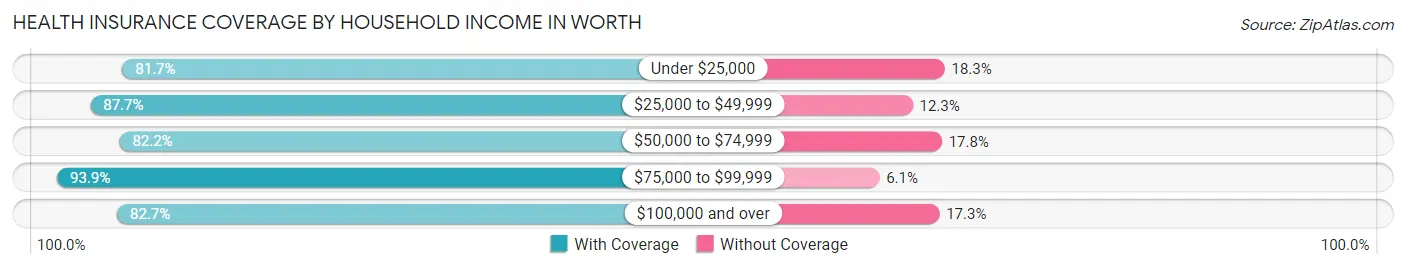
| Household Income | With Coverage | Without Coverage |
| Under $25,000 | 1,458 (81.7%) | 327 (18.3%) |
| $25,000 to $49,999 | 1,808 (87.7%) | 254 (12.3%) |
| $50,000 to $74,999 | 1,568 (82.2%) | 339 (17.8%) |
| $75,000 to $99,999 | 1,390 (93.9%) | 90 (6.1%) |
| $100,000 and over | 2,988 (82.7%) | 626 (17.3%) |
Public vs Private Health Insurance Coverage by Age in Worth
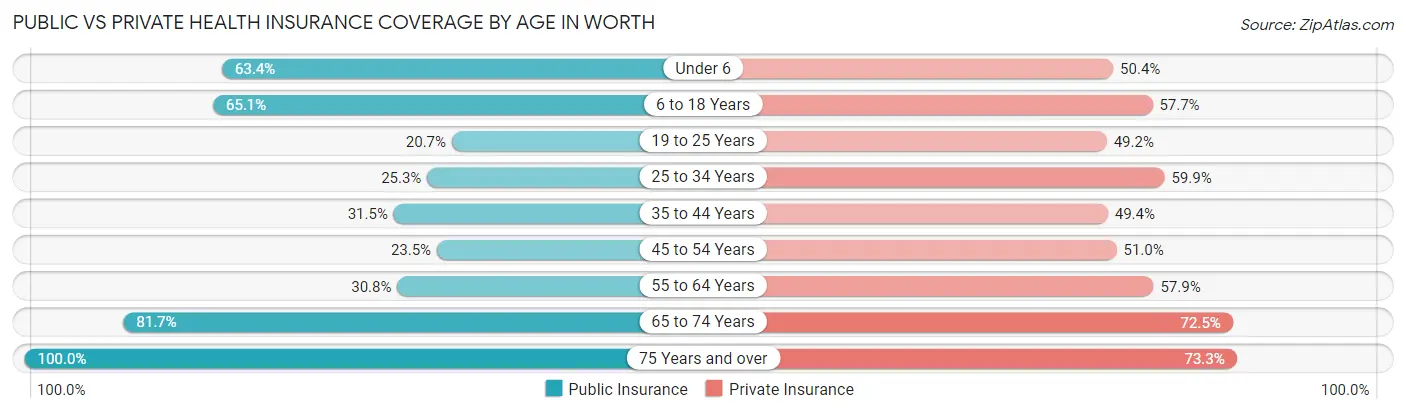
| Age Bracket | Public Insurance | Private Insurance |
| Under 6 | 429 (63.4%) | 341 (50.4%) |
| 6 to 18 Years | 1,197 (65.0%) | 1,061 (57.7%) |
| 19 to 25 Years | 215 (20.7%) | 511 (49.2%) |
| 25 to 34 Years | 300 (25.3%) | 711 (59.9%) |
| 35 to 44 Years | 528 (31.5%) | 828 (49.4%) |
| 45 to 54 Years | 281 (23.5%) | 611 (51.0%) |
| 55 to 64 Years | 479 (30.8%) | 899 (57.9%) |
| 65 to 74 Years | 788 (81.7%) | 700 (72.5%) |
| 75 Years and over | 722 (100.0%) | 529 (73.3%) |
| Total | 4,939 (45.5%) | 6,191 (57.0%) |
Disability Status by Sex by Age in Worth
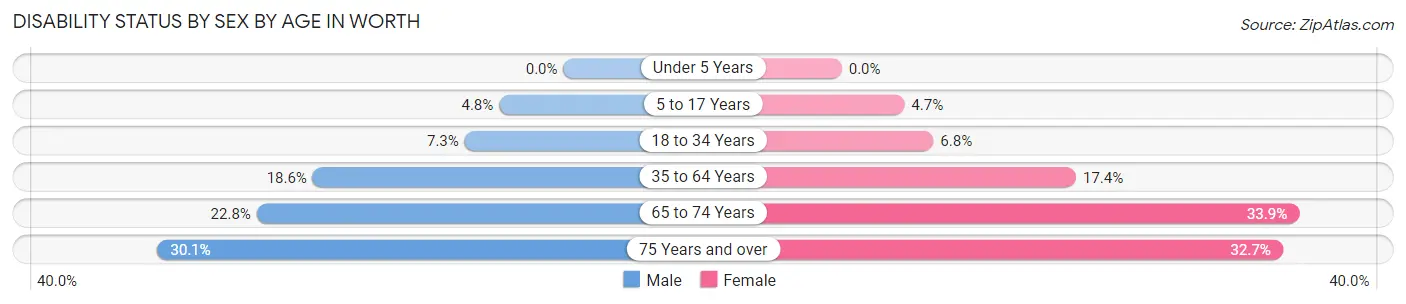
| Age Bracket | Male | Female |
| Under 5 Years | 0 (0.0%) | 0 (0.0%) |
| 5 to 17 Years | 49 (4.8%) | 41 (4.6%) |
| 18 to 34 Years | 90 (7.3%) | 74 (6.8%) |
| 35 to 64 Years | 410 (18.6%) | 387 (17.4%) |
| 65 to 74 Years | 107 (22.8%) | 168 (33.9%) |
| 75 Years and over | 85 (30.1%) | 144 (32.7%) |
Disability Class by Sex by Age in Worth
Disability Class: Hearing Difficulty
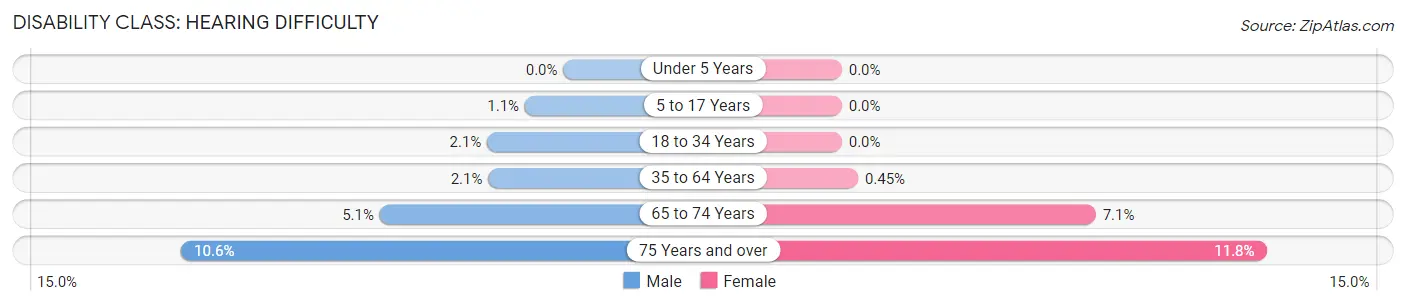
| Age Bracket | Male | Female |
| Under 5 Years | 0 (0.0%) | 0 (0.0%) |
| 5 to 17 Years | 11 (1.1%) | 0 (0.0%) |
| 18 to 34 Years | 26 (2.1%) | 0 (0.0%) |
| 35 to 64 Years | 46 (2.1%) | 10 (0.4%) |
| 65 to 74 Years | 24 (5.1%) | 35 (7.1%) |
| 75 Years and over | 30 (10.6%) | 52 (11.8%) |
Disability Class: Vision Difficulty
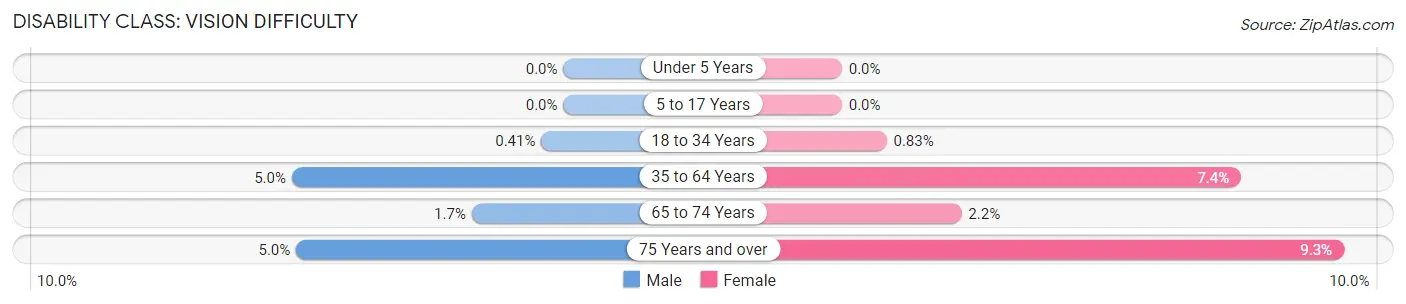
| Age Bracket | Male | Female |
| Under 5 Years | 0 (0.0%) | 0 (0.0%) |
| 5 to 17 Years | 0 (0.0%) | 0 (0.0%) |
| 18 to 34 Years | 5 (0.4%) | 9 (0.8%) |
| 35 to 64 Years | 111 (5.0%) | 165 (7.4%) |
| 65 to 74 Years | 8 (1.7%) | 11 (2.2%) |
| 75 Years and over | 14 (5.0%) | 41 (9.3%) |
Disability Class: Cognitive Difficulty
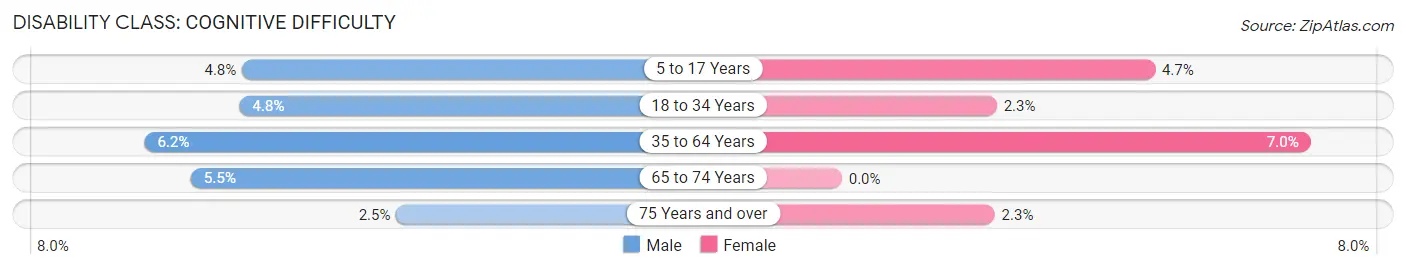
| Age Bracket | Male | Female |
| 5 to 17 Years | 49 (4.8%) | 41 (4.6%) |
| 18 to 34 Years | 59 (4.8%) | 25 (2.3%) |
| 35 to 64 Years | 137 (6.2%) | 155 (7.0%) |
| 65 to 74 Years | 26 (5.5%) | 0 (0.0%) |
| 75 Years and over | 7 (2.5%) | 10 (2.3%) |
Disability Class: Ambulatory Difficulty
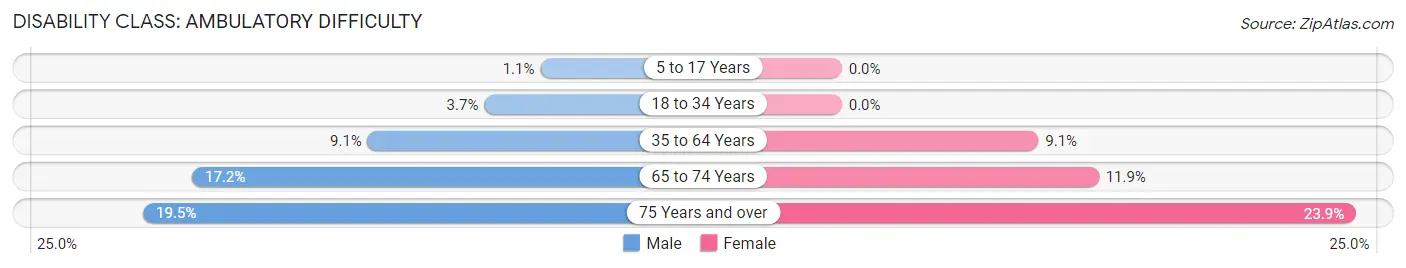
| Age Bracket | Male | Female |
| 5 to 17 Years | 11 (1.1%) | 0 (0.0%) |
| 18 to 34 Years | 45 (3.7%) | 0 (0.0%) |
| 35 to 64 Years | 200 (9.1%) | 203 (9.1%) |
| 65 to 74 Years | 81 (17.2%) | 59 (11.9%) |
| 75 Years and over | 55 (19.5%) | 105 (23.9%) |
Disability Class: Self-Care Difficulty
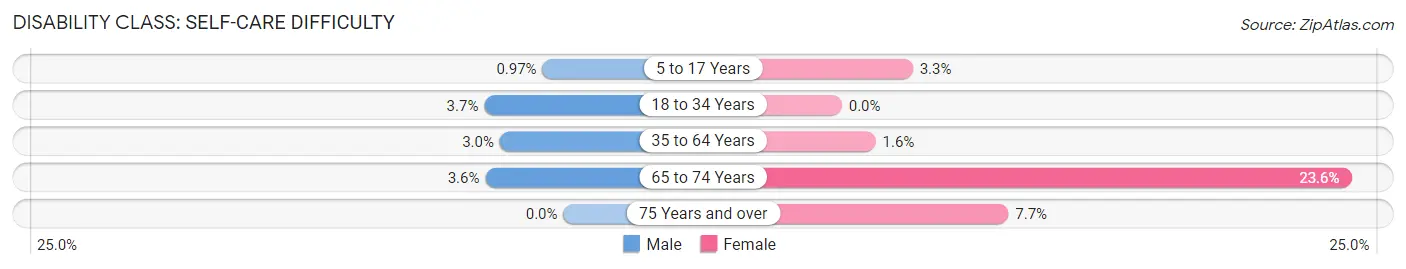
| Age Bracket | Male | Female |
| 5 to 17 Years | 10 (1.0%) | 29 (3.3%) |
| 18 to 34 Years | 45 (3.7%) | 0 (0.0%) |
| 35 to 64 Years | 65 (2.9%) | 35 (1.6%) |
| 65 to 74 Years | 17 (3.6%) | 117 (23.6%) |
| 75 Years and over | 0 (0.0%) | 34 (7.7%) |
Technology Access in Worth
Computing Device Access in Worth
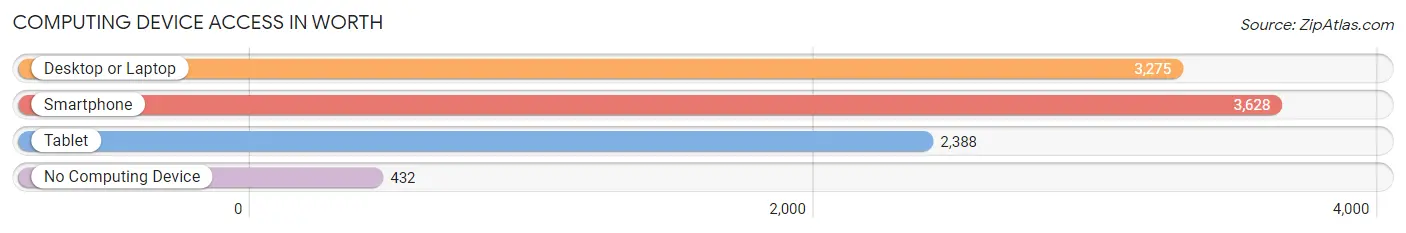
| Device Type | # Households | % Households |
| Desktop or Laptop | 3,275 | 75.1% |
| Smartphone | 3,628 | 83.2% |
| Tablet | 2,388 | 54.7% |
| No Computing Device | 432 | 9.9% |
| Total | 4,363 | 100.0% |
Internet Access in Worth
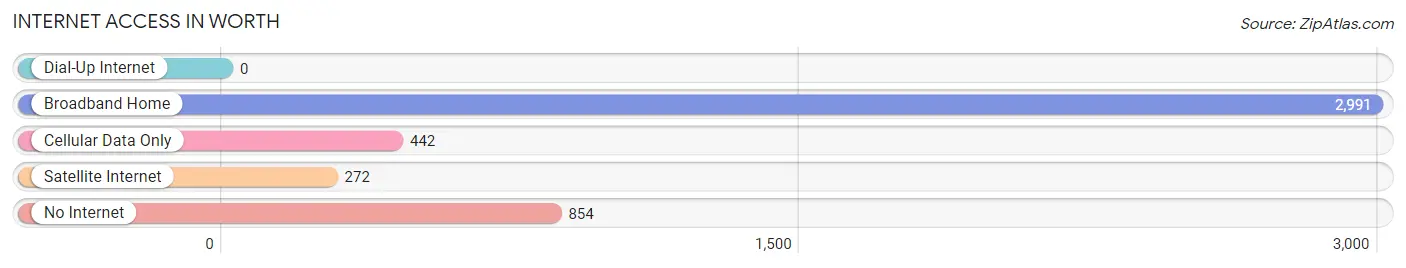
| Internet Type | # Households | % Households |
| Dial-Up Internet | 0 | 0.0% |
| Broadband Home | 2,991 | 68.5% |
| Cellular Data Only | 442 | 10.1% |
| Satellite Internet | 272 | 6.2% |
| No Internet | 854 | 19.6% |
| Total | 4,363 | 100.0% |
Worth Summary
Worth, Illinois is a village located in Cook County, Illinois, United States. It is a suburb of Chicago, located approximately 25 miles southwest of the city. The population of Worth was estimated to be 10,945 in 2019.
History
Worth was first settled in the early 1800s by German immigrants. The village was originally known as Worth Township, and was incorporated in 1892. The name of the village was derived from General William J. Worth, a hero of the War of 1812.
In the early 1900s, Worth was a farming community, with many of its residents employed in the agricultural industry. The village was also home to a number of small businesses, including a brickyard, a lumberyard, and a coal mine.
In the 1950s, Worth began to experience a population boom as many people moved to the village from Chicago. This influx of people led to the development of new housing and businesses, and the village began to grow rapidly.
Geography
Worth is located in Cook County, Illinois, approximately 25 miles southwest of Chicago. The village is situated on the Des Plaines River, and is bordered by the villages of Palos Heights, Palos Park, and Oak Lawn.
The village has a total area of 4.2 square miles, all of which is land. The terrain is mostly flat, with some rolling hills in the northern part of the village.
Economy
Worth is primarily a residential community, with many of its residents employed in the service and retail industries. The village is home to a number of small businesses, including restaurants, shops, and professional services.
The village is also home to a number of industrial and manufacturing businesses, including a steel mill, a printing company, and a plastics manufacturer.
Demographics
As of the 2019 census, the population of Worth was estimated to be 10,945. The racial makeup of the village was 79.3% White, 8.2% African American, 0.3% Native American, 5.2% Asian, and 6.9% from other races.
The median household income in Worth was $60,945 in 2019, and the median home value was $232,400. The village has a high rate of homeownership, with over 80% of residents owning their own homes.
Conclusion
Worth, Illinois is a village located in Cook County, Illinois, approximately 25 miles southwest of Chicago. The village has a population of 10,945, and is primarily a residential community. The village is home to a number of small businesses, and is also home to a number of industrial and manufacturing businesses. The median household income in Worth is $60,945, and the median home value is $232,400. Worth is a diverse community, with a population that is 79.3% White, 8.2% African American, 0.3% Native American, 5.2% Asian, and 6.9% from other races.
Common Questions
What is Per Capita Income in Worth?
Per Capita income in Worth is $31,036.
What is the Median Family Income in Worth?
Median Family Income in Worth is $72,411.
What is the Median Household income in Worth?
Median Household Income in Worth is $54,893.
What is Income or Wage Gap in Worth?
Income or Wage Gap in Worth is 36.6%.
Women in Worth earn 63.4 cents for every dollar earned by a man.
What is Family Income Deficit in Worth?
Family Income Deficit in Worth is $11,107.
Families that are below poverty line in Worth earn $11,107 less on average than the poverty threshold level.
What is Inequality or Gini Index in Worth?
Inequality or Gini Index in Worth is 0.44.
What is the Total Population of Worth?
Total Population of Worth is 10,859.
What is the Total Male Population of Worth?
Total Male Population of Worth is 5,432.
What is the Total Female Population of Worth?
Total Female Population of Worth is 5,427.
What is the Ratio of Males per 100 Females in Worth?
There are 100.09 Males per 100 Females in Worth.
What is the Ratio of Females per 100 Males in Worth?
There are 99.91 Females per 100 Males in Worth.
What is the Median Population Age in Worth?
Median Population Age in Worth is 39.1 Years.
What is the Average Family Size in Worth
Average Family Size in Worth is 3.1 People.
What is the Average Household Size in Worth
Average Household Size in Worth is 2.5 People.
How Large is the Labor Force in Worth?
There are 5,727 People in the Labor Forcein in Worth.
What is the Percentage of People in the Labor Force in Worth?
64.5% of People are in the Labor Force in Worth.
What is the Unemployment Rate in Worth?
Unemployment Rate in Worth is 10.8%.