Collinsville, IL Map & Demographics
Collinsville Map
Collinsville Overview
$39,666
PER CAPITA INCOME
$85,686
AVG FAMILY INCOME
$63,155
AVG HOUSEHOLD INCOME
33.8%
WAGE / INCOME GAP [ % ]
66.2¢/ $1
WAGE / INCOME GAP [ $ ]
$7,608
FAMILY INCOME DEFICIT
0.45
INEQUALITY / GINI INDEX
24,294
TOTAL POPULATION
11,898
MALE POPULATION
12,396
FEMALE POPULATION
95.98
MALES / 100 FEMALES
104.19
FEMALES / 100 MALES
39.9
MEDIAN AGE
2.9
AVG FAMILY SIZE
2.2
AVG HOUSEHOLD SIZE
13,709
LABOR FORCE [ PEOPLE ]
68.0%
PERCENT IN LABOR FORCE
4.6%
UNEMPLOYMENT RATE
Collinsville Zip Codes
Collinsville Area Codes
Income in Collinsville
Income Overview in Collinsville
Per Capita Income in Collinsville is $39,666, while median incomes of families and households are $85,686 and $63,155 respectively.
| Characteristic | Number | Measure |
| Per Capita Income | 24,294 | $39,666 |
| Median Family Income | 6,373 | $85,686 |
| Mean Family Income | 6,373 | $100,678 |
| Median Household Income | 11,089 | $63,155 |
| Mean Household Income | 11,089 | $86,160 |
| Income Deficit | 6,373 | $7,608 |
| Wage / Income Gap (%) | 24,294 | 33.81% |
| Wage / Income Gap ($) | 24,294 | 66.19¢ per $1 |
| Gini / Inequality Index | 24,294 | 0.45 |
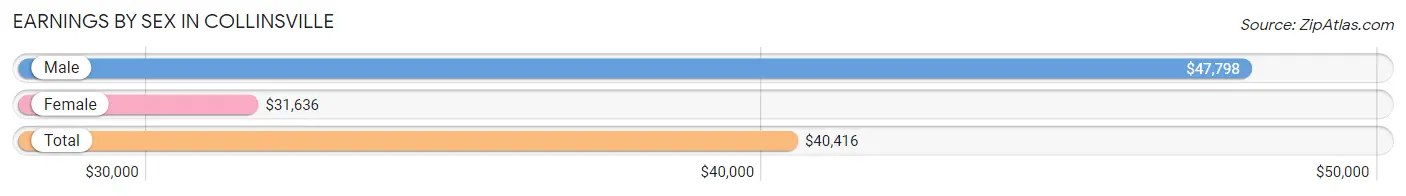
Earnings by Sex in Collinsville
Average Earnings in Collinsville are $40,416, $47,798 for men and $31,636 for women, a difference of 33.8%.
| Sex | Number | Average Earnings |
| Male | 7,386 (52.6%) | $47,798 |
| Female | 6,650 (47.4%) | $31,636 |
| Total | 14,036 (100.0%) | $40,416 |
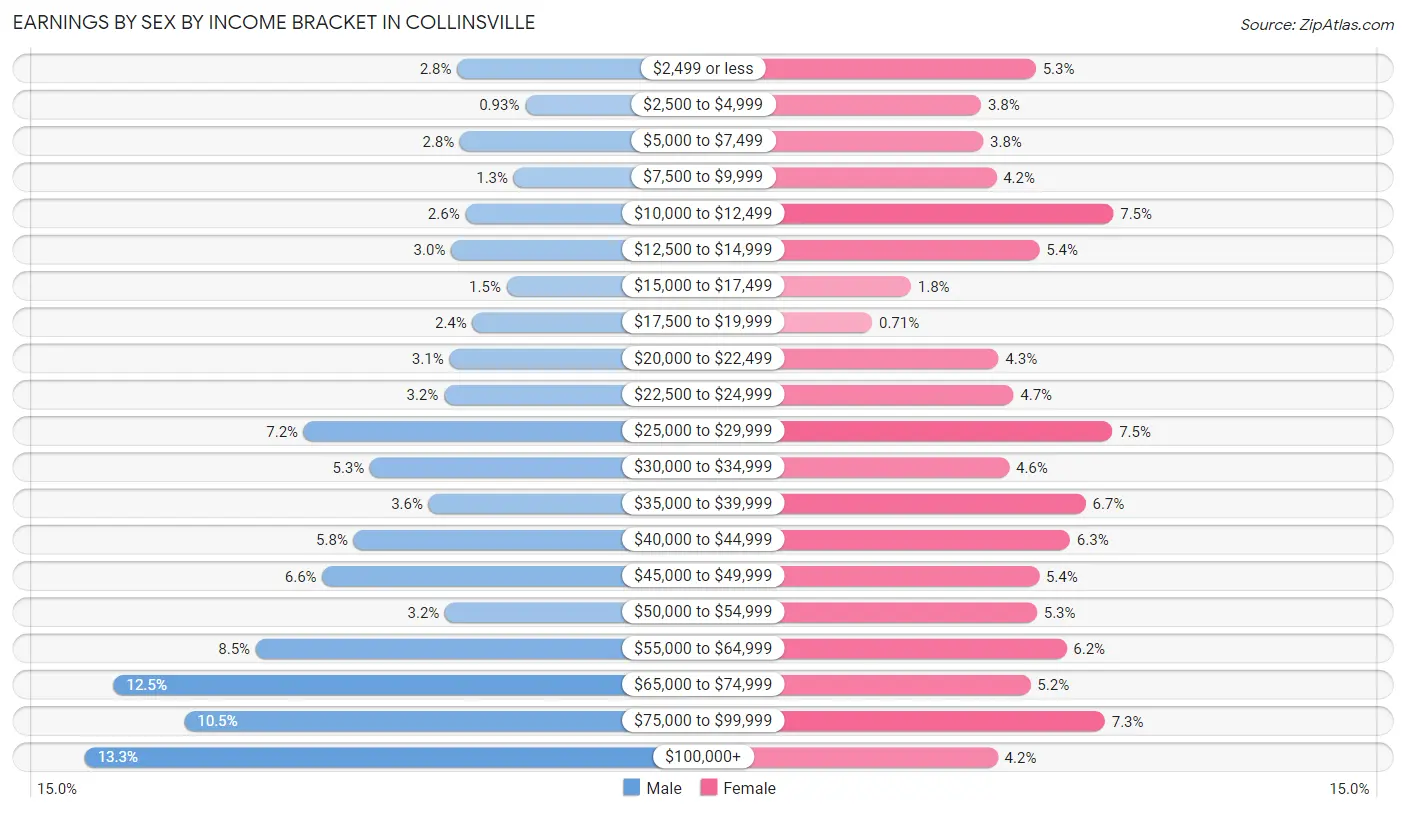
Earnings by Sex by Income Bracket in Collinsville
The most common earnings brackets in Collinsville are $100,000+ for men (983 | 13.3%) and $10,000 to $12,499 for women (498 | 7.5%).
| Income | Male | Female |
| $2,499 or less | 210 (2.8%) | 353 (5.3%) |
| $2,500 to $4,999 | 69 (0.9%) | 251 (3.8%) |
| $5,000 to $7,499 | 204 (2.8%) | 255 (3.8%) |
| $7,500 to $9,999 | 92 (1.3%) | 279 (4.2%) |
| $10,000 to $12,499 | 193 (2.6%) | 498 (7.5%) |
| $12,500 to $14,999 | 222 (3.0%) | 360 (5.4%) |
| $15,000 to $17,499 | 107 (1.5%) | 120 (1.8%) |
| $17,500 to $19,999 | 178 (2.4%) | 47 (0.7%) |
| $20,000 to $22,499 | 226 (3.1%) | 283 (4.3%) |
| $22,500 to $24,999 | 237 (3.2%) | 311 (4.7%) |
| $25,000 to $29,999 | 528 (7.1%) | 496 (7.5%) |
| $30,000 to $34,999 | 391 (5.3%) | 303 (4.6%) |
| $35,000 to $39,999 | 269 (3.6%) | 446 (6.7%) |
| $40,000 to $44,999 | 425 (5.8%) | 417 (6.3%) |
| $45,000 to $49,999 | 490 (6.6%) | 359 (5.4%) |
| $50,000 to $54,999 | 235 (3.2%) | 355 (5.3%) |
| $55,000 to $64,999 | 628 (8.5%) | 410 (6.2%) |
| $65,000 to $74,999 | 923 (12.5%) | 343 (5.2%) |
| $75,000 to $99,999 | 776 (10.5%) | 482 (7.2%) |
| $100,000+ | 983 (13.3%) | 282 (4.2%) |
| Total | 7,386 (100.0%) | 6,650 (100.0%) |
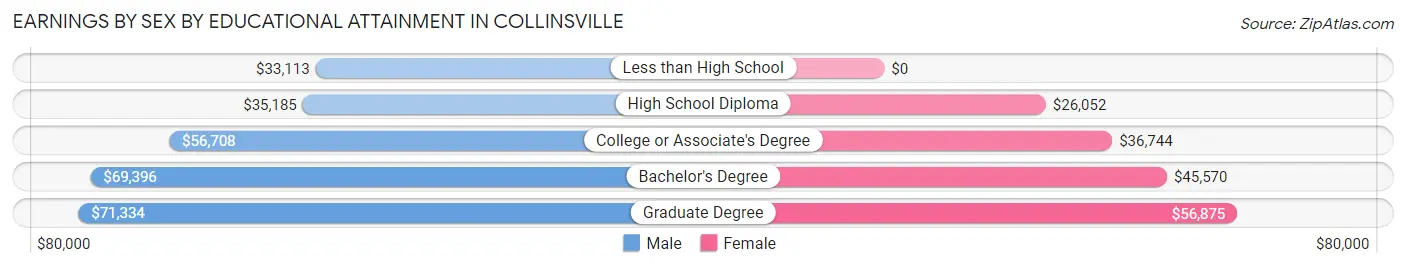
Earnings by Sex by Educational Attainment in Collinsville
Average earnings in Collinsville are $53,590 for men and $37,246 for women, a difference of 30.5%. Men with an educational attainment of graduate degree enjoy the highest average annual earnings of $71,334, while those with less than high school education earn the least with $33,113. Women with an educational attainment of graduate degree earn the most with the average annual earnings of $56,875, while those with high school diploma education have the smallest earnings of $26,052.
| Educational Attainment | Male Income | Female Income |
| Less than High School | $33,113 | $0 |
| High School Diploma | $35,185 | $26,052 |
| College or Associate's Degree | $56,708 | $36,744 |
| Bachelor's Degree | $69,396 | $45,570 |
| Graduate Degree | $71,334 | $56,875 |
| Total | $53,590 | $37,246 |
Family Income in Collinsville
Family Income Brackets in Collinsville
According to the Collinsville family income data, there are 1,466 families falling into the $100,000 to $149,999 income range, which is the most common income bracket and makes up 23.0% of all families. Conversely, the less than $10,000 income bracket is the least frequent group with only 89 families (1.4%) belonging to this category.
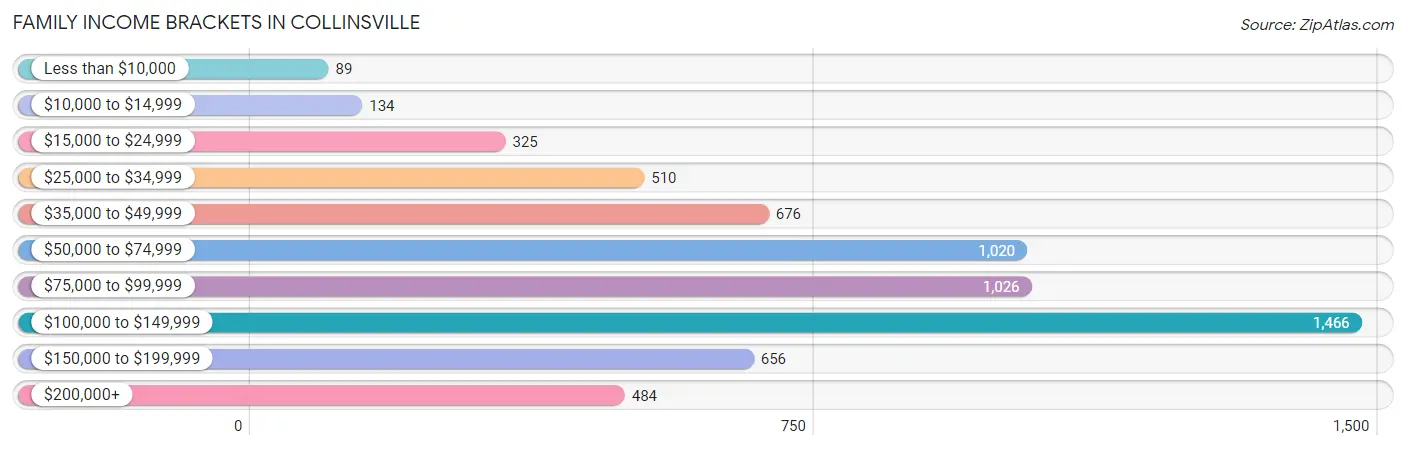
| Income Bracket | # Families | % Families |
| Less than $10,000 | 89 | 1.4% |
| $10,000 to $14,999 | 134 | 2.1% |
| $15,000 to $24,999 | 325 | 5.1% |
| $25,000 to $34,999 | 510 | 8.0% |
| $35,000 to $49,999 | 676 | 10.6% |
| $50,000 to $74,999 | 1,020 | 16.0% |
| $75,000 to $99,999 | 1,026 | 16.1% |
| $100,000 to $149,999 | 1,466 | 23.0% |
| $150,000 to $199,999 | 656 | 10.3% |
| $200,000+ | 484 | 7.6% |
Family Income by Famaliy Size in Collinsville
4-person families (903 | 14.2%) account for the highest median family income in Collinsville with $142,930 per family, while 2-person families (3,453 | 54.2%) have the highest median income of $38,165 per family member.
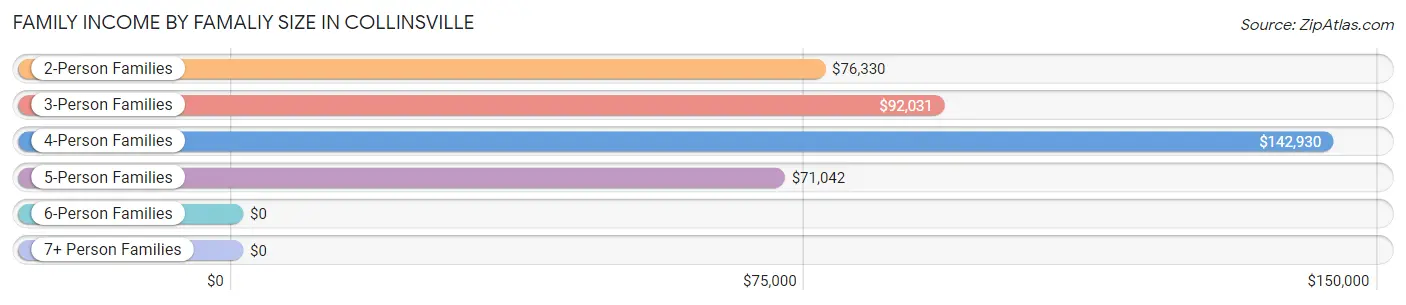
| Income Bracket | # Families | Median Income |
| 2-Person Families | 3,453 (54.2%) | $76,330 |
| 3-Person Families | 1,391 (21.8%) | $92,031 |
| 4-Person Families | 903 (14.2%) | $142,930 |
| 5-Person Families | 394 (6.2%) | $71,042 |
| 6-Person Families | 208 (3.3%) | $0 |
| 7+ Person Families | 24 (0.4%) | $0 |
| Total | 6,373 (100.0%) | $85,686 |
Family Income by Number of Earners in Collinsville
The median family income in Collinsville is $85,686, with families comprising 3+ earners (892) having the highest median family income of $147,606, while families with 1 earner (2,186) have the lowest median family income of $50,663, accounting for 14.0% and 34.3% of families, respectively.
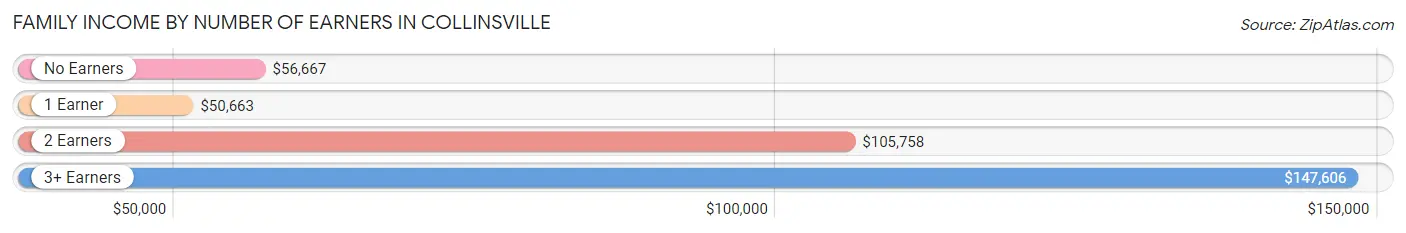
| Number of Earners | # Families | Median Income |
| No Earners | 1,052 (16.5%) | $56,667 |
| 1 Earner | 2,186 (34.3%) | $50,663 |
| 2 Earners | 2,243 (35.2%) | $105,758 |
| 3+ Earners | 892 (14.0%) | $147,606 |
| Total | 6,373 (100.0%) | $85,686 |
Household Income in Collinsville
Household Income Brackets in Collinsville
With 2,129 households falling in the category, the $50,000 to $74,999 income range is the most frequent in Collinsville, accounting for 19.2% of all households. In contrast, only 344 households (3.1%) fall into the $10,000 to $14,999 income bracket, making it the least populous group.
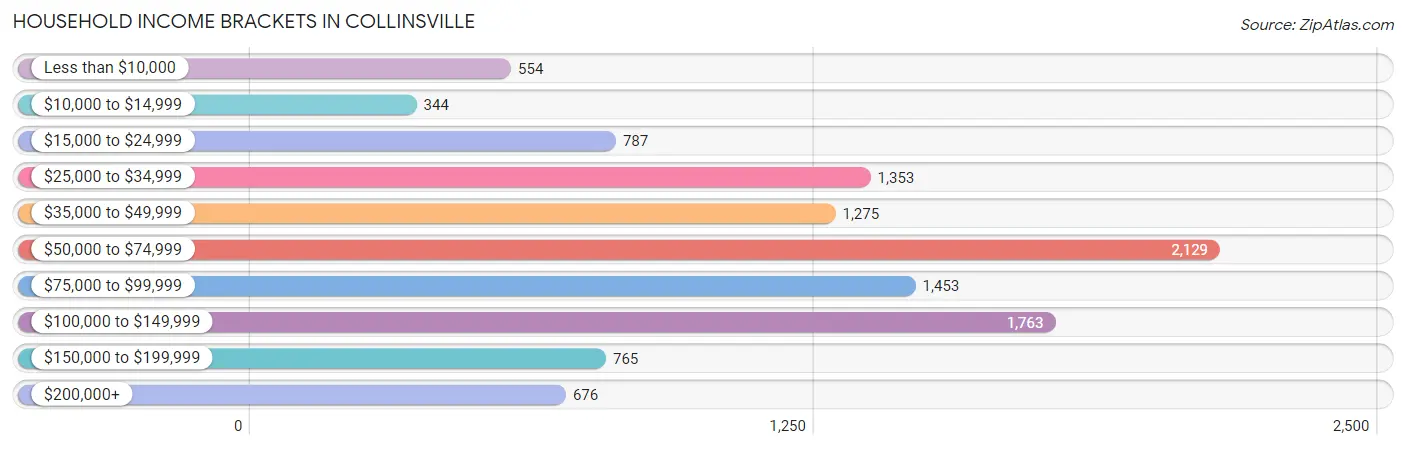
| Income Bracket | # Households | % Households |
| Less than $10,000 | 554 | 5.0% |
| $10,000 to $14,999 | 344 | 3.1% |
| $15,000 to $24,999 | 787 | 7.1% |
| $25,000 to $34,999 | 1,353 | 12.2% |
| $35,000 to $49,999 | 1,275 | 11.5% |
| $50,000 to $74,999 | 2,129 | 19.2% |
| $75,000 to $99,999 | 1,453 | 13.1% |
| $100,000 to $149,999 | 1,763 | 15.9% |
| $150,000 to $199,999 | 765 | 6.9% |
| $200,000+ | 676 | 6.1% |
Household Income by Householder Age in Collinsville
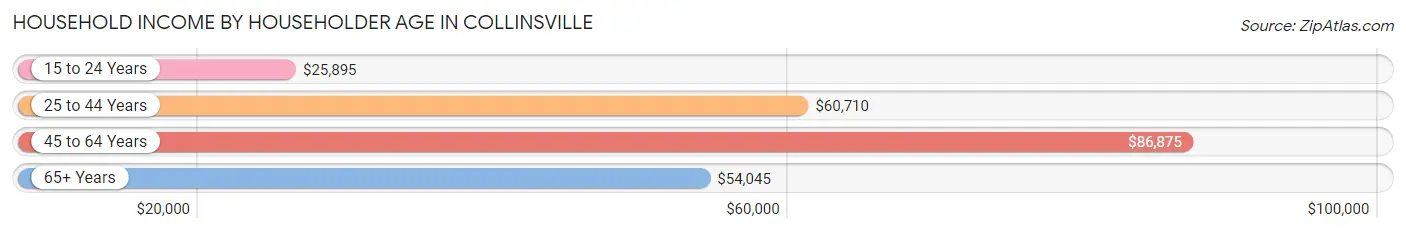
The median household income in Collinsville is $63,155, with the highest median household income of $86,875 found in the 45 to 64 years age bracket for the primary householder. A total of 3,453 households (31.1%) fall into this category. Meanwhile, the 15 to 24 years age bracket for the primary householder has the lowest median household income of $25,895, with 371 households (3.4%) in this group.
| Income Bracket | # Households | Median Income |
| 15 to 24 Years | 371 (3.4%) | $25,895 |
| 25 to 44 Years | 4,268 (38.5%) | $60,710 |
| 45 to 64 Years | 3,453 (31.1%) | $86,875 |
| 65+ Years | 2,997 (27.0%) | $54,045 |
| Total | 11,089 (100.0%) | $63,155 |
Poverty in Collinsville
Income Below Poverty by Sex and Age in Collinsville
With 11.7% poverty level for males and 14.2% for females among the residents of Collinsville, under 5 year old males and 6 to 11 year old females are the most vulnerable to poverty, with 269 males (45.4%) and 259 females (36.3%) in their respective age groups living below the poverty level.
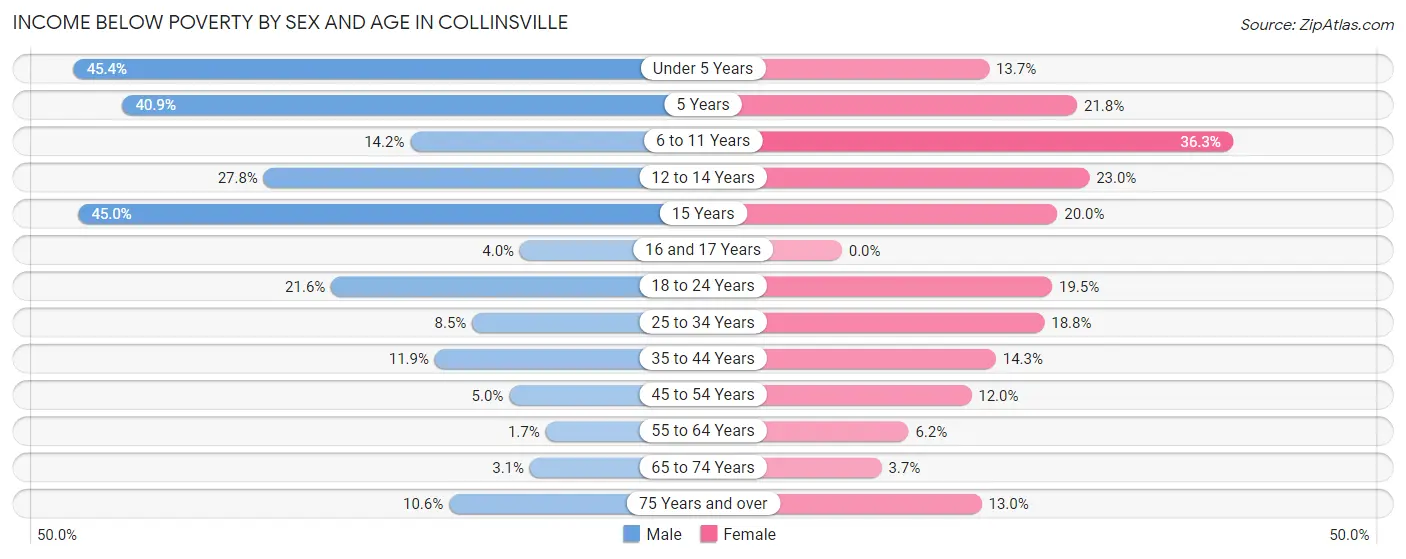
| Age Bracket | Male | Female |
| Under 5 Years | 269 (45.4%) | 87 (13.7%) |
| 5 Years | 45 (40.9%) | 31 (21.8%) |
| 6 to 11 Years | 106 (14.2%) | 259 (36.3%) |
| 12 to 14 Years | 151 (27.8%) | 87 (23.0%) |
| 15 Years | 27 (45.0%) | 34 (20.0%) |
| 16 and 17 Years | 10 (4.0%) | 0 (0.0%) |
| 18 to 24 Years | 183 (21.5%) | 198 (19.5%) |
| 25 to 34 Years | 152 (8.5%) | 310 (18.8%) |
| 35 to 44 Years | 242 (11.9%) | 272 (14.3%) |
| 45 to 54 Years | 77 (5.0%) | 184 (12.0%) |
| 55 to 64 Years | 25 (1.7%) | 92 (6.2%) |
| 65 to 74 Years | 39 (3.1%) | 50 (3.7%) |
| 75 Years and over | 59 (10.6%) | 147 (13.0%) |
| Total | 1,385 (11.7%) | 1,751 (14.2%) |
Income Above Poverty by Sex and Age in Collinsville
According to the poverty statistics in Collinsville, males aged 55 to 64 years and females aged 16 and 17 years are the age groups that are most secure financially, with 98.4% of males and 100.0% of females in these age groups living above the poverty line.

| Age Bracket | Male | Female |
| Under 5 Years | 323 (54.6%) | 550 (86.3%) |
| 5 Years | 65 (59.1%) | 111 (78.2%) |
| 6 to 11 Years | 640 (85.8%) | 455 (63.7%) |
| 12 to 14 Years | 392 (72.2%) | 292 (77.0%) |
| 15 Years | 33 (55.0%) | 136 (80.0%) |
| 16 and 17 Years | 238 (96.0%) | 249 (100.0%) |
| 18 to 24 Years | 666 (78.4%) | 817 (80.5%) |
| 25 to 34 Years | 1,645 (91.5%) | 1,340 (81.2%) |
| 35 to 44 Years | 1,786 (88.1%) | 1,632 (85.7%) |
| 45 to 54 Years | 1,455 (95.0%) | 1,347 (88.0%) |
| 55 to 64 Years | 1,489 (98.4%) | 1,395 (93.8%) |
| 65 to 74 Years | 1,214 (96.9%) | 1,307 (96.3%) |
| 75 Years and over | 497 (89.4%) | 986 (87.0%) |
| Total | 10,443 (88.3%) | 10,617 (85.8%) |
Income Below Poverty Among Married-Couple Families in Collinsville
The poverty statistics for married-couple families in Collinsville show that 5.1% or 238 of the total 4,623 families live below the poverty line. Families with 3 or 4 children have the highest poverty rate of 25.5%, comprising of 106 families. On the other hand, families with 5 or more children have the lowest poverty rate of 0.0%, which includes 0 families.
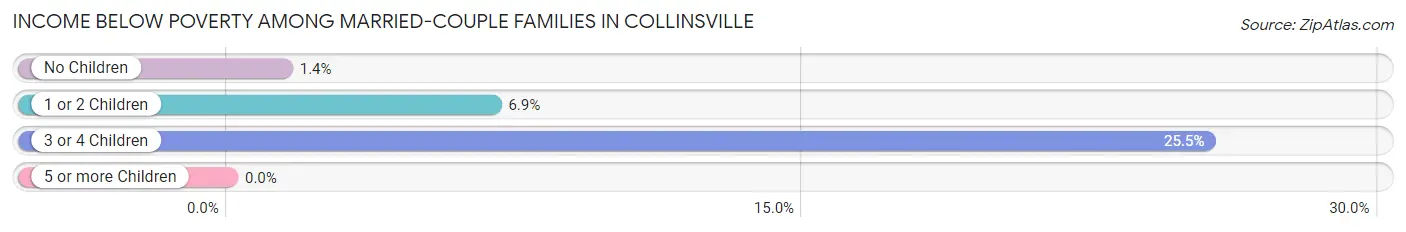
| Children | Above Poverty | Below Poverty |
| No Children | 2,826 (98.6%) | 41 (1.4%) |
| 1 or 2 Children | 1,231 (93.1%) | 91 (6.9%) |
| 3 or 4 Children | 309 (74.5%) | 106 (25.5%) |
| 5 or more Children | 19 (100.0%) | 0 (0.0%) |
| Total | 4,385 (94.9%) | 238 (5.1%) |
Income Below Poverty Among Single-Parent Households in Collinsville
According to the poverty data in Collinsville, 24.2% or 118 single-father households and 19.3% or 244 single-mother households are living below the poverty line. Among single-father households, those with 3 or 4 children have the highest poverty rate, with 30 households (100.0%) experiencing poverty. Likewise, among single-mother households, those with 5 or more children have the highest poverty rate, with 13 households (100.0%) falling below the poverty line.
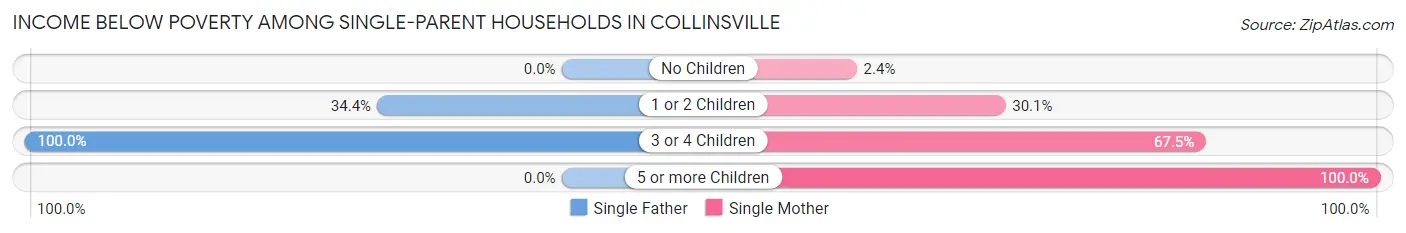
| Children | Single Father | Single Mother |
| No Children | 0 (0.0%) | 14 (2.4%) |
| 1 or 2 Children | 88 (34.4%) | 190 (30.1%) |
| 3 or 4 Children | 30 (100.0%) | 27 (67.5%) |
| 5 or more Children | 0 (0.0%) | 13 (100.0%) |
| Total | 118 (24.2%) | 244 (19.3%) |
Income Below Poverty Among Married-Couple vs Single-Parent Households in Collinsville
The poverty data for Collinsville shows that 238 of the married-couple family households (5.1%) and 362 of the single-parent households (20.7%) are living below the poverty level. Within the married-couple family households, those with 3 or 4 children have the highest poverty rate, with 106 households (25.5%) falling below the poverty line. Among the single-parent households, those with 5 or more children have the highest poverty rate, with 13 household (100.0%) living below poverty.
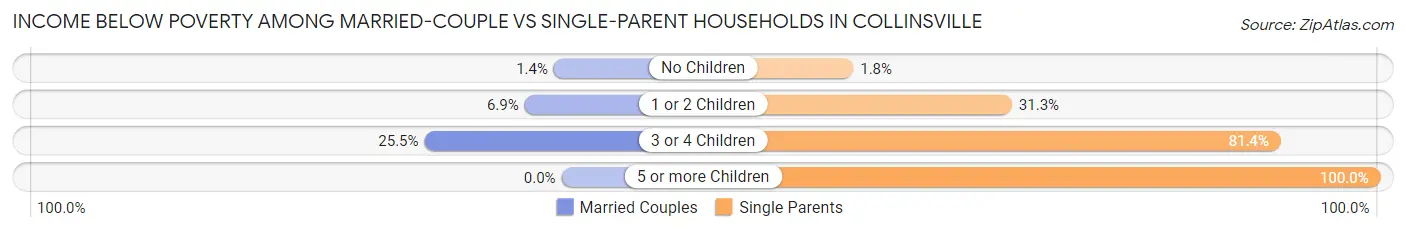
| Children | Married-Couple Families | Single-Parent Households |
| No Children | 41 (1.4%) | 14 (1.8%) |
| 1 or 2 Children | 91 (6.9%) | 278 (31.3%) |
| 3 or 4 Children | 106 (25.5%) | 57 (81.4%) |
| 5 or more Children | 0 (0.0%) | 13 (100.0%) |
| Total | 238 (5.1%) | 362 (20.7%) |
Race in Collinsville
The most populous races in Collinsville are White / Caucasian (18,377 | 75.6%), Black / African American (3,811 | 15.7%), and Hispanic or Latino (1,748 | 7.2%).
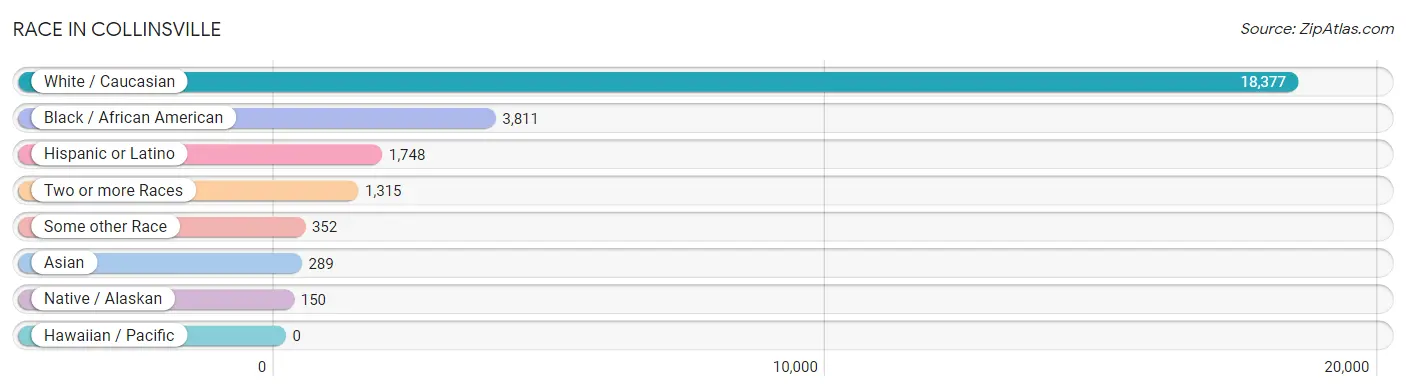
| Race | # Population | % Population |
| Asian | 289 | 1.2% |
| Black / African American | 3,811 | 15.7% |
| Hawaiian / Pacific | 0 | 0.0% |
| Hispanic or Latino | 1,748 | 7.2% |
| Native / Alaskan | 150 | 0.6% |
| White / Caucasian | 18,377 | 75.6% |
| Two or more Races | 1,315 | 5.4% |
| Some other Race | 352 | 1.5% |
| Total | 24,294 | 100.0% |
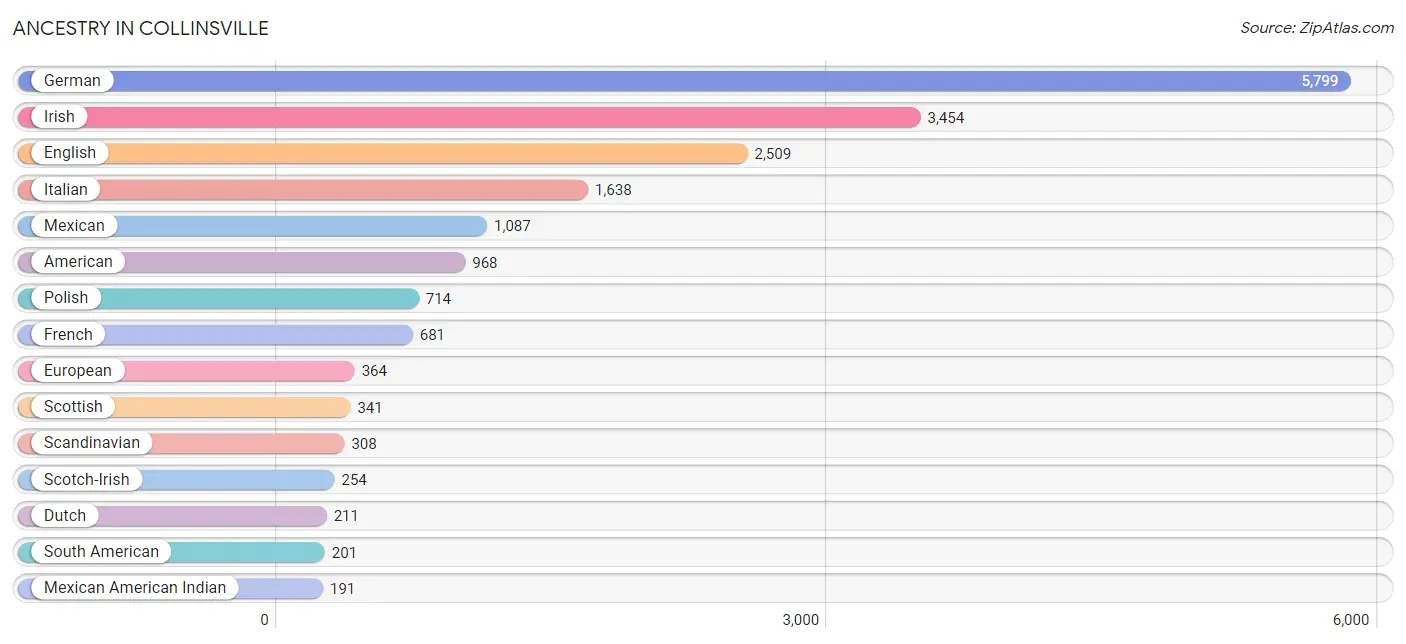
Ancestry in Collinsville
The most populous ancestries reported in Collinsville are German (5,799 | 23.9%), Irish (3,454 | 14.2%), English (2,509 | 10.3%), Italian (1,638 | 6.7%), and Mexican (1,087 | 4.5%), together accounting for 59.6% of all Collinsville residents.
| Ancestry | # Population | % Population |
| African | 88 | 0.4% |
| American | 968 | 4.0% |
| Arab | 7 | 0.0% |
| Austrian | 61 | 0.3% |
| Belgian | 11 | 0.1% |
| Bhutanese | 1 | 0.0% |
| Blackfeet | 18 | 0.1% |
| Bolivian | 69 | 0.3% |
| British | 103 | 0.4% |
| Bulgarian | 33 | 0.1% |
| Burmese | 97 | 0.4% |
| Canadian | 26 | 0.1% |
| Central American | 182 | 0.7% |
| Cherokee | 41 | 0.2% |
| Choctaw | 12 | 0.1% |
| Colombian | 12 | 0.1% |
| Croatian | 109 | 0.4% |
| Czech | 132 | 0.5% |
| Czechoslovakian | 127 | 0.5% |
| Danish | 27 | 0.1% |
| Dutch | 211 | 0.9% |
| Eastern European | 60 | 0.3% |
| Ecuadorian | 120 | 0.5% |
| English | 2,509 | 10.3% |
| European | 364 | 1.5% |
| Finnish | 11 | 0.1% |
| French | 681 | 2.8% |
| French Canadian | 86 | 0.4% |
| German | 5,799 | 23.9% |
| German Russian | 13 | 0.1% |
| Ghanaian | 64 | 0.3% |
| Greek | 7 | 0.0% |
| Guatemalan | 97 | 0.4% |
| Honduran | 30 | 0.1% |
| Hungarian | 94 | 0.4% |
| Iranian | 23 | 0.1% |
| Irish | 3,454 | 14.2% |
| Italian | 1,638 | 6.7% |
| Jamaican | 31 | 0.1% |
| Korean | 44 | 0.2% |
| Lebanese | 7 | 0.0% |
| Lithuanian | 138 | 0.6% |
| Mexican | 1,087 | 4.5% |
| Mexican American Indian | 191 | 0.8% |
| Norwegian | 124 | 0.5% |
| Pakistani | 30 | 0.1% |
| Panamanian | 55 | 0.2% |
| Polish | 714 | 2.9% |
| Portuguese | 59 | 0.2% |
| Puerto Rican | 74 | 0.3% |
| Romanian | 66 | 0.3% |
| Russian | 27 | 0.1% |
| Scandinavian | 308 | 1.3% |
| Scotch-Irish | 254 | 1.1% |
| Scottish | 341 | 1.4% |
| Slovene | 10 | 0.0% |
| South American | 201 | 0.8% |
| Spaniard | 104 | 0.4% |
| Spanish | 8 | 0.0% |
| Subsaharan African | 162 | 0.7% |
| Swedish | 66 | 0.3% |
| Swiss | 94 | 0.4% |
| Thai | 181 | 0.7% |
| Welsh | 102 | 0.4% |
| West Indian | 20 | 0.1% |
| Yugoslavian | 13 | 0.1% | View All 66 Rows |
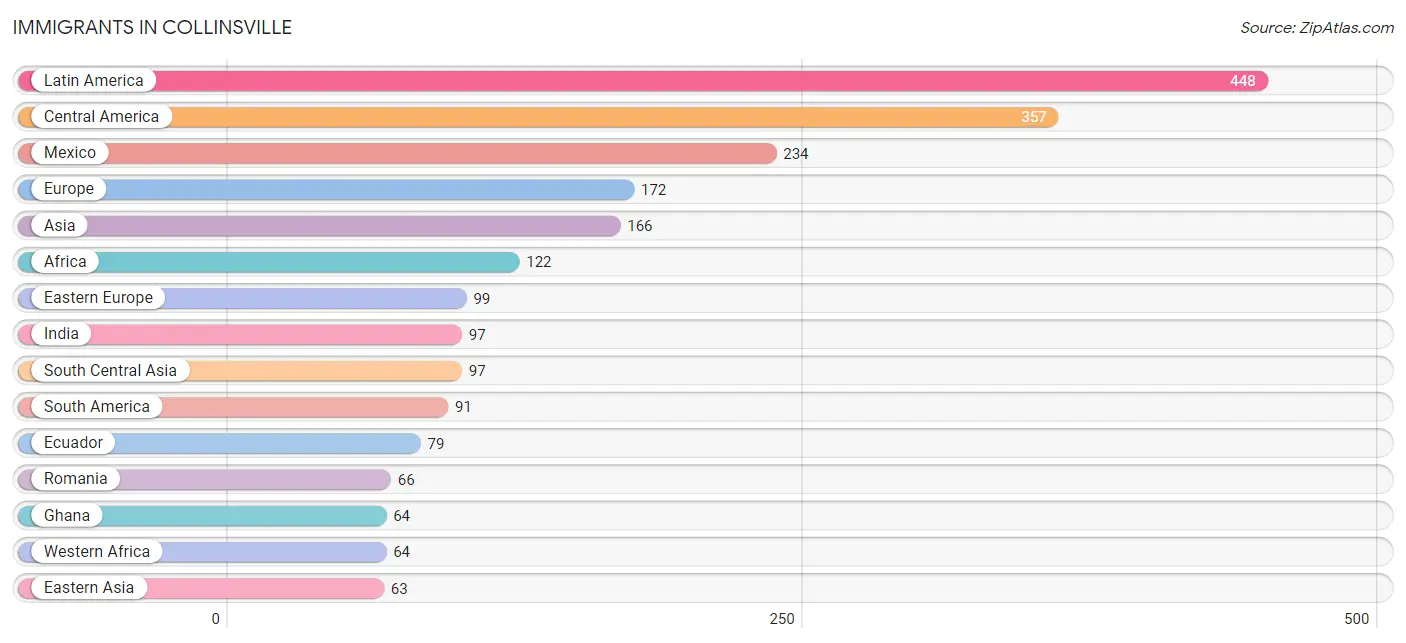
Immigrants in Collinsville
The most numerous immigrant groups reported in Collinsville came from Latin America (448 | 1.8%), Central America (357 | 1.5%), Mexico (234 | 1.0%), Europe (172 | 0.7%), and Asia (166 | 0.7%), together accounting for 5.7% of all Collinsville residents.
| Immigration Origin | # Population | % Population |
| Africa | 122 | 0.5% |
| Asia | 166 | 0.7% |
| Bulgaria | 33 | 0.1% |
| Canada | 10 | 0.0% |
| Central America | 357 | 1.5% |
| Colombia | 12 | 0.1% |
| Eastern Africa | 58 | 0.2% |
| Eastern Asia | 63 | 0.3% |
| Eastern Europe | 99 | 0.4% |
| Ecuador | 79 | 0.3% |
| England | 11 | 0.1% |
| Ethiopia | 35 | 0.1% |
| Europe | 172 | 0.7% |
| Germany | 32 | 0.1% |
| Ghana | 64 | 0.3% |
| Guatemala | 62 | 0.3% |
| Honduras | 30 | 0.1% |
| India | 97 | 0.4% |
| Japan | 1 | 0.0% |
| Korea | 62 | 0.3% |
| Latin America | 448 | 1.8% |
| Mexico | 234 | 1.0% |
| Northern Europe | 11 | 0.1% |
| Panama | 31 | 0.1% |
| Philippines | 6 | 0.0% |
| Portugal | 30 | 0.1% |
| Romania | 66 | 0.3% |
| South America | 91 | 0.4% |
| South Central Asia | 97 | 0.4% |
| South Eastern Asia | 6 | 0.0% |
| Southern Europe | 30 | 0.1% |
| Western Africa | 64 | 0.3% |
| Western Europe | 32 | 0.1% | View All 33 Rows |
Sex and Age in Collinsville
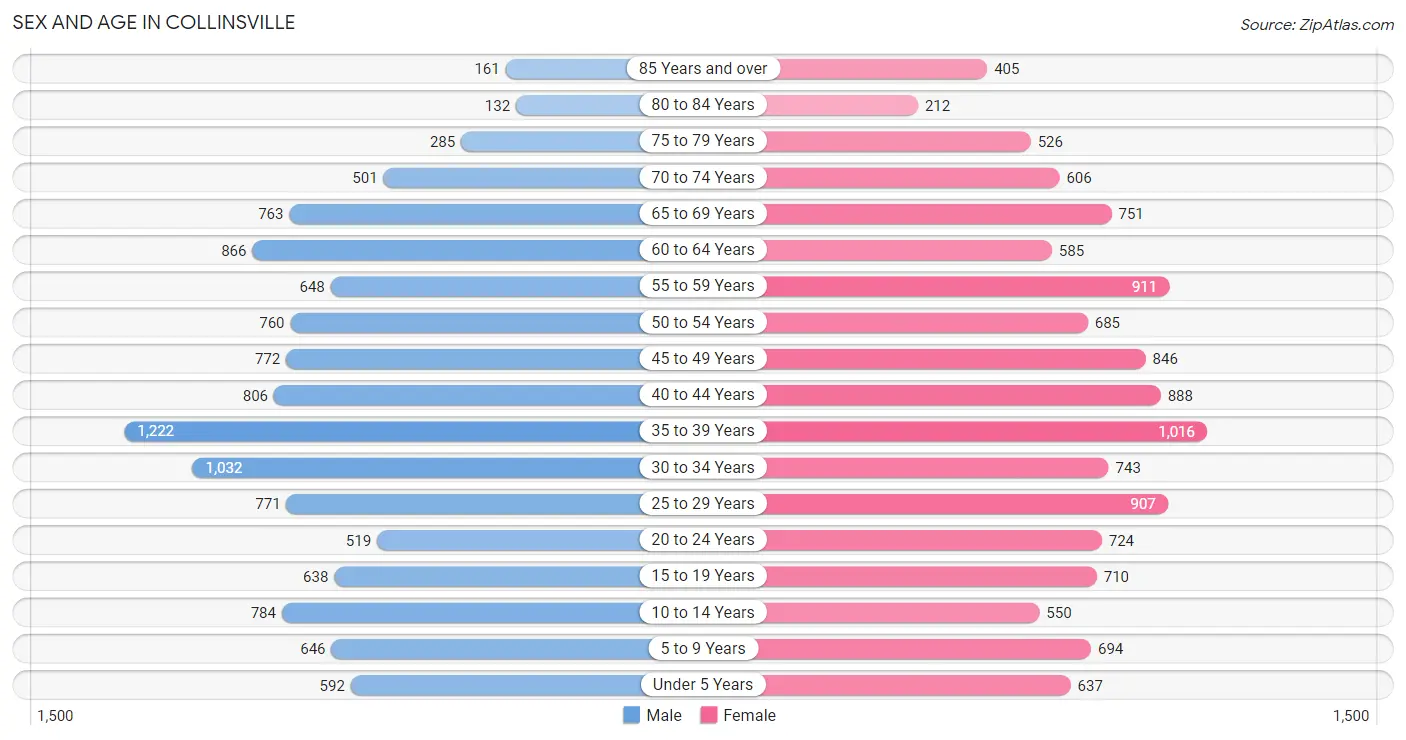
Sex and Age in Collinsville
The most populous age groups in Collinsville are 35 to 39 Years (1,222 | 10.3%) for men and 35 to 39 Years (1,016 | 8.2%) for women.
| Age Bracket | Male | Female |
| Under 5 Years | 592 (5.0%) | 637 (5.1%) |
| 5 to 9 Years | 646 (5.4%) | 694 (5.6%) |
| 10 to 14 Years | 784 (6.6%) | 550 (4.4%) |
| 15 to 19 Years | 638 (5.4%) | 710 (5.7%) |
| 20 to 24 Years | 519 (4.4%) | 724 (5.8%) |
| 25 to 29 Years | 771 (6.5%) | 907 (7.3%) |
| 30 to 34 Years | 1,032 (8.7%) | 743 (6.0%) |
| 35 to 39 Years | 1,222 (10.3%) | 1,016 (8.2%) |
| 40 to 44 Years | 806 (6.8%) | 888 (7.2%) |
| 45 to 49 Years | 772 (6.5%) | 846 (6.8%) |
| 50 to 54 Years | 760 (6.4%) | 685 (5.5%) |
| 55 to 59 Years | 648 (5.4%) | 911 (7.3%) |
| 60 to 64 Years | 866 (7.3%) | 585 (4.7%) |
| 65 to 69 Years | 763 (6.4%) | 751 (6.1%) |
| 70 to 74 Years | 501 (4.2%) | 606 (4.9%) |
| 75 to 79 Years | 285 (2.4%) | 526 (4.2%) |
| 80 to 84 Years | 132 (1.1%) | 212 (1.7%) |
| 85 Years and over | 161 (1.3%) | 405 (3.3%) |
| Total | 11,898 (100.0%) | 12,396 (100.0%) |
Families and Households in Collinsville
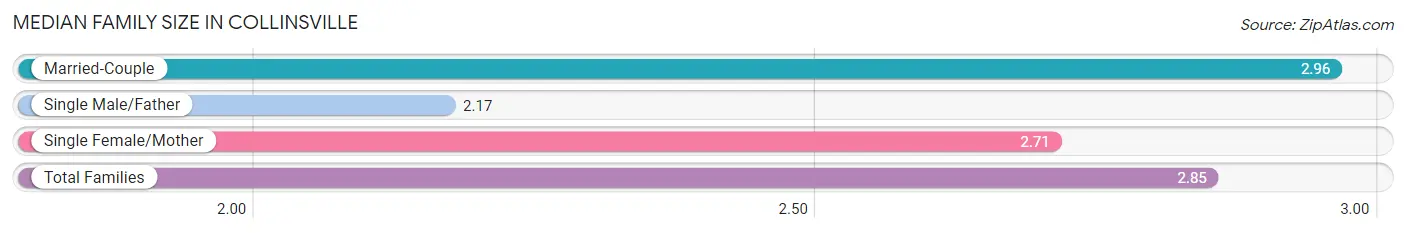
Median Family Size in Collinsville
The median family size in Collinsville is 2.85 persons per family, with married-couple families (4,623 | 72.5%) accounting for the largest median family size of 2.96 persons per family. On the other hand, single male/father families (487 | 7.6%) represent the smallest median family size with 2.17 persons per family.
| Family Type | # Families | Family Size |
| Married-Couple | 4,623 (72.5%) | 2.96 |
| Single Male/Father | 487 (7.6%) | 2.17 |
| Single Female/Mother | 1,263 (19.8%) | 2.71 |
| Total Families | 6,373 (100.0%) | 2.85 |
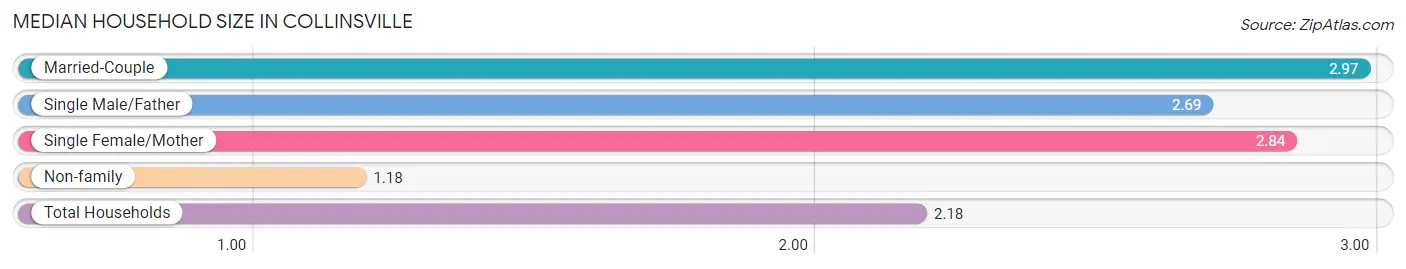
Median Household Size in Collinsville
The median household size in Collinsville is 2.18 persons per household, with married-couple households (4,623 | 41.7%) accounting for the largest median household size of 2.97 persons per household. non-family households (4,716 | 42.5%) represent the smallest median household size with 1.18 persons per household.
| Household Type | # Households | Household Size |
| Married-Couple | 4,623 (41.7%) | 2.97 |
| Single Male/Father | 487 (4.4%) | 2.69 |
| Single Female/Mother | 1,263 (11.4%) | 2.84 |
| Non-family | 4,716 (42.5%) | 1.18 |
| Total Households | 11,089 (100.0%) | 2.18 |
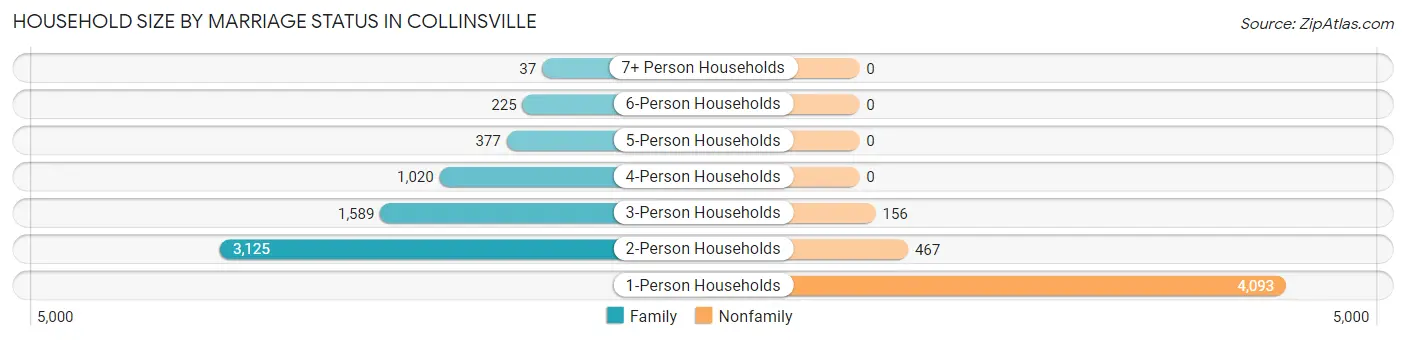
Household Size by Marriage Status in Collinsville
Out of a total of 11,089 households in Collinsville, 6,373 (57.5%) are family households, while 4,716 (42.5%) are nonfamily households. The most numerous type of family households are 2-person households, comprising 3,125, and the most common type of nonfamily households are 1-person households, comprising 4,093.
| Household Size | Family Households | Nonfamily Households |
| 1-Person Households | - | 4,093 (36.9%) |
| 2-Person Households | 3,125 (28.2%) | 467 (4.2%) |
| 3-Person Households | 1,589 (14.3%) | 156 (1.4%) |
| 4-Person Households | 1,020 (9.2%) | 0 (0.0%) |
| 5-Person Households | 377 (3.4%) | 0 (0.0%) |
| 6-Person Households | 225 (2.0%) | 0 (0.0%) |
| 7+ Person Households | 37 (0.3%) | 0 (0.0%) |
| Total | 6,373 (57.5%) | 4,716 (42.5%) |
Female Fertility in Collinsville
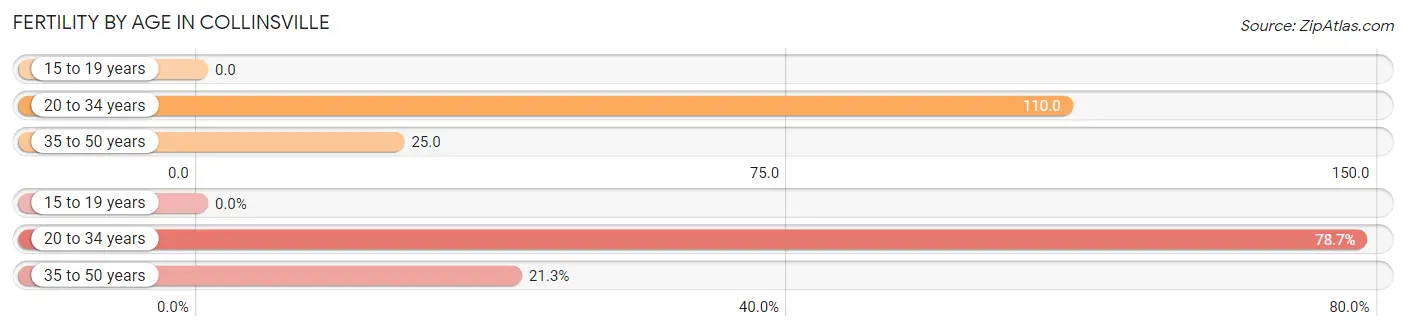
Fertility by Age in Collinsville
Average fertility rate in Collinsville is 56.0 births per 1,000 women. Women in the age bracket of 20 to 34 years have the highest fertility rate with 110.0 births per 1,000 women. Women in the age bracket of 20 to 34 years acount for 78.7% of all women with births.
| Age Bracket | Women with Births | Births / 1,000 Women |
| 15 to 19 years | 0 (0.0%) | 0.0 |
| 20 to 34 years | 262 (78.7%) | 110.0 |
| 35 to 50 years | 71 (21.3%) | 25.0 |
| Total | 333 (100.0%) | 56.0 |
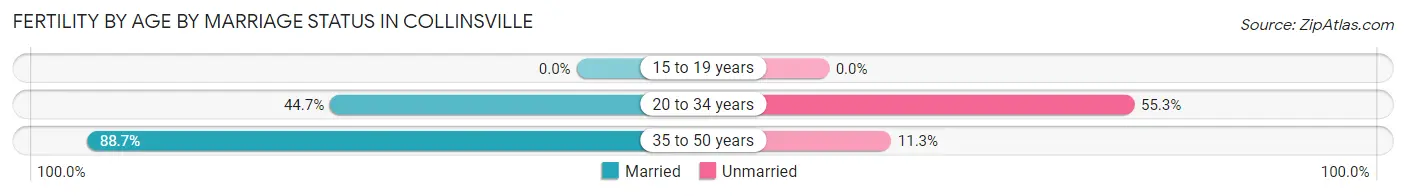
Fertility by Age by Marriage Status in Collinsville
54.1% of women with births (333) in Collinsville are married. The highest percentage of unmarried women with births falls into 20 to 34 years age bracket with 55.3% of them unmarried at the time of birth, while the lowest percentage of unmarried women with births belong to 35 to 50 years age bracket with 11.3% of them unmarried.
| Age Bracket | Married | Unmarried |
| 15 to 19 years | 0 (0.0%) | 0 (0.0%) |
| 20 to 34 years | 117 (44.7%) | 145 (55.3%) |
| 35 to 50 years | 63 (88.7%) | 8 (11.3%) |
| Total | 180 (54.0%) | 153 (46.0%) |
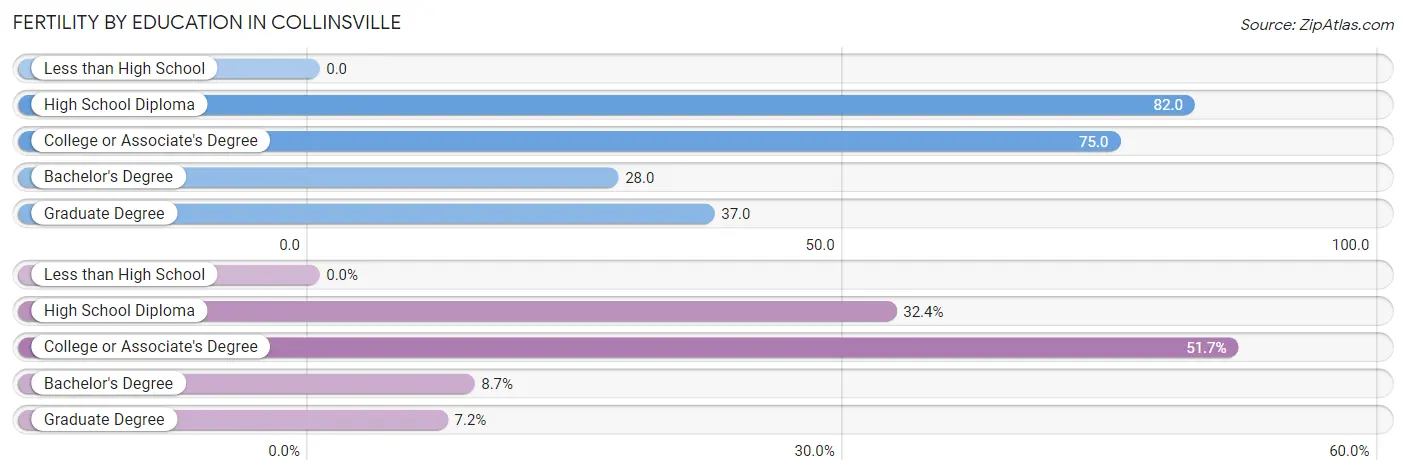
Fertility by Education in Collinsville
| Educational Attainment | Women with Births | Births / 1,000 Women |
| Less than High School | 0 (0.0%) | 0.0 |
| High School Diploma | 108 (32.4%) | 82.0 |
| College or Associate's Degree | 172 (51.6%) | 75.0 |
| Bachelor's Degree | 29 (8.7%) | 28.0 |
| Graduate Degree | 24 (7.2%) | 37.0 |
| Total | 333 (100.0%) | 56.0 |
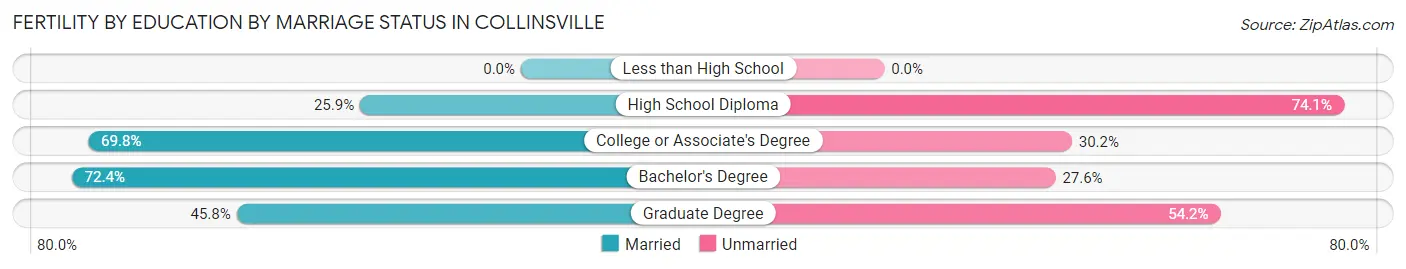
Fertility by Education by Marriage Status in Collinsville
46.0% of women with births in Collinsville are unmarried. Women with the educational attainment of bachelor's degree are most likely to be married with 72.4% of them married at childbirth, while women with the educational attainment of high school diploma are least likely to be married with 74.1% of them unmarried at childbirth.
| Educational Attainment | Married | Unmarried |
| Less than High School | 0 (0.0%) | 0 (0.0%) |
| High School Diploma | 28 (25.9%) | 80 (74.1%) |
| College or Associate's Degree | 120 (69.8%) | 52 (30.2%) |
| Bachelor's Degree | 21 (72.4%) | 8 (27.6%) |
| Graduate Degree | 11 (45.8%) | 13 (54.2%) |
| Total | 180 (54.0%) | 153 (46.0%) |
Employment Characteristics in Collinsville
Employment by Class of Employer in Collinsville
Among the 12,840 employed individuals in Collinsville, private company employees (9,075 | 70.7%), not-for-profit organizations (1,088 | 8.5%), and local government employees (864 | 6.7%) make up the most common classes of employment.
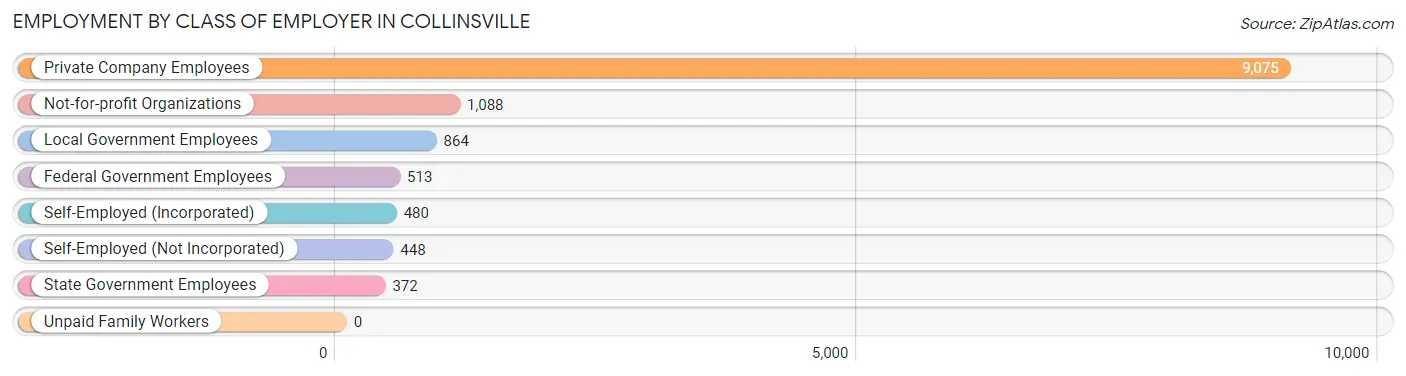
| Employer Class | # Employees | % Employees |
| Private Company Employees | 9,075 | 70.7% |
| Self-Employed (Incorporated) | 480 | 3.7% |
| Self-Employed (Not Incorporated) | 448 | 3.5% |
| Not-for-profit Organizations | 1,088 | 8.5% |
| Local Government Employees | 864 | 6.7% |
| State Government Employees | 372 | 2.9% |
| Federal Government Employees | 513 | 4.0% |
| Unpaid Family Workers | 0 | 0.0% |
| Total | 12,840 | 100.0% |
Employment Status by Age in Collinsville
According to the labor force statistics for Collinsville, out of the total population over 16 years of age (20,161), 68.0% or 13,709 individuals are in the labor force, with 4.6% or 631 of them unemployed. The age group with the highest labor force participation rate is 45 to 54 years, with 89.6% or 2,744 individuals in the labor force. Within the labor force, the 75 years and over age range has the highest percentage of unemployed individuals, with 15.3% or 11 of them being unemployed.
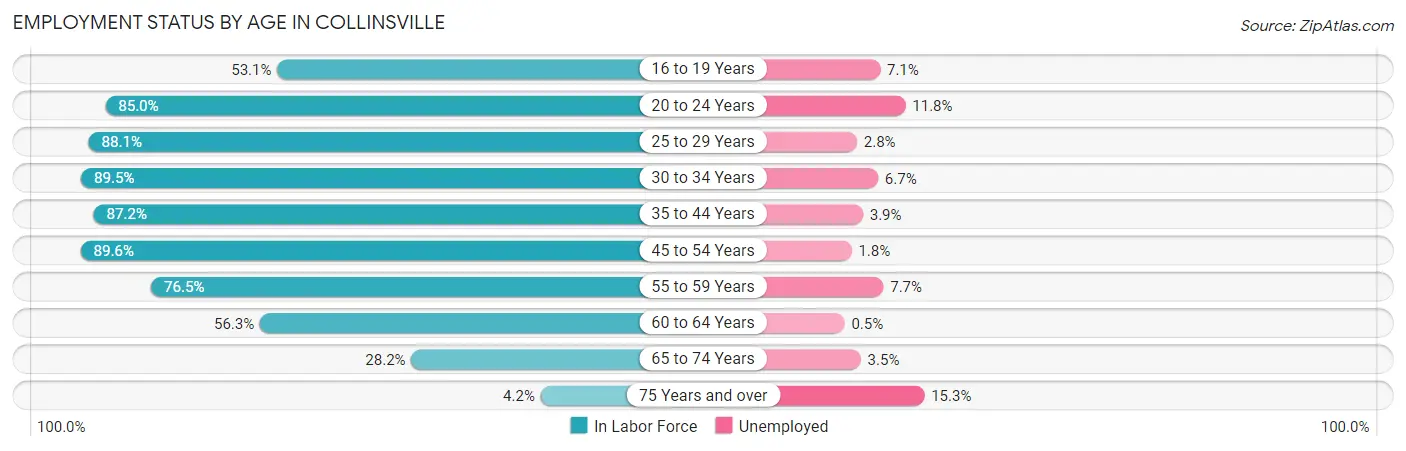
| Age Bracket | In Labor Force | Unemployed |
| 16 to 19 Years | 594 (53.1%) | 42 (7.1%) |
| 20 to 24 Years | 1,057 (85.0%) | 125 (11.8%) |
| 25 to 29 Years | 1,478 (88.1%) | 41 (2.8%) |
| 30 to 34 Years | 1,589 (89.5%) | 106 (6.7%) |
| 35 to 44 Years | 3,429 (87.2%) | 134 (3.9%) |
| 45 to 54 Years | 2,744 (89.6%) | 49 (1.8%) |
| 55 to 59 Years | 1,193 (76.5%) | 92 (7.7%) |
| 60 to 64 Years | 817 (56.3%) | 4 (0.5%) |
| 65 to 74 Years | 739 (28.2%) | 26 (3.5%) |
| 75 Years and over | 72 (4.2%) | 11 (15.3%) |
| Total | 13,709 (68.0%) | 631 (4.6%) |
Employment Status by Educational Attainment in Collinsville
According to labor force statistics for Collinsville, 83.6% of individuals (11,251) out of the total population between 25 and 64 years of age (13,458) are in the labor force, with 3.8% or 428 of them being unemployed. The group with the highest labor force participation rate are those with the educational attainment of bachelor's degree or higher, with 91.3% or 3,724 individuals in the labor force. Within the labor force, individuals with high school diploma education have the highest percentage of unemployment, with 7.0% or 175 of them being unemployed.
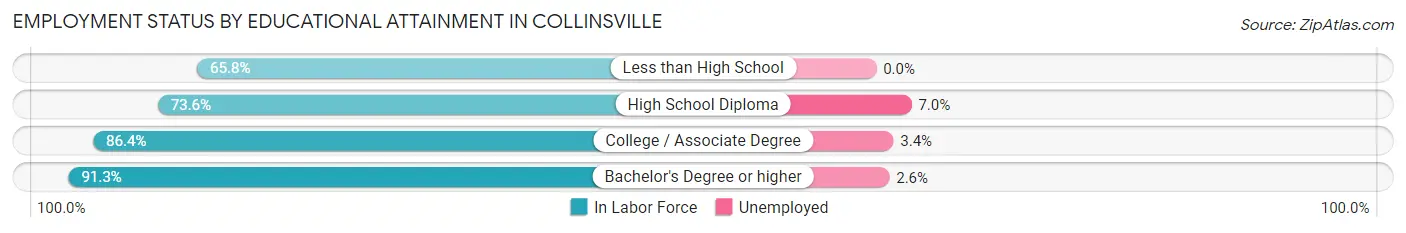
| Educational Attainment | In Labor Force | Unemployed |
| Less than High School | 463 (65.8%) | 0 (0.0%) |
| High School Diploma | 2,494 (73.6%) | 237 (7.0%) |
| College / Associate Degree | 4,568 (86.4%) | 180 (3.4%) |
| Bachelor's Degree or higher | 3,724 (91.3%) | 106 (2.6%) |
| Total | 11,251 (83.6%) | 511 (3.8%) |
Employment Occupations by Sex in Collinsville
Management, Business, Science and Arts Occupations
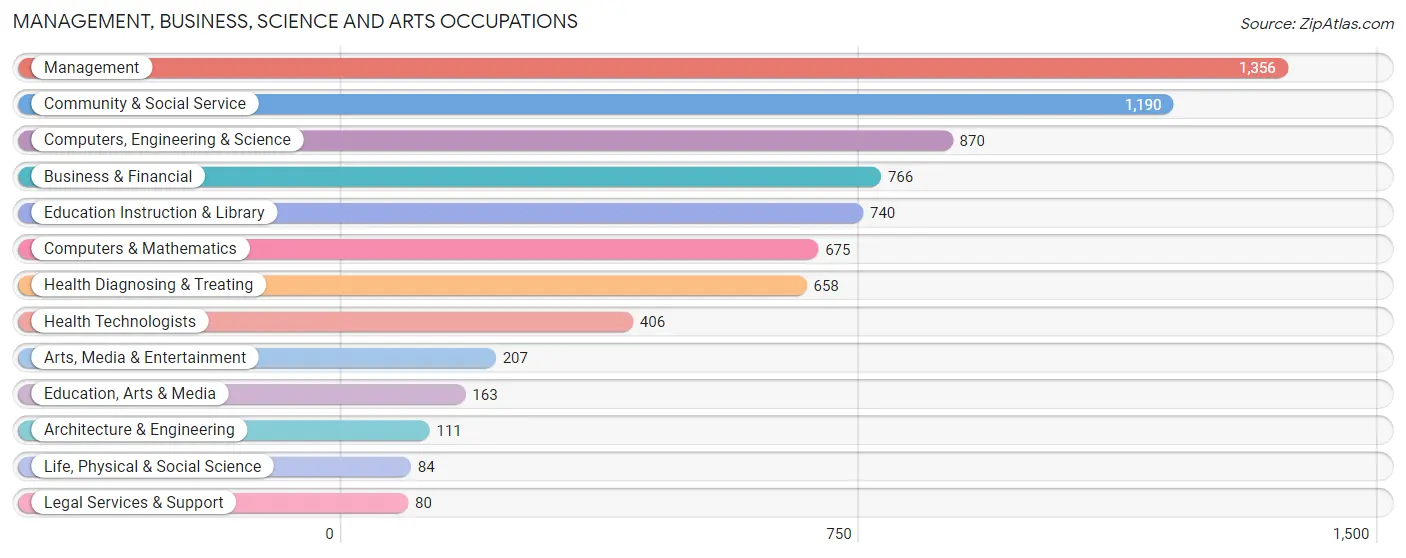
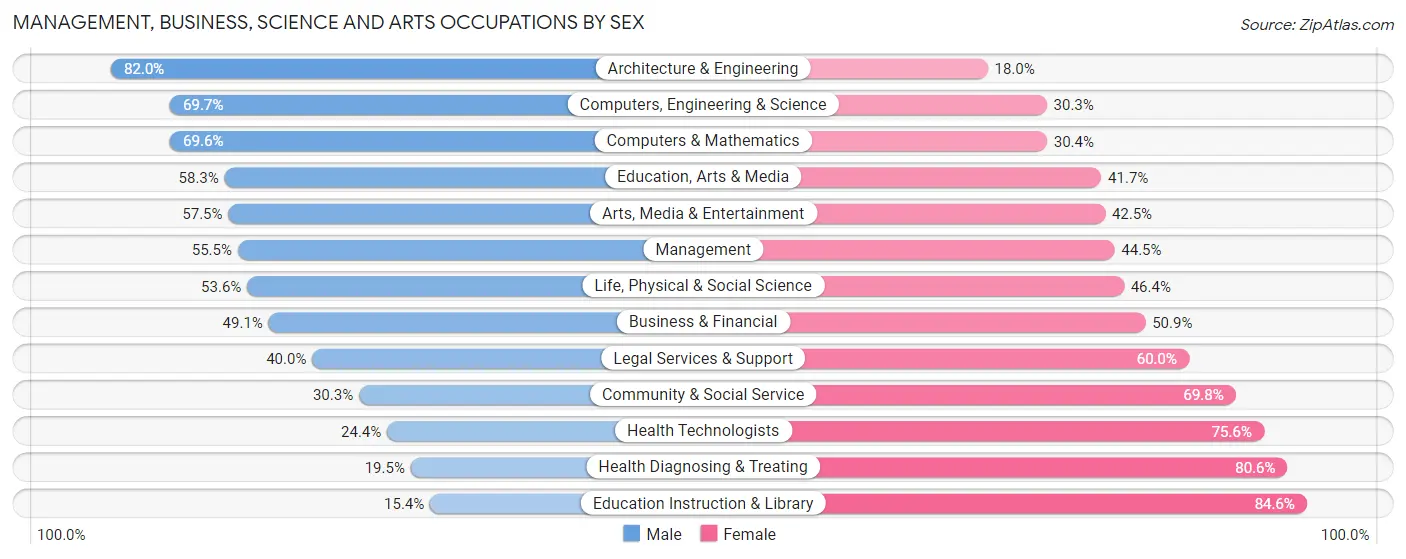
The most common Management, Business, Science and Arts occupations in Collinsville are Management (1,356 | 10.4%), Community & Social Service (1,190 | 9.2%), Computers, Engineering & Science (870 | 6.7%), Business & Financial (766 | 5.9%), and Education Instruction & Library (740 | 5.7%).
Management, Business, Science and Arts Occupations by Sex
Within the Management, Business, Science and Arts occupations in Collinsville, the most male-oriented occupations are Architecture & Engineering (82.0%), Computers, Engineering & Science (69.7%), and Computers & Mathematics (69.6%), while the most female-oriented occupations are Education Instruction & Library (84.6%), Health Diagnosing & Treating (80.5%), and Health Technologists (75.6%).
| Occupation | Male | Female |
| Management | 753 (55.5%) | 603 (44.5%) |
| Business & Financial | 376 (49.1%) | 390 (50.9%) |
| Computers, Engineering & Science | 606 (69.7%) | 264 (30.3%) |
| Computers & Mathematics | 470 (69.6%) | 205 (30.4%) |
| Architecture & Engineering | 91 (82.0%) | 20 (18.0%) |
| Life, Physical & Social Science | 45 (53.6%) | 39 (46.4%) |
| Community & Social Service | 360 (30.2%) | 830 (69.8%) |
| Education, Arts & Media | 95 (58.3%) | 68 (41.7%) |
| Legal Services & Support | 32 (40.0%) | 48 (60.0%) |
| Education Instruction & Library | 114 (15.4%) | 626 (84.6%) |
| Arts, Media & Entertainment | 119 (57.5%) | 88 (42.5%) |
| Health Diagnosing & Treating | 128 (19.5%) | 530 (80.5%) |
| Health Technologists | 99 (24.4%) | 307 (75.6%) |
| Total (Category) | 2,223 (45.9%) | 2,617 (54.1%) |
| Total (Overall) | 6,900 (53.1%) | 6,087 (46.9%) |
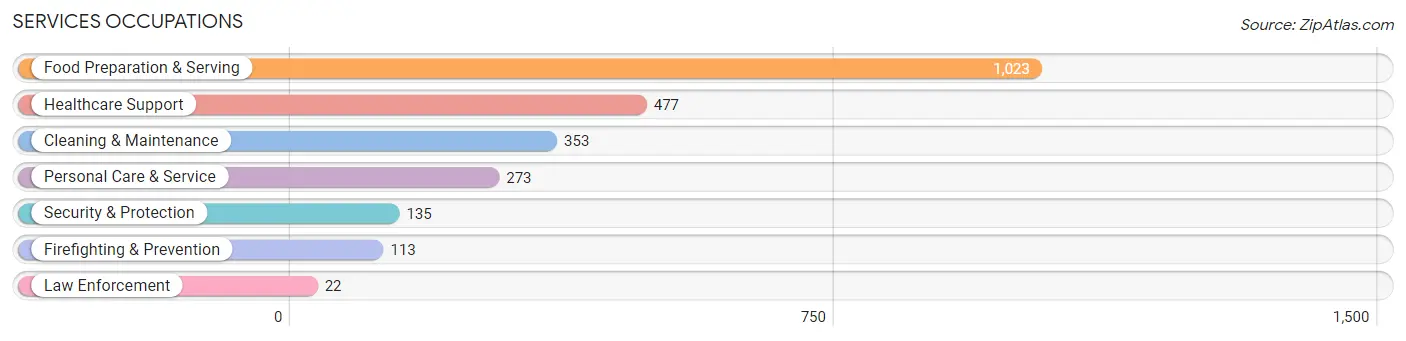
Services Occupations
The most common Services occupations in Collinsville are Food Preparation & Serving (1,023 | 7.9%), Healthcare Support (477 | 3.7%), Cleaning & Maintenance (353 | 2.7%), Personal Care & Service (273 | 2.1%), and Security & Protection (135 | 1.0%).
Services Occupations by Sex
Within the Services occupations in Collinsville, the most male-oriented occupations are Law Enforcement (100.0%), Cleaning & Maintenance (82.2%), and Security & Protection (69.6%), while the most female-oriented occupations are Healthcare Support (89.9%), Personal Care & Service (69.6%), and Food Preparation & Serving (67.7%).
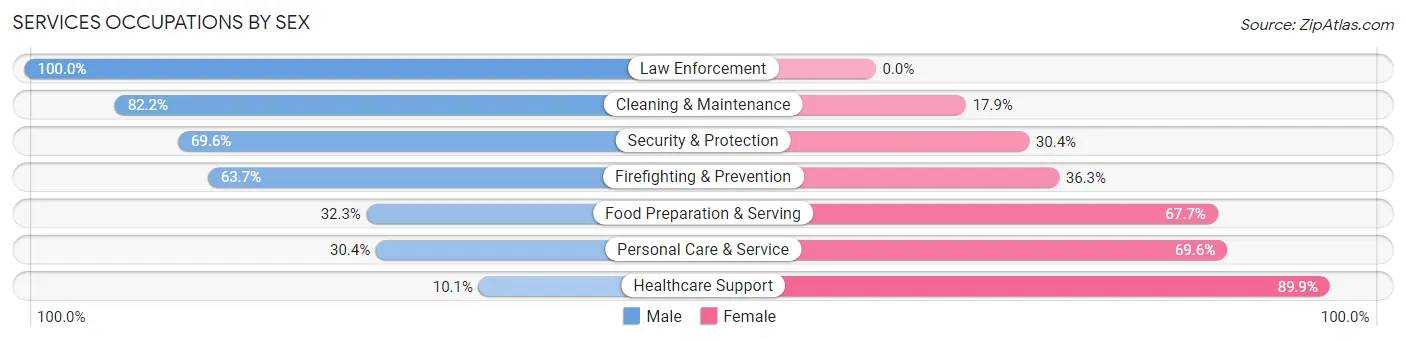
| Occupation | Male | Female |
| Healthcare Support | 48 (10.1%) | 429 (89.9%) |
| Security & Protection | 94 (69.6%) | 41 (30.4%) |
| Firefighting & Prevention | 72 (63.7%) | 41 (36.3%) |
| Law Enforcement | 22 (100.0%) | 0 (0.0%) |
| Food Preparation & Serving | 330 (32.3%) | 693 (67.7%) |
| Cleaning & Maintenance | 290 (82.2%) | 63 (17.8%) |
| Personal Care & Service | 83 (30.4%) | 190 (69.6%) |
| Total (Category) | 845 (37.4%) | 1,416 (62.6%) |
| Total (Overall) | 6,900 (53.1%) | 6,087 (46.9%) |
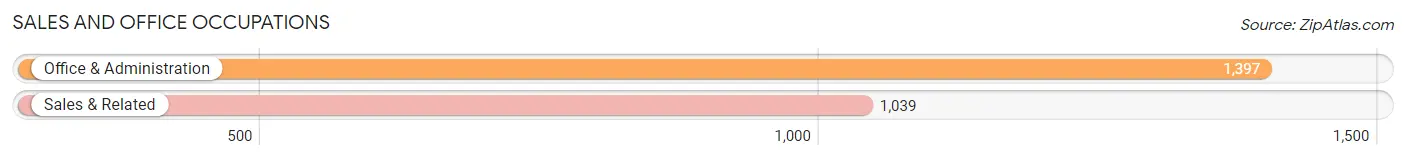
Sales and Office Occupations
The most common Sales and Office occupations in Collinsville are Office & Administration (1,397 | 10.8%), and Sales & Related (1,039 | 8.0%).
Sales and Office Occupations by Sex
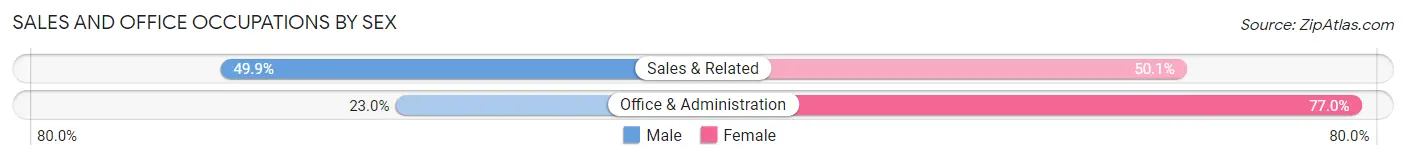
| Occupation | Male | Female |
| Sales & Related | 518 (49.9%) | 521 (50.1%) |
| Office & Administration | 321 (23.0%) | 1,076 (77.0%) |
| Total (Category) | 839 (34.4%) | 1,597 (65.6%) |
| Total (Overall) | 6,900 (53.1%) | 6,087 (46.9%) |
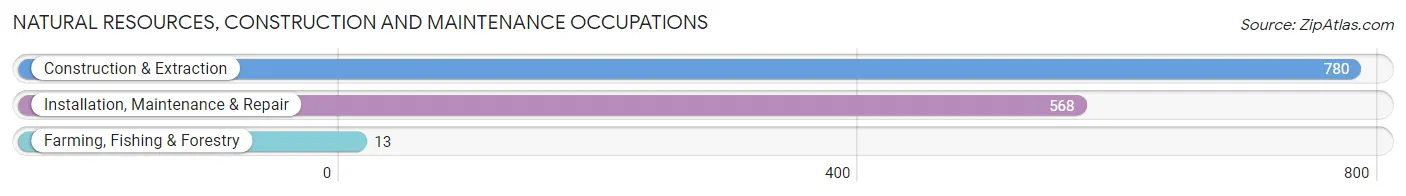
Natural Resources, Construction and Maintenance Occupations
The most common Natural Resources, Construction and Maintenance occupations in Collinsville are Construction & Extraction (780 | 6.0%), Installation, Maintenance & Repair (568 | 4.4%), and Farming, Fishing & Forestry (13 | 0.1%).
Natural Resources, Construction and Maintenance Occupations by Sex
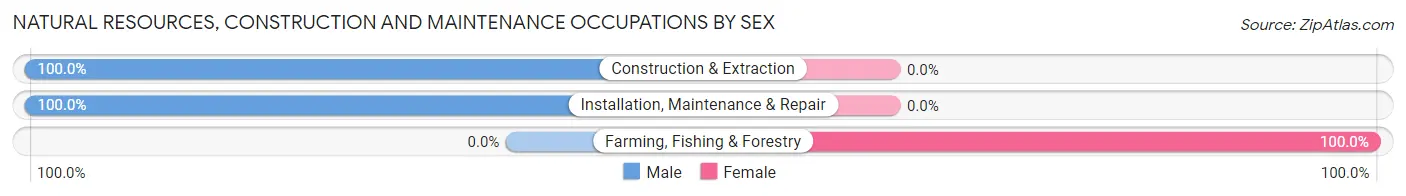
| Occupation | Male | Female |
| Farming, Fishing & Forestry | 0 (0.0%) | 13 (100.0%) |
| Construction & Extraction | 780 (100.0%) | 0 (0.0%) |
| Installation, Maintenance & Repair | 568 (100.0%) | 0 (0.0%) |
| Total (Category) | 1,348 (99.0%) | 13 (1.0%) |
| Total (Overall) | 6,900 (53.1%) | 6,087 (46.9%) |
Production, Transportation and Moving Occupations
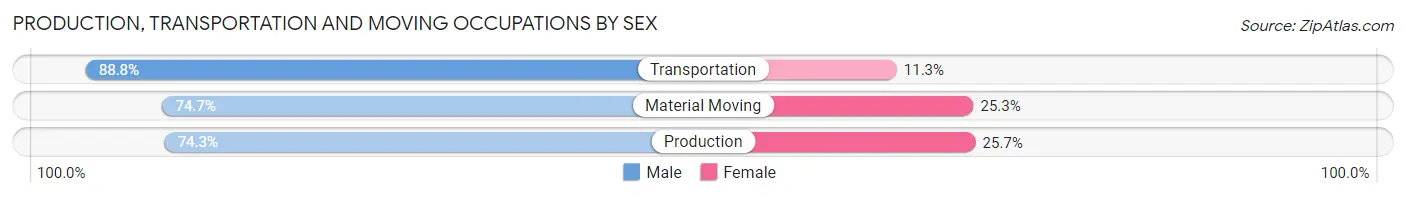
The most common Production, Transportation and Moving occupations in Collinsville are Production (992 | 7.6%), Transportation (631 | 4.9%), and Material Moving (466 | 3.6%).
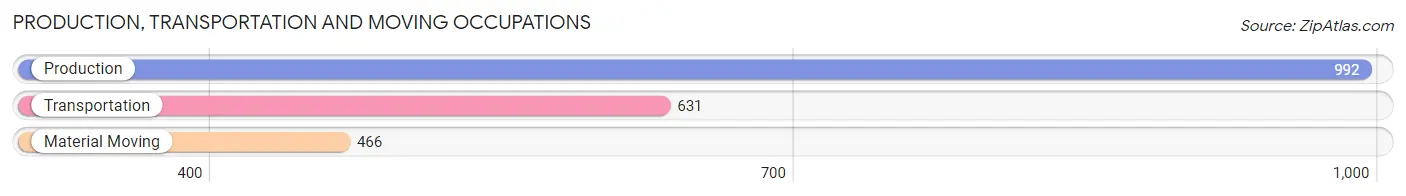
Production, Transportation and Moving Occupations by Sex
| Occupation | Male | Female |
| Production | 737 (74.3%) | 255 (25.7%) |
| Transportation | 560 (88.7%) | 71 (11.3%) |
| Material Moving | 348 (74.7%) | 118 (25.3%) |
| Total (Category) | 1,645 (78.7%) | 444 (21.2%) |
| Total (Overall) | 6,900 (53.1%) | 6,087 (46.9%) |
Employment Industries by Sex in Collinsville
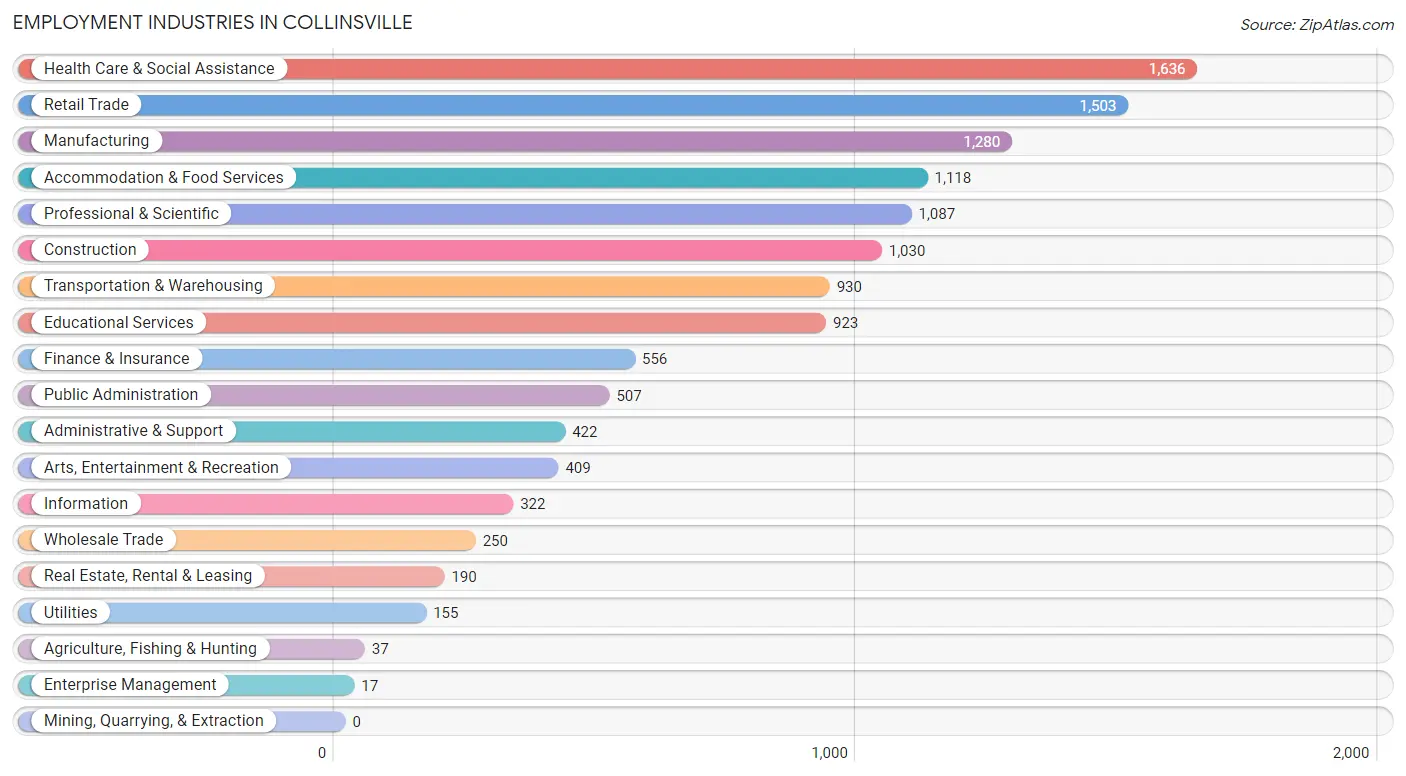
Employment Industries in Collinsville
The major employment industries in Collinsville include Health Care & Social Assistance (1,636 | 12.6%), Retail Trade (1,503 | 11.6%), Manufacturing (1,280 | 9.9%), Accommodation & Food Services (1,118 | 8.6%), and Professional & Scientific (1,087 | 8.4%).
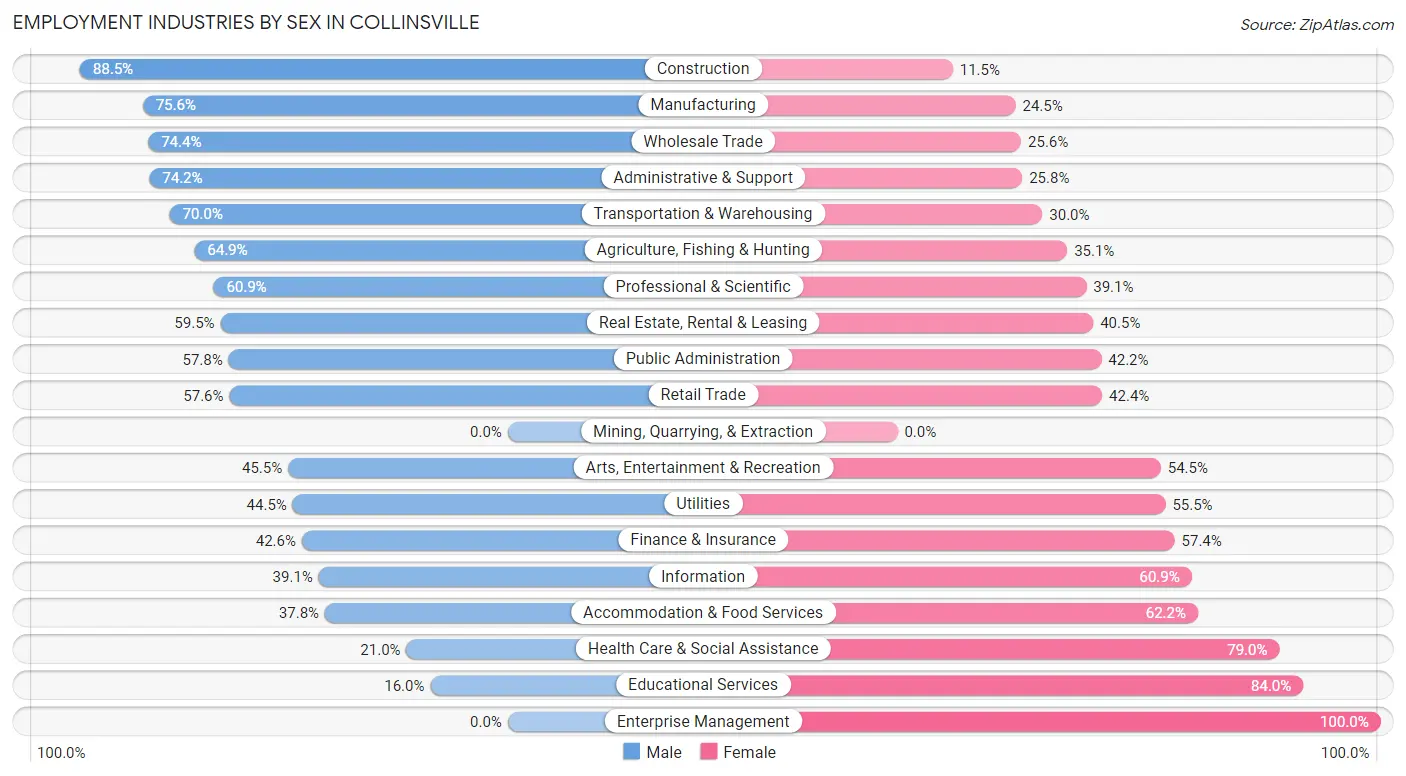
Employment Industries by Sex in Collinsville
The Collinsville industries that see more men than women are Construction (88.5%), Manufacturing (75.5%), and Wholesale Trade (74.4%), whereas the industries that tend to have a higher number of women are Enterprise Management (100.0%), Educational Services (84.0%), and Health Care & Social Assistance (79.0%).
| Industry | Male | Female |
| Agriculture, Fishing & Hunting | 24 (64.9%) | 13 (35.1%) |
| Mining, Quarrying, & Extraction | 0 (0.0%) | 0 (0.0%) |
| Construction | 912 (88.5%) | 118 (11.5%) |
| Manufacturing | 967 (75.5%) | 313 (24.4%) |
| Wholesale Trade | 186 (74.4%) | 64 (25.6%) |
| Retail Trade | 866 (57.6%) | 637 (42.4%) |
| Transportation & Warehousing | 651 (70.0%) | 279 (30.0%) |
| Utilities | 69 (44.5%) | 86 (55.5%) |
| Information | 126 (39.1%) | 196 (60.9%) |
| Finance & Insurance | 237 (42.6%) | 319 (57.4%) |
| Real Estate, Rental & Leasing | 113 (59.5%) | 77 (40.5%) |
| Professional & Scientific | 662 (60.9%) | 425 (39.1%) |
| Enterprise Management | 0 (0.0%) | 17 (100.0%) |
| Administrative & Support | 313 (74.2%) | 109 (25.8%) |
| Educational Services | 148 (16.0%) | 775 (84.0%) |
| Health Care & Social Assistance | 343 (21.0%) | 1,293 (79.0%) |
| Arts, Entertainment & Recreation | 186 (45.5%) | 223 (54.5%) |
| Accommodation & Food Services | 423 (37.8%) | 695 (62.2%) |
| Public Administration | 293 (57.8%) | 214 (42.2%) |
| Total | 6,900 (53.1%) | 6,087 (46.9%) |
Education in Collinsville
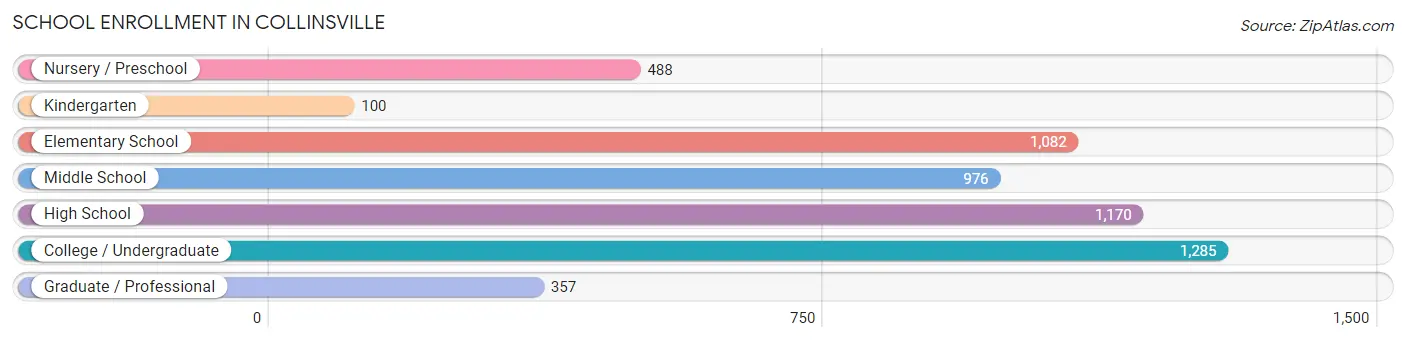
School Enrollment in Collinsville
The most common levels of schooling among the 5,458 students in Collinsville are college / undergraduate (1,285 | 23.5%), high school (1,170 | 21.4%), and elementary school (1,082 | 19.8%).
| School Level | # Students | % Students |
| Nursery / Preschool | 488 | 8.9% |
| Kindergarten | 100 | 1.8% |
| Elementary School | 1,082 | 19.8% |
| Middle School | 976 | 17.9% |
| High School | 1,170 | 21.4% |
| College / Undergraduate | 1,285 | 23.5% |
| Graduate / Professional | 357 | 6.5% |
| Total | 5,458 | 100.0% |
School Enrollment by Age by Funding Source in Collinsville
Out of a total of 5,458 students who are enrolled in schools in Collinsville, 884 (16.2%) attend a private institution, while the remaining 4,574 (83.8%) are enrolled in public schools. The age group of 35 years and over has the highest likelihood of being enrolled in private schools, with 162 (53.6% in the age bracket) enrolled. Conversely, the age group of 18 to 19 year olds has the lowest likelihood of being enrolled in a private school, with 315 (100.0% in the age bracket) attending a public institution.
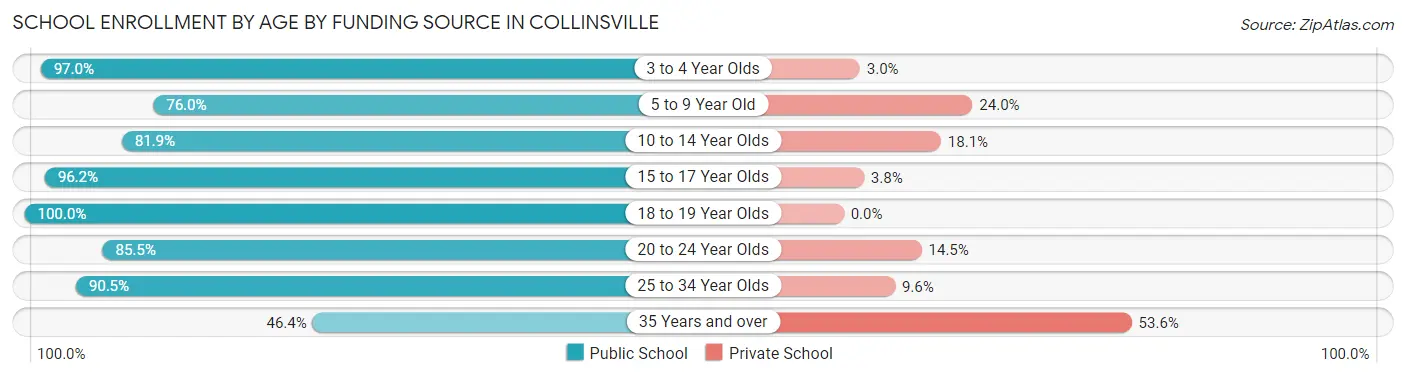
| Age Bracket | Public School | Private School |
| 3 to 4 Year Olds | 322 (97.0%) | 10 (3.0%) |
| 5 to 9 Year Old | 967 (76.0%) | 305 (24.0%) |
| 10 to 14 Year Olds | 1,072 (81.9%) | 237 (18.1%) |
| 15 to 17 Year Olds | 690 (96.2%) | 27 (3.8%) |
| 18 to 19 Year Olds | 315 (100.0%) | 0 (0.0%) |
| 20 to 24 Year Olds | 471 (85.5%) | 80 (14.5%) |
| 25 to 34 Year Olds | 597 (90.4%) | 63 (9.6%) |
| 35 Years and over | 140 (46.4%) | 162 (53.6%) |
| Total | 4,574 (83.8%) | 884 (16.2%) |
Educational Attainment by Field of Study in Collinsville
Business (1,219 | 22.2%), education (912 | 16.6%), computers & mathematics (387 | 7.1%), engineering (353 | 6.4%), and science & technology (339 | 6.2%) are the most common fields of study among 5,481 individuals in Collinsville who have obtained a bachelor's degree or higher.
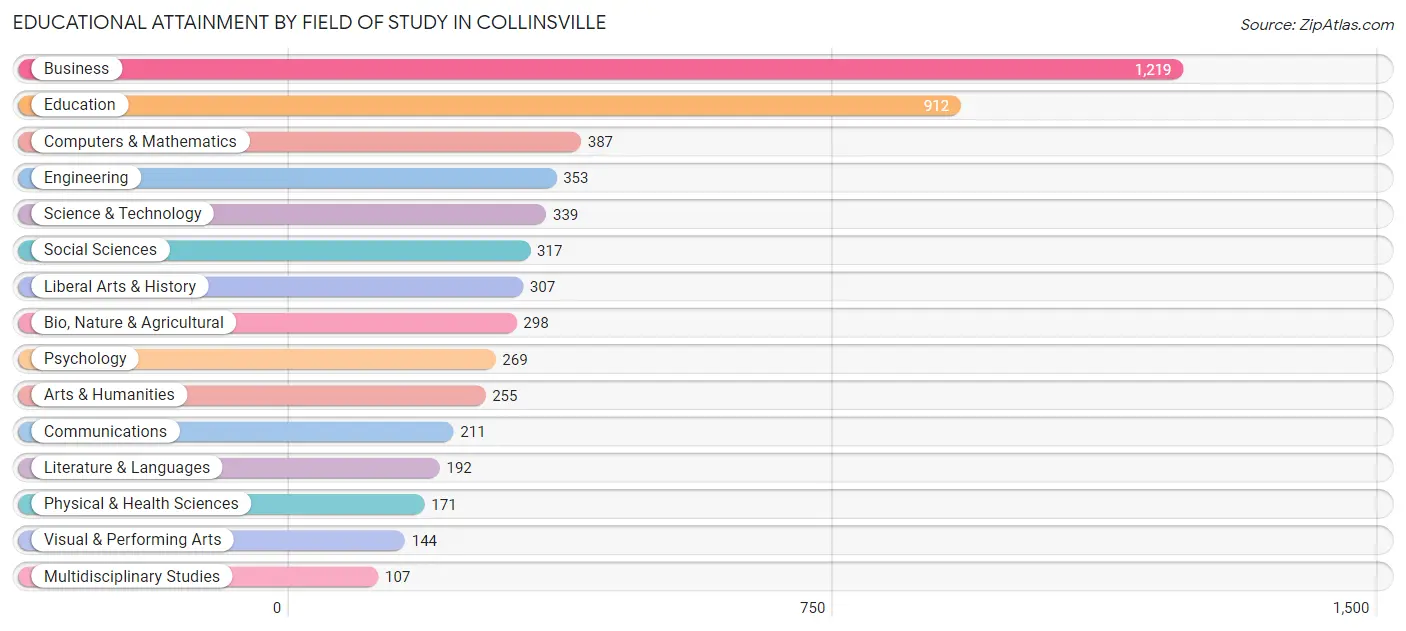
| Field of Study | # Graduates | % Graduates |
| Computers & Mathematics | 387 | 7.1% |
| Bio, Nature & Agricultural | 298 | 5.4% |
| Physical & Health Sciences | 171 | 3.1% |
| Psychology | 269 | 4.9% |
| Social Sciences | 317 | 5.8% |
| Engineering | 353 | 6.4% |
| Multidisciplinary Studies | 107 | 1.9% |
| Science & Technology | 339 | 6.2% |
| Business | 1,219 | 22.2% |
| Education | 912 | 16.6% |
| Literature & Languages | 192 | 3.5% |
| Liberal Arts & History | 307 | 5.6% |
| Visual & Performing Arts | 144 | 2.6% |
| Communications | 211 | 3.8% |
| Arts & Humanities | 255 | 4.6% |
| Total | 5,481 | 100.0% |
Transportation & Commute in Collinsville
Vehicle Availability by Sex in Collinsville
The most prevalent vehicle ownership categories in Collinsville are males with 2 vehicles (2,539, accounting for 37.3%) and females with 2 vehicles (2,299, making up 42.2%).
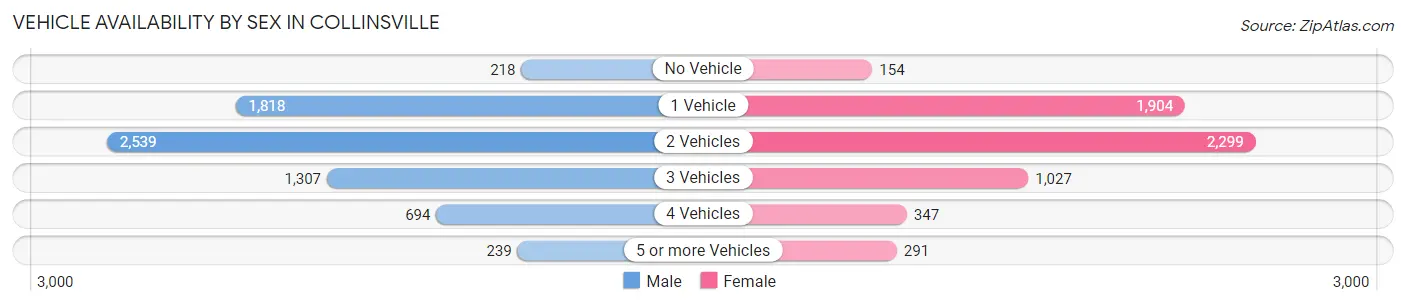
| Vehicles Available | Male | Female |
| No Vehicle | 218 (3.2%) | 154 (2.6%) |
| 1 Vehicle | 1,818 (26.7%) | 1,904 (31.6%) |
| 2 Vehicles | 2,539 (37.3%) | 2,299 (38.2%) |
| 3 Vehicles | 1,307 (19.2%) | 1,027 (17.1%) |
| 4 Vehicles | 694 (10.2%) | 347 (5.8%) |
| 5 or more Vehicles | 239 (3.5%) | 291 (4.8%) |
| Total | 6,815 (100.0%) | 6,022 (100.0%) |
Commute Time in Collinsville
The most frequently occuring commute durations in Collinsville are 20 to 24 minutes (2,064 commuters, 17.7%), 30 to 34 minutes (1,981 commuters, 17.0%), and 15 to 19 minutes (1,802 commuters, 15.4%).
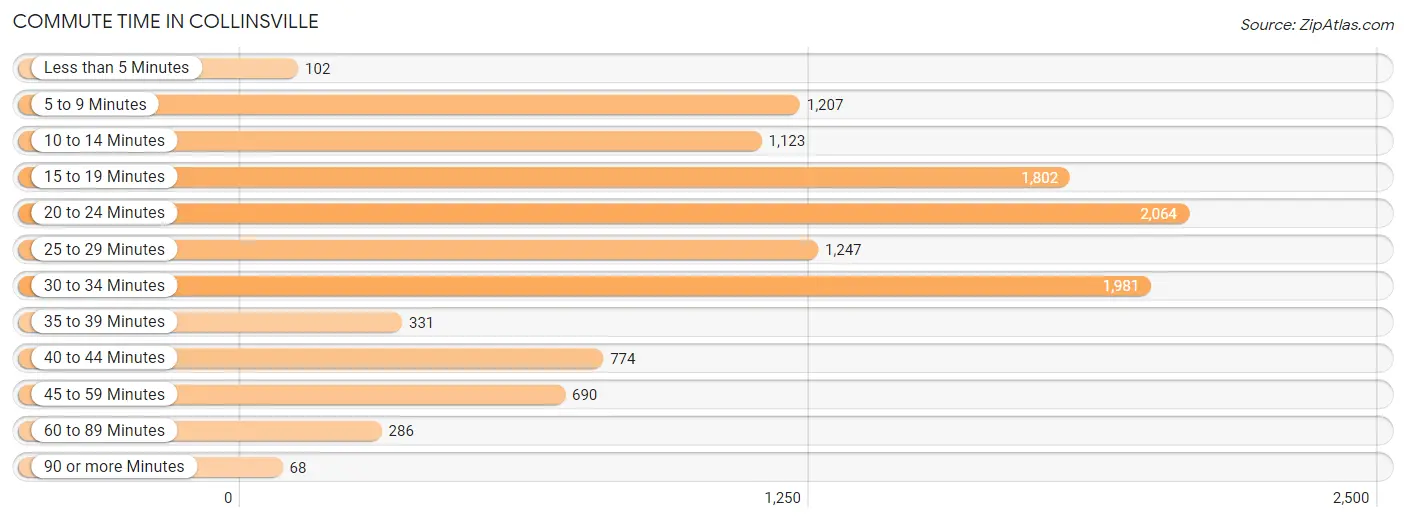
| Commute Time | # Commuters | % Commuters |
| Less than 5 Minutes | 102 | 0.9% |
| 5 to 9 Minutes | 1,207 | 10.3% |
| 10 to 14 Minutes | 1,123 | 9.6% |
| 15 to 19 Minutes | 1,802 | 15.4% |
| 20 to 24 Minutes | 2,064 | 17.7% |
| 25 to 29 Minutes | 1,247 | 10.7% |
| 30 to 34 Minutes | 1,981 | 17.0% |
| 35 to 39 Minutes | 331 | 2.8% |
| 40 to 44 Minutes | 774 | 6.6% |
| 45 to 59 Minutes | 690 | 5.9% |
| 60 to 89 Minutes | 286 | 2.5% |
| 90 or more Minutes | 68 | 0.6% |
Commute Time by Sex in Collinsville
The most common commute times in Collinsville are 30 to 34 minutes (1,090 commuters, 17.7%) for males and 20 to 24 minutes (1,139 commuters, 20.7%) for females.
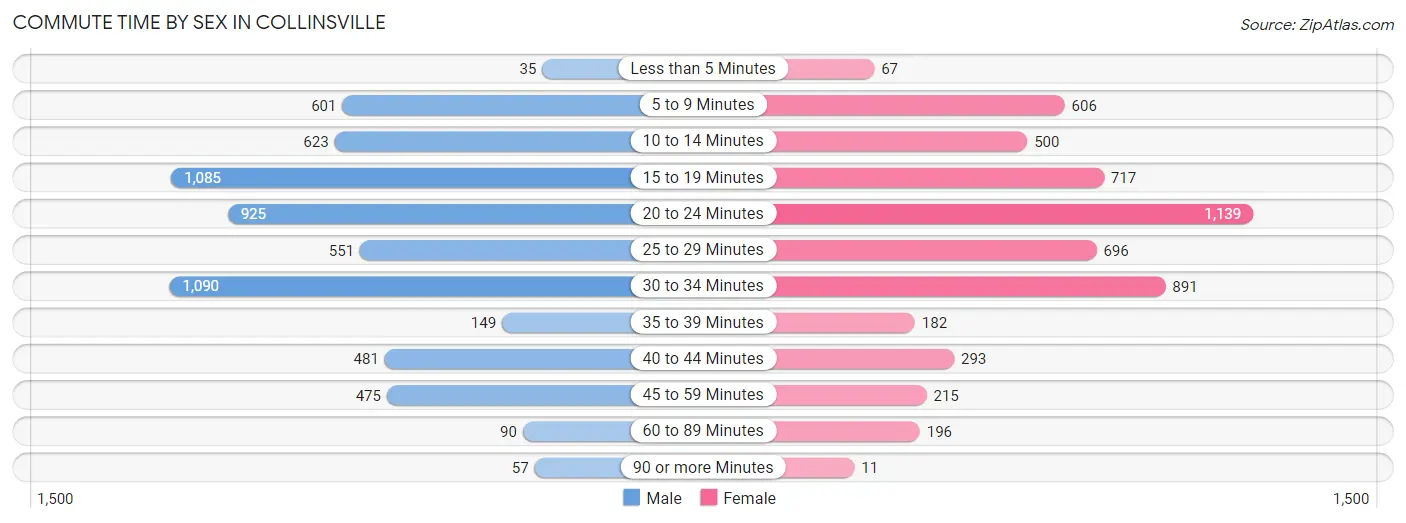
| Commute Time | Male | Female |
| Less than 5 Minutes | 35 (0.6%) | 67 (1.2%) |
| 5 to 9 Minutes | 601 (9.8%) | 606 (11.0%) |
| 10 to 14 Minutes | 623 (10.1%) | 500 (9.1%) |
| 15 to 19 Minutes | 1,085 (17.6%) | 717 (13.0%) |
| 20 to 24 Minutes | 925 (15.0%) | 1,139 (20.7%) |
| 25 to 29 Minutes | 551 (8.9%) | 696 (12.6%) |
| 30 to 34 Minutes | 1,090 (17.7%) | 891 (16.2%) |
| 35 to 39 Minutes | 149 (2.4%) | 182 (3.3%) |
| 40 to 44 Minutes | 481 (7.8%) | 293 (5.3%) |
| 45 to 59 Minutes | 475 (7.7%) | 215 (3.9%) |
| 60 to 89 Minutes | 90 (1.5%) | 196 (3.6%) |
| 90 or more Minutes | 57 (0.9%) | 11 (0.2%) |
Time of Departure to Work by Sex in Collinsville
The most frequent times of departure to work in Collinsville are 6:00 AM to 6:29 AM (810, 13.2%) for males and 7:00 AM to 7:29 AM (783, 14.2%) for females.
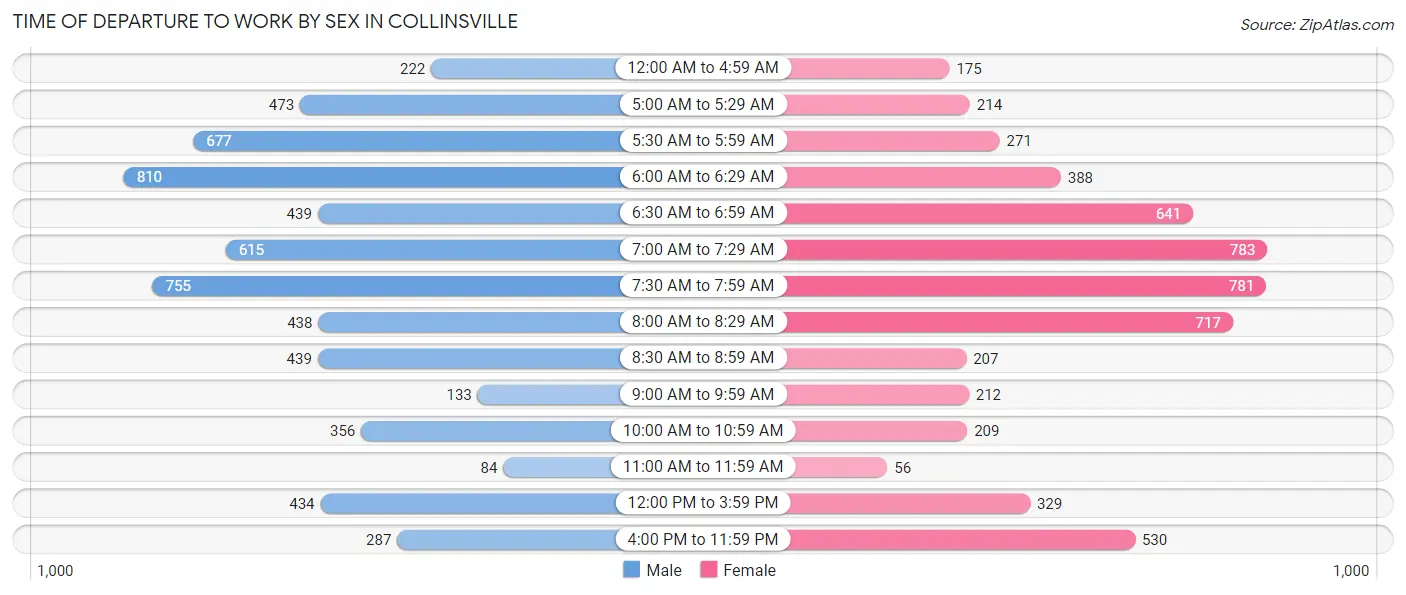
| Time of Departure | Male | Female |
| 12:00 AM to 4:59 AM | 222 (3.6%) | 175 (3.2%) |
| 5:00 AM to 5:29 AM | 473 (7.7%) | 214 (3.9%) |
| 5:30 AM to 5:59 AM | 677 (11.0%) | 271 (4.9%) |
| 6:00 AM to 6:29 AM | 810 (13.2%) | 388 (7.0%) |
| 6:30 AM to 6:59 AM | 439 (7.1%) | 641 (11.6%) |
| 7:00 AM to 7:29 AM | 615 (10.0%) | 783 (14.2%) |
| 7:30 AM to 7:59 AM | 755 (12.2%) | 781 (14.2%) |
| 8:00 AM to 8:29 AM | 438 (7.1%) | 717 (13.0%) |
| 8:30 AM to 8:59 AM | 439 (7.1%) | 207 (3.7%) |
| 9:00 AM to 9:59 AM | 133 (2.2%) | 212 (3.8%) |
| 10:00 AM to 10:59 AM | 356 (5.8%) | 209 (3.8%) |
| 11:00 AM to 11:59 AM | 84 (1.4%) | 56 (1.0%) |
| 12:00 PM to 3:59 PM | 434 (7.0%) | 329 (6.0%) |
| 4:00 PM to 11:59 PM | 287 (4.7%) | 530 (9.6%) |
| Total | 6,162 (100.0%) | 5,513 (100.0%) |
Housing Occupancy in Collinsville
Occupancy by Ownership in Collinsville
Of the total 11,089 dwellings in Collinsville, owner-occupied units account for 7,132 (64.3%), while renter-occupied units make up 3,957 (35.7%).
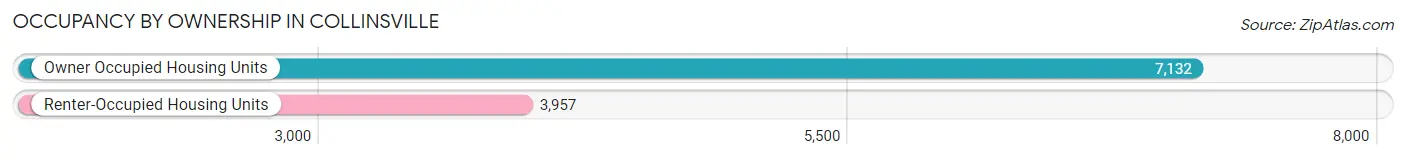
| Occupancy | # Housing Units | % Housing Units |
| Owner Occupied Housing Units | 7,132 | 64.3% |
| Renter-Occupied Housing Units | 3,957 | 35.7% |
| Total Occupied Housing Units | 11,089 | 100.0% |
Occupancy by Household Size in Collinsville
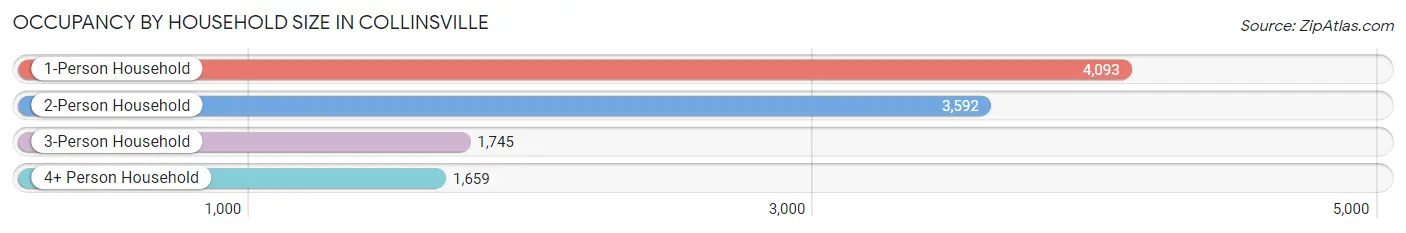
| Household Size | # Housing Units | % Housing Units |
| 1-Person Household | 4,093 | 36.9% |
| 2-Person Household | 3,592 | 32.4% |
| 3-Person Household | 1,745 | 15.7% |
| 4+ Person Household | 1,659 | 15.0% |
| Total Housing Units | 11,089 | 100.0% |
Occupancy by Ownership by Household Size in Collinsville
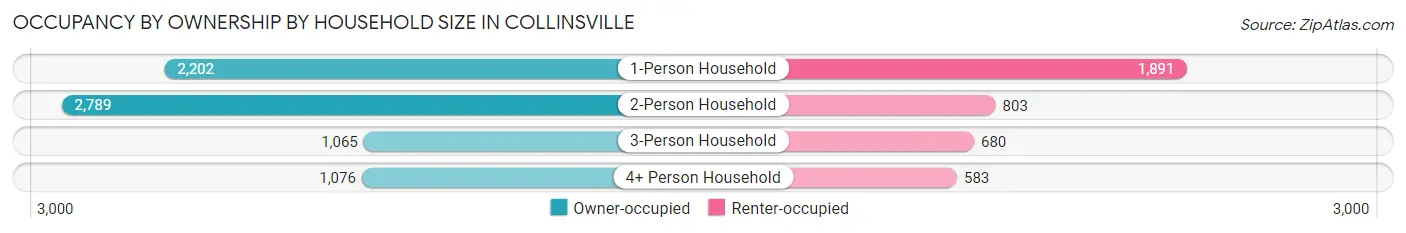
| Household Size | Owner-occupied | Renter-occupied |
| 1-Person Household | 2,202 (53.8%) | 1,891 (46.2%) |
| 2-Person Household | 2,789 (77.6%) | 803 (22.4%) |
| 3-Person Household | 1,065 (61.0%) | 680 (39.0%) |
| 4+ Person Household | 1,076 (64.9%) | 583 (35.1%) |
| Total Housing Units | 7,132 (64.3%) | 3,957 (35.7%) |
Occupancy by Educational Attainment in Collinsville
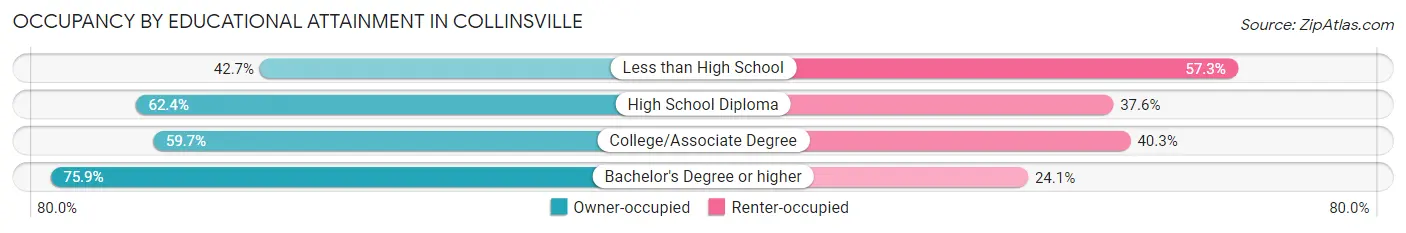
| Household Size | Owner-occupied | Renter-occupied |
| Less than High School | 271 (42.7%) | 364 (57.3%) |
| High School Diploma | 1,965 (62.4%) | 1,184 (37.6%) |
| College/Associate Degree | 2,386 (59.7%) | 1,613 (40.3%) |
| Bachelor's Degree or higher | 2,510 (75.9%) | 796 (24.1%) |
Occupancy by Age of Householder in Collinsville
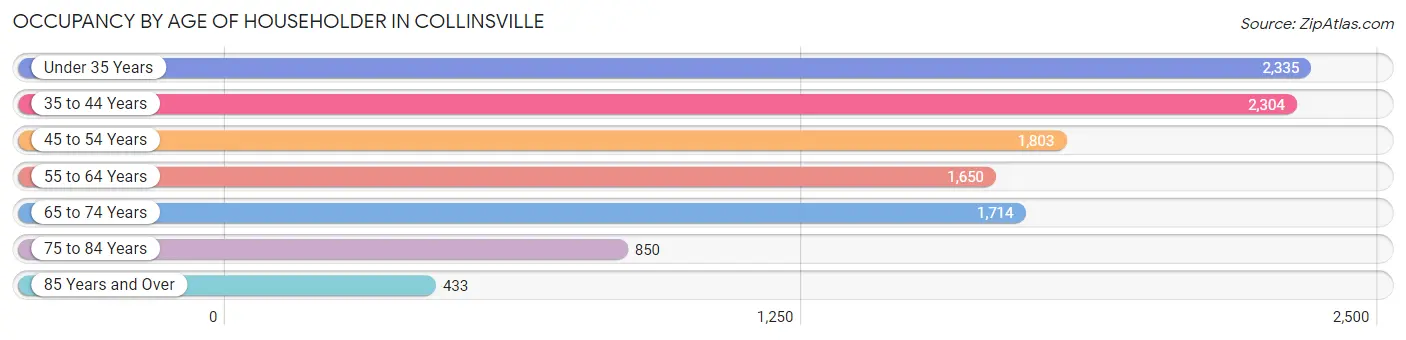
| Age Bracket | # Households | % Households |
| Under 35 Years | 2,335 | 21.1% |
| 35 to 44 Years | 2,304 | 20.8% |
| 45 to 54 Years | 1,803 | 16.3% |
| 55 to 64 Years | 1,650 | 14.9% |
| 65 to 74 Years | 1,714 | 15.5% |
| 75 to 84 Years | 850 | 7.7% |
| 85 Years and Over | 433 | 3.9% |
| Total | 11,089 | 100.0% |
Housing Finances in Collinsville
Median Income by Occupancy in Collinsville
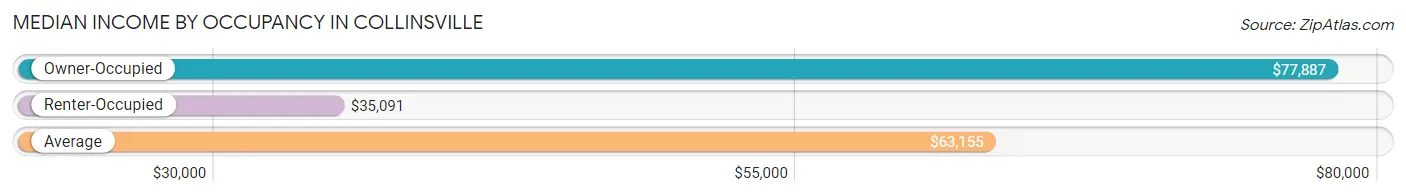
| Occupancy Type | # Households | Median Income |
| Owner-Occupied | 7,132 (64.3%) | $77,887 |
| Renter-Occupied | 3,957 (35.7%) | $35,091 |
| Average | 11,089 (100.0%) | $63,155 |
Occupancy by Householder Income Bracket in Collinsville
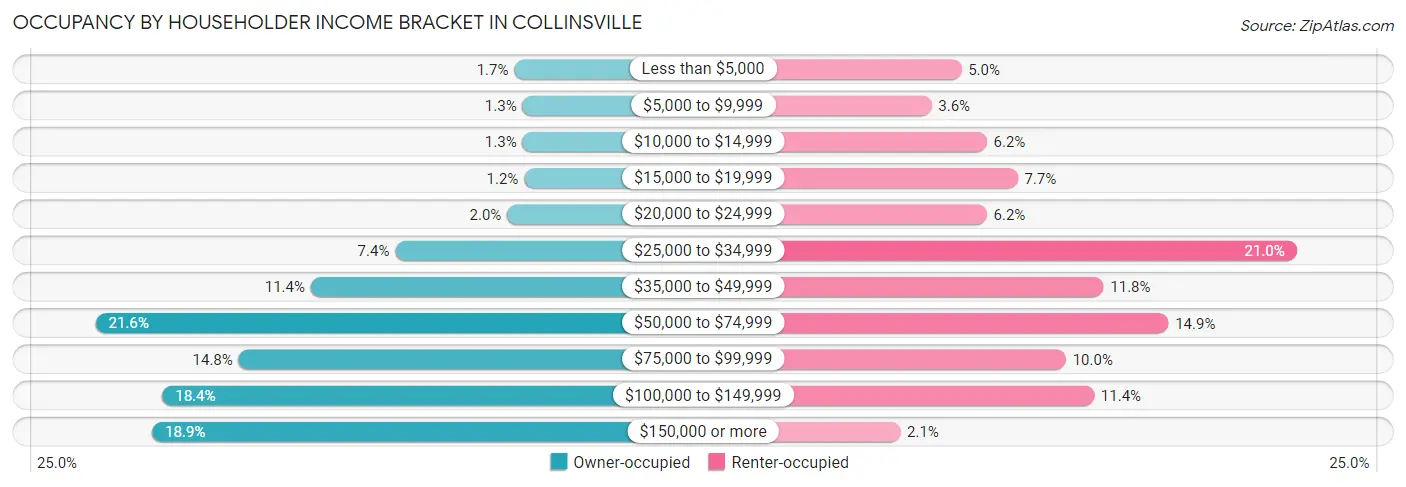
| Income Bracket | Owner-occupied | Renter-occupied |
| Less than $5,000 | 120 (1.7%) | 199 (5.0%) |
| $5,000 to $9,999 | 92 (1.3%) | 143 (3.6%) |
| $10,000 to $14,999 | 92 (1.3%) | 247 (6.2%) |
| $15,000 to $19,999 | 86 (1.2%) | 305 (7.7%) |
| $20,000 to $24,999 | 144 (2.0%) | 247 (6.2%) |
| $25,000 to $34,999 | 524 (7.3%) | 831 (21.0%) |
| $35,000 to $49,999 | 811 (11.4%) | 467 (11.8%) |
| $50,000 to $74,999 | 1,542 (21.6%) | 589 (14.9%) |
| $75,000 to $99,999 | 1,056 (14.8%) | 396 (10.0%) |
| $100,000 to $149,999 | 1,315 (18.4%) | 449 (11.4%) |
| $150,000 or more | 1,350 (18.9%) | 84 (2.1%) |
| Total | 7,132 (100.0%) | 3,957 (100.0%) |
Monthly Housing Cost Tiers in Collinsville
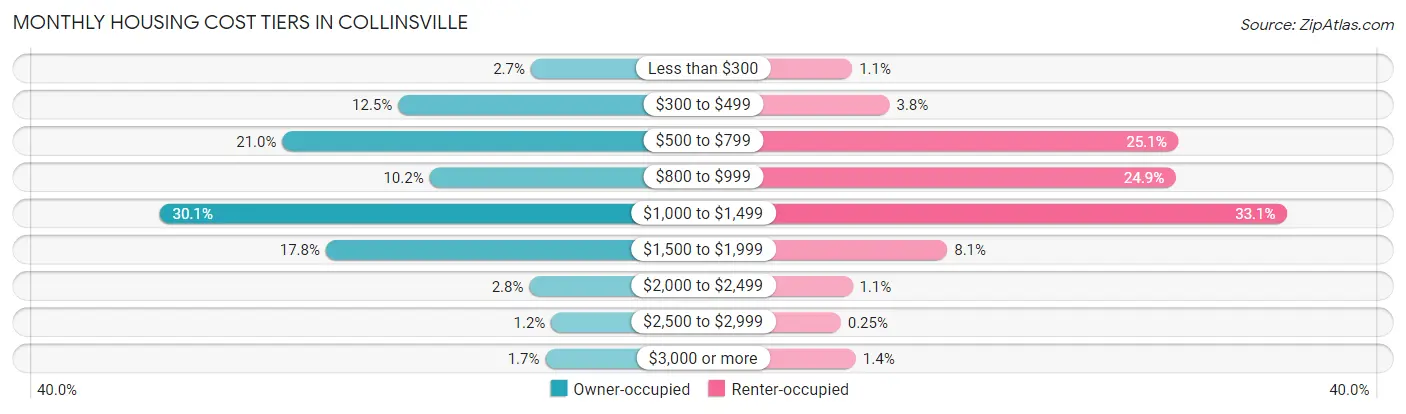
| Monthly Cost | Owner-occupied | Renter-occupied |
| Less than $300 | 194 (2.7%) | 43 (1.1%) |
| $300 to $499 | 891 (12.5%) | 152 (3.8%) |
| $500 to $799 | 1,499 (21.0%) | 994 (25.1%) |
| $800 to $999 | 726 (10.2%) | 987 (24.9%) |
| $1,000 to $1,499 | 2,144 (30.1%) | 1,311 (33.1%) |
| $1,500 to $1,999 | 1,271 (17.8%) | 320 (8.1%) |
| $2,000 to $2,499 | 202 (2.8%) | 44 (1.1%) |
| $2,500 to $2,999 | 87 (1.2%) | 10 (0.3%) |
| $3,000 or more | 118 (1.7%) | 54 (1.4%) |
| Total | 7,132 (100.0%) | 3,957 (100.0%) |
Physical Housing Characteristics in Collinsville
Housing Structures in Collinsville
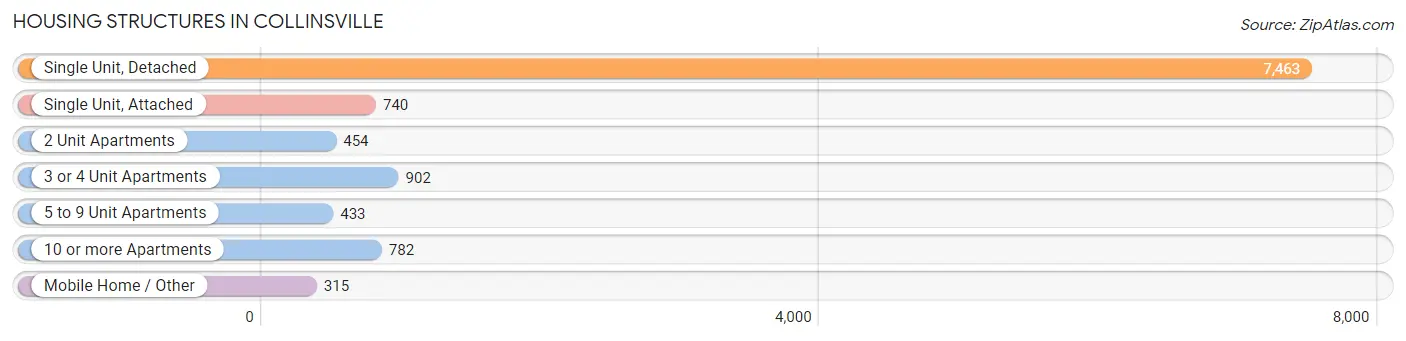
| Structure Type | # Housing Units | % Housing Units |
| Single Unit, Detached | 7,463 | 67.3% |
| Single Unit, Attached | 740 | 6.7% |
| 2 Unit Apartments | 454 | 4.1% |
| 3 or 4 Unit Apartments | 902 | 8.1% |
| 5 to 9 Unit Apartments | 433 | 3.9% |
| 10 or more Apartments | 782 | 7.0% |
| Mobile Home / Other | 315 | 2.8% |
| Total | 11,089 | 100.0% |
Housing Structures by Occupancy in Collinsville
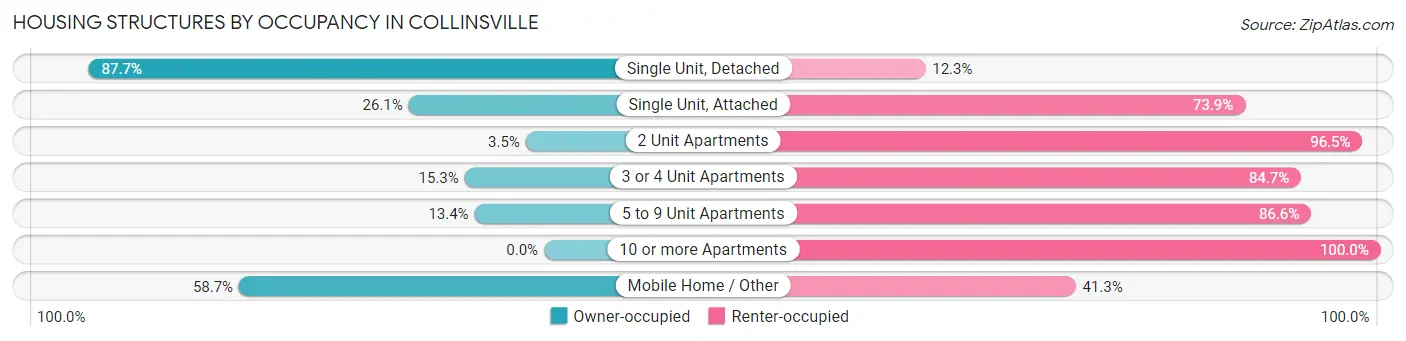
| Structure Type | Owner-occupied | Renter-occupied |
| Single Unit, Detached | 6,542 (87.7%) | 921 (12.3%) |
| Single Unit, Attached | 193 (26.1%) | 547 (73.9%) |
| 2 Unit Apartments | 16 (3.5%) | 438 (96.5%) |
| 3 or 4 Unit Apartments | 138 (15.3%) | 764 (84.7%) |
| 5 to 9 Unit Apartments | 58 (13.4%) | 375 (86.6%) |
| 10 or more Apartments | 0 (0.0%) | 782 (100.0%) |
| Mobile Home / Other | 185 (58.7%) | 130 (41.3%) |
| Total | 7,132 (64.3%) | 3,957 (35.7%) |
Housing Structures by Number of Rooms in Collinsville
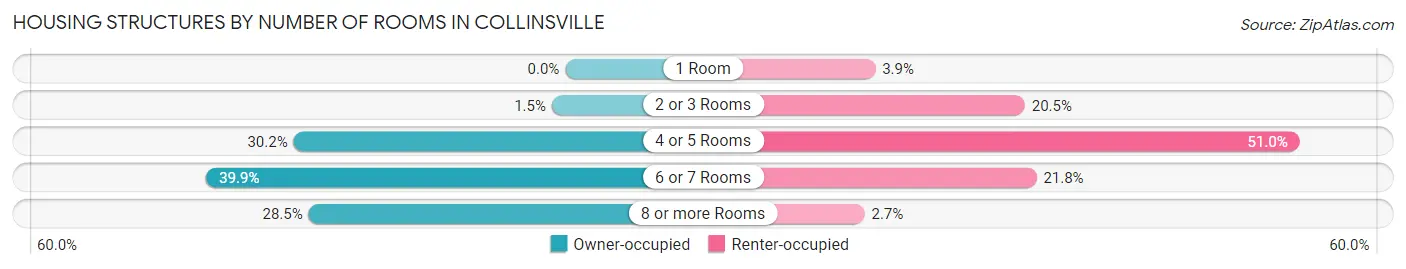
| Number of Rooms | Owner-occupied | Renter-occupied |
| 1 Room | 0 (0.0%) | 155 (3.9%) |
| 2 or 3 Rooms | 106 (1.5%) | 812 (20.5%) |
| 4 or 5 Rooms | 2,151 (30.2%) | 2,019 (51.0%) |
| 6 or 7 Rooms | 2,843 (39.9%) | 863 (21.8%) |
| 8 or more Rooms | 2,032 (28.5%) | 108 (2.7%) |
| Total | 7,132 (100.0%) | 3,957 (100.0%) |
Housing Structure by Heating Type in Collinsville
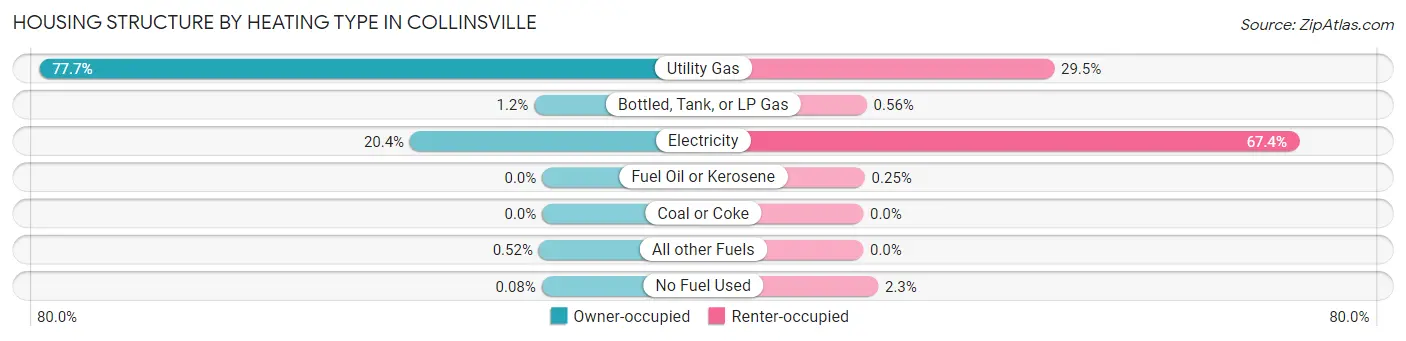
| Heating Type | Owner-occupied | Renter-occupied |
| Utility Gas | 5,544 (77.7%) | 1,168 (29.5%) |
| Bottled, Tank, or LP Gas | 88 (1.2%) | 22 (0.6%) |
| Electricity | 1,457 (20.4%) | 2,665 (67.3%) |
| Fuel Oil or Kerosene | 0 (0.0%) | 10 (0.3%) |
| Coal or Coke | 0 (0.0%) | 0 (0.0%) |
| All other Fuels | 37 (0.5%) | 0 (0.0%) |
| No Fuel Used | 6 (0.1%) | 92 (2.3%) |
| Total | 7,132 (100.0%) | 3,957 (100.0%) |
Household Vehicle Usage in Collinsville
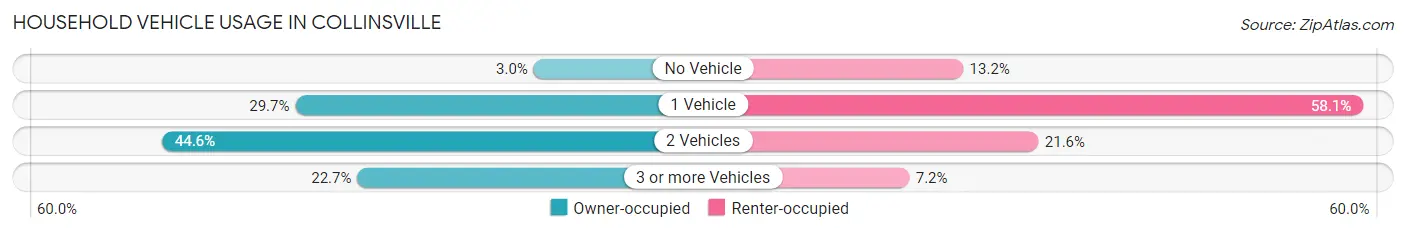
| Vehicles per Household | Owner-occupied | Renter-occupied |
| No Vehicle | 212 (3.0%) | 522 (13.2%) |
| 1 Vehicle | 2,117 (29.7%) | 2,297 (58.1%) |
| 2 Vehicles | 3,182 (44.6%) | 855 (21.6%) |
| 3 or more Vehicles | 1,621 (22.7%) | 283 (7.1%) |
| Total | 7,132 (100.0%) | 3,957 (100.0%) |
Real Estate & Mortgages in Collinsville
Real Estate and Mortgage Overview in Collinsville
| Characteristic | Without Mortgage | With Mortgage |
| Housing Units | 2,758 | 4,374 |
| Median Property Value | $137,200 | $156,400 |
| Median Household Income | $61,449 | $1,034 |
| Monthly Housing Costs | $563 | $46 |
| Real Estate Taxes | $2,367 | $83 |
Property Value by Mortgage Status in Collinsville
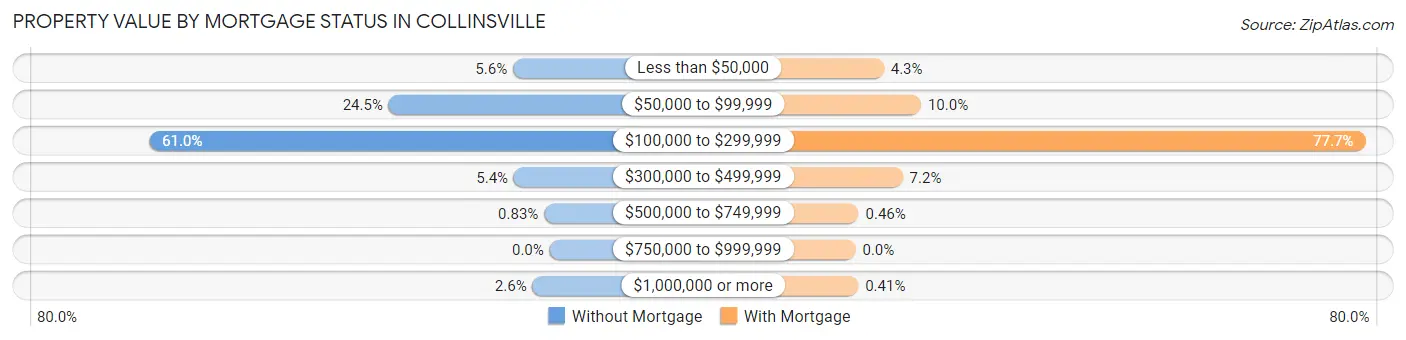
| Property Value | Without Mortgage | With Mortgage |
| Less than $50,000 | 154 (5.6%) | 188 (4.3%) |
| $50,000 to $99,999 | 676 (24.5%) | 436 (10.0%) |
| $100,000 to $299,999 | 1,683 (61.0%) | 3,398 (77.7%) |
| $300,000 to $499,999 | 150 (5.4%) | 314 (7.2%) |
| $500,000 to $749,999 | 23 (0.8%) | 20 (0.5%) |
| $750,000 to $999,999 | 0 (0.0%) | 0 (0.0%) |
| $1,000,000 or more | 72 (2.6%) | 18 (0.4%) |
| Total | 2,758 (100.0%) | 4,374 (100.0%) |
Household Income by Mortgage Status in Collinsville
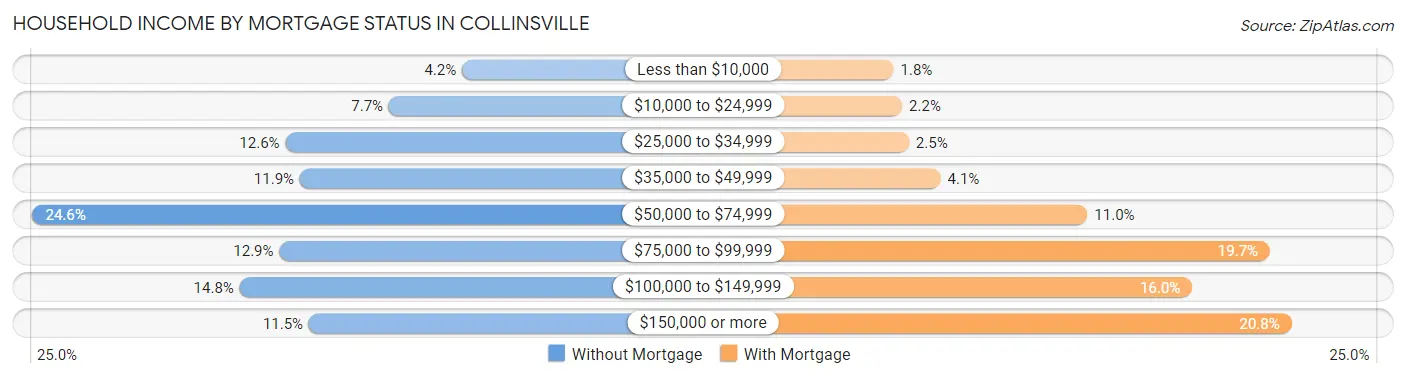
| Household Income | Without Mortgage | With Mortgage |
| Less than $10,000 | 115 (4.2%) | 79 (1.8%) |
| $10,000 to $24,999 | 211 (7.6%) | 97 (2.2%) |
| $25,000 to $34,999 | 347 (12.6%) | 111 (2.5%) |
| $35,000 to $49,999 | 328 (11.9%) | 177 (4.1%) |
| $50,000 to $74,999 | 679 (24.6%) | 483 (11.0%) |
| $75,000 to $99,999 | 355 (12.9%) | 863 (19.7%) |
| $100,000 to $149,999 | 407 (14.8%) | 701 (16.0%) |
| $150,000 or more | 316 (11.5%) | 908 (20.8%) |
| Total | 2,758 (100.0%) | 4,374 (100.0%) |
Property Value to Household Income Ratio in Collinsville
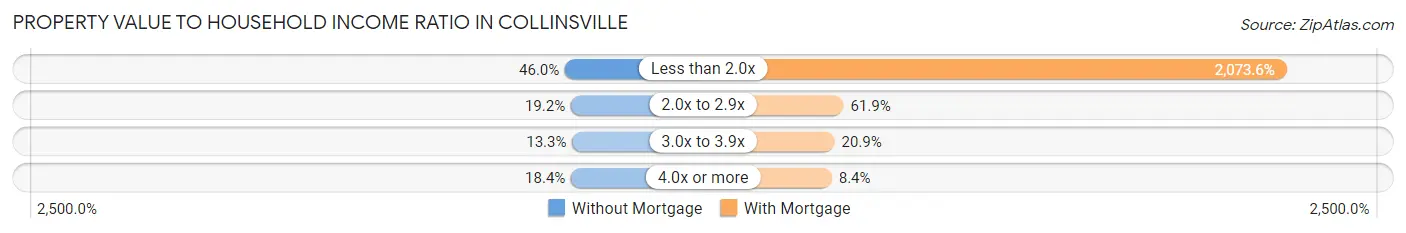
| Value-to-Income Ratio | Without Mortgage | With Mortgage |
| Less than 2.0x | 1,268 (46.0%) | 90,701 (2,073.6%) |
| 2.0x to 2.9x | 530 (19.2%) | 2,708 (61.9%) |
| 3.0x to 3.9x | 366 (13.3%) | 914 (20.9%) |
| 4.0x or more | 508 (18.4%) | 367 (8.4%) |
| Total | 2,758 (100.0%) | 4,374 (100.0%) |
Real Estate Taxes by Mortgage Status in Collinsville
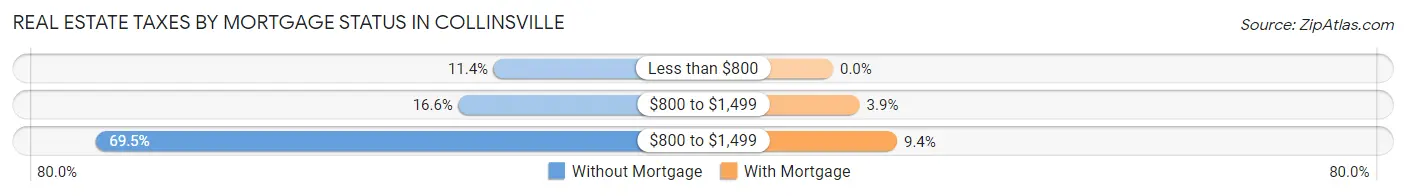
| Property Taxes | Without Mortgage | With Mortgage |
| Less than $800 | 315 (11.4%) | 0 (0.0%) |
| $800 to $1,499 | 457 (16.6%) | 170 (3.9%) |
| $800 to $1,499 | 1,917 (69.5%) | 409 (9.3%) |
| Total | 2,758 (100.0%) | 4,374 (100.0%) |
Health & Disability in Collinsville
Health Insurance Coverage by Age in Collinsville
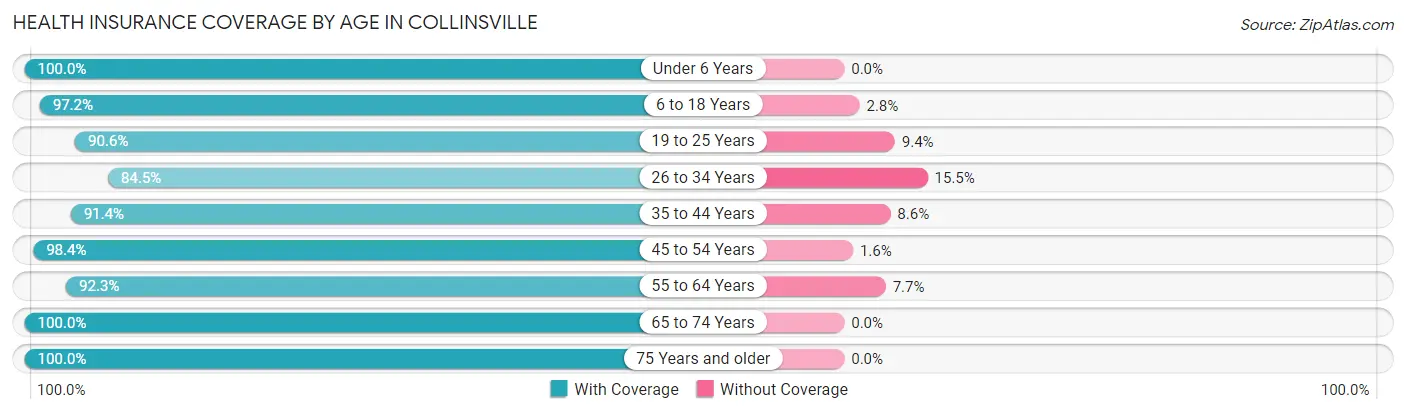
| Age Bracket | With Coverage | Without Coverage |
| Under 6 Years | 1,481 (100.0%) | 0 (0.0%) |
| 6 to 18 Years | 3,495 (97.2%) | 102 (2.8%) |
| 19 to 25 Years | 1,654 (90.6%) | 172 (9.4%) |
| 26 to 34 Years | 2,495 (84.5%) | 459 (15.5%) |
| 35 to 44 Years | 3,594 (91.4%) | 338 (8.6%) |
| 45 to 54 Years | 2,999 (98.4%) | 49 (1.6%) |
| 55 to 64 Years | 2,769 (92.3%) | 232 (7.7%) |
| 65 to 74 Years | 2,610 (100.0%) | 0 (0.0%) |
| 75 Years and older | 1,689 (100.0%) | 0 (0.0%) |
| Total | 22,786 (94.4%) | 1,352 (5.6%) |
Health Insurance Coverage by Citizenship Status in Collinsville
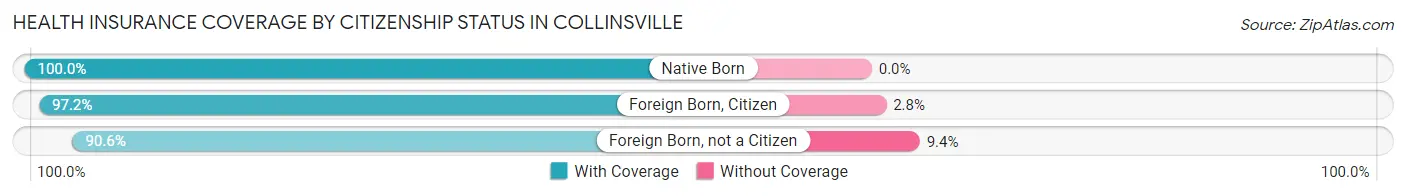
| Citizenship Status | With Coverage | Without Coverage |
| Native Born | 1,481 (100.0%) | 0 (0.0%) |
| Foreign Born, Citizen | 3,495 (97.2%) | 102 (2.8%) |
| Foreign Born, not a Citizen | 1,654 (90.6%) | 172 (9.4%) |
Health Insurance Coverage by Household Income in Collinsville
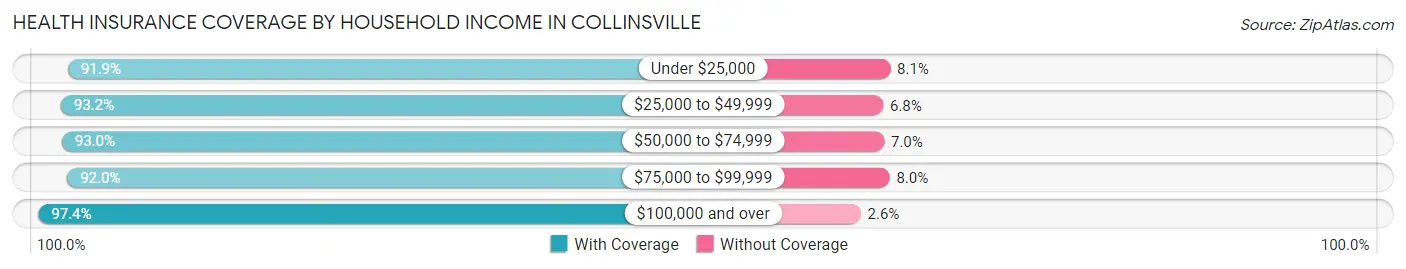
| Household Income | With Coverage | Without Coverage |
| Under $25,000 | 2,256 (91.9%) | 199 (8.1%) |
| $25,000 to $49,999 | 4,643 (93.2%) | 338 (6.8%) |
| $50,000 to $74,999 | 4,023 (93.0%) | 302 (7.0%) |
| $75,000 to $99,999 | 3,292 (92.0%) | 286 (8.0%) |
| $100,000 and over | 8,547 (97.4%) | 227 (2.6%) |
Public vs Private Health Insurance Coverage by Age in Collinsville
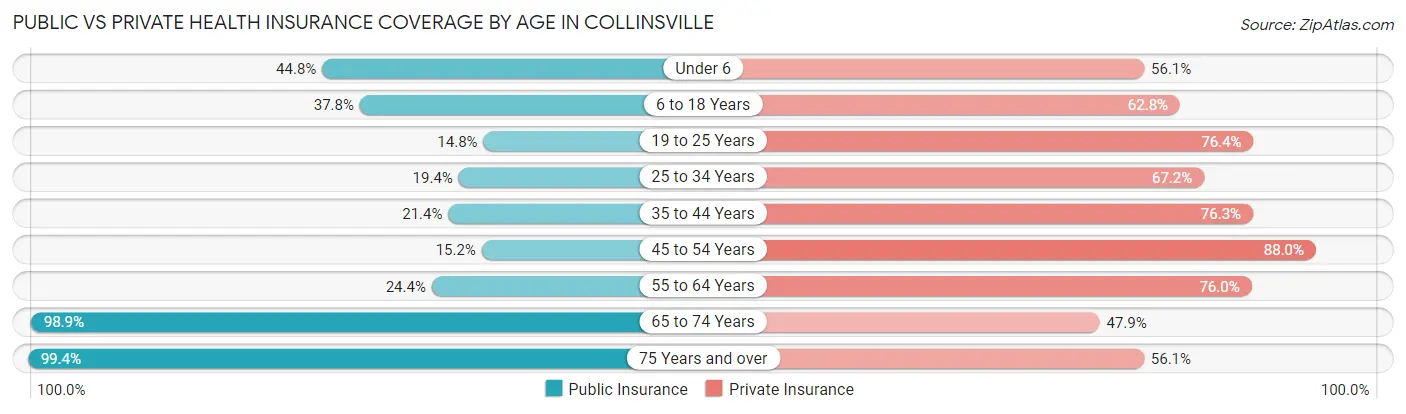
| Age Bracket | Public Insurance | Private Insurance |
| Under 6 | 663 (44.8%) | 831 (56.1%) |
| 6 to 18 Years | 1,359 (37.8%) | 2,257 (62.7%) |
| 19 to 25 Years | 271 (14.8%) | 1,395 (76.4%) |
| 25 to 34 Years | 574 (19.4%) | 1,986 (67.2%) |
| 35 to 44 Years | 840 (21.4%) | 3,000 (76.3%) |
| 45 to 54 Years | 462 (15.2%) | 2,682 (88.0%) |
| 55 to 64 Years | 733 (24.4%) | 2,282 (76.0%) |
| 65 to 74 Years | 2,580 (98.9%) | 1,249 (47.8%) |
| 75 Years and over | 1,679 (99.4%) | 947 (56.1%) |
| Total | 9,161 (38.0%) | 16,629 (68.9%) |
Disability Status by Sex by Age in Collinsville
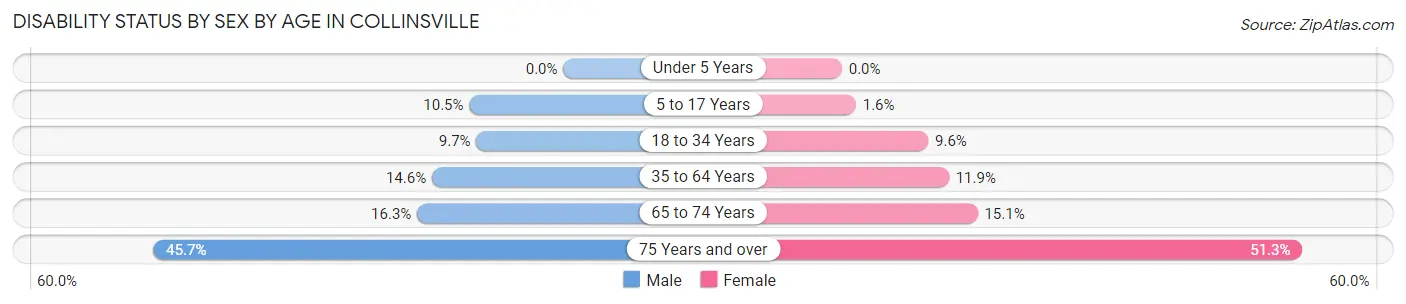
| Age Bracket | Male | Female |
| Under 5 Years | 0 (0.0%) | 0 (0.0%) |
| 5 to 17 Years | 182 (10.5%) | 26 (1.6%) |
| 18 to 34 Years | 248 (9.7%) | 256 (9.6%) |
| 35 to 64 Years | 740 (14.6%) | 586 (11.9%) |
| 65 to 74 Years | 204 (16.3%) | 205 (15.1%) |
| 75 Years and over | 254 (45.7%) | 581 (51.3%) |
Disability Class by Sex by Age in Collinsville
Disability Class: Hearing Difficulty
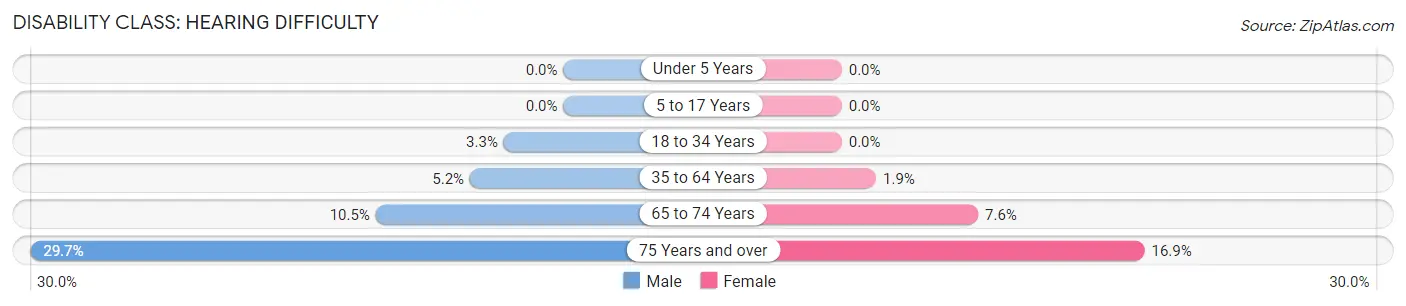
| Age Bracket | Male | Female |
| Under 5 Years | 0 (0.0%) | 0 (0.0%) |
| 5 to 17 Years | 0 (0.0%) | 0 (0.0%) |
| 18 to 34 Years | 85 (3.3%) | 0 (0.0%) |
| 35 to 64 Years | 263 (5.2%) | 94 (1.9%) |
| 65 to 74 Years | 131 (10.4%) | 103 (7.6%) |
| 75 Years and over | 165 (29.7%) | 191 (16.9%) |
Disability Class: Vision Difficulty
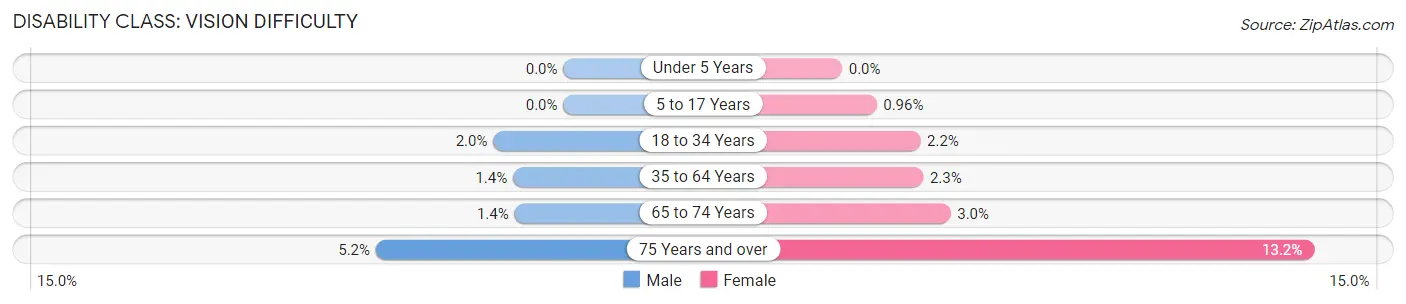
| Age Bracket | Male | Female |
| Under 5 Years | 0 (0.0%) | 0 (0.0%) |
| 5 to 17 Years | 0 (0.0%) | 16 (1.0%) |
| 18 to 34 Years | 50 (1.9%) | 58 (2.2%) |
| 35 to 64 Years | 71 (1.4%) | 111 (2.3%) |
| 65 to 74 Years | 17 (1.4%) | 41 (3.0%) |
| 75 Years and over | 29 (5.2%) | 149 (13.2%) |
Disability Class: Cognitive Difficulty
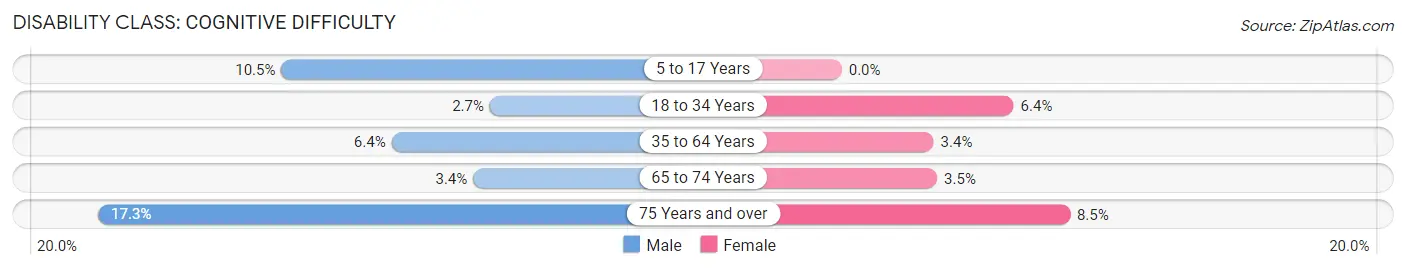
| Age Bracket | Male | Female |
| 5 to 17 Years | 182 (10.5%) | 0 (0.0%) |
| 18 to 34 Years | 70 (2.7%) | 170 (6.4%) |
| 35 to 64 Years | 323 (6.4%) | 168 (3.4%) |
| 65 to 74 Years | 42 (3.4%) | 48 (3.5%) |
| 75 Years and over | 96 (17.3%) | 96 (8.5%) |
Disability Class: Ambulatory Difficulty
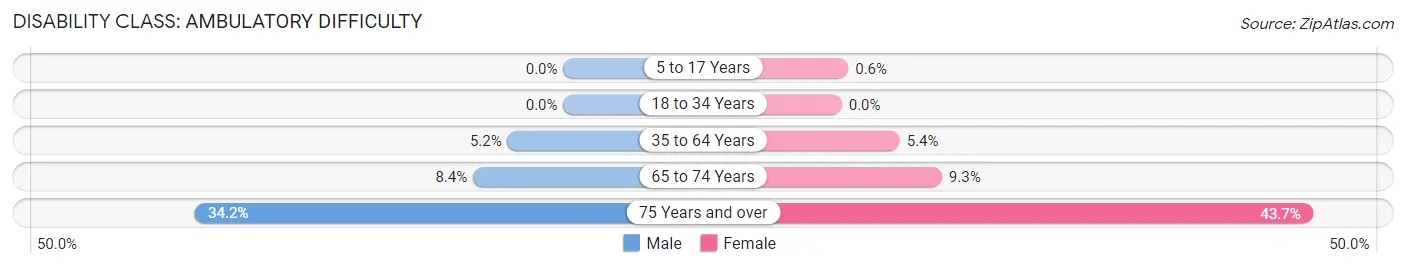
| Age Bracket | Male | Female |
| 5 to 17 Years | 0 (0.0%) | 10 (0.6%) |
| 18 to 34 Years | 0 (0.0%) | 0 (0.0%) |
| 35 to 64 Years | 262 (5.2%) | 265 (5.4%) |
| 65 to 74 Years | 105 (8.4%) | 126 (9.3%) |
| 75 Years and over | 190 (34.2%) | 495 (43.7%) |
Disability Class: Self-Care Difficulty
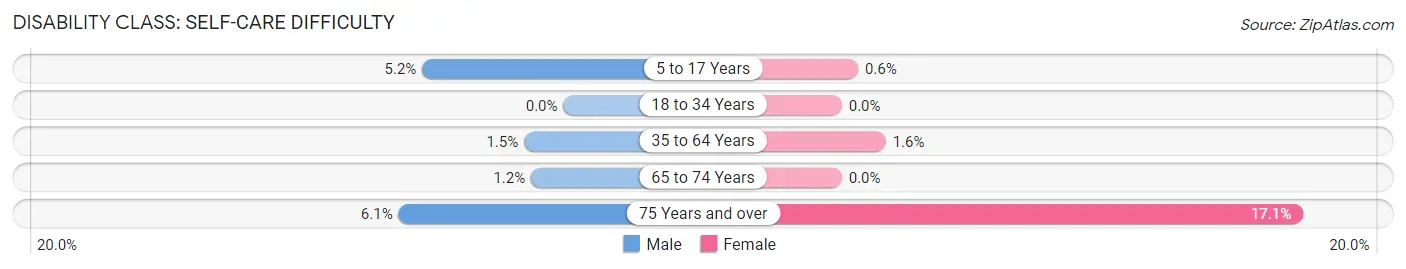
| Age Bracket | Male | Female |
| 5 to 17 Years | 91 (5.2%) | 10 (0.6%) |
| 18 to 34 Years | 0 (0.0%) | 0 (0.0%) |
| 35 to 64 Years | 74 (1.5%) | 80 (1.6%) |
| 65 to 74 Years | 15 (1.2%) | 0 (0.0%) |
| 75 Years and over | 34 (6.1%) | 194 (17.1%) |
Technology Access in Collinsville
Computing Device Access in Collinsville
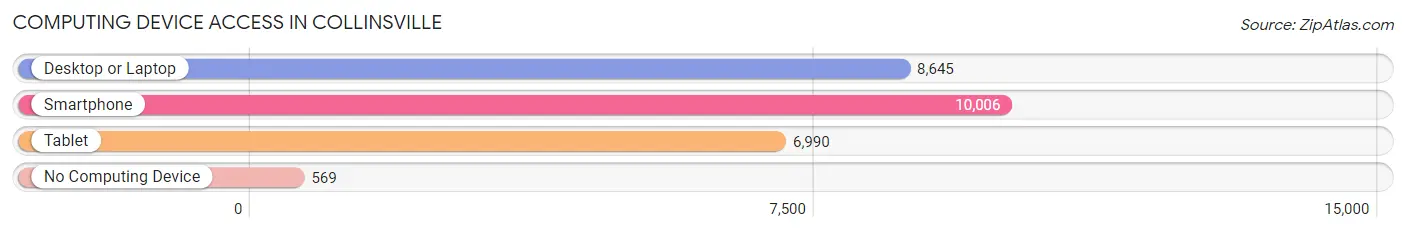
| Device Type | # Households | % Households |
| Desktop or Laptop | 8,645 | 78.0% |
| Smartphone | 10,006 | 90.2% |
| Tablet | 6,990 | 63.0% |
| No Computing Device | 569 | 5.1% |
| Total | 11,089 | 100.0% |
Internet Access in Collinsville
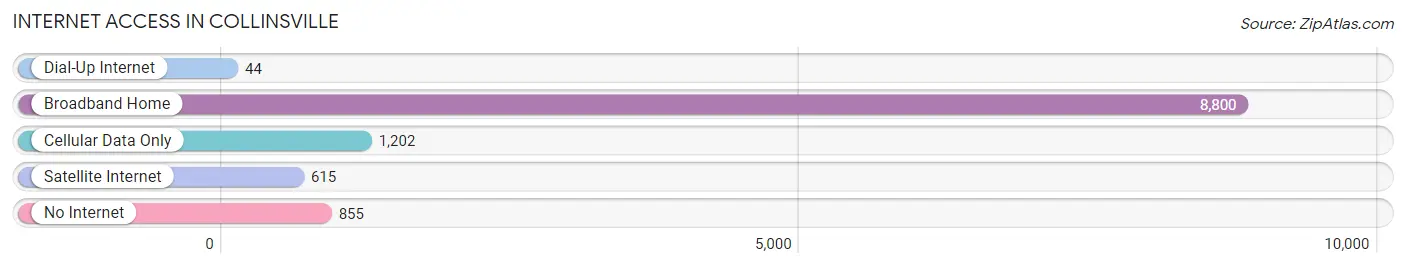
| Internet Type | # Households | % Households |
| Dial-Up Internet | 44 | 0.4% |
| Broadband Home | 8,800 | 79.4% |
| Cellular Data Only | 1,202 | 10.8% |
| Satellite Internet | 615 | 5.6% |
| No Internet | 855 | 7.7% |
| Total | 11,089 | 100.0% |
Collinsville Summary
History
The city of Collinsville, Illinois is located in Madison County, just east of St. Louis, Missouri. It is part of the Metro-East region of the St. Louis metropolitan area. The city was founded in 1810 by John Collins, a Revolutionary War veteran, and was originally known as Collins’ Settlement. The city was officially incorporated in 1859.
Collinsville has a rich history of industry and manufacturing. In the late 19th century, the city was home to several brickyards, coal mines, and glass factories. The city was also home to the first commercial oil well in the United States, which was drilled in 1858. The city was also home to the first commercial oil refinery in the United States, which was built in 1864.
In the early 20th century, Collinsville was home to several large manufacturing companies, including the International Shoe Company, the American Steel and Wire Company, and the Collinsville Canning Company. The city was also home to the first drive-in movie theater in the United States, which opened in 1933.
Geography
Collinsville is located in southwestern Illinois, in Madison County. The city is situated on the bluffs of the Mississippi River, and is bordered by the cities of Edwardsville, Maryville, and Troy. The city has a total area of 8.3 square miles, of which 8.2 square miles is land and 0.1 square miles is water.
The city has a humid continental climate, with hot, humid summers and cold, snowy winters. The average annual temperature is 54°F, and the average annual precipitation is 40 inches.
Economy
Collinsville’s economy is largely based on manufacturing and retail. The city is home to several large manufacturing companies, including the International Shoe Company, the American Steel and Wire Company, and the Collinsville Canning Company. The city is also home to several large retail stores, including Walmart, Target, and Kohl’s.
The city is also home to several large employers, including the Anderson Hospital, the Collinsville School District, and the Madison County government. The city is also home to several small businesses, including restaurants, bars, and shops.
Demographics
As of the 2010 census, the city of Collinsville had a population of 25,579. The racial makeup of the city was 87.3% White, 8.2% African American, 0.7% Native American, 0.9% Asian, 0.1% Pacific Islander, 1.2% from other races, and 1.6% from two or more races. Hispanic or Latino of any race were 3.3% of the population.
The median household income in Collinsville was $45,945, and the median family income was $54,945. The per capita income for the city was $22,845. About 8.3% of families and 10.7% of the population were below the poverty line, including 15.2% of those under age 18 and 6.2% of those age 65 or over.
Common Questions
What is Per Capita Income in Collinsville?
Per Capita income in Collinsville is $39,666.
What is the Median Family Income in Collinsville?
Median Family Income in Collinsville is $85,686.
What is the Median Household income in Collinsville?
Median Household Income in Collinsville is $63,155.
What is Income or Wage Gap in Collinsville?
Income or Wage Gap in Collinsville is 33.8%.
Women in Collinsville earn 66.2 cents for every dollar earned by a man.
What is Family Income Deficit in Collinsville?
Family Income Deficit in Collinsville is $7,608.
Families that are below poverty line in Collinsville earn $7,608 less on average than the poverty threshold level.
What is Inequality or Gini Index in Collinsville?
Inequality or Gini Index in Collinsville is 0.45.
What is the Total Population of Collinsville?
Total Population of Collinsville is 24,294.
What is the Total Male Population of Collinsville?
Total Male Population of Collinsville is 11,898.
What is the Total Female Population of Collinsville?
Total Female Population of Collinsville is 12,396.
What is the Ratio of Males per 100 Females in Collinsville?
There are 95.98 Males per 100 Females in Collinsville.
What is the Ratio of Females per 100 Males in Collinsville?
There are 104.19 Females per 100 Males in Collinsville.
What is the Median Population Age in Collinsville?
Median Population Age in Collinsville is 39.9 Years.
What is the Average Family Size in Collinsville
Average Family Size in Collinsville is 2.9 People.
What is the Average Household Size in Collinsville
Average Household Size in Collinsville is 2.2 People.
How Large is the Labor Force in Collinsville?
There are 13,709 People in the Labor Forcein in Collinsville.
What is the Percentage of People in the Labor Force in Collinsville?
68.0% of People are in the Labor Force in Collinsville.
What is the Unemployment Rate in Collinsville?
Unemployment Rate in Collinsville is 4.6%.