Dekalb, IL Map & Demographics
Dekalb Map
Dekalb Overview
$26,761
PER CAPITA INCOME
$69,100
AVG FAMILY INCOME
$47,410
AVG HOUSEHOLD INCOME
46.4%
WAGE / INCOME GAP [ % ]
53.6¢/ $1
WAGE / INCOME GAP [ $ ]
$12,315
FAMILY INCOME DEFICIT
0.49
INEQUALITY / GINI INDEX
40,697
TOTAL POPULATION
20,287
MALE POPULATION
20,410
FEMALE POPULATION
99.40
MALES / 100 FEMALES
100.61
FEMALES / 100 MALES
24.9
MEDIAN AGE
3.1
AVG FAMILY SIZE
2.3
AVG HOUSEHOLD SIZE
22,823
LABOR FORCE [ PEOPLE ]
67.3%
PERCENT IN LABOR FORCE
10.7%
UNEMPLOYMENT RATE
Dekalb Zip Codes
Income in Dekalb
Income Overview in Dekalb
Per Capita Income in Dekalb is $26,761, while median incomes of families and households are $69,100 and $47,410 respectively.
| Characteristic | Number | Measure |
| Per Capita Income | 40,697 | $26,761 |
| Median Family Income | 7,633 | $69,100 |
| Mean Family Income | 7,633 | $85,275 |
| Median Household Income | 16,043 | $47,410 |
| Mean Household Income | 16,043 | $65,075 |
| Income Deficit | 7,633 | $12,315 |
| Wage / Income Gap (%) | 40,697 | 46.36% |
| Wage / Income Gap ($) | 40,697 | 53.64¢ per $1 |
| Gini / Inequality Index | 40,697 | 0.49 |
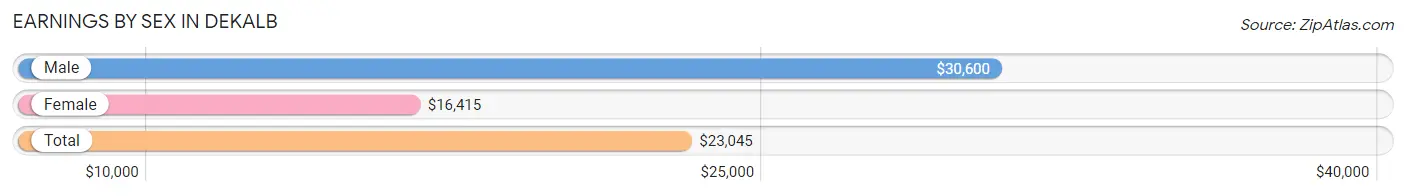
Earnings by Sex in Dekalb
Average Earnings in Dekalb are $23,045, $30,600 for men and $16,415 for women, a difference of 46.4%.
| Sex | Number | Average Earnings |
| Male | 13,101 (52.7%) | $30,600 |
| Female | 11,761 (47.3%) | $16,415 |
| Total | 24,862 (100.0%) | $23,045 |
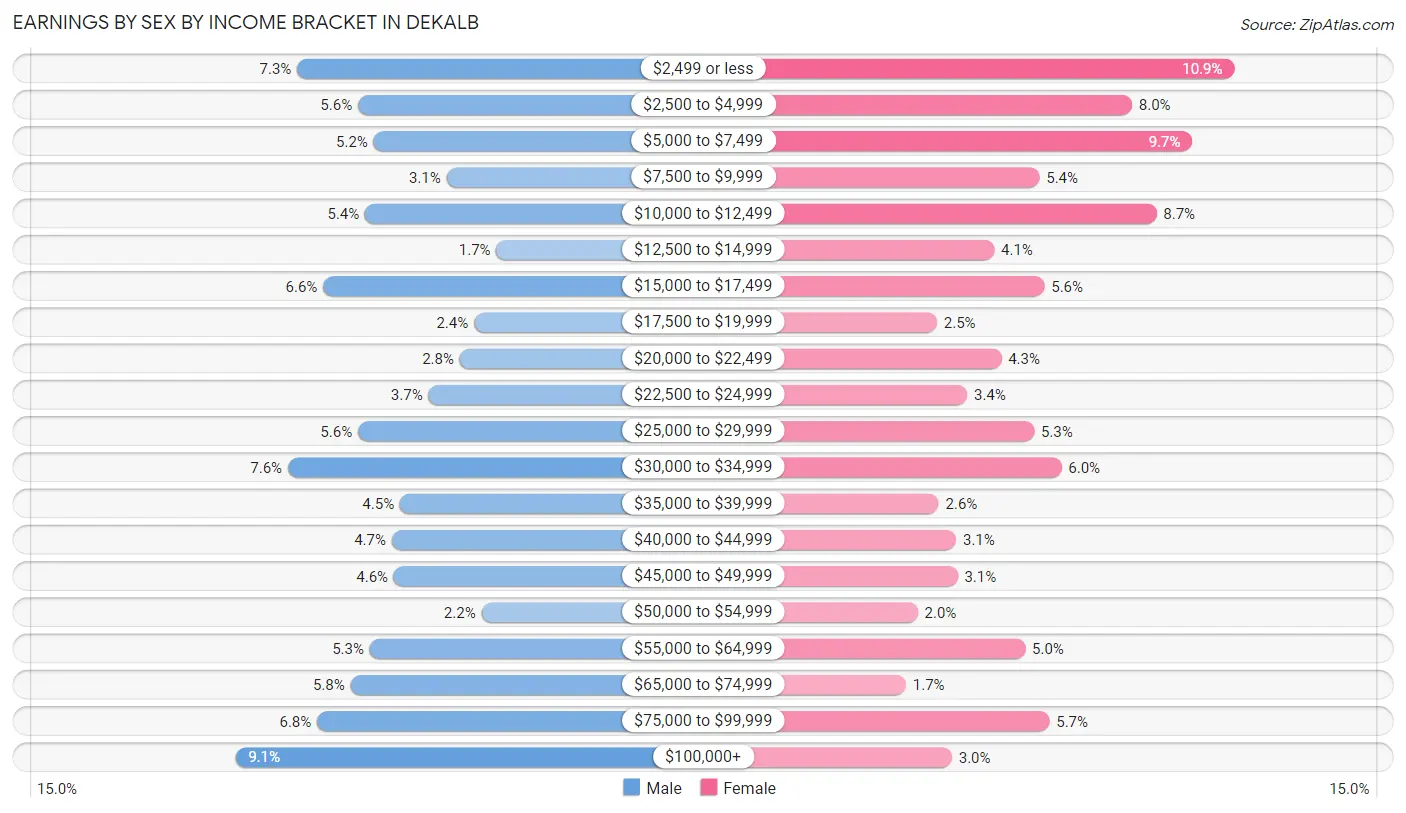
Earnings by Sex by Income Bracket in Dekalb
The most common earnings brackets in Dekalb are $100,000+ for men (1,190 | 9.1%) and $2,499 or less for women (1,281 | 10.9%).
| Income | Male | Female |
| $2,499 or less | 961 (7.3%) | 1,281 (10.9%) |
| $2,500 to $4,999 | 737 (5.6%) | 942 (8.0%) |
| $5,000 to $7,499 | 680 (5.2%) | 1,142 (9.7%) |
| $7,500 to $9,999 | 412 (3.1%) | 636 (5.4%) |
| $10,000 to $12,499 | 711 (5.4%) | 1,023 (8.7%) |
| $12,500 to $14,999 | 228 (1.7%) | 487 (4.1%) |
| $15,000 to $17,499 | 866 (6.6%) | 653 (5.6%) |
| $17,500 to $19,999 | 311 (2.4%) | 297 (2.5%) |
| $20,000 to $22,499 | 363 (2.8%) | 510 (4.3%) |
| $22,500 to $24,999 | 478 (3.6%) | 398 (3.4%) |
| $25,000 to $29,999 | 737 (5.6%) | 619 (5.3%) |
| $30,000 to $34,999 | 996 (7.6%) | 709 (6.0%) |
| $35,000 to $39,999 | 583 (4.4%) | 303 (2.6%) |
| $40,000 to $44,999 | 613 (4.7%) | 361 (3.1%) |
| $45,000 to $49,999 | 605 (4.6%) | 366 (3.1%) |
| $50,000 to $54,999 | 283 (2.2%) | 234 (2.0%) |
| $55,000 to $64,999 | 694 (5.3%) | 589 (5.0%) |
| $65,000 to $74,999 | 765 (5.8%) | 195 (1.7%) |
| $75,000 to $99,999 | 888 (6.8%) | 669 (5.7%) |
| $100,000+ | 1,190 (9.1%) | 347 (2.9%) |
| Total | 13,101 (100.0%) | 11,761 (100.0%) |
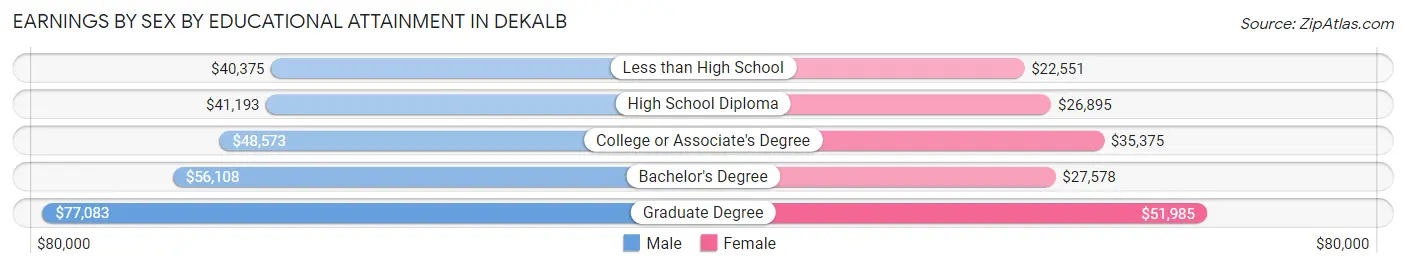
Earnings by Sex by Educational Attainment in Dekalb
Average earnings in Dekalb are $47,869 for men and $31,018 for women, a difference of 35.2%. Men with an educational attainment of graduate degree enjoy the highest average annual earnings of $77,083, while those with less than high school education earn the least with $40,375. Women with an educational attainment of graduate degree earn the most with the average annual earnings of $51,985, while those with less than high school education have the smallest earnings of $22,551.
| Educational Attainment | Male Income | Female Income |
| Less than High School | $40,375 | $22,551 |
| High School Diploma | $41,193 | $26,895 |
| College or Associate's Degree | $48,573 | $35,375 |
| Bachelor's Degree | $56,108 | $27,578 |
| Graduate Degree | $77,083 | $51,985 |
| Total | $47,869 | $31,018 |
Family Income in Dekalb
Family Income Brackets in Dekalb
According to the Dekalb family income data, there are 1,321 families falling into the $100,000 to $149,999 income range, which is the most common income bracket and makes up 17.3% of all families. Conversely, the $10,000 to $14,999 income bracket is the least frequent group with only 237 families (3.1%) belonging to this category.
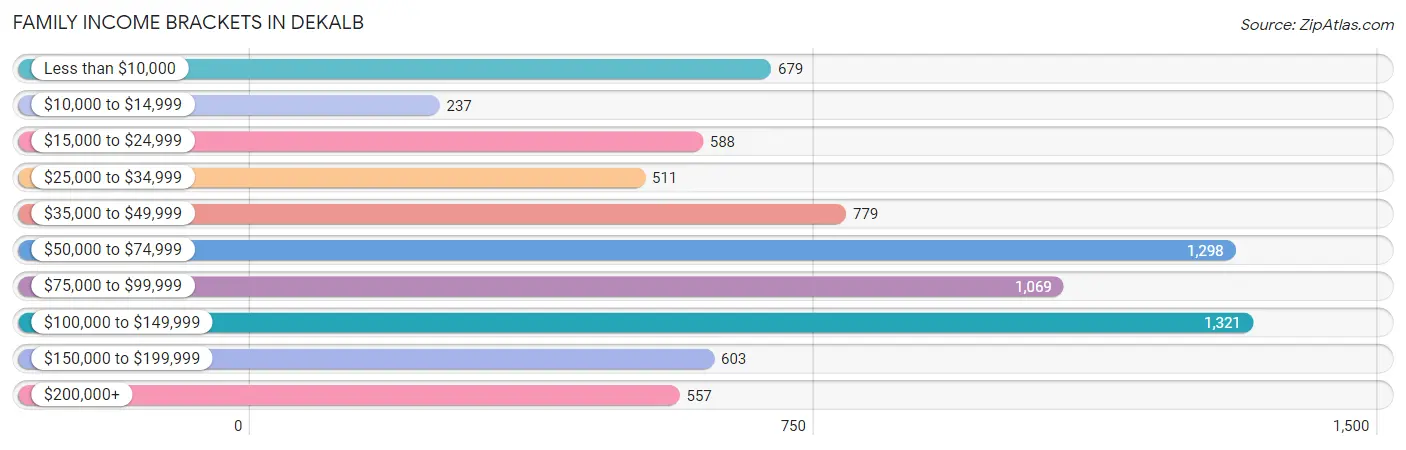
| Income Bracket | # Families | % Families |
| Less than $10,000 | 679 | 8.9% |
| $10,000 to $14,999 | 237 | 3.1% |
| $15,000 to $24,999 | 588 | 7.7% |
| $25,000 to $34,999 | 511 | 6.7% |
| $35,000 to $49,999 | 779 | 10.2% |
| $50,000 to $74,999 | 1,298 | 17.0% |
| $75,000 to $99,999 | 1,069 | 14.0% |
| $100,000 to $149,999 | 1,321 | 17.3% |
| $150,000 to $199,999 | 603 | 7.9% |
| $200,000+ | 557 | 7.3% |
Family Income by Famaliy Size in Dekalb
6-person families (250 | 3.3%) account for the highest median family income in Dekalb with $118,365 per family, while 2-person families (3,695 | 48.4%) have the highest median income of $31,512 per family member.
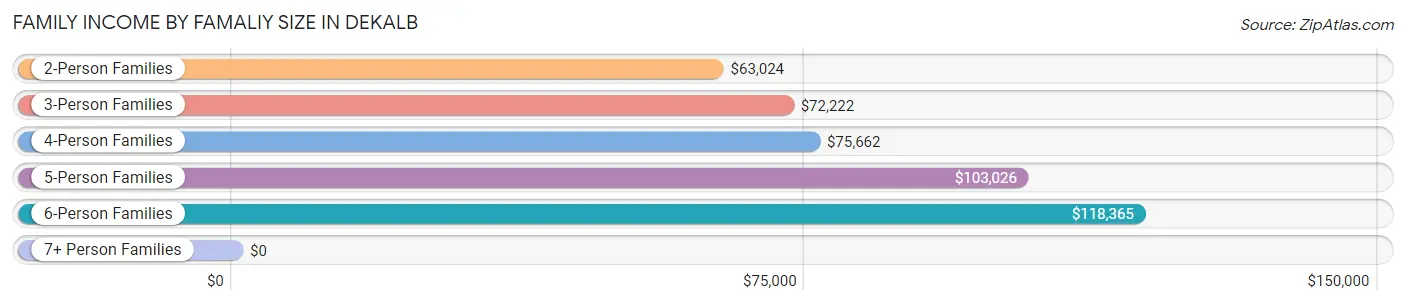
| Income Bracket | # Families | Median Income |
| 2-Person Families | 3,695 (48.4%) | $63,024 |
| 3-Person Families | 1,632 (21.4%) | $72,222 |
| 4-Person Families | 1,342 (17.6%) | $75,662 |
| 5-Person Families | 694 (9.1%) | $103,026 |
| 6-Person Families | 250 (3.3%) | $118,365 |
| 7+ Person Families | 20 (0.3%) | $0 |
| Total | 7,633 (100.0%) | $69,100 |
Family Income by Number of Earners in Dekalb
The median family income in Dekalb is $69,100, with families comprising 3+ earners (815) having the highest median family income of $142,997, while families with 1 earner (2,546) have the lowest median family income of $37,083, accounting for 10.7% and 33.4% of families, respectively.
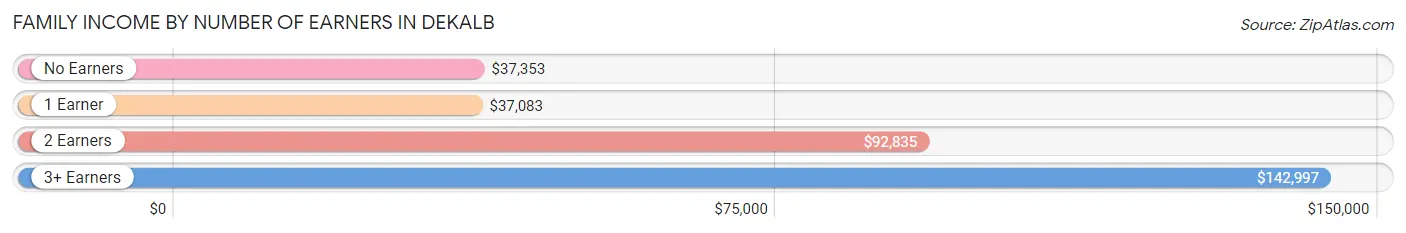
| Number of Earners | # Families | Median Income |
| No Earners | 1,106 (14.5%) | $37,353 |
| 1 Earner | 2,546 (33.4%) | $37,083 |
| 2 Earners | 3,166 (41.5%) | $92,835 |
| 3+ Earners | 815 (10.7%) | $142,997 |
| Total | 7,633 (100.0%) | $69,100 |
Household Income in Dekalb
Household Income Brackets in Dekalb
With 2,535 households falling in the category, the $50,000 to $74,999 income range is the most frequent in Dekalb, accounting for 15.8% of all households. In contrast, only 610 households (3.8%) fall into the $200,000+ income bracket, making it the least populous group.
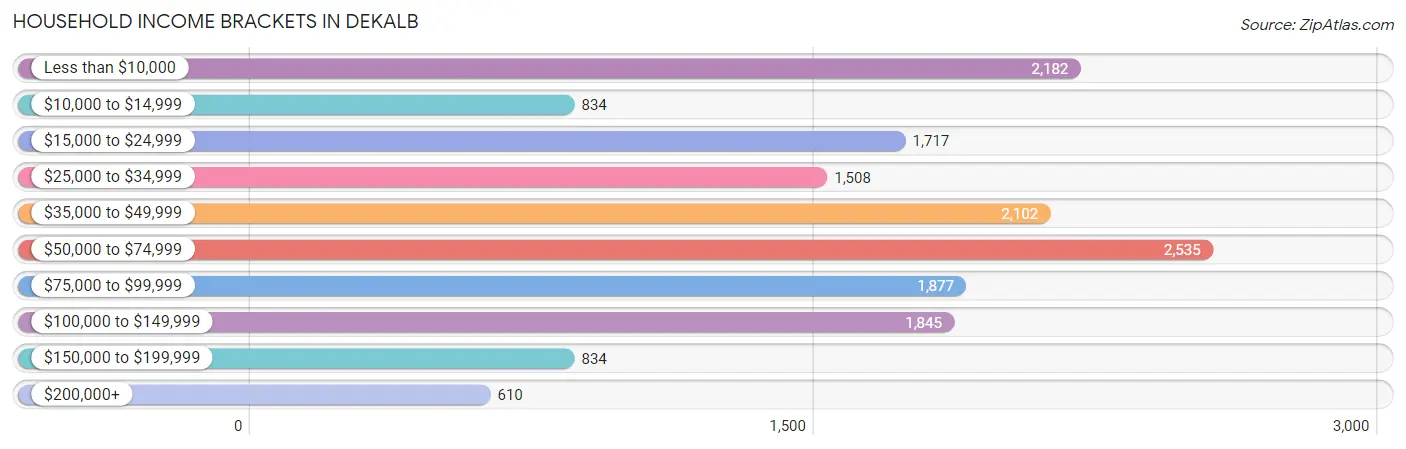
| Income Bracket | # Households | % Households |
| Less than $10,000 | 2,182 | 13.6% |
| $10,000 to $14,999 | 834 | 5.2% |
| $15,000 to $24,999 | 1,717 | 10.7% |
| $25,000 to $34,999 | 1,508 | 9.4% |
| $35,000 to $49,999 | 2,102 | 13.1% |
| $50,000 to $74,999 | 2,535 | 15.8% |
| $75,000 to $99,999 | 1,877 | 11.7% |
| $100,000 to $149,999 | 1,845 | 11.5% |
| $150,000 to $199,999 | 834 | 5.2% |
| $200,000+ | 610 | 3.8% |
Household Income by Householder Age in Dekalb
The median household income in Dekalb is $47,410, with the highest median household income of $79,140 found in the 45 to 64 years age bracket for the primary householder. A total of 4,004 households (25.0%) fall into this category. Meanwhile, the 15 to 24 years age bracket for the primary householder has the lowest median household income of $17,141, with 3,699 households (23.1%) in this group.
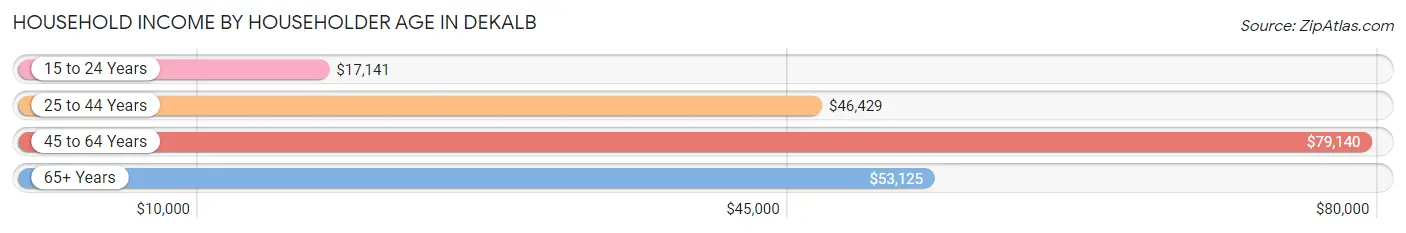
| Income Bracket | # Households | Median Income |
| 15 to 24 Years | 3,699 (23.1%) | $17,141 |
| 25 to 44 Years | 5,711 (35.6%) | $46,429 |
| 45 to 64 Years | 4,004 (25.0%) | $79,140 |
| 65+ Years | 2,629 (16.4%) | $53,125 |
| Total | 16,043 (100.0%) | $47,410 |
Poverty in Dekalb
Income Below Poverty by Sex and Age in Dekalb
With 25.9% poverty level for males and 27.2% for females among the residents of Dekalb, under 5 year old males and 18 to 24 year old females are the most vulnerable to poverty, with 497 males (53.2%) and 2,081 females (47.0%) in their respective age groups living below the poverty level.
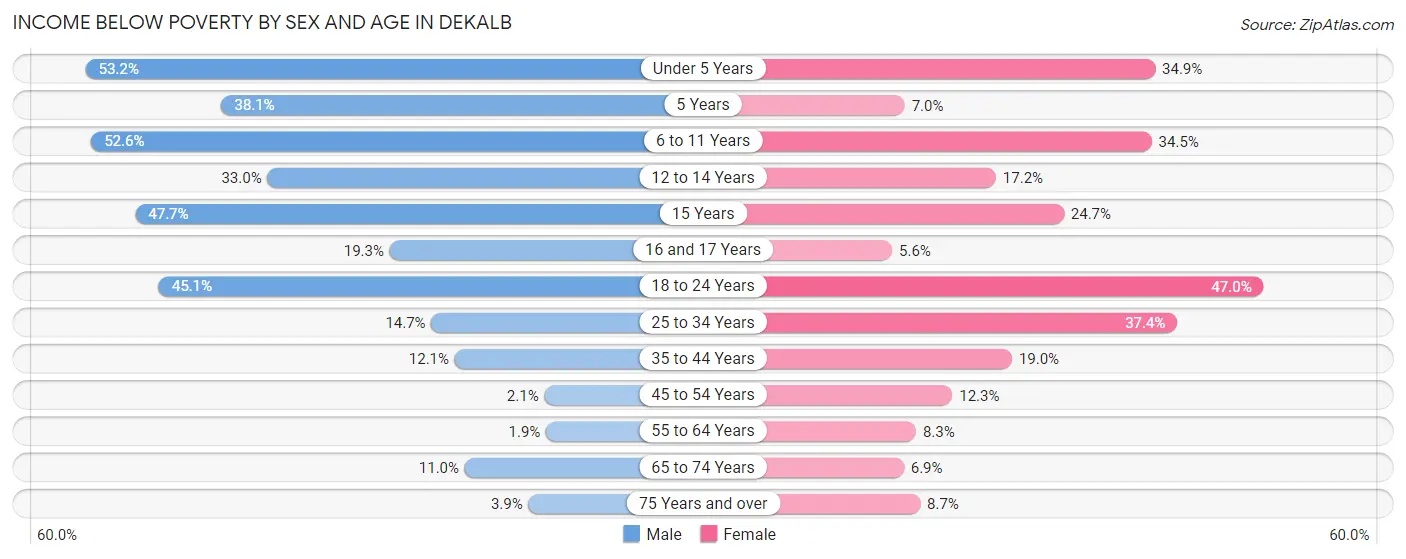
| Age Bracket | Male | Female |
| Under 5 Years | 497 (53.2%) | 314 (34.9%) |
| 5 Years | 155 (38.1%) | 11 (7.0%) |
| 6 to 11 Years | 530 (52.6%) | 499 (34.5%) |
| 12 to 14 Years | 202 (33.0%) | 117 (17.2%) |
| 15 Years | 122 (47.7%) | 69 (24.7%) |
| 16 and 17 Years | 87 (19.3%) | 19 (5.6%) |
| 18 to 24 Years | 2,358 (45.1%) | 2,081 (47.0%) |
| 25 to 34 Years | 453 (14.7%) | 1,004 (37.3%) |
| 35 to 44 Years | 214 (12.1%) | 366 (19.0%) |
| 45 to 54 Years | 36 (2.1%) | 206 (12.3%) |
| 55 to 64 Years | 30 (1.9%) | 131 (8.3%) |
| 65 to 74 Years | 113 (11.0%) | 71 (6.9%) |
| 75 Years and over | 20 (3.9%) | 104 (8.7%) |
| Total | 4,817 (25.9%) | 4,992 (27.2%) |
Income Above Poverty by Sex and Age in Dekalb
According to the poverty statistics in Dekalb, males aged 55 to 64 years and females aged 16 and 17 years are the age groups that are most secure financially, with 98.1% of males and 94.4% of females in these age groups living above the poverty line.
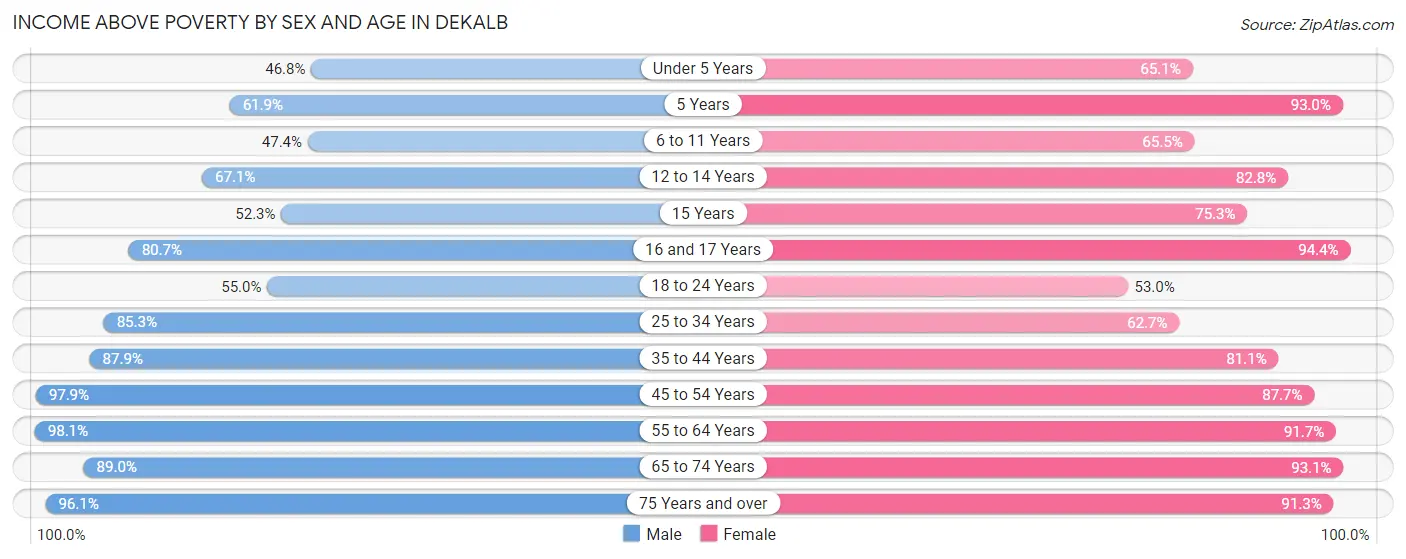
| Age Bracket | Male | Female |
| Under 5 Years | 437 (46.8%) | 586 (65.1%) |
| 5 Years | 252 (61.9%) | 146 (93.0%) |
| 6 to 11 Years | 478 (47.4%) | 947 (65.5%) |
| 12 to 14 Years | 411 (67.0%) | 565 (82.8%) |
| 15 Years | 134 (52.3%) | 210 (75.3%) |
| 16 and 17 Years | 363 (80.7%) | 320 (94.4%) |
| 18 to 24 Years | 2,876 (54.9%) | 2,350 (53.0%) |
| 25 to 34 Years | 2,630 (85.3%) | 1,684 (62.6%) |
| 35 to 44 Years | 1,558 (87.9%) | 1,565 (81.0%) |
| 45 to 54 Years | 1,676 (97.9%) | 1,467 (87.7%) |
| 55 to 64 Years | 1,539 (98.1%) | 1,455 (91.7%) |
| 65 to 74 Years | 917 (89.0%) | 958 (93.1%) |
| 75 Years and over | 495 (96.1%) | 1,089 (91.3%) |
| Total | 13,766 (74.1%) | 13,342 (72.8%) |
Income Below Poverty Among Married-Couple Families in Dekalb
The poverty statistics for married-couple families in Dekalb show that 5.4% or 258 of the total 4,745 families live below the poverty line. Families with 3 or 4 children have the highest poverty rate of 24.9%, comprising of 138 families. On the other hand, families with 1 or 2 children have the lowest poverty rate of 2.3%, which includes 36 families.
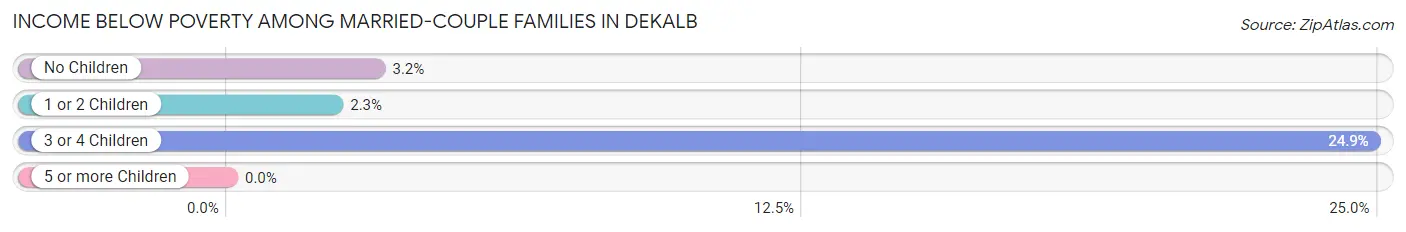
| Children | Above Poverty | Below Poverty |
| No Children | 2,535 (96.8%) | 84 (3.2%) |
| 1 or 2 Children | 1,535 (97.7%) | 36 (2.3%) |
| 3 or 4 Children | 417 (75.1%) | 138 (24.9%) |
| 5 or more Children | 0 (0.0%) | 0 (0.0%) |
| Total | 4,487 (94.6%) | 258 (5.4%) |
Income Below Poverty Among Single-Parent Households in Dekalb
According to the poverty data in Dekalb, 24.9% or 191 single-father households and 45.4% or 963 single-mother households are living below the poverty line. Among single-father households, those with 1 or 2 children have the highest poverty rate, with 109 households (30.1%) experiencing poverty. Likewise, among single-mother households, those with 5 or more children have the highest poverty rate, with 29 households (100.0%) falling below the poverty line.
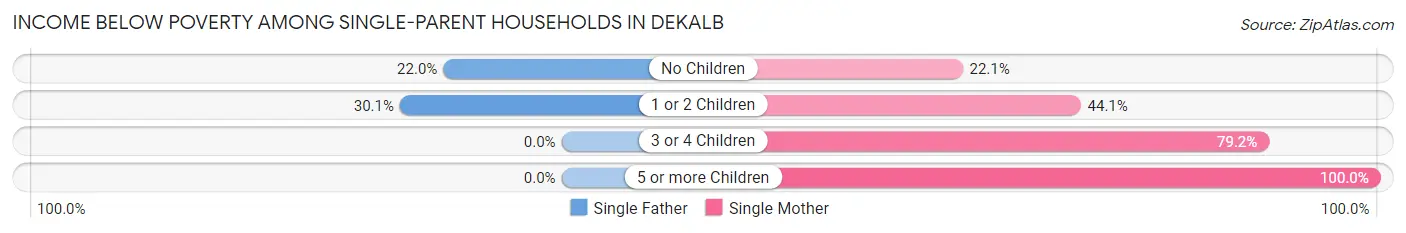
| Children | Single Father | Single Mother |
| No Children | 82 (22.0%) | 147 (22.1%) |
| 1 or 2 Children | 109 (30.1%) | 432 (44.1%) |
| 3 or 4 Children | 0 (0.0%) | 355 (79.2%) |
| 5 or more Children | 0 (0.0%) | 29 (100.0%) |
| Total | 191 (24.9%) | 963 (45.4%) |
Income Below Poverty Among Married-Couple vs Single-Parent Households in Dekalb
The poverty data for Dekalb shows that 258 of the married-couple family households (5.4%) and 1,154 of the single-parent households (40.0%) are living below the poverty level. Within the married-couple family households, those with 3 or 4 children have the highest poverty rate, with 138 households (24.9%) falling below the poverty line. Among the single-parent households, those with 5 or more children have the highest poverty rate, with 29 household (100.0%) living below poverty.
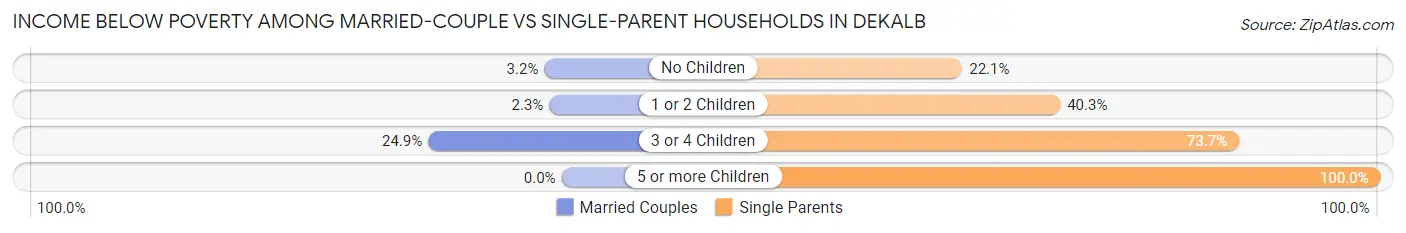
| Children | Married-Couple Families | Single-Parent Households |
| No Children | 84 (3.2%) | 229 (22.1%) |
| 1 or 2 Children | 36 (2.3%) | 541 (40.3%) |
| 3 or 4 Children | 138 (24.9%) | 355 (73.7%) |
| 5 or more Children | 0 (0.0%) | 29 (100.0%) |
| Total | 258 (5.4%) | 1,154 (40.0%) |
Race in Dekalb
The most populous races in Dekalb are White / Caucasian (26,628 | 65.4%), Hispanic or Latino (6,559 | 16.1%), and Black / African American (5,959 | 14.6%).
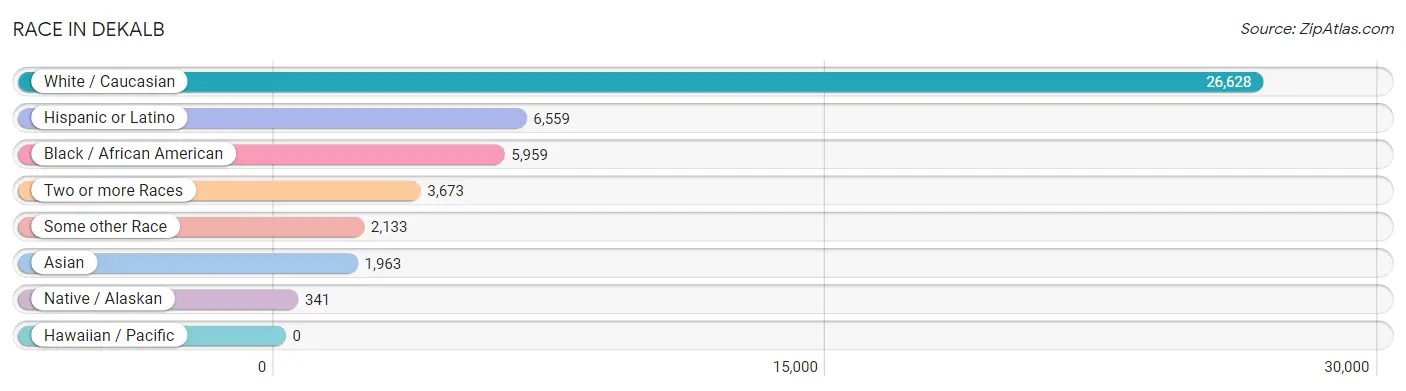
| Race | # Population | % Population |
| Asian | 1,963 | 4.8% |
| Black / African American | 5,959 | 14.6% |
| Hawaiian / Pacific | 0 | 0.0% |
| Hispanic or Latino | 6,559 | 16.1% |
| Native / Alaskan | 341 | 0.8% |
| White / Caucasian | 26,628 | 65.4% |
| Two or more Races | 3,673 | 9.0% |
| Some other Race | 2,133 | 5.2% |
| Total | 40,697 | 100.0% |
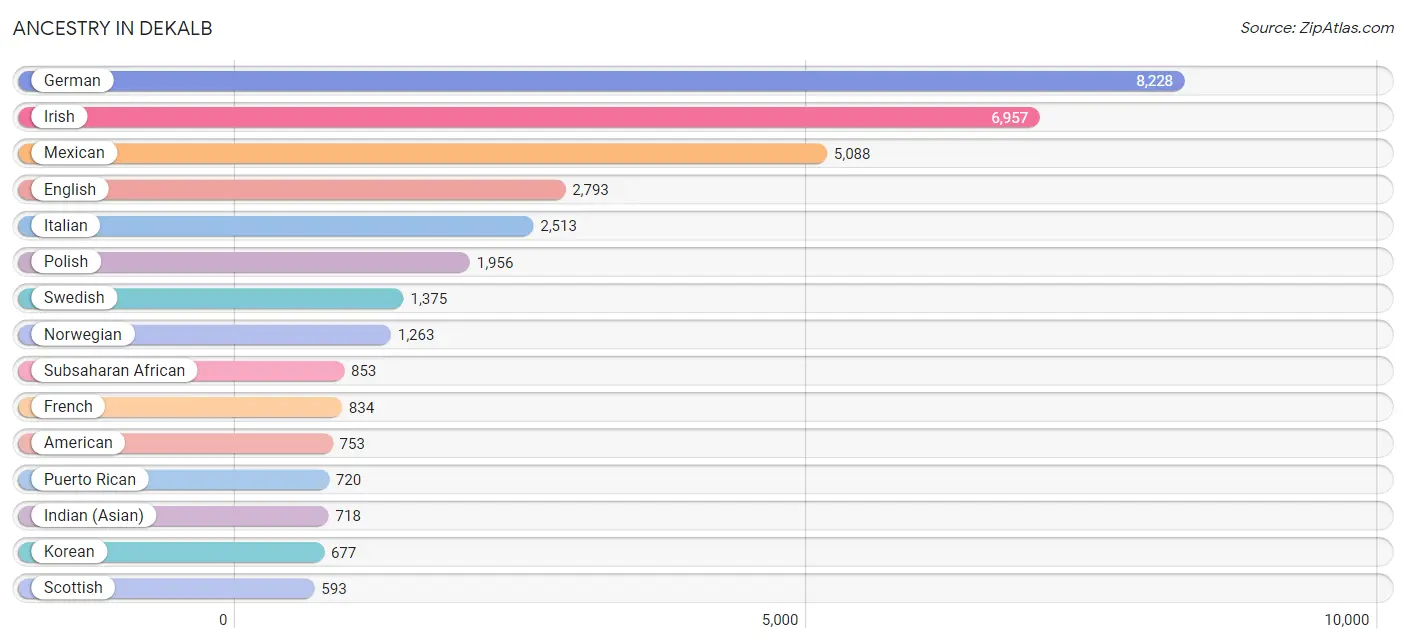
Ancestry in Dekalb
The most populous ancestries reported in Dekalb are German (8,228 | 20.2%), Irish (6,957 | 17.1%), Mexican (5,088 | 12.5%), English (2,793 | 6.9%), and Italian (2,513 | 6.2%), together accounting for 62.8% of all Dekalb residents.
| Ancestry | # Population | % Population |
| African | 218 | 0.5% |
| Albanian | 4 | 0.0% |
| American | 753 | 1.8% |
| Apache | 87 | 0.2% |
| Arab | 543 | 1.3% |
| Argentinean | 3 | 0.0% |
| Australian | 83 | 0.2% |
| Austrian | 74 | 0.2% |
| Belgian | 81 | 0.2% |
| Bhutanese | 149 | 0.4% |
| Blackfeet | 46 | 0.1% |
| Brazilian | 42 | 0.1% |
| British | 137 | 0.3% |
| Burmese | 64 | 0.2% |
| Canadian | 41 | 0.1% |
| Central American | 74 | 0.2% |
| Central American Indian | 197 | 0.5% |
| Cherokee | 130 | 0.3% |
| Chilean | 148 | 0.4% |
| Chippewa | 4 | 0.0% |
| Choctaw | 62 | 0.2% |
| Colombian | 112 | 0.3% |
| Comanche | 2 | 0.0% |
| Costa Rican | 18 | 0.0% |
| Croatian | 68 | 0.2% |
| Cuban | 222 | 0.5% |
| Czech | 396 | 1.0% |
| Czechoslovakian | 19 | 0.1% |
| Danish | 70 | 0.2% |
| Dutch | 270 | 0.7% |
| Eastern European | 15 | 0.0% |
| Egyptian | 6 | 0.0% |
| English | 2,793 | 6.9% |
| Estonian | 56 | 0.1% |
| Ethiopian | 11 | 0.0% |
| European | 553 | 1.4% |
| Finnish | 93 | 0.2% |
| French | 834 | 2.1% |
| French Canadian | 118 | 0.3% |
| German | 8,228 | 20.2% |
| Ghanaian | 64 | 0.2% |
| Greek | 168 | 0.4% |
| Guatemalan | 46 | 0.1% |
| Haitian | 45 | 0.1% |
| Hungarian | 236 | 0.6% |
| Indian (Asian) | 718 | 1.8% |
| Indonesian | 24 | 0.1% |
| Iranian | 41 | 0.1% |
| Irish | 6,957 | 17.1% |
| Israeli | 40 | 0.1% |
| Italian | 2,513 | 6.2% |
| Jamaican | 178 | 0.4% |
| Japanese | 19 | 0.1% |
| Jordanian | 63 | 0.2% |
| Kenyan | 5 | 0.0% |
| Korean | 677 | 1.7% |
| Laotian | 41 | 0.1% |
| Latvian | 33 | 0.1% |
| Lebanese | 5 | 0.0% |
| Lithuanian | 61 | 0.2% |
| Malaysian | 49 | 0.1% |
| Mexican | 5,088 | 12.5% |
| Mexican American Indian | 138 | 0.3% |
| Mongolian | 57 | 0.1% |
| Native Hawaiian | 183 | 0.4% |
| Nigerian | 394 | 1.0% |
| Northern European | 14 | 0.0% |
| Norwegian | 1,263 | 3.1% |
| Pakistani | 79 | 0.2% |
| Palestinian | 288 | 0.7% |
| Peruvian | 22 | 0.1% |
| Polish | 1,956 | 4.8% |
| Puerto Rican | 720 | 1.8% |
| Romanian | 6 | 0.0% |
| Russian | 354 | 0.9% |
| Salvadoran | 10 | 0.0% |
| Samoan | 11 | 0.0% |
| Scandinavian | 86 | 0.2% |
| Scotch-Irish | 169 | 0.4% |
| Scottish | 593 | 1.5% |
| Serbian | 56 | 0.1% |
| Sioux | 47 | 0.1% |
| Slovak | 159 | 0.4% |
| Slovene | 127 | 0.3% |
| Somali | 56 | 0.1% |
| South African | 15 | 0.0% |
| South American | 285 | 0.7% |
| Spaniard | 46 | 0.1% |
| Spanish | 87 | 0.2% |
| Sri Lankan | 23 | 0.1% |
| Subsaharan African | 853 | 2.1% |
| Sudanese | 82 | 0.2% |
| Swedish | 1,375 | 3.4% |
| Swiss | 77 | 0.2% |
| Thai | 525 | 1.3% |
| Turkish | 24 | 0.1% |
| Ukrainian | 203 | 0.5% |
| Vietnamese | 22 | 0.1% |
| Welsh | 182 | 0.4% |
| Yugoslavian | 12 | 0.0% | View All 100 Rows |
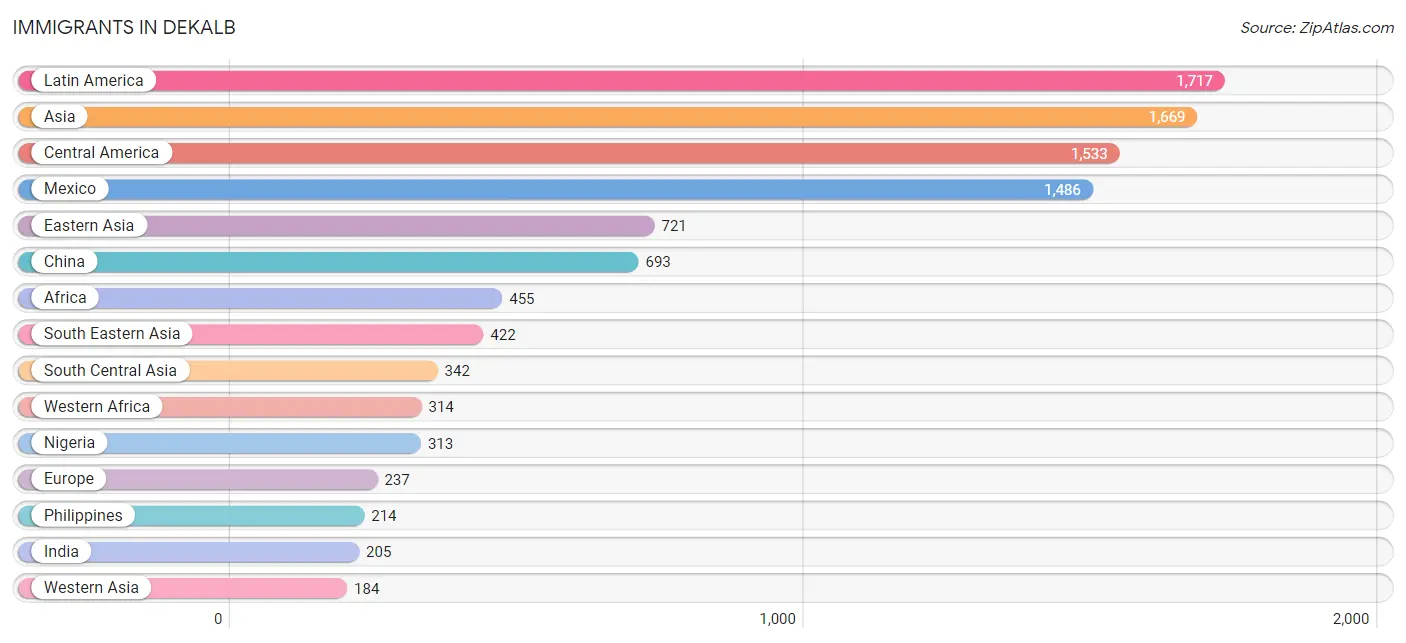
Immigrants in Dekalb
The most numerous immigrant groups reported in Dekalb came from Latin America (1,717 | 4.2%), Asia (1,669 | 4.1%), Central America (1,533 | 3.8%), Mexico (1,486 | 3.6%), and Eastern Asia (721 | 1.8%), together accounting for 17.5% of all Dekalb residents.
| Immigration Origin | # Population | % Population |
| Africa | 455 | 1.1% |
| Albania | 4 | 0.0% |
| Asia | 1,669 | 4.1% |
| Bangladesh | 4 | 0.0% |
| Belarus | 22 | 0.1% |
| Brazil | 21 | 0.1% |
| Cambodia | 6 | 0.0% |
| Caribbean | 53 | 0.1% |
| Central America | 1,533 | 3.8% |
| Chile | 50 | 0.1% |
| China | 693 | 1.7% |
| Colombia | 38 | 0.1% |
| Cuba | 8 | 0.0% |
| Eastern Africa | 27 | 0.1% |
| Eastern Asia | 721 | 1.8% |
| Eastern Europe | 105 | 0.3% |
| El Salvador | 1 | 0.0% |
| England | 15 | 0.0% |
| Europe | 237 | 0.6% |
| France | 9 | 0.0% |
| Germany | 36 | 0.1% |
| Greece | 15 | 0.0% |
| Guatemala | 46 | 0.1% |
| Haiti | 45 | 0.1% |
| Hong Kong | 13 | 0.0% |
| Hungary | 11 | 0.0% |
| India | 205 | 0.5% |
| Indonesia | 41 | 0.1% |
| Iran | 41 | 0.1% |
| Ireland | 17 | 0.0% |
| Japan | 25 | 0.1% |
| Kazakhstan | 1 | 0.0% |
| Kenya | 27 | 0.1% |
| Korea | 3 | 0.0% |
| Laos | 49 | 0.1% |
| Latin America | 1,717 | 4.2% |
| Malaysia | 57 | 0.1% |
| Mexico | 1,486 | 3.6% |
| Middle Africa | 3 | 0.0% |
| Nepal | 7 | 0.0% |
| Nigeria | 313 | 0.8% |
| Northern Africa | 76 | 0.2% |
| Northern Europe | 59 | 0.1% |
| Pakistan | 6 | 0.0% |
| Peru | 22 | 0.1% |
| Philippines | 214 | 0.5% |
| Poland | 31 | 0.1% |
| Russia | 17 | 0.0% |
| Saudi Arabia | 142 | 0.4% |
| South Africa | 35 | 0.1% |
| South America | 131 | 0.3% |
| South Central Asia | 342 | 0.8% |
| South Eastern Asia | 422 | 1.0% |
| Southern Europe | 28 | 0.1% |
| Spain | 13 | 0.0% |
| Sudan | 60 | 0.2% |
| Sweden | 10 | 0.0% |
| Taiwan | 63 | 0.2% |
| Thailand | 31 | 0.1% |
| Turkey | 6 | 0.0% |
| Ukraine | 20 | 0.1% |
| Uzbekistan | 12 | 0.0% |
| Western Africa | 314 | 0.8% |
| Western Asia | 184 | 0.4% |
| Western Europe | 45 | 0.1% |
| Zaire | 3 | 0.0% | View All 66 Rows |
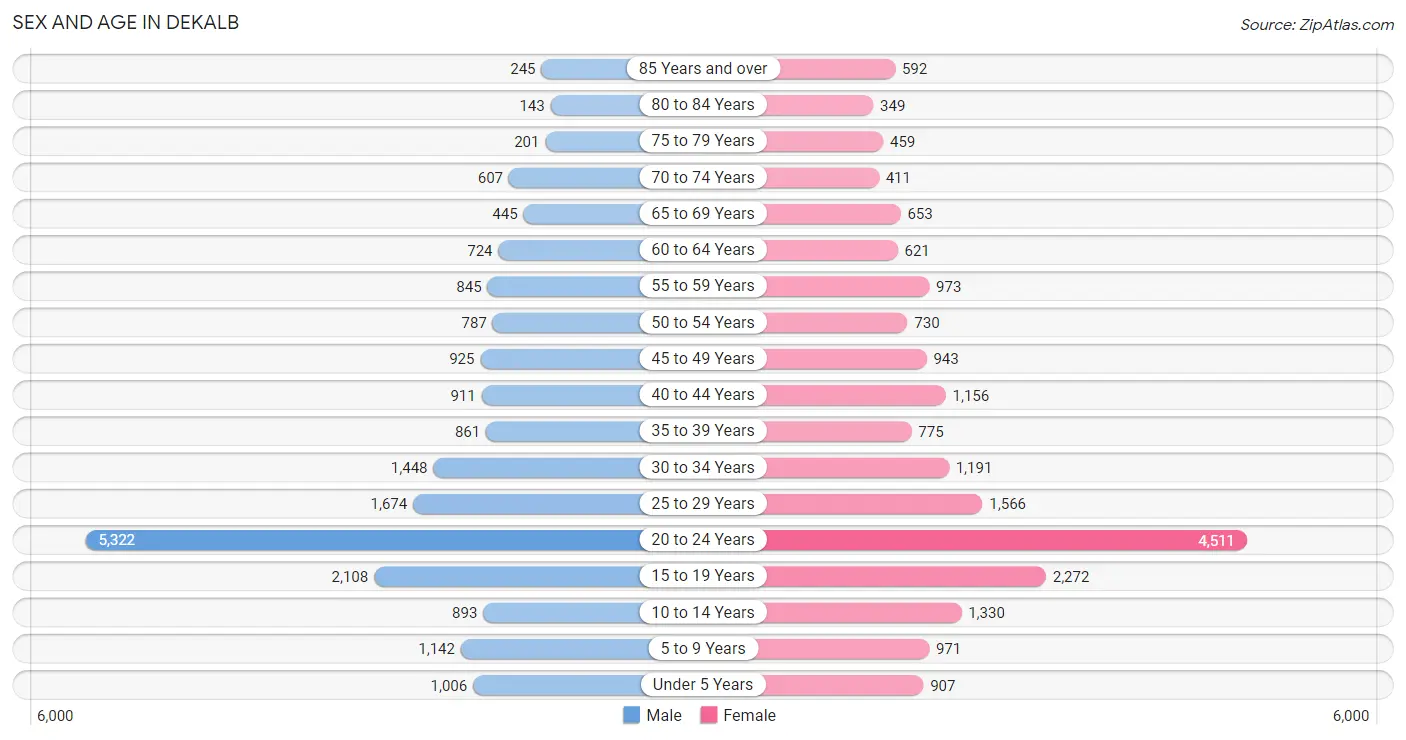
Sex and Age in Dekalb
Sex and Age in Dekalb
The most populous age groups in Dekalb are 20 to 24 Years (5,322 | 26.2%) for men and 20 to 24 Years (4,511 | 22.1%) for women.
| Age Bracket | Male | Female |
| Under 5 Years | 1,006 (5.0%) | 907 (4.4%) |
| 5 to 9 Years | 1,142 (5.6%) | 971 (4.8%) |
| 10 to 14 Years | 893 (4.4%) | 1,330 (6.5%) |
| 15 to 19 Years | 2,108 (10.4%) | 2,272 (11.1%) |
| 20 to 24 Years | 5,322 (26.2%) | 4,511 (22.1%) |
| 25 to 29 Years | 1,674 (8.3%) | 1,566 (7.7%) |
| 30 to 34 Years | 1,448 (7.1%) | 1,191 (5.8%) |
| 35 to 39 Years | 861 (4.2%) | 775 (3.8%) |
| 40 to 44 Years | 911 (4.5%) | 1,156 (5.7%) |
| 45 to 49 Years | 925 (4.6%) | 943 (4.6%) |
| 50 to 54 Years | 787 (3.9%) | 730 (3.6%) |
| 55 to 59 Years | 845 (4.2%) | 973 (4.8%) |
| 60 to 64 Years | 724 (3.6%) | 621 (3.0%) |
| 65 to 69 Years | 445 (2.2%) | 653 (3.2%) |
| 70 to 74 Years | 607 (3.0%) | 411 (2.0%) |
| 75 to 79 Years | 201 (1.0%) | 459 (2.2%) |
| 80 to 84 Years | 143 (0.7%) | 349 (1.7%) |
| 85 Years and over | 245 (1.2%) | 592 (2.9%) |
| Total | 20,287 (100.0%) | 20,410 (100.0%) |
Families and Households in Dekalb
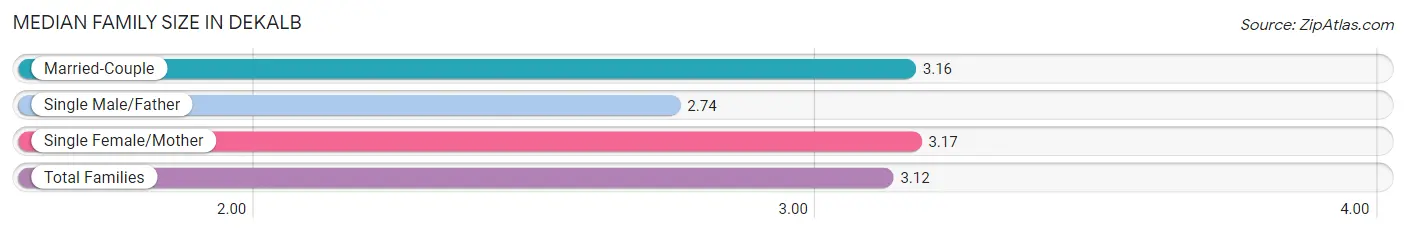
Median Family Size in Dekalb
The median family size in Dekalb is 3.12 persons per family, with single female/mother families (2,120 | 27.8%) accounting for the largest median family size of 3.17 persons per family. On the other hand, single male/father families (768 | 10.1%) represent the smallest median family size with 2.74 persons per family.
| Family Type | # Families | Family Size |
| Married-Couple | 4,745 (62.2%) | 3.16 |
| Single Male/Father | 768 (10.1%) | 2.74 |
| Single Female/Mother | 2,120 (27.8%) | 3.17 |
| Total Families | 7,633 (100.0%) | 3.12 |
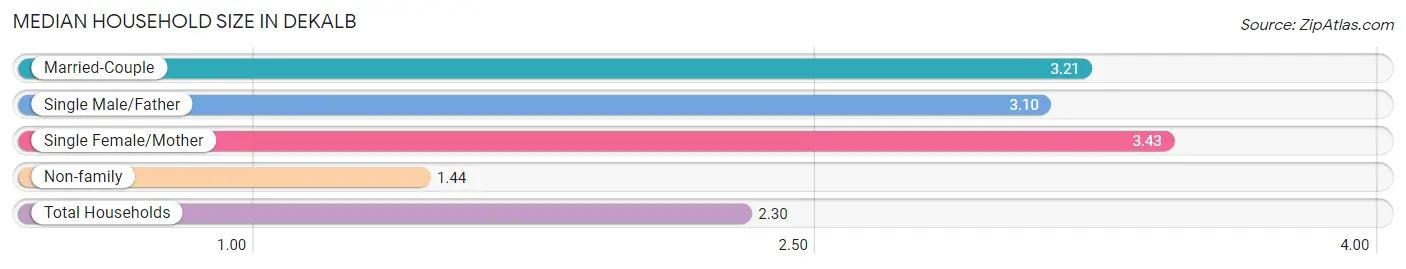
Median Household Size in Dekalb
The median household size in Dekalb is 2.30 persons per household, with single female/mother households (2,120 | 13.2%) accounting for the largest median household size of 3.43 persons per household. non-family households (8,410 | 52.4%) represent the smallest median household size with 1.44 persons per household.
| Household Type | # Households | Household Size |
| Married-Couple | 4,745 (29.6%) | 3.21 |
| Single Male/Father | 768 (4.8%) | 3.10 |
| Single Female/Mother | 2,120 (13.2%) | 3.43 |
| Non-family | 8,410 (52.4%) | 1.44 |
| Total Households | 16,043 (100.0%) | 2.30 |
Household Size by Marriage Status in Dekalb
Out of a total of 16,043 households in Dekalb, 7,633 (47.6%) are family households, while 8,410 (52.4%) are nonfamily households. The most numerous type of family households are 2-person households, comprising 3,410, and the most common type of nonfamily households are 1-person households, comprising 5,714.
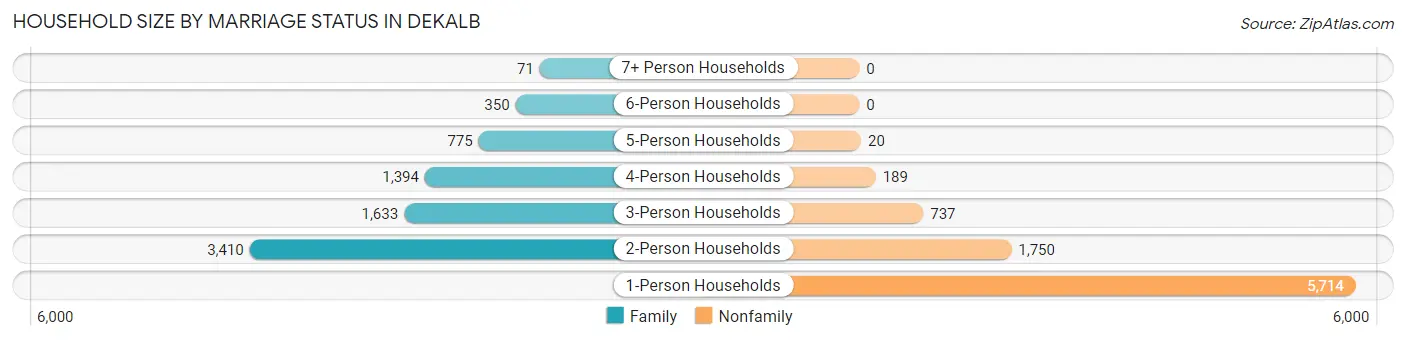
| Household Size | Family Households | Nonfamily Households |
| 1-Person Households | - | 5,714 (35.6%) |
| 2-Person Households | 3,410 (21.3%) | 1,750 (10.9%) |
| 3-Person Households | 1,633 (10.2%) | 737 (4.6%) |
| 4-Person Households | 1,394 (8.7%) | 189 (1.2%) |
| 5-Person Households | 775 (4.8%) | 20 (0.1%) |
| 6-Person Households | 350 (2.2%) | 0 (0.0%) |
| 7+ Person Households | 71 (0.4%) | 0 (0.0%) |
| Total | 7,633 (47.6%) | 8,410 (52.4%) |
Female Fertility in Dekalb
Fertility by Age in Dekalb
Average fertility rate in Dekalb is 39.0 births per 1,000 women. Women in the age bracket of 20 to 34 years have the highest fertility rate with 54.0 births per 1,000 women. Women in the age bracket of 20 to 34 years acount for 79.3% of all women with births.
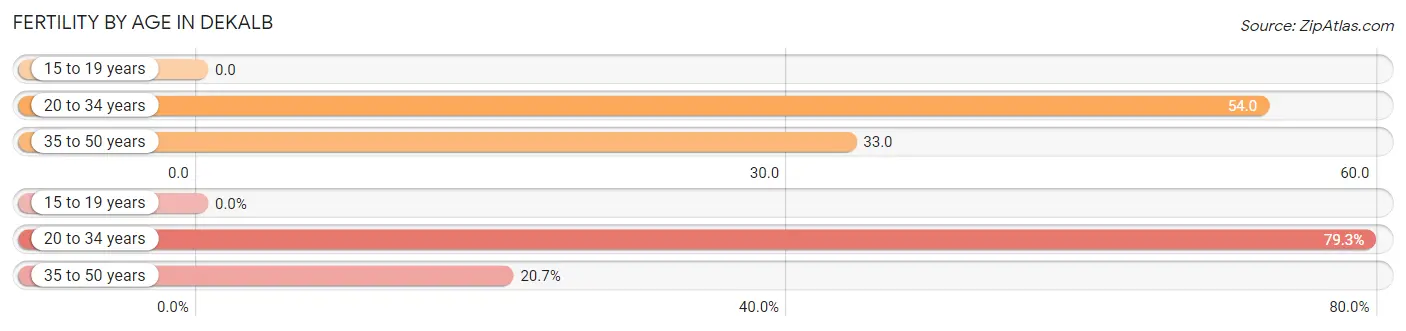
| Age Bracket | Women with Births | Births / 1,000 Women |
| 15 to 19 years | 0 (0.0%) | 0.0 |
| 20 to 34 years | 390 (79.3%) | 54.0 |
| 35 to 50 years | 102 (20.7%) | 33.0 |
| Total | 492 (100.0%) | 39.0 |
Fertility by Age by Marriage Status in Dekalb
28.9% of women with births (492) in Dekalb are married. The highest percentage of unmarried women with births falls into 20 to 34 years age bracket with 77.4% of them unmarried at the time of birth, while the lowest percentage of unmarried women with births belong to 35 to 50 years age bracket with 47.1% of them unmarried.
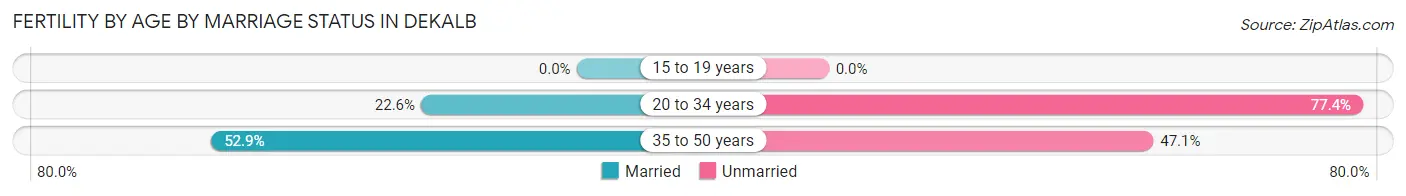
| Age Bracket | Married | Unmarried |
| 15 to 19 years | 0 (0.0%) | 0 (0.0%) |
| 20 to 34 years | 88 (22.6%) | 302 (77.4%) |
| 35 to 50 years | 54 (52.9%) | 48 (47.1%) |
| Total | 142 (28.9%) | 350 (71.1%) |
Fertility by Education in Dekalb
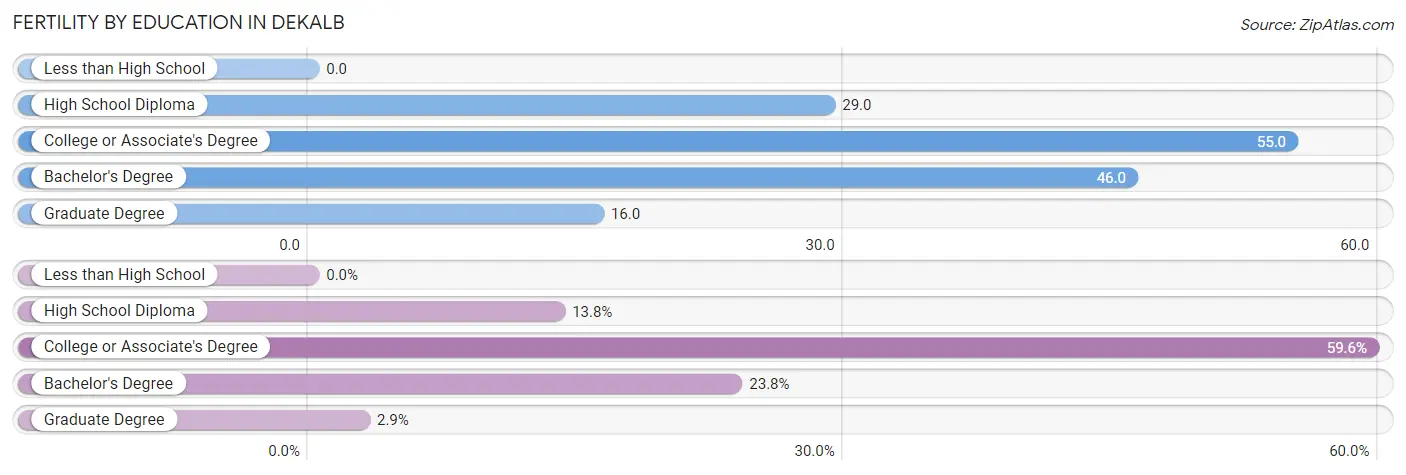
| Educational Attainment | Women with Births | Births / 1,000 Women |
| Less than High School | 0 (0.0%) | 0.0 |
| High School Diploma | 68 (13.8%) | 29.0 |
| College or Associate's Degree | 293 (59.6%) | 55.0 |
| Bachelor's Degree | 117 (23.8%) | 46.0 |
| Graduate Degree | 14 (2.9%) | 16.0 |
| Total | 492 (100.0%) | 39.0 |
Fertility by Education by Marriage Status in Dekalb
71.1% of women with births in Dekalb are unmarried. Women with the educational attainment of graduate degree are most likely to be married with 100.0% of them married at childbirth, while women with the educational attainment of high school diploma are least likely to be married with 100.0% of them unmarried at childbirth.
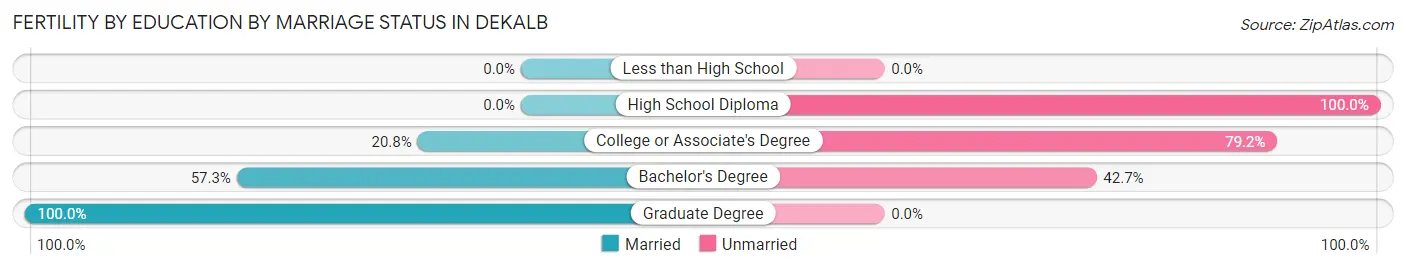
| Educational Attainment | Married | Unmarried |
| Less than High School | 0 (0.0%) | 0 (0.0%) |
| High School Diploma | 0 (0.0%) | 68 (100.0%) |
| College or Associate's Degree | 61 (20.8%) | 232 (79.2%) |
| Bachelor's Degree | 67 (57.3%) | 50 (42.7%) |
| Graduate Degree | 14 (100.0%) | 0 (0.0%) |
| Total | 142 (28.9%) | 350 (71.1%) |
Employment Characteristics in Dekalb
Employment by Class of Employer in Dekalb
Among the 19,893 employed individuals in Dekalb, private company employees (13,014 | 65.4%), state government employees (2,526 | 12.7%), and not-for-profit organizations (1,509 | 7.6%) make up the most common classes of employment.
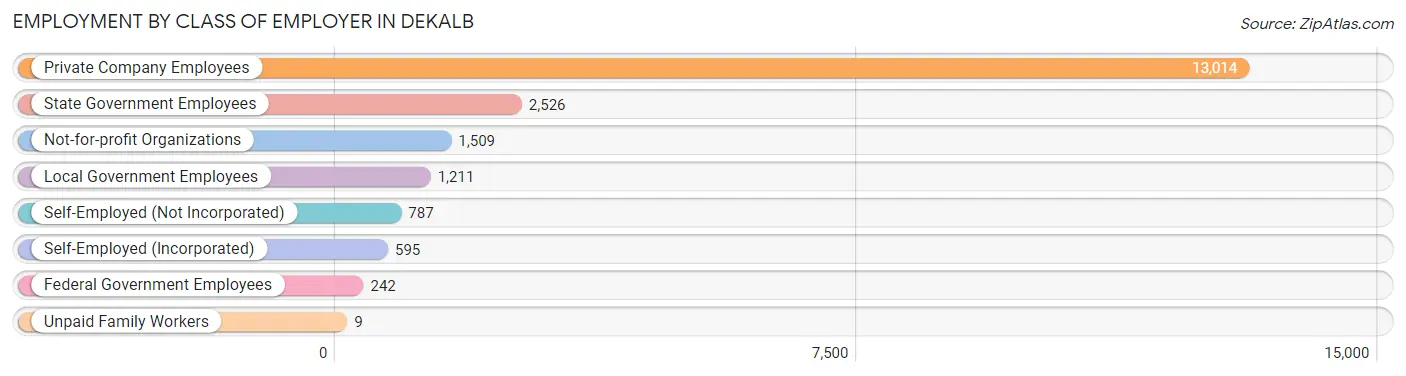
| Employer Class | # Employees | % Employees |
| Private Company Employees | 13,014 | 65.4% |
| Self-Employed (Incorporated) | 595 | 3.0% |
| Self-Employed (Not Incorporated) | 787 | 4.0% |
| Not-for-profit Organizations | 1,509 | 7.6% |
| Local Government Employees | 1,211 | 6.1% |
| State Government Employees | 2,526 | 12.7% |
| Federal Government Employees | 242 | 1.2% |
| Unpaid Family Workers | 9 | 0.1% |
| Total | 19,893 | 100.0% |
Employment Status by Age in Dekalb
According to the labor force statistics for Dekalb, out of the total population over 16 years of age (33,913), 67.3% or 22,823 individuals are in the labor force, with 10.7% or 2,442 of them unemployed. The age group with the highest labor force participation rate is 30 to 34 years, with 93.8% or 2,475 individuals in the labor force. Within the labor force, the 16 to 19 years age range has the highest percentage of unemployed individuals, with 25.6% or 465 of them being unemployed.
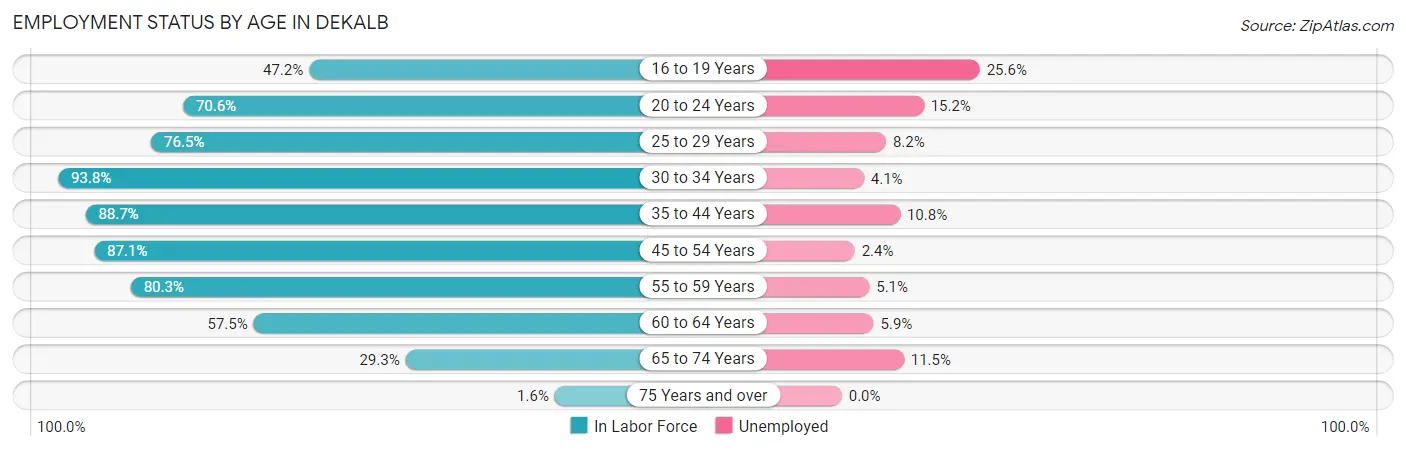
| Age Bracket | In Labor Force | Unemployed |
| 16 to 19 Years | 1,815 (47.2%) | 465 (25.6%) |
| 20 to 24 Years | 6,942 (70.6%) | 1,055 (15.2%) |
| 25 to 29 Years | 2,479 (76.5%) | 203 (8.2%) |
| 30 to 34 Years | 2,475 (93.8%) | 101 (4.1%) |
| 35 to 44 Years | 3,285 (88.7%) | 355 (10.8%) |
| 45 to 54 Years | 2,948 (87.1%) | 71 (2.4%) |
| 55 to 59 Years | 1,460 (80.3%) | 74 (5.1%) |
| 60 to 64 Years | 773 (57.5%) | 46 (5.9%) |
| 65 to 74 Years | 620 (29.3%) | 71 (11.5%) |
| 75 Years and over | 32 (1.6%) | 0 (0.0%) |
| Total | 22,823 (67.3%) | 2,442 (10.7%) |
Employment Status by Educational Attainment in Dekalb
According to labor force statistics for Dekalb, 83.2% of individuals (13,420) out of the total population between 25 and 64 years of age (16,130) are in the labor force, with 6.3% or 845 of them being unemployed. The group with the highest labor force participation rate are those with the educational attainment of bachelor's degree or higher, with 85.8% or 5,494 individuals in the labor force. Within the labor force, individuals with high school diploma education have the highest percentage of unemployment, with 12.3% or 350 of them being unemployed.
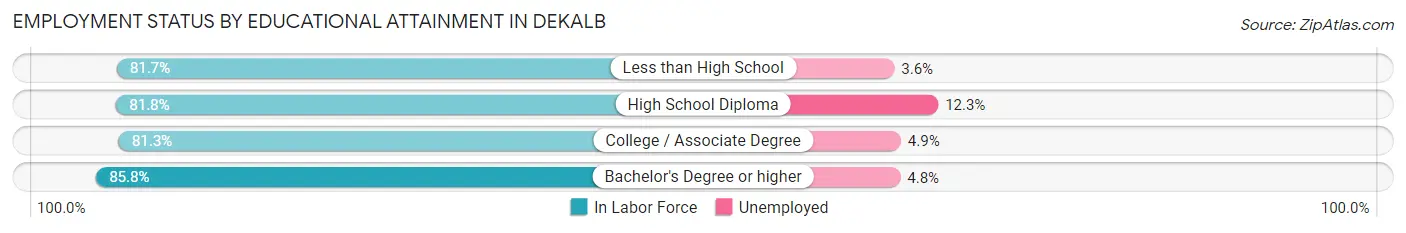
| Educational Attainment | In Labor Force | Unemployed |
| Less than High School | 998 (81.7%) | 44 (3.6%) |
| High School Diploma | 2,846 (81.8%) | 428 (12.3%) |
| College / Associate Degree | 4,087 (81.3%) | 246 (4.9%) |
| Bachelor's Degree or higher | 5,494 (85.8%) | 307 (4.8%) |
| Total | 13,420 (83.2%) | 1,016 (6.3%) |
Employment Occupations by Sex in Dekalb
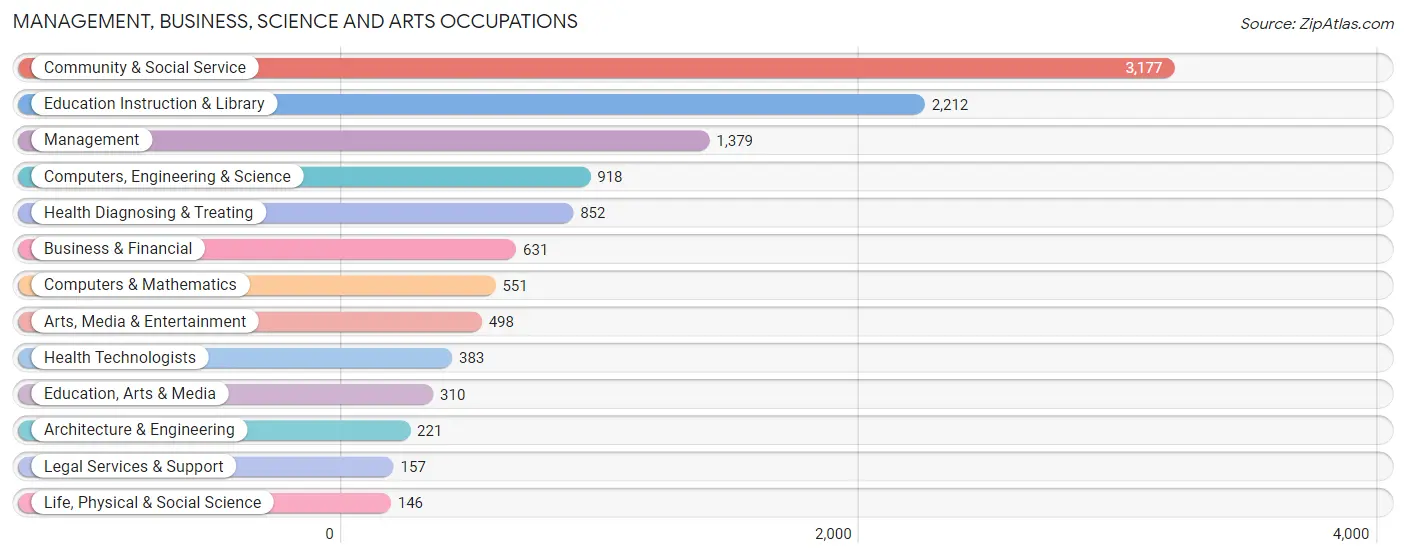
Management, Business, Science and Arts Occupations
The most common Management, Business, Science and Arts occupations in Dekalb are Community & Social Service (3,177 | 15.6%), Education Instruction & Library (2,212 | 10.8%), Management (1,379 | 6.8%), Computers, Engineering & Science (918 | 4.5%), and Health Diagnosing & Treating (852 | 4.2%).
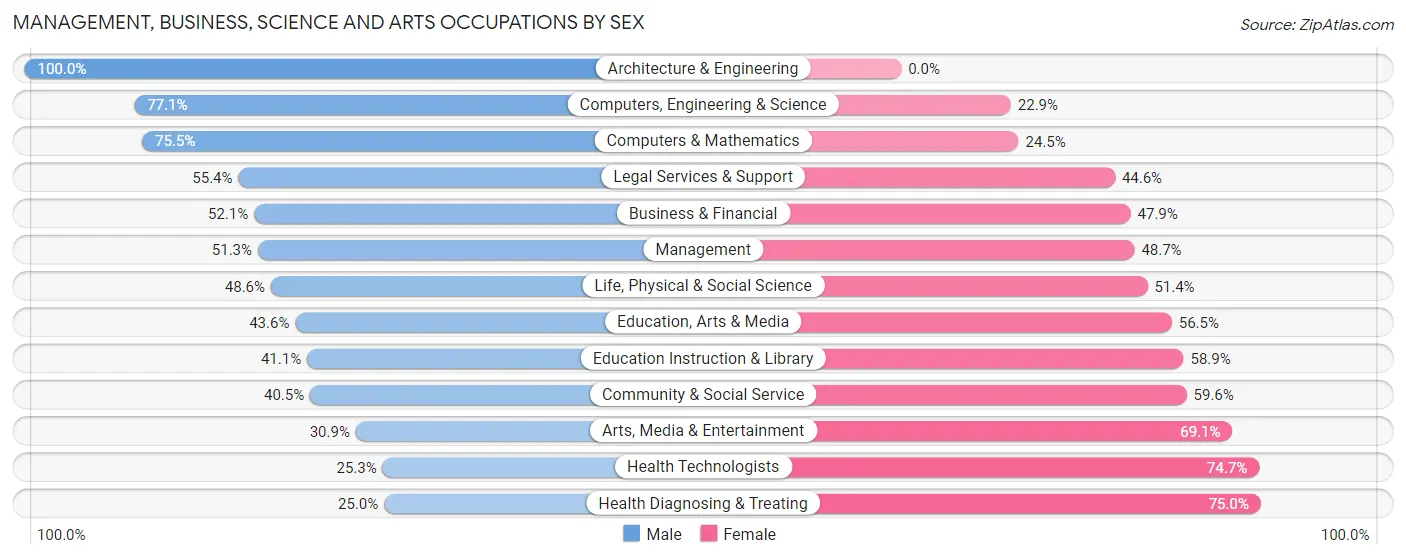
Management, Business, Science and Arts Occupations by Sex
Within the Management, Business, Science and Arts occupations in Dekalb, the most male-oriented occupations are Architecture & Engineering (100.0%), Computers, Engineering & Science (77.1%), and Computers & Mathematics (75.5%), while the most female-oriented occupations are Health Diagnosing & Treating (75.0%), Health Technologists (74.7%), and Arts, Media & Entertainment (69.1%).
| Occupation | Male | Female |
| Management | 708 (51.3%) | 671 (48.7%) |
| Business & Financial | 329 (52.1%) | 302 (47.9%) |
| Computers, Engineering & Science | 708 (77.1%) | 210 (22.9%) |
| Computers & Mathematics | 416 (75.5%) | 135 (24.5%) |
| Architecture & Engineering | 221 (100.0%) | 0 (0.0%) |
| Life, Physical & Social Science | 71 (48.6%) | 75 (51.4%) |
| Community & Social Service | 1,285 (40.5%) | 1,892 (59.6%) |
| Education, Arts & Media | 135 (43.5%) | 175 (56.5%) |
| Legal Services & Support | 87 (55.4%) | 70 (44.6%) |
| Education Instruction & Library | 909 (41.1%) | 1,303 (58.9%) |
| Arts, Media & Entertainment | 154 (30.9%) | 344 (69.1%) |
| Health Diagnosing & Treating | 213 (25.0%) | 639 (75.0%) |
| Health Technologists | 97 (25.3%) | 286 (74.7%) |
| Total (Category) | 3,243 (46.6%) | 3,714 (53.4%) |
| Total (Overall) | 10,847 (53.2%) | 9,531 (46.8%) |
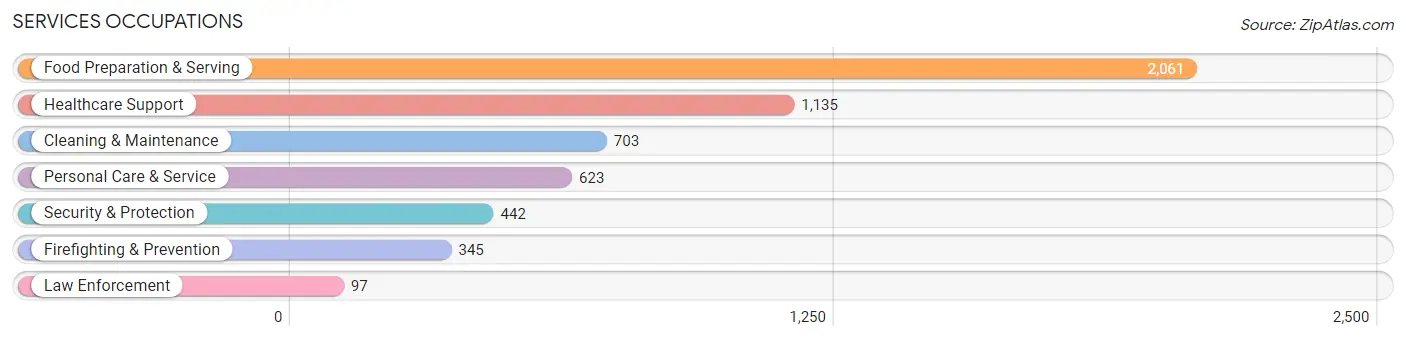
Services Occupations
The most common Services occupations in Dekalb are Food Preparation & Serving (2,061 | 10.1%), Healthcare Support (1,135 | 5.6%), Cleaning & Maintenance (703 | 3.5%), Personal Care & Service (623 | 3.1%), and Security & Protection (442 | 2.2%).
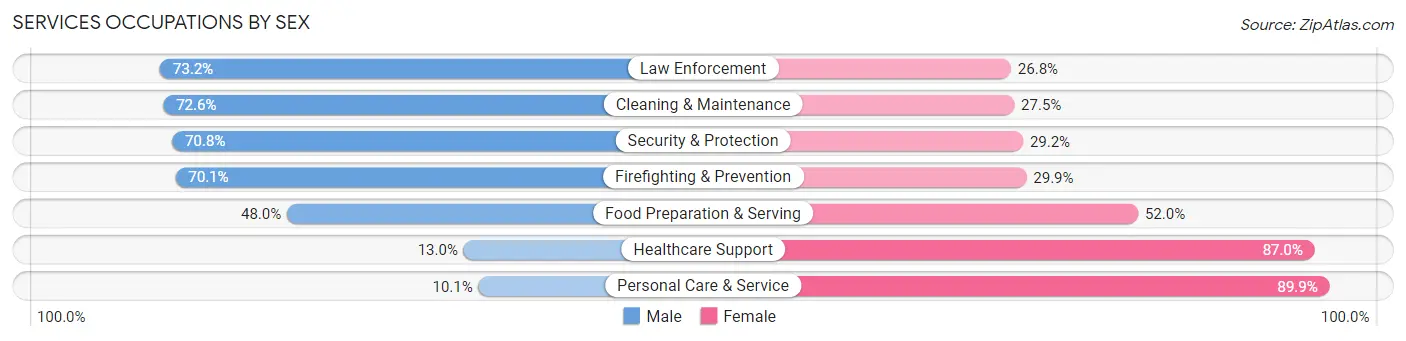
Services Occupations by Sex
Within the Services occupations in Dekalb, the most male-oriented occupations are Law Enforcement (73.2%), Cleaning & Maintenance (72.6%), and Security & Protection (70.8%), while the most female-oriented occupations are Personal Care & Service (89.9%), Healthcare Support (87.0%), and Food Preparation & Serving (52.0%).
| Occupation | Male | Female |
| Healthcare Support | 148 (13.0%) | 987 (87.0%) |
| Security & Protection | 313 (70.8%) | 129 (29.2%) |
| Firefighting & Prevention | 242 (70.1%) | 103 (29.9%) |
| Law Enforcement | 71 (73.2%) | 26 (26.8%) |
| Food Preparation & Serving | 990 (48.0%) | 1,071 (52.0%) |
| Cleaning & Maintenance | 510 (72.6%) | 193 (27.5%) |
| Personal Care & Service | 63 (10.1%) | 560 (89.9%) |
| Total (Category) | 2,024 (40.8%) | 2,940 (59.2%) |
| Total (Overall) | 10,847 (53.2%) | 9,531 (46.8%) |
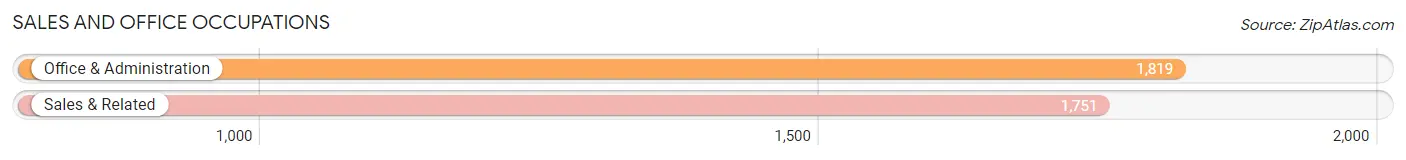
Sales and Office Occupations
The most common Sales and Office occupations in Dekalb are Office & Administration (1,819 | 8.9%), and Sales & Related (1,751 | 8.6%).
Sales and Office Occupations by Sex
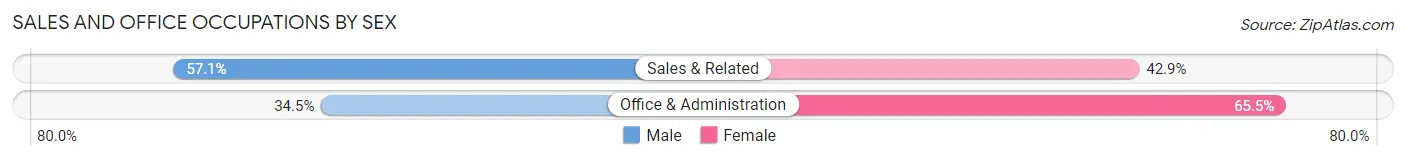
| Occupation | Male | Female |
| Sales & Related | 1,000 (57.1%) | 751 (42.9%) |
| Office & Administration | 628 (34.5%) | 1,191 (65.5%) |
| Total (Category) | 1,628 (45.6%) | 1,942 (54.4%) |
| Total (Overall) | 10,847 (53.2%) | 9,531 (46.8%) |
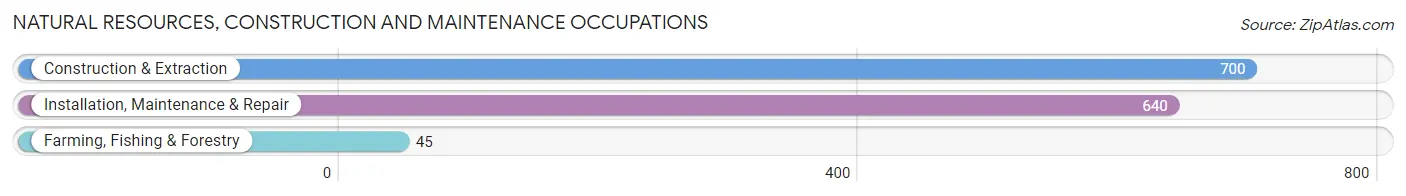
Natural Resources, Construction and Maintenance Occupations
The most common Natural Resources, Construction and Maintenance occupations in Dekalb are Construction & Extraction (700 | 3.4%), Installation, Maintenance & Repair (640 | 3.1%), and Farming, Fishing & Forestry (45 | 0.2%).
Natural Resources, Construction and Maintenance Occupations by Sex
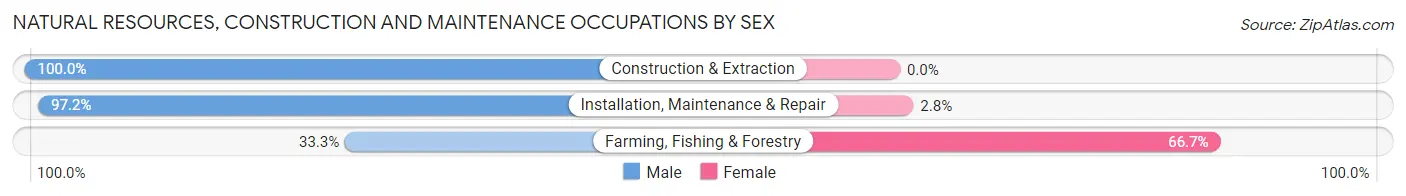
| Occupation | Male | Female |
| Farming, Fishing & Forestry | 15 (33.3%) | 30 (66.7%) |
| Construction & Extraction | 700 (100.0%) | 0 (0.0%) |
| Installation, Maintenance & Repair | 622 (97.2%) | 18 (2.8%) |
| Total (Category) | 1,337 (96.5%) | 48 (3.5%) |
| Total (Overall) | 10,847 (53.2%) | 9,531 (46.8%) |
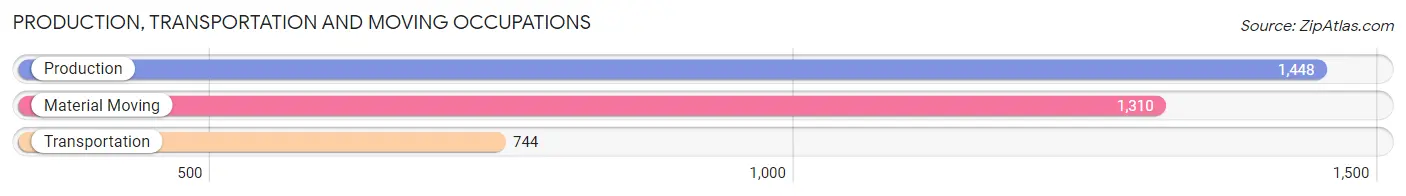
Production, Transportation and Moving Occupations
The most common Production, Transportation and Moving occupations in Dekalb are Production (1,448 | 7.1%), Material Moving (1,310 | 6.4%), and Transportation (744 | 3.6%).
Production, Transportation and Moving Occupations by Sex

| Occupation | Male | Female |
| Production | 964 (66.6%) | 484 (33.4%) |
| Transportation | 655 (88.0%) | 89 (12.0%) |
| Material Moving | 996 (76.0%) | 314 (24.0%) |
| Total (Category) | 2,615 (74.7%) | 887 (25.3%) |
| Total (Overall) | 10,847 (53.2%) | 9,531 (46.8%) |
Employment Industries by Sex in Dekalb
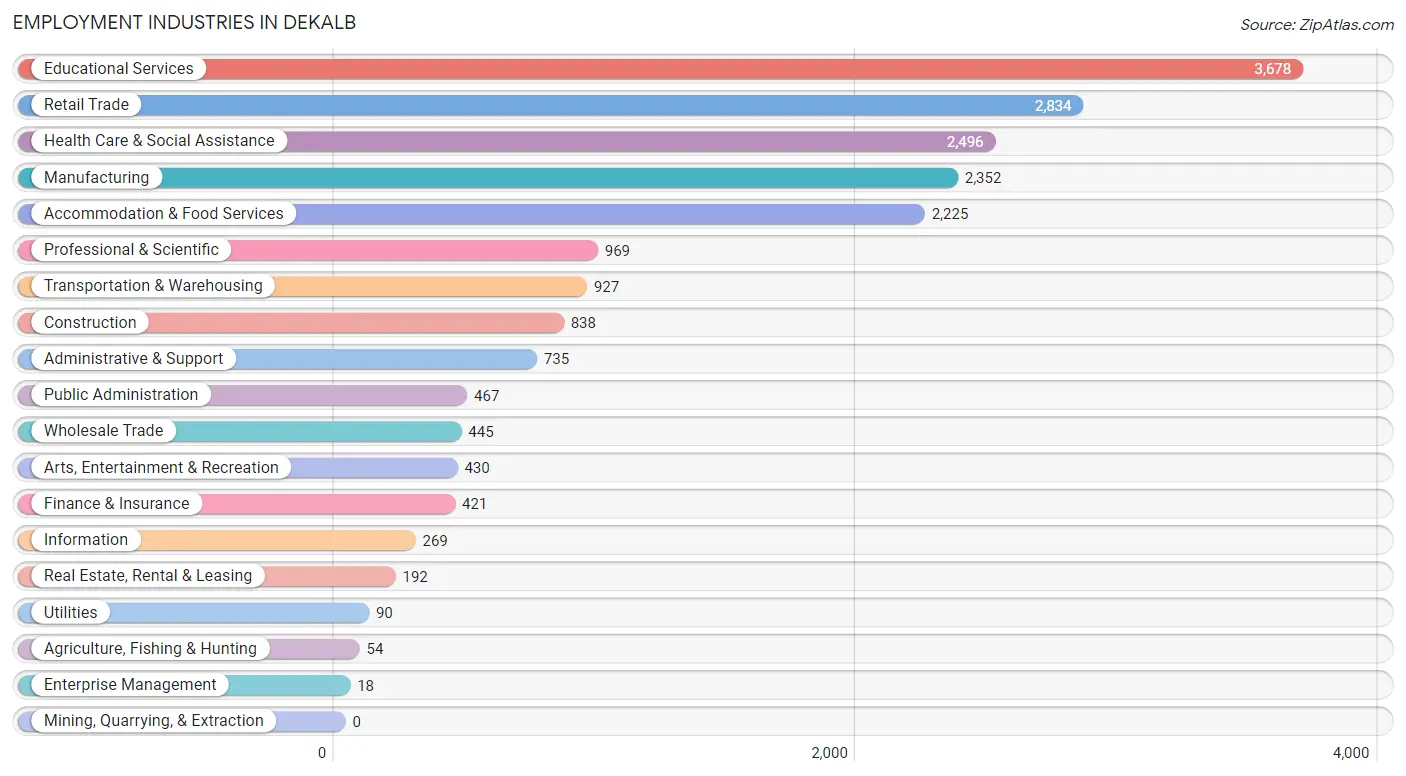
Employment Industries in Dekalb
The major employment industries in Dekalb include Educational Services (3,678 | 18.0%), Retail Trade (2,834 | 13.9%), Health Care & Social Assistance (2,496 | 12.2%), Manufacturing (2,352 | 11.5%), and Accommodation & Food Services (2,225 | 10.9%).
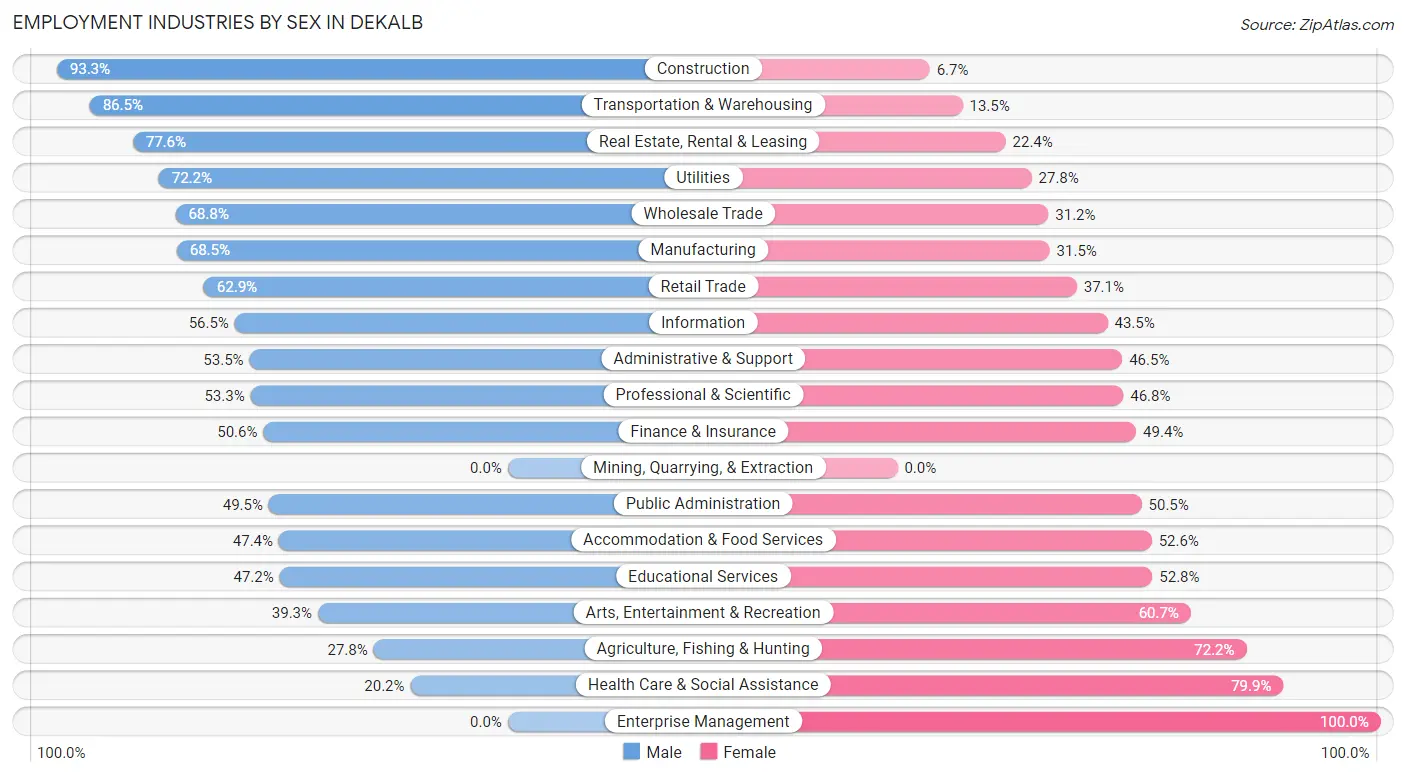
Employment Industries by Sex in Dekalb
The Dekalb industries that see more men than women are Construction (93.3%), Transportation & Warehousing (86.5%), and Real Estate, Rental & Leasing (77.6%), whereas the industries that tend to have a higher number of women are Enterprise Management (100.0%), Health Care & Social Assistance (79.8%), and Agriculture, Fishing & Hunting (72.2%).
| Industry | Male | Female |
| Agriculture, Fishing & Hunting | 15 (27.8%) | 39 (72.2%) |
| Mining, Quarrying, & Extraction | 0 (0.0%) | 0 (0.0%) |
| Construction | 782 (93.3%) | 56 (6.7%) |
| Manufacturing | 1,611 (68.5%) | 741 (31.5%) |
| Wholesale Trade | 306 (68.8%) | 139 (31.2%) |
| Retail Trade | 1,782 (62.9%) | 1,052 (37.1%) |
| Transportation & Warehousing | 802 (86.5%) | 125 (13.5%) |
| Utilities | 65 (72.2%) | 25 (27.8%) |
| Information | 152 (56.5%) | 117 (43.5%) |
| Finance & Insurance | 213 (50.6%) | 208 (49.4%) |
| Real Estate, Rental & Leasing | 149 (77.6%) | 43 (22.4%) |
| Professional & Scientific | 516 (53.2%) | 453 (46.8%) |
| Enterprise Management | 0 (0.0%) | 18 (100.0%) |
| Administrative & Support | 393 (53.5%) | 342 (46.5%) |
| Educational Services | 1,737 (47.2%) | 1,941 (52.8%) |
| Health Care & Social Assistance | 503 (20.2%) | 1,993 (79.8%) |
| Arts, Entertainment & Recreation | 169 (39.3%) | 261 (60.7%) |
| Accommodation & Food Services | 1,054 (47.4%) | 1,171 (52.6%) |
| Public Administration | 231 (49.5%) | 236 (50.5%) |
| Total | 10,847 (53.2%) | 9,531 (46.8%) |
Education in Dekalb
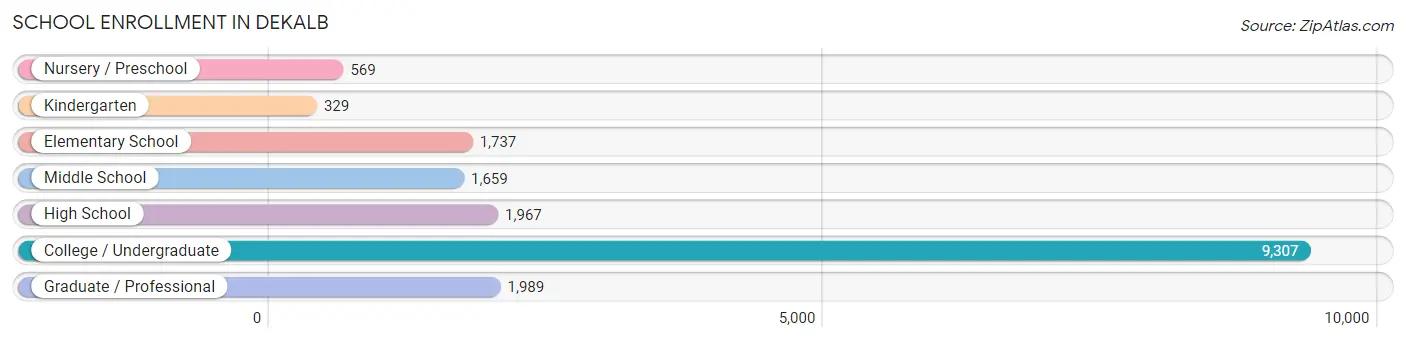
School Enrollment in Dekalb
The most common levels of schooling among the 17,557 students in Dekalb are college / undergraduate (9,307 | 53.0%), graduate / professional (1,989 | 11.3%), and high school (1,967 | 11.2%).
| School Level | # Students | % Students |
| Nursery / Preschool | 569 | 3.2% |
| Kindergarten | 329 | 1.9% |
| Elementary School | 1,737 | 9.9% |
| Middle School | 1,659 | 9.5% |
| High School | 1,967 | 11.2% |
| College / Undergraduate | 9,307 | 53.0% |
| Graduate / Professional | 1,989 | 11.3% |
| Total | 17,557 | 100.0% |
School Enrollment by Age by Funding Source in Dekalb
Out of a total of 17,557 students who are enrolled in schools in Dekalb, 1,053 (6.0%) attend a private institution, while the remaining 16,504 (94.0%) are enrolled in public schools. The age group of 3 to 4 year olds has the highest likelihood of being enrolled in private schools, with 75 (23.5% in the age bracket) enrolled. Conversely, the age group of 20 to 24 year olds has the lowest likelihood of being enrolled in a private school, with 6,626 (98.6% in the age bracket) attending a public institution.
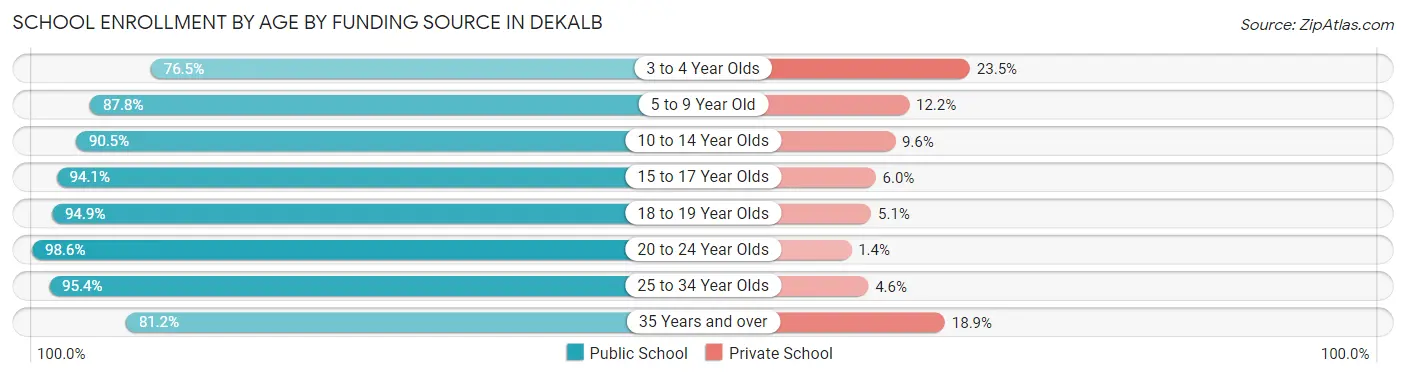
| Age Bracket | Public School | Private School |
| 3 to 4 Year Olds | 244 (76.5%) | 75 (23.5%) |
| 5 to 9 Year Old | 1,738 (87.8%) | 241 (12.2%) |
| 10 to 14 Year Olds | 1,960 (90.4%) | 207 (9.6%) |
| 15 to 17 Year Olds | 1,248 (94.1%) | 79 (5.9%) |
| 18 to 19 Year Olds | 2,600 (94.9%) | 140 (5.1%) |
| 20 to 24 Year Olds | 6,626 (98.6%) | 94 (1.4%) |
| 25 to 34 Year Olds | 1,501 (95.4%) | 72 (4.6%) |
| 35 Years and over | 594 (81.1%) | 138 (18.9%) |
| Total | 16,504 (94.0%) | 1,053 (6.0%) |
Educational Attainment by Field of Study in Dekalb
Business (1,342 | 15.3%), education (1,231 | 14.1%), social sciences (779 | 8.9%), science & technology (745 | 8.5%), and visual & performing arts (654 | 7.5%) are the most common fields of study among 8,747 individuals in Dekalb who have obtained a bachelor's degree or higher.
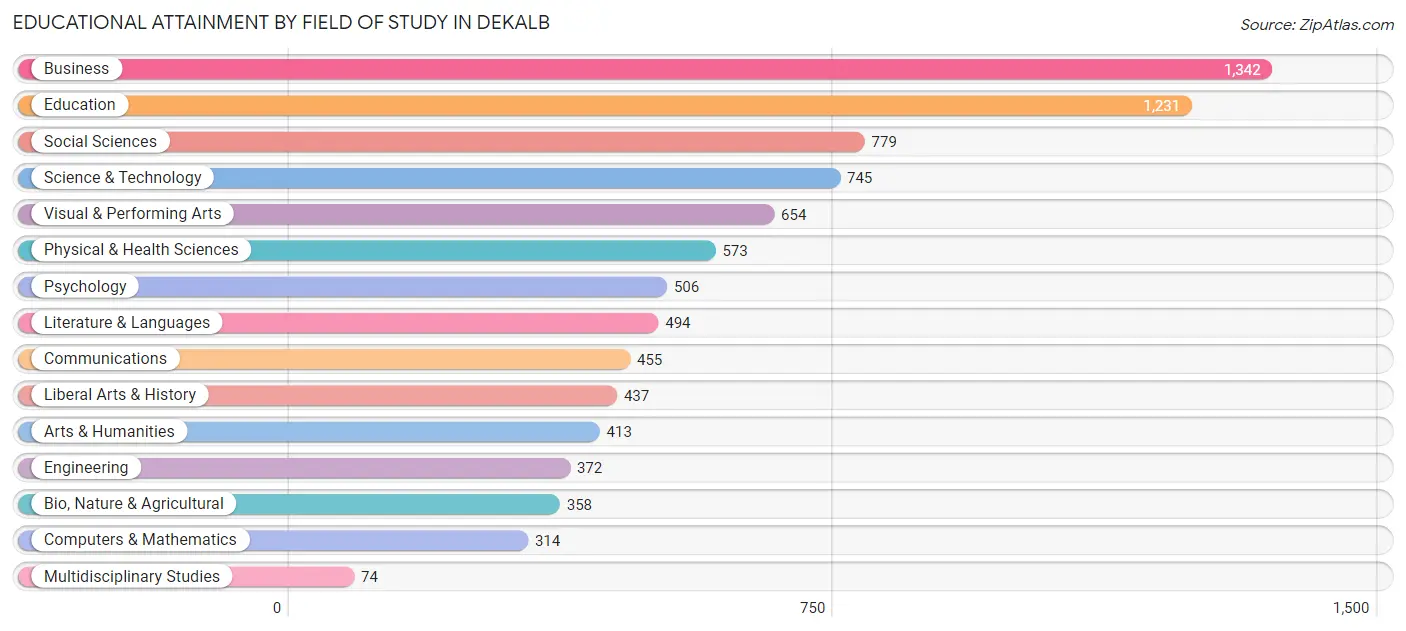
| Field of Study | # Graduates | % Graduates |
| Computers & Mathematics | 314 | 3.6% |
| Bio, Nature & Agricultural | 358 | 4.1% |
| Physical & Health Sciences | 573 | 6.6% |
| Psychology | 506 | 5.8% |
| Social Sciences | 779 | 8.9% |
| Engineering | 372 | 4.3% |
| Multidisciplinary Studies | 74 | 0.9% |
| Science & Technology | 745 | 8.5% |
| Business | 1,342 | 15.3% |
| Education | 1,231 | 14.1% |
| Literature & Languages | 494 | 5.7% |
| Liberal Arts & History | 437 | 5.0% |
| Visual & Performing Arts | 654 | 7.5% |
| Communications | 455 | 5.2% |
| Arts & Humanities | 413 | 4.7% |
| Total | 8,747 | 100.0% |
Transportation & Commute in Dekalb
Vehicle Availability by Sex in Dekalb
The most prevalent vehicle ownership categories in Dekalb are males with 2 vehicles (4,461, accounting for 43.8%) and females with 2 vehicles (4,097, making up 52.4%).
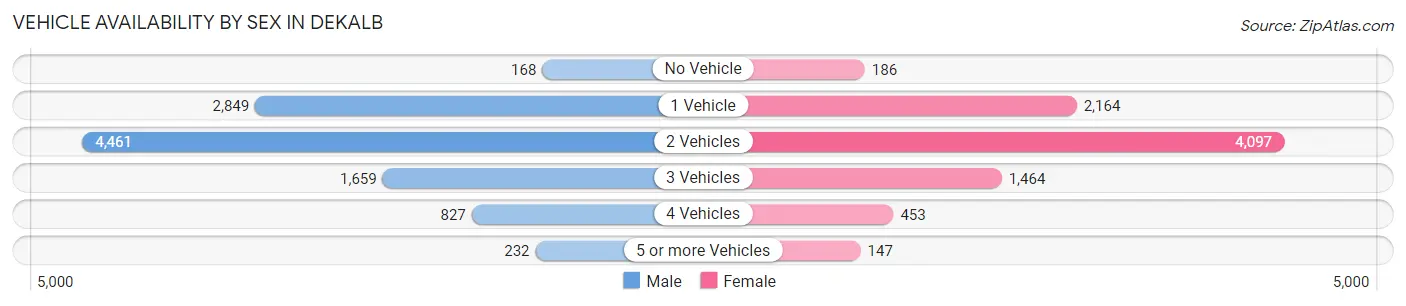
| Vehicles Available | Male | Female |
| No Vehicle | 168 (1.7%) | 186 (2.2%) |
| 1 Vehicle | 2,849 (27.9%) | 2,164 (25.4%) |
| 2 Vehicles | 4,461 (43.8%) | 4,097 (48.1%) |
| 3 Vehicles | 1,659 (16.3%) | 1,464 (17.2%) |
| 4 Vehicles | 827 (8.1%) | 453 (5.3%) |
| 5 or more Vehicles | 232 (2.3%) | 147 (1.7%) |
| Total | 10,196 (100.0%) | 8,511 (100.0%) |
Commute Time in Dekalb
The most frequently occuring commute durations in Dekalb are 10 to 14 minutes (4,769 commuters, 24.9%), 5 to 9 minutes (4,407 commuters, 23.0%), and 15 to 19 minutes (2,337 commuters, 12.2%).
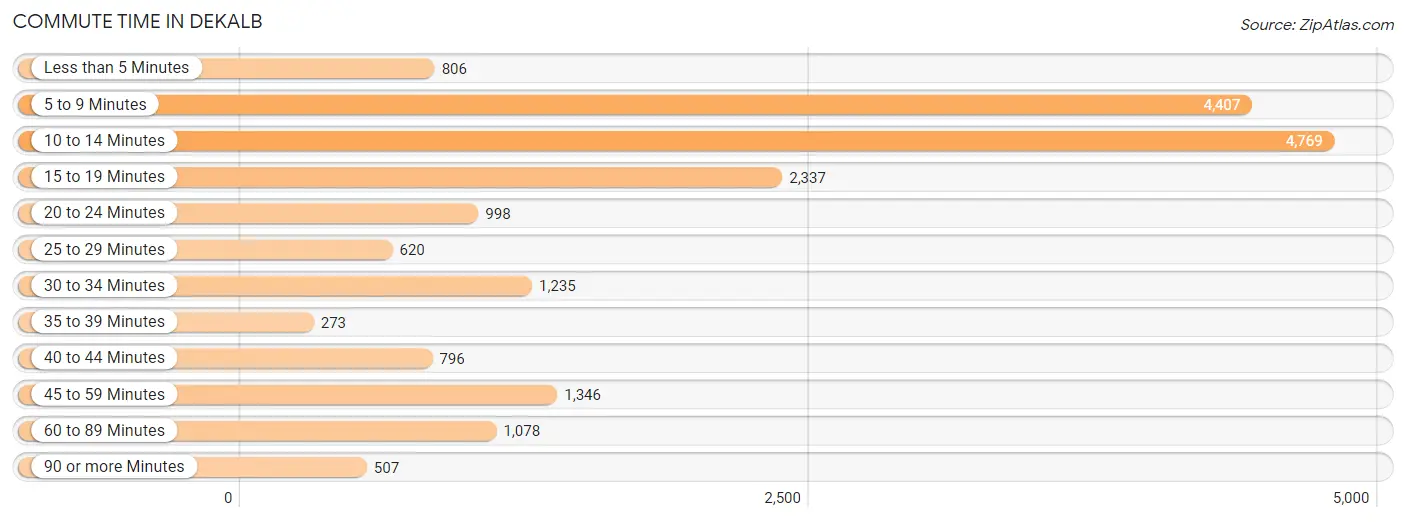
| Commute Time | # Commuters | % Commuters |
| Less than 5 Minutes | 806 | 4.2% |
| 5 to 9 Minutes | 4,407 | 23.0% |
| 10 to 14 Minutes | 4,769 | 24.9% |
| 15 to 19 Minutes | 2,337 | 12.2% |
| 20 to 24 Minutes | 998 | 5.2% |
| 25 to 29 Minutes | 620 | 3.2% |
| 30 to 34 Minutes | 1,235 | 6.4% |
| 35 to 39 Minutes | 273 | 1.4% |
| 40 to 44 Minutes | 796 | 4.2% |
| 45 to 59 Minutes | 1,346 | 7.0% |
| 60 to 89 Minutes | 1,078 | 5.6% |
| 90 or more Minutes | 507 | 2.6% |
Commute Time by Sex in Dekalb
The most common commute times in Dekalb are 10 to 14 minutes (2,612 commuters, 25.1%) for males and 10 to 14 minutes (2,157 commuters, 24.6%) for females.
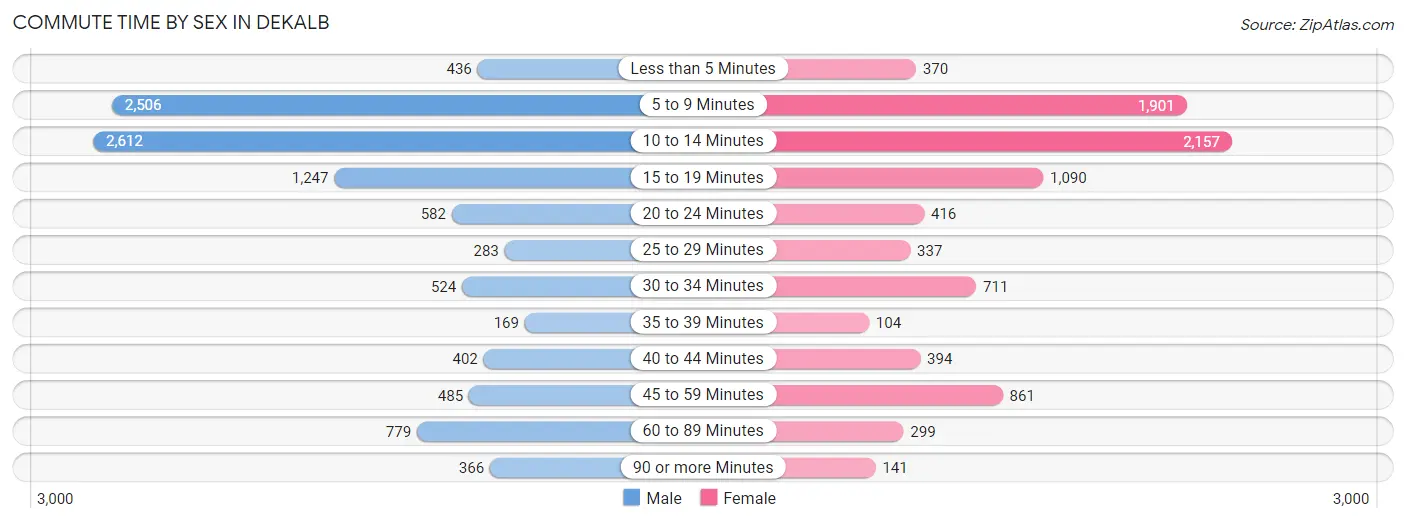
| Commute Time | Male | Female |
| Less than 5 Minutes | 436 (4.2%) | 370 (4.2%) |
| 5 to 9 Minutes | 2,506 (24.1%) | 1,901 (21.6%) |
| 10 to 14 Minutes | 2,612 (25.1%) | 2,157 (24.6%) |
| 15 to 19 Minutes | 1,247 (12.0%) | 1,090 (12.4%) |
| 20 to 24 Minutes | 582 (5.6%) | 416 (4.7%) |
| 25 to 29 Minutes | 283 (2.7%) | 337 (3.8%) |
| 30 to 34 Minutes | 524 (5.0%) | 711 (8.1%) |
| 35 to 39 Minutes | 169 (1.6%) | 104 (1.2%) |
| 40 to 44 Minutes | 402 (3.9%) | 394 (4.5%) |
| 45 to 59 Minutes | 485 (4.7%) | 861 (9.8%) |
| 60 to 89 Minutes | 779 (7.5%) | 299 (3.4%) |
| 90 or more Minutes | 366 (3.5%) | 141 (1.6%) |
Time of Departure to Work by Sex in Dekalb
The most frequent times of departure to work in Dekalb are 4:00 PM to 11:59 PM (1,542, 14.8%) for males and 4:00 PM to 11:59 PM (1,231, 14.0%) for females.
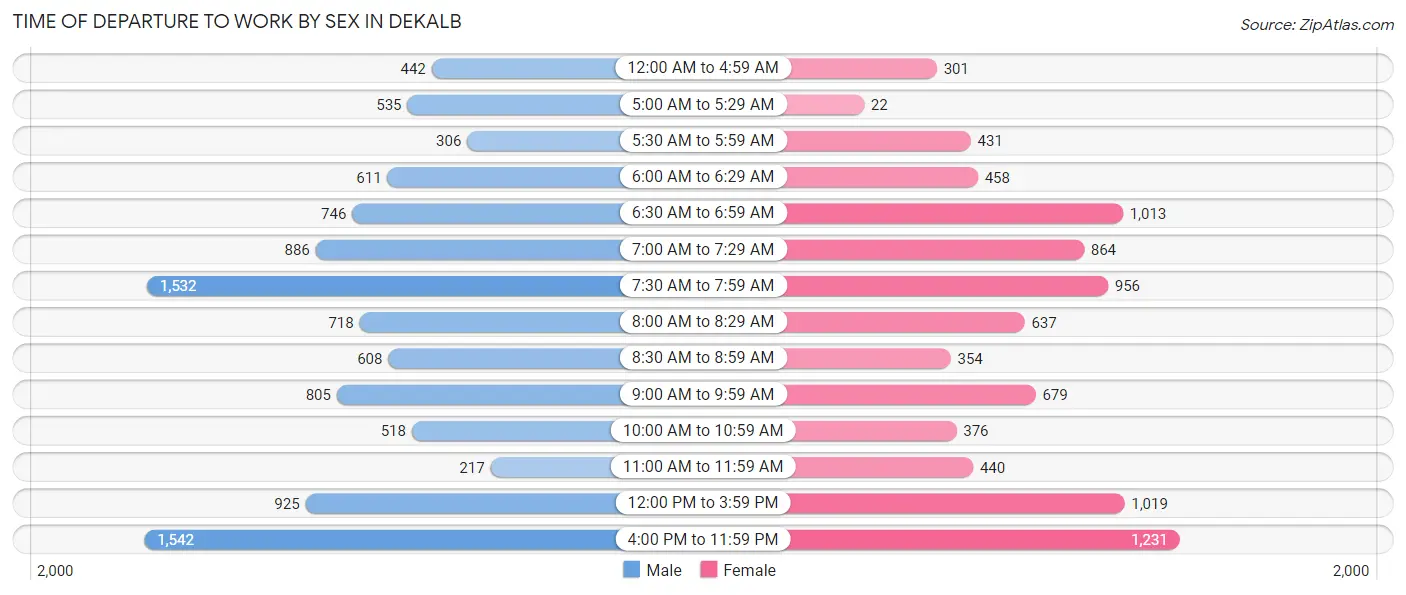
| Time of Departure | Male | Female |
| 12:00 AM to 4:59 AM | 442 (4.3%) | 301 (3.4%) |
| 5:00 AM to 5:29 AM | 535 (5.1%) | 22 (0.3%) |
| 5:30 AM to 5:59 AM | 306 (2.9%) | 431 (4.9%) |
| 6:00 AM to 6:29 AM | 611 (5.9%) | 458 (5.2%) |
| 6:30 AM to 6:59 AM | 746 (7.2%) | 1,013 (11.5%) |
| 7:00 AM to 7:29 AM | 886 (8.5%) | 864 (9.8%) |
| 7:30 AM to 7:59 AM | 1,532 (14.7%) | 956 (10.9%) |
| 8:00 AM to 8:29 AM | 718 (6.9%) | 637 (7.2%) |
| 8:30 AM to 8:59 AM | 608 (5.9%) | 354 (4.0%) |
| 9:00 AM to 9:59 AM | 805 (7.7%) | 679 (7.7%) |
| 10:00 AM to 10:59 AM | 518 (5.0%) | 376 (4.3%) |
| 11:00 AM to 11:59 AM | 217 (2.1%) | 440 (5.0%) |
| 12:00 PM to 3:59 PM | 925 (8.9%) | 1,019 (11.6%) |
| 4:00 PM to 11:59 PM | 1,542 (14.8%) | 1,231 (14.0%) |
| Total | 10,391 (100.0%) | 8,781 (100.0%) |
Housing Occupancy in Dekalb
Occupancy by Ownership in Dekalb
Of the total 16,043 dwellings in Dekalb, owner-occupied units account for 6,750 (42.1%), while renter-occupied units make up 9,293 (57.9%).
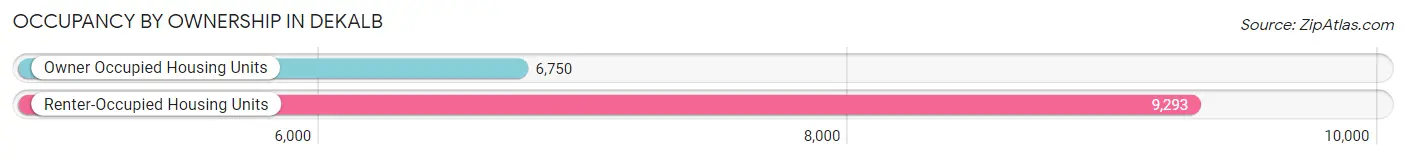
| Occupancy | # Housing Units | % Housing Units |
| Owner Occupied Housing Units | 6,750 | 42.1% |
| Renter-Occupied Housing Units | 9,293 | 57.9% |
| Total Occupied Housing Units | 16,043 | 100.0% |
Occupancy by Household Size in Dekalb
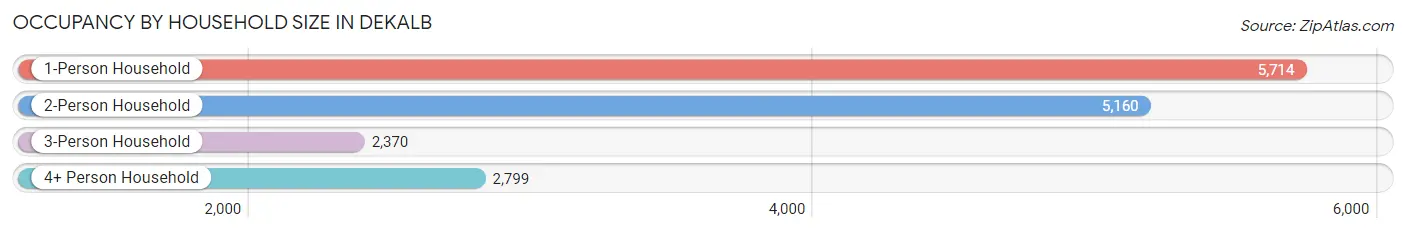
| Household Size | # Housing Units | % Housing Units |
| 1-Person Household | 5,714 | 35.6% |
| 2-Person Household | 5,160 | 32.2% |
| 3-Person Household | 2,370 | 14.8% |
| 4+ Person Household | 2,799 | 17.4% |
| Total Housing Units | 16,043 | 100.0% |
Occupancy by Ownership by Household Size in Dekalb
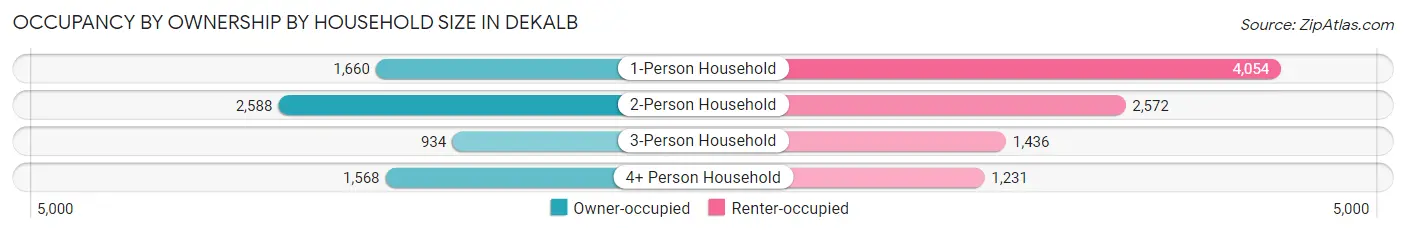
| Household Size | Owner-occupied | Renter-occupied |
| 1-Person Household | 1,660 (29.0%) | 4,054 (71.0%) |
| 2-Person Household | 2,588 (50.2%) | 2,572 (49.8%) |
| 3-Person Household | 934 (39.4%) | 1,436 (60.6%) |
| 4+ Person Household | 1,568 (56.0%) | 1,231 (44.0%) |
| Total Housing Units | 6,750 (42.1%) | 9,293 (57.9%) |
Occupancy by Educational Attainment in Dekalb
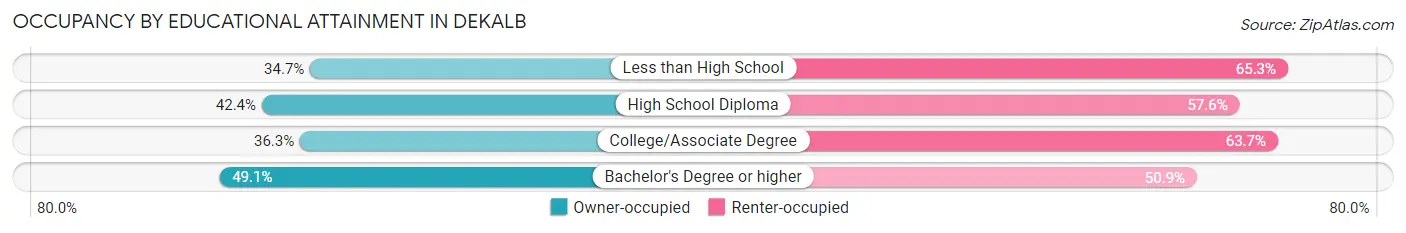
| Household Size | Owner-occupied | Renter-occupied |
| Less than High School | 412 (34.7%) | 775 (65.3%) |
| High School Diploma | 1,297 (42.4%) | 1,764 (57.6%) |
| College/Associate Degree | 2,135 (36.3%) | 3,745 (63.7%) |
| Bachelor's Degree or higher | 2,906 (49.1%) | 3,009 (50.9%) |
Occupancy by Age of Householder in Dekalb
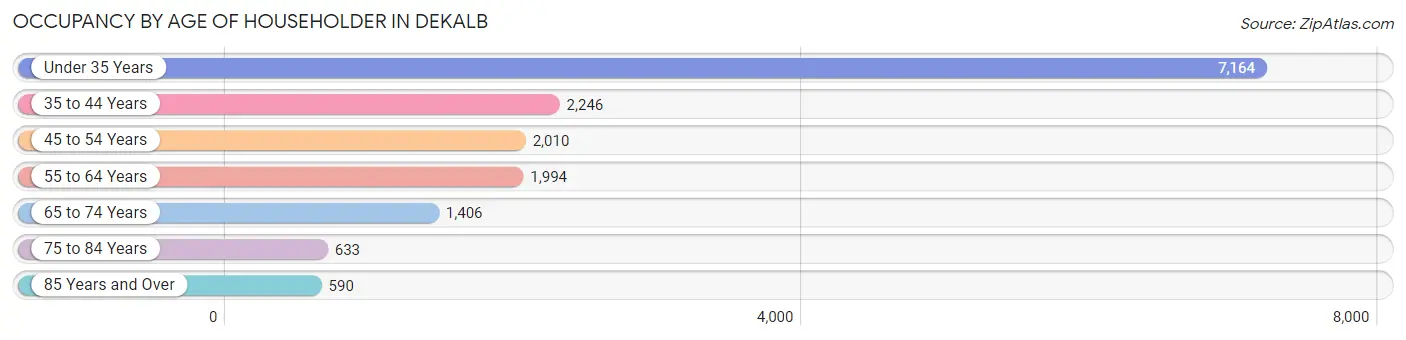
| Age Bracket | # Households | % Households |
| Under 35 Years | 7,164 | 44.7% |
| 35 to 44 Years | 2,246 | 14.0% |
| 45 to 54 Years | 2,010 | 12.5% |
| 55 to 64 Years | 1,994 | 12.4% |
| 65 to 74 Years | 1,406 | 8.8% |
| 75 to 84 Years | 633 | 4.0% |
| 85 Years and Over | 590 | 3.7% |
| Total | 16,043 | 100.0% |
Housing Finances in Dekalb
Median Income by Occupancy in Dekalb
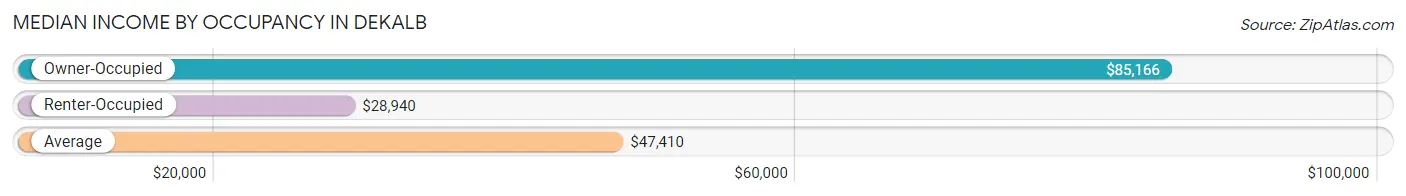
| Occupancy Type | # Households | Median Income |
| Owner-Occupied | 6,750 (42.1%) | $85,166 |
| Renter-Occupied | 9,293 (57.9%) | $28,940 |
| Average | 16,043 (100.0%) | $47,410 |
Occupancy by Householder Income Bracket in Dekalb
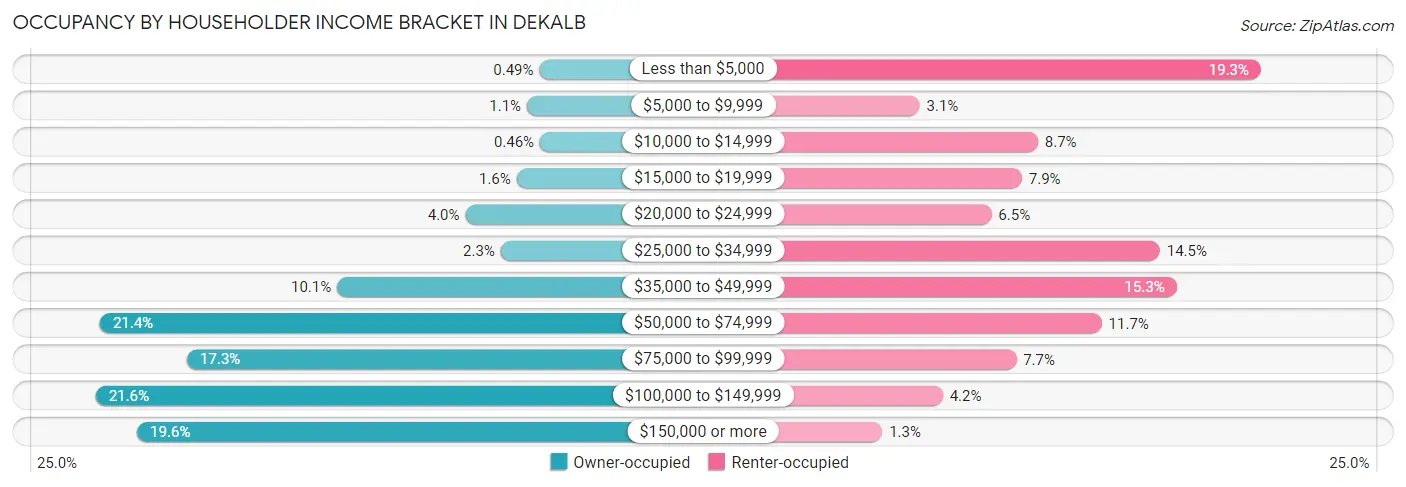
| Income Bracket | Owner-occupied | Renter-occupied |
| Less than $5,000 | 33 (0.5%) | 1,794 (19.3%) |
| $5,000 to $9,999 | 73 (1.1%) | 283 (3.0%) |
| $10,000 to $14,999 | 31 (0.5%) | 807 (8.7%) |
| $15,000 to $19,999 | 106 (1.6%) | 736 (7.9%) |
| $20,000 to $24,999 | 271 (4.0%) | 601 (6.5%) |
| $25,000 to $34,999 | 157 (2.3%) | 1,347 (14.5%) |
| $35,000 to $49,999 | 683 (10.1%) | 1,421 (15.3%) |
| $50,000 to $74,999 | 1,445 (21.4%) | 1,089 (11.7%) |
| $75,000 to $99,999 | 1,166 (17.3%) | 711 (7.6%) |
| $100,000 to $149,999 | 1,459 (21.6%) | 386 (4.2%) |
| $150,000 or more | 1,326 (19.6%) | 118 (1.3%) |
| Total | 6,750 (100.0%) | 9,293 (100.0%) |
Monthly Housing Cost Tiers in Dekalb
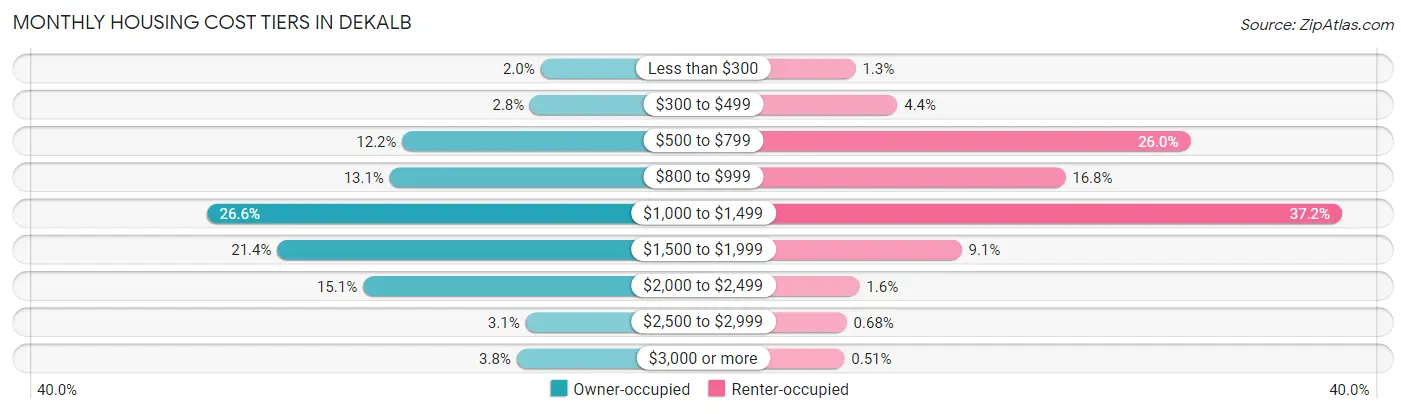
| Monthly Cost | Owner-occupied | Renter-occupied |
| Less than $300 | 135 (2.0%) | 124 (1.3%) |
| $300 to $499 | 187 (2.8%) | 410 (4.4%) |
| $500 to $799 | 822 (12.2%) | 2,414 (26.0%) |
| $800 to $999 | 885 (13.1%) | 1,559 (16.8%) |
| $1,000 to $1,499 | 1,795 (26.6%) | 3,452 (37.1%) |
| $1,500 to $1,999 | 1,444 (21.4%) | 849 (9.1%) |
| $2,000 to $2,499 | 1,018 (15.1%) | 151 (1.6%) |
| $2,500 to $2,999 | 210 (3.1%) | 63 (0.7%) |
| $3,000 or more | 254 (3.8%) | 47 (0.5%) |
| Total | 6,750 (100.0%) | 9,293 (100.0%) |
Physical Housing Characteristics in Dekalb
Housing Structures in Dekalb
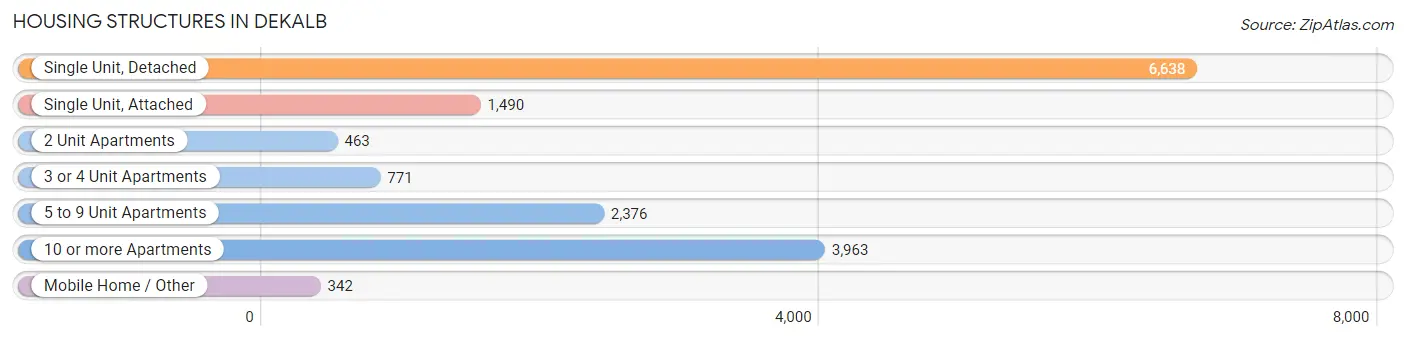
| Structure Type | # Housing Units | % Housing Units |
| Single Unit, Detached | 6,638 | 41.4% |
| Single Unit, Attached | 1,490 | 9.3% |
| 2 Unit Apartments | 463 | 2.9% |
| 3 or 4 Unit Apartments | 771 | 4.8% |
| 5 to 9 Unit Apartments | 2,376 | 14.8% |
| 10 or more Apartments | 3,963 | 24.7% |
| Mobile Home / Other | 342 | 2.1% |
| Total | 16,043 | 100.0% |
Housing Structures by Occupancy in Dekalb
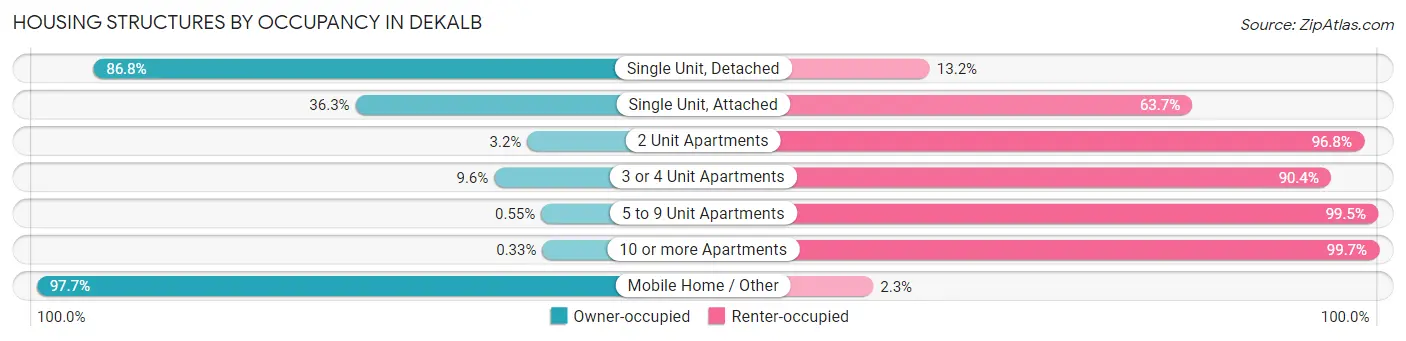
| Structure Type | Owner-occupied | Renter-occupied |
| Single Unit, Detached | 5,760 (86.8%) | 878 (13.2%) |
| Single Unit, Attached | 541 (36.3%) | 949 (63.7%) |
| 2 Unit Apartments | 15 (3.2%) | 448 (96.8%) |
| 3 or 4 Unit Apartments | 74 (9.6%) | 697 (90.4%) |
| 5 to 9 Unit Apartments | 13 (0.5%) | 2,363 (99.5%) |
| 10 or more Apartments | 13 (0.3%) | 3,950 (99.7%) |
| Mobile Home / Other | 334 (97.7%) | 8 (2.3%) |
| Total | 6,750 (42.1%) | 9,293 (57.9%) |
Housing Structures by Number of Rooms in Dekalb
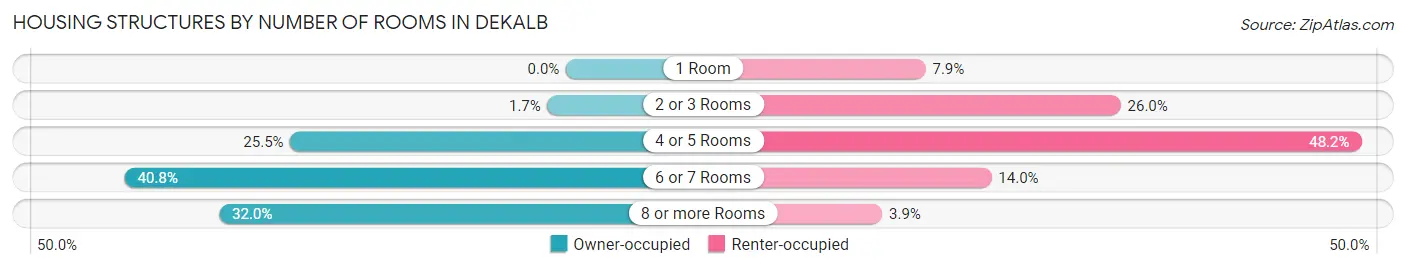
| Number of Rooms | Owner-occupied | Renter-occupied |
| 1 Room | 0 (0.0%) | 736 (7.9%) |
| 2 or 3 Rooms | 116 (1.7%) | 2,412 (26.0%) |
| 4 or 5 Rooms | 1,722 (25.5%) | 4,481 (48.2%) |
| 6 or 7 Rooms | 2,751 (40.8%) | 1,302 (14.0%) |
| 8 or more Rooms | 2,161 (32.0%) | 362 (3.9%) |
| Total | 6,750 (100.0%) | 9,293 (100.0%) |
Housing Structure by Heating Type in Dekalb
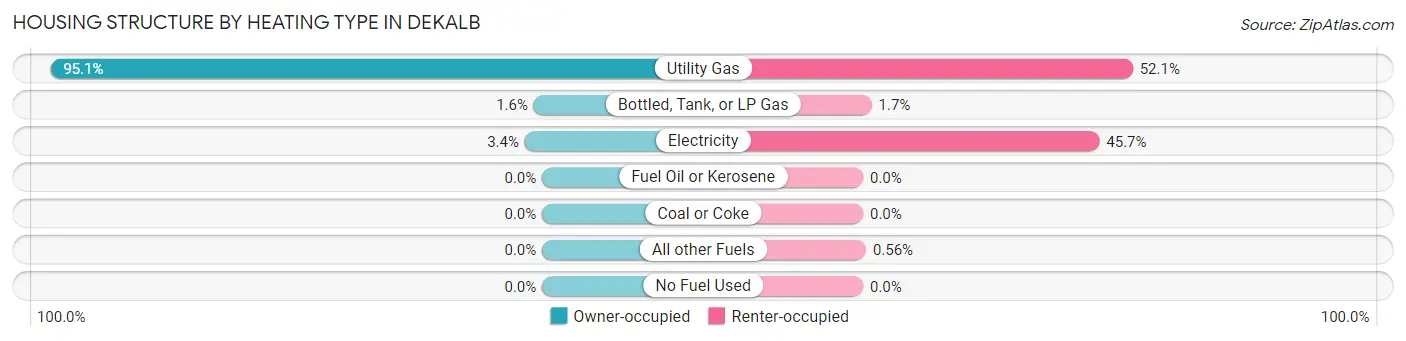
| Heating Type | Owner-occupied | Renter-occupied |
| Utility Gas | 6,416 (95.1%) | 4,843 (52.1%) |
| Bottled, Tank, or LP Gas | 108 (1.6%) | 154 (1.7%) |
| Electricity | 226 (3.4%) | 4,244 (45.7%) |
| Fuel Oil or Kerosene | 0 (0.0%) | 0 (0.0%) |
| Coal or Coke | 0 (0.0%) | 0 (0.0%) |
| All other Fuels | 0 (0.0%) | 52 (0.6%) |
| No Fuel Used | 0 (0.0%) | 0 (0.0%) |
| Total | 6,750 (100.0%) | 9,293 (100.0%) |
Household Vehicle Usage in Dekalb
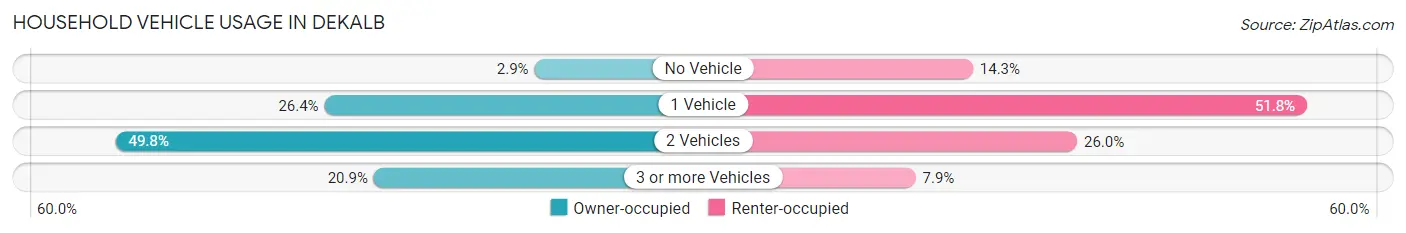
| Vehicles per Household | Owner-occupied | Renter-occupied |
| No Vehicle | 195 (2.9%) | 1,332 (14.3%) |
| 1 Vehicle | 1,783 (26.4%) | 4,809 (51.7%) |
| 2 Vehicles | 3,362 (49.8%) | 2,416 (26.0%) |
| 3 or more Vehicles | 1,410 (20.9%) | 736 (7.9%) |
| Total | 6,750 (100.0%) | 9,293 (100.0%) |
Real Estate & Mortgages in Dekalb
Real Estate and Mortgage Overview in Dekalb
| Characteristic | Without Mortgage | With Mortgage |
| Housing Units | 2,408 | 4,342 |
| Median Property Value | $189,700 | $192,800 |
| Median Household Income | $61,992 | $927 |
| Monthly Housing Costs | $828 | $254 |
| Real Estate Taxes | $5,404 | $104 |
Property Value by Mortgage Status in Dekalb
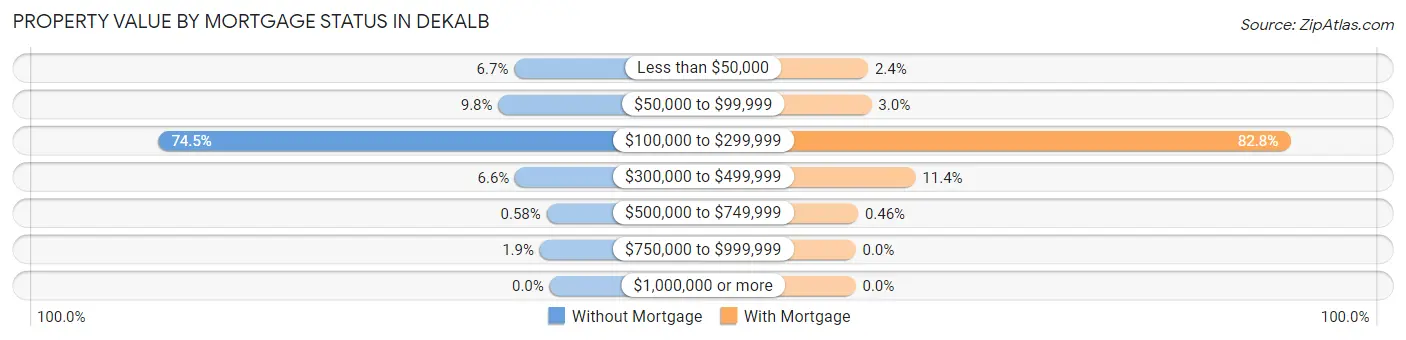
| Property Value | Without Mortgage | With Mortgage |
| Less than $50,000 | 162 (6.7%) | 103 (2.4%) |
| $50,000 to $99,999 | 235 (9.8%) | 131 (3.0%) |
| $100,000 to $299,999 | 1,794 (74.5%) | 3,593 (82.8%) |
| $300,000 to $499,999 | 158 (6.6%) | 495 (11.4%) |
| $500,000 to $749,999 | 14 (0.6%) | 20 (0.5%) |
| $750,000 to $999,999 | 45 (1.9%) | 0 (0.0%) |
| $1,000,000 or more | 0 (0.0%) | 0 (0.0%) |
| Total | 2,408 (100.0%) | 4,342 (100.0%) |
Household Income by Mortgage Status in Dekalb
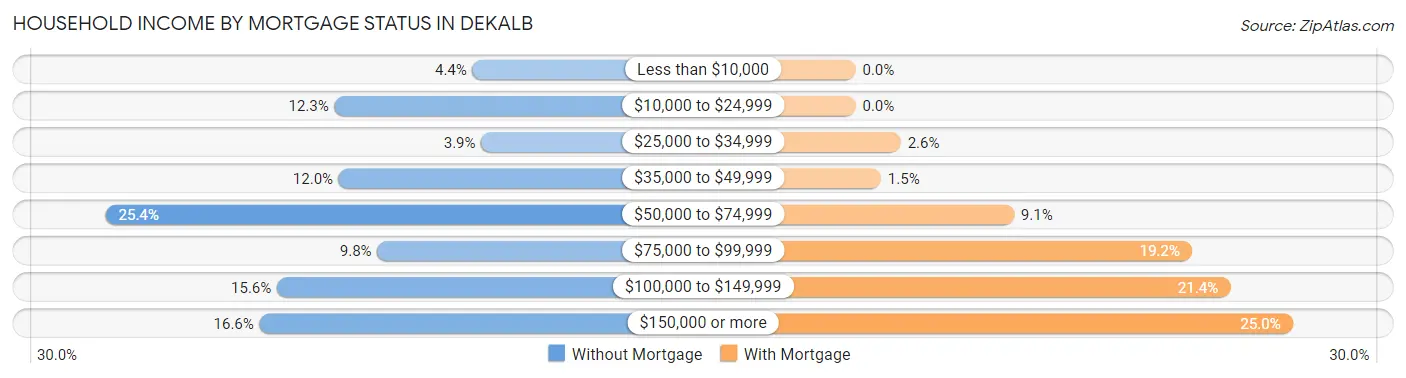
| Household Income | Without Mortgage | With Mortgage |
| Less than $10,000 | 106 (4.4%) | 0 (0.0%) |
| $10,000 to $24,999 | 296 (12.3%) | 0 (0.0%) |
| $25,000 to $34,999 | 94 (3.9%) | 112 (2.6%) |
| $35,000 to $49,999 | 290 (12.0%) | 63 (1.5%) |
| $50,000 to $74,999 | 611 (25.4%) | 393 (9.0%) |
| $75,000 to $99,999 | 237 (9.8%) | 834 (19.2%) |
| $100,000 to $149,999 | 375 (15.6%) | 929 (21.4%) |
| $150,000 or more | 399 (16.6%) | 1,084 (25.0%) |
| Total | 2,408 (100.0%) | 4,342 (100.0%) |
Property Value to Household Income Ratio in Dekalb
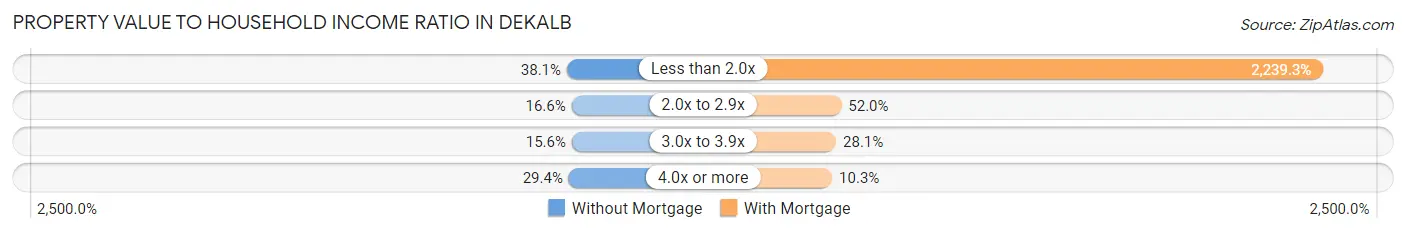
| Value-to-Income Ratio | Without Mortgage | With Mortgage |
| Less than 2.0x | 917 (38.1%) | 97,230 (2,239.3%) |
| 2.0x to 2.9x | 399 (16.6%) | 2,257 (52.0%) |
| 3.0x to 3.9x | 376 (15.6%) | 1,220 (28.1%) |
| 4.0x or more | 709 (29.4%) | 445 (10.2%) |
| Total | 2,408 (100.0%) | 4,342 (100.0%) |
Real Estate Taxes by Mortgage Status in Dekalb
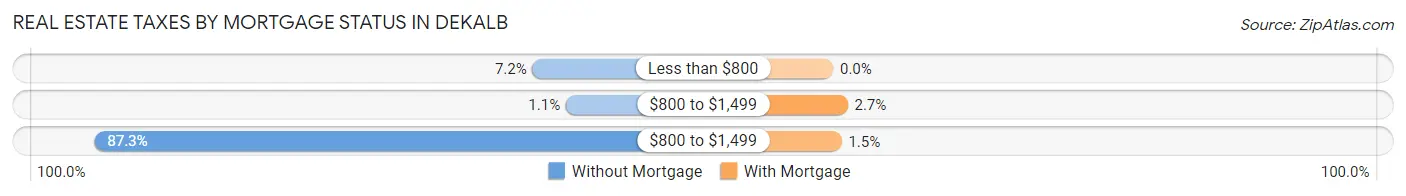
| Property Taxes | Without Mortgage | With Mortgage |
| Less than $800 | 174 (7.2%) | 0 (0.0%) |
| $800 to $1,499 | 27 (1.1%) | 115 (2.6%) |
| $800 to $1,499 | 2,101 (87.3%) | 67 (1.5%) |
| Total | 2,408 (100.0%) | 4,342 (100.0%) |
Health & Disability in Dekalb
Health Insurance Coverage by Age in Dekalb
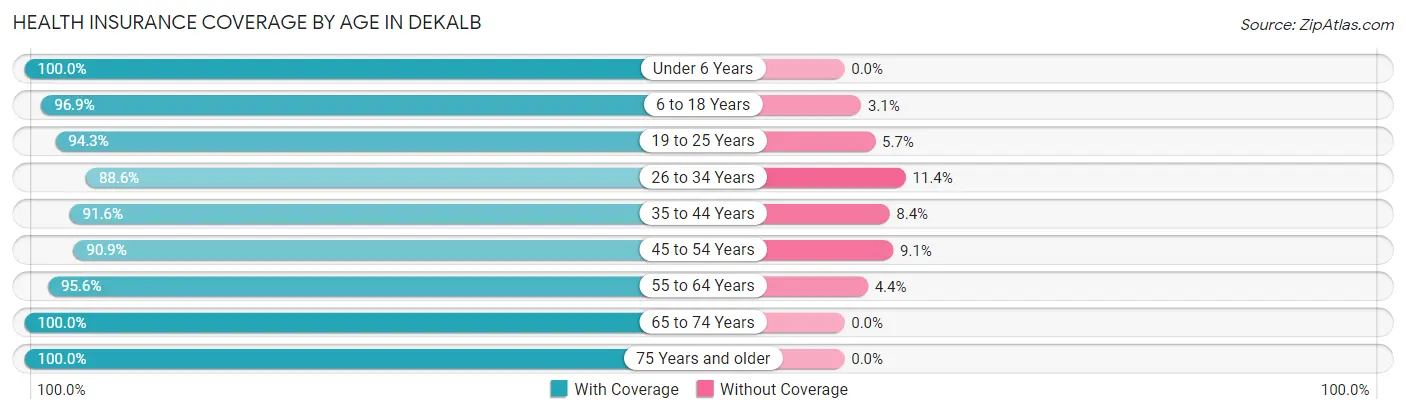
| Age Bracket | With Coverage | Without Coverage |
| Under 6 Years | 2,493 (100.0%) | 0 (0.0%) |
| 6 to 18 Years | 6,336 (96.9%) | 204 (3.1%) |
| 19 to 25 Years | 11,482 (94.3%) | 699 (5.7%) |
| 26 to 34 Years | 4,529 (88.6%) | 585 (11.4%) |
| 35 to 44 Years | 3,392 (91.6%) | 311 (8.4%) |
| 45 to 54 Years | 3,077 (90.9%) | 308 (9.1%) |
| 55 to 64 Years | 3,017 (95.6%) | 138 (4.4%) |
| 65 to 74 Years | 2,059 (100.0%) | 0 (0.0%) |
| 75 Years and older | 1,708 (100.0%) | 0 (0.0%) |
| Total | 38,093 (94.4%) | 2,245 (5.6%) |
Health Insurance Coverage by Citizenship Status in Dekalb
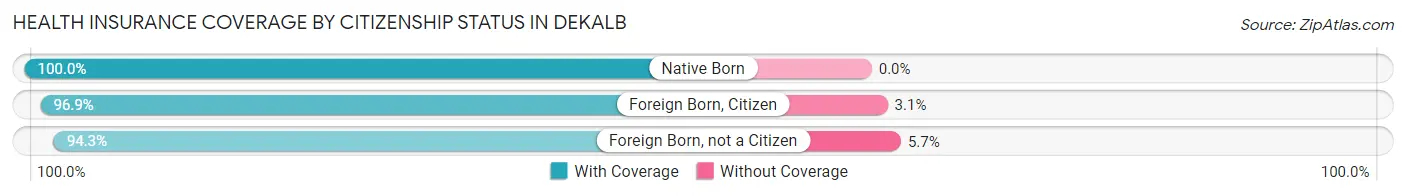
| Citizenship Status | With Coverage | Without Coverage |
| Native Born | 2,493 (100.0%) | 0 (0.0%) |
| Foreign Born, Citizen | 6,336 (96.9%) | 204 (3.1%) |
| Foreign Born, not a Citizen | 11,482 (94.3%) | 699 (5.7%) |
Health Insurance Coverage by Household Income in Dekalb
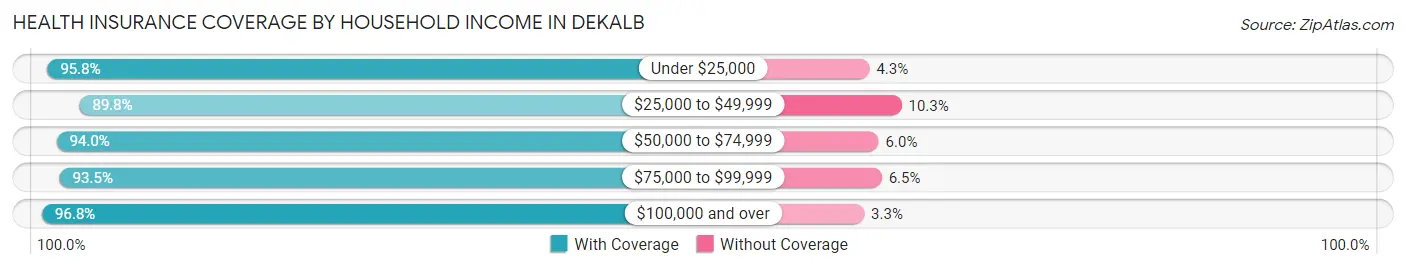
| Household Income | With Coverage | Without Coverage |
| Under $25,000 | 8,088 (95.8%) | 359 (4.3%) |
| $25,000 to $49,999 | 6,471 (89.7%) | 739 (10.2%) |
| $50,000 to $74,999 | 5,652 (94.0%) | 359 (6.0%) |
| $75,000 to $99,999 | 3,974 (93.5%) | 278 (6.5%) |
| $100,000 and over | 10,674 (96.8%) | 358 (3.3%) |
Public vs Private Health Insurance Coverage by Age in Dekalb
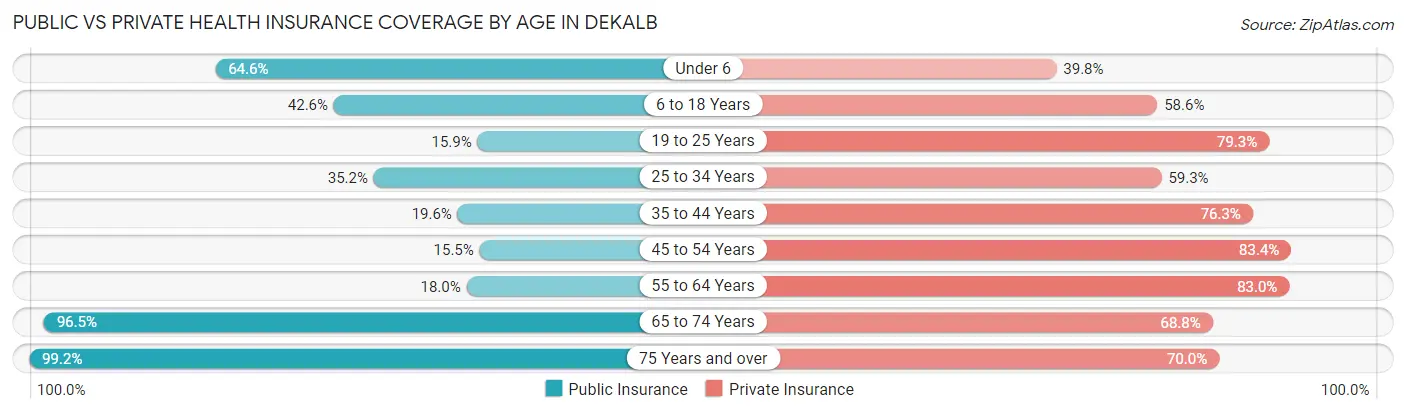
| Age Bracket | Public Insurance | Private Insurance |
| Under 6 | 1,611 (64.6%) | 993 (39.8%) |
| 6 to 18 Years | 2,786 (42.6%) | 3,829 (58.6%) |
| 19 to 25 Years | 1,939 (15.9%) | 9,659 (79.3%) |
| 25 to 34 Years | 1,799 (35.2%) | 3,034 (59.3%) |
| 35 to 44 Years | 726 (19.6%) | 2,824 (76.3%) |
| 45 to 54 Years | 526 (15.5%) | 2,823 (83.4%) |
| 55 to 64 Years | 567 (18.0%) | 2,620 (83.0%) |
| 65 to 74 Years | 1,986 (96.5%) | 1,417 (68.8%) |
| 75 Years and over | 1,694 (99.2%) | 1,196 (70.0%) |
| Total | 13,634 (33.8%) | 28,395 (70.4%) |
Disability Status by Sex by Age in Dekalb
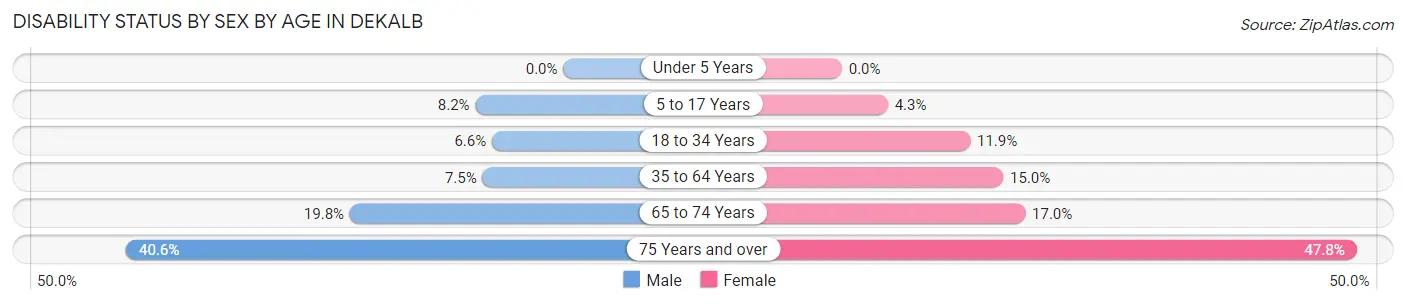
| Age Bracket | Male | Female |
| Under 5 Years | 0 (0.0%) | 0 (0.0%) |
| 5 to 17 Years | 224 (8.2%) | 125 (4.3%) |
| 18 to 34 Years | 651 (6.6%) | 1,060 (11.9%) |
| 35 to 64 Years | 379 (7.5%) | 777 (15.0%) |
| 65 to 74 Years | 204 (19.8%) | 175 (17.0%) |
| 75 Years and over | 209 (40.6%) | 570 (47.8%) |
Disability Class by Sex by Age in Dekalb
Disability Class: Hearing Difficulty
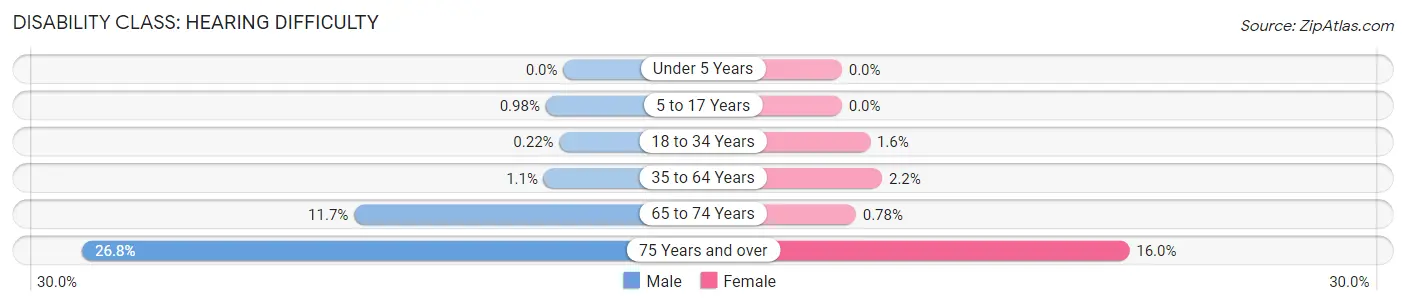
| Age Bracket | Male | Female |
| Under 5 Years | 0 (0.0%) | 0 (0.0%) |
| 5 to 17 Years | 27 (1.0%) | 0 (0.0%) |
| 18 to 34 Years | 22 (0.2%) | 140 (1.6%) |
| 35 to 64 Years | 55 (1.1%) | 116 (2.2%) |
| 65 to 74 Years | 120 (11.7%) | 8 (0.8%) |
| 75 Years and over | 138 (26.8%) | 191 (16.0%) |
Disability Class: Vision Difficulty
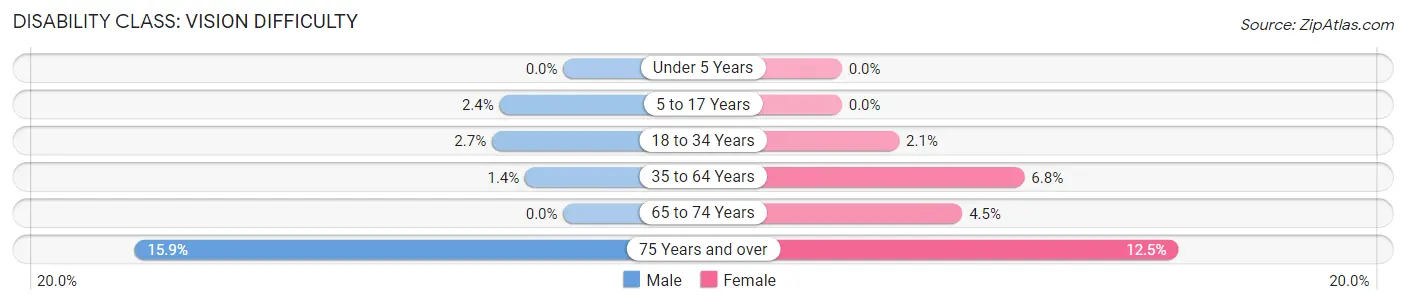
| Age Bracket | Male | Female |
| Under 5 Years | 0 (0.0%) | 0 (0.0%) |
| 5 to 17 Years | 65 (2.4%) | 0 (0.0%) |
| 18 to 34 Years | 260 (2.6%) | 190 (2.1%) |
| 35 to 64 Years | 72 (1.4%) | 352 (6.8%) |
| 65 to 74 Years | 0 (0.0%) | 46 (4.5%) |
| 75 Years and over | 82 (15.9%) | 149 (12.5%) |
Disability Class: Cognitive Difficulty
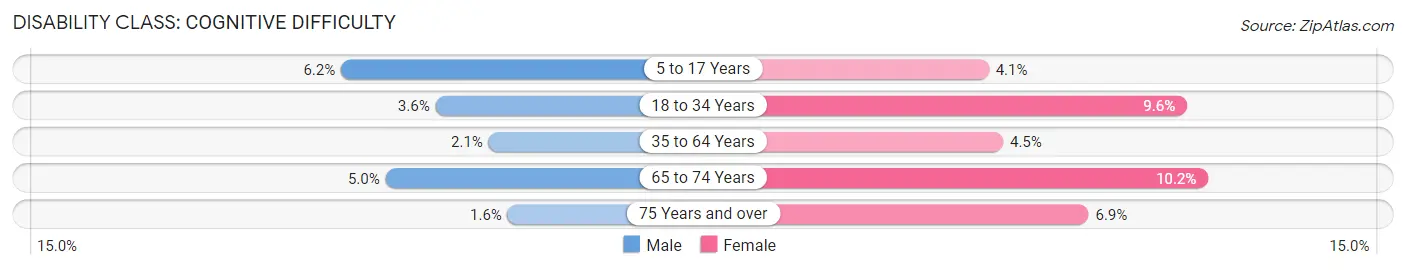
| Age Bracket | Male | Female |
| 5 to 17 Years | 170 (6.2%) | 120 (4.1%) |
| 18 to 34 Years | 350 (3.6%) | 856 (9.6%) |
| 35 to 64 Years | 105 (2.1%) | 233 (4.5%) |
| 65 to 74 Years | 51 (5.0%) | 105 (10.2%) |
| 75 Years and over | 8 (1.5%) | 82 (6.9%) |
Disability Class: Ambulatory Difficulty
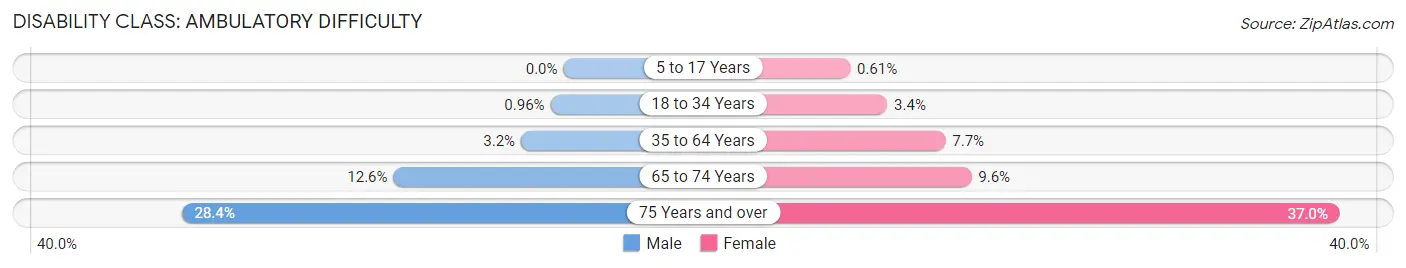
| Age Bracket | Male | Female |
| 5 to 17 Years | 0 (0.0%) | 18 (0.6%) |
| 18 to 34 Years | 94 (1.0%) | 300 (3.4%) |
| 35 to 64 Years | 159 (3.2%) | 399 (7.7%) |
| 65 to 74 Years | 130 (12.6%) | 99 (9.6%) |
| 75 Years and over | 146 (28.3%) | 441 (37.0%) |
Disability Class: Self-Care Difficulty
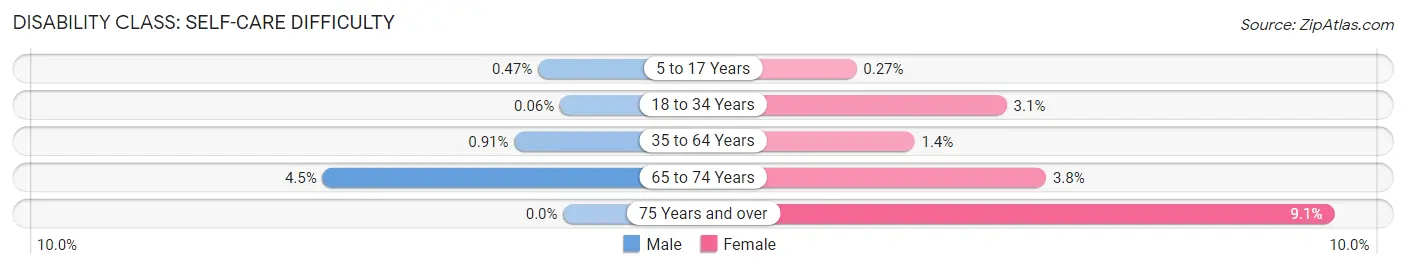
| Age Bracket | Male | Female |
| 5 to 17 Years | 13 (0.5%) | 8 (0.3%) |
| 18 to 34 Years | 6 (0.1%) | 273 (3.1%) |
| 35 to 64 Years | 46 (0.9%) | 70 (1.3%) |
| 65 to 74 Years | 46 (4.5%) | 39 (3.8%) |
| 75 Years and over | 0 (0.0%) | 109 (9.1%) |
Technology Access in Dekalb
Computing Device Access in Dekalb
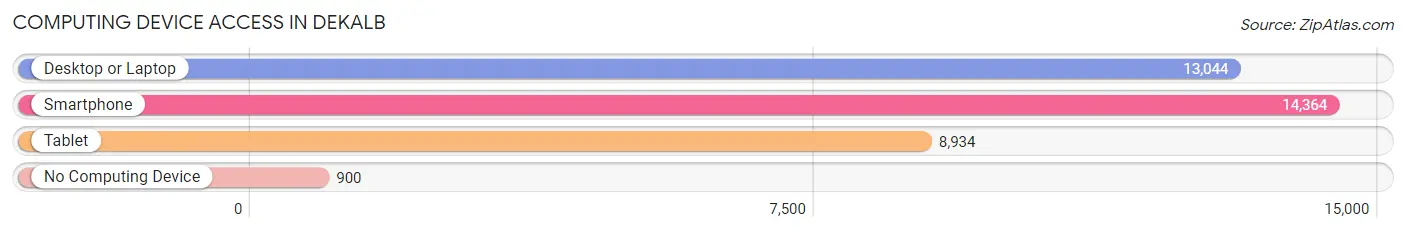
| Device Type | # Households | % Households |
| Desktop or Laptop | 13,044 | 81.3% |
| Smartphone | 14,364 | 89.5% |
| Tablet | 8,934 | 55.7% |
| No Computing Device | 900 | 5.6% |
| Total | 16,043 | 100.0% |
Internet Access in Dekalb
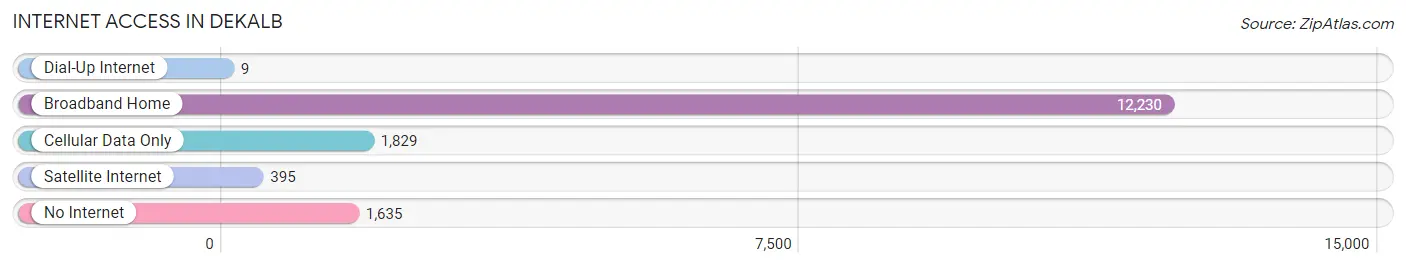
| Internet Type | # Households | % Households |
| Dial-Up Internet | 9 | 0.1% |
| Broadband Home | 12,230 | 76.2% |
| Cellular Data Only | 1,829 | 11.4% |
| Satellite Internet | 395 | 2.5% |
| No Internet | 1,635 | 10.2% |
| Total | 16,043 | 100.0% |
Dekalb Summary
Dekalb, Illinois is a city located in DeKalb County, Illinois, United States. The city is located approximately 65 miles west of Chicago and is part of the Chicago metropolitan area. As of the 2010 census, the city had a population of 43,862.
History
The area that is now Dekalb was first settled in the 1830s by settlers from New England. The settlers were attracted to the area due to its fertile soil and abundant natural resources. The first permanent settlement was established in 1837 and the town was named after Baron Johann de Kalb, a German-born French military officer who fought in the American Revolutionary War.
In 1856, the Illinois and Wisconsin Railroad was built through the town, connecting it to Chicago and other cities in the region. This allowed for the growth of the town and the establishment of several businesses, including a flour mill, a sawmill, and a brickyard.
In 1892, the city was incorporated and the population had grown to 1,500. The city continued to grow throughout the 20th century, reaching a peak population of 44,000 in 2000.
Geography
Dekalb is located at 41°55'N 88°45'W (41.914, -88.749). According to the United States Census Bureau, the city has a total area of 11.2 square miles (29.0 km2), of which 11.1 square miles (28.7 km2) is land and 0.1 square miles (0.3 km2) is water.
The city is located in the Kishwaukee River Valley, which is part of the larger Rock River Valley. The city is surrounded by rolling hills and farmland.
Economy
Dekalb is home to several large employers, including Northern Illinois University, the Dekalb County government, and the DeKalb School District. The city is also home to several manufacturing companies, including the John Deere Harvester Works, the Dekalb AgResearch Center, and the Dekalb Seed Company.
The city is also home to several retail stores, restaurants, and other businesses. The city is served by the DeKalb Taylor Municipal Airport, which provides air service to Chicago and other cities in the region.
Demographics
As of the 2010 census, there were 43,862 people, 16,945 households, and 9,945 families residing in the city. The population density was 3,945.3 people per square mile (1,521.2/km2). There were 18,068 housing units at an average density of 1,622.3 per square mile (625.7/km2). The racial makeup of the city was 79.2% White, 8.3% African American, 0.3% Native American, 6.2% Asian, 0.1% Pacific Islander, 3.2% from other races, and 2.9% from two or more races. Hispanic or Latino of any race were 8.7% of the population.
There were 16,945 households, out of which 24.2% had children under the age of 18 living with them, 43.2% were married couples living together, 10.3% had a female householder with no husband present, and 42.3% were non-families. 33.2% of all households were made up of individuals, and 11.2% had someone living alone who was 65 years of age or older. The average household size was 2.37 and the average family size was 3.05.
In the city, the population was spread out, with 20.3% under the age of 18, 20.2% from 18 to 24, 24.7% from 25 to 44, 21.2% from 45 to 64, and 13.6% who were 65 years of age or older. The median age was 32.4 years. For every 100 females, there were 91.2 males. For every 100 females age 18 and over, there were 87.7 males.
The median income for a household in the city was $41,945, and the median income for a family was $54,945. Males had a median income of $41,945 versus $31,945 for females. The per capita income for the city was $21,945. About 8.2% of families and 12.2% of the population were below the poverty line, including 16.2% of those under age 18 and 6.2% of those age 65 or over.
Common Questions
What is Per Capita Income in Dekalb?
Per Capita income in Dekalb is $26,761.
What is the Median Family Income in Dekalb?
Median Family Income in Dekalb is $69,100.
What is the Median Household income in Dekalb?
Median Household Income in Dekalb is $47,410.
What is Income or Wage Gap in Dekalb?
Income or Wage Gap in Dekalb is 46.4%.
Women in Dekalb earn 53.6 cents for every dollar earned by a man.
What is Family Income Deficit in Dekalb?
Family Income Deficit in Dekalb is $12,315.
Families that are below poverty line in Dekalb earn $12,315 less on average than the poverty threshold level.
What is Inequality or Gini Index in Dekalb?
Inequality or Gini Index in Dekalb is 0.49.
What is the Total Population of Dekalb?
Total Population of Dekalb is 40,697.
What is the Total Male Population of Dekalb?
Total Male Population of Dekalb is 20,287.
What is the Total Female Population of Dekalb?
Total Female Population of Dekalb is 20,410.
What is the Ratio of Males per 100 Females in Dekalb?
There are 99.40 Males per 100 Females in Dekalb.
What is the Ratio of Females per 100 Males in Dekalb?
There are 100.61 Females per 100 Males in Dekalb.
What is the Median Population Age in Dekalb?
Median Population Age in Dekalb is 24.9 Years.
What is the Average Family Size in Dekalb
Average Family Size in Dekalb is 3.1 People.
What is the Average Household Size in Dekalb
Average Household Size in Dekalb is 2.3 People.
How Large is the Labor Force in Dekalb?
There are 22,823 People in the Labor Forcein in Dekalb.
What is the Percentage of People in the Labor Force in Dekalb?
67.3% of People are in the Labor Force in Dekalb.
What is the Unemployment Rate in Dekalb?
Unemployment Rate in Dekalb is 10.7%.